AGILENT TECHNOLOGIES, INC.
10-Ks and 10-Qs
|
|
|
|
|
|
|
|
|
|
|
|
|
|
|
|
|
|
|
|
|
|
|
|
|
|
|
|
|
|
|
|
|
|
|
|
|
|
|
|
|
|
|
|
|
|
|
|
|
|
|
|
|
|
|
|
|
|
|
UNITED STATES
SECURITIES AND EXCHANGE COMMISSION
Washington, D.C. 20549
_____________________________________________________________
Form 10-K
_____________________________________________________________
|
(Mark One)
|
||
|
x
|
|
ANNUAL REPORT PURSUANT TO SECTION 13 OR 15(d) OF THE SECURITIES EXCHANGE ACT OF 1934
|
|
|
|
For the fiscal year ended October 31, 2017
|
|
or
|
||
|
o
|
|
TRANSITION REPORT PURSUANT TO SECTION 13 OR 15(d) OF THE SECURITIES EXCHANGE ACT OF 1934
|
|
|
|
For the transition period from to
|
Commission File Number: 001-15405
_____________________________________________________________
Agilent Technologies, Inc.
(Exact name of registrant as specified in its charter)
|
Delaware
|
|
77-0518772
|
|
State or other jurisdiction of
Incorporation or organization
|
|
I.R.S. Employer
Identification No.
|
Address of principal executive offices: 5301 Stevens Creek Blvd., Santa Clara, California 95051
Registrant's telephone number, including area code: (408) 345-8886
Securities registered pursuant to Section 12(b) of the Act:
|
Title of each class
|
|
Name of each exchange on which registered
|
|
Common Stock
par value $0.01 per share
|
|
New York Stock Exchange
|
Securities registered pursuant to Section 12(g) of the Act:
None
_____________________________________________________________
Indicate by check mark if the registrant is a well-known seasoned issuer, as defined in Rule 405 of the Securities Act. Yes
x
No
¨
Indicate by check mark if the registrant is not required to file reports pursuant to Section 13 or Section 15(d) of the Act. Yes
¨
No
x
Indicate by check mark whether the registrant (1) has filed all reports required to be filed by Section 13 or 15(d) of the Securities Exchange Act of 1934 during the preceding 12 months (or for such shorter period that the registrant was required to file such reports), and (2) has been subject to such filing requirements for the past 90 days. Yes
x
No
¨
Indicate by check mark whether the registrant has submitted electronically and posted on its corporate website, if any, every Interactive Data File required to be submitted and posted pursuant to Rule 405 of Regulation S-T (§232.405 of this chapter) during the preceding 12 months (or for such shorter period that the registrant was required to submit and post such files). Yes
x
No
¨
Indicate by check mark if disclosure of delinquent filers pursuant to Item 405 of Regulation S-K (§229.405 of this chapter) is not contained herein, and will not be contained, to the best of registrant's knowledge, in definitive proxy or information statements incorporated by reference in Part III of this Form 10-K or any amendment to this Form 10-K.
Indicate by check mark whether the registrant is a large accelerated filer, an accelerated filer, a non-accelerated filer, smaller reporting company or an emerging growth company. See the definitions of "large accelerated filer," "accelerated filer", "smaller reporting company" and "emerging growth company" in Rule 12b-2 of the Exchange Act.
|
Large accelerated filer
x
|
|
Accelerated filer
¨
|
|
Smaller reporting company
¨
|
|
Emerging growth company
¨
|
|
Non-accelerated filer
¨
(Do not check if a smaller reporting company)
|
|
|
||||
Indicate by check mark whether the registrant is a shell company (as defined in Rule 12b-2 of the Exchange Act). Yes
¨
No
x
If an emerging growth company, indicate by check mark if the registrant has elected not to use the extended transition period for complying with any new or revised financial accounting standards provided pursuant to Section 13(a) of the Exchange Act.
¨
The aggregate market value of the registrant's common equity held by non-affiliates as of April 30, 2017, was approximately
$12.6 billion
. Shares of stock held by officers, directors and 5 percent or more stockholders have been excluded in that such persons may be deemed to be affiliates. This determination of affiliate status is not necessarily a conclusive determination for other purposes.
As of December 1, 2017, there were
323,018,027
outstanding shares of common stock, par value $0.01 per share.
_____________________________________________________________
DOCUMENTS INCORPORATED BY REFERENCE
|
Document Description
|
|
10-K Part
|
|
Portions of the Proxy Statement for the Annual Meeting of Stockholders (the "Proxy Statement") to be held on March 21, 2018, and to be filed pursuant to Regulation 14A within 120 days after registrant's fiscal year ended October 31, 2017 are incorporated by reference into Part III of this Report
|
|
III
|
TABLE OF CONTENTS
|
|
|
Page
|
2
Forward-Looking Statements
This report contains forward-looking statements including, without limitation, statements regarding trends, seasonality and growth in, and drivers of, the markets we sell into, our strategic direction, our future effective tax rate and tax valuation allowance, earnings from our foreign subsidiaries, repatriation of our earnings from foreign jurisdictions and its impact on our tax expense, lease and site services income from Keysight, the impact of foreign currency movements on our performance, our hedging programs, indemnification, new product and service introductions, the ability of our products to meet market needs, adoption of our products, changes to our manufacturing processes, the use of contract manufacturers, out sourcing and third-party package delivery services, source and supply of materials used in our products, the impact of local government regulations on our ability to pay vendors or conduct operations, our liquidity position, our ability to generate cash from operations, growth in our businesses, our investments, including in research and development, the potential impact of adopting new accounting pronouncements, our financial results, our operating margin, our sales, our purchase commitments, our capital expenditures, our contributions to our pension and other defined benefit plans, our strategic initiatives, our cost-control activities and other cost saving initiatives, uncertainties relating to Food and Drug Administration ("FDA") and other regulatory approvals, the integration of our acquisitions and other transactions, impairment of goodwill and other intangible assets, write down of investment values or loans and convertible notes, our stock repurchase program, our declared dividends, and the existence of economic instability, that involve risks and uncertainties. Our actual results could differ materially from the results contemplated by these forward-looking statements due to various factors, including those discussed in Part I Item 1A and elsewhere in this Form 10-K.
Item 1.
Business
Overview
Agilent Technologies Inc. ("we", "Agilent" or the "company"), incorporated in Delaware in May 1999, is a global leader in life sciences, diagnostics and applied chemical markets, providing application focused solutions that includes instruments, software, services and consumables for the entire laboratory workflow.
On November 1, 2014, we completed the distribution of 100% of the outstanding common shares of Keysight Technologies, Inc. ("Keysight") to Agilent stockholders who received one share of Keysight common stock for every two shares of Agilent held as of the close of business on the record date, October 22, 2014. For fiscal year 2015, discontinued operations includes costs incurred to effect the separation of Keysight and certain costs associated with transition services provided by Agilent to Keysight. No income or expense has been recorded for the Keysight business after separation from Agilent on November 1, 2014.
For the fiscal year ended
October 31, 2017
, we have three business segments comprised of the life sciences and applied markets business, the diagnostics and genomics business and the Agilent CrossLab business.
Our life sciences and applied markets business provides application-focused solutions that include instruments and software that enable customers to identify, quantify and analyze the physical and biological properties of substances and products, as well as enable customers in the clinical and life sciences research areas to interrogate samples at the molecular and cellular level. Our diagnostics and genomics business is comprised of five areas of activity providing solutions that include reagents, instruments, software and consumables which enable customers in the clinical and life sciences research areas to interrogate samples at the cellular and molecular level. The Agilent CrossLab business spans the entire lab with its extensive consumables and services portfolio, which is designed to improve customer outcomes. In addition, we conduct centralized order fulfillment and supply chain operations for our businesses through the order fulfillment and supply chain organization (“OFS”). OFS provides resources for manufacturing, engineering and strategic sourcing to our respective businesses. Each of our businesses, together with OFS and Agilent Technologies Research Laboratories, is supported by our global infrastructure organization, which provides shared services in the areas of finance, information technology, legal,certain procurement services, workplace services and human resources.
We sell our products primarily through direct sales, but we also utilize distributors, resellers, manufacturer's representatives and electronic commerce. Of our total net revenue of
$4.5 billion
for the fiscal year ended
October 31, 2017
, we generated
29 percent
in the U.S. and
71 percent
outside the U.S. As of
October 31, 2017
, we employed approximately
13,500
people worldwide. Our primary research and development and manufacturing sites are in California, Colorado, Delaware, Massachusetts and Texas in the U.S. and in Australia, China, Denmark, Germany, Italy, Japan, Malaysia, Singapore and the United Kingdom.
The net revenue, income from operations and assets by business segment, as of and for the fiscal year ended
October 31, 2017
and for each of the past three years are shown in Note 19, "Segment Information", to our consolidated financial statements,
3
which we incorporate by reference herein.
Life Sciences and Applied Markets Business
Our life sciences and applied markets business provides application-focused solutions that include instruments and software that enable customers to identify, quantify and analyze the physical and biological properties of substances and products, as well as enable customers in the clinical and life sciences research areas to interrogate samples at the molecular and cellular level. Key product categories include: liquid chromatography ("LC") systems and components; liquid chromatography mass spectrometry ("LCMS") systems; gas chromatography ("GC") systems and components; gas chromatography mass spectrometry ("GCMS") systems; inductively coupled plasma mass spectrometry ("ICP-MS") instruments; atomic absorption ("AA") instruments; microwave plasma-atomic emission spectrometry (“MP-AES”) instruments; inductively coupled plasma optical emission spectrometry ("ICP-OES") instruments; raman spectroscopy; microfluidics based automated electrophoresis products; cell analysis plate based assays; laboratory software and informatics systems; laboratory automation; dissolution testing; vacuum pumps and measurement technologies.
We employed approximately
4,200
people as of
October 31, 2017
in our life sciences and applied markets business. This business generated revenue of
$2.2 billion
in fiscal
2017
,
$2.1 billion
in fiscal
2016
and
$2.0 billion
in fiscal
2015
.
Life Sciences and Applied Markets
Our life sciences and applied markets business focuses primarily on the following five markets:
The Pharmaceutical, Biotechnology, CRO & CMO Market.
This market consists of “for-profit” companies who participate across the pharmaceutical value chain in the areas of therapeutic research, discovery & development, clinical trials, manufacturing and quality assurance and quality control. One sub-segment of this market is core and emerging pharmaceutical companies (“pharma”). A second sub-segment includes biotechnology companies (“biotech”), contract research organizations (“CROs”) and contract manufacturing organizations (“CMOs”). Biotech companies and, to a somewhat lesser extent, CROs and CMOs typically participate in specific points in the pharmaceutical industry value chain. Additionally, due to the relatively low drug efficacy within oncology, pharma companies are partnering with diagnostic companies to bring validated tests to the market with their new drugs.
The Life Science Research Market.
This market consists primarily of “not-for-profit” organizations and includes academic institutions, large government institutes and privately funded organizations. The life science research market plays an influential role in technology adoption and therapeutic developments for pharmaceutical and molecular diagnostics companies. After decades of investment in basic biomedical research by government funding bodies, the focus has widened to include translational research - multidisciplinary scientific efforts directed at accelerating therapy development.
The Chemical & Energy Market.
The natural gas and petroleum refining markets use our products to measure and control the quality of their finished products and to verify the environmental safety of their operations. Petroleum refiners use our measurement solutions to analyze crude oil composition, perform raw material analysis, verify and improve refining processes and ensure the overall quality of gasoline, fuels, lubricants and other products. Our solutions are also used in the development, manufacturing and quality control of fine chemicals and other industrial applications such as materials analysis.
The Environmental & Forensics Market.
Our instruments, software and workflow solutions are used by the environmental market for applications such as laboratory and field analysis of chemical pollutants in air, water, soil and solid waste. Environmental industry customers include all levels of government, the industrial and manufacturing sectors, engineering and consulting companies, commercial testing laboratories and colleges and universities. Drug testing and forensics laboratories use our instruments, software and workflow solutions for applications such as analyzing evidence associated with crime, screening athletes for performance enhancing drugs, analyzing samples for recreational drugs, or detecting and identifying biological and chemical warfare agents. This instrumentation is used in either static or mobile laboratories. Customers include local, state, federal, and international law enforcement agencies and health laboratories.
The Food Market.
Our instruments, software, and workflow solutions are used throughout the food production chain, including incoming inspection, new product development, quality control and assurance, and packaging. For example, our mass spectrometer portfolio is used to analyze contaminants and residual pesticides in food. There is also a significant food safety market involved in analyzing food for pathogen contamination, accurate verification of species type and evidence of genetically modified content.
4
Life Sciences and Applied Markets Products and Applications
Our products fall into nine main areas of work: liquid chromatography, gas chromatography, mass spectrometry, spectroscopy, software and informatics, lab automation and robotics, automated electrophoresis and microfluidics, vacuum technology and cell analysis.
Our key product and applications include the following technologies:
Liquid Chromatography
A liquid chromatograph ("LC") or a high performance liquid chromatograph (“HPLC”) is used to separate molecules of a liquid mixture to determine the quantity and identity of the molecules present. The Agilent LC portfolio is modular in construction and can be configured as analytical and preparative systems. These systems can be stepwise upgraded to highly sophisticated, automated workflow solutions such as method development, multi‑method/walk-up, high-capacity/high-throughput or multi‑dimensional LC and can be extended to application‑based analyzers e.g. for bio-molecular separations, chiral analysis or size exclusion chromatography. As a leader in liquid chromatography, we continue to expand our application space with new HPLC columns, new services and diagnostics offerings and ongoing instrument and software product enhancements.
Gas Chromatography
Agilent is the world's leading provider of gas chromatographs, both laboratory and portable models. GC's are used to separate any gas, liquid or solid that can be vaporized and then detect the molecules present to determine their identity and quantity. Agilent provides custom or standard analyzers configured for specific chemical analysis applications, such as detailed speciation of a complex hydrocarbon stream, calculation of gas calorific values in the field, or analysis of a new bio-fuel formulation. We also offer related software, accessories and consumable products for these and other similar instruments.
Mass Spectrometry
A mass spectrometer (“MS”) identifies and quantifies chemicals based on a chemical's molecular mass and characteristic patterns of fragment ion masses that result when a molecule is broken apart. Liquid chromatography is commonly used to separate compounds and introduce them to the MS system. The combined use of LC and MS is frequently used both to identify and quantify chemical compounds. Mass spectrometry is an important tool in analyzing small molecules and can also be used to characterize and quantify proteins and other biological entities. Agilent's LCMS portfolio includes instruments built around four main analyzer types - single quadrupole, triple quadrupole, time-of-flight (“TOF”) and quadrupole time-of-flight (“QTOF”). We significantly expanded our mass spectrometry portfolio in recent years with a focus on improving performance, sensitivity, and ease of use.
Spectroscopy
Spectroscopy is a technique for analyzing the individual chemical components of substances based on the absorption or emission of electromagnetic radiation of specific wavelengths of light. Our spectroscopy instruments include AA spectrometers, microwave plasma-atomic emission spectrometers (“MP-AES”), ICP-OES, ICP-MS, fluorescence spectrophotometers, ultraviolet- visible ("UV-Vis") spectrophotometers, Fourier Transform infrared ("FT-IR") spectrophotometers, near-infrared ("NIR") spectrophotometers, Raman spectrometers and sample automation products. We also offer related software, accessories and consumable products for these and other similar instruments.
Software and Informatics
We provide software for instrument control, data acquisition, data analysis, laboratory content and business process management, and informatics. Our software facilitates the compliant use of instruments in pharmaceutical quality assurance/quality control environments. With our OpenLab Laboratory Software Suite, Agilent has a scalable, open software platform that enables customers to capture, analyze, and share scientific data throughout the lab and across the enterprise.
Lab Automation and Robotics
We offer a comprehensive suite of workflow solutions to our life science customers with the addition of automated liquid handling and robotics that range from standalone instrumentation to bench-top automation solutions. These solutions strengthen our offering of automated sample preparation solutions across a broad range of applications.
5
Automated Electrophoresis and Microfluidics
Automated electrophoresis is a separation technique for bio molecules such as proteins, peptides and nucleic acids (RNA and DNA) and is used to determine the identity of a molecule by either size or charge. It is widely used as a QC tool to check sample integrity prior to subsequent analysis. Prominent examples are nucleic acid preparation products in front of polymerase chain reaction, NGS and microarrays.
Vacuum Technology
Our vacuum technologies products are used to create, control, measure and test vacuum environments in life science, industrial and scientific applications where ultra-clean, high-vacuum environments are needed. Vacuum technologies' customers are typically OEMs that manufacture equipment for these applications, or government and research organizations that require vacuum solutions in their facilities. Products include a wide range of high and ultra-high vacuum pumps (diffusion, turbomolecular and ion getter), intermediate vacuum pumps (rotary vane, sorption and dry scroll), vacuum instrumentation (vacuum control instruments, sensor gauges and meters) and vacuum components (valves, flanges and other mechanical hardware). These products also include helium mass spectrometry and helium-sensing leak detection instruments used to identify and measure leaks in hermetic or vacuum environments. In addition to product sales, we also offer a wide range of services including an exchange and rebuild program, assistance with the design and integration of vacuum systems, applications support and training in basic and advanced vacuum technologies.
Cell Analysis
Our cell analysis tools are used to study cell signaling pathways and function through metabolic profile analysis for cells. The multi-well plate assays and readers are used to understand the impact of stimuli on cells as part of the drug development process. Cell analysis customers are typically academia and pharma companies who need to assess the metabolic state of the cell and use mass spectrometry to study the related metabolites as part of research and drug development processes.
Life Sciences and Applied Markets Customers
We had approximately
26,000
customers for our life sciences and applied markets business in fiscal
2017
. No single customer represented a material amount of the net revenue of the life sciences and applied markets business. A significant number of our life sciences and applied markets customers are also customers of our Agilent CrossLab business.
The life sciences and applied markets business is susceptible to seasonality in its orders and revenues primarily related to U.S. and foreign government budgets, chemical and energy and environmental customers and large pharmaceutical company budgets. Historically, the result is that our first and fourth fiscal quarters tend to deliver the strongest profits for this group. However, general economic trends, new product introductions and competition might overshadow this trend in any given year.
Life Sciences and Applied Markets Sales, Marketing and Support
The life science and applied markets channels focus on the therapeutics and human disease research customer base (pharma, biotech, CRO, CMO and generics), clinical customer base (high complexity clinical testing labs) and on emerging life sciences opportunities in life science research institutes. We deploy a multi-channel approach, marketing products to our customers through direct sales, electronic commerce, resellers, manufacturers' representatives and distributors. We primarily use direct sales to market our solutions to our pharmaceutical, biopharmaceutical and clinical accounts. Sales agents supplement direct sales by providing broader geographic coverage and coverage of smaller accounts. Our active reseller program augments our ability to provide more complete solutions to our customers. We sell our consumable products through distributors, electronic commerce and direct sales.
Our products typically come with standard warranties, and extended warranties are available for additional cost.
Life Sciences and Applied Markets Manufacturing
Our manufacturing supports our diverse product range and customer‑centric focus. We assemble highly configurable products to individual customer orders and make standard products to stock. We employ advanced manufacturing techniques and supply chain management systems to reduce costs and manufacturing cycle times. Our manufacturing process then converts these designs into standard as well as custom products for shipment to customers. We selectively use third parties to provide some supply chain processes for manufacturing, warehousing and logistics. We have manufacturing facilities in California, Delaware and Massachusetts in the U.S. Outside of the U.S., we have manufacturing facilities in Germany, Malaysia and Singapore. We have FDA registered sites in California, Germany and Singapore.
6
Life Sciences and Applied Markets Competition
The markets for analytical instruments in which we compete are characterized by evolving industry standards and intense competition. Our principal competitors in the life sciences and applied markets arena include: Danaher Corporation, PerkinElmer Inc., Shimadzu Corporation, Thermo Fisher Scientific Inc. and Waters Corporation. Agilent competes on the basis of product performance, reliability, support quality, applications expertise, global channel coverage and price.
Diagnostics and Genomics Business
Our diagnostics and genomics business includes the genomics, nucleic acid contract manufacturing and research and development, pathology, companion diagnostics and reagent partnership businesses.
Our diagnostics and genomics business is comprised of five areas of activity providing active pharmaceutical ingredients ("APIs") for oligo-based therapeutics as well as solutions that include reagents, instruments, software and consumables, which enable customers in the clinical and life sciences research areas to interrogate samples at the cellular and molecular level. First, our genomics business includes arrays for DNA mutation detection, genotyping, gene copy number determination, identification of gene rearrangements, DNA methylation profiling, gene expression profiling, as well as next generation sequencing ("NGS") target enrichment and genetic data management and interpretation support software. This business also includes our new acquisition “Multiplicom” a leading European diagnostics company with state-of-the-art genetic testing technology and products. Multiplicom’s solutions enable clinical labs to identify DNA variants associated with genetic disease and help direct cancer therapy. Second, our nucleic acid solutions business provides equipment and expertise focused on production of synthesized oligonucleotides under pharmaceutical good manufacturing practices ("GMP") conditions for use as active pharmaceutical ingredients ("API") in an emerging class of drugs that utilize nucleic acid molecules for disease therapy. Next, our pathology solutions business is focused on product offerings to cancer diagnostics and anatomic pathology workflows. The broad portfolio of offerings includes immunohistochemistry (“IHC”), in situ hybridization (“ISH”), hematoxylin and eosin (“H&E”) staining and special staining. We also collaborate with a number of major pharmaceutical companies to develop new potential pharmacodiagnostics, also known as companion diagnostics, which may be used to identify patients most likely to benefit from a specific targeted therapy. Finally, the reagent partnership business is a provider of reagents used for turbidimetry and flow cytometry.
We employed approximately
2,200
people as of
October 31, 2017
in our diagnostics and genomics business. This business generated revenue of
$0.8 billion
in fiscal
2017
,
$0.7 billion
in fiscal
2016
, and
$0.7 billion
in fiscal
2015
.
Diagnostics and Genomics Market
Within diagnostics and genomics business, we focus primarily on the diagnostics and clinical market. A significant part of our clinical diagnostic customers are in pathology labs throughout the world. Our high-quality, automated pathology tissue staining platforms and solutions are used most heavily by the large labs located in hospitals, medical centers, and reference labs. The market is skewed towards mature economies, with most of the market in North America, Western Europe and Japan. The mix is changing, however, as emerging markets increase spending on human health.
The clinical market for genomics consists of high complexity clinical labs performing patient testing, including “for-profit” reference laboratories, hospital labs, and molecular diagnostic companies. While these labs primarily purchase in vitro diagnostics (“IVD”) labeled testing kits, they often develop and validate their own molecular based tests. Analyte Specific Reagents (“ASRs”) are often used by these labs.
Diagnostics and Genomics Products
Our products fall into six main areas of work: pathology products, specific proteins and flow reagents, target enrichment, cytogenetic research solutions and microarrays, PCR and qPCR instrumentation and molecular biology reagents and nucleic acid solutions.
Pathology
This area consists of routine clinical solutions for tissue based cancer diagnostics with solutions that comprise antibodies, reagents, instruments and software targeting both primary and advanced cancer diagnostics. Our CoverStainer and Artisan based product families target primary cancer diagnostics through Hematoxylin and Eosin staining as well as Special Stains for additional insights and detection of potentially carcinogenic tissue. In the fourth quarter of 2013, we launched our new combined IHC/ISH platform, Dako Omnis. The Dako Omnis and Autostainer based IHC solution and Instant Quality Fluorescence In Situ Hybridization
7
("IQFISH") technologies provide advanced tumor typing through investigation of protein and gene expression. These products also include companion diagnostic tests that are used to help identify patients most likely to benefit from a specific targeted therapy.
Specific Proteins and Flow Reagents
Our reagent OEM business is a provider of clinical diagnostic products within the areas of specific proteins for turbidimetry and reagents for flow cytometry. These are sold to OEM customers as customized reagent solutions supplied to top IVD companies or through retail partners.
Companion Diagnostics
In our Companion Diagnostics business, we partner with a number of major pharmaceutical companies to develop new potential pharmacodiagnostics, which may be used to identify patients most likely to benefit from a specific targeted therapy.
Target Enrichment
Agilent continues to be a strong player in the next generation sequencing market. We provide a target enrichment portfolio composed of two main platforms, SureSelect and HaloPlex, both enabling customers to select specific target regions of the genome for sequencing. Customers can customize our products for their regions of interest using the SureDesign software, or they can choose from a wide range of catalog products, including gene panels for specific applications and Exome designs, which allow analysis of the entire coding sequences of the genome. After preparing samples with SureSelect and HaloPlex, products can be sequenced in the main next generation sequencing platforms available in the market. The technologies provide an easy sample prep workflow that can be automated with the Agilent Bravo platform for scalability. HaloPlex provides less-than-24-hours fast workflow, which makes it suitable for labs that require fast turnaround time from sample to results. These products are used for mutation detection and genotyping. Results can be easily analyzed using Agilent software solutions GeneSpring or SureCall. Our solutions also enable clinical labs to identify DNA variants associated with genetic diseases and help direct cancer therapy.
Cytogenetic Research Solutions and Microarrays
Agilent is a leading provider of microarrays for Comparative Genomic Hybridization (“CGH”), mostly used by customers in cytogenetic laboratories. The arrays allow customers to detect genome-wide copy number alterations, with high levels of resolution (from entire chromosomal copy number changes to specific microdeletions or duplications). The arrays are offered in many formats allowing the customers to choose from different levels of resolution and number of samples per arrays. Arrays can also be customized using the SureDesign software. In addition to the microarrays, Agilent's solution includes reagents for sample processing, hardware for reading the microarrays, and software to help users view the data in a meaningful way. In addition to the CGH portfolio, the cytogenetics solution comprises a line of oligonucleotide probes for Fluorescent In Situ Hybridization ("FISH") called SureFISH. Over 400 probes are available in our catalog, covering most relevant regions in the genome. Cytogenetic labs can use SureFISH probes to detect specific translocations or copy number changes in samples. Additionally, Agilent provides a wide range of microarrays to the research market for different types of applications: gene expression, microRNA, methylation, splice variants, and chromatin immunoprecipitation applications. Arrays are offered as catalog designs or customizable designs, with no minimum order size and short delivery time, which differentiates us from other vendors and enables researchers the maximum flexibility in their studies. Our end-to-end solution includes reagents for sample preparation and microarray processing; hardware for sample QC and high-throughput microarray scanning; microarrays on industry-standard 1” × 3” glass slides for key applications; custom microarray design services; and GeneSpring and CytoGenomics software products for data analysis.
PCR and qPCR Instrumentation and Molecular Biology Reagents
Polymerase Chain Reaction (“PCR”) is a standard laboratory method used to amplify the amount of genetic material of a given sample to enable further interrogation. Quantitative PCR (“qPCR”) or real time PCR is also a standard method used in genomic research facilities to measure the amount of a specific nucleic acid sequence within a sample. There are several applications for qPCR, among the most common are identifying the expression level of a specific gene, or calculating the amount of a specific pathogen present in a sample. Agilent offers a complete portfolio of PCR & qPCR instruments, as well as specialty enzymes for amplifying difficult sample types. In addition to PCR and qPCR enzymes, Agilent offers a wide range of molecular biology reagents including tools for cloning and mutagenesis applications.
Nucleic Acid Solutions
Our Nucleic Acid Solutions division ("NASD") is a contract manufacturing and development services business with equipment and expertise focused on mid to large scale production of synthesized oligonucleotide APIs (Active Pharmaceutical
8
Ingredients) under pharmaceutical GMP conditions for an emerging class of drugs that utilize oligonucleotide molecules for disease therapy. State of the art for these drugs has advanced from single strand DNA molecules to complex, highly modified molecules including antisense, aptamers, double-stranded RNA, and RNA mixtures. These advancements in the technology have greatly improved the efficacy of delivery and stability of the oligos in-vivo. NASD offers industry leading experience to efficiently advance our customer’s oligo drug candidates from clinical trials to commercial launch with a common goal of patient health and safety.
Diagnostics and Genomics Customers
We had approximately
11,000
customers for our diagnostics and genomics business in fiscal
2017
. No single customer represented a material amount of the net revenue of the diagnostics and genomics business.
Diagnostics and Genomics Sales, Marketing and Support
The diagnostics and genomics channels focus on the therapeutics and human disease research customer base (pharma, biotech, CRO, CMO and generics), clinical customer base (pathology labs and high complexity clinical testing labs) and on emerging life sciences opportunities in life science research institutes. We deploy a multi-channel approach, marketing products to our customers through direct sales, electronic commerce, resellers, manufacturers' representatives and distributors. We primarily use direct sales to market our solutions to our pharmaceutical, biopharmaceutical and clinical accounts. Sales agents supplement direct sales by providing broader geographic coverage and coverage of smaller accounts. Our active reseller program augments our ability to provide more complete solutions to our customers. We sell our consumable products through distributors, telesales, electronic commerce and direct sales. We utilize telesales for more mature product lines, as well as for reorders of reagent products.
Diagnostics and Genomics Manufacturing
Our manufacturing supports our diverse product range and customer-centric focus. We assemble highly configurable products to individual customer orders and make standard products to stock. We employ advanced manufacturing techniques and supply chain management systems to reduce costs and manufacturing cycle times. We selectively use third parties to provide some supply chain processes for manufacturing, warehousing and logistics. We have manufacturing facilities in California, Colorado and Texas in the U.S. Outside of the U.S., we have manufacturing facilities in Denmark, Malaysia and Germany. Our FDA registered sites include California, Colorado, Texas and Denmark. We utilize just-in-time manufacturing and so typically do not maintain a high level of inventory.
Diagnostics and Genomics Competition
The markets for diagnostics and genomics analytical products in which we compete are characterized by evolving industry standards and intense competition. Our principal competitors in the diagnostics and genomics arena include: Roche Ventana Medical Systems, Inc., a member of the Roche Group, Leica Biosystems, Inc., a division of Danaher Corporation, Abbott Laboratories, Ilumina, Inc. and Affymetrix, Inc., a division of Thermo Fisher Scientific Inc. Agilent competes on the basis of product performance, reliability, support quality, applications expertise, whole solution offering, global channel coverage and price.
Diagnostics and Genomics Government Regulation
Some of the products the diagnostics and genomics business sells are subject to regulatory approval by the FDA and other regulatory bodies throughout the world. These regulations govern a wide variety of product related activities, from quality management, design and development to labeling, manufacturing, promotion, sales and distribution. We continually invest in our manufacturing infrastructure to gain and maintain certifications necessary for the level of clearance.
Agilent CrossLab Business
The Agilent CrossLab business spans the entire lab with its extensive consumables and services portfolio, which is designed to improve customer outcomes. The majority of the portfolio is vendor neutral, meaning Agilent can serve and supply customers regardless of their instrument purchase choices. Solutions range from chemistries and supplies to services and software helping to connect the entire lab. Key product categories in consumables include GC and LC columns, sample preparation products, custom chemistries, and a large selection of laboratory instrument supplies. Services include startup, operational, training and compliance support, software as a service, as well as asset management and consultative services that help increase customer productivity. Custom service and consumable bundles are tailored to meet the specific application needs of various industries and to keep instruments fully operational and compliant with the respective industry requirements.
9
Our Agilent CrossLab business employed approximately
4,500
people as of
October 31, 2017
. Our Agilent CrossLab business generated
$1.5 billion
in revenue in fiscal
2017
,
$1.4 billion
in revenue in fiscal
2016
and
$1.3 billion
in revenue in fiscal
2015
.
Agilent CrossLab Markets
The Pharmaceutical, Biotechnology, CRO & CMO Market.
Our services and consumable products support customers in this market that consists of “for-profit” companies who participate across the pharmaceutical value chain in the areas of therapeutic research, discovery and development, clinical trials, manufacturing and quality assurance and quality control. One sub-segment of this market is core and emerging pharmaceutical companies (“pharma”). A second sub-segment includes biotechnology companies (“biotech”), contract research organizations (“CROs”) and contract manufacturing organizations (“CMOs”). Biotech companies and, to a somewhat lesser extent, CROs and CMOs typically participate in specific points in the pharmaceutical industry value chain. Additionally, due to the relatively low drug efficacy within oncology, pharma companies are partnering with diagnostic companies to bring validated tests to the market with their new drugs.
The Life Science Research Market.
Our services and consumable products support customers in this market that consists primarily of “not-for-profit” organizations and includes academic institutions, large government institutes and privately funded organizations. The life science research market plays an influential role in technology adoption and therapeutic developments for pharmaceutical and molecular diagnostics companies. After decades of investment in basic biomedical research by government funding bodies, the focus has widened to include translational research - multidisciplinary scientific efforts directed at accelerating therapy development.
The Chemical & Energy Market.
The natural gas and petroleum refining markets use our services and consumable products to support their quality control and environmental safety reviews.
The Environmental & Forensics Market.
Our services and consumable products support the environmental industry customers that perform laboratory and field analysis of chemical pollutants in air, water, soil and solid waste. Environmental industry customers include all levels of government, the industrial and manufacturing sectors, engineering and consulting companies, commercial testing laboratories and colleges and universities. Our services and consumable products also support drug testing and forensics laboratories that are involved with analyzing evidence associated with crime, screening athletes for performance enhancing drugs, analyzing samples for recreational drugs, or detecting and identifying biological and chemical warfare agents. Customers include local, state, federal, and international law enforcement agencies and commercial testing laboratories.
The Food Market.
Our services and consumable products support the food production chain, including incoming inspection, new product development, quality control and assurance, and packaging.
The Diagnostics and Clinical Market
. Our services and consumable products support clinical diagnostic customers in pathology labs throughout the world. The market is skewed towards the mature economies, with most of the market in North America, Western Europe and Japan. The mix is changing, however, as emerging markets increase spending on human health.
Agilent CrossLab Applications
Chemistries and Supplies
We offer a broad range of consumable products, which support our technology platforms, including sample preparation consumables such as solid phase extraction ("SPE") and filtration products, self-manufactured GC and LC columns, chemical standards, and instrument replacement parts. Consumable products also include scientific instrument parts and supplies such as filters and fittings for GC systems; xenon lamps and cuvettes for UV-Vis-NIR, fluorescence, FT-IR and Raman spectroscopy instruments; and graphite furnace tubes, hollow cathode lamps and specialized sample introduction glassware for our AA, ICP-OES and ICP-MS products.
Services and Support
We offer a wide range of startup, operational, educational and compliance support services for our measurement and data handling systems. Our support services include maintenance, troubleshooting, repair and training for all of our chemical and bioanalytical instrumentation hardware and software products. Special service bundles have also been designed to meet the specific application needs of various industries. As customers continue to outsource laboratory operations and consolidate suppliers, our enterprise services consist of a broad portfolio of integrated laboratory management services including instrument services, lab supply management, asset management, procurement, informatics and scientific services.
10
Remarketed Instruments
We refurbish and resell certified pre-owned instruments to value oriented customers who demand Agilent quality and performance at a budget conscious price.
Agilent CrossLab Customers
We had approximately
49,000
Agilent CrossLab customers in fiscal
2017
and no single customer represented a material amount of the net revenue of the Agilent CrossLab business. A significant number of our Agilent CrossLab customers are also customers of our life sciences and applied markets business.
The service and consumables business is mostly recurring in nature, and is not as susceptible to market seasonality and industry cycles in comparison to our instrument businesses. The vendor neutral portion of the portfolio allows the business to perform relatively independent from our instrument business.
Agilent CrossLab Sales, Marketing and Support
We deploy a multi-channel approach, marketing products and services to our customers through direct sales, electronic commerce, resellers, manufacturers' representatives and distributors. We primarily use direct sales to market our solutions to our large accounts. Sales agents supplement direct sales by providing broader geographic coverage and coverage of smaller accounts. Our active reseller program augments our ability to provide more complete solutions to our customers. We utilize telesales to enhance the transactional sales model of our products. All channels are supported by technical product and application specialists to meet our customer’s specific requirements.
We deliver our support services to customers in a variety of ways, including on-site assistance with repair or exchange of returned products, telephone support and self-diagnostic services provided over the Internet. We also offer special industry-focused service bundles that are designed to meet the specific needs of hydrocarbon processing, environmental, pharmaceutical and biopharmaceutical customers to keep instruments fully operational and compliant with the respective industry requirements. Our products typically come with standard warranties, and extended warranties are available for additional cost.
Agilent CrossLab Manufacturing
Our primary manufacturing sites for the consumables business are in California and Delaware in the U.S., and outside of the U.S. in the Netherlands and the United Kingdom. Our direct service delivery organization is regionally based operating in 30 countries.
Agilent CrossLab Competition
Our principal competitors in the services and consumable products arena include many of our competitors from the instrument business, such as: Danaher Corporation, PerkinElmer Inc., Shimadzu Corporation, Thermo Fisher Scientific Inc. and Waters Corporation, as well as numerous niche consumables and service providers. Agilent competes on the basis of product performance, reliability, support quality, applications expertise, global channel coverage and price.
Agilent Technologies Research Laboratories
Agilent Technologies Research Laboratories ("Research Labs") is our research organization based in Santa Clara, California. The Research Labs create competitive advantage through high-impact technology, driving market leadership and growth in Agilent's core businesses and expanding Agilent's footprint into adjacent markets. At the cross-roads of the organization, the Research Labs are able to identify and enable synergies across Agilent's businesses to create competitive differentiation and compelling customer value.
The technical staff have advanced degrees that cover a wide range of scientific and engineering fields, including biology, chemistry, distributed measurement, image processing, mathematics, nano/microfabrication, microfluidics, software, physics and physiology.
11
Global Infrastructure Organization
We provide support to our businesses through our global infrastructure organization. This support includes services in the areas of finance, legal, workplace services, human resources and information technology. Generally, these organizations are managed from Santa Clara, California, with operations and services provided worldwide. As of the end of
October 2017
, our global infrastructure organization employed approximately
2,600
people worldwide.
Agilent Order Fulfillment Organizations
Our order fulfillment and supply chain organization (“OFS”) centralizes all order fulfillment and supply chain operations in our businesses. OFS provides resources for manufacturing, engineering and strategic sourcing to our respective businesses. In general, OFS employees are dedicated to specific businesses and the associated costs are directly allocated to those businesses.
The following discussions of Research and Development, Backlog, Intellectual Property, Materials, Environmental, International Operations and Acquisition and Disposal of Material Assets include information common to each of our businesses.
Research and Development
Research and development ("R&D") expenditures were
$339 million
in
2017
,
$329 million
in
2016
and
$330 million
in
2015
. We anticipate that we will continue to have significant R&D expenditures in order to maintain our competitive position with a continuing flow of innovative, high-quality products and services.
Backlog
We believe that backlog is not a meaningful indicator of future business prospects for our business segments since a significant portion of our revenue for a given quarter is derived from the current quarter's orders. Therefore, we believe that backlog information is not material to an understanding of our business.
Intellectual Property
We generate patent and other intellectual property rights covering significant inventions and other innovations in order to create a competitive advantage. While we believe that our licenses, patents and other intellectual property rights have value, in general no single license, patent or other intellectual property right is in itself material. In addition, our intellectual property rights may be challenged, invalidated or circumvented or may otherwise not provide significant competitive advantage.
Materials
Our life sciences and applied markets, diagnostics and genomics and Agilent CrossLab businesses all purchase materials from thousands of suppliers on a global basis. Some of the parts that require custom design work are not readily available from alternate suppliers due to their unique design or the length of time necessary for design work. Our long-term relationships with suppliers allow us to proactively manage technology road maps and product discontinuance plans and monitor their financial health. To address any potential disruption in our supply chain, we use a number of techniques, including qualifying multiple sources of supply and redesign of products for alternative components. In addition, while we generally attempt to keep our inventory at minimal levels, we do purchase incremental inventory as circumstances warrant to protect the supply chain.
Environmental
Our R&D, manufacturing and distribution operations involve the use of hazardous substances and are regulated under international, federal, state and local laws governing health and safety and the environment. We apply strict standards for protection of the environment and occupational health and safety to sites inside and outside the U.S., even if not subject to regulation imposed by foreign governments. We believe that our properties and operations at our facilities comply in all material respects with applicable environmental laws and occupational health and safety laws. We are also regulated under a number of international, federal, state, and local laws regarding recycling, product packaging and product content requirements. We believe we are substantially in compliance with such environmental, product content/disposal and recycling laws.
We maintain a comprehensive Environmental Site Liability insurance policy which may cover certain clean-up costs or legal claims related to environmental contamination. This policy covers specified active, inactive and divested locations.
12
International Operations
Our net revenue originating outside the U.S., as a percentage of our total net revenue, was approximately
71 percent
in fiscal
2017
,
70 percent
in fiscal
2016
and
70 percent
in fiscal
2015
, the majority of which was from customers other than foreign governments. Annual revenues derived from China including Hong Kong were approximately
20 percent
in fiscal
2017
,
20 percent
in fiscal
2016
and
17 percent
in fiscal
2015
. Revenues from external customers are generally attributed to countries based on where we ship the products or provide the services.
Long-lived assets located outside of the U.S., as a percentage of our total long-lived assets, was approximately
46 percent
in fiscal year
2017
and
44 percent
in fiscal year
2016
.
Most of our sales in international markets are made by foreign sales subsidiaries. In countries with low sales volumes, sales are made through various representatives and distributors. However, we also sell into international markets directly from the U.S. Financial information about our international operations is contained in Note 19, "Segment Information", to our consolidated financial statements.
Acquisition and Disposal of Material Assets
On September 19, 2013, Agilent announced plans to separate into two publicly traded companies, one comprising of the life sciences, diagnostics and chemical analysis businesses that retained the Agilent name, and the other one that comprised of the electronic measurement business that was renamed Keysight Technologies, Inc. (“Keysight”). Keysight was incorporated in Delaware as a wholly-owned subsidiary of Agilent on December 6, 2013. On November 1, 2014, we completed the distribution of 100% of the outstanding common shares of Keysight to Agilent stockholders who received one share of Keysight common stock for every two shares of Agilent held as of the close of business on the record date, October 22, 2014.
Executive Officers of the Registrant
The names of our current executive officers and their ages, titles and biographies appear below:
Henrik Ancher-Jensen, 52
, has served as Senior Vice President, Agilent and President, Order Fulfillment since September 2013. From September 2012 to September 2013, Mr. Ancher-Jensen served as our Vice President, Global Product Supply, Diagnostics and Genomics Group. From September 2010 to September 2012 he served as Corporate Vice President, Global Operations of Dako A/S, a Danish diagnostics company, and as Dako’s Vice President, Supply Chain and Chief Information Officer from 2006 to September 2010. Prior to joining Dako, he spent more than 15 years in senior management roles and management consulting with Chr. Hansen, Deloitte Consulting and NVE.
Mark Doak
, 62, has served as our Senior Vice President, Agilent and President, Agilent CrossLab Group (formerly a group within the Life Sciences & Applied Markets Group) since September 2014. From August 2008 to September 2014, Mr. Doak served as our Vice President and General Manager of the Services and Support Division. Prior to that, he held several senior management positions across functions in marketing, quality and services.
Rodney Gonsalves,
52, has served as our Vice President, Corporate Controllership and Chief Accounting Officer since May 2015. From September 2009 to May 2015, Mr. Gonsalves served as Vice President and operational CFO for various business groups within the Company, most recently for the Life Sciences and Applied Markets Group. From January 2007 to August 2009 he served as our vice president of Investor Relations. Prior to assuming this position, Mr. Gonsalves served in various capacities for Agilent, including as controller, corporate governance and customer financing in Agilent’s Global Infrastructure Organization, and controller for the Photonics Systems Business Unit. Prior to joining Agilent, Mr. Gonsalves held a variety of positions in finance with Hewlett- Packard Co. Mr. Gonsalves holds a master’s degree in business administration from Santa Clara University in California.
Dominique P. Grau
58, has served as our Senior Vice President, Human Resources since August 2014. From May 2012 to August 2014 Mr. Grau served as Vice President, Worldwide Human Resources. Prior to that, he served as Vice President, Compensation, Benefits and HR Services from May 2006 to May 2012. Mr. Grau had previously served in various capacities for Agilent and Hewlett-Packard Company.
Didier Hirsch,
66, has served as our Senior Vice President and Chief Financial Officer since July 2010 and served as interim Chief Financial Officer from April 2010 to July 2010. Prior to that he served as Vice President, Corporate Controllership and Tax from November 2006 to July 20, 2010 and as Chief Accounting Officer from November 2007 to July 20, 2010. From April 2003 to October 2006, Mr. Hirsch served as Vice President and Controller. Prior to assuming this position, Mr. Hirsch served as Vice
13
President and Treasurer from September 1999 to April 2003. Mr. Hirsch had joined Hewlett‑Packard Company in 1989 as Director of Finance and Administration of Hewlett‑Packard France. In 1993, he became Director of Finance and Administration of Hewlett‑ Packard Asia Pacific, and in 1996 Director of Finance and Administration of Hewlett‑ Packard Europe, Middle East, and Africa. Mr. Hirsch serves on the Board of Directors of Logitech International and Knowles Corporation.
Patrick K. Kaltenbach, 54
, has served as Senior Vice President, Agilent and President, Life Sciences and Applied Markets Group since November 2014. From January 2014 to November 2014 he served as Vice President and General Manager of the Life Sciences Products and Solutions organization. Prior to that he served as Vice President and General Manager of the Liquid Phase Division from December 2012 to January 2014. From July 2010 to December 2012 he served as Vice President and General Manager of the Liquid Phase Separations Business. Prior to that he served as General Manager of the Liquid Chromatography Business from February 2008 to July 2010. Mr. Kaltenbach has held various positions in R&D management and senior management beginning at Hewlett-Packard Co.
Michael R. McMullen
, 56, has served as Chief Executive Officer since March 2015 and as President since September 2014. From September 2014 to March 2015 he also served as Chief Operating Officer. From September 2009 to September 2014 he served as Senior Vice President, Agilent and President, Chemical Analysis Group. From January 2002 to September 2009, he served as our Vice President and General Manager of the Chemical Analysis Solutions Unit of the Life Sciences and Chemical Analysis Group. Prior to assuming this position, from March 1999 to December 2001, Mr. McMullen served as Country Manager for Agilent's China, Japan and Korea Life Sciences and Chemical Analysis Group. Prior to this position, Mr. McMullen served as our Controller for the Hewlett‑Packard Company and Yokogawa Electric Joint Venture from July 1996 to March 1999.
Michael Tang,
43, has served as our Senior Vice President, General Counsel and Secretary since January 2016. From May 2015 to January 2016 he served as Vice President, Assistant General Counsel and Secretary and from November 2013 to April 2015 he served as Vice President, Assistant General Counsel and Assistant Secretary. From March 2012 to October 2013 he served as Business Development Manager in Agilent’s Corporate Development group. From November 2009 to February 2012 he served as Senior Counsel. From August 2006 to October 2009 he served in various capacities in Agilent’s legal department. Prior to joining Agilent, Mr. Tang represented public and private technology companies in a broad range of corporate and securities matters at Wilson Sonsini Goodrich & Rosati, a Palo Alto, California, law firm and Fenwick & West LLP, a Mountain View, California, law firm.
Jacob Thaysen
, 42, has served as Senior Vice President, Agilent and President, Diagnostics and Genomics Group since November 2014. From October 2013 to November 2014 he served as Vice President and General Manager of the Diagnostics and Genomics business. Prior to that he served as Vice President and General Manager of the Genomics Solutions unit from January 2013 to October 2013. Before joining Agilent, he was Corporate Vice President of R&D at Dako A/S, a Danish diagnostics company from April 2011 to January 2013. His previous positions at Dako include Vice President, System Development, R&D from March 2010 to April 2011, Vice President, Strategic Marketing from April 2009 to March 2010 and Vice President, Global Sales Operations from August 2008 to March 2009.
Prior to Dako, Mr. Thaysen worked as a management consultant and Chief Technical Officer and founder of a high-tech start-up company.
Investor Information
We are subject to the informational requirements of the Securities Exchange Act of 1934 (“Exchange Act”). Therefore, we file periodic reports, proxy statements and other information with the Securities and Exchange Commission (“SEC”). Such reports, proxy statements and other information may be read and copied by visiting the Public Reference Room of the SEC at 100 F Street N.E., Washington, D.C. 20549. You may obtain information on the operation of the Public Reference Room by calling the SEC at 1-800-SEC-0330. In addition, the SEC maintains an Internet site (http://www.sec.gov) that contains reports, proxy and information statements and other information regarding issuers that file electronically.
Our financial and other information can be accessed at our Investor Relations website. The address is www.investor.agilent.com. We make available, free of charge, copies of our annual report on Form 10-K, quarterly reports on Form 10-Q, current reports on Form 8-K and amendments to those reports filed or furnished pursuant to Section 13(a) or 15(d) of the Exchange Act as soon as reasonably practicable after filing such material electronically or otherwise furnishing it to the SEC.
Our Amended and Restated Bylaws, Corporate Governance Standards, the charters of our Audit and Finance Committee, our Compensation Committee, our Executive Committee and our Nominating/Corporate Governance Committee, as well as our Standards of Business Conduct (including code of ethics provisions that apply to our principal executive officer, principal financial officer, principal accounting officer and senior financial officers) are available on our website at www.investor.agilent.com under “Corporate Governance”. These items are also available in print to any stockholder in the United States and Canada who requests
14
them by calling (877) 942-4200. This information is also available by writing to the company at the address on the cover of this Annual Report on Form 10-K.
Our operating results and financial condition could be harmed if the markets into which we sell our products decline or do not grow as anticipated.
Visibility into our markets is limited. Our quarterly sales and operating results are highly dependent on the volume and timing of orders received during the fiscal quarter, which are difficult to forecast and may be cancelled by our customers. In addition, our revenue and earnings forecasts for future fiscal quarters are often based on the expected seasonality of our markets. However, the markets we serve do not always experience the seasonality that we expect as customer spending policies and budget allocations, particularly for capital items, may change. Any decline in our customers' markets or in general economic conditions would likely result in a reduction in demand for our products and services. Also, if our customers' markets decline, we may not be able to collect on outstanding amounts due to us. Such declines could harm our consolidated financial position, results of operations, cash flows and stock price, and could limit our profitability. Also, in such an environment, pricing pressures could intensify. Since a significant portion of our operating expenses is relatively fixed in nature due to sales, research and development and manufacturing costs, if we were unable to respond quickly enough these pricing pressures could further reduce our operating margins.
If we do not introduce successful new products and services in a timely manner to address increased competition through frequent new product and service introductions, rapid technological changes and changing industry standards, our products and services may become obsolete, and our operating results may suffer.
We generally sell our products in industries that are characterized by increased competition through frequent new product and service introductions, rapid technological changes and changing industry standards. Without the timely introduction of new products, services and enhancements, our products and services may become technologically obsolete over time, in which case our revenue and operating results could suffer. The success of our new products and services will depend on several factors, including our ability to:
|
•
|
properly identify customer needs and predict future needs;
|
|
•
|
innovate and develop new technologies, services and applications;
|
|
•
|
appropriately allocate our research and development spending to products and services with higher growth prospects;
|
|
•
|
successfully commercialize new technologies in a timely manner;
|
|
•
|
manufacture and deliver new products in sufficient volumes and on time;
|
|
•
|
differentiate our offerings from our competitors' offerings;
|
|
•
|
price our products competitively;
|
|
•
|
anticipate our competitors' development of new products, services or technological innovations; and
|
|
•
|
control product quality in our manufacturing process.
|
In addition, if we fail to accurately predict future customer needs and preferences or fail to produce viable technologies, we may invest in research and development of products and services that do not lead to significant revenue, which would adversely affect our profitability. Even if we successfully innovate and develop new and enhanced products and services, we may incur substantial costs in doing so, and our operating results may suffer. In addition, promising new products may fail to reach the market or realize only limited commercial success because of real or perceived concerns of our customers. Furthermore, as we collaborate with pharmaceutical customers to develop drugs such as companion diagnostics assays or providing drug components like active pharmaceutical ingredients, we face risks that those drug programs may be cancelled upon clinical trial failures.
General economic conditions may adversely affect our operating results and financial condition.
Our business is sensitive to negative changes in general economic conditions, both inside and outside the United States. Slower global economic growth and uncertainty in the markets in which we operate may adversely impact our business resulting in:
|
•
|
reduced demand for our products, delays in the shipment of orders, or increases in order cancellations;
|
|
•
|
increased risk of excess and obsolete inventories;
|
|
•
|
increased price pressure for our products and services; and
|
|
•
|
greater risk of impairment to the value, and a detriment to the liquidity, of our investment portfolio.
|
15
Failure to adjust our purchases due to changing market conditions or failure to accurately estimate our customers' demand could adversely affect our income.
Our income could be harmed if we are unable to adjust our purchases to reflect market fluctuations, including those caused by the seasonal nature of the markets in which we operate. The sale of our products and services are dependent, to a large degree, on customers whose industries are subject to seasonal trends in the demand for their products. During a market upturn, we may not be able to purchase sufficient supplies or components to meet increasing product demand, which could materially affect our results. In the past we have experienced a shortage of parts for some of our products. In addition, some of the parts that require custom design are not readily available from alternate suppliers due to their unique design or the length of time necessary for design work. Should a supplier cease manufacturing such a component, we would be forced to reengineer our product. In addition to discontinuing parts, suppliers may also extend lead times, limit supplies or increase prices due to capacity constraints or other factors. In order to secure components for the production of products, we may continue to enter into non-cancelable purchase commitments with vendors, or at times make advance payments to suppliers, which could impact our ability to adjust our inventory to declining market demands. If demand for our products is less than we expect, we may experience additional excess and obsolete inventories and be forced to incur additional expenses.
Demand for some of our products and services depends on the capital spending policies of our customers, research and development budgets and on government funding policies.
Our customers include pharmaceutical companies, laboratories, universities, healthcare providers, government agencies and public and private research institutions. Many factors, including public policy spending priorities, available resources, mergers and consolidations, spending priorities, institutional and governmental budgetary policies and product and economic cycles, have a significant effect on the capital spending policies of these entities. Fluctuations in the research and development budgets at these organizations could have a significant effect on the demand for our products and services. Research and development budgets fluctuate due to changes in available resources, consolidation, spending priorities, general economic conditions and institutional and governmental budgetary policies. The timing and amount of revenue from customers that rely on government funding or research may vary significantly due to factors that can be difficult to forecast, including changes in spending authorizations and budgetary priorities for our products and services. If demand for our products and services is adversely affected, our revenue and operating results would suffer.
Economic, political, foreign currency and other risks associated with international sales and operations could adversely affect our results of operations.
Because we sell our products worldwide, our business is subject to risks associated with doing business internationally. We anticipate that revenue from international operations will continue to represent a majority of our total revenue. International revenue and costs are subject to the risk that fluctuations in foreign currency exchange rates could adversely affect our financial results when translated into U.S. dollars for financial reporting purposes. The unfavorable effects of changes in foreign currency exchange rates has decreased revenues by approximately
1
percentage points in the year ended
October 31, 2017
. In addition, many of our employees, contract manufacturers, suppliers, job functions, outsourcing activities and manufacturing facilities are located outside the United States. Accordingly, our future results could be harmed by a variety of factors, including:
|
•
|
interruption to transportation flows for delivery of parts to us and finished goods to our customers;
|
|
•
|
changes in a specific country's or region's political, economic or other conditions;
|
|
•
|
trade protection measures and import or export licensing requirements;
|
|
•
|
negative consequences from changes in tax laws;
|
|
•
|
difficulty in staffing and managing widespread operations;
|
|
•
|
differing labor regulations;
|
|
•
|
differing protection of intellectual property;
|
|
•
|
unexpected changes in regulatory requirements; and
|
|
•
|
geopolitical uncertainty or turmoil, including terrorism and war.
|
We centralized most of our accounting and tax processes to two locations: India and Malaysia. These processes include general accounting, cost accounting, accounts payable, accounts receivables and tax functions. If conditions change in those countries, it may adversely affect operations, including impairing our ability to pay our suppliers and collect our receivables. Our results of operations, as well as our liquidity, may be adversely affected and possible delays may occur in reporting financial results.
16
In addition, although the majority of our products are priced and paid for in U.S. dollars, a significant amount of certain types of expenses, such as payroll, utilities, tax, and marketing expenses, are paid in local currencies. Our hedging programs reduce, but do not always entirely eliminate, within any given twelve-month period, the impact of currency exchange rate movements, and therefore fluctuations in exchange rates, including those caused by currency controls, could impact our business, operating results and financial condition by resulting in lower revenue or increased expenses. For expenses beyond that twelve-month period, our hedging strategy does not mitigate our exposure. In addition, our currency hedging programs involve third party financial institutions as counterparties. The weakening or failure of financial institution counterparties may adversely affect our hedging programs and our financial condition through, among other things, a reduction in available counterparties, increasingly unfavorable terms, and the failure of the counterparties to perform under hedging contracts.
Our strategic initiatives to adjust our cost structure could have long-term adverse effects on our business and we may not realize the operational or financial benefits from such actions.
We have implemented multiple strategic initiatives across our businesses to adjust our cost structure, and we may engage in similar activities in the future. These strategic initiatives and our regular ongoing cost reduction activities may distract management, could slow improvements in our products and services and limit our ability to increase production quickly if demand for our products increases. In addition, delays in implementing our strategic initiatives, unexpected costs or failure to meet targeted improvements may diminish the operational and financial benefits we realize from such actions. Any of the above circumstances could have an adverse effect on our business and operating results and financial condition.
Our business will suffer if we are not able to retain and hire key personnel.
Our future success depends partly on the continued service of our key research, engineering, sales, marketing, manufacturing, executive and administrative personnel. If we fail to retain and hire a sufficient number of these personnel, we will not be able to maintain or expand our business. The markets in which we operate are very dynamic, and our businesses continue to respond with reorganizations, workforce reductions and site closures. We believe our pay levels are competitive within the regions that we operate. However, there is an intense competition for certain highly technical specialties in geographic areas where we continue to recruit, and it may become more difficult to hire and retain our key employees.
Our acquisitions, strategic investments and alliances, joint ventures, exiting of businesses and divestitures may result in financial results that are different than expected.
In the normal course of business, we frequently engage in discussions with third parties relating to possible acquisitions, strategic investments and alliances, joint ventures and divestitures, and generally expect to complete several transactions per year. In addition, we may decide to exit a particular business within our product portfolio. As a result of such transactions, our financial results may differ from our own or the investment community's expectations in a given fiscal quarter, or over the long term. We may have difficulty developing, manufacturing and marketing the products of a newly acquired company in a way that enhances the performance of our combined businesses or product lines. Acquired businesses may also expose us to new risks and new markets and we may have difficulty addressing these risks in a cost effective and timely manner. Transactions such as acquisitions have resulted, and may in the future result in, unexpected significant costs and expenses. In the future, we may be required to record charges to earnings during the period if we determine there is an impairment of goodwill or intangible assets, up to the full amount of the value of the assets, or, in the case of strategic investments and alliances, consolidate results, including losses, of third parties or write down investment values or loans and convertible notes related to the strategic investment.
Integrating the operations of acquired businesses within Agilent could be a difficult, costly and time-consuming process that involves a number of risks. Acquisitions and strategic investments and alliances may require us to integrate and collaborate with a different company culture, management team, business models, business infrastructure and sales and distribution methodologies and assimilate and retain geographically dispersed, decentralized operations and personnel. Depending on the size and complexity of an acquisition, our successful integration of the entity depends on a variety of factors, including introducing new products and meeting revenue targets as expected, the retention of key employees and key customers, increased exposure to certain governmental regulations and compliance requirements and increased costs and use of resources. Further, the integration of acquired businesses is likely to result in our systems and internal controls becoming increasingly complex and more difficult to manage. Any difficulties in the assimilation of acquired businesses into our control system could harm our operating results or cause us to fail to meet our financial reporting obligations.
Even if we are able to successfully integrate acquired businesses within Agilent, we may not be able to realize the revenue and other synergies and growth that we anticipated from the acquisition in the time frame that we expected, and the costs of achieving these benefits may be higher than what we expected. As a result, the acquisition and integration of acquired businesses
17
may not contribute to our earnings as expected, we may not achieve our operating margin targets when expected, or at all, and we may not achieve the other anticipated strategic and financial benefits of this transaction.
A successful divestiture depends on various factors, including our ability to effectively transfer liabilities, contracts, facilities and employees to the purchaser, identify and separate the intellectual property to be divested from the intellectual property that we wish to keep and reduce fixed costs previously associated with the divested assets or business. In addition, if customers of the divested business do not receive the same level of service from the new owners, this may adversely affect our other businesses to the extent that these customers also purchase other Agilent products. In exiting a business, we may still retain liabilities associated with the support and warranty of those businesses and other indemnification obligations. All of these efforts require varying levels of management resources, which may divert our attention from other business operations. If we do not realize the expected benefits or synergies of such transactions, our consolidated financial position, results of operations, cash flows and stock price could be negatively impacted.
If we fail to maintain an effective system of internal controls, we may not be able to accurately report our financial results, which could lead to a loss of investor confidence in our financial statements and have an adverse effect on our stock price.
Effective internal controls are necessary for us to provide reliable and accurate financial statements and to effectively prevent fraud. We devote significant resources and time to comply with the internal control over financial reporting requirements of the Sarbanes Oxley Act of 2002 and continue to enhance our controls. However, we cannot be certain that we will be able to prevent future significant deficiencies or material weaknesses. Inadequate internal controls could cause investors to lose confidence in our reported financial information, which could have a negative effect on investor confidence in our financial statements, the trading price of our stock and our access to capital.
Our customers and we are subject to various governmental regulations, compliance with or changes in such regulations may cause us to incur significant expenses, and if we fail to maintain satisfactory compliance with certain regulations, we may be forced to recall products and cease their manufacture and distribution, and we could be subject to civil or criminal penalties.
Our customers and we are subject to various significant international, federal, state and local regulations, including but not limited to regulations in the areas of health and safety, packaging, product content, employment, labor and immigration, import/export controls, trade restrictions and anti-competition. In addition, a
s a global organization, we are subject to data privacy and security laws, regulations, and customer-imposed controls in numerous
jurisdictions
as a result of having access to and processing confidential, personal, sensitive and/or patient health data in the course of our business.
We must also comply with complex foreign and U.S. laws and regulations, such as the U.S. Foreign Corrupt Practices Act, the U.K. Bribery Act, and other local laws prohibiting corrupt payments to governmental officials, anti-competition regulations and sanctions imposed by the U.S. Office of Foreign Assets Control and other similar laws and regulations. Violations of these laws and regulations could result in fines and penalties, criminal sanctions, restrictions on our business conduct and on our ability to offer our products in one or more countries, and could also materially affect our brand, our ability to attract and retain employees, our international operations, our business and our operating results. Although we have implemented policies and procedures designed to ensure compliance with these laws and regulations, there can be no assurance that our employees, contractors, or agents will not violate our policies.
These regulations are complex, change frequently and have tended to become more stringent over time. We may be required to incur significant expenses to comply with these regulations or to remedy any violations of these regulations. Any failure by us to comply with applicable government regulations could also result in the cessation of our operations or portions of our operations, product recalls or impositions of fines and restrictions on our ability to carry on or expand our operations. In addition, because many of our products are regulated or sold into regulated industries, we must comply with additional regulations in marketing our products. We develop, configure and market our products to meet customer needs created by these regulations. Any significant change in these regulations could reduce demand for our products, force us to modify our products to comply with new regulations or increase our costs of producing these products. If demand for our products is adversely affected or our costs increase, our operating results and business would suffer.
Our products and operations are also often subject to the rules of industrial standards bodies, like the International Standards Organization, as well as regulation by other agencies such as the FDA. We also must comply with work safety rules. If we fail to adequately address any of these regulations, our businesses could be harmed.
We are subject to extensive regulation by the FDA and certain similar foreign regulatory agencies, and failure to comply with such regulations could harm our reputation, business, financial condition and results of operations.
A number of our products are subject to regulation by the FDA and certain similar foreign regulatory agencies. In addition, a number of our products may in the future be subject to regulation by the FDA and certain similar foreign regulatory agencies.
18
These regulations govern a wide variety of product-related activities, from quality management, design and development to labeling, manufacturing, promotion, sales and distribution. If we or any of our suppliers or distributors fail to comply with FDA and other applicable regulatory requirements or are perceived to potentially have failed to comply, we may face, among other things, warning letters, adverse publicity affecting both us and our customers; investigations or notices of non-compliance, fines, injunctions, and civil penalties; import or export restrictions; partial suspensions or total shutdown of production facilities or the imposition of operating restrictions; increased difficulty in obtaining required FDA clearances or approvals or foreign equivalents; seizures or recalls of our products or those of our customers; or the inability to sell our products. Any such FDA or other regulatory agency actions could disrupt our business and operations, lead to significant remedial costs and have a material adverse impact on our financial position and results of operations.
Some of our products are subject to particularly complex regulations such as regulations of toxic substances and failure to comply with such regulations could harm our business.
Some of our products and related consumables are used in conjunction with chemicals whose manufacture, processing, distribution and notification requirements are regulated by the U.S. Environmental Protection Agency (“EPA”) under the Toxic Substances Control Act, and by regulatory bodies in other countries under similar laws. The Toxic Substances Control Act regulations govern, among other things, the testing, manufacture, processing and distribution of chemicals, the testing of regulated chemicals for their effects on human health and safety and the import and export of chemicals. The Toxic Substances Control Act prohibits persons from manufacturing any chemical in the United States that has not been reviewed by EPA for its effect on health and safety, and placed on an EPA inventory of chemical substances. We must ensure conformance of the manufacturing, processing, distribution of and notification about these chemicals to these laws and adapt to regulatory requirements in all applicable countries as these requirements change. If we fail to comply with the notification, record-keeping and other requirements in the manufacture or distribution of our products, then we could be subject to civil penalties, criminal prosecution and, in some cases, prohibition from distributing or marketing our products until the products or component substances are brought into compliance.
Our business may suffer if we fail to comply with government contracting laws and regulations.
We derive a portion of our revenue from direct and indirect sales to U.S., state, local, and foreign governments and their respective agencies. Such contracts are subject to various procurement laws and regulations, and contract provisions relating to their formation, administration and performance. Failure to comply with these laws, regulations or provisions in our government contracts could result in the imposition of various civil and criminal penalties, termination of contracts, forfeiture of profits, suspension of payments, or suspension from future government contracting. If our government contracts are terminated, if we are suspended from government work, or if our ability to compete for new contracts is adversely affected, our business could suffer.
Our reputation, ability to do business and financial statements may be harmed by improper conduct by any of our employees, agents or business partners.
We cannot provide assurance that our internal controls and compliance systems will always protect us from acts committed by employees, agents or business partners of ours (or of businesses we acquire or partner with) that would violate U.S. and/or non-U.S. laws, including the laws governing payments to government officials, bribery, fraud, kickbacks and false claims, pricing, sales and marketing practices, conflicts of interest, competition, export and import compliance, money laundering and data privacy. In particular, the U.S. Foreign Corrupt Practices Act, the U.K. Bribery Act and similar anti-bribery laws in other jurisdictions generally prohibit companies and their intermediaries from making improper payments to government officials for the purpose of obtaining or retaining business, and we operate in many parts of the world that have experienced governmental corruption to some degree. Any such improper actions or allegations of such acts could damage our reputation and subject us to civil or criminal investigations in the United States and in other jurisdictions and related shareholder lawsuits, could lead to substantial civil and criminal, monetary and non-monetary penalties and could cause us to incur significant legal and investigatory fees. In addition, the government may seek to hold us liable as a successor for violations committed by companies in which we invest or that we acquire. We also rely on our suppliers to adhere to our supplier standards of conduct, and material violations of such standards of conduct could occur that could have a material effect on our business, reputation and financial statements.
Our retirement and post retirement pension plans are subject to financial market risks that could adversely affect our future results of operations and cash flows.
We have significant retirement and post retirement pension plan assets and obligations. The performance of the financial markets and interest rates impact our plan expenses and funding obligations. Significant decreases in market interest rates, decreases in the fair value of plan assets and investment losses on plan assets will increase our funding obligations and adversely impact our results of operations and cash flows.
19
The impact of consolidation and acquisitions of competitors is difficult to predict and may harm our business.
The life sciences industry is intensely competitive and has been subject to increasing consolidation. Consolidation in our industries could result in existing competitors increasing their market share through business combinations and result in stronger competitors, which could have a material adverse effect on our business, financial condition and results of operations. We may not be able to compete successfully in increasingly consolidated industries and cannot predict with certainty how industry consolidation will affect our competitors or us.
If we are unable to successfully manage the consolidation and streamlining of our manufacturing operations, we may not achieve desired efficiencies and our ability to deliver products to our customers could be disrupted.
Although we utilize manufacturing facilities throughout the world, we have been consolidating, and may continue to consolidate, our manufacturing operations to certain of our plants to achieve efficiencies and gross margin improvements. Additionally, we typically consolidate the production of products from our acquisitions into our supply chain and manufacturing processes, which are technically complex and require expertise to operate. If we are unable to establish processes to efficiently and effectively produce high quality products in the consolidated locations, we may not achieve the anticipated synergies and production may be disrupted, which could adversely affect our business and operating results.
Our operating results may suffer if our manufacturing capacity does not match the demand for our products.
Because we cannot immediately adapt our production capacity and related cost structures to rapidly changing market conditions, when demand does not meet our expectations, our manufacturing capacity may exceed our production requirements. If during an economic downturn we had excess manufacturing capacity, then our fixed costs associated with excess manufacturing capacity would adversely affect our gross margins, and operating results. If, during a general market upturn or an upturn in one of our segments, we cannot increase our manufacturing capacity to meet product demand, we may not be able to fulfill orders in a timely manner which could lead to order cancellations, contract breaches or indemnification obligations. This inability could materially and adversely limit our ability to improve our results.
Dependence on contract manufacturing and outsourcing other portions of our supply chain, including logistics and third-party package delivery services, may adversely affect our ability to bring products to market and damage our reputation. Dependence on outsourced information technology and other administrative functions may impair our ability to operate effectively.
As part of our efforts to streamline operations and to cut costs, we outsource aspects of our manufacturing processes and other functions and continue to evaluate additional outsourcing. If our contract manufacturers or other outsourcers fail to perform their obligations in a timely manner or at satisfactory quality levels, our ability to bring products to market and our reputation could suffer. For example, during a market upturn, our contract manufacturers may be unable to meet our demand requirements, which may preclude us from fulfilling our customers' orders on a timely basis. The ability of these manufacturers to perform is largely outside of our control. If one or more of the third-party package delivery providers experiences a significant disruption in services or institutes a significant price increase, we may have to seek alternative providers, our costs could increase and the delivery of our products could be prevented or delayed. Additionally, changing or replacing our contract manufacturers, logistics providers or other outsourcers could cause disruptions or delays. In addition, we outsource significant portions of our information technology ("IT") and other administrative functions. Since IT is critical to our operations, any failure to perform on the part of our IT providers could impair our ability to operate effectively. In addition to the risks outlined above, problems with manufacturing or IT outsourcing could result in lower revenue and unexecuted efficiencies, and impact our results of operations and our stock price.
Environmental contamination from past and ongoing operations could subject us to substantial liabilities.
Certain properties we have previously owned are undergoing remediation for subsurface contaminations. Although we are indemnified for any liability relating to the required remediation, we may be subject to liability if these indemnification obligations are not fulfilled. Further, other properties we have previously owned or facilities we have operated in the past, may be contaminated based on our operations. In some cases, we have agreed to indemnify the current owners of certain properties for any liabilities related to such contamination, including companies that we used to be affiliated with such as HP, Inc., Hewlett-Packard Enterprise (formerly Hewlett-Packard Company) and Varian Medical Systems, Inc. While we are not aware of any material liabilities associated with any potential environmental contamination at any of those properties or facilities, we may be exposed to material liability if such environmental contamination is found to exist. In addition, in connection with the acquisition of certain companies, we have
20
assumed the costs and potential liabilities for environmental matters. Any significant costs or liabilities could have an adverse effect on results of operations.
Our current and historical manufacturing processes and operations involve, or have involved, the use of substances regulated under various foreign, federal, state and local environment protection and health and safety laws and regulations. As a result, we may become subject to liabilities for environmental contamination and these liabilities may be substantial. Although our policy is to apply strict standards for environmental protection and health and safety at our sites inside and outside the United States, we may not be aware of all conditions that could subject us to liability. Failure to comply with these environmental protection and health and safety laws and regulations could result in civil, criminal, regulatory, administrative or contractual sanction, including fines, penalties or suspensions. If we have any violations of, or incur liabilities pursuant to these laws or regulations, our financial condition and operating results could be adversely affected.
Regulations related to “conflict minerals” may cause us to incur additional expenses and could limit the supply and increase the cost of certain metals used in manufacturing our products.
We are subject to the rules of the Securities and Exchange Commission (“SEC”) which require disclosures by public companies of specified minerals, known as conflict minerals, that are necessary to the functionality or production of products manufactured or contracted to be manufactured. The rule, which requires an annual disclosure report to be filed with the SEC by May 31st of each year, requires companies to perform due diligence, disclose and report whether or not such minerals originate from the Democratic Republic of Congo or an adjoining country. There are costs associated with complying with these disclosure requirements, including for diligence in regards to the sources of any conflict minerals used in our products, in addition to the cost of remediation and other changes to products, processes, or sources of supply as a consequence of such verification activities. In addition, our ongoing implementation of these rules could adversely affect the sourcing, supply, and pricing of materials used in our products. The rule could affect sourcing at competitive prices and availability in sufficient quantities of certain minerals used in the manufacture of our products, including tin, tantalum, gold and tungsten. The number of suppliers who provide conflict-free minerals may be limited. In addition, there may be material costs associated with complying with the disclosure requirements, such as costs related to the due diligence process of determining the source of certain minerals used in our products, as well as costs of possible changes to products, processes, or sources of supply as a consequence of such verification activities. As our supply chain is complex and we use contract manufacturers for some of our products, we may not be able to sufficiently verify the origins of the relevant minerals used in our products through the due diligence procedures that we implement, which may harm our reputation. We may also encounter challenges to satisfy those customers who require that all of the components of our products be certified as conflict-free, which could place us at a competitive disadvantage if we are unable to do so.
Third parties may claim that we are infringing their intellectual property and we could suffer significant litigation or licensing expenses or be prevented from selling products or services.
From time to time, third parties may claim that one or more of our products or services infringe their intellectual property rights. We analyze and take action in response to such claims on a case by case basis. Any dispute or litigation regarding patents or other intellectual property could be costly and time-consuming due to the complexity of our technology and the uncertainty of intellectual property litigation and could divert our management and key personnel from our business operations. A claim of intellectual property infringement could force us to enter into a costly or restrictive license agreement, which might not be available under acceptable terms or at all, could require us to redesign our products, which would be costly and time-consuming, and/or could subject us to significant damages or to an injunction against the development and sale of certain of our products or services. Our intellectual property portfolio may not be useful in asserting a counterclaim, or negotiating a license, in response to a claim of intellectual property infringement. In certain of our businesses, we rely on third party intellectual property licenses and we cannot ensure that these licenses will continue to be available to us in the future or can be expanded to cover new products on favorable terms or at all.
Third parties may infringe our intellectual property and we may suffer competitive injury or expend significant resources enforcing our rights.
Our success depends in large part on our proprietary technology, including technology we obtained through acquisitions. We rely on various intellectual property rights, including patents, copyrights, trademarks and trade secrets, as well as confidentiality provisions and licensing arrangements, to establish our proprietary rights. If we do not enforce our intellectual property rights successfully our competitive position may suffer which could harm our operating results.
Our pending patent copyright and trademark registration applications, may not be allowed or competitors may challenge the validity or scope of our patents, copyrights or trademarks. In addition, our patents, copyrights, trademarks and other intellectual property rights may not provide us with a significant competitive advantage.
21
We may need to spend significant resources monitoring our intellectual property rights and we may not be aware of or able to detect or prove infringement by third parties. Our competitive position may be harmed if we cannot detect infringement and enforce our intellectual property rights quickly or at all. In some circumstances, we may choose to not pursue enforcement because an infringer has a dominant intellectual property position or for other business reasons. In addition, competitors might avoid infringement by designing around our intellectual property rights or by developing non-infringing competing technologies. Intellectual property rights and our ability to enforce them may be unavailable or limited in some countries which could make it easier for competitors to capture market share and could result in lost revenues. Furthermore, some of our intellectual property is licensed to others which may allow them to compete with us using that intellectual property.
Changes in tax laws, unfavorable resolution of tax examinations, or exposure to additional tax liabilities could have a material adverse effect on our results of operations, financial condition and liquidity.
We are subject to taxes in the U.S., Singapore and various foreign jurisdictions. Governments in the jurisdictions in which we operate implement changes to tax laws and regulations periodically. Any implementation of tax laws that fundamentally change the taxation of corporations in the U.S. or Singapore could materially impact our effective tax rate and could have a significant adverse impact on our financial results.
We are also subject to examinations of our tax returns by tax authorities in various jurisdictions around the world. We regularly assess the likelihood of adverse outcomes resulting from ongoing tax examinations to determine the adequacy of our provision for taxes. These assessments can require a high degree of judgment and estimation. Intercompany transactions associated with the sale of inventory, services, intellectual property and cost share arrangements are complex and affect our tax liabilities. The calculation of our tax liabilities involves dealing with uncertainties in the application of complex tax laws and regulations in multiple jurisdictions. There can be no assurance that the outcomes from ongoing tax examinations will not have an adverse effect on our operating results and financial condition. A difference in the ultimate resolution of tax uncertainties from what is currently estimated could have an adverse effect on our financial results and condition.
If tax incentives change or cease to be in effect, our income taxes could increase significantly.
We benefit from tax incentives extended to our foreign subsidiaries to encourage investment or employment. Several jurisdictions have granted us tax incentives which require renewal at various times in the future. The incentives are conditioned on achieving various thresholds of investments and employment, or specific types of income. Our taxes could increase if the incentives are not renewed upon expiration. If we cannot or do not wish to satisfy all or parts of the tax incentive conditions, we may lose the related tax incentive and could be required to refund tax incentives previously realized. As a result, our effective tax rate could be higher than it would have been had we maintained the benefits of the tax incentives.
We have substantial cash requirements in the United States while most of our cash is generated outside of the United States. The failure to maintain a level of cash sufficient to address our cash requirements in the United States could adversely affect our financial condition and results of operations.
Although the cash generated in the United States from our operations should cover our normal operating requirements and debt service requirements, a substantial amount of additional cash is required for special purposes such as the maturity of our debt obligations, our stock repurchase program, our declared dividends and acquisitions of third parties. Our business operating results, financial condition, and strategic initiatives could be adversely impacted if we were unable to address our U.S. cash requirements through the efficient and timely repatriations of overseas cash or other sources of cash obtained at an acceptable cost.
We have outstanding debt and may incur other debt in the future, which could adversely affect our financial condition, liquidity and results of operations.
We currently have outstanding an aggregate principal amount of $1.9 billion in senior unsecured notes. We also are party to a five-year unsecured revolving credit facility which expires in September 2019. On June 9, 2015, we increased the commitments under the existing credit facility by $300 million and on July 14, 2017, the commitments under the existing credit facility were increased by an additional $300 million so that the aggregate commitments under the facility now total $1 billion. As of
October 31, 2017
, we had
$110 million
outstanding under the credit facility. We may borrow additional amounts in the future and use the proceeds from any future borrowing for general corporate purposes, other future acquisitions, expansion of our business or repurchases of our outstanding shares of common stock.
Our incurrence of this debt and increases in our aggregate levels of debt, may adversely affect our operating results and financial condition by, among other things:
22
|
•
|
increasing our vulnerability to downturns in our business, to competitive pressures and to adverse economic and industry conditions;
|
|
•
|
requiring the dedication of an increased portion of our expected cash flows from operations to service our indebtedness, thereby reducing the amount of expected cash flows available for other purposes, including capital expenditures, acquisitions, stock repurchases and dividends; and
|
|
•
|
limiting our flexibility in planning for, or reacting to, changes in our business and our industry.
|
Our current revolving credit facility imposes restrictions on us, including restrictions on our ability to create liens on our assets and the ability of our subsidiaries to incur indebtedness, and requires us to maintain compliance with specified financial ratios. Our ability to comply with these ratios may be affected by events beyond our control. In addition, the indenture governing our senior notes contains covenants that may adversely affect our ability to incur certain liens or engage in certain types of sale and leaseback transactions. If we breach any of the covenants and do not obtain a waiver from the lenders, then, subject to applicable cure periods, our outstanding indebtedness could be declared immediately due and payable.
If we suffer a loss to our factories, facilities or distribution system due to catastrophe, our operations could be seriously harmed.
Our factories, facilities and distribution system are subject to catastrophic loss due to fire, flood, terrorism or other natural or man-made disasters. In particular, several of our facilities could be subject to a catastrophic loss caused by earthquake due to their locations. Our production facilities, headquarters, laboratories in California, and our production facilities in Japan, are all located in areas with above-average seismic activity. If any of our facilities were to experience a catastrophic loss, it could disrupt our operations, delay production, shipments and revenue and result in large expenses to repair or replace the facility. If such a disruption were to occur, we could breach agreements, our reputation could be harmed, and our business and operating results could be adversely affected. In addition, because we have consolidated our manufacturing facilities and we may not have redundant manufacturing capability readily available, we are more likely to experience an interruption to our operations in the event of a catastrophe in any one location. Although we carry insurance for property damage and business interruption, we do not carry insurance or financial reserves for interruptions or potential losses arising from earthquakes or terrorism. Also, our third-party insurance coverage will vary from time to time in both type and amount depending on availability, cost and our decisions with respect to risk retention. Economic conditions and uncertainties in global markets may adversely affect the cost and other terms upon which we are able to obtain third-party insurance. If our third party insurance coverage is adversely affected, or to the extent we have elected to self-insure, we may be at a greater risk that our operations will be harmed by a catastrophic loss.
If we experience a significant disruption in, or breach in security of, our information technology systems, or if we fail to implement new systems and software successfully, our business could be adversely affected.
We rely on several centralized information technology systems throughout our company to provide products and services, keep financial records, process orders, manage inventory, process shipments to customers and operate other critical functions. Our information technology systems may be susceptible to damage, disruptions or shutdowns due to power outages, hardware failures, computer viruses, attacks by computer hackers, telecommunication failures, user errors, catastrophes or other unforeseen events. Our information technology systems also may experience interruptions, delays or cessations of service or produce errors in connection with system integration, software upgrades or system migration work that takes place from time to time. If we were to experience a prolonged system disruption in the information technology systems that involve our interactions with customers or suppliers, it could result in the loss of sales and customers and significant incremental costs, which could adversely affect our business. In addition, security breaches of our information technology systems could result in the misappropriation or unauthorized disclosure of confidential information belonging to us or to our employees, partners, customers or suppliers, which could result in our suffering significant financial or reputational damage.
Adverse conditions in the global banking industry and credit markets may adversely impact the value of our cash investments or impair our liquidity.
As of
October 31, 2017
, we had cash and cash equivalents of approximately
$2,678 million
invested or held in a mix of money market funds, time deposit accounts and bank demand deposit accounts. Disruptions in the financial markets may, in some cases, result in an inability to access assets such as money market funds that traditionally have been viewed as highly liquid. Any failure of our counterparty financial institutions or funds in which we have invested may adversely impact our cash and cash equivalent positions and, in turn, our operating results and financial condition.
23
We could incur significant liability if the distribution of Keysight common stock to our shareholders is determined to be a taxable transaction.
We have received an opinion from outside tax counsel to the effect that the separation and distribution of Keysight qualifies as a transaction that is described in Sections 355(a) and 368(a)(1)(D) of the Internal Revenue Code. The opinion relies on certain facts, assumptions, representations and undertakings from Keysight and us regarding the past and future conduct of the companies’ respective businesses and other matters. If any of these facts, assumptions, representations or undertakings are incorrect or not satisfied, our shareholders and we may not be able to rely on the opinion of tax counsel and could be subject to significant tax liabilities. Notwithstanding the opinion of tax counsel we have received, the IRS could determine on audit that the separation is taxable if it determines that any of these facts, assumptions, representations or undertakings are not correct or have been violated or if it disagrees with the conclusions in the opinion. If the separation is determined to be taxable for U.S. federal income tax purposes, our shareholders that are subject to U.S. federal income tax and we could incur significant U.S. federal income tax liabilities.
We cannot assure that we will continue to pay dividends on our common stock.
Since the first quarter of fiscal year 2012, we have paid a quarterly dividend on our common stock. The timing, declaration, amount and payment of any future dividends fall within the discretion of our Board of Directors and will depend on many factors, including our available cash, estimated cash needs, earnings, financial condition, operating results, capital requirements, as well as limitations in our contractual agreements, applicable law, regulatory constraints, industry practice and other business considerations that our Board of Directors considers relevant. A change in our dividend program could have an adverse effect on the market price of our common stock.
Item 1B.
Unresolved Staff Comments
None.
Item 2.
Properties
As of
October 31, 2017
, we owned or leased a total of approximately 5.9 million square feet of space worldwide. Of that, we owned approximately 4.3 million square feet and leased the remaining 1.6 million square feet. Our sales and support facilities occupied a total of approximately 0.7 million square feet. Our manufacturing plants, R&D facilities and warehouse and administrative facilities occupied approximately 5.2 million square feet. All of our businesses share sales offices throughout the world.
Information about each of our businesses appears below:
Life Sciences & Applied Markets Business.
Our life sciences and applied markets business has manufacturing and R&D facilities in Australia, China, Germany, Italy, Malaysia, Singapore, United Kingdom and the United States.
Diagnostics and Genomics Business.
Our diagnostics and genomics business has manufacturing and R&D facilities in Belgium, Denmark, Germany, Malaysia and the United States.
Agilent CrossLab Business.
Our Agilent CrossLab business has manufacturing and R&D facilities in Australia, China, Germany, Japan, Netherlands, United Kingdom and the United States.
Item 3.
Legal Proceedings
We are involved in lawsuits, claims, investigations and proceedings, including, but not limited to, intellectual property, commercial and employment matters, which arise in the ordinary course of business. There are no matters pending that we currently believe are probable or reasonably possible of having a material impact to our business, consolidated financial condition, results of operations or cash flows.
Item 4.
Mine Safety Disclosures
Not applicable.
24
Item 5.
Market for the Registrant's Common Equity, Related Stockholder Matters and Issuer Purchases of Equity Securities
Our common stock is listed on the New York Stock Exchange with the ticker symbol “A”. The following table sets forth the high and low sale prices and the dividend declarations per quarter for the
2016
and
2017
fiscal years as reported in the consolidated transaction reporting system for the New York Stock Exchange:
|
Fiscal 2016
|
High
|
Low
|
Dividends
|
|||||||||
|
First Quarter (ended January 31, 2016)
|
$
|
42.48
|
|
$
|
36.01
|
|
$
|
0.115
|
|
|||
|
Second Quarter (ended April 30, 2016)
|
$
|
42.00
|
|
$
|
34.15
|
|
$
|
0.115
|
|
|||
|
Third Quarter (ended July 31, 2016)
|
$
|
48.18
|
|
$
|
40.39
|
|
$
|
0.115
|
|
|||
|
Fourth Quarter (ended October 31, 2016)
|
$
|
48.63
|
|
$
|
43.11
|
|
$
|
0.115
|
|
|||
|
Fiscal 2017
|
High
|
Low
|
Dividends
|
|||||||||
|
First Quarter (ended January 31, 2017)
|
$
|
49.48
|
|
$
|
42.92
|
|
$
|
0.132
|
|
|||
|
Second Quarter (ended April 30, 2017)
|
$
|
55.51
|
|
$
|
48.47
|
|
$
|
0.132
|
|
|||
|
Third Quarter (ended July 31, 2017)
|
$
|
61.84
|
|
$
|
55.36
|
|
$
|
0.132
|
|
|||
|
Fourth Quarter (ended October 31, 2017)
|
$
|
68.52
|
|
$
|
58.22
|
|
$
|
0.132
|
|
|||
As of
December 1, 2017
, there were
23,445
common stockholders of record.
During fiscal
2017
, we issued four quarterly dividends of
$0.132
per share. All decisions regarding the declaration and payment of dividends are at the discretion of our Board of Directors and will be evaluated regularly in light of our financial condition, earnings, growth prospects, funding requirements, applicable law, and any other factors that our Board deems relevant. The information required by this item with respect to equity compensation plans is included under the caption
Equity Compensation Plans
in our proxy statement for the annual meeting of stockholders to be held
March 21, 2018
, to be filed with the Securities and Exchange Commission pursuant to Regulation 14A, and is incorporated herein by reference.
25
STOCK PRICE PERFORMANCE GRAPH
The graph below shows the cumulative total stockholder return on our common stock with the cumulative total return of the S&P 500 Index and our peer group, consisting of all companies in the Health Care and Materials Indexes of the S&P 500, assuming an initial investment of $100 on October 31, 2012 and the reinvestment of all dividends. The cumulative returns on our common stock have also been adjusted to reflect the spin-off of our electronic measurement business into an independent publicly traded company called Keysight Technologies, Inc. on November 1, 2014.
Agilent’s stock price performance shown in the following graph is not indicative of future stock price performance. The data for this performance graph was compiled for us by Standard and Poor’s.
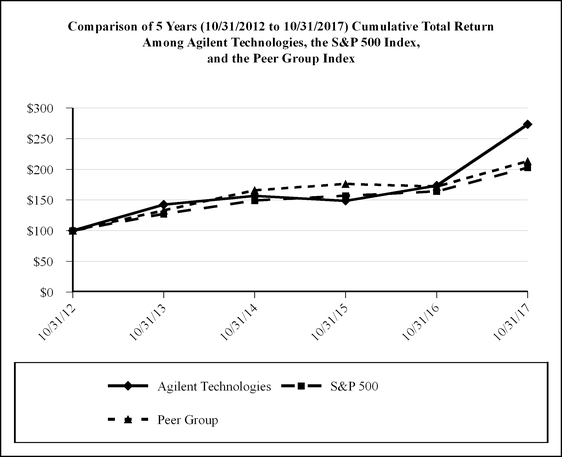
|
INDEXED RETURNS
|
|||||||||||
|
Base
|
Years Ending
|
||||||||||
|
Period
|
|||||||||||
|
Company Name / Index
|
10/31/2012
|
10/31/2013
|
|
10/31/2014
|
|
10/31/2015
|
|
10/31/2016
|
|
10/31/2017
|
|
|
Agilent Technologies
|
100
|
142.52
|
|
156.67
|
|
148.68
|
|
173.38
|
|
273.31
|
|
|
S&P 500
|
100
|
127.18
|
|
149.14
|
|
156.89
|
|
163.97
|
|
202.72
|
|
|
Peer Group
|
100
|
133.00
|
|
165.85
|
|
176.13
|
|
171.91
|
|
213.11
|
|
26
ISSUER PURCHASES OF EQUITY SECURITIES
The table below summarizes information about the Company’s purchases, based on trade date; of its equity securities registered pursuant to Section 12 of the Exchange Act during the quarterly period ended
October 31, 2017
. The total number of shares of common stock purchased by the Company during the fiscal year ended
October 31, 2017
is 3,956,816 shares.
|
Period
|
Total Number of
Shares of Common
Stock Purchased(1)
|
Weighted Average
Price Paid per Share of
Common Stock(2)
|
Total
Number of
Shares of Common
Stock Purchased as
Part of Publicly
Announced Plans or
Programs(1)
|
Maximum
Approximate Dollar
Value of Shares of
Common Stock that
May Yet Be
Purchased Under the
Plans or Programs
(in millions)(1)
|
||||||||||
|
|
||||||||||||||
|
Aug. 1, 2017 through
Aug. 31, 2017 |
—
|
|
—
|
|
—
|
|
$
|
610
|
|
|||||
|
Sep. 1, 2017 through
Sep. 30, 2017 |
—
|
|
—
|
|
—
|
|
$
|
610
|
|
|||||
|
Oct. 1, 2017 through
Oct. 31, 2017 |
—
|
|
$
|
—
|
|
—
|
|
$
|
610
|
|
||||
|
Total
|
—
|
|
$
|
—
|
|
—
|
|
|
|
|||||
|
(1)
|
On May 28, 2015, we announced that our board of directors had approved a new share repurchase program (the "2015 repurchase program"). The 2015 repurchase program authorizes the purchase of up to $1.14 billion of our common stock through and including November 1, 2018. The 2015 repurchase program does not require the company to acquire a specific number of shares and may be suspended or discontinued at any time. As of October 31, 2017, all repurchased shares have been retired.
|
|
(2)
|
The weighted average price paid per share of common stock does not include the cost of commissions.
|
27
Item 6.
Selected Financial Data
SELECTED FINANCIAL DATA
(Unaudited)
|
|
Years Ended October 31,
|
||||||||||||||||||
|
|
2017
|
2016
|
2015
|
2014
|
2013
|
||||||||||||||
|
|
(in millions, except per share data)
|
||||||||||||||||||
|
Consolidated Statement of Operations Data:
|
|||||||||||||||||||
|
Net revenue
|
$
|
4,472
|
|
$
|
4,202
|
|
$
|
4,038
|
|
$
|
4,048
|
|
$
|
3,894
|
|
||||
|
Income from continuing operations before taxes
|
$
|
803
|
|
$
|
544
|
|
$
|
480
|
|
$
|
229
|
|
$
|
293
|
|
||||
|
Income from continuing operations
|
$
|
684
|
|
$
|
462
|
|
$
|
438
|
|
$
|
232
|
|
$
|
225
|
|
||||
|
Income (loss) from discontinued operations, net of taxes
|
$
|
—
|
|
$
|
—
|
|
$
|
(37
|
)
|
$
|
317
|
|
$
|
509
|
|
||||
|
Net income
|
$
|
684
|
|
$
|
462
|
|
$
|
401
|
|
$
|
549
|
|
$
|
734
|
|
||||
|
Net income per share — basic:
|
|||||||||||||||||||
|
Income from continuing operations
|
$
|
2.12
|
|
$
|
1.42
|
|
$
|
1.32
|
|
$
|
0.70
|
|
$
|
0.66
|
|
||||
|
Income (loss) from discontinued operations, net of taxes
|
—
|
|
—
|
|
(0.12
|
)
|
0.95
|
|
1.49
|
|
|||||||||
|
Net income per share - basic
|
$
|
2.12
|
|
$
|
1.42
|
|
$
|
1.20
|
|
$
|
1.65
|
|
$
|
2.15
|
|
||||
|
Net income per share — diluted:
|
|||||||||||||||||||
|
Income from continuing operations
|
$
|
2.10
|
|
$
|
1.40
|
|
$
|
1.31
|
|
$
|
0.69
|
|
$
|
0.65
|
|
||||
|
Income (loss) from discontinued operations, net of taxes
|
—
|
|
—
|
|
(0.11
|
)
|
0.93
|
|
1.48
|
|
|||||||||
|
Net income per share - diluted
|
$
|
2.10
|
|
$
|
1.40
|
|
$
|
1.20
|
|
$
|
1.62
|
|
$
|
2.13
|
|
||||
|
Weighted average shares used in computing basic net income per share
|
322
|
|
326
|
|
333
|
|
333
|
|
341
|
|
|||||||||
|
Weighted average shares used in computing diluted net income per share
|
326
|
|
329
|
|
335
|
|
338
|
|
345
|
|
|||||||||
|
Cash dividends declared per common share
|
$
|
0.528
|
|
$
|
0.460
|
|
0.400
|
|
$
|
0.528
|
|
$
|
0.460
|
|
|||||
|
|
October 31,
|
||||||||||||||||||
|
|
2017
|
2016
|
2015
|
2014
|
2013
|
||||||||||||||
|
|
(in millions)
|
||||||||||||||||||
|
Consolidated Balance Sheet Data:
|
(1)
|
(1)
|
|||||||||||||||||
|
Cash and cash equivalents
|
$
|
2,678
|
|
$
|
2,289
|
|
$
|
2,003
|
|
$
|
2,218
|
|
$
|
2,675
|
|
||||
|
Working capital
|
$
|
2,906
|
|
$
|
2,690
|
|
$
|
2,710
|
|
$
|
3,817
|
|
$
|
3,392
|
|
||||
|
Total assets
|
$
|
8,426
|
|
$
|
7,794
|
|
$
|
7,479
|
|
$
|
10,815
|
|
$
|
10,608
|
|
||||
|
Long-term debt
|
$
|
1,801
|
|
$
|
1,904
|
|
$
|
1,655
|
|
$
|
1,663
|
|
$
|
2,699
|
|
||||
|
Stockholders' equity
|
$
|
4,831
|
|
$
|
4,243
|
|
$
|
4,167
|
|
$
|
5,301
|
|
$
|
5,297
|
|
||||
|
(1) The above consolidated balance sheet includes Keysight which is presented as a discontinued operation until October 31, 2014.
|
|||||||||||||||||||
28
Item 7.
Management's Discussion and Analysis of Financial Condition and Results of Operations
The following discussion should be read in conjunction with the consolidated financial statements and notes thereto included elsewhere in this Annual Report on Form 10-K. This report contains forward-looking statements including, without limitation, statements regarding trends, seasonality and growth in, and drivers of, the markets we sell into, our strategic direction, our future effective tax rate and tax valuation allowance, earnings from our foreign subsidiaries, repatriation of our earnings from foreign jurisdictions and its impact on our tax expense, lease and site services income from Keysight, the impact of foreign currency movements on our performance, our hedging programs, indemnification, new product and service introductions, the ability of our products to meet market needs, adoption of our products, changes to our manufacturing processes, the use of contract manufacturers, out sourcing and third-party package delivery services, source and supply of materials used in our products, the impact of local government regulations on our ability to pay vendors or conduct operations, our liquidity position, our ability to generate cash from operations, growth in our businesses, our investments, including in research and development, the potential impact of adopting new accounting pronouncements, our financial results, our operating margin, our sales, our purchase commitments, our capital expenditures, our contributions to our pension and other defined benefit plans, our strategic initiatives, our cost-control activities and other cost saving initiatives, the integration of our acquisitions and other transactions, impairment of goodwill and other intangible assets, write down of investment values or loans and convertible notes, our stock repurchase program, our declared dividends, and the existence of economic instability, that involve risks and uncertainties. Our actual results could differ materially from the results contemplated by these forward-looking statements due to various factors, including those discussed in Part I Item 1A and elsewhere in this Form 10-K.
Overview and Executive Summary
Agilent Technologies Inc. ("we", "Agilent" or the "company"), incorporated in Delaware in May 1999, is a global leader in life sciences, diagnostics and applied chemical markets, providing application focused solutions that includes instruments, software, services and consumables for the entire laboratory workflow.
On January 20, 2017, we completed the acquisition of 100 percent of the stock of Multiplicom NV (“Multiplicom”), a leading European diagnostics company with state-of-the-art genetic testing technology and products, for approximately $72 million in cash. Multiplicom, headquartered in Belgium, develops, manufactures and commercializes molecular diagnostic assays, provided as kits, which enable personalized medicine. The financial results of Multiplicom have been included within Agilent's from the date of the transaction.
On July 7, 2017, we completed the acquisition of Cobalt Light Systems (“Cobalt”) for approximately $53 million in cash. Cobalt, based in Oxfordshire, U.K., is a provider of differentiated Raman spectroscopic instruments for the pharmaceutical industry, applied markets and public safety. Cobalt's suite of benchtop and handheld/portable Raman spectroscopic instruments are based on proprietary technologies that enable through-barrier identification of chemicals and materials. The financial results of Cobalt have been included within Agilent's from the date of the transaction.
In fiscal year 2016, we completed the acquisition of Seahorse Bioscience ("Seahorse") for $242 million and iLab Solutions LLC ("iLab") for $26 million. The financial results of Seahorse and iLab have been included within Agilent's from the date of the transaction. On March 2, 2016, we also made a preferred stock investment in Lasergen for $80 million. Lasergen is a Variable Interest Entity ("VIE"), however, we do not consolidate the entity in our financial statements because we do not have the power to direct the activities of the VIE that most significantly impact the VIE's economic performance. Because of the nature of the preferred stock of Lasergen that we own, we account for this investment under the cost method.
Agilent's net revenue of
$4,472 million
in
2017
increased
6 percent
when compared to
2016
. Foreign currency movements for
2017
had an unfavorable impact of approximately
1
percentage point compared to
2016
. Agilent's net revenue of
$4,202 million
increased 4 percent in
2016
when compared to
2015
.
Revenue in the life sciences and applied markets business increased
5 percent
in 2017 when compared to 2016. Foreign currency movements had an unfavorable impact of less than 1 percentage point in
2017
when compared to 2016. For the year ended October 31, 2017, our performance within the life sciences markets was led by solid growth in the biotechnology and pharmaceutical markets. Within the applied markets, there was strong growth in the chemical and energy, food and environmental markets. Revenue in the life sciences and applied markets business increased 1 percent in 2016 when compared to 2015. Foreign currency movements had an unfavorable impact of approximately 2 percentage points in 2016 when compared to 2015. For the year ended October 31, 2016 and excluding the impact of foreign currency movements, acquisitions and the NMR business our performance within the life sciences market continued to show strong revenue growth from the pharmaceutical and biotechnology markets. Within the applied markets, and excluding the impact of foreign currency movements and the NMR business for 2016
29
when compared to 2015, there was strong growth in both the environmental and food markets, but revenue from sales to other applied markets was weak with a decline in revenue from sales to the chemical and energy markets.
Revenue in the diagnostics and genomics business increased
9 percent
in 2017 when compared to 2016. Foreign currency movements had no overall currency impact on revenue growth in 2017 when compared to 2016. For the year ended October 31, 2017, our performance within the clinical and diagnostics market continued to improve with strong revenue growth from our companion diagnostics and pathology businesses. Revenue in the diagnostics and genomics business increased 7 percent in 2016 when compared to 2015. Foreign currency movements had an unfavorable impact of approximately 1 percentage point in 2016 when compared to 2015. Excluding the impact of foreign currency movements and acquisitions, growth in revenue from sales to the diagnostics and clinical research markets continued to be strong, led by our companion diagnostics and genomics businesses in the year ended October 31, 2016 when compared to the prior year.
Revenue generated by Agilent CrossLab increased
8 percent
in 2017 when compared to 2016. Foreign currency movements had an unfavorable impact of less than 1 percentage point in 2017 when compared to 2016. Revenue grew across all key end markets led by strong growth in the biotechnology and pharmaceutical, chemical and energy and food markets. Revenue generated by Agilent CrossLab increased 7 percent in 2016 when compared to 2015. Foreign currency movements had an unfavorable impact of approximately 2 percentage points in 2016 when compared to 2015. Excluding the impact of foreign currency movements and acquisitions, there was growth in sales to all key markets. The pharmaceutical and biotechnology markets led all the markets in revenue and revenue growth along with very strong revenue growth from the food markets. In addition, we saw moderate growth from the environmental market and modest revenue growth from the chemical and energy markets.
Net income from continuing operations was
$684 million
in
2017
compared to net income from continuing operations of
$462 million
and
$438 million
in
2016
and
2015
, respectively. As of
October 31, 2017
and
2016
, we had cash and cash equivalents balances of
$2,678 million
and
$2,289 million
, respectively.
On November 22, 2013, we announced that our board of directors had authorized a share repurchase program. The program was designed to reduce or eliminate dilution resulting from issuance of stock under the company's employee equity incentive programs to target maintaining a weighted average share count of approximately
335 million
diluted shares. For the year ended
October 31, 2015
we repurchased
6 million
shares for
$267 million
. For the year ended
October 31, 2016
we repurchased approximately
2.4 million
shares for
$98 million
which completed the purchases under this authorization.
On May 28, 2015 we announced that our board of directors had approved a new share repurchase program (the "2015 repurchase program"). The 2015 share repurchase program authorizes the purchase of up to
$1.14 billion
of our common stock at the company's discretion through and including November 1, 2018. The 2015 repurchase program does not require the company to acquire a specific number of shares and may be suspended or discontinued at any time; however, we plan to repurchase a minimum of 674,000 shares per quarter in fiscal year 2018. Any additional repurchases may be impacted by our share price as well as other market conditions. During the year ended
October 31, 2016
, upon the completion of our previous repurchase program, we repurchased approximately
8.3 million
shares for
$336 million
under this authorization. During the year ended
October 31, 2017
we repurchased approximately
4.1 million
shares for
$194 million
under this authorization. As of
October 31, 2017
, we had remaining authorization to repurchase up to
$610 million
of our common stock under this program.
During fiscal year 2017, we retired
294.2 million
treasury shares at an aggregate cost of
$10.7 billion
, the amount of which represents all of our previously repurchased shares over the past 12 years including 2017 repurchases. Also the retirement resulted in a decrease of
$6.7 billion
to retained earnings and a decrease of
$4 billion
to additional paid-in-capital.
For the years ended
October 31, 2017
,
2016
and
2015
, cash dividends of
$170 million
,
$150 million
and
$133 million
were paid on the company's outstanding common stock, respectively. On
November 15, 2017
, we declared a quarterly dividend of
$0.149
per share of common stock, or approximately
$48 million
which will be paid on
January 24, 2018
to shareholders of record as of the close of business on
January 2, 2018
. The timing and amounts of any future dividends are subject to determination and approval by our board of directors.
Looking forward, we expect to continue to focus on the growth of operating margin in our businesses by exploring new ways to simplify our operations, differentiate product solutions and improve our customers' experience. In addition, we remain focused on returning a significant proportion of our cash flow to shareholders through our dividend and share repurchase programs. We are entering fiscal year 2018 with good momentum. However, considering the macroeconomic and political uncertainties, and corresponding poor visibility on our end-markets for most of fiscal year 2018, we remain cautious on our revenue projections for most of fiscal year 2018. Therefore, we expect our revenue growth in the pharmaceutical and biotechnology market to moderate slightly downward in fiscal year 2018. Although we experienced strong revenue growth within the chemical and energy market in fiscal year 2017, we are expecting lower revenue growth in fiscal year 2018. Within the clinical and diagnostics market, we
30
remain optimistic about our revenue growth opportunities in these markets and continue to invest in expanding and improving our solutions portfolio. The unfavorable effects of changes in foreign currency exchange rates has decreased revenue by approximately
1
percentage point for the year ended
October 31, 2017
. Costs and expenses, incurred in local currency, were subject to the favorable effects due to changes in foreign currency exchange rates reducing our overall net exposure. The impact of foreign currency exchange rates movements can be positive or negative in any period and is calculated by applying the prior period foreign currency exchange rates to the current year period.
Critical Accounting Policies and Estimates
The preparation of financial statements in accordance with accounting principles generally accepted in the U.S. requires management to make estimates and assumptions that affect the amounts reported in our consolidated financial statements and accompanying notes. Management bases its estimates on historical experience and various other assumptions believed to be reasonable. Although these estimates are based on management's best knowledge of current events and actions that may impact the company in the future, actual results may be different from the estimates. An accounting policy is deemed to be critical if it requires an accounting estimate to be made based on assumptions about matters that are highly uncertain at the time the estimate is made and if different estimates that reasonably could have been used or changes in the accounting estimate that are reasonably likely to occur could materially change the financial statements. Our critical accounting policies are those that affect our financial statements materially and involve difficult, subjective or complex judgments by management. Those policies are revenue recognition, inventory valuation, share-based compensation, retirement and post-retirement plan assumptions, valuation of goodwill and purchased intangible assets and accounting for income taxes.
Revenue Recognition.
We enter into agreements to sell products (hardware or software), services, and other arrangements (multiple element arrangements) that include combinations of products and services. Revenue from product sales, net of trade discounts and allowances, is recognized provided that persuasive evidence of an arrangement exists, delivery has occurred, the price is fixed or determinable, and collectability is reasonably assured. Delivery is considered to have occurred when title and risk of loss have transferred to the customer. Revenue is reduced for estimated product returns, when appropriate. For sales that include customer-specified acceptance criteria, revenue is recognized after the acceptance criteria have been met. For products that include installation, if the installation meets the criteria to be considered a separate element, product revenue is recognized upon delivery, and recognition of installation revenue occurs when the installation is complete. Otherwise, neither the product nor the installation revenue is recognized until the installation is complete. Revenue from services is deferred and recognized over the contractual period or as services are rendered and accepted by the customer. We allocate revenue to each element in our multiple-element arrangements based upon their relative selling prices. We determine the selling price for each deliverable based on a selling price hierarchy. The selling price for a deliverable is based on our vendor specific objective evidence (VSOE) if available, third-party evidence (TPE) if VSOE is not available, or estimated selling price (ESP) if neither VSOE nor TPE is available. Revenue from the sale of software products that are not required to deliver the tangible product's essential functionality are accounted for under software revenue recognition rules. Revenue allocated to each element is then recognized when the basic revenue recognition criteria for that element have been met. The amount of product revenue recognized is affected by our judgments as to whether an arrangement includes multiple elements.
The aforementioned factors may result in a different allocation of revenue to the deliverables in multiple element arrangements, which may change the pattern and timing of revenue recognition for these elements but will not change the total revenue recognized for the arrangement.
Inventory Valuation.
We assess the valuation of our inventory on a periodic basis and make adjustments to the value for estimated excess and obsolete inventory based upon estimates about future demand and actual usage. Such estimates are difficult to make under most economic conditions. The excess balance determined by this analysis becomes the basis for our excess inventory charge. Our excess inventory review process includes analysis of sales forecasts, managing product rollovers and working with manufacturing to maximize recovery of excess inventory. If actual market conditions are less favorable than those projected by management, additional write-downs may be required. If actual market conditions are more favorable than anticipated, inventory previously written down may be sold to customers, resulting in lower cost of sales and higher income from operations than expected in that period.
Share-Based Compensation.
We account for share-based awards in accordance with the authoritative guidance. Under the authoritative guidance, share-based compensation expense is primarily based on estimated grant date fair value and is recognized on a straight line basis. The fair value of share-based awards for employee stock option awards was estimated using the Black-Scholes option pricing model. Stock options were granted in years prior to fiscal year 2016. Shares granted under the Long-Term Performance Program based on Total Shareholders Return ("LTPP-TSR") were valued using the Monte Carlo simulation model. The estimated fair value of restricted stock unit awards, LTPP based on Operating Margin (“LTPP-OM”) and LTPP based on
31
Earnings per share (“LTPP-EPS”) is determined based on the market price of Agilent's common stock on the date of grant adjusted for expected dividend yield. The compensation cost for LTPP (OM) and LTPP (EPS) reflects the cost of awards that are probable to vest at the end of the performance period. In the case of LTPP-OM, the performance targets for all the three years of performance period is set at the time of grant. The performance targets for LTPP-EPS grants for year 2 and year 3 of the performance period will be set in the first quarter of year 2 and year 3, respectively. The probable shares to vest are estimated based on the forecasted OM and EPS at the time of the grant and updated every quarter with latest forecast and actual information. The Employee Stock Purchase Plan ("ESPP") allows eligible employees to purchase shares of our common stock at 85 percent of the fair market value at the purchase date. All awards granted in 2017 and 2016 to our senior management employees have a one year post-vest holding restriction. The estimated discount associated with post-vest holding restrictions is calculated using the Finnerty model.
Both the Black-Scholes and Monte Carlo simulation fair value models require the use of highly subjective and complex assumptions, including the option's expected life and the price volatility of the underlying stock. For the stock option grants in 2015 and LTPP (TSR) grants in 2015 and 2016, we used the 3-year average historical stock price volatility of a group of our peer companies. We believed our historical volatility prior to the separation of Keysight in 2015 was no longer relevant to use. For the 2017 LTPP (TSR) grants and calculation of the post-vest discount using the Finnerty model, we used our own post-separation historical stock price volatility. See Note 4, "Share-based Compensation," to the consolidated financial statements for more information.
The assumptions used in calculating the fair value of share-based awards represent our best estimates, but these estimates involve inherent uncertainties and the application of management judgment. Although we believe the assumptions and estimates we have made are reasonable and appropriate, changes in assumptions could materially impact our reported financial results.
Retirement and Post-Retirement Benefit Plan Assumptions.
Retirement and post-retirement benefit plan costs are a significant cost of doing business. They represent obligations that will ultimately be settled sometime in the future and therefore are subject to estimation. Pension accounting is intended to reflect the recognition of future benefit costs over the employees' average expected future service to Agilent based on the terms of the plans and investment and funding decisions. To estimate the impact of these future payments and our decisions concerning funding of these obligations, we are required to make assumptions using actuarial concepts within the framework of accounting principles generally accepted in the U.S. Two critical assumptions are the discount rate and the expected long-term return on plan assets. Other important assumptions include, expected future salary increases, expected future increases to benefit payments, expected retirement dates, employee turnover, retiree mortality rates, and portfolio composition. We evaluate these assumptions at least annually.
The discount rate is used to determine the present value of future benefit payments at the measurement date - October 31 for both U.S. and non-U.S. plans. For 2017 and 2016, the U.S. discount rates were based on the results of matching expected plan benefit payments with cash flows from a hypothetically constructed bond portfolio. In 2017, discount rates for the U.S. plans were the same as the previous year. For 2017 and 2016, the discount rate for non-U.S. plans was generally based on published rates for high quality corporate bonds and in 2017, were approximately the same as the previous year. If we changed our discount rate by 1 percent, the impact would be less than $1 million on U.S. pension expense and $16 million on non-U.S. pension expense. Lower discount rates increase present values of the pension benefit obligation and subsequent year pension expense; higher discount rates decrease present values of the pension benefit obligation and subsequent year pension expense.
The company uses alternate methods of amortization as allowed by the authoritative guidance which amortizes the actuarial gains and losses on a consistent basis for the years presented. For U.S. Plans, gains and losses are amortized over the average future lifetime of participants using the corridor method. For most Non-U.S. Plans and U.S. Post-Retirement Benefit Plans, gains and losses are amortized using a separate layer for each year's gains and losses. The expected long-term return on plan assets is estimated using current and expected asset allocations as well as historical and expected returns. Plan assets are valued at fair value. If we changed our estimated return on assets by 1 percent, the impact would be $4 million on U.S. pension expense and $9 million on non-U.S. pension expense. For 2017, actual return on assets was above expectations which, along with contributions during the year, decreased next year’s pension cost as well as resulting in an improvement of the funded status at year end. The net periodic pension and post-retirement benefit costs recorded were a $15 million benefit in 2017, $3 million expense in 2016 and $26 million expense in 2015. The year ended October 31, 2017 and 2016, included a $32 million and $16 million, respectively, gain on curtailment and settlement.
Goodwill and Purchased Intangible Assets.
Under the authoritative guidance, we have the option to perform a qualitative assessment to determine whether further impairment testing is necessary. The accounting standard gives an entity the option to first assess qualitative factors to determine whether performing the two-step test is necessary. If an entity believes, as a result of its qualitative assessment, that it is more-likely-than-not (i.e. greater than 50% chance) that the fair value of a reporting unit is less than its carrying amount, the quantitative impairment test will be required. Otherwise, no further testing will be required.
32
The guidance includes examples of events and circumstances that might indicate that a reporting unit's fair value is less than its carrying amount. These include macro-economic conditions such as deterioration in the entity's operating environment or industry or market considerations; entity-specific events such as increasing costs, declining financial performance, or loss of key personnel; or other events such as an expectation that a reporting unit will be sold or a sustained decrease in the stock price on either an absolute basis or relative to peers.
If it is determined, as a result of the qualitative assessment, that it is more-likely-than-not that the fair value of a reporting unit is less than its carrying amount, the provisions of authoritative guidance require that we perform a two-step impairment test on goodwill. In the first step, we compare the fair value of each reporting unit to its carrying value. The second step (if necessary) measures the amount of impairment by applying fair-value-based tests to the individual assets and liabilities within each reporting unit. As defined in the authoritative guidance, a reporting unit is an operating segment, or one level below an operating segment. We aggregate components of an operating segment that have similar economic characteristics into our reporting units.
In fiscal year
2017
, we assessed goodwill impairment for our three reporting units which consisted of three segments: life sciences and applied markets, diagnostics and genomics and Agilent CrossLab. We performed a qualitative test for goodwill impairment of the three reporting units, as of September 30,
2017
. Based on the results of our qualitative testing, we believe that it is more-likely-than-not that the fair value of these reporting units are greater than their respective carrying values. Each quarter we review the events and circumstances to determine if goodwill impairment is indicated. There was
no
impairment of goodwill during the years ended
October 31, 2017
,
2016
and
2015
.
Purchased intangible assets consist primarily of acquired developed technologies, proprietary know-how, trademarks, and customer relationships and are amortized using the best estimate of the asset's useful life that reflect the pattern in which the economic benefits are consumed or used up or a straight-line method ranging from 6 months to 15 years. In-process research and development ("IPR&D") is initially capitalized at fair value as an intangible asset with an indefinite life and assessed for impairment thereafter. When the IPR&D project is complete, it is reclassified as an amortizable purchased intangible asset and is amortized over its estimated useful life. If an IPR&D project is abandoned, we will record a charge for the value of the related intangible asset to our consolidated statement of operations in the period it is abandoned.
Our indefinite-lived intangible assets are IPR&D intangible assets. The accounting guidance allows a qualitative approach for testing indefinite-lived intangible assets for impairment, similar to the issued impairment testing guidance for goodwill and allows the option to first assess qualitative factors (events and circumstances) that could have affected the significant inputs used in determining the fair value of the indefinite-lived intangible asset to determine whether it is more-likely-than-not (i.e. greater than 50% chance) that the indefinite-lived intangible asset is impaired. An organization may choose to bypass the qualitative assessment for any indefinite-lived intangible asset in any period and proceed directly to calculating its fair value. We performed a qualitative test for impairment of indefinite-lived intangible assets as of September 30,
2017
. Based on the results of our qualitative testing, we believe that it is more-likely-than-not that the fair value of these indefinite-lived intangible assets is greater than their respective carrying values. Each quarter we review the events and circumstances to determine if impairment of indefinite-lived intangible asset is indicated. During the year ended
October 31, 2017
, there were
no
impairments of indefinite-lived intangible assets. Based on triggering events in the years ended
October 31, 2016
and
2015
, we recorded an impairment of
$4 million
and
$3 million
, respectively due to the cancellation of certain IPR&D projects.
Accounting for Income Taxes.
We must make certain estimates and judgments in determining income tax expense for financial statement purposes. These estimates and judgments occur in the calculation of tax credits, benefits and deductions, and in the calculation of certain tax assets and liabilities which arise from differences in the timing of recognition of revenue and expense for tax and financial statement purposes, as well as interest and penalties related to uncertain tax positions. Significant changes to these estimates may result in an increase or decrease to our tax provision in a subsequent period.
Significant management judgment is also required in determining whether deferred tax assets will be realized in full or in part. When it is more-likely-than-not that all or some portion of specific deferred tax assets such as net operating losses or foreign tax credit carryforwards will not be realized, a valuation allowance must be established for the amount of the deferred tax assets that cannot be realized. We consider all available positive and negative evidence on a jurisdiction-by-jurisdiction basis when assessing whether it is more likely than not that deferred tax assets are recoverable. We consider evidence such as our past operating results, the existence of losses in recent years and our forecast of future taxable income. At October 31, 2017, we continue to recognize a valuation allowance for certain U.S. and U.S state and foreign deferred tax assets. We intend to maintain a valuation allowance in these jurisdictions until sufficient positive evidence exists to support its reversal.
We have not provided for all U.S. federal income and foreign withholding taxes on the undistributed earnings of some of our foreign subsidiaries because we intend to reinvest such earnings indefinitely. Should we decide to remit this income to the
33
U.S. in a future period of if there is a U.S. tax law change with respect to taxation of accumulated foreign earnings, our provision for income taxes may increase materially in that period.
The calculation of our tax liabilities involves dealing with uncertainties in the application of complex tax law and regulations in a multitude of jurisdictions. Although the guidance on the accounting for uncertainty in income taxes prescribes the use of a recognition and measurement model, the determination of whether an uncertain tax position has met those thresholds will continue to require significant judgment by management. In accordance with the guidance on the accounting for uncertainty in income taxes, for all U.S. and other tax jurisdictions, we recognize potential liabilities for anticipated tax audit issues based on our estimate of whether, and the extent to which, additional taxes and interest will be due. The ultimate resolution of tax uncertainties may differ from what is currently estimated, which could result in a material impact on income tax expense. If our estimate of income tax liabilities proves to be less than the ultimate assessment, a further charge to expense would be required. If events occur and the payment of these amounts ultimately proves to be unnecessary, the reversal of the liabilities would result in tax benefits being recognized in the period when we determine the liabilities are no longer necessary. We include interest and penalties related to unrecognized tax benefits within the provision for income taxes on the consolidated statements of operations.
As a part of our accounting for business combinations, intangible assets are recognized at fair values and goodwill is measured as the excess of consideration transferred over the net estimated fair values of assets acquired. Impairment charges associated with goodwill are generally not tax deductible and will result in an increased effective income tax rate in the period that any impairment is recorded. Amortization expenses associated with acquired intangible assets are generally not tax deductible and therefore deferred tax liabilities have been recorded for non-deductible amortization expenses as a part of the accounting for business combinations.
The U.S. Congress passed tax legislation on December 20, 2017 which broadly reforms the corporate tax system but the legislation must be signed by the U.S. President before it is considered enacted. The tax reform could have a significant impact on our effective tax rate, cash tax expenses and/or net deferred tax assets. The tax reform law would reduce the U.S. corporate tax rate, eliminates or limits deduction of several expenses which were previously deductible, imposes a mandatory deemed repatriation tax on undistributed historic earnings of foreign subsidiaries, requires a minimum tax on earnings generated by foreign subsidiaries and permits a tax-free repatriation of foreign earnings through a dividends received deduction. We are evaluating the overall impact of the tax reform on our effective tax rate and balance sheet but we are unable to quantify the impact at this time.
Adoption of New Pronouncements
See Note 2, "New Accounting Pronouncements," to the consolidated financial statements for a description of new accounting pronouncements.
Foreign Currency
Our revenues, costs and expenses, and monetary assets and liabilities are exposed to changes in foreign currency exchange rates as a result of our global operating and financing activities. The unfavorable effects of changes in foreign currency exchange rates has decreased revenue by approximately
1
percentage point for the year ended
October 31, 2017
and 2 percentage points for the year ended
October 31, 2016
. Costs and expenses, incurred in local currency, were subject to the favorable effects due to changes in foreign currency exchange rates for the years ended
October 31, 2017
and
2016
, reducing our overall net exposure. The impact of foreign currency exchange rates movements can be positive or negative in any period and is calculated by applying the prior period foreign currency exchange rates to the current year period. We hedge revenues, expenses and balance sheet exposures that are not denominated in the functional currencies of our subsidiaries on a short term and anticipated basis. We do experience some fluctuations within individual lines of the consolidated statement of operations and balance sheet because our hedging program is not designed to offset the currency movements in each category of revenues, expenses, monetary assets and liabilities. Our hedging program is designed to hedge currency movements on a relatively short-term basis (up to a rolling twelve-month period). Therefore, we are exposed to currency fluctuations over the longer term. To the extent that we are required to pay for all, or portions, of an acquisition price in foreign currencies, we may enter into foreign exchange contracts to reduce the risk that currency movements will impact the U.S. dollar cost of the transaction.
34
Results from Operations
Net Revenue
|
|
Years Ended October 31,
|
2017 over 2016
% Change |
2016 over 2015 % Change
|
||||||||||||
|
|
2017
|
2016
|
2015
|
||||||||||||
|
|
(in millions)
|
|
|
||||||||||||
|
Net revenue:
|
|
|
|
|
|
||||||||||
|
Products
|
$
|
3,410
|
|
$
|
3,227
|
|
$
|
3,146
|
|
6%
|
3%
|
||||
|
Services and other
|
$
|
1,062
|
|
$
|
975
|
|
$
|
892
|
|
9%
|
9%
|
||||
|
Total net revenue
|
$
|
4,472
|
|
$
|
4,202
|
|
$
|
4,038
|
|
6%
|
4%
|
||||
|
|
Years Ended October 31,
|
2017 over 2016
ppts Change |
2016 over 2015
ppts Change |
|||||||||
|
|
2017
|
2016
|
2015
|
|||||||||
|
% of total net revenue:
|
|
|
|
|
|
|||||||
|
Products
|
76
|
%
|
77
|
%
|
78
|
%
|
(1) ppt
|
(1) ppt
|
||||
|
Services and other
|
24
|
%
|
23
|
%
|
22
|
%
|
1 ppt
|
1 ppt
|
||||
|
Total
|
100
|
%
|
100
|
%
|
100
|
%
|
|
|
||||
Agilent's net revenue of
$4,472 million
in
October 31, 2017
increased
6 percent
when compared to
2016
. Foreign currency movements for
2017
had an unfavorable impact of approximately
1
percentage point compared to
2016
. Agilent's net revenue of
$4,202 million
increased
4 percent
in
2016
when compared to
2015
.
Product revenue includes revenue generated from the sales of our analytical instrumentation, software and consumables. Services and other revenue includes revenue generated from servicing our installed base of products, warranty extensions and consulting including companion diagnostics. Services and other revenue increased
9 percent
in
2017
as compared to
2016
. The service and other revenue growth is impacted by a portion of the revenue being driven by the current and previously installed product base. Service and other revenue increased due to continued strong companion diagnostics revenue and increases across nearly all service types. Services and other revenue increased
9 percent
in
2016
as compared to
2015
. Service and other revenue increased due to increased service contract repairs, compliance services and preventative maintenance, and strong companion diagnostics revenue.
Net Revenue By Segment
|
|
Years Ended October 31,
|
2017 over 2016
% Change |
2016 over 2015 % Change
|
||||||||||||
|
|
2017
|
2016
|
2015
|
||||||||||||
|
|
(in millions)
|
|
|
||||||||||||
|
Net revenue by segment:
|
|
|
|
|
|
||||||||||
|
Life sciences and applied markets
|
$
|
2,169
|
|
$
|
2,073
|
|
$
|
2,046
|
|
5%
|
1%
|
||||
|
Diagnostics and genomics
|
$
|
772
|
|
$
|
709
|
|
$
|
662
|
|
9%
|
7%
|
||||
|
Agilent CrossLab
|
$
|
1,531
|
|
$
|
1,420
|
|
$
|
1,330
|
|
8%
|
7%
|
||||
|
Total net revenue
|
$
|
4,472
|
|
$
|
4,202
|
|
$
|
4,038
|
|
6%
|
4%
|
||||
Revenue in the life sciences and applied markets business increased
5 percent
in 2017 when compared to 2016. Foreign currency movements had an unfavorable impact of less than 1 percentage point in
2017
when compared to 2016. For the year ended October 31, 2017, our performance within the life sciences markets was led by solid growth in the biotechnology and pharmaceutical markets. Within the applied markets, there was strong growth in the chemical and energy, food and environmental markets. Revenue in the life sciences and applied markets business increased 1 percent in 2016 when compared to 2015. Foreign currency movements had an unfavorable impact of approximately 2 percentage points in 2016 when compared to 2015. For the year ended October 31, 2016 and excluding the impact of foreign currency movements, acquisitions and the NMR business, our performance within the life sciences market continued to show strong revenue growth from the pharmaceutical and biotechnology markets. Within the applied markets, and excluding the impact of foreign currency movements and the NMR business for 2016 when compared to 2015, there was strong growth in both the environmental and food markets, but revenue from sales to other applied markets was weak with a decline in revenue from sales to the chemical and energy markets.
35
Revenue in the diagnostics and genomics business increased
9 percent
in 2017 when compared to 2016. Foreign currency movements had no overall currency impact on revenue growth in 2017 when compared to 2016. For the year ended October 31, 2017, our performance within the clinical and diagnostics market continued to improve with strong revenue growth from our companion diagnostics and pathology businesses. Revenue in the diagnostics and genomics business increased 7 percent in 2016 when compared to 2015. Foreign currency movements had an unfavorable impact of approximately 1 percentage point in 2016 when compared to 2015. Excluding the impact of foreign currency movements and acquisitions, growth in revenue from sales to the diagnostics and clinical research markets continued to be strong, led by our companion diagnostics and genomics businesses in the year ended October 31, 2016 when compared to the prior year.
Revenue generated by Agilent CrossLab increased
8 percent
in 2017 when compared to 2016. Foreign currency movements had an unfavorable impact of less than 1 percentage point in 2017 when compared to 2016. Revenue grew across all key end markets led by strong growth in the biotechnology and pharmaceutical, chemical and energy and food markets. Revenue generated by Agilent CrossLab increased 7 percent in 2016 when compared to 2015. Foreign currency movements had an unfavorable impact of approximately 2 percentage points in 2016 when compared to 2015. Excluding the impact of foreign currency movements and acquisitions, there was growth in sales to all key markets. The pharmaceutical and biotechnology markets led all the markets in revenue and revenue growth along with very strong revenue growth from the food markets. In addition, we saw moderate growth from the environmental market and modest revenue growth from the chemical and energy markets.
Costs and Expenses
|
|
Years Ended October 31,
|
2017 over 2016
Change |
2016 over 2015
Change |
|||||||||
|
|
2017
|
2016
|
2015
|
|||||||||
|
Gross margin on products
|
56.9
|
%
|
54.6
|
%
|
52.5
|
%
|
2 ppts
|
2 ppts
|
||||
|
Gross margin on services and other
|
44.1
|
%
|
44.5
|
%
|
43.8
|
%
|
—
|
1 ppt
|
||||
|
Total gross margin
|
53.9
|
%
|
52.3
|
%
|
50.5
|
%
|
2 ppts
|
2 ppts
|
||||
|
Operating margin
|
18.8
|
%
|
14.6
|
%
|
12.9
|
%
|
4 ppts
|
2 ppts
|
||||
|
(in millions)
|
|
|
|
|
|
||||||||||
|
Research and development
|
$
|
339
|
|
$
|
329
|
|
$
|
330
|
|
3%
|
—
|
||||
|
Selling, general and administrative
|
$
|
1,229
|
|
$
|
1,253
|
|
$
|
1,189
|
|
(2)%
|
5%
|
||||
Total gross margin for the year ended
October 31, 2017
increased 2 percentage points when compared to last year. Increases in total gross margins for the year ended
October 31, 2017
reflects higher sales volume, results from margin improvement initiatives, lower amortization expense of intangible assets and the impact of an employee pension settlement gain partially offset by higher wages and variable pay. Total gross margin for the year ended
October 31, 2016
increased 2 percentage points when compared to last year. Increases in total gross margins for the year ended
October 31, 2016
were as a result of the exit of the NMR business, several margin improvement initiatives, lower logistics costs, lower costs to address the now lifted FDA warning letter offset by increased wages and variable pay.
Total operating margin increased 4 percentage points for the year ended
October 31, 2017
, when compared to last year. Operating margins increased due to improvements in gross margins, the impact of lower amortization expense of intangible assets, lower transformation initiatives costs, lower acquisition and integration costs and the impact of an employee pension settlement gain when compared to last year. Total operating margin increased 2 percentage points for the year ended
October 31, 2016
, when compared to last year. Operating margins increased due to improvements in gross margin and the impact of an employee pension curtailment gain offset by the increased acquisition and integrations costs, the impairment charge for investment-related loans and increased wages and variable pay.
Gross inventory charges were $24 million in 2017, $20 million in 2016 and $30 million in 2015. Sales of previously written down inventory were $9 million in 2017, $9 million in 2016 and $13 million in 2015.
Our research and development efforts focus on potential new products and product improvements covering a wide variety of technologies, none of which is individually significant to our operations. Our research seeks to improve on various technical competencies in software, systems and solutions, life sciences and diagnostics. In each of these research fields, we conduct research that is focused on specific product development for release in the short-term as well as other research that is intended to be the foundation for future products over a longer time-horizon. Most of our product development research is designed to improve products already in production, focus on major new product releases, and develop new product segments for the future. Due to
36
the breadth of research and development projects across all of our businesses, there are a number of drivers of this expense. We remain committed to invest significantly in research and development and have focused our development efforts on key strategic opportunities to align our business with available markets and position ourselves to capture market share.
Research and development expenses increased 3 percent for the year ended
October 31, 2017
when compared with last year. Research and development expenditures increased due to increased spending on new products related to all of our businesses, additional expenses related to increased headcount from acquisitions, and higher wages and variable pay. Research and development expenses was relatively flat for the year ended
October 31, 2016
when compared with last year. Research and development expenditures increased by a $4 million in-process research and development (IPR&D) impairment charge mostly offset by the impact of an employee pension curtailment gain.
Selling, general and administrative expenses decreased 2 percent in
2017
compared to
2016
. Selling, general and administrative expenses decreased due to lower amortization expense from intangible assets, lower transformational initiatives, lower acquisition and integration costs, the impact of an employee pension settlement gain and reduced costs due to business improvement initiatives partially offset by higher wages and variable pay and additional selling, general and administrative expenses associated with our recent acquisitions. Selling, general and administrative expenses increased 5 percent in 2016 compared to 2015. Selling, general and administrative expenses increased due to acquisition and integration costs related to recently acquired businesses, higher wages and variable pay and an impairment charge related to equity method investment loans offset by the impact of an employee pension curtailment gain.
Interest expense for the years ended
October 31, 2017
,
2016
and
2015
was
$79 million
,
$72 million
and
$66 million
, respectively, and relates to the interest charged on our senior notes and the amortization of the deferred loss recorded upon termination of the forward starting interest rate swap contracts offset by the amortization of deferred gains recorded upon termination of interest rate swap contracts.
At
October 31, 2017
, our headcount was approximately
13,500
compared to
12,500
in
2016
.
Other income (expense), net
For the years ended
October 31, 2017
,
2016
and
2015
, other income (expense), net includes income of
$12 million
,
$12 million
and
$25 million
, respectively, related to the provision of certain IT and site service costs to, and lease income from, Keysight. The costs associated with these services are reported within income from operations. Agilent expects to receive lease income and site service income from Keysight over the next 2-3 years of approximately $12 million per year. For the year ended October 31, 2016, other income (expense), net also includes an $18 million expense related to the impairment of an investment.
Income Taxes
|
|
Years Ended October 31,
|
||||||||||
|
|
2017
|
2016
|
2015
|
||||||||
|
|
(in millions)
|
||||||||||
|
Provision for income taxes
|
$
|
119
|
|
$
|
82
|
|
$
|
42
|
|
||
For 2017, the company's income tax expense was
$119 million
with an effective tax rate of
14.8 percent
. Our effective tax rate is impacted by earnings realized in foreign jurisdictions with statutory tax rates lower than the federal statutory tax rate. During the year, the company determined a portion of current year foreign earnings from its low tax jurisdictions would not be considered as indefinitely reinvested. As such, a deferred tax liability for that portion of unremitted foreign earnings was accrued causing an increase in the annual tax expense. Our annual effective tax rate also included tax benefits due to the settlement of an audit in Germany for the years 2005 through 2008 and the lapse of U.S. statute of limitation for the fiscal years 2012 and 2013. This benefit was offset by a deferred tax liability required for the tax expected upon repatriation of related unremitted foreign earnings that were not asserted as indefinitely invested outside the U.S.
For 2016, the company's income tax expense was
$82 million
with an effective tax rate of 15.1 percent. The income tax provision from continuing operations for the year ended October 31, 2016 included net discrete tax expense of
$17 million
primarily due to tax expense related to the establishment of a valuation allowance on an equity method investment impairment that would generate a capital loss when realized.
For 2015, the company’s income tax expense from continuing operations was
$42 million
with an effective tax rate of 8.7 percent. The income tax expense from continuing operations for the year ended October 31, 2015 included a net discrete tax
37
benefit of
$(55) million
primarily due to the settlement of an Internal Revenue Service (“IRS) audit in the U.S. and the recognition of tax expense related to the repatriation of dividends.
Agilent enjoys tax holidays in several different jurisdictions, most significantly in Singapore. The tax holidays provide lower rates of taxation on certain classes of income and require various thresholds of investments and employment or specific types of income in those jurisdictions. The tax holidays are due for renewal between 2018 and 2023. As a result of the incentives, the impact of the tax holidays decreased income taxes by
$93 million
,
$86 million
, and
$65 million
in
2017
,
2016
, and
2015
, respectively. The benefit of the tax holidays on net income per share (diluted) was approximately
$0.29
,
$0.26
, and
$0.19
in
2017
,
2016
and
2015
, respectively.
In accordance with the guidance on the accounting for uncertainty in income taxes, for all U.S. and other tax jurisdictions, we recognize potential liabilities for anticipated tax audit issues based on our estimate of whether, and the extent to which, additional taxes and interest will be due. If our estimate of income tax liabilities proves to be less than the ultimate assessment, a further charge to expense would be required. If events occur and the payment of these amounts ultimately proves to be unnecessary, the reversal of the liabilities would result in tax benefits being recognized in the period when we determine the liabilities are no longer necessary. We include interest and penalties related to unrecognized tax benefits within the provision for income taxes on the consolidated statements of operations.
In the U.S., tax years remain open back to the year 2014 for federal income tax purposes and the year 2000 for significant states. There were no substantial changes to the status of these open tax years during 2017. The U.S. statute of limitation for audit of tax returns for the fiscal years 2012 and 2013 expired in July, 2017. The statute expiration resulted in the recognition, within the continuing operations, of previously unrecognized tax benefits of
$40 million
. This discrete tax benefit was offset by a deferred tax liability required for the tax expected upon repatriation of related unremitted foreign earnings that were not asserted as indefinitely invested outside the U.S.
On September 22, 2015, we reached an agreement with the Internal Revenue Service ("IRS") for the tax years 2008 through 2011. The settlement resulted in the recognition, within the continuing operations, of previously unrecognized tax benefits of
$119 million
, offset by a tax liability on foreign distributions of approximately
$99 million
principally related to the repatriation of foreign earnings.
In other major jurisdictions where the company conducts business, the tax years generally remain open back to the year 2001. During the first quarter of fiscal year 2017, the company settled its ongoing tax audit in Italy for the years 2011 to 2013 resulting in a net tax expense of $7 million. The settlement resulted in the recognition of previously unrecognized tax benefits of approximately $14 million. During the third quarter of fiscal year 2017, the company settled its ongoing tax audit in Germany for the years 2005 to 2008, which resulted in the recognition of previously unrecognized tax benefits of approximately $51 million.
With these jurisdictions and the U.S., it is reasonably possible that there could be significant changes to our unrecognized tax benefits in the next twelve months due to either the expiration of a statute of limitation or a tax audit settlement which will be partially offset by an anticipated tax liability related to unremitted foreign earnings, where applicable. Given the number of years and numerous matters that remain subject to examination in various tax jurisdictions, management is unable to estimate the range of possible changes to the balance of our unrecognized tax benefits.
On July 27, 2015, the U.S. Tax Court issued an opinion in Altera Corp. v. Commissioner related to the treatment of stock-based compensation expense in an intercompany cost-sharing arrangement. A final decision was entered by the U.S. Tax Court on December 1, 2015. At this time, the U.S. Department of the Treasury has not withdrawn the requirement from its regulations to include stock-based compensation. The IRS appealed the decision and filed its arguments opposing the Tax Court decision in June 2016. The case is currently in the appeals process in the Ninth Circuit. Due to the uncertainty surrounding the Court’s decision, we concluded that no adjustment to our consolidated financial statements is appropriate at this time.
Segment Overview
Through October 31, 2017, we have three business segments comprised of the life sciences and applied markets business, the diagnostics and genomics business and the Agilent CrossLab business.
Life Sciences and Applied Markets
Our life sciences and applied markets business provides application-focused solutions that include instruments and software that enable customers to identify, quantify and analyze the physical and biological properties of substances and products, as well as enable customers in the clinical and life sciences research areas to interrogate samples at the molecular and cellular level. Key
38
product categories include: liquid chromatography ("LC") systems and components; liquid chromatography mass spectrometry ("LCMS") systems; gas chromatography ("GC") systems and components; gas chromatography mass spectrometry ("GCMS") systems; inductively coupled plasma mass spectrometry ("ICP-MS") instruments; atomic absorption ("AA") instruments; microwave plasma-atomic emission spectrometry (“MP-AES”) instruments; inductively coupled plasma optical emission spectrometry ("ICP-OES") instruments; raman spectroscopy; cell analysis plate based assays; laboratory software and informatics systems; laboratory automation and robotic systems; dissolution testing; vacuum pumps and measurement technologies.
Net Revenue
|
|
Years Ended October 31,
|
2017 over 2016
Change |
2016 over 2015
Change |
||||||||||||
|
|
2017
|
2016
|
2015
|
||||||||||||
|
|
(in millions)
|
|
|
||||||||||||
|
Net revenue
|
$
|
2,169
|
|
$
|
2,073
|
|
$
|
2,046
|
|
5%
|
1%
|
||||
Life science and applied markets business revenue in 2017 increased 5 percent compared to 2016. Foreign currency movements for 2017 had an overall unfavorable currency impact of less than 1 percentage point on revenue growth when compared to the same period last year. Geographically, revenue increased 2 percent in the Americas, increased 7 percent in Europe with a 1 percentage point unfavorable currency impact and increased 5 percent in Asia Pacific. From a product standpoint, gas chromatography mass spectrometry, software and informatics systems, and cell analysis systems led with double digit growth during the year. Gas chromatography returned to strong growth on the strength of rebounding chemical and energy markets. Liquid chromatography grew single digits compared to 2016 as the pharmaceutical markets moderated.
Life science and applied markets business revenue in 2016 increased 1 percent compared to 2015. Strong growth in China led the geographic portfolio during 2016, and helped offset softness in the Americas and Europe. Liquid chromatography products revenue continued solid growth on strength in the pharmaceutical market. Revenue from mass spectrometry had areas of strength, particularly in China, which were offset by continued declines in revenue in the chemical and energy markets as well as diagnostic and clinical market declines in the Americas.
End market performance in 2017 showed a shift in growth trends from those of 2016. Chemical and energy markets rebounded sharply from the depressed levels of 2016 and delivered strong growth. The growth from pharmaceutical markets, which led the way in 2016, was modest reflecting difficult year on year comparisons. Food and environmental markets demonstrated continued growth during the year. Life science research and diagnostic and clinical market sales saw improvement as the year progressed. End market performance reflected mixed growth across markets in 2016. Pharmaceutical market growth was robust in 2016 driven by continuing technology refresh programs. Food and environmental markets, driven by strong sales in China, were areas of good growth in an otherwise weak applied market sector. Chemical and energy markets continued their declines throughout 2016 as oil prices remained low and capital budgets were constrained.
Looking forward, we are optimistic about our growth opportunities in the life sciences and applied markets as our broad portfolio of products and solutions are well suited to address customer needs. We anticipate strong sales funnels given new product introductions as we continue to invest in expanding and improving our applications and solutions portfolio. While we anticipate volatility in our markets, we expect continued growth across most end markets.
39
Gross Margin and Operating Margin
The following table shows the life sciences and applied markets business' margins, expenses and income from operations for
2017
versus
2016
, and
2016
versus
2015
.
|
|
Years Ended October 31,
|
2017 over 2016
Change |
2016 over 2015
Change |
|||||||||
|
|
2017
|
2016
|
2015
|
|||||||||
|
Total gross margin
|
60.1
|
%
|
58.6
|
%
|
56.2
|
%
|
2 ppts
|
2 ppts
|
||||
|
Operating margin
|
22.5
|
%
|
20.7
|
%
|
18.6
|
%
|
2 ppts
|
2 ppts
|
||||
|
(in millions)
|
|
|
|
|
|
||||||||||
|
Research and development
|
$
|
206
|
|
$
|
195
|
|
$
|
192
|
|
6%
|
2%
|
||||
|
Selling, general and administrative
|
$
|
610
|
|
$
|
590
|
|
$
|
576
|
|
3%
|
2%
|
||||
|
Income from operations
|
$
|
487
|
|
$
|
429
|
|
$
|
380
|
|
13%
|
13%
|
||||
Gross margin increased 2 percentage points in 2017 compared to 2016. The increase was due to a combination of moderate price increases, margin improvement initiatives, and reduced logistics costs. Gross margin increased 2 percentage points in 2016 compared to 2015. The exit of our NMR business contributed 1 percentage point to gross margin improvement. Other contributions were the result of reduced warranty costs and improved efficiencies in logistics offset by higher wages and variable pay.
Research and development expenses increased 6 percent in 2017 when compared to 2016. Research and development expenses increased due to higher project investments across our businesses as well as higher wages and variable pay. Research and development expenses increased 2 percent in 2016 when compared to 2015. Acquisitions partially offset savings from the NMR business exit, with growth coming from wage increases, variable pay and targeted investments.
Selling, general and administrative expenses increased 3 percent in 2017 compared to 2016. Selling, general and administrative expenses increased due to higher funding in marketing programs to promote newly released products as well as higher wages and variable pay. Selling, general and administrative expenses increased 2 percent in 2016 compared to 2015. Acquisitions partially offset savings from the NMR business exit, with growth coming from higher wages and variable pay.
Operating margin increased 2 percentage points in 2017 compared to 2016. Operating margin increased due to revenue growth paired with improvements from gross margin initiatives and moderate price increases. Operating margin increased 2 percentage points in 2016 compared to 2015. The exit of our NMR business contributed 2 percentage point to operating margin improvement, with gross margin improvements from lower warranty and logistics costs making up the difference.
Income from Operations
Income from operations in 2017 increased by $58 million or 13 percent when compared to 2016 on a revenue increase of $96 million. The increase was due to higher revenues and lower cost of sales on incremental revenues. Income from operations in 2016 increased by $49 million or 13 percent compared to 2015 on a revenue increase of $27 million. The exit of our NMR division contributed roughly 40 percent of the improvement with revenue growth and improved gross margins making up the difference.
Diagnostics and Genomics
Our diagnostics and genomics business includes the genomics, nucleic acid contract manufacturing and research and development, pathology, companion diagnostics and reagent partnership businesses.
Our diagnostics and genomics business is comprised of five areas of activity providing active pharmaceutical ingredients ("APIs") for oligo-based therapeutics as well as solutions that include reagents, instruments, software and consumables, which enable customers in the clinical and life sciences research areas to interrogate samples at the cellular and molecular level. First, our genomics business includes arrays for DNA mutation detection, genotyping, gene copy number determination, identification of gene rearrangements, DNA methylation profiling, gene expression profiling, as well as next generation sequencing ("NGS") target enrichment and genetic data management and interpretation support software. This business also includes our new acquisition “Multiplicom” a leading European diagnostics company with state-of-the-art genetic testing technology and products. Multiplicom’s solutions enable clinical labs to identify DNA variants associated with genetic disease and help direct cancer therapy.
40
Second, our nucleic acid solutions business provides equipment and expertise focused on production of synthesized oligonucleotides under pharmaceutical good manufacturing practices ("GMP") conditions for use as active pharmaceutical ingredients ("API") in an emerging class of drugs that utilize nucleic acid molecules for disease therapy. Next, our pathology solutions business is focused on product offerings to cancer diagnostics and anatomic pathology workflows. The broad portfolio of offerings includes immunohistochemistry (“IHC”), in situ hybridization (“ISH”), hematoxylin and eosin (“H&E”) staining and special staining. We also collaborate with a number of major pharmaceutical companies to develop new potential pharmacodiagnostics, also known as companion diagnostics, which may be used to identify patients most likely to benefit from a specific targeted therapy. Finally, the reagent partnership business is a provider of reagents used for turbidimetry and flow cytometry.
Net Revenue
|
|
Years Ended October 31,
|
2017 over 2016
Change |
2016 over 2015
Change |
||||||||||||
|
|
2017
|
2016
|
2015
|
||||||||||||
|
|
(in millions)
|
|
|
||||||||||||
|
Net revenue
|
$
|
772
|
|
$
|
709
|
|
$
|
662
|
|
9%
|
7%
|
||||
Diagnostics and genomics business revenue in 2017 increased 9 percent compared to 2016. Foreign currency movements for 2017 had no overall currency impact on revenue growth when compared to the same period last year. Geographically, revenue increased 8 percent in the Americas with a 1 percentage point favorable currency impact, increased 10 percent in Europe with a 1 percentage point unfavorable currency impact and increased 10 percent in Asia Pacific. The growth in the Americas was assisted by continued strength in our nucleic acid solutions division, growth in sales in our pathology business and continuing strong growth in the companion diagnostic business. Pathology growth was a result of strength in all regions led by our companion diagnostics ("CDx") assays and molecular pathology products. Europe results were supported by growth in our genomics, pathology, and the companion diagnostic business. Asia Pacific, our relatively smaller region, increased mainly due to higher shipment volumes in China and Japan.
Diagnostics and genomics business revenue in 2016 increased 7 percent compared to 2015. The performance in Americas and Europe were assisted by growth in sales in genomics (particularly target enrichment and arrays), strength in pathology business, continued demand in the nucleic acid solutions and good momentum in the companion diagnostic business. Growth in Asia Pacific reflected strong growth in China.
The 9 percent revenue growth in 2017 was due to positive growth from all businesses and regions. This was led by revenue growth in the companion diagnostics business working with our pharmaceutical partners. Nucleic acid business saw continued market demand in the nucleic acid solutions business related to therapeutic oligo programs and the pathology business saw steady growth due to strong utilization of Agilent’s Dako OMNIS platform and strength in our PD-L1 assays. The end markets in diagnostics and clinical research remain strong and growing driven by an aging population and lifestyle. The 7 percent revenue growth in 2016 was driven by demand in the nucleic acid solutions, good revenue performance in pathology and companion diagnostics businesses as well as next generation sequencing solution offering within the genomics business.
Looking forward, we are optimistic about our growth opportunities in the diagnostics markets and continue to invest in expanding and improving our applications and solutions portfolio. We remain positive about our growth in these markets, as our Dako OMNIS products, PD-L1 assays and SureFISH continue to gain strength with our customers in clinical oncology applications and our next generation sequencing (target enrichment solutions) continue to be adopted. Market demand in the nucleic acid solutions business related to therapeutic oligo programs continues to be strong. We are investing in building further capacity in our nucleic acid business to address the demand for the oligos. We will continue to invest in research and development, and seek to expand our position in developing countries and emerging markets.
41
Gross Margin and Operating Margin
The following table shows the diagnostics and genomics business's margins, expenses and income from operations for
2017
versus
2016
, and
2016
versus
2015
.
|
|
Years Ended October 31,
|
2017 over 2016
Change |
2016 over 2015
Change |
|||||||||
|
|
2017
|
2016
|
2015
|
|||||||||
|
Total gross margin
|
55.1
|
%
|
54.6
|
%
|
54.4
|
%
|
1 ppt
|
—
|
||||
|
Operating margin
|
19.3
|
%
|
16.0
|
%
|
13.3
|
%
|
3 ppts
|
3 ppts
|
||||
|
(in millions)
|
|
|
|
|
|
||||||||||
|
Research and development
|
$
|
84
|
|
$
|
83
|
|
$
|
78
|
|
1%
|
6%
|
||||
|
Selling, general and administrative
|
$
|
193
|
|
$
|
190
|
|
$
|
195
|
|
1%
|
(2)%
|
||||
|
Income from operations
|
$
|
149
|
|
$
|
114
|
|
$
|
88
|
|
31%
|
29%
|
||||
Gross margin increased 1 percentage point in 2017 when compared to 2016, mainly driven out of higher volume. Gross margin was flat in 2016 when compared to 2015. Favorable gross margins due to higher volumes were fully offset by unfavorable currency movements.
Research and development expenses increased 1 percent in 2017 when compared to 2016 however reduced 1 percent as a percentage of revenue. The spending increase is related to an acquisition and higher wages and variable pay. Research and development expenses increased 6 percent in 2016 when compared to 2015 however, remained flat as a percentage of revenue. This reflected higher wages and variable pay and increased spending around the development of clinical applications and solutions were partially offset by favorable currency movements.
Selling, general and administrative expenses increased 1 percent in 2017 when compared to 2016. Selling, general and administrative expenses increase was related to additional operating expenses associated with an acquisition and higher wages and variable pay partially offset by reduced expenses due to business improvement initiatives. Selling, general and administrative expenses decreased 2 percent in 2016 when compared to 2015, reflecting favorable currency movements, reduced expenses due to business improvement initiatives partially offset by higher wages and variable pay.
Operating margin increased 3 percentage points in 2017 when compared to 2016. The margin improvement was driven by higher revenue volumes partially offset by adding the cost structure of an acquisition and higher wages and variable pay. Operating margin increased 3 percentage points in 2016 when compared to 2015. The increase was due to higher volumes, efficiency gains in selling, general and administrative costs partially offset by higher wages and variable pay.
Income from Operations
Income from operations in 2017 increased by $35 million or 31 percent when compared to 2016 on a revenue increase of $63 million. The increase was due to higher volumes and controlled expenses. Income from operations in 2016 increased by $26 million or 29 percent when compared to 2015 on a revenue increase of $47 million. The increase was due to higher volumes and reduced selling and general administration expenses.
Agilent CrossLab
The Agilent CrossLab business spans the entire lab with its extensive consumables and services portfolio, which is designed to improve customer outcomes. The majority of the portfolio is vendor neutral, meaning Agilent can serve and supply customers regardless of their instrument purchase choices. Solutions range from chemistries and supplies to services and software helping to connect the entire lab. Key product categories in consumables include GC and LC columns, sample preparation products, custom chemistries, and a large selection of laboratory instrument supplies. Services include startup, operational, training and compliance support, software as a service, as well as asset management and consultative services that help increase customer productivity. Custom service and consumable bundles are tailored to meet the specific application needs of various industries and to keep instruments fully operational and compliant with the respective industry requirements.
42
Net Revenue
|
|
Years Ended October 31,
|
2017 over 2016
Change |
2016 over 2015
Change |
||||||||||||
|
|
2017
|
2016
|
2015
|
||||||||||||
|
|
(in millions)
|
|
|
||||||||||||
|
Total net revenue
|
$
|
1,531
|
|
$
|
1,420
|
|
$
|
1,330
|
|
8%
|
7%
|
||||
Agilent CrossLab business revenue in 2017 increased 8 percent when compared to 2016. Foreign currency movements for 2017 had an overall unfavorable impact of less than 1 percentage point when compared to 2016. Revenue growth in 2017 was led by increases in most core services and lab enterprise services and was led in terms of percentage growth by the remarketed instruments business. Geographically, revenue increased 8 percent in the Americas, increased 4 percent in Europe with a 2 percentage points unfavorable currency impact and increased 11 percent in Asia Pacific with a 1 percentage point unfavorable currency impact. Agilent CrossLab business revenue in 2016 increased 7 percent when compared to 2015. Revenue growth in 2016 was led by increases in enterprise service contracts, LC small molecule columns, remarketed instruments, and bio-columns.
Agilent CrossLab business saw positive revenue growth in all the key end markets in 2017, except in the forensics market. In 2017, revenue growth, from a percentage perspective, was led by the food market. The pharmaceutical and biotechnology market in 2017 saw slower growth than in the prior year mostly due to a tougher comparison, but was still the primary growth driver from a volume perspective. The chemical and energy market provided the same level of solid revenue growth in 2017 as in 2016. In 2016, the business saw positive revenue growth in all the key end markets after accounting for the unfavorable currency movements, and was led by the pharmaceutical and biotechnology market, as well as the food market.
Looking forward, we expect balanced strength in nearly all key end markets to drive growth in the near term. Geographically, we remain optimistic on the market growth and market penetration opportunities in China and the emerging markets. Other factors for near term revenue growth include upcoming product launches from our consumables pipeline, as well as on our investment in our laboratory enterprise offerings.
Gross Margin and Operating Margin
The following table shows the Agilent CrossLab business's margins, expenses and income from operations for
2017
versus
2016
and
2016
versus
2015
.
|
|
Years Ended October 31,
|
2017 over 2016
Change |
2016 over 2015
Change |
|||||||||
|
|
2017
|
2016
|
2015
|
|||||||||
|
Total gross margin
|
49.5
|
%
|
49.4
|
%
|
49.6
|
%
|
—
|
—
|
||||
|
Operating margin
|
22.1
|
%
|
22.3
|
%
|
22.5
|
%
|
—
|
—
|
||||
|
(in millions)
|
|
|
|
|
|
||||||||||
|
Research and development
|
$
|
49
|
|
$
|
46
|
|
$
|
46
|
|
7%
|
—
|
||||
|
Selling, general and administrative
|
$
|
370
|
|
$
|
339
|
|
$
|
315
|
|
9%
|
7%
|
||||
|
Income from operations
|
$
|
338
|
|
$
|
316
|
|
$
|
299
|
|
7%
|
6%
|
||||
Gross margin was flat in 2017 when compared to 2016, due to the higher sales volume offset by higher wages and variable pay. Gross margin was flat in 2016 when compared to 2015, due to the higher sales volume and several margin improvement initiatives which were partially offset by higher wages and variable pay, unfavorable currency movements and less favorable currency hedging results.
Research and development expenses increased 7 percent in 2017 when compared to 2016, due to increased investment related to an acquisition, as well as higher wages and variable pay. Research and development expenses was flat in 2016 when compared to 2015, due to wage increases being offset by moderate favorable currency movements.
Selling, general and administrative expenses increased 9 percent in 2017 when compared to 2016, due to higher orders driving higher selling costs, as well as higher wages and variable pay and the additional operating expenses from an acquisition. Selling, general and administrative expenses increased 7 percent in 2016 when compared to 2015, primarily due to higher orders driving higher field selling costs, higher wages and variable pay and larger investments into marketing and the sales channel.
43
Operating margin was flat in 2017 when compared to 2016, due to higher sales volume helping to offset growth in the number of service workforce, higher wages and variable pay and higher field selling costs. Operating margin was flat in 2016 when compared to 2015, due to higher sales volume which was partially offset by higher wages and variable pay, unfavorable currency movements less favorable currency hedging results, and increased selling, general and administrative expenses.
Income from Operations
Income from operations in 2017 increased by $22 million or 7 percent when compared to 2016 on a revenue increase of $111 million. This increase was due to higher sales volume, partially offset by higher operating expenses. Income from operations in 2016 increased by $17 million or 6 percent when compared to 2015 on a revenue increase of $90 million. This increase was due to higher sales volume, partially offset by currency and higher operating expenses.
Financial Condition
Liquidity and Capital Resources
Our financial position as of
October 31, 2017
consisted of cash and cash equivalents of
$2,678 million
as compared to
$2,289 million
as of
October 31, 2016
.
As of
October 31, 2017
, approximately
$2,600 million
of our cash and cash equivalents is held outside of the U.S. by our foreign subsidiaries. Most of the amounts held outside of the U.S. could be repatriated to the U.S. but, under tax law effective through our 2017 fiscal year-end, would be subject to U.S. federal and state income taxes, less applicable tax credits. Agilent has accrued for U.S. federal and state tax liabilities on the earnings of its foreign subsidiaries except when the earnings are asserted as indefinitely reinvested outside of the U.S. Repatriation could result in additional material U.S. federal and state income tax payments in future years. In 2017, we assessed our overall cash needs and funding sources and determined a portion of our current year foreign earnings from our low-tax jurisdictions would be repatriated, the timing of which is dependent upon the recently passed U.S. tax legislation. We utilize a variety of funding strategies in an effort to ensure that our worldwide cash is available in the locations in which it is needed.
We believe our cash and cash equivalents, cash generated from operations, and ability to access capital markets and credit lines will satisfy, for at least the next twelve months, our liquidity requirements, both globally and domestically, including the following: working capital needs, capital expenditures, business acquisitions, stock repurchases, cash dividends, contractual obligations, commitments, principal and interest payments on debt, and other liquidity requirements associated with our operations.
Net Cash Provided by Operating Activities
Net cash provided by operating activities was
$889 million
in
2017
as compared to
$793 million
provided in
2016
and
$512 million
provided in
2015
. We paid approximately
$63 million
of net taxes in
2017
, as compared to
$67 million
in net taxes in
2016
and net taxes of
$129 million
in
2015
. The decrease in taxes paid for the year ended October 31, 2016 compared to 2015 was primarily due to taxes paid related to the separation of Keysight in 2015 and to a lesser extent due to some tax refunds. Cash paid for income taxes for the year ended October 31, 2015, included tax payments related to the separation of Keysight. For the years ended
October 31, 2017
,
2016
and
2015
, other assets and liabilities used cash of
$98 million
, provided cash of
$10 million
and used cash of
$249 million
, respectively. The increase in cash usage for the year ended October 31, 2017 in other assets and liabilities is primarily due to pension contributions and taxes.
In
2017
, the change in accounts receivable used cash of
$81 million
,
$33 million
in
2016
, and
$24 million
in
2015
. Days' sales outstanding as of October 31, were
55
days in
2017
,
51
days in
2016
and
53
days in
2015
. The change in accounts payable provided cash of
$2 million
in
2017
, used cash of
$15 million
in
2016
and used cash of
$26 million
in
2015
. Cash used in inventory was
$61 million
in
2017
, in
$7 million
in
2016
and
$24 million
in
2015
. Inventory days on-hand increased to
95
days in
2017
compared to
92
days in
2016
and decreased compared to
97
days in
2015
.
We contributed
$25 million
,
zero
and
$15 million
to our U.S. defined benefit plans in
2017
,
2016
and
2015
, respectively. We contributed
$21 million
,
$24 million
and
$25 million
to our non-U.S. defined benefit plans in
2017
,
2016
and
2015
, respectively. We contributed less than
$1 million
in 2017,
2016
and
2015
to our U.S. post-retirement benefit plans. Our non-U.S. defined benefit plans are generally funded ratably throughout the year. Total contributions in
2017
were
$46 million
or 92 percent more than
2016
. Our annual contributions are highly dependent on the relative performance of our assets versus our projected liabilities, among other factors. We do not expect to contribute to our U.S. plans and expect to contribute
$22 million
to our non-U.S. defined benefit plans and
nothing
to our U.S. post-retirement benefit plans during 2018.
44
Net Cash Used in Investing Activities
Net cash used in investing activities in
2017
was
$305 million
and in
2016
was
$238 million
as compared to net cash used of
$400 million
in
2015
.
Investments in property, plant and equipment were
$176 million
in
2017
,
$139 million
in
2016
and
$98 million
in
2015
. Proceeds from sale of property, plant and equipment were
zero
in
2017
and
2016
, and
$12 million
in
2015
. In
2017
we invested
$128 million
in acquisitions of businesses and intangible assets, net of cash acquired compared to
$261 million
in
2016
and
$74 million
in
2015
. In
2017
there were approximately
$1 million
purchases of cost method investments compared to
$80 million
outlay in
2016
and
zero
in
2015
. Change in restricted cash and cash equivalents was
$1 million
outflow in
2017
,
$245 million
inflow in
2016
and
$240 million
outflow in
2015
, respectively (changes in 2016 and 2015 related to our Seahorse Biosciences acquisition).
Net Cash Used in Financing Activities
Net cash used in financing activities in
2017
was
$202 million
compared to
$268 million
in
2016
and
$1,089 million
in
2015
, respectively.
Treasury Stock Repurchases
On November 22, 2013 we announced that our board of directors had authorized a share repurchase program. The program was designed to reduce or eliminate dilution resulting from issuance of stock under the company's employee equity incentive programs to target maintaining a weighted average share count of approximately
335 million
diluted shares. For the year ended
October 31, 2015
we repurchased
6 million
shares for
$267 million
. For the year ended
October 31, 2016
we repurchased approximately
2.4 million
shares for
$98 million
which completed the purchases under this authorization.
On May 28, 2015 we announced that our board of directors had approved a new share repurchase program (the "2015 repurchase program"). The 2015 share repurchase program authorizes the purchase of up to
$1.14 billion
of our common stock at the company's discretion through and including November 1, 2018. The 2015 repurchase program does not require the company to acquire a specific number of shares and may be suspended or discontinued at any time; however, we plan to repurchase a minimum of 674,000 shares per quarter in fiscal year 2018. Any additional repurchases may be impacted by our share price as well as other market conditions. During the year ended
October 31, 2016
, upon the completion of our previous repurchase program, we repurchased approximately
8.3 million
shares for
$336 million
under this authorization. During the year ended
October 31, 2017
we repurchased approximately
4.1 million
shares for
$194 million
under this authorization. As of
October 31, 2017
, we had remaining authorization to repurchase up to
$610 million
of our common stock under this program.
During fiscal year 2017, we retired
294.2 million
treasury shares at an aggregate cost of
$10.7 billion
, the amount of which represents all of our previously repurchased shares over the past 12 years including 2017 repurchases. Also the retirement resulted in a decrease of
$6.7 billion
to retained earnings and a decrease of
$4.0 billion
to additional paid-in-capital.
Dividends
For the years ended
October 31, 2017
,
2016
and
2015
cash dividends of
$170 million
,
$150 million
and
$133 million
were paid on the company's outstanding common stock, respectively. On
November 15, 2017
we declared a quarterly dividend of
$0.149
per share of common stock, or approximately
$48 million
which will be paid on
January 24, 2018
to shareholders of record as of the close of business on
January 2, 2018
. The timing and amounts of any future dividends are subject to determination and approval by our board of directors.
Credit Facility
On
September 15, 2014
, Agilent entered into a credit agreement with a financial institution which provides for a
$400 million
five
-year unsecured credit facility that will expire on
September 15, 2019
. On June 9, 2015, the commitments under the existing credit facility were increased by
$300 million
and on July 14, 2017, the commitments under the existing credit facility were increased by an additional
$300 million
so that the aggregate commitments under the facility now total
$1 billion
. As of
October 31, 2017
, the company had
$110 million
outstanding under the facility. We were in compliance with the covenants for the credit facility during the years ended
October 31, 2017
and
2016
.
45
Short-term and Long-term Debt
In October 2007, the company issued an aggregate principal amount of
$600 million
in senior notes ("2017 senior notes"). On October 20, 2014, we settled the redemption of
$500 million
of the
$600 million
outstanding aggregate principal amount of our 2017 senior notes. The remaining
$100 million
in senior notes matured and were paid in full on November 1, 2017.
In
July 2010
, the company issued an aggregate principal amount of
$500 million
in senior notes ("2020 senior notes"). The 2020 senior notes were issued at
99.54%
of their principal amount. The notes will mature on
July 15, 2020
, and bear interest at a fixed rate of
5.00%
per annum. The interest is payable
semi-annually
on January 15th and July 15th of each year, payments commenced on
January 15, 2011
.
On
August 9, 2011
, we terminated our interest rate swap contracts related to our 2020 senior notes that represented the notional amount of
$500 million
. The asset value, including interest receivable, upon termination for these contracts was approximately
$34 million
and the amount to be amortized at
October 31, 2017
was
$11 million
. The gain is being deferred and amortized to interest expense over the remaining life of the 2020 senior notes.
In
September 2012
, the company issued an aggregate principal amount of
$400 million
in senior notes ("2022 senior notes"). The 2022 senior notes were issued at
99.80%
of their principal amount. The notes will mature on
October 1, 2022
, and bear interest at a fixed rate of
3.20%
per annum. The interest is payable
semi-annually
on April 1st and October 1st of each year, payments commenced on
April 1, 2013
.
In
June 2013
, the company issued aggregate principal amount of
$600 million
in senior notes ("2023 senior notes"). The 2023 senior notes were issued at
99.544%
of their principal amount. The notes will mature on
July 15, 2023
and bear interest at a fixed rate of
3.875%
per annum. The interest is payable
semi-annually
on January 15th and July 15th of each year and payments commenced
January 15, 2014
.
On
September 15, 2016
, the company issued aggregate principal amount of
$300 million
in senior notes ("2026 senior notes"). The 2026 senior notes were issued at
99.624%
of their principal amount. The notes will mature on
September 22, 2026
and bear interest at a fixed rate of
3.050%
per annum. The interest is payable
semi-annually
on March 22nd and September 22nd of each year and payments commenced
March 22, 2017
.
In February 2016, Agilent executed three forward-starting pay fixed/receive variable interest rate swaps for the notional amount of
$300 million
in connection with future interest payments to be made on our 2026 senior notes issued on September 15, 2016. The swap arrangements were terminated on September 15, 2016 with a payment of
$10 million
and we recognized this as a deferred loss in accumulated other comprehensive income which is being amortized to interest expense over the life of the 2026 senior notes.The remaining loss to be amortized related to the interest rate swap agreements at
October 31, 2017
was
$9 million
.
Off Balance Sheet Arrangements and Other
We have contractual commitments for non-cancelable operating leases. See Note 15, "Commitments and Contingencies", to our consolidated financial statements for further information on our non-cancelable operating leases.
Our liquidity is affected by many factors, some of which are based on normal ongoing operations of our business and some of which arise from fluctuations related to global economics and markets. Our cash balances are generated and held in many locations throughout the world. Local government regulations may restrict our ability to move cash balances to meet cash needs under certain circumstances. We do not currently expect such regulations and restrictions to impact our ability to pay vendors and conduct operations throughout our global organization.
46
Contractual Commitments
Our cash flows from operations are dependent on a number of factors, including fluctuations in our operating results, accounts receivable collections, inventory management, and the timing of tax and other payments. As a result, the impact of contractual obligations on our liquidity and capital resources in future periods should be analyzed in conjunction with such factors.
The following table summarizes our total contractual obligations at
October 31, 2017
for Agilent operations and excludes amounts recorded in our consolidated balance sheet (in millions):
|
Less than one
year
|
One to three years
|
Three to five years
|
More than five years
|
||||||||||||
|
Operating leases
|
$
|
42
|
|
$
|
52
|
|
$
|
16
|
|
$
|
26
|
|
|||
|
Commitments to contract manufacturers and suppliers
|
384
|
|
4
|
|
—
|
|
—
|
|
|||||||
|
Other purchase commitments
|
40
|
|
—
|
|
—
|
|
—
|
|
|||||||
|
Retirement plans
|
22
|
|
—
|
|
—
|
|
—
|
|
|||||||
|
Transitional pension contributions to our U.S. 401(k) plan
|
$
|
8
|
|
$
|
15
|
|
$
|
12
|
|
$
|
—
|
|
|||
|
Total
|
$
|
496
|
|
$
|
71
|
|
$
|
28
|
|
$
|
26
|
|
|||
Operating Leases.
Commitments under operating leases relate primarily to leasehold property, see Note 15, "Commitments and Contingencies".
Commitments to Contract Manufacturers and Suppliers.
We purchase components from a variety of suppliers and use several contract manufacturers to provide manufacturing services for our products. During the normal course of business, we issue purchase orders with estimates of our requirements several months ahead of the delivery dates. The above amounts represent the commitments under the open purchase orders with our suppliers that have not yet been received. However, our agreements with these suppliers usually provide us the option to cancel, reschedule, and adjust our requirements based on our business needs prior to firm orders being placed. We expect to fulfill most of our purchase commitments for inventory within one year.
In addition to the above mentioned commitments to contract manufacturers and suppliers, in the past we recorded a liability for firm, non-cancelable and unconditional purchase commitments for quantities in excess of our future demand forecasts consistent with our policy relating to excess inventory. As of
October 31, 2017
, the liability for our firm, non-cancelable and unconditional purchase commitments was
$1 million
compared to less than
$1 million
as of
October 31, 2016
and
$5 million
as of
October 31, 2015
. These amounts are included in other accrued liabilities in our consolidated balance sheet.
Other Purchase Commitments.
We have categorized "other purchase commitments" related to contracts with professional services suppliers. Typically, we can cancel contracts without penalties. For those contracts that are not cancelable without penalties, we are disclosing the termination fees and costs or commitments for continued spending that we are obligated to pay to a supplier under each contact's termination period before such contract can be cancelled. Our contractual obligations with these suppliers under "other purchase commitments" were approximately
$40 million
within the next year.
Retirement Plans.
Commitments under the retirement plans relate to expected contributions to be made to our U.S. and non-U.S. defined benefit plans and to our post-retirement medical plans for the next year only. Contributions after next year are impractical to estimate. Effective May 1, 2016 until April 30, 2022, we will provide an additional transitional company contribution for certain eligible employees equal to
3 percent
,
4 percent
or
5 percent
of an employee's annual eligible compensation due to the U.S. Retirement Plan benefits being frozen.
We had no material off-balance sheet arrangements as of
October 31, 2017
or
October 31, 2016
.
47
On Balance Sheet Arrangements
The following table summarizes our total contractual obligations at
October 31, 2017
related to our debt and interest expense (in millions):
|
Less than one
year
|
One to three years
|
Three to five years
|
More than five years
|
||||||||||||
|
Senior notes
|
$
|
100
|
|
$
|
500
|
|
$
|
400
|
|
$
|
900
|
|
|||
|
Credit facility
(1)
|
110
|
|
—
|
|
—
|
|
—
|
|
|||||||
|
Interest expense
|
74
|
|
141
|
|
90
|
|
61
|
|
|||||||
|
Total
|
$
|
284
|
|
$
|
641
|
|
$
|
490
|
|
$
|
961
|
|
|||
(1) The credit facility expires on September 15, 2019.
Other long-term liabilities include
$131 million
and
$190 million
of liabilities for uncertain tax positions as of
October 31, 2017
and
October 31, 2016
, respectively. We are unable to accurately predict when these amounts will be realized or released. However, it is reasonably possible that there could be significant changes to our unrecognized tax benefits in the next twelve months due to either the expiration of a statute of limitations or a tax audit settlement.
48
Item 7A.
Quantitative and Qualitative Disclosures About Market Risk
We are exposed to foreign currency exchange rate risks inherent in our sales commitments, anticipated sales, and assets and liabilities denominated in currencies other than the functional currency of our subsidiaries. We hedge future cash flows denominated in currencies other than the functional currency using sales forecasts up to twelve months in advance. Our exposure to exchange rate risks is managed on an enterprise-wide basis. This strategy utilizes derivative financial instruments, including option and forward contracts, to hedge certain foreign currency exposures with the intent of offsetting gains and losses that occur on the underlying exposures with gains and losses on the derivative contracts hedging them. We do not currently and do not intend to utilize derivative financial instruments for speculative trading purposes.To the extent that we are required to pay for all, or portions, of an acquisition price in foreign currencies, we may enter into foreign exchange contracts to reduce the risk that currency movements will impact the cost of the transaction.
Our operations generate non-functional currency cash flows such as revenues, third party vendor payments and inter-company payments. In anticipation of these foreign currency cash flows and in view of volatility of the currency market, we enter into such foreign exchange contracts as are described above to manage our currency risk. Approximately 51 percent of our revenue in
2017
, 54 percent of our revenue in
2016
and 57 percent of our revenues in
2015
were generated in U.S. dollars.The unfavorable effects of changes in foreign currency exchange rates, principally as a result of the strength of the U.S. dollar, has decreased revenue by approximately
1
percentage points in the year ended
October 31, 2017
. The impact of foreign currency movements is calculated by applying the prior period foreign currency exchange rates to the current year period.
We performed a sensitivity analysis assuming a hypothetical 10 percent adverse movement in foreign exchange rates to the hedging contracts and the underlying exposures described above. As of
October 31, 2017
and
2016
, the analysis indicated that these hypothetical market movements would not have a material effect on our consolidated financial position, results of operations, statement of comprehensive income or cash flows.
We are also exposed to interest rate risk due to the mismatch between the interest expense we pay on our loans at fixed rates and the variable rates of interest we receive from cash, cash equivalents and other short-term investments. We have issued long-term debt in U.S. dollars or foreign currencies at fixed interest rates based on the market conditions at the time of financing. We believe that the fair value of our fixed rate debt changes when the underlying market rates of interest change, and we may use interest rate swaps to modify such market risk.
We performed a sensitivity analysis assuming a hypothetical 10 percent adverse movement in interest rates relating to the underlying fair value of our fixed rate debt. As of
October 31, 2017
and
2016
, the sensitivity analyses indicated that a hypothetical 10 percent adverse movement in interest rates would result in an immaterial impact to the fair value of our fixed interest rate debt.
49
Item 8.
Financial Statements and Supplementary Data
|
Index to Consolidated Financial Statements
|
Page
|
|
|
|
||
|
Consolidated Financial Statements:
|
|
|
50
REPORT OF INDEPENDENT REGISTERED PUBLIC ACCOUNTING FIRM
To
the Stockholders and Board of Directors of Agilent Technologies, Inc.:
In our opinion, the accompanying consolidated balance sheets and the related consolidated statements of income, comprehensive income, equity and cash flows present fairly, in all material respects, the financial position of Agilent Technologies, Inc. and its subsidiaries as of October 31, 2017 and October 31, 2016, and the results of their operations and their cash flows for each of the three years in the period ended October 31, 2017 in conformity with accounting principles generally accepted in the United States of America. In addition, in our opinion, the financial statement schedule listed in the index appearing under item 15(a)(2)
presents fairly, in all material respects, the information set forth therein when read in conjunction with the related consolidated financial statements. Also in our opinion, the Company maintained, in all material respects, effective internal control over financial reporting as of October 31, 2017, based on criteria established in
Internal Control - Integrated Framework
(2013) issued by the Committee of Sponsoring Organizations of the Treadway Commission (COSO). The Company's management is responsible for these financial statements and financial statement schedule, for maintaining effective internal control over financial reporting and for its assessment of the effectiveness of internal control over financial reporting, included in Management's Report on Internal Control over Financial Reporting
appearing under Item 9A. Our responsibility is to express opinions on these financial statements, on the financial statement schedule, and on the Company's internal control over financial reporting based on our integrated audits. We conducted our audits in accordance with the standards of the Public Company Accounting Oversight Board (United States). Those standards require that we plan and perform the audits to obtain reasonable assurance about whether the financial statements are free of material misstatement and whether effective internal control over financial reporting was maintained in all material respects. Our audits of the financial statements included examining, on a test basis, evidence supporting the amounts and disclosures in the financial statements, assessing the accounting principles used and significant estimates made by management, and evaluating the overall financial statement presentation. Our audit of internal control over financial reporting included obtaining an understanding of internal control over financial reporting, assessing the risk that a material weakness exists, and testing and evaluating the design and operating effectiveness of internal control based on the assessed risk. Our audits also included performing such other procedures as we considered necessary in the circumstances. We believe that our audits provide a reasonable basis for our opinions.
A company’s internal control over financial reporting is a process designed to provide reasonable assurance regarding the reliability of financial reporting and the preparation of financial statements for external purposes in accordance with generally accepted accounting principles. A company’s internal control over financial reporting includes those policies and procedures that (i) pertain to the maintenance of records that, in reasonable detail, accurately and fairly reflect the transactions and dispositions of the assets of the company; (ii) provide reasonable assurance that transactions are recorded as necessary to permit preparation of financial statements in accordance with generally accepted accounting principles, and that receipts and expenditures of the company are being made only in accordance with authorizations of management and directors of the company; and (iii) provide reasonable assurance regarding prevention or timely detection of unauthorized acquisition, use, or disposition of the company’s assets that could have a material effect on the financial statements.
Because of its inherent limitations, internal control over financial reporting may not prevent or detect misstatements. Also, projections of any evaluation of effectiveness to future periods are subject to the risk that controls may become inadequate because of changes in conditions, or that the degree of compliance with the policies or procedures may deteriorate.
|
/s/ PRICEWATERHOUSECOOPERS LLP
|
|
|
San Jose, California
|
|
|
December 21, 2017
|
|
51
AGILENT TECHNOLOGIES, INC.
|
|
Years Ended October 31,
|
||||||||||
|
|
2017
|
2016
|
2015
|
||||||||
|
|
(in millions, except per
share data)
|
||||||||||
|
Net revenue:
|
|
|
|
||||||||
|
Products
|
$
|
3,410
|
|
$
|
3,227
|
|
$
|
3,146
|
|
||
|
Services and other
|
1,062
|
|
975
|
|
892
|
|
|||||
|
Total net revenue
|
4,472
|
|
4,202
|
|
4,038
|
|
|||||
|
Costs and expenses:
|
|
|
|
||||||||
|
Cost of products
|
1,469
|
|
1,464
|
|
1,496
|
|
|||||
|
Cost of services and other
|
594
|
|
541
|
|
501
|
|
|||||
|
Total costs
|
2,063
|
|
2,005
|
|
1,997
|
|
|||||
|
Research and development
|
339
|
|
329
|
|
330
|
|
|||||
|
Selling, general and administrative
|
1,229
|
|
1,253
|
|
1,189
|
|
|||||
|
Total costs and expenses
|
3,631
|
|
3,587
|
|
3,516
|
|
|||||
|
Income from operations
|
841
|
|
615
|
|
522
|
|
|||||
|
Interest income
|
22
|
|
11
|
|
7
|
|
|||||
|
Interest expense
|
(79
|
)
|
(72
|
)
|
(66
|
)
|
|||||
|
Other income (expense), net
|
19
|
|
(10
|
)
|
17
|
|
|||||
|
Income from continuing operations before taxes
|
803
|
|
544
|
|
480
|
|
|||||
|
Provision for income taxes
|
119
|
|
82
|
|
42
|
|
|||||
|
Income from continuing operations
|
684
|
|
462
|
|
438
|
|
|||||
|
Loss from discontinued operations, net of tax benefit of $0, $0, and $2
|
$
|
—
|
|
$
|
—
|
|
$
|
(37
|
)
|
||
|
Net income
|
$
|
684
|
|
$
|
462
|
|
$
|
401
|
|
||
|
Net income per share - basic:
|
|
|
|
||||||||
|
Income from continuing operations
|
$
|
2.12
|
|
$
|
1.42
|
|
$
|
1.32
|
|
||
|
Loss from discontinued operations
|
—
|
|
—
|
|
(0.12
|
)
|
|||||
|
Net income per share - basic
|
$
|
2.12
|
|
$
|
1.42
|
|
$
|
1.20
|
|
||
|
Net income per share - diluted:
|
|||||||||||
|
Income from continuing operations
|
$
|
2.10
|
|
$
|
1.40
|
|
$
|
1.31
|
|
||
|
Loss from discontinued operations
|
—
|
|
—
|
|
(0.11
|
)
|
|||||
|
Net income per share - diluted
|
$
|
2.10
|
|
$
|
1.40
|
|
$
|
1.20
|
|
||
|
Weighted average shares used in computing net income per share:
|
|
|
|
||||||||
|
Basic
|
322
|
|
326
|
|
333
|
|
|||||
|
Diluted
|
326
|
|
329
|
|
335
|
|
|||||
|
Cash dividends declared per common share
|
$
|
0.528
|
|
$
|
0.460
|
|
$
|
0.400
|
|
||
The accompanying notes are an integral part of these consolidated financial statements.
52
AGILENT TECHNOLOGIES, INC.
CONSOLIDATED STATEMENT OF COMPREHENSIVE INCOME
(in millions)
|
Years Ended October 31,
|
|||||||||||
|
|
2017
|
2016
|
2015
|
||||||||
|
Net income
|
$
|
684
|
|
$
|
462
|
|
$
|
401
|
|
||
|
Other comprehensive income (loss):
|
|
|
|
||||||||
|
Gain (loss) on derivative instruments, net of tax expense (benefit) of $0, $(4) and $3
|
—
|
|
(6
|
)
|
8
|
|
|||||
|
Amounts reclassified into earnings related to derivative instruments, net of tax expense (benefit) of $0, $0 and $(6)
|
(1
|
)
|
3
|
|
(12
|
)
|
|||||
|
Foreign currency translation, net of tax expense (benefit) of $3, $3 and $(24)
|
41
|
|
(8
|
)
|
(336
|
)
|
|||||
|
Net defined benefit pension cost and post retirement plan costs:
|
|
|
|
||||||||
|
Change in actuarial net loss, net of tax expense (benefit) of $52, $(42), and $(17)
|
123
|
|
(86
|
)
|
(38
|
)
|
|||||
|
Change in net prior service benefit, net of tax benefit of $(3), $(8), and $(6)
|
(6
|
)
|
(15
|
)
|
(11
|
)
|
|||||
|
Other comprehensive income (loss)
|
157
|
|
(112
|
)
|
(389
|
)
|
|||||
|
Total comprehensive income
|
$
|
841
|
|
$
|
350
|
|
$
|
12
|
|
||
The accompanying notes are an integral part of these condensed consolidated financial statements.
53
AGILENT TECHNOLOGIES, INC.
|
|
October 31,
|
||||||
|
|
2017
|
2016
|
|||||
|
|
(in millions, except
par value and
share data)
|
||||||
|
ASSETS
|
|
|
|||||
|
Current assets:
|
|
|
|||||
|
Cash and cash equivalents
|
$
|
2,678
|
|
$
|
2,289
|
|
|
|
Accounts receivable, net
|
724
|
|
631
|
|
|||
|
Inventory
|
575
|
|
533
|
|
|||
|
Other current assets
|
192
|
|
182
|
|
|||
|
Total current assets
|
4,169
|
|
3,635
|
|
|||
|
Property, plant and equipment, net
|
757
|
|
639
|
|
|||
|
Goodwill
|
2,607
|
|
2,517
|
|
|||
|
Other intangible assets, net
|
361
|
|
416
|
|
|||
|
Long-term investments
|
138
|
|
135
|
|
|||
|
Other assets
|
394
|
|
452
|
|
|||
|
Total assets
|
$
|
8,426
|
|
$
|
7,794
|
|
|
|
LIABILITIES AND EQUITY
|
|
|
|||||
|
Current liabilities:
|
|
|
|||||
|
Accounts payable
|
$
|
305
|
|
$
|
257
|
|
|
|
Employee compensation and benefits
|
276
|
|
235
|
|
|||
|
Deferred revenue
|
291
|
|
269
|
|
|||
|
Short-term debt
|
210
|
|
—
|
|
|||
|
Other accrued liabilities
|
181
|
|
184
|
|
|||
|
Total current liabilities
|
1,263
|
|
945
|
|
|||
|
Long-term debt
|
1,801
|
|
1,904
|
|
|||
|
Retirement and post-retirement benefits
|
234
|
|
360
|
|
|||
|
Other long-term liabilities
|
293
|
|
339
|
|
|||
|
Total liabilities
|
3,591
|
|
3,548
|
|
|||
|
Commitments and contingencies (Note 15)
|
|
|
|
|
|||
|
Total equity:
|
|
|
|||||
|
Stockholders' equity:
|
|
|
|||||
|
Preferred stock; $0.01 par value; 125 million shares authorized; none issued and outstanding
|
—
|
|
—
|
|
|||
|
Common stock; $0.01 par value; 2 billion shares authorized; 322 million shares at October 31, 2017 and 614 million shares at October 31, 2016 issued
|
3
|
|
6
|
|
|||
|
Treasury stock at cost; zero shares at October 31, 2017 and 290 million shares at October 31, 2016
|
—
|
|
(10,508
|
)
|
|||
|
Additional paid-in-capital
|
5,300
|
|
9,159
|
|
|||
|
Retained earnings (accumulated deficit)
|
(126
|
)
|
6,089
|
|
|||
|
Accumulated other comprehensive loss
|
(346
|
)
|
(503
|
)
|
|||
|
Total stockholders' equity
|
4,831
|
|
4,243
|
|
|||
|
Non-controlling interest
|
4
|
|
3
|
|
|||
|
Total equity
|
4,835
|
|
4,246
|
|
|||
|
Total liabilities and equity
|
$
|
8,426
|
|
$
|
7,794
|
|
|
The accompanying notes are an integral part of these consolidated financial statements.
54
AGILENT TECHNOLOGIES, INC.
|
|
Years Ended October 31,
|
||||||||||
|
|
2017
|
2016
|
2015
|
||||||||
|
|
(in millions)
|
||||||||||
|
Cash flows from operating activities:
|
|
|
|
||||||||
|
Net income
|
$
|
684
|
|
$
|
462
|
|
$
|
401
|
|
||
|
Adjustments to reconcile net income to net cash provided by operating activities:
|
|
|
|
||||||||
|
Depreciation and amortization
|
212
|
|
246
|
|
253
|
|
|||||
|
Share-based compensation
|
60
|
|
58
|
|
54
|
|
|||||
|
Deferred taxes
|
102
|
|
3
|
|
70
|
|
|||||
|
Excess and obsolete inventory related charges
|
24
|
|
20
|
|
30
|
|
|||||
|
Asset impairment charges
|
—
|
|
4
|
|
3
|
|
|||||
|
Impairment of equity method investment and loans
|
—
|
|
25
|
|
—
|
|
|||||
|
Other
|
7
|
|
15
|
|
16
|
|
|||||
|
Changes in assets and liabilities:
|
|||||||||||
|
Accounts receivable, net
|
(81
|
)
|
(33
|
)
|
(24
|
)
|
|||||
|
Inventory
|
(61
|
)
|
(7
|
)
|
(24
|
)
|
|||||
|
Accounts payable
|
2
|
|
(15
|
)
|
(26
|
)
|
|||||
|
Employee compensation and benefits
|
38
|
|
15
|
|
8
|
|
|||||
|
Interest rate swap payments
|
—
|
|
(10
|
)
|
—
|
|
|||||
|
Other assets and liabilities
|
(98
|
)
|
10
|
|
(249
|
)
|
|||||
|
Net cash provided by operating activities
|
889
|
|
793
|
|
512
|
|
|||||
|
Cash flows from investing activities:
|
|
|
|
||||||||
|
Investments in property, plant and equipment
|
(176
|
)
|
(139
|
)
|
(98
|
)
|
|||||
|
Proceeds from the sale of property, plant and equipment
|
—
|
|
—
|
|
12
|
|
|||||
|
Proceeds from the sale of investment securities
|
—
|
|
1
|
|
—
|
|
|||||
|
Proceeds from divestitures
|
2
|
|
—
|
|
3
|
|
|||||
|
Payment to acquire cost method investment
|
(1
|
)
|
(80
|
)
|
—
|
|
|||||
|
Payment to acquire equity method investment
|
—
|
|
—
|
|
(1
|
)
|
|||||
|
Payment in exchange for convertible note
|
(1
|
)
|
(1
|
)
|
(2
|
)
|
|||||
|
Loan to equity method investment
|
—
|
|
(3
|
)
|
—
|
|
|||||
|
Change in restricted cash, cash equivalents and investments, net
|
(1
|
)
|
245
|
|
(240
|
)
|
|||||
|
Acquisitions of businesses and intangible assets, net of cash acquired
|
(128
|
)
|
(261
|
)
|
(74
|
)
|
|||||
|
Net cash used in investing activities
|
(305
|
)
|
(238
|
)
|
(400
|
)
|
|||||
|
Cash flows from financing activities:
|
|
|
|
||||||||
|
Issuance of common stock under employee stock plans
|
66
|
|
62
|
|
58
|
|
|||||
|
Payment of taxes related to net share settlement of equity awards
|
(14
|
)
|
(6
|
)
|
(13
|
)
|
|||||
|
Treasury stock repurchases
|
(194
|
)
|
(434
|
)
|
(267
|
)
|
|||||
|
Payment of dividends
|
(170
|
)
|
(150
|
)
|
(133
|
)
|
|||||
|
Issuance of senior notes
|
—
|
|
299
|
|
—
|
|
|||||
|
Debt issuance costs
|
—
|
|
(2
|
)
|
—
|
|
|||||
|
Proceeds from debts and credit facility
|
400
|
|
255
|
|
—
|
|
|||||
|
Repayment of debts and credit facility
|
(290
|
)
|
(292
|
)
|
—
|
|
|||||
|
Net transfer of cash and cash equivalents to Keysight
|
—
|
|
—
|
|
(734
|
)
|
|||||
|
Net cash used in financing activities
|
(202
|
)
|
(268
|
)
|
(1,089
|
)
|
|||||
|
Effect of exchange rate movements
|
7
|
|
(1
|
)
|
(48
|
)
|
|||||
|
Net increase (decrease) in cash and cash equivalents
|
389
|
|
286
|
|
(1,025
|
)
|
|||||
|
Change in cash and cash equivalents within current assets of discontinued operations
|
—
|
|
—
|
|
810
|
|
|||||
|
Cash and cash equivalents at beginning of year
|
2,289
|
|
2,003
|
|
2,218
|
|
|||||
|
Cash and cash equivalents at end of year
|
$
|
2,678
|
|
$
|
2,289
|
|
$
|
2,003
|
|
||
|
Supplemental cash flow information:
|
|||||||||||
|
Income tax payments, net
|
$
|
63
|
|
$
|
67
|
|
$
|
129
|
|
||
|
Interest payments
|
$
|
82
|
|
$
|
73
|
|
$
|
71
|
|
||
The accompanying notes are an integral part of these consolidated financial statements.
55
AGILENT TECHNOLOGIES, INC.
CONSOLIDATED STATEMENT OF EQUITY
|
|
Common Stock
|
Treasury Stock
|
|
Accumulated
Other
Comprehensive
Income/(Loss)
|
|
|
|
||||||||||||||||||||||||||||||
|
|
Number
of
Shares
|
Par
Value
|
Additional
Paid-in
Capital
|
Number
of
Shares
|
Treasury
Stock at
Cost
|
Retained
Earnings
(Accumulated Deficit)
|
Total Stockholders' Equity
|
Non-
Controlling
Interest
|
Total
Equity
|
||||||||||||||||||||||||||||
|
|
(in millions, except number of shares in thousands)
|
||||||||||||||||||||||||||||||||||||
|
Balance as of October 31, 2014
|
607,890
|
|
$
|
6
|
|
$
|
8,967
|
|
(272,924
|
)
|
$
|
(9,807
|
)
|
$
|
6,469
|
|
$
|
(334
|
)
|
$
|
5,301
|
|
$
|
3
|
|
$
|
5,304
|
|
|||||||||
|
Components of comprehensive income, net of tax:
|
|
|
|
|
|
|
|
|
|
|
|||||||||||||||||||||||||||
|
Net income
|
—
|
|
—
|
|
—
|
|
—
|
|
—
|
|
401
|
|
—
|
|
401
|
|
—
|
|
401
|
|
|||||||||||||||||
|
Other comprehensive loss
|
—
|
|
—
|
|
—
|
|
—
|
|
—
|
|
—
|
|
(389
|
)
|
(389
|
)
|
—
|
|
(389
|
)
|
|||||||||||||||||
|
Total comprehensive income
|
|
|
|
|
|
|
|
|
|
|
|
|
|
|
12
|
|
|
12
|
|
||||||||||||||||||
|
Cash dividends declared ($0.40 per common share)
|
—
|
|
—
|
|
—
|
|
—
|
|
—
|
|
(133
|
)
|
—
|
|
(133
|
)
|
—
|
|
(133
|
)
|
|||||||||||||||||
|
Distribution of Keysight
|
—
|
|
—
|
|
(28
|
)
|
—
|
|
—
|
|
(1,156
|
)
|
332
|
|
(852
|
)
|
—
|
|
(852
|
)
|
|||||||||||||||||
|
Share-based awards issued
|
2,964
|
|
—
|
|
44
|
|
—
|
|
—
|
|
—
|
|
—
|
|
44
|
|
—
|
|
44
|
|
|||||||||||||||||
|
Tax benefits from share-based awards issued
|
—
|
|
—
|
|
8
|
|
—
|
|
—
|
|
—
|
|
—
|
|
8
|
|
—
|
|
8
|
|
|||||||||||||||||
|
Repurchase of common stock
|
—
|
|
—
|
|
—
|
|
(6,471
|
)
|
(267
|
)
|
—
|
|
—
|
|
(267
|
)
|
—
|
|
(267
|
)
|
|||||||||||||||||
|
Share-based compensation
|
—
|
|
—
|
|
54
|
|
—
|
|
—
|
|
—
|
|
—
|
|
54
|
|
—
|
|
54
|
|
|||||||||||||||||
|
Balance as of October 31, 2015
|
610,854
|
|
$
|
6
|
|
$
|
9,045
|
|
(279,395
|
)
|
$
|
(10,074
|
)
|
$
|
5,581
|
|
$
|
(391
|
)
|
$
|
4,167
|
|
$
|
3
|
|
$
|
4,170
|
|
|||||||||
|
Adjustment due to adoption of ASU 2016-09
|
—
|
|
—
|
|
—
|
|
—
|
|
—
|
|
196
|
|
—
|
|
196
|
|
—
|
|
196
|
|
|||||||||||||||||
|
Components of comprehensive income, net of tax:
|
|
|
|
|
|
|
|
|
|
|
|||||||||||||||||||||||||||
|
Net income
|
—
|
|
—
|
|
—
|
|
—
|
|
—
|
|
462
|
|
—
|
|
462
|
|
—
|
|
462
|
|
|||||||||||||||||
|
Other comprehensive loss
|
—
|
|
—
|
|
—
|
|
—
|
|
—
|
|
—
|
|
(112
|
)
|
(112
|
)
|
—
|
|
(112
|
)
|
|||||||||||||||||
|
Total comprehensive income
|
|
|
|
|
|
|
|
|
|
|
|
|
|
|
350
|
|
350
|
|
|||||||||||||||||||
|
Cash dividends declared ($0.46 per common share)
|
—
|
|
—
|
|
—
|
|
—
|
|
—
|
|
(150
|
)
|
—
|
|
(150
|
)
|
—
|
|
(150
|
)
|
|||||||||||||||||
|
Share-based awards issued
|
2,682
|
|
—
|
|
56
|
|
—
|
|
—
|
|
—
|
|
—
|
|
56
|
|
—
|
|
56
|
|
|||||||||||||||||
|
Repurchase of common stock
|
—
|
|
—
|
|
—
|
|
(10,680
|
)
|
(434
|
)
|
—
|
|
—
|
|
(434
|
)
|
—
|
|
(434
|
)
|
|||||||||||||||||
|
Share-based compensation
|
—
|
|
—
|
|
58
|
|
—
|
|
—
|
|
—
|
|
—
|
|
58
|
|
—
|
|
58
|
|
|||||||||||||||||
|
Balance as of October 31, 2016
|
613,536
|
|
$
|
6
|
|
$
|
9,159
|
|
(290,075
|
)
|
$
|
(10,508
|
)
|
$
|
6,089
|
|
$
|
(503
|
)
|
$
|
4,243
|
|
$
|
3
|
|
$
|
4,246
|
|
|||||||||
|
Components of comprehensive income, net of tax:
|
|||||||||||||||||||||||||||||||||||||
|
Net income
|
—
|
|
—
|
|
—
|
|
—
|
|
—
|
|
684
|
|
—
|
|
684
|
|
—
|
|
684
|
|
|||||||||||||||||
|
Other comprehensive income
|
—
|
|
—
|
|
—
|
|
—
|
|
—
|
|
—
|
|
157
|
|
157
|
|
—
|
|
157
|
|
|||||||||||||||||
|
Total comprehensive income
|
|
|
|
|
|
|
|
|
|
|
|
|
|
|
841
|
|
841
|
|
|||||||||||||||||||
|
Non-controlling interest
|
1
|
|
1
|
|
|||||||||||||||||||||||||||||||||
|
Cash dividends declared ($0.528 per common share)
|
—
|
|
—
|
|
—
|
|
—
|
|
—
|
|
(170
|
)
|
—
|
|
(170
|
)
|
—
|
|
(170
|
)
|
|||||||||||||||||
|
Share-based awards issued
|
2,621
|
|
—
|
|
51
|
|
—
|
|
—
|
|
—
|
|
—
|
|
51
|
|
—
|
|
51
|
|
|||||||||||||||||
|
Repurchase of common stock
|
—
|
|
—
|
|
—
|
|
(4,107
|
)
|
(194
|
)
|
—
|
|
—
|
|
(194
|
)
|
—
|
|
(194
|
)
|
|||||||||||||||||
|
Retirement of treasury stock
|
(294,182
|
)
|
(3
|
)
|
(3,970
|
)
|
294,182
|
|
10,702
|
|
(6,729
|
)
|
—
|
|
—
|
|
—
|
|
—
|
|
|||||||||||||||||
|
Share-based compensation
|
—
|
|
—
|
|
60
|
|
—
|
|
—
|
|
—
|
|
—
|
|
60
|
|
—
|
|
60
|
|
|||||||||||||||||
|
Balance as of October 31, 2017
|
321,975
|
|
$
|
3
|
|
$
|
5,300
|
|
—
|
|
$
|
—
|
|
$
|
(126
|
)
|
$
|
(346
|
)
|
$
|
4,831
|
|
$
|
4
|
|
$
|
4,835
|
|
|||||||||
The accompanying notes are an integral part of these consolidated financial statements.
56
AGILENT TECHNOLOGIES, INC.
NOTES TO CONSOLIDATED FINANCIAL STATEMENTS
1. OVERVIEW AND SUMMARY OF SIGNIFICANT ACCOUNTING POLICIES
Overview.
Agilent Technologies Inc. ("we", "Agilent" or the "company"), incorporated in Delaware in May 1999, is a global leader in life sciences, diagnostics and applied chemical markets, providing application focused solutions that includes instruments, software, services and consumables for the entire laboratory workflow.
Keysight Separation.
On November 1, 2014, we completed the distribution of 100% of the outstanding common shares of Keysight Technologies, Inc. ("Keysight") to Agilent stockholders who received one share of Keysight common stock for every two shares of Agilent held as of the close of business on the record date, October 22, 2014. For fiscal year 2015, discontinued operations includes costs incurred to effect the separation of Keysight and certain costs associated with transition services provided by Agilent to Keysight. No income or expense has been recorded for the Keysight business after separation from Agilent on November 1, 2014.
Exit of Nuclear Magnetic Resonance Business.
Beginning the fourth quarter of fiscal year 2014, we ceased the manufacture and sale of our nuclear magnetic resonance (“NMR”) product line within our life sciences and applied markets segment. In connection with the exit from this business, we recorded approximately
$6 million
in restructuring and other related costs in 2015. The exit of the NMR business was completed in fiscal year 2016.
Basis of Presentation.
The accompanying financial data has been prepared by us pursuant to the rules and regulations of the U.S. Securities and Exchange Commission ("SEC") and is in conformity with U.S. generally accepted accounting principles ("GAAP"). Our fiscal year end is October 31. Unless otherwise stated, all years and dates refer to our fiscal year.
Principles of Consolidation.
The consolidated financial statements include the accounts of the company and our wholly- and majority-owned subsidiaries. All significant intercompany accounts and transactions have been eliminated.
Reclassification.
Certain reclassifications to our prior period consolidated balance sheet have been made to conform with our current reporting. The October 31, 2016 consolidated balance sheet reflects the reclassification of
$8 million
of intangible assets related to purchased technology and licenses from third parties that were not associated with a business combination from other assets to other intangible assets.
Use of Estimates.
The preparation of financial statements in accordance with U.S. GAAP requires management to make estimates and assumptions that affect the amounts reported in our consolidated financial statements and accompanying notes. Management bases its estimates on historical experience and various other assumptions believed to be reasonable. Although these estimates are based on management's best knowledge of current events and actions that may impact the company in the future, actual results may be different from the estimates. Our critical accounting policies are those that affect our financial statements materially and involve difficult, subjective or complex judgments by management. Those policies are revenue recognition, valuation of goodwill and purchased intangible assets, inventory valuation, share-based compensation, retirement and post-retirement plan assumptions and accounting for income taxes.
Retirement of Treasury Shares.
Upon the formal retirement of treasury shares, we deduct the par value of the retired treasury shares from common stock and allocate the excess of cost over par as a deduction to additional paid-in capital, based on the pro-rata portion of additional paid-in-capital, and the remaining excess as a deduction to retained earnings. All retired treasury shares revert to the status of authorized but unissued shares.
Revenue Recognition.
We enter into agreements to sell products (hardware and/or software), services and other arrangements (multiple element arrangements) that include combinations of products and services.
We recognize revenue, net of trade discounts and allowances, provided that (1) persuasive evidence of an arrangement exists, (2) delivery has occurred, (3) the price is fixed or determinable and (4) collectability is reasonably assured. Delivery is considered to have occurred when title and risk of loss have transferred to the customer for products, or when the service has been provided. We consider the price to be fixed or determinable when the price is not subject to refund or adjustments. At the time of the transaction, we evaluate the creditworthiness of our customers to determine the appropriate timing of revenue recognition. Provisions for discounts, warranties, returns, extended payment terms, and other adjustments are provided for in the period the related sales are recorded.
57
Product Revenue.
Product revenue includes revenue generated from the sales of our analytical instrumentation, software and consumables. Our product revenue is generated predominantly from the sales of various types of analytical instrumentation. Product revenue, including sales to resellers and distributors, is reduced for estimated returns when appropriate. For sales or arrangements that include customer-specified acceptance criteria, including those where acceptance is required upon achievement of performance milestones, revenue is recognized after the acceptance criteria have been met. For products that include installation, if the installation meets the criteria to be considered a separate element, product revenue is recognized upon delivery, and recognition of installation revenue is delayed until the installation is complete. Otherwise, neither the product nor the installation revenue is recognized until the installation is complete.
Where software is licensed separately, revenue is recognized when the software is delivered and has been transferred to the customer or, in the case of electronic delivery of software, when the customer is given access to the licensed software programs.
We also evaluate whether collection of the receivable is probable, the fee is fixed or determinable and whether any other undelivered elements of the arrangement exist on which a portion of the total fee would be allocated based on vendor-specific objective evidence.
Service Revenue.
Revenue from services includes extended warranty, customer and software support including, Software as a Service (SaaS), consulting including companion diagnostics and training and education. Service revenue is deferred and recognized over the contractual period or as services are rendered and accepted by the customer. For example, customer support contracts are recognized ratably over the contractual period, while training revenue is recognized as the training is provided to the customer. In addition, the four revenue recognition criteria described above must be met before service revenue is recognized.
Revenue Recognition for Arrangements with Multiple Deliverables.
Our multiple-element arrangements are generally comprised of a combination of measurement instruments, installation or other start-up services, and/or software and/or support or services. Hardware and software elements are typically delivered at the same time and revenue is recognized upon delivery once title and risk of loss pass to the customer. Delivery of installation, start-up services and other services varies based on the complexity of the equipment, staffing levels in a geographic location and customer preferences, and can range from a few days to a few months. Service revenue is deferred and recognized over the contractual period or as services are rendered and accepted by the customer. Revenue from the sale of software products that are not required to deliver the tangible product's essential functionality are accounted for under software revenue recognition rules which require vendor specific objective evidence (VSOE) of fair value to allocate revenue in a multiple element arrangement. Our arrangements generally do not include any provisions for cancellation, termination, or refunds that would significantly impact recognized revenue.
We have evaluated the deliverables in our multiple-element arrangements and concluded that they are separate units of accounting if the delivered item or items have value to the customer on a standalone basis and for an arrangement that includes a general right of return relative to the delivered item(s), delivery or performance of the undelivered item(s) is considered probable and substantially in our control. We allocate revenue to each element in our multiple-element arrangements based upon their relative selling prices. We determine the selling price for each deliverable based on a selling price hierarchy. The selling price for a deliverable is based on VSOE if available, third-party evidence (TPE) if VSOE is not available, or estimated selling price (ESP) if neither VSOE nor TPE is available. Revenue allocated to each element is then recognized when the basic revenue recognition criteria for that element have been met.
We use VSOE of selling price in the selling price allocation in all instances where it exists. VSOE of selling price for products and services is determined when a substantial majority of the selling prices fall within a reasonable range when sold separately. TPE of selling price can be established by evaluating largely interchangeable competitor products or services in standalone sales to similarly situated customers. As our products contain a significant element of proprietary technology and the solution offered differs substantially from that of competitors, it is difficult to obtain the reliable standalone competitive pricing necessary to establish TPE. ESP represents the best estimate of the price at which we would transact a sale if the product or service were sold on a standalone basis. We determine ESP for a product or service by using historical selling prices which reflect multiple factors including, but not limited to customer type, geography, market conditions, competitive landscape, gross margin objectives and pricing practices. The determination of ESP is made through consultation with and approval by management. We may modify or develop new pricing practices and strategies in the future. As these pricing strategies evolve changes may occur in ESP. The aforementioned factors may result in a different allocation of revenue to the deliverables in multiple element arrangements, which may change the pattern and timing of revenue recognition for these elements but will not change the total revenue recognized for the arrangement.
58
For sales arrangements that include equipment lease along with other products or services, revenue is allocated to the different elements based on the Revenue Recognition for Multiple Element Arrangements. Each of these contracts is evaluated as a lease arrangement, either as an operating lease or a capital (sales-type) lease using lease classification guidance.
Deferred Revenue.
Deferred revenue represents the amount that is allocated to undelivered elements in multiple element arrangements. We limit the revenue recognized to the amount that is not contingent on the future delivery of products or services or meeting other specified performance conditions.
Accounts Receivable, net.
Trade accounts receivable are recorded at the invoiced amount and do not bear interest. Such accounts receivable has been reduced by an allowance for doubtful accounts, which is our best estimate of the amount of probable credit losses in our existing accounts receivable. We determine the allowance based on customer specific experience and the aging of such receivables, among other factors. The allowance for doubtful accounts as of
October 31, 2017
and
2016
was not material. We do not have any off-balance-sheet credit exposure related to our customers. Accounts receivable are also recorded net of product returns.
Shipping and Handling Costs.
Our shipping and handling costs charged to customers are included in net revenue, and the associated expense is recorded in cost of products for all periods presented.
Inventory.
Inventory is valued at standard cost, which approximates actual cost computed on a first-in, first-out basis, not in excess of market value. We assess the valuation of our inventory on a periodic basis and make adjustments to the value for estimated excess and obsolete inventory based on estimates about future demand. The excess balance determined by this analysis becomes the basis for our excess inventory charge. Our excess inventory review process includes analysis of sales forecasts, managing product rollovers and working with manufacturing to maximize recovery of excess inventory.
Goodwill and Purchased Intangible Assets.
Under the authoritative guidance we have the option to perform a qualitative assessment to determine whether further impairment testing is necessary. The accounting standard gives an entity the option to first assess qualitative factors to determine whether performing the two-step test is necessary. If an entity believes, as a result of its qualitative assessment, that it is more-likely-than-not (i.e. greater than 50% chance) that the fair value of a reporting unit is less than its carrying amount, the quantitative impairment test will be required. Otherwise, no further testing will be required.
The guidance includes examples of events and circumstances that might indicate that a reporting unit's fair value is less than its carrying amount. These include macro-economic conditions such as deterioration in the entity's operating environment or industry or market considerations; entity-specific events such as increasing costs, declining financial performance, or loss of key personnel; or other events such as an expectation that a reporting unit will be sold or a sustained decrease in the stock price on either an absolute basis or relative to peers.
If it is determined, as a result of the qualitative assessment, that it is more-likely-than-not that the fair value of a reporting unit is less than its carrying amount, the provisions of authoritative guidance require that we perform a two-step impairment test on goodwill. In the first step, we compare the fair value of each reporting unit to its carrying value. The second step (if necessary) measures the amount of impairment by applying fair-value-based tests to the individual assets and liabilities within each reporting unit. As defined in the authoritative guidance, a reporting unit is an operating segment, or one level below an operating segment. We aggregate components of an operating segment that have similar economic characteristics into our reporting units.
In fiscal year
2017
, we assessed goodwill impairment for our three reporting units which consisted of three segments: life sciences and applied markets, diagnostics and genomics and Agilent CrossLab. We performed a qualitative test for goodwill impairment of the three reporting units, as of September 30,
2017
. Based on the results of our qualitative testing, we believe that it is more-likely-than-not- that the fair value of these reporting units are greater than their respective carrying values. Each quarter we review the events and circumstances to determine if goodwill impairment is indicated. There was
no
impairment of goodwill during the years ended
October 31, 2017
,
2016
and
2015
.
Purchased intangible assets consist primarily of acquired developed technologies, proprietary know-how, trademarks, and customer relationships and are amortized using the best estimate of the asset's useful life that reflect the pattern in which the economic benefits are consumed or used up or a straight-line method ranging from
6 months
to
15
years. In-process research and development ("IPR&D") is initially capitalized at fair value as an intangible asset with an indefinite life and assessed for impairment thereafter. When the IPR&D project is complete, it is reclassified as an amortizable purchased intangible asset and is amortized over its estimated useful life. If an IPR&D project is abandoned, Agilent will record a charge for the value of the related intangible asset to Agilent's consolidated statement of operations in the period it is abandoned.
59
Agilent's indefinite-lived intangible assets are IPR&D intangible assets. The accounting guidance allows a qualitative approach for testing indefinite-lived intangible assets for impairment, similar to the issued impairment testing guidance for goodwill and allows the option to first assess qualitative factors (events and circumstances) that could have affected the significant inputs used in determining the fair value of the indefinite-lived intangible asset to determine whether it is more-likely-than-not (i.e. greater than 50% chance) that the indefinite-lived intangible asset is impaired. An organization may choose to bypass the qualitative assessment for any indefinite-lived intangible asset in any period and proceed directly to calculating its fair value. We performed a qualitative test for impairment of indefinite-lived intangible assets as of September 30,
2017
. Based on the results of our qualitative testing, we believe that it is more-likely-than-not that the fair value of these indefinite-lived intangible assets is greater than their respective carrying values. Each quarter we review the events and circumstances to determine if impairment of indefinite-lived intangible asset is indicated. During the year ended
October 31, 2017
, there were
no
impairments of indefinite-lived intangible assets. Based on triggering events in the years ended
October 31, 2016
and
2015
, we recorded an impairment of
$4 million
and
$3 million
, respectively due to the cancellation of certain IPR&D projects.
Share-Based Compensation.
For the years ended
2017
,
2016
and
2015
, we accounted for share-based awards made to our employees and directors including employee stock option awards, restricted stock units, employee stock purchases made under our Employee Stock Purchase Plan ("ESPP") and performance share awards under Agilent Technologies, Inc. Long-Term Performance Program ("LTPP") using the estimated grant date fair value method of accounting. Under the fair value method, we recorded compensation expense, in continuing operations, for all share-based awards of
$61 million
in
2017
,
$60 million
in
2016
and
$55 million
in
2015
. See Note 4, "Share-based Compensation" for additional information.
Retirement and Post-Retirement Plans.
Substantially all of our employees are covered under various defined benefit and/or defined contribution retirement plans. Additionally, we sponsor post-retirement health care benefits for our eligible U.S. employees. Assumptions used to determine the benefit obligations and the expense for these plans are derived annually. See Note 13, “Retirement plans and post-retirement pension plans” for additional information.
Taxes on Income.
Income tax expense or benefit is based on income or loss before taxes. Deferred tax assets and liabilities are recognized principally for the expected tax consequences of temporary differences between the tax bases of assets and liabilities and their reported amounts. See Note 5, "Income Taxes" for more information.
Warranty.
Our standard warranty terms typically extend for one year from the date of delivery. We accrue for standard warranty costs based on historical trends in warranty charges as a percentage of net product revenue. The accrual is reviewed regularly and periodically adjusted to reflect changes in warranty cost estimates. Estimated warranty charges are recorded within cost of products at the time products are sold. See Note 14, "Guarantees".
Advertising.
Advertising costs are generally expensed as incurred and amounted to
$38 million
in
2017
,
$30 million
in
2016
and
$25 million
in
2015
.
Research and Development.
Costs related to research, design and development of our products are charged to research and development expense as they are incurred.
Sales Taxes.
Sales taxes collected from customers and remitted to governmental authorities are not included in our revenue.
Net Income Per Share.
Basic net income per share is computed by dividing net income - the numerator - by the weighted average number of common shares outstanding - the denominator - during the period excluding the dilutive effect of stock options and other employee stock plans. Diluted net income per share gives effect to all potential common shares outstanding during the period unless the effect is anti-dilutive. The dilutive effect of share-based awards is reflected in diluted net income per share by application of the treasury stock method, which includes consideration of unamortized share-based compensation expense and the dilutive effect of in-the-money options and non-vested restricted stock units. Under the treasury stock method, the amount the employee must pay for exercising stock options and unamortized share-based compensation expense are assumed proceeds to be used to repurchase hypothetical shares. See Note 6, "Net Income Per Share".
Cash, Cash Equivalents and Short Term Investments.
We classify investments as cash equivalents if their original or remaining maturity is three months or less at the date of purchase. Cash equivalents are stated at cost, which approximates fair value.
As of
October 31, 2017
, approximately
$2,600 million
of our cash and cash equivalents is held outside of the U.S. by our foreign subsidiaries. Under current tax laws, the cash could be repatriated to the U.S. but most of it would be subject to U.S. federal and state income taxes, less applicable tax credits. Our cash and cash equivalents mainly consist of short term deposits held at
60
major global financial institutions, institutional money market funds, and similar short duration instruments with original maturities of 90 days or less. We continuously monitor the creditworthiness of the financial institutions and institutional money market funds in which we invest our funds.
We classify investments as short-term investments if their original maturities are greater than three months and their remaining maturities are one year or less. Currently, we have no short-term investments.
Variable Interest Entities.
We make a determination upon entering into an arrangement whether an entity in which we have made an investment is considered a Variable Interest Entity (“VIE”). The company evaluates its investments in privately held companies on an ongoing basis. We have determined that as of
October 31, 2017
and 2016, there were no VIE’s required to be consolidated in the company’s consolidated financial statements because we do not have a controlling financial interest in any of the VIE’s that we have invested in nor are we the primary beneficiary. We account for these investments under either the equity or cost method, depending on the circumstances. We periodically reassess whether we are the primary beneficiary of a VIE. The reassessment process considers whether we have acquired the power to direct the most significant activities of the VIE through changes in governing documents or other circumstances. We also reconsider whether entities previously determined not to be VIEs have become VIEs, based on changes in facts and circumstances including changes in contractual arrangements and capital structure. During 2016, we wrote down an equity method investment to its fair value of
zero
, resulting in an impairment charge of
$18 million
. In addition, we recorded an impairment of
$7 million
of uncollectible loans related to this equity method investment.
During the year ended October 31, 2016, Agilent made a preferred stock investment in Lasergen for
$80 million
. Agilent’s initial ownership stake was
48 percent
and we have also joined the board of Lasergen and signed a collaboration agreement. We have the option to acquire all of the remaining shares of Lasergen until March 2, 2018, for additional consideration of
$105 million
. Lasergen is a VIE, however, we do not consolidate the entity in our financial statements because we do not have the power to direct the activities of the VIE that most significantly impact the VIE's economic performance. Because of the nature of the preferred stock of Lasergen that we own, we account for this investment under the cost method. As of
October 31, 2017
and 2016, the carrying value of our investments in VIE’s was
$80 million
with a maximum exposure of
$80 million
. The maximum exposure is equal to the carrying value because we do not have future funding commitments. The investment is included on the long term investments line of the consolidated balance sheet.
Fair Value of Financial Instruments.
The carrying values of certain of our financial instruments including cash and cash equivalents, accounts receivable, accounts payable, accrued compensation and other accrued liabilities approximate fair value because of their short maturities. The fair value of long-term equity investments is determined using quoted market prices for those securities when available. For those long-term equity investments accounted for under the cost or equity method, their carrying value approximates their estimated fair value. Equity method investments are reported at the amount of the company’s initial investment and adjusted each period for the company’s share of the investee’s income or loss and dividend paid. There are no equity method investments as of
October 31, 2017
. The fair value of our senior notes, calculated from quoted prices which are primarily Level 1 inputs under the accounting guidance fair value hierarchy, exceeds the carrying value by approximately
$58 million
and
$104 million
as of
October 31, 2017
and
2016
, respectively. The change in the excess of fair value over carrying value in the year ended
October 31, 2017
is primarily due to fluctuations in market interest rates. The carrying value as of October 31, 2016 reflects the new accounting guidance related to the presentation of debt issuance costs which we adopted on November 1, 2016. The fair value of foreign currency contracts used for hedging purposes is estimated internally by using inputs tied to active markets. These inputs, for example, interest rate yield curves, foreign exchange rates, and forward and spot prices for currencies are observable in the market or can be corroborated by observable market data for substantially the full term of the assets or liabilities. See also Note 11, "Fair Value Measurements" for additional information on the fair value of financial instruments.
Investments.
Cost method investments consisting of non-marketable equity securities and are accounted for at historical cost. Trading securities are reported at fair value, with gains or losses resulting from changes in fair value recognized currently in earnings. Equity method investments are reported at the amount of the company’s initial investment and adjusted each period for the company’s share of the investee’s income or loss and dividend paid. The company assesses investments for impairment whenever events or changes in circumstances indicate that the carrying value of an investment may not be recoverable.
Concentration of Credit Risk.
Financial instruments that potentially subject Agilent to significant concentration of credit risk include money market fund investments, time deposits and demand deposit balances. These investments are categorized as cash and cash equivalents. In addition, Agilent has credit risk from derivative financial instruments used in hedging activities and accounts receivable. We invest in a variety of financial instruments and limit the amount of credit exposure with any one financial institution. We have a comprehensive credit policy in place and credit exposure is monitored on an ongoing basis.
61
Credit risk with respect to our accounts receivable is diversified due to the large number of entities comprising our customer base and their dispersion across many different industries and geographies. Credit evaluations are performed on customers requiring credit over a certain amount and we sell the majority of our products through our direct sales force. Credit risk is mitigated through collateral such as letter of credit, bank guarantees or payment terms like cash in advance. No single customer accounted for more than 10 percent of combined accounts receivable as of
October 31, 2017
, or
2016
.
Derivative Instruments.
Agilent is exposed to global foreign currency exchange rate and interest rate risks in the normal course of business. We enter into foreign exchange hedging contracts, primarily forward contracts and purchased options and, in the past, interest rate swaps to manage financial exposures resulting from changes in foreign currency exchange rates and interest rates. In the vast majority of cases, these contracts are designated at inception as hedges of the related foreign currency or interest exposures. Foreign currency exposures include committed and anticipated revenue and expense transactions and assets and liabilities that are denominated in currencies other than the functional currency of the subsidiary. Interest rate exposures are associated with the company's fixed-rate debt. For option contracts, we exclude time value from the measurement of effectiveness. To qualify for hedge accounting, contracts must reduce the foreign currency exchange rate and interest rate risk otherwise inherent in the amount and duration of the hedged exposures and comply with established risk management policies; foreign exchange hedging contracts generally mature within
twelve
months and interest rate swaps, if any, mature at the same time as the maturity of the debt. In order to manage foreign currency exposures in a few limited jurisdictions we may enter into foreign exchange contracts that do not qualify for hedge accounting. In such circumstances, the local foreign currency exposure is offset by contracts owned by the parent company. We do not use derivative financial instruments for speculative trading purposes.
All derivatives are recognized on the balance sheet at their fair values. For derivative instruments that are designated and qualify as a fair value hedge, changes in value of the derivative are recognized in the consolidated statement of operations in the current period, along with the offsetting gain or loss on the hedged item attributable to the hedged risk. For derivative instruments that are designated and qualify as a cash flow hedges, changes in the value of the effective portion of the derivative instrument is recognized in comprehensive income (loss), a component of stockholders' equity. Amounts associated with cash flow hedges are reclassified and recognized in income when either the forecasted transaction occurs or it becomes probable the forecasted transaction will not occur. Derivatives not designated as hedging instruments are recorded on the balance sheet at their fair value and changes in the fair values are recorded in the income statement in the current period. Derivative instruments are subject to master netting arrangements and are disclosed gross in the balance sheet. Changes in the fair value of the ineffective portion of derivative instruments are recognized in earnings in the current period. Ineffectiveness in
2017
,
2016
and
2015
was not material. Cash flows from derivative instruments are classified in the statement of cash flows in the same category as the cash flows from the hedged or economically hedged item, primarily in operating activities.
Property, Plant and Equipment.
Property, plant and equipment are stated at cost less accumulated depreciation. Additions, improvements and major renewals are capitalized; maintenance, repairs and minor renewals are expensed as incurred. When assets are retired or disposed of, the assets and related accumulated depreciation and amortization are removed from our general ledger, and the resulting gain or loss is reflected in the consolidated statement of operations. Buildings and improvements are depreciated over the lesser of their useful lives or the remaining term of the lease and machinery and equipment over
three
to
ten
years. We use the straight-line method to depreciate assets.
Leases.
We lease buildings, machinery and equipment under operating leases for original terms ranging generally from
one
year to
twenty
years. Certain leases contain renewal options for periods up to
six
years. In addition, we lease equipment to customers in connection with our diagnostics business using both capital and operating leases. As of
October 31, 2017
and
2016
our diagnostics and genomics segment has approximately
$27 million
and
$15 million
, respectively, of lease receivables related to capital leases and approximately
$22 million
and
$23 million
, respectively, of net assets for operating leases. We depreciate the assets related to the operating leases over their estimated useful lives, typically five years.
Capitalized Software.
We capitalize certain internal and external costs incurred to acquire or create internal use software. Capitalized software is included in property, plant and equipment and is depreciated over
three
to
five
years once development is complete.
Impairment of Long-Lived Assets.
We continually monitor events and changes in circumstances that could indicate carrying amounts of long-lived assets, including intangible assets, may not be recoverable. When such events or changes in circumstances occur, we assess the recoverability of long-lived assets by determining whether the carrying value of such assets will be recovered through undiscounted expected future cash flows. If the total of the undiscounted future cash flows is less than the carrying amount of those assets, we recognize an impairment loss based on the excess of the carrying amount over the fair value of the assets.
62
Employee Compensation and Benefits.
Amounts owed to employees, such as accrued salary, bonuses and vacation benefits are accounted for within employee compensation and benefits. The total amount of accrued vacation benefit was
$101 million
and
$92 million
as of
October 31, 2017
, and
2016
, respectively.
Foreign Currency Translation.
We translate and remeasure balance sheet and income statement items into U.S. dollars. For those subsidiaries that operate in a local currency functional environment, all assets and liabilities are translated into U.S. dollars using current exchange rates at the balance sheet date; revenue and expenses are translated using monthly exchange rates which approximate to average exchange rates in effect during each period. Resulting translation adjustments are reported as a separate component of accumulated other comprehensive income (loss) in stockholders' equity.
For those subsidiaries that operate in a U.S. dollar functional environment, foreign currency assets and liabilities are remeasured into U.S. dollars at current exchange rates except for non-monetary assets and capital accounts which are remeasured at historical exchange rates. Revenue and expenses are generally remeasured at monthly exchange rates which approximate average exchange rates in effect during each period. Gains or losses from foreign currency remeasurement are included in consolidated net income. Net gains or losses resulting from foreign currency transactions, including hedging gains and losses, are reported in other income (expense), net and was
$2 million
loss for fiscal year
2017
,
$5 million
loss for
2016
and
$9 million
loss for
2015
, respectively.
2. NEW ACCOUNTING PRONOUNCEMENTS
Recently Adopted Accounting Pronouncements
In April 2015, the Financial Accounting Standards Board ("FASB") issued amendments to simplify the presentation of debt issuance costs. The amendments require that debt issuance costs related to a recognized debt liability to be presented in the balance sheet as a direct deduction from the carrying amount of that debt liability, consistent with debt discounts. The recognition and measurement guidance for debt issuance costs remain unchanged. The amendments were effective for us beginning November 1, 2016. The impact of adoption to our consolidated balance sheet was a decrease of
$8 million
in other assets and long-term debt. The October 31, 2016 consolidated balance sheet has been revised to reflect the new disclosure requirement.
New Accounting Pronouncements Not Yet Adopted
In May 2014, the FASB issued new revenue recognition guidance, Accounting Standard Codification Topic 606, Revenue from contract with customers, which provides a single comprehensive model for entities to use in accounting for revenue arising from contracts with customers and will supersede most current revenue recognition guidance. The objective of the new revenue standard is to significantly enhance comparability and clarify principles of revenue recognition practices across entities, industries, jurisdictions and capital markets. The guidance is effective for us at the beginning in November 1, 2018. We expect to adopt this standard on November 1, 2018 through application of the modified retrospective method reflecting the cumulative effect of initially applying the new guidance to revenue recognition in the first quarter of fiscal 2019. Under the new guidance, there are specific criteria to determine if a performance obligation should be recognized over time or at a point in time. We expect that in some cases the revenue recognition timing under the new guidance will change from current practice. We are currently evaluating the impact the adoption of this standard will have on our consolidated financial statements and disclosures.
In September 2015, the FASB issued guidance intended to simplify accounting for adjustments to provisional amounts recorded in connection with business combinations. Beginning in November 1, 2017 and in the interim periods from November 1, 2018, adjustments will be recorded in the period that they are determined rather than applied retrospectively via revision to the period of acquisition and each period thereafter. We currently do not expect this guidance to have a material impact on our consolidated financial statements and disclosures.
In January 2016, the FASB issued amendments to address certain aspects of recognition, measurement, presentation, and disclosure of financial instruments. The standard requires entities to measure equity investments that do not result in consolidation and are not accounted for under the equity method at fair value and recognize any changes in fair value in net income. The provisions under this amendment are effective for us beginning November 1, 2018, and for interim periods within that year. Early adoption is not permitted. We currently do not expect this guidance to have a material impact on our consolidated financial statements and disclosures.
In February 2016, the FASB issued guidance which amends the existing accounting standards for leases. Consistent with existing guidance, the recognition, measurement, and presentation of expenses and cash flows arising from a lease by a lessee primarily will depend on its classification. Under the new guidance, a lessee will be required to recognize right-of-use assets and
63
lease liabilities on the balance sheet. The new guidance is effective for us beginning November 1, 2019, and for interim periods within that year. Early adoption is permitted and we will be required to adopt using a modified retrospective approach. We are evaluating the timing of adoption and the impact of this guidance on our consolidated financial statements and disclosures.
In March 2016, the FASB issued amendments to simplify the transition to the equity method of accounting. The amendments require that the equity method investor add the cost of acquiring the additional interest in the investee to the current basis of the investor’s previously held interest and adopt the equity method of accounting as of the date the investment becomes qualified for equity method accounting. The amendments are effective for us beginning November 1, 2017, and for interim periods within that year. We currently do not expect material impact of this amendment on our consolidated financial statements and disclosures.
In August 2016, the FASB issued amendments to address eight specific cash flow issues with the objective of reducing the existing diversity in practice. The amendments are effective for us beginning November 1, 2018, and for interim periods within that year. Early adoption is permitted. If we decide to early adopt the amendments, we will be required to adopt all of the amendments in the same period. We do not expect to early adopt and we are evaluating the impact of the amendments on our consolidated statement of cash flows and disclosures.
In October 2016, the FASB issued amendments to improve the accounting for the income tax consequences of intra-entity transfers of assets other than inventory. The amendments are effective for us beginning November 1, 2018, and for interim periods within that year. Early adoption is permitted and should be applied on a modified retrospective basis through a cumulative-effect adjustment directly to retained earnings as of the beginning of the period of adoption. We are evaluating the timing of our adoption and the impact of the amendments on our consolidated financial statements and disclosures.
In November 2016, the FASB issued amendments to require amounts generally described as restricted cash and restricted cash equivalents be included with cash and cash equivalents when reconciling the beginning-of-period and end-of-period total amounts shown on the statement of cash flows. The amendments are effective for us beginning November 1, 2018, and for interim periods within that year. Early adoption is permitted. We do not expect to early adopt and we are evaluating the impact of the amendments on our consolidated statement of cash flows and disclosures.
In January 2017, the FASB issued guidance intended to clarify the definition of a business in connection with business combinations with the objective of adding guidance to assist entities with evaluating whether transactions should be accounted for as acquisitions (or disposals) of assets or businesses. This guidance is effective for us beginning November 1, 2018, and for interim periods within that year. Adjustments will be recorded in the period that they are determined rather than applied retrospectively via revision to the period of acquisition and each period thereafter. We do not expect to early adopt this guidance nor do we expect this guidance to have a material impact on our consolidated financial statements and disclosures.
In January 2017, the FASB issued an amendment to modify the concept of impairment from the condition that exists when the carrying amount of goodwill exceeds its implied fair value to the condition that exists when the carrying amount of a reporting unit exceeds its fair value. The amendment also simplifies the subsequent measurement of goodwill by eliminating Step 2 from the goodwill impairment test. The amendments are effective for us beginning November 1, 2020. Early adoption is permitted for interim or annual goodwill impairment tests performed on testing dates after January 1, 2017. We do not expect to early adopt nor do we expect this guidance to have a material impact on our consolidated financial statements and disclosures.
In March 2017, the FASB issued guidance on the presentation of the net periodic pension and postretirement benefit cost. This guidance also specifies that only the service cost component of net benefit cost is eligible for capitalization. The standard requires employers to report the service cost component in the same line item as other compensation costs and to report the other components of net periodic benefit costs (which include interest costs, expected return on plan assets, amortization of prior service cost or credits and actuarial gains and losses) separately and below operating income in the statement of operations. The amendments are effective for us beginning November 1, 2018, including interim periods within those annual periods. We are evaluating the impact of adopting this guidance to our consolidated financial statements.
In May 2017, the FASB issued an update to clarify when to account for a change to the terms or conditions of a share-based payment award as a modification. Under the new guidance, modification accounting is required only if the fair value, the vesting conditions, or the classification of the award (as equity or liability) changes as a result of the change in terms or conditions. The amendments are effective for us beginning November 1, 2018. We do not expect this guidance to have a material impact on our consolidated financial statements and disclosures.
In August 2017, the FASB issued amendments to hedge accounting intended to better align a company's risk management strategies and financial reporting for hedging relationships through changes to both the designation and measurement guidance
64
for qualifying hedging relationships and presentation of hedge results. The amendments expand and refine accounting for both nonfinancial and financial risk components and align the recognition and presentation of the effects of the hedging instrument and hedged item in the financial statements. The amendments are effective for us beginning November 1, 2019, including the interim periods within those annual periods. We are currently evaluating the timing of our adoption and the impact the adoption of this guidance will have on our consolidated financial statements and disclosures.
Other amendments to GAAP in the U.S. that have been issued by the FASB or other standards-setting bodies that do not require adoption until a future date are not expected to have a material impact on our consolidated financial statements upon adoption.
3. DISCONTINUED OPERATIONS
On September 19, 2013, Agilent announced its intention to separate its electronic measurement business, Keysight, which was previously a separate reportable segment, into a stand-alone publicly traded company. Keysight was incorporated in Delaware as a wholly-owned subsidiary of Agilent on December 6, 2013. On November 1, 2014, we completed the distribution of 100% of the outstanding common stock of Keysight to Agilent stockholders, who received one share of Keysight common stock for every two shares of Agilent common stock held as of the close of business on the record date, October 22, 2014. The separation agreement ensured that Keysight had approximately
$700 million
of total cash and cash equivalents immediately following distribution. For the year ended October 31, 2015, we transferred a total amount of cash and cash equivalents of
$734 million
to Keysight.
The following table summarizes results from discontinued operations of Keysight included in the consolidated statement of operations:
|
Year Ended October 31,
|
|||
|
2015
|
|||
|
(in millions)
|
|||
|
Net revenue
|
$
|
—
|
|
|
Costs and expenses
|
39
|
|
|
|
Operating loss
|
(39
|
)
|
|
|
Other income (expense), net
|
—
|
|
|
|
Loss from discontinued operations before tax
|
(39
|
)
|
|
|
Benefit for income taxes
|
(2
|
)
|
|
|
Net loss from discontinued operations
|
$
|
(37
|
)
|
For the year ended October 31, 2015, net income (loss) from discontinued operations includes transaction, information systems and other costs to effect the separation of
$39 million
. In the year ended October 31, 2015 only those costs incurred to effect the separation of Keysight have been included. No income or expense has been recorded for the Keysight business after separation from Agilent on November 1, 2014.
In addition,
$332 million
of accumulated other comprehensive loss, net of income taxes, primarily related to pension and other post-retirement benefits plans and currency translation was also transferred to Keysight together with
$28 million
of additional paid in capital related to share based compensation windfall tax benefits. The removal of Keysight net assets and equity related adjustments is presented as a reduction in Agilent's retained earnings and represents a non cash financing activity excluding cash transferred.
Under the terms of the Transition Services Agreement, we recorded income for all services provided to Keysight of approximately
$12 million
in fiscal year 2015. In addition, Agilent expects to receive lease income together with site service income from Keysight over the next 2-3 years of approximately
$12 million
per year. In the years ended October 31, 2017, 2016 and 2015 other income (expense), net includes
$12 million
,
$12 million
and
$25 million
of income related to the provision of services to, and lease income from Keysight.
65
4. SHARE-BASED COMPENSATION
Agilent accounts for share-based awards in accordance with the provisions of the accounting guidance which requires the measurement and recognition of compensation expense for all share-based payment awards made to our employees and directors including employee stock option awards, restricted stock units, employee stock purchases made under our ESPP and performance share awards granted to selected members of our senior management under the LTPP based on estimated fair values.
Description of Share-Based Plans
Employee Stock Purchase Plan.
Effective November 1, 2000, we adopted the ESPP. The ESPP allows eligible employees to contribute up to
ten percent
of their base compensation to purchase shares of our common stock at
85
percent of the closing market price at purchase date. Shares authorized for issuance in connection with the ESPP are subject to an automatic annual increase of the lesser of
one percent
of the outstanding shares of common stock of Agilent on November 1, or an amount determined by the Compensation Committee of our Board of Directors. Under the terms of the ESPP, in no event shall the number of shares issued under the ESPP exceed
75 million
shares.
Under our ESPP, employees purchased
618,270
shares for
$26 million
in
2017
,
696,178
shares for
$23 million
in
2016
and
346,472
shares for
$12 million
in
2015
. As of
October 31, 2017
, the number of shares of common stock authorized and available for issuance under our ESPP was
27,556,310
. This excludes the number of shares of common stock to be issued to participants in consideration of the aggregate participants contributions totaling
$15 million
as of
October 31, 2017
.
Incentive Compensation Plans.
On November 19, 2008 and March 11, 2009, the Compensation Committee of Board of Directors and the stockholders, respectively, approved the Agilent Technologies, Inc. 2009 Stock Plan (the "2009 Stock Plan") to replace the Company's 1999 Stock Plan and 1999 Stock Non-Employee Director Stock Plan and subsequently reserved
25 million
shares of Company common stock that may be issued under the 2009 Plan, plus any shares forfeited or cancelled under the 1999 Stock Plan. The 2009 Stock Plan provides for the grant of awards in the form of stock options, stock appreciation rights ("SARs"), restricted stock, restricted stock units ("RSUs"), performance shares and performance units with performance-based conditions on vesting or exercisability, and cash awards. The 2009 Plan has a term of
ten years
. As of
October 31, 2017
,
8,140,709
shares were available for future awards under the 2009 Stock Plan.
Stock options under the 2009 Stock Plans may be either "incentive stock options", as defined in Section 422 of the Internal Revenue Code, or non-statutory. Options were granted prior to November 1, 2015 and generally vest at a rate of
25 percent
per year over a period of
four years
from the date of grant with a maximum contractual term of
ten years
. The exercise price for stock options is generally not less than
100 percent
of the fair market value of our common stock on the date the stock award is granted. Stock options were granted in years prior to fiscal year 2016. Agilent issues new shares of common stock when employee stock options are exercised.
Effective November 1, 2003, the Compensation Committee of the Board of Directors approved the LTPP, which is a performance stock award program administered under the 2009 Stock Plan, for the company's executive officers and other key employees. Participants in this program are entitled to receive unrestricted shares of the company's stock after the end of a three-year period, if specified performance targets are met. Certain LTPP awards are generally designed to meet the criteria of a performance award with the performance metrics and peer group comparison based on the Total Stockholders’ Return (“TSR”) set at the beginning of the performance period. Effective November 1, 2015, the Compensation Committee of the Board of Directors approved another type of performance stock award, for the company's executive officers and other key employees. Participants in this program are also entitled to receive unrestricted shares of the company's stock after the end of a three-year period, if specified performance targets over the three-year period are met. The performance target for grants made in 2016 and 2017 were based on Operating Margin (“OM”) and Earnings Per Share ("EPS"), respectively. In the case of LTPP-OM, the performance targets for all the three years of performance period is set at the time of grant. The performance targets for LTPP-EPS grants for year 2 and year 3 of the performance period will be set in the first quarter of year 2 and year 3, respectively. All LTPP awards granted after November 1, 2015, are subject to a one-year post-vest holding period.
Based on the performance metrics the final LTPP award may vary from
zero
to
200 percent
of the target award. The maximum contractual term for awards under the LTPP program is
three years
and the maximum award value for awards granted in 2017 and 2016 cannot exceed 300 percent of the grant date target value. We consider the dilutive impact of these programs in our diluted net income per share calculation only to the extent that the performance conditions are expected to be met.
We also issue restricted stock units under our share-based plans. The estimated fair value of the restricted stock unit awards granted under the Stock Plans is determined based on the market price of Agilent's common stock on the date of grant adjusted
66
for expected dividend yield. Restricted stock units generally vest, with some exceptions, at a rate of
25 percent
per year over a period of
four years
from the date of grant. All restricted stock units granted to our executives after November 1, 2015, are subject to a one-year post-vest holding period.
Impact of Share-based Compensation Awards
We have recognized compensation expense based on the estimated grant date fair value method under the authoritative guidance. For all share-based awards we have recognized compensation expense using a straight-line amortization method. As the guidance requires that share-based compensation expense be based on awards that are ultimately expected to vest, estimated share-based compensation has been reduced for estimated forfeitures.
The impact on our results for share-based compensation was as follows:
|
Years Ended October 31,
|
|||||||||||
|
2017
|
2016
|
2015
|
|||||||||
|
(in millions)
|
|||||||||||
|
Cost of products and services
|
$
|
15
|
|
$
|
14
|
|
$
|
11
|
|
||
|
Research and development
|
6
|
|
6
|
|
5
|
|
|||||
|
Selling, general and administrative
|
40
|
|
40
|
|
39
|
|
|||||
|
Total share-based compensation expense
|
$
|
61
|
|
$
|
60
|
|
$
|
55
|
|
||
At
October 31, 2017
and
2016
there was
no
share-based compensation capitalized within inventory. The weighted average grant date fair value of options, granted in
2015
was
$10.58
per share. Stock options were granted in years prior to fiscal year 2016.
Included in the
2015
expense is an incremental expense for the acceleration of share-based compensation related to the announced workforce reduction plan of
$2 million
.
No
such expense was recorded for
2017
or
2016
. Upon termination of the employees impacted by the workforce reduction, the non-vested Agilent awards held by these employees immediately vests. Employees have a period of up to
three months
in which to exercise the Agilent options before such options are cancelled.
Valuation Assumptions
For all periods presented, the fair value of share based awards for employee stock option awards was estimated using the Black-Scholes option pricing model. For all periods presented, shares granted under the LTPP (TSR) were valued using a Monte Carlo simulation. The ESPP allows eligible employees to purchase shares of our common stock at
85
percent of the fair market value at the purchase date.
The estimated fair value of restricted stock unit awards, LTPP (OM) and LTPP (EPS) was determined based on the market price of Agilent's common stock on the date of grant adjusted for expected dividend yield and as appropriate, a discount related to the one-year post vesting. The compensation cost for LTPP (OM) and LTPP (EPS) awards reflect the cost of awards that are probable to vest at the end of the performance period.
67
The following assumptions were used to estimate the fair value of employee stock options and LTPP grants.
|
|
Years Ended October 31,
|
||||
|
|
2017
|
2016
|
2015
|
||
|
Stock Option Plans:
|
|
|
|
||
|
Weighted average risk-free interest rate
|
—
|
—
|
1.75%
|
||
|
Dividend yield
|
—
|
—
|
1%
|
||
|
Weighted average volatility
|
—
|
—
|
28%
|
||
|
Expected life
|
—
|
—
|
5.5 years
|
||
|
LTPP:
|
|
|
|
||
|
Volatility of Agilent shares
|
23%
|
24%
|
25%
|
||
|
Volatility of selected peer-company shares
|
15%-63%
|
14%-50%
|
12%-57%
|
||
|
Price-wise correlation with selected peers
|
36%
|
35%
|
37%
|
||
|
Post-vest restriction discount for all executive awards
|
5.3%
|
5.5%
|
—
|
||
Both the Black-Scholes and Monte Carlo simulation fair value models require the use of highly subjective and complex assumptions, including the option’s expected life and the price volatility of the underlying stock. For the stock option grants in 2015 and LTPP (TSR) grants in 2015 and 2016, we used the 3-year average historical stock price volatility of a group of our peer companies. We believed our historical volatility prior to the separation of Keysight in 2015 was no longer relevant to use. For LTPP (TSR) grants in 2017, we used our own historical stock price volatility.
All LTPP awards granted in 2017 and 2016 to our executives have a one-year post-vest holding restriction. The estimated discount associated with post-vest holding restrictions is calculated using the Finnerty model. The model calculates the potential lost value if the employee were able to sell the shares during the lack of marketability period, instead of being required to hold the shares. For 2016, the model used the 3-year average historical stock price volatility of a group of our peer companies and an expected dividend yield to compute the discount. For 2017, the model used Agilent's own post-separation historical stock price volatility. The grants made during 2017 and 2016 have a discount of
5.3 percent
and
5.5 percent
, respectively, while computing the fair values.
68
Share-Based Payment Award Activity
Employee Stock Options
The following table summarizes employee stock option award activity of our employees and directors for
2017
.
|
Options
Outstanding
|
Weighted
Average
Exercise Price
|
|||||
|
|
(in thousands)
|
|
||||
|
Outstanding at October 31, 2016
|
4,106
|
|
$
|
33
|
|
|
|
Granted
|
—
|
|
$
|
—
|
|
|
|
Exercised
|
(1,343
|
)
|
$
|
30
|
|
|
|
Cancelled/Forfeited/Expired
|
(2
|
)
|
$
|
41
|
|
|
|
Outstanding at October 31, 2017
|
2,761
|
|
$
|
34
|
|
|
Forfeited and expired options from total cancellations in
2017
were as follows:
|
Options
Cancelled
|
Weighted
Average
Exercise Price
|
|||||
|
|
(in thousands)
|
|
||||
|
Forfeited
|
2
|
|
$
|
41
|
|
|
|
Expired
|
—
|
|
$
|
—
|
|
|
|
Total options cancelled during 2017
|
2
|
|
$
|
41
|
|
|
The options outstanding and exercisable for equity share-based payment awards at
October 31, 2017
were as follows:
|
|
Options Outstanding
|
Options Exercisable
|
|||||||||||||||||||||||
|
Range of
Exercise Prices
|
Number
Outstanding
|
Weighted
Average
Remaining
Contractual
Life
|
Weighted
Average
Exercise
Price
|
Aggregate
Intrinsic
Value
|
Number
Exercisable
|
Weighted
Average
Remaining
Contractual
Life
|
Weighted
Average
Exercise
Price
|
Aggregate
Intrinsic
Value
|
|||||||||||||||||
|
|
(in thousands)
|
(in years)
|
|
(in thousands)
|
(in thousands)
|
(in years)
|
|
(in thousands)
|
|||||||||||||||||
|
$0 - 25
|
170
|
|
1.6
|
$
|
18
|
|
$
|
8,561
|
|
170
|
|
1.6
|
$
|
18
|
|
$
|
8,561
|
|
|||||||
|
$25.01 - 30
|
957
|
|
4.3
|
$
|
26
|
|
39,804
|
|
957
|
|
4.3
|
$
|
26
|
|
39,804
|
|
|||||||||
|
$30.01 - 40
|
528
|
|
6.1
|
$
|
39
|
|
15,258
|
|
296
|
|
6.1
|
$
|
39
|
|
8,566
|
|
|||||||||
|
$40.01 - over
|
1,106
|
|
7.0
|
$
|
41
|
|
30,035
|
|
493
|
|
7.0
|
$
|
41
|
|
13,396
|
|
|||||||||
|
2,761
|
|
5.6
|
$
|
34
|
|
$
|
93,658
|
|
1,916
|
|
5.0
|
$
|
31
|
|
$
|
70,327
|
|
||||||||
The aggregate intrinsic value in the table above represents the total pre-tax intrinsic value, based on the company's closing stock price of
$68.03
at
October 31, 2017
, which would have been received by award holders had all award holders exercised their awards that were in-the-money as of that date. The total number of in-the-money awards exercisable at
October 31, 2017
was approximately
1.9 million
.
69
The following table summarizes the aggregate intrinsic value of options exercised in
2017
,
2016
and
2015
and the fair value of options granted in
2015
:
|
Aggregate
Intrinsic Value
|
Weighted
Average
Exercise
Price
|
Per Share Value Using
Black-Scholes
Model
|
|||||||||
|
|
(in thousands)
|
|
|
||||||||
|
Options exercised in fiscal 2015
|
$
|
33,258
|
|
$
|
24
|
|
|
|
|||
|
Black-Scholes per share value of options granted during fiscal 2015
|
|
|
|
|
$
|
11
|
|
||||
|
Options exercised in fiscal 2016
|
$
|
26,913
|
|
$
|
25
|
|
|
|
|||
|
Options exercised in fiscal 2017
|
$
|
36,175
|
|
$
|
30
|
|
|
|
|||
As of
October 31, 2017
, the unrecognized share-based compensation costs for outstanding stock option awards, net of expected forfeitures, was approximately
$0.7 million
which is expected to be amortized over a weighted average period of
1
year. The amount of cash received from the exercise of share-based awards granted was
$66 million
in
2017
,
$62 million
in
2016
and
$58 million
in
2015
.
Non-Vested Awards
The following table summarizes non-vested award activity in
2017
primarily for our LTPP and restricted stock unit awards.
|
Shares
|
Weighted
Average
Grant Price
|
|||||
|
|
(in thousands)
|
|
||||
|
Non-vested at October 31, 2016
|
3,062
|
|
$
|
40
|
|
|
|
Granted
|
1,405
|
|
$
|
47
|
|
|
|
Vested
|
(1,068
|
)
|
$
|
39
|
|
|
|
Forfeited
|
(84
|
)
|
$
|
42
|
|
|
|
Change in LTPP shares in the year due to not meeting performance conditions
|
(13
|
)
|
$
|
—
|
|
|
|
Non-vested at October 31, 2017
|
3,302
|
|
$
|
43
|
|
|
As of
October 31, 2017
, the unrecognized share-based compensation costs for non-vested restricted stock awards, net of expected forfeitures, was approximately
$58 million
which is expected to be amortized over a weighted average period of
2.2
years. The total fair value of restricted stock awards vested was
$42 million
for
2017
,
$21 million
for
2016
and
$31 million
for
2015
.
70
5. INCOME TAXES
The domestic and foreign components of income from continuing operations before taxes are:
|
|
Years Ended October 31,
|
||||||||||
|
|
2017
|
2016
|
2015
|
||||||||
|
|
(in millions)
|
||||||||||
|
U.S. operations
|
$
|
116
|
|
$
|
27
|
|
$
|
77
|
|
||
|
Non-U.S. operations
|
687
|
|
517
|
|
403
|
|
|||||
|
Total income from continuing operations before taxes
|
$
|
803
|
|
$
|
544
|
|
$
|
480
|
|
||
The provision for income taxes is comprised of:
|
|
Years Ended October 31,
|
||||||||||
|
|
2017
|
2016
|
2015
|
||||||||
|
|
(in millions)
|
||||||||||
|
U.S. federal taxes:
|
|
|
|
||||||||
|
Current
|
$
|
15
|
|
$
|
(1
|
)
|
$
|
(91
|
)
|
||
|
Deferred
|
110
|
|
19
|
|
97
|
|
|||||
|
Non-U.S. taxes:
|
|
|
|
||||||||
|
Current
|
1
|
|
77
|
|
62
|
|
|||||
|
Deferred
|
(7
|
)
|
(14
|
)
|
(27
|
)
|
|||||
|
State taxes, net of federal benefit:
|
|
|
|
||||||||
|
Current
|
1
|
|
3
|
|
1
|
|
|||||
|
Deferred
|
(1
|
)
|
(2
|
)
|
—
|
|
|||||
|
Total provision
|
$
|
119
|
|
$
|
82
|
|
$
|
42
|
|
||
The income tax provision does not reflect potential future tax savings resulting from excess deductions associated with our various share-based award plans.
The significant components of deferred tax assets and deferred tax liabilities included on the consolidated balance sheet are:
|
|
October 31,
|
||||||||||||||
|
|
2017
|
2016
|
|||||||||||||
|
|
Deferred
Tax Assets
|
Deferred Tax
Liabilities
|
Deferred
Tax Assets
|
Deferred Tax
Liabilities
|
|||||||||||
|
|
(in millions)
|
||||||||||||||
|
Inventory
|
$
|
16
|
|
$
|
—
|
|
$
|
13
|
|
$
|
—
|
|
|||
|
Intangibles
|
—
|
|
93
|
|
—
|
|
92
|
|
|||||||
|
Property, plant and equipment
|
12
|
|
—
|
|
16
|
|
—
|
|
|||||||
|
Warranty reserves
|
12
|
|
—
|
|
14
|
|
—
|
|
|||||||
|
Pension benefits and retiree medical benefits
|
70
|
|
—
|
|
136
|
|
—
|
|
|||||||
|
Employee benefits, other than retirement
|
28
|
|
—
|
|
28
|
|
—
|
|
|||||||
|
Net operating loss, capital loss, and credit carryforwards
|
328
|
|
—
|
|
293
|
|
—
|
|
|||||||
|
Unremitted earnings of foreign subsidiaries
|
—
|
|
163
|
|
—
|
|
53
|
|
|||||||
|
Share-based compensation
|
45
|
|
—
|
|
41
|
|
—
|
|
|||||||
|
Deferred revenue
|
45
|
|
—
|
|
42
|
|
—
|
|
|||||||
|
Other
|
1
|
|
—
|
|
12
|
|
—
|
|
|||||||
|
Subtotal
|
557
|
|
256
|
|
595
|
|
145
|
|
|||||||
|
Tax valuation allowance
|
(138
|
)
|
—
|
|
(129
|
)
|
—
|
|
|||||||
|
Total deferred tax assets or deferred tax liabilities
|
$
|
419
|
|
$
|
256
|
|
$
|
466
|
|
$
|
145
|
|
|||
The decrease in 2017 as compared to 2016 for the deferred tax asset relating to pension benefits is due mainly to the tax effect of changes in pension plans recognized in other comprehensive income (loss). During the third quarter of 2017, the company determined a portion of current year foreign earnings from its low tax jurisdictions would not be considered as
71
indefinitely reinvested. As such, a liability for that portion of unremitted foreign earnings was accrued causing an increase in ending deferred tax liability.
Agilent records U.S. income taxes on the undistributed earnings of foreign subsidiaries unless the subsidiaries' earnings are considered indefinitely reinvested outside the U.S. As of
October 31, 2017
the company recognized a
$163 million
deferred tax liability for the overall residual tax expected to be imposed upon the repatriation of unremitted foreign earnings not considered permanently reinvested. As of
October 31, 2017
, the cumulative amount of undistributed earnings considered indefinitely reinvested was
$5.8 billion
. No deferred tax liability has been recognized on the basis difference created by such earnings since it is our intention to utilize those earnings in the company’s foreign operations. Due to the availability of U.S. foreign tax credits, the determination of the unrecognized deferred tax liability on these earnings is not practicable.
The breakdown between long-term deferred tax assets and deferred tax liabilities was as follows for the years
2017
and
2016
:
|
|
October 31,
|
||||||
|
|
2017
|
2016
|
|||||
|
|
(in millions)
|
||||||
|
Long-term deferred tax assets (included within other assets)
|
$
|
240
|
|
$
|
386
|
|
|
|
Long-term deferred tax liabilities (included within other long-term liabilities)
|
(77
|
)
|
(65
|
)
|
|||
|
Total
|
$
|
163
|
|
$
|
321
|
|
|
Valuation allowances require an assessment of both positive and negative evidence when determining whether it is more likely than not that deferred tax assets are recoverable. Such assessment is required on a jurisdiction by jurisdiction basis. As of
October 31, 2017
, we continued to maintain a valuation allowance of
$138 million
until sufficient positive evidence exists to support reversal. The valuation allowance is mainly related to deferred tax assets for California R&D credits, net operating losses in the state of Colorado and the Netherlands and capital losses in the U.S. and foreign jurisdictions.
At
October 31, 2017
, we had federal, state and foreign net operating loss carryforwards of approximately
$10 million
,
$670 million
and
$310 million
, respectively. The federal and state net operating loss carryforwards are subject to various limitations under Section 382 of the Internal Revenue Code and applicable state tax laws. If not utilized, the federal and state net operating loss carryforwards will both begin to expire in 2018. If not utilized,
$124 million
of the foreign net operating loss carryforwards will begin to expire in 2018. The remaining
$186 million
of the foreign net operating losses carry forward indefinitely. At
October 31, 2017
, we had federal and foreign capital loss carryforwards of
$48 million
and
$129 million
, respectively. If not utilized, the federal capital loss carryforwards will begin to expire in 2022. The foreign capital losses carry forward indefinitely. At
October 31, 2017
, we had federal and state tax credit carryforwards, net of reserves. of approximately
$144 million
and
$55 million
, respectively. If not utilized, the federal tax credit carryforwards will begin to expire in 2018. The state tax credits carry forward indefinitely.
The differences between the U.S. federal statutory income tax rate and our effective tax rate are:
|
|
Years Ended October 31,
|
||||||||||
|
|
2017
|
2016
|
2015
|
||||||||
|
|
(in millions)
|
||||||||||
|
Profit before tax times statutory rate
|
$
|
281
|
|
$
|
190
|
|
$
|
167
|
|
||
|
State income taxes, net of federal benefit
|
2
|
|
2
|
|
(8
|
)
|
|||||
|
Non-U.S. income taxed at different rates
|
(43
|
)
|
(68
|
)
|
(72
|
)
|
|||||
|
Change in unrecognized tax benefits
|
(110
|
)
|
(27
|
)
|
(116
|
)
|
|||||
|
Repatriation of foreign earnings
|
—
|
|
—
|
|
68
|
|
|||||
|
Valuation allowances
|
1
|
|
18
|
|
(2
|
)
|
|||||
|
Adjustments to earnings of foreign subsidiaries
|
—
|
|
(11
|
)
|
—
|
|
|||||
|
Other, net
|
(12
|
)
|
(22
|
)
|
5
|
|
|||||
|
Provision for income taxes
|
$
|
119
|
|
$
|
82
|
|
$
|
42
|
|
||
|
Effective tax rate
|
14.8
|
%
|
15.1
|
%
|
8.7
|
%
|
|||||
Agilent enjoys tax holidays in several different jurisdictions, most significantly in Singapore. The tax holidays provide lower rates of taxation on certain classes of income and require various thresholds of investments and employment or specific types of income in those jurisdictions. The tax holidays are due for renewal between 2018 and 2023. As a result of the incentives,
72
the impact of the tax holidays decreased income taxes by
$93 million
,
$86 million
, and
$65 million
in
2017
,
2016
, and
2015
, respectively. The benefit of the tax holidays on net income per share (diluted) was approximately
$0.29
,
$0.26
, and
$0.19
in
2017
,
2016
and
2015
, respectively.
For 2017, the company's income tax expense was
$119 million
with an effective tax rate of
14.8 percent
. Our effective tax rate is impacted by earnings realized in foreign jurisdictions with statutory tax rates lower than the federal statutory tax rate. During the year, the company determined a portion of current year foreign earnings from its low tax jurisdictions would not be considered as indefinitely reinvested. As such, a deferred tax liability for that portion of unremitted foreign earnings was accrued causing an increase in the annual tax expense. Our annual effective tax rate also included tax benefits due to the settlement of an audit in Germany for the years 2005 through 2008 and the lapse of U.S. statute of limitation for the fiscal years 2012 and 2013. This benefit was offset by a deferred tax liability required for the tax expected upon repatriation of related unremitted foreign earnings that were not asserted as indefinitely invested outside the U.S.
For 2016, the company's income tax expense was
$82 million
with an effective tax rate of
15.1 percent
. The income tax provision from continuing operations for the year ended October 31, 2016 included net discrete tax expense of
$17 million
primarily due to tax expense related to the establishment of a valuation allowance on an equity method impairment that would generate a capital loss when realized.
For 2015, the company’s income tax expense was
$42 million
with an effective tax rate of
8.7 percent
. The income tax expense from continuing operations for the year ended October 31, 2015 included a net discrete tax benefit of
$55 million
primarily due to the settlement of an Internal Revenue Service (“IRS) audit in the U.S. and the recognition of tax expense related to the repatriation of dividends.
The breakdown between current and long-term income tax assets and liabilities, excluding deferred tax assets and liabilities, was as follows for the years
2017
and
2016
:
|
October 31,
|
|||||||
|
2017
|
2016
|
||||||
|
(in millions)
|
|||||||
|
Current income tax assets (included within other current assets)
|
$
|
77
|
|
$
|
83
|
|
|
|
Long-term income tax assets (included within other assets)
|
18
|
|
19
|
|
|||
|
Current income tax liabilities (included within other accrued liabilities)
|
(55
|
)
|
(49
|
)
|
|||
|
Long-term income tax liabilities (included within other long-term liabilities)
|
(131
|
)
|
(190
|
)
|
|||
|
Total
|
$
|
(91
|
)
|
$
|
(137
|
)
|
|
The calculation of our tax liabilities involves dealing with uncertainties in the application of complex tax law and regulations in a multitude of jurisdictions. Although the guidance on the accounting for uncertainty in income taxes prescribes the use of a recognition and measurement model, the determination of whether an uncertain tax position has met those thresholds will continue to require significant judgment by management. In accordance with the guidance on the accounting for uncertainty in income taxes, for all U.S. and other tax jurisdictions, we recognize potential liabilities for anticipated tax audit issues based on our estimate of whether, and the extent to which, additional taxes and interest will be due. The ultimate resolution of tax uncertainties may differ from what is currently estimated, which could result in a material impact on income tax expense. If our estimate of income tax liabilities proves to be less than the ultimate assessment, a further charge to expense would be required. If events occur and the payment of these amounts ultimately proves to be unnecessary, the reversal of the liabilities would result in tax benefits being recognized in the period when we determine the liabilities are no longer necessary.
73
The aggregate changes in the balances of our unrecognized tax benefits including all federal, state and foreign tax jurisdictions are as follows:
|
2017
|
2016
|
2015
|
|||||||||
|
|
(in millions)
|
||||||||||
|
Balance, beginning of year
|
$
|
293
|
|
$
|
289
|
|
$
|
417
|
|
||
|
Additions for tax positions related to the current year
|
32
|
|
31
|
|
33
|
|
|||||
|
Additions for tax positions from prior years
|
1
|
|
1
|
|
3
|
|
|||||
|
Reductions for tax positions from prior years
|
(3
|
)
|
(27
|
)
|
(156
|
)
|
|||||
|
Settlements with taxing authorities
|
(52
|
)
|
—
|
|
(4
|
)
|
|||||
|
Statute of limitations expirations
|
(47
|
)
|
(1
|
)
|
(4
|
)
|
|||||
|
Balance, end of year
|
$
|
224
|
|
$
|
293
|
|
$
|
289
|
|
||
As of
October 31, 2017
, we had
$224 million
of unrecognized tax benefits of which
$202 million
, if recognized, would affect our effective tax rate.
We recognized a tax benefit of
$9 million
, a tax expense of
$2 million
and a tax benefit of
$2 million
of interest and penalties related to unrecognized tax benefits in
2017
,
2016
and
2015
, respectively. Interest and penalties accrued as of
October 31, 2017
and
2016
were
$16 million
and
$25 million
, respectively.
In the U.S., tax years remain open back to the year 2014 for federal income tax purposes and the year 2000 for significant states. There were no substantial changes to the status of these open tax years during 2017. The U.S. statute of limitation for audit of tax returns for the fiscal years 2012 and 2013 expired in July, 2017. The statute expiration resulted in the recognition, within the continuing operations, of previously unrecognized tax benefits of
$40 million
. This discrete tax benefit was offset by a deferred tax liability required for the tax expected upon repatriation of related unremitted foreign earnings that were not asserted as indefinitely invested outside the U.S.
On September 22, 2015, we reached an agreement with the Internal Revenue Service ("IRS") for the tax years 2008 through 2011. The settlement resulted in the recognition, within the continuing operations, of previously unrecognized tax benefits of
$119 million
, offset by a tax liability on foreign distributions of approximately
$99 million
principally related to the repatriation of foreign earnings.
In other major jurisdictions where the company conducts business, the tax years generally remain open back to the year 2001. During the first quarter of fiscal year 2017, the company settled its ongoing tax audit in Italy for the years 2011 to 2013 resulting in a net tax expense of
$7 million
. The settlement resulted in the recognition of previously unrecognized tax benefits of approximately
$14 million
. During the third quarter of fiscal year 2017, the company settled its ongoing tax audit in Germany for the years 2005 to 2008, which resulted in the recognition of previously unrecognized tax benefits of approximately
$51 million
.
With these jurisdictions and the U.S., it is reasonably possible that there could be significant changes to our unrecognized tax benefits in the next twelve months due to either the expiration of a statute of limitation or a tax audit settlement which will be partially offset by an anticipated tax liability related to unremitted foreign earnings, where applicable. Given the number of years and numerous matters that remain subject to examination in various tax jurisdictions, management is unable to estimate the range of possible changes to the balance of our unrecognized tax benefits.
On July 27, 2015, the U.S. Tax Court issued an opinion in Altera Corp. v. Commissioner related to the treatment of stock-based compensation expense in an intercompany cost-sharing arrangement. A final decision was entered by the U.S. Tax Court on December 1, 2015. At this time, the U.S. Department of the Treasury has not withdrawn the requirement from its regulations to include stock-based compensation. The IRS appealed the decision and filed its arguments opposing the Tax Court decision in June 2016. The case is currently in the appeals process in the Ninth Circuit. Due to the uncertainty surrounding the Court’s decision, we concluded that no adjustment to our consolidated financial statements is appropriate at this time.
74
6. NET INCOME PER SHARE
The following is a reconciliation of the numerators and denominators of the basic and diluted net income per share computations for the periods presented below.
|
|
Years Ended October 31,
|
||||||||||
|
|
2017
|
2016
|
2015
|
||||||||
|
|
(in millions)
|
||||||||||
|
Numerator:
|
|
|
|
||||||||
|
Income from continuing operations
|
$
|
684
|
|
$
|
462
|
|
$
|
438
|
|
||
|
Loss from discontinued operations
|
$
|
—
|
|
$
|
—
|
|
$
|
(37
|
)
|
||
|
Net income
|
684
|
|
462
|
|
401
|
|
|||||
|
Denominators:
|
|
|
|
||||||||
|
Basic weighted average shares
|
322
|
|
326
|
|
333
|
|
|||||
|
Potential common shares — stock options and other employee stock plans
|
4
|
|
3
|
|
2
|
|
|||||
|
Diluted weighted average shares
|
326
|
|
329
|
|
335
|
|
|||||
The dilutive effect of share-based awards is reflected in diluted net income per share by application of the treasury stock method, which includes consideration of unamortized share-based compensation expense and the dilutive effect of in-the-money options and non-vested restricted stock units. Under the treasury stock method, the amount the employee must pay for exercising stock options and unamortized share-based compensation expense collectively are assumed proceeds to be used to repurchase hypothetical shares. An increase in the fair market value of the company's common stock can result in a greater dilutive effect from potentially dilutive awards. We issued a total of
3 million
share-based awards in each year of
2017
,
2016
and
2015
.
We exclude stock options with exercise prices greater than the average market price of our common stock from the calculation of diluted earnings per share because their effect would be anti-dilutive. For
2017
,
2016
and
2015
, options to purchase
zero
,
842,200
and
1.2 million
shares respectively were excluded from the calculation of diluted earnings per share. In addition, we also exclude from the calculation of diluted earnings per share, stock options, ESPP, LTPP and restricted stock awards whose combined exercise price and unamortized fair value collectively were greater than the average market price of our common stock because their effect would also be anti-dilutive. For the year ended
2017
,
2016
and
2015
, options to purchase
200
shares,
229,600
shares and
368,900
shares, respectively, were excluded from the calculation of diluted earnings per share.
7. INVENTORY
|
|
October 31,
|
||||||
|
|
2017
|
2016
|
|||||
|
|
(in millions)
|
||||||
|
Finished goods
|
$
|
363
|
|
$
|
339
|
|
|
|
Purchased parts and fabricated assemblies
|
212
|
|
194
|
|
|||
|
Inventory
|
$
|
575
|
|
$
|
533
|
|
|
Inventory-related excess and obsolescence charges, included in continuing operations, of
$24 million
were recorded in total cost of products in
2017
,
$20 million
in
2016
and
$30 million
in
2015
, respectively. We record excess and obsolete inventory charges for both inventory on our site as well as inventory at our contract manufacturers and suppliers where we have non-cancellable purchase commitments.
75
8. PROPERTY, PLANT AND EQUIPMENT, NET
|
|
October 31,
|
||||||
|
|
2017
|
2016
|
|||||
|
|
(in millions)
|
||||||
|
Land
|
$
|
56
|
|
$
|
53
|
|
|
|
Buildings and leasehold improvements
|
886
|
|
757
|
|
|||
|
Machinery and equipment
|
470
|
|
420
|
|
|||
|
Software
|
188
|
|
176
|
|
|||
|
Total property, plant and equipment
|
1,600
|
|
1,406
|
|
|||
|
Accumulated depreciation and amortization
|
(843
|
)
|
(767
|
)
|
|||
|
Property, plant and equipment, net
|
$
|
757
|
|
$
|
639
|
|
|
There were
no
asset impairments in
2017
,
2016
and
2015
. Depreciation expenses were
$94 million
in
2017
,
$95 million
in
2016
and
$98 million
in
2015
.
9. GOODWILL AND OTHER INTANGIBLE ASSETS
The goodwill balances at
October 31, 2017
,
2016
and
2015
and the movements in
2017
and
2016
for each of our reportable segments are shown in the table below:
|
Life Sciences and Applied Markets
|
Diagnostics and Genomics
|
Agilent CrossLab
|
Total
|
||||||||||||
|
|
(in millions)
|
||||||||||||||
|
Goodwill as of October 31, 2015
|
$
|
650
|
|
$
|
1,234
|
|
$
|
482
|
|
$
|
2,366
|
|
|||
|
Foreign currency translation impact
|
3
|
|
(11
|
)
|
3
|
|
(5
|
)
|
|||||||
|
Goodwill arising from acquisitions
|
137
|
|
—
|
|
19
|
|
156
|
|
|||||||
|
Goodwill as of October 31, 2016
|
$
|
790
|
|
$
|
1,223
|
|
$
|
504
|
|
$
|
2,517
|
|
|||
|
Foreign currency translation impact
|
2
|
|
10
|
|
—
|
|
12
|
|
|||||||
|
Goodwill arising from acquisitions
|
26
|
|
52
|
|
—
|
|
78
|
|
|||||||
|
Goodwill as of October 31, 2017
|
$
|
818
|
|
$
|
1,285
|
|
$
|
504
|
|
$
|
2,607
|
|
|||
As of September 30, 2017, we assessed goodwill impairment for our reporting units and
no
impairment was indicated.
76
The component parts of other intangible assets at
October 31, 2017
and
2016
are shown in the table below:
|
|
Other Intangible Assets
(1)
|
||||||||||
|
|
Gross
Carrying
Amount
|
Accumulated
Amortization
and Impairments
|
Net Book
Value
|
||||||||
|
|
(in millions)
|
||||||||||
|
As of October 31, 2016:
|
|
|
|
||||||||
|
Purchased technology
|
$
|
823
|
|
$
|
572
|
|
$
|
251
|
|
||
|
Backlog
|
1
|
|
1
|
|
—
|
|
|||||
|
Trademark/Tradename
|
149
|
|
61
|
|
88
|
|
|||||
|
Customer relationships
|
263
|
|
211
|
|
52
|
|
|||||
|
Total amortizable intangible assets
|
$
|
1,236
|
|
$
|
845
|
|
$
|
391
|
|
||
|
In-Process R&D
|
17
|
|
—
|
|
17
|
|
|||||
|
Total
|
$
|
1,253
|
|
$
|
845
|
|
$
|
408
|
|
||
|
As of October 31, 2017:
|
|
|
|
||||||||
|
Purchased technology
|
$
|
855
|
|
$
|
646
|
|
$
|
209
|
|
||
|
Trademark/Tradename
|
149
|
|
73
|
|
76
|
|
|||||
|
Customer relationships
|
151
|
|
112
|
|
39
|
|
|||||
|
Total amortizable intangible assets
|
$
|
1,155
|
|
$
|
831
|
|
$
|
324
|
|
||
|
In-Process R&D
|
24
|
|
—
|
|
24
|
|
|||||
|
Total
|
$
|
1,179
|
|
$
|
831
|
|
$
|
348
|
|
||
(1) We also purchase technology and licenses from third parties, separately from business combinations. As of October 31, 2017 and 2016, the net balance of these intangibles not included in this table was
$13 million
and
$8 million
, respectively.
In
2017, we acquired Cobalt Light Systems (“Cobalt”), an Oxfordshire, U.K. based provider of differentiated Raman spectroscopic instruments for the pharmaceutical industry, applied markets and public safety, for approximately
$53 million
in cash and Multiplicom NV (“Multiplicom”), a leading European diagnostics company with state-of-the-art genetic testing technology and products, for approximately
$72 million
in cash.
We have not included the pro forma impact of these acquisitions since they are not material to our current or prior period results.
During 2017,
w
e recorded additions to goodwill of
$78 million
and to other intangible assets of
$52 million
related to these acquisitions. During 2017, other intangible assets increased
$5 million
, due to the impact of foreign exchange translation.
During 2017, we also wrote-off the gross carrying amount of
$132 million
and the related accumulated amortization of fully amortized intangible assets which were no longer being used.
In 2016, we acquired Seahorse Bioscience, a leader in providing instruments and assay kits for measuring cell metabolism and bioenergetics, for
$242 million
and iLab Solutions LLC ("iLab"), a
cloud-based solutions provider for core laboratory management for
$26 million
.
In 2016, we recorded additions to goodwill of
$156 million
and to intangible assets of
$121 million
related to these acquisitions. During the year other intangible assets decreased
$2 million
, due to the impact of foreign exchange translation.
There were
no
impairments of other intangible assets recorded during
2017
. In addition, we recorded impairments of other intangibles related to the cancellation of in-process research and development projects of
$4 million
and
$3 million
during
2016
and
2015
, respectively.
Amortization expense of intangible assets was
$120 million
in
2017
,
$154 million
in
2016
, and
$158 million
in
2015
.
77
Future amortization expense related to existing finite-lived purchased intangible assets associated with business combinations for the next five fiscal years and thereafter is estimated below:
|
Estimated future amortization expense:
|
|||
|
(in millions)
|
|||
|
2018
|
$
|
94
|
|
|
2019
|
$
|
69
|
|
|
2020
|
$
|
57
|
|
|
2021
|
$
|
43
|
|
|
2022
|
$
|
32
|
|
|
Thereafter
|
$
|
42
|
|
10. INVESTMENTS
The following table summarizes the company's equity investments as of
October 31, 2017
and
2016
(net book value):
|
|
October 31,
|
||||||
|
|
2017
|
2016
|
|||||
|
|
(in millions)
|
||||||
|
Long-Term
|
|
|
|||||
|
Cost method investments
|
$
|
106
|
|
$
|
104
|
|
|
|
Trading securities
|
32
|
|
31
|
|
|||
|
Total
|
$
|
138
|
|
$
|
135
|
|
|
Cost method investments consist of non-marketable equity securities and a fund and are accounted for at historical cost. Approximately
$80 million
relates to our variable interest entity investment, see Note 1, "
Overview and Summary of Significant Accounting Policies
". Trading securities are reported at fair value, with gains or losses resulting from changes in fair value recognized currently in earnings.
All of our investments, excluding trading securities, are subject to periodic impairment review. The impairment analysis requires significant judgment to identify events or circumstances that would likely have significant adverse effect on the future value of the investment. We consider various factors in determining whether an impairment is other-than-temporary, including the severity and duration of the impairment, forecasted recovery, the financial condition and near-term prospects of the investee, and our ability and intent to hold the investment for a period of time sufficient to allow for any anticipated recovery in market value. During the year ended October 31, 2016, we identified certain events and circumstances that indicated the decline in value of an equity method investment was other-than-temporary. As a result, we wrote down the investment to its fair value of
zero
, resulting in an impairment charge of approximately
$18 million
.
Amounts included in other income (expense), net for the appropriate share of loss on equity method investments and other than temporary impairments were as follows:
|
|
Years Ended October 31,
|
||||||||||
|
|
2017
|
2016
|
2015
|
||||||||
|
|
(in millions)
|
||||||||||
|
Equity method investments - share of losses
|
$
|
—
|
|
$
|
(10
|
)
|
$
|
(9
|
)
|
||
|
Equity method investments - other than temporary impairments
|
—
|
|
(18
|
)
|
—
|
|
|||||
|
Total
|
$
|
—
|
|
$
|
(28
|
)
|
$
|
(9
|
)
|
||
Net unrealized gains on our trading securities portfolio were
$4 million
in
2017
,
$1 million
in
2016
and
$2 million
in
2015
.
11. FAIR VALUE MEASUREMENTS
The authoritative guidance defines fair value as the price that would be received from selling an asset or paid to transfer a liability in an orderly transaction between market participants at the measurement date. When determining the fair value measurements for assets and liabilities required or permitted to be recorded at fair value, we consider the principal or most advantageous market and assumptions that market participants would use when pricing the asset or liability.
78
Fair Value Hierarchy
The guidance establishes a fair value hierarchy that prioritizes the use of inputs used in valuation techniques into three levels. A financial instrument's categorization within the fair value hierarchy is based upon the lowest level of input that is significant to the fair value measurement. There are three levels of inputs that may be used to measure fair value:
Level 1
— applies to assets or liabilities for which there are quoted prices in active markets for identical assets or liabilities.
Level 2
— applies to assets or liabilities for which there are inputs other than quoted prices included within level 1 that are observable, either directly or indirectly, for the asset or liability such as: quoted prices for similar assets or liabilities in active markets; quoted prices for identical or similar assets or liabilities in less active markets; or other inputs that can be derived principally from, or corroborated by, observable market data.
Level 3
— applies to assets or liabilities for which there are unobservable inputs to the valuation methodology that are significant to the measurement of the fair value of the assets or liabilities.
Financial Assets and Liabilities Measured at Fair Value on a Recurring Basis
Financial assets and liabilities measured at fair value on a recurring basis as of
October 31, 2017
were as follows:
|
|
|
Fair Value Measurement at
October 31, 2017 Using |
|||||||||||||
|
|
October 31,
2017 |
Quoted Prices
in Active
Markets for
Identical Assets
(Level 1)
|
Significant
Other
Observable
Inputs
(Level 2)
|
Significant
Unobservable
Inputs
(Level 3)
|
|||||||||||
|
|
(in millions)
|
||||||||||||||
|
Assets:
|
|
|
|
|
|||||||||||
|
Short-term
|
|
|
|
|
|||||||||||
|
Cash equivalents (money market funds)
|
$
|
1,659
|
|
$
|
1,659
|
|
$
|
—
|
|
$
|
—
|
|
|||
|
Derivative instruments (foreign exchange contracts)
|
4
|
|
—
|
|
4
|
|
—
|
|
|||||||
|
Long-term
|
|
|
|
|
|||||||||||
|
Trading securities
|
32
|
|
32
|
|
—
|
|
—
|
|
|||||||
|
Total assets measured at fair value
|
$
|
1,695
|
|
$
|
1,691
|
|
$
|
4
|
|
$
|
—
|
|
|||
|
Liabilities:
|
|
|
|
|
|||||||||||
|
Short-term
|
|
|
|
|
|||||||||||
|
Derivative instruments (foreign exchange contracts)
|
$
|
6
|
|
$
|
—
|
|
$
|
6
|
|
$
|
—
|
|
|||
|
Long-term
|
|
|
|
|
|||||||||||
|
Deferred compensation liability
|
32
|
|
—
|
|
32
|
|
—
|
|
|||||||
|
Total liabilities measured at fair value
|
$
|
38
|
|
$
|
—
|
|
$
|
38
|
|
$
|
—
|
|
|||
79
Financial assets and liabilities measured at fair value on a recurring basis as of
October 31, 2016
were as follows:
|
|
|
Fair Value Measurement at
October 31, 2016 Using |
|||||||||||||
|
|
October 31,
2016 |
Quoted Prices
in Active
Markets for
Identical Assets
(Level 1)
|
Significant
Other
Observable
Inputs
(Level 2)
|
Significant
Unobservable
Inputs
(Level 3)
|
|||||||||||
|
|
(in millions)
|
||||||||||||||
|
Assets:
|
|
|
|
|
|||||||||||
|
Short-term
|
|
|
|
|
|||||||||||
|
Cash equivalents (money market funds)
|
$
|
1,482
|
|
$
|
1,482
|
|
$
|
—
|
|
$
|
—
|
|
|||
|
Derivative instruments (foreign exchange contracts)
|
9
|
|
—
|
|
9
|
|
—
|
|
|||||||
|
Long-term
|
|
|
|
|
|||||||||||
|
Trading securities
|
31
|
|
31
|
|
—
|
|
—
|
|
|||||||
|
Total assets measured at fair value
|
$
|
1,522
|
|
$
|
1,513
|
|
$
|
9
|
|
$
|
—
|
|
|||
|
Liabilities:
|
|
|
|
|
|||||||||||
|
Short-term
|
|
|
|
|
|||||||||||
|
Derivative instruments (foreign exchange contracts)
|
$
|
8
|
|
$
|
—
|
|
$
|
8
|
|
$
|
—
|
|
|||
|
Long-term
|
|
|
|
|
|||||||||||
|
Deferred compensation liability
|
31
|
|
—
|
|
31
|
|
—
|
|
|||||||
|
Total liabilities measured at fair value
|
$
|
39
|
|
$
|
—
|
|
$
|
39
|
|
$
|
—
|
|
|||
Our money market funds and trading securities are generally valued using quoted market prices and therefore are classified within level 1 of the fair value hierarchy. Our derivative financial instruments are classified within level 2, as there is not an active market for each hedge contract, but the inputs used to calculate the value of the instruments are tied to active markets. Our deferred compensation liability is classified as level 2 because although the values are not directly based on quoted market prices, the inputs used in the calculations are observable.
Trading securities, which is comprised of mutual funds, bonds and other similar instruments, and deferred compensation liability are reported at fair value, with gains or losses resulting from changes in fair value recognized currently in net income. Certain derivative instruments are reported at fair value, with unrealized gains and losses, net of tax, included in accumulated other comprehensive loss within stockholders' equity. Realized gains and losses from the sale of these instruments are recorded in net income.
Assets and Liabilities Measured at Fair Value on a Non-Recurring Basis
Long-Lived Assets
For assets measured at fair value on a non-recurring basis, the following table summarizes the impairments included in net income for the years ended
October 31, 2017
,
2016
and
2015
:
|
|
Years Ended
October 31,
|
||||||||||
|
|
2017
|
2016
|
2015
|
||||||||
|
|
(in millions)
|
||||||||||
|
Long-lived assets held and used
|
$
|
—
|
|
$
|
4
|
|
$
|
3
|
|
||
|
Long-lived assets held for sale
|
$
|
—
|
|
$
|
—
|
|
$
|
—
|
|
||
For
2017
, there were
no
impairments of long-lived assets held and used. Long-lived assets held and used with a carrying amount of
$4 million
were written down to their fair value of
zero
, resulting in an impairment charge of
$4 million
, which was included in net income for
2016
. Long-lived assets held and used with a carrying amount of
$3 million
were written down to their fair value of
zero
, resulting in an impairment charge of
$3 million
, which was included in net income for
2015
. The impairment
80
charge in 2016 and 2015 of
$4 million
and
$3 million
, respectively, relates to IPR&D projects that were abandoned and written down to their fair value of zero.
There were
no
impairments of long-lived assets held for sale in
2017
,
2016
and
2015
.
Fair values for the impaired long-lived assets were measured using level 2 inputs.
12. DERIVATIVES
We are exposed to foreign currency exchange rate fluctuations and interest rate changes in the normal course of our business. As part of risk management strategy, we use derivative instruments, primarily forward contracts, purchased options, and interest rate swaps, to hedge economic and/or accounting exposures resulting from changes in foreign currency exchange rates and interest rates.
Fair Value Hedges
We are exposed to interest rate risk due to the mismatch between the interest expense we pay on our loans at fixed rates and the variable rates of interest we receive from cash, cash equivalents and other short-term investments. We have issued long-term debt in U.S. dollars at fixed interest rates based on the market conditions at the time of financing. The fair value of our fixed rate debt changes when the underlying market rates of interest change, and, in the past, we have used interest rate swaps to change our fixed interest rate payments to U.S. dollar LIBOR-based variable interest expense to match the floating interest income from our cash, cash equivalents and other short term investments. As of
October 31, 2017
, all interest rate swap contracts had either been terminated or had expired.
On August 9, 2011, we terminated
five
interest rate swap contracts related to our 2020 senior notes that represented the notional amount of
$500 million
. The gain to be amortized at
October 31, 2017
was
$11 million
. All deferred gains from terminated interest rate swaps are being amortized over the remaining life of the respective senior notes.
Cash Flow Hedges
We enter into foreign exchange contracts to hedge our forecasted operational cash flow exposures resulting from changes in foreign currency exchange rates. These foreign exchange contracts, carried at fair value, have maturities between one and twelve months. These derivative instruments are designated and qualify as cash flow hedges under the criteria prescribed in the authoritative guidance. The changes in the fair value of the effective portion of the derivative instrument are recognized in accumulated other comprehensive income. Amounts associated with cash flow hedges are reclassified to cost of sales in the consolidated statement of operations when the forecasted transaction occurs. If it becomes probable that the forecasted transaction will not occur, the hedge relationship will be de-designated and amounts accumulated in other comprehensive income will be reclassified to other income (expense) in the current period. Changes in the fair value of the ineffective portion of derivative instruments are recognized in other income (expense) in the consolidated statement of operations in the current period. We record the premium paid (time value) of an option on the date of purchase as an asset. For options designated as cash flow hedges, changes in the time value are excluded from the assessment of hedge effectiveness and are recognized in other income (expense) over the life of the option contract. For the years ended
October 31, 2017
,
2016
and
2015
, ineffectiveness and gains and losses recognized in earnings due to de-designation of cash flow hedge contracts were not significant.
In July 2012, Agilent executed treasury lock agreements for
$400 million
in connection with future interest payments to be made on our 2022 senior notes issued on September 10, 2012. We designated the treasury lock as a cash flow hedge. The treasury lock contracts were terminated on September 10, 2012 and we recognized a deferred gain in accumulated other comprehensive income which is being amortized to interest expense over the life of the 2022 senior notes. The remaining gain to be amortized related to the treasury lock agreements at
October 31, 2017
was
$2 million
.
In February 2016, Agilent executed three forward-starting pay fixed/receive variable interest rate swaps for the notional amount of
$300 million
in connection with future interest payments to be made on our 2026 senior notes issued on September 15, 2016. These derivative instruments were designated and qualified as cash flow hedges under the criteria prescribed in the authoritative guidance. The swap arrangements were terminated on September 15, 2016 with a payment of $
10 million
and we recognized this as a deferred loss in accumulated other comprehensive income which is being amortized to interest expense over the life of the 2026 senior notes. The remaining loss to be amortized related to the interest rate swap agreements at
October 31, 2017
was
$9 million
.
81
Other Hedges
Additionally, we enter into foreign exchange contracts to hedge monetary assets and liabilities that are denominated in currencies other than the functional currency of our subsidiaries. These foreign exchange contracts are carried at fair value and do not qualify for hedge accounting treatment and are not designated as hedging instruments. Changes in value of the derivative are recognized in other income (expense) in the consolidated statement of operations, in the current period, along with the offsetting foreign currency gain or loss on the underlying assets or liabilities.
Our use of derivative instruments exposes us to credit risk to the extent that the counterparties may be unable to meet the terms of the agreement. We do, however, seek to mitigate such risks by limiting our counterparties to major financial institutions which are selected based on their credit ratings and other factors. We have established policies and procedures for mitigating credit risk that include establishing counterparty credit limits, monitoring credit exposures, and continually assessing the creditworthiness of counterparties.
A number of our derivative agreements contain threshold limits to the net liability position with counterparties and are dependent on our corporate credit rating determined by the major credit rating agencies. The counterparties to the derivative instruments may request collateralization, in accordance with derivative agreements, on derivative instruments in net liability positions.
The aggregate fair value of all derivative instruments with credit-risk-related contingent features that were in a net liability position as of
October 31, 2017
, was
$4 million
. The credit-risk-related contingent features underlying these agreements had not been triggered as of
October 31, 2017
.
There were
71
foreign exchange forward contracts open as of
October 31, 2017
and designated as cash flow hedges. There were
143
foreign exchange forward contracts open as of
October 31, 2017
not designated as hedging instruments. The aggregated notional amounts by currency and designation as of
October 31, 2017
were as follows:
|
|
Derivatives Designated as
Cash Flow Hedges |
Derivatives
Not
Designated
as Hedging
Instruments
|
||||||
|
|
Forward
Contracts USD |
Forward
Contracts USD |
||||||
|
Currency
|
Buy/(Sell)
|
Buy/(Sell)
|
||||||
|
|
(in millions)
|
|||||||
|
Euro
|
$
|
(73
|
)
|
$
|
85
|
|
||
|
British Pound
|
(42
|
)
|
12
|
|
||||
|
Canadian Dollar
|
(28
|
)
|
4
|
|
||||
|
Australian Dollars
|
4
|
|
16
|
|
||||
|
Malaysian Ringgit
|
—
|
|
(3
|
)
|
||||
|
Japanese Yen
|
(55
|
)
|
5
|
|
||||
|
Danish Krone
|
—
|
|
17
|
|
||||
|
Korean Won
|
(38
|
)
|
—
|
|
||||
|
Singapore Dollar
|
11
|
|
—
|
|
||||
|
Swiss Franc
|
—
|
|
34
|
|
||||
|
Other
|
—
|
|
(20
|
)
|
||||
|
$
|
(221
|
)
|
$
|
150
|
|
|||
82
Derivative instruments are subject to master netting arrangements and are disclosed gross in the balance sheet in accordance with the authoritative guidance. The gross fair values and balance sheet location of derivative instruments held in the consolidated balance sheet as of
October 31, 2017
and
2016
were as follows:
|
Fair Values of Derivative Instruments
|
||||||||||||||||||
|
Asset Derivatives
|
Liability Derivatives
|
|||||||||||||||||
|
|
Fair Value
|
|
Fair Value
|
|||||||||||||||
|
Balance Sheet Location
|
October 31,
2017 |
October 31,
2016 |
Balance Sheet Location
|
October 31,
2017 |
October 31,
2016 |
|||||||||||||
|
(in millions)
|
||||||||||||||||||
|
Derivatives designated as hedging instruments:
|
|
|
|
|
|
|||||||||||||
|
Cash flow hedges
|
|
|
|
|
|
|||||||||||||
|
Foreign exchange contracts
|
|
|
|
|
|
|||||||||||||
|
Other current assets
|
$
|
2
|
|
$
|
5
|
|
Other accrued liabilities
|
$
|
2
|
|
$
|
3
|
|
|||||
|
$
|
2
|
|
$
|
5
|
|
|
$
|
2
|
|
$
|
3
|
|
||||||
|
Derivatives not designated as hedging instruments:
|
|
|
|
|
|
|||||||||||||
|
Foreign exchange contracts
|
|
|
|
|
|
|||||||||||||
|
Other current assets
|
$
|
2
|
|
$
|
4
|
|
Other accrued liabilities
|
$
|
4
|
|
$
|
5
|
|
|||||
|
Total derivatives
|
$
|
4
|
|
$
|
9
|
|
|
$
|
6
|
|
$
|
8
|
|
|||||
The effect of derivative instruments for foreign exchange contracts designated as hedging instruments and not designated as hedging instruments in our consolidated statement of operations were as follows:
|
2017
|
2016
|
2015
|
|||||||||
|
|
(in millions)
|
||||||||||
|
Derivatives designated as hedging instruments:
|
|
|
|
||||||||
|
Cash Flow Hedges
|
|
|
|
||||||||
|
Loss on interest rate swaps recognized in other comprehensive income (loss)
|
$
|
—
|
|
$
|
(9
|
)
|
$
|
—
|
|
||
|
Gain (loss) recognized in accumulated other comprehensive income (loss)
|
$
|
—
|
|
$
|
(1
|
)
|
$
|
11
|
|
||
|
Gain (loss) reclassified from accumulated other comprehensive income (loss) into cost of sales
|
$
|
1
|
|
$
|
(3
|
)
|
$
|
18
|
|
||
|
Derivatives not designated as hedging instruments:
|
|
|
|
||||||||
|
Gain (loss) recognized in other income (expense), net within continuing operations
|
$
|
5
|
|
$
|
1
|
|
$
|
(21
|
)
|
||
At
October 31, 2017
the amount expected to be reclassified from accumulated other comprehensive income to cost of sales within the next twelve months is not significant.
13. RETIREMENT PLANS AND POST RETIREMENT PENSION PLANS
General.
Substantially all of our employees are covered under various defined benefit and/or defined contribution retirement plans. Additionally, we sponsor post-retirement health care benefits for our eligible U.S. employees.
Agilent provides U.S. employees, who meet eligibility criteria under the Agilent Technologies, Inc. Retirement Plan (the "RP"), defined benefits which are based on an employee's base or target pay during the years of employment and on length of service. For eligible service through October 31, 1993, the benefit payable under the Agilent Retirement Plans is reduced by any amounts due to the eligible employee under the Agilent defined contribution Deferred Profit-Sharing Plan (the "DPSP"), which was closed to new participants as of November 1993. Effective November 1, 2014, Agilent’s U.S. defined benefit retirement plan is closed to new entrants including new employees, new transfers to the U.S. payroll and rehires. As of April 30, 2016, benefits under the RP were frozen. See Plan Amendments below.
As of
October 31, 2017
and
2016
, the fair value of plan assets of the DPSP was
$156 million
and
$157 million
, respectively. Note that the projected benefit obligation for the DPSP equals the fair value of plan assets.
83
In addition to the DPSP, in the U.S., Agilent maintains a Supplemental Benefits Retirement Plan ("SBRP"), supplemental unfunded non-qualified defined benefit plan to provide benefits that would be provided under the RP but for limitations imposed by the Internal Revenue Code. The RP and the SBRP comprise the "U.S. Plans" in the tables below.
Eligible employees outside the U.S. generally receive retirement benefits under various retirement plans based upon factors such as years of service and/or employee compensation levels. Eligibility is generally determined in accordance with local statutory requirements.
401(k) Defined Contribution Plan
. Eligible Agilent U.S. employees may participate in the Agilent Technologies, Inc. 401(k) Plan. Effective April 30, 2016, we began matching contributions to employees up to a maximum of
6 percent
of an employee's annual eligible compensation. Effective May 1, 2016 until April 30, 2022, we will provide an additional transitional company contribution for certain eligible employees equal to
3 percent
,
4 percent
or
5 percent
of an employee's annual eligible compensation due to the RP benefits being frozen. The maximum contribution to the 401(k) Plan is
50 percent
of an employee's annual eligible compensation, subject to regulatory limitations. The 401(k) Plan employer expense included in income from operations was
$33 million
in 2017,
$24 million
in 2016 and
$14 million
in 2015.
Post-Retirement Medical Benefit Plans.
In addition to receiving retirement benefits, Agilent U.S. employees who meet eligibility requirements as of their termination date may participate in the Agilent Technologies, Inc. Health Plan for Retirees. Eligible retirees who were less than age 50 as of January 1, 2005 and who retire after age 55 with 15 or more years of service are eligible for a fixed amount which can be utilized to pay for either sponsored plans and/or individual medicare plans. Effective January 1, 2012, employees who were at least age 50 as of January 1, 2005 and who retire after age 55 with 15 or more years of service are eligible for fixed dollar subsidies and stipends. Grandfathered retirees receive a fixed monthly subsidy toward pre-65 premium costs (subsidy capped at 2011 levels) and a fixed monthly stipend post-65. The subsidy amounts will not increase. In addition, any new employee hired on or after November 1, 2014, will not be eligible to participate in the retiree medical plans upon retiring. Current eligible employees will continue to participate in the retiree medical program in place as of November 1, 2014. Retirees will maintain the retiree medical benefits they are eligible for as of November 1, 2014. As of April 30, 2016, benefits under this plan were changed - see Plan Amendments below.
Plan Amendments.
In 2016, we made changes to our U.S. Retirement Plan and Supplemental Benefits Retirement Plan ("U.S. Plans"). Effective April 30, 2016, benefit accruals under the U.S. Plans were frozen. Any pension benefit earned in the U.S. Plans through April 30, 2016 remained fully vested, and there were no additional benefit accruals after April 30, 2016. In addition, active employees who have not met the eligibility requirement for the Retiree Medical Account (RMA) under the U.S. Post Retirement Benefit Plan - 55 years old with at least 15 years of Agilent service - as of April 30, 2016 - will only be eligible for 50 percent of the current RMA reimbursement amount upon retirement.
Due to these plan amendments, we recorded a curtailment gain of
$15 million
in the U.S. Plans during the year ended October 31, 2016. In addition, we recognized a settlement gain of
$1 million
related to the U.S. Supplemental Benefits Retirement Plan during the year ended October 31, 2016.
Japanese Welfare Pension Insurance Law
. In Japan, Agilent has employees' pension fund plans, which are defined benefit pension plans established under the Japanese Welfare Pension Insurance Law (JWPIL). The plans are composed of (a) a substitutional portion based on the pay-related part of the old-age pension benefits prescribed by JWPIL (similar to social security benefits in the United States) and (b) a corporate portion based on a contributory defined benefit pension arrangement established at the discretion of the company.
During the year ended October
31, 2017
,
Agilent received government approval and returned the substitutional portion of Japan's pension plan to the Japanese government, as allowed by the JWPIL. The initial transfer resulted in a net gain of
$32 million
recorded within cost of sales and operating expenses in the consolidated statement of operations. The net gain consisted of two parts - a gain of
$41 million
, representing the difference between the fair values of the Accumulated Benefit Obligation (ABO) settled of
$65 million
and the assets transferred from the pension trust to the government of Japan of
$24 million
, offset by a settlement loss of
$9 million
related to the recognition of previously unrecognized actuarial losses included in accumulated other comprehensive income. In December 2017, after the Japanese government’s final review of our initial payment, we received a
$5.2 million
refund. We will record a settlement gain related to the refund in fiscal 2018.
84
Components of Net periodic cost.
The company uses alternate methods of amortization as allowed by the authoritative guidance which amortizes the actuarial gains and losses on a consistent basis for the years presented. For U.S. Plans, gains and losses are amortized over the average future lifetime of participants using the corridor method. For most Non-U.S. Plans and U.S. Post-Retirement Benefit Plans, gains and losses are amortized using a separate layer for each year's gains and losses. For the years ended
October 31, 2017
,
2016
and
2015
, components of net periodic benefit cost and other amounts recognized in other comprehensive income were comprised of:
|
|
Pensions
|
U.S. Post-Retirement Benefit Plans
|
|||||||||||||||||||||||||||||||||
|
|
U.S. Plans
|
Non-U.S. Plans
|
|||||||||||||||||||||||||||||||||
|
|
2017
|
2016
|
2015
|
2017
|
2016
|
2015
|
2017
|
2016
|
2015
|
||||||||||||||||||||||||||
|
|
(in millions)
|
||||||||||||||||||||||||||||||||||
|
Net periodic benefit cost (benefit)
|
|
|
|
|
|
|
|
|
|
||||||||||||||||||||||||||
|
Service cost — benefits earned during the period
|
$
|
—
|
|
$
|
12
|
|
$
|
25
|
|
$
|
19
|
|
$
|
19
|
|
$
|
18
|
|
$
|
1
|
|
$
|
1
|
|
$
|
2
|
|
||||||||
|
Interest cost on benefit obligation
|
15
|
|
16
|
|
14
|
|
12
|
|
16
|
|
23
|
|
3
|
|
4
|
|
4
|
|
|||||||||||||||||
|
Expected return on plan assets
|
(25
|
)
|
(25
|
)
|
(27
|
)
|
(41
|
)
|
(44
|
)
|
(42
|
)
|
(7
|
)
|
(7
|
)
|
(8
|
)
|
|||||||||||||||||
|
Amortization of net actuarial loss
|
3
|
|
3
|
|
3
|
|
36
|
|
27
|
|
25
|
|
11
|
|
10
|
|
6
|
|
|||||||||||||||||
|
Amortization of prior service benefit
|
—
|
|
(3
|
)
|
(5
|
)
|
—
|
|
—
|
|
—
|
|
(9
|
)
|
(10
|
)
|
(12
|
)
|
|||||||||||||||||
|
Total periodic benefit cost (benefit)
|
$
|
(7
|
)
|
$
|
3
|
|
$
|
10
|
|
$
|
26
|
|
$
|
18
|
|
$
|
24
|
|
$
|
(1
|
)
|
$
|
(2
|
)
|
$
|
(8
|
)
|
||||||||
|
Curtailments and settlements
|
$
|
—
|
|
$
|
(16
|
)
|
$
|
—
|
|
$
|
(32
|
)
|
$
|
—
|
|
$
|
—
|
|
$
|
—
|
|
$
|
—
|
|
$
|
—
|
|
||||||||
|
Other changes in plan assets and benefit obligations recognized in other comprehensive (income) loss
|
|
|
|
|
|
|
|
|
|
||||||||||||||||||||||||||
|
Net actuarial (gain) loss
|
$
|
(19
|
)
|
$
|
22
|
|
$
|
44
|
|
$
|
(128
|
)
|
$
|
149
|
|
$
|
32
|
|
$
|
(9
|
)
|
$
|
3
|
|
$
|
16
|
|
||||||||
|
Amortization of net actuarial loss
|
(3
|
)
|
(3
|
)
|
(3
|
)
|
(36
|
)
|
(27
|
)
|
(25
|
)
|
(11
|
)
|
(10
|
)
|
(6
|
)
|
|||||||||||||||||
|
Prior service cost (benefit)
|
—
|
|
15
|
|
—
|
|
—
|
|
—
|
|
—
|
|
9
|
|
(7
|
)
|
—
|
|
|||||||||||||||||
|
Amortization of prior service benefit
|
—
|
|
3
|
|
5
|
|
—
|
|
—
|
|
—
|
|
—
|
|
10
|
|
12
|
|
|||||||||||||||||
|
Gain due to settlement
|
—
|
|
—
|
|
—
|
|
32
|
|
—
|
|
—
|
|
—
|
|
—
|
|
—
|
|
|||||||||||||||||
|
Foreign currency
|
—
|
|
—
|
|
—
|
|
2
|
|
(3
|
)
|
10
|
|
—
|
|
—
|
|
—
|
|
|||||||||||||||||
|
Total recognized in other comprehensive (income) loss
|
$
|
(22
|
)
|
$
|
37
|
|
$
|
46
|
|
$
|
(130
|
)
|
$
|
119
|
|
$
|
17
|
|
$
|
(11
|
)
|
$
|
(4
|
)
|
$
|
22
|
|
||||||||
|
Total recognized in net periodic benefit cost (benefit) and other comprehensive (income) loss
|
$
|
(29
|
)
|
$
|
24
|
|
$
|
56
|
|
$
|
(136
|
)
|
$
|
137
|
|
$
|
41
|
|
$
|
(12
|
)
|
$
|
(6
|
)
|
$
|
14
|
|
||||||||
85
Funded Status.
As of
October 31, 2017
and
2016
, the funded status of the defined benefit and post-retirement benefit plans was:
|
|
U.S. Defined
Benefit Plans
|
Non-U.S. Defined
Benefit Plans
|
U.S.
Post-Retirement
Benefit Plans
|
||||||||||||||||||||
|
|
2017
|
2016
|
2017
|
2016
|
2017
|
2016
|
|||||||||||||||||
|
|
(in millions)
|
||||||||||||||||||||||
|
Change in fair value of plan assets:
|
|
|
|
|
|
|
|||||||||||||||||
|
Fair value — beginning of year
|
$
|
341
|
|
$
|
347
|
|
$
|
774
|
|
$
|
778
|
|
$
|
88
|
|
$
|
91
|
|
|||||
|
Actual return on plan assets
|
66
|
|
13
|
|
81
|
|
25
|
|
14
|
|
3
|
|
|||||||||||
|
Employer contributions
|
25
|
|
—
|
|
21
|
|
24
|
|
—
|
|
—
|
|
|||||||||||
|
Participants' contributions
|
—
|
|
—
|
|
—
|
|
1
|
|
—
|
|
—
|
|
|||||||||||
|
Benefits paid
|
(18
|
)
|
(19
|
)
|
(23
|
)
|
(27
|
)
|
(7
|
)
|
(6
|
)
|
|||||||||||
|
Settlements
|
—
|
|
—
|
|
(26
|
)
|
—
|
|
—
|
|
—
|
|
|||||||||||
|
Currency impact
|
—
|
|
—
|
|
28
|
|
(27
|
)
|
—
|
|
—
|
|
|||||||||||
|
Fair value — end of year
|
$
|
414
|
|
$
|
341
|
|
$
|
855
|
|
$
|
774
|
|
$
|
95
|
|
$
|
88
|
|
|||||
|
Change in benefit obligation:
|
|
|
|
|
|
|
|||||||||||||||||
|
Benefit obligation — beginning of year
|
$
|
434
|
|
$
|
415
|
|
$
|
1,002
|
|
$
|
900
|
|
$
|
103
|
|
$
|
112
|
|
|||||
|
Service cost
|
—
|
|
12
|
|
19
|
|
19
|
|
1
|
|
1
|
|
|||||||||||
|
Interest cost
|
15
|
|
16
|
|
12
|
|
16
|
|
3
|
|
4
|
|
|||||||||||
|
Participants' contributions
|
—
|
|
—
|
|
—
|
|
1
|
|
—
|
|
—
|
|
|||||||||||
|
Plan amendment
|
—
|
|
—
|
|
(1
|
)
|
—
|
|
—
|
|
(7
|
)
|
|||||||||||
|
Actuarial (gain) loss
|
15
|
|
41
|
|
(43
|
)
|
130
|
|
(3
|
)
|
(1
|
)
|
|||||||||||
|
Benefits paid
|
(19
|
)
|
(20
|
)
|
(22
|
)
|
(27
|
)
|
(7
|
)
|
(6
|
)
|
|||||||||||
|
Curtailments
|
—
|
|
(30
|
)
|
—
|
|
—
|
|
—
|
|
—
|
|
|||||||||||
|
Settlements
|
—
|
|
—
|
|
(70
|
)
|
—
|
|
—
|
|
—
|
|
|||||||||||
|
Currency impact
|
—
|
|
—
|
|
38
|
|
(37
|
)
|
—
|
|
—
|
|
|||||||||||
|
Benefit obligation — end of year
|
$
|
445
|
|
$
|
434
|
|
$
|
935
|
|
$
|
1,002
|
|
$
|
97
|
|
$
|
103
|
|
|||||
|
Overfunded (underfunded) status of PBO
|
$
|
(31
|
)
|
$
|
(93
|
)
|
$
|
(80
|
)
|
$
|
(228
|
)
|
$
|
(2
|
)
|
$
|
(15
|
)
|
|||||
|
Amounts recognized in the consolidated balance sheet consist of:
|
|
|
|
|
|
|
|||||||||||||||||
|
Other assets
|
$
|
—
|
|
$
|
—
|
|
$
|
86
|
|
$
|
1
|
|
$
|
—
|
|
$
|
—
|
|
|||||
|
Employee compensation and benefits
|
(1
|
)
|
(1
|
)
|
—
|
|
—
|
|
—
|
|
—
|
|
|||||||||||
|
Retirement and post-retirement benefits
|
(30
|
)
|
(92
|
)
|
(166
|
)
|
(229
|
)
|
(2
|
)
|
(15
|
)
|
|||||||||||
|
Total net asset (liability)
|
$
|
(31
|
)
|
$
|
(93
|
)
|
$
|
(80
|
)
|
$
|
(228
|
)
|
$
|
(2
|
)
|
$
|
(15
|
)
|
|||||
|
Amounts Recognized in Accumulated Other Comprehensive Income (loss):
|
|||||||||||||||||||||||
|
Actuarial (gains) losses
|
$
|
65
|
|
$
|
93
|
|
$
|
243
|
|
$
|
375
|
|
$
|
20
|
|
$
|
41
|
|
|||||
|
Prior service costs (benefits)
|
—
|
|
—
|
|
(1
|
)
|
—
|
|
(28
|
)
|
(37
|
)
|
|||||||||||
|
Total
|
$
|
65
|
|
$
|
93
|
|
$
|
242
|
|
$
|
375
|
|
$
|
(8
|
)
|
$
|
4
|
|
|||||
The amounts in accumulated other comprehensive income expected to be recognized by Agilent as components of net expense during
2018
are as follows:
|
U.S. Defined
Benefit Plans
|
Non-U.S. Defined
Benefit Plans
|
U.S. Post-Retirement
Benefit Plans
|
|||||||||
|
|
(in millions)
|
||||||||||
|
Amortization of net prior service cost (benefit)
|
$
|
—
|
|
$
|
—
|
|
$
|
(8
|
)
|
||
|
Amortization of actuarial net loss (gain)
|
$
|
1
|
|
$
|
29
|
|
$
|
8
|
|
||
86
Investment Policies and Strategies as of
October 31, 2017
and
2016
.
In the U.S., target asset allocations for our retirement and post-retirement benefit plans are approximately
80 percent
to equities and approximately
20 percent
to fixed income investments. Our DPSP target asset allocation is approximately
60 percent
to equities and approximately
40 percent
to fixed income investments. Approximately,
5 percent
of our U.S. equity portfolio consists of limited partnerships. The general investment objective for all our plan assets is to obtain the optimum rate of investment return on the total investment portfolio consistent with the assumption of a reasonable level of risk. Specific investment objectives for the plans' portfolios are to: maintain and enhance the purchasing power of the plans' assets; achieve investment returns consistent with the level of risk being taken; and earn performance rates of return in accordance with the benchmarks adopted for each asset class. Outside the U.S., our target asset allocation is from
37
to
60 percent
to equities, from
37
to
60 percent
to fixed income investments, and from
zero
to
25 percent
to real estate investments and from
zero
to
7 percent
to cash, depending on the plan. All plans' assets are broadly diversified. Due to fluctuations in equity markets, our actual allocations of plan assets at
October 31, 2017
and
2016
differ from the target allocation. Our policy is to bring the actual allocation in line with the target allocation.
Equity securities include exchange-traded common stock and preferred stock of companies from broadly diversified industries. Fixed income securities include a global portfolio of corporate bonds of companies from diversified industries, government securities, mortgage-backed securities, asset-backed securities, derivative instruments and other. Other investments include a group trust consisting primarily of private equity partnerships. Portions of the cash and cash equivalent, equity, and fixed income investments are held in commingled funds that are valued using Net Asset Value (“NAV”) as the practical expedient. In addition, some of the investments valued using NAV as the practical expedient may have limits on their redemption to weekly or monthly and/or may require prior written notice specified by each fund.
Fair Value.
The measurement of the fair value of pension and post-retirement plan assets uses the valuation methodologies and the inputs as described in Note 11, "Fair Value Measurements".
Cash and Cash Equivalents - Cash and cash equivalents consist of short-term investment funds. The funds also invest in short-term domestic fixed income securities and other securities with debt-like characteristics emphasizing short-term maturities and quality. Some of our cash and cash equivalents are held in commingled funds. Other cash and cash equivalents are classified as Level 1 investments.
Equity - Some equity securities consisting of common and preferred stock that are not traded on an active market are valued at quoted prices reported by investment dealers based on the underlying terms of the security and comparison to similar securities traded on an active market; these are classified as Level 2 investments. Securities which have quoted prices in active markets are classified as Level 1 investments.
Fixed Income - Some of the fixed income securities are not actively traded and are valued at quoted prices based on the terms of the security and comparison to similar securities traded on an active market; these are classified as Level 2 investments. Securities which have quoted prices in active markets are classified as Level 1 investments.
Other Investments - Other investments also includes partnership investments where, due to their private nature, pricing inputs are not readily observable. Asset valuations are developed by the general partners that manage the partnerships. These valuations are based on proprietary appraisals, application of public market multiples to private company cash flows, utilization of market transactions that provide valuation information for comparable companies and other methods. Holdings of limited partnerships are classified as Level 3.
Agilent has adopted new accounting guidance related to the presentation of certain investments using the NAV practical expedient. The accounting guidance exempts investments using this practical expedient from categorization within the fair value hierarchy. Agilent applied the adoption of this standard retrospectively and removed certain investments from the fair value hierarchy in both periods.
87
The following tables present the fair value of U.S. Defined Benefit Plans assets classified under the appropriate level of the fair value hierarchy as of
October 31, 2017
and
2016
.
|
|
|
Fair Value Measurement
at October 31, 2017 Using |
|||||||||||||||||
|
|
October 31,
2017 |
Quoted Prices
in Active
Markets for
Identical Assets
(Level 1)
|
Significant
Other
Observable
Inputs
(Level 2)
|
Significant
Unobservable
Inputs
(Level 3)
|
Not Subject to Leveling
(1)
|
||||||||||||||
|
|
(in millions)
|
||||||||||||||||||
|
Cash and Cash Equivalents
|
$
|
4
|
|
$
|
1
|
|
$
|
—
|
|
$
|
—
|
|
$
|
3
|
|
||||
|
Equity
|
327
|
|
88
|
|
—
|
|
—
|
|
239
|
|
|||||||||
|
Fixed Income
|
76
|
|
38
|
|
—
|
|
—
|
|
38
|
|
|||||||||
|
Other Investments
|
7
|
|
—
|
|
—
|
|
7
|
|
—
|
|
|||||||||
|
Total assets measured at fair value
|
$
|
414
|
|
$
|
127
|
|
$
|
—
|
|
$
|
7
|
|
$
|
280
|
|
||||
(1) Investments measured at the net asset value per share (or its equivalent) practical expedient have not been classified in the fair value hierarchy.
|
|
|
Fair Value Measurement
at October 31, 2016 Using |
|||||||||||||||||
|
|
October 31,
2016 |
Quoted Prices
in Active
Markets for
Identical Assets
(Level 1)
|
Significant
Other
Observable
Inputs
(Level 2)
|
Significant
Unobservable
Inputs
(Level 3)
|
Not Subject to Leveling
(1)
|
||||||||||||||
|
|
(in millions)
|
||||||||||||||||||
|
Cash and Cash Equivalents
|
$
|
4
|
|
$
|
—
|
|
$
|
—
|
|
$
|
—
|
|
$
|
4
|
|
||||
|
Equity
|
248
|
|
62
|
|
—
|
|
—
|
|
186
|
|
|||||||||
|
Fixed Income
|
80
|
|
42
|
|
—
|
|
—
|
|
38
|
|
|||||||||
|
Other Investments
|
9
|
|
—
|
|
—
|
|
9
|
|
—
|
|
|||||||||
|
Total assets measured at fair value
|
$
|
341
|
|
$
|
104
|
|
$
|
—
|
|
$
|
9
|
|
$
|
228
|
|
||||
(1) Investments measured at the net asset value per share (or its equivalent) practical expedient have not been classified in the fair value hierarchy.
For U.S. Defined Benefit Plans assets measured at fair value using significant unobservable inputs (level 3), the following table summarizes the change in balances during
2017
and
2016
:
|
|
Years Ended
October 31.
|
||||||
|
|
2017
|
2016
|
|||||
|
Balance, beginning of year
|
$
|
9
|
|
$
|
9
|
|
|
|
Realized gains/(losses)
|
(3
|
)
|
—
|
|
|||
|
Unrealized gains/(losses)
|
3
|
|
3
|
|
|||
|
Purchases, sales, issuances, and settlements
|
(2
|
)
|
(3
|
)
|
|||
|
Transfers in (out)
|
—
|
|
—
|
|
|||
|
Balance, end of year
|
$
|
7
|
|
$
|
9
|
|
|
88
The following tables present the fair value of U.S. Post-Retirement Benefit Plans assets classified under the appropriate level of the fair value hierarchy as of
October 31, 2017
and
2016
.
|
|
|
Fair Value Measurement at
October 31, 2017 Using |
|||||||||||||||||
|
|
October 31,
2017 |
Quoted Prices
in Active
Markets for
Identical Assets
(Level 1)
|
Significant
Other
Observable
Inputs
(Level 2)
|
Significant
Unobservable
Inputs
(Level 3)
|
Not Subject to Leveling
(1)
|
||||||||||||||
|
|
(in millions)
|
||||||||||||||||||
|
Cash and Cash Equivalents
|
$
|
6
|
|
$
|
5
|
|
$
|
—
|
|
$
|
—
|
|
$
|
1
|
|
||||
|
Equity
|
68
|
|
18
|
|
—
|
|
—
|
|
50
|
|
|||||||||
|
Fixed Income
|
17
|
|
9
|
|
—
|
|
—
|
|
8
|
|
|||||||||
|
Other Investments
|
4
|
|
—
|
|
—
|
|
4
|
|
—
|
|
|||||||||
|
Total assets measured at fair value
|
$
|
95
|
|
$
|
32
|
|
$
|
—
|
|
$
|
4
|
|
$
|
59
|
|
||||
(1) Investments measured at the net asset value per share (or its equivalent) practical expedient have not been classified in the fair value hierarchy.
|
|
|
Fair Value Measurement
at October 31, 2016 Using |
|||||||||||||||||
|
|
October 31,
2016 |
Quoted Prices
in Active
Markets for
Identical Assets
(Level 1)
|
Significant
Other
Observable
Inputs
(Level 2)
|
Significant
Unobservable
Inputs
(Level 3)
|
Not Subject to Leveling
(1)
|
||||||||||||||
|
|
(in millions)
|
||||||||||||||||||
|
Cash and Cash Equivalents
|
$
|
3
|
|
$
|
2
|
|
$
|
—
|
|
$
|
—
|
|
$
|
1
|
|
||||
|
Equity
|
59
|
|
15
|
|
—
|
|
—
|
|
44
|
|
|||||||||
|
Fixed Income
|
21
|
|
11
|
|
—
|
|
—
|
|
10
|
|
|||||||||
|
Other Investments
|
5
|
|
—
|
|
—
|
|
5
|
|
—
|
|
|||||||||
|
Total assets measured at fair value
|
$
|
88
|
|
$
|
28
|
|
$
|
—
|
|
$
|
5
|
|
$
|
55
|
|
||||
(1) Investments measured at the net asset value per share (or its equivalent) practical expedient have not been classified in the fair value hierarchy.
For U.S. Post-Retirement Benefit Plans assets measured at fair value using significant unobservable inputs (level 3), the following table summarizes the change in balances during
2017
and
2016
:
|
|
Years Ended
October 31,
|
||||||
|
|
2017
|
2016
|
|||||
|
Balance, beginning of year
|
$
|
5
|
|
$
|
6
|
|
|
|
Realized gains/(losses)
|
(2
|
)
|
—
|
|
|||
|
Unrealized gains/(losses)
|
2
|
|
1
|
|
|||
|
Purchases, sales, issuances, and settlements
|
(1
|
)
|
(2
|
)
|
|||
|
Transfers in (out)
|
—
|
|
—
|
|
|||
|
Balance, end of year
|
$
|
4
|
|
$
|
5
|
|
|
89
The following tables present the fair value of non-U.S. Defined Benefit Plans assets classified under the appropriate level of the fair value hierarchy as of
October 31, 2017
and
2016
:
|
|
|
Fair Value Measurement at
October 31, 2017 Using |
|||||||||||||||||
|
|
October 31,
2017 |
Quoted Prices
in Active
Markets for
Identical Assets
(Level 1)
|
Significant
Other
Observable
Inputs
(Level 2)
|
Significant
Unobservable
Inputs
(Level 3)
|
Not Subject to Leveling
(1)
|
||||||||||||||
|
|
(in millions)
|
||||||||||||||||||
|
Cash and Cash Equivalents
|
$
|
8
|
|
$
|
—
|
|
$
|
8
|
|
$
|
—
|
|
$
|
—
|
|
||||
|
Equity
|
539
|
|
326
|
|
28
|
|
—
|
|
185
|
|
|||||||||
|
Fixed Income
|
307
|
|
60
|
|
229
|
|
—
|
|
18
|
|
|||||||||
|
Other Investments
|
1
|
|
—
|
|
1
|
|
—
|
|
—
|
|
|||||||||
|
Total assets measured at fair value
|
$
|
855
|
|
$
|
386
|
|
$
|
266
|
|
$
|
—
|
|
$
|
203
|
|
||||
(1) Investments measured at the net asset value per share (or its equivalent) practical expedient have not been classified in the fair value hierarchy.
|
|
|
Fair Value Measurement
at October 31, 2016 Using |
|||||||||||||||||
|
|
October 31,
2016 |
Quoted Prices
in Active
Markets for
Identical Assets
(Level 1)
|
Significant
Other
Observable
Inputs
(Level 2)
|
Significant
Unobservable
Inputs
(Level 3)
|
Not Subject to Leveling
(1)
|
||||||||||||||
|
|
(in millions)
|
||||||||||||||||||
|
Cash and Cash Equivalents
|
$
|
26
|
|
$
|
18
|
|
$
|
8
|
|
$
|
—
|
|
$
|
—
|
|
||||
|
Equity
|
422
|
|
239
|
|
23
|
|
—
|
|
160
|
|
|||||||||
|
Fixed Income
|
325
|
|
83
|
|
222
|
|
—
|
|
20
|
|
|||||||||
|
Other Investments
|
1
|
|
—
|
|
1
|
|
—
|
|
—
|
|
|||||||||
|
Total assets measured at fair value
|
$
|
774
|
|
$
|
340
|
|
$
|
254
|
|
$
|
—
|
|
$
|
180
|
|
||||
(1) Investments measured at the net asset value per share (or its equivalent) practical expedient have not been classified in the fair value hierarchy.
90
The table below presents the combined projected benefit obligation ("PBO"), accumulated benefit obligation ("ABO") and fair value of plan assets, grouping plans using comparisons of the PBO and ABO relative to the plan assets as of
October 31, 2017
or
2016
.
|
|
2017
|
2016
|
|||||||||||||
|
|
Benefit
Obligation
|
|
Benefit
Obligation
|
|
|||||||||||
|
|
Fair Value of
Plan Assets
|
Fair Value of
Plan Assets
|
|||||||||||||
|
|
PBO
|
PBO
|
|||||||||||||
|
|
(in millions)
|
||||||||||||||
|
U.S. defined benefit plans where PBO exceeds the fair value of plan assets
|
$
|
445
|
|
$
|
414
|
|
$
|
434
|
|
$
|
341
|
|
|||
|
U.S. defined benefit plans where fair value of plan assets exceeds PBO
|
—
|
|
—
|
|
—
|
|
—
|
|
|||||||
|
Total
|
$
|
445
|
|
$
|
414
|
|
$
|
434
|
|
$
|
341
|
|
|||
|
Non-U.S. defined benefit plans where PBO exceeds or is equal to the fair value of plan assets
|
$
|
563
|
|
$
|
397
|
|
$
|
970
|
|
$
|
741
|
|
|||
|
Non-U.S. defined benefit plans where fair value of plan assets exceeds PBO
|
372
|
|
458
|
|
32
|
|
33
|
|
|||||||
|
Total
|
$
|
935
|
|
$
|
855
|
|
$
|
1,002
|
|
$
|
774
|
|
|||
|
|
ABO
|
|
ABO
|
|
|||||||||||
|
U.S. defined benefit plans where ABO exceeds the fair value of plan assets
|
$
|
445
|
|
$
|
414
|
|
$
|
434
|
|
$
|
341
|
|
|||
|
U.S. defined benefit plans where the fair value of plan assets exceeds ABO
|
—
|
|
—
|
|
—
|
|
—
|
|
|||||||
|
Total
|
$
|
445
|
|
$
|
414
|
|
$
|
434
|
|
$
|
341
|
|
|||
|
Non-U.S. defined benefit plans where ABO exceeds or is equal to the fair value of plan assets
|
$
|
539
|
|
$
|
397
|
|
$
|
737
|
|
$
|
542
|
|
|||
|
Non-U.S. defined benefit plans where fair value of plan assets exceeds ABO
|
365
|
|
458
|
|
226
|
|
232
|
|
|||||||
|
Total
|
$
|
904
|
|
$
|
855
|
|
$
|
963
|
|
$
|
774
|
|
|||
Contributions and Estimated Future Benefit Payments.
During fiscal year
2018
, we do not expect to contribute to the U.S. defined benefit plans nor to the Post-Retirement Medical Plans and we expect to contribute
$22 million
to plans outside the U.S. The following table presents expected future benefit payments for the next 10 years:
|
U.S. Defined
Benefit Plans
|
Non-U.S. Defined
Benefit Plans
|
U.S. Post-Retirement
Benefit Plans
|
|||||||||
|
|
(in millions)
|
||||||||||
|
2018
|
$
|
29
|
|
$
|
23
|
|
$
|
8
|
|
||
|
2019
|
$
|
28
|
|
$
|
25
|
|
$
|
8
|
|
||
|
2020
|
$
|
31
|
|
$
|
26
|
|
$
|
8
|
|
||
|
2021
|
$
|
29
|
|
$
|
29
|
|
$
|
7
|
|
||
|
2022
|
$
|
30
|
|
$
|
32
|
|
$
|
7
|
|
||
|
2023 - 2027
|
$
|
145
|
|
$
|
176
|
|
$
|
34
|
|
||
Assumptions.
The assumptions used to determine the benefit obligations and expense for our defined benefit and post-retirement benefit plans are presented in the tables below. The expected long-term return on assets below represents an estimate of long-term returns on investment portfolios consisting of a mixture of equities, fixed income and alternative investments in proportion to the asset allocations of each of our plans. We consider long-term rates of return, which are weighted based on the asset classes (both historical and forecasted) in which we expect our pension and post-retirement funds to be invested. Discount rates reflect the current rate at which pension and post-retirement obligations could be settled based on the measurement dates of the plans - October 31. The U.S. discount rates at
October 31, 2017
and
2016
, were determined based on the results of matching expected plan benefit payments with cash flows from a hypothetically constructed bond portfolio. The non-U.S. rates were generally
91
based on published rates for high-quality corporate bonds. The range of assumptions that were used for the non-U.S. defined benefit plans reflects the different economic environments within various countries.
Assumptions used to calculate the net periodic cost in each year were as follows:
|
|
For years ended October 31,
|
||||
|
|
2017
|
2016
|
2015
|
||
|
U.S. defined benefit plans:
|
|
|
|
||
|
Discount rate
|
3.75%
|
4.20%
|
4.00%
|
||
|
Average increase in compensation levels
|
n/a
|
3.50%
|
3.50%
|
||
|
Expected long-term return on assets
|
7.25%
|
7.50%
|
8.00%
|
||
|
Non-U.S. defined benefit plans:
|
|
|
|
||
|
Discount rate
|
0.22-2.66%
|
0.77-3.76%
|
1.50-4.00%
|
||
|
Average increase in compensation levels
|
2.00-4.25%
|
2.25-4.00%
|
2.50-3.25%
|
||
|
Expected long-term return on assets
|
4.00-6.25%
|
4.25-6.50%
|
4.00-6.50%
|
||
|
U.S. post-retirement benefits plans:
|
|
|
|
||
|
Discount rate
|
3.50%
|
4.00%
|
4.00%
|
||
|
Expected long-term return on assets
|
7.25%
|
7.50%
|
8.00%
|
||
|
Current medical cost trend rate
|
6.00%
|
7.00%
|
8.00%
|
||
|
Ultimate medical cost trend rate
|
3.50%
|
3.50%
|
3.50%
|
||
|
Medical cost trend rate decreases to ultimate rate in year
|
2029
|
2029
|
2028
|
||
Assumptions used to calculate the benefit obligation were as follows:
|
|
As of the Years Ending October 31,
|
||
|
|
2017
|
2016
|
|
|
U.S. defined benefit plans:
|
|
|
|
|
Discount rate
|
3.75%
|
3.75%
|
|
|
Non-U.S. defined benefit plans:
|
|
|
|
|
Discount rate
|
0.67-2.52%
|
0.40-2.62%
|
|
|
Average increase in compensation levels
|
2.00-3.25%
|
2.00-4.25%
|
|
|
U.S. post-retirement benefits plans:
|
|
|
|
|
Discount rate
|
3.50%
|
3.50%
|
|
|
Current medical cost trend rate
|
6.00%
|
6.00%
|
|
|
Ultimate medical cost trend rate
|
3.50%
|
3.50%
|
|
|
Medical cost trend rate decreases to ultimate rate in year
|
2029
|
2029
|
|
Health care trend rates do not have a significant effect on the total service and interest cost components or on the post-retirement benefit obligation amounts reported for the U.S. Post-Retirement Benefit Plan for the year ended
October 31, 2017
.
14. GUARANTEES
Standard Warranty
We accrue for standard warranty costs based on historical trends in warranty charges as a percentage of net product shipments. The accrual is reviewed regularly and periodically adjusted to reflect changes in warranty cost estimates. Estimated warranty charges are recorded within cost of products at the time products are sold. The standard warranty accrual balances are held in other accrued and other long-term liabilities on our consolidated balance sheet. Our standard warranty terms typically extend to one years from the date of delivery, depending on the product.
92
A summary of the standard warranty accrual activity is shown in the table below. The standard warranty accrual balances are held in other accrued and other long-term liabilities.
|
|
October 31,
|
||||||
|
|
2017
|
2016
|
|||||
|
|
(in millions)
|
||||||
|
Balance as of October 31, 2016 and 2015
|
$
|
35
|
|
$
|
31
|
|
|
|
Accruals for warranties including change in estimates
|
53
|
|
53
|
|
|||
|
Settlements made during the period
|
(54
|
)
|
(49
|
)
|
|||
|
Balance as of October 31, 2017 and 2016
|
$
|
34
|
|
$
|
35
|
|
|
|
Accruals for warranties due within one year
|
33
|
|
34
|
|
|||
|
Accruals for warranties due after one year
|
1
|
|
1
|
|
|||
|
Balance as of October 31, 2017 and 2016
|
$
|
34
|
|
$
|
35
|
|
|
Indemnifications in Connection with Transactions
In connection with various divestitures, acquisitions, spin-offs and other transactions, we have agreed to indemnify certain parties, their affiliates and/or other related parties against certain damages and expenses that might occur in the future. These indemnifications may cover a variety of liabilities, including, but not limited to, employee, tax, environmental, intellectual property, litigation and other liabilities related to the business conducted prior to the date of the transaction. In our opinion, the fair value of these indemnification obligations was not material as of
October 31, 2017
.
Indemnifications to Officers and Directors
Our corporate by-laws require that we indemnify our officers and directors, as well as those who act as directors and officers of other entities at our request, against expenses, judgments, fines, settlements and other amounts actually and reasonably incurred in connection with any proceedings arising out of their services to Agilent and such other entities, including service with respect to employee benefit plans. In addition, we have entered into separate indemnification agreements with each director and each board-appointed officer of Agilent which provide for indemnification of these directors and officers under similar circumstances and under additional circumstances. The indemnification obligations are more fully described in the by-laws and the indemnification agreements. We purchase standard insurance to cover claims or a portion of the claims made against our directors and officers. Since a maximum obligation is not explicitly stated in our by-laws or in our indemnification agreements and will depend on the facts and circumstances that arise out of any future claims, the overall maximum amount of the obligations cannot be reasonably estimated. Historically, we have not made payments related to these obligations, and the fair value for these indemnification obligations was not material as of
October 31, 2017
.
Other Indemnifications
As is customary in our industry and as provided for in local law in the U.S. and other jurisdictions, many of our standard contracts provide remedies to our customers and others with whom we enter into contracts, such as defense, settlement, or payment of judgment for intellectual property claims related to the use of our products. From time to time, we indemnify customers, as well as our suppliers, contractors, lessors, lessees, companies that purchase our businesses or assets and others with whom we enter into contracts, against combinations of loss, expense, or liability arising from various triggering events related to the sale and the use of our products and services, the use of their goods and services, the use of facilities and state of our owned facilities, the state of the assets and businesses that we sell and other matters covered by such contracts, usually up to a specified maximum amount. In addition, from time to time we also provide protection to these parties against claims related to undiscovered liabilities, additional product liability or environmental obligations. In our experience, claims made under such indemnifications are rare and the associated estimated fair value of the liability was not material as of
October 31, 2017
.
In connection with the sale of several of our businesses, we have agreed to indemnify the buyers of such business, their respective affiliates and other related parties against certain damages that they might incur in the future. The continuing indemnifications primarily cover damages relating to liabilities of the businesses that Agilent retained and did not transfer to the buyers, as well as other specified items. In our opinion, the fair value of these indemnification obligations was not material as of
October 31, 2017
.
93
15. COMMITMENTS AND CONTINGENCIES
Operating Lease Commitments:
We lease certain real and personal property from unrelated third parties under non-cancelable operating leases. Future minimum lease payments under operating leases at
October 31, 2017
were
$42 million
for
2018
,
$33 million
for
2019
,
$19 million
for
2020
,
$10 million
for
2021
,
$6 million
for
2022
and
$26 million
thereafter. Future minimum lease income under leases at
October 31, 2017
was
$9 million
for
2018
,
$9 million
for
2019
,
$8 million
for
2020
, and
$10 million
thereafter. Certain leases require us to pay property taxes, insurance and routine maintenance, and include escalation clauses. Total rent expense was
$57 million
in
2017
,
$61 million
in
2016
and
$65 million
in
2015
.
Contingencies:
We are involved in lawsuits, claims, investigations and proceedings, including, but not limited to, patent, commercial and environmental matters, which arise in the ordinary course of business. There are no matters pending that we currently believe are reasonably possible of having a material impact to our business, consolidated financial condition, results of operations or cash flows.
Credit Facilities
On
September 15, 2014
, Agilent entered into a credit agreement with a financial institution which provides for a
$400 million
five
-year unsecured credit facility that will expire on
September 15, 2019
. On June 9, 2015, the commitments under the existing credit facility were increased by
$300 million
and on July 14, 2017, the commitments under the existing credit facility were increased by an additional
$300 million
so that the aggregate commitments under the facility now total
$1 billion
. As of
October 31, 2017
, the company had borrowings of
$110 million
outstanding under the facility. We were in compliance with the covenants for the credit facility during the years ended
October 31, 2017
and
2016
.
2017 Senior Notes
In
October 2007
, the company issued an aggregate principal amount of
$600 million
in senior notes ("2017 senior notes"). On October 20, 2014, we settled the redemption of
$500 million
of the
$600 million
outstanding aggregate principal amount of our 2017 senior notes. The 2017 senior notes are repayable within one year as of October 31, 2017 and have been reclassified to short-term debt. The remaining
$100 million
in senior notes matured and were paid in full on November 1, 2017.
17. LONG-TERM DEBT
Senior Notes
The following table summarizes the company's long-term senior notes and the related interest rate swaps:
|
|
October 31, 2017
|
October 31, 2016
|
|||||||||||||||||||||
|
|
Amortized
Principal
|
Swap
|
Total
|
Amortized
Principal
|
Swap
|
Total
|
|||||||||||||||||
|
|
(in millions)
|
||||||||||||||||||||||
|
2017 Senior Notes
|
$
|
—
|
|
$
|
—
|
|
$
|
—
|
|
$
|
100
|
|
$
|
1
|
|
101
|
|
||||||
|
2020 Senior Notes
|
499
|
|
11
|
|
510
|
|
498
|
|
15
|
|
513
|
|
|||||||||||
|
2022 Senior Notes
|
398
|
|
—
|
|
398
|
|
398
|
|
—
|
|
398
|
|
|||||||||||
|
2023 Senior Notes
|
596
|
|
—
|
|
596
|
|
595
|
|
—
|
|
595
|
|
|||||||||||
|
2026 Senior Notes
|
297
|
|
—
|
|
297
|
|
297
|
|
—
|
|
297
|
|
|||||||||||
|
Total
|
$
|
1,790
|
|
$
|
11
|
|
$
|
1,801
|
|
$
|
1,888
|
|
$
|
16
|
|
$
|
1,904
|
|
|||||
On November 1, 2016, we adopted new guidance related to the presentation of debt issuance costs in the balance sheet. As a result, the amortized principal of long-term debt decreased by
$8 million
. The table above for October 31, 2016 reflects the new disclosure requirement. Please refer to Note 2, "New Accounting Pronouncements" for additional information.
94
2020 Senior Notes
In
July 2010
, the company issued an aggregate principal amount of
$500 million
in senior notes ("2020 senior notes"). The 2020 senior notes were issued at
99.54%
of their principal amount. The notes will mature on
July 15, 2020
, and bear interest at a fixed rate of
5.00%
per annum. The interest is payable
semi-annually
on January 15th and July 15th of each year, payments commenced on
January 15, 2011
.
On
August 9, 2011
, we terminated our interest rate swap contracts related to our 2020 senior notes that represented the notional amount of
$500 million
. The asset value, including interest receivable, upon termination for these contracts was approximately
$34 million
and the amount to be amortized at
October 31, 2017
was
$11 million
. The gain is being deferred and amortized to interest expense over the remaining life of the 2020 senior notes.
2022 Senior Notes
In
September 2012
, the company issued an aggregate principal amount of
$400 million
in senior notes ("2022 senior notes"). The 2022 senior notes were issued at
99.80%
of their principal amount. The notes will mature on
October 1, 2022
, and bear interest at a fixed rate of
3.20%
per annum. The interest is payable
semi-annually
on April 1st and October 1st of each year, payments commenced on
April 1, 2013
.
2023 Senior Notes
In
June 2013
, the company issued aggregate principal amount of
$600 million
in senior notes ("2023 senior notes"). The 2023 senior notes were issued at
99.544%
of their principal amount. The notes will mature on
July 15, 2023
and bear interest at a fixed rate of
3.875%
per annum. The interest is payable
semi-annually
on January 15th and July 15th of each year and payments commenced
January 15, 2014
.
2026 Senior Notes
On
September 15, 2016
, the company issued aggregate principal amount of
$300 million
in senior notes ("2026 senior notes"). The 2026 senior notes were issued at
99.624%
% of their principal amount. The notes will mature on
September 22, 2026
and bear interest at a fixed rate of
3.050%
per annum. The interest is payable
semi-annually
on March 22nd and September 22nd of each year and payments commenced
March 22, 2017
.
In February 2016, Agilent executed three forward-starting pay fixed/receive variable interest rate swaps for the notional amount of
$300 million
in connection with future interest payments to be made on our 2026 senior notes issued on September 15, 2016. The swap arrangements were terminated on September 15, 2016 with a payment of
$10 million
and we recognized this as a deferred loss in accumulated other comprehensive income which is being amortized to interest expense over the life of the 2026 senior notes.The remaining loss to be amortized related to the interest rate swap agreements at
October 31, 2017
was
$9 million
.
Other Debt
In 2016, we paid approximately
$37 million
of our mortgage debt, secured on buildings in Denmark, to a Danish financial institution. The gain recognized upon early payment was not material.
No
balance exists on this debt as of October 31. 2016.
18. STOCKHOLDERS' EQUITY
Stock Repurchase Program
On November 22, 2013 we announced that our board of directors had authorized a share repurchase program. The program was designed to reduce or eliminate dilution resulting from issuance of stock under the company's employee equity incentive programs to target maintaining a weighted average share count of approximately
335 million
diluted shares. For the year ended
October 31, 2015
we repurchased
6 million
shares for
$267 million
. For the year ended
October 31, 2016
we repurchased approximately
2.4 million
shares for
$98 million
which completed the purchases under this authorization.
On May 28, 2015 we announced that our board of directors had approved a new share repurchase program (the "2015 repurchase program"). The 2015 share repurchase program authorizes the purchase of up to
$1.14 billion
of our common stock at the company's discretion through and including November 1, 2018. The 2015 repurchase program does not require the company to acquire a specific number of shares and may be suspended or discontinued at any time. During the year ended
October 31,
95
2016
, upon the completion of our previous repurchase program, we repurchased approximately
8.3 million
shares for
$336 million
under this authorization. During the year ended
October 31, 2017
we repurchased approximately
4.1 million
shares for
$194 million
under this authorization. As of
October 31, 2017
, we had remaining authorization to repurchase up to
$610 million
of our common stock under this program.
During fiscal year 2017, we retired
294.2 million
treasury shares at an aggregate cost of
$10.7 billion
, the amount of which represents all of our previously repurchased shares over the past 12 years including repurchases made in fiscal year 2017. The retirement of these treasury shares resulted in a decrease of
$6.7 billion
to retained earnings and a decrease of
$4.0 billion
to additional paid-in-capital.
Cash Dividends on Shares of Common Stock
During the year ended
October 31, 2017
, cash dividends of
$0.528
per share, or
$170 million
were declared and paid on the company's outstanding common stock. During the year ended
October 31, 2016
, cash dividends of
$0.460
per share, or
$150 million
were declared and paid on the company's outstanding common stock. During the year ended
October 31, 2015
, cash dividends of
$0.400
per share, or
$133 million
were declared and paid on the company's outstanding common stock.
On
November 15, 2017
we declared a quarterly dividend of
$0.149
per share of common stock, or approximately
$48 million
which will be paid on
January 24, 2018
to shareholders of record as of the close of business on
January 2, 2018
. The timing and amounts of any future dividends are subject to determination and approval by our board of directors.
Accumulated Other Comprehensive Income (Loss)
The following table summarizes the components of our accumulated other comprehensive income (loss) as of
October 31, 2017
and
2016
, net of tax effect:
|
|
October 31,
|
||||||
|
|
2017
|
2016
|
|||||
|
|
(in millions)
|
||||||
|
Foreign currency translation, net of tax expense of $(8) and $(5) for 2017 and 2016, respectively
|
$
|
(156
|
)
|
(197
|
)
|
||
|
Unrealized losses (including prior service benefit) on defined benefit plans, net of tax benefit of $127 and $176 for 2017 and 2016, respectively
|
(188
|
)
|
(305
|
)
|
|||
|
Unrealized gains (losses) on derivative instruments, net of tax benefit of $2 and $2 for 2017 and 2016, respectively
|
(2
|
)
|
(1
|
)
|
|||
|
Total accumulated other comprehensive loss
|
$
|
(346
|
)
|
$
|
(503
|
)
|
|
96
Changes in accumulated other comprehensive income (loss) by component and related tax effects for the years ended
October 31, 2017
and
2016
were as follows (in millions):
|
Net defined benefit pension cost and post retirement plan costs
|
||||||||||||||||||||
|
Foreign currency translation
|
Prior service credits
|
Actuarial Losses
|
Unrealized gains (losses) on derivatives
|
Total
|
||||||||||||||||
|
(in millions)
|
||||||||||||||||||||
|
As of October 31, 2015
|
$
|
(189
|
)
|
$
|
161
|
|
$
|
(365
|
)
|
$
|
2
|
|
$
|
(391
|
)
|
|||||
|
Other comprehensive income (loss) before reclassifications
|
(5
|
)
|
6
|
|
(171
|
)
|
(10
|
)
|
(180
|
)
|
||||||||||
|
Amounts reclassified out of accumulated other comprehensive income
|
—
|
|
(29
|
)
|
43
|
|
3
|
|
17
|
|
||||||||||
|
Tax benefit
|
(3
|
)
|
8
|
|
42
|
|
4
|
|
51
|
|
||||||||||
|
Other comprehensive loss
|
(8
|
)
|
(15
|
)
|
(86
|
)
|
(3
|
)
|
(112
|
)
|
||||||||||
|
As of October 31, 2016
|
$
|
(197
|
)
|
$
|
146
|
|
$
|
(451
|
)
|
$
|
(1
|
)
|
$
|
(503
|
)
|
|||||
|
Other comprehensive income (loss) before reclassifications
|
44
|
|
—
|
|
116
|
|
—
|
|
160
|
|
||||||||||
|
Amounts reclassified out of accumulated other comprehensive income
|
—
|
|
(9
|
)
|
59
|
|
(1
|
)
|
49
|
|
||||||||||
|
Tax (expense) benefit
|
(3
|
)
|
3
|
|
(52
|
)
|
—
|
|
(52
|
)
|
||||||||||
|
Other comprehensive income (loss)
|
41
|
|
(6
|
)
|
123
|
|
(1
|
)
|
157
|
|
||||||||||
|
As of October 31, 2017
|
$
|
(156
|
)
|
$
|
140
|
|
$
|
(328
|
)
|
$
|
(2
|
)
|
$
|
(346
|
)
|
|||||
97
Reclassifications out of accumulated other comprehensive income (loss) for the years ended
October 31, 2017
and
2016
were as follows (in millions):
|
Details about accumulated other
|
|
Amounts Reclassified
|
Affected line item in
|
|||||||
|
comprehensive income components
|
|
from other comprehensive income
|
statement of operations
|
|||||||
|
|
|
2017
|
|
2016
|
|
|
||||
|
|
|
|
|
|
|
|
||||
|
Unrealized gains and (losses) on derivatives
|
|
$
|
1
|
|
|
$
|
(3
|
)
|
Cost of products
|
|
|
|
|
1
|
|
|
(3
|
)
|
|
Total before income tax
|
||
|
|
|
—
|
|
|
—
|
|
(Provision)/benefit for income tax
|
|||
|
|
|
1
|
|
|
(3
|
)
|
|
Total net of income tax
|
||
|
Net defined benefit pension cost and post retirement plan costs:
|
|
|
|
|
|
|
||||
|
|
|
|
|
|
|
|
||||
|
Actuarial net loss
|
|
(59
|
)
|
|
(43
|
)
|
|
Cost of sales and operating expenses
|
||
|
Prior service benefit
|
|
9
|
|
|
29
|
|
|
Cost of sales and operating expenses
|
||
|
|
|
(50
|
)
|
|
(14
|
)
|
|
Total before income tax
|
||
|
|
|
14
|
|
|
4
|
|
(Provision)/benefit for income tax
|
|||
|
|
|
(36
|
)
|
|
(10
|
)
|
|
Total net of income tax
|
||
|
|
|
|
|
|
|
|
||||
|
Total reclassifications for the period
|
|
$
|
(35
|
)
|
|
$
|
(13
|
)
|
|
|
Amounts in parentheses indicate reductions to income and increases to other comprehensive income.
Reclassifications of prior service benefit and actuarial net loss in respect of retirement plans and post retirement pension plans are included in the computation of net periodic cost (see Note 13 "Retirement Plans and Post Retirement Pension Plans").
19. SEGMENT INFORMATION
Description of Segments.
We are a global leader in life sciences, diagnostics and applied chemical markets, providing application focused solutions that include instruments, software, services and consumables for the entire laboratory workflow.
Agilent has three business segments comprised of the life sciences and applied markets business, diagnostics and genomics business and the Agilent CrossLab business each of which comprises a reportable segment. The
three
operating segments were determined based primarily on how the chief operating decision maker views and evaluates our operations. Operating results are regularly reviewed by the chief operating decision maker to make decisions about resources to be allocated to the segment and to assess its performance. Other factors, including market separation and customer specific applications, go-to-market channels, products and services and manufacturing are considered in determining the formation of these operating segments.
A description of our
three
reportable segments is as follows:
Our life sciences and applied markets business provides application-focused solutions that include instruments and software that enable customers to identify, quantify and analyze the physical and biological properties of substances and products, as well as enable customers in the clinical and life sciences research areas to interrogate samples at the molecular and cellular level. Key product categories include: liquid chromatography ("LC") systems and components; liquid chromatography mass spectrometry ("LCMS") systems; gas chromatography ("GC") systems and components; gas chromatography mass spectrometry ("GCMS") systems; inductively coupled plasma mass spectrometry ("ICP-MS") instruments; atomic absorption ("AA") instruments; microwave plasma-atomic emission spectrometry (“MP-AES”) instruments; inductively coupled plasma optical emission
98
spectrometry ("ICP-OES") instruments; raman spectroscopy; cell analysis plate based assays; laboratory software and informatics systems; laboratory automation; dissolution testing; vacuum pumps and measurement technologies.
Our diagnostics and genomics business is comprised of five areas of activity providing active pharmaceutical ngredients ("APIs") for oligo-based therapeutics as well as solutions that include reagents, instruments, software and consumables, which enable customers in the clinical and life sciences research areas to interrogate samples at the cellular and molecular level. First, our genomics business includes arrays for DNA mutation detection, genotyping, gene copy number determination, identification of gene rearrangements, DNA methylation profiling, gene expression profiling, as well as next generation sequencing ("NGS") target enrichment and genetic data management and interpretation support software. This business also includes our new acquisition “Multiplicom” a leading European diagnostics company with state-of-the-art genetic testing technology and products. Multiplicom’s solutions enable clinical labs to identify DNA variants associated with genetic disease and help direct cancer therapy. Second, our nucleic acid solutions business provides equipment and expertise focused on production of synthesized oligonucleotides under pharmaceutical good manufacturing practices ("GMP") conditions for use as active pharmaceutical ingredients ("API") in an emerging class of drugs that utilize nucleic acid molecules for disease therapy. Next, our pathology solutions business is focused on product offerings to cancer diagnostics and anatomic pathology workflows. The broad portfolio of offerings includes immunohistochemistry (“IHC”), in situ hybridization (“ISH”), hematoxylin and eosin (“H&E”) staining and special staining. We also collaborate with a number of major pharmaceutical companies to develop new potential pharmacodiagnostics, also known as companion diagnostics, which may be used to identify patients most likely to benefit from a specific targeted therapy. Finally, the reagent partnership business is a provider of reagents used for turbidimetry and flow cytometry.
The Agilent CrossLab business spans the entire lab with its extensive consumables and services portfolio, which is designed to improve customer outcomes. The majority of the portfolio is vendor neutral, meaning Agilent can serve and supply customers regardless of their instrument purchase choices. Solutions range from chemistries and supplies to services and software helping to connect the entire lab. Key product categories in consumables include GC and LC columns, sample preparation products, custom chemistries, and a large selection of laboratory instrument supplies. Services include startup, operational, training and compliance support, software as a service, as well as asset management and consultative services that help increase customer productivity. Custom service and consumable bundles are tailored to meet the specific application needs of various industries and to keep instruments fully operational and compliant with the respective industry requirements
A significant portion of the segments' expenses arise from shared services and infrastructure that we have historically provided to the segments in order to realize economies of scale and to efficiently use resources. These expenses, collectively called corporate charges, include legal, accounting, real estate, insurance services, information technology services, treasury, other corporate infrastructure expenses and costs of centralized research and development. Charges are allocated to the segments, and the allocations have been determined on a basis that we consider to be a reasonable reflection of the utilization of services provided to or benefits received by the segments. In addition, we do not allocate amortization and impairment of acquisition-related intangible assets, restructuring and transformational expenses, acquisition and integration costs and certain other charges to the operating margin for each segment because management does not include this information in its measurement of the performance of the operating segments.
The following tables reflect the results of our reportable segments under our management reporting system. The performance of each segment is measured based on several metrics, including segment income from operations. These results are used, in part, by the chief operating decision maker in evaluating the performance of, and in allocating resources to, each of the segments.
99
The profitability of each of the segments is measured after excluding restructuring and asset impairment charges, investment gains and losses, interest income, interest expense, acquisition and integration costs, non-cash amortization and other items as noted in the reconciliations below.
|
Life Sciences and Applied Markets
|
Diagnostics and Genomics
|
Agilent CrossLab
|
Total
Segments
|
||||||||||||
|
|
(in millions)
|
||||||||||||||
|
Year ended October 31, 2017:
|
|
|
|
|
|||||||||||
|
Total net revenue
|
$
|
2,169
|
|
$
|
772
|
|
$
|
1,531
|
|
$
|
4,472
|
|
|||
|
Income from operations
|
$
|
487
|
|
$
|
149
|
|
$
|
338
|
|
$
|
974
|
|
|||
|
Depreciation expense
|
$
|
35
|
|
$
|
30
|
|
$
|
29
|
|
$
|
94
|
|
|||
|
Share-based compensation expense
|
$
|
30
|
|
$
|
10
|
|
$
|
21
|
|
$
|
61
|
|
|||
|
Year ended October 31, 2016:
|
|
|
|
||||||||||||
|
Total net revenue
|
$
|
2,073
|
|
$
|
709
|
|
$
|
1,420
|
|
$
|
4,202
|
|
|||
|
Income from operations
|
$
|
429
|
|
$
|
114
|
|
$
|
316
|
|
$
|
859
|
|
|||
|
Depreciation expense
|
$
|
36
|
|
$
|
31
|
|
$
|
28
|
|
$
|
95
|
|
|||
|
Share-based compensation expense
|
$
|
29
|
|
$
|
10
|
|
$
|
21
|
|
$
|
60
|
|
|||
|
Year ended October 31, 2015:
|
|
|
|
||||||||||||
|
Total net revenue
|
$
|
2,046
|
|
$
|
662
|
|
$
|
1,330
|
|
$
|
4,038
|
|
|||
|
Income from operations
|
$
|
380
|
|
$
|
88
|
|
$
|
299
|
|
$
|
767
|
|
|||
|
Depreciation expense
|
$
|
27
|
|
$
|
37
|
|
$
|
34
|
|
$
|
98
|
|
|||
|
Share-based compensation expense
|
$
|
27
|
|
$
|
9
|
|
$
|
18
|
|
$
|
54
|
|
|||
The following table reconciles reportable segments' income from operations to Agilent's total enterprise income before taxes:
|
|
Years Ended October 31,
|
||||||||||
|
|
2017
|
2016
|
2015
|
||||||||
|
|
(in millions)
|
||||||||||
|
Total reportable segments' income from operations
|
$
|
974
|
|
$
|
859
|
|
$
|
767
|
|
||
|
Business exit and divestiture costs ( primarily our NMR business)
|
—
|
|
(11
|
)
|
(12
|
)
|
|||||
|
Asset Impairments
|
—
|
|
(4
|
)
|
(3
|
)
|
|||||
|
Transformational initiatives
|
(12
|
)
|
(38
|
)
|
(56
|
)
|
|||||
|
Amortization of intangible assets related to business combinations
|
(117
|
)
|
(152
|
)
|
(156
|
)
|
|||||
|
Acquisition and integration costs
|
(30
|
)
|
(41
|
)
|
(13
|
)
|
|||||
|
Acceleration of share-based compensation expense related to workforce reduction
|
—
|
|
—
|
|
(2
|
)
|
|||||
|
Pension curtailment gain
|
—
|
|
15
|
|
—
|
|
|||||
|
Pension settlement gain
|
32
|
|
1
|
|
—
|
|
|||||
|
Impairment of loans
|
—
|
|
(7
|
)
|
—
|
|
|||||
|
Other
|
(6
|
)
|
(7
|
)
|
(3
|
)
|
|||||
|
Interest Income
|
22
|
|
11
|
|
7
|
|
|||||
|
Interest Expense
|
(79
|
)
|
(72
|
)
|
(66
|
)
|
|||||
|
Other income (expense), net
|
19
|
|
(10
|
)
|
17
|
|
|||||
|
Income from continuing operations before taxes, as reported
|
$
|
803
|
|
$
|
544
|
|
$
|
480
|
|
||
Major Customers.
No customer represented 10 percent or more of our total net revenue in
2017
,
2016
or
2015
.
100
The following table presents assets and capital expenditures attributed to each segment. Unallocated assets primarily consist of cash, cash equivalents, accumulated amortization of other intangibles and other assets.
|
Life Sciences and Applied Markets
|
Diagnostics and Genomics
|
Agilent CrossLab
|
Total
Segments
|
||||||||||||
|
|
(in millions)
|
||||||||||||||
|
As of October 31, 2017:
|
|
|
|
|
|||||||||||
|
Assets
|
$
|
1,753
|
|
$
|
2,119
|
|
$
|
1,138
|
|
$
|
5,010
|
|
|||
|
Capital expenditures
|
$
|
39
|
|
$
|
111
|
|
$
|
26
|
|
$
|
176
|
|
|||
|
As of October 31, 2016:
|
|
|
|
|
|||||||||||
|
Assets
|
$
|
1,687
|
|
$
|
1,960
|
|
$
|
1,082
|
|
$
|
4,729
|
|
|||
|
Capital expenditures
|
$
|
53
|
|
$
|
41
|
|
$
|
45
|
|
$
|
139
|
|
|||
The following table reconciles segment assets to Agilent's total assets:
|
|
October 31,
|
||||||
|
|
2017
|
2016
|
|||||
|
|
(in millions)
|
||||||
|
Total reportable segments' assets
|
$
|
5,010
|
|
$
|
4,729
|
|
|
|
Cash, cash equivalents
|
2,678
|
|
2,289
|
|
|||
|
Prepaid expenses
|
92
|
|
92
|
|
|||
|
Investments
|
138
|
|
135
|
|
|||
|
Long-term and other receivables
|
105
|
|
92
|
|
|||
|
Other
|
403
|
|
457
|
|
|||
|
Total assets
|
$
|
8,426
|
|
$
|
7,794
|
|
|
The other category primarily includes deferred tax assets which are not allocated to the segments.
The following table represents total revenue by product category:
|
|
Years Ended October 31,
|
||||||||||
|
|
2017
|
2016
|
2015
|
||||||||
|
|
(in millions)
|
||||||||||
|
Instrumentation
|
$
|
1,946
|
|
$
|
1,871
|
|
$
|
1,827
|
|
||
|
Analytical lab services
|
991
|
|
910
|
|
843
|
|
|||||
|
Analytical lab consumables
|
540
|
|
510
|
|
489
|
|
|||||
|
Diagnostics and genomics solutions
|
772
|
|
709
|
|
662
|
|
|||||
|
Informatics and other
|
223
|
|
202
|
|
217
|
|
|||||
|
Total
|
$
|
4,472
|
|
$
|
4,202
|
|
$
|
4,038
|
|
||
The following table presents summarized information for net revenue and long-lived assets by geographic region. Revenues from external customers are generally attributed to countries based upon the customer's location. Long lived assets consist of property, plant, and equipment, long-term receivables and other long-term assets excluding intangible assets. The rest of the world primarily consists of rest of Asia and Europe.
|
United
States
|
China
(1)
|
Rest of the
World
|
Total
|
||||||||||||
|
|
(in millions)
|
||||||||||||||
|
Net revenue:
|
|
|
|
|
|||||||||||
|
Year ended October 31, 2017
|
$
|
1,314
|
|
$
|
900
|
|
$
|
2,258
|
|
$
|
4,472
|
|
|||
|
Year ended October 31, 2016
|
$
|
1,251
|
|
$
|
839
|
|
$
|
2,112
|
|
$
|
4,202
|
|
|||
|
Year ended October 31, 2015
|
$
|
1,214
|
|
$
|
693
|
|
$
|
2,131
|
|
$
|
4,038
|
|
|||
|
1.
|
China also includes Hong Kong net revenue. Prior periods have been revised to conform with current year presentation.
|
101
|
United
States
|
Germany
|
Rest of the
World
|
Total
|
||||||||||||
|
|
(in millions)
|
||||||||||||||
|
Long-lived assets:
|
|
|
|
||||||||||||
|
October 31, 2017
|
$
|
556
|
|
$
|
118
|
|
$
|
358
|
|
$
|
1,032
|
|
|||
|
October 31, 2016
|
$
|
449
|
|
$
|
89
|
|
$
|
266
|
|
$
|
804
|
|
|||
QUARTERLY SUMMARY
(Unaudited)
|
|
Three Months Ended
|
||||||||||||||
|
|
January 31,
|
April 30,
|
July 31,
|
October 31,
|
|||||||||||
|
|
(in millions, except per share data)
|
||||||||||||||
|
2017
|
|
|
|
|
|||||||||||
|
Net revenue
|
$
|
1,067
|
|
$
|
1,102
|
|
$
|
1,114
|
|
$
|
1,189
|
|
|||
|
Gross profit
|
574
|
|
592
|
|
596
|
|
647
|
|
|||||||
|
Income from operations
|
206
|
|
201
|
|
201
|
|
233
|
|
|||||||
|
Net Income
|
168
|
|
164
|
|
175
|
|
177
|
|
|||||||
|
Net income per share — Basic
|
$
|
0.52
|
|
$
|
0.51
|
|
$
|
0.55
|
|
$
|
0.55
|
|
|||
|
Net income per share — Diluted
|
$
|
0.52
|
|
$
|
0.50
|
|
$
|
0.54
|
|
$
|
0.54
|
|
|||
|
Weighted average shares used in computing net income per share:
|
|
|
|
|
|||||||||||
|
Basic
|
322
|
|
321
|
|
321
|
|
322
|
|
|||||||
|
Diluted
|
326
|
|
325
|
|
326
|
|
326
|
|
|||||||
|
Cash dividends per common share
|
$
|
0.132
|
|
$
|
0.132
|
|
$
|
0.132
|
|
$
|
0.132
|
|
|||
|
Range of stock prices on NYSE
|
$42.92-$49.48
|
|
$48.47-$55.51
|
|
$55.36-$61.84
|
|
$58.22-$68.52
|
|
|||||||
|
2016
|
|
|
|
||||||||||||
|
Net revenue
|
$
|
1,028
|
|
$
|
1,019
|
|
$
|
1,044
|
|
$
|
1,111
|
|
|||
|
Gross profit
|
537
|
|
530
|
|
542
|
|
588
|
|
|||||||
|
Income from operations
|
155
|
|
131
|
|
146
|
|
183
|
|
|||||||
|
Net income
|
121
|
|
91
|
|
124
|
|
126
|
|
|||||||
|
Net income per share — Basic
|
$
|
0.37
|
|
$
|
0.28
|
|
$
|
0.38
|
|
$
|
0.39
|
|
|||
|
Net income per share — Diluted
|
$
|
0.36
|
|
$
|
0.28
|
|
$
|
0.38
|
|
$
|
0.38
|
|
|||
|
Weighted average shares used in computing net income per share:
|
|
|
|
|
|||||||||||
|
Basic
|
329
|
|
326
|
|
325
|
|
324
|
|
|||||||
|
Diluted
|
332
|
|
328
|
|
328
|
|
328
|
|
|||||||
|
Cash dividends per common share
|
$
|
0.115
|
|
$
|
0.115
|
|
$
|
0.115
|
|
$
|
0.115
|
|
|||
|
Range of stock prices on NYSE
|
$36.01-$42.48
|
|
$34.15-$42.00
|
|
$40.39-$48.18
|
|
$43.11-$48.63
|
|
|||||||
102
Item 9.
Changes in and Disagreements with Accountants on Accounting and Financial Disclosure
None.
Item 9A.
Controls and Procedures
Evaluation of Disclosure Controls and Procedures
Our management has evaluated, under the supervision and with the participation of our Chief Executive Officer and Chief Financial Officer, the effectiveness of our disclosure controls and procedures as of
October 31, 2017
, pursuant to and as required by Rule 13a-15(b) under the Securities Exchange Act of 1934 (“Exchange Act”). Based on that evaluation, our Chief Executive Officer and Chief Financial Officer have concluded that, as of
October 31, 2017
, the company's disclosure controls and procedures, as defined by Rule 13a-15(e) under the Exchange Act, were effective and designed to ensure that (i) information required to be disclosed in the company's reports filed under the Exchange Act is recorded, processed, summarized and reported within the time periods specified in the SEC's rules and forms, and (ii) information is accumulated and communicated to management, including the Chief Executive Officer and Chief Financial Officer, as appropriate to allow timely decisions regarding required disclosures.
Management's Report on Internal Control Over Financial Reporting
Our management is responsible for establishing and maintaining adequate internal control over financial reporting, as such term is defined in Exchange Act Rule 13a-15(f). Under the supervision and with the participation of our management, including our Chief Executive Officer and Chief Financial Officer, we assessed the effectiveness of our internal control over financial reporting based on the framework in
Internal Control - Integrated Framework
(2013) issued by the Committee of Sponsoring Organizations of the Treadway Commission ("COSO"). As a result of that assessment, management concluded that our internal control over financial reporting was effective as of
October 31, 2017
based on criteria in
Internal Control - Integrated Framework
(2013) issued by the COSO.
The effectiveness of our internal control over financial reporting as of
October 31, 2017
has been audited by PricewaterhouseCoopers LLP, an independent registered public accounting firm, as stated in their report which appears in Item 8 of this Annual Report on Form 10-K.
Changes in Internal Control Over Financial Reporting
There were no changes in our internal control over financial reporting that occurred during Agilent's last fiscal quarter that have materially affected, or are reasonably likely to materially affect, our internal control over financial reporting.
Item 9B.
Other Information
None.
Item 10.
Directors, Executive Officers and Corporate Governance
Information regarding our directors appears under “Proposal No. 1 - Election of Directors” in our Proxy Statement for the Annual Meeting of Stockholders (“Proxy Statement”), to be held
March 21, 2018
. That portion of the Proxy Statement is incorporated by reference into this report. Information regarding our executive officers appears in Item 1 of this report under “Executive Officers of the Registrant.” Information regarding our Audit and Finance Committee and our Audit and Finance Committee's financial expert appears under “Audit and Finance Committee Report” and “Board Structure and Compensation” in our Proxy Statement. That portion of the Proxy Statement is incorporated by reference into this report.
There were no material changes to the procedures by which security holders may recommend nominees to our Board of Directors. Information regarding our code of ethics (the company's Standards of Business Conduct) applicable to our principal executive officer, our principal financial officer, our controller and other senior financial officers appears in Item 1 of this report under “Investor Information.” We will post amendments to or waivers from a provision of the Standards of Business Conduct with respect to those persons on our website at www.investor.agilent.com.
103
Compliance with Section 16(a) of the Exchange Act
Information about compliance with Section 16(a) of the Exchange Act appears under “Section 16(a) Beneficial Ownership Reporting Compliance” in the Proxy Statement. That portion of the Proxy Statement is incorporated by reference into this report.
Item 11.
Executive Compensation
Information about compensation of our named executive officers appears under “Executive Compensation”, “Compensation Committee Interlocks and Insider Participation” in the Proxy Statement. Information about compensation of our directors appears under “Director Compensation” and “Compensation Committee Report” and “Stock Ownership Guidelines” in the Proxy Statement. Those portions of the Proxy Statement are incorporated by reference into this report.
Item 12.
Security Ownership of Certain Beneficial Owners and Management and Related Stockholder Matters
Information about security ownership of certain beneficial owners and management appears under "Common Stock Ownership of Certain Beneficial Owners and Management" in the Proxy Statement. That portion of the Proxy Statement is incorporated by reference into this report.
EQUITY COMPENSATION PLAN INFORMATION
The following table summarizes information about our equity compensation plans as of
October 31, 2017
. All outstanding awards relate to our common stock.
|
Plan Category
|
Number of Securities
to be Issued upon
Exercise of
Outstanding Options,
Warrants and Rights
|
Weighted-average
Exercise Price of
Outstanding
Options,
Warrants and
Rights
|
Number of Securities
Remaining Available for
Future Issuance under
Equity Compensation Plans
(Excluding Securities
Reflected in Column
(a))
|
||||||
|
|
(a)
|
(b)
|
(c)
|
||||||
|
Equity compensation plans approved by security holders (1)(2)(3)
|
6,063,545
|
|
$
|
34
|
|
35,697,020
|
|
||
|
Equity compensation plans not approved by security holders
|
—
|
|
—
|
|
—
|
|
|||
|
Total
|
6,063,545
|
|
$
|
34
|
|
35,697,020
|
|
||
|
(1)
|
The number of securities remaining available for future issuance in column (c) includes
27,556,310
shares of common stock authorized and available for issuance under the Agilent Technologies, Inc. Employee Stock Purchase Plan ("423(b) Plan"). The number of shares authorized for issuance under the 423(b) Plan is subject to an automatic annual increase of the lesser of one percent of the outstanding common stock of Agilent or an amount determined by the Compensation Committee of our Board of Directors. Under the terms of the 423(b) Plan, in no event shall the aggregate number of shares issued under the Plan exceed 75
million
shares.
|
|
(2)
|
We issue securities under our equity compensation plans in forms other than options, warrants or rights. On November 19, 2008 and March 11, 2009, the Board and the stockholders, respectively, approved the Agilent Technologies, Inc. 2009 Stock Plan ("2009 Plan") to replace the company's 1999 Plan and 1999 Non-Employee Director Stock Plan for awards of stock-based incentive compensation to our employees (including officers), directors and consultants. The 2009 Plan provides for the grant of awards in the form of stock options, stock appreciation rights, restricted stock, restricted stock units, performance shares and performance units with performance-based conditions to vesting or exercisability, and cash awards. The 2009 Plan has a term of ten years.
|
|
(3)
|
We issue securities under our equity compensation plans in forms which do not require a payment by the recipient to us at the time of exercise or vesting, including restricted stock, restricted stock units and performance units. Accordingly, the weighted-average exercise price in column (b) does not take these awards into account.
|
104
Item 13.
Certain Relationships and Related Transactions, and Director Independence
Information about certain relationships and related transactions appears under "Related Person Transaction Policy and Procedures" in the Proxy Statement. Information about director independence appears under the heading "Board Structure and Compensation — Director Independence" in the Proxy Statement. Each of those portions of the Proxy Statement is incorporated by reference into this report.
Item 14.
Principal Accounting Fees and Services
Information about principal accountant fees and services as well as related pre-approval policies appears under "Fees Paid to PricewaterhouseCoopers" and "Policy on Audit and Finance Committee Preapproval of Audit and Permissible Non-Audit Services of Independent Registered Auditors" in the Proxy Statement. Those portions of the Proxy Statement are incorporated by reference into this report.
|
(a)
|
The following documents are filed as part of this report:
|
|
1.
|
Financial Statements.
|
See Index to Consolidated Financial Statements under Item 8 on Page 51 of this report.
|
2.
|
Financial Statement Schedule.
|
The following additional financial statement schedule should be considered in conjunction with our consolidated financial statements. All other schedules have been omitted because the required information is either not applicable or not sufficiently material to require submission of the schedule:
SCHEDULE II
SCHEDULE II
VALUATION AND QUALIFYING ACCOUNTS
|
Column A
|
Column B
|
Column C
|
Column D
|
Column E
|
||||||||||||
|
Description
|
Balance at
Beginning of Period |
Additions Charged to
Expenses or Other Accounts* |
Deductions Credited to Expenses or Other Accounts**
|
Balance at
End of Period |
||||||||||||
|
|
(in millions)
|
|||||||||||||||
|
2017
|
|
|
|
|
||||||||||||
|
Tax valuation allowance
|
$
|
129
|
|
$
|
14
|
|
$
|
(5
|
)
|
$
|
138
|
|
||||
|
2016
|
|
|
|
|
||||||||||||
|
Tax valuation allowance
|
$
|
131
|
|
$
|
22
|
|
$
|
(24
|
)
|
$
|
129
|
|
||||
|
2015
|
|
|
|
|
||||||||||||
|
Tax valuation allowance
|
$
|
134
|
|
$
|
6
|
|
$
|
(9
|
)
|
$
|
131
|
|
||||
* Additions include current year additions charged to expenses and current year build due to increases in net deferred tax assets, return to provision true-ups, other adjustments and OCI impact to deferred taxes.
** Deductions include current year releases credited to expenses and current year reductions due to decreases in net deferred tax assets, return to provision true-ups, other adjustments and OCI impact to deferred taxes.
105
|
3.
|
Exhibits.
|
Exhibits are incorporated herein by reference or are filed with this report as indicated below (numbered in accordance with Item 601 of Regulation S-K):
|
Incorporation by Reference
|
||||||||||||
|
Exhibit
Number
|
Description
|
Form
|
Date
|
Exhibit
Number
|
Filed
Herewith
|
|||||||
|
2.1
|
|
8-K
|
8/5/2014
|
2.1
|
||||||||
|
3.1
|
|
S-1
|
8/16/1999
|
3.1
|
||||||||
|
3.2
|
|
8-K
|
11/20/2012
|
3.1
|
||||||||
|
4.1
|
|
8-K
|
11/27/2001
|
99.3
|
||||||||
|
4.2
|
|
S-3ASR
|
10/24/2007
|
4.01
|
||||||||
|
4.3
|
|
8-K
|
7/20/2010
|
4.02
|
||||||||
|
4.4
|
|
8-K
|
9/13/2012
|
4.01
|
||||||||
|
4.5
|
|
8-K
|
6/21/2013
|
4.01
|
||||||||
|
4.6
|
|
8-K
|
9/22/2016
|
4.01
|
||||||||
|
10.1
|
|
10-K
|
12/22/2006
|
10.8
|
||||||||
|
10.2
|
|
8-K
|
11/12/2004
|
10.1
|
||||||||
|
10.3
|
|
8-K
|
11/12/2004
|
10.2
|
||||||||
|
10.4
|
|
10-Q
|
9/5/2008
|
10.1
|
||||||||
|
10.5
|
|
10-K
|
12/21/2007
|
10.23
|
||||||||
106
|
Incorporation by Reference
|
||||||||||||
|
Exhibit
Number
|
Description
|
Form
|
Date
|
Exhibit
Number
|
Filed
Herewith
|
|||||||
|
10.6
|
|
8-K
|
11/12/2004
|
10.3
|
||||||||
|
10.7
|
|
10-Q
|
9/5/2008
|
10.2
|
||||||||
|
10.8
|
|
DEF14A
|
1/27/2009
|
Appendix A
|
||||||||
|
10.9
|
|
10‑K
|
12/20/2010
|
10.17
|
||||||||
|
10.10
|
|
10-K
|
12/21/2009
|
10.31
|
||||||||
|
10.11
|
|
10‑K
|
12/20/2010
|
10.19
|
||||||||
|
10.12
|
|
10-K
|
12/21/2009
|
10.32
|
||||||||
|
10.13
|
|
10‑K
|
12/20/2010
|
10.21
|
||||||||
|
10.14
|
|
10-K
|
12/21/2015
|
10.26
|
||||||||
|
10.15
|
|
10-K
|
12/21/2015
|
10.28
|
||||||||
|
10.16
|
|
10-K
|
12/21/2015
|
10.29
|
||||||||
|
10.17
|
|
X
|
||||||||||
|
10.18
|
|
10-Q
|
3/9/2006
|
10.63
|
||||||||
|
10.19
|
|
10-K
|
12/21/2009
|
10.39
|
||||||||
|
10.20
|
|
X
|
||||||||||
|
10.21
|
|
DEF14A
|
2/6/2015
|
Annex A
|
||||||||
|
10.22
|
|
8-K
|
4/10/2008
|
10.1
|
||||||||
107
|
Incorporation by Reference
|
||||||||||||
|
Exhibit
Number
|
Description
|
Form
|
Date
|
Exhibit
Number
|
Filed
Herewith
|
|||||||
|
10.23
|
|
10-K
|
12/22/2014
|
10.35
|
||||||||
|
10.24
|
|
8-K
|
4/10/2008
|
10.3
|
||||||||
|
10.25
|
|
10-K
|
12/22/2014
|
10.37
|
||||||||
|
10.26
|
|
10-K
|
12/21/2009
|
10.50
|
||||||||
|
10.27
|
|
10-K
|
12/22/2014
|
10.39
|
||||||||
|
10.28
|
|
8-K
|
8/5/2014
|
10.1
|
||||||||
|
10.29
|
|
8-K
|
8/5/2014
|
10.2
|
||||||||
|
10.30
|
|
8-K
|
8/5/2014
|
10.3
|
||||||||
|
10.31
|
|
8-K
|
8/5/2014
|
10.4
|
||||||||
|
10.32
|
|
8-K
|
8/5/2014
|
10.5
|
||||||||
108
|
Incorporation by Reference
|
||||||||||||
|
Exhibit
Number
|
Description
|
Form
|
Date
|
Exhibit
Number
|
Filed
Herewith
|
|||||||
|
10.33
|
|
8-K
|
9/17/2014
|
10.2
|
||||||||
|
10.34
|
|
8-K
|
6/10/2015
|
10.1
|
||||||||
|
10.35
|
|
8-K
|
7/17/2017
|
10.1
|
||||||||
|
10.36
|
|
10-K
|
12/22/2014
|
10.62
|
||||||||
|
10.37
|
|
10-K
|
12/21/2015
|
10.70
|
||||||||
|
10.38
|
|
10-K
|
12/21/2015
|
10.71
|
||||||||
|
10.39
|
|
10-Q
|
3/8/2016
|
10.1
|
||||||||
|
10.40
|
|
X
|
||||||||||
|
11.1
|
|
X
|
||||||||||
|
12.1
|
|
X
|
||||||||||
|
21.1
|
|
X
|
||||||||||
|
23.1
|
|
X
|
||||||||||
|
24.1
|
|
X
|
||||||||||
|
31.1
|
|
X
|
||||||||||
|
31.2
|
|
X
|
||||||||||
|
32.1
|
|
X
|
||||||||||
109
|
Incorporation by Reference
|
||||||||||||
|
Exhibit
Number
|
Description
|
Form
|
Date
|
Exhibit
Number
|
Filed
Herewith
|
|||||||
|
32.2
|
|
X
|
||||||||||
|
101.INS
|
XBRL Instance Document.
|
X
|
||||||||||
|
101.SCH
|
XBRL Taxonomy Extension Schema Document.
|
X
|
||||||||||
|
101.CAL
|
XBRL Taxonomy Extension Calculation Linkbase Document.
|
X
|
||||||||||
|
101.LAB
|
XBRL Taxonomy Extension Label Linkbase Document.
|
X
|
||||||||||
|
101.PRE
|
XBRL Taxonomy Extension Presentation Linkbase Document.
|
X
|
||||||||||
|
101.DEF
|
XBRL Taxonomy Extension Definition Linkbase Document.
|
X
|
||||||||||
|
*
|
Indicates management contract or compensatory plan, contract or arrangement.
|
+ Pursuant to a request for confidential treatment, confidential portions of this Exhibit have been redacted and have been
filed separately with the Securities and Exchange Commission.
110
SIGNATURES
Pursuant to the requirements of Section 13 or 15(d) of the Securities Exchange Act of 1934, the registrant has duly caused this report to be signed on its behalf by the undersigned, thereunto duly authorized.
|
|
|
AGILENT TECHNOLOGIES, INC.
|
||
|
|
|
BY
|
|
/s/ MICHAEL TANG
|
|
Michael Tang
|
||||
|
Senior Vice President,
|
||||
|
General Counsel and Secretary
|
||||
Date:
December 21, 2017
111
POWER OF ATTORNEY
KNOW ALL PERSONS BY THESE PRESENTS, that each person whose signature appears below constitutes and appoints Michael Tang and P. Diana Chiu, or either of them, his or her attorneys-in-fact, for such person in any and all capacities, to sign any amendments to this report and to file the same, with exhibits thereto, and other documents in connection therewith, with the Securities and Exchange Commission, hereby ratifying and confirming all that any of said attorneys-in-fact, or substitute or substitutes, may do or cause to be done by virtue hereof. Pursuant to the requirements of the Securities Exchange Act of 1934, this report has been signed below by the following persons on behalf of the registrant and in the capacities and on the dates indicated.
|
Signature
|
Title
|
Date
|
||
|
/s/ MICHAEL R. MCMULLEN
|
Director, President and Chief Executive Officer
|
December 21, 2017
|
||
|
Michael R. McMullen
|
(Principal Executive Officer)
|
|||
|
/s/ DIDIER HIRSCH
|
Senior Vice President and Chief Financial Officer
|
December 21, 2017
|
||
|
Didier Hirsch
|
(Principal Financial Officer)
|
|||
|
/s/ RODNEY GONSALVES
|
Vice President, Corporate Controllership
|
December 21, 2017
|
||
|
Rodney Gonsalves
|
(Principal Accounting Officer)
|
|||
|
/s/ KOH BOON HWEE
|
|
Chairman of the Board of Directors
|
|
December 21, 2017
|
|
Koh Boon Hwee
|
|
|
|
|
|
/s/ HANS E. BISHOP
|
Director
|
December 21, 2017
|
||
|
Hans E. Bishop
|
||||
|
/s/ PAUL N. CLARK
|
Director
|
December 21, 2017
|
||
|
Paul N. Clark
|
||||
|
/s/ JAMES G. CULLEN
|
Director
|
December 21, 2017
|
||
|
James G. Cullen
|
||||
|
/s/ ROBERT J. HERBOLD
|
Director
|
December 21, 2017
|
||
|
Robert J. Herbold
|
||||
|
/s/ HEIDI KUNZ
|
Director
|
December 21, 2017
|
||
|
Heidi Kunz
|
||||
|
/s/ DANIEL K. PODOLSKY, M.D.
|
Director
|
December 21, 2017
|
||
|
Daniel K. Podolsky, M.D.
|
||||
|
/s/ SUE H. RATAJ
|
Director
|
December 21, 2017
|
||
|
Sue H. Rataj
|
||||
|
/s/ GEORGE A. SCANGOS, Ph D
|
Director
|
December 21, 2017
|
||
|
George A. Scangos, Ph D.
|
||||
|
/s/ TADATAKA YAMADA, M.D.
|
Director
|
December 21, 2017
|
||
|
Tadataka Yamada, M.D.
|
||||
112
TABLE OF CONTENTS
Part IItem 1. BusinessItem 1A. Risk FactorsItem 1B. Unresolved Staff CommentsItem 2. PropertiesItem 3. Legal ProceedingsItem 4. Mine Safety DisclosuresPart IIItem 5. Market For The Registrant's Common Equity, Related Stockholder Matters and Issuer Purchases Of Equity SecuritiesItem 6. Selected Financial DataItem 7. Management's Discussion and Analysis Of Financial Condition and Results Of OperationsItem 7A. Quantitative and Qualitative Disclosures About Market RiskItem 8. Financial Statements and Supplementary DataItem 9. Changes in and Disagreements with Accountants on Accounting and Financial DisclosureItem 9A. Controls and ProceduresItem 9B. Other InformationPart IIIItem 10. Directors, Executive Officers and Corporate GovernanceItem 11. Executive CompensationItem 12. Security Ownership Of Certain Beneficial Owners and Management and Related Stockholder MattersItem 13. Certain Relationships and Related Transactions, and Director IndependenceItem 14. Principal Accounting Fees and ServicesPart IVItem 15. Exhibits and Financial Statement Schedules