AAON, INC.
10-Ks and 10-Qs
|
|
|
|
|
|
|
|
|
|
|
|
|
|
|
|
|
|
|
|
|
|
|
|
|
|
|
|
|
|
|
|
|
|
|
|
|
|
|
|
|
|
|
|
|
|
|
|
|
|
|
|
|
|
|
|
|
|
|
UNITED STATES
SECURITIES AND EXCHANGE COMMISSION
Washington, D.C. 20549
FORM 10-K
|
[
X
]
|
ANNUAL REPORT PURSUANT TO SECTION 13 OR 15(d) OF THE SECURITIES EXCHANGE ACT OF 1934
|
For the fiscal year ended December 31, 2011
or
|
[_]
|
TRANSITION REPORT PURSUANT TO SECTION 13 OR 15(d) OF THE SECURITIES EXCHANGE ACT OF 1934
|
For the transition period from _____________________________ to _____________________________
Commission file number: 0-18953
AAON, INC.
(Exact name of registrant as specified in its charter)
| Nevada | 87-0448736 |
|
(State or other jurisdiction
|
(IRS Employer
|
| of incorporation or organization) | Identification No.) |
| 2425 South Yukon, Tulsa, Oklahoma | 74107 |
| (Address of principal executive offices) | (Zip Code) |
Registrant's telephone number, including area code: (918) 583-2266
Securities registered pursuant to Section 12(g) of the Act:
Common Stock, par value $.004
(Title of Class)
Rights to Purchase Series A Preferred Stock
(Title of Class)
Indicate by check mark if the registrant is a well-known seasoned issuer, as defined in Rule 405 of the Securities Act.
[_] Yes [X] No
Indicate by check mark if the registrant is not required to file reports pursuant to Section 13 or 15(d) of the Act.
[_] Yes [X] No
Indicate by check mark whether the registrant (1) has filed all reports required to be filed by Section 13 or 15(d) of the Securities Exchange Act of 1934 during the preceding 12 months (or for such shorter period that the registrant was required to file such reports), and (2) has been subject to such filing requirements for the past 90 days.
[X] Yes [_] No
Indicate by check mark whether the registrant has submitted electronically and posted on its corporate Web site, if any, every Interactive Data File required to be submitted and posted pursuant to Rule 405 of Regulation S-T during the preceding 12 months (or for such shorter period that the registrant was required to submit and post such files).
[X]
Yes [_] No
Indicate by check mark if disclosure of delinquent filers pursuant to Item 405 of Regulation S-K is not contained herein, and will not be contained, to the best of registrant's knowledge, in definitive proxy or information statements incorporated by reference in Part III of this Form 10-K or any amendment to this Form 10-K.
[X]
Indicate by check mark whether the registrant is a large accelerated filer, an accelerated filer, a non-accelerated filer or a smaller reporting company (as defined in Rule 12b-2 of the Securities Exchange Act of 1934).
| Large accelerated filer [_] | Accelerated filer [X] |
| Non-accelerated filer [_] | Smaller reporting company [_] |
Indicate by check mark whether the registrant is a shell company (as defined by Rule 12b-2 of the Act.)
[_] Yes [X] No
The aggregate market value of the common equity held by non-affiliates computed by reference to the closing price of registrant’s common stock on the last business day of registrant’s most recently completed second quarter (June 30, 2011) was $404.5 million.
As of February 29
,
2012, registrant had outstanding a total of 24,574,058
shares of its $.004 par value Common Stock.
DOCUMENTS INCORPORATED BY REFERENCE
Portions of registrant's definitive Proxy Statement to be filed in connection with the Annual Meeting of Stockholders to be held May 15, 2012, are incorporated into Part III.
| TABLE OF CONTENTS | ||||
| Item Number and Caption |
Page
Number
|
|||
| PART I | ||||
| 1. | Business. | 1 | ||
| 1A. | Risk Factors. | 4 | ||
| 1B. | Unresolved Staff Comments. | 6 | ||
| 2. | Properties. | 6 | ||
| 3. | Legal Proceedings. | 7 | ||
| 4. | Mine Safety Disclosure. | 7 | ||
| PART II | ||||
| 5. | Market for Registrant's Common Equity, Related Stockholder Matters and Issuer Purchases of Equity Securities. | 7 | ||
| 6. | Selected Financial Data. | 10 | ||
| 7. | Management's Discussion and Analysis of Financial Condition and Results of Operations. | 10 | ||
| 7A. | Quantitative and Qualitative Disclosures About Market Risk. | 19 | ||
| 8. | Financial Statements and Supplementary Data. | 19 | ||
| 9. | Changes in and Disagreements with Accountants on Accounting and Financial Disclosure. | 19 | ||
| 9A. | Controls and Procedures. | 20 | ||
| 9B. | Other Information. | 22 | ||
| PART III | ||||
| 10. | Directors, Executive Officers and Corporate Governance. | 22 | ||
| 11. | Executive Compensation. | 22 | ||
| 12. | Security Ownership of Certain Beneficial Owners and Management and Related Stockholder Matters. | 22 | ||
| 13. | Certain Relationships and Related Transactions. | 22 | ||
| 14. | Principal Accountant Fees and Services. | 22 | ||
|
PART IV
|
||||
| 15. | Exhibits and Financial Statement Schedules. | 23 | ||
Forward-Looking Statements
This Annual Report includes “forward-looking statements” within the meaning of the Private Securities Litigation Reform Act of 1995. Words such as “expects”, “anticipates”, “intends”, “plans”, “believes”, “seeks”, “estimates”, “should”, “will”, and variations of such words and similar expressions are intended to identify such forward-looking statements. These statements are not guarantees of future performance and involve certain risks, uncertainties and assumptions, which are difficult to predict. Therefore, actual outcomes and results may differ materially from what is expressed or forecasted in such forward-looking statements. Readers are cautioned not to place undue reliance on these forward-looking statements, which speak only as of the date on which they are made. We undertake no obligations to update publicly any forward-looking statements, whether as a result of new information, future events or otherwise. Important factors that could cause results to differ materially from those in the forward-looking statements
include (1) the timing and extent of changes in raw material and component prices, (2) the effects of fluctuations in the commercial/industrial new construction market, (3) the timing and extent of changes in interest rates, as well as other competitive factors during the year, and (4) general economic, market or business conditions.
General Development and Description of Business
AAON, Inc., a Nevada corporation, was incorporated on August 18, 1987. We have two operating subsidiaries, AAON, Inc., an Oklahoma corporation and AAON Coil Products, Inc., a Texas corporation. Unless the context otherwise requires, references in this Annual Report to “AAON,” the “Company”, “we”, “us”, “our”, or “ours” refer to AAON, Inc., and our subsidiaries.
We are engaged in the manufacture and sale of air-conditioning and heating equipment. Our products consist of rooftop units, chillers, air-handling units, make-up air units, heat recovery units, condensing units, commercial self contained units and coils.
Products and Markets
Our products serve the commercial and industrial new construction and replacement markets. To date, our sales have been primarily to the domestic market. Foreign sales accounted for approximately 5% of our sales in 2011.
Our rooftop and condenser markets consist of units installed on commercial or industrial structures of generally less than 10 stories in height. Our air-handling units, commercial self-contained units, chillers, and coils are applicable to all sizes of commercial and industrial buildings.
The size of these markets is determined primarily by the number of commercial and industrial building completions. The replacement market consists of products installed to replace existing units/components that are worn or damaged. Historically, approximately half of the industry's market has consisted of replacement units.
The commercial and industrial new construction market is subject to cyclical fluctuations in that it is generally tied to housing starts, but has a lag factor of 6-18 months. Housing starts, in turn, are affected by such factors as interest rates, the state of the economy, population growth and the relative age of the population. When new construction is down, we emphasize the replacement market.
Based on our 2011 level of sales of $266 million, we estimate that we have approximately a 14% plus share of the rooftop market and a 1% share of the coil market. Approximately 55% of our sales were generated from the sale to the renovation and replacement markets and 45% from new construction. The percentage of sales for new construction vs. replacement to particular customers is related to the customer’s stage of development.
1
We purchase certain components, fabricate sheet metal and tubing and then assemble and test the finished products. Our primary finished products consist of a single unit system containing heating, cooling and/or heat recovery components in a self-contained cabinet, referred to in the industry as "unitary" products. Our other finished products are chillers, coils, air-handling units, condensing units, make-up air units, heat recovery units and commercial self-contained units.
We offer four groups of rooftop units. The RQ Series consisting of six cooling sizes ranging from one to six tons; the RN Series offered in 18 cooling sizes ranging from six to 70 tons, and an expansion of the RN series will be introduced in 2012 that will increase the cooling range up to 140 tons and the number of cooling sizes from 18 to 26. The RL Series, which is offered in 15 cooling sizes ranging from 40 to 230 tons; and the HA Series, which is a horizontal discharge package for either rooftop or ground installation offered in eight sizes ranging from seven and one-half to 50 tons. We also offer the SA and SB models as an indoor package water cooled units with cooling capacities of 2 to 70 tons.
We manufacture a Model LC Chiller, air cooled, and a Model LL chiller, which is available in both air-cooled condensing and evaporative cooled configurations covering a range of 3 to 540 tons.
Our air-handling units consist of the F1 and H3/V3 Series and the modular (M2 and M3) Series as well as air handling unit versions of the RN, RL and SA units.
Our heat recovery option applicable to our RQ, RN and RL units, as well as our M2 and M3 Series air handlers, respond to the U.S. Clean Air Act mandate to increase fresh air in commercial structures. Our products are designed to compete on the higher quality end of standardized products.
Performance characteristics of our products range in cooling capacity from 1½ to 540 tons and in heating capacity from 69,000 - 9,000,000 BTU's. All of our products meet the Department of Energy's minimum efficiency standards, which define the maximum amount of energy to be used in producing a given amount of cooling. Many of our units far exceed these minimum standards and are among the highest efficiency units currently available.
A typical commercial building installation requires a ton of air-conditioning for every 300-400 square feet or, for a 100,000 square foot building, 250 tons of air-conditioning, which can involve multiple units
Major Customers
No customer accounted for 10% of our sales during 2011, 2010 or 2009.
Sources and Availability of Raw Materials
The most important materials we purchase are steel, copper and aluminum, which are obtained from domestic suppliers. We also purchase from other domestic manufacturers certain components, including compressors, electric motors and electrical controls used in our products. We attempt to obtain the lowest possible cost in our purchases of raw materials and components, consistent with meeting specified quality standards. We are not dependent upon any one source for raw materials or the major components of our manufactured products. By having multiple suppliers, we believe that we will have adequate sources of supplies to meet our manufacturing requirements for the foreseeable future.
We attempt to limit the impact of increases in raw materials and purchased component prices on our profit margins by negotiating with each of our major suppliers on a term basis from six months to one year.
Distribution
We employ a sales staff of 20 individuals and utilize approximately 93 independent manufacturer representatives (“Representatives”) organizations having 108 offices to market our products in the United States and Canada. We also have one international sales organization, which utilizes 12 distributors in other countries. Sales are made directly to the contractor or end user, with shipments being made from our Tulsa, Oklahoma and Longview, Texas plants to the job site.
2
Our products and sales strategy focus on niche markets. The targeted markets for our equipment are customers seeking products of better quality than offered, and/or options not offered, by standardized manufacturers.
To support and service our customers and the ultimate consumer, we provide parts availability through our sales offices and have factory service organizations at each of our plants. Also, a number of the manufacturer representatives we utilize have their own service organizations, which, in connection with us, provide the necessary warranty work and/or normal service to customers.
Our product warranty policy is: the earlier of one year from the date of first use or 18 months from date of shipment for parts only; an additional four years for compressors (if applicable); 15 years on aluminized steel gas-fired heat exchangers (if applicable); 25 years on stainless steel heat exchangers (if applicable); and 10 years on gas-fired heat exchangers in RL products (if applicable). With the introduction of the RQ product line in 2010, our warranty policy for the RQ series was implemented to cover parts for two years from date of unit shipment and labor for one year from date of unit shipment.
Research and Development
The ability to successfully bring new products to market that meet new energy efficiency standards, environmental regulations, and are engineered for performance, flexibility, and serviceability in a timely manner has rapidly become a critical factor in competing in the heating, ventilation and air conditioning (“HVAC”) equipment industry. We must continually develop new and improved products in order to compete effectively and to meet evolving regulatory standards in all of our major product lines.
All of our R&D activities are self-sponsored, rather than customer-sponsored. R&D has involved the RQ, RN and RL (rooftop units), F1, H/V, M2 and M3 (air handlers), LC and LL (chillers), CB and CC (condensing units), SA (commercial self-contained units) and BL (boilers), as well as component evaluation and refinement, development of control systems and new product development. We incurred research and development expenses of approximately $4.8 million, $3.6 million and $3.1 million in 2011, 2010 and 2009, respectively.
Backlog
Our current backlog as of March 1, 2012 was approximately $55.3 million compared to approximately $37.9 million as of March 1, 2011. The current backlog consists of orders considered by management to be firm and generally are filled on average within approximately 60 days to 92 days after an order is deemed to become firm; however, the orders are subject to cancellation by the customers.
Working Capital Practices
Working capital practices in the industry center on inventories and accounts receivable. Our management regularly reviews our working capital with a view of maintaining the lowest level consistent with requirements of anticipated levels of operation. Our greatest needs arise during the months of July - November, the peak season for inventory (primarily purchased material) and accounts receivable. Our working capital requirements are generally met by cash flow from operations and a bank revolving credit facility, which currently permits borrowings up to $30 million. We believe that we will have sufficient funds available to meet our working capital needs for the foreseeable future. We expect to renew our revolving credit agreement in July 2012.
Seasonality
Sales of our products are moderately seasonal with the peak period being July - November of each year.
3
Competition
In the standardized market, we compete primarily with Lennox International, Inc., Ingersoll Rand Limited, Johnson Controls Inc. and United Technologies Corporation. All of these competitors are substantially larger and have greater resources than we do. In the custom market, we compete with many larger and smaller manufacturers. Our products compete on the basis of total value, quality, function, serviceability, efficiency, availability of product, product line recognition and acceptability of sales outlet. However, in new construction where the contractor is the purchasing decision maker, we are often at a competitive disadvantage because of the emphasis placed on initial cost. In the replacement market and other owner-controlled purchases, we have a better chance of getting the business since quality and long-term cost are generally taken into account.
Employees
As of March 1, 2012, we employed approximately 1,491 permanent employees and 15 temporary employees. Our employees are not currently represented by unions. Management considers relations with our employees to be good.
Patents, Trademarks, Licenses and Concessions
We do not consider any patents, trademarks, licenses or concessions to be material to our business operations, other than patents issued regarding our heat recovery wheel option, blower, gas-fired heat exchanger and evaporative condenser desuperheater which have terms of twenty years with expiration dates ranging from 2016 to 2022.
Environmental Matters
Laws concerning the environment that affect or could affect our domestic operations include, among others, the Clean Water Act, the Clean Air Act, the Resource Conservation and Recovery Act, the Occupational Safety and Health Act, the National Environmental Policy Act, the Toxic Substances Control Act, regulations promulgated under these Acts, and any other federal, state or local laws or regulations governing environmental matters. We believe that we are in compliance with these laws and that future compliance will not materially affect our earnings or competitive position.
Available Information
Our Internet website address is http://www.aaon.com. Our annual reports on Form 10-K, quarterly reports on Form 10-Q, current reports on Form 8-K and amendments to those reports filed or furnished pursuant to Section 13(a) or 15(d) of the Exchange Act of 1934 will be available through our Internet website as soon as reasonably practical after we electronically file such material with, or furnish it to, the SEC.
The following risks and uncertainties may affect our performance and results of operations.
Our business has been hurt by the current economic downturn
.
Our business is affected by a number of economic factors, including the level of economic activity in the markets in which we operate. The state of the United States economy has negatively impacted the commercial and industrial new construction markets. The current decline in economic activity in the United States could materially affect our financial condition and results of operations. Sales in the commercial and industrial new construction markets correlate closely to the number of new homes and buildings that are built, which in turn is influenced by cyclical factors such as interest rates, inflation, consumer spending habits, employment rates and other macroeconomic factors over which we have no control. In the heating, ventilation, and air conditioning (“HVAC”) business, a decline in economic activity as a result of these cyclical or other factors typically results in a decline in new construction and replacement purchases, which has resulted in a decrease in our sales volume and profitability.
4
We may be adversely affected by problems in the availability, or increases in the prices, of raw materials and components
.
Problems in the availability, or increases in the prices, of raw materials or components could depress our sales or increase the costs of our products. We are dependent upon components purchased from third parties, as well as raw materials such as steel, copper and aluminum. We enter into cancelable and noncancelable contracts on terms from six months to one year for raw materials and components at fixed prices. However, if a key supplier is unable or unwilling to meet our supply requirements, we could experience supply interruptions or cost increases, either of which could have an adverse effect on our gross profit.
We risk having losses resulting from the use of non-cancelable fixed price contracts.
Historically, we attempted to limit the impact of price fluctuations on commodities by entering into non-cancelable fixed price contracts with our major suppliers for periods of 6 - 18 months. We expect to receive delivery of raw materials from our fixed price contracts for use in our manufacturing operations. These fixed price contracts are not accounted for as derivative instruments since they meet the normal purchases and sales exemption.
We may not be able to successfully develop and market new products
.
Our future success will depend upon our continued investment in research and new product development and our ability to continue to realize new technological advances in the HVAC industry. Our inability to
continue to successfully develop and market new products or our inability to achieve technological advances on a pace consistent with that of our competitors could lead to a material adverse effect on our business and results of operations.
We may incur material costs as a result of warranty and product liability claims that would negatively affect our profitability
.
The development, manufacture, sale and use of our products involve a risk of warranty and product liability claims. Our product liability insurance policies have limits that, if exceeded, may result in material costs that would have an adverse effect on our future profitability. In addition, warranty claims are not covered by our product liability insurance and there may be types of product liability claims that are also not covered by our product liability insurance.
We may not be able to compete favorably in the highly competitive HVAC business
.
Competition in our various markets could cause us to reduce our prices or lose market share, or could negatively affect our cash flow, which could have an adverse effect on our future financial results. Substantially all of the markets in which we participate are highly competitive. The most significant competitive factors we face are product reliability, product performance, service and price, with the relative importance of these factors varying among our product line. Other factors that affect competition in the HVAC market include the development and application of new technologies and an increasing emphasis on the development of more efficient HVAC products. Moreover, new product introductions are an important factor in the market categories in which our products compete. Several of our competitors have greater financial and other resources than we have, allowing them to invest in more extensive research and development. We may not be able to compete successfully against current and future competition and current and future competitive pressures faced by us may materially adversely affect our business and results of operations.
The loss of Norman H. Asbjornson could impair the growth of our business
.
Norman H. Asbjornson, our founder, has served as our President and Chief Executive Officer from inception to date. He has provided the leadership and vision for our growth. Although important responsibilities and functions have been delegated to other highly experienced and capable management personnel, our products are technologically advanced and well positioned for sales into the future and we carry key man insurance on Mr. Asbjornson, his death, disability or retirement could impair the growth of our business. We do not have an employment agreement with Mr. Asbjornson.
5
Our stockholder rights plan and some provisions in our bylaws and Nevada law could delay or prevent a change in control
.
Our stockholder rights plan and some provisions in our bylaws and Nevada law could delay or prevent a change in control, which could adversely affect the price of our common stock.
Our business is subject to the risks of interruptions by problems such as computer viruses.
Despite our implementation of network security measures, our services are vulnerable to computer viruses, break-ins and similar disruptions from unauthorized tampering with our computer systems. Any such event could have a material adverse affect on our business.
Exposure to environmental liabilities could adversely affect our results of operations
.
Our future profitability could be adversely affected by current or future environmental laws. We are subject to extensive and changing federal, state and local laws and regulations designed to protect the environment in the United States and in other parts of the world. These laws and regulations could impose liability for remediation costs and result in civil or criminal penalties in case of non-compliance. Compliance with environmental laws increases our costs of doing business. Because these laws are subject to frequent change, we are unable to predict the future costs resulting from environmental compliance.
Extreme governmental regulations.
We always face the possibility of new governmental regulations which could have a substantial or even extreme negative effect on our operations and profitability. Specifically, Final Rule, Regulatory Identification No. 1904-AC23, published on March 7, 2011, which, if fully implemented subsequent to the current suspense date of January 1, 2013, would have highly detrimental consequences to all industries involving sales of energy using products by imposing burdensome, excessive and, in part, impossible testing requirements.
We are subject to adverse changes in tax laws.
Our tax expense or benefits could be adversely affected by changes in tax provisions, unfavorable findings in tax examinations or differing interpretations by tax authorities. We are unable to estimate the impact that current and future tax proposals and tax laws could have on our results of operations. We are currently under review by the IRS for tax years 2008 and 2009 and three state sales tax audits for which we do not expect any major assessments.
None.
As of December 31, 2011, we own approximately 1.5 million square feet of space for office, manufacturing, warehouse and assembly operations in Tulsa, Oklahoma and Longview, Texas. We believe that our facilities are well maintained and are in good condition and suitable for the conduct of our business.
Our plant and office facilities in Tulsa, Oklahoma, consist of a 342,000 sq. ft. building (327,000 sq. ft. of manufacturing/warehouse space and 15,000 sq. ft. of office space) located on a 12-acre tract of land at 2425 South Yukon Avenue (the “original facility”), and a 861,000 sq. ft. manufacturing/warehouse building and a 54,000 sq. ft. office building (the “expansion facility”) located on a 40-acre tract of land across the street from the original facility (2440 South Yukon Avenue). We own the original facility and the expansion facility. Both plants are of sheet metal construction.
6
Our manufacturing area is in heavy industrial type buildings, with total coverage by bridge cranes, containing manufacturing equipment designed for sheet metal fabrication and metal stamping. The manufacturing equipment contained in the facilities consists primarily of automated sheet metal fabrication equipment, supplemented by presses. Assembly lines consist of seven cart-type conveyor lines with variable line speed adjustment, which are motor driven. Subassembly areas and production line manning are based upon line speed.
Our operations in Longview, Texas, are conducted in a plant/office building at 203-207 Gum Springs Road, containing 258,000 sq. ft. on 14 acres. The manufacturing area (approximately 251,000 sq. ft.) is located in three 120-foot wide sheet metal buildings connected by an adjoining structure. The remaining 7,000 square feet are utilized as office space. The facility is built for light industrial manufacturing. An additional, contiguous 15 acres were purchased in 2004 and 2005 for future expansion. We own both the existing plant/office building, and the 15 acres designated for future expansion.
We are not a party to any pending legal proceeding which management believes is likely to result in a material liability and no such action is contemplated by or, to the best of our knowledge, has been threatened against us.
Not applicable.
|
Item 5.
|
Market for Registrant's Common Equity, Related Stockholder Matters and Issuer Purchases of Equity Securities.
|
Our common stock is quoted on the NASDAQ Global Select Market under the symbol "AAON".
The table below summarizes the high and low reported sale prices for our common stock for the past two fiscal years. As of the close of business on February 29, 2012, there were 1,006 holders of record, and approximately 4,321 beneficial owners, of our common stock.
|
Quarter Ended
|
High
|
Low
|
||
|
March 31, 2010
|
$15.37
|
$12.43
|
||
|
June 30, 2010
|
$16.84
|
$14.33
|
||
|
September 30, 2010
|
$17.42
|
$13.39
|
||
|
December 31, 2010
|
$19.76
|
$15.27
|
||
|
March 31, 2011
|
$21.98
|
$17.51
|
||
|
June 30, 2011
|
$23.44
|
$20.07
|
||
|
September 30, 2011
|
$24.23
|
$14.91
|
||
|
December 31, 2011
|
$22.98
|
$14.64
|
_______________
At the discretion of the Board of Directors we pay semi-annual cash dividends.
Board approval is required to determine the date of declaration and amount for each semi-annual dividend payment. The Board of Directors approved dividend payments of $0.12 per share related to the 3-for-2 stock split effective June 13, 2011.
7
During 2011 we declared dividends to shareholders of record at the close of business on June 10, 2011 and December 1, 2011 which were paid on July 1, 2011 and December 22, 2011, respectively. We paid cash dividends of $5.9 million and $9.2 million in 2011 and 2010, respectively.
On November 6, 2007, our Board of Directors authorized a stock buyback program, targeting repurchases of up to approximately 10% (2.7 million shares) of our outstanding stock from time to time in open market transactions. On May 12, 2010, we completed the stock buyback program. Through May 12, 2010, we repurchased a total of 2.7 million shares under this program for an aggregate price of $36.1 million, or an average price of $13.36 per share. We purchased the shares at current market prices.
On May 17, 2010, the Board authorized a new stock buyback program, targeting repurchases of up to approximately 5% (1.3 million shares) of our outstanding stock from time to time in open market transactions. Through June 28, 2010, we repurchased a total of approximately 0.718 million shares under this program for an aggregate price of $11.5 million, or an average price of $16.04 per share. We purchased the shares at current market prices. We did not repurchase any of our equity securities during 2011.
On July 1, 2005, we entered into a stock repurchase arrangement by which employee-participants in our 401(k) savings and investment plan are entitled to have shares of AAON stock in their accounts sold to us to provide diversification of their investments. The maximum number of shares to be repurchased is contingent upon the number of shares sold by employees. Through December 31, 2011, we repurchased approximately 1.7 million shares for an aggregate price of $21.5 million, or an average price of $12.71 per share. We purchased the shares at current market prices.
On November 7, 2006, the Board of Directors authorized us to repurchase shares from certain directors and officers following their exercise of stock options. The maximum number of shares to be repurchased is contingent upon the number of shares sold. Through December 31, 2011, we repurchased approximately 0.580 million shares for an aggregate price of $8.1 million, or an average price of $13.98 per share. We purchased the shares at current market prices.
Repurchases during the fourth quarter of 2011 were as follows:
ISSUER PURCHASES OF EQUITY SECURITIES
|
Period
|
(a)
Total Number of Shares (or Units) Purchased
|
(b)
Average Price Paid Per Share (or Unit)
|
(c)
Total Number of Shares (or Units) Purchased as Part of Publicly Announced Plans or Programs
|
(d)
Maximum Number (or Approximate Dollar Value) of Shares (or Units) that May Yet Be Purchased Under the Plans or Programs
|
||||||||||||
|
October 2011
|
15,549 | $ | 18.64 | 15,549 | - | |||||||||||
|
November 2011
|
13,852 | $ | 21.15 | 13,852 | - | |||||||||||
|
December 2011
|
20,118 | $ | 21.09 | 20,118 | - | |||||||||||
|
Total
|
49,519 | $ | 20.34 | 49,519 | - | |||||||||||
8
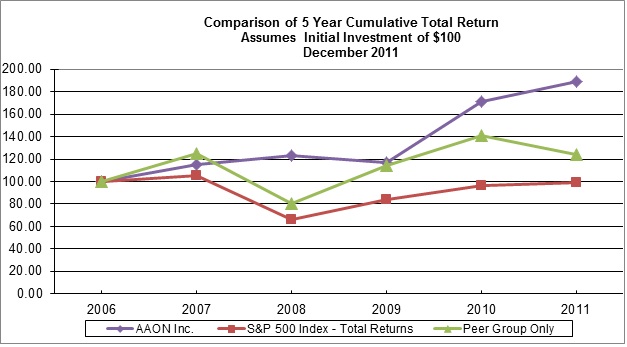
Comparative Stock Performance Graph
The following performance graph compares our cumulative total shareholder return, the NASDAQ Composite and a peer group of U.S. industrial manufacturing companies in the air conditioning, ventilation, and heating exchange equipment markets from December 31, 2006 through December 31, 2011. The graph assumes that $100 was invested at the close of trading December 31, 2006, with reinvestment of dividends. Our peer group includes Lennox International, Inc., Ingersoll Rand Limited, Johnson Controls Inc., and United Technologies Corporation. This table is not intended to forecast future performance of our Common Stock.
|
This stock performance Graph is not deemed to be “soliciting material” or otherwise be considered to be “filed” with the SEC or subject to Regulation 14A or 14C under the Securities Exchange Act of 1934 (Exchange Act) or to the liabilities of Section 18 of the Exchange Act, and should not be deemed to be incorporated by reference into any filing under the Securities Act of 1933 or the Exchange Act, except to the extent the Company specifically incorporates it by reference into such a filing.
9
The following selected financial data should be read in conjunction with our Consolidated Financial Statements and Notes thereto included under Item 8 of this report and "Management's Discussion and Analysis of Financial Condition and Results of Operations" contained in Item 7.
|
Years Ended December 31,
|
||||||||||||||||||||
|
Results of Operations:
|
2011
|
2010
|
2009
|
2008
|
2007
|
|||||||||||||||
|
(in thousands, except per share data)
|
||||||||||||||||||||
|
Net sales
|
$ | 266,220 | $ | 244,552 | $ | 245,282 | $ | 279,725 | $ | 262,517 | ||||||||||
|
Net income
|
$ | 13,986 | $ | 21,894 | $ | 27,721 | $ | 28,589 | $ | 23,156 | ||||||||||
|
Earnings per share*:
|
||||||||||||||||||||
|
Basic
|
$ | 0.57 | $ | 0.87 | $ | 1.07 | $ | 1.09 | $ | 0.83 | ||||||||||
|
Diluted
|
$ | 0.56 | $ | 0.87 | $ | 1.07 | $ | 1.07 | $ | 0.81 | ||||||||||
|
Dividends per share*
|
$ | 0.24 | $ | 0.24 | $ | 0.24 | $ | 0.21 | $ | 0.21 | ||||||||||
|
Weighted average shares outstanding:
|
||||||||||||||||||||
|
Basic*
|
24,690 | 25,198 | 25,780 | 26,340 | 27,942 | |||||||||||||||
|
Diluted*
|
24,881 | 25,339 | 25,963 | 26,782 | 28,391 | |||||||||||||||
| December 31, | ||||||||||||||||||||
|
Financial Position at End of
Fiscal Year:
|
2011
|
2010
|
2009
|
2008
|
2007
|
|||||||||||||||
| (in thousands) | ||||||||||||||||||||
|
Working capital
|
$ | 45,700 | $ | 55,502 | $ | 65,354 | $ | 40,600 | $ | 38,788 | ||||||||||
|
Total assets
|
$ | 178,981 | $ | 160,277 | $ | 156,211 | $ | 140,743 | $ | 137,140 | ||||||||||
|
Long-term and current debt
|
$ | 4,575 | $ | - | $ | 76 | $ | 3,113 | $ | 330 | ||||||||||
|
Total stockholders’ equity
|
$ | 122,504 | $ | 116,739 | $ | 117,999 | $ | 96,522 | $ | 95,420 | ||||||||||
* All share and per share amounts reflect a three-for-two stock split effective June 13, 2011.
Overview
We engineer, manufacture and market air-conditioning and heating equipment consisting of rooftop units, chillers, air-handling units, make-up air units, heat recovery units, condensing units, commercial self-contained units and coils. These products are marketed and sold to retail, manufacturing, educational, medical and other commercial industries. We market our products to all 50 states in the United States and certain provinces in Canada. Foreign sales were approximately 5% of our 2011 sales.
Our business can be affected by a number of economic factors, including the level of economic activity in the markets in which we operate. The recent state of the economy has negatively impacted the commercial and industrial new construction markets. A further decline in economic activity could result in a decrease in our sales volume and profitability. Sales in the commercial and industrial new construction markets correlate closely to the number of new homes and buildings that are built, which in turn is influenced by cyclical factors such as interest rates, inflation, consumer spending habits, employment rates and other macroeconomic factors over which we have no control.
We sell our products to property owners and contractors through a network of manufacturers representatives and our internal sales force. The demand for our products is influenced by national and regional economic and demographic factors. The commercial and industrial new construction market is subject to cyclical fluctuations in that it is generally tied to housing starts, but has a lag factor of 6-18 months. Housing starts, in turn, are affected by such factors as interest rates, the state of the economy, population growth and the relative age of the population. When new construction is down, we emphasize the replacement market.
10
The principal components of cost of goods sold are labor, raw materials, component costs, factory overhead, freight and engineering expense. The principal high volume raw materials used in our manufacturing processes are steel, copper and aluminum and are obtained from domestic suppliers. We also purchase from domestic manufacturers certain components, including compressors, motors and electrical controls. The raw materials market has been volatile during 2011 and 2010 due to the economic environment and uncertainty in the financial markets. For the year ended December 31, 2011 prices for copper and steel increased approximately 3% and 10%, respectively from prior year, while the cost of aluminum decreased approximately 2%. For the year ended December 31, 2010 the cost of copper, steel, and aluminum increased approximately 88.7% and 11.5%, and 66.7% from 2009.
We attempt to limit the impact of price fluctuations of the raw materials used in our manufacturing processes by entering into cancelable and non-cancelable fixed price contracts with our major suppliers for periods of approximately 6 - 18 months. In addition, from time to time we use derivative contracts to partially mitigate the volatility in the prices for some of these commodities.
The following are key highlights and events that impacted our results of operations, cash flows, and financial condition in 2011:
|
·
|
Net sales for 2011 were $266 million, the second highest in the Company’s history in the last 10 years, compared to $245 million in 2010. The increase in net sales was a direct result of the increase in market acceptance of products released during the year and the signing into law of the Tax Relief, Unemployment Insurance Reauthorization and Job Creation Act on December 31, 2010 which provided 100 percent tax depreciation bonus on qualified capital investments put in service through December 31, 2011 which prompted our customers to benefit and take advantage of this provision of the law.
|
|
·
|
We estimate that we have captured approximately 14% plus share of the rooftop market and a 1% share of the coil market. Approximately 55% of our sales were generated from the sale to the renovation and replacement markets and 45% from new construction markets.
|
|
·
|
Income from operations was $22.2 million compared to $32.7 million in 2010. The decline in operational income was primarily due to lower gross margins caused by increases in raw materials and component costs and lost production for 8.5 days that resulted from the collapse of the roof for one of our manufacturing facilities.
|
|
·
|
Net income for 2011 was $13.9 million down by $7.9 million compared to $21.9 million in 2010. The decrease was the result of higher commodity and purchase parts prices and our inability to fully pass on the additional costs to our customers as a result of tight market conditions and fierce competition.
|
|
·
|
We paid $35.9 million in capital expenditures. A loss of approximately $1.8 million was incurred from the trade-in of production equipment that was replaced with new state of the art equipment that combines the latest advancement in automation and laser technology as a result of our strategic vision to improve current manufacturing efficiencies.
|
|
·
|
We paid cash dividends of $5.9 million, and announced a 3-for-2 stock split effective on June 13, 2011.
|
11
Results of Operations
The following is a summary of the income statement information as a percentage of net sales:
|
Years Ending December 31,
|
||||||||||||||||||||||||
|
2011
|
2010
|
2009
|
||||||||||||||||||||||
|
(in thousands)
|
||||||||||||||||||||||||
|
Net sales
|
$ | 266,220 | 100.0% | $ | 244,552 | 100.0% | $ | 245,282 | 100.0% | |||||||||||||||
|
Cost of sales
|
219,939 | 82.6% | 189,364 | 77.4% | 177,737 | 72.5% | ||||||||||||||||||
|
Gross profit
|
46,281 | 17.4% | 55,188 | 22.6% | 67,545 | 27.5% | ||||||||||||||||||
|
Selling, general and
administrative expenses
|
22,310 | 8.4% | 22,546 | 9.2% | 23,850 | 9.7% | ||||||||||||||||||
|
Loss (gain) on disposal of assets
|
1,802 | 0.7% | (73 | ) | (0.03)% | (59 | ) | (0.02)% | ||||||||||||||||
|
Income from operations
|
22,169 | 8.3% | 32,715 | 13.4% | 43,754 | 17.8% | ||||||||||||||||||
|
Interest expense
|
(277 | ) | (0.1)% | (45 | ) | (0.02)% | (9 | ) | 0.0% | |||||||||||||||
| Interest income | 98 | 0.04% | 258 | 0.10% | 71 | 0.03% | ||||||||||||||||||
| Other income (expense), net | (477 | ) | (0.2)% | (235 | ) | (0.10)% | 76 | 0.03% | ||||||||||||||||
|
Income before income taxes
|
21,513 | 8.1% | 32,693 | 13.4% | 43,892 | 17.9% | ||||||||||||||||||
| Income tax provision | 7,527 | 2.8% | 10,799 | 4.4% | 16,171 | 6.6% | ||||||||||||||||||
|
Net income
|
$ | 13,986 | 5.3% | $ | 21,894 | 9.0% | $ | 27,721 | 11.3% | |||||||||||||||
Year Ended December 31, 2011 vs. Year Ended December 31, 2010
Net Sales
Net sales for the year ended December 31, 2011 increased by 9%, or $21.7 million to $266.2 million, compared with the same period in 2010. The increase in net sales was the result of the favorable reception to our new products, a significant increase in the replacement market of approximately 10% over prior year, and increased market share.
Gross Profit
Gross margin decreased by $8.9 million (16.1%) to $46.3 million in 2011 compared to 2010.
As a percentage of sales, gross margins were 17.4% and 22.6% in 2011 and 2010, respectively.
The decrease in gross profit was caused by increases in raw material and component part costs of approximately 6% that we were unable to neutralize completely with price increases for some of our product lines, and increased labor costs and freight cost of 8% and 1%, respectively.
The principal components of cost of goods sold are labor, raw materials, component costs, factory overhead, freight out and engineering expense. The principal high volume raw materials used in our manufacturing processes are steel, copper and aluminum, which are obtained from domestic suppliers. For the year ended December 31, 2011 we experienced price increases in copper and steel of approximately 3% and 10%, and an overall price decrease in aluminum of approximately 2% as compared to 2010.
Selling, General and Administrative Expenses
Selling, General and Administrative (“SG&A”) expenses decreased by $0.236 million, or 1.1% to $22.3 million in 2011 compared to 2010, and as a percentage of net sales, SG&A expenses declined to 8.4% in 2011 from 9.2% in 2010. The decrease was primarily due to lower profit sharing expense of approximately $1.4 million as a result of lower operating income before income tax offset by increases in salaries and employee benefits of $0.6 million, and advertising expense and professional fees of approximately $0.6 million.
12
Interest Expense
Interest expense was approximately $0.277 million and $0.045 million in 2011 and 2010, respectively. The increase in interest expense of $0.232 million in 2011 from prior year was due to increased borrowings on the revolving credit facility. During 2011 we borrowed $82.1 million from the revolving credit facility as compared to $20.8 million in 2010.
Interest on borrowings is payable monthly at LIBOR plus 2.5%. For the year ended December 31, 2011, we paid a weighted average interest rate of approximately 3.4%.
Interest Income
Interest income decreased by approximately $0.160 million to $0.098 million in 2011 compared to the same period in 2010. The decreased was due primarily to all of our investments maturing and no additional funds invested in 2011.
Other Income (Expense)
Other expense, net increased by $0.242 million to $0.477 million in 2011 from $0.235 million in 2010. The increase in other expense is primarily due to repair expenses related to roof damage to
one of our manufacturing facilities in Tulsa, Oklahoma caused by a severe snowstorm in February 2011.
Year Ended December 31, 2010 vs. Year Ended December 31, 2009
Net Sales
Net sales were $244.6 million and $245.3 in 2010 and 2009, respectively. Sales in 2010 remained substantially level with 2009 despite poor economic conditions that caused the non-residential construction market spending to decline by approximately 14.1% from 2009 overall spending, as a result of our strategy of releasing new products in the markets in which we compete while maintaining prices constant which resulted in increased market share.
Gross Profit
Gross margin declined by $12.4 million or 18.3% to $55.2 million in 2010 from $67.5 million in 2010. As a percentage of sales, gross margins were 22.6% and 27.5% in 2010 and 2009, respectively. The decrease in gross margin was primarily a result of the absence of a derivative related to a copper hedge of $2.2 million that we benefited from in 2009, higher raw material and commodity costs, increased labor expenses to relocate a production line and set up new production lines for the Tulsa building addition and related supplies to stock the new lines, and our inability in the current economic environment to implement price increases to our minimum sales prices for HVAC units.
The raw materials market was volatile during 2010 and 2009 due to the economic environment. We experienced price increases for copper, steel and aluminum of approximately 88.7%, 11.5%, and 66.7%, respectively in 2010 compared to 2009.
Selling, General and Administrative Expenses
Selling, General and Administrative (“SG&A”) expenses decreased by $1.3 million, or 5.5% to $22.5 million in 2010 compared to 2009, and as a percentage of net sales, SG&A expenses declined to 9.2% in 2010 from 9.7% in 2009. The decrease was primarily due to lower profit sharing expense of $1.0 million as a result of lower
operating income before income tax
.
Interest Expense
Interest expense was approximately $0.045 million and $0.009 million in 2010 and 2009, respectively. The increase in interest expense of approximately $0.036 million was due to increased borrowings on the revolving credit facility. We borrowed $20.8 million from the revolving credit facility during 2010 compared to $10.0 million during 2009. We paid interest on borrowings at the greater of 4.0% or LIBOR plus 2.5% or at an average of approximately 4.0% for the year ended December 31, 2010.
13
Interest Income
Interest income was approximately $0.258 million and $0.071 million in 2010 and 2009, respectively. The increase in interest income of $0.187 million in 2010 from 2009 was due primarily to interest income generated from investments in corporate notes and bonds that average approximately $10.9 million in invested funds through September 30, 2010 and ended with a balance of $9.5 million at December 31, 2010.
Other Income (Expense)
Other expense, net decreased by $0.311 million to $0.235 million in 2010 from income of $0.076 million in 2009 due to the termination of a lease for one of our facilities during the second quarter of 2009.
Liquidity and Capital Resources
Our working capital and capital expenditure requirements are generally met through net cash provided by operations and the occasional use of the revolving bank line of credit based on our current liquidity at the time.
General
On July 30, 2011 we renewed and increased the line of credit with the Bank of Oklahoma, National Association from $15.2 million to $30 million. The revolving line of credit matures on July 29, 2012. We expect to renew our line of credit in July 2012 with favorable terms as we do not anticipate a tightening of funds in the financial markets. Under the line of credit, there is one standby letter of credit of $0.9 million. At December 31, 2011 we have approximately $ 24.5 million of borrowings available under the revolving credit facility. No fees are associated with the unused portion of the committed amount.
As of December 31, 2011 our outstanding balance under the revolving credit facility is $4.6 million and no borrowings were outstanding at December 31, 2010. Interest on borrowings is payable monthly at LIBOR plus 2.5%. The weighted average interest rate was 3.4% and 4.0% for the years ended December 31, 2011 and 2010, respectively.
At December 31, 2011 we were in compliance with all of the covenants under the revolving credit facility. We are obligated to comply with certain financial covenants under the revolving credit facility. These covenants require that we meet certain parameters related to our tangible net worth, total liabilities to tangible net worth ratio and working capital. At December 31, 2011 our tangible net worth was $122.5 million which meets the requirement of being at or above $95.0 million. Our total liabilities to tangible net worth ratio were 0.46 to 1.0 which meets the requirement of not being above 2 to 1. Our working capital was $45.7 million which meets the requirement of being at or above $35.0 million. Starting on June 30, 2012 our working capital requirement will change from $35.0 million to $40.0 million.
We repurchased shares of stock under our authorized stock buyback programs, employees’ 401(k) savings, investment plan, and from option exercises of our directors and officers in the open market in the amount of $3.7 million for 0.212 million shares, $19.5 million for 1.2 million shares and $3.1 million for approximately 0.246 million shares of stock in 2011, 2010 and 2009, respectively.
For the year ended December 31, 2011, 2010 and 2009 we paid cash dividends of $5.9 million, $9.2 million, and $5.9 million respectively.
During the quarter ended December 31, 2011, the Company recognized an income tax receivable of approximately $10.0 million. The tax receivable represents the anticipated Federal and State estimated tax over payments as of December 31, 2011 primarily as a result of new equipment purchases placed in service during the year which qualified for the 100% bonus tax depreciation expense allowed under the Tax Relief, Unemployment Insurance Reauthorization and Job Creation Act of 2010.
14
Based on historical performance and current expectations, we believe our cash and cash equivalents balance, the projected cash flows generated from our operations, our existing committed revolving credit facility (or comparable financing) and our expected ability to access capital markets will satisfy our working capital needs, capital expenditures and other liquidity requirements associated with our operations in 2012 and the foreseeable future.
Statement of Cash Flows
The table below reflects a summary of our net cash flows provided by operating activities, net cash flows used in investing activities, and net cash flows used in financing activities for the years indicated.
|
2011
|
2010
|
2009
|
|||||||||||
|
(in millions)
|
|||||||||||||
|
Net cash provided by operating activities
|
$ | 26.5 | $ | 32.2 | $ | 45.2 | |||||||
|
Net cash used in investing activities
|
(24.5 | ) | (28.3 | ) | (9.6 | ) | |||||||
|
Net cash used in financing activities
|
(4.3 | ) | (27.2 | ) | (10.1 | ) | |||||||
Cash Flows from Operating Activities
Net cash provided by operating activities was $26.5 million in 2011 compared to $32.2 million in 2010. This decrease was due to lower net income, and an unfavorable change in working capital. For the year ended December 31, 2011, net income decreased by $7.9 million and includes a non-cash loss on the sale of assets of $1.8 million. For 2010, net income decreased by $5.8 million from 2009.
Significant fluctuations in working capital were as follows:
|
·
|
Inventory - more cash was used in 2011 as improved demand resulted in increased volume and higher prices for raw materials, component, and parts in our inventory balance as compared to 2010 resulting in decreased cash flows of $1.3 million. In 2010, inventory increased by $4.8 million primarily as a result of increased inventory levels associated with an increase in our backlog from 2009 and valuation of inventories associated with higher raw material and component part prices.
|
|
·
|
Accounts receivable - impact of $6.1 million. We experienced improved collection rates as a result of targeted sales discounts for some of our selected customers. In 2010, accounts receivable negatively impacted cash flows by $6.4 million due primarily to slow customer payments and relatively flat sales from the previous year.
|
|
·
|
Accounts payable – accounts payable decreased cash flows by approximately $2.8 million to support the growth in the business. For the year ended December 31, 2010 accounts payable increased cash flows by approximately $6.5 million as a result of the increase in inventory levels and timing of payments to vendors.
|
|
·
|
Accrued liabilities – accrued liabilities decreased cash flows by approximately $3.0 million due to changes in certain reserves estimates as a result of better and improved experience and a decreased in amounts due to our representatives offset by a slight increase in accrued payroll and employee benefits. For the year ended December 31, 2010 accrued liabilities increased cash flows by approximately $2.4 million due to an increase in amounts due to our representatives, payroll and workers compensation partially offset by a decrease in medical self-insurance reserves.
|
15
Cash Flows from Investing Activities
Net cash used by investing activities was $24.5 million for the year ended December 31, 2011 compared with net cash used in investing activities of $28.3 million in 2010. The change in investing activities is primarily attributable to net proceeds from investments of $11.0 million, as well as proceeds from the sale of assets of approximately $0.5 million. These proceeds were offset by an increase in capital expenditures during 2011.
Net cash used in investing activities was $28.3 million for the year ended December 31, 2010 compared with $9.6 million in 2009. The change in investing activities is primarily attributable to an increase in investments in corporate bonds and notes and certificates of deposits of approximately $14.8 million and capital expenditures during 2010.
Capital expenditures were $35.9 million, $17.5 million and $9.8 million in 2011, 2010 and 2009, respectively. Capital expenditures in 2011 were primarily investments in our manufacturing and production equipment to support our growth and improve efficiencies with equipment which combines the latest advancement in automation and laser technology.
The capital expenditure program for 2012 is estimated to be approximately in the range of $10 million to $12 million, including amounts approved in prior periods. Many of these projects are subject to review and cancellation at the discretion of our CEO and Board of Directors without incurring substantial charges
Cash Flows from Financing Activities
Net cash used in financing activities during the year ended December 31, 2011 was $4.3 million, compared with $27.2 million during 2010. The change in financing activities is primarily related to approximately $3.7 million of share repurchases as well as dividend payments of $5.9 million, partially offset by an increase in borrowing of approximately $4.6 million and stock options and restricted stock awards exercised.
Net cash used in financing activities during the year ended December 31, 2010 was $27.2 million, compared with $10.1 million during 2009. The change in financing activities is primarily related to increase share repurchases of approximately $19.5 million and cash dividend payments of $9.2 million in 2010, partially offset by stock options exercised.
Off-Balance Sheet Arrangements
We are not party to any off-balance sheet arrangements that have or are reasonably likely to have a material current or future effect on our financial condition, changes in financial condition, revenues, expenses, results of operations, liquidity, capital expenditures or capital resources.
Commitments and Contractual Agreements
The following table summarizes our contractual agreements as of December 31, 2011:
| Payments Due By Period | ||||||||||||||||||||
| Contractual Obligations | Total | Less Than 1 Year |
1-3
Years
|
4-5
Years
|
After 5 Years | |||||||||||||||
|
(in millions)
|
||||||||||||||||||||
|
Revolving credit facility
|
$ | 4.6 | $ | 4.6 | ||||||||||||||||
|
Purchase obligations
(1)
|
$ | 4.6 | $ | 2.3 | $ | 2.3 | - | - | ||||||||||||
|
Total contractual obligations
|
$ | 9.2 | $ | 6.9 | $ | 2.3 | $ | - | $ | - | ||||||||||
(1)The purchase obligation consists of delivery of R-410A refrigerant from one supplier. The price used to calculate the purchased obligation amount is the average price paid during 2011 as the quantity is fixed, but not the price.
16
Contingencies
We are subject to various claims and legal actions that arise in the ordinary course of business. We closely monitor these claims and legal actions and frequently consult with our legal counsel to determine whether they may, when resolved, have a material adverse effect on our financial position or results of operations. While we are unable to estimate the ultimate dollar amount of exposure or loss in connection with these matters, we make accruals as warranted. We believe that we have adequately provided in our consolidated financial statements for the potential impact of these contingencies. We also believe that the outcomes will not significantly affect the long-term results of operations, our financial position or our cash flows.
Critical Accounting Policies
The preparation of financial statements in conformity with accounting principles generally accepted in the United States of America (“US GAAP”) requires management to make estimates and assumptions about future events, and apply judgments that affect the reported amounts of assets, liabilities, revenue and expenses in our consolidated financial statements and related notes. We base our estimates, assumptions and judgments on historical experience, current trends and other factors believed to be relevant at the time our consolidated financial statements are prepared. However, because future events and their effects cannot be determined with certainty, actual results could differ from our estimates and assumptions, and such differences could be material. We believe the following critical accounting policies affect our more significant estimates, assumptions and judgments used in the preparation of our consolidated financial statements.
Revenue Recognition
–
We recognize revenues from sales of products when the products are shipped and the title and risk of ownership pass to the customer. Final sales prices are fixed based on purchase orders. Sales allowances and customer incentives are treated as reductions to sales and are provided for based on historical experiences and current estimates. Our policy is to record the collection and payment of sales taxes through a liability account.
We present revenues net of certain payments to our independent manufacturer representatives (“Representatives”). Representatives are national companies that are in the business of providing HVAC units and other related products and services to customers. The end user customer orders a bundled group of products and services from the Representative and expects the Representative to fulfill the order. Only after the specifications are agreed to by the Representative and the customer, and the decision is made to use an AAON HVAC unit, will we receive notice of the order. We establish the amount we must receive for our HVAC unit (“minimum sales price”), but do not control the total order price which is negotiated by the Representative with the end user customer.
We are responsible for billings and collections resulting from all sales transactions, including those initiated by our Representatives. The Representatives submit the total order price to us for invoicing and collection. The total order price includes our minimum sales price and an additional amount which may include both the Representatives’ fee and amounts due for additional products and services required by the customer. These additional products and services may include controls purchased from another manufacturer to operate the unit, start-up services, and curbs for supporting the unit (“Third Party Products”). All are associated with the purchase of a HVAC unit but may be provided by the Representative or another third party. The Company is under no obligation related to Third Party Products.
The Representatives do not provide us with a break-out of the amount of the total order price over the minimum sales price which includes the Representatives’ fee and Third Party Product amounts (“Due to Representatives”). The Due to Representatives amount is paid only after all amounts associated with the order are collected from the customer. The amount of payments to our Representatives was $51.6 million, $51.4 million and $58.0 million for the years ended December 31, 2011, 2010, and 2009, respectively.
17
Allowance for Doubtful Accounts
- Our allowance for doubtful accounts is estimated to cover the risk of loss related to accounts receivable. We establish an allowance for doubtful accounts based upon factors surrounding the credit risk of specific customers, historical trends in collections and write-offs, current customer status, the age of the receivable, economic conditions and other information. Aged receivables are reviewed on a monthly basis to determine if the reserve is adequate and adjusted accordingly at that time. The evaluation of these factors involves subjective judgments. Thus, changes in these factors or changes in economic circumstances may significantly impact our Consolidated Financial Statements.
Inventory Reserves
– We establish a reserve for inventories based on the change in inventory requirements due to product line changes, the feasibility of using obsolete parts for upgraded part substitutions, the required parts needed for part supply sales, replacement parts and for estimated shrinkage.
Warranty
– A provision is made for estimated warranty costs at the time the product is shipped and revenue is recognized. The warranty period is: the earlier of one year from the date of first use or 18 months from date of shipment for parts only; an additional four years on compressors (if applicable); 15 years on aluminized steel gas-fired heat exchangers (if applicable); 25 years on stainless steel heat exchangers (if applicable); and 10 years on gas-fired heat exchangers in RL products (if applicable). With the introduction of the RQ product line in 2010, our warranty policy for the RQ series was implemented to cover parts for two years from date of unit shipment and labor for one year from date of unit shipment. Warranty expense is estimated based on the warranty period, historical warranty trends and associated costs, and any known identifiable warranty issue.
Due to the absence of warranty history on new products, an additional provision may be made for such products. Our estimated future warranty cost is subject to adjustment from time to time depending on changes in actual warranty trends and cost experience. Should actual claim rates differ from our estimates, revisions to the estimated product warranty liability would be required.
Medical Insurance
–
A provision is made for medical costs associated with our Medical Employee Benefit Plan, which is primarily a self-funded plan. A provision is made for estimated medical costs based on historical claims paid and potential significant future claims. The plan is supplemented by employee contributions and any claim over $125,000 is covered by insurance.
Stock Compensation
– We measure and recognize compensation expense for all share-based payment awards made to our employees and directors, including stock options and restricted stock awards, based on their fair values at the time of grant. Compensation expense, net of estimated forfeitures, is recognized on a straight-line basis during the service period of the related share-based compensation award. The fair value of each option award and restricted stock award is estimated on the date of grant using the Black-Scholes-Merton option pricing model. The use of the Black-Scholes option valuation model requires the input of subjective assumptions such as: the expected volatility, the expected term of the options granted, expected dividend yield, and the risk free rate.
Actual results have been within management’s expectations.
New Accounting Pronouncements
In January 2010, the FASB issued ASU No. 2010-06, Improving Disclosures about Fair Value Measurements (ASU 2010-06). The provisions of ASU 2010-06 amend Topic 820 to require reporting entities to make new disclosures about recurring and nonrecurring fair value measurements including significant transfers into and out of Level 1 and Level 2 fair value measurements and information on purchases, sales, issuances, and settlements on a gross basis in the reconciliation of Level 3 fair value measurements. ASU 2010-6 was effective for annual reporting periods beginning after December 15, 2009, except for Level 3 reconciliation disclosures which are effective for annual periods beginning after December 15, 2010. The adoption of the standard did not have a material impact of the consolidated financial statements.
In May 2011, the FASB issued ASU No. 2011-04, Fair Value Measurement (Topic 820): Amendments to Achieve Common Fair Value Measurement and Disclosure Requirements in U.S. GAAP and IFRSs. The ASU amends the fair value measurement and disclosure guidance for measuring amounts at fair value as well as disclosures about these measurements. The amendments introduced are effective for annual periods beginning after December 15, 2011, and should be applied prospectively. This ASU clarifies existing concepts and the amendments are not expected to result in significant changes to how the Company currently applies the fair value principles.
18
In June 2011, the FASB issued ASU No. 2011-05, Presentation of Comprehensive Income. This standard eliminates the current option to report other comprehensive income and its components in the statement of changes in equity. The amendment requires that all non-owner changes in stockholders’ equity be presented either in a single continuous statement of comprehensive income or in two separate but consecutive statements. In the two-statement approach, the first statement should present total net income and its components followed consecutively by a second statement that should present total other comprehensive income, the components of other comprehensive income, and the total of comprehensive income. The amendment must be applied retrospectively and is effective for fiscal years and interim periods within those years, beginning after December 15, 2011. We do not expect the adoption of this standard to have a material effect on our consolidated financial statements.
We experience various market risks, primarily from commodity prices and interest rates. We do not use derivative financial instruments to hedge our interest rate risk. However, occasionally we use financial derivatives to economically hedge our commodity price risk. We do not use financial derivatives for speculative purposes.
Interest Rate Risk
We are exposed to interest rate risk on our revolving credit facility, which bears a variable interest rate of LIBOR plus 2.5%
.
At December 31, 2011 we had borrowings of $4.6 million outstanding under the revolving credit facility. The weighted average interest rate was 3.4% and 4.0% for the years ended December 31, 2011 and 2010, respectively.
Commodity Price Risk
We are exposed to volatility in the prices of commodities used in some of our products and occasionally we use fixed price cancellable and non-cancellable contracts with our major suppliers for periods of 6 to 18 months to manage this exposure. From time to time we use financial derivatives to economically hedge our commodity price risk. We do not have committed commodity derivative instruments in place at December 31, 2011.
The financial statements and supplementary data are included commencing at page 28.
Not Applicable.
19
(a)
Evaluation of Disclosure Controls and Procedures
At the end of the period covered by this Annual Report on Form 10-K, our management, under the supervision and with the participation of our Chief Executive Officer and Chief Financial Officer, has evaluated the effectiveness of the design and operation of our disclosure controls and procedures. Based on that evaluation, our Chief Executive Officer and Chief Financial Officer believe that:
|
·
|
Our disclosure controls and procedures are designed at a reasonable assurance threshold to ensure that information required to be disclosed by us in the reports we file under the Securities Exchange Act of 1934 is recorded, processed, summarized and reported within the time periods specified in the SEC’s rules and forms; and
|
|
·
|
Our disclosure controls and procedures operate at a reasonable assurance threshold such that important information flows to appropriate collection and disclosure points in a timely manner and are effective to ensure that such information is accumulated and communicated to our management, and made known to our Chief Executive Officer and Chief Financial Officer, particularly during the period when this Annual Report was prepared, as appropriate to allow timely decisions regarding the required disclosure.
|
Our Chief Executive Officer and Chief Financial Officer have evaluated our disclosure controls and procedures and concluded that these controls and procedures were effective as of December 31, 2011.
(b)
Management's Annual Report on Internal Control over Financial Reporting
Our management is responsible for establishing and maintaining adequate internal control over our financial reporting. Our internal control over financial reporting is a process designed by, or under the supervision of, our principal executive and principal financial officer, and effected by our board of directors, management and other personnel, to provide reasonable assurance regarding the reliability of financial reporting and the preparation of financial statements for external purposes in accordance with U.S. generally accepted accounting principles.
All internal control systems, no matter how well designed, have inherent limitations. Therefore, even those systems determined to be effective can provide only reasonable assurance with respect to financial statement preparation and presentation.
In making our assessment of internal control over financial reporting, management used the criteria issued by the Committee of Sponsoring Organizations of the Treadway Commission (COSO) in
Internal Control—Integrated Framework.
Based on our assessment, we believe that, as of December 31, 2011, our internal control over financial reporting is effective at the reasonable assurance level based on those criteria.
The effectiveness of the Company’s internal control over financial reporting as of December 31, 2011 has been audited by Grant Thornton LLP, our independent registered public accounting firm, as stated in their report which is included in this Item 9A of this report on Form 10-K.
(c) Changes in Internal Control over Financial Reporting
There have been no changes in internal control over financial reporting that occurred during the fourth quarter of 2011 that have materially affected, or are reasonably likely to materially affect, our internal control over financial reporting.
20
REPORT OF INDEPENDENT REGISTERED PUBLIC ACCOUNTING FIRM
Board of Directors and Stockholders
AAON, Inc.
We have audited AAON, Inc.’s (a Nevada Corporation) and subsidiaries, collectively, the “Company”, internal control over financial reporting as of December 31, 2011, based on criteria established in
Internal Control – Integrated Framework
issued by the Committee of Sponsoring Organizations of the Treadway Commission (COSO). The Company’s management is responsible for maintaining effective internal control over financial reporting and for its assessment of the effectiveness of internal control over financial reporting, included in the accompanying Management’s Annual Report on Internal Control over Financial Reporting. Our responsibility is to express an opinion of the Company’s internal control over financial reporting based on our audit.
We conducted our audit in accordance with the standards of the Public Company Accounting Oversight Board (United States). Those standards require that we plan and perform the audit to obtain reasonable assurance about whether effective internal control over financial reporting was maintained in all material respects. Our audit included obtaining an understanding of internal control over financial reporting, assessing the risk that a material weakness exists, testing and evaluating the design and operating effectiveness of internal control based on the assessed risk, and performing such other procedures as we considered necessary in the circumstances. We believe that our audit provides a reasonable basis for our opinion.
A company’s internal control over financial reporting is a process designed to provide reasonable assurance regarding the reliability of financial reporting and the preparation of financial statements for external purposes in accordance with generally accepted accounting principles. A company’s internal control over financial reporting includes those policies and procedures that (1) pertain to the maintenance of records that, in reasonable detail, accurately and fairly reflect the transactions and dispositions of the assets of the company; (2) provide reasonable assurance that transactions are recorded as necessary to permit preparation of financial statements in accordance with generally accepted accounting principles, and that receipts and expenditures of the company are being made only in accordance with authorizations of management and directors of the company; and (3) provide reasonable assurance regarding prevention or timely detection of unauthorized acquisition, use, or disposition of the company’s assets that could have a material effect on the financial statements.
Because of its inherent limitations, internal control over financial reporting may not prevent or detect misstatements. Also, projections of any evaluation of effectiveness to future periods are subject to the risk that controls may become inadequate because of changes in conditions, or that the degree of compliance with the policies or procedures may deteriorate.
In our opinion, the Company maintained, in all material respects, effective internal control over financial reporting as of December 31, 2011, based on criteria established in
Internal Control – Integrated Framework
issued by COSO.
We also have audited, in accordance with the standards of the Public Company Accounting Oversight Board (United States), the consolidated balance sheets of AAON, Inc. and subsidiaries, as of December 31, 2011 and 2010, and the related consolidated statements of income, stockholders’ equity and comprehensive income, and cash flows for each of the three years in the period ended December 31, 2011 and our report dated March 14, 2012, expressed an unqualified opinion on those consolidated financial statements.
/s/ GRANT THORNTON LLP
Tulsa, Oklahoma
March 14, 2012
21
None.
Item 10.
Directors, Executive Officers and Corporate Governance.
The information required by Items 401, 405, 406 and 407(c)(3), (d)(4) and (d)(5) of Regulation S-K is incorporated by reference to the information contained in our definitive Proxy Statement to be filed with the Securities and Exchange Commission in connection with our annual meeting of shareholders scheduled to be held on May 15, 2012.
Code of Ethics
We adopted a code of ethics that applies to our principal executive officer, principal financial officer and principal accounting officer or persons performing similar functions, as well as other employees and directors. Our code of ethics can be found on our website at www.aaon.com. We will also provide any person without charge, upon request, a copy of such code of ethics. Requests may be directed to AAON, Inc., 2425 South Yukon Avenue, Tulsa, Oklahoma 74107, attention Kathy I. Sheffield, or by calling (918) 382-6204.
Item 11.
Executive Compensation.
The information required by Items 402 and 407(e)(4) and (e)(5) of Regulation S-K is incorporated by reference to the information contained in our definitive Proxy Statement to be filed with the Securities and Exchange Commission in connection with our annual meeting of shareholders scheduled to be held on May 15, 2012.
Item 12.
Security Ownership of Certain Beneficial Owners and Management and Related Stockholder Matters.
The information required by Item 403 and Item 201(d) of Regulation S-K is incorporated by reference to the information contained in our definitive Proxy Statement to be filed with the Securities and Exchange Commission in connection with our annual meeting of stockholders scheduled to be held May 15, 2012.
Item 13.
Certain Relationships and Related Transactions, and Director Independence
The information required to be reported pursuant to Item 404 of Regulation S-K and paragraph (a) of Item
407 of Regulation S-K is incorporated by reference in our definitive proxy statement relating to our
2012 annual meeting of shareholders scheduled to be held May 15, 2012.
Our Code of Conduct guides the Board of Directors in its actions and deliberations with respect to related party transactions. Under the Code, conflicts of interest, including any involving the directors or any Named Officers, are prohibited except under any guidelines approved by the Board of Directors. Only the Board of Directors may waive a provision of the Code of Conduct for a director or a Named Officer, and only then in compliance with all applicable laws, rules and regulations. We have not entered into any new related party transactions and have no preexisting related party transactions in 2011, 2010 or 2009.
Item 14.
Principal Accountant Fees and Services.
This information is incorporated by reference in our definitive Proxy Statement to be filed with the Securities and Exchange Commission in connection with our annual meeting of stockholders scheduled to be held May 15, 2012.
22
|
Item 15.
|
Exhibits and Financial Statement Schedules.
|
| (a) |
Financial statements.
|
|||
|
See Index to Consolidated Financial Statements on page 26.
|
||||
| (b) |
Exhibits:
|
|||
| (3) | (A) | Articles of Incorporation (i) | ||
| (A-1) | Article Amendments (ii) | |||
| (B) | Bylaws (i) | |||
| (B-1) |
Amendments of Bylaws (iii)
|
|||
| (4) | (A) |
Third Restated Revolving Credit and Term Loan Agreement and related documents (iv)
|
||
| (A-1) |
Amendment Seven to Third Restated Revolving Credit Loan Agreement (v)
|
|||
| (B) |
Rights Agreement dated February 19, 1999, as amended (vi)
|
|||
| (10.1) | AAON, Inc. 1992 Stock Option Plan, as amended (vii) | |||
| (10.2) |
AAON, Inc. 2007 Long-Term Incentive Plan, as amended (viii)
|
|||
| (21) |
List of Subsidiaries (ix)
|
|||
|
Consent of Grant Thornton LLP
|
||||
|
Certification of CEO
|
||||
|
Certification of CFO
|
||||
|
Section 1350 Certification – CEO
|
||||
|
Section 1350 Certification – CFO
|
||||
|
__________
|
||||
| (i) |
Incorporated herein by reference to the exhibits to our Form S-18 Registration Statement No. 33-18336-LA.
|
|||
| (ii) |
Incorporated herein by reference to the exhibits to our Annual Report on Form 10-K for the fiscal year ended December 31, 1990, and to our Forms 8-K dated March 21, 1994, March 10, 1997, and March 17, 2000.
|
|||
| (iii) |
Incorporated herein by reference to our Forms 8-K dated March 10, 1997, May 27, 1998 and February 25, 1999, or exhibits thereto.
|
|||
| (iv) |
Incorporated by reference to exhibit to our Form 8-K dated July 30, 2004.
|
|||
| (v) |
Incorporated herein by reference to exhibit to our Form 8-K dated July 30, 2011
|
|||
| (vi) |
Incorporated by reference to exhibits to our Forms 8-K dated February 25, 1999, and August 20, 2002, and Form 8-A Registration Statement No. 000-18953, as amended.
|
|||
23
| (vii) |
Incorporated herein by reference to exhibits to our Annual Report on Form 10-K for the fiscal year ended December 31, 1991, and to our Form S-8 Registration Statement No. 33-78520, as amended.
|
|||
| (viii) |
Incorporated herein by reference to Appendix B to our definitive Proxy Statement for the 2007 Annual Meeting of Stockholders filed April 23, 2007.
|
|||
| (ix) |
Incorporated herein by reference to exhibits to our Annual Report on Form 10-K for the fiscal year ended December 31, 2004.
|
24
SIGNATURES
Pursuant to the requirement of Section 13 or 15(d) of the Securities Exchange Act of 1934, as amended, the Registrant has duly caused this report to be signed on its behalf by the undersigned, hereunto duly authorized.
|
AAON, INC.
|
||
| Dated: March 14, 2012 | By: | /s/ Norman H. Asbjornson |
|
Norman H. Asbjornson, President
|
||
Pursuant to the requirements of the Securities Exchange Act of 1934, as amended, this report has been signed below by the following persons on behalf of the Registrant and in the capacities and on the dates indicated.
| Dated: March 14, 2012 | /s/ Norman H. Asbjornson |
|
Norman H. Asbjornson
President and Director
(principal executive officer)
|
|
| Dated: March 14, 2012 | /s/ Kathy I. Sheffield |
|
Kathy I. Sheffield
Vice President and Treasurer
(principal financial officer
and principal accounting officer)
|
|
| Dated: March 14, 2012 | /s/ John B. Johnson, Jr. |
|
John B. Johnson, Jr.
Director
|
|
| Dated: March 14, 2012 | /s/ Jack E. Short |
|
Jack E. Short
Director
|
|
| Dated: March 14, 2012 | /s/ Paul K. Lackey, Jr. |
|
Paul K. Lackey, Jr.
Director
|
|
| Dated: March 14, 2012 | /s/ A.H. McElroy II |
|
A.H. McElroy II
Director
|
|
| Dated: March 14, 2012 | /s/ Jerry R. Levin e |
|
Jerry R. Levine
Director
|
|
| Dated: March 14, 2012 | /s/ Joseph E. Cappy |
|
Joseph E. Cappy
Director
|
25
INDEX TO CONSOLIDATED FINANCIAL STATEMENTS
| Page | |
| Report of Independent Registered Public Accounting Firm |
27
|
| Consolidated Balance Sheets |
28
|
| Consolidated Statements of Income |
29
|
| Consolidated Statements of Stockholders’ Equity and Comprehensive Income |
30
|
| Consolidated Statements of Cash Flows |
31
|
| Notes to Consolidated Financial Statements |
32
|
26
REPORT OF INDEPENDENT REGISTERED PUBLIC ACCOUNTING FIRM
Board of Directors and Stockholders
AAON, Inc.
We have audited the accompanying consolidated balance sheets of AAON, Inc. (a Nevada Corporation) and subsidiaries (the “Company”) as of December 31, 2011 and 2010, and the related consolidated statements of income, stockholders’ equity and comprehensive income, and cash flows for each of the three years in the period ended December 31, 2011. These financial statements are the responsibility of the Company’s management. Our responsibility is to express an opinion on these financial statements based on our audits.
We conducted our audits in accordance with the standards of the Public Company Accounting Oversight Board (United States). Those standards require that we plan and perform the audit to obtain reasonable assurance about whether the financial statements are free of material misstatement. An audit includes examining, on a test basis, evidence supporting the amounts and disclosures in the financial statements. An audit also includes assessing the accounting principles used and significant estimates made by management, as well as evaluating the overall financial statement presentation. We believe that our audits provide a reasonable basis for our opinion.
In our opinion, the consolidated financial statements referred to above present fairly, in all material respects, the financial position of AAON, Inc. and subsidiaries as of December 31, 2011 and 2010, and the results of their operations and their cash flows for each of the three years in the period ended December 31, 2011, in conformity with accounting principles generally accepted in the United States of America.
We also have audited, in accordance with the standards of the Public Company Accounting Oversight Board (United States), the Company’s internal control over financial reporting as of December 31, 2011, based on criteria established in
Internal Control – Integrated Framework
issued by the Committee of Sponsoring Organizations of the Treadway Commission (COSO) and our report dated March 14, 2012, expressed an unqualified opinion on the effectiveness of internal control over financial reporting.
/s/ GRANT THORNTON LLP
Tulsa, Oklahoma
March 14, 2012
27
AAON, Inc., and Subsidiaries
Consolidated Balance Sheets
|
December 31,
2011
|
December 31,
2010
|
|||||||
|
(in thousands, except share and per share data)
|
||||||||
|
Assets
|
||||||||
|
Current assets:
|
||||||||
|
Cash and cash equivalents
|
$ | 13 | $ | 2,393 | ||||
|
Certificates of deposit
|
- | 1,503 | ||||||
|
Investments held to maturity at amortized cost
|
- | 9,520 | ||||||
|
Accounts receivable, net
|
34,137 | 39,901 | ||||||
|
Income tax receivable
|
10,016 | - | ||||||
|
Note receivable, current
|
27 | 26 | ||||||
|
Inventories, net
|
34,948 | 33,602 | ||||||
|
Prepaid expenses and other
|
723 | 656 | ||||||
|
Deferred tax assets
|
4,523 | 4,147 | ||||||
|
Total current assets
|
84,387 | 91,748 | ||||||
|
Property, plant and equipment:
|
||||||||
|
Land
|
1,340 | 1,328 | ||||||
|
Buildings
|
56,057 | 45,482 | ||||||
|
Machinery and equipment
|
114,256 | 100,559 | ||||||
|
Furniture and fixtures
|
7,784 | 6,356 | ||||||
|
Total property, plant and equipment
|
179,437 | 153,725 | ||||||
|
Less: Accumulated depreciation
|
85,935 | 86,307 | ||||||
|
Property, plant and equipment, net
|
93,502 | 67,418 | ||||||
|
Note receivable, long-term
|
1,092 | 1,111 | ||||||
|
Total assets
|
$ | 178,981 | $ | 160,277 | ||||
|
Liabilities and Stockholders’ Equity
|
||||||||
|
Current liabilities:
|
||||||||
|
Revolving credit facility
|
4,575 | - | ||||||
|
Accounts payable
|
14,118 | 13,017 | ||||||
|
Accrued liabilities
|
19,994 | 23,229 | ||||||
|
Total current liabilities
|
38,687 | 36,246 | ||||||
|
Deferred tax liabilities
|
17,790 | 7,292 | ||||||
|
Commitments and contingencies
|
||||||||
|
Stockholders’ equity:
|
||||||||
|
Preferred stock, $.001 par value, 11,250,000 shares authorized,
no shares issued*
|
- | - | ||||||
|
Common stock, $.004 par value, 112,500,000 shares authorized,
24,618,324 and 24,758,480 issued and outstanding at December
31, 2011 and 2010, respectively*
|
98 | 99 | ||||||
|
Additional paid-in capital
|
- | - | ||||||
|
Retained earnings
|
122,406 | 116,640 | ||||||
|
Total stockholders’ equity
|
122,504 | 116,739 | ||||||
|
Total liabilities and stockholders’ equity
|
$ | 178,981 | $ | 160,277 | ||||
* Reflects three-for-two stock split effective June 13, 2011.
The accompanying notes are an integral part of these statements.
28
AAON, Inc., and Subsidiaries
Consolidated Statements of Income
|
For the Years Ended December 31,
|
||||||||||||
|
2011
|
2010
|
2009
|
||||||||||
|
(in thousands, except per share data)
|
||||||||||||
| Net sales | $ | 266,220 | $ | 244,552 | $ | 245,282 | ||||||
|
Cost of sales
|
219,939 | 189,364 | 177,737 | |||||||||
|
Gross profit
|
46,281 | 55,188 | 67,545 | |||||||||
|
Selling, general and administrative expenses
|
22,310 | 22,546 | 23,850 | |||||||||
|
Loss (gain) on disposal of assets
|
1,802 | (73 | ) | (59 | ) | |||||||
|
Income from operations
|
22,169 | 32,715 | 43,754 | |||||||||
|
Interest expense
|
(277 | ) | (45 | ) | (9 | ) | ||||||
|
Interest income
|
98 | 258 | 71 | |||||||||
|
Other income (expense), net
|
(477 | ) | (235 | ) | 76 | |||||||
|
Income before income taxes
|
21,513 | 32,693 | 43,892 | |||||||||
|
Income tax provision
|
7,527 | 10,799 | 16,171 | |||||||||
|
Net income
|
$ | 13,986 | $ | 21,894 | $ | 27,721 | ||||||
|
Earnings per share:
|
||||||||||||
|
Basic*
|
$ | 0.57 | $ | 0.87 | $ | 1.07 | ||||||
|
Diluted*
|
$ | 0.56 | $ | 0.87 | $ | 1.07 | ||||||
|
Cash dividends declared per common share*
|
$ | 0.24 | $ | 0.24 | $ | 0.24 | ||||||
|
Weighted average shares outstanding:
|
||||||||||||
|
Basic*
|
24,690 | 25,198 | 25,780 | |||||||||
|
Diluted*
|
24,881 | 25,339 | 25,963 | |||||||||
|
* Reflects three-for-two stock split effective June 13, 2011.
|
||||||||||||
The accompanying notes are an integral part of these statements.
29
AAON, Inc., and Subsidiaries
Consolidated Statements of Stockholders’ Equity and Comprehensive Income
|
Accumulated
|
||||||||||||||||||||||||
|
Other
|
||||||||||||||||||||||||
|
Common Stock
|
Paid-in
|
Comprehensive
|
Retained
|
|||||||||||||||||||||
|
Shares
|
Amount
|
Capital
|
Income
|
Earnings
|
Total
|
|||||||||||||||||||
| (in thousands) | ||||||||||||||||||||||||
|
Balance at December 31, 2008
|
25,812 | * | $ | 102 | * | $ | 538 | $ | 778 | $ | 95,104 | 96,522 | ||||||||||||
|
Comprehensive income:
|
||||||||||||||||||||||||
|
Net income
|
– | – | – | – | 27,721 | 27,721 | ||||||||||||||||||
|
Foreign currency translation adjustment
|
– | – | – | 299 | – | 299 | ||||||||||||||||||
|
Total comprehensive income
|
28,020 | |||||||||||||||||||||||
|
Stock options exercised and restricted stock awards vested, including tax benefits
|
255 | 1 | 1,938 | – | – | 1,939 | ||||||||||||||||||
|
Share-based compensation
|
– | – | 848 | – | – | 848 | ||||||||||||||||||
|
Stock repurchased and retired
|
(246 | ) | (1 | ) | (2,680 | ) | – | (448 | ) | (3,129 | ) | |||||||||||||
|
Dividends
|
– | – | – | – | (6,201 | ) | (6,201 | ) | ||||||||||||||||
|
Balance at December 31, 2009
|
25,821 | 102 | 644 | 1,077 | 116,176 | 117,999 | ||||||||||||||||||
|
Comprehensive income:
|
||||||||||||||||||||||||
|
Net income
|
– | – | – | – | 21,894 | 21,894 | ||||||||||||||||||
|
Foreign currency translation adjustment
|
– | – | – | (1,077 | ) | 1,155 | 78 | |||||||||||||||||
|
Total comprehensive income
|
21,972 | |||||||||||||||||||||||
|
Stock options exercised and restricted stock awards vested, including tax benefits
|
170 | – | 1,524 | – | – | 1,524 | ||||||||||||||||||
|
Share-based compensation
|
– | – | 791 | – | – | 791 | ||||||||||||||||||
|
Stock repurchased and retired
|
(1,233 | ) | (3 | ) | (2,959 | ) | – | (16,518 | ) | (19,480 | ) | |||||||||||||
|
Dividends
|
– | – | – | – | (6,067 | ) | (6,067 | ) | ||||||||||||||||
|
Balance at December 31, 2010
|
24,758 | 99 | – | – | 116,640 | 116,739 | ||||||||||||||||||
|
Net income and total comprehensive income
|
– | – | – | – | 13,986 | 13,986 | ||||||||||||||||||
|
Stock options exercised and restricted stock awards vested, including tax benefits
|
72 | – | 705 | – | – | 705 | ||||||||||||||||||
|
Share-based compensation
|
– | – | 680 | – | – | 680 | ||||||||||||||||||
|
Stock repurchased and retired
|
(212 | ) | (1 | ) | (1,375 | ) | – | (2,295 | ) | (3,671 | ) | |||||||||||||
|
Dividends
|
– | – | (10 | )** | – | (5,925 | ) | (5,935 | ) | |||||||||||||||
|
Balance at December 31, 2011
|
24,618 | $ | 98 | $ | - | $ | - | $ | 122,406 | $ | 122,504 | |||||||||||||
* Reflects 3-for-2 stock split effective June 13, 2011
** Includes cash payment of fractional shares resulting from 3-for-2 stock split effective June 13, 2011
The accompanying notes are an integral part of these statements
30
AAON, Inc., and Subsidiaries
Consolidated Statements of Cash Flows
|
For the Years Ended December 31,
|
||||||||||||
|
2011
|
2010
|
2009
|
||||||||||
|
(in thousands)
|
||||||||||||
|
Operating Activities
|
||||||||||||
|
Net income
|
$ | 13,986 | $ | 21,894 | $ | 27,721 | ||||||
|
Adjustments to reconcile net income to net cash provided by operating activities:
|
||||||||||||
|
Depreciation
|
11,397 | 9,886 | 9,061 | |||||||||
|
Amortization of bond premiums
|
156 | 379 | - | |||||||||
|
Provision for losses on accounts receivable, net of adjustments
|
(289 | ) | (117 | ) | 10 | |||||||
|
Provision for excess and obsolete inventories
|
(50 | ) | - | 410 | ||||||||
|
Share-based compensation
|
680 | 791 | 848 | |||||||||
|
Excess tax benefits from stock options exercised and restricted stock awards vested
|
(211 | ) | (356 | ) | (703 | ) | ||||||
|
(Gain) loss on disposition of assets
|
1,802 | (73 | ) | (59 | ) | |||||||
|
Unrealized gain on financial derivative asset
|
- | (14 | ) | (2,200 | ) | |||||||
|
Effect of foreign currency (gain) loss
|
(8 | ) | - | - | ||||||||
|
Deferred income taxes
|
10,122 | (558 | ) | 3,531 | ||||||||
|
Changes in assets and liabilities:
|
||||||||||||
|
Accounts receivable
|
6,053 | (6,403 | ) | 5,495 | ||||||||
|
Income tax receivable
|
(10,016 | ) | - | - | ||||||||
|
Inventories
|
(1,296 | ) | (4,814 | ) | 7,243 | |||||||
|
Prepaid expenses and other
|
(67 | ) | 431 | (660 | ) | |||||||
|
Financial derivative asset
|
- | 2,214 | - | |||||||||
|
Accounts payable
|
(2,751 | ) | 6,522 | (6,334 | ) | |||||||
|
Accrued liabilities
|
(3,024 | ) | 2,370 | 842 | ||||||||
|
Net cash provided by operating activities
|
26,484 | 32,152 | 45,205 | |||||||||
|
Investing Activities
|
||||||||||||
|
Proceeds from sale of property, plant and equipment
|
482 | 136 | 135 | |||||||||
|
Investment in certificates of deposit
|
- | (2,745 | ) | - | ||||||||
|
Maturities of certificates of deposit
|
1,503 | 1,242 | - | |||||||||
|
Investments held to maturity
|
- | (12,018 | ) | - | ||||||||
|
Maturities of investments
|
9,364 | 2,119 | - | |||||||||
|
Proceeds from assets held for sale
|
- | 460 | - | |||||||||
|
Proceeds from note receivable
|
27 | - | - | |||||||||
|
Capital expenditures
|
(35,914 | ) | (17,470 | ) | (9,774 | ) | ||||||
|
Net cash used in investing activities
|
(24,538 | ) | (28,276 | ) | (9,639 | ) | ||||||
|
Financing Activities
|
||||||||||||
|
Borrowings under revolving credit facility
|
82,078 | 20,839 | 9,972 | |||||||||
|
Payments under revolving credit facility
|
(77,503 | ) | (20,839 | ) | (12,873 | ) | ||||||
|
Payments of long-term debt
|
- | (76 | ) | (136 | ) | |||||||
|
Stock options exercised
|
494 | 1,168 | 1,236 | |||||||||
|
Excess tax benefits from stock options exercised and restricted stock awards vested
|
211 | 356 | 703 | |||||||||
|
Repurchase of stock
|
(3,671 | ) | (19,480 | ) | (3,129 | ) | ||||||
|
Cash dividends paid to stockholders
|
(5,935 | ) | (9,168 | ) | (5,874 | ) | ||||||
|
Net cash used in financing activities
|
(4,326 | ) | (27,200 | ) | (10,101 | ) | ||||||
|
Effects of exchange rate on cash
|
- | 78 | (95 | ) | ||||||||
|
Net increase (decrease) in cash and cash equivalents
|
(2,380 | ) | (23,246 | ) | 25,370 | |||||||
|
Cash and cash equivalents, beginning of year
|
2,393 | 25,639 | 269 | |||||||||
|
Cash and cash equivalents, end of year
|
$ | 13 | $ | 2,393 | $ | 25,639 | ||||||
The accompanying notes are an integral part of these statements.
31
AAON, Inc., and Subsidiaries
Notes to Consolidated Financial Statements
December 31, 2011
1. Business Description
AAON, Inc. is a Nevada corporation which was incorporated on August 18, 1987. Our operating subsidiaries include AAON, Inc., an Oklahoma corporation and AAON Coil Products, Inc., a Texas corporation. The Consolidated Financial Statements include our accounts and the accounts of our subsidiaries. Unless the context otherwise requires, references in this Annual Report to “AAON,” the “Company”, “we,” “us,” “our” or “ours” refer to AAON, Inc., and our subsidiaries.
We are engaged in the manufacture and sale of air conditioning and heating equipment consisting of rooftop units, chillers, air-handling units, make-up air units, heat recovery units, condensing units and coils.
2. Summary of Significant Accounting Policies
Principles of Consolidation
These financial statements are prepared in accordance with accounting principles generally accepted in the United States of America. The accompanying consolidated financial statements include the accounts of the Company and its wholly-owned subsidiaries. All significant intercompany accounts and transactions have been eliminated.
Cash and Cash Equivalents
We consider all highly liquid temporary investments with original maturity dates of three months or less to be cash equivalents.
Cash and cash equivalents consist of bank deposits and highly liquid, interest-bearing money market funds.
Investments
Investments with a maturity of greater than three months to one year are classified as short-term investments. Investments with maturities beyond one year may be classified as short-term if we reasonably expect the investment to be realized in cash or sold or consumed during the normal operating cycle of the business; otherwise, they are classified as long-term. Investments available for sale are recorded at market value. Investments held to maturity are measured at amortized cost in the consolidated balance sheets if it is our intent and ability to hold those securities to maturity. Any unrealized gains and losses on available for sale securities are reported as other comprehensive income (loss) as a separate component of stockholders’ equity until realized or until a decline in fair value is determined to be other than temporary.
We have no outstanding investments in certificates of deposit and corporate notes and bonds at December 31, 2011. At December 31, 2010 investments in certificates of deposits and corporate notes and bonds amounted to $1.5 million and $9.5 million, respectively.
Accounts and Notes Receivable
Accounts and notes receivable are stated at amounts due from customers, net of an allowance for doubtful accounts. We generally do not require that our customers provide collateral. The Company determines its allowance for doubtful accounts by considering a number of factors, including the credit risk of specific customers, the customer’s ability to pay current obligations, historical trends, economic and market conditions and the age of the receivable. Accounts are considered past due when the balance has been outstanding for greater than ninety days. Past due accounts are generally written-off against the allowance for doubtful accounts only after all collection attempts have been exhausted.
32
Concentration of Credit Risk
Our customers are concentrated primarily in the domestic commercial and industrial new construction and replacement markets. To date, our sales have been primarily to the domestic market, with foreign sales accounting for approximately 5% of revenues for the years ended December 31, 2011 and 2010. No customer accounted for 10% of our sales during 2011, 2010 or 2009 or more than 5% of our accounts receivable balance at December 31, 2011 or 2010.
Fair Value of Financial Instruments
The carrying amounts of cash and cash equivalents, receivables, accounts payable and accrued expenses approximate fair value because of the short-term maturity of the items. The carrying amount of the Company's revolving line of credit, and other payables, approximate their fair values either due to their short term nature, the variable rates associated with the debt or based on current rates offered to the Company for debt with similar characteristics. See Note 10 for further detail about fair market value.
Inventories
Inventories are valued at the lower of cost or market using the first-in, first-out (“FIFO”) method. Cost in inventory includes purchased parts and materials, direct labor and applied manufacturing overhead. We establish an allowance for excess and obsolete inventories based on product line changes, the feasibility of substituting parts and the need for supply and replacement parts.
Property, Plant and Equipment
Property, plant and equipment, including significant improvements, are recorded at cost, net of accumulated depreciation. Repairs and maintenance and any gains or losses on disposition are included in operations.
Depreciation is computed using the straight-line method over the following estimated useful lives:
|
Buildings
|
10-40 years
|
|
Machinery and equipment
|
3-15 years
|
|
Furniture and fixtures
|
2-5 years
|
Impairment of Long-Lived Assets
We periodically review long-lived assets for possible impairment when events or changes in circumstances indicate, in management’s judgment, that the carrying amount of an asset may not be recoverable. Recoverability is measured by a comparison of the carrying amount of an asset or asset group to its estimated undiscounted future cash flows expected to be generated by the asset or asset group. If the undiscounted cash flows are less than the carrying amount of the asset or asset group, an impairment loss is recognized for the amount by which the carrying amount of the asset or asset group exceeds its fair value.
Research and Development
The costs associated with research and development for the purpose of developing and improving new products are expensed as incurred. For the years ended December 31, 2011, 2010, and 2009 research and development costs amounted to approximately $4.8 million, $3.6 million, and $3.1 million, respectively.
Advertising
Advertising costs are expensed as incurred. Advertising expense for the years ended December 31, 2011, 2010, and 2009 was approximately $1.2 million, $0.877 million and $0.761 million respectively.
33
Shipping and Handling
We incur shipping and handling costs in the distribution of products sold that are recorded in cost of sales. Shipping charges that are billed to the customer are recorded in revenues and as an expense in cost of sales. For the years ended December 31, 2011, 2010 and 2009 shipping and handling fees amounted to approximately $8.7 million, $8.6 million, and $10.2 million, respectively.
Income Taxes
Income taxes are accounted for under the asset and liability method. The Company recognizes deferred tax assets and liabilities for the expected future tax consequences of temporary differences between the book carrying amounts and the tax basis of assets and liabilities. We establish accruals for uncertain tax positions when it is more likely than not that our tax return positions may not be fully sustained. The Company records a valuation allowance for deferred tax assets when, in the opinion of management, it is more likely than not that deferred tax assets will not be realized.
Stock Compensation
The Company recognizes expense for its share-based compensation based on the fair value of the awards that are granted. The Company’s share-based compensation plans provide for the granting of stock options, and restricted stock. The fair values of stock options are estimated at the date of grant using the Black-Scholes option valuation model. The use of the Black-Scholes option valuation model requires the input of subjective assumptions. Measured compensation cost, net of estimated forfeitures, is recognized ratably over the vesting period of the related share-based compensation award. The fair value of restricted stock awards is determined based on the market value of the Company’s shares on the grant date and the compensation expense is recognized on a straight-line basis during the service period of the respective grant.
Financial Derivatives
The Company occasionally uses derivative financial instruments to reduce its exposure to the risk of increasing commodity prices. Contract terms of the hedging instrument closely mirror those of the hedged forecasted transaction providing for the hedge relationship to be highly effective both at inception and continuously throughout the term of the hedging relationship. The Company does not engage in speculative transactions, nor does the Company hold or issue financial instruments for trading purposes.
The Company recognizes all derivatives on the balance sheets at fair value. Derivatives that do not meet the criteria for hedge accounting are adjusted to fair value through income. If the derivative is designated as a cash flow hedge, changes in the fair value are recognized in accumulated other comprehensive income (loss) until the hedged transaction is recognized in income. If a hedging instrument is terminated, any unrealized gain (loss) at the date of termination is carried in accumulated other comprehensive income (loss) until the hedged transaction is recognized in income. The ineffective portion of a derivative’s change in fair value is recognized in income in the period of change.
Revenue Recognition
We recognize revenues from sales of products when the products are shipped and the title and risk of ownership pass to the customer. Final sales prices are fixed based on purchase orders. Sales allowances and customer incentives are treated as reductions to sales and are provided for based on historical experiences and current estimates. Our policy is to record the collection and payment of sales taxes through a liability account.
We present revenues net of certain payments to our independent manufacturer representatives (“Representatives”). Representatives are national companies that are in the business of providing HVAC units and other related products and services to customers. The end user customer orders a bundled group of products and services from the Representative and expects the Representative to fulfill the order. Only after the specifications are agreed to by the Representative and the customer, and the decision is made to use an AAON HVAC unit, will we receive notice of the order. We establish the amount we must receive for our HVAC unit (“minimum sales price”), but do not control the total order price which is negotiated by the Representative with the end user customer.
34
We are responsible for billings and collections resulting from all sales transactions, including those initiated by our Representatives. The Representatives submit the total order price to us for invoicing and collection. The total order price includes our minimum sales price and an additional amount which may include both the Representatives’ fee and amounts due for additional products and services required by the customer. These additional products and services may include controls purchased from another manufacturer to operate the unit, start-up services, and curbs for supporting the unit (“Third Party Products”). All are associated with the purchase of a HVAC unit but may be provided by the Representative or another third party. The Company is under no obligation related to Third Party Products.
The Representatives do not provide us with a break-out of the amount of the total order price over the minimum sales price which includes the Representatives’ fee and Third Party Product amounts (“Due to Representatives”). The Due to Representatives amount is paid only after all amounts associated with the order are collected from the customer. The amount of payments to our representatives was $51.6 million, $51.4 million and $58.0 million for the years ended December 31, 2011, 2010, and 2009, respectively.
Insurance Reserves
Under the Company’s insurance programs, coverage is obtained for significant liability limits as well as those risks required to be insured by law or contract. It is the policy of the Company to self-insure a portion of certain expected losses related primarily to workers’ compensation and medical liability. Provisions for losses expected under these programs are recorded based on the Company’s estimates of the aggregate liabilities for the claims incurred.
Product Warranties
A
provision is made for the estimated cost of maintaining product warranties to customers at the time the product is sold based upon historical claims experience by product line. The Company records a liability and an expense for estimated future warranty claims based upon historical experience and management's estimate of the level of future claims. Changes in the estimated amounts recognized in prior years are recorded as an adjustment to the liability and expense in the current year.
Use of Estimates
The preparation of financial statements in conformity with accounting principles generally accepted in the United States requires management to make estimates and assumptions that affect the reported amounts of assets and liabilities and disclosures of contingent assets and liabilities at the date of the financial statements and the reported amounts of revenues and expenses during the reporting period. Because these estimates and assumptions require significant judgment, future actual results could differ from those estimates and could have a significant impact on our results of operations, financial position and cash flows. We reevaluate our estimates and assumptions on a monthly basis. The most significant estimates include the allowance for doubtful accounts, inventory reserves, warranty accrual, medical insurance accrual, share-based compensation and the fair value of derivative financial instruments. Actual results could differ materially from those estimates.
Reclassifications
Certain amounts have been reclassified from the prior year presentation to conform to the current year presentation with no impact to reported net income or stockholders’ equity.
35
3. Accounts Receivable
Accounts receivable and the related allowance for doubtful accounts are as follows:
|
December 31,
|
||||||||
|
2011
|
2010
|
|||||||
|
(in thousands)
|
||||||||
|
Accounts receivable
|
$ | 34,405 | $ | 40,501 | ||||
|
Less: Allowance for doubtful accounts
|
(268 | ) | (600 | ) | ||||
|
Total, net
|
$ | 34,137 | $ | 39,901 | ||||
|
Years Ended December 31,
|
||||||||||||
|
2011
|
2010
|
2009
|
||||||||||
|
(in thousands)
|
||||||||||||
|
Allowance for doubtful accounts:
|
||||||||||||
|
Balance, beginning of period
|
$ | 600 | $ | 776 | $ | 795 | ||||||
|
Provision for losses on accounts receivable
|
673 | 617 | 629 | |||||||||
|
Adjustments to provision
|
(962 | ) | (734 | ) | (630 | ) | ||||||
|
Accounts receivable written off, net of recoveries
|
(43 | ) | (59 | ) | (18 | ) | ||||||
|
Balance, end of period
|
$ | 268 | $ | 600 | $ | 776 | ||||||
4. Inventories
The components of inventories at December 31, 2011 and 2010, and the related changes in the allowance for excess and obsolete inventories for the three years ended December 31, 2011, 2010 and 2009, are as follows:
|
December 31,
|
||||||||
|
2011
|
2010
|
|||||||
|
(in thousands)
|
||||||||
|
Raw materials
|
$ | 31,746 | $ | 28,560 | ||||
|
Work in process
|
1,979 | 3,334 | ||||||
|
Finished goods
|
1,523 | 2,058 | ||||||
| 35,248 | 33,952 | |||||||
|
Less: Allowance for excess and obsolete inventories
|
(300 | ) | (350 | ) | ||||
|
Total, net
|
$ | 34,948 | $ | 33,602 | ||||
|
Years Ended December 31,
|
||||||||||||
|
2011
|
2010
|
2009
|
||||||||||
|
(in thousands)
|
||||||||||||
|
Allowance for excess and obsolete inventories:
|
||||||||||||
|
Balance, beginning of period
|
$ | 350 | $ | 760 | $ | 350 | ||||||
|
Provision for excess and obsolete inventories
|
205 | 800 | 1,849 | |||||||||
|
Adjustments to reserve
|
(255 | ) | (800 | ) | (1,439 | ) | ||||||
|
Inventories written off
|
- | (410 | ) | - | ||||||||
|
Balance, end of period
|
$ | 300 | $ | 350 | $ | 760 | ||||||
36
5. Note Receivable
In connection with the closure of our Canadian facility on May 18, 2009 we sold land and a building in September 2010 and assumed a note receivable from the borrower secured by the property. The $1.1 million, fifteen-year note has an interest rate of 4.0% and is payable to us monthly, and has a $0.6 million balloon payment due in October 2025. Interest payments are recognized in interest income.
We evaluate the note for impairment on a quarterly basis. We determine the note receivable to be impaired if we are uncertain of its collectability based on the contractual terms. At December 31, 2011 and 2010 there was no impairment.
6.
Supplemental Cash Flow Information
Cash paid for interest payments were approximately $0.277 million, $0.045 million, and $0.009 million for the years ended December 31, 2011, 2010 and 2009, respectively. Payments for income taxes were $6.4 million, $7.8 million and $10.0 million for the years ended December 31, 2011, 2010 and 2009, respectively.
Capital expenditures amounted to $39.8 million, $17.5 million and $9.8 million in 2011, 2010 and 2009, respectively. At December 31, 2011, $3.9 million of capital expenditures are accrued in accounts payable.
For the year ended December 31, 2011 we incurred a loss of approximately $1.8 million from the trade-in of production equipment. This equipment was replaced with new state of the art equipment that combines the latest advancement in automation and laser technology as a result of our strategic vision to improve our current manufacturing efficiencies.
7. Warranties
A provision is made for estimated warranty costs at the time the related products are sold based upon the warranty period, historical trends, new products and any known identifiable warranty issues. Warranty expense was $4.2 million, $4.5 million and $4.8 million for the years ended December 31, 2011, 2010 and 2009, respectively.
Changes in the warranty accrual during the years ended December 31, 2011, 2010 and 2009 are as follows:
|
2011
|
2010
|
2009
|
|||||||||||
|
(in thousands)
|
|||||||||||||
|
Balance, beginning of the year
|
$ | 7,300 | $ | 7,200 | $ | 6,589 | |||||||
|
Payments made
|
(5,387 | ) | (4,405 | ) | (4,211 | ) | |||||||
|
Warranties issued
|
5,146 | 3,987 | 4,822 | ||||||||||
|
Adjustments related to changes in estimates
|
(966 | ) | 518 | - | |||||||||
|
Balance, end of period
|
$ | 6,093 | $ | 7,300 | $ | 7,200 | |||||||
37
8. Accrued Liabilities
At December 31, accrued liabilities were comprised of the following:
|
2011
|
2010
|
|||||||
|
(in thousands)
|
||||||||
|
Warranty
|
$ | 6,093 | $ | 7,300 | ||||
|
Due to Representatives
|
7,891 | 9,668 | ||||||
|
Payroll
|
1,736 | 2,398 | ||||||
|
Workers’ compensation
|
886 | 855 | ||||||
|
Medical self-insurance
|
326 | 734 | ||||||
|
Employee benefits and other
|
3,062 | 2,274 | ||||||
|
Total
|
$ | 19,994 | $ | 23,229 | ||||
9. Revolving Credit Facility
Our revolving credit facility provides for maximum borrowings of $30.0 million which is provided by the Bank of Oklahoma, National Association. Under the line of credit, there is one standby letter of credit totaling $0.9 million. Borrowings available under the revolving credit facility at December 31, 2011, were $24.5 million. Interest on borrowings is payable monthly at LIBOR plus 2.5%. No fees are associated with the unused portion of the committed amount. As of December 31, 2011 our outstanding balance under the revolving credit facility is $4.6 million and had no borrowings outstanding at December 31, 2010. At December 31, 2011 and 2010, the weighted average interest rate was 3.4% and 4.0%, respectively
At December 31, 2011, we were in compliance with our financial covenants. These covenants require that we meet certain parameters related to our tangible net worth, total liabilities to tangible net worth ratio and working capital. At December 31, 2011 our tangible net worth was $122.5 million which meets the requirement of being at or above $95.0 million. Our total liabilities to tangible net worth ratio were 0.46 to 1.0 which meets the requirement of not being above 2 to 1. Our working capital was $45.7 million which meets the requirement of being at or above $35.0 million.
10. Fair Value Measurements
The Company determines the fair value of its financial instruments based on the fair value definition and hierarchy levels established in the guidance of ASC Topic 820, ‘
Fair Value Measurements and Disclosure’
. Three levels are established within the hierarchy that may be used to measure fair value:
Level 1: Quoted prices (unadjusted) in active markets for identical assets or liabilities. Level 1 assets and liabilities include exchange-traded derivative contracts, U.S. treasury securities and certain publicly traded equity securities.
Level 2: Observable inputs, including Level 1 prices that have been adjusted; quoted prices for similar assets or liabilities; quoted prices in markets that are less active than traded exchanges; and other inputs that are observable or can be substantially corroborated by observable market data.
Level 3: Unobservable inputs that are supported by little or no market activity and that are a significant component of the fair value of the assets or liabilities. Valuation is generated from model-based techniques that use at least one significant assumption not observable in the market. These unobservable assumptions reflect estimates of assumptions that market participants would use in pricing the asset or liability. Judgment is required in evaluating both quantitative and qualitative factors in the determination of significance for purposes of fair value level classification. Level 3 amounts can include assets and liabilities whose value is determined using pricing models, discounted cash flow methodologies, or similar techniques, as well as assets and liabilities for which the determination of fair value requires significant management judgment or estimation.
38
The lowest level of input that is a significant component of the fair value measurement determines the placement of the entire fair value measurement in the hierarchy. Our assessment of the significance of a particular input to the fair value measurement requires judgment, and may affect the valuation of the fair value of the financial instrument and its placement within the hierarchy level.
11. Income Taxes
The provision for income taxes consists of the following:
|
Years Ending December 31,
|
||||||||||||
|
2011
|
2010
|
2009
|
||||||||||
|
(in thousands)
|
||||||||||||
| Current | $ | (2,594 | ) | $ | 10,241 | $ | 19,529 | |||||
|
Deferred
|
10,121 | 558 | (3,358 | ) | ||||||||
| $ | 7,527 | $ | 10,799 | $ | 16,171 | |||||||
The provision for income taxes differs from the amount computed by applying the statutory federal income tax rate before the provision for income taxes.
The reconciliation of the federal statutory income tax rate to the effective income tax rate is as follows:
|
Years Ending December 31,
|
||||||||||||
|
2011
|
2010
|
2009
|
||||||||||
|
Federal statutory rate
|
35% | 35% | 35% | |||||||||
|
State income taxes, net of federal benefit
|
4% | 4% | 4% | |||||||||
|
Other
|
(4)% | (6%) | (2%) | |||||||||
| 35% | 33% | 37% | ||||||||||
The “other” tax rate primarily relates to the domestic production activity credit, certain domestic credits and a change in rate applied to deferred taxes.
Deferred income taxes reflect the net tax effects of temporary differences between the carrying amounts of assets and liabilities for financial reporting purposes and the amount used for income tax purposes.
The significant components of the Company’s deferred tax assets and liabilities at December 31, 2011, and 2010 are as follows:
|
December 31,
|
||||||||
|
2011
|
2010
|
|||||||
|
Net current deferred assets and (liabilities) relating to:
|
(in thousands)
|
|||||||
|
Valuation reserves
|
$ | 221 | $ | 342 | ||||
|
Warranty accrual
|
2,376 | 2,385 | ||||||
|
Other accruals
|
1,216 | 1,311 | ||||||
|
Other, net
|
710 | 109 | ||||||
| $ | 4,523 | $ | 4,147 | |||||
|
Net long-term deferred assets and (liabilities) relating to:
|
||||||||
|
Depreciation
|
(18,802 | ) | (7,796 | ) | ||||
|
Share-based compensation
|
648 | 504 | ||||||
|
Other net
|
364 | - | ||||||
| $ | (17,790 | ) | $ | (7,292 | ) | |||
39
We file income tax returns in the U.S., state and foreign income tax returns jurisdictions. We are currently under examination for our U.S. federal income taxes for 2008 and 2009 and are subject to examination for tax years 2010 and 2011, and to non-U.S. income tax examinations for the tax years of 2007 through 2010. In addition, we are subject to state and local income tax examinations for the tax years 2006 through 2011.
During the quarter ended December 31, 2011, the Company recognized an income tax receivable of approximately $10.0 million. The tax receivable represents the anticipated Federal and State estimated tax over payments as of December 31, 2011 primarily as a result of new equipment purchases placed in service during the year which qualified for the 100% bonus tax depreciation expense allowed under the Tax Relief, Unemployment Insurance Reauthorization and Job Creation Act of 2010.
We are unaware of any positions for which it is reasonably possible that the total amounts of any unrecognized tax benefit will significantly increase or decrease within 12 months of the reporting date. There are no unrecognized tax benefits that if recognized would impact the effective tax rate at December 31, 2011 and 2010. The Company recognizes accrued interest and penalties related to income tax balances in income tax expense.
12. Share-Based Compensation
We have historically maintained a stock option plan for key employees, directors and consultants (“the 1992 Plan”).
The 1992 Plan provided for 6.6 million shares of common stock to be issued under the plan. Under the terms of the plan, the exercise price of shares granted may not be less than 85% of the fair market value at the date of the grant. Options granted to directors prior to May 25, 2004, vest one year from the date of grant and are exercisable for nine years thereafter. Options granted to directors on or after May 25, 2004, vest one-third each year, commencing one year after the date of grant. All other options granted vest at a rate of 20% per year, commencing one year after date of grant, and are exercisable during years 2-10.
On May 22, 2007, our stockholders adopted a Long-Term Incentive Plan (“LTIP”) which provides an additional 1,125,000 shares that can be granted in the form of stock options, stock appreciation rights, restricted stock awards, performance units and performance awards. Since inception of the Plan, non-qualified stock options and restricted stock awards have been granted with the same vesting schedule as the previous plan.
Under the LTIP, the exercise price of shares granted may not be less than 100% of the fair market value at the date of the grant.
We recognized approximately $0.389 million, $0.446 million and $0.484 million at December 31, 2011, 2010 and 2009, respectively, in pre-tax compensation expense related to stock options in the Consolidated Statements of Income. The total pre-tax compensation cost related to unvested stock options not yet recognized as of December 31, 2011 is $1.1 million and is expected to be recognized over a weighted-average period of 2.3 years.
The following weighted average assumptions were used to determine the fair value of the stock options granted on the original grant date for expense recognition purposes for options granted during December 31, 2011, 2010 and 2009
:
|
Directors and Officers:
|
2011
|
2010
|
2009
|
|
Expected dividend yield
|
N/A
|
1.53%
|
1.87%
|
|
Expected volatility
|
N/A
|
45.37%
|
47.47%
|
|
Risk-free interest rate
|
N/A
|
2.63%
|
2.53%
|
|
Expected life
|
N/A
|
7 years
|
7 years
|
40
|
Employees:
|
|||
|
Expected dividend yield
|
1.19%
|
1.53%
|
1.87%
|
|
Expected volatility
|
45.22%
|
45.29%
|
46.94%
|
|
Risk-free interest rate
|
1.41%
|
2.44%
|
2.62%
|
|
Expected life
|
8 years
|
8 years
|
8 years
|
The expected term of the options is based on evaluations of historical and expected future employee exercise behavior. The risk-free interest rate is based on the U.S. Treasury rates at the date of grant with maturity dates approximately equal to the expected life at the grant date. Volatility is based on historical volatility of our stock over time periods equal to the expected life at grant date.
The following is a summary of stock options outstanding as of December 31, 2011:
|
Options Outstanding
|
Options Exercisable
|
|||||||||||||||||||||||||
|
Range of
Exercise Prices*
|
Number
Outstanding at
December 31, 2011*
|
Weighted Average
Remaining Contractual Life*
|
Weighted Average Exercise Price*
|
Aggregate Intrinsic Value*
|
Number
Exercisable at
December 31, 2011*
|
Weighted Average Exercise Price*
|
||||||||||||||||||||
| 6.45 – 7.21 | 81,850 | 2.42 | $ | 6.91 | $ | 13.58 | 81,850 | $ | 6.91 | |||||||||||||||||
| 7.53 – 10.66 | 229,500 | 5.71 | 9.78 | 10.71 | 153,900 | 9.56 | ||||||||||||||||||||
| 10.75 – 13.79 | 171,200 | 5.86 | 12.29 | 8.20 | 114,200 | 12.12 | ||||||||||||||||||||
| 15.51 – 21.57 | 170,500 | 9.14 | 16.28 | 4.21 | 16,200 | 15.91 | ||||||||||||||||||||
|
Total
|
653,050 | 6.23 | $ | 11.77 | $ | 10.44 | 366,150 | $ | 10.05 | |||||||||||||||||
* Reflects 3-for-2 stock split effective June 13, 2011
A summary of option activity under the plan is as follows:
|
Options
|
Shares*
|
Weighted
Average
Exercise Price*
|
Weighted Average Remaining Contractual Term
|
Aggregate Intrinsic Value ($000)
|
||||||||||||
|
Outstanding at December 31, 2008
|
869,364 | 8.19 | ||||||||||||||
|
Granted
|
139,500 | 10.61 | ||||||||||||||
|
Exercised
|
(246,020 | ) | 5.02 | |||||||||||||
|
Forfeited or Expired
|
(72,075 | ) | 11.33 | |||||||||||||
|
Outstanding at December 31, 2009
|
690,770 | 9.48 | ||||||||||||||
|
Granted
|
121,500 | 15.13 | ||||||||||||||
|
Exercised
|
(149,420 | ) | 7.82 | |||||||||||||
|
Forfeited or Expired
|
(33,600 | ) | 12.01 |
|
|
|||||||||||
|
Outstanding at December 31, 2010
|
629,250 | 10.83 | ||||||||||||||
|
Granted
|
89,500 | 16.60 | ||||||||||||||
|
Exercised
|
(56,350 | ) | 8.77 | |||||||||||||
|
Forfeited or Expired
|
(9,350 | ) | 12.86 | |||||||||||||
|
Outstanding at December 31, 2011
|
653,050 | 11.77 |
6.23
|
$ |
5,693
|
|||||||||||
|
Exercisable at December 31, 2011
|
366,150 | $ | 10.05 |
4.62
|
$ |
3,824
|
||||||||||
* Reflects 3-for-2 stock split effective June 13, 2011
41
The weighted average grant date fair value of options granted during 2011 and 2010 was $7.06 and $6.57, respectively. The total intrinsic value of options exercised during December 31, 2011, 2010 and 2009 was $1.1 million, $2.4 million and $3.3 million, respectively. The cash received from options exercised during December 31, 2011, 2010 and 2009 was $0.494 million, $1.2 million and $1.2 million, respectively. The impact of these cash receipts is included in financing activities in the accompanying Consolidated Statements of Cash Flows. For the year ended December 31, 2011, 2010 and 2009, the excess tax benefits of stock options exercised and restricted stock awards vested was $0.211 million, $0.356 million and $0.703 million, respectively.
A summary of the status of the unvested stock options is as follows:
|
Shares*
|
Weighted Average Grant Date Fair Value*
|
|||||||
|
Unvested at January 1, 2011
|
309,900 | $ | 5.37 | |||||
|
Granted
|
89,500 | 7.06 | ||||||
|
Vested
|
(103,800 | ) | 5.10 | |||||
|
Forfeited
|
(8,700 | ) | 6.11 | |||||
|
Unvested at December 31, 2011
|
286,900 | $ | 5.97 | |||||
* Reflects 3-for-2 stock split effective June 13, 2011
The total grant date fair value of options vested during December 31, 2011 and 2010 was $0.5 million and $0.5 million, respectively.
During 2007, the Compensation Committee of the Board of Directors authorized and issued restricted stock awards to directors and key employees. The restricted stock award program offers the opportunity to earn shares of AAON Common Stock over time, rather than options that give the right to purchase stock at a set price. Restricted stock awards granted to directors vest one-third each year. All other restricted stock awards vest at a rate of 20% per year. Restricted stock awards are grants that entitle the holder to shares of common stock subject to certain terms. The fair value of restricted stock awards is based on the fair market value of AAON common stock on the respective grant dates, reduced for the present value of dividends.
These awards are recorded at their fair value on the date of grant and compensation cost is recorded using straight-line vesting over the service period. The weighted average grant date fair value of restricted stock awards granted during 2011 and 2010 was $20.65 and $14.83 per share, respectively. We recognized approximately $0.291 million, $0.344 million and $0.364 million at December 31, 2011, 2010 and 2009, respectively in pre-tax compensation expense related to restricted stock awards in the Consolidated Statements of Income. In addition, as of December 31, 2011, unrecognized compensation cost related to unvested restricted stock awards was approximately $0.466 million which is expected to be recognized over a weighted average period of 1.5 years.
A summary of the unvested restricted stock awards is as follows:
|
Shares*
|
||||
|
Unvested at January 1, 2011
|
42,075 | |||
|
Granted
|
15,750 | |||
|
Vested
|
(20,475 | ) | ||
|
Forfeited
|
- | |||
|
Unvested at December 31, 2011
|
37,350 | |||
* Reflects 3-for-2 stock split effective June 13, 2011
42
13. Employee Benefits
Defined Contribution Plan - 401(k
)
- We sponsor a defined contribution plan (“the Plan”). Eligible employees may make contributions in accordance with the Plan and IRS guidelines. In addition to the traditional 401(k), effective July 2010, eligible employees were given the option of making an after-tax contribution to a Roth 401(k) or a combination of both. Effective May 30, 2005, the Plan was amended to provide for automatic enrollment and provided for an automatic increase to the deferral percentage at January 1st of each year and each year thereafter, unless the employee elects to decline the automatic increase and enrollment. Beginning with pay periods after May 30, 2005, the one year enrollment waiting period was waived.
Under the plan the Company contributes a specified percentage of each eligible employee’s compensation. In addition, the Company contributes 1.5% of eligible payroll to the 401(k) plan each year. We contribute in the form of cash and direct the investment to shares of AAON stock. Employees are 100% vested in salary deferral contributions and vest 20% per year at the end of years two through six of employment in employer matching contributions. For the year ended December 31, 2011, 2010 and 2009 we made matching contributions of $2.2 million, $1.7 million and $1.2 million, respectively. Administrative expenses were approximately $0.108 million, $0.097 million and $0.081 million for the years ended 2011, 2010 and 2009, respectively.
Profit Sharing Bonus Plan
-
We maintain a discretionary profit sharing bonus plan under which 10% of pre-tax profit is paid to eligible employees on a quarterly basis in order to reward employee productivity. Eligible employees are regular full-time employees who are actively employed and working on the first day of the calendar quarter and remain continuously, actively employed and working on the last day of the quarter and who work at least 80% of the quarter. Profit sharing expense was $2.4 million, $3.8 million and $4.8 million for the years ended December 31, 2011, 2010 and 2009, respectively.
14
.
Shareholders’ Equity
Stockholder Rights Plan -
During 1999, the Board of Directors adopted a Stockholder Rights Plan (the “Plan”), which was amended in 2002. Under the Plan, stockholders of record on March 1, 1999, received a dividend of one right per share of our Common Stock. Stock issued after March 1, 1999, contains a notation incorporating the rights. Each right entitles the holder to purchase one one-thousandth (1/1,000) of a share of Series A Preferred Stock at an exercise price of $90. The rights are traded with our Common Stock. The rights become exercisable after a person has acquired, or a tender offer is made for, 15% or more of our Common Stock. If either of these events occurs, upon exercise the holder (other than a holder owning more than 15% of the outstanding stock) will receive the number of shares of our Common Stock having a market value equal to two times the exercise price.
The rights may be redeemed by us for $0.001 per right until a person or group has acquired 15% of our Common Stock. The rights expire on August 20, 2012.
Stock Repurchase
-
On May 12, 2010, we completed a stock buyback program under a Board of Directors authorization dated November 6, 2007. As authorized we repurchased a total of 2.7 million shares under this program for an aggregate price of approximately $36.1 million, or an average price of $13.36 per share. We purchased these shares at current market prices.
On May 17, 2010, the Board authorized a new stock buyback program, targeting repurchases of up to approximately 5% (approximately 1.3 million shares) of our outstanding stock from time to time in open market transactions. Through June 28, 2010, we repurchased a total of approximately 0.718 million shares for an aggregate price of $11.5 million, or an average price of $16.04 per share. We purchased the shares at current market prices. No purchases were made during 2011.
On July 1, 2005, we entered into a stock repurchase arrangement by which employee participants in our 401(k) savings and investment plan are entitled to have shares of AAON stock in their accounts sold to us to provide diversification of their investments. The maximum number of shares to be repurchased is not known under the program as the amount is contingent on the number of shares sold by employees. Through December 31, 2011, we repurchased 1.7 million shares for an aggregate price of $21.5 million or an average price of $12.71 per share. We purchased the shares at current market prices.
43
On November 7, 2006, the Board of Directors authorized us to repurchase shares from certain directors and officers following their exercise of stock options. The maximum number of shares to be repurchased under the program is not known as the amount is contingent on the number of shares sold. Through December 31, 2011, we repurchased 579,625 shares for an aggregate price of $8.1 million or an average price of $13.98 per share. We purchased the shares at current market prices.
Dividends -
At the discretion of the Board of Directors we pay semi-annual cash dividends. Board approval is required to determine the date of declaration and amount for each semi-annual dividend payment. The Board of Directors approved dividend payments of $0.12 per share related to the 3-for-2 stock split effective on June 13, 2011.
During 2011 we declared dividends to shareholders of record at the close of business on June 10, 2011 and December 1, 2011 which were paid on July 1, 2011 and December 22, 2011, respectively. We paid cash dividends of $5.9 million, $9.2 million, and $5.9 million in 2011, 2010, and 2009, respectively.
15. Commitments and Contingencies
We are subject to various claims and legal actions that arise in the ordinary course of business. We closely monitor these claims and legal actions and frequently consult with our legal counsel to determine whether they may, when resolved, have a material adverse effect on our financial position or results of operations and accrue and/or disclose loss contingencies as appropriate.
We are party to several short-term, cancelable and occasionally non-cancelable, fixed price contracts with major suppliers for the purchase of raw material and component parts. We expect to receive delivery of raw materials for use in our manufacturing operations. These contracts are not accounted for as derivative instruments because they meet the normal purchases and sales exemption.
16. Earnings Per Share
Basic net income per share is calculated by dividing net income by the weighted average number of shares of common stock outstanding during the period. Diluted net income per share assumes the conversion of all potentially dilutive securities and is calculated by dividing net income by the sum of the weighted average number of shares of common stock outstanding plus all potentially dilutive securities. Dilutive common shares consist primarily of stock options and restricted stock awards.
The following table sets forth the computation of basic and diluted earnings per share:
|
Years Ended,
|
||||||||||||
|
2011
|
2010
|
2009
|
||||||||||
|
(in thousands except share and per share data)
|
||||||||||||
|
Numerator:
|
||||||||||||
|
Net income
|
$ | 13,986 | $ | 21,894 | $ | 27,721 | ||||||
|
Denominator:
|
||||||||||||
|
Basic earnings per share –
Weighted average shares*
|
24,689,852 | 25,198,166 | 25,780,395 | |||||||||
|
Effect of dilutive stock options and restricted stock*
|
191,294 | 141,227 | 183,057 | |||||||||
|
Diluted earnings per share –
Weighted average shares*
|
24,881,146 | 25,339,393 | 25,963,452 | |||||||||
|
Earnings per share
|
||||||||||||
|
Basic*
|
$ | 0.57 | $ | 0.87 | $ | 1.07 | ||||||
|
Diluted*
|
$ | 0.56 | $ | 0.87 | $ | 1.07 | ||||||
|
Anti-dilutive shares*
|
171,250 | 121,500 | 340,425 | |||||||||
|
Weighted average exercise price of anti-dilutive shares*
|
$ | 16.35 | $ | 15.23 | $ | 10.43 | ||||||
* Reflects 3-for-2 stock split effective June 13, 2011
44
17.
Quarterly Results (Unaudited)
The following is a summary of the quarterly results of operations for the years ending December 31, 2011 and 2010:
|
Quarter Ended
|
||||||||||||||||
|
March 31
|
June 30
|
September 30
|
December 31
|
|||||||||||||
|
(in thousands, except per share data)
|
||||||||||||||||
|
2011
|
||||||||||||||||
|
Net sales
|
$ | 59,913 | $ | 69,076 | $ | 73,829 | $ | 63,402 | ||||||||
|
Gross profit
|
11,638 | 11,737 | 14,259 | 8,647 | ||||||||||||
|
Net income
|
3,650 | 3,839 | 5,626 | 871 | ** | |||||||||||
|
Earnings per share:
|
||||||||||||||||
|
Basic*
|
0.15 | 0.16 | 0.23 | 0.04 | ||||||||||||
|
Diluted*
|
0.15 | 0.15 | 0.23 | 0.04 | ||||||||||||
|
Quarter Ended
|
||||||||||||||||
|
March 31
|
June 30
|
September 30
|
December 31
|
|||||||||||||
|
(in thousands, except per share data)
|
||||||||||||||||
|
2010
|
||||||||||||||||
|
Net sales
|
$ | 49,309 | $ | 64,531 | $ | 64,886 | $ | 65,826 | ||||||||
|
Gross profit
|
12,994 | 15,506 | 12,497 | 14,191 | ||||||||||||
|
Net income
|
5,118 | 5,821 | 5,173 | 5,782 | ||||||||||||
|
Earnings per share:
|
||||||||||||||||
|
Basic*
|
0.20 | 0.23 | 0.21 | 0.23 | ||||||||||||
|
Diluted*
|
0.20 | 0.23 | 0.21 | 0.23 | ||||||||||||
* Reflects three-for-two stock split effective June 13, 2011.
** Includes a pre-tax loss from the trade-in of production equipment of approximately $1.8 million.
45
TABLE OF CONTENTS
Part IItem 1. BusinessItem 1A. Risk FactorsItem 1B. Unresolved Staff CommentsItem 2. PropertiesItem 3. Legal ProceedingsItem 4. Mine Safety DisclosurePart IIItem 5. Market For Registrant's Common Equity, Related Stockholder Matters and Issuer Purchases Of Equity SecuritiesItem 6. Selected Financial DataItem 7. Management's Discussion and Analysis Of Financial Condition and Results Of OperationsItem 7A. Quantitative and Qualitative Disclosures About Market RiskItem 8. Financial Statements and Supplementary DataItem 9. Changes in and Disagreements with Accountants on Accounting and Financial DisclosureItem 9A. Controls and ProceduresItem 9B. Other InformationPart IIIItem 10. Directors, Executive Officers and Corporate GovernanceItem 11. Executive CompensationItem 12. Security Ownership Of Certain Beneficial Owners and Management and Related Stockholder MattersItem 13. Certain Relationships and Related Transactions, and Director IndependenceItem 14. Principal Accountant Fees and ServicesPart IVItem 15. Exhibits and Financial Statement Schedules