AAON, INC.
10-Ks and 10-Qs
|
|
|
|
|
|
|
|
|
|
|
|
|
|
|
|
|
|
|
|
|
|
|
|
|
|
|
|
|
|
|
|
|
|
|
|
|
|
|
|
|
|
|
|
|
|
|
|
|
|
|
|
|
|
|
|
|
|
|
UNITED STATES
SECURITIES AND EXCHANGE COMMISSION
Washington, D.C. 20549
FORM 10-K
|
[X]
|
ANNUAL REPORT PURSUANT TO SECTION 13 OR 15(d) OF THE SECURITIES EXCHANGE ACT OF 1934
|
For the fiscal year ended
December 31, 2017
or
|
[
]
|
TRANSITION REPORT PURSUANT TO SECTION 13 OR 15(d) OF THE SECURITIES EXCHANGE ACT OF 1934
|
For the transition period from _____________________________ to _____________________________
Commission file number: 0-18953
AAON, INC.
(Exact name of registrant as specified in its charter)
|
Nevada
|
87-0448736
|
|
(State or other jurisdiction
|
(IRS Employer
|
|
of incorporation or organization)
|
Identification No.)
|
|
|
|
|
2425 South Yukon, Tulsa, Oklahoma
|
74107
|
|
(Address of principal executive offices)
|
(Zip Code)
|
Registrant's telephone number, including area code: (918) 583-2266
Securities registered pursuant to Section 12(b) of the Act: None
Securities registered pursuant to Section 12(g) of the Act:
Common Stock, par value $.004
(Title of Class)
Rights to Purchase Series A Preferred Stock
(Title of Class)
Indicate by check mark if the registrant is a well-known seasoned issuer, as defined in Rule 405 of the Securities Act.
[
] Yes [X] No
Indicate by check mark if the registrant is not required to file reports pursuant to Section 13 or 15(d) of the Act.
[
] Yes [X] No
Indicate by check mark whether the registrant (1) has filed all reports required to be filed by Section 13 or 15(d) of the Securities Exchange Act of 1934 during the preceding 12 months (or for such shorter period that the registrant was required to file such reports), and (2) has been subject to such filing requirements for the past 90 days.
[X] Yes [
] No
Indicate by check mark whether the registrant has submitted electronically and posted on its corporate Web site, if any, every Interactive Data File required to be submitted and posted pursuant to Rule 405 of Regulation S-T during the preceding 12 months (or for such shorter period that the registrant was required to submit and post such files).
[X] Yes [
] No
Indicate by check mark if disclosure of delinquent filers pursuant to Item 405 of Regulation S-K is not contained herein, and will not be contained, to the best of registrant's knowledge, in definitive proxy or information statements incorporated by reference in Part III of this Form 10-K or any amendment to this Form 10-K.
[ ]
Indicate by check mark whether the registrant is a large accelerated filer, an accelerated filer, a non-accelerated filer or a smaller reporting company (as defined in Rule 12b-2 of the Securities Exchange Act of 1934).
|
Large accelerated filer [
X
]
|
Accelerated filer [
]
|
|
Non-accelerated filer [
]
|
Smaller reporting company [
]
|
Indicate by check mark whether the registrant is a shell company (as defined by Rule 12b-2 of the Act.)
[
] Yes [X] No
The aggregate market value of the common equity held by non-affiliates computed by reference to the closing price of registrant’s common stock on the last business day of registrant’s most recently completed second quarter June 30,
2017
was
$1,502.1 million
.
As of
February 23, 2018
, registrant had outstanding a total of
52,433,208
shares of its $.004 par value Common Stock.
DOCUMENTS INCORPORATED BY REFERENCE
Portions of registrant's definitive Proxy Statement to be filed in connection with the Annual Meeting of Stockholders to be held May 15,
2018
, are incorporated into Part III.
|
TABLE OF CONTENTS
|
|||
|
Item Number and Caption
|
Page
Number
|
||
|
|
|
|
|
|
PART I
|
|
||
|
|
|
|
|
|
1.
|
Business.
|
||
|
|
|
|
|
|
1A.
|
Risk Factors.
|
||
|
|
|
|
|
|
1B.
|
Unresolved Staff Comments.
|
||
|
|
|
|
|
|
2.
|
Properties.
|
||
|
|
|
|
|
|
3.
|
Legal Proceedings.
|
||
|
|
|
|
|
|
4.
|
Mine Safety Disclosure.
|
||
|
|
|
|
|
|
PART II
|
|
|
|
|
|
|
|
|
|
5.
|
Market for Registrant's Common Equity, Related Stockholder Matters and Issuer Purchases of Equity Securities.
|
||
|
|
|
|
|
|
6.
|
Selected Financial Data.
|
||
|
|
|
|
|
|
7.
|
Management's Discussion and Analysis of Financial Condition and Results of Operations.
|
||
|
|
|
|
|
|
7A.
|
Quantitative and Qualitative Disclosures About Market Risk.
|
||
|
|
|
|
|
|
8.
|
Financial Statements and Supplementary Data.
|
||
|
|
|
|
|
|
9.
|
Changes in and Disagreements with Accountants on Accounting and Financial Disclosure.
|
||
|
|
|
|
|
|
9A.
|
Controls and Procedures.
|
||
|
|
|
|
|
|
9B.
|
Other Information.
|
||
|
|
|
|
|
|
PART III
|
|
|
|
|
|
|
|
|
|
10.
|
Directors, Executive Officers and Corporate Governance.
|
||
|
|
|
|
|
|
11.
|
Executive Compensation.
|
||
|
|
|
|
|
|
12.
|
Security Ownership of Certain Beneficial Owners and Management and Related Stockholder Matters.
|
||
|
|
|
|
|
|
13.
|
Certain Relationships and Related Transactions, and Director Independence.
|
||
|
|
|
|
|
|
14.
|
Principal Accountant Fees and Services.
|
||
|
|
|
|
|
|
PART IV
|
|
|
|
|
|
|
|
|
|
15.
|
Exhibits and Financial Statement Schedules.
|
||
Forward-Looking Statements
This Annual Report includes “forward-looking statements” within the meaning of the Private Securities Litigation Reform Act of 1995. Words such as “expects”, “anticipates”, “intends”, “plans”, “believes”, “seeks”, “estimates”, “should”, “will”, and variations of such words and similar expressions are intended to identify such forward-looking statements. These statements are not guarantees of future performance and involve certain risks, uncertainties and assumptions, which are difficult to predict. Therefore, actual outcomes and results may differ materially from what is expressed or forecasted in such forward-looking statements. Readers are cautioned not to place undue reliance on these forward-looking statements, which speak only as of the date on which they are made. We undertake no obligations to update publicly any forward-looking statements, whether as a result of new information, future events or otherwise. Important factors that could cause results to differ materially from those in the forward-looking statements include (1) the timing and extent of changes in raw material and component prices, (2) the effects of fluctuations in the commercial/industrial new construction market, (3) the timing and extent of changes in interest rates, as well as other competitive factors during the year, and (4) general economic, market or business conditions.
General Development and Description of Business
AAON, Inc., a Nevada corporation, ("AAON Nevada") was incorporated on August 18, 1987. Our operating subsidiaries include AAON, Inc., an Oklahoma corporation, and AAON Coil Products, Inc., a Texas corporation. Unless the context otherwise requires, references in this Annual Report to “AAON,” the “Company”, “we”, “us”, “our”, or “ours” refer to AAON Nevada and our subsidiaries.
We are engaged in the engineering, manufacturing, marketing and sale of air conditioning and heating equipment consisting of standard, semi-custom and custom rooftop units, chillers, packaged outdoor mechanical rooms, air handling units, makeup air units, energy recovery units, condensing units, geothermal/water-source heat pumps and coils.
Products and Markets
Our products serve the commercial and industrial new construction and replacement markets. To date, our sales have been primarily to the domestic market. Foreign sales accounted for approximately $
14.6 million
, $
14.7 million
and
$14.6 million
of our sales in
2017
,
2016
and
2015
, respectively. As a percent of sales, foreign sales accounted for approximately 4% of our net sales in each of those years.
Our rooftop and condensing unit markets primarily consist of units installed on commercial or industrial structures of generally less than ten stories in height. Our air handling units, self-contained units, geothermal/water-source heat pumps, chillers, packaged outdoor mechanical rooms and coils are suitable for all sizes of commercial and industrial buildings.
The size of these markets is determined primarily by the number of commercial and industrial building completions. The replacement market consists of products installed to replace existing units/components that are worn or damaged. Currently, over half of the industry's market consists of replacement units.
The commercial and industrial new construction market is subject to cyclical fluctuations in that it is generally tied to housing starts, but has a lag factor of six to 18 months. Housing starts, in turn, are affected by such factors as interest rates, the state of the economy, population growth and the relative age of the population. When new construction is down, we emphasize the replacement market.
Based on our
2017
sales of
$405 million
, we estimate that we have approximately a
12%
share of the greater than five ton rooftop market and a
2%
share of the less than five ton market. Approximately
55%
of our sales were generated from the renovation and replacement markets and
45%
from new construction. The percentage of sales for new construction vs. replacement to particular customers is related to the customer’s stage of development.
1
We purchase certain components, fabricate sheet metal and tubing and then assemble and test the finished products. Our primary finished products consist of a single unit system containing heating and cooling in a self-contained cabinet, referred to in the industry as "unitary products". Our other finished products are chillers, packaged outdoor mechanical rooms, coils, air handling units, condensing units, makeup air units, energy recovery units, rooftop units and geothermal/ water-source heat pumps.
We offer three groups of rooftop units: the RQ Series, consisting of five cooling sizes ranging from two to six tons; the RN Series, offered in 28 cooling sizes ranging from six to 140 tons; and the RL Series, which is offered in 21 cooling sizes ranging from 45 to 240 tons.
We also offer the SA, SB and M2 Series as indoor packaged, water-cooled or geothermal/water-source heat pump self-contained units with cooling capacities of three to 70 tons.
Our small packaged geothermal/water-source heat pump units consist of the WH Series horizontal configuration and WV Series vertical configuration, both from one-half to five tons.
We manufacture a LF Series chiller, air-cooled, a LN Series chiller, air-cooled, and a LZ Series chiller and packaged outdoor mechanical room, which are available in both air-cooled condensing and evaporative-cooled configurations, covering a range of four to 540 tons. BL Series boiler outdoor mechanical rooms are also available with 400-6,000 MBH heating capacity. FZ Series fluid cooler outdoor mechanical rooms are also available with a range of 50 to 450 tons.
We offer four groups of condensing units: the CB Series, two to five tons; the CF Series, two to 70 tons; the CN Series, 55 to 140 tons; and the CL Series, 45 to 230 tons.
Our air handling units consist of the indoor F1, H3 and V3 Series and the modular M2 and M3 Series, as well as air handling unit configurations of the RQ, RN, RL and SA Series units.
Our energy recovery option applicable to our RQ, RN, RL and SB units, as well as our H3, V3, M2 and M3 Series air handling units, respond to the U.S. Clean Air Act mandate to increase fresh air in commercial structures. Our products are designed to compete on the higher quality end of standardized products.
Performance characteristics of our products range in cooling capacity from one-half to 540 tons and in heating capacity from 7,200 to 9,000,000 BTUs. All of our products meet the Department of Energy's (“DOE”) minimum efficiency standards, which define the maximum amount of energy to be used in producing a given amount of cooling. Many of our units far exceed these minimum standards and are among the highest efficiency units currently available.
A typical commercial building installation requires one ton of air conditioning for every 300-400 square feet or, for a 100,000 square foot building, 250 tons of air conditioning, which can involve multiple units.
Major Customers
One customer, Texas AirSystems, accounted for 10% or more of our sales during
2017
and
2016
. No customer accounted for 10% or more of our sales during
2015
.
Sources and Availability of Raw Materials
The most important materials we purchase are steel, copper and aluminum, which are obtained from domestic suppliers. We also purchase from other domestic manufacturers certain components, including compressors, electric motors and electrical controls used in our products. We attempt to obtain the lowest possible cost in our purchases of raw materials and components, consistent with meeting specified quality standards. We are not dependent upon any one source for raw materials or the major components of our manufactured products. By having multiple suppliers, we believe that we will have adequate sources of supplies to meet our manufacturing requirements for the foreseeable future.
We have not been significantly impacted by the Dodd-Frank Wall Street Reform and Consumer Protection Act (the "Dodd-Frank Act") that contains provisions to improve transparency and accountability concerning the supply of certain minerals, known as "conflict minerals", originating from the Democratic Republic of Congo and adjoining countries.
2
We attempt to limit the impact of price fluctuations on these materials by entering into cancellable and non-cancellable fixed price contracts with our major suppliers for periods of six to 18 months. We expect to receive delivery of raw materials from our fixed price contracts for use in our manufacturing operations.
Representatives
We employ a sales staff of 33 individuals and utilize approximately 62 independent manufacturer representatives' organizations ("Representatives") having 100 offices to market our products in the United States and Canada. We also have one international sales organization, which utilizes 12 distributors in other countries. Sales are made directly to the contractor or end user, with shipments being made from our Tulsa, Oklahoma, and Longview, Texas, plants to the job site.
Our products and sales strategy focuses on niche markets. The targeted markets for our equipment are customers seeking products of better quality than offered, and/or options not offered, by standardized manufacturers.
To support and service our customers and the ultimate consumer, we provide parts availability through our sales offices. We also have factory service organizations at each of our plants. Additionally, a number of the Representatives we utilize have their own service organizations, which, in connection with us, provide the necessary warranty work and/or normal service to customers.
Warranties
Our product warranty policy is: the earlier of one year from the date of first use or 18 months from date of shipment for parts only; an additional four years for compressors (if applicable); 15 years on aluminized steel gas-fired heat exchangers (if applicable); 25 years on stainless steel heat exchangers (if applicable); and ten years on gas-fired heat exchangers in RL products (if applicable). Our warranty policy for the RQ series covers parts for two years from date of unit shipment and labor for one year from date of unit shipment. Our warranty policy for the WH and WV Series geothermal/water-source heat pumps covers parts for five years from the date of manufacture.
The Company also sells extended warranties on parts for various lengths of time ranging from six months to ten years. Revenue for these separately priced warranties is deferred and recognized on a straight-line basis over the separately priced warranty period.
Research and Development
Our products are engineered for performance, flexibility and serviceability. This has become a critical factor in competing in the heating, ventilation and air conditioning ("HVAC") equipment industry. We must continually develop new and improved products in order to compete effectively and to meet evolving regulatory standards in all of our major product lines.
All of our Research and Development ("R&D") activities are self-sponsored, rather than customer-sponsored. R&D activities have involved the RQ, RN and RL (rooftop units), F1, H3, V3, M2 and M3 (air handling units), LF, LN and LZ (chillers), CB, CF and CN (condensing units), SA and SB (self-contained units), WH and WV (water-source heat pumps), FZ (fluid coolers) and BL (boilers), as well as component evaluation and refinement, development of control systems and new product development. We incurred R&D expenses of approximately
$13.0
million,
$12.0 million
and
$7.5 million
in
2017
,
2016
and
2015
, respectively.
Backlog
Our backlog as of February 1,
2018
was approximately $64.9 million compared to approximately $53.5 million as of February 1,
2017
. The current backlog consists of orders considered by management to be firm and generally are filled on average within approximately 60 to 90 days after an order is deemed to become firm; however, the orders are subject to cancellation by the customers.
3
Working Capital Practices
Working capital practices in the industry center on inventories and accounts receivable. Our management regularly reviews our working capital with a view of maintaining the lowest level consistent with requirements of anticipated levels of operation. Our greatest needs arise during the months of July - November, the peak season for inventory (primarily purchased material) and accounts receivable. Our working capital requirements are generally met by cash flow from operations and a bank revolving credit facility, which currently permits borrowings up to $30 million and had no balance outstanding at
December 31, 2017
. We believe that we will have sufficient funds available to meet our working capital needs for the foreseeable future.
Seasonality
Sales of our products are moderately seasonal with the peak period being July - November of each year due to timing of construction projects being directly related to warmer weather.
Competition
In the standardized market, we compete primarily with Lennox International, Inc., Trane (Ingersoll Rand Limited), York (Johnson Controls Inc.) and Carrier (United Technologies Corporation). All of these competitors are substantially larger and have greater resources than we do. Our products compete on the basis of total value, quality, function, serviceability, efficiency, availability of product, product line recognition and acceptability of sales outlet. However, in new construction where the contractor is the purchasing decision maker, we are often at a competitive disadvantage because of the emphasis placed on initial cost. In the replacement market and other owner-controlled purchases, we have a better chance of getting business since quality and long-term cost are generally taken into account.
Employees
As of February
12,
2018
, we employed 1,991 permanent employees. Our employees are not represented by unions. Management considers its relations with our employees to be good.
Patents, Trademarks, Licenses and Concessions
We do not consider any patents, trademarks, licenses or concessions to be material to our business operations, other than patents issued regarding our energy recovery wheel option, blower, gas-fired heat exchanger, evaporative-cooled condenser de-superheater and low leakage damper which have terms of 20 years with expiration dates ranging from 2018 to 2033.
Environmental Matters
Laws concerning the environment that affect or could affect our operations include, among others, the Clean Water Act, the Clean Air Act, the Resource Conservation and Recovery Act, the Occupational Safety and Health Act, the National Environmental Policy Act, the Toxic Substances Control Act, regulations promulgated under these Acts, and any other federal, state or local laws or regulations governing environmental matters. We believe that we are in compliance with these laws and that future compliance will not materially affect our earnings or competitive position.
Available Information
Our Internet website address is http://www.aaon.com. Our annual reports on Form 10-K, quarterly reports on Form 10-Q, current reports on Form 8-K and amendments to those reports filed or furnished pursuant to Section 13(a) or 15(d) of the Securities Exchange Act of 1934, as amended, will be available free of charge through our Internet website as soon as reasonably practicable after we electronically file such material with, or furnish it to, the SEC. The information on our website is not a part of, or incorporated by reference into, this annual report on Form 10-K.
Copies of any materials we file with the SEC can also be obtained free of charge through the SEC’s website at http://www.sec.gov, at the SEC’s Public Reference Room at 100 F Street, N.E., Washington, D.C. 20549, or by calling the SEC at 1-800-732-0330.
4
The following risks and uncertainties may affect our performance and results of operations. The discussion below contains "forward-looking statements" as outlined in the Forward-Looking Statements section above. Our ability to mitigate risks may cause our future results to materially differ from what we currently anticipate. Additionally, the ability of our competitors to react to material risks will affect our future results.
Our business can be hurt by economic conditions
.
Our business is affected by a number of economic factors, including the level of economic activity in the markets in which we operate. Sales in the commercial and industrial new construction markets correlate to the number of new homes and buildings that are built, which in turn is influenced by cyclical factors such as interest rates, inflation, consumer spending habits, employment rates and other macroeconomic factors over which we have no control. In the HVAC business, a decline in economic activity as a result of these cyclical or other factors typically results in a decline in new construction and replacement purchases which could impact our sales volume and profitability.
We may be adversely affected by problems in the availability, or increases in the prices, of raw materials and components
.
Problems in the availability, or increases in the prices, of raw materials or components could depress our sales or increase the costs of our products. We are dependent upon components purchased from third parties, as well as raw materials such as steel, copper and aluminum. Occasionally, we enter into cancellable and non-cancellable contracts on terms from six to 18 months for raw materials and components at fixed prices. However, if a key supplier is unable or unwilling to meet our supply requirements, we could experience supply interruptions or cost increases, either of which could have an adverse effect on our gross profit.
We risk having losses resulting from the use of non-cancellable fixed price contracts.
Historically, we have attempted to limit the impact of price fluctuations on commodities by entering into non-cancellable fixed price contracts with our major suppliers for periods of six to 18 months. We expect to receive delivery of raw materials from our fixed price contracts for use in our manufacturing operations. These fixed price contracts are not accounted for using hedge accounting since they meet the normal purchases and sales exemption.
We may not be able to successfully develop and market new products
.
Our future success will depend upon our continued investment in research and new product development and our ability to continue to achieve new technological advances in the HVAC industry. Our inability to continue to successfully develop and market new products or our inability to implement technological advances on a pace consistent with that of our competitors could lead to a material adverse effect on our business and results of operations.
We may incur material costs as a result of warranty and product liability claims that would negatively affect our profitability
.
The development, manufacture, sale and use of our products involve a risk of warranty and product liability claims. Our product liability insurance policies have limits that, if exceeded, may result in material costs that would have an adverse effect on our future profitability. In addition, warranty claims are not covered by our product liability insurance and there may be types of product liability claims that are also not covered by our product liability insurance.
5
We may not be able to compete favorably in the highly competitive HVAC business
.
Competition in our various markets could cause us to reduce our prices or lose market share, which could have an adverse effect on our future financial results. Substantially all of the markets in which we participate are highly competitive. The most significant competitive factors we face are product reliability, product performance, service and price, with the relative importance of these factors varying among our product line. Other factors that affect competition in the HVAC market include the development and application of new technologies and an increasing emphasis on the development of more efficient HVAC products. Moreover, new product introductions are an important factor in the market categories in which our products compete. Several of our competitors have greater financial and other resources than we have, allowing them to invest in more extensive research and development. We may not be able to compete successfully against current and future competition and current and future competitive pressures faced by us may materially adversely affect our business and results of operations.
The loss of Norman H. Asbjornson could impair the growth of our business
.
Norman H. Asbjornson, our founder, has served as our Chief Executive Officer from inception to date and President from inception to November 2016. He has provided the leadership and vision for our strategy and growth. Although important responsibilities and functions have been delegated to other highly experienced and capable management personnel, and our products are technologically advanced and well positioned for sales well into the future, the death, disability or retirement of Mr. Asbjornson could impair the growth of our business. We do not have an employment agreement with Mr. Asbjornson.
The Board of Directors attempts to manage this risk by continually engaging in succession planning concerning Mr. Asbjornson (as well as other key management personnel), as demonstrated by the Board's appointment of Gary D. Fields as President of AAON in November 2016.
Our business is subject to the risks of interruptions by cybersecurity attacks.
We depend upon information technology infrastructure, including network, hardware and software systems to conduct our business. Despite our implementation of network and other cybersecurity measures, our information technology system and networks could be disrupted or experience a security breach from computer viruses, break-ins and similar disruptions from unauthorized tampering with our computer systems. Our security measures may not be adequate to protect against highly targeted sophisticated cyber-attacks, or other improper disclosures of confidential and/or sensitive information. Additionally, we may have access to confidential or other sensitive information of our customers, which, despite our efforts to protect, may be vulnerable to security breaches, theft, or other improper disclosure. Any cyber-related attack or other improper disclosure of confidential information could have a material adverse effect on our business, as well as other negative consequences, including significant damage to our reputation, litigation, regulatory actions and increased cost.
Exposure to environmental liabilities could adversely affect our results of operations
.
Our future profitability could be adversely affected by current or future environmental laws. We are subject to extensive and changing federal, state and local laws and regulations designed to protect the environment in the United States and in other parts of the world. These laws and regulations could impose liability for remediation costs and result in civil or criminal penalties in case of non-compliance. Compliance with environmental laws increases our costs of doing business. Because these laws are subject to frequent change, we are unable to predict the future costs resulting from environmental compliance.
We are subject to potentially extreme governmental regulations.
We always face the possibility of new governmental regulations which could have a substantial or even extreme negative effect on our operations and profitability. Negotiations during the summer of 2013 mitigated some of the negative effects of the Department of Energy Final Rule, Regulatory Identification No. 1904-AC23, published on March 7, 2011. However, certain additional testing and listing requirements are still in place and scheduled to be phased in.
6
Several other intrusive component part governmental regulations are in process. If these proposals become final rules, the effect would be the regulation of compressors and fans in products for which the Department of Energy does not have current authority. This could affect equipment we currently manufacture and could have an impact on our product design, operations and profitability.
The Dodd-Frank Wall Street Reform and Consumer Protection Act contains provisions to improve transparency and accountability concerning the supply of certain minerals, known as "conflict minerals", originating from the Democratic Republic of Congo and adjoining countries. As a result, in August 2012, the SEC adopted annual disclosure and reporting requirements for those companies who use conflict minerals in their products. Accordingly, we began our reasonable country of origin inquiries in fiscal year 2013, with initial disclosure requirements beginning in May 2014. There are costs associated with complying with these disclosure requirements, including for due diligence to determine the sources of conflict minerals used in our products and other potential changes to products, processes or sources of supply as a consequence of such verification activities. The implementation of these rules could adversely affect the sourcing, supply and pricing of materials used in our products. As there may be only a limited number of suppliers offering "conflict free" conflict minerals, we cannot be sure that we will be able to obtain necessary conflict minerals from such suppliers in sufficient quantities or at competitive prices. Also, we may face reputational challenges if we determine that certain of our products contain minerals not determined to be conflict free or if we are unable to sufficiently verify the origins for all conflict minerals used in our products through the procedures we may implement.
We are subject to adverse changes in tax laws.
Our tax expense or benefits could be adversely affected by changes in tax provisions, unfavorable findings in tax examinations or differing interpretations by tax authorities. We are unable to estimate the impact that current and future tax proposals and tax laws could have on our results of operations. We are currently subject to state and local tax examinations for which we do not expect any major assessments.
We are subject to international regulations that could adversely affect our business and results of operations.
Due to our use of representatives in foreign markets, we are subject to many laws governing international relations, including those that prohibit improper payments to government officials and commercial customers, and restrict where we can do business, what information or products we can supply to certain countries and what information we can provide to a non-U.S. government, including but not limited to the Foreign Corrupt Practices Act, U.K. Bribery Act and the U.S. Export Administration Act. Violations of these laws, which are complex, may result in criminal penalties or sanctions that could have a material adverse effect on our business, financial condition and results of operations.
Operations may be affected by natural disasters, especially since most of our operations are performed at a single location.
Natural disasters such as tornadoes and ice storms, as well as accidents, acts of terror, infection and other factors beyond our control could adversely affect our operations. Especially, as our facilities are in areas where tornadoes are likely to occur, and the majority of our operations are at our Tulsa facilities, the effects of natural disasters and other events could damage our facilities and equipment and force a temporary halt to manufacturing and other operations, and such events could consequently cause severe damage to our business. We maintain insurance against these sorts of events; however, this is not guaranteed to cover all the losses and damages incurred.
If we are unable to hire, develop or retain employees, it could have an adverse effect on our business.
We compete to hire new employees and then seek to train them to develop their skills. We may not be able to successfully recruit, develop and retain the personnel we need. Unplanned turnover or failure to hire and retain a diverse, skilled workforce, could increase our operating costs and adversely affect our results of operations.
Variability in self-insurance liability estimates could impact our results of operations.
We self-insure for employee health insurance and workers' compensation insurance coverage up to a predetermined level, beyond which we maintain stop-loss insurance from a third-party insurer for claims over $200,000 and $750,000 for employee health insurance claims and workers' compensation insurance claims, respectively. Our aggregate exposure varies from year to year based upon the number of participants in our insurance plans. We estimate our self-insurance liabilities using an analysis provided by our claims administrator and our historical claims experience. Our accruals
7
for insurance reserves reflect these estimates and other management judgments, which are subject to a high degree of variability. If the number or severity of claims for which we self-insure increases, it could cause a material and adverse change to our reserves for self-insurance liabilities, as well as to our earnings.
None.
As of
December 31, 2017
, we own all of our facilities, consisting of approximately 1.55 million square feet of space for office, manufacturing, warehouse, assembly operations and parts sales in Tulsa, Oklahoma, and Longview, Texas. We believe that our facilities are well maintained and are in good condition and suitable for the conduct of our business.
Our plant and office facilities in Tulsa, Oklahoma, consist of a 342,000 sq. ft. building (327,000 sq. ft. of manufacturing/warehouse space and 15,000 sq. ft. of office space) located on a 12-acre tract of land at 2425 South Yukon Avenue, and a 940,000 sq. ft. manufacturing/warehouse building and a 70,000 sq. ft. office building located on an approximately 78-acre tract of land across the street from the original facility (2440 South Yukon Avenue) (the "Tulsa facilities").
Our manufacturing area is in heavy industrial type buildings, with some coverage by overhead cranes, containing manufacturing equipment designed for sheet metal fabrication and metal stamping. The manufacturing equipment contained in the facilities consists primarily of automated sheet metal fabrication equipment, supplemented by presses. Assembly lines consist of six cart-type conveyor lines and one roller-type conveyor line with variable line speed adjustment, which are motor driven. Subassembly areas and production line manning are based upon line speed.
In 2017, construction continued on a new engineering research and development laboratory at the Tulsa facilities, since named the Norman Asbjornson Innovation Center. The three-story 134,000 square foot facility will be both an acoustical and a performance measuring laboratory. The new facility will consist of ten test chambers allowing AAON to meet and maintain industry certifications.
Our operations in Longview, Texas, are conducted in a plant/office building at 203-207 Gum Springs Road, containing 263,000 sq. ft. on 33.0 acres. The manufacturing area (approximately 256,000 sq. ft.) is located in three 120-foot wide sheet metal buildings connected by an adjoining structure. The remaining 7,000 square feet are utilized as office space. The facility is built for light industrial manufacturing.
Item 3.
Legal Proceedings.
We are not a party to any pending legal proceeding which management believes is likely to result in a material liability and no such action has been threatened against us, or, to the best of our knowledge, is contemplated.
Not applicable.
Item 5.
Market for Registrant's Common Equity, Related Stockholder Matters and Issuer Purchases of Equity Securities.
Our common stock is quoted on the NASDAQ Global Select Market under the symbol "AAON". The table below summarizes the intraday high and low reported sale prices for our common stock for the past two fiscal years. As of the close of business on
February 23, 2018
, there were 1,139 holders of record of our common stock.
8
|
Quarter Ended
|
High
|
Low
|
||
|
March 31, 2016
|
$28.02
|
$19.49
|
||
|
June 30, 2016
|
$28.27
|
$25.65
|
||
|
September 30, 2016
|
$29.04
|
$25.75
|
||
|
December 31, 2016
|
$33.90
|
$27.55
|
||
|
March 31, 2017
|
$37.00
|
$31.95
|
||
|
June 30, 2017
|
$38.10
|
$33.95
|
||
|
September 29, 2017
|
$37.65
|
$31.65
|
||
|
December 29, 2017
|
$37.55
|
$33.35
|
||
Dividends -
At the discretion of the Board of Directors, we pay semi-annual cash dividends. Board approval is required to determine the date of declaration and amount for each semi-annual dividend payment.
Our recent dividends are as follows:
|
Declaration Date
|
Record Date
|
Payment Date
|
Dividend per Share
|
|
May 19, 2015
|
June 12, 2015
|
July 1, 2015
|
$0.11
|
|
October 29, 2015
|
December 2, 2015
|
December 23, 2015
|
$0.11
|
|
May 24, 2016
|
June 10, 2016
|
July 1, 2016
|
$0.11
|
|
November 9, 2016
|
December 2, 2016
|
December 23, 2016
|
$0.13
|
|
May 16, 2017
|
June 9, 2017
|
July 7, 2017
|
$0.13
|
|
November 7, 2017
|
November 30, 2017
|
December 21, 2017
|
$0.13
|
The following is a summary of our share-based compensation plans as of December 31,
2017
:
|
EQUITY COMPENSATION PLAN INFORMATION
|
||||||||||
|
Plan category
|
(a)
Number of securities to be issued upon exercise of outstanding options, warrants and rights
|
(b)
Weighted-average exercise price of outstanding options, warrants and rights
|
(c)
Number of securities remaining available for future issuance under equity compensation plans (excluding securities reflected in column (a))
|
|||||||
|
The 2007 Long-Term Incentive Plan
|
456,475
|
|
$
|
13.31
|
|
—
|
|
|||
|
The 2016 Long-Term Incentive Plan
|
100,836
|
|
$
|
32.71
|
|
2,983,642
|
|
|||
9
Repurchases during the fourth quarter of
2017
were as follows:
|
ISSUER PURCHASES OF EQUITY SECURITIES
|
|||||||||||||
|
(a)
Total
Number
of Shares
(or Units
|
(b)
Average
Price
Paid
(Per Share
|
(c)
Total Number
of Shares (or
Units) Purchased
as part of
Publicly Announced
|
(d)
Maximum Number (or
Approximate Dollar
Value) of Shares (or
Units) that may yet be
Purchased under the
|
||||||||||
|
Period
|
Purchased)
|
or Unit)
|
Plans or Programs
|
Plans or Programs
|
|||||||||
|
October 2017
|
49,485
|
|
$
|
34.51
|
|
49,485
|
|
—
|
|
||||
|
November 2017
|
27,044
|
|
35.34
|
|
27,044
|
|
—
|
|
|||||
|
December 2017
|
38,245
|
|
36.29
|
|
38,245
|
|
—
|
|
|||||
|
Total
|
114,774
|
|
$
|
35.30
|
|
114,774
|
|
—
|
|
||||
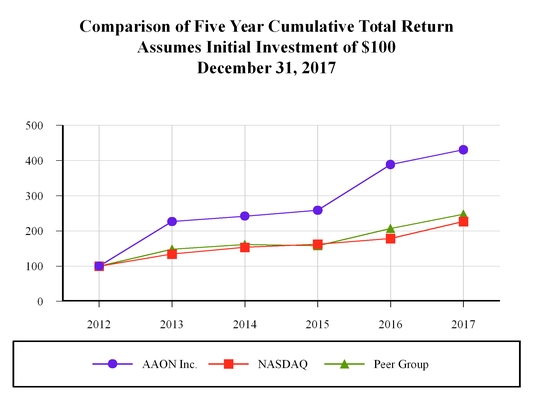
Comparative Stock Performance Graph
The following performance graph compares our cumulative total shareholder return, the NASDAQ Composite and a peer group of U.S. industrial manufacturing companies in the air conditioning, ventilation, and heating exchange equipment markets from December 31,
2012
through
December 31, 2017
. The graph assumes that $100 was invested at the close of trading December 31,
2012
, with reinvestment of dividends. Our peer group includes Lennox International, Inc., Ingersoll Rand Limited, Johnson Controls Inc., and United Technologies Corporation. This table is not intended to forecast future performance of our Common Stock.
This stock performance Graph is not deemed to be “soliciting material” or otherwise be considered to be “filed” with the SEC or subject to Regulation 14A or 14C under the Securities Exchange Act of 1934 (Exchange Act) or to the liabilities of Section 18 of the Exchange Act, and should not be deemed to be incorporated by reference into any filing under the Securities Act of 1933 or the Exchange Act, except to the extent the Company specifically incorporates it by reference into such a filing.
10
Item 6.
Selected Financial Data
.
The following selected financial data should be read in conjunction with our Consolidated Financial Statements and Notes thereto included under Item 8 of this report and "Management's Discussion and Analysis of Financial Condition and Results of Operations" contained in Item 7.
|
|
Years Ended December 31,
|
|||||||||||||||||||
|
Results of Operations:
|
2017
|
2016
|
2015
|
2014
|
2013
|
|||||||||||||||
|
|
(in thousands, except per share data)
|
|||||||||||||||||||
|
Net sales
|
$
|
405,232
|
|
$
|
383,977
|
|
$
|
358,632
|
|
$
|
356,322
|
|
$
|
321,140
|
|
|||||
|
Net income
|
$
|
54,498
|
|
$
|
53,376
|
|
$
|
45,728
|
|
$
|
44,158
|
|
$
|
37,547
|
|
|||||
|
Earnings per share:
|
|
|
|
|
|
|
|
|
|
|
||||||||||
|
Basic
|
$
|
1.04
|
|
$
|
1.01
|
|
$
|
0.85
|
|
$
|
0.81
|
|
$
|
0.68
|
|
|||||
|
Diluted
|
$
|
1.03
|
|
$
|
1.00
|
|
$
|
0.84
|
|
$
|
0.80
|
|
$
|
0.68
|
|
|||||
|
Cash dividends declared per common share:
|
$
|
0.26
|
|
$
|
0.24
|
|
$
|
0.22
|
|
$
|
0.18
|
|
$
|
0.13
|
|
|||||
|
|
December 31,
|
||||||||||||||||||
|
Financial Position at End of Fiscal Year:
|
2017
|
2016
|
2015
|
2014
|
2013
|
||||||||||||||
|
|
(in thousands)
|
||||||||||||||||||
|
Working capital
|
$
|
103,662
|
|
$
|
101,939
|
|
$
|
80,800
|
|
$
|
82,227
|
|
$
|
72,515
|
|
||||
|
Total assets
|
296,780
|
|
256,530
|
|
232,854
|
|
226,974
|
|
210,665
|
|
|||||||||
|
Long-term and current debt
|
—
|
|
—
|
|
—
|
|
—
|
|
—
|
|
|||||||||
|
Total stockholders’ equity
|
237,226
|
|
205,898
|
|
178,918
|
|
174,059
|
|
164,106
|
|
|||||||||
Use of Non-GAAP Financial Measure
To supplement the Company's consolidated financial statements presented in accordance with generally accepted accounting principles ("GAAP"), an additional non-GAAP financial measure is provided and reconciled in the following table. The Company believes that this non-GAAP financial measure, when considered together with the GAAP financial measures, provides information that is useful to investors in understanding period-over-period operating results. The Company believes that this non-GAAP financial measure enhances the ability of investors to analyze the Company’s business trends and operating performance.
EBITDAX
EBITDAX (as defined below) is presented herein and reconciled from the GAAP measure of net income because of its wide acceptance by the investment community as a financial indicator of a company's ability to internally fund operations.
The Company defines EBITDAX as net income, plus (1) depreciation, (2) amortization of bond premiums, (3) share-based compensation, (4) interest (income) expense and (5) income tax expense. EBITDAX is not a measure of net income or cash flows as determined by GAAP.
The Company's EBITDAX measure provides additional information which may be used to better understand the Company’s operations. EBITDAX is one of several metrics that the Company uses as a supplemental financial measurement in the evaluation of its business and should not be considered as an alternative to, or more meaningful than, net income, as an indicator of operating performance. Certain items excluded from EBITDAX are significant components in understanding and assessing a company's financial performance. EBITDAX, as used by the Company, may not be comparable to similarly titled measures reported by other companies. The Company believes that EBITDAX is a widely followed measure of operating performance and is one of many metrics used by the Company’s management team, and by other users of the Company’s consolidated financial statements.
11
The following table provides a reconciliation of net income (GAAP) to EBITDAX (non-GAAP) for the periods indicated:
|
|
December 31,
|
||||||||||||||||||
|
2017
|
2016
|
2015
|
2014
|
2013
|
|||||||||||||||
|
|
(in thousands)
|
||||||||||||||||||
|
Net Income, a GAAP measure
|
$
|
54,498
|
|
$
|
53,376
|
|
$
|
45,728
|
|
$
|
44,158
|
|
$
|
37,547
|
|
||||
|
Depreciation
|
15,007
|
|
13,035
|
|
11,741
|
|
11,553
|
|
12,312
|
|
|||||||||
|
Amortization of bond premiums
|
47
|
|
249
|
|
266
|
|
688
|
|
790
|
|
|||||||||
|
Share-based compensation
|
6,458
|
|
4,357
|
|
2,891
|
|
2,178
|
|
1,763
|
|
|||||||||
|
Interest income
|
(345
|
)
|
(541
|
)
|
(427
|
)
|
(964
|
)
|
(1,011
|
)
|
|||||||||
|
Income tax expense
|
19,994
|
|
26,615
|
|
25,611
|
|
24,088
|
|
18,747
|
|
|||||||||
|
EBITDAX, a non-GAAP measure
|
$
|
95,659
|
|
$
|
97,091
|
|
$
|
85,810
|
|
$
|
81,701
|
|
$
|
70,148
|
|
||||
Overview
We engineer, manufacture, market and sell air conditioning and heating equipment consisting of standard, semi-custom and custom rooftop units, chillers, packaged outdoor mechanical rooms, air handling units, makeup air units, energy recovery units, condensing units, geothermal/water-source heat pumps and coils. These products are marketed and sold to retail, manufacturing, educational, lodging, supermarket, medical and other commercial industries. We market our products to all 50 states in the United States and certain provinces in Canada.
Our business can be affected by a number of economic factors, including the level of economic activity in the markets in which we operate. The recent uncertainty of the economy has negatively impacted the commercial and industrial new construction markets. A further decline in economic activity could result in a decrease in our sales volume and profitability. Sales in the commercial and industrial new construction markets correlate closely to the number of new homes and buildings that are built, which in turn is influenced by cyclical factors such as interest rates, inflation, consumer spending habits, employment rates and other macroeconomic factors over which we have no control.
We sell our products to property owners and contractors through a network of manufacturers’ representatives and our internal sales force. The demand for our products is influenced by national and regional economic and demographic factors. The commercial and industrial new construction market is subject to cyclical fluctuations in that it is generally tied to housing starts, but has a lag factor of six to 18 months. Housing starts, in turn, are affected by such factors as interest rates, the state of the economy, population growth and the relative age of the population. When new construction is down, we emphasize the replacement market. The new construction market in
2017
continued to be unpredictable and uneven. Thus, throughout the year, we emphasized promotion of the benefits of AAON equipment to property owners in the replacement market.
The principal components of cost of goods sold are labor, raw materials, component costs, factory overhead, freight out and engineering expense. The principal high volume raw materials used in our manufacturing processes are steel, copper and aluminum and are obtained from domestic suppliers. We also purchase from domestic manufacturers certain components, including compressors, motors and electrical controls.
The price levels of our raw materials fluctuate given that the market continues to be volatile and unpredictable as a result of the uncertainty related to the U.S. economy and global economy. For the year ended December 31,
2017
, the prices for copper, galvanized steel and stainless steel
increased
approximately
6.2%
,
15.8%
and
4.4%
, respectively, from a year ago, while the price for aluminum remained relatively unchanged from a year ago. For the year ended December 31,
2016
, the prices for copper, galvanized steel and stainless steel
decreased
approximately
4.8%
,
9.5%
, and
12.3%
, respectively, from
2015
, while the price for aluminum increased
0.0%
from
2015
.
We attempt to limit the impact of price fluctuations on these materials by entering into cancellable and non-cancellable fixed price contracts with our major suppliers for periods of six to 18 months. We expect to receive delivery of raw materials from our fixed price contracts for use in our manufacturing operations.
12
The following are highlights of our results of operations, cash flows, and financial condition:
|
•
|
We spent
$41.7 million
in capital expenditures in
2017
, an
increase
of $15.1 million from the
$26.6 million
spent in
2016
, primarily due to construction projects related to our new research and development lab, water-source heat pump production line, as well as other internal development projects.
|
|
•
|
We paid cash dividends of
$13.7 million
in
2017
compared to
$12.7 million
in
2016
.
|
|
•
|
We experienced increases in our warranty expense due to refinements and changes to our warranty process.
|
Results of Operations
Units sold for years ended December 31:
|
2017
|
2016
|
2015
|
|||||||
|
Rooftop Units
|
16,003
|
|
16,764
|
|
14,891
|
|
|||
|
Split Systems
|
4,829
|
|
3,753
|
|
3,385
|
|
|||
|
Outdoor Mechanical Rooms
|
64
|
|
65
|
|
57
|
|
|||
|
Water-Source Heat Pumps
|
2,485
|
|
316
|
|
243
|
|
|||
|
Total Units
|
23,381
|
|
20,898
|
|
18,576
|
|
|||
Year Ended December 31,
2017
vs. Year Ended December 31,
2016
Net Sales
|
|
Years Ending December 31,
|
|||||||||||||
|
|
2017
|
2016
|
$ Change
|
% Change
|
||||||||||
|
(in thousands, except unit data)
|
||||||||||||||
|
Net sales
|
$
|
405,232
|
|
$
|
383,977
|
|
$
|
21,255
|
|
5.5
|
%
|
|||
|
Total units
|
23,381
|
|
20,898
|
|
2,483
|
|
11.9
|
%
|
||||||
While we did see an
11.9%
increase in the volume of units sold, most of that increase was in Water-Source Heat Pumps which have a lower price per unit than our other products. As such, total net sales did not increase by the same percentage as our volume.
Cost of Sales
|
|
Years Ending December 31,
|
Percent of Sales
|
||||||||||||
|
|
2017
|
2016
|
2017
|
2016
|
||||||||||
|
(in thousands)
|
||||||||||||||
|
Cost of sales
|
$
|
281,835
|
|
$
|
265,897
|
|
69.5
|
%
|
69.2
|
%
|
||||
|
Gross Profit
|
123,397
|
|
118,080
|
|
30.5
|
%
|
30.8
|
%
|
||||||
The principal components of cost of sales are labor, raw materials, component costs, factory overhead, freight out and engineering expense. The principal high volume raw materials used in our manufacturing processes are steel, copper and aluminum, which are obtained from domestic suppliers. As shown below, our raw material prices increased during the year. The Company's gross profit remained stable due to efforts to improve efficiency and absorb overhead.
Twelve month average raw material cost per pound as of December 31:
13
|
Years Ending December 31,
|
|||||||||||
|
2017
|
2016
|
% Change
|
|||||||||
|
Copper
|
$
|
3.58
|
|
$
|
3.37
|
|
6.2
|
%
|
|||
|
Galvanized Steel
|
$
|
0.44
|
|
$
|
0.38
|
|
15.8
|
%
|
|||
|
Stainless Steel
|
$
|
1.19
|
|
$
|
1.14
|
|
4.4
|
%
|
|||
|
Aluminum
|
$
|
1.71
|
|
$
|
1.67
|
|
2.4
|
%
|
|||
Selling, General and Administrative Expenses
|
Years Ending December 31,
|
Percent of Sales
|
|||||||||||||
|
2017
|
2016
|
2017
|
2016
|
|||||||||||
|
(in thousands)
|
||||||||||||||
|
Warranty
|
$
|
11,233
|
|
$
|
3,601
|
|
2.8
|
%
|
0.9
|
%
|
||||
|
Profit Sharing
|
8,400
|
|
8,991
|
|
2.1
|
%
|
2.3
|
%
|
||||||
|
Salaries & Benefits
|
11,586
|
|
11,363
|
|
2.9
|
%
|
3.0
|
%
|
||||||
|
Stock Compensation
|
4,288
|
|
2,914
|
|
1.1
|
%
|
0.8
|
%
|
||||||
|
Advertising
|
1,735
|
|
1,395
|
|
0.4
|
%
|
0.4
|
%
|
||||||
|
Depreciation
|
720
|
|
796
|
|
0.2
|
%
|
0.2
|
%
|
||||||
|
Insurance
|
1,005
|
|
1,072
|
|
0.2
|
%
|
0.3
|
%
|
||||||
|
Professional Fees
|
1,888
|
|
2,032
|
|
0.5
|
%
|
0.5
|
%
|
||||||
|
Donations
|
724
|
|
370
|
|
0.2
|
%
|
0.1
|
%
|
||||||
|
Bad Debt Expense
|
179
|
|
(45
|
)
|
—
|
%
|
—
|
%
|
||||||
|
Other
|
7,491
|
|
6,017
|
|
1.8
|
%
|
1.6
|
%
|
||||||
|
Total SG&A
|
$
|
49,249
|
|
$
|
38,506
|
|
12.2
|
%
|
10.0
|
%
|
||||
The overall increase in SG&A was primarily due to increased warranty expenses. The Company has been working on modifications and refinements to its warranty policy. These modifications more clearly define what qualifies as a warranty claim and place a deadline for when claims may be submitted.
Income Taxes
|
|
Years Ending December 31,
|
Effective Tax Rate
|
||||||||||||
|
|
2017
|
2016
|
2017
|
2016
|
||||||||||
|
(in thousands)
|
||||||||||||||
|
Income tax provision
|
$
|
19,994
|
|
$
|
26,615
|
|
26.8
|
%
|
33.3
|
%
|
||||
The Tax Cuts and Jobs Act (the "Act") was enacted on December 22, 2017. As a result of the changes provided under the Act, the Company adjusted its deferred tax assets and liabilities existing at the date of enactment using the newly enacted rates for the periods when they are expected to be realized. This remeasurement resulted in a benefit to income taxes of $4.4 million.
14
Year Ended December 31,
2016
vs. Year Ended December 31,
2015
Net Sales
|
|
Years Ending December 31,
|
|||||||||||||
|
|
2016
|
2015
|
$ Change
|
% Change
|
||||||||||
|
(in thousands, except unit data)
|
||||||||||||||
|
Net sales
|
$
|
383,977
|
|
$
|
358,632
|
|
$
|
25,345
|
|
7.1
|
%
|
|||
|
Total units
|
20,898
|
|
18,576
|
|
2,322
|
|
12.5
|
%
|
||||||
Net sales increased due to an increase in our total units sold, offset by a decline in the average price per unit for both of our locations.
Cost of Sales
|
|
Years Ending December 31,
|
Percent of Sales
|
||||||||||||
|
|
2016
|
2015
|
2016
|
2015
|
||||||||||
|
(in thousands)
|
||||||||||||||
|
Cost of sales
|
$
|
265,897
|
|
$
|
249,951
|
|
69.2
|
%
|
69.7
|
%
|
||||
|
Gross Profit
|
118,080
|
|
108,681
|
|
30.8
|
%
|
30.3
|
%
|
||||||
The principal components of cost of sales are labor, raw materials, component costs, factory overhead, freight out and engineering expense. The principal high volume raw materials used in our manufacturing processes are steel, copper and aluminum, which are obtained from domestic suppliers.
Twelve month average raw material cost per pound as of December 31:
|
Years Ending December 31,
|
|||||||||||
|
2016
|
2015
|
% Change
|
|||||||||
|
Copper
|
$
|
3.37
|
|
$
|
3.54
|
|
(4.8
|
)%
|
|||
|
Galvanized Steel
|
$
|
0.38
|
|
$
|
0.42
|
|
(9.5
|
)%
|
|||
|
Stainless Steel
|
$
|
1.14
|
|
$
|
1.30
|
|
(12.3
|
)%
|
|||
|
Aluminum
|
$
|
1.67
|
|
$
|
1.67
|
|
—
|
%
|
|||
15
Selling, General and Administrative Expenses
|
Years Ending December 31,
|
Percent of Sales
|
|||||||||||||
|
2016
|
2015
|
2016
|
2015
|
|||||||||||
|
(in thousands)
|
||||||||||||||
|
Warranty
|
$
|
3,601
|
|
$
|
4,317
|
|
0.9
|
%
|
1.2
|
%
|
||||
|
Profit Sharing
|
8,991
|
|
8,037
|
|
2.3
|
%
|
2.2
|
%
|
||||||
|
Salaries & Benefits
|
11,363
|
|
11,078
|
|
3.0
|
%
|
3.1
|
%
|
||||||
|
Stock Compensation
|
2,914
|
|
2,082
|
|
0.8
|
%
|
0.6
|
%
|
||||||
|
Advertising
|
1,395
|
|
1,191
|
|
0.4
|
%
|
0.3
|
%
|
||||||
|
Depreciation
|
796
|
|
930
|
|
0.2
|
%
|
0.3
|
%
|
||||||
|
Insurance
|
1,072
|
|
1,153
|
|
0.3
|
%
|
0.3
|
%
|
||||||
|
Professional Fees
|
2,032
|
|
1,794
|
|
0.5
|
%
|
0.5
|
%
|
||||||
|
Donations
|
370
|
|
452
|
|
0.1
|
%
|
0.1
|
%
|
||||||
|
Bad Debt Expense
|
(45
|
)
|
(48
|
)
|
—
|
%
|
—
|
%
|
||||||
|
Other
|
6,017
|
|
6,452
|
|
1.6
|
%
|
1.8
|
%
|
||||||
|
Total SG&A
|
$
|
38,506
|
|
$
|
37,438
|
|
10.0
|
%
|
10.4
|
%
|
||||
The increase in SG&A is primarily due to increased compensation costs due to better operating results, offset by a decrease in warranty expense as a result of continued improvements in quality control and a decrease in other expense.
Income Taxes
|
|
Years Ending December 31,
|
Effective Tax Rate
|
||||||||||||
|
|
2016
|
2015
|
2016
|
2015
|
||||||||||
|
(in thousands)
|
||||||||||||||
|
Income tax provision
|
$
|
26,615
|
|
$
|
25,611
|
|
33.3
|
%
|
35.9
|
%
|
||||
The Company early adopted ASU 2016-09, Improvements to Employee Share-Based Payment Accounting, applying the changes for excess tax benefits and tax deficiencies prospectively. As a result, excess tax benefits and deficiencies are reported as an income tax benefit or expense on the statement of income rather than as a component of additional paid-in capital on the statement of equity. Excess tax benefits and deficiencies are treated as discrete items to the income tax provision in the reporting period in which they occur. For the twelve months ended December 31, 2016, the Company recorded $2.1 million in excess tax benefits as an income tax benefit.
Liquidity and Capital Resources
Our working capital and capital expenditure requirements are generally met through net cash provided by operations and the occasional use of the revolving bank line of credit based on our current liquidity at the time.
Our cash and cash equivalents decreased
$2.7 million
from
December 31, 2016
to
December 31, 2017
. As of
December 31, 2017
, we had
$21.5 million
in cash and cash equivalents.
As of December 31,
2017
, we had certificates of deposit of
$2.9 million
and investments held to maturity at amortized cost of
$6.1 million
. These certificates of deposit had maturity dates of
one to five months
. The investments held to maturity at amortized cost had maturity dates of
one to four months
.
16
On July 25, 2016 we renewed our line of credit with BOKF, NA dba Bank of Oklahoma, formerly known as Bank of Oklahoma, N.A. ("Bank of Oklahoma"). The revolving line of credit matures on July 27, 2018. We expect to renew our line of credit in July 2018 with favorable terms. Under the line of credit, there was one standby letter of credit of $0.8 million as of
December 31, 2017
. At December 31,
2017
we have $29.2 million of borrowings available under the revolving credit facility. No fees are associated with the unused portion of the committed amount.
As of December 31,
2017
and
2016
, there were no outstanding balances under the revolving credit facility. Interest on borrowings is payable monthly at LIBOR plus
2.5%
. The weighted average interest rate was
3.5%
and
3.0%
for the years ended December 31,
2017
and
2016
, respectively.
At December 31,
2017
, we were in compliance with all of the covenants under the revolving credit facility. We are obligated to comply with certain financial covenants under the revolving credit facility. These covenants require that we meet certain parameters related to our tangible net worth and total liabilities to tangible net worth ratio. At December 31,
2017
, our tangible net worth was
$237.2 million
, which meets the requirement of being at or above $125.0 million. Our total liabilities to tangible net worth ratio was
0.3
to 1.0 which meets the requirement of not being above 2 to 1.
The Board has authorized three stock repurchase programs for the Company. The Company may purchase shares on the open market from time to time, up to a total of
5.7 million
shares. The Board must authorize the timing and amount of these purchases. Effective May 24, 2016, the Board authorized up to $25.0 million in open market repurchases and on June 2, 2016, the Company executed a repurchase agreement in accordance with the rules and regulations of the SEC allowing the Company to repurchase an aggregate amount of $25.0 million or a total of approximately 2.0 million shares from the open market. The repurchase agreement expired on April 15, 2017. The Company also has a stock repurchase arrangement by which employee-participants in our 401(k) savings and investment plan are entitled to have shares in AAON, Inc. stock in their accounts sold to the Company. The maximum number of shares to be repurchased is contingent upon the number of shares sold by employee-participants. Lastly, the Company repurchases shares of AAON, Inc. stock from certain of its directors and employees for payment of statutory tax withholdings on stock transactions. Any other repurchases from directors or employees are contingent upon Board approval. All repurchases are done at current market prices.
Our repurchase activity is as follows:
|
2017
|
2016
|
2015
|
||||||||||||||||||||||
|
Program
|
Shares
|
Total $
|
$ per share
|
Shares
|
Total $
|
$ per share
|
Shares
|
Total $
|
$ per share
|
|||||||||||||||
|
Open market
|
8,676
|
|
$
|
283,654
|
|
$
|
32.69
|
|
165,598
|
|
$
|
4,440,658
|
|
$
|
26.82
|
|
1,037,590
|
|
$
|
24,999,963
|
|
$
|
24.09
|
|
|
401(k)
|
467,580
|
|
16,336,084
|
|
34.94
|
|
540,501
|
|
14,875,850
|
|
27.52
|
|
512,754
|
|
11,557,598
|
|
22.54
|
|
||||||
|
Directors and employees
|
45,878
|
|
1,614,425
|
|
35.19
|
|
30,072
|
|
823,446
|
|
27.38
|
|
25,746
|
|
585,413
|
|
22.74
|
|
||||||
|
Total
|
522,134
|
|
$
|
18,234,163
|
|
$
|
34.92
|
|
736,171
|
|
$
|
20,139,954
|
|
$
|
27.36
|
|
1,576,090
|
|
$
|
37,142,974
|
|
$
|
23.57
|
|
|
Inception to Date
|
||||||||
|
Program
|
Shares
|
Total $
|
$ per share
|
|||||
|
Open market
|
3,843,495
|
|
$
|
61,232,115
|
|
$
|
15.93
|
|
|
401(k)
|
6,550,023
|
|
82,068,805
|
|
12.53
|
|
||
|
Directors and employees
|
1,919,510
|
|
17,278,033
|
|
9.00
|
|
||
|
Total
|
12,313,028
|
|
$
|
160,578,953
|
|
$
|
13.04
|
|
Dividends
- At the discretion of the Board of Directors, we pay semi-annual cash dividends. Board approval is required to determine the date of declaration and amount for each semi-annual dividend payment.
Our recent dividends are as follows:
17
|
Declaration Date
|
Record Date
|
Payment Date
|
Dividend per Share
|
||
|
May 19, 2015
|
June 12, 2015
|
July 1, 2015
|
$
|
0.11
|
|
|
October 29, 2015
|
December 2, 2015
|
December 23, 2015
|
$
|
0.11
|
|
|
May 24, 2016
|
June 10, 2016
|
July 1, 2016
|
$
|
0.11
|
|
|
November 9, 2016
|
December 2, 2016
|
December 23, 2016
|
$
|
0.13
|
|
|
May 16, 2017
|
June 9, 2017
|
July 7, 2017
|
$
|
0.13
|
|
|
November 7, 2017
|
November 30, 2017
|
December 21, 2017
|
$
|
0.13
|
|
Based on historical performance and current expectations, we believe our cash and cash equivalents balance, the projected cash flows generated from our operations, our existing committed revolving credit facility (or comparable financing) and our expected ability to access capital markets will satisfy our working capital needs, capital expenditures and other liquidity requirements associated with our operations in
2018
and the foreseeable future.
The table below reflects a summary of our net cash flows provided by operating activities, net cash flows used in investing activities, and net cash flows used in financing activities for the years indicated.
|
|
2017
|
2016
|
2015
|
||||||||
|
|
(in thousands)
|
||||||||||
|
Operating Activities
|
|||||||||||
|
Net Income
|
$
|
54,498
|
|
$
|
53,376
|
|
$
|
45,728
|
|
||
|
Income statement adjustments, net
|
20,362
|
|
18,996
|
|
16,250
|
|
|||||
|
Changes in assets and liabilities:
|
|||||||||||
|
Accounts receivable
|
(7,516
|
)
|
7,048
|
|
(5,884
|
)
|
|||||
|
Income tax receivable
|
4,596
|
|
(1,537
|
)
|
312
|
|
|||||
|
Inventories
|
(23,698
|
)
|
(9,478
|
)
|
(1,059
|
)
|
|||||
|
Prepaid expenses and other
|
98
|
|
(83
|
)
|
76
|
|
|||||
|
Accounts payable
|
3,043
|
|
654
|
|
(5,109
|
)
|
|||||
|
Deferred revenue
|
258
|
|
417
|
|
189
|
|
|||||
|
Accrued liabilities
|
6,353
|
|
(5,470
|
)
|
4,852
|
|
|||||
|
Net cash provided by operating activities
|
57,994
|
|
63,923
|
|
55,355
|
|
|||||
|
Investing Activities
|
|||||||||||
|
Capital expenditures
|
(41,713
|
)
|
(26,604
|
)
|
(20,967
|
)
|
|||||
|
Purchases of investments
|
(18,521
|
)
|
(14,496
|
)
|
(20,863
|
)
|
|||||
|
Maturities of investments and proceeds from called investments
|
29,112
|
|
24,095
|
|
18,519
|
|
|||||
|
Other
|
70
|
|
80
|
|
117
|
|
|||||
|
Net cash used in investing activities
|
(31,052
|
)
|
(16,925
|
)
|
(23,194
|
)
|
|||||
|
Financing Activities
|
|||||||||||
|
(Payments) borrowings under revolving credit facility, net
|
—
|
|
—
|
|
—
|
|
|||||
|
Stock options exercised
|
2,259
|
|
2,063
|
|
2,795
|
|
|||||
|
Repurchase of stock
|
(16,620
|
)
|
(19,317
|
)
|
(36,558
|
)
|
|||||
|
Employee taxes paid by withholding shares
|
(1,614
|
)
|
(823
|
)
|
(585
|
)
|
|||||
|
Cash dividends paid to stockholders
|
(13,663
|
)
|
(12,676
|
)
|
(11,857
|
)
|
|||||
|
Net cash used in financing activities
|
$
|
(29,638
|
)
|
$
|
(30,753
|
)
|
$
|
(46,205
|
)
|
||
Cash Flows from Operating Activities
Cash flows from operating activities decreased primarily due to increased purchases of inventory during the year.
18
Cash Flows from Investing Activities
The capital expenditure program for
2018
is estimated to be approximately $53.2 million. The increase in capital expenditures is primarily due to construction projects related to our new research and development lab, water-source heat pump production lines, as well as other internal development projects. Many of these projects are subject to review and cancellation at the discretion of our CEO and Board of Directors without incurring substantial charges.
Cash Flows from Financing Activities
Cash flows used in financing activities decreased slightly due to fewer open market buybacks following the expiration of the Company's repurchase agreement in April 2017.
Off-Balance Sheet Arrangements
We are not party to any off-balance sheet arrangements that have or are reasonably likely to have a material current or future effect on our financial condition, changes in financial condition, revenues, expenses, results of operations, liquidity, capital expenditures or capital resources.
Commitments and Contractual Agreements
We had no material contractual purchase agreements as of December 31,
2017
.
Contingencies
We are subject to various claims and legal actions that arise in the ordinary course of business. We closely monitor these claims and legal actions and frequently consult with our legal counsel to determine whether they may, when resolved, have a material adverse effect on our financial position, results of operations or cash flows and we accrue and/or disclose loss contingencies as appropriate. We have concluded that the likelihood is remote that the ultimate resolution of any pending litigation or claims will be material or have a material adverse effect on the Company's business, financial position, results of operations or cash flows.
Critical Accounting Estimates
The preparation of financial statements in conformity with accounting principles generally accepted in the United States of America (“US GAAP”) requires management to make estimates and assumptions about future events, and apply judgments that affect the reported amounts of assets, liabilities, revenue and expenses in our consolidated financial statements and related notes. We base our estimates, assumptions and judgments on historical experience, current trends and other factors believed to be relevant at the time our consolidated financial statements are prepared. However, because future events and their effects cannot be determined with certainty, actual results could differ from our estimates and assumptions, and such differences could be material. We believe the following critical accounting policies affect our more significant estimates, assumptions and judgments used in the preparation of our consolidated financial statements.
Inventory Reserves
– We establish a reserve for inventories based on the change in inventory requirements due to product line changes, the feasibility of using obsolete parts for upgraded part substitutions, the required parts needed for part supply sales, replacement parts and for estimated shrinkage.
Warranty
– A provision is made for estimated warranty costs at the time the product is shipped and revenue is recognized. The warranty period is: the earlier of one year from the date of first use or 18 months from date of shipment for parts only; an additional four years on compressors (if applicable); 15 years on aluminized steel gas-fired heat exchangers (if applicable); 25 years on stainless steel heat exchangers (if applicable); and 10 years on gas-fired heat exchangers in RL products (if applicable). With the introduction of the RQ product line in 2010, our warranty policy for the RQ series was implemented to cover parts for two years from date of unit shipment and labor for one year from date of unit shipment. Our warranty policy for the WH and WV Series geothermal/water-source heat pumps covers parts for five years from the date of manufacture. Warranty expense is estimated based on the warranty period, historical warranty trends and associated costs, and any known identifiable warranty issue.
19
Due to the absence of warranty history on new products, an additional provision may be made for such products. Our estimated future warranty cost is subject to adjustment from time to time depending on changes in actual warranty trends and cost experience. Should actual claim rates differ from our estimates, revisions to the estimated product warranty liability would be required.
Stock Compensation
– We measure and recognize compensation expense for all share-based payment awards made to our employees and directors, including stock options and restricted stock awards, based on their fair values at the time of grant. Compensation expense is recognized on a straight-line basis during the service period of the related share-based compensation award. Forfeitures are accounted for as they occur. The fair value of each option award and restricted stock award is estimated on the date of grant using the Black-Scholes-Merton option pricing model. The use of the Black-Scholes-Merton option valuation model requires the input of subjective assumptions such as: the expected volatility, the expected term of the options granted, expected dividend yield, and the risk-free rate.
New Accounting Pronouncements
Changes to U.S. GAAP are established by the Financial Accounting Standards Board ("FASB") in the form of accounting standards updates ("ASUs") to the FASB's Accounting Standards Codification.
We consider the applicability and impact of all ASUs. ASUs not listed below were assessed and determined to be either not applicable or are expected to have minimal impact on our consolidated financial statements and notes thereto.
In May 2014, the FASB issued ASU 2014-09,
Revenue from Contracts with Customers
, which requires an entity to recognize the amount of revenue to which it expects to be entitled for the transfer of promised goods or services to customers. The ASU will replace most existing revenue recognition guidance in U.S. GAAP when it becomes effective. In August 2015, with the issuance of ASU 2015-14, the FASB amended the effective date for us to January 1, 2018.
The following ASUs have been issued in 2016 along with ASU 2014-09 with the same effective dates and transition requirements:
|
•
|
ASU 2016-08,
Principal versus Agent Considerations (Reporting Revenue Gross versus Net)
, which provides implementation guidance for Topic 606 on principal versus agent considerations.
|
|
•
|
ASU 2016-10,
Identifying Performance Obligations and Licensing
, which provides clarification for two aspects of Topic 606: identifying performance obligations and the licensing implementation guidance.
|
|
•
|
ASU 2016-12,
Revenue from Contracts with Customers
, which further amends Topic 606.
|
|
•
|
ASU 2016-20,
Technical Corrections and Improvements to Topic 606, Revenue from Contracts with Customers
, which further amends Topic 606.
|
The Company plans to adopt using the retrospective transition method. The Company believes the impact will not be material to the consolidated financial statements. The Company has reviewed all types of customer contracts and gone through the five step process outlined in ASU 2014-09 for each type of contract. The new five step process required by ASU 2014-09 provides results substantially consistent with our current revenue recognition policies. The Company has also evaluated the categories to use for the disaggregate revenue disclosures. The primary change upon adoption will be additional disclosures to show disaggregated revenue and further details around our revenue recognition process. Once we adopt ASU 2014-09, we not anticipate that our internal control framework will materially change, but rather that existing internal controls will be modified and augmented, as necessary, to consider our new revenue recognition policy effective January 1, 2018.
In January 2016, the FASB issued ASU 2016-01,
Recognition and Measurement of Financial Assets and Financial Liabilities
, which will address certain aspects of recognition, measurement, presentation and disclosure of financial instruments. The ASU becomes effective in the annual reporting period beginning after December 31, 2017, including interim reporting periods. We do not expect ASU 2016-01 will have a material effect on our consolidated financial statements and notes thereto.
In May 2017, the FASB issued ASU 2017-09,
Scope of Modification Accounting
, which addresses changes to the terms or condition of a share-based payment award. The ASU becomes effective in the annual reporting period beginning after December 15, 2017, including interim reporting periods. We do not expect ASU 2017-09 will have a material effect on our consolidated financial statements and notes thereto.
20
Commodity Price Risk
We are exposed to volatility in the prices of commodities used in some of our products and, occasionally, we use fixed price cancellable and non-cancellable contracts with our major suppliers for periods of six to 18 months to manage this exposure.
21
INDEX TO CONSOLIDATED FINANCIAL STATEMENTS
22
REPORT OF INDEPENDENT REGISTERED PUBLIC ACCOUNTING FIRM
Board of Directors and Stockholders
AAON, Inc.
Opinion on the financial statements
We have audited the accompanying consolidated balance sheets of AAON, Inc. (a Nevada corporation) and subsidiaries (the “Company”) as of December 31,
2017
and
2016
, and the related consolidated statements of income, stockholders’ equity, and cash flows for each of the three years in the period ended December 31,
2017
, and the related notes (collectively referred to as the "financial statements"). In our opinion, the financial statements present fairly, in all material respects, the financial position of the Company as of December 31, 2017 and 2016, and the results of its operations and its cash flows for each of the three years in the period ended December 31, 2017, in conformity with accounting principles generally accepted in the United States of America.
We also have audited, in accordance with the standards of the Public Company Accounting Oversight Board (United States) (“PCAOB”), the Company’s internal control over financial reporting as of December 31, 2017, based on criteria established in the 2013 Internal Control-Integrated Framework issued by the Committee of Sponsoring Organizations of the Treadway Commission (“COSO”), and our report dated February 27, 2018 expressed an unqualified opinion.
Basis for opinion
These financial statements are the responsibility of the Company’s management. Our responsibility is to express an opinion on the Company’s financial statements based on our audits. We are a public accounting firm registered with the PCAOB and are required to be independent with respect to the Company in accordance with the U.S. federal securities laws and the applicable rules and regulations of the Securities and Exchange Commission and the PCAOB.
We conducted our audits in accordance with the standards of the PCAOB. Those standards require that we plan and perform the audit to obtain reasonable assurance about whether the financial statements are free of material misstatement, whether due to error or fraud. Our audits included performing procedures to assess the risks of material misstatement of the financial statements, whether due to error or fraud, and performing procedures that respond to those risks. Such procedures included examining, on a test basis, evidence supporting the amounts and disclosures in the financial statements. Our audits also included evaluating the accounting principles used and significant estimates made by management, as well as evaluating the overall presentation of the financial statements. We believe that our audits provide a reasonable basis for our opinion.
/s/ GRANT THORNTON LLP
We have served as the Company's auditor since 2004
Tulsa, Oklahoma
February 27, 2018
23
|
AAON, Inc. and Subsidiaries
|
|||||||
|
|
|||||||
|
|
December 31,
|
||||||
|
|
2017
|
2016
|
|||||
|
Assets
|
(in thousands, except share and per share data)
|
||||||
|
Current assets:
|
|
|
|||||
|
Cash and cash equivalents
|
$
|
21,457
|
|
$
|
24,153
|
|
|
|
Certificates of deposit
|
2,880
|
|
5,512
|
|
|||
|
Investments held to maturity at amortized cost
|
6,077
|
|
14,083
|
|
|||
|
Accounts receivable, net
|
50,338
|
|
43,001
|
|
|||
|
Income tax receivable
|
1,643
|
|
6,239
|
|
|||
|
Note receivable
|
28
|
|
25
|
|
|||
|
Inventories, net
|
70,786
|
|
47,352
|
|
|||
|
Prepaid expenses and other
|
518
|
|
616
|
|
|||
|
Total current assets
|
153,727
|
|
140,981
|
|
|||
|
Property, plant and equipment:
|
|
|
|
|
|||
|
Land
|
2,233
|
|
2,233
|
|
|||
|
Buildings
|
92,075
|
|
78,806
|
|
|||
|
Machinery and equipment
|
184,316
|
|
158,216
|
|
|||
|
Furniture and fixtures
|
13,714
|
|
12,783
|
|
|||
|
Total property, plant and equipment
|
292,338
|
|
252,038
|
|
|||
|
Less: Accumulated depreciation
|
149,963
|
|
137,146
|
|
|||
|
Property, plant and equipment, net
|
142,375
|
|
114,892
|
|
|||
|
Note receivable, long-term
|
678
|
|
657
|
|
|||
|
Total assets
|
$
|
296,780
|
|
$
|
256,530
|
|
|
|
Liabilities and Stockholders' Equity
|
|
|
|
|
|||
|
Current liabilities:
|
|
|
|
|
|||
|
Revolving credit facility
|
$
|
—
|
|
$
|
—
|
|
|
|
Accounts payable
|
10,967
|
|
7,102
|
|
|||
|
Accrued liabilities
|
39,098
|
|
31,940
|
|
|||
|
Total current liabilities
|
50,065
|
|
39,042
|
|
|||
|
Deferred revenue
|
1,512
|
|
1,498
|
|
|||
|
Deferred tax liabilities
|
7,977
|
|
9,531
|
|
|||
|
Donations
|
—
|
|
561
|
|
|||
|
Commitments and contingencies
|
|
|
|
|
|||
|
Stockholders' equity:
|
|
|
|
|
|||
|
Preferred stock, $.001 par value, 5,000,000 shares authorized, no shares issued
|
|
|
|
|
|||
|
Common stock, $.004 par value, 100,000,000 shares authorized, 52,422,801 and 52,651,448 issued and outstanding at December 31, 2017 and 2016, respectively
|
210
|
|
211
|
|
|||
|
Additional paid-in capital
|
—
|
|
—
|
|
|||
|
Retained earnings
|
237,016
|
|
205,687
|
|
|||
|
Total stockholders' equity
|
237,226
|
|
205,898
|
|
|||
|
Total liabilities and stockholders' equity
|
$
|
296,780
|
|
$
|
256,530
|
|
|
The accompanying notes are an integral part of these consolidated financial statements.
24
|
AAON, Inc. and Subsidiaries
|
|||||||||||
|
|
|||||||||||
|
|
Years Ending December 31,
|
||||||||||
|
|
2017
|
2016
|
2015
|
||||||||
|
|
(in thousands, except per share data)
|
||||||||||
|
Net sales
|
$
|
405,232
|
|
$
|
383,977
|
|
$
|
358,632
|
|
||
|
Cost of sales
|
281,835
|
|
265,897
|
|
249,951
|
|
|||||
|
Gross profit
|
123,397
|
|
118,080
|
|
108,681
|
|
|||||
|
Selling, general and administrative expenses
|
49,249
|
|
38,506
|
|
37,438
|
|
|||||
|
(Gain) loss on disposal of assets
|
45
|
|
(20
|
)
|
(59
|
)
|
|||||
|
Income from operations
|
74,103
|
|
79,594
|
|
71,302
|
|
|||||
|
Interest income, net
|
298
|
|
292
|
|
161
|
|
|||||
|
Other income (expense), net
|
91
|
|
105
|
|
(124
|
)
|
|||||
|
Income before taxes
|
74,492
|
|
79,991
|
|
71,339
|
|
|||||
|
Income tax provision
|
19,994
|
|
26,615
|
|
25,611
|
|
|||||
|
Net income
|
$
|
54,498
|
|
$
|
53,376
|
|
$
|
45,728
|
|
||
|
Earnings per share:
|
|
|
|
|
|
|
|||||
|
Basic
|
$
|
1.04
|
|
$
|
1.01
|
|
$
|
0.85
|
|
||
|
Diluted
|
$
|
1.03
|
|
$
|
1.00
|
|
$
|
0.84
|
|
||
|
Cash dividends declared per common share:
|
$
|
0.26
|
|
$
|
0.24
|
|
$
|
0.22
|
|
||
|
Weighted average shares outstanding:
|
|
|
|
|
|||||||
|
Basic
|
52,572,496
|
|
52,924,398
|
|
54,045,841
|
|
|||||
|
Diluted
|
53,078,734
|
|
53,449,754
|
|
54,481,484
|
|
|||||
The accompanying notes are an integral part of these consolidated financial statements.
25
|
AAON, Inc. and Subsidiaries
|
||||||||||||||||||
|
Consolidated Statements of Stockholders' Equity
|
||||||||||||||||||
|
|
|
|
|
|
|
|||||||||||||
|
|
|
|
|
|
|
|||||||||||||
|
|
Common Stock
|
Paid-in
|
Retained
|
|
||||||||||||||
|
|
Shares
|
Amount
|
Capital
|
Earnings
|
Total
|
|||||||||||||
|
|
(in thousands)
|
|||||||||||||||||
|
Balance at December 31, 2014
|
54,042
|
|
$
|
216
|
|
$
|
—
|
|
$
|
173,843
|
|
$
|
174,059
|
|
||||
|
Net income
|
—
|
|
—
|
|
—
|
|
45,728
|
|
45,728
|
|
||||||||
|
Stock options exercised and restricted
|
546
|
|
2
|
|
5,238
|
|
—
|
|
5,240
|
|
||||||||
|
stock awards granted, including tax benefits
|
|
|
|
|
|
|
||||||||||||
|
Share-based compensation
|
—
|
|
—
|
|
2,891
|
|
—
|
|
2,891
|
|
||||||||
|
Stock repurchased and retired
|
(1,576
|
)
|
(6
|
)
|
(8,129
|
)
|
(29,008
|
)
|
(37,143
|
)
|
||||||||
|
Dividends
|
—
|
|
—
|
|
—
|
|
(11,857
|
)
|
(11,857
|
)
|
||||||||
|
Balance at December 31, 2015
|
53,012
|
|
212
|
|
—
|
|
178,706
|
|
178,918
|
|
||||||||
|
Net income
|
—
|
|
—
|
|
—
|
|
53,376
|
|
53,376
|
|
||||||||
|
Stock options exercised and restricted
|
375
|
|
2
|
|
2,061
|
|
—
|
|
2,063
|
|
||||||||
|
stock awards granted
|
|
|
|
|
|
|
||||||||||||
|
Share-based compensation
|
—
|
|
—
|
|
4,357
|
|
—
|
|
4,357
|
|
||||||||
|
Stock repurchased and retired
|
(736
|
)
|
(3
|
)
|
(6,418
|
)
|
(13,719
|
)
|
(20,140
|
)
|
||||||||
|
Dividends
|
—
|
|
—
|
|
—
|
|
(12,676
|
)
|
(12,676
|
)
|
||||||||
|
Balance at December 31, 2016
|
52,651
|
|
211
|
|
—
|
|
205,687
|
|
205,898
|
|
||||||||
|
Net income
|
—
|
|
—
|
|
—
|
|
54,498
|
|
54,498
|
|
||||||||
|
Stock options exercised and restricted
|
293
|
|
1
|
|
2,258
|
|
—
|
|
2,259
|
|
||||||||
|
stock awards granted
|
|
|
|
|
|
|
||||||||||||
|
Share-based compensation
|
—
|
|
—
|
|
6,458
|
|
—
|
|
6,458
|
|
||||||||
|
Stock repurchased and retired
|
(522
|
)
|
(2
|
)
|
(8,716
|
)
|
(9,516
|
)
|
(18,234
|
)
|
||||||||
|
Dividends
|
—
|
|
—
|
|
—
|
|
(13,653
|
)
|
(13,653
|
)
|
||||||||
|
Balance at December 31, 2017
|
52,422
|
|
$
|
210
|
|
$
|
—
|
|
$
|
237,016
|
|
$
|
237,226
|
|
||||
The accompanying notes are an integral part of these consolidated financial statements.
26
|
AAON, Inc. and Subsidiaries
|
|||||||||||
|
Consolidated Statements of Cash Flows
|
|||||||||||
|
|
Years Ending December 31,
|
||||||||||
|
|
2017
|
2016
|
2015
|
||||||||
|
Operating Activities
|
(in thousands)
|
||||||||||
|
Net income
|
$
|
54,498
|
|
$
|
53,376
|
|
$
|
45,728
|
|
||
|
Adjustments to reconcile net income to net cash provided by operating activities:
|
|
|
|
|
|
|
|||||
|
Depreciation
|
15,007
|
|
13,035
|
|
11,741
|
|
|||||
|
Amortization of bond premiums
|
47
|
|
249
|
|
266
|
|
|||||
|
Provision for losses on accounts receivable, net of adjustments
|
179
|
|
(25
|
)
|
(48
|
)
|
|||||
|
Provision for excess and obsolete inventories
|
264
|
|
625
|
|
178
|
|
|||||
|
Share-based compensation
|
6,458
|
|
4,357
|
|
2,891
|
|
|||||
|
Loss (gain) on disposition of assets
|
45
|
|
(20
|
)
|
(59
|
)
|
|||||
|
Foreign currency transaction (gain) loss
|
(59
|
)
|
(22
|
)
|
139
|
|
|||||
|
Interest income on note receivable
|
(25
|
)
|
(28
|
)
|
(30
|
)
|
|||||
|
Deferred income taxes
|
(1,554
|
)
|
825
|
|
1,172
|
|
|||||
|
Changes in assets and liabilities:
|
|
|
|
|
|
|
|||||
|
Accounts receivable
|
(7,516
|
)
|
7,048
|
|
(5,884
|
)
|
|||||
|
Income tax receivable
|
4,596
|
|
(1,537
|
)
|
312
|
|
|||||
|
Inventories
|
(23,698
|
)
|
(9,478
|
)
|
(1,059
|
)
|
|||||
|
Prepaid expenses and other
|
98
|
|
(83
|
)
|
76
|
|
|||||
|
Accounts payable
|
3,043
|
|
654
|
|
(5,109
|
)
|
|||||
|
Deferred revenue
|
258
|
|
417
|
|
189
|
|
|||||
|
Accrued liabilities and donations
|
6,353
|
|
(5,470
|
)
|
4,852
|
|
|||||
|
Net cash provided by operating activities
|
57,994
|
|
63,923
|
|
55,355
|
|
|||||
|
Investing Activities
|
|
|
|
|
|
|
|||||
|
Capital expenditures
|
(41,713
|
)
|
(26,604
|
)
|
(20,967
|
)
|
|||||
|
Proceeds from sale of property, plant and equipment
|
10
|
|
28
|
|
63
|
|
|||||
|
Investment in certificates of deposits
|
(5,280
|
)
|
(4,112
|
)
|
(6,680
|
)
|
|||||
|
Maturities of certificates of deposits
|
7,912
|
|
10,560
|
|
6,098
|
|
|||||
|
Purchases of investments held to maturity
|
(13,241
|
)
|
(10,384
|
)
|
(14,183
|
)
|
|||||
|
Maturities of investments
|
19,700
|
|
10,021
|
|
11,408
|
|
|||||
|
Proceeds from called investments
|
1,500
|
|
3,514
|
|
1,013
|
|
|||||
|
Principal payments from note receivable
|
60
|
|
52
|
|
54
|
|
|||||
|
Net cash used in investing activities
|
(31,052
|
)
|
(16,925
|
)
|
(23,194
|
)
|
|||||
|
Financing Activities
|
|
|
|
|
|
|
|||||
|
Borrowings under revolving credit facility
|
—
|
|
761
|
|
—
|
|
|||||
|
Payments under revolving credit facility
|
—
|
|
(761
|
)
|
—
|
|
|||||
|
Stock options exercised
|
2,259
|
|
2,063
|
|
2,795
|
|
|||||
|
Repurchase of stock
|
(16,620
|
)
|
(19,317
|
)
|
(36,558
|
)
|
|||||
|
Employee taxes paid by withholding shares
|
(1,614
|
)
|
(823
|
)
|
(585
|
)
|
|||||
|
Cash dividends paid to stockholders
|
(13,663
|
)
|
(12,676
|
)
|
(11,857
|
)
|
|||||
|
Net cash used in financing activities
|
(29,638
|
)
|
(30,753
|
)
|
(46,205
|
)
|
|||||
|
Net increase (decrease) in cash and cash equivalents
|
(2,696
|
)
|
16,245
|
|
(14,044
|
)
|
|||||
|
Cash and cash equivalents, beginning of year
|
24,153
|
|
7,908
|
|
21,952
|
|
|||||
|
Cash and cash equivalents, end of year
|
$
|
21,457
|
|
$
|
24,153
|
|
$
|
7,908
|
|
||
The accompanying notes are an integral part of these consolidated financial statements.
27
AAON, Inc. and Subsidiaries
Notes to Consolidated Financial Statements
December 31, 2017
1. Business Description
AAON, Inc. is a Nevada corporation which was incorporated on August 18, 1987. Our operating subsidiaries include AAON, Inc., an Oklahoma corporation and AAON Coil Products, Inc., a Texas corporation (collectively, the "Company"). The Consolidated Financial Statements include our accounts and the accounts of our subsidiaries.
We are engaged in the engineering, manufacturing, marketing and sale of air conditioning and heating equipment consisting of standard, semi-custom and custom rooftop units, chillers, packaged outdoor mechanical rooms, air handling units, makeup air units, energy recovery units, condensing units, geothermal/water-source heat pumps and coils.
2. Summary of Significant Accounting Policies
Principles of Consolidation
These financial statements are prepared in accordance with accounting principles generally accepted in the United States of America ("U.S. GAAP"). The accompanying consolidated financial statements include the accounts of the Company and its wholly-owned subsidiaries. All inter-company accounts and transactions have been eliminated.
Cash and Cash Equivalents
We consider all highly liquid temporary investments with original maturity dates of three months or less to be cash equivalents. Cash and cash equivalents consist of bank deposits and highly liquid, interest-bearing money market funds. The Company's cash and cash equivalents are held in a few financial institutions in amounts that exceed the insurance limits of the Federal Deposit Insurance Corporation. However, management believes that the Company's counterparty risks are minimal based on the reputation and history of the institutions selected.
Investments
Certificates of Deposit
We held
$2.9 million
and
$5.5 million
in certificates of deposit at
December 31, 2017
and
December 31, 2016
, respectively. At
December 31, 2017
, the certificates of deposit bear interest ranging from
0.95%
to
1.10%
per annum and have various maturities ranging from
one to five months
.
Investments Held to Maturity
At
December 31, 2017
, our investments held to maturity were comprised of
$6.1 million
of corporate notes and bonds with various maturities ranging from
one to four months
. The investments have moderate risk with S&P ratings ranging from AA+ to BBB.
We record the amortized cost basis and accrued interest of the corporate notes and bonds in the Consolidated Balance Sheets. We record the interest and amortization of bond premium to interest income in the Consolidated Statements of Income.
28
The following summarizes the amortized cost and estimated fair value of our investments held to maturity at
December 31, 2017
and
December 31, 2016
:
|
Amortized
Cost
|
Gross
Unrealized
Gain
|
Gross
Unrealized
(Loss)
|
Fair
Value
|
||||||||||||
|
December 31, 2017:
|
(in thousands)
|
||||||||||||||
|
Current assets:
|
|
|
|
|
|
|
|
|
|||||||
|
Investments held to maturity
|
$
|
6,077
|
|
$
|
—
|
|
$
|
(6
|
)
|
$
|
6,071
|
|
|||
|
Non current assets:
|
|
|
|
|
|
|
|
|
|||||||
|
Investments held to maturity
|
—
|
|
—
|
|
—
|
|
—
|
|
|||||||
|
Total
|
$
|
6,077
|
|
$
|
—
|
|
$
|
(6
|
)
|
$
|
6,071
|
|
|||
|
December 31, 2016:
|
|
|
|
|
|
|
|
|
|||||||
|
Current assets:
|
|
|
|
|
|
|
|
|
|||||||
|
Investments held to maturity
|
$
|
14,083
|
|
$
|
—
|
|
$
|
(12
|
)
|
$
|
14,071
|
|
|||
|
Non current assets:
|
|
|
|
|
|
|
|
|
|||||||
|
Investments held to maturity
|
—
|
|
—
|
|
—
|
|
—
|
|
|||||||
|
Total
|
$
|
14,083
|
|
$
|
—
|
|
$
|
(12
|
)
|
$
|
14,071
|
|
|||
We evaluate these investments for other-than-temporary impairments on a quarterly basis. We do not believe there was an other-than-temporary impairment for our investments at
December 31, 2017
or
2016
.
Accounts and Note Receivable
Accounts and note receivable are stated at amounts due from customers, net of an allowance for doubtful accounts. We generally do not require that our customers provide collateral. The Company determines its allowance for doubtful accounts by considering a number of factors, including the credit risk of specific customers, the customer’s ability to pay current obligations, historical trends, economic and market conditions and the age of the receivable. Accounts are considered past due when the balance has been outstanding for ninety days past negotiated credit terms. Past due accounts are generally written-off against the allowance for doubtful accounts only after all collection attempts have been exhausted.
Concentration of Credit Risk
Our customers are concentrated primarily in the domestic commercial and industrial new construction and replacement markets. To date, our sales have been primarily to the domestic market, with foreign sales accounting for approximately
4%
,
4%
and
4%
of revenues for the years ended December 31,
2017
,
2016
and
2015
, respectively.
One
customer, Texas AirSystems, accounted for 10% or more of our sales during
2017
,
2016
or 2015.
No
customer accounted for
5%
or more of our accounts receivable balance at
December 31, 2017
or
2016
.
Fair Value of Financial Instruments
The carrying amounts of cash and cash equivalents, receivables, accounts payable and accrued liabilities approximate fair value because of the short-term maturity of the items. The carrying amount of the Company's revolving line of credit, and other payables, approximate their fair values either due to their short term nature, the variable rates associated with the debt or based on current rates offered to the Company for debt with similar characteristics.
Inventories
Inventories are valued at the lower of cost or market using the first-in, first-out (“FIFO”) method. Cost in inventory includes purchased parts and materials, direct labor and applied manufacturing overhead. We establish an allowance for excess and obsolete inventories based on product line changes, the feasibility of substituting parts and the need for supply and replacement parts.
29
Property, Plant and Equipment
Property, plant and equipment, including significant improvements, are recorded at cost, net of accumulated depreciation. Repairs and maintenance and any gains or losses on disposition are included in operations.
Depreciation is computed using the straight-line method over the following estimated useful lives:
|
Buildings
|
3-40 years
|
|
Machinery and equipment
|
3-15 years
|
|
Furniture and fixtures
|
3-7 years
|
Impairment of Long-Lived Assets
We review long-lived assets for possible impairment when events or changes in circumstances indicate, in management’s judgment, that the carrying amount of an asset may not be recoverable. Recoverability is measured by a comparison of the carrying amount of an asset or asset group to its estimated undiscounted future cash flows expected to be generated by the asset or asset group. If the undiscounted cash flows are less than the carrying amount of the asset or asset group, an impairment loss is recognized for the amount by which the carrying amount of the asset or asset group exceeds its fair value.
Research and Development
The costs associated with research and development for the purpose of developing and improving new products are expensed as incurred. For the years ended December 31,
2017
,
2016
, and
2015
research and development costs amounted to approximately
$13.0
million,
$12.0 million
, and
$7.5 million
, respectively.
Advertising
Advertising costs are expensed as incurred. Advertising expense for the years ended December 31,
2017
,
2016
, and
2015
was approximately
$1.7
million,
$1.4 million
, and
$1.2 million
, respectively.
Shipping and Handling
We incur shipping and handling costs in the distribution of products sold that are recorded in cost of sales. Shipping charges that are billed to the customer are recorded in revenues and as an expense in cost of sales. For the years ended December 31,
2017
,
2016
and
2015
shipping and handling fees amounted to approximately
$11.4
million,
$10.3 million
, and
$9.6 million
, respectively.
Income Taxes
Income taxes are accounted for under the asset and liability method. The Company recognizes deferred tax assets and liabilities for the expected future tax consequences of temporary differences between the book carrying amounts and the tax basis of assets and liabilities. Excess tax benefits and deficiencies are reported as an income tax benefit or expense on the statement of income and are treated as discrete items to the income tax provision in the reporting period in which they occur. We establish accruals for unrecognized tax positions when it is more likely than not that our tax return positions may not be fully sustained. The Company records a valuation allowance for deferred tax assets when, in the opinion of management, it is more likely than not that deferred tax assets will not be realized.
30
Share-Based Compensation
The Company recognizes expense for its share-based compensation based on the fair value of the awards that are granted. The Company’s share-based compensation plans provide for the granting of stock options and restricted stock. The fair values of stock options are estimated at the date of grant using the Black-Scholes-Merton option valuation model. The use of the Black-Scholes-Merton option valuation model requires the input of subjective assumptions. Measured compensation cost is recognized ratably over the vesting period of the related share-based compensation award. Forfeitures are accounted for as they occur. The fair value of restricted stock awards is determined based on the market value of the Company’s shares on the grant date and the compensation expense is recognized on a straight-line basis during the service period of the respective grant.
Derivative Instruments
In the course of normal operations, the Company occasionally enters into contracts such as forward priced physical contracts for the purchase of raw materials that qualify for and are designated as normal purchase or normal sale contracts. Such contracts are exempted from the fair value accounting requirements and are accounted for at the time product is purchased or sold under the related contract. The Company does not engage in speculative transactions, nor does the Company hold or issue financial instruments for trading purposes.
Revenue Recognition
We recognize revenues from sales of products when title and risk of ownership pass to the customer. Final sales prices are fixed and based on purchase orders. Sales allowances and customer incentives are treated as reductions to sales and are provided for based on historical experiences and current estimates. Sales of our products are moderately seasonal with the peak period being July - November of each year.
In addition, the Company presents revenues net of sales tax and net of certain payments to our independent manufacturer representatives (“Representatives”). Representatives are national companies that are in the business of providing HVAC units and other related products and services to customers. The end user customer orders a bundled group of products and services from the Representative and expects the Representative to fulfill the order. Only after the specifications are agreed to by the Representative and the customer, and the decision is made to use an AAON HVAC unit, will we receive notice of the order. We establish the amount we must receive for our HVAC unit (“minimum sales price”), but do not control the total order price which is negotiated by the Representative with the end user customer.
We are responsible for billings and collections resulting from all sales transactions, including those initiated by our Representatives. The Representatives submit the total order price to us for invoicing and collection. The total order price includes our minimum sales price and could contain an additional amount which may include both the Representatives’ fee and amounts due for additional products and services required by the customer. These additional products and services may include controls purchased from another manufacturer to operate the unit, start-up services, and curbs for supporting the unit (“Third Party Products”). All are associated with the purchase of a HVAC unit but may be provided by the Representative or another third party. The Company is under no obligation related to Third Party Products.
The Representatives’ fee and Third Party Products amounts (“Due to Representatives”) are paid only after all amounts associated with the order are collected from the customer. The Due to Representatives amount is paid only after all amounts associated with the order are collected from the customer. The amount of payments to our representatives was
$51.8
million,
$55.0 million
, and
$55.4 million
for each of the years ended December 31,
2017
,
2016
, and
2015
, respectively.
The Company also sells extended warranties on parts for various lengths of time ranging from
six
months to
10
years. Revenue for these separately priced warranties is deferred and recognized on a straight-line basis over the separately priced warranty period.
31
Insurance Reserves
Under the Company’s insurance programs, coverage is obtained for significant liability limits as well as those risks required to be insured by law or contract. It is the policy of the Company to self-insure a portion of certain expected losses related primarily to workers’ compensation and medical liability. Provisions for losses expected under these programs are recorded based on the Company’s estimates of the aggregate liabilities for the claims incurred.
Product Warranties
A provision is made for the estimated cost of maintaining product warranties to customers at the time the product is sold based upon historical claims experience by product line. The Company records a liability and an expense for estimated future warranty claims based upon historical experience and management's estimate of the level of future claims. Changes in the estimated amounts recognized in prior years are recorded as an adjustment to the liability and expense in the current year.
Use of Estimates
The preparation of financial statements in conformity with U.S. GAAP requires management to make estimates and assumptions that affect the reported amounts of assets and liabilities and disclosures of contingent assets and liabilities at the date of the financial statements and the reported amounts of revenues and expenses during the reporting period. Because these estimates and assumptions require significant judgment, actual results could differ from those estimates and could have a significant impact on our results of operations, financial position and cash flows. We reevaluate our estimates and assumptions as needed, but at a minimum on a quarterly basis. The most significant estimates include, but are not limited to, the allowance for doubtful accounts, inventory reserves, warranty accrual, workers compensation accrual, medical insurance accrual, share-based compensation and income taxes. Actual results could differ materially from those estimates.
3. Accounts Receivable
Accounts receivable and the related allowance for doubtful accounts are as follows:
|
|
December 31,
|
||||||
|
|
2017
|
2016
|
|||||
|
|
(in thousands)
|
||||||
|
Accounts receivable
|
$
|
50,457
|
|
$
|
43,091
|
|
|
|
Less: Allowance for doubtful accounts
|
(119
|
)
|
(90
|
)
|
|||
|
Total, net
|
$
|
50,338
|
|
$
|
43,001
|
|
|
|
|
Years Ending December 31,
|
||||||||||
|
|
2017
|
2016
|
2015
|
||||||||
|
Allowance for doubtful accounts:
|
(in thousands)
|
||||||||||
|
Balance, beginning of period
|
$
|
90
|
|
$
|
115
|
|
$
|
171
|
|
||
|
Provisions for losses on accounts receivables, net of adjustments
|
179
|
|
(25
|
)
|
(48
|
)
|
|||||
|
Accounts receivable written off, net of recoveries
|
(150
|
)
|
—
|
|
(8
|
)
|
|||||
|
Balance, end of period
|
$
|
119
|
|
$
|
90
|
|
$
|
115
|
|
||
32
4. Inventories
The components of inventories and the related changes in the allowance for excess and obsolete inventories are as follows:
|
|
December 31,
|
||||||
|
|
2017
|
2016
|
|||||
|
|
(in thousands)
|
||||||
|
Raw materials
|
$
|
57,784
|
|
$
|
43,438
|
|
|
|
Work in process
|
5,957
|
|
2,279
|
|
|||
|
Finished goods
|
8,163
|
|
3,017
|
|
|||
|
|
71,904
|
|
48,734
|
|
|||
|
Less: Allowance for excess and obsolete inventories
|
(1,118
|
)
|
(1,382
|
)
|
|||
|
Total, net
|
$
|
70,786
|
|
$
|
47,352
|
|
|
|
|
Years Ending December 31,
|
||||||||||
|
|
2017
|
2016
|
2015
|
||||||||
|
Allowance for excess and obsolete inventories:
|
(in thousands)
|
||||||||||
|
Balance, beginning of period
|
$
|
1,382
|
|
$
|
757
|
|
$
|
714
|
|
||
|
Provisions for excess and obsolete inventories
|
102
|
|
625
|
|
178
|
|
|||||
|
Inventories written off
|
(366
|
)
|
—
|
|
(135
|
)
|
|||||
|
Balance, end of period
|
$
|
1,118
|
|
$
|
1,382
|
|
$
|
757
|
|
||
5. Note Receivable
In connection with the closure of our Canadian facility on May 18, 2009, we sold land and a building in September 2010 and assumed a note receivable from the borrower secured by the property. The C
$1.1 million
,
15
year note has an interest rate of
4.0%
and is payable to us monthly, and has a C
$0.6 million
balloon payment due in
October 2025
. Interest payments are recognized in interest income.
We evaluate the note for impairment on a quarterly basis. We determine the note receivable to be impaired if we are uncertain of its collectability based on the contractual terms. At December 31,
2017
and
2016
, there was no impairment.
6.
Supplemental Cash Flow Information
|
|
Years Ending December 31,
|
||||||||||
|
|
2017
|
2016
|
2015
|
||||||||
|
Supplemental disclosures:
|
(in thousands)
|
||||||||||
|
Interest paid
|
$
|
—
|
|
$
|
—
|
|
$
|
—
|
|
||
|
Income taxes paid, net
|
16,951
|
|
27,353
|
|
24,125
|
|
|||||
|
Non-cash investing and financing activities:
|
|||||||||||
|
Non-cash capital expenditures
|
832
|
|
270
|
|
83
|
|
|||||
33
7. Warranties
The Company has warranties with various terms from 18 months for parts to 25 years for certain heat exchangers. The Company has an obligation to replace parts or service its products if conditions under the warranty are met. A provision is made for estimated warranty costs at the time the related products are sold based upon the warranty period, historical trends, new products and any known identifiable warranty issues.
Changes in the warranty accrual are as follows:
|
|
Years Ending December 31,
|
||||||||||
|
|
2017
|
2016
|
2015
|
||||||||
|
Warranty accrual:
|
(in thousands)
|
||||||||||
|
Balance, beginning of period
|
$
|
7,936
|
|
$
|
8,469
|
|
$
|
8,130
|
|
||
|
Payments made
|
(8,686
|
)
|
(4,134
|
)
|
(3,978
|
)
|
|||||
|
Provisions
|
11,233
|
|
3,601
|
|
4,317
|
|
|||||
|
Balance, end of period
|
$
|
10,483
|
|
$
|
7,936
|
|
$
|
8,469
|
|
||
|
Warranty expense:
|
$
|
11,233
|
|
$
|
3,601
|
|
$
|
4,317
|
|
||
8. Accrued Liabilities
At December 31, accrued liabilities were comprised of the following:
|
|
December 31,
|
||||||
|
|
2017
|
2016
|
|||||
|
|
(in thousands)
|
||||||
|
Warranty
|
$
|
10,483
|
|
$
|
7,936
|
|
|
|
Due to representatives
|
13,086
|
|
9,907
|
|
|||
|
Payroll
|
4,456
|
|
4,129
|
|
|||
|
Profit sharing
|
2,034
|
|
1,967
|
|
|||
|
Workers' compensation
|
593
|
|
580
|
|
|||
|
Medical self-insurance
|
725
|
|
872
|
|
|||
|
Customer prepayments
|
2,838
|
|
2,256
|
|
|||
|
Donations
|
588
|
|
600
|
|
|||
|
Employee vacation time
|
2,688
|
|
2,367
|
|
|||
|
Other
|
1,607
|
|
1,326
|
|
|||
|
Total
|
$
|
39,098
|
|
$
|
31,940
|
|
|
9. Revolving Credit Facility
Our revolving credit facility provides for maximum borrowings of
$30.0 million
which is provided by BOKF, NA dba Bank of Oklahoma, formerly known as Bank of Oklahoma, N.A. ("Bank of Oklahoma"). Under the line of credit, there was one standby letter of credit totaling
$0.8 million
as of
December 31, 2017
. Borrowings available under the revolving credit facility at December 31,
2017
, were
$29.2 million
. Interest on borrowings is payable
monthly
at LIBOR plus
2.5%
.
No
fees are associated with the unused portion of the committed amount. As of December 31,
2017
and
2016
, we had
no
balance outstanding under our revolving credit facility. The revolving credit facility expires on July 27, 2018. At December 31,
2017
and
2016
, the weighted average interest rate was
3.5%
and
3.0%
, respectively.
At December 31,
2017
, we were in compliance with our financial covenants. These covenants require that we meet certain parameters related to our tangible net worth and total liabilities to tangible net worth ratio. At December 31,
2017
our tangible net worth was
$237.2 million
, which meets the requirement of being at or above
$125.0 million
. Our total liabilities to tangible net worth ratio was
0.3
to 1.0, which meets the requirement of not being above
2
to 1.
34
10. Income Taxes
The provision (benefit) for income taxes consists of the following:
|
|
Years Ending December 31,
|
||||||||||
|
|
2017
|
2016
|
2015
|
||||||||
|
|
(in thousands)
|
||||||||||
|
Current
|
$
|
21,548
|
|
$
|
25,790
|
|
$
|
24,439
|
|
||
|
Deferred
|
(1,554
|
)
|
825
|
|
1,172
|
|
|||||
|
Total
|
$
|
19,994
|
|
$
|
26,615
|
|
$
|
25,611
|
|
||
The provision for income taxes differs from the amount computed by applying the statutory federal income tax rate before the provision for income taxes.
The reconciliation of the federal statutory income tax rate to the effective income tax rate is as follows:
|
|
Years Ending December 31,
|
|||||||
|
|
2017
|
2016
|
2015
|
|||||
|
Federal statutory rate
|
35
|
%
|
35
|
%
|
35
|
%
|
||
|
State income taxes, net of federal benefit
|
5
|
%
|
5
|
%
|
5
|
%
|
||
|
Remeasurement of deferred taxes
|
(6
|
)%
|
—
|
%
|
—
|
%
|
||
|
Domestic manufacturing deduction
|
(3
|
)%
|
(3
|
)%
|
(3
|
)%
|
||
|
Excess tax benefits
|
(3
|
)%
|
(3
|
)%
|
—
|
%
|
||
|
Other
|
(1
|
)%
|
(1
|
)%
|
(1
|
)%
|
||
|
|
27
|
%
|
33
|
%
|
36
|
%
|
||
The Tax Cuts and Jobs Act (the "Act") was enacted on December 22, 2017. Major changes under the Act include the following:
|
•
|
Reducing the corporate rate to 21 percent
|
|
•
|
Doubling bonus depreciation to
100 percent
for five years
|
|
•
|
Further limitations on executive compensation deductions
|
|
•
|
Eliminating the domestic manufacturing deduction
|
As a result of these changes, the Company adjusted its deferred tax assets and liabilities existing at the date of enactment using the newly enacted rates for the periods when they are expected to be realized. This remeasurement resulted in a benefit to income taxes of
$4.4 million
. The new bonus depreciation provisions resulted in the Company taking
$3.2 million
of bonus depreciation in the fourth quarter of 2017. The Company sometimes has executive compensation that exceeds the
$1.0 million
limitation. Typically the limit is exceeded due to the volume of stock activity performed by the executive during the year. The Company cannot predict the performance of its stock or when executives may choose to initiate stock activity. As such, the Company is unable to quantify any impact of this tax law change but any compensation that does exceed this limitation in the future will be a permanent difference and cause an increase to our income tax provision. The Company also has historically taken the domestic manufacturing deduction. The Company will no longer receive the benefit of this deduction which typically has lowered our effective tax rate by
3.0%
to
4.0%
.
Deferred income taxes reflect the net tax effects of temporary differences between the carrying amounts of assets and liabilities for financial reporting purposes and the amount used for income tax purposes.
35
The significant components of the Company’s deferred tax assets and liabilities are as follows:
|
|
December 31,
|
||||||
|
|
2017
|
2016
|
|||||
|
|
(in thousands)
|
||||||
|
Deferred income tax assets (liabilities):
|
|
|
|||||
|
Accounts receivable and inventory reserves
|
$
|
318
|
|
$
|
587
|
|
|
|
Warranty accrual
|
2,698
|
|
3,165
|
|
|||
|
Other accruals
|
1,395
|
|
1,715
|
|
|||
|
Share-based compensation
|
1,432
|
|
1,784
|
|
|||
|
Donations
|
152
|
|
463
|
|
|||
|
Other, net
|
698
|
|
738
|
|
|||
|
Total deferred income tax assets
|
6,693
|
|
8,452
|
|
|||
|
Property & equipment
|
(14,670
|
)
|
(17,983
|
)
|
|||
|
Total deferred income tax liabilities
|
$
|
(14,670
|
)
|
$
|
(17,983
|
)
|
|
|
Net deferred income tax liabilities
|
$
|
(7,977
|
)
|
$
|
(9,531
|
)
|
|
We file income tax returns in the U.S., state and foreign income tax returns jurisdictions. We are subject to U.S. examinations for tax years
2013
to present, and to non-U.S. income tax examinations for the tax years of
2013
to present. In addition, we are subject to state and local income tax examinations for tax years
2013
to present. The Company continues to evaluate its need to file returns in various state jurisdictions. Any interest or penalties would be recognized as a component of income tax expense.
11. Share-Based Compensation
On May 22, 2007, our stockholders adopted a Long-Term Incentive Plan ("LTIP") which provided an additional
3.3
million shares that could be granted in the form of stock options, stock appreciation rights, restricted stock awards, performance units and performance awards, in addition to the shares from the previous plan, the 1992 Plan. Since inception of the LTIP, non-qualified stock options and restricted stock awards have been granted with the same vesting schedule as the 1992 Plan. Under the LTIP, the exercise price of shares granted may not be less than
100%
of the fair market value at the date of the grant.
On May 24, 2016, our stockholders adopted the 2016 Long-Term Incentive Plan ("2016 Plan") which provides for approximately
3.8 million
shares, comprised of
3.4 million
new shares provided for under the 2016 Plan and approximately
0.4 million
shares that were available for issuance under the previous LTIP, that are now authorized for issuance under the 2016 Plan, that can be granted in the form of stock options, stock appreciation rights, restricted stock awards, performance awards, dividend equivalent rights, and other awards. Under the 2016 Plan, the exercise price of shares granted may not be less than
100%
of the fair market value at the date of the grant. The 2016 Plan is administered by the Compensation Committee of the Board of Directors or such other committee of the Board of Directors as is designated by the Board of Directors (the "Committee"). Membership on the Committee is limited to independent directors. The Committee may delegate certain duties to one or more officers of the Company as provided in the 2016 Plan. The Committee determines the persons to whom awards are to be made, determines the type, size and terms of awards, interprets the 2016 Plan, establishes and revises rules and regulations relating to the 2016 Plan and makes any other determinations that it believes necessary for the administration of the 2016 Plan.
The total pre-tax compensation cost related to unvested stock options not yet recognized as of December 31,
2017
is
$8.3 million
and is expected to be recognized over a weighted-average period of
2.29
years.
36
The following weighted average assumptions were used to determine the fair value of the stock options granted on the original grant date for expense recognition purposes for options granted during December 31,
2017
,
2016
and
2015
using a Black Scholes-Merton Model:
|
|
2017
|
2016
|
2015
|
||||||||
|
Director and Officers:
|
|
|
|
||||||||
|
Expected dividend yield
|
$
|
0.26
|
|
$
|
0.22
|
|
$
|
0.18
|
|
||
|
Expected volatility
|
30.81
|
%
|
41.19
|
%
|
44.14
|
%
|
|||||
|
Risk-free interest rate
|
1.90
|
%
|
2.00
|
%
|
1.97
|
%
|
|||||
|
Expected life (in years)
|
5.00
|
|
7.68
|
|
8.00
|
|
|||||
|
Employees:
|
|
|
|
|
|||||||
|
Expected dividend yield
|
$
|
0.26
|
|
$
|
0.25
|
|
$
|
0.22
|
|
||
|
Expected volatility
|
30.67
|
%
|
34.50
|
%
|
42.71
|
%
|
|||||
|
Risk-free interest rate
|
1.89
|
%
|
1.73
|
%
|
1.41
|
%
|
|||||
|
Expected life (in years)
|
5.00
|
|
5.69
|
|
8.00
|
|
|||||
The expected term of the options is based on evaluations of historical and expected future employee exercise behavior. The risk-free interest rate is based on the U.S. Treasury rates at the date of grant with maturity dates approximately equal to the expected life at the grant date. Volatility is based on historical volatility of our stock over time periods equal to the expected life at grant date.
The following is a summary of stock options vested and exercisable as of December 31,
2017
:
|
Weighted
Average
|
Weighted
|
||||||||||||
|
Range of
|
Number
|
Remaining
|
Average
|
|
|||||||||
|
Exercise
|
of
|
Contractual
|
Exercise
|
Intrinsic
|
|||||||||
|
Prices
|
Shares
|
Life
|
Price
|
Value
|
|||||||||
|
|
|
|
|
(in thousands)
|
|||||||||
|
$4.54 - 22.76
|
424,130
|
|
4.36
|
$
|
12.41
|
|
$
|
10,303
|
|
||||
|
$23.57 - 32.85
|
107,456
|
|
8.31
|
30.10
|
|
709
|
|
||||||
|
$32.90 - 37.30
|
25,725
|
|
9.19
|
34.07
|
|
68
|
|
||||||
|
Total
|
557,311
|
|
5.35
|
$
|
16.82
|
|
$
|
11,080
|
|
||||
The following is a summary of stock options vested and exercisable as of December 31,
2016
:
|
Weighted
Average
|
Weighted
|
||||||||||||
|
Range of
|
Number
|
Remaining
|
Average
|
|
|||||||||
|
Exercise
|
of
|
Contractual
|
Exercise
|
Intrinsic
|
|||||||||
|
Prices
|
Shares
|
Life
|
Price
|
Value
|
|||||||||
|
|
|
|
|
(in thousands)
|
|||||||||
|
$4.54 - 20.92
|
338,308
|
|
4.75
|
$
|
8.03
|
|
$
|
8,465
|
|
||||
|
$20.96 - 26.50
|
71,928
|
|
8.56
|
22.50
|
|
759
|
|
||||||
|
Total
|
410,236
|
|
5.42
|
$
|
10.57
|
|
$
|
9,224
|
|
||||
37
The following is a summary of stock options vested and exercisable as of December 31,
2015
:
|
Weighted
Average
|
Weighted
|
||||||||||||
|
Range of
|
Number
|
Remaining
|
Average
|
|
|||||||||
|
Exercise
|
of
|
Contractual
|
Exercise
|
Intrinsic
|
|||||||||
|
Prices
|
Shares
|
Life
|
Price
|
Value
|
|||||||||
|
|
|
|
|
(in thousands)
|
|||||||||
|
$4.31 - 8.65
|
421,237
|
|
4.89
|
$
|
7.04
|
|
$
|
6,814
|
|
||||
|
$8.70 - 22.76
|
27,134
|
|
7.82
|
15.31
|
|
215
|
|
||||||
|
Total
|
448,371
|
|
5.07
|
$
|
7.54
|
|
$
|
7,029
|
|
||||
A summary of option activity under the plans is as follows:
|
Weighted
Average
Exercise
|
||||||
|
Options
|
Shares
|
Price
|
||||
|
Outstanding at December 31, 2016
|
1,450,704
|
|
$
|
21.33
|
|
|
|
Granted
|
410,960
|
|
34.46
|
|
||
|
Exercised
|
(189,415
|
)
|
11.93
|
|
||
|
Forfeited or Expired
|
(105,140
|
)
|
29.93
|
|
||
|
Outstanding at December 31, 2017
|
1,567,109
|
|
$
|
25.27
|
|
|
|
Exercisable at December 31, 2017
|
557,311
|
|
$
|
16.82
|
|
|
The total intrinsic value of options exercised during December 31,
2017
,
2016
and
2015
was
$4.5 million
,
$4.9 million
and
$7.4 million
, respectively. The cash received from options exercised during December 31,
2017
,
2016
and
2015
was
$2.3 million
,
$2.1 million
and
$2.8 million
, respectively. The impact of these cash receipts is included in financing activities in the accompanying Consolidated Statements of Cash Flows.
Since 2007, as part of the LTIP and since May 2016 as part of the 2016 Plan, the Compensation Committee of the Board of Directors has authorized and issued restricted stock awards to directors and certain key employees. Restricted stock awards granted to directors vest one-third each year. All other restricted stock awards vest at a rate of
20%
per year. The fair value of restricted stock awards is based on the fair market value of AAON common stock on the respective grant dates, reduced for the present value of dividends.
These awards are recorded at their fair value on the date of grant and compensation cost is recorded using straight-line vesting over the service period. At December 31,
2017
, unrecognized compensation cost related to unvested restricted stock awards was approximately
$6.5 million
which is expected to be recognized over a weighted average period of
1.85
years.
38
A summary of the unvested restricted stock awards is as follows:
|
Weighted
Average
Grant date
|
||||||
|
Restricted stock
|
Shares
|
Fair Value
|
||||
|
Unvested at December 31, 2016
|
408,162
|
|
$
|
20.47
|
|
|
|
Granted
|
124,126
|
|
33.97
|
|
||
|
Vested
|
(170,434
|
)
|
19.97
|
|
||
|
Forfeited
|
(20,054
|
)
|
22.09
|
|
||
|
Unvested at December 31, 2017
|
341,800
|
|
$
|
25.52
|
|
|
A summary of share-based compensation is as follows for the years ending December 31,
2017
,
2016
and
2015
:
|
|
2017
|
2016
|
2015
|
||||||||
|
Grant date fair value of awards during the period:
|
(in thousands)
|
||||||||||
|
Options
|
$
|
3,699
|
|
$
|
6,102
|
|
$
|
3,685
|
|
||
|
Restricted stock
|
4,217
|
|
3,147
|
|
2,985
|
|
|||||
|
Total
|
$
|
7,916
|
|
$
|
9,249
|
|
$
|
6,670
|
|
||
|
2017
|
2016
|
2015
|
|||||||||
|
Share-based compensation expense:
|
(in thousands)
|
||||||||||
|
Options
|
$
|
2,904
|
|
$
|
1,681
|
|
$
|
833
|
|
||
|
Restricted stock
|
3,554
|
|
2,676
|
|
2,058
|
|
|||||
|
Total
|
$
|
6,458
|
|
$
|
4,357
|
|
$
|
2,891
|
|
||
|
2017
|
2016
|
2015
|
|||||||||
|
Income tax benefit related to share-based compensation:
|
(in thousands)
|
||||||||||
|
Options
|
$
|
1,413
|
|
$
|
1,610
|
|
$
|
2,165
|
|
||
|
Restricted stock
|
1,051
|
|
458
|
|
280
|
|
|||||
|
Total
|
$
|
2,464
|
|
$
|
2,068
|
|
$
|
2,445
|
|
||
12. Employee Benefits
Defined Contribution Plan - 401(k
)
- We sponsor a defined contribution plan (the "Plan”). Eligible employees may make contributions in accordance with the Plan and IRS guidelines. In addition to the traditional 401(k), eligible employees are given the option of making an after-tax contribution to a Roth 401(k) or a combination of both. The Plan provides for automatic enrollment and for an automatic increase to the deferral percentage at January 1st of each year and each year thereafter. Eligible employees are automatically enrolled in the Plan at a
6%
deferral rate and currently contributing employees deferral rates will be increased to
6%
unless their current rate is above
6%
or the employee elects to decline the automatic enrollment or increase.
Effective October 1, 2013, the Plan was amended such that the Company contributed
3%
of eligible payroll to the Plan for each employee and matched
100%
up to
6%
of employee contributions of eligible compensation. We contributed and continue to contribute in the form of cash and direct the investment to shares of AAON stock. Employees are
100%
vested in salary deferral contributions and vest
20%
per year at the end of
years two through six of employment
in employer matching contributions. The additional
3%
Company contribution, a Safe-Harbor contribution, vested over two years.
39
Effective January 1, 2016, the Plan was amended such that the Company matches
175%
up to
6%
of employee contributions of eligible compensation. The Company no longer contributes
3%
of eligible payroll to the Plan for each employee. The Company ceased paying administrative expenses for the Plan at which time administrative expenses are paid for by Plan participants. Additionally, Plan participant forfeitures are used to reduce the cost of the Company contributions.
For the years ended December 31,
2017
,
2016
and
2015
we made contributions of
$6.1 million
,
$5.9 million
and
$9.0 million
, respectively. Administrative expenses were approximately
$0
,
$40.0 thousand
, and
$0.1 million
for the years ended
2017
,
2016
and
2015
, respectively.
Profit Sharing Bonus Plan
-
We maintain a discretionary profit sharing bonus plan under which approximately
10%
of pre-tax profit is paid to eligible employees on a quarterly basis in order to reward employee productivity. Eligible employees are regular full-time employees who are actively employed and working on the first and last days of the calendar quarter and who were employed full-time for at least three full months prior to the beginning of the calendar quarter. Profit sharing expense was
$8.4 million
,
$9.0 million
and
$8.0 million
for the years ended December 31,
2017
,
2016
and
2015
, respectively.
13. Stockholders’ Equity
Stock Repurchase
- The Board has authorized three stock repurchase programs for the Company. The Company may purchase shares on the open market from time to time, up to a total of
5.7 million
shares. The Board must authorize the timing and amount of these purchases. Effective May 24, 2016, the Board authorized up to
$25.0 million
in open market repurchases and on June 2, 2016, the Company executed a repurchase agreement in accordance with the rules and regulations of the SEC allowing the Company to repurchase an aggregate amount of
$25.0 million
or a total of approximately
2.0 million
shares from the open market. The repurchase agreement expired on April 15, 2017. The Company also has a stock repurchase arrangement by which employee-participants in our 401(k) savings and investment plan are entitled to have shares in AAON, Inc. stock in their accounts sold to the Company. The maximum number of shares to be repurchased is contingent upon the number of shares sold by employee-participants. Lastly, the Company repurchases shares of AAON, Inc. stock from certain of its directors and employees for payment of statutory tax withholdings on stock transactions. A11 other repurchases from directors or employees are contingent upon Board approval. All repurchases are done at current market prices.
Our repurchase activity is as follows:
|
2017
|
2016
|
2015
|
||||||||||||||||||||||
|
Program
|
Shares
|
Total $
|
$ per share
|
Shares
|
Total $
|
$ per share
|
Shares
|
Total $
|
$ per share
|
|||||||||||||||
|
Open market
|
8,676
|
|
$
|
283,654
|
|
$
|
32.69
|
|
165,598
|
|
$
|
4,440,658
|
|
$
|
26.82
|
|
1,037,590
|
|
$
|
24,999,963
|
|
$
|
24.09
|
|
|
401(k)
|
467,580
|
|
16,336,084
|
|
34.94
|
|
540,501
|
|
14,875,850
|
|
27.52
|
|
512,754
|
|
11,557,598
|
|
22.54
|
|
||||||
|
Directors and employees
|
45,878
|
|
1,614,425
|
|
35.19
|
|
30,072
|
|
823,446
|
|
27.38
|
|
25,746
|
|
585,413
|
|
22.74
|
|
||||||
|
Total
|
522,134
|
|
$
|
18,234,163
|
|
$
|
34.92
|
|
736,171
|
|
$
|
20,139,954
|
|
$
|
27.36
|
|
1,576,090
|
|
$
|
37,142,974
|
|
$
|
23.57
|
|
|
Inception to Date
|
||||||||
|
Program
|
Shares
|
Total $
|
$ per share
|
|||||
|
Open market
|
3,843,495
|
|
$
|
61,232,115
|
|
$
|
15.93
|
|
|
401(k)
|
6,550,023
|
|
82,068,805
|
|
12.53
|
|
||
|
Directors and employees
|
1,919,510
|
|
17,278,033
|
|
9.00
|
|
||
|
Total
|
12,313,028
|
|
$
|
160,578,953
|
|
$
|
13.04
|
|
Dividends -
At the discretion of the Board of Directors, we pay semi-annual cash dividends. Board approval is required to determine the date of declaration and amount for each semi-annual dividend payment.
Our recent dividends are as follows:
40
|
Declaration Date
|
Record Date
|
Payment Date
|
Dividend per Share
|
|
May 19, 2015
|
June 12, 2015
|
July 1, 2015
|
$0.11
|
|
October 29, 2015
|
December 2, 2015
|
December 23, 2015
|
$0.11
|
|
May 24, 2016
|
June 10, 2016
|
July 1, 2016
|
$0.11
|
|
November 9, 2016
|
December 2, 2016
|
December 23, 2016
|
$0.13
|
|
May 16, 2017
|
June 9, 2017
|
July 7, 2017
|
$0.13
|
|
November 7, 2017
|
November 30, 2017
|
December 21, 2017
|
$0.13
|
We paid cash dividends of
$13.7 million
,
$12.7 million
and
$11.9 million
in
2017
,
2016
and
2015
, respectively.
14. Commitments and Contingencies
We are subject to various claims and legal actions that arise in the ordinary course of business. We closely monitor these claims and legal actions and frequently consult with our legal counsel to determine whether they may, when resolved, have a material adverse effect on our financial position, results of operations or cash flows and we accrue and/or disclose loss contingencies as appropriate. We have concluded that the likelihood is remote that the ultimate resolution of any pending litigation or claims will be material or have a material adverse effect on the Company's business, financial position, results of operations or cash flows.
We are occasionally party to short-term, cancellable and occasionally non-cancellable, fixed price contracts with major suppliers for the purchase of raw material and component parts. We expect to receive delivery of raw materials for use in our manufacturing operations. These contracts are not accounted for as derivative instruments because they meet the normal purchase and normal sales exemption.
15. New Accounting Pronouncements
Changes to U.S. GAAP are established by the Financial Accounting Standards Board ("FASB") in the form of accounting standards updates ("ASUs") to the FASB's Accounting Standards Codification.
We consider the applicability and impact of all ASUs. ASUs not listed below were assessed and determined to be either not applicable or are expected to have minimal impact on our consolidated financial statements and notes thereto.
In May 2014, the FASB issued ASU 2014-09,
Revenue from Contracts with Customers
, which requires an entity to recognize the amount of revenue to which it expects to be entitled for the transfer of promised goods or services to customers. The ASU will replace most existing revenue recognition guidance in U.S. GAAP when it becomes effective. In August 2015, with the issuance of ASU 2015-14, the FASB amended the effective date for us to January 1, 2018.
The following ASUs have been issued in 2016 along with ASU 2014-09 with the same effective dates and transition requirements:
|
•
|
ASU 2016-08,
Principal versus Agent Considerations (Reporting Revenue Gross versus Net)
, which provides implementation guidance for Topic 606 on principal versus agent considerations.
|
|
•
|
ASU 2016-10,
Identifying Performance Obligations and Licensing
, which provides clarification for two aspects of Topic 606: identifying performance obligations and the licensing implementation guidance.
|
|
•
|
ASU 2016-12,
Revenue from Contracts with Customers
, which further amends Topic 606.
|
|
•
|
ASU 2016-20,
Technical Corrections and Improvements to Topic 606, Revenue from Contracts with Customers
, which further amends Topic 606.
|
The Company plans to adopt using the retrospective transition method. The Company believes the impact will not be material to the consolidated financial statements. The Company has reviewed all types of customer contracts and gone through the five step process outlined in ASU 2014-09 for each type of contract. The new five step process required by ASU 2014-09 provides results substantially consistent with our current revenue recognition policies. The Company has also evaluated the categories to use for the disaggregate revenue disclosures. The primary change upon adoption will be additional disclosures to show disaggregated revenue and further details around our revenue recognition process. Once we adopt ASU 2014-09, we do not anticipate that our internal control framework will materially change, but rather that existing internal controls will be modified and augmented, as necessary, to consider our new revenue recognition policy effective January 1, 2018.
41
In January 2016, the FASB issued ASU 2016-01,
Recognition and Measurement of Financial Assets and Financial Liabilities
, which will address certain aspects of recognition, measurement, presentation and disclosure of financial instruments. The ASU becomes effective in the annual reporting period beginning after December 31, 2017, including interim reporting periods. We do not expect ASU 2016-01 will have a material effect on our consolidated financial statements and notes thereto.
In May 2017, the FASB issued ASU 2017-09,
Scope of Modification Accounting
, which addresses changes to the terms or condition of a share-based payment award. The ASU becomes effective in the annual reporting period beginning after December 15, 2017, including interim reporting periods. We do not expect ASU 2017-09 will have a material effect on our consolidated financial statements and notes thereto.
16. Earnings Per Share
Basic net income per share is calculated by dividing net income by the weighted average number of shares of common stock outstanding during the period. Diluted net income per share assumes the conversion of all potentially dilutive securities and is calculated by dividing net income by the sum of the weighted average number of shares of common stock outstanding plus all potentially dilutive securities. Dilutive common shares consist primarily of stock options and restricted stock awards.
The following table sets forth the computation of basic and diluted earnings per share:
|
|
2017
|
2016
|
2015
|
||||||||
|
Numerator:
|
(in thousands, except share and per share data)
|
||||||||||
|
Net income
|
$
|
54,498
|
|
$
|
53,376
|
|
$
|
45,728
|
|
||
|
Denominator:
|
|
|
|
|
|
|
|||||
|
Basic weighted average shares
|
52,572,496
|
|
52,924,398
|
|
54,045,841
|
|
|||||
|
Effect of dilutive stock options and restricted stock
|
506,238
|
|
525,356
|
|
435,643
|
|
|||||
|
Diluted weighted average shares
|
53,078,734
|
|
53,449,754
|
|
54,481,484
|
|
|||||
|
Earnings per share:
|
|
|
|
|
|
|
|||||
|
Basic
|
$
|
1.04
|
|
$
|
1.01
|
|
$
|
0.85
|
|
||
|
Dilutive
|
$
|
1.03
|
|
$
|
1.00
|
|
$
|
0.84
|
|
||
|
Anti-dilutive shares:
|
|
|
|
|
|
|
|||||
|
Shares
|
785,825
|
|
469,603
|
|
146,548
|
|
|||||
42
17.
Related Parties
The Company purchases some supplies from an entity controlled by the Company's CEO. The Company sometimes makes sales to the CEO for parts. Additionally, the Company sells units to an entity owned by a member of the President's immediate family. This entity is also one of the Company's Representatives and as such, the Company makes payments to the entity for third party products. All related party transactions are made on standard Company terms. Following is a summary of transactions and balance with affiliates:
|
Years Ending December 31,
|
||||||||||
|
2017
|
2016
|
2015
|
||||||||
|
(in thousands)
|
||||||||||
|
Sales to affiliates
|
$
|
1,579
|
|
$
|
1,671
|
|
$
|
1,532
|
|
|
|
Payments to affiliates
|
432
|
|
697
|
|
841
|
|
||||
|
December 31,
|
||||||||||
|
2017
|
2016
|
|||||||||
|
(in thousands)
|
||||||||||
|
Due from affiliates
|
$
|
9
|
|
$
|
10
|
|
||||
|
Due to affiliates
|
—
|
|
—
|
|
||||||
18.
Subsequent Events
On January 2, 2018, the Company granted
37,700
shares of restricted stock and
433,400
stock options to members of senior management. Additionally, on February 9, 2018, the Company granted
19,100
shares of restricted stock and
921,700
stock options to employees of the Company.
19.
Quarterly Results (Unaudited)
The following is a summary of the quarterly results of operations for the years ending December 31,
2017
and
2016
:
|
|
Quarter
|
||||||||||||||
|
|
First
|
Second
|
Third
|
Fourth
|
|||||||||||
|
|
(in thousands, except per share data)
|
||||||||||||||
|
2017
|
|
|
|
|
|||||||||||
|
Net sales
|
$
|
86,078
|
|
$
|
101,326
|
|
$
|
113,668
|
|
$
|
104,160
|
|
|||
|
Gross profit
|
24,986
|
|
31,678
|
|
35,658
|
|
31,075
|
|
|||||||
|
Net income
|
10,217
|
|
13,794
|
|
14,717
|
|
15,770
|
|
|||||||
|
Earnings per share:
|
|
|
|
|
|
|
|
|
|||||||
|
Basic
|
$
|
0.19
|
|
$
|
0.26
|
|
$
|
0.28
|
|
$
|
0.30
|
|
|||
|
Diluted
|
$
|
0.19
|
|
$
|
0.26
|
|
$
|
0.28
|
|
$
|
0.30
|
|
|||
|
2016
|
|
|
|
|
|
|
|
|
|||||||
|
Net sales
|
$
|
85,422
|
|
$
|
102,319
|
|
$
|
104,568
|
|
$
|
91,668
|
|
|||
|
Gross profit
|
25,731
|
|
32,747
|
|
33,092
|
|
26,510
|
|
|||||||
|
Net income
|
11,551
|
|
14,725
|
|
15,682
|
|
11,420
|
|
|||||||
|
Earnings per share:
|
|
|
|
|
|
|
|
|
|||||||
|
Basic
|
$
|
0.22
|
|
$
|
0.28
|
|
$
|
0.30
|
|
$
|
0.22
|
|
|||
|
Diluted
|
$
|
0.22
|
|
$
|
0.27
|
|
$
|
0.29
|
|
$
|
0.21
|
|
|||
43
Not Applicable.
(a)
Evaluation of Disclosure Controls and Procedures
At the end of the period covered by this Annual Report on Form 10-K, our management, under the supervision and with the participation of our Chief Executive Officer and Chief Financial Officer, has evaluated the effectiveness of the design and operation of our disclosure controls and procedures. Based on that evaluation, our Chief Executive Officer and Chief Financial Officer believe that:
|
•
|
Our disclosure controls and procedures are designed at a reasonable assurance threshold to ensure that information required to be disclosed by us in the reports we file under the Securities Exchange Act of 1934 is recorded, processed, summarized and reported within the time periods specified in the SEC’s rules and forms; and
|
|
•
|
Our disclosure controls and procedures operate at a reasonable assurance threshold such that important information flows to appropriate collection and disclosure points in a timely manner and are effective to ensure that such information is accumulated and communicated to our management, and made known to our Chief Executive Officer and Chief Financial Officer, particularly during the period when this Annual Report was prepared, as appropriate to allow timely decisions regarding the required disclosure.
|
Our Chief Executive Officer and Chief Financial Officer have evaluated our disclosure controls and procedures and concluded that these controls and procedures were effective as of December 31,
2017
.
(b)
Management's Annual Report on Internal Control over Financial Reporting
Our management is responsible for establishing and maintaining adequate internal control over our financial reporting. Our internal control over financial reporting is a process designed by, or under the supervision of, our principal executive and principal financial officer, and effected by our board of directors, management and other personnel, to provide reasonable assurance regarding the reliability of financial reporting and the preparation of financial statements for external purposes in accordance with U.S. GAAP.
All internal control systems, no matter how well designed, have inherent limitations. Therefore, even those systems determined to be effective can provide only reasonable assurance with respect to financial statement preparation and presentation.
In making our assessment of internal control over financial reporting, management has used the criteria issued by the Committee of Sponsoring Organizations of the Treadway Commission ("COSO") in the 2013
Internal Control—Integrated Framework
. Based on our assessment, we believe that, as of December 31,
2017
, our internal control over financial reporting is effective at the reasonable assurance level based on those criteria.
The effectiveness of the Company's internal control over financial reporting as of December 31,
2017
has been audited by Grant Thornton LLP, our independent registered public accounting firm, as stated in their report which is included in this Item 9A of this report on Form 10-K.
(c)
Changes in Internal Control over Financial Reporting
There have been no changes in internal control over financial reporting that occurred during the fourth quarter of
2017
that have materially affected, or are reasonably likely to materially affect, our internal control over financial reporting.
44
REPORT OF INDEPENDENT REGISTERED PUBLIC ACCOUNTING FIRM
Board of Directors and Stockholders
AAON, Inc.
Opinion on internal control over financial reporting
We have audited the internal control over financial reporting of AAON, Inc. (a Nevada corporation) and subsidiaries (the “Company”) as of December 31,
2017
, based on criteria established in the 2013
Internal Control—Integrated Framework
issued by the Committee of Sponsoring Organizations of the Treadway Commission ("COSO"). In our opinion, the Company maintained, in all material respects, effective internal control over financial reporting as of December 31,
2017
, based on criteria established in the 2013
Internal Control - Integrated Framework
issued by COSO.
We also have audited, in accordance with the standards of the Public Company Accounting Oversight Board (United States) ("PCAOB"), the consolidated financial statements of the Company as of and for the year ended December 31,
2017
, and our report dated
February 27, 2018
, expressed an unqualified opinion on those financial statements.
Basis for opinion
The Company’s management is responsible for maintaining effective internal control over financial reporting and for its assessment of the effectiveness of internal control over financial reporting, included in the accompanying Management’s Annual Report on Internal Control over Financial Reporting. Our responsibility is to express an opinion on the Company’s internal control over financial reporting based on our audit. We are a public accounting firm registered with the PCAOB and are required to be independent with respect to the Company in accordance with the U.S. federal securities laws and the applicable rules and regulations of the Securities and Exchange Commission and the PCAOB.
We conducted our audit in accordance with the standards of the PCAOB. Those standards require that we plan and perform the audit to obtain reasonable assurance about whether effective internal control over financial reporting was maintained in all material respects. Our audit included obtaining an understanding of internal control over financial reporting, assessing the risk that a material weakness exists, testing and evaluating the design and operating effectiveness of internal control based on the assessed risk, and performing such other procedures as we considered necessary in the circumstances. We believe that our audit provides a reasonable basis for our opinion.
Definition and limitations of internal control over financial reporting
A company’s internal control over financial reporting is a process designed to provide reasonable assurance regarding the reliability of financial reporting and the preparation of financial statements for external purposes in accordance with generally accepted accounting principles. A company’s internal control over financial reporting includes those policies and procedures that (1) pertain to the maintenance of records that, in reasonable detail, accurately and fairly reflect the transactions and dispositions of the assets of the company; (2) provide reasonable assurance that transactions are recorded as necessary to permit preparation of financial statements in accordance with generally accepted accounting principles, and that receipts and expenditures of the company are being made only in accordance with authorizations of management and directors of the company; and (3) provide reasonable assurance regarding prevention or timely detection of unauthorized acquisition, use, or disposition of the company’s assets that could have a material effect on the financial statements.
Because of its inherent limitations, internal control over financial reporting may not prevent or detect misstatements. Also, projections of any evaluation of effectiveness to future periods are subject to the risk that controls may become inadequate because of changes in conditions, or that the degree of compliance with the policies or procedures may deteriorate.
/s/ GRANT THORNTON LLP
Tulsa, Oklahoma
February 27, 2018
45
None.
Item 10.
Directors, Executive Officers and Corporate Governance.
The information required by Items 401, 405, 406 and 407(c)(3), (d)(4) and (d)(5) of Regulation S-K is incorporated by reference to the information contained in our definitive Proxy Statement to be filed with the Securities and Exchange Commission in connection with our annual meeting of shareholders scheduled to be held on May 15,
2018
.
Code of Ethics
We adopted a code of ethics that applies to our principal executive officer, principal financial officer and principal accounting officer or persons performing similar functions, as well as other employees and directors. Our code of ethics can be found on our website at www.aaon.com. We will also provide any person without charge, upon request, a copy of such code of ethics. Requests may be directed to AAON, Inc., 2425 South Yukon Avenue, Tulsa, Oklahoma 74107, attention Scott M. Asbjornson, or by calling (918) 382-6204.
Item 11.
Executive Compensation.
The information required by Items 402 and 407(e)(4) and (e)(5) of Regulation S-K is incorporated by reference to the information contained in our definitive Proxy Statement to be filed with the Securities and Exchange Commission in connection with our annual meeting of shareholders scheduled to be held on May 15,
2018
.
Item 12.
Security Ownership of Certain Beneficial Owners and Management and Related Stockholder Matters.
The information required by Item 403 and Item 201(d) of Regulation S-K is incorporated by reference to the information contained in our definitive Proxy Statement to be filed with the Securities and Exchange Commission in connection with our annual meeting of stockholders scheduled to be held May 15,
2018
.
Item 13.
Certain Relationships and Related Transactions, and Director Independence.
The information required to be reported pursuant to Item 404 of Regulation S-K and paragraph (a) of Item 407 of Regulation S-K is incorporated by reference in our definitive proxy statement relating to our annual meeting of shareholders scheduled to be held May 15,
2018
.
Our Code of Conduct guides the Board of Directors in its actions and deliberations with respect to related party transactions. Under the Code, conflicts of interest, including any involving the directors or any Named Officers, are prohibited except under any guidelines approved by the Board of Directors. Only the Board of Directors may waive a provision of the Code of Conduct for a director or a Named Officer, and only then in compliance with all applicable laws, rules and regulations. We have not entered into any new material related party transactions and have no preexisting material related party transactions in
2017
, 2016 or 2015.
Item 14.
Principal Accountant Fees and Services.
This information is incorporated by reference in our definitive Proxy Statement to be filed with the Securities and Exchange Commission in connection with our annual meeting of stockholders scheduled to be held May 15,
2018
.
46
|
Item 15.
|
Exhibits and Financial Statement Schedules.
|
|
(a)
|
Financial statements.
|
|||||
|
|
(1)
|
The consolidated financial statements and the report of independent registered public accounting firm are included in Item 8 of this Form 10-K.
|
||||
|
(2)
|
The consolidated financial statements other than those listed at item (a)(1) above have been omitted because they are not required under the related instructions or are not applicable.
|
|||||
|
(3)
|
The exhibits listed at item (b) below are filed as part of, or incorporated by reference into, this Form 10-K.
|
|||||
|
(b)
|
Exhibits:
|
|
||||
|
|
(3)
|
(A)
|
Amended and Restated Articles of Incorporation (ii)
|
|||
|
|
|
(B)
|
Bylaws (i)
|
|||
|
|
|
(B-1)
|
Amendments of Bylaws (iii)
|
|||
|
|
(4)
|
(A)
|
Third Restated Revolving Credit and Term Loan Agreement and related documents (iv)
|
|||
|
|
|
(A-1)
|
Amendment Eleven to Third Restated Revolving Credit Loan Agreement (v)
|
|||
|
|
(10.1)
|
|
AAON, Inc. 1992 Stock Option Plan, as amended (vii)
|
|||
|
|
(10.2)
|
|
AAON, Inc. 2007 Long-Term Incentive Plan, as amended (viii)
|
|||
|
(10.3)
|
AAON, Inc. 2016 Long-Term Incentive Plan (vi)
|
|||||
|
|
(21)
|
|
List of Subsidiaries (ix)
|
|||
|
|
|
Consent of Grant Thornton LLP
|
||||
|
|
|
Certification of CEO
|
||||
|
|
|
Certification of CFO
|
||||
|
|
|
Section 1350 Certification – CEO
|
||||
|
|
|
Section 1350 Certification – CFO
|
||||
|
(101)
|
(INS)
|
XBRL Instance Document
|
||||
|
(101)
|
(SCH)
|
XBRL Taxonomy Extension Schema Document
|
||||
|
(101)
|
(CAL)
|
XBRL Taxonomy Extension Calculation Linkbase Document
|
||||
|
(101)
|
(DEF)
|
XBRL Taxonomy Extension Definition Linkbase Document
|
||||
|
(101)
|
(LAB)
|
XBRL Taxonomy Extension Label Linkbase Document
|
||||
|
(101)
|
(PRE)
|
XBRL Taxonomy Extension Presentation Linkbase Document
|
||||
|
|
|
|
||||
|
|
(i)
|
|
Incorporated herein by reference to the exhibits to our Form S-18 Registration Statement No. 33-18336-LA.
|
|||
|
|
(ii)
|
|
Incorporated herein by reference to exhibits to our Annual Report on Form 10-K for the fiscal year ended December 31, 2014.
|
|||
|
|
(iii)
|
|
Incorporated herein by reference to our Forms 8-K dated March 10, 1997, May 27, 1998 and February 25, 1999, or exhibits thereto.
|
|||
|
|
(iv)
|
|
Incorporated herein by reference to exhibit to our Form 8-K dated July 30, 2004.
|
|||
|
|
(v)
|
|
Incorporated herein by reference to exhibit to our Form 8-K dated July 27, 2016.
|
|||
|
|
(vi)
|
|
Incorporated herein by reference to our Form S-8 Registration Statement No. 333-212863 dated August 2, 2016.
|
|||
47
|
(vii)
|
Incorporated by reference to exhibits to our Annual Report on Form 10-K for the fiscal year ended December 31, 1991, and to our Form S-8 Registration Statement No. 333-52824.
|
|||||
|
(viii)
|
Incorporated herein by reference to our Form S-8 Registration Statement No. 333-151915, Form S-8 Registration Statement No. 333-207737, and to our Form 8-K dated May 21, 2014.
|
|||||
|
(ix)
|
Incorporated herein by reference to exhibits to our Annual Report on Form 10-K for the fiscal year ended December 31, 2004.
|
|||||
48
SIGNATURES
Pursuant to the requirement of Section 13 or 15(d) of the Securities Exchange Act of 1934, as amended, the Registrant has duly caused this report to be signed on its behalf by the undersigned, hereunto duly authorized.
|
|
AAON, INC.
|
||
|
|
|
|
|
|
Dated:
|
February 27, 2018
|
By:
|
/s/ Norman H. Asbjornson
|
|
|
|
Norman H. Asbjornson, Chief Executive Officer
|
|
Pursuant to the requirements of the Securities Exchange Act of 1934, as amended, this report has been signed below by the following persons on behalf of the Registrant and in the capacities and on the dates indicated.
|
Dated:
|
February 27, 2018
|
/s/ Norman H. Asbjornson
|
|
|
Norman H. Asbjornson
Chief Executive Officer and Director
(principal executive officer)
|
|
|
|
|
|
|
Dated:
|
February 27, 2018
|
/s/ Scott M. Asbjornson
|
|
|
Scott M. Asbjornson
Chief Financial Officer
(principal financial officer)
|
|
|
|
|
|
|
Dated:
|
February 27, 2018
|
/s/ Rebecca A. Thompson
|
|
|
Rebecca A. Thompson
Chief Accounting Officer
(principal accounting officer)
|
|
|
|
|
|
|
Dated:
|
February 27, 2018
|
/s/ Gary D. Fields
|
|
|
Gary D. Fields
President and Director
|
|
|
|
||
|
Dated:
|
February 27, 2018
|
/s/ Jack E. Short
|
|
|
Jack E. Short
Director
|
|
|
|
|
|
|
Dated:
|
February 27, 2018
|
/s/ Paul K. Lackey, Jr.
|
|
|
Paul K. Lackey, Jr.
Director
|
|
|
|
|
|
|
Dated:
|
February 27, 2018
|
/s/ A.H. McElroy II
|
|
|
A.H. McElroy II
Director
|
|
|
|
|
|
|
Dated:
|
February 27, 2018
|
/s/ Stephen O. LeClair
|
|
|
Stephen O. LeClair
Director
|
|
|
|
|
|
|
Dated:
|
February 27, 2018
|
/s/ Angela E. Kouplen
|
|
Angela E. Kouplen Director
|
||
|
Dated:
|
February 27, 2018
|
/s/ Luke A. Bomer
|
|
|
Luke A. Bomer
Secretary
|
|
49
Exhibit 23
CONSENT OF INDEPENDENT REGISTERED PUBLIC ACCOUNTING FIRM
We have issued our reports dated
February 27, 2018
, with respect to the consolidated financial statements and internal control over financial reporting in the Annual Report of AAON, Inc. on Form 10-K for the year ended December 31,
2017
. We consent to the incorporation by reference of said reports in the Registration Statements of AAON, Inc. on Forms S-8 (File No. 333-151915, File No. 333-207737, and File No. 333-212863).
/s/ GRANT THORNTON LLP
Tulsa, Oklahoma
February 27, 2018
50
Exhibit 31.1
CERTIFICATION
I, Norman H. Asbjornson, certify that:
|
1.
|
I have reviewed this Annual Report on Form 10-K of AAON, Inc.
|
|
2.
|
Based on my knowledge, this report does not contain any untrue statement of a material fact or omit to state a material fact necessary to make the statements made, in light of the circumstances under which such statements were made, not misleading with respect to the period covered by this report;
|
|
3.
|
Based on my knowledge, the financial statements, and other financial information included in this report, fairly present in all material respects the financial condition, results of operations and cash flows of the registrant as of, and for, the periods presented in this report;
|
|
4.
|
The registrant’s other certifying officer and I are responsible for establishing and maintaining disclosure controls and procedures (as defined in Exchange Act Rules 13a-15(e) and 15d-15(e) and internal control over financial reporting (as defined in Exchange Act Rules 13a-15(f) and 15d-15(f)) for the registrant and have:
|
|
a)
|
designed such disclosure controls and procedures, or caused such disclosure controls and procedures to be designed under our supervision, to ensure that material information relating to the registrant, including our consolidated subsidiaries, is made known to us by others within those entities, particularly during the period in which this report is being prepared;
|
|
b)
|
designed such internal control over financial reporting, or caused such internal control over financial reporting to be designed under our supervision, to provide reasonable assurance regarding the reliability of financial reporting and the preparation of financial statements for external purposes in accordance with generally accepted accounting principles;
|
|
c)
|
evaluated the effectiveness of the registrant’s disclosure controls and procedures and presented in this report our conclusions about the effectiveness of the disclosure controls and procedures, as of the end of the period covered by this report based on such evaluation;
|
|
d)
|
disclosed in this report any change in the registrant’s internal controls over financial reporting that occurred during the registrant’s most recent fiscal quarter (the registrant’s fourth fiscal quarter in the case of an annual report) that has materially affected, or is reasonably likely to materially affect, the registrant’s internal control over financial reporting; and
|
|
5.
|
The registrant’s other certifying officer and I have disclosed, based on our most recent evaluation of internal control over financial reporting, to the registrant’s auditors and the audit committee of registrant’s board of directors (or persons performing the equivalent functions):
|
|
a)
|
all significant deficiencies and material weaknesses in the design or operation of internal control over financial reporting which are reasonably likely to adversely affect the registrant’s ability to record, process, summarize and report financial information; and
|
|
b)
|
any fraud, whether or not material, that involves management or other employees who have a significant role in the registrant’s internal control over financial reporting.
|
|
Dated:
|
February 27, 2018
|
|
|
|
/s/ Norman H. Asbjornson
|
|
|
|
|
|
|
|
Norman H. Asbjornson
Chief Executive Officer
|
|
51
Exhibit 31.2
CERTIFICATION
I, Scott M. Asbjornson, certify that:
|
1.
|
I have reviewed this Annual Report on Form 10-K of AAON, Inc.
|
|
2.
|
Based on my knowledge, this report does not contain any untrue statement of a material fact or omit to state a material fact necessary to make the statements made, in light of the circumstances under which such statements were made, not misleading with respect to the period covered by this report;
|
|
3.
|
Based on my knowledge, the financial statements, and other financial information included in this report, fairly present in all material respects the financial condition, results of operations and cash flows of the registrant as of, and for, the periods presented in this report;
|
|
4.
|
The registrant’s other certifying officer and I are responsible for establishing and maintaining disclosure controls and procedures (as defined in Exchange Act Rules 13a-15(e) and 15d-15(e) and internal control over financial reporting (as defined in Exchange Act Rules 13a-15(f) and 15d-15(f)) for the registrant and have:
|
|
a)
|
designed such disclosure controls and procedures, or caused such disclosure controls and procedures to be designed under our supervision, to ensure that material information relating to the registrant, including our consolidated subsidiaries, is made known to us by others within those entities, particularly during the period in which this report is being prepared;
|
|
b)
|
designed such internal control over financial reporting, or caused such internal control over financial reporting to be designed under our supervision, to provide reasonable assurance regarding the reliability of financial reporting and the preparation of financial statements for external purposes in accordance with generally accepted accounting principles;
|
|
c)
|
evaluated the effectiveness of the registrant’s disclosure controls and procedures and presented in this report our conclusions about the effectiveness of the disclosure controls and procedures, as of the end of the period covered by this report based on such evaluation;
|
|
d)
|
disclosed in this report any change in the registrant’s internal controls over financial reporting that occurred during the registrant’s most recent fiscal quarter (the registrant’s fourth fiscal quarter in the case of an annual report) that has materially affected, or is reasonably likely to materially affect, the registrant’s internal control over financial reporting; and
|
|
5.
|
The registrant’s other certifying officer and I have disclosed, based on our most recent evaluation of internal control over financial reporting, to the registrant’s auditors and the audit committee of registrant’s board of directors (or persons performing the equivalent functions):
|
|
a)
|
all significant deficiencies and material weaknesses in the design or operation of internal control over financial reporting which are reasonably likely to adversely affect the registrant’s ability to record, process, summarize and report financial information; and
|
|
b)
|
any fraud, whether or not material, that involves management or other employees who have a significant role in the registrant’s internal control over financial reporting.
|
|
Dated:
|
February 27, 2018
|
|
|
|
/s/ Scott M. Asbjornson
|
|
|
|
Scott M. Asbjornson
Chief Financial Officer
|
|
52
Exhibit 32.1
CERTIFICATION PURSUANT TO
18 U.S.C. SECTION 1350,
AS ADOPTED PURSUANT TO
SECTION 906 OF THE SARBANES-OXLEY ACT OF 2002
In connection with the Annual Report of AAON, Inc. (the “Company”), on Form 10-K for the year ended December 31,
2017
, as filed with the Securities and Exchange Commission on the date hereof (the “Report”), I, Norman H. Asbjornson, Chief Executive Officer of the Company, certify, pursuant to 18 U.S.C. § 1350, as adopted pursuant to § 906 of the Sarbanes-Oxley Act of 2002, that:
(1) The Report fully complies with the requirements of section 13(a) or 15(d) of the Securities Exchange Act of 1934; and
(2) The information contained in the Report fairly presents, in all material respects, the financial condition and our results of operations.
|
Dated:
|
February 27, 2018
|
|
|
|
/s/ Norman H. Asbjornson
|
|
|
|
Norman H. Asbjornson
Chief Executive Officer
|
|
53
Exhibit 32.2
CERTIFICATION PURSUANT TO
18 U.S.C. SECTION 1350,
AS ADOPTED PURSUANT TO
SECTION 906 OF THE SARBANES-OXLEY ACT OF 2002
In connection with the Annual Report of AAON, Inc. (the “Company”), on Form 10-K for the year ended December 31,
2017
, as filed with the Securities and Exchange Commission on the date hereof (the “Report”), I, Scott M. Asbjornson, Chief Financial Officer of the Company, certify, pursuant to 18 U.S.C. § 1350, as adopted pursuant to § 906 of the Sarbanes-Oxley Act of 2002, that:
(1) The Report fully complies with the requirements of section 13(a) or 15(d) of the Securities Exchange Act of 1934; and
(2) The information contained in the Report fairly presents, in all material respects, the financial condition and our results of operations.
|
Dated:
|
February 27, 2018
|
|
|
|
/s/ Scott M. Asbjornson
|
|
|
|
|
|
|
|
Scott M. Asbjornson
Chief Financial Officer
|
|
54
TABLE OF CONTENTS
Part IItem 1. BusinessItem 1A. Risk FactorsItem 1B. Unresolved Staff CommentsItem 2. PropertiesItem 3. Legal ProceedingsItem 4. Mine Safety DisclosurePart IIItem 5. Market For Registrant's Common Equity, Related Stockholder Matters and Issuer Purchases Of Equity SecuritiesItem 6. Selected Financial DataItem 7. Management's Discussion and Analysis Of Financial Condition and Results Of OperationsItem 7A. Quantitative and Qualitative Disclosures About Market RiskItem 8. Financial Statements and Supplementary DataItem 9. Changes in and Disagreements with Accountants on Accounting and Financial DisclosureItem 9A. Controls and ProceduresItem 9B. Other InformationPart IIIItem 10. Directors, Executive Officers and Corporate GovernanceItem 11. Executive CompensationItem 12. Security Ownership Of Certain Beneficial Owners and Management and Related Stockholder MattersItem 13. Certain Relationships and Related Transactions, and Director IndependenceItem 14. Principal Accountant Fees and ServicesPart IVItem 15. Exhibits and Financial Statement Schedules