ADVANCE AUTO PARTS INC
10-Ks and 10-Qs
|
|
|
|
|
|
|
|
|
|
|
|
|
|
|
|
|
|
|
|
|
|
|
|
|
|
|
|
|
|
|
|
|
|
|
|
|
|
|
|
|
|
|
|
|
|
|
|
|
|
|
|
|
UNITED STATES
SECURITIES AND EXCHANGE COMMISSION
Washington, D.C. 20549
|
FORM 10-K
|
|
x
|
ANNUAL REPORT PURSUANT TO SECTION 13 OR 15(d) OF THE SECURITIES EXCHANGE ACT OF 1934
|
For the fiscal year ended
December 29, 2018
|
o
|
TRANSITION REPORT PURSUANT TO SECTION 13 OR 15(d) OF THE SECURITIES EXCHANGE ACT OF 1934
|
For the transition period from ________ to ________.
Commission file number 001-16797
________________________

ADVANCE AUTO PARTS, INC.
(Exact name of registrant as specified in its charter)
________________________
|
Delaware
(State or other jurisdiction of
incorporation or organization)
|
54-2049910
(I.R.S. Employer
Identification No.)
|
|
2635 East Millbrook Road
Raleigh, North Carolina
(Address of principal executive offices)
|
27604
(Zip Code)
|
(540) 362-4911
(Registrant’s telephone number, including area code)
Securities Registered Pursuant to Section 12(b) of the Act
|
Title of each class
Common Stock ($0.0001 par value)
|
Name of each exchange on which registered
New York Stock Exchange
|
Securities Registered Pursuant to Section 12(g) of the Act: None
Indicate by check mark if the registrant is a well-known seasoned issuer, as defined in Rule 405 of the Securities Act. Yes
x
No
o
Indicate by check mark if the registrant is not required to file reports pursuant to Section 13 or Section 15(d) of the Act.
Yes
o
No
x
Indicate by check mark whether the registrant (1) has filed all reports required to be filed by Section 13 or 15(d) of the Securities Exchange Act of 1934 during the preceding 12 months (or for such shorter period that the registrant was required to file such reports), and (2) has been subject to such filing requirements for the past 90 days. Yes
x
No
o
Indicate by check mark whether the registrant has submitted electronically every Interactive Data File required to be submitted pursuant to Rule 405 of Registration S-T (§232.405 of this chapter) during the preceding 12 months (or for such shorter period that the registrant was required to submit such files). Yes
x
No
o
Indicate by check mark if disclosure of delinquent filers pursuant to Item 405 of Registration S-K (§229.405 of this chapter) is not contained herein, and will not be contained, to the best of registrant’s knowledge, in definitive proxy or information statements incorporated by reference in Part III of this Form 10-K or any amendment to the Form 10-K.
o
Indicate by check mark whether the registrant is a large accelerated filer, an accelerated filer, a non-accelerated filer, a smaller reporting company or an emerging growth company. See the definitions of “large accelerated filer,” “accelerated filer,” “smaller reporting company” and “emerging growth company” in Rule 12b-2 of the Exchange Act.
|
Large accelerated filer
x
|
Accelerated filer
o
|
|
Non-accelerated filer
o
|
Smaller reporting company
o
|
|
Emerging growth company
o
|
|
If an emerging growth company, indicate by check mark if the registrant has elected not to use the extended transition period for complying with any new or revised financial accounting standards provided pursuant to Section 13(a) of the Exchange Act.
o
Indicate by check mark whether the registrant is a shell company (as defined in Rule 12b-2 of the Exchange Act).
Yes
o
No
x
As of the last business day of the registrant’s most recently completed second fiscal quarter,
July 13, 2018
, the aggregate market value of common stock held by non-affiliates of the registrant was
$9,863,346,448
, based on the last sales price on
July 13, 2018
, as reported by the New York Stock Exchange.
As of
February 15, 2019
, the number of shares of the registrant’s common stock outstanding was
71,670,134
shares.
Documents Incorporated by Reference:
Portions of the registrant’s definitive proxy statement for its
2019
Annual Meeting of Stockholders, to be held on
May 15, 2019
, are incorporated by reference into Part III of this Form 10-K.
|
TABLE OF CONTENTS
|
|||
|
|
|
|
Page
|
|
|
|
|
|
|
|
|||
|
|
|
|
|
|
|
|||
|
|
|
|
|
|
|
|||
|
|
|
|
|
|
|
|||
|
|
|
|
|
|
|
|||
|
|
|
|
|
|
|
|||
|
|
|
|
|
|
|
|
|
|
|
|
|||
|
|
|
|
|
|
|
|||
|
|
|
|
|
|
|
|
|
|
|
|
|||
|
|
|
|
|
|
|
|||
|
|
|
|
|
FORWARD-LOOKING STATEMENTS
Certain statements in this Annual Report on Form 10-K are “forward-looking statements” within the meaning of the Private Securities Litigation Reform Act of 1995. All statements, other than statements of historical facts, may be forward-looking statements. Forward-looking statements are usually identified by the use of words such as “anticipate,” “believe,” “could,” “estimate,” “expect,” “forecast,” “intend,” “likely,” “may,” “plan,” “position,” “possible,” “potential,” “probable,” “project,” “projection,” “should,” “strategy,” “will,” or similar expressions. These statements are based upon assessments and assumptions of management in light of historical results and trends, current conditions and potential future developments that often involve judgment, estimates, assumptions and projections. Forward-looking statements reflect current views about our plans, strategies and prospects, which are based on information currently available as of the date of this report. Except as required by law, we undertake no obligation to update any forward-looking statements to reflect events or circumstances after the date of such statements. Please refer to other filings made by the Company with the Securities and Exchange Commission for additional risk factors that could materially affect the Company’s actual results. Forward-looking statements are subject to risks and uncertainties, many of which are outside our control, which could cause actual results to differ materially from these statements. Therefore, you should not place undue reliance on those statements.
1
PART I
Item 1.
Business.
Unless the context otherwise requires, “Advance,” “we,” “us,” “our,” and similar terms refer to Advance Auto Parts, Inc., its subsidiaries and their respective operations on a consolidated basis. Our fiscal year consists of 52 or 53 weeks ending on the Saturday closest to December 31
st
of each year. Our fiscal year ended
December 29, 2018
(“
2018
”), fiscal year ended
December 30, 2017
(“
2017
”) and fiscal year ended
December 31, 2016
(“
2016
”) included 52 weeks of operations.
Overview
We are a leading automotive aftermarket parts provider in North America, serving both professional installers (“Professional”), and “do-it-yourself” (“DIY”), customers as well as independently owned operators. Our stores and branches offer a broad selection of brand name, original equipment manufacturer (“OEM”) and private label automotive replacement parts, accessories, batteries and maintenance items for domestic and imported cars, vans, sport utility vehicles and light and heavy duty trucks. As of
December 29, 2018
, we operated
4,966
total stores and
143
branches primarily under the trade names “Advance Auto Parts”, “Autopart International”, “Carquest” and “Worldpac”.
We were founded in 1929 as Advance Stores Company, Incorporated and operated as a retailer of general merchandise until the 1980s. During the 1980s, we began targeting the sale of automotive parts and accessories to DIY customers. We initiated our Professional delivery program in 1996 and have steadily increased our sales to Professional customers since 2000. We have grown significantly as a result of comparable store sales growth, new store openings and strategic acquisitions. Advance Auto Parts, Inc., a Delaware corporation, was incorporated in 2001 in conjunction with the acquisition of Discount Auto Parts, Inc. In 2014, we acquired General Parts International, Inc. (“GPI”), a privately held company that was a leading distributor and supplier of original equipment and aftermarket automotive replacement products for Professional markets operating under the Carquest and Worldpac names.
Stores and Branches
Through our integrated operating approach, we serve our Professional and DIY customers through a variety of channels ranging from traditional “brick and mortar” store locations to self-service e-commerce sites. We believe we are better able to meet our customers’ needs by operating under several store names, which are as follows:
Advance Auto Parts
— Our
4,380
stores as of
December 29, 2018
are generally located in freestanding buildings with a focus on both Professional and DIY customers. The average size of an Advance Auto Parts store is approximately
7,600
square feet with the size of our typical new stores ranging from approximately
6,600
to
22,900
square feet. These stores carry a wide variety of products serving aftermarket auto part needs for both domestic and import vehicles. Our Advance Auto Parts stores carry a product offering of approximately
21,000
stock keeping units (“SKUs”), generally consisting of a custom mix of product based on each store’s respective market. Supplementing the inventory on-hand at our stores, additional less common SKUs are available in many of our larger stores (known as “HUB” stores). These additional SKUs are available on a same-day or next-day basis.
Autopart International
— Our
185
stores as of
December 29, 2018
operate primarily in the Northeastern and Mid-Atlantic regions of the United States with a focus on Professional customers. These stores specialize in imported aftermarket and private label branded auto parts. Autopart International stores offer approximately
54,000
SKUs through routine replenishment from their supply chain.
Carquest
— Our
401
stores as of
December 29, 2018
, including
140
stores in Canada, are generally located in freestanding buildings with a primary focus on Professional customers, but also serving DIY customers. The average size of a Carquest store is approximately
7,300
square feet. These stores carry a wide variety of products serving the aftermarket auto part needs for both domestic and import vehicles with a product offering of approximately
21,000
SKUs. As of
December 29, 2018
, Carquest also served
1,231
independently owned stores that operate under the “Carquest” name.
Worldpac
— Our
143
branches as of
December 29, 2018
that principally serve Professional customers utilizing an efficient and sophisticated on-line ordering and fulfillment system.Worldpac branches are generally larger than our other store locations averaging approximately
26,400
square feet in size. Worldpac specializes in imported, OEM parts. Worldpac’s complete product offering includes over
165,000
SKUs for import and domestic vehicle carlines.
2
Our Products
The following table shows some of the types of products that we sell by major category of items:
|
Parts & Batteries
|
Accessories & Chemicals
|
Engine Maintenance
|
|
Batteries and battery accessories
|
Air conditioning chemicals and accessories
|
Air filters
|
|
Belts and hoses
|
Air fresheners
|
Fuel and oil additives
|
|
Brakes and brake pads
|
Antifreeze and washer fluid
|
Fuel filters
|
|
Chassis parts
|
Electrical wire and fuses
|
Grease and lubricants
|
|
Climate control parts
|
Electronics
|
Motor oil
|
|
Clutches and drive shafts
|
Floor mats, seat covers and interior accessories
|
Oil filters
|
|
Engines and engine parts
|
Hand and specialty tools
|
Part cleaners and treatments
|
|
Exhaust systems and parts
|
Lighting
|
Transmission fluid
|
|
Hub assemblies
|
Performance parts
|
|
|
Ignition components and wire
|
Sealants, adhesives and compounds
|
|
|
Radiators and cooling parts
|
Tire repair accessories
|
|
|
Starters and alternators
|
Vent shades, mirrors and exterior accessories
|
|
|
Steering and alignment parts
|
Washes, waxes and cleaning supplies
|
|
|
Wiper blades
|
||
We provide our customers with quality products, that are offered at a good, better or best recommendation differentiated by price and quality.
Our Customers
Our Professional customers consist primarily of customers for whom we deliver product from our store or branch locations to their places of business, including garages, service stations and auto dealers. Our Professional sales represented approximately
58%
of our sales in 2018, 2017 and 2016. We also serve
1,231
independently owned Carquest stores with shipments directly from our distribution centers. Our DIY customers are primarily served through our stores and can also order online to pick up merchandise at a conveniently located store or have their purchases shipped directly to them. Except where prohibited, we also provide a variety of services at our stores free of charge to our customers, including:
|
•
|
Battery and wiper installation;
|
|
•
|
Battery charging;
|
|
•
|
Check engine light reading;
|
|
•
|
Electrical system testing, including batteries, starters, alternators and sensors;
|
|
•
|
“How-To” video clinics;
|
|
•
|
Oil and battery recycling; and
|
|
•
|
Loaner tool programs.
|
We also serve our customers online at www.AdvanceAutoParts.com. Our Professional customers can conveniently place their orders electronically, including through MyAdvance.com, by phone or in-store and we deliver product from our store or branch locations to their places of business.
Store Development
The key factors used in selecting sites and market locations in which we operate include population, demographics, traffic count, vehicle profile, number and strength of competitors’ stores and the cost of real estate. As of
December 29, 2018
, 4,948 stores and branches were located in 49 U.S. states and 2 U.S. territories and 161 stores and branches were located in 9 Canadian provinces.
We serve our Advance Auto Parts and Carquest stores primarily from our customer support centers in Raleigh, NC and Roanoke, VA. We also maintain a store support center in Newark, CA to support our Worldpac and e-commerce operations and in Norton, MA to support our Autopart International stores.
3
Supply Chain
Our supply chain consists of a network of distribution centers, HUBs, stores and branches that enable us to provide same-day or next-day availability to our customers. As of
December 29, 2018
, we operated
51
distribution centers, ranging in size from approximately
51,000
to
943,000
square feet with total square footage of approximately
11.5 million
. Our smaller distribution centers primarily service our Carquest stores, including those that have converted to the Advance Auto Parts format, while our larger distribution centers primarily service Advance Auto Parts, Autopart International and Worldpac locations. In 2018, we closed distribution centers in Gallman, MS and San Antonio, TX.
Merchandise, Marketing and Advertising
In
2018
, we purchased merchandise from over
1,100
vendors, with no single vendor accounting for more than
9%
of purchases. Our purchasing strategy involves negotiating agreements to purchase merchandise over a specified period of time along with other provisions, including pricing, volume and payment terms.
Our merchandising strategy is to carry a broad selection of high quality and reputable brand name automotive parts and accessories that we believe will appeal to our Professional customers and also generate DIY customer traffic. Some of our brands include Bosch
®
, Castrol
®
, Dayco
®
, Denso
®
, Gates
®
, Moog
®
, Monroe
®
, NGK
®
, Prestone
®
, Purolator
®
, Trico
®
and Wagner
®
. In addition to these branded products, we stock a wide selection of high-quality private label products with a goal of appealing to to value-conscious customers. These lines of merchandise include chemicals, interior automotive accessories, batteries and parts under various private label names such as Autocraft
®
, Autopart International
®
, Driveworks
®
, Tough One
®
and Wearever
®
as well as the Carquest
®
brand.
Our marketing and advertising program is designed to drive brand awareness, consideration by consumers and omni-channel traffic by positioning Advance Auto Parts as the leader in parts availability, in-store parts and project expertise within the aftermarket auto parts category. We strive to exceed our customers’ expectations end-to-end through a comprehensive online and in-store pick up experience, extensive parts assortment, experienced parts professionals, Professional programs that are designed to build loyalty with our customers and our DIY customer loyalty program, Speed Perks. Our DIY campaign was developed around a multi-channel communications plan that brings together radio, television, direct marketing, social media, sponsorships, store events and Speed Perks.
Seasonality
Our business is somewhat seasonal in nature, with the highest sales usually occurring in the spring and summer months. In addition, our business can be affected by weather conditions. While unusually heavy precipitation tends to soften sales as elective maintenance is deferred during such periods, extremely hot or cold weather tends to enhance sales by causing automotive parts to fail at an accelerated rate. Our fourth quarter is generally our most volatile as weather and spending trade-offs typically influence our Professional and DIY sales.
Team Members
As of
December 29, 2018
, we employed approximately
40,000
full-time Team Members and approximately
31,000
part-time Team Members. Our workforce consisted of
85%
of our Team Members employed in store-level operations,
11%
employed in distribution and
4%
employed in our corporate offices. As of
December 29, 2018
, less than 1% of our Team Members were represented by labor unions. We have never experienced any labor disruption.
Intellectual Property
We own a number of trade names, service marks and trademarks, including “Advance Auto Parts”, “Autopart International”, “Carquest”, “CARQUEST Technical Institute”, “DriverSide”, “MotoLogic”, “MotoShop”, “Worldpac”, “speedDIAL” and “TECH-NET Professional Auto Service” for use in connection with the automotive parts business. In addition, we own and have registered a number of trademarks for our private label brands. We believe that these trade names, service marks and trademarks are important to our merchandising strategy. We do not know of any infringing uses that would materially affect the use of these trade names and marks and we actively defend and enforce them.
4
Competition
We operate in both the Professional and DIY markets of the automotive aftermarket industry. Our primary competitors are (i) both national and regional chains of automotive parts stores, including AutoZone, Inc., NAPA, O’Reilly Automotive, Inc., The Pep Boys-Manny, Moe & Jack and Auto Plus (formerly Uni-Select USA, Inc.), (ii) discount stores and mass merchandisers that carry automotive products, (iii) wholesalers or jobber stores, including those associated with national parts distributors or associations, (iv) independently owned stores, (v) automobile dealers that supply parts and (vi) internet-based retailers. We believe that chains of automotive parts stores that, like us, have multiple locations in one or more markets, have competitive advantages in customer service, marketing, inventory selection, purchasing and distribution as compared to independent retailers and jobbers that are not part of a chain or associated with other retailers or jobbers. The principal methods of competition in our business include customer service, product offerings, availability, quality, price and store location.
Environmental Matters
We are subject to various federal, state and local laws and governmental regulations relating to the operation of our business, including those governing collection, transportation and recycling of automotive lead-acid batteries, used motor oil and other recyclable items, and ownership and operation of real property. We sell products containing hazardous materials as part of our business. In addition, our customers may bring automotive lead-acid batteries, used motor oil or other recyclable items onto our properties. We currently provide collection and recycling programs for used lead-acid batteries, used oil and other recyclable items at a majority of our stores as a service to our customers. Pursuant to agreements with third-party vendors, lead-acid batteries, used motor oil and other recyclable items are collected by our Team Members, deposited onto pallets or into vendor supplied containers and stored by us until collected by the third party vendors for recycling or proper disposal. The terms of our contracts with third party vendors require that they are in compliance with all applicable laws and regulations. Our third-party vendors who arrange for the removal, disposal, treatment or other handling of hazardous or toxic substances may be liable for the costs of removal or remediation at any affected disposal, treatment or other site affected by such substances. Based on our experience, we do not believe that there are any material environmental costs associated with the current business practice of accepting lead-acid batteries, used oil and other recyclable items as these costs are borne by the respective third-party vendors.
We own and lease real property. Under various environmental laws and regulations, a current or previous owner or operator of real property may be liable for the cost of removal or remediation of hazardous or toxic substances on, under or in such property. These laws often impose joint and several liability and may be imposed without regard to whether the owner or operator knew of, or was responsible for, the release of such hazardous or toxic substances. Other environmental laws and common law principles also could be used to impose liability for releases of hazardous materials into the environment or work place, and third parties may seek recovery from owners or operators of real properties for personal injury or property damage associated with exposure to released hazardous substances. From time to time, we receive notices from the U.S. Environmental Protection Agency and state environmental authorities indicating that there may be contamination on properties we own, lease or operate or may have owned, leased or operated in the past or on adjacent properties for which we may be responsible. Compliance with these laws and regulations and clean-up of released hazardous substances have not had a material impact on our operations to date.
Available Information
Our Internet address is www.AdvanceAutoParts.com. Our website and the information contained therein or linked thereto are not part of this Annual Report on Form 10-K for 2018. We make available free of charge through our Internet website our annual reports on Form 10-K, quarterly reports on Form 10-Q, current reports on Form 8-K, proxy statements, registration statements and amendments to those reports filed or furnished pursuant to the Exchange Act as soon as reasonably practicable after we electronically file such material with, or furnish them to the SEC. The SEC maintains a website that contains reports, proxy statements and other information regarding issuers that file electronically with the SEC. These materials may be obtained electronically by accessing the SEC’s website at www.sec.gov.
5
Item 1A. Risk Factors.
Our business is subject to a variety of risks. Our business, financial condition, results of operations and cash flows could be negatively impacted by the following risk factors. These risks are not the only risks that may impact our business.
If overall demand for the products we sell declines, our business, financial condition, results of operations and cash flows will suffer. Decreased demand could also negatively impact our stock price.
Overall demand for products sold by our stores depends on many factors and may decrease due to any number of reasons, including:
|
•
|
a decrease in the total number of vehicles on the road or in the number of annual miles driven or significant increase in the use of ridesharing services
, because fewer vehicles means less maintenance and repairs, and lower vehicle mileage, which decreases the need for maintenance and repair;
|
|
•
|
the economy
, because during periods of declining economic conditions and rising interest rates, consumers may reduce their discretionary spending by deferring vehicle maintenance or repair and new car purchases, which may impact the number of cars requiring repair in the future;
|
|
•
|
the weather,
because milder weather conditions may lower the failure rates of automobile parts while extended periods of rain and winter precipitation may cause our customers to defer elective maintenance and repair of their vehicles;
|
|
•
|
the average duration of vehicle manufacturer warranties and average age of vehicles being driven,
because newer cars typically require fewer repairs and will be repaired by the manufacturers’ dealer networks using dealer parts pursuant to warranties (which have gradually increased in duration and/or mileage expiration over the recent past), while vehicles that are seven years old and older are generally no longer covered under manufacturers’ warranties and tend to need more maintenance and repair than newer vehicles;
|
|
•
|
an increase in internet-based retailers
, because potentially favorable prices and ease of use of purchasing parts via other websites on the internet may decrease the need for customers to visit and purchase their aftermarket parts from our physical stores and may cause fewer customers to order aftermarket parts on our website;
|
|
•
|
technological advances, such as battery electric vehicles, and the increase in quality of vehicles manufactured
, because vehicles that need less frequent maintenance or have lower part failure rates will require less frequent repairs using aftermarket parts and, in the case of battery electric vehicles, do not require oil changes; and
|
|
•
|
the refusal of vehicle manufacturers to make available diagnostic, repair and maintenance information
to
the automotive aftermarket industry that our Professional and DIY customers require to diagnose, repair and maintain their vehicles
, because this may force consumers to have a majority of diagnostic work, repairs and maintenance performed by the vehicle manufacturers’ dealer networks.
|
If we are unable to compete successfully against other companies in the automotive aftermarket industry we may lose customers and our revenues may decline.
The sale of automotive parts, accessories and maintenance items is highly competitive and influenced by a number of factors, including name recognition, location, price, quality, product availability and customer service. We compete in both the Professional and DIY categories of the automotive aftermarket industry, primarily with: (i) national and regional chains of automotive parts stores, (ii) internet-based retailers, (iii) discount stores and mass merchandisers that carry automotive products, (iv) wholesalers or jobbers stores, including those associated with national parts distributors or associations (v) independently owned stores and (vi) automobile dealers that supply parts. These competitors and the level of competition vary by market. Some of our competitors may possess advantages over us in certain markets we share, including with respect to the level of marketing activities, number of stores, store locations, store layouts, operating histories, name recognition, established customer bases, vendor relationships, prices and product warranties. Internet-based retailers may possess cost advantages over us due to lower overhead costs, time and travel savings and ability to price competitively. In order to compete favorably, we may need to increase delivery speeds and incur higher shipping costs. Consolidation among our competitors could enhance their market share and financial position, provide them with the ability to achieve better purchasing terms and allow them to provide more competitive prices to customers for whom we compete.
In addition, our reputation is critical to our continued success. Customers are increasingly shopping, reading reviews and comparing products and prices on-line. If we fail to maintain high standards for, or receive negative publicity (whether through social media or traditional media channels) relating to, product safety and quality or our integrity and reputation, we could lose customers to our competition. The product we sell is branded both in brands of our vendors and in our own private label brands. If the perceived quality or value of the brands we sell declines in the eyes of our customers, our results of operations could be negatively affected.
6
Competition may require us to reduce our prices below our normal selling prices or increase our promotional spending, which could lower our revenue and profitability. Competitive disadvantages may also prevent us from introducing new product lines, require us to discontinue current product offerings, or change some of our current operating strategies. If we do not have the resources, expertise and consistent execution, or otherwise fail to develop successful strategies, to address these potential competitive disadvantages, we may lose customers, our revenues and profit margins may decline and we may be less profitable or potentially unprofitable.
If we are unable to successfully implement our business strategy, including increasing sales to Professional and DIY customers, expanding our margins and increasing our return on invested capital, our business, financial condition, results of operations and cash flows could be adversely affected.
We have identified numerous initiatives as part of our business strategy to increase sales to both Professional and DIY customers and expand our margins in order to increase our earnings and cash flows. If we are unable to implement these initiatives efficiently and effectively, our business, financial condition, results of operations and cash flows could be adversely affected. For a description of select initiatives, see Note 4,
Exit Activities and Other Initiatives,
of the Notes to the Consolidated Financial Statements included herein.
Our inventory and ability to meet customer expectations may be adversely impacted by factors out or our control.
For that portion of our inventory manufactured and/or sourced outside the United States, geopolitical changes, changes in trade regulations or tariff rates, currency fluctuations, work stoppages, labor strikes, port delays, civil unrest, natural disasters, pandemics and other factors beyond our control may increase the cost of items we purchase or create shortages that could have a material adverse effect on our sales and profitability. In addition, unanticipated changes in consumer preferences or any unforeseen hurdles to meeting our customers’ needs for automotive products (particularly parts availability) in a timely manner could undermine our business strategy.
If we are unable to successfully implement our growth strategy, keep existing store locations or open new locations in desirable places on favorable terms, it could adversely affect our business, financial condition, results of operations and cash flows.
We intend to continue to expand the markets we serve as part of our growth strategy, which may include opening new stores or branches, as well as expansion of our online business. We may also grow our business through strategic acquisitions. We do not know whether the implementation of our growth strategy will be successful. As we expand our market presence through various means, it becomes more critical that we have consistent and effective execution across all of our Company’s locations and brands. We are unsure whether we will be able to open and operate new locations on a timely or sufficiently profitable basis, or that opening new locations in markets we already serve will not harm the profitability or comparable store sales of existing locations. The newly opened and existing locations’ profitability will depend on the competition we face as well as our ability to properly stock, market and price the products desired by customers in these markets. The actual number and format of any new locations to be opened and the success of our growth strategy will depend on a number of factors, including, among other things:
•
the availability of desirable locations;
•
the negotiation of acceptable lease or purchase terms for new locations;
•
the availability of financial resources, including access to capital at cost-effective interest rates;
•
our ability to expand our on-line offerings and sales; and
•
our ability to manage the expansion and to hire, train and retain qualified Team Members.
We compete with other retailers and businesses for suitable locations for our stores. Local land use and zoning regulations, environmental regulations and other regulatory requirements may impact our ability to find suitable locations and influence the cost of constructing, renovating and operating our stores. In addition, real estate, zoning, construction and other delays may adversely affect store openings and renovations and increase our costs. Further, changing local demographics at existing store locations may adversely affect revenue and profitability levels at those stores. The termination or expiration of leases at existing store locations may adversely affect us if the renewal terms of those leases are unacceptable to us and we are forced to close or relocate stores. If we determine to close or relocate a store subject to a lease, we may remain obligated under the applicable lease for the balance of the lease term. In addition to potentially incurring costs related to lease obligations, we may also incur severance or other facility closure costs for stores that are closed or relocated.
7
If we are unable to successfully integrate future acquisitions into our existing operations, it could adversely affect our business, financial condition, results of operations and cash flows.
We also expect to continue to make strategic acquisitions an element of our growth strategy. Acquisitions involve certain risks that could cause our growth and profitability to differ from our expectations. The success of our acquisitions depends on a number of factors, including among other things:
|
•
|
our ability to continue to identify and acquire suitable targets or to acquire additional companies at favorable prices and on other favorable terms;
|
|
•
|
our ability to obtain the full benefits envisioned by strategic relationships;
|
|
•
|
the risk that management’s attention may be distracted;
|
|
•
|
our ability to retain key personnel from acquired businesses;
|
|
•
|
our ability to successfully integrate the operations and systems of the acquired companies and achieve the strategic, operational, financial or other anticipated synergies of the acquisition;
|
|
•
|
we may incur significant transaction and integration costs in connection with acquisitions that may not be offset by the synergies achieved from the acquisition in the near term, or at all; and
|
|
•
|
we may assume or become subject to loss contingencies, known or unknown, of the acquired companies, which could relate to past, present or future facts, events, circumstances or occurrences.
|
If we experience difficulties implementing various information systems, including our new enterprise resource planning system (“ERP”), our ability to conduct or business could be negatively impacted.
We are dependent on information systems to facilitate the day-to-day operations of the business and to produce timely, accurate and reliable information on financial and operational results. We are in process of implementing various information systems, including a new ERP. These implementations will require significant investment of human and financial resources, and we may experience significant delays, increased costs and other difficulties with these projects. Any significant disruption or deficiency in the design and implementation of these information systems could adversely affect our ability to process orders, ship product, send invoices and track payments, fulfill contractual obligations or otherwise operate our business. While we have invested meaningful resources in planning, project management and training, additional and serious implementation issues may arise as we integrate onto these new information systems that may disrupt our operations and negatively impact our business, financial condition, results of operations and cash flows.
If we are unable to maintain adequate supply chain capacity and improve supply chain efficiency, we will not be able to expand our business, which could adversely affect our business, financial condition, results of operations and cash flows.
Our store inventories are primarily replenished by shipments from our network of distribution centers, warehouses and HUB stores. As we expand our market presence, we will need to increase the efficiency and maintain adequate capacity of our supply chain network in order to achieve the business goal of reducing inventory costs while improving availability and movement of goods throughout our supply chain to meet consumer product needs and channel preferences. We continue to streamline and optimize our supply chain network and systems and cannot be assured of our ability to increase the productivity and efficiency of our overall supply chain network to desired levels. If we fail to effectively utilize our existing supply chain or if our investments in our supply chain do not provide the anticipated benefits, we could experience sub-optimal inventory levels or increases in our costs, which could adversely affect our business, financial condition, results of operations and cash flows.
We are dependent on our suppliers to supply us with products that comply with safety and quality standards at competitive prices.
We are dependent on our vendors continuing to supply us quality products on payment terms that are favorable to us. If our merchandise offerings do not meet our customers’ expectations regarding safety and quality, we could experience lost sales, increased costs and exposure to legal and reputational risk. All of our suppliers must comply with applicable product safety laws, and we are dependent on them to ensure that the products we buy comply with all safety and quality standards. Events that give rise to actual, potential or perceived product safety concerns could expose us to government enforcement action and private litigation and result in costly product recalls and other liabilities. To the extent our suppliers are subject to additional government regulation of their product design and/or manufacturing processes, the cost of the merchandise we purchase may rise. In addition, negative customer perceptions regarding the safety or quality of the products we sell could cause our customers to seek alternative sources for their needs, resulting in lost sales. In those circumstances, it may be difficult and costly for us to regain the confidence of our customers.
8
Our reliance on suppliers subjects us to various risks and uncertainties which could affect our financial results.
We source the products we sell from a wide variety of domestic and international suppliers. Our financial results depend on us securing acceptable terms with our suppliers for, among other things, the price of merchandise we purchase from them, funding for various forms of promotional programs, payment terms and terms covering returns and factory warranties. To varying degrees, our suppliers may be able to leverage their competitive advantages - for example, their financial strength, the strength of their brand with customers, their own stores or online channels or their relationships with other retailers - to our commercial disadvantage. Generally, our ability to negotiate favorable terms with our suppliers is more difficult with suppliers for whom our purchases represent a smaller proportion of their total revenues, consequently impacting our profitability from such vendor relationships. We have established standards for product safety and quality and workplace standards that we require all our suppliers to meet. We do not condone human trafficking, forced labor, child labor, harassment or abuse of any kind, and we expect our suppliers to operate within these same principles. Our ability to find qualified suppliers who can supply products in a timely and efficient manner that meet our standards can be challenging. Suppliers may also fail to invest adequately in design, production or distribution facilities, may reduce their customer incentives, advertising and promotional activities or change their pricing policies. If we encounter any of these issues with our suppliers, our business, financial condition, results of operations and cash flows could be adversely impacted.
Deterioration of general macro-economic conditions, including unemployment, inflation or deflation, consumer debt levels, high fuel and energy costs, could have a negative impact on our business, financial condition, results of operations and cash flows due to impacts on our suppliers, customers and operating costs.
Our business depends on developing and maintaining close relationships with our suppliers and on our suppliers’ ability and willingness to sell quality products to us at favorable prices and terms. Many factors outside our control may harm these relationships and the ability or willingness of these suppliers to sell us products on favorable terms. Such factors include a general decline in the economy and economic conditions and prolonged recessionary conditions. These events could negatively affect our suppliers’ operations and make it difficult for them to obtain the credit lines or loans necessary to finance their operations in the short-term or long-term and meet our product requirements. Financial or operational difficulties that some of our suppliers may face could also increase the cost of the products we purchase from them or our ability to source product from them. We might not be able to pass our increased costs onto our customers. If our suppliers fail to develop new products we may not be able to meet the demands of our customers and our results of operations could be negatively affected.
In addition, the trend towards consolidation among automotive parts suppliers as well as the off-shoring of manufacturing capacity to foreign countries may disrupt or end our relationship with some suppliers, and could lead to less competition and result in higher prices. We could also be negatively impacted by suppliers who might experience bankruptcies, work stoppages, labor strikes, changes in foreign or domestic trade policies, changes in tariff rates or other interruptions to or difficulties in the manufacture or supply of the products we purchase from them.
Deterioration in macro-economic conditions or an increase in fuel costs or proposed or additional tariffs may have a negative impact on our customers’ net worth, financial resources, disposable income or willingness or ability to pay for accessories, maintenance or repair for their vehicles, resulting in lower sales in our stores. An increase in fuel costs may also reduce the overall number of miles driven by our customers resulting in fewer parts failures and a reduced need for elective maintenance.
Rising energy prices also directly impact our operating and product costs, including our store, supply chain, Professional delivery, utility and product acquisition costs.
We depend on the services of many qualified executives and other Team Members, whom we may not be able to attract, develop and retain.
Our success depends to a significant extent on the continued services and experience of our executives and other Team Members. We may not be able to retain our current executives and other key Team Members or attract and retain additional qualified executives and Team Members who may be needed in the future. We must also continue to motivate employees and keep them focused on our strategies and goals. Our ability to maintain an adequate number of executive and other qualified Team Members is highly dependent on an attractive and competitive compensation and benefits package. In addition, less than one percent of our Team Members are represented by unions. If these Team Members were to engage in a strike, work stoppage, or other slowdown, or if the terms and conditions in labor agreements were renegotiated, we could experience a disruption in our operations and higher ongoing labor costs. If we fail or are unable to maintain competitive compensation, our customer service and execution levels could suffer by reason of a declining quality of our workforce, which could adversely affect our business, financial condition, results of operations and cash flows.
9
The market price of our common stock may be volatile and could expose us to securities class action litigation.
The stock market and the price of our common stock may be subject to wide fluctuations based upon general economic and market conditions. Downturns in the stock market may cause the price of our common stock to decline. The market price of our stock may also be affected by our ability to meet analysts’ expectations. Failure to meet such expectations, even slightly, could have an adverse effect on the price of our common stock. In the past, following periods of volatility in the market price of a company’s securities, securities class action litigation has often been instituted against such a company. If similar litigation were instituted against us, it could result in substantial costs and a diversion of our attention and resources, which could have an adverse effect on our business.
Our level of indebtedness, a downgrade in our credit ratings or a deterioration in global credit markets could limit the cash flow available for operations and could adversely affect our ability to service our debt or obtain additional financing.
Our level of indebtedness could restrict our operations and make it more difficult for us to satisfy our debt obligations. For example, our level of indebtedness could, among other things:
|
•
|
affect our liquidity by limiting our ability to obtain additional financing for working capital;
|
|
•
|
limit our ability to obtain financing for capital expenditures and acquisitions or make any available financing more costly;
|
|
•
|
require us to dedicate all or a substantial portion of our cash flow to service our debt, which would reduce funds available for other business purposes, such as capital expenditures, dividends or acquisitions;
|
|
•
|
limit our flexibility in planning for or reacting to changes in the markets in which we compete;
|
|
•
|
place us at a competitive disadvantage relative to our competitors who may have less indebtedness;
|
|
•
|
render us more vulnerable to general adverse economic and industry conditions; and
|
|
•
|
make it more difficult for us to satisfy our financial obligations.
|
The indenture governing our notes and credit agreement governing our credit facilities contain financial and other restrictive covenants. Our failure to comply with those covenants could result in an event of default which, if not cured or waived, could result in the acceleration of all of our debt, including such notes.
In addition, our overall credit rating may be negatively impacted by deteriorating and uncertain credit markets or other factors that may or may not be within our control. The interest rates on our publicly issued debt and revolving credit facility are linked directly to our credit ratings. Accordingly, any negative impact on our credit ratings would likely result in higher interest rates and interest expense on any borrowings under our revolving credit facility or future issuances of public debt and less favorable terms on other operating and financing arrangements. In addition, it could reduce the attractiveness of certain vendor payment programs whereby third-party institutions finance arrangements to our vendors based on our credit rating, which could result in increased working capital requirements.
Conditions and events in the global credit market could have a material adverse effect on our access to short and long-term borrowings to finance our operations and the terms and cost of that debt. It is possible that one or more of the banks that provide us with financing under our revolving credit facility may fail to honor the terms of our existing credit facility or be financially unable to provide the unused credit as a result of significant deterioration in such bank’s financial condition. An inability to obtain sufficient financing at cost-effective rates could have a material adverse effect on our business, financial condition, results of operations and cash flows.
10
Because we are involved in litigation from time to time, and are subject to numerous laws and governmental regulations, we could incur substantial judgments, fines, legal fees and other costs.
We are sometimes the subject of complaints or litigation, which may include class action litigation from customers, Team Members or others for various actions. From time to time, we are involved in litigation involving claims related to, among other things, breach of contract, tortious conduct, employment, labor discrimination, breach of laws or regulations (including The Americans With Disabilities Act), payment of wages, exposure to asbestos or potentially hazardous product, real estate and product defects. The damages sought against us in some of these litigation proceedings are substantial. Although we maintain liability insurance for some litigation claims, if one or more of the claims were to greatly exceed our insurance coverage limits or if our insurance policies do not cover a claim, this could have a material adverse effect on our business, financial condition, results of operations and cash flows. For instance, we are currently subject to a putative securities class action regarding past public disclosures (see Item 3, "Legal Proceedings" of this annual report) and to several lawsuits alleging injury as a result of exposure to asbestos-containing products (see Note 14, Contingencies, of the Notes to the Consolidated Financial Statements included herein).
We are subject to numerous federal, state and local laws and governmental regulations relating to, among other things, environmental protection, product quality and safety standards, building and zoning requirements, labor and employment, discrimination and income taxes. Compliance with existing and future laws and regulations could increase the cost of doing business and adversely affect our results of operations. If we fail to comply with existing or future laws or regulations, we may be subject to governmental or judicial fines or sanctions, while incurring substantial legal fees and costs, as well as reputational risk. In addition, our capital and operating expenses could increase due to remediation measures that may be required if we are found to be noncompliant with any existing or future laws or regulations.
We work diligently to maintain the privacy and security of our customer, supplier, Team Member and business information and the functioning of our computer systems, website and other on-line offerings. In the event of a security breach or other cyber security incident, we could experience adverse operational effects or interruptions and/or become subject to legal or regulatory proceedings, any of which could lead to damage to our reputation in the marketplace and substantial costs.
The nature of our business requires us to receive, retain and transmit certain personally identifiable information about our customers, suppliers and Team Members, some of which is entrusted to third-party service providers. While we have taken and continue to undertake significant steps to protect such personally identifiable information and other confidential information and to protect the functioning of our computer systems, website and other online offerings, a compromise of our data security systems or those of businesses we interact with could result in information related to our customers, suppliers, Team Members or business being obtained by unauthorized persons or adverse operational effects or interruptions, which could have a material adverse effect on our business, financial condition, results of operations and cash flows. We develop, maintain and update processes and systems in an effort to try to prevent this from occurring, but these actions are costly and require constant, ongoing attention as technologies change, privacy and information security regulations change, and efforts to overcome security measures by bad actors continue to become ever more sophisticated.
Despite our efforts, our security measures may be breached in the future due to a cyber-attack, computer malware viruses, exploitation of hardware and software vulnerabilities, Team Member error, malfeasance, fraudulent inducement (including so-called “social engineering” attacks and “phishing” scams) or other acts. While we have experienced threats to our data and systems, including phishing attacks, to date we are not aware that we have experienced a material cyber-security breach that has in any manner hindered our operational capabilities. Unauthorized parties may in the future obtain access to our data or the data of our customers, suppliers or Team Members or may otherwise cause damage to or interfere with our equipment, our data and/or our network including our supply chain. Any breach, damage to or interference with our equipment or our network, or unauthorized access in the future could result in significant operational difficulties including legal and financial exposure and damage to our reputation that could potentially have an adverse effect on our business. While we also seek to obtain assurances that others we interact with will protect confidential information, there is always the risk that the confidentiality or accessibility of data held or utilized by others may be compromised. If a compromise of our data security or function of our computer systems or website were to occur, it could have a material adverse effect on our operating results and financial condition and possibly subject us to additional legal, regulatory and operating costs and damage our reputation in the marketplace.
11
Business interruptions may negatively impact our store hours, operability of our computer systems and the availability and cost of merchandise, which may adversely impact our sales and profitability.
Hurricanes, tornadoes, earthquakes or other natural disasters, war or acts of terrorism, or the threat of any of these calamities or others, may have a negative impact on our ability to obtain merchandise to sell in our stores, result in certain of our stores being closed for an extended period of time, negatively affect the lives of our customers or Team Members, or otherwise negatively impact our operations. Some of our merchandise is imported from other countries. If imported goods become difficult or impossible to import into the United States due to business interruption (including regulation of exporting or importing), and if we cannot obtain such merchandise from other sources at similar costs and without an adverse delay, our sales and profit margins may be negatively affected.
In the event that commercial transportation, including the global shipping industry, is curtailed or substantially delayed, our business may be adversely impacted as we may have difficulty receiving merchandise from our suppliers and/or transporting it to our stores.
Terrorist attacks, war in the Middle East, or insurrection involving any oil producing country could result in an abrupt increase in the price of crude oil, gasoline and diesel fuel. Such price increases would increase the cost of doing business for us and our suppliers, and also negatively impact our customers’ disposable income, causing an adverse impact on our business, sales, profit margins and results of operations.
We rely extensively on our computer systems and the systems of our business partners to manage inventory, process transactions and report results. These systems are subject to damage or interruption from power outages, telecommunication failures, computer viruses, security breaches and catastrophic events or occasional system breakdowns related to ordinary use or wear and tear. If our computer systems or those of our business partners fail we may experience loss of critical data and interruptions or delays in our ability to process transactions and manage inventory. Any such failure, including plans for disaster recovery, if widespread or extended, could adversely affect the operation of our business and our results of operations.
We may be affected by global climate change or by legal, regulatory, or market responses to such change.
The concern over climate change has led to legislative and regulatory initiatives aimed at reducing greenhouse gas emissions (“GHG”). For example, proposals that would impose mandatory requirements related to GHG continue to be considered by policy makers in the United States and elsewhere. Laws enacted to reduce GHG that directly or indirectly affect our suppliers (through an increase in their cost of production) or our business (through an impact on our inventory availability, cost of sales, operations or demand for the products we sell) could adversely affect our business, financial condition, results of operations and cash flows. Changes in automotive technology and compliance with any new or more stringent laws or regulations, or stricter interpretations of existing laws, could require additional expenditures by us or our suppliers all of which could adversely impact the demand for our products and our business, financial condition, results of operations or cash flows.
Item 1B. Unresolved Staff Comments.
None.
Item 2. Properties.
The following table summarizes the location, ownership status and total square footage of space utilized for distribution centers, principal corporate offices and retail stores and branches at the end of
2018
:
|
Square Footage
(in thousands)
|
||||||||
|
Location
|
Leased
|
Owned
|
||||||
|
Distribution Centers
|
51 locations in 33 U.S. states and 4 Canadian provinces
|
7,298
|
|
4,183
|
|
|||
|
Customer Support Centers:
|
||||||||
|
Raleigh, NC
|
Raleigh, NC
|
177
|
|
—
|
|
|||
|
Roanoke, VA
|
Roanoke, VA
|
253
|
|
—
|
|
|||
|
Stores and branches
|
4,948 stores and branches in 49 U.S. states and 2 U.S. territories and 161 stores and branches in 9 Canadian provinces
|
35,525
|
|
6,210
|
|
|||
Item 3. Legal Proceedings.
On February 6, 2018, a putative class action on behalf of purchasers of our securities who purchased or otherwise acquired their securities between November 14, 2016 and August 15, 2017, inclusive (the “Class Period”), was commenced against us and certain of our current and former officers in the U.S. District Court for the District of Delaware. The plaintiff alleges that the defendants failed to disclose material adverse facts about our financial well-being, business relationships, and prospects during the alleged Class Period in violation of Section 10(b) of the Securities Exchange Act of 1934 and Rule 10b-5 promulgated thereunder. The case is still in its preliminary stages. We strongly dispute the allegations of the complaint and intend to defend the case vigorously.
Refer to discussion in Note 14,
Contingencies
, of the Notes to the Consolidated Financial Statements included herein for information relating to additional legal proceedings.
Item 4. Mine Safety Disclosures.
Not applicable.
12
PART II
|
Item 5.
|
Market for Registrant
’
s Common Equity, Related Stockholder Matters and Issuer Purchases of Equity Securities.
|
Our common stock is listed on the New York Stock Exchange (“NYSE”) under the symbol “AAP”.
At
February 15, 2019
, there were
348
holders of record of our common stock, which does not include the number of beneficial owners whose shares were represented by security position listings.
Our stock repurchase program authorizing the repurchase of up to
$600.0 million
in common stock was authorized by our Board of Directors on August 8, 2018 and publicly announced on August 14, 2018. The following table sets forth information with respect to repurchases of our common stock for the
fourth
quarter ended
December 29, 2018
:
|
Period
|
Total Number
of Shares
Purchased
(1)
|
Average
Price Paid
per Share
(1)
|
Total Number of
Shares Purchased as
Part of Publicly
Announced Plans or
Programs
|
Maximum Dollar
Value that May Yet
Be Purchased
Under the Plans or
Programs
(In thousands)
|
||||||||||
|
October 7, 2018 to November 3, 2018
|
486,728
|
|
$
|
164.53
|
|
486,723
|
|
$
|
400,000
|
|
||||
|
November 4, 2018 to December 1, 2018
|
6,215
|
|
169.44
|
|
—
|
|
400,000
|
|
||||||
|
December 2, 2018 to December 29, 2018
|
470,834
|
|
156.61
|
|
465,085
|
|
327,218
|
|
||||||
|
Total
|
963,777
|
|
$
|
160.69
|
|
951,808
|
|
$
|
327,218
|
|
||||
|
(1)
|
The aggregate cost of repurchasing shares in connection with the net settlement of shares issued as a result of the vesting of restricted stock units was $2.0 million, or an average price of $167.87 per share, during the twelve weeks ended December 29, 2018.
|
13
Stock Price Performance
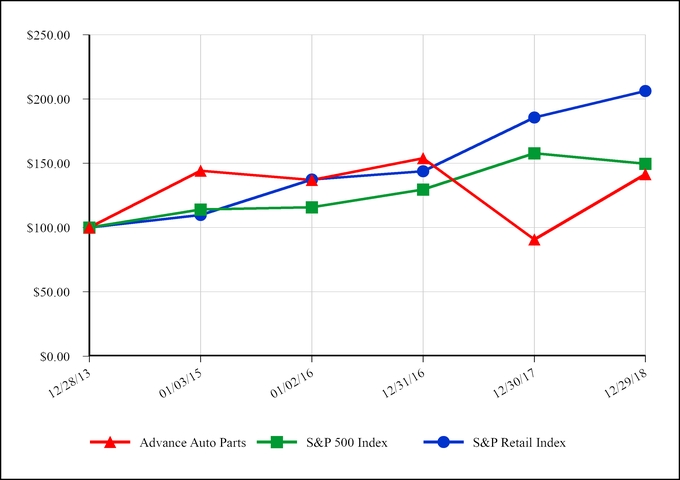
The following graph shows a comparison of the cumulative total return on our common stock, the Standard & Poor’s 500 Index and the Standard & Poor’s Retail Index. The graph assumes that the value of an investment in our common stock and in each such index was $100 on December 28, 2013, and that any dividends have been reinvested. The comparison in the graph below is based solely on historical data and is not intended to forecast the possible future performance of our common stock.
COMPARISON OF CUMULATIVE TOTAL RETURN AMONG
ADVANCE AUTO PARTS, INC., S&P 500 INDEX
AND S&P RETAIL INDEX
|
Company/Index
|
December 28, 2013
|
January 3, 2015
|
January 2, 2016
|
December 31, 2016
|
December 30, 2017
|
December 29, 2018
|
||||||||||||||||||
|
Advance Auto Parts
|
$
|
100.00
|
|
$
|
144.25
|
|
$
|
136.93
|
|
$
|
153.86
|
|
$
|
90.69
|
|
$
|
141.43
|
|
||||||
|
S&P 500 Index
|
$
|
100.00
|
|
$
|
114.11
|
|
$
|
115.71
|
|
$
|
129.55
|
|
$
|
157.84
|
|
$
|
149.63
|
|
||||||
|
S&P Retail Index
|
$
|
100.00
|
|
$
|
109.80
|
|
$
|
137.39
|
|
$
|
143.76
|
|
$
|
185.59
|
|
$
|
206.28
|
|
||||||
14
Item 6.
Selected Consolidated Financial Data.
The following table sets forth our selected historical consolidated statements of operations, balance sheets and other operating data. Included in this table are key metrics and operating results used to measure our financial progress. The selected historical consolidated financial and other data (excluding the Selected Store Data and Performance Measures) as of
December 29, 2018
and
December 30, 2017
and for the years ended
December 29, 2018
,
December 30, 2017
and
December 31, 2016
have been derived from our audited consolidated financial statements and the related notes included elsewhere in this report. The historical consolidated financial and other data as of
December 31, 2016
, January 2, 2016 and January 3, 2015 and for the fiscal years ended January 2, 2016 (“2015”) and January 3, 2015 (“2014”) have been derived from our audited consolidated financial statements and the related notes that have not been included in this report. You should read this data along with “Management’s Discussion and Analysis of Financial Condition and Results of Operations” and our consolidated financial statements and the related notes included elsewhere in this report.
|
(in thousands, except per share data, store data and ratios)
|
Year
(1)
|
||||||||||||||||||
|
2018
|
2017
|
2016
|
2015
|
2014
|
|||||||||||||||
|
Statement of Operations Data:
|
|||||||||||||||||||
|
Net sales
|
$
|
9,580,554
|
|
$
|
9,373,784
|
|
$
|
9,567,679
|
|
$
|
9,737,018
|
|
$
|
9,843,861
|
|
||||
|
Gross profit
|
$
|
4,219,413
|
|
$
|
4,085,049
|
|
$
|
4,255,915
|
|
$
|
4,422,772
|
|
$
|
4,453,613
|
|
||||
|
Operating income
|
$
|
604,275
|
|
$
|
570,212
|
|
$
|
787,598
|
|
$
|
825,780
|
|
$
|
851,710
|
|
||||
|
Net income
(2)
|
$
|
423,847
|
|
$
|
475,505
|
|
$
|
459,622
|
|
$
|
473,398
|
|
$
|
493,825
|
|
||||
|
Basic earnings per common share
|
$
|
5.75
|
|
$
|
6.44
|
|
$
|
6.22
|
|
$
|
6.45
|
|
$
|
6.75
|
|
||||
|
Diluted earnings per common share
|
$
|
5.73
|
|
$
|
6.42
|
|
$
|
6.20
|
|
$
|
6.40
|
|
$
|
6.71
|
|
||||
|
Cash dividends declared per basic share
|
$
|
0.24
|
|
$
|
0.24
|
|
$
|
0.24
|
|
$
|
0.24
|
|
$
|
0.24
|
|
||||
|
Balance Sheet and Other Financial Data:
|
|||||||||||||||||||
|
Total assets
|
$
|
9,040,648
|
|
$
|
8,482,301
|
|
$
|
8,315,033
|
|
$
|
8,127,701
|
|
$
|
7,954,392
|
|
||||
|
Total debt
|
$
|
1,045,930
|
|
$
|
1,044,677
|
|
$
|
10,433,255
|
|
$
|
1,206,895
|
|
$
|
1,628,927
|
|
||||
|
Total stockholders’ equity
|
$
|
3,550,813
|
|
$
|
3,415,196
|
|
$
|
2,916,192
|
|
$
|
2,460,648
|
|
$
|
2,002,912
|
|
||||
|
Selected Store Data and Performance Measures:
|
|||||||||||||||||||
|
Comparable store sales growth
(3)
|
2.3
|
%
|
(2.0
|
%)
|
(1.4
|
%)
|
0.0
|
%
|
2.0
|
%
|
|||||||||
|
Number of stores, beginning of year
|
5,183
|
|
5,189
|
|
5,293
|
|
5,372
|
|
4,049
|
|
|||||||||
|
New stores
|
27
|
|
60
|
|
78
|
|
121
|
|
1,487
|
|
|||||||||
|
Closed stores
|
(101
|
)
|
(66
|
)
|
(182
|
)
|
(200
|
)
|
(164
|
)
|
|||||||||
|
Number of stores, end of year
|
5,109
|
|
5,183
|
|
5,189
|
|
5,293
|
|
5,372
|
|
|||||||||
|
(1)
|
All fiscal years presented are 52 weeks, with the exception of 2014, which consisted of 53 weeks. The impact of week 53 included in sales, gross profit and selling, general and administrative expenses for 2014 was $150.4 million, $67.8 million and $46.7 million.
|
|
(2)
|
Net income for 2018 and 2017 includes an income tax benefit of
$5.7 million
and $143.8 million related to the U.S. Tax Cuts and Jobs Act (the “Act”) that was signed into law on December 22, 2017. Refer to discussion in Note 12,
Income Taxes
, of the Notes to the Consolidated Financial Statements included herein for further information.
|
|
(3)
|
Comparable store sales include net sales from our stores, branches and e-commerce websites. Sales to independently owned Carquest branded stores are excluded from our comparable store sales. The change in store sales is calculated based on the change in net sales starting once a store or branch has been open for 13 complete accounting periods (each period represents four weeks). Relocations are included in comparable store sales from the original date of opening. Acquired stores are included in our comparable store sales once the stores have completed 13 complete accounting periods following the acquisition date (approximately one year). Comparable store sales growth for 2014 excludes sales from the 53
rd
week of 2014.
|
15
Item 7. Management
’
s Discussion and Analysis of Financial Condition and Results of Operations.
The following discussion and analysis of financial condition and results of operations should be read in conjunction with our consolidated historical financial statements and the notes to those statements that appear elsewhere in this report. Our discussion contains forward-looking statements based upon current expectations that involve risks and uncertainties, such as our plans, objectives, expectations and intentions. Actual results and the timing of events could differ materially from those anticipated in these forward-looking statements as a result of a number of factors, including those set forth under the section entitled “Risk Factors” elsewhere in this report.
Management Overview
Net sales increased
2.2%
in 2018, primarily driven by an increase in comparable store sales. We experienced improvement across all regions with stronger sales growth in our Mid-Atlantic, Midwest and Northeast regions, growth in our Professional and Canadian businesses, as well as increased sales in several product categories.
Our gross margin expansion for 2018 was primarily driven by our increase in comparable sales, an improvement in inventory management related to utilizing inventory on hand and continued material cost optimization efforts. These improvements in margin were partially offset by increased supply chain costs due to higher fuel prices and transportation costs.
Our diluted earnings per share in 2018 was
$5.73
compared to
$6.42
in 2017. When adjusted for the following non-operational items, our adjusted diluted earnings per share (“adjusted EPS”) in
2018
was
$7.13
compared to
$5.37
during
2017
:
|
Year Ended
|
||||||||
|
December 29, 2018
|
December 30, 2017
|
|||||||
|
GPI integration and store closure and consolidation expenses
|
$
|
0.07
|
|
$
|
0.22
|
|
||
|
GPI amortization of acquired intangible assets
|
$
|
0.39
|
|
$
|
0.33
|
|
||
|
Transformation expenses
|
$
|
1.02
|
|
$
|
0.41
|
|
||
|
Other income adjustment
|
$
|
—
|
|
$
|
(0.07
|
)
|
||
|
Impact of the Act
|
$
|
(0.08
|
)
|
$
|
(1.94
|
)
|
||
Refer to
“Reconciliation of Non-GAAP Financial Measures”
for further details of our comparable adjustments and the usefulness of such measures to investors.
Summary of
2018
Financial Results
A high-level summary of our financial results and other highlights from
2018
includes:
|
•
|
Net sales during
2018
were
$9,580.6 million
,
an increase
of
2.2%
as compared to
2017
, which primarily related to a comparable store sales
growth
of
2.3%
.
|
|
•
|
Operating income for
2018
was
$604.3 million
,
an increase
of
$34.1 million
from
2017
. As a percentage of total sales, operating income was
6.3%
,
an increase
of
22
basis points as compared to
2017
, due to an increase in comparable store sales, continued material cost improvement and lower GPI integration and store closure and consolidation costs. Partially offsetting these improvements, we incurred an increase in supply chain costs, higher bonus, an increase in costs relating to our transformation plan and an increase in spending related to our new marketing campaign.
|
|
•
|
Inventories as of
December 29, 2018
increase
d
$194.1 million
, or
4.7%
, as compared to
2017
. This increase was driven by our implementation of demand-based assortment, higher purchases to ensure future replenishment capabilities throughout our supply chain and the additional Worlpac branches we opened in
2018
.
|
|
•
|
We generated cash flow from operations of
$811.0 million
during
2018
,
an increase
of
35.0%
compared to
2017
, primarily due to improvements to working capital.
|
|
•
|
Provision for income taxes
increase
d
$86.7 million
to
$131.4 million
in
2018
as compared to
$44.8 million
in
2017
primarily due to a net
$143.8 million
one-time tax benefit associated with the Act that was recorded in
2017
, which was partially offset by the reduction of the federal tax rate from 35% to 21% due to the enactment of the Act.
|
Refer to
“Results of Operations”
and
“Liquidity and Capital Resources”
for further details on our results.
16
Business Update
We continue to make progress on the various elements of our strategic business plan, which is focused on improving the customer experience and driving consistent execution for both Professional and DIY customers. To achieve these improvements, we have undertaken planned transformation actions to help build a foundation for long-term success across the entire company. These transformation actions include:
|
•
|
Improvement of our common catalog of products across our Professional and DIY businesses — AAP, Carquest (“CQ”), Worldpac (“WP”) and Autopart International (“AI”) that was completed in the first half of 2018.
|
|
•
|
Development of a demand-based assortment, leveraging purchase and search history from the common catalog, versus our existing push-down supply approach. This technology is a first step in moving from a supply-driven to a demand-driven assortment.
|
|
•
|
Progress in the early development of a more efficient end-to-end supply chain to deliver our broad assortment.
|
|
•
|
Continued movement towards optimizing our footprint by market to drive share, repurposing of our in-market store and asset base and optimizing our distribution centers.
|
|
•
|
Creation of new Professional omni-channel capabilities to reach our customers in the manner that is most desirable for them, including the launch of MyAdvance.com, an interactive, easy-to-use, mobile-friendly platform where we have combined multiple online tools and capabilities into one place.
|
|
•
|
Entered into strategic partnership with Walmart.com that we expect to enable us to reach a much broader group of DIY customers and help drive our DIY market share growth.
|
|
•
|
Continued focus on Worldpac branch openings in 2018 to drive Professional growth while investing in online and digital to drive DIY improvements.
|
Industry Update
Operating within the automotive aftermarket industry, we are influenced by a number of general macroeconomic factors, many of which are similar to those affecting the overall retail industry. These factors include, but are not limited to:
|
•
|
Fuel costs
|
|
•
|
Unemployment rates
|
|
•
|
Consumer confidence
|
|
•
|
Competition
|
|
•
|
Changes in new car sales
|
|
•
|
Miles driven
|
|
•
|
Vehicle manufacturer warranties
|
|
•
|
Average age of vehicles in operation
|
|
•
|
Economic and political uncertainty
|
|
•
|
Deferral of elective automotive maintenance and improvements in new car quality
|
While these factors tend to fluctuate, we remain confident in the long-term growth prospects for the automotive parts industry.
17
Results of Operations
The following table sets forth certain of our operating data expressed as a percentage of net sales for the periods indicated.
|
Year Ended
|
2018 vs. 2017
$ Change
|
Basis Points
|
2017 vs. 2016
$ Change
|
Basis Points
|
|||||||||||||||||||||||||||
|
(in millions)
|
December 29, 2018
|
December 30, 2017
|
December 31, 2016
|
||||||||||||||||||||||||||||
|
Net sales
|
$
|
9,580.6
|
|
100.0
|
%
|
$
|
9,373.8
|
|
100.0
|
%
|
$
|
9,567.7
|
|
100.0
|
%
|
$
|
206.8
|
|
—
|
|
$
|
(193.9
|
)
|
—
|
|
||||||
|
Cost of sales
|
5,361.1
|
|
56.0
|
|
5,288.7
|
|
56.4
|
|
5,311.8
|
|
55.5
|
|
72.4
|
|
(46
|
)
|
(23.0
|
)
|
90
|
|
|||||||||||
|
Gross profit
|
4,219.4
|
|
44.0
|
|
4,085.0
|
|
43.6
|
|
4,255.9
|
|
44.5
|
|
134.4
|
|
46
|
|
(170.9
|
)
|
(90
|
)
|
|||||||||||
|
SG&A
|
3,615.1
|
|
37.7
|
|
3,514.8
|
|
37.5
|
|
3,468.3
|
|
36.3
|
|
100.3
|
|
24
|
|
46.5
|
|
125
|
|
|||||||||||
|
Operating income
|
604.3
|
|
6.3
|
|
570.2
|
|
6.1
|
|
787.6
|
|
8.2
|
|
34.1
|
|
22
|
|
(217.4
|
)
|
(215
|
)
|
|||||||||||
|
Interest expense
|
(56.6
|
)
|
(0.6
|
)
|
(58.8
|
)
|
(0.6
|
)
|
(59.9
|
)
|
(0.6
|
)
|
2.2
|
|
4
|
|
1.1
|
|
—
|
|
|||||||||||
|
Other income, net
|
7.6
|
|
0.1
|
|
8.8
|
|
0.1
|
|
11.1
|
|
0.1
|
|
(1.3
|
)
|
(2
|
)
|
(2.3
|
)
|
(2
|
)
|
|||||||||||
|
Provision for income taxes
|
131.4
|
|
1.4
|
|
44.8
|
|
0.5
|
|
279.2
|
|
2.9
|
|
86.7
|
|
89
|
|
(234.5
|
)
|
(244
|
)
|
|||||||||||
|
Net income
|
$
|
423.8
|
|
4.4
|
%
|
$
|
475.5
|
|
5.1
|
%
|
$
|
459.6
|
|
4.8
|
%
|
$
|
(51.7
|
)
|
(65
|
)
|
$
|
15.9
|
|
27
|
|
||||||
Note: Table amounts may not foot due to rounding.
2018
Compared to
2017
Net Sales
Net sales for
2018
were
$9,580.6 million
,
an increase
of
$206.8
million, or
2.2%
, from net sales in
2017
. This
increase
was primarily due to our comparable store sales
growth
of
2.3%
. Our
growth
in comparable store sales was driven by an overall improvement across our business in
2018
, growth in our Professional and Canadian businesses, increased sales in several product categories and strong spring and summer selling seasons, partially offset by decreased sales in the winter season resulting from extreme cold temperatures.
Gross Profit
Gross profit for
2018
was
$4,219.4
million, or
44.0%
of net sales, as compared to
$4,085.0
million, or
43.6%
of net sales, in
2017
,
an increase
of
46
basis points. The
increase
in gross profit as a percentage of net sales was primarily the result of an improvement in inventory management related to utilizing inventory on hand and material cost optimization efforts, as well as a continued focus on productivity initiatives throughout the year. These improvements in margin were partially offset by increased supply chain costs due to higher fuel prices and transportation costs.
SG&A
SG&A for
2018
was
$3,615.1
million, or
37.7%
of net sales, as compared to
$3,514.8
million, or
37.5%
of net sales, for
2017
,
an increase
of
24
basis points. This
increase
as a percentage of net sales was primarily due to costs incurred in connection with our transformation plan, higher bonus and increased spending related to our new marketing campaign. Partially offsetting these costs were lower GPI integration and store closure and consolidation and insurance and claims expense in
2018
compared to the prior year, as well as a continued focus on expense management throughout the year.
Income Taxes
Our effective income tax rate was
23.7%
and
8.6%
for
2018
and
2017
. The
increase
in our effective tax rate for
2018
compared to
2017
was primarily related to the net tax benefit of
$143.8 million
related to the Act that was recorded in 2017. This was partially offset by the reduction of the federal tax rate from 35% to 21% due to the enactment of the Act, which favorably impacted our Net income for
2018
by
$77.7 million
, or
$1.05
per diluted share. During the third quarter of 2018 in conjunction with the completion of our 2017 U.S. income tax return, we identified a change in estimate to amounts previously recorded for the remeasurement of the net deferred tax liability and nonrecurring repatriation tax on accumulated earnings of foreign subsidiaries which resulted in a net tax benefit of
$5.7 million
. Our accounting for the impact of the Act under Staff Accounting Bulletin No. 118 (“SAB 118”) was completed as of the third quarter of 2018.
18
2017
Compared to
2016
Net Sales
Net sales for
2017
were
$9,373.8 million
,
a decline
of
$193.9 million
, or
2.0%
, over net sales for
2016
. This
decrease
was primarily due to our comparable store sales
decline
of
2.0%
and the portion of sales that did not transfer from stores that were consolidated. During
2017
, we consolidated 16 stores and closed 50 stores, which was partially offset by the opening of 60 new stores. Our decline in comparable store sales was driven by a decrease in overall transactions in 2017 and mild summer weather conditions, which was partially offset by an increase in the average transaction value and favorable weather in the fourth quarter of the year that drove a stronger demand across the business.
Gross Profit
Gross profit for
2017
was
$4,085.0 million
, or
43.6%
of net sales, as compared to
$4,255.9 million
, or
44.5%
of net sales, in
2016
,
a decrease
of
90
basis points.
The decrease in gross profit as a percentage of net sales was primarily the result of higher supply chain costs driven by unfavorable commodity prices and the negative impact related to the continued inventory optimization efforts, partially offset by continued material cost improvement.
SG&A
SG&A for
2017
was
$3,514.8
million, or
37.5%
of net sales, as compared to
$3,468.3
million, or
36.3%
of net sales, for
2016
,
an increase
of
125
basis points. This increase as a percentage of net sales was primarily due to costs incurred in connection with our transformation plan and higher customer facing costs including store labor and incentives and higher medical costs. Partially offsetting these costs were lower GPI integration and store closure and consolidation expenses in 2017 compared to the prior year and continued focus on expense management throughout the year.
Interest Expense
Interest expense for
2017
was
$58.8 million
, as compared to
$59.9 million
in
2016
. The decrease in interest expense was due to lower outstanding balances of our credit facilities during 2017, as compared to 2016.
Income Taxes
Income tax expense for
2017
was
$44.8 million
, as compared to
$279.2 million
for
2016
. Our effective income tax rate was
8.6%
and
37.8%
for
2017
and
2016
. The decrease in our effective tax rate for 2017 compared to 2016 was primarily due to a net $143.8 million benefit related to the Act.
Reconciliation of Non-GAAP Financial Measures
“Management’s Discussion and Analysis of Financial Condition and Results of Operations”
includes certain financial measures not derived in accordance with accounting principles generally accepted in the United States of America (“GAAP”). Non-GAAP financial measures should not be used as a substitute for GAAP financial measures, or considered in isolation, for the purpose of analyzing our operating performance, financial position or cash flows. We have presented these non-GAAP financial measures as we believe that the presentation of our financial results that exclude (1) non-operational expenses associated with the integration of GPI and store closure and consolidation; (2) non-cash charges related to the acquired GPI intangible assets; (3) transformation expenses under our strategic business plan; and (4) nonrecurring impact of the Act, is useful and indicative of our base operations because the expenses vary from period to period in terms of size, nature and significance and/or relate to the integration of GPI and store closure and consolidation activity in excess of historical levels. These measures assist in comparing our current operating results with past periods and with the operational performance of other companies in our industry. The disclosure of these measures allows investors to evaluate our performance using the same measures management uses in developing internal budgets and forecasts and in evaluating management’s compensation. Included below is a description of the expenses we have determined are not normal, recurring cash operating expenses necessary to operate our business and the rationale for why providing these measures is useful to investors as a supplement to the GAAP measures.
19
GPI Integration and Store Closure and Consolidation Expenses
—We acquired GPI in 2014 and are progressing in our multi-year plan to integrate the operations of GPI with AAP. Due to the size of the acquisition, we consider these expenses to be outside of our base business. Therefore, we believe providing additional information in the form of non-GAAP measures that exclude these costs is beneficial to the users of our financial statements in evaluating the operating performance of our base business and our sustainability once the integration is complete. In addition to integration expenses, we incur store closure and consolidation expenses that consist of expenses associated with our plans to convert and consolidate the Carquest stores acquired from GPI. While periodic store closures are common, these closures represent a significant program outside of our typical market evaluation process. We believe it is useful to provide additional non-GAAP measures that exclude these costs to provide investors greater comparability of our base business and core operating performance. We also continue to have store closures that occur as part of our normal market evaluation process and have not excluded the expenses associated with these store closures in computing our non-GAAP measures.
Transformation Expenses
—We expect to recognize a significant amount of transformation expenses over the next several years as we transition from integration of our AAP/CQUS businesses to a plan that involves a more holistic and integrated transformation of the entire Company, including WP and AI. These expenses will include, but not be limited to, restructuring costs, store closure costs and third-party professional services and other significant costs to integrate and streamline our operating structure across the enterprise. We are focused on several areas throughout Advance, such as supply chain and information technology.
U.S. Tax Reform
—On December 22, 2017, the Act was signed into law. The Act amends the Internal Revenue Code of 1986 by, among other things, permanently lowering the corporate tax rate to 21% from the existing maximum rate of 35%, implementing a territorial tax system and imposing a one-time repatriation tax on deemed repatriated earnings of foreign subsidiaries. During the third quarter of 2018, and in conjunction with the completion of our 2017 U.S. income tax return, we identified a change in estimate, in accordance with SAB 118, to amounts previously estimated for the remeasurement of the net deferred tax liability and nonrecurring repatriation tax on accumulated earnings foreign subsidiaries.
We have included a reconciliation of this information to the most comparable GAAP measures in the following table.
|
Year Ended
|
||||||||
|
(in thousands, except per share data)
|
December 29, 2018
|
December 30, 2017
|
||||||
|
Net income (GAAP)
|
$
|
423,847
|
|
$
|
475,505
|
|
||
|
Cost of sales adjustments:
|
||||||||
|
Transformation expenses
|
6,740
|
|
—
|
|
||||
|
SG&A adjustments:
|
||||||||
|
GPI integration and store closure and consolidation expenses
|
7,360
|
|
26,207
|
|
||||
|
GPI amortization of acquired intangible assets
|
38,018
|
|
39,477
|
|
||||
|
Transformation expenses
|
93,767
|
|
50,425
|
|
||||
|
Other income adjustment
(1)
|
—
|
|
(8,878
|
)
|
||||
|
Provision for income taxes on adjustments
(2)
|
(36,274
|
)
|
(40,748
|
)
|
||||
|
Impact of the Act, net
|
(5,665
|
)
|
(143,756
|
)
|
||||
|
Adjusted net income (Non-GAAP)
|
$
|
527,793
|
|
$
|
398,232
|
|
||
|
Diluted earnings per share (GAAP)
|
$
|
5.73
|
|
$
|
6.42
|
|
||
|
Adjustments, net of tax
|
1.40
|
|
(1.05
|
)
|
||||
|
Adjusted EPS (Non-GAAP)
|
$
|
7.13
|
|
$
|
5.37
|
|
||
|
(1)
|
The adjustment to Other income for
2017
relates to income recognized from an indemnification agreement associated with the acquisition of GPI.
|
|
(2)
|
The income tax impact of non-GAAP adjustments is calculated using the estimated tax rate in effect for the respective non-GAAP adjustments.
|
20
Liquidity and Capital Resources
Overview
Our primary cash requirements necessary to maintain our current operations include payroll and benefits, inventory purchases, contractual obligations, capital expenditures, payment of income taxes and funding of initiatives under our strategic business plan. In addition, we may use available funds for acquisitions, to repay borrowings under our credit agreement, to periodically repurchase shares of our common stock under our stock repurchase programs and for the payment of quarterly cash dividends. Historically, we have funded these requirements primarily through cash generated from operations, supplemented by borrowings under our credit facilities and debt securities as needed. We believe funds generated from our expected results of operations, available cash and cash equivalents, and available borrowing capacity under our credit facility will be sufficient to fund our primary obligations for the next year.
Capital Expenditures
Our primary capital requirements have been the funding of our investments in supply chain and information technology (“IT”), e-commerce and maintenance of existing stores. We lease approximately
84%
of our stores.
Our capital expenditures were
$193.7
million in
2018
,
an increase
of
$4.0 million
from
2017
. This
increase
in capital expenditures related to several IT projects, including our Finance enterprise resource planning tool, as well as investment in supply chain and store improvements.
Our future capital requirements will depend in large part on the timing or number of the investments we make on IT and supply chain network initiatives and existing stores and new store development (leased and owned locations) within a given year. In
2019
, we anticipate that our capital expenditures related to such investments will range from
$250
million to
$300
million, but may vary with business conditions.
Analysis of Cash Flows
The following table summarizes our cash flows from operating, investing and financing activities:
|
|
Year Ended
|
||||||||||
|
(in millions)
|
December 29, 2018
|
December 30, 2017
|
January 2, 2016
|
||||||||
|
Cash flows provided by operating activities
|
$
|
811.0
|
|
$
|
600.8
|
|
$
|
523.3
|
|
||
|
Cash flows used in investing activities
|
(191.8
|
)
|
(178.6
|
)
|
(262.0
|
)
|
|||||
|
Cash flows used in financing activities
|
(263.9
|
)
|
(14.9
|
)
|
(217.1
|
)
|
|||||
|
Effect of exchange rate changes on cash
|
(5.7
|
)
|
4.5
|
|
0.3
|
|
|||||
|
Net increase in cash and cash equivalents
|
$
|
349.6
|
|
$
|
411.8
|
|
$
|
44.4
|
|
||
Operating Activities
For
2018
, net cash provided by operating activities
increase
d
$210.2 million
to
$811.0 million
. The net increase in operating cash flows compared to the prior year was primarily driven by our focus on working capital management, including an increase in Accounts payable, partially offset by increases in Receivables, net and Inventories.
For
2017
, net cash provided by operating activities
increase
d
$77.5 million
to
$600.8 million
. This net increase in operating cash flow was primarily driven by the timing of payments within working capital. Our inventory balance as of December 30, 2017 decreased $157.4 million, or 3.6%, over the prior year primarily driven by the focus on inventory optimization across the Company.
21
Investing Activities
For
2018
, net cash used in investing activities increased by
$13.2 million
to
$191.8 million
compared to
2017
. The increase in cash used in investing activities was primarily driven by an increase in capital expenditures related to several IT projects, including our Finance enterprise resource planning tool, as well as investments in supply chain, e-commerce and store improvements.
For
2017
, net cash used in investing activities decreased by
$83.4 million
to
$178.6 million
compared to
2016
. The decrease in cash used in investing activities was primarily driven by the decrease in cash used for purchases of property and equipment.
Financing Activities
For
2018
, net cash used in financing activities
increase
d by
$249.0 million
to
$263.9 million
. This
increase
was primarily a result of returning cash to shareholders in the form of stock repurchases and dividends.
For
2017
, net cash used in financing activities
decrease
d by
$202.3 million
to
$14.9 million
. This
decrease
was primarily a result of lower net repayments on the revolving credit facility and term loan than in the prior year.
Long-Term Debt
As of
December 29, 2018
, we had a credit rating from Standard & Poor’s of BBB- and from Moody’s Investor Service of Baa2. The current outlooks by Standard & Poor’s and Moody’s are both stable. The current pricing grid used to determine our borrowing rate under our revolving credit facility is based on our credit ratings. If these credit ratings decline, our interest rate on outstanding balances may increase and our access to additional financing on favorable terms may become more limited. In addition, it could reduce the attractiveness of certain vendor payment programs whereby third-party institutions finance arrangements to our vendors based on our credit rating, which could result in increased working capital requirements. Conversely, if these credit ratings improve, our interest rate may decrease.
On January 29, 2019, we notified Wells Fargo Bank, N.A., as trustee, of our intent to redeem all
$300.0
million aggregate principal amount of our outstanding
5.75%
Notes due 2020. For detailed information refer to Note 7,
Long-term Debt and Fair Value of Financial Instruments
, of the Notes to the Consolidated Financial Statements included herein.
Stock Repurchases
On August 8, 2018, the Company's Board of Directors authorized a
$600 million
stock repurchase program. Under this authorization, the Company repurchased
1.7 million
shares of its common stock at an aggregate cost of
$272.8 million
during 2018. We had
$327.2
million remaining under our stock repurchase program as of
December 29, 2018
.
Subsequent to
December 29, 2018
, we have repurchased
0.8 million
shares of common stock at an aggregate cost of
$127.2 million
through our stock repurchase program.
Off-Balance-Sheet Arrangements
As of
December 29, 2018
, other than as disclosed in Note 7,
Long-term Debt and Fair Value of Financial Instruments
, of the Notes to the Consolidated Financial Statements included herein, we had no other off-balance-sheet arrangements. We include other off-balance-sheet arrangements in our Contractual Obligations table including operating lease payments and interest payments on our senior unsecured notes, revolving credit facility and letters of credit outstanding.
22
Contractual Obligations
In addition to our senior unsecured notes and revolving credit facility, we utilize operating leases as another source of financing. The amounts payable under these operating leases are included in our Contractual Obligations table. Our future contractual obligations related to long-term debt, operating leases and other contractual obligations as of
December 29, 2018
were as follows:
|
(in thousands)
|
Payments Due by Period
|
|||||||||||||||||||
|
Contractual Obligations
|
Total
|
Less than 1 Year
|
1 - 3 Years
|
3 - 5 Years
|
More than 5 Years
|
|||||||||||||||
|
Long-term debt
(1)
|
$
|
1,050,210
|
|
$
|
210
|
|
$
|
300,000
|
|
$
|
750,000
|
|
$
|
—
|
|
|||||
|
Interest payments
|
174,375
|
|
51,000
|
|
76,125
|
|
47,250
|
|
—
|
|
||||||||||
|
Operating leases
(2)
|
2,876,275
|
|
520,541
|
|
898,707
|
|
619,586
|
|
837,441
|
|
||||||||||
|
Other long-term liabilities
(3)
|
558,165
|
|
—
|
|
—
|
|
—
|
|
—
|
|
||||||||||
|
Purchase commitments
(4)
|
101,516
|
|
35,276
|
|
34,520
|
|
31,720
|
|
—
|
|
||||||||||
|
$
|
4,760,541
|
|
$
|
607,027
|
|
$
|
1,309,352
|
|
$
|
1,448,556
|
|
$
|
837,441
|
|
||||||
Note: For additional information refer to Note 7,
Long-term Debt and Fair Value of Financial Instruments
; Note 12,
Income Taxes
; Note 13,
Lease Commitments
; Note 14,
Contingencies
; and Note 15,
Benefit Plans
, of the Notes to the Consolidated Financial Statements included herein.
|
(1)
|
Long-term debt represents the principal amount of our senior unsecured notes, which become due in 2020, 2022 and 2023.
|
|
(2)
|
We lease certain store locations, distribution centers, office space, equipment and vehicles. Our property leases generally contain renewal and escalation clauses and other concessions. These provisions are considered in our calculation of our minimum lease payments that are recognized as expense on a straight-line basis over the applicable lease term. Any lease payments that are based upon an existing index or rate are included in our minimum lease payment calculations.
|
|
(3)
|
Includes the long-term portion of deferred income taxes and other liabilities, including self-insurance reserves for which no contractual payment schedule exists. As we expect the payments to occur beyond 12 months from
December 29, 2018
, the related balances have not been reflected in the “Payments Due by Period” section of the table.
|
|
(4)
|
Purchase commitments include agreements to purchase goods or services that are enforceable, legally binding and specify all significant terms, including fixed or minimum quantities to be purchased; fixed, minimum or variable price provisions; and the approximate timing of the transaction. Included in the table above is the lesser of the remaining obligation or the cancellation penalty under the agreement.
|
Critical Accounting Policies
Our financial statements have been prepared in accordance with GAAP. Our discussion and analysis of the financial condition and results of operations are based on these financial statements. The preparation of these financial statements requires the application of accounting policies in addition to certain estimates and judgments by our management. Our estimates and judgments are based on currently available information, historical results and other assumptions we believe are reasonable. Actual results could differ materially from these estimates.
The preparation of our financial statements included the following significant estimates and exercise of judgment.
Goodwill and Indefinite-Lived Intangible Assets
We evaluate goodwill and indefinite-lived intangibles for impairment annually as of the first day of our fourth quarter or whenever events or changes in circumstances indicate the carrying value of the goodwill or other intangible asset may not be recoverable. We test goodwill for impairment at the reporting unit level. Effective in the third quarter of 2017, we realigned our three geographic divisions, which included the operations of the stores operating under the Advance Auto Parts, Carquest and Autopart International trade names, into two U.S. geographic divisions. As a result of this realignment and change in the operating structure of its Carquest Independent and Carquest Canada businesses, we now have five operating segments. As each operating segment represents a reporting unit, goodwill was reassigned to the affected reporting units using a relative fair value approach.
23
Our detailed impairment testing involves comparing the fair value of each reporting unit to its carrying value, including goodwill. If a reporting unit’s fair value has historically significantly exceeded its carrying value, then a risk-based market approach of determining the reporting unit’s fair value is utilized. We use a valuation specialist to determine the fair value for the remaining reporting units. If the fair value exceeds carrying value, we conclude that no goodwill impairment has occurred. If the carrying value of the reporting unit exceeds its fair value, a second step is required to measure possible goodwill impairment loss.
Our indefinite-lived intangible assets primarily consist of the Carquest and Worldpac brands are tested for impairment at the asset group level. Indefinite-lived intangibles are evaluated by comparing the carrying amount of the asset to the future discounted cash flows that the asset is expected to generate. If the fair value based on the future discounted cash flows exceeds the carrying value, we conclude that no intangible asset impairment has occurred. If the carrying value of the indefinite-lived intangible asset exceeds the fair value, we recognize an impairment loss.
We complete our impairment evaluations by combining information from our internal valuation analyses, considering other publicly available market information and using an independent valuation firm. We determine fair value using widely accepted valuation techniques, including discounted cash flows and market multiple analyses. These types of analyses require management to make assumptions as a marketplace participant would and to apply judgment to estimate industry economic factors and the profitability of future business strategies of our Company and our reporting units. These assumptions and estimates are a major component of the derived fair value of our reporting units. Critical assumptions include projected sales growth, gross profit rates, SG&A rates, working capital fluctuations, capital expenditures, discount rates, royalty rates and terminal growth rates. If actual results are not consistent with our estimates or assumptions, we may be exposed to an impairment charge that could be material.
Inventory Reserves
Our inventory consists primarily of parts, batteries, accessories and other products used on vehicles that have reasonably long shelf lives. Although the risk of obsolescence is minimal, we consider whether we may have excess inventory based on our current approach for managing slower moving inventory. We establish reserves when the expected net proceeds are less than carrying value.
Future changes by vendors in their policies or willingness to accept returns of excess inventory, changes in our inventory management approach for excess and obsolete inventory or failure by us to effectively manage the life cycle of our inventory could require us to revise our estimates of required reserves and result in a negative impact on our consolidated statement of operations. A 10% difference in actual inventory reserves at
December 29, 2018
would result in a change in expense of approximately $9.5 million for
2018
.
Self-Insurance Reserves
Our self-insurance reserves consist of the estimated exposure for claims filed, claims incurred but not yet reported and projected future claims, and are established using actuarial methods followed in the insurance industry and our historical claims experience. Specific factors include, but are not limited to, assumptions about health care costs, the severity of accidents and the incidence of illness and the average size of claims. Generally, claims for automobile and general liability and workers’ compensation take several years to settle. We classify the portion of our self-insurance reserves that is not expected to be settled within one year in long-term liabilities.
While we do not expect the amounts ultimately paid to differ significantly from our estimates, our self-insurance reserves and corresponding SG&A could be affected if future claim experience differs significantly from historical trends and actuarial assumptions. A 10% change in our self-insurance liabilities at
December 29, 2018
would result in a change in expense of approximately $15.4 million for
2018
.
Vendor Incentives
We receive incentives in the form of reductions to amounts owed and/or payments from vendors related to volume rebates and other promotional considerations. Many of these incentives are under agreements with terms in excess of one year, while others are negotiated on an annual basis or less. Volume rebates and vendor promotional allowances not offsetting in SG&A are earned based on inventory purchases and initially recorded as a reduction to inventory. These deferred amounts are included as a reduction to cost of sales as the inventory is sold.
24
Vendor promotional allowances provided as a reimbursement of specific, incremental and identifiable costs incurred to promote a vendor’s products are included as an offset to SG&A when the cost is incurred if the fair value of that benefit can be reasonably estimated. Certain of our vendor agreements contain purchase volume incentives that provide for increased funding when graduated purchase volumes are met. Amounts accrued throughout the year could be impacted if actual purchase volumes differ from projected annual purchase volumes.
Similarly, we recognize other promotional incentives earned under long-term agreements as a reduction to cost of sales. However, these incentives are recognized based on the cumulative net purchases as a percentage of total estimated net purchases over the life of the agreement. Short-term incentives with terms less than one year are generally recognized as a reduction to cost of sales over the duration of the agreements.
Amounts received or receivable from vendors that are not yet earned are reflected as deferred revenue. Management’s estimate of the portion of deferred revenue that will be realized within one year of the balance sheet date is included in Other current liabilities. Earned amounts that are receivable from vendors are included in Receivables, net except for that portion expected to be received after one year, which is included in Other assets, net. We regularly review the receivables from vendors to ensure they are able to meet their obligations. Historically, the change in our reserve for receivables related to vendor funding has not been significant.
New Accounting Pronouncements
For a description of recently adopted and issued accounting standards, including the expected dates of adoption and estimated effects, if any, on our consolidated financial statements, see “
Recently Issued Accounting Pronouncements”
in Note 2,
Significant Accounting Policies,
of the Notes to the Consolidated Financial Statements included herein.
Item 7A. Quantitative and Qualitative Disclosures about Market Risks.
We are subject to interest rate risk to the extent we borrow against our revolving credit facility as it is based, at our option, on adjusted LIBOR, plus a margin, or an alternate base rate, plus a margin. As of
December 29, 2018
and
December 30, 2017
, we had
no
borrowings outstanding under our revolving credit facility.
Our financial assets that are exposed to credit risk consist primarily of trade accounts receivable and vendor receivables. We are exposed to normal credit risk from customers. Our concentration of credit risk is limited because our customer base consists of a large number of customers with relatively small balances, which allows the credit risk to be spread across a broad base. We have not historically had significant credit losses.
We are exposed to foreign currency exchange rate fluctuations for the portion of our inventory purchases denominated in foreign currencies. We believe that the price volatility relating to foreign currency exchange rates is partially mitigated by our ability to adjust selling prices. During
2018
,
2017
and 2016, foreign currency transactions did not significantly impact net income.
Item 8. Financial Statements and Supplementary Data.
See financial statements included in Item 15 “
Exhibits, Financial Statement Schedules
” of this annual report.
Item 9. Changes in and Disagreements with Accountants on Accounting and Financial Disclosure.
None.
Item 9A. Controls and Procedures.
Disclosure Controls and Procedures
Disclosure controls and procedures (as that term is defined in Rules 13a-15(e) and 15d-15(e) under the Securities Exchange Act of 1934, as amended (the “Exchange Act”)) are our controls and other procedures that are designed to ensure that information required to be disclosed by us in our reports that we file or submit under the Exchange Act is recorded, processed, summarized and reported within the time periods specified in the SEC’s rules and forms, and that such information is accumulated and communicated to our management, including our principal executive officer and principal financial officer, as appropriate to allow timely decisions regarding required disclosure. Internal controls over financial reporting, no matter how well designed, have inherent limitations, including the possibility of human error and the override of controls. Therefore, even
25
those systems determined to be effective can provide only “reasonable assurance” with respect to the reliability of financial reporting and financial statement preparation and presentation. Further, because of changes in conditions, the effectiveness may vary over time.
Evaluation of Disclosure Controls and Procedures
Our management evaluated, with the participation of our principal executive officer and principal financial officer, the effectiveness of our disclosure controls and procedures as of
December 29, 2018
. Based on this evaluation, our principal executive officer and our principal financial officer have concluded that, as of the end of the period covered by this report, our disclosure controls and procedures were effective to accomplish their objectives at the reasonable assurance level.
Management’s Report on Internal Control over Financial Reporting
Our management is responsible for establishing and maintaining adequate internal control over financial reporting as defined in Rule 13(a) - 15(f) under the Exchange Act. Our internal control over financial reporting is a process designed under the supervision of our principal executive officer and principal financial officer, and effected by our Board of Directors, management and other personnel, to provide “reasonable assurance” regarding the reliability of financial reporting and the preparation of our financial statements for external purposes in accordance with GAAP. Our internal control over financial reporting includes policies and procedures that (1) pertain to the maintenance of records that, in reasonable detail, accurately and fairly reflect the transactions and dispositions of our assets; (2) provide reasonable assurance that transactions are recorded as necessary to permit preparation of financial statements in accordance with GAAP, and that our receipts and expenditures are being made only in accordance with authorizations of our management and directors; and (3) provide “reasonable assurance” regarding prevention or timely detection of unauthorized acquisition, use, or disposition of our assets that could have a material effect on the financial statements.
As of
December 29, 2018
, management, including our principal executive officer and principal financial officer, assessed the effectiveness of the Company’s internal control over financial reporting based on the criteria established in
Internal Control - Integrated Framework (2013)
issued by the Committee of Sponsoring Organizations of the Treadway Commission (COSO). Based on this assessment, management has determined that our internal control over financial reporting as of
December 29, 2018
is effective.
Changes in Internal Control Over Financial Reporting
There were no changes in our internal control over financial reporting (as that term is defined in Rules 13a-15(f) and 15d-15(f) under the Exchange Act) that occurred during the quarter ended
December 29, 2018
that have materially affected, or are reasonably likely to materially affect, our internal control over financial reporting.
Attestation Report of Registered Public Accounting Firm
Our internal control over financial reporting as of
December 29, 2018
has been audited by Deloitte & Touche LLP, an independent registered public accounting firm, which also audited our Consolidated Financial Statements for the year ended
December 29, 2018
, as stated in their report included herein, which expresses an unqualified opinion on the effectiveness of our internal control over financial reporting as of
December 29, 2018
.
Item 9B. Other Information.
Refer to discussion in Note 4,
Exit Activities and Other Initiatives
, of the Notes to the Consolidated Financial Statements included herein.
26
PART III
Item 10.
Directors, Executive Officers and Corporate Governance.
For a discussion of our directors, executive officers and corporate governance, see the information set forth in the sections entitled “Proposal No. 1 - Election of Directors,” “Corporate Governance,” “Meetings and Committees of the Board,” “Information Concerning Our Executive Officers,” “Audit Committee Report,” and “Section 16(a) Beneficial Ownership Reporting Compliance” in our proxy statement for the
2019
annual meeting of stockholders to be filed with the SEC within 120 days after the end of the year ended
December 29, 2018
(the “
2019
Proxy Statement”), which is incorporated herein by reference.
Item 11. Executive Compensation
.
See the information set forth in the sections entitled “Meetings and Committees of the Board,” “Compensation Committee Report,” “Compensation Discussion and Analysis,” “Additional Information Regarding Executive Compensation” and “Director Compensation” in the
2019
Proxy Statement, which is incorporated herein by reference.
Item 12. Security Ownership of Certain Beneficial Owners and Management and Related Stockholder Matters
.
See the information set forth in the sections entitled “Equity Compensation Plan Information Table” and “Security Ownership of Certain Beneficial Owners and Management” in the
2019
Proxy Statement, which is incorporated herein by reference.
Item 13. Certain Relationships and Related Transactions, and Director Independence
.
See the information set forth in the sections entitled “Corporate Governance” and “Meetings and Committees of the Board” in the
2019
Proxy Statement, which is incorporated herein by reference.
Item 14. Principal Accountant Fees and Services
.
See the information set forth in the section entitled “2018 and 2017 Audit Fees” in the
2019
Proxy Statement, which is incorporated herein by reference.
27
PART IV
Item 15.
Exhibits, Financial Statement Schedules.
|
(a)(1) Financial Statements
|
||
|
Audited Consolidated Financial Statements of Advance Auto Parts, Inc. and Subsidiaries for the years ended December 29, 2018, December 30, 2017 and December 31, 2016:
|
||
|
(2) Financial Statement Schedule
|
||
|
(3) Exhibits
|
||
28
REPORT OF INDEPENDENT REGISTERED PUBLIC ACCOUNTING FIRM
To the stockholders and the Board of Directors of Advance Auto Parts, Inc.
Opinion on the Financial Statements
We have audited the accompanying consolidated balance sheets of Advance Auto Parts, Inc. and subsidiaries (the "Company") as of December 29, 2018 and December 30, 2017, the related consolidated statements of operations, comprehensive income, changes in stockholders' equity, and cash flows for each of the three years in the period ended December 29, 2018, and the related notes and the schedule listed in the Index at Item 15 (collectively referred to as the "financial statements"). In our opinion, the financial statements present fairly, in all material respects, the financial position of the Company as of December 29, 2018 and December 30, 2017, and the results of its operations and its cash flows for each of the three years in the period ended December 29, 2018, in conformity with accounting principles generally accepted in the United States of America.
We have also audited, in accordance with the standards of the Public Company Accounting Oversight Board (United States) (PCAOB), the Company's internal control over financial reporting as of December 29, 2018, based on criteria established in
Internal Control - Integrated Framework (2013)
issued by the Committee of Sponsoring Organizations of the Treadway Commission and our report dated
February 19, 2019
, expressed an unqualified opinion on the Company's internal control over financial reporting.
Basis for Opinion
These financial statements are the responsibility of the Company's management. Our responsibility is to express an opinion on the Company's financial statements based on our audits. We are a public accounting firm registered with the PCAOB and are required to be independent with respect to the Company in accordance with the U.S. federal securities laws and the applicable rules and regulations of the Securities and Exchange Commission and the PCAOB.
We conducted our audits in accordance with the standards of the PCAOB. Those standards require that we plan and perform the audit to obtain reasonable assurance about whether the financial statements are free of material misstatement, whether due to error or fraud. Our audits included performing procedures to assess the risks of material misstatement of the financial statements, whether due to error or fraud, and performing procedures that respond to those risks. Such procedures included examining, on a test basis, evidence regarding the amounts and disclosures in the financial statements. Our audits also included evaluating the accounting principles used and significant estimates made by management, as well as evaluating the overall presentation of the financial statements. We believe that our audits provide a reasonable basis for our opinion.
/s/ Deloitte & Touche LLP
Charlotte, North Carolina
February 19, 2019
We have served as the Company’s auditor since 2002.
29
REPORT OF INDEPENDENT REGISTERED PUBLIC ACCOUNTING FIRM
To the stockholders and the Board of Directors of Advance Auto Parts, Inc.
Opinion on Internal Control over Financial Reporting
We have audited the internal control over financial reporting of Advance Auto Parts, Inc. and subsidiaries (the “Company”) as of December 29, 2018, based on criteria established in
Internal Control - Integrated Framework (2013)
issued by the Committee of Sponsoring Organizations of the Treadway Commission (COSO). In our opinion, the Company maintained, in all material respects, effective internal control over financial reporting as of December 29, 2018, based on criteria established in
Internal Control - Integrated Framework (2013)
issued by COSO.
We have also audited, in accordance with the standards of the Public Company Accounting Oversight Board (United States) (PCAOB), the consolidated financial statements and financial statement schedule as of and for the year ended December 29, 2018, of the Company and our report dated
February 19, 2019
, expressed an unqualified opinion on those consolidated financial statements and financial statement schedule.
Basis for Opinion
The Company's management is responsible for maintaining effective internal control over financial reporting and for its assessment of the effectiveness of internal control over financial reporting, included in the accompanying
Management's Report on Internal Control over Financial Reporting
. Our responsibility is to express an opinion on the Company's internal control over financial reporting based on our audit. We are a public accounting firm registered with the PCAOB and are required to be independent with respect to the Company in accordance with the U.S. federal securities laws and the applicable rules and regulations of the Securities and Exchange Commission and the PCAOB.
We conducted our audit in accordance with the standards of the PCAOB. Those standards require that we plan and perform the audit to obtain reasonable assurance about whether effective internal control over financial reporting was maintained in all material respects. Our audit included obtaining an understanding of internal control over financial reporting, assessing the risk that a material weakness exists, testing and evaluating the design and operating effectiveness of internal control based on the assessed risk, and performing such other procedures as we considered necessary in the circumstances. We believe that our audit provides a reasonable basis for our opinion.
Definition and Limitations of Internal Control over Financial Reporting
A company’s internal control over financial reporting is a process designed to provide reasonable assurance regarding the reliability of financial reporting and the preparation of financial statements for external purposes in accordance with generally accepted accounting principles. A company’s internal control over financial reporting includes those policies and procedures that (1) pertain to the maintenance of records that, in reasonable detail, accurately and fairly reflect the transactions and dispositions of the assets of the company; (2) provide reasonable assurance that transactions are recorded as necessary to permit preparation of financial statements in accordance with generally accepted accounting principles, and that receipts and expenditures of the company are being made only in accordance with authorizations of management and directors of the company; and (3) provide reasonable assurance regarding prevention or timely detection of unauthorized acquisition, use, or disposition of the company’s assets that could have a material effect on the financial statements.
Because of its inherent limitations, internal control over financial reporting may not prevent or detect misstatements. Also, projections of any evaluation of effectiveness to future periods are subject to the risk that controls may become inadequate because of changes in conditions, or that the degree of compliance with the policies or procedures may deteriorate.
/s/ Deloitte & Touche LLP
Charlotte, North Carolina
February 19, 2019
30
Advance Auto Parts, Inc. and Subsidiaries
Consolidated Balance Sheets
(in thousands, except per share data)
|
|
December 29, 2018
|
December 30, 2017
|
|||||
|
Assets
|
|||||||
|
Current assets:
|
|
|
|||||
|
Cash and cash equivalents
|
$
|
896,527
|
|
$
|
546,937
|
|
|
|
Receivables, net
|
624,972
|
|
606,357
|
|
|||
|
Inventories
|
4,362,547
|
|
4,168,492
|
|
|||
|
Other current assets
|
198,408
|
|
105,106
|
|
|||
|
Total current assets
|
6,082,454
|
|
5,426,892
|
|
|||
|
Property and equipment, net of accumulated depreciation of $1,918,502 and $1,783,383
|
1,368,985
|
|
1,394,138
|
|
|||
|
Goodwill
|
990,237
|
|
994,293
|
|
|||
|
Intangible assets, net
|
550,593
|
|
597,674
|
|
|||
|
Other assets, net
|
48,379
|
|
69,304
|
|
|||
|
|
$
|
9,040,648
|
|
$
|
8,482,301
|
|
|
|
Liabilities and Stockholders’ Equity
|
|
|
|
|
|||
|
Current liabilities:
|
|
|
|
|
|||
|
Accounts payable
|
$
|
3,172,790
|
|
$
|
2,894,582
|
|
|
|
Accrued expenses
|
623,141
|
|
533,548
|
|
|||
|
Other current liabilities
|
90,019
|
|
51,967
|
|
|||
|
Total current liabilities
|
3,885,950
|
|
3,480,097
|
|
|||
|
Long-term debt
|
1,045,720
|
|
1,044,327
|
|
|||
|
Deferred income taxes
|
318,353
|
|
303,620
|
|
|||
|
Other long-term liabilities
|
239,812
|
|
239,061
|
|
|||
|
Commitments and contingencies
|
|
|
|
|
|||
|
Stockholders’ equity:
|
|
|
|
|
|||
|
Preferred stock, nonvoting, $0.0001 par value,
|
|||||||
|
10,000 shares authorized; no shares issued or outstanding
|
—
|
|
—
|
|
|||
|
Common stock, voting, $0.0001 par value, 200,000 shares authorized;
|
|||||||
|
75,831 shares issued and 72,460 outstanding at December 29, 2018
|
|||||||
|
75,569 shares issued and 73,936 outstanding at December 30, 2017
|
8
|
|
8
|
|
|||
|
Additional paid-in capital
|
694,797
|
|
664,646
|
|
|||
|
Treasury stock, at cost, 3,371 and 1,633 shares
|
(425,954
|
)
|
(144,600
|
)
|
|||
|
Accumulated other comprehensive loss
|
(44,193
|
)
|
(24,954
|
)
|
|||
|
Retained earnings
|
3,326,155
|
|
2,920,096
|
|
|||
|
Total stockholders’ equity
|
3,550,813
|
|
3,415,196
|
|
|||
|
|
$
|
9,040,648
|
|
$
|
8,482,301
|
|
|
The accompanying notes to the consolidated financial statements
are an integral part of these statements.
31
Advance Auto Parts, Inc. and Subsidiaries
Consolidated Statements of Operations
(in thousands, except per share data)
|
Year Ended
|
|||||||||||
|
December 29, 2018
|
December 30, 2017
|
December 31, 2016
|
|||||||||
|
Net sales
|
$
|
9,580,554
|
|
$
|
9,373,784
|
|
$
|
9,567,679
|
|
||
|
Cost of sales,
including purchasing and warehousing costs
|
5,361,141
|
|
5,288,735
|
|
5,311,764
|
|
|||||
|
Gross profit
|
4,219,413
|
|
4,085,049
|
|
4,255,915
|
|
|||||
|
Selling, general and administrative expenses
|
3,615,138
|
|
3,514,837
|
|
3,468,317
|
|
|||||
|
Operating income
|
604,275
|
|
570,212
|
|
787,598
|
|
|||||
|
Other, net:
|
|
|
|||||||||
|
Interest expense
|
(56,588
|
)
|
(58,801
|
)
|
(59,910
|
)
|
|||||
|
Other income, net
|
7,577
|
|
8,848
|
|
11,147
|
|
|||||
|
Total other, net
|
(49,011
|
)
|
(49,953
|
)
|
(48,763
|
)
|
|||||
|
Income before provision for income taxes
|
555,264
|
|
520,259
|
|
738,835
|
|
|||||
|
Provision for income taxes
|
131,417
|
|
44,754
|
|
279,213
|
|
|||||
|
Net income
|
$
|
423,847
|
|
$
|
475,505
|
|
$
|
459,622
|
|
||
|
Basic earnings per common share
|
$
|
5.75
|
|
$
|
6.44
|
|
$
|
6.22
|
|
||
|
Weighted average common shares outstanding
|
73,728
|
|
73,846
|
|
73,562
|
|
|||||
|
Diluted earnings per common share
|
$
|
5.73
|
|
$
|
6.42
|
|
$
|
6.20
|
|
||
|
Weighted average common shares outstanding
|
73,991
|
|
74,110
|
|
73,856
|
|
|||||
Consolidated Statements of Comprehensive Income
(in thousands)
|
|
Year Ended
|
||||||||||
|
December 29, 2018
|
December 30, 2017
|
December 31, 2016
|
|||||||||
|
Net income
|
$
|
423,847
|
|
$
|
475,505
|
|
$
|
459,622
|
|
||
|
Other comprehensive (loss) income:
|
|||||||||||
|
Changes in net unrecognized other postretirement benefit costs, net of tax of $103, $126 and $346
|
(294
|
)
|
(194
|
)
|
(534
|
)
|
|||||
|
Currency translation adjustments
|
(18,945
|
)
|
14,941
|
|
4,892
|
|
|||||
|
Total other comprehensive (loss) income
|
(19,239
|
)
|
14,747
|
|
4,358
|
|
|||||
|
Comprehensive income
|
$
|
404,608
|
|
$
|
490,252
|
|
$
|
463,980
|
|
||
The accompanying notes to the consolidated financial statements
are an integral part of these statements.
32
|
Advance Auto Parts, Inc. and Subsidiaries
Consolidated Statements of Changes in Stockholders’ Equity
(in thousands, except per share data)
|
||||||||||||||||||||||||||
|
|
Common Stock
|
Additional
Paid-in Capital
|
Treasury Stock, at cost
|
Accumulated Other
Comprehensive Loss
|
Retained Earnings
|
Total Stockholders’ Equity
|
||||||||||||||||||||
|
|
Shares
|
Amount
|
||||||||||||||||||||||||
|
Balance, January 2, 2016
|
73,314
|
|
$
|
7
|
|
$
|
603,332
|
|
$
|
(119,709
|
)
|
$
|
(44,059
|
)
|
$
|
2,021,077
|
|
$
|
2,460,648
|
|
||||||
|
Net income
|
—
|
|
—
|
|
—
|
|
—
|
|
—
|
|
459,622
|
|
459,622
|
|
||||||||||||
|
Total other comprehensive loss
|
—
|
|
—
|
|
—
|
|
—
|
|
4,358
|
|
—
|
|
4,358
|
|
||||||||||||
|
Issuance of shares upon the exercise of stock appreciation rights
|
149
|
|
1
|
|
—
|
|
—
|
|
—
|
|
—
|
|
1
|
|
||||||||||||
|
Tax withholdings related to the exercise of stock appreciation rights
|
—
|
|
—
|
|
(19,558
|
)
|
—
|
|
—
|
|
—
|
|
(19,558
|
)
|
||||||||||||
|
Tax benefit from share-based compensation, net
|
—
|
|
—
|
|
22,325
|
|
—
|
|
—
|
|
—
|
|
22,325
|
|
||||||||||||
|
Restricted stock, restricted stock units and deferred stock units vested
|
372
|
|
—
|
|
—
|
|
—
|
|
—
|
|
—
|
|
—
|
|
||||||||||||
|
Share-based compensation
|
—
|
|
—
|
|
20,422
|
|
—
|
|
—
|
|
—
|
|
20,422
|
|
||||||||||||
|
Stock issued under employee stock purchase plan
|
30
|
|
—
|
|
4,369
|
|
—
|
|
—
|
|
—
|
|
4,369
|
|
||||||||||||
|
Repurchase of common stock
|
(116
|
)
|
—
|
|
—
|
|
(18,393
|
)
|
—
|
|
—
|
|
(18,393
|
)
|
||||||||||||
|
Cash dividends declared ($0.24 per common share)
|
—
|
|
—
|
|
—
|
|
—
|
|
—
|
|
(17,764
|
)
|
(17,764
|
)
|
||||||||||||
|
Other
|
—
|
|
—
|
|
162
|
|
—
|
|
—
|
|
—
|
|
162
|
|
||||||||||||
|
Balance, December 31, 2016
|
73,749
|
|
8
|
|
631,052
|
|
(138,102
|
)
|
(39,701
|
)
|
2,462,935
|
|
2,916,192
|
|
||||||||||||
|
Net income
|
—
|
|
—
|
|
—
|
|
—
|
|
—
|
|
475,505
|
|
475,505
|
|
||||||||||||
|
Cumulative effect of accounting change from adoption of ASU 2016-09
|
—
|
|
—
|
|
782
|
|
—
|
|
—
|
|
(490
|
)
|
292
|
|
||||||||||||
|
Total other comprehensive loss
|
—
|
|
—
|
|
—
|
|
—
|
|
14,747
|
|
—
|
|
14,747
|
|
||||||||||||
|
Issuance of shares upon the exercise of stock appreciation rights
|
67
|
|
—
|
|
—
|
|
—
|
|
—
|
|
—
|
|
—
|
|
||||||||||||
|
Tax withholdings related to the exercise of stock appreciation rights
|
—
|
|
—
|
|
(6,531
|
)
|
—
|
|
—
|
|
—
|
|
(6,531
|
)
|
||||||||||||
|
Restricted stock units and deferred stock units vested
|
147
|
|
—
|
|
—
|
|
—
|
|
—
|
|
—
|
|
—
|
|
||||||||||||
|
Share-based compensation
|
—
|
|
—
|
|
35,267
|
|
—
|
|
—
|
|
—
|
|
35,267
|
|
||||||||||||
|
Stock issued under employee stock purchase plan
|
29
|
|
—
|
|
4,053
|
|
—
|
|
—
|
|
—
|
|
4,053
|
|
||||||||||||
|
Repurchase of common stock
|
(56
|
)
|
—
|
|
—
|
|
(6,498
|
)
|
—
|
|
—
|
|
(6,498
|
)
|
||||||||||||
|
Cash dividends declared ($0.24 per common share)
|
—
|
|
—
|
|
—
|
|
—
|
|
—
|
|
(17,854
|
)
|
(17,854
|
)
|
||||||||||||
|
Other
|
—
|
|
—
|
|
23
|
|
—
|
|
—
|
|
—
|
|
23
|
|
||||||||||||
|
Balance, December 30, 2017
|
73,936
|
|
8
|
|
664,646
|
|
(144,600
|
)
|
(24,954
|
)
|
2,920,096
|
|
3,415,196
|
|
||||||||||||
|
Net income
|
—
|
|
—
|
|
—
|
|
—
|
|
—
|
|
423,847
|
|
423,847
|
|
||||||||||||
|
Total other comprehensive loss
|
—
|
|
—
|
|
—
|
|
—
|
|
(19,239
|
)
|
—
|
|
(19,239
|
)
|
||||||||||||
|
Issuance of shares upon the exercise of stock appreciation rights
|
11
|
|
—
|
|
—
|
|
—
|
|
—
|
|
—
|
|
—
|
|
||||||||||||
|
Tax withholdings related to the exercise of stock appreciation rights
|
—
|
|
—
|
|
(773
|
)
|
—
|
|
—
|
|
—
|
|
(773
|
)
|
||||||||||||
|
Restricted stock units and deferred stock units vested
|
215
|
|
—
|
|
—
|
|
—
|
|
—
|
|
—
|
|
—
|
|
||||||||||||
|
Share-based compensation
|
—
|
|
—
|
|
27,760
|
|
—
|
|
—
|
|
—
|
|
27,760
|
|
||||||||||||
|
Stock issued under employee stock purchase plan
|
36
|
|
—
|
|
3,200
|
|
—
|
|
—
|
|
—
|
|
3,200
|
|
||||||||||||
|
Repurchase of common stock
|
(1,738
|
)
|
—
|
|
—
|
|
(281,354
|
)
|
—
|
|
—
|
|
(281,354
|
)
|
||||||||||||
|
Cash dividends declared ($0.24 per common share)
|
—
|
|
—
|
|
—
|
|
—
|
|
—
|
|
(17,788
|
)
|
(17,788
|
)
|
||||||||||||
|
Other
|
—
|
|
—
|
|
(36
|
)
|
—
|
|
—
|
|
—
|
|
(36
|
)
|
||||||||||||
|
Balance, December 29, 2018
|
72,460
|
|
$
|
8
|
|
$
|
694,797
|
|
$
|
(425,954
|
)
|
$
|
(44,193
|
)
|
$
|
3,326,155
|
|
$
|
3,550,813
|
|
||||||
The accompanying notes to the consolidated financial statements
are an integral part of these statements.
33
|
Advance Auto Parts, Inc. and Subsidiaries
Consolidated Statements of
Cash Flows
(in thousands) |
|||||||||||
|
|
Year Ended
|
||||||||||
|
December 29, 2018
|
December 30, 2017
|
December 31, 2016
|
|||||||||
|
Cash flows from operating activities:
|
|||||||||||
|
Net income
|
$
|
423,847
|
|
$
|
475,505
|
|
$
|
459,622
|
|
||
|
Adjustments to reconcile net income to net cash provided by operating activities:
|
|||||||||||
|
Depreciation and amortization
|
238,184
|
|
249,260
|
|
258,387
|
|
|||||
|
Share-based compensation
|
27,760
|
|
35,267
|
|
20,452
|
|
|||||
|
Loss and impairment of long-lived assets
|
15,956
|
|
17,106
|
|
5,999
|
|
|||||
|
Other, net
|
2,195
|
|
3,123
|
|
(2,039
|
)
|
|||||
|
Provision (benefit) for deferred income taxes
|
15,956
|
|
(151,263
|
)
|
20,213
|
|
|||||
|
Net change in:
|
|||||||||||
|
Receivables, net
|
(21,471
|
)
|
36,047
|
|
(41,642
|
)
|
|||||
|
Inventories
|
(206,125
|
)
|
167,548
|
|
(144,603
|
)
|
|||||
|
Accounts payable
|
285,493
|
|
(197,168
|
)
|
(119,325
|
)
|
|||||
|
Accrued expenses
|
93,940
|
|
(13,295
|
)
|
49,341
|
|
|||||
|
Other assets and liabilities, net
|
(64,707
|
)
|
(21,325
|
)
|
16,898
|
|
|||||
|
Net cash provided by operating activities
|
811,028
|
|
600,805
|
|
523,303
|
|
|||||
|
Cash flows from investing activities:
|
|
|
|
|
|||||||
|
Purchases of property and equipment
|
(193,715
|
)
|
(189,758
|
)
|
(259,559
|
)
|
|||||
|
Proceeds from sales of property and equipment
|
1,888
|
|
11,099
|
|
2,212
|
|
|||||
|
Other, net
|
—
|
|
20
|
|
(4,697
|
)
|
|||||
|
Net cash used in investing activities
|
(191,827
|
)
|
(178,639
|
)
|
(262,044
|
)
|
|||||
|
Cash flows from financing activities:
|
|
|
|
|
|||||||
|
Increase (decrease) in bank overdrafts
|
32,014
|
|
14,004
|
|
(5,573
|
)
|
|||||
|
Borrowings under credit facilities
|
—
|
|
534,400
|
|
799,600
|
|
|||||
|
Payments on credit facilities
|
—
|
|
(534,400
|
)
|
(959,600
|
)
|
|||||
|
Dividends paid
|
(17,819
|
)
|
(17,854
|
)
|
(17,738
|
)
|
|||||
|
Proceeds from the issuance of common stock
|
3,200
|
|
4,076
|
|
4,532
|
|
|||||
|
Tax withholdings related to the exercise of stock appreciation rights
|
(773
|
)
|
(6,531
|
)
|
(19,558
|
)
|
|||||
|
Repurchase of common stock
|
(281,354
|
)
|
(6,498
|
)
|
(18,393
|
)
|
|||||
|
Other, net
|
817
|
|
(2,069
|
)
|
(390
|
)
|
|||||
|
Net cash used in financing activities
|
(263,915
|
)
|
(14,872
|
)
|
(217,120
|
)
|
|||||
|
Effect of exchange rate changes on cash
|
(5,696
|
)
|
4,465
|
|
257
|
|
|||||
|
Net increase in cash and cash equivalents
|
349,590
|
|
411,759
|
|
44,396
|
|
|||||
|
Cash and cash equivalents
, beginning of period
|
546,937
|
|
135,178
|
|
90,782
|
|
|||||
|
Cash and cash equivalents
, end of period
|
$
|
896,527
|
|
$
|
546,937
|
|
$
|
135,178
|
|
||
|
Supplemental cash flow information:
|
|||||||||||
|
Interest paid
|
$
|
45,322
|
|
$
|
53,509
|
|
$
|
55,457
|
|
||
|
Income tax payments
|
$
|
143,213
|
|
$
|
192,116
|
|
$
|
225,327
|
|
||
|
Non-cash transactions:
|
|||||||||||
|
Accrued purchases of property and equipment
|
$
|
15,365
|
|
$
|
14,335
|
|
$
|
21,176
|
|
||
The accompanying notes to the consolidated financial statements
are an integral part of these statements.
34
|
1.
|
Nature of Operations and Basis of Presentation:
|
Description of Business
Advance Auto Parts, Inc. and subsidiaries is a leading automotive aftermarket parts provider in North America, serving both professional installers, or Professional, and “do-it-yourself,” or DIY customers. The accompanying consolidated financial statements have been prepared by us and include the accounts of Advance Auto Parts, Inc., its wholly owned subsidiary, Advance Stores Company, Incorporated (“Advance Stores”), and its subsidiaries (collectively referred to as “Advance,” “we,” “us,” or “our”).
As of
December 29, 2018
, our operations are comprised of
4,966
stores and
143
distribution branches primarily within the United States, with additional locations in Canada, Puerto Rico and the U.S. Virgin Islands. Our stores operate primarily under the trade names “Advance Auto Parts,” “Carquest” and “Autopart International,” and our distribution branches operate under the “Worldpac” trade name. In addition, we served
1,231
independently owned Carquest branded stores across the same geographic locations served by our stores in addition to Mexico, the Bahamas, Turks and Caicos, the British Virgin Islands and the Pacific Islands.
Accounting Period
Our fiscal year ends on the Saturday nearest the end of December. All references herein for the years “
2018
,” “
2017
” and “
2016
” represent the fiscal years ended
December 29, 2018
,
December 30, 2017
and
December 31, 2016
, which were all 52 weeks.
Basis of Presentation
The consolidated financial statements include the accounts of Advance and its wholly owned subsidiaries prepared in accordance with accounting principles generally accepted in the United States of America (“GAAP”). All intercompany balances and transactions have been eliminated in consolidation.
Use of Estimates
The preparation of financial statements in conformity with GAAP requires management to make estimates and assumptions that affect the reported amounts of assets and liabilities and the disclosure of contingent assets and liabilities at the date of the financial statements and the reported amounts of revenues and expenses during the reporting period. Actual results could differ materially from those estimates.
|
2.
|
Significant Accounting Policies:
|
Cash and Cash Equivalents
Cash and cash equivalents consist of cash in banks and money market funds with original maturities of three months or less. Also included in cash equivalents are credit card and debit card receivables from banks, which generally settle in less than four business days.
Inventory
Our inventory consists primarily of parts, batteries, accessories and other products used on vehicles that have reasonably long shelf lives and is stated at the lower of cost or market. The cost of our merchandise inventory is primarily determined using the last-in, first-out (“LIFO”) method. Under the LIFO method, our cost of sales reflects the costs of the most recently purchased inventories, while the inventory carrying balance represents the costs relating to prices paid in
2018
and prior years. We regularly review inventory quantities on-hand, consider whether we may have excess inventory based on our current approach for managing slower moving inventory and adjusts the carrying value as necessary.
35
Vendor Incentives
We receive incentives in the form of reductions to amounts owed to and/or payments from vendors related to volume rebates and other promotional considerations. Many of these incentives are under long-term agreements in excess of one year, while others are negotiated on an annual basis or shorter. Advertising allowances provided as a reimbursement of specific, incremental and identifiable costs incurred to promote a vendor’s products are included as an offset to selling, general and administrative expenses (“SG&A”) when the cost is incurred. Volume rebates and allowances that do not meet the requirements for offsetting in SG&A are recorded as a reduction to inventory as they are earned based on inventory purchases. Total deferred vendor incentives included as a reduction of Inventories were
$164.1 million
and
$179.2 million
as of
December 29, 2018
and
December 30, 2017
.
We recognize other promotional incentives earned under long-term agreements not specifically related to volume of purchases as a reduction to cost of sales. However, these incentives are not deferred as a reduction of inventory and are recognized based on the cumulative net purchases as a percentage of total estimated net purchases over the life of the agreement. Short-term incentives with terms less than one year are generally recognized as a reduction to cost of sales over the duration of the agreements. Amounts received or receivable from vendors that are not yet earned are reflected as deferred revenue in the accompanying consolidated balance sheets.
Property and Equipment
Property and equipment are stated at cost less accumulated depreciation. Expenditures for maintenance and repairs are charged directly to expense when incurred; major improvements are capitalized. When items are sold or retired, the related cost and accumulated depreciation are removed from the account balances, with any gain or loss reflected in the consolidated statements of operations.
Depreciation of land improvements, buildings, furniture, fixtures and equipment, and vehicles is provided over the estimated useful lives of the respective assets using the straight-line method. Depreciation of building and leasehold improvements is provided over the shorter of the original useful lives of the respective assets or the term of the lease using the straight-line method.
Goodwill and Indefinite-Lived Intangible Assets
We perform our evaluation for the impairment of goodwill and indefinite-lived intangible assets for our reporting units annually as of the first day of the fourth quarter, or when indications of potential impairment exist. These indicators would include a significant change in operating performance, the business climate, legal factors, competition, or a planned sale or disposition of a significant portion of the business, among other factors. We assess qualitative factors such as current company performance and overall economic factors to determine if it is more-likely-than-not that the goodwill might be impaired and whether it is necessary to perform the step one quantitative goodwill impairment test. In the quantitative goodwill test, we compare the carrying value of a reporting unit to its fair value. If the carrying value of the reporting unit exceeds the estimated fair value, a second step is performed, which compares the implied fair value of goodwill to the carrying value, to determine the amount of impairment. Our indefinite-lived intangible assets are tested for impairment at the asset group level. Indefinite-lived intangibles are evaluated by comparing the carrying amount of the asset to the future discounted cash flows that the asset is expected to generate. If the fair value based on the future discounted cash flows exceeds the carrying value, we conclude that no intangible asset impairment has occurred. If the carrying value of the indefinite-lived intangible asset exceeds the fair value, we recognize an impairment loss.
Effective in the third quarter of 2017, we realigned our three geographic divisions, which included the operations of the stores operating under the Advance Auto Parts, Carquest and Autopart International trade names, into two U.S. geographic divisions. As a result of this realignment and change in the operating structure of its Carquest Independent and Carquest Canada businesses, we now have five operating segments, and defined them as “Northern Division,” “Southern Division,” “Carquest Canada,” “Independents” and “Worldpac.” As each operating segment represents a reporting unit, goodwill was reassigned to the affected reporting units using a relative fair value approach.
36
Valuation of Long-Lived Assets
We evaluate the recoverability of our long-lived assets, including finite-lived intangible assets, whenever events or changes in circumstances indicate that the carrying amount of an asset might not be recoverable and exceeds its fair value. When such an event occurs, we estimate the undiscounted future cash flows expected to result from the use of the long-lived asset or asset group and its eventual disposition. These impairment evaluations involve estimates of asset useful lives and future cash flows. If the undiscounted expected future cash flows are less than the carrying amount of the asset and the carrying amount of the asset exceeds its fair value, an impairment loss is recognized. When an impairment loss is recognized, the carrying amount of the asset is reduced to its estimated fair value based on quoted market prices or other valuation techniques (e.g., discounted cash flow analysis).
Self-Insurance
We are self-insured for general and automobile liability, workers’ compensation and health care claims of its employees, or Team Members, while maintaining stop-loss coverage with third-party insurers to limit its total liability exposure. Expenses associated with these liabilities are calculated for (i) claims filed, (ii) claims incurred but not yet reported and (iii) projected future claims using actuarial methods followed in the insurance industry as well as our historical claims experience. We include the current and long-term portions of its self-insurance reserves in Accrued expenses and Other long-term liabilities.
Warranty Liabilities
The warranty obligation on the majority of merchandise sold by us with a manufacturer’s warranty is the responsibility of our vendors. However, we have an obligation to provide customers replacement of certain merchandise at no cost or merchandise at a prorated cost if under a warranty and not covered by the manufacturer. Merchandise sold with warranty coverage by us primarily includes batteries, but may also include other parts such as brakes and shocks. We estimate our warranty obligation at the time of sale based on the historical return experience, sales level and cost of the respective product sold. To the extent vendors provide upfront allowances in lieu of accepting the obligation for warranty claims and the allowance is in excess of the related warranty expense, the excess is recorded as a reduction to cost of sales.
Leases
We lease certain store locations, distribution centers, office spaces, equipment and vehicles. The total amount of minimum rent is expensed on a straight-line basis over the initial term of the lease unless external economic factors exist such that renewals are reasonably assured. In those instances, the renewal period would be included in the lease term for purposes of establishing an amortization period and determining if such lease qualified as a capital or operating lease. Differences between the calculated rent expense and cash payments are recorded as a liability within the Accrued expenses and Other long-term liabilities captions in the accompanying consolidated balance sheets, based on the terms of the lease. Most leases require us to pay taxes, maintenance, insurance and certain other expenses applicable to the leased premises. Management expects that in the normal course of business leases that expire will be renewed or replaced by other leases.
Fair Value Measurements
A three-level valuation hierarchy, based upon observable and unobservable inputs, is used for fair value measurements. Observable inputs reflect market data obtained from independent sources, while unobservable inputs reflect market assumptions based on the best evidence available. These two types of inputs create the following fair value hierarchy: Level 1 - Quoted prices for identical instruments in active markets; Level 2 - Quoted prices for similar instruments in active markets, quoted prices for identical or similar instruments in markets that are not active and model-derived valuations whose significant inputs are observable; and Level 3 - Instruments whose significant inputs are unobservable. Financial instruments are transferred in and/or out of Level 1, 2 or 3 at the beginning of the accounting period in which there is a change in the valuation inputs.
37
Closed Facility Liabilities and Exit Activities
We continually review the operating performance of our existing store locations and close or relocate certain stores identified as underperforming. Expenses accrued pertaining to closed facility exit activities are included in our closed facility liabilities, within Accrued expenses and Other long-term liabilities in the accompanying consolidated balance sheets, and recognized in Cost of sales or SG&A in the accompanying consolidated statements of operations at the time of facility closure. Closed facility liabilities include the present value of the remaining lease obligations and management’s estimate of future costs of insurance, property tax and common area maintenance expenses, reduced by the present value of estimated revenues from subleases and lease buyouts.
Employees receiving severance benefits as the result of a store closing or other restructuring activity are required to render service until they are terminated in order to receive benefits. Severance benefits are recognized over the related service period. Other restructuring costs, including costs to relocate employees, are recognized in the period in which the liability is incurred.
Share-Based Payments
We provide share-based compensation to our eligible Team Members and Board of Directors. We are required to exercise judgment and make estimates when determining the (i) fair value of each award granted and (ii) projected number of awards expected to vest. We calculate the fair value of all share-based awards at the date of grant and use the straight-line method to amortize this fair value as compensation cost over the requisite service period.
Revenues
Revenue for periods through December 30, 2017 was reported under Accounting Standards Codification (“ASC”) 605,
Revenue Recognition (Topic 605)
. We recognized revenue at the time the sale is made, at which time our walk-in customers took immediate possession of the merchandise or same-day delivery was made to our Professional delivery customers, which included certain independently owned store locations. For e-commerce sales, revenue was recognized either at the time of pick-up at one of our store locations or at the time of shipment depending on the customer’s order designation. Sales were recorded net of discounts, sales incentives and rebates, sales taxes and estimated returns and allowances. We estimated the reduction to sales and cost of sales for returns based on current sales levels and our historical return experience.
Effective December 31, 2017, we adopted ASC 606,
Revenue From Contracts With Customers (Topic 606)
(“ASC 606”). The results of applying Topic 606 using the modified retrospective approach were insignificant and did not have a material impact on our consolidated financial condition, results of operations, cash flows, business process, controls or systems.
ASC 606 defines a performance obligation as a promise in a contract to transfer a distinct good or service to the customer and is considered the unit of account. The majority of our contracts have one single performance obligation as the promise to transfer the individual goods is not separately identifiable from other promises in the contracts and is, therefore, not distinct. Discounts and incentives are treated as separate performance obligations. We allocate the contract’s transaction price to each of these performance obligations separately using explicitly stated amounts or our best estimate using historical data. Additionally, we estimate and record gift card breakage as redemptions occur.
In accordance with ASC 606 revenue is recognized at the time the sale is made, at which time our walk-in customers take immediate possession of the merchandise or same-day delivery is made to our Professional delivery customers, which include certain independently-owned store locations. Payment terms are established for our Professional delivery customers based on pre-established credit requirements. Payment terms vary depending on the customer and generally range from 1 to 30 days. Based on the nature of receivables, no significant financing components exist. For e-commerce sales, revenue is recognized either at the time of pick-up at one of our store locations or at the time of shipment depending on the customer's order designation. Sales are recorded net of discounts, sales incentives and rebates, sales taxes and estimated returns and allowances. We estimate the reduction to Net sales and Cost of sales for returns based on current sales levels and our historical return experience.
We provide assurance type warranty coverage primarily on batteries, brakes and struts whereby we are required to provide replacement product at no cost or a reduced cost for a set period of time.
38
The following table summarizes financial information for each of our product groups.
|
Year Ended
|
|||||||||
|
December 29, 2018
|
December 30, 2017
|
December 31, 2016
|
|||||||
|
Percentage of Sales, by Product Group
|
|||||||||
|
Parts and Batteries
|
66
|
%
|
65
|
%
|
66
|
%
|
|||
|
Accessories and Chemicals
|
20
|
%
|
20
|
%
|
19
|
%
|
|||
|
Engine Maintenance
|
13
|
%
|
14
|
%
|
14
|
%
|
|||
|
Other
|
1
|
%
|
1
|
%
|
1
|
%
|
|||
|
Total
|
100
|
%
|
100
|
%
|
100
|
%
|
|||
Receivables, net consist primarily of receivables from Professional customers. We grant credit to certain Professional customers who meet our pre-established credit requirements. Accounts receivable is stated at net realizable value. We regularly review accounts receivable balances and maintains allowances for doubtful accounts for estimated losses whenever events or circumstances indicate the carrying value may not be recoverable. We consider the following factors when determining if collection is reasonably assured: customer creditworthiness, past transaction history with the customer, current economic and industry trends and changes in customer payment terms. We control credit risk through credit approvals, credit limits and accounts receivable and credit monitoring procedures.
Cost of Sales
Cost of sales includes actual product cost, warranty costs, vendor incentives, cash discounts on payments to vendors, costs associated with operating our distribution network, including payroll and benefits costs, occupancy costs and depreciation, in-bound freight-related costs from our vendors, impairment of inventory resulting from store closures and costs associated with moving merchandise inventories from our distribution centers to stores, branch locations and customers.
Selling, General and Administrative Expenses
SG&A includes payroll and benefits costs for store and corporate Team Members, occupancy costs of store and corporate facilities, depreciation and amortization related to store and corporate assets, share-based compensation expense, advertising, self-insurance, costs of consolidating, converting or closing facilities, including early termination of lease obligations, severance and impairment charges, professional services and costs associated with our Professional delivery program, including payroll and benefit costs, and transportation expenses associated with moving merchandise inventories from stores and branches to customer locations.
Advertising Costs
We expense advertising costs as incurred. Advertising expense, net of qualifying vendor promotional funds, was
$120.9 million
,
$102.8 million
and
$97.0 million
in
2018
,
2017
and
2016
. Vendor promotional funds, which reduced advertising expense, amounted to
$26.9 million
and
$33.3 million
and
$29.3 million
in
2018
,
2017
and
2016
.
Foreign Currency Translation
The assets and liabilities of our foreign operations are translated into U.S. dollars at current exchange rates, and revenues, expenses and cash flows are translated at average exchange rates for the year. Resulting translation adjustments are reflected as a separate component in the Consolidated Statements of Comprehensive Income. Losses from foreign currency transactions, which are included in Other income, net, were
$5.0 million
during
2018
and
$4.0 million
during
2017
.
39
Income Taxes
We account for income taxes under the asset and liability method, which requires the recognition of deferred tax assets and liabilities for the expected future tax consequences of events that have been included in the financial statements. Under the asset and liability method, deferred tax assets and liabilities are determined based on the differences between the financial statements and tax basis of assets and liabilities using enacted tax rates in effect for the year in which the differences are expected to reverse. Deferred income taxes reflect the net income tax effect of temporary differences between the basis of assets and liabilities for financial reporting purposes and for income tax reporting purposes. The effect of a change in tax rates on deferred tax assets and liabilities is recognized in income in the period of the enactment date.
We recognize tax benefits and/or tax liabilities for uncertain income tax positions based on a two-step process. The first step is to evaluate the tax position for recognition by determining if the weight of available evidence indicates that it is more likely than not that the position will be sustained on audit, including resolution of related appeals or litigation processes, if any. The second step requires us to estimate and measure the tax benefit as the largest amount that is more than 50% likely to be realized upon ultimate settlement. It is inherently difficult and subjective to estimate such amounts as we must determine the probability of various possible outcomes.
We reevaluate these uncertain tax positions on a quarterly basis or when new information becomes available to management. The reevaluations are based on many factors, including but not limited to, changes in facts or circumstances, changes in tax law, successfully settled issues under audit, expirations due to statutes of limitations and new federal or state audit activity. Any change in either our recognition or measurement could result in the recognition of a tax benefit or an increase to the tax accrual.
Earnings per Share
Basic earnings per share of common stock has been computed based on the weighted-average number of common shares outstanding during the period. Diluted earnings per share is calculated by including the effect of dilutive securities. Diluted earnings per share of common stock reflects the weighted-average number of shares of common stock outstanding, outstanding deferred stock units and the impact of outstanding stock options and stock appreciation rights (collectively “share-based awards”). Share-based awards containing performance conditions are included in the dilution impact as those conditions are met.
Segment Information
Operating segments are defined as components of an enterprise for which discrete financial information is available that is evaluated regularly by the chief operating decision maker (“CODM”) for purposes of allocating resources and evaluating financial performance. Our CODM, the Chief Executive Officer, reviews financial information presented on a consolidated basis, accompanied by information about our five operating segments, for purposes of allocating resources and evaluating financial performance.
We have one reportable segment as the five operating segments are aggregated due primarily to the economic and operational similarities of each operating segment as the stores and branches have similar characteristics, including the nature of the products and services, customer base and the methods used to distribute products and provide service to its customers.
Recently Issued Accounting Pronouncements
In February 2016, the Financial Accounting Standards Board (“FASB”) issued Accounting Standards Update (“ASU”) 2016-02,
Leases (Topic 842)
(“ASU 2016-02”). This ASU is a comprehensive new accounting standard with respect to leases that amends various aspects of existing guidance for leases and requires additional disclosures about leasing arrangements. It will require lessees to recognize lease assets and lease liabilities for most leases, including those leases previously classified as operating leases under current GAAP. ASU 2016-02 retains a distinction between finance leases and operating leases. The classification criteria for distinguishing between finance leases and operating leases are substantially similar to the classification criteria for distinguishing between capital leases and operating leases in previous lease guidance. ASU 2016-02 is effective for annual periods beginning after December 15, 2018, including interim periods within those years; earlier adoption is permitted.
40
In July 2018, the FASB issued ASU 2018-11, Leases
(Topic 842): Targeted Improvements
, which provides clarifications and improvements to ASU 2016-02 including allowing entities to elect an additional transition method with which to adopt ASU 2016-02. The approved transition method enables entities to apply the transition requirements in this ASU at the effective date of ASU 2016-02 (rather than at the beginning of the earliest comparative period presented as currently required) with the effect of initially applying ASU 2016-02 recognized as a cumulative-effect adjustment to retained earnings in the period of adoption. Consequently, an entity’s reporting for the comparative periods presented in the year of adoption would continue to be in accordance with ASC 840,
Leases (Topic 840)
(“ASC 840”), including the disclosure requirements of ASC 840. Using this transition method, we plan to adopt ASU 2016-02 at the beginning of 2019. We also plan to elect the package of practical expedients permitted under the transition guidance within the new standard. In addition, as a practical expedient relating to our facility and vehicle leases, we plan to not separate lease components from nonlease components. This practical expedient was not elected for our equipment leases.
We are in process of finalizing the implementation of our leasing software solution and are continuing to identify changes to our business processes, systems and controls to support adoption of the new standard in 2019. We are evaluating the impact that the new standard will have on the consolidated financial statements. Based on our initial evaluation, upon adoption of ASU 2016-02, we anticipate recording lease assets and liabilities of approximately
$2.5 billion
on our consolidated balance sheet, primarily relating to real estate. As the majority of our leases will remain operating in nature and the expense recognition will be similar to the straight-line expense treatment that was previously required, we expect an insignificant impact to our consolidated statements of operations and cash flows.
In March 2018, the FASB issued ASU 2018-05,
Income Taxes (Topic 740) - Amendments to SEC Paragraphs Pursuant to SEC Staff Accounting Bulletin No. 118
(“SAB 118”). ASU 2018-05 provides guidance on accounting for the tax effects of the U.S. Tax Cuts and Jobs Act (the “Act”) pursuant to the Staff Accounting Bulletin No. 118, which allows companies to complete the accounting under ASC 740,
Income Taxes (Topic 740)
within a one-year measurement period from the Act enactment date, which occurred in the financial statements for the year ended December 30, 2017. During 2018, and in conjunction with the completion of our 2017 U.S. income tax return, we identified certain adjustments to amounts previously estimated for the remeasurement of the net deferred tax liability and nonrecurring repatriation tax on accumulated earnings of foreign subsidiaries that resulted in a net tax benefit of
$5.7 million
and reflects a change in estimate. Our analysis under SAB 118 is complete.
In June 2018, the FASB issued ASU 2018-07,
Compensation - Stock Compensation (Topic 718)
to expand the scope of ASC 718, Compensation - Stock Compensation (Topic 718) (“ASU 2018-07”), to include share-based payment transactions for acquiring goods and services from nonemployees. The pronouncement is effective for fiscal years, and for interim periods within those fiscal years, beginning after December 15, 2018, with early adoption permitted. We elected to early adopt ASU 2018-07 in the second quarter of 2018. The results of applying ASU 2018-07 were insignificant and did not have a material impact on our consolidated financial condition, results of operations, cash flows, business process, controls or systems.
In August 2018, the FASB issued ASU 2018-15,
Intangibles - Goodwill and Other - Internal-Use Software (Subtopic 350-40)
, which aligns the requirements for capitalizing implementation costs incurred in a hosting arrangement that is a service contract with the requirements for capitalizing implementation costs incurred to develop or obtain internal-use software (and hosting arrangements that include an internal-use software license). The pronouncement is effective for years, and for interim periods within those years, beginning after December 15, 2019, with early adoption permitted. We elected to early adopt ASU 2018-15 in the third quarter of 2018 on a prospective basis. The results of applying ASU 2018-15 were insignificant and did not have a material impact on our consolidated financial condition, results of operations, cash flows, business process, controls or systems.
|
3.
|
Inventories:
|
We used the LIFO method of accounting for approximately
89%
and
88%
of inventories at
December 29, 2018
and
December 30, 2017
. As a result of changes in the LIFO reserve, we recorded a decrease to cost of sales of
$39.8 million
in
2018
, an increase to cost of sales of
$2.7 million
in 2017 and a decrease to cost of sales of
$40.7 million
in
2016
.
Purchasing and warehousing costs included in inventory as of
December 29, 2018
and
December 30, 2017
, were
$435.2 million
and
$429.8 million
.
41
Inventory balances were as follows:
|
(in thousands)
|
December 29, 2018
|
December 30, 2017
|
|||||
|
Inventories at first in, first out (“FIFO”)
|
$
|
4,119,617
|
|
$
|
3,965,370
|
|
|
|
Adjustments to state inventories at LIFO
|
242,930
|
|
203,122
|
|
|||
|
Inventories at LIFO
|
$
|
4,362,547
|
|
$
|
4,168,492
|
|
|
|
4.
|
Exit Activities and Other Initiatives:
|
2018 Store Rationalization
During the fourth quarter of 2018, the Board of Directors approved a plan to close certain underperforming stores as part of our strategy to transform the enterprise. As of
December 29, 2018
, total charges related to these actions are expected to total up to approximately
$50 million
, which consists of
$35 million
relating to future lease obligations that will be amortized over the remaining lease term upon store closure,
$10 million
of other facility closures costs and
$5 million
of severance. During 2018, no stores had been closed in connection with this initiative; however, we recorded an impairment charge of
$7.9 million
as part of our plan to close certain underperforming stores, which were included in SG&A in the accompanying consolidated statements of operations.
2017 Store and Supply Chain Rationalization
During the fourth quarter of 2017, the Board of Directors approved a plan to close certain underperforming stores and begin to rationalize our supply chain costs as part of our strategy to transform the enterprise. As of
December 29, 2018
, total charges related to these actions are expected to total up to approximately
$70 million
, which consist of
$35 million
relating to the early termination of lease obligations,
$15 million
of inventory and supply chain asset impairment charges,
$15 million
of other facility closure costs and
$5 million
of severance.
During
2018
, we incurred
$25.5 million
of early termination of lease obligation charges,
$8.9 million
of inventory and supply chain asset impairment charges,
$13.6 million
of facility closure costs and
$3.5 million
of severance relating to the store and supply chain rationalization. Of these costs,
$44.8 million
are included in SG&A and
$6.7 million
are included in Cost of sales in the accompanying consolidated statements of operations.
During
2017
, no stores or distribution centers had been closed in connection with this initiative; however, we recorded an impairment charge of
$6.9 million
as part of our plan to close certain underperforming stores, which were included in SG&A in the accompanying consolidated statements of operations.
42
Total Exit Liabilities
Our total exit liabilities include liabilities recorded in connection with the initiatives described above, along with liabilities associated with facility closures that have occurred as part of our normal market evaluation process. Cash payments on the closed facility lease obligations are expected to be made through 2028 and the remaining severance payments are expected to be made in 2019. Of our total exit liabilities as of
December 29, 2018
,
$27.0 million
is included in Other long-term liabilities and the remainder is included in Accrued expenses in the accompanying consolidated balance sheets. A summary of our exit liabilities are presented in the following table:
|
(in thousands)
|
Closed Facility Lease Obligations
|
Severance
|
Total
|
|||||||||
|
Balance, December 31, 2016
|
$
|
44,265
|
|
$
|
959
|
|
$
|
45,224
|
|
|||
|
Reserves established
|
7,940
|
|
7,927
|
|
15,867
|
|
||||||
|
Change in estimates
|
(1,116
|
)
|
(699
|
)
|
(1,815
|
)
|
||||||
|
Cash payments
|
(19,519
|
)
|
(6,542
|
)
|
(26,061
|
)
|
||||||
|
Balance, December 30, 2017
|
31,570
|
|
1,645
|
|
33,215
|
|
||||||
|
Reserves established
|
25,285
|
|
6,600
|
|
31,885
|
|
||||||
|
Change in estimates
|
1,664
|
|
(324
|
)
|
1,340
|
|
||||||
|
Cash payments
|
(16,217
|
)
|
(4,532
|
)
|
(20,749
|
)
|
||||||
|
Balance, December 29, 2018
|
$
|
42,302
|
|
$
|
3,389
|
|
$
|
45,691
|
|
|||
|
5.
|
Goodwill and Intangible Assets:
|
Goodwill
At
December 29, 2018
and
December 30, 2017
, the carrying amount of goodwill was
$990.2 million
and
$994.3 million
. The change in goodwill during
2018
and
2017
was
$4.1 million
and
$3.4 million
related to foreign currency translation.
Intangible Assets Other Than Goodwill
Amortization expense was
$40.7
million,
$47.4
million and
$48.0
million for
2018
,
2017
and
2016
. A summary of the composition of the gross carrying amounts and accumulated amortization of acquired intangible assets are presented in the following table:
|
December 29, 2018
|
December 30, 2017
|
|||||||||||||||||||||||
|
(in thousands)
|
Gross Carrying Amount
|
Accumulated Amortization
|
Net
|
Gross Carrying Amount
|
Accumulated Amortization
|
Net
|
||||||||||||||||||
|
Amortized intangible assets:
|
||||||||||||||||||||||||
|
Customer relationships
|
$
|
349,157
|
|
$
|
(148,889
|
)
|
$
|
200,268
|
|
$
|
351,203
|
|
$
|
(116,909
|
)
|
$
|
234,294
|
|
||||||
|
Favorable leases
|
27,139
|
|
(12,791
|
)
|
14,348
|
|
32,512
|
|
(14,959
|
)
|
17,553
|
|
||||||||||||
|
Non-compete and other
|
37,875
|
|
(36,974
|
)
|
901
|
|
54,929
|
|
(46,389
|
)
|
8,540
|
|
||||||||||||
|
414,171
|
|
(198,654
|
)
|
215,517
|
|
438,644
|
|
(178,257
|
)
|
|
260,387
|
|
||||||||||||
|
Indefinite-lived intangible assets:
|
||||||||||||||||||||||||
|
Brands, trademark and tradenames
|
335,076
|
|
—
|
|
335,076
|
|
337,287
|
|
—
|
|
337,287
|
|
||||||||||||
|
Total intangible assets
|
$
|
749,247
|
|
$
|
(198,654
|
)
|
$
|
550,593
|
|
$
|
775,931
|
|
$
|
(178,257
|
)
|
$
|
597,674
|
|
||||||
43
Future Amortization Expense
The table below shows expected amortization expense for the next five years and thereafter for acquired intangible assets recorded as of
December 29, 2018
:
|
Year
|
Amount
|
|||
|
(in thousands)
|
||||
|
2019
|
$
|
32,475
|
|
|
|
2020
|
32,277
|
|
||
|
2021
|
31,727
|
|
||
|
2022
|
31,574
|
|
||
|
2023
|
28,616
|
|
||
|
Thereafter
|
58,848
|
|
||
|
$
|
215,517
|
|
||
|
6.
|
Receivables, net:
|
Receivables, net consist of the following:
|
(in thousands)
|
December 29, 2018
|
December 30, 2017
|
||||||
|
Trade
|
$
|
397,909
|
|
$
|
389,963
|
|
||
|
Vendor
|
228,024
|
|
220,510
|
|
||||
|
Other
|
17,081
|
|
14,103
|
|
||||
|
Total receivables
|
643,014
|
|
624,576
|
|
||||
|
Less: allowance for doubtful accounts
|
(18,042
|
)
|
(18,219
|
)
|
||||
|
Receivables, net
|
$
|
624,972
|
|
$
|
606,357
|
|
||
|
7.
|
Long-term Debt and Fair Value of Financial Instruments:
|
Long-term debt consists of the following:
|
(in thousands)
|
December 29, 2018
|
December 30, 2017
|
|||||
|
5.75% Senior Unsecured Notes (net of unamortized discount and debt issuance costs of $802 and $1,403 at December 29, 2018 and December 30, 2017) due May 1, 2020
|
$
|
299,198
|
|
$
|
298,597
|
|
|
|
4.50% Senior Unsecured Notes (net of unamortized discount and debt issuance costs of $833 and $1,108 at December 29, 2018 and December 30, 2017) due January 15, 2022
|
299,167
|
|
298,892
|
|
|||
|
4.50% Senior Unsecured Notes (net of unamortized discount and debt issuance costs of $2,645 and $3,162 at December 29, 2018 and December 30, 2017) due December 1, 2023
|
447,355
|
|
446,838
|
|
|||
|
Other
|
210
|
|
350
|
|
|||
|
|
1,045,930
|
|
1,044,677
|
|
|||
|
Less: Current portion of long-term debt
|
(210
|
)
|
(350
|
)
|
|||
|
Long-term debt, excluding current portion
|
$
|
1,045,720
|
|
$
|
1,044,327
|
|
|
|
Fair value of long-term debt
|
$
|
1,074,000
|
|
$
|
1,109,000
|
|
|
44
Fair Value of Financial Assets and Liabilities
The fair value of our senior unsecured notes was determined using Level 2 inputs based on quoted market prices. We believe the carrying value of its other long-term debt approximates fair value. The carrying amounts of our cash and cash equivalents, receivables, accounts payable and accrued expenses approximate their fair values due to the relatively short-term nature of these instruments.
Bank Debt
On January 31, 2017, we entered into a new credit agreement that provides a
$1.0 billion
unsecured revolving credit facility (the “2017 Credit Agreement”) with Advance Stores, as Borrower, the lenders party thereto, and Bank of America, N.A., as the administrative agent and replaces a prior credit agreement entered into in 2013. The 2017 Credit Agreement provides for the issuance of letters of credit with a sublimit of
$200.0
million. We may request that the total revolving commitment be increased by an amount not exceeding
$250.0
million during the term of the 2017 Credit Agreement. Voluntary prepayments and voluntary reductions of the revolving loan balance, if any, are permitted in whole or in part, at our option, in minimum principal amounts as specified in the 2017 Credit Agreement. The 2017 Credit Agreement terminates in January 2022; however, we may request one or two one-year extensions of the termination date prior to the first or second anniversary of the closing date.
On January 31, 2018, we entered into Amendment No. 1 to the 2017 Credit Agreement (the “Amendment”), among Advance Stores, as Borrower, the lenders party thereto, and Bank of America, N.A., Administrative Agent. The Amendment: (i) provided for LIBOR replacement rates in the event that LIBOR is unavailable in the future; (ii) modified the definitions of the financial covenants (and the testing level relating thereto) with respect to a maximum leverage ratio and a minimum coverage ratio that we are required to comply with; and (iii) extended the termination date of the 2017 Credit Agreement from January 31, 2022 until January 31, 2023. We have the option to make one additional written request of the lenders to extend the termination date then in effect for one additional year.
As of
December 29, 2018
, we had
no
outstanding borrowings under the revolver and borrowing availability was
$998.0
million based on our leverage ratio. As of
December 29, 2018
, we had letters of credit outstanding of
$100.5
million, which generally have a term of one year or less and primarily serve as collateral for our self-insurance policies.
Interest on any borrowings on the revolver will be based at our option, on an adjusted LIBOR, plus a margin, or an alternate base rate, plus a margin. After an initial interest period, we may elect to convert a particular borrowing to a different type. The initial margins per annum for the revolving loan are
1.10%
for the adjusted LIBOR and
0.10%
for alternate base rate borrowings. A facility fee of
0.15%
per annum is charged on the total revolving facility commitment, payable quarterly in arrears. Under the terms of the 2017 Credit Agreement, the interest rate spread and facility fee are based on our credit rating. The interest rate spread ranges from
0.91%
to
1.50%
for adjusted LIBOR borrowings and
0.00%
to
0.50%
for alternate base rate borrowings.
The 2017 Credit Agreement contains customary covenants restricting the ability of: (a) Advance Stores and its subsidiaries to, among other things, (i) create, incur or assume additional debt (only with respect to subsidiaries of Advance Stores), (ii) incur liens, (iii) guarantee obligations, and (iv) change the nature of its business conducted by itself and its subsidiaries; (b) Advance, Advance Stores and their subsidiaries to, among other things (i) enter into certain hedging arrangements, (ii) enter into restrictive agreements limiting their ability to incur liens on any of their property or assets, pay distributions, repay loans, or guarantee indebtedness of their subsidiaries; and (c) Advance, among other things, to change the holding company status of Advance. Advance Stores is required to comply with financial covenants with respect to a maximum leverage ratio and a minimum coverage ratio. The 2017 Credit Agreement also provides for customary events of default, including non-payment defaults, covenant defaults and cross-defaults of Advance Stores’ other material indebtedness. We were in compliance with our financial covenants with respect to the 2017 Credit Agreement as of
December 29, 2018
.
On January 10, 2019, we entered into Amendment No. 2 to the 2017 Credit Agreement (the “ Second Amendment”), among Advance Stores Company, Incorporated, as Borrower, Advance Auto Parts, Inc., as Parent, the banks, financial institutions and other institutional lenders parties thereto and Bank of America, N.A., as Administrative Agent. The Second Amendment: (i) added a new definition of "Insurance Subsidiary" to the 2017 Credit Agreement meaning each wholly owned subsidiary of Parent that is maintained as a special purpose self-insurance subsidiary and any of its subsidiaries; (ii) provided that an Insurance Subsidiary does not serve as a Guarantor of the 2017 Credit Agreement; and (iii) provided that Insurance
45
Subsidiaries are permitted to incur intercompany indebtedness. Insurance Subsidiaries will not be required to serve as Guarantors of the Parent's unsecured notes so long as they are not guarantors of the 2017 Credit Agreement.
Senior Unsecured Notes
Our
4.50%
senior unsecured notes were issued in December 2013 at
99.69%
of the principal amount of
$450.0 million
and are due December 1, 2023 (the “2023 Notes”). The 2023 Notes bear interest at a rate of
4.50%
per year payable semi-annually in arrears on June 1 and December 1 of each year. Our
4.50%
senior unsecured notes were issued in January 2012 at
99.968%
of the principal amount of
$300.0 million
and are due January 15, 2022 (the “2022 Notes”). The 2022 Notes bear interest at a rate of
4.50%
per year payable semi-annually in arrears on January 15 and July 15 of each year. Our
5.75%
senior unsecured notes were issued in April 2010 at
99.587%
of the principal amount of
$300.0 million
and are due May 1, 2020 (the “2020 Notes” or collectively with the 2023 Notes and the 2022 Notes, “the Notes”). The 2020 Notes bear interest at a rate of
5.75%
per year payable semi-annually in arrears on May 1 and November 1 of each year. Advance served as the issuer of the Notes with certain of Advance’s domestic subsidiaries currently serving as subsidiary guarantors. The terms of the Notes are governed by an indenture (as amended, supplemented, waived or otherwise modified, the “Indenture”) among Advance, the subsidiary guarantors from time to time party thereto and Wells Fargo Bank, National Association, as Trustee.
We may redeem some or all of the Notes at any time or from time to time, at the redemption price described in the Indenture. In addition, in the event of a Change of Control Triggering Event (as defined in the Indenture for the Notes), we will be required to offer to repurchase the Notes at a price equal to 101% of the principal amount thereof, plus accrued and unpaid interest to the repurchase date. The Notes are currently fully and unconditionally guaranteed, jointly and severally, on an unsubordinated and unsecured basis by each of the subsidiary guarantors. We will be permitted to release guarantees without the consent of holders of the Notes under the circumstances described in the Indenture: (i) upon the release of the guarantee of our other debt that resulted in the affected subsidiary becoming a guarantor of this debt; (ii) upon the sale or other disposition of all or substantially all of the stock or assets of the subsidiary guarantor; or (iii) upon our exercise of our legal or covenant defeasance option.
The Indenture contains customary provisions for events of default including for: (i) failure to pay principal or interest when due and payable; (ii) failure to comply with covenants or agreements in the Indenture or the Notes and failure to cure or obtain a waiver of such default upon notice; (iii) a default under any debt for money borrowed by us or any of our subsidiaries that results in acceleration of the maturity of such debt, or failure to pay any such debt within any applicable grace period after final stated maturity, in an aggregate amount greater than $25.0 million without such debt having been discharged or acceleration having been rescinded or annulled within 10 days after receipt by us of notice of the default by the Trustee or holders of not less than 25% in aggregate principal amount of the Notes then outstanding; and (iv) events of bankruptcy, insolvency or reorganization affecting us and certain of its subsidiaries. In the case of an event of default, the principal amount of the Notes plus accrued and unpaid interest may be accelerated. The Indenture also contains covenants limiting the ability of us and our subsidiaries to incur debt secured by liens and to enter into sale and lease-back transactions.
On January 29, 2019, we notified Wells Fargo Bank, N.A., as trustee, of our intent to redeem all
$300.0
million aggregate principal amount of our outstanding
5.75%
Notes due 2020 (the “2020 Notes”) at a redemption price of approximately
$1,035
per
$1,000
principal amount of the 2020 Notes, plus accrued and unpaid interest, if any, to the expected redemption date of February 28, 2019.
46
Future Payments
As of
December 29, 2018
, the aggregate future annual maturities of long-term debt instruments are as follows:
|
Year
|
Amount
|
||||
|
(in thousands)
|
|||||
|
2019
|
|
$
|
210
|
|
|
|
2020
|
|
300,000
|
|
||
|
2021
|
|
—
|
|
||
|
2022
|
|
300,000
|
|
||
|
2023
|
|
450,000
|
|
||
|
Thereafter
|
|
—
|
|
||
|
$
|
1,050,210
|
|
|||
Debt Guarantees
We are a guarantor of loans made by banks to various independently owned Carquest-branded stores that are customers of ours totaling
$24.3
million as of
December 29, 2018
. These loans are collateralized by security agreements on merchandise inventory and other assets of the borrowers. The approximate value of the inventory collateralized by these agreements is
$53.9
million as of
December 29, 2018
. We believe that the likelihood of performance under these guarantees is remote.
|
8.
|
Property and Equipment:
|
Property and equipment consists of the following:
|
(in thousands)
|
Useful Lives |
December 29, 2018
|
December 30, 2017
|
|||||||
|
Land and land improvements
|
0 - 10 years
|
$
|
453,511
|
|
$
|
451,261
|
|
|||
|
Buildings
|
30 - 40 years
|
488,977
|
|
478,235
|
|
|||||
|
Building and leasehold improvements
|
3 - 30 years
|
504,518
|
|
490,635
|
|
|||||
|
Furniture, fixtures and equipment
|
3 - 20 years
|
1,740,960
|
|
1,675,522
|
|
|||||
|
Vehicles
|
2 - 13 years
|
14,636
|
|
16,587
|
|
|||||
|
Construction in progress
|
84,885
|
|
65,281
|
|
||||||
|
3,287,487
|
|
3,177,521
|
|
|||||||
|
Less - Accumulated depreciation
|
(1,918,502
|
)
|
(1,783,383
|
)
|
||||||
|
Property and equipment, net
|
$
|
1,368,985
|
|
$
|
1,394,138
|
|
||||
Depreciation expense relating to Property and equipment was
$201.6 million
,
$206.9 million
and
$216.0 million
for
2018
,
2017
and
2016
. We capitalized
$13.0 million
,
$11.2 million
and
$13.0 million
incurred for the development of internal use computer software during
2018
,
2017
and
2016
. These costs are currently classified in the Construction in progress category above, but once placed into service within the Furniture, fixtures equipment category, these costs will be depreciated on the straight-line method over
three to eleven years
.
In
2018
,
2017
and
2016
, we recognized impairment losses of
$13.4 million
,
$13.3 million
and
$2.8 million
, on various store and corporate assets.
47
|
9.
|
Accrued Expenses:
|
Accrued expenses consist of the following:
|
(in thousands)
|
December 29, 2018
|
December 30, 2017
|
||||||
|
Payroll and related benefits
|
$
|
129,909
|
|
$
|
92,106
|
|
||
|
Taxes payable
|
119,203
|
|
112,930
|
|
||||
|
Self-insurance reserves
|
70,962
|
|
65,463
|
|
||||
|
Warranty reserves
|
45,280
|
|
49,024
|
|
||||
|
Capital expenditures
|
15,365
|
|
14,335
|
|
||||
|
Transportation
|
28,872
|
|
25,476
|
|
||||
|
Other
|
213,550
|
|
174,214
|
|
||||
|
Total accrued expenses
|
$
|
623,141
|
|
$
|
533,548
|
|
||
The following table presents changes in our warranty reserves:
|
Year Ended
|
||||||||||||
|
(in thousands)
|
December 29, 2018
|
December 30, 2017
|
December 31, 2016
|
|||||||||
|
Warranty reserves, beginning of period
|
$
|
49,024
|
|
$
|
47,243
|
|
$
|
44,479
|
|
|||
|
Additions to warranty reserves
|
43,200
|
|
50,895
|
|
46,903
|
|
||||||
|
Reserves utilized
|
(46,944
|
)
|
(49,114
|
)
|
(44,139
|
)
|
||||||
|
Warranty reserves, end of period
|
$
|
45,280
|
|
$
|
49,024
|
|
$
|
47,243
|
|
|||
|
10.
|
Stock Repurchase Program:
|
Our stock repurchase program allow us to repurchase our common stock on the open market or in privately negotiated transactions from time to time. On August 8, 2018, our Board of Directors authorized a
$600.0 million
stock repurchase program. This new authorization replaced the previous
$500.0 million
stock repurchase program that was authorized by our Board of Directors on May 14, 2012.
During
2018
, we repurchased
1.7 million
shares of its common stock at an aggregate cost of
$272.8 million
, or an average price of
$163.17
per share, in connection with our stock repurchase program. We had
$327.2
million remaining under our stock repurchase program as of
December 29, 2018
. During 2017, we repurchased
no
shares of our common stock under our stock repurchase program.
Subsequent to
December 29, 2018
, we have repurchased
0.8 million
shares of common stock at an aggregate cost of
$127.2 million
, or
$159.65
per share, through our stock repurchase program.
48
|
11.
|
Earnings per Share:
|
The computation of basic and diluted earnings per share is as follows:
|
Year Ended
|
||||||||||||
|
(in thousands, except per share data)
|
December 29, 2018
|
December 30, 2017
|
December 31, 2016
|
|||||||||
|
Numerator
|
||||||||||||
|
Net income applicable to common shares
|
$
|
423,847
|
|
$
|
475,505
|
|
$
|
459,622
|
|
|||
|
Denominator
|
||||||||||||
|
Basic weighted average common shares
|
73,728
|
|
73,846
|
|
73,562
|
|
||||||
|
Dilutive impact of share-based awards
|
263
|
|
264
|
|
294
|
|
||||||
|
Diluted weighted average common shares
|
73,991
|
|
74,110
|
|
73,856
|
|
||||||
|
|
|
|||||||||||
|
Basic earnings per common share
|
$
|
5.75
|
|
$
|
6.44
|
|
$
|
6.22
|
|
|||
|
Diluted earnings per common share
|
$
|
5.73
|
|
$
|
6.42
|
|
$
|
6.20
|
|
|||
|
12.
|
Income Taxes:
|
U.S. Tax Reform
On December 22, 2017, the U.S. Tax Cuts and Jobs Act (the “Act”) was signed into law. The Act amends the Internal Revenue Code by, among other things, permanently lowering the corporate tax rate to
21%
from the existing maximum rate of
35%
, implementing a territorial tax system and imposing a transition tax on deemed repatriated earnings of foreign subsidiaries. We are required to remeasure deferred income tax assets and liabilities in the reporting period of enactment. The remeasurement of the our net deferred income tax liability resulted in a
$155.1 million
income tax benefit in 2017. In 2017, we also recorded an estimated charge of
$11.3 million
to income tax expense primarily for the nonrecurring repatriation tax on accumulated earnings of foreign subsidiaries and it is our intention to bring back the accumulated foreign earnings held as cash in the near term. Prospectively, any future foreign earnings will be utilized to grow and support our foreign operations and will be treated as being indefinitely reinvested outside the U.S.
During 2018, in conjunction with the completion of our 2017 U.S. income tax return, we identified a change in estimate to amounts previously estimated in 2017 for the remeasurement of the net deferred tax liability and nonrecurring repatriation tax on accumulated earnings of foreign subsidiaries that resulted in a net tax benefit of
$5.7 million
. Our analysis under Staff Accounting Bulletin No. 118 is complete.
49
Provision for Income Taxes
Provision for income taxes consists of the following:
|
(in thousands)
|
Current
|
Deferred
|
Total
|
|||||||||
|
2018
|
||||||||||||
|
Federal
|
$
|
72,598
|
|
$
|
14,745
|
|
$
|
87,343
|
|
|||
|
State
|
19,571
|
|
3,439
|
|
23,010
|
|
||||||
|
Foreign
|
23,292
|
|
(2,228
|
)
|
21,064
|
|
||||||
|
$
|
115,461
|
|
$
|
15,956
|
|
$
|
131,417
|
|
||||
|
2017
|
||||||||||||
|
Federal
|
$
|
146,855
|
|
$
|
(146,741
|
)
|
$
|
114
|
|
|||
|
State
|
31,352
|
|
(3,437
|
)
|
27,915
|
|
||||||
|
Foreign
|
17,810
|
|
(1,085
|
)
|
16,725
|
|
||||||
|
$
|
196,017
|
|
$
|
(151,263
|
)
|
$
|
44,754
|
|
||||
|
2016
|
||||||||||||
|
Federal
|
$
|
209,499
|
|
$
|
17,989
|
|
$
|
227,488
|
|
|||
|
State
|
29,345
|
|
1,366
|
|
30,711
|
|
||||||
|
Foreign
|
20,156
|
|
858
|
|
21,014
|
|
||||||
|
$
|
259,000
|
|
$
|
20,213
|
|
$
|
279,213
|
|
||||
The provision for income taxes differed from the amount computed by applying the federal statutory income tax rate due to:
|
Year Ended
|
||||||||||||
|
(in thousands)
|
December 29, 2018
|
December 30, 2017
|
December 31, 2016
|
|||||||||
|
Income before provision for income taxes at statutory U.S. federal income tax rate (21% for 2018 and 35% for 2017 and 2016)
|
$
|
116,605
|
|
$
|
182,091
|
|
$
|
258,592
|
|
|||
|
State income taxes, net of federal income tax benefit
|
18,178
|
|
18,145
|
|
19,962
|
|
||||||
|
Impact of the Act
|
(5,655
|
)
|
(143,756
|
)
|
—
|
|
||||||
|
Other, net
|
2,289
|
|
(11,726
|
)
|
659
|
|
||||||
|
$
|
131,417
|
|
$
|
44,754
|
|
$
|
279,213
|
|
||||
50
Deferred Income Tax Assets (Liabilities)
Temporary differences that give rise to significant deferred income tax assets (liabilities) are as follows:
|
(in thousands)
|
December 29, 2018
|
December 30, 2017
|
||||||
|
Deferred income tax assets:
|
||||||||
|
Accrued expenses not currently deductible for tax
|
$
|
40,066
|
|
$
|
38,200
|
|
||
|
Share-based compensation
|
7,780
|
|
9,556
|
|
||||
|
Accrued medical and workers compensation
|
34,430
|
|
33,697
|
|
||||
|
Net operating loss carryforwards
|
7,423
|
|
6,701
|
|
||||
|
Straight-line rent
|
21,091
|
|
21,733
|
|
||||
|
Other, net
|
8,390
|
|
2,973
|
|
||||
|
Total deferred income tax assets before valuation allowances
|
119,180
|
|
112,860
|
|
||||
|
Less: Valuation allowance
|
(8,694
|
)
|
(3,778
|
)
|
||||
|
Total deferred income tax assets
|
110,486
|
|
109,082
|
|
||||
|
Deferred income tax liabilities:
|
||||||||
|
Property and equipment
|
(92,505
|
)
|
(98,186
|
)
|
||||
|
Inventories
|
(196,772
|
)
|
(169,478
|
)
|
||||
|
Intangible assets
|
(139,562
|
)
|
(145,038
|
)
|
||||
|
Total deferred income tax liabilities
|
(428,839
|
)
|
(412,702
|
)
|
||||
|
Net deferred income tax liabilities
|
$
|
(318,353
|
)
|
$
|
(303,620
|
)
|
||
As of
December 29, 2018
and
December 30, 2017
, our net operating loss (“NOL”) carryforwards related to state NOLs of
$195.0
million and
$177.8
million. These NOLs may be used to reduce future taxable income and expire periodically through 2037. Due to uncertainties related to the realization of these NOLs in certain jurisdictions, we have recorded a valuation allowance of
$3.8
million and
$3.8
million as of
December 29, 2018
and
December 30, 2017
. In addition, we have recorded a
$4.9 million
valuation allowance on foreign tax credit carryforwards. The amount of deferred income tax assets realizable, however, could change in the future if projections of future taxable income change.
We have not recorded deferred taxes when earnings from foreign operations are considered to be indefinitely invested outside of the U.S. As of
December 29, 2018
, these accumulated net earnings generated by our foreign operations were approximately
$12.1 million
, which did not include earnings deemed to be repatriated as part of the Act. It is not practicable to determine the income tax liability that would be payable if such earnings were repatriated.
Unrecognized Tax Benefits
The following table summarizes the activity of our gross unrecognized tax benefits:
|
(in thousands)
|
December 29, 2018
|
December 30, 2017
|
December 31, 2016
|
|||||||||
|
Unrecognized tax benefits, beginning of period
|
$
|
22,665
|
|
$
|
13,946
|
|
$
|
13,841
|
|
|||
|
Increases related to prior period tax positions
|
5,435
|
|
8,077
|
|
8,274
|
|
||||||
|
Decreases related to prior period tax positions
|
(1,356
|
)
|
(2,331
|
)
|
(1,600
|
)
|
||||||
|
Increases related to current period tax positions
|
5,425
|
|
5,644
|
|
2,105
|
|
||||||
|
Settlements
|
(14
|
)
|
(1,496
|
)
|
(6,894
|
)
|
||||||
|
Expiration of statute of limitations
|
(1,331
|
)
|
(1,175
|
)
|
(1,780
|
)
|
||||||
|
Unrecognized tax benefits, end of period
|
$
|
30,824
|
|
$
|
22,665
|
|
$
|
13,946
|
|
|||
51
As of
December 29, 2018
,
December 30, 2017
and
December 31, 2016
, the entire amount of unrecognized tax benefits, if recognized, would reduce our annual effective tax rate. During
2018
, we recorded a gain relating to income tax-related interest and penalties of
$0.9
million due to uncertain tax positions included in Provision for income taxes in the accompanying consolidated statements of operations. During 2017 and 2016, we recorded expenses relating to income tax-related interest and penalties of
$1.7
million and
$1.9
million due to uncertain tax positions included in Provision for income taxes in the accompanying consolidated statements of operations. As of
December 29, 2018
and
December 30, 2017
, we recorded a liability for potential interest of
$3.3
million and
$4.2
million and for potential penalties of
$0.1
million and
$0.1
million. We did not provide for any penalties associated with tax contingencies unless considered probable of assessment. We do not expect our unrecognized tax benefits to change significantly over the next 12 months. With few exceptions, we are no longer subject to U.S. federal, state and local or non-U.S. income tax examinations by tax authorities for years before 2014.
|
13.
|
Lease and Other Commitments:
|
Initial terms for facility leases are typically
5
to
10
years, with renewal options at
5
year intervals, and may include rent escalation clauses. As of
December 29, 2018
, future minimum lease payments due under non-cancelable operating leases with lease terms extending through the year
2059
are as follows:
|
Year
|
Amount
|
||||
|
(in thousands)
|
|||||
|
2019
|
|
$
|
520,541
|
|
|
|
2020
|
|
481,812
|
|
||
|
2021
|
|
416,895
|
|
||
|
2022
|
|
349,470
|
|
||
|
2023
|
|
270,116
|
|
||
|
Thereafter
|
|
837,441
|
|
||
|
|
$
|
2,876,275
|
|
||
Net Rent Expense
The following table summarizes net rent expense:
|
Year Ended
|
||||||||||||
|
(in thousands)
|
December 29, 2018
|
December 30, 2017
|
December 31, 2016
|
|||||||||
|
Minimum facility rentals
|
$
|
484,291
|
|
$
|
483,178
|
|
$
|
473,596
|
|
|||
|
Equipment rentals
|
23,635
|
|
24,786
|
|
26,897
|
|
||||||
|
Vehicle rentals
|
53,015
|
|
32,670
|
|
47,251
|
|
||||||
|
560,941
|
|
540,634
|
|
547,744
|
|
|||||||
|
Less: Sub-lease income
|
(7,141
|
)
|
(7,144
|
)
|
(7,379
|
)
|
||||||
|
$
|
553,800
|
|
$
|
533,490
|
|
$
|
540,365
|
|
||||
Other Commitments
We have entered into certain arrangements which require the future purchase of goods or services. Our obligations primarily consist of payments for the purchase of hardware, software and maintenance. As of
December 29, 2018
, future payments amount to
$101.5 million
and are not accrued in our consolidated balance sheet.
52
|
14.
|
Contingencies:
|
We are currently and from time to time subject to litigation, claims and other disputes, including legal and regulatory proceedings, arising in the normal course of business. We record a loss contingency liability when a loss is considered probable and the amount can be reasonably estimated. Although the final outcome of these legal matters cannot be determined, based on the facts presently known, it is management’s opinion that the final outcome of any pending matters will not have a material adverse effect on our consolidated financial position, results of operations or cash flows.
Our Western Auto subsidiary, together with other defendants (including Advance and other of its subsidiaries), has been named as a defendant in lawsuits alleging injury as a result of exposure to asbestos-containing products. The plaintiffs have alleged that certain products contained asbestos and were manufactured, distributed and/or sold by the various defendants. Many of the cases pending against us are in the early stages of litigation. While the damages claimed against the defendants in some of these proceedings are substantial, we believe many of these claims are at least partially covered by insurance and historically asbestos claims against us have been inconsistent in fact patterns alleged and immaterial. We do not believe the cases currently pending will have a material adverse effect on our financial position, results of operations or cash flows.
|
15.
|
Benefit Plans:
|
401(k) Plan
We maintain a defined contribution benefit plan, which covers substantially all Team Members after one year of service and who have attained the age of 21. The plan allows for Team Member salary deferrals, which are matched at our discretion. Company contributions to these plans were
$15.0 million
,
$14.2 million
and
$13.9 million
in
2018
,
2017
and
2016
.
Deferred Compensation
We maintain a non-qualified deferred compensation plan for certain Team Members. This plan provides for a minimum and maximum deferral percentage of the Team Member’s base salary and bonus, as determined by the Retirement Plan Committee. We established and maintained a deferred compensation liability for this plan. As of
December 29, 2018
and
December 30, 2017
, these liabilities were
$12.2 million
and
$16.8 million
.
|
16.
|
Share-Based Compensation:
|
Overview
We grant share-based compensation awards to our Team Members and members of our Board of Directors as provided for under our 2014 Long-Term Incentive Plan (“2014 LTIP”), which was approved by our shareholders on May 14, 2014. In
2018
,
2017
and
2016
, we granted share-based compensation in the form of stock appreciation rights (“SARs”), restricted stock units (“RSUs”) or deferred stock units (“DSUs”). Our grants, which have three methods of measuring fair value, generally include a time-based service, a performance-based or a market-based portion, which collectively represent the target award.
At
December 29, 2018
, there were
5.3 million
shares of common stock available for future issuance under the 2014 LTIP based on management’s current estimate of the probable vesting outcome for performance-based awards. We issue new shares of common stock upon exercise of SARs. Shares forfeited and shares withheld for payment of taxes due become available for reissuance and are included in availability. Availability also includes shares that became available for reissuance in connection with the exercise of SARs.
53
The fair value of each SAR granted was estimated on the date of grant using the Black-Scholes option-pricing model with the following weighted average assumptions:
|
Black-Scholes Option Valuation Assumptions
|
2016
|
||
|
Risk-free interest rate
(1)
|
1.2
|
%
|
|
|
Expected dividend yield
|
0.2
|
%
|
|
|
Expected stock price volatility
(2)
|
27.7
|
%
|
|
|
Expected life of awards (in months)
(3)
|
55
|
|
|
|
(1)
|
The risk-free interest rate is based on the U.S. Treasury constant maturity interest rate having a term consistent with the expected life of the award.
|
|
(2)
|
Expected volatility is determined using a blend of historical and implied volatility.
|
|
(3)
|
The expected life of our awards represents the estimated period of time until exercise and is based on historical experience of previously granted awards.
|
As
no
time-based and performance-based SARs were granted in 2018 or 2017, the Black-Scholes model was not utilized and no assumptions were created.
For time-based and performance-based RSUs, the fair value of each award was determined based on the market price of our stock on the date of grant adjusted for expected dividends during the vesting period, as applicable.
The fair value of each market-based RSU was determined using a Monte Carlo simulation model. The model uses multiple input variables that determined the probability of satisfying the market condition requirements as follows:
|
Monte Carlo Simulation Model Assumptions
|
2018
|
2017
|
|||
|
Risk-free interest rate
(1)
|
2.4
|
%
|
1.6
|
%
|
|
|
Expected dividend yield
|
0.2
|
%
|
0.2
|
%
|
|
|
Expected stock price volatility
(2)
|
34.0
|
%
|
26.2
|
%
|
|
|
(1)
|
The risk-free interest rate is based on the U.S. Treasury constant maturity interest rate having term consistent with the vesting period of the award.
|
|
(2)
|
Expected volatility is determined based on historical volatility over a matching look-back period and is consistent with the correlation coefficients between our stock prices and our peer group.
|
As
no
market-based RSUs were granted in 2016, the Monte Carlo simulation model was not utilized and no assumptions were created.
Additionally, we estimated a liquidity discount of
14.5%
using the Chaffe Protective Put Method to adjust the fair value for the post-vest restrictions.
Time-Based Awards
Our outstanding time-vested awards consist of SARs and RSUs. The SARs generally vest over a three-year period in equal annual installments beginning on the first anniversary of the grant date. The SARs granted are non-qualified, terminate on the seventh anniversary of the grant date and contain no post-vesting restrictions other than normal trading black-out periods prescribed by our corporate governance policies. The RSUs generally vest over a three-year period in equal annual installments beginning on the first anniversary of the grant date. During the vesting period, holders of RSUs are entitled to receive dividend equivalents, but are not entitled to voting rights.
54
The following table summarizes activity for time-vested SARs and RSUs in
2018
:
|
SARs
|
RSUs
|
|||||||||||||||||||
|
(in thousands, except per share data)
|
Number of Awards
|
Weighted-Average Exercise Price
|
Weighted-Average Remaining Contractual Term (in years)
|
Aggregate Intrinsic Value
|
Number of Awards
|
Weighted-Average Grant Date Fair Value
|
||||||||||||||
|
Outstanding SARs / Nonvested RSUs at December 30, 2017
|
113
|
|
$
|
126.07
|
|
346
|
|
$
|
135.58
|
|
||||||||||
|
Granted
|
—
|
|
—
|
|
259
|
|
130.12
|
|
||||||||||||
|
Exercised
|
(26
|
)
|
71.06
|
|
—
|
|
—
|
|
||||||||||||
|
Vested
|
—
|
|
—
|
|
(125
|
)
|
140.62
|
|
||||||||||||
|
Forfeited
|
(4
|
)
|
71.94
|
|
(70
|
)
|
124.55
|
|
||||||||||||
|
Outstanding SARs / Nonvested RSUs at December 29, 2018
|
83
|
|
$
|
145.91
|
|
3.71
|
$
|
1,172
|
|
410
|
|
$
|
132.49
|
|
||||||
|
Vested and expected to vest
|
83
|
|
$
|
145.91
|
|
3.71
|
$
|
—
|
|
|||||||||||
|
Outstanding and exercisable
|
14
|
|
$
|
74.55
|
|
0.98
|
$
|
1,172
|
|
|||||||||||
The aggregate intrinsic value of time-vested SARs and performance-based SARs is based on our closing stock price of
$155.46
as of the last trading day of
2018
. The fair value of time-based RSUs and performance-based RSUs is determined based on the market price of our common stock on the date of grant.
The following table summarizes certain information concerning activity for time-vested SARs and RSUs:
|
Year Ended
|
||||||||||||
|
(in thousands, except per share data)
|
December 29, 2018
|
December 30, 2017
|
December 31, 2016
|
|||||||||
|
SARs:
|
||||||||||||
|
Weighted average fair value of grants
|
$
|
—
|
|
$
|
—
|
|
$
|
43.64
|
|
|||
|
Aggregate intrinsic value of SARs exercised
|
$
|
1,898
|
|
$
|
11,455
|
|
$
|
31,450
|
|
|||
|
RSUs:
|
||||||||||||
|
Weighted average fair value of grants
|
$
|
130.12
|
|
$
|
131.01
|
|
$
|
155.51
|
|
|||
|
Total grant date fair value of RSUs vested
|
$
|
17,527
|
|
$
|
13,578
|
|
$
|
16,089
|
|
|||
Performance-Based Awards
Our outstanding performance-based awards consist of SARs and RSUs. Performance awards generally may vest following a three-year period subject to our achievement of certain financial goals as specified in the grant agreements. Depending on our results during the three-year performance period, the actual number of awards vesting at the end of the period generally ranges from 0% to 200% of the performance award. The performance RSUs generally do not have dividend equivalent rights and do not have voting rights until the shares are earned and issued following the applicable performance period. We also grant broad-based incentive awards to store and field team members that vested over a one-year service period based on the achievement of performance goals.
55
The number of performance-based awards outstanding is reflected in the following tables based on the number of awards that we believed were probable of vesting at
December 29, 2018
. Performance-based SARs and performance-based RSU’s granted during
2018
are presented as grants in the table at their respective target levels. The change in units based on performance represents the change in the number of granted awards expected to vest based on the updated probability assessment as of
December 29, 2018
.
Compensation expense for performance-based awards of
$5.4 million
,
$13.6 million
, and
$0.8 million
in
2018
,
2017
and
2016
, was determined based on management’s estimate of the probable vesting outcome.
The following table summarizes activity for performance-based SARs and RSUs in
2018
:
|
SARs
|
RSUs
|
|||||||||||||||||||
|
(in thousands, except per share data)
|
Number of Awards
|
Weighted-Average Exercise Price
|
Weighted-Average Remaining Contractual Term (in years)
|
Aggregate Intrinsic Value
|
Number of Awards
|
Weighted-Average Grant Date Fair Value
|
||||||||||||||
|
Outstanding SARs / Nonvested RSUs at December 30, 2017
|
29
|
|
$
|
90.90
|
|
125
|
|
$
|
156.36
|
|
||||||||||
|
Granted
|
—
|
|
—
|
|
115
|
|
119.08
|
|
||||||||||||
|
Change in units based on performance
|
—
|
|
—
|
|
(41
|
)
|
147.09
|
|
||||||||||||
|
Exercised
|
(12
|
)
|
85.92
|
|
—
|
|
—
|
|
||||||||||||
|
Vested
|
—
|
|
—
|
|
(56
|
)
|
163.42
|
|
||||||||||||
|
Forfeited
|
(2
|
)
|
84.80
|
|
(18
|
)
|
124.85
|
|
||||||||||||
|
Outstanding SARs / Nonvested RSUs at December 29, 2018
|
15
|
|
$
|
96.04
|
|
1.51
|
$
|
838
|
|
125
|
|
$
|
126.19
|
|
||||||
|
Vested and expected to vest
|
15
|
|
$
|
96.04
|
|
1.51
|
$
|
—
|
|
|||||||||||
|
Outstanding and exercisable
|
15
|
|
$
|
96.04
|
|
1.51
|
$
|
838
|
|
|||||||||||
The following table summarizes certain information concerning activity for performance-based SARs and RSUs:
|
Year Ended
|
||||||||||||
|
(in thousands, except per share data)
|
December 29, 2018
|
December 30, 2017
|
December 31, 2016
|
|||||||||
|
SARs:
|
||||||||||||
|
Weighted average fair value of grants
|
$
|
—
|
|
$
|
—
|
|
$
|
36.78
|
|
|||
|
Aggregate intrinsic value of SARs exercised
|
$
|
610
|
|
$
|
5,221
|
|
$
|
11,556
|
|
|||
|
RSUs:
|
||||||||||||
|
Weighted average fair value of grants
|
$
|
119.08
|
|
$
|
146.42
|
|
$
|
163.76
|
|
|||
|
Total grant date fair value of RSUs vested
|
$
|
9,224
|
|
$
|
7,823
|
|
$
|
13,512
|
|
|||
As of
December 29, 2018
, the maximum potential payout under our currently outstanding performance-based SARs and RSUs was
310
thousand and
228
thousand units.
Market-Based Awards
Our outstanding market-based awards consist of RSUs. Market-based RSU’s vesting depends on our relative total shareholder return among a designated group of peer companies during a three-year period and will be subject to a one-year holding period after vesting.
56
At the beginning of
2018
,
24 thousand
market-based RSUs were outstanding. During
2018
, a total of
38 thousand
market-based RSUs were granted at a weighted average fair value of
$131.48
per unit and
9 thousand
market-based RSUs were forfeited at a weighted average fair value of
$137.58
.
At the beginning of
2017
,
zero
market-based RSUs were outstanding. During
2017
, a total of
27 thousand
market-based RSUs were granted at a weighted average fair value of
$139.33
per unit and
3 thousand
market-based RSUs were forfeited at a weighted average fair value of
$145.83
.
Other Considerations
Total income tax benefit related to share-based compensation expense for
2018
,
2017
and
2016
was
$6.8 million
,
$15.3 million
and
$7.5 million
.
As of
December 29, 2018
, there was
$53.0
million of unrecognized compensation expense related to all share-based awards that was expected to be recognized over a weighted average period of
1.7
years.
Deferred Stock Units
We grant share-based awards annually to our Board of Directors in connection with its annual meeting of stockholders. These awards are granted in the form of DSUs as provided for in the Advance Auto Parts, Inc. Deferred Stock Unit Plan for Non-Employee Directors and Selected Executives (“DSU Plan”). Each DSU is equivalent to one share of our common stock and will be distributed in common shares after the director’s service on the Board ends. DSUs granted vest over a one year service period. Additionally, the DSU Plan provides for the deferral of compensation earned in the form of (i) an annual retainer for directors, and (ii) wages for certain highly compensated Team Members. These DSUs are settled in common stock with the participants at a future date, or over a specified time period, as elected by the participants in accordance with the DSU Plan.
We granted
15
thousand DSUs in
2018
. The weighted average fair value of DSUs granted during
2018
,
2017
and
2016
was
$127.14
,
$125.34
, and
$146.30
. The DSUs are awarded at a price equal to the market price of our underlying stock on the date of the grant. For
2018
,
2017
and
2016
, we recognized
$1.9 million
,
$1.5 million
and
$0.9 million
of share-based compensation expense for these DSU grants.
Employee Stock Purchase Plan
We also offer an employee stock purchase plan (“ESPP”). Under the ESPP, eligible Team Members may elect salary deferrals to purchase our common stock at a discount of 10% from its fair market value on the date of purchase. There are annual limitations on the amounts a Team Member may elect of either $25 thousand per Team Member or 10% of compensation, whichever is less. As of
December 29, 2018
, there were
1.0 million
shares available to be issued under the ESPP.
|
17.
|
Accumulated Other Comprehensive Loss:
|
Accumulated other comprehensive loss, net of tax, consisted of the following:
|
(in thousands)
|
Unrealized Gain (Loss) on Postretirement Plan
|
Foreign Currency Translation
|
Accumulated Other Comprehensive (Loss) Income
|
|||||||||
|
Balance, January 2, 2016
|
$
|
2,486
|
|
$
|
(46,545
|
)
|
$
|
(44,059
|
)
|
|||
|
2016 activity
|
(534
|
)
|
4,892
|
|
4,358
|
|
||||||
|
Balance, December 31, 2016
|
1,952
|
|
(41,653
|
)
|
(39,701
|
)
|
||||||
|
2017 activity
|
(194
|
)
|
14,941
|
|
14,747
|
|
||||||
|
Balance, December 30, 2017
|
1,758
|
|
(26,712
|
)
|
(24,954
|
)
|
||||||
|
2018 activity
|
(294
|
)
|
(18,945
|
)
|
(19,239
|
)
|
||||||
|
Balance, December 29, 2018
|
$
|
1,464
|
|
$
|
(45,657
|
)
|
$
|
(44,193
|
)
|
|||
57
|
18.
|
Condensed Consolidating Financial Statements:
|
Certain 100% wholly owned domestic subsidiaries of Advance, including its Material Subsidiaries (as defined in the 2017 Credit Agreement) serve as guarantors of Advance’s senior unsecured notes (“Guarantor Subsidiaries”). The subsidiary guarantees related to Advance’s senior unsecured notes are full and unconditional, joint and several and there are no restrictions on the ability of Advance to obtain funds from its Guarantor Subsidiaries. Certain of Advance’s wholly owned subsidiaries, including all of its foreign subsidiaries, do not serve as guarantors of Advance’s senior unsecured notes (“Non-Guarantor Subsidiaries”).
Set forth below are condensed consolidating financial statements presenting the financial position, results of operations, and cash flows of (i) Advance, (ii) the Guarantor Subsidiaries, (iii) the Non-Guarantor Subsidiaries, and (iv) the eliminations necessary to arrive at consolidated information for Advance. Investments in subsidiaries of Advance are presented under the equity method. The statement of operations eliminations relate primarily to the sale of inventory from a Non-Guarantor Subsidiary to a Guarantor Subsidiary. The balance sheet eliminations relate primarily to the elimination of intercompany receivables and payables and subsidiary investment accounts.
58
The following tables present condensed consolidating balance sheets, condensed consolidating statements of operations, comprehensive income and cash flows, and should be read in conjunction with the consolidated financial statements herein.
Condensed Consolidating Balance Sheet
As of
December 29, 2018
|
(in thousands)
|
Advance Auto Parts, Inc.
|
Guarantor Subsidiaries
|
Non-Guarantor Subsidiaries
|
Eliminations
|
Consolidated
|
||||||||||||||
|
Assets
|
|||||||||||||||||||
|
Current assets:
|
|||||||||||||||||||
|
Cash and cash equivalents
|
$
|
—
|
|
$
|
785,605
|
|
$
|
110,922
|
|
$
|
—
|
|
$
|
896,527
|
|
||||
|
Receivables, net
|
—
|
|
590,269
|
|
34,703
|
|
—
|
|
624,972
|
|
|||||||||
|
Inventories
|
—
|
|
4,182,973
|
|
179,574
|
|
—
|
|
4,362,547
|
|
|||||||||
|
Other current assets
|
3,103
|
|
191,318
|
|
3,987
|
|
—
|
|
198,408
|
|
|||||||||
|
Total current assets
|
3,103
|
|
5,750,165
|
|
329,186
|
|
—
|
|
6,082,454
|
|
|||||||||
|
Property and equipment, net of accumulated depreciation
|
77
|
|
1,359,980
|
|
8,928
|
|
—
|
|
1,368,985
|
|
|||||||||
|
Goodwill
|
—
|
|
943,364
|
|
46,873
|
|
—
|
|
990,237
|
|
|||||||||
|
Intangible assets, net
|
—
|
|
510,586
|
|
40,007
|
|
—
|
|
550,593
|
|
|||||||||
|
Other assets, net
|
2,408
|
|
47,815
|
|
564
|
|
(2,408
|
)
|
48,379
|
|
|||||||||
|
Investment in subsidiaries
|
3,945,862
|
|
474,772
|
|
—
|
|
(4,420,634
|
)
|
—
|
|
|||||||||
|
Intercompany note receivable
|
1,048,993
|
|
—
|
|
—
|
|
(1,048,993
|
)
|
—
|
|
|||||||||
|
Due from intercompany, net
|
—
|
|
102,886
|
|
297,580
|
|
(400,466
|
)
|
—
|
|
|||||||||
|
|
$
|
5,000,443
|
|
$
|
9,189,568
|
|
$
|
723,138
|
|
$
|
(5,872,501
|
)
|
$
|
9,040,648
|
|
||||
|
Liabilities and Stockholders' Equity
|
|||||||||||||||||||
|
Current liabilities:
|
|||||||||||||||||||
|
Accounts payable
|
$
|
—
|
|
$
|
2,954,632
|
|
$
|
218,158
|
|
$
|
—
|
|
$
|
3,172,790
|
|
||||
|
Accrued expenses
|
3,444
|
|
603,460
|
|
16,237
|
|
—
|
|
623,141
|
|
|||||||||
|
Other current liabilities
|
—
|
|
91,994
|
|
(1,975
|
)
|
—
|
|
90,019
|
|
|||||||||
|
Total current liabilities
|
3,444
|
|
3,650,086
|
|
232,420
|
|
—
|
|
3,885,950
|
|
|||||||||
|
Long-term debt
|
1,045,720
|
|
—
|
|
—
|
|
—
|
|
1,045,720
|
|
|||||||||
|
Deferred income taxes
|
—
|
|
306,127
|
|
14,634
|
|
(2,408
|
)
|
318,353
|
|
|||||||||
|
Other long-term liabilities
|
—
|
|
238,500
|
|
1,312
|
|
—
|
|
239,812
|
|
|||||||||
|
Intercompany note payable
|
—
|
|
1,048,993
|
|
—
|
|
(1,048,993
|
)
|
—
|
|
|||||||||
|
Due to intercompany, net
|
400,466
|
|
—
|
|
—
|
|
(400,466
|
)
|
—
|
|
|||||||||
|
Commitments and contingencies
|
|
|
|
|
|
||||||||||||||
|
Stockholders' equity
|
3,550,813
|
|
3,945,862
|
|
474,772
|
|
(4,420,634
|
)
|
3,550,813
|
|
|||||||||
|
|
$
|
5,000,443
|
|
$
|
9,189,568
|
|
$
|
723,138
|
|
$
|
(5,872,501
|
)
|
$
|
9,040,648
|
|
||||
59
Condensed Consolidating Balance Sheet
As of
December 30, 2017
|
(in thousands)
|
Advance Auto Parts, Inc.
|
Guarantor Subsidiaries
|
Non-Guarantor Subsidiaries
|
Eliminations
|
Consolidated
|
||||||||||||||
|
Assets
|
|||||||||||||||||||
|
Current assets:
|
|||||||||||||||||||
|
Cash and cash equivalents
|
$
|
23
|
|
$
|
482,620
|
|
$
|
64,317
|
|
$
|
(23
|
)
|
$
|
546,937
|
|
||||
|
Receivables, net
|
—
|
|
567,460
|
|
38,897
|
|
—
|
|
606,357
|
|
|||||||||
|
Inventories
|
—
|
|
3,986,724
|
|
181,768
|
|
—
|
|
4,168,492
|
|
|||||||||
|
Other current assets
|
—
|
|
103,118
|
|
2,063
|
|
(75
|
)
|
105,106
|
|
|||||||||
|
Total current assets
|
23
|
|
5,139,922
|
|
287,045
|
|
(98
|
)
|
5,426,892
|
|
|||||||||
|
Property and equipment, net of accumulated depreciation
|
103
|
|
1,384,115
|
|
9,920
|
|
—
|
|
1,394,138
|
|
|||||||||
|
Goodwill
|
—
|
|
943,359
|
|
50,934
|
|
—
|
|
994,293
|
|
|||||||||
|
Intangible assets, net
|
—
|
|
551,781
|
|
45,893
|
|
—
|
|
597,674
|
|
|||||||||
|
Other assets, net
|
3,224
|
|
68,749
|
|
554
|
|
(3,223
|
)
|
69,304
|
|
|||||||||
|
Investment in subsidiaries
|
3,521,330
|
|
448,462
|
|
—
|
|
(3,969,792
|
)
|
—
|
|
|||||||||
|
Intercompany note receivable
|
1,048,700
|
|
—
|
|
—
|
|
(1,048,700
|
)
|
—
|
|
|||||||||
|
Due from intercompany, net
|
—
|
|
—
|
|
332,467
|
|
(332,467
|
)
|
—
|
|
|||||||||
|
|
$
|
4,573,380
|
|
$
|
8,536,388
|
|
$
|
726,813
|
|
$
|
(5,354,280
|
)
|
$
|
8,482,301
|
|
||||
|
Liabilities and Stockholders' Equity
|
|||||||||||||||||||
|
Current liabilities:
|
|||||||||||||||||||
|
Accounts payable
|
$
|
—
|
|
$
|
2,657,792
|
|
$
|
236,790
|
|
$
|
—
|
|
$
|
2,894,582
|
|
||||
|
Accrued expenses
|
1,134
|
|
511,841
|
|
20,648
|
|
(75
|
)
|
533,548
|
|
|||||||||
|
Other current liabilities
|
—
|
|
50,963
|
|
1,027
|
|
(23
|
)
|
51,967
|
|
|||||||||
|
Total current liabilities
|
1,134
|
|
3,220,596
|
|
258,465
|
|
(98
|
)
|
3,480,097
|
|
|||||||||
|
Long-term debt
|
1,044,327
|
|
—
|
|
—
|
|
—
|
|
1,044,327
|
|
|||||||||
|
Deferred income taxes
|
—
|
|
288,999
|
|
17,844
|
|
(3,223
|
)
|
303,620
|
|
|||||||||
|
Other long-term liabilities
|
—
|
|
237,019
|
|
2,042
|
|
—
|
|
239,061
|
|
|||||||||
|
Intercompany note payable
|
—
|
|
1,048,700
|
|
—
|
|
(1,048,700
|
)
|
—
|
|
|||||||||
|
Due to intercompany, net
|
112,723
|
|
219,744
|
|
—
|
|
(332,467
|
)
|
—
|
|
|||||||||
|
Commitments and contingencies
|
|||||||||||||||||||
|
Stockholders' equity
|
3,415,196
|
|
3,521,330
|
|
448,462
|
|
(3,969,792
|
)
|
3,415,196
|
|
|||||||||
|
|
$
|
4,573,380
|
|
$
|
8,536,388
|
|
$
|
726,813
|
|
$
|
(5,354,280
|
)
|
$
|
8,482,301
|
|
||||
60
Condensed Consolidating Statement of Operations
For the Year Ended
December 29, 2018
|
(in thousands)
|
Advance Auto Parts, Inc.
|
Guarantor Subsidiaries
|
Non-Guarantor Subsidiaries
|
Eliminations
|
Consolidated
|
||||||||||||||
|
Net sales
|
$
|
—
|
|
$
|
9,225,772
|
|
$
|
519,883
|
|
$
|
(165,101
|
)
|
$
|
9,580,554
|
|
||||
|
Cost of sales,
including purchasing and warehousing costs
|
—
|
|
5,169,076
|
|
357,166
|
|
(165,101
|
)
|
5,361,141
|
|
|||||||||
|
Gross profit
|
—
|
|
4,056,696
|
|
162,717
|
|
—
|
|
4,219,413
|
|
|||||||||
|
Selling, general and administrative expenses
|
20,235
|
|
3,547,645
|
|
98,412
|
|
(51,154
|
)
|
3,615,138
|
|
|||||||||
|
Operating (loss) income
|
(20,235
|
)
|
509,051
|
|
64,305
|
|
51,154
|
|
604,275
|
|
|||||||||
|
Other, net:
|
|||||||||||||||||||
|
Interest (expense) income
|
(52,253
|
)
|
(4,336
|
)
|
1
|
|
—
|
|
(56,588
|
)
|
|||||||||
|
Other income (expense), net
|
73,174
|
|
(6,961
|
)
|
(7,482
|
)
|
(51,154
|
)
|
7,577
|
|
|||||||||
|
Total other, net
|
20,921
|
|
(11,297
|
)
|
(7,481
|
)
|
(51,154
|
)
|
(49,011
|
)
|
|||||||||
|
Income before provision for income taxes
|
686
|
|
497,754
|
|
56,824
|
|
—
|
|
555,264
|
|
|||||||||
|
Provision for income taxes
|
2,519
|
|
117,015
|
|
11,883
|
|
—
|
|
131,417
|
|
|||||||||
|
(Loss) income before equity in earnings of subsidiaries
|
(1,833
|
)
|
380,739
|
|
44,941
|
|
—
|
|
423,847
|
|
|||||||||
|
Equity in earnings of subsidiaries
|
425,680
|
|
44,941
|
|
—
|
|
(470,621
|
)
|
—
|
|
|||||||||
|
Net income
|
$
|
423,847
|
|
$
|
425,680
|
|
$
|
44,941
|
|
$
|
(470,621
|
)
|
$
|
423,847
|
|
||||
Condensed Consolidating Statement of Operations
For the Year Ended
December 30, 2017
|
(in thousands)
|
Advance Auto Parts, Inc.
|
Guarantor Subsidiaries
|
Non-Guarantor Subsidiaries
|
Eliminations
|
Consolidated
|
||||||||||||||
|
Net sales
|
$
|
—
|
|
$
|
9,034,790
|
|
$
|
550,450
|
|
$
|
(211,456
|
)
|
$
|
9,373,784
|
|
||||
|
Cost of sales,
including purchasing and warehousing costs
|
—
|
|
5,107,063
|
|
393,128
|
|
(211,456
|
)
|
5,288,735
|
|
|||||||||
|
Gross profit
|
—
|
|
3,927,727
|
|
157,322
|
|
—
|
|
4,085,049
|
|
|||||||||
|
Selling, general and administrative expenses
|
30,478
|
|
3,453,406
|
|
82,155
|
|
(51,202
|
)
|
3,514,837
|
|
|||||||||
|
Operating (loss) income
|
(30,478
|
)
|
474,321
|
|
75,167
|
|
51,202
|
|
570,212
|
|
|||||||||
|
Other, net:
|
|||||||||||||||||||
|
Interest (expense) income
|
(52,305
|
)
|
(6,496
|
)
|
—
|
|
—
|
|
(58,801
|
)
|
|||||||||
|
Other income (expense), net
|
83,840
|
|
(17,729
|
)
|
(6,061
|
)
|
(51,202
|
)
|
8,848
|
|
|||||||||
|
Total other, net
|
31,535
|
|
(24,225
|
)
|
(6,061
|
)
|
(51,202
|
)
|
(49,953
|
)
|
|||||||||
|
Income before provision for income taxes
|
1,057
|
|
450,096
|
|
69,106
|
|
—
|
|
520,259
|
|
|||||||||
|
Provision for income taxes
|
641
|
|
32,623
|
|
11,490
|
|
—
|
|
44,754
|
|
|||||||||
|
Income before equity in earnings of subsidiaries
|
416
|
|
417,473
|
|
57,616
|
|
—
|
|
475,505
|
|
|||||||||
|
Equity in earnings of subsidiaries
|
475,089
|
|
57,616
|
|
—
|
|
(532,705
|
)
|
—
|
|
|||||||||
|
Net income
|
$
|
475,505
|
|
$
|
475,089
|
|
$
|
57,616
|
|
$
|
(532,705
|
)
|
$
|
475,505
|
|
||||
61
Condensed Consolidating Statement of Operations
For the Year Ended
December 31, 2016
|
(in thousands)
|
Advance Auto Parts, Inc.
|
Guarantor Subsidiaries
|
Non-Guarantor Subsidiaries
|
Eliminations
|
Consolidated
|
||||||||||||||
|
Net sales
|
$
|
—
|
|
$
|
9,254,477
|
|
$
|
556,747
|
|
$
|
(243,545
|
)
|
$
|
9,567,679
|
|
||||
|
Cost of sales,
including purchasing and warehousing costs
|
—
|
|
5,171,953
|
|
383,356
|
|
(243,545
|
)
|
5,311,764
|
|
|||||||||
|
Gross profit
|
—
|
|
4,082,524
|
|
173,391
|
|
—
|
|
4,255,915
|
|
|||||||||
|
Selling, general and administrative expenses
|
28,695
|
|
3,402,323
|
|
92,287
|
|
(54,988
|
)
|
3,468,317
|
|
|||||||||
|
Operating (loss) income
|
(28,695
|
)
|
680,201
|
|
81,104
|
|
54,988
|
|
787,598
|
|
|||||||||
|
Other, net:
|
|||||||||||||||||||
|
Interest (expense) income
|
(52,081
|
)
|
(7,897
|
)
|
68
|
|
—
|
|
(59,910
|
)
|
|||||||||
|
Other income (expense), net
|
81,683
|
|
(19,558
|
)
|
4,010
|
|
(54,988
|
)
|
11,147
|
|
|||||||||
|
Total other, net
|
29,602
|
|
(27,455
|
)
|
4,078
|
|
(54,988
|
)
|
(48,763
|
)
|
|||||||||
|
Income before provision for income taxes
|
907
|
|
652,746
|
|
85,182
|
|
—
|
|
738,835
|
|
|||||||||
|
Provision for income taxes
|
1,588
|
|
260,155
|
|
17,470
|
|
—
|
|
279,213
|
|
|||||||||
|
(Loss) income before equity in earnings of subsidiaries
|
(681
|
)
|
392,591
|
|
67,712
|
|
—
|
|
459,622
|
|
|||||||||
|
Equity in earnings of subsidiaries
|
460,303
|
|
67,712
|
|
—
|
|
(528,015
|
)
|
—
|
|
|||||||||
|
Net income
|
$
|
459,622
|
|
$
|
460,303
|
|
$
|
67,712
|
|
$
|
(528,015
|
)
|
$
|
459,622
|
|
||||
62
Condensed Consolidating Statement of Comprehensive Income
For the Year Ended
December 29, 2018
|
(in thousands)
|
Advance Auto Parts, Inc.
|
Guarantor Subsidiaries
|
Non-Guarantor Subsidiaries
|
Eliminations
|
Consolidated
|
||||||||||||||
|
Net income
|
$
|
423,847
|
|
$
|
425,680
|
|
$
|
44,941
|
|
$
|
(470,621
|
)
|
$
|
423,847
|
|
||||
|
Other comprehensive loss:
|
|||||||||||||||||||
|
Changes in net unrecognized other postretirement benefit costs
|
—
|
|
(294
|
)
|
—
|
|
—
|
|
(294
|
)
|
|||||||||
|
Currency translation adjustments
|
—
|
|
—
|
|
(18,945
|
)
|
—
|
|
(18,945
|
)
|
|||||||||
|
Equity in other comprehensive loss of subsidiaries
|
(19,239
|
)
|
(18,945
|
)
|
—
|
|
38,184
|
|
—
|
|
|||||||||
|
Total other comprehensive loss
|
(19,239
|
)
|
(19,239
|
)
|
(18,945
|
)
|
38,184
|
|
(19,239
|
)
|
|||||||||
|
Comprehensive income
|
$
|
404,608
|
|
$
|
406,441
|
|
$
|
25,996
|
|
$
|
(432,437
|
)
|
$
|
404,608
|
|
||||
Condensed Consolidating Statement of Comprehensive Income
For the Year Ended
December 30, 2017
|
(in thousands)
|
Advance Auto Parts, Inc.
|
Guarantor Subsidiaries
|
Non-Guarantor Subsidiaries
|
Eliminations
|
Consolidated
|
||||||||||||||
|
Net income
|
$
|
475,505
|
|
$
|
475,089
|
|
$
|
57,616
|
|
$
|
(532,705
|
)
|
$
|
475,505
|
|
||||
|
Other comprehensive income:
|
|||||||||||||||||||
|
Changes in net unrecognized other postretirement benefit costs
|
—
|
|
(194
|
)
|
—
|
|
—
|
|
(194
|
)
|
|||||||||
|
Currency translation adjustments
|
—
|
|
—
|
|
14,941
|
|
—
|
|
14,941
|
|
|||||||||
|
Equity in other comprehensive income of subsidiaries
|
14,747
|
|
14,941
|
|
—
|
|
(29,688
|
)
|
—
|
|
|||||||||
|
Total other comprehensive income
|
14,747
|
|
14,747
|
|
14,941
|
|
(29,688
|
)
|
14,747
|
|
|||||||||
|
Comprehensive income
|
$
|
490,252
|
|
$
|
489,836
|
|
$
|
72,557
|
|
$
|
(562,393
|
)
|
$
|
490,252
|
|
||||
Condensed Consolidating Statement of Comprehensive Income
For the Year Ended
December 31, 2016
|
(in thousands)
|
Advance Auto Parts, Inc.
|
Guarantor Subsidiaries
|
Non-Guarantor Subsidiaries
|
Eliminations
|
Consolidated
|
||||||||||||||
|
Net income
|
$
|
459,622
|
|
$
|
460,303
|
|
$
|
67,712
|
|
$
|
(528,015
|
)
|
$
|
459,622
|
|
||||
|
Other comprehensive income:
|
|||||||||||||||||||
|
Changes in net unrecognized other postretirement benefit costs
|
—
|
|
(534
|
)
|
—
|
|
—
|
|
(534
|
)
|
|||||||||
|
Currency translation adjustments
|
—
|
|
—
|
|
4,892
|
|
—
|
|
4,892
|
|
|||||||||
|
Equity in other comprehensive income of subsidiaries
|
4,358
|
|
4,892
|
|
—
|
|
(9,250
|
)
|
—
|
|
|||||||||
|
Other comprehensive income
|
4,358
|
|
4,358
|
|
4,892
|
|
(9,250
|
)
|
4,358
|
|
|||||||||
|
Comprehensive income
|
$
|
463,980
|
|
$
|
464,661
|
|
$
|
72,604
|
|
$
|
(537,265
|
)
|
$
|
463,980
|
|
||||
63
Condensed Consolidating Statement of Cash Flows
For the Year Ended
December 29, 2018
|
(in thousands)
|
Advance Auto Parts, Inc.
|
Guarantor Subsidiaries
|
Non-Guarantor Subsidiaries
|
Eliminations
|
Consolidated
|
||||||||||||||
|
Net cash provided by operating activities
|
$
|
—
|
|
$
|
753,948
|
|
$
|
57,080
|
|
$
|
—
|
|
$
|
811,028
|
|
||||
|
Cash flows from investing activities:
|
|||||||||||||||||||
|
Purchases of property and equipment
|
—
|
|
(192,156
|
)
|
(1,559
|
)
|
—
|
|
(193,715
|
)
|
|||||||||
|
Proceeds from sales of property and equipment
|
—
|
|
1,842
|
|
46
|
|
—
|
|
1,888
|
|
|||||||||
|
Other, net
|
—
|
|
—
|
|
—
|
|
—
|
|
—
|
|
|||||||||
|
Net cash used in investing activities
|
—
|
|
(190,314
|
)
|
(1,513
|
)
|
—
|
|
(191,827
|
)
|
|||||||||
|
Cash flows from financing activities:
|
|||||||||||||||||||
|
Increase (decrease) in bank overdrafts
|
—
|
|
35,280
|
|
(3,266
|
)
|
—
|
|
32,014
|
|
|||||||||
|
Dividends paid
|
—
|
|
(17,819
|
)
|
—
|
|
—
|
|
(17,819
|
)
|
|||||||||
|
Proceeds from the issuance of common stock
|
—
|
|
3,200
|
|
—
|
|
—
|
|
3,200
|
|
|||||||||
|
Tax withholdings related to the exercise of stock appreciation rights
|
—
|
|
(773
|
)
|
—
|
|
—
|
|
(773
|
)
|
|||||||||
|
Repurchase of common stock
|
—
|
|
(281,354
|
)
|
—
|
|
—
|
|
(281,354
|
)
|
|||||||||
|
Other, net
|
(23
|
)
|
817
|
|
—
|
|
23
|
|
817
|
|
|||||||||
|
Net cash used in financing activities
|
(23
|
)
|
(260,649
|
)
|
(3,266
|
)
|
23
|
|
(263,915
|
)
|
|||||||||
|
Effect of exchange rate changes on cash
|
—
|
|
—
|
|
(5,696
|
)
|
—
|
|
(5,696
|
)
|
|||||||||
|
Net (decrease) increase in cash and cash equivalents
|
(23
|
)
|
302,985
|
|
46,605
|
|
23
|
|
349,590
|
|
|||||||||
|
Cash and cash equivalents
, beginning of period
|
23
|
|
482,620
|
|
64,317
|
|
(23
|
)
|
546,937
|
|
|||||||||
|
Cash and cash equivalents
, end of period
|
$
|
—
|
|
$
|
785,605
|
|
$
|
110,922
|
|
$
|
—
|
|
$
|
896,527
|
|
||||
64
Condensed Consolidating Statement of Cash Flows
For the Year Ended
December 30, 2017
|
(in thousands)
|
Advance Auto Parts, Inc.
|
Guarantor Subsidiaries
|
Non-Guarantor Subsidiaries
|
Eliminations
|
Consolidated
|
||||||||||||||
|
Net cash provided by operating activities
|
$
|
—
|
|
$
|
593,091
|
|
$
|
7,714
|
|
$
|
—
|
|
$
|
600,805
|
|
||||
|
Cash flows from investing activities:
|
|||||||||||||||||||
|
Purchases of property and equipment
|
—
|
|
(187,993
|
)
|
(1,765
|
)
|
—
|
|
(189,758
|
)
|
|||||||||
|
Proceeds from sales of property and equipment
|
—
|
|
11,085
|
|
14
|
|
—
|
|
11,099
|
|
|||||||||
|
Other, net
|
—
|
|
480
|
|
(460
|
)
|
—
|
|
20
|
|
|||||||||
|
Net cash used in investing activities
|
—
|
|
(176,428
|
)
|
(2,211
|
)
|
—
|
|
(178,639
|
)
|
|||||||||
|
Cash flows from financing activities:
|
|||||||||||||||||||
|
Increase (decrease) in bank overdrafts
|
—
|
|
16,290
|
|
(2,286
|
)
|
—
|
|
14,004
|
|
|||||||||
|
Borrowings under credit facilities
|
—
|
|
534,400
|
|
—
|
|
—
|
|
534,400
|
|
|||||||||
|
Payments on credit facilities
|
—
|
|
(534,400
|
)
|
—
|
|
—
|
|
(534,400
|
)
|
|||||||||
|
Dividends paid
|
—
|
|
(17,854
|
)
|
—
|
|
—
|
|
(17,854
|
)
|
|||||||||
|
Proceeds from the issuance of common stock
|
—
|
|
4,076
|
|
—
|
|
—
|
|
4,076
|
|
|||||||||
|
Tax withholdings related to the exercise of stock appreciation rights
|
—
|
|
(6,531
|
)
|
—
|
|
—
|
|
(6,531
|
)
|
|||||||||
|
Repurchase of common stock
|
—
|
|
(6,498
|
)
|
—
|
|
—
|
|
(6,498
|
)
|
|||||||||
|
Other, net
|
1
|
|
(2,069
|
)
|
—
|
|
(1
|
)
|
(2,069
|
)
|
|||||||||
|
Net cash provided by (used in) financing activities
|
1
|
|
(12,586
|
)
|
(2,286
|
)
|
(1
|
)
|
(14,872
|
)
|
|||||||||
|
Effect of exchange rate changes on cash
|
—
|
|
—
|
|
4,465
|
|
—
|
|
4,465
|
|
|||||||||
|
Net increase in cash and cash equivalents
|
1
|
|
404,077
|
|
7,682
|
|
(1
|
)
|
411,759
|
|
|||||||||
|
Cash and cash equivalents
, beginning of period
|
22
|
|
78,543
|
|
56,635
|
|
(22
|
)
|
135,178
|
|
|||||||||
|
Cash and cash equivalents
, end of period
|
$
|
23
|
|
$
|
482,620
|
|
$
|
64,317
|
|
$
|
(23
|
)
|
$
|
546,937
|
|
||||
65
Condensed Consolidating Statement of Cash Flows
For the Year Ended
December 31, 2016
|
(in thousands)
|
Advance Auto Parts, Inc.
|
Guarantor Subsidiaries
|
Non-Guarantor Subsidiaries
|
Eliminations
|
Consolidated
|
||||||||||||||
|
Net cash provided by operating activities
|
$
|
14
|
|
$
|
491,180
|
|
$
|
32,109
|
|
$
|
—
|
|
$
|
523,303
|
|
||||
|
Cash flows from investing activities:
|
|||||||||||||||||||
|
Purchases of property and equipment
|
—
|
|
(257,159
|
)
|
(2,400
|
)
|
—
|
|
(259,559
|
)
|
|||||||||
|
Proceeds from sales of property and equipment
|
—
|
|
2,210
|
|
2
|
|
—
|
|
2,212
|
|
|||||||||
|
Other, net
|
—
|
|
(4,697
|
)
|
—
|
|
—
|
|
(4,697
|
)
|
|||||||||
|
Net cash used in investing activities
|
—
|
|
(259,646
|
)
|
(2,398
|
)
|
—
|
|
(262,044
|
)
|
|||||||||
|
Cash flows from financing activities:
|
|||||||||||||||||||
|
Decrease in bank overdrafts
|
—
|
|
(4,902
|
)
|
(657
|
)
|
(14
|
)
|
(5,573
|
)
|
|||||||||
|
Borrowings under credit facilities
|
—
|
|
799,600
|
|
—
|
|
—
|
|
799,600
|
|
|||||||||
|
Payments on credit facilities
|
—
|
|
(959,600
|
)
|
—
|
|
—
|
|
(959,600
|
)
|
|||||||||
|
Dividends paid
|
—
|
|
(17,738
|
)
|
—
|
|
—
|
|
(17,738
|
)
|
|||||||||
|
Proceeds from the issuance of common stock
|
—
|
|
4,532
|
|
—
|
|
—
|
|
4,532
|
|
|||||||||
|
Tax withholdings related to the exercise of stock appreciation rights
|
—
|
|
(19,558
|
)
|
—
|
|
—
|
|
(19,558
|
)
|
|||||||||
|
Repurchase of common stock
|
—
|
|
(18,393
|
)
|
—
|
|
—
|
|
(18,393
|
)
|
|||||||||
|
Other, net
|
—
|
|
(390
|
)
|
—
|
|
—
|
|
(390
|
)
|
|||||||||
|
Net cash used in financing activities
|
—
|
|
(216,449
|
)
|
(657
|
)
|
(14
|
)
|
(217,120
|
)
|
|||||||||
|
Effect of exchange rate changes on cash
|
—
|
|
—
|
|
257
|
|
—
|
|
257
|
|
|||||||||
|
Net increase in cash and cash equivalents
|
14
|
|
15,085
|
|
29,311
|
|
(14
|
)
|
44,396
|
|
|||||||||
|
Cash and cash equivalents
, beginning of period
|
8
|
|
63,458
|
|
27,324
|
|
(8
|
)
|
90,782
|
|
|||||||||
|
Cash and cash equivalents
, end of period
|
$
|
22
|
|
$
|
78,543
|
|
$
|
56,635
|
|
$
|
(22
|
)
|
$
|
135,178
|
|
||||
66
|
19.
|
Quarterly Financial Data (unaudited):
|
The following table summarizes quarterly financial data for
2018
and
2017
:
|
2018
|
First
|
Second
|
Third
|
Fourth
|
||||||||||||
|
(in thousands, except per share data)
|
(16 weeks)
|
(12 weeks)
|
(12 weeks)
|
(12 weeks)
|
||||||||||||
|
Net sales
|
$
|
2,873,848
|
|
$
|
2,326,652
|
|
$
|
2,274,982
|
|
$
|
2,105,072
|
|
||||
|
Gross profit
|
$
|
1,272,284
|
|
$
|
1,011,559
|
|
$
|
1,006,927
|
|
$
|
928,643
|
|
||||
|
Net income
|
$
|
136,727
|
|
$
|
117,836
|
|
$
|
115,843
|
|
$
|
53,441
|
|
||||
|
Basic earnings per common share
|
$
|
1.85
|
|
$
|
1.59
|
|
$
|
1.57
|
|
$
|
0.74
|
|
||||
|
Diluted earnings per common share
|
$
|
1.84
|
|
$
|
1.59
|
|
$
|
1.56
|
|
$
|
0.74
|
|
||||
|
2017
|
First
|
Second
|
Third
|
Fourth
|
||||||||||||
|
(in thousands, except per share data)
|
(16 weeks)
|
(12 weeks)
|
(12 weeks)
|
(12 weeks)
|
||||||||||||
|
Net sales
|
$
|
2,890,838
|
|
$
|
2,263,727
|
|
$
|
2,182,233
|
|
$
|
2,036,986
|
|
||||
|
Gross profit
|
$
|
1,270,684
|
|
$
|
993,088
|
|
$
|
947,708
|
|
$
|
873,569
|
|
||||
|
Net income
|
$
|
107,960
|
|
$
|
87,049
|
|
$
|
95,996
|
|
$
|
184,500
|
|
||||
|
Basic earnings per common share
|
$
|
1.46
|
|
$
|
1.18
|
|
$
|
1.30
|
|
$
|
2.50
|
|
||||
|
Diluted earnings per common share
|
$
|
1.46
|
|
$
|
1.17
|
|
$
|
1.30
|
|
$
|
2.49
|
|
||||
Quarterly and year-to-date computations of per share amounts are made independently. Therefore, the sum of per share amounts for the quarters may not be equal to the per share amount for the year.
67
Advance Auto Parts, Inc.
Schedule II - Valuation and Qualifying Accounts
(in thousands)
|
Allowance for doubtful accounts receivable
|
Balance at Beginning of Period
|
Charges to Expenses
|
Deductions
|
Balance at End of Period
|
||||||||||||
|
December 31, 2016
|
$
|
25,758
|
|
$
|
24,597
|
|
$
|
(21,191
|
)
|
(1)
|
$
|
29,164
|
|
|||
|
December 30, 2017
|
$
|
29,164
|
|
$
|
20,110
|
|
$
|
(31,055
|
)
|
(1)
|
$
|
18,219
|
|
|||
|
December 29, 2018
|
$
|
18,219
|
|
$
|
18,445
|
|
$
|
(18,622
|
)
|
(1)
|
$
|
18,042
|
|
|||
|
(1)
|
Accounts written off during the period. These amounts did not impact our statement of operations for any year presented.
|
Other valuation and qualifying accounts have not been reported in this schedule because they are either not applicable or because the information has been included elsewhere in this report
.
68
EXHIBIT INDEX
|
|
|
Incorporated by Reference
|
Filed
|
|||
|
Exhibit No.
|
Exhibit Description
|
Form
|
Exhibit
|
Filing Date
|
Herewith
|
|
|
2.1
|
10-K
|
2.1
|
|
2/25/2014
|
||
|
3.1
|
10-Q
|
3.1
|
|
8/14/2018
|
||
|
3.2
|
10-Q
|
3.2
|
|
5/22/2018
|
||
|
4.1
|
8-K
|
4.1
|
|
4/29/2010
|
||
|
4.2
|
8-K
|
4.2
|
|
4/29/2010
|
||
|
4.3
|
8-K
|
10.45
|
|
6/3/2011
|
||
|
4.4
|
8-K
|
4.4
|
|
1/17/2012
|
||
|
4.5
|
8-K
|
4.5
|
|
12/21/2012
|
||
|
4.6
|
8-K
|
4.6
|
|
4/19/2013
|
||
|
4.7
|
8-K
|
4.7
|
|
12/9/2013
|
||
|
4.8
|
8-K
|
4.3
|
|
4/29/2010
|
||
|
4.9
|
8-K
|
4.5
|
|
1/17/2012
|
||
|
4.10
|
8-K
|
4.7
|
|
12/9/2013
|
||
|
4.11
|
10-Q
|
4.11
|
|
5/28/2014
|
||
|
10.1
|
8-K
|
10.19
|
|
5/20/2004
|
||
|
10.2
|
10-Q
|
10.19
|
|
5/29/2008
|
||
69
|
|
|
Incorporated by Reference
|
Filed
|
|||
|
Exhibit No.
|
Exhibit Description
|
Form
|
Exhibit
|
Filing Date
|
Herewith
|
|
|
10.3
|
10-K
|
10.17
|
|
3/1/2011
|
||
|
10.4
|
DEF 14A
|
Appendix C
|
|
4/16/2012
|
||
|
10.5
|
10-K
|
10.19
|
|
3/1/2011
|
||
|
10.6
|
DEF 14A
|
Appendix B
|
|
4/11/2007
|
||
|
10.7
|
8-K
|
10.35
|
|
6/4/2008
|
||
|
10.8
|
8-K
|
10.39
|
|
11/21/2008
|
||
|
10.9
|
10-K
|
10.33
|
|
2/28/2012
|
||
|
10.10
|
10-K
|
10.34
|
|
2/28/2012
|
||
|
10.11
|
8-K
|
10.1
|
|
12/21/2012
|
||
|
10.12
|
10-K
|
10.33
|
|
2/25/2013
|
||
|
10.13
|
10-K
|
10.34
|
|
2/25/2013
|
||
|
10.14
|
10-K
|
10.36
|
|
2/25/2013
|
||
|
10.15
|
8-K
|
10.38
|
|
3/7/2013
|
||
|
10.16
|
8-K
|
10.1
|
|
12/9/2013
|
||
|
10.17
|
8-K
|
10.2
|
|
12/9/2013
|
||
|
10.18
|
10-K
|
10.45
|
|
2/25/2014
|
||
|
10.19
|
10-K
|
10.46
|
|
2/25/2014
|
||
|
10.20
|
10-K
|
10.48
|
|
2/25/2014
|
||
70
|
|
|
Incorporated by Reference
|
Filed
|
|||
|
Exhibit No.
|
Exhibit Description
|
Form
|
Exhibit
|
Filing Date
|
Herewith
|
|
|
10.21
|
10-K
|
10.50
|
|
3/3/2015
|
||
|
10.22
|
10-K
|
10.51
|
|
3/3/2015
|
||
|
10.23
|
10-K
|
10.52
|
|
3/3/2015
|
||
|
10.24
|
10-K
|
10.53
|
|
3/3/2015
|
||
|
10.25
|
10-K
|
10.54
|
|
3/3/2015
|
||
|
10.26
|
8-K
|
10.1
|
|
11/13/2015
|
||
|
10.27
|
10-K
|
10.58
|
|
3/1/2016
|
||
|
10.28
|
10-Q
|
10.1
|
|
5/31/2016
|
||
|
10.29
|
10-Q
|
10.2
|
|
5/31/2016
|
||
|
10.30
|
10-Q
|
10.3
|
|
5/31/2016
|
||
|
10.31
|
10-Q
|
10.4
|
|
5/31/2016
|
||
|
10.32
|
10-Q
|
10.5
|
|
5/31/2016
|
||
|
10.33
|
10-Q
|
10.6
|
|
5/31/2016
|
||
|
10.34
|
10-Q
|
10.7
|
|
5/31/2016
|
||
|
10.35
|
10-Q
|
10.1
|
|
11/15/2016
|
||
|
10.36
|
8-K
|
10.1
|
|
2/6/2017
|
||
|
10.37
|
8-K
|
10.2
|
|
2/6/2017
|
||
|
10.38
|
10-K
|
10.50
|
|
2/28/2017
|
||
|
10.39
|
10-K
|
10.52
|
|
2/28/2017
|
||
71
|
|
|
Incorporated by Reference
|
Filed
|
|||
|
Exhibit No.
|
Exhibit Description
|
Form
|
Exhibit
|
Filing Date
|
Herewith
|
|
|
10.40
|
10-K
|
10.53
|
|
2/28/2017
|
||
|
10.41
|
10-K
|
10.54
|
|
2/28/2017
|
||
|
10.42
|
10-K
|
10.55
|
|
2/28/2017
|
||
|
10.43
|
10-K
|
10.56
|
|
2/28/2017
|
||
|
10.44
|
10-K
|
10.57
|
|
2/28/2017
|
||
|
10.45
|
10-K
|
10.58
|
|
2/28/2017
|
||
|
10.46
|
DEF14A
|
Appendix A
|
|
4/6/2017
|
||
|
10.47
|
8-K
|
10.1
|
|
2/6/2018
|
||
|
10.48
|
10-K
|
10.57
|
|
2/21/2018
|
||
|
10.49
|
10-K
|
10.58
|
|
2/21/2018
|
||
|
10.50
|
10-Q
|
10.1
|
|
11/13/2018
|
||
|
10.51
|
8-K
|
10.1
|
|
10/15/2018
|
||
|
10.52
|
X
|
|||||
|
10.53
|
X
|
|||||
|
10.54
|
X
|
|||||
|
10.55
|
X
|
|||||
|
10.56
|
X
|
|||||
|
10.57
|
X
|
|||||
|
10.58
|
X
|
|||||
|
21.1
|
X
|
|||||
72
|
|
|
Incorporated by Reference
|
Filed
|
|||
|
Exhibit No.
|
Exhibit Description
|
Form
|
Exhibit
|
Filing Date
|
Herewith
|
|
|
23.1
|
X
|
|||||
|
31.1
|
X
|
|||||
|
31.2
|
X
|
|||||
|
32.1
|
X
|
|||||
|
101.INS
|
XBRL Instance Document
|
X
|
||||
|
101.SCH
|
XBRL Taxonomy Extension Schema Document
|
X
|
||||
|
101.CAL
|
XBRL Taxonomy Extension Calculation Linkbase Document
|
X
|
||||
|
101.DEF
|
XBRL Taxonomy Extension Definition Linkbase Document
|
X
|
||||
|
101.LAB
|
XBRL Taxonomy Extension Labels Linkbase Document
|
X
|
||||
|
101.PRE
|
XBRL Taxonomy Extension Presentation Linkbase Document
|
X
|
||||
73
Item 16. Form 10-K Summary.
None.
74
Signatures
Pursuant to the requirements of Section 13 or 15(d) of the Securities Exchange Act of 1934, the registrant has duly caused this report to be signed on its behalf by the undersigned, thereunto duly authorized.
|
ADVANCE AUTO PARTS, INC.
|
||||
|
Dated:
|
February 19, 2019
|
By:
|
/s/ Jeffrey W. Shepherd
|
|
|
Jeffrey W. Shepherd
|
||||
|
Executive Vice President, Chief Financial Officer, Controller and Chief Accounting Officer
|
||||
Pursuant to the requirements of the Securities Exchange Act of 1934, this report has been signed below by the following persons on behalf of the registrant and in the capacities and on the dates indicated.
|
Signature
|
Title
|
Date
|
||
|
/s/ Thomas R. Greco
|
President and Chief Executive Officer and Director
|
February 19, 2019
|
||
|
Thomas R. Greco
|
(Principal Executive Officer)
|
|||
|
/s/ Jeffrey W. Shepherd
|
Executive Vice President, Chief Financial Officer, Controller and Chief Accounting Officer
|
February 19, 2019
|
||
|
Jeffrey W. Shepherd
|
(Principal Financial and Accounting Officer)
|
|||
|
/s/ Jeffrey C. Smith
|
Chairman and Director
|
February 19, 2019
|
||
|
Jeffrey C. Smith
|
||||
|
/s/ John F. Bergstrom
|
Director
|
February 19, 2019
|
||
|
John F. Bergstrom
|
||||
|
/s/ Brad W. Buss
|
Director
|
February 19, 2019
|
||
|
Brad W. Buss
|
||||
|
/s/ Fiona P. Dias
|
Director
|
February 19, 2019
|
||
|
Fiona P. Dias
|
||||
|
/s/ John F. Ferraro
|
Director
|
February 19, 2019
|
||
|
John F. Ferraro
|
||||
|
/s/ Adriana Karaboutis
|
Director
|
February 19, 2019
|
||
|
Adriana Karaboutis
|
||||
|
/s/ Eugene I. Lee, Jr.
|
Director
|
February 19, 2019
|
||
|
Eugene I. Lee, Jr.
|
||||
|
/s/ Nigel Travis
|
Director
|
February 19, 2019
|
||
|
Nigel Travis
|
||||
|
/s/ Douglas A. Pertz
|
Director
|
February 19, 2019
|
||
|
Douglas A. Pertz
|
||||
|
/s/ Jeffrey J. Jones II
|
Director
|
February 19, 2019
|
||
|
Jeffrey J. Jones II
|
||||
|
/s/ Sharon L. McCollam
|
Director
|
February 19, 2019
|
||
|
Sharon L. McCollam
|
||||
75
TABLE OF CONTENTS
Part IItem 1. BusinessPart Cleaners and TreatmentsItem 1A. Risk FactorsItem 1B. Unresolved Staff CommentsItem 2. PropertiesItem 3. Legal ProceedingsItem 4. Mine Safety DisclosuresPart IIItem 5. Market For Registrant S Common Equity, Related Stockholder Matters and Issuer Purchases Of Equity SecuritiesItem 6. Selected Consolidated Financial DataItem 7. Management S Discussion and Analysis Of Financial Condition and Results Of OperationsItem 7. ManagementItem 7A. Quantitative and Qualitative Disclosures About Market RisksItem 8. Financial Statements and Supplementary DataItem 9. Changes in and Disagreements with Accountants on Accounting and Financial DisclosureItem 9A. Controls and ProceduresItem 9B. Other InformationPart IIIItem 10. Directors, Executive Officers and Corporate GovernanceItem 11. Executive CompensationItem 12. Security Ownership Of Certain Beneficial Owners and Management and Related Stockholder MattersItem 13. Certain Relationships and Related Transactions, and Director IndependenceItem 14. Principal Accountant Fees and ServicesPart IVItem 15. Exhibits, Financial Statement SchedulesItem 16. Form 10-k Summary