APPLE INC.
10-Ks and 10-Qs
|
|
|
|
|
|
|
|
|
|
|
|
|
|
|
|
|
|
|
|
|
|
|
|
|
|
|
|
|
|
|
|
|
|
|
|
|
|
|
|
|
|
|
|
|
|
|
|
|
|
|
|
|
|
|
|
|
|
|
UNITED STATES
SECURITIES AND EXCHANGE COMMISSION
Washington, D.C. 20549
FORM 10-K
(Mark One)
☒
ANNUAL REPORT PURSUANT TO SECTION 13 OR 15(d) OF THE SECURITIES EXCHANGE ACT OF 1934
For the fiscal year ended
September 30, 2017
or
☐
TRANSITION REPORT PURSUANT TO SECTION 13 OR 15(d) OF THE SECURITIES EXCHANGE ACT OF 1934
For the transition period from
to
Commission File Number:
001-36743

Apple Inc.
(Exact name of Registrant as specified in its charter)
|
California
|
94-2404110
|
|
|
(State or other jurisdiction
of incorporation or organization)
|
(I.R.S. Employer Identification No.)
|
|
|
1 Infinite Loop
Cupertino, California
|
95014
|
|
|
(Address of principal executive offices)
|
(Zip Code)
|
|
(408) 996-1010
(Registrant’s telephone number, including area code)
Securities registered pursuant to Section 12(b) of the Act:
|
Common Stock, $0.00001 par value per share
1.000% Notes due 2022
1.375% Notes due 2024
0.875% Notes due 2025
1.625% Notes due 2026
2.000% Notes due 2027
1.375% Notes due 2029
3.050% Notes due 2029
3.600% Notes due 2042
|
The Nasdaq Stock Market LLC
New York Stock Exchange LLC
New York Stock Exchange LLC
New York Stock Exchange LLC
New York Stock Exchange LLC
New York Stock Exchange LLC
New York Stock Exchange LLC
New York Stock Exchange LLC
New York Stock Exchange LLC
|
|
|
(Title of each class)
|
(Name of each exchange on which registered)
|
|
Securities registered pursuant to Section 12(g) of the Act: None
Indicate by check mark if the Registrant is a well-known seasoned issuer, as defined in Rule 405 of the Securities Act.
Yes
☒
No
☐
Indicate by check mark if the Registrant is not required to file reports pursuant to Section 13 or Section 15(d) of the Act.
Yes
☐
No
☒
Indicate by check mark whether the Registrant (1) has filed all reports required to be filed by Section 13 or 15(d) of the Securities Exchange Act of 1934 during the preceding 12 months (or for such shorter period that the Registrant was required to file such reports), and (2) has been subject to such filing requirements for the past 90 days.
Yes
☒
No
☐
Indicate by check mark whether the Registrant has submitted electronically and posted on its corporate Web site, if any, every Interactive Data File required to be submitted and posted pursuant to Rule 405 of Regulation S-T (§232.405 of this chapter) during the preceding 12 months (or for such shorter period that the Registrant was required to submit and post such files).
Yes
☒
No
☐
Indicate by check mark if disclosure of delinquent filers pursuant to Item 405 of Regulation S-K (§229.405 of this chapter) is not contained herein, and will not be contained, to the best of the Registrant’s knowledge, in definitive proxy or information statements incorporated by reference in Part III of this Form 10-K or any amendment to this Form 10-K.
☐
Indicate by check mark whether the Registrant is a large accelerated filer, an accelerated filer, a non-accelerated filer, smaller reporting company, or an emerging growth company. See the definitions of “large accelerated filer,” “accelerated filer,” “smaller reporting company,” and “emerging growth company” in Rule 12b-2 of the Exchange Act.
|
Large accelerated filer
|
☒
|
Accelerated filer
|
☐
|
|||
|
Non-accelerated filer
|
☐
(Do not check if a smaller reporting company)
|
Smaller reporting company
|
☐
|
|||
|
Emerging growth company
|
☐
|
|||||
If an emerging growth company, indicate by check mark if the Registrant has elected not to use the extended transition period for complying with any new or revised financial accounting standards provided pursuant to Section 13(a) of the Exchange Act.
☐
Indicate by check mark whether the Registrant is a shell company (as defined in Rule 12b-2 of the Act).
Yes
☐
No
☒
The aggregate market value of the voting and non-voting stock held by non-affiliates of the Registrant, as of
March 31, 2017
, the last business day of the Registrant’s most recently completed second fiscal quarter, was approximately
$747,509,000,000
. Solely for purposes of this disclosure, shares of common stock held by executive officers and directors of the Registrant as of such date have been excluded because such persons may be deemed to be affiliates. This determination of executive officers and directors as affiliates is not necessarily a conclusive determination for any other purposes.
5,134,312,000
shares of common stock were issued and outstanding as of
October 20, 2017
.
DOCUMENTS INCORPORATED BY REFERENCE
Portions of the Registrant’s definitive proxy statement relating to its
2018
annual meeting of shareholders (the “
2018
Proxy Statement”) are incorporated by reference into Part III of this Annual Report on Form 10-K where indicated. The
2018
Proxy Statement will be filed with the U.S. Securities and Exchange Commission within 120 days after the end of the fiscal year to which this report relates.
Apple Inc.
Form 10-K
For the Fiscal Year Ended
September 30, 2017
TABLE OF CONTENTS
This Annual Report on Form 10-K (“Form 10-K”) contains forward-looking statements, within the meaning of the Private Securities Litigation Reform Act of 1995, that involve risks and uncertainties. Many of the forward-looking statements are located in Part II, Item 7 of this Form 10-K under the heading “Management’s Discussion and Analysis of Financial Condition and Results of Operations.” Forward-looking statements provide current expectations of future events based on certain assumptions and include any statement that does not directly relate to any historical or current fact. Forward-looking statements can also be identified by words such as “future,” “anticipates,” “believes,” “estimates,” “expects,” “intends,” “plans,” “predicts,” “will,” “would,” “could,” “can,” “may,” and similar terms. Forward-looking statements are not guarantees of future performance and the Company’s actual results may differ significantly from the results discussed in the forward-looking statements. Factors that might cause such differences include, but are not limited to, those discussed in Part I, Item 1A of this Form 10-K under the heading “Risk Factors,” which are incorporated herein by reference. All information presented herein is based on the Company’s fiscal calendar. Unless otherwise stated, references to particular years, quarters, months or periods refer to the Company’s fiscal years ended in September and the associated quarters, months and periods of those fiscal years. Each of the terms the “Company” and “Apple” as used herein refers collectively to Apple Inc. and its wholly-owned subsidiaries, unless otherwise stated. The Company assumes no obligation to revise or update any forward-looking statements for any reason, except as required by law.
|
Item 1.
|
Business
|
Company Background
The Company designs, manufactures and markets mobile communication and media devices and personal computers, and sells a variety of related software, services, accessories, networking solutions and third-party digital content and applications. The Company’s products and services include iPhone
®
, iPad
®
, Mac
®
, Apple Watch
®
, Apple TV
®
, a portfolio of consumer and professional software applications, iOS, macOS
®
, watchOS
®
and tvOS™ operating systems, iCloud
®
, Apple Pay
®
and a variety of accessory, service and support offerings. The Company sells and delivers digital content and applications through the iTunes Store
®
, App Store
®
, Mac App Store, TV App Store, iBooks Store
®
and Apple Music
®
(collectively “Digital Content and Services”). The Company sells its products worldwide through its retail stores, online stores and direct sales force, as well as through third-party cellular network carriers, wholesalers, retailers and value-added resellers. In addition, the Company sells a variety of third-party Apple-compatible products, including application software and various accessories through its retail and online stores. The Company sells to consumers, small and mid-sized businesses and education, enterprise and government customers. The Company’s fiscal year is the 52 or 53-week period that ends on the last Saturday of September. The Company is a California corporation established in 1977.
Business Strategy
The Company is committed to bringing the best user experience to its customers through its innovative hardware, software and services. The Company’s business strategy leverages its unique ability to design and develop its own operating systems, hardware, application software and services to provide its customers products and solutions with innovative design, superior ease-of-use and seamless integration. As part of its strategy, the Company continues to expand its platform for the discovery and delivery of digital content and applications through its Digital Content and Services, which allows customers to discover and download digital content, iOS, Mac, Apple Watch and Apple TV applications, and books through either a Mac or Windows personal computer or through iPhone, iPad and iPod touch
®
devices (“iOS devices”), Apple TV and Apple Watch. The Company also supports a community for the development of third-party software and hardware products and digital content that complement the Company’s offerings. The Company believes a high-quality buying experience with knowledgeable salespersons who can convey the value of the Company’s products and services greatly enhances its ability to attract and retain customers. Therefore, the Company’s strategy also includes building and expanding its own retail and online stores and its third-party distribution network to effectively reach more customers and provide them with a high-quality sales and post-sales support experience. The Company believes ongoing investment in research and development (“R&D”), marketing and advertising is critical to the development and sale of innovative products, services and technologies.
Business Organization
The Company manages its business primarily on a geographic basis. The Company’s reportable segments consist of the Americas, Europe, Greater China, Japan and Rest of Asia Pacific. Americas includes both North and South America. Europe includes European countries, as well as India, the Middle East and Africa. Greater China includes China, Hong Kong and Taiwan. Rest of Asia Pacific includes Australia and those Asian countries not included in the Company’s other reportable segments. Although the reportable segments provide similar hardware and software products and similar services, each one is managed separately to better align with the location of the Company’s customers and distribution partners and the unique market dynamics of each geographic region. Further information regarding the Company’s reportable segments may be found in Part II, Item 7 of this Form 10-K under the subheading “Segment Operating Performance,” and in Part II, Item 8 of this Form 10-K in the Notes to Consolidated Financial Statements in Note 11, “Segment Information and Geographic Data.”
Apple Inc. | 2017 Form 10-K |
1
Products
iPhone
iPhone is the Company’s line of smartphones based on its iOS operating system. iPhone includes Siri
®
, a voice-activated intelligent assistant, and Apple Pay and Touch ID
®
on qualifying devices. In September 2017, the Company introduced iPhone 8 and 8 Plus, featuring a new glass and aluminum design, enhanced cameras and speakers, wireless charging and augmented reality optimization. Additionally, in September 2017, the Company announced iPhone X, featuring an all-glass design with a Super Retina™ OLED display and facial recognition. iPhone 8 and 8 Plus were available starting in September 2017, and iPhone X is expected to be available in November 2017. The Company’s line of smartphones also includes iPhone 7, 7 Plus, 6s, 6s Plus and SE models. iPhone works with the iTunes Store, App Store, iBooks Store and Apple Music for purchasing, organizing and playing digital content and apps.
iPad
iPad is the Company’s line of multi-purpose tablets based on its iOS operating system, which includes iPad Pro
®
, iPad and iPad mini™. iPad includes Siri, Apple Pay and Touch ID. In June 2017, the Company released a new 10.5-inch iPad Pro and an updated 12.9-inch iPad Pro with more advanced displays and enhanced performance. iPad works with the iTunes Store, App Store, iBooks Store and Apple Music for purchasing, organizing and playing digital content and apps.
Mac
Mac is the Company’s line of desktop and portable personal computers based on its macOS operating system. Mac includes Siri and Apple Pay and also includes Touch ID on qualifying devices. The Company’s desktop computers include iMac
®
, 21.5” iMac with Retina
®
4K display, 27” iMac with Retina 5K display, Mac Pro
®
and Mac mini
®
. In June 2017, the Company announced the new iMac Pro™, which is expected to be available in December 2017. The Company’s portable computers include MacBook
®
, MacBook Air
®
, MacBook Pro
®
and MacBook Pro with Touch Bar™.
Operating Systems
iOS
iOS is the Company’s mobile operating system that serves as the foundation for iOS devices. Devices running iOS are compatible with both Mac and Windows personal computers and Apple’s iCloud services. In September 2017, the Company released iOS 11, which includes new iPad features, new capabilities to improve images in Photos and Camera, enhanced Siri functionality and a redesigned App Store. iOS 11 also introduces ARKit, an augmented reality framework for developers.
macOS
macOS is the Company’s desktop operating system and is built on an open-source UNIX-based foundation and provides an intuitive and integrated computer experience. Support for iCloud is built into macOS so users can access content and information from Mac, iOS devices and other supported devices and access downloaded content and apps from the iTunes Store. macOS High Sierra, released in September 2017, is the 14th major release of macOS and incorporates new storage, video and graphics technologies, and includes improvements to Photos, Safari
®
and Mail.
watchOS
watchOS is the Company’s operating system for Apple Watch. In September 2017, the Company released watchOS 4, which adds a proactive Siri watch face that displays the information users need most throughout the day, personalized activity coaching and a new music experience. watchOS 4 also includes an enhanced Workout app and introduces GymKit™, a technology platform that offers users connected workouts with cardio equipment.
tvOS
tvOS is the Company’s operating system for Apple TV. The tvOS operating system is based on the Company’s iOS platform and enables developers to create new apps and games specifically for Apple TV and deliver them to customers through the Apple TV App Store. tvOS incorporates Siri capabilities that allow searching across apps and services.
Apple Inc. | 2017 Form 10-K |
2
Application Software
The Company’s application software includes iWork
®
and various other software, including Final Cut Pro
®
, Logic Pro
®
X and FileMaker
®
Pro. iWork is the Company’s integrated productivity suite included with all Mac computers and is designed to help users create, present and publish documents through Pages
®
, presentations through Keynote
®
and spreadsheets through Numbers
®
. The Company also has Multi-Touch™ versions of iWork applications designed specifically for use on iOS devices, which are available as free downloads for all new iOS devices.
Services
Digital Content and Services
The iTunes Store, available for iOS devices, Mac and Windows personal computers and Apple TV, allows customers to purchase and download music and TV shows, rent or purchase movies and download free podcasts. The App Store, available for iOS devices, allows customers to discover and download apps and purchase in-app content. The Mac App Store, available for Mac computers, allows customers to discover, download and install Mac applications. The TV App Store allows customers access to apps and games specifically for Apple TV. The iBooks Store, available for iOS devices and Mac computers, features e-books from major and independent publishers. Apple Music offers users a curated listening experience with on-demand radio stations that evolve based on a user’s play or download activity and a subscription-based internet streaming service that also provides unlimited access to the Apple Music library.
iCloud
iCloud is the Company’s cloud service which stores music, photos, contacts, calendars, mail, documents and more, keeping them up-to-date and available across multiple iOS devices, Mac and Windows personal computers and Apple TV. iCloud services include iCloud Drive
®
, iCloud Photo Library, Family Sharing, Find My iPhone, iPad or Mac, Find My Friends, Notes, iCloud Keychain
®
and iCloud Backup for iOS devices.
AppleCare
The Company offers a range of support options for its customers. These include assistance that is built into software products, electronic product manuals, online support including comprehensive product information as well as technical assistance, the AppleCare
®
Protection Plan (“APP”) and AppleCare+ (“AC+”). APP and AC+ are fee-based services that extend the coverage of phone support eligibility and hardware warranty repairs. APP and AC+ offer additional coverage under some circumstances for instances of accidental damage and are available in certain countries for certain products.
Apple Pay
Apple Pay is the Company’s cashless payment service available in certain countries that offers an easy, secure and private way to pay. Apple Pay allows users to pay for purchases in participating stores accepting contactless payments and to pay for purchases within participating apps on qualifying devices. Apple Pay accepts credit and debit cards across major card networks and also supports reward programs and store-issued credit and debit cards. The Company expects to release an update to iOS 11 and watchOS 4 in fall 2017 that will allow peer-to-peer payments using Apple Pay.
Other Products
Accessories
The Company sells a variety of Apple-branded and third-party accessories, including Beats
®
products, headphones, displays, storage devices, and various other connectivity and computing products and supplies. In December 2016, the Company released AirPods
®
, new wireless headphones that interact with Siri. Additionally, in June 2017, the Company announced the HomePod™ wireless speaker and in September 2017, announced AirPower™, a new wireless charging accessory, which are expected to be available in December 2017 and calendar year 2018, respectively.
Apple TV
Apple TV connects to consumers’ TVs and enables them to access digital content directly for streaming video, playing music and games, and viewing photos. Content from Apple Music and other media services is also available on Apple TV. Apple TV allows streaming digital content from Mac and Windows personal computers through Home Share and from compatible Mac and iOS devices through AirPlay
®
. Apple TV runs on the Company’s tvOS operating system and is based on apps built for the television. Additionally, the Apple TV remote features Siri, allowing users to search and access content with their voice. In September 2017, the Company introduced Apple TV 4K, which supports 4K and High Dynamic Range content, providing customers with enhanced picture quality.
Apple Inc. | 2017 Form 10-K |
3
Apple Watch
Apple Watch is a personal electronic device that combines the watchOS user interface and technologies created specifically for a smaller device, including the Digital Crown™, a unique navigation tool that allows users to seamlessly scroll, zoom and navigate, and Force Touch, a technology that senses the difference between a tap and a press and allows users to access controls within apps. Apple Watch enables users to communicate in new ways from their wrist, track their health and fitness through activity and workout apps, and includes Siri and Apple Pay. In September 2017, the Company introduced Apple Watch Series 3, featuring health and fitness enhancements and built-in cellular capability on qualifying devices.
iPod touch
iPod touch, based on the Company’s iOS operating system, is a flash memory-based digital music and media player that works with the iTunes Store, App Store, iBooks Store and Apple Music for purchasing and playing digital content and apps.
Developer Programs
The Company’s developer programs support app developers with building, testing and distributing apps for iOS, macOS, watchOS and tvOS. Developer program membership provides access to beta software and advanced app capabilities (e.g., CloudKit
®
, HealthKit™ and Apple Pay), the ability to test apps using TestFlight
®
, distribution on the App Store, access to App Analytics and code-level technical support. Developer programs also exist for businesses creating apps for internal use (the Apple Developer Enterprise Program) and developers creating accessories for Apple devices (the MFi Program). All developers, even those who are not developer program members, can sign in with their Apple ID to post on the Apple Developer Forums and use Xcode
®
, the Company’s integrated development environment for creating apps for Apple platforms. Xcode includes project management tools; analysis tools to collect, display and compare app performance data; simulation tools to locally run, test and debug apps; and tools to simplify the design and development of user interfaces. All developers also have access to extensive technical documentation and sample code.
Markets and Distribution
The Company’s customers are primarily in the consumer, small and mid-sized business, education, enterprise and government markets. The Company sells its products and resells third-party products in most of its major markets directly to consumers and small and mid-sized businesses through its retail and online stores and its direct sales force. The Company also employs a variety of indirect distribution channels, such as third-party cellular network carriers, wholesalers, retailers and value-added resellers. During
2017
, the Company’s net sales through its direct and indirect distribution channels accounted for 28% and 72%, respectively, of total net sales.
The Company believes that sales of its innovative and differentiated products and services are enhanced by knowledgeable salespersons who can convey the value of the hardware and software integration and demonstrate the unique solutions that are available on its products. The Company further believes providing direct contact with its targeted customers is an effective way to demonstrate the advantages of its products over those of its competitors and providing a high-quality sales and after-sales support experience is critical to attracting new and retaining existing customers.
To ensure a high-quality buying experience for its products in which service and education are emphasized, the Company continues to build and improve its distribution capabilities by expanding the number of its own retail stores worldwide. The Company’s retail stores are typically located at high-traffic locations in quality shopping malls and urban shopping districts. By operating its own stores and locating them in desirable high-traffic locations the Company is better positioned to ensure a high-quality customer buying experience and attract new customers. The stores are designed to simplify and enhance the presentation and marketing of the Company’s products and related solutions. The retail stores employ experienced and knowledgeable personnel who provide product advice, service and training, and offer a wide selection of third-party hardware, software and other accessories that complement the Company’s products.
The Company has also invested in programs to enhance reseller sales by placing high-quality Apple fixtures, merchandising materials and other resources within selected third-party reseller locations. Through the Apple Premium Reseller Program, certain third-party resellers focus on the Apple platform by providing a high level of product expertise, integration and support services.
The Company is committed to delivering solutions to help educators teach and students learn. The Company believes effective integration of technology into classroom instruction can result in higher levels of student achievement and has designed a range of products, services and programs to address the needs of education customers. The Company also supports mobile learning and real-time distribution of, and access to, education-related materials through iTunes U
®
, a platform that allows students and teachers to share and distribute educational media online. The Company sells its products to the education market through its direct sales force, select third-party resellers and its retail and online stores.
Apple Inc. | 2017 Form 10-K |
4
The Company also sells its hardware and software products to enterprise and government customers in each of its reportable segments. The Company’s products are deployed in these markets because of their performance, productivity, ease-of-use and seamless integration into information technology environments. The Company’s products are compatible with thousands of third-party business applications and services, and its tools enable the development and secure deployment of custom applications as well as remote device administration.
No single customer accounted for more than 10% of net sales in
2017
,
2016
and
2015
.
Competition
The markets for the Company’s products and services are highly competitive and the Company is confronted by aggressive competition in all areas of its business. These markets are characterized by frequent product introductions and rapid technological advances that have substantially increased the capabilities and use of mobile communication and media devices, personal computers and other digital electronic devices. Many of the Company’s competitors that sell mobile devices and personal computers based on other operating systems seek to compete primarily through aggressive pricing and very low cost structures. The Company’s financial condition and operating results can be adversely affected by these and other industry-wide downward pressures on gross margins. Principal competitive factors important to the Company include price, product features (including security features), relative price and performance, product quality and reliability, design innovation, a strong third-party software and accessories ecosystem, marketing and distribution capability, service and support and corporate reputation.
The Company is focused on expanding its market opportunities related to personal computers and mobile communication and media devices. These markets are highly competitive and include many large, well-funded and experienced participants. The Company expects competition in these markets to intensify significantly as competitors attempt to imitate some of the features of the Company’s products and applications within their own products or, alternatively, collaborate with each other to offer solutions that are more competitive than those they currently offer. These markets are characterized by aggressive price competition, frequent product introductions, evolving design approaches and technologies, rapid adoption of technological and product advancements by competitors and price sensitivity on the part of consumers and businesses.
The Company’s digital content services have faced significant competition from other companies promoting their own digital music and content products and services, including those offering free peer-to-peer music and video services.
The Company’s future financial condition and operating results depend on the Company’s ability to continue to develop and offer new innovative products and services in each of the markets in which it competes. The Company believes it offers superior innovation and integration of the entire solution including the hardware (iOS devices, Mac, Apple Watch and Apple TV), software (iOS, macOS, watchOS and tvOS), online services and distribution of digital content and applications (Digital Content and Services). Some of the Company’s current and potential competitors have substantial resources and may be able to provide such products and services at little or no profit or even at a loss to compete with the Company’s offerings.
Supply of Components
Although most components essential to the Company’s business are generally available from multiple sources, a few components are currently obtained from single or limited sources. In addition, the Company competes for various components with other participants in the markets for mobile communication and media devices and personal computers. Therefore, many components used by the Company, including those that are available from multiple sources, are at times subject to industry-wide shortage and significant pricing fluctuations that could materially adversely affect the Company’s financial condition and operating results.
The Company uses some custom components that are not commonly used by its competitors, and new products introduced by the Company often utilize custom components available from only one source. When a component or product uses new technologies, initial capacity constraints may exist until the suppliers’ yields have matured or manufacturing capacity has increased. If the Company’s supply of components for a new or existing product were delayed or constrained, or if an outsourcing partner delayed shipments of completed products to the Company, the Company’s financial condition and operating results could be materially adversely affected. The Company’s business and financial performance could also be materially adversely affected depending on the time required to obtain sufficient quantities from the original source, or to identify and obtain sufficient quantities from an alternative source. Continued availability of these components at acceptable prices, or at all, may be affected if those suppliers decide to concentrate on the production of common components instead of components customized to meet the Company’s requirements.
The Company has entered into agreements for the supply of many components; however, there can be no guarantee that the Company will be able to extend or renew these agreements on similar terms, or at all. Therefore, the Company remains subject to significant risks of supply shortages and price increases that could materially adversely affect its financial condition and operating results.
Apple Inc. | 2017 Form 10-K |
5
Substantially all of the Company’s hardware products are currently manufactured by outsourcing partners that are located primarily in Asia, with some Mac computers manufactured in the U.S. and Ireland. A significant concentration of this manufacturing is currently performed by a small number of outsourcing partners, often in single locations. Certain of these outsourcing partners are the sole-sourced suppliers of components and manufacturers for many of the Company’s products. Although the Company works closely with its outsourcing partners on manufacturing schedules, the Company’s operating results could be adversely affected if its outsourcing partners were unable to meet their production commitments. The Company’s manufacturing purchase obligations typically cover its requirements for periods up to
150 days
.
Research and Development
Because the industries in which the Company competes are characterized by rapid technological advances, the Company’s ability to compete successfully depends heavily upon its ability to ensure a continual and timely flow of competitive products, services and technologies to the marketplace. The Company continues to develop new technologies to enhance existing products and services, and to expand the range of its offerings through R&D, licensing of intellectual property and acquisition of third-party businesses and technology. Total R&D expense was $
11.6 billion
, $
10.0 billion
and $
8.1 billion
in
2017
,
2016
and
2015
, respectively.
Intellectual Property
The Company currently holds a broad collection of intellectual property rights relating to certain aspects of its hardware devices, accessories, software and services. This includes patents, copyrights, trademarks, service marks, trade dress and other forms of intellectual property rights in the U.S. and a number of foreign countries. Although the Company believes the ownership of such intellectual property rights is an important factor in its business and that its success does depend in part on such ownership, the Company relies primarily on the innovative skills, technical competence and marketing abilities of its personnel.
The Company regularly files patent applications to protect innovations arising from its research, development and design, and is currently pursuing thousands of patent applications around the world. Over time, the Company has accumulated a large portfolio of issued patents, including utility patents, design patents and others. The Company also holds copyrights relating to certain aspects of its products and services. No single intellectual property right is solely responsible for protecting the Company’s products. The Company believes the duration of its intellectual property rights is adequate relative to the expected lives of its products.
Many of the Company’s products are designed to include intellectual property obtained from third parties. It may be necessary in the future to seek or renew licenses relating to various aspects of its products, processes and services. While the Company has generally been able to obtain such licenses on commercially reasonable terms in the past, there is no guarantee that such licenses could be obtained in the future on reasonable terms or at all. Because of technological changes in the industries in which the Company competes, current extensive patent coverage and the rapid rate of issuance of new patents, it is possible that certain components of the Company’s products, processes and services may unknowingly infringe existing patents or intellectual property rights of others. From time to time, the Company has been notified that it may be infringing certain patents or other intellectual property rights of third parties.
Foreign and Domestic Operations and Geographic Data
During
2017
, the Company’s domestic and international net sales accounted for
37%
and
63%
, respectively, of total net sales. Information regarding financial data by geographic segment is set forth in Part II, Item 7 of this Form 10-K under the subheading “Segment Operating Performance,” and in Part II, Item 8 of this Form 10-K in the Notes to Consolidated Financial Statements in Note 11, “Segment Information and Geographic Data.”
Substantially all of the Company’s hardware products are currently manufactured by outsourcing partners that are located primarily in Asia, with some Mac computers manufactured in the U.S. and Ireland. The supply and manufacture of a number of components is performed by sole-sourced outsourcing partners in the U.S., Asia and Europe. Margins on sales of the Company’s products in foreign countries and on sales of products that include components obtained from foreign suppliers, can be adversely affected by foreign currency exchange rate fluctuations and by international trade regulations, including tariffs and antidumping penalties. Information regarding concentration in the available sources of supply of materials and products is set forth in Part II, Item 8 of this Form 10-K in the Notes to Consolidated Financial Statements in Note 10, “Commitments and Contingencies.”
Business Seasonality and Product Introductions
The Company has historically experienced higher net sales in its first quarter compared to other quarters in its fiscal year due in part to seasonal holiday demand. Additionally, new product introductions can significantly impact net sales, product costs and operating expenses. Product introductions can also impact the Company’s net sales to its indirect distribution channels as these channels are filled with new product inventory following a product introduction, and often, channel inventory of a particular product declines as the next related major product launch approaches. Net sales can also be affected when consumers and distributors anticipate a product introduction. However, neither historical seasonal patterns nor historical patterns of product introductions should be considered reliable indicators of the Company’s future pattern of product introductions, future net sales or financial performance.
Apple Inc. | 2017 Form 10-K |
6
Warranty
The Company offers a limited parts and labor warranty on its hardware products. The basic warranty period is typically one year from the date of purchase by the original end-user. The Company also offers a 90-day limited warranty on the service parts used to repair the Company’s hardware products. In certain jurisdictions, local law requires that manufacturers guarantee their products for a period prescribed by statute, typically at least two years. In addition, where available, consumers may purchase APP or AC+, which extends service coverage on many of the Company’s hardware products.
Backlog
In the Company’s experience, the actual amount of product backlog at any particular time is not a meaningful indication of its future business prospects. In particular, backlog often increases immediately following new product introductions as customers anticipate shortages. Backlog is often reduced once customers believe they can obtain sufficient supply. Because of the foregoing, backlog should not be considered a reliable indicator of the Company’s ability to achieve any particular level of revenue or financial performance.
Employees
As of
September 30, 2017
, the Company had approximately 123,000 full-time equivalent employees.
Available
Infor
mation
The Company’s Annual Report on Form 10-K, Quarterly Reports on Form 10-Q, Current Reports on Form 8-K, and amendments to reports filed pursuant to Sections 13(a) and 15(d) of the Securities Exchange Act of 1934, as amended (the “Exchange Act”), are filed with the Securities and Exchange Commission (the “SEC”). The Company is subject to the informational requirements of the Exchange Act and files or furnishes reports, proxy statements and other information with the SEC. Such reports and other information filed by the Company with the SEC are available free of charge on the Company’s website at investor.apple.com/sec.cfm when such reports are available on the SEC’s website. The public may read and copy any materials filed by the Company with the SEC at the SEC’s Public Reference Room at 100 F Street, NE, Room 1580, Washington, DC 20549. The public may obtain information on the operation of the Public Reference Room by calling the SEC at 1-800-SEC-0330. The SEC maintains an internet site that contains reports, proxy and information statements and other information regarding issuers that file electronically with the SEC at www.sec.gov. The information contained on the websites referenced in this Form 10-K is not incorporated by reference into this filing. Further, the Company’s references to website URLs are intended to be inactive textual references only.
Apple Inc. | 2017 Form 10-K |
7
|
Item 1A.
|
Risk Factors
|
The following discussion of risk factors contains forward-looking statements. These risk factors may be important to understanding other statements in this Form 10-K. The following information should be read in conjunction with Part II, Item 7, “Management’s Discussion and Analysis of Financial Condition and Results of Operations” and the consolidated financial statements and related notes in Part II, Item 8, “Financial Statements and Supplementary Data” of this Form 10-K.
The business, financial condition and operating results of the Company can be affected by a number of factors, whether currently known or unknown, including but not limited to those described below, any one or more of which could, directly or indirectly, cause the Company’s actual financial condition and operating results to vary materially from past, or from anticipated future, financial condition and operating results. Any of these factors, in whole or in part, could materially and adversely affect the Company’s business, financial condition, operating results and stock price.
Because of the following factors, as well as other factors affecting the Company’s financial condition and operating results, past financial performance should not be considered to be a reliable indicator of future performance, and investors should not use historical trends to anticipate results or trends in future periods.
Global and regional economic conditions could materially adversely affect the Company.
The Company’s operations and performance depend significantly on global and regional economic conditions. Uncertainty about global and regional economic conditions poses a risk as consumers and businesses may postpone spending in response to tighter credit, higher unemployment, financial market volatility, government austerity programs, negative financial news, declines in income or asset values and/or other factors. These worldwide and regional economic conditions could have a material adverse effect on demand for the Company’s products and services. Demand also could differ materially from the Company’s expectations as a result of currency fluctuations because the Company generally raises prices on goods and services sold outside the U.S. to correspond with the effect of a strengthening of the U.S. dollar. Other factors that could influence worldwide or regional demand include changes in fuel and other energy costs, conditions in the real estate and mortgage markets, unemployment, labor and healthcare costs, access to credit, consumer confidence and other macroeconomic factors affecting consumer spending behavior. These and other economic factors could materially adversely affect demand for the Company’s products and services.
In the event of financial turmoil affecting the banking system and financial markets, additional consolidation of the financial services industry, or significant financial service institution failures, there could be tightening in the credit markets, low liquidity and extreme volatility in fixed income, credit, currency and equity markets. This could have a number of effects on the Company’s business, including the insolvency or financial instability of outsourcing partners or suppliers or their inability to obtain credit to finance development and/or manufacture products, resulting in product delays; inability of customers, including channel partners, to obtain credit to finance purchases of the Company’s products; failure of derivative counterparties and other financial institutions; and restrictions on the Company’s ability to issue new debt. Other income and expense also could vary materially from expectations depending on gains or losses realized on the sale or exchange of financial instruments; impairment charges resulting from revaluations of debt and equity securities and other investments; changes in interest rates; increases or decreases in cash balances; volatility in foreign exchange rates; and changes in fair value of derivative instruments. Increased volatility in the financial markets and overall economic uncertainty would increase the risk of the actual amounts realized in the future on the Company’s financial instruments differing significantly from the fair values currently assigned to them.
Global markets for the Company’s products and services are highly competitive and subject to rapid technological change, and the Company may be unable to compete effectively in these markets.
The Company’s products and services compete in highly competitive global markets characterized by aggressive price competition and resulting downward pressure on gross margins, frequent introduction of new products, short product life cycles, evolving industry standards, continual improvement in product price/performance characteristics, rapid adoption of technological and product advancements by competitors and price sensitivity on the part of consumers.
The Company’s ability to compete successfully depends heavily on its ability to ensure a continuing and timely introduction of innovative new products, services and technologies to the marketplace. The Company believes it is unique in that it designs and develops nearly the entire solution for its products, including the hardware, operating system, numerous software applications and related services. As a result, the Company must make significant investments in R&D. The Company currently holds a significant number of patents and copyrights and has registered and/or has applied to register numerous patents, trademarks and service marks. In contrast, many of the Company’s competitors seek to compete primarily through aggressive pricing and very low cost structures, and emulating the Company’s products and infringing on its intellectual property. If the Company is unable to continue to develop and sell innovative new products with attractive margins or if competitors infringe on the Company’s intellectual property, the Company’s ability to maintain a competitive advantage could be adversely affected.
Apple Inc. | 2017 Form 10-K |
8
The Company markets certain mobile communication and media devices based on the iOS mobile operating system and also markets related services, including third-party digital content and applications. The Company faces substantial competition in these markets from companies that have significant technical, marketing, distribution and other resources, as well as established hardware, software and digital content supplier relationships; and the Company has a minority market share in the global smartphone market. Additionally, the Company faces significant competition as competitors reduce their selling prices and attempt to imitate the Company’s product features and applications within their own products or, alternatively, collaborate with each other to offer solutions that are more competitive than those they currently offer. The Company competes with business models that provide content to users for free. The Company also competes with illegitimate means to obtain third-party digital content and applications. Some of the Company’s competitors have greater experience, product breadth and distribution channels than the Company. Because some current and potential competitors have substantial resources and/or experience and a lower cost structure, they may be able to provide products and services at little or no profit or even at a loss. The Company also expects competition to intensify as competitors attempt to imitate the Company’s approach to providing components seamlessly within their individual offerings or work collaboratively to offer integrated solutions. The Company’s financial condition and operating results depend substantially on the Company’s ability to continually improve iOS and iOS devices in order to maintain their functional and design advantages.
The Company is the only authorized maker of hardware using macOS, which has a minority market share in the personal computer market. This market has been contracting and is dominated by computer makers using competing operating systems, most notably Windows. In the market for personal computers and accessories, the Company faces a significant number of competitors, many of which have broader product lines, lower-priced products and a larger installed customer base. Historically, consolidation in this market has resulted in larger competitors. Competition has been particularly intense as competitors have aggressively cut prices and lowered product margins. An increasing number of internet-enabled devices that include software applications and are smaller and simpler than traditional personal computers compete for market share with the Company’s existing products. The Company’s financial condition and operating results also depend on its ability to continually improve the Mac platform to maintain its functional and design advantages.
There can be no assurance the Company will be able to continue to provide products and services that compete effectively.
To remain competitive and stimulate customer demand, the Company must successfully manage frequent product introductions and transitions.
Due to the highly volatile and competitive nature of the industries in which the Company competes, the Company must continually introduce new products, services and technologies, enhance existing products and services, effectively stimulate customer demand for new and upgraded products and successfully manage the transition to these new and upgraded products. The success of new product introductions depends on a number of factors including, but not limited to, timely and successful product development, market acceptance, the Company’s ability to manage the risks associated with new product production ramp-up issues, the availability of application software for new products, the effective management of purchase commitments and inventory levels in line with anticipated product demand, the availability of products in appropriate quantities and at expected costs to meet anticipated demand and the risk that new products may have quality or other defects or deficiencies in the early stages of introduction. Accordingly, the Company cannot determine in advance the ultimate effect of new product introductions and transitions.
The Company depends on the performance of distributors, carriers and other resellers.
The Company distributes its products through cellular network carriers, wholesalers, national and regional retailers and value-added resellers, many of whom distribute products from competing manufacturers. The Company also sells its products and third-party products in most of its major markets directly to education, enterprise and government customers and consumers and small and mid-sized businesses through its retail and online stores.
Some carriers providing cellular network service for iPhone subsidize users’ purchases of the device. There is no assurance that such subsidies will be continued at all or in the same amounts upon renewal of the Company’s agreements with these carriers or in agreements the Company enters into with new carriers.
The Company has invested and will continue to invest in programs to enhance reseller sales, including staffing selected resellers’ stores with Company employees and contractors, and improving product placement displays. These programs could require a substantial investment while providing no assurance of return or incremental revenue. The financial condition of these resellers could weaken, these resellers could stop distributing the Company’s products, or uncertainty regarding demand for some or all of the Company’s products could cause resellers to reduce their ordering and marketing of the Company’s products.
Apple Inc. | 2017 Form 10-K |
9
The Company faces substantial inventory and other asset risk in addition to purchase commitment cancellation risk.
The Company records a write-down for product and component inventories that have become obsolete or exceed anticipated demand or net realizable value and accrues necessary cancellation fee reserves for orders of excess products and components. The Company also reviews its long-lived assets, including capital assets held at its suppliers’ facilities and inventory prepayments, for impairment whenever events or circumstances indicate the carrying amount of an asset may not be recoverable. If the Company determines that impairment has occurred, it records a write-down equal to the amount by which the carrying value of the asset exceeds its fair value. Although the Company believes its provisions related to inventory, capital assets, inventory prepayments and other assets and purchase commitments are currently adequate, no assurance can be given that the Company will not incur additional related charges given the rapid and unpredictable pace of product obsolescence in the industries in which the Company competes.
The Company must order components for its products and build inventory in advance of product announcements and shipments. Manufacturing purchase obligations typically cover forecasted component and manufacturing requirements for periods up to
150 days
. Because the Company’s markets are volatile, competitive and subject to rapid technology and price changes, there is a risk the Company will forecast incorrectly and order or produce excess or insufficient amounts of components or products, or not fully utilize firm purchase commitments.
Future operating results depend upon the Company’s ability to obtain components in sufficient quantities on commercially reasonable terms.
Because the Company currently obtains components from single or limited sources, the Company is subject to significant supply and pricing risks. Many components, including those that are available from multiple sources, are at times subject to industry-wide shortages and significant commodity pricing fluctuations. While the Company has entered into agreements for the supply of many components, there can be no assurance that the Company will be able to extend or renew these agreements on similar terms, or at all. A number of suppliers of components may suffer from poor financial conditions, which can lead to business failure for the supplier or consolidation within a particular industry, further limiting the Company’s ability to obtain sufficient quantities of components on commercially reasonable terms. The effects of global or regional economic conditions on the Company’s suppliers, described in “
Global and regional economic conditions could materially adversely affect the Company”
above, also could affect the Company’s ability to obtain components
.
Therefore, the Company remains subject to significant risks of supply shortages and price increases.
The Company’s new products often utilize custom components available from only one source. When a component or product uses new technologies, initial capacity constraints may exist until the suppliers’ yields have matured or manufacturing capacity has increased. Continued availability of these components at acceptable prices, or at all, may be affected for any number of reasons, including if those suppliers decide to concentrate on the production of common components instead of components customized to meet the Company’s requirements. The supply of components for a new or existing product could be delayed or constrained, or a key manufacturing vendor could delay shipments of completed products to the Company.
The Company depends on component and product manufacturing and logistical services provided by outsourcing partners, many of which are located outside of the U.S.
Substantially all of the Company’s manufacturing is performed in whole or in part by a few outsourcing partners located primarily in Asia. The Company has also outsourced much of its transportation and logistics management. While these arrangements may lower operating costs, they also reduce the Company’s direct control over production and distribution. It is uncertain what effect such diminished control will have on the quality or quantity of products or services, or the Company’s flexibility to respond to changing conditions. Although arrangements with these partners may contain provisions for warranty expense reimbursement, the Company may remain responsible to the consumer for warranty service in the event of product defects and could experience an unanticipated product defect or warranty liability. While the Company relies on its partners to adhere to its supplier code of conduct, material violations of the supplier code of conduct could occur.
The Company relies on sole-sourced outsourcing partners in the U.S., Asia and Europe to supply and manufacture many critical components, and on outsourcing partners primarily located in Asia, for final assembly of substantially all of the Company’s hardware products. Any failure of these partners to perform may have a negative impact on the Company’s cost or supply of components or finished goods. In addition, manufacturing or logistics in these locations or transit to final destinations may be disrupted for a variety of reasons including, but not limited to, natural and man-made disasters, information technology system failures, commercial disputes, military actions or economic, business, labor, environmental, public health, or political issues.
The Company has invested in manufacturing process equipment, much of which is held at certain of its outsourcing partners, and has made prepayments to certain of its suppliers associated with long-term supply agreements. While these arrangements help ensure the supply of components and finished goods, if these outsourcing partners or suppliers experience severe financial problems or other disruptions in their business, such continued supply could be reduced or terminated and the net realizable value of these assets could be negatively impacted.
Apple Inc. | 2017 Form 10-K |
10
The Company’s products and services may experience quality problems from time to time that can result in decreased sales and operating margin and harm to the Company’s reputation.
The Company sells complex hardware and software products and services that can contain design and manufacturing defects. Sophisticated operating system software and applications, such as those sold by the Company, often contain “bugs” that can unexpectedly interfere with the software’s intended operation. The Company’s online services may from time to time experience outages, service slowdowns or errors. Defects may also occur in components and products the Company purchases from third parties. There can be no assurance the Company will be able to detect and fix all defects in the hardware, software and services it sells. Failure to do so could result in lost revenue, significant warranty and other expenses and harm to the Company’s reputation.
The Company relies on access to third-party digital content, which may not be available to the Company on commercially reasonable terms or at all.
The Company contracts with numerous third parties to offer their digital content to customers. This includes the right to sell currently available music, movies, TV shows and books. The licensing or other distribution arrangements with these third parties are for relatively short terms and do not guarantee the continuation or renewal of these arrangements on reasonable terms, if at all. Some third-party content providers and distributors currently or in the future may offer competing products and services, and could take action to make it more difficult or impossible for the Company to license or otherwise distribute their content in the future. Other content owners, providers or distributors may seek to limit the Company’s access to, or increase the cost of, such content. The Company may be unable to continue to offer a wide variety of content at reasonable prices with acceptable usage rules, or continue to expand its geographic reach. Failure to obtain the right to make third-party digital content available, or to make such content available on commercially reasonable terms, could have a material adverse impact on the Company’s financial condition and operating results.
Some third-party digital content providers require the Company to provide digital rights management and other security solutions. If requirements change, the Company may have to develop or license new technology to provide these solutions. There is no assurance the Company will be able to develop or license such solutions at a reasonable cost and in a timely manner. In addition, certain countries have passed or may propose and adopt legislation that would force the Company to license its digital rights management, which could lessen the protection of content and subject it to piracy and also could negatively affect arrangements with the Company’s content providers.
The Company’s future performance depends in part on support from third-party software developers.
The Company believes decisions by customers to purchase its hardware products depend in part on the availability of third-party software applications and services. There is no assurance that third-party developers will continue to develop and maintain software applications and services for the Company’s products. If third-party software applications and services cease to be developed and maintained for the Company’s products, customers may choose not to buy the Company’s products.
With respect to its Mac products, the Company believes the availability of third-party software applications and services depends in part on the developers’ perception and analysis of the relative benefits of developing, maintaining and upgrading such software for the Company’s products compared to Windows-based products. This analysis may be based on factors such as the market position of the Company and its products, the anticipated revenue that may be generated, expected future growth of Mac sales and the costs of developing such applications and services. If the Company’s minority share of the global personal computer market causes developers to question the Mac’s prospects, developers could be less inclined to develop or upgrade software for the Company’s Mac products and more inclined to devote their resources to developing and upgrading software for the larger Windows market.
With respect to iOS devices, the Company relies on the continued availability and development of compelling and innovative software applications, including applications distributed through the App Store. iOS devices are subject to rapid technological change, and, if third-party developers are unable to or choose not to keep up with this pace of change, third-party applications might not successfully operate and may result in dissatisfied customers. As with applications for the Company’s Mac products, the availability and development of these applications also depend on developers’ perceptions and analysis of the relative benefits of developing, maintaining or upgrading software for the Company’s iOS devices rather than its competitors’ platforms, such as Android. If developers focus their efforts on these competing platforms, the availability and quality of applications for the Company’s iOS devices may suffer.
Apple Inc. | 2017 Form 10-K |
11
The Company relies on access to third-party intellectual property, which may not be available to the Company on commercially reasonable terms or at all.
Many of the Company’s products include third-party intellectual property, which requires licenses from those third parties. Based on past experience and industry practice, the Company believes such licenses generally can be obtained on reasonable terms. There is, however, no assurance that the necessary licenses can be obtained on acceptable terms or at all. Failure to obtain the right to use third-party intellectual property, or to use such intellectual property on commercially reasonable terms, could preclude the Company from selling certain products or otherwise have a material adverse impact on the Company’s financial condition and operating results.
The Company could be impacted by unfavorable results of legal proceedings, such as being found to have infringed on intellectual property rights.
The Company is subject to various legal proceedings and claims that have arisen in the ordinary course of business and have not yet been fully resolved, and new claims may arise in the future. In addition, agreements entered into by the Company sometimes include indemnification provisions which may subject the Company to costs and damages in the event of a claim against an indemnified third party.
Claims against the Company based on allegations of patent infringement or other violations of intellectual property rights have generally increased over time and may continue to increase. In particular, the Company has historically faced a significant number of patent claims relating to its cellular-enabled products, and new claims may arise in the future. For example, technology and other patent-holding companies frequently assert their patents and seek royalties and often enter into litigation based on allegations of patent infringement or other violations of intellectual property rights. The Company is vigorously defending infringement actions in courts in a number of U.S. jurisdictions and before the U.S. International Trade Commission, as well as internationally in various countries. The plaintiffs in these actions frequently seek injunctions and substantial damages.
Regardless of the merit of particular claims, litigation may be expensive, time-consuming, disruptive to the Company’s operations and distracting to management. In recognition of these considerations, the Company may enter into licensing agreements or other arrangements to settle litigation and resolve such disputes. No assurance can be given that such agreements can be obtained on acceptable terms or that litigation will not occur. These agreements may also significantly increase the Company’s operating expenses.
In management’s opinion, there is not at least a reasonable possibility the Company may have incurred a material loss, or a material loss in excess of a recorded accrual, with respect to loss contingencies, including matters related to infringement of intellectual property rights. However, the outcome of litigation is inherently uncertain.
Although management considers the likelihood of such an outcome to be remote, if one or more legal matters were resolved against the Company or an indemnified third party in a reporting period for amounts in excess of management’s expectations, the Company’s consolidated financial statements for that reporting period could be materially adversely affected. Further, such an outcome could result in significant compensatory, punitive or trebled monetary damages, disgorgement of revenue or profits, remedial corporate measures or injunctive relief against the Company that could materially adversely affect its financial condition and operating results.
While the Company maintains insurance coverage for certain types of claims, such insurance coverage may be insufficient to cover all losses or all types of claims that may arise.
The Company is subject to laws and regulations worldwide, changes to which could increase the Company’s costs and individually or in the aggregate adversely affect the Company’s business.
The Company is subject to laws and regulations affecting its domestic and international operations in a number of areas. These U.S. and foreign laws and regulations affect the Company’s activities including, but not limited to, in areas of labor, advertising, digital content, consumer protection, real estate, billing, e-commerce, promotions, quality of services, telecommunications, mobile communications and media, television, intellectual property ownership and infringement, tax, import and export requirements, anti-corruption, foreign exchange controls and cash repatriation restrictions, data privacy requirements, anti-competition, environmental, health and safety.
By way of example, laws and regulations related to mobile communications and media devices in the many jurisdictions in which the Company operates are extensive and subject to change. Such changes could include, among others, restrictions on the production, manufacture, distribution and use of devices, locking devices to a carrier’s network, or mandating the use of devices on more than one carrier’s network. These devices are also subject to certification and regulation by governmental and standardization bodies, as well as by cellular network carriers for use on their networks. These certification processes are extensive and time consuming, and could result in additional testing requirements, product modifications, or delays in product shipment dates, or could preclude the Company from selling certain products.
Apple Inc. | 2017 Form 10-K |
12
Compliance with these laws, regulations and similar requirements may be onerous and expensive, and they may be inconsistent from jurisdiction to jurisdiction, further increasing the cost of compliance and doing business. Any such costs, which may rise in the future as a result of changes in these laws and regulations or in their interpretation, could individually or in the aggregate make the Company’s products and services less attractive to the Company’s customers, delay the introduction of new products in one or more regions, or cause the Company to change or limit its business practices. The Company has implemented policies and procedures designed to ensure compliance with applicable laws and regulations, but there can be no assurance that the Company’s employees, contractors, or agents will not violate such laws and regulations or the Company’s policies and procedures.
The Company’s business is subject to the risks of international operations.
The Company derives a significant portion of its revenue and earnings from its international operations. Compliance with applicable U.S. and foreign laws and regulations, such as import and export requirements, anti-corruption laws, tax laws, foreign exchange controls and cash repatriation restrictions, data privacy requirements, environmental laws, labor laws and anti-competition regulations, increases the costs of doing business in foreign jurisdictions. Although the Company has implemented policies and procedures to comply with these laws and regulations, a violation by the Company’s employees, contractors or agents could nevertheless occur. In some cases, compliance with the laws and regulations of one country could violate the laws and regulations of another country. Violations of these laws and regulations could materially adversely affect the Company’s brand, international growth efforts and business.
The Company also could be significantly affected by other risks associated with international activities including, but not limited to, economic and labor conditions, increased duties, taxes and other costs and political instability. Margins on sales of the Company’s products in foreign countries, and on sales of products that include components obtained from foreign suppliers, could be materially adversely affected by international trade regulations, including duties, tariffs and antidumping penalties. The Company is also exposed to credit and collectability risk on its trade receivables with customers in certain international markets. There can be no assurance the Company can effectively limit its credit risk and avoid losses.
The Company’s retail stores have required and will continue to require a substantial investment and commitment of resources and are subject to numerous risks and uncertainties.
The Company’s retail stores have required substantial investment in equipment and leasehold improvements, information systems, inventory and personnel. The Company also has entered into substantial operating lease commitments for retail space. Certain stores have been designed and built to serve as high-profile venues to promote brand awareness and serve as vehicles for corporate sales and marketing activities. Because of their unique design elements, locations and size, these stores require substantially more investment than the Company’s more typical retail stores. Due to the high cost structure associated with the Company’s retail stores, a decline in sales or the closure or poor performance of individual or multiple stores could result in significant lease termination costs, write-offs of equipment and leasehold improvements and severance costs.
Many factors unique to retail operations, some of which are beyond the Company’s control, pose risks and uncertainties. These risks and uncertainties include, but are not limited to, macro-economic factors that could have an adverse effect on general retail activity, as well as the Company’s inability to manage costs associated with store construction and operation, the Company’s failure to manage relationships with its existing retail partners, more challenging environments in managing retail operations outside the U.S., costs associated with unanticipated fluctuations in the value of retail inventory, and the Company’s inability to obtain and renew leases in quality retail locations at a reasonable cost.
Investment in new business strategies and acquisitions could disrupt the Company’s ongoing business and present risks not originally contemplated.
The Company has invested, and in the future may invest, in new business strategies or acquisitions. Such endeavors may involve significant risks and uncertainties, including distraction of management from current operations, greater than expected liabilities and expenses, inadequate return of capital and unidentified issues not discovered in the Company’s due diligence. These new ventures are inherently risky and may not be successful.
The Company’s business and reputation may be impacted by information technology system failures or network disruptions.
The Company may be subject to information technology system failures or network disruptions caused by natural disasters, accidents, power disruptions, telecommunications failures, acts of terrorism or war, computer viruses, physical or electronic break-ins, or other events or disruptions. System redundancy and other continuity measures may be ineffective or inadequate, and the Company’s business continuity and disaster recovery planning may not be sufficient for all eventualities. Such failures or disruptions could adversely impact the Company’s business by, among other things, preventing access to the Company’s online services, interfering with customer transactions or impeding the manufacturing and shipping of the Company’s products. These events could materially adversely affect the Company’s reputation, financial condition and operating results.
Apple Inc. | 2017 Form 10-K |
13
There may be losses or unauthorized access to or releases of confidential information, including personally identifiable information, that could subject the Company to significant reputational, financial, legal and operational consequences.
The Company’s business requires it to use and store confidential information, including, among other things, personally identifiable information (“PII”) with respect to the Company’s customers and employees. The Company devotes significant resources to network and data security, including through the use of encryption and other security measures intended to protect its systems and data. But these measures cannot provide absolute security, and losses or unauthorized access to or releases of confidential information may still occur, which could materially adversely affect the Company’s reputation, financial condition and operating results.
The Company’s business also requires it to share confidential information with suppliers and other third parties. Although the Company takes steps to secure confidential information that is provided to third parties, such measures may not be effective and losses or unauthorized access to or releases of confidential information may still occur, which could materially adversely affect the Company’s reputation, financial condition and operating results.
For example, the Company may experience a security breach impacting the Company’s information technology systems that compromises the confidentiality, integrity or availability of confidential information. Such an incident could, among other things, impair the Company’s ability to attract and retain customers for its products and services, impact the Company’s stock price, materially damage supplier relationships, and expose the Company to litigation or government investigations, which could result in penalties, fines or judgments against the Company.
Although malicious attacks perpetrated to gain access to confidential information, including PII, affect many companies across various industries, the Company is at a relatively greater risk of being targeted because of its high profile and the value of the confidential information it creates, owns, manages, stores and processes.
The Company has implemented systems and processes intended to secure its information technology systems and prevent unauthorized access to or loss of sensitive data, including through the use of encryption and authentication technologies. As with all companies, these security measures may not be sufficient for all eventualities and may be vulnerable to hacking, employee error, malfeasance, system error, faulty password management or other irregularities. For example, third parties may attempt to fraudulently induce employees or customers into disclosing user names, passwords or other sensitive information, which may in turn be used to access the Company’s information technology systems. To help protect customers and the Company, the Company monitors its services and systems for unusual activity and may freeze accounts under suspicious circumstances, which, among other things, may result in the delay or loss of customer orders or impede customer access to the Company’s products and services.
In addition to the risks relating to general confidential information described above, the Company may also be subject to specific obligations relating to health data and payment card data. Health data may be subject to additional privacy, security and breach notification requirements, and the Company may be subject to audit by governmental authorities regarding the Company’s compliance with these obligations. If the Company fails to adequately comply with these rules and requirements, or if health data is handled in a manner not permitted by law or under the Company’s agreements with healthcare institutions, the Company could be subject to litigation or government investigations, may be liable for associated investigatory expenses, and could also incur significant fees or fines.
Under payment card rules and obligations, if cardholder information is potentially compromised, the Company could be liable for associated investigatory expenses and could also incur significant fees or fines if the Company fails to follow payment card industry data security standards. The Company could also experience a significant increase in payment card transaction costs or lose the ability to process payment cards if it fails to follow payment card industry data security standards, which would materially adversely affect the Company’s reputation, financial condition and operating results.
While the Company maintains insurance coverage that is intended to address certain aspects of data security risks, such insurance coverage may be insufficient to cover all losses or all types of claims that may arise.
The Company’s business is subject to a variety of U.S. and international laws, rules, policies and other obligations regarding data protection.
The Company is subject to federal, state and international laws relating to the collection, use, retention, security and transfer of PII. In many cases, these laws apply not only to third-party transactions, but also may restrict transfers of PII among the Company and its international subsidiaries. Several jurisdictions have passed laws in this area, and other jurisdictions are considering imposing additional restrictions. These laws continue to develop and may be inconsistent from jurisdiction to jurisdiction. Complying with emerging and changing international requirements may cause the Company to incur substantial costs or require the Company to change its business practices. Noncompliance could result in significant penalties or legal liability.
The Company makes statements about its use and disclosure of PII through its privacy policy, information provided on its website and press statements. Any failure by the Company to comply with these public statements or with other federal, state or international privacy-related or data protection laws and regulations could result in proceedings against the Company by governmental entities or others. In addition to reputational impacts, penalties could include ongoing audit requirements and significant legal liability.
Apple Inc. | 2017 Form 10-K |
14
The Company’s success depends largely on the continued service and availability of key personnel.
Much of the Company’s future success depends on the continued availability and service of key personnel, including its Chief Executive Officer, executive team and other highly skilled employees. Experienced personnel in the technology industry are in high demand and competition for their talents is intense, especially in Silicon Valley, where most of the Company’s key personnel are located.
The Company’s business may be impacted by political events, war, terrorism, public health issues, natural disasters and other business interruptions.
War, terrorism, geopolitical uncertainties, public health issues and other business interruptions have caused and could cause damage or disruption to international commerce and the global economy, and thus could have a material adverse effect on the Company, its suppliers, logistics providers, manufacturing vendors and customers, including channel partners. The Company’s business operations are subject to interruption by, among others, natural disasters, whether as a result of climate change or otherwise, fire, power shortages, nuclear power plant accidents and other industrial accidents, terrorist attacks and other hostile acts, labor disputes, public health issues and other events beyond its control. Such events could decrease demand for the Company’s products, make it difficult or impossible for the Company to make and deliver products to its customers, including channel partners, or to receive components from its suppliers, and create delays and inefficiencies in the Company’s supply chain. While the Company’s suppliers are required to maintain safe working environments and operations, an industrial accident could occur and could result in disruption to the Company’s business and harm to the Company’s reputation. Should major public health issues, including pandemics, arise, the Company could be adversely affected by more stringent employee travel restrictions, additional limitations in freight services, governmental actions limiting the movement of products between regions, delays in production ramps of new products and disruptions in the operations of the Company’s manufacturing vendors and component suppliers. The majority of the Company’s R&D activities, its corporate headquarters, information technology systems and other critical business operations, including certain component suppliers and manufacturing vendors, are in locations that could be affected by natural disasters. In the event of a natural disaster, the Company could incur significant losses, require substantial recovery time and experience significant expenditures in order to resume operations.
The Company expects its quarterly revenue and operating results to fluctuate.
The Company’s profit margins vary across its products and distribution channels. The Company’s software, accessories, and service and support contracts generally have higher gross margins than certain of the Company’s other products. Gross margins on the Company’s hardware products vary across product lines and can change over time as a result of product transitions, pricing and configuration changes, and component, warranty, and other cost fluctuations. The Company’s direct sales generally have higher associated gross margins than its indirect sales through its channel partners. In addition, the Company’s gross margin and operating margin percentages, as well as overall profitability, may be materially adversely impacted as a result of a shift in product, geographic or channel mix, component cost increases, the strengthening U.S. dollar, price competition, or the introduction of new products, including those that have higher cost structures with flat or reduced pricing.
The Company has typically experienced higher net sales in its first quarter compared to other quarters due in part to seasonal holiday demand. Additionally, new product introductions can significantly impact net sales, product costs and operating expenses. Further, the Company generates a majority of its net sales from a single product and a decline in demand for that product could significantly impact quarterly net sales. The Company could also be subject to unexpected developments late in a quarter, such as lower-than-anticipated demand for the Company’s products, issues with new product introductions, an internal systems failure, or failure of one of the Company’s logistics, components supply, or manufacturing partners.
The Company’s stock price is subject to volatility.
The Company’s stock price has experienced substantial price volatility in the past and may continue to do so in the future. Additionally, the Company, the technology industry and the stock market as a whole have experienced extreme stock price and volume fluctuations that have affected stock prices in ways that may have been unrelated to these companies’ operating performance. Price volatility over a given period may cause the average price at which the Company repurchases its own stock to exceed the stock’s price at a given point in time. The Company believes its stock price should reflect expectations of future growth and profitability. The Company also believes its stock price should reflect expectations that its cash dividend will continue at current levels or grow and that its current share repurchase program will be fully consummated. Future dividends are subject to declaration by the Company’s Board of Directors, and the Company’s share repurchase program does not obligate it to acquire any specific number of shares. If the Company fails to meet expectations related to future growth, profitability, dividends, share repurchases or other market expectations, its stock price may decline significantly, which could have a material adverse impact on investor confidence and employee retention.
Apple Inc. | 2017 Form 10-K |
15
The Company’s financial performance is subject to risks associated with changes in the value of the U.S. dollar versus local currencies.
The Company’s primary exposure to movements in foreign currency exchange rates relates to non-U.S. dollar-denominated sales and operating expenses worldwide. Weakening of foreign currencies relative to the U.S. dollar adversely affects the U.S. dollar value of the Company’s foreign currency-denominated sales and earnings, and generally leads the Company to raise international pricing, potentially reducing demand for the Company’s products. Margins on sales of the Company’s products in foreign countries and on sales of products that include components obtained from foreign suppliers, could be materially adversely affected by foreign currency exchange rate fluctuations. In some circumstances, for competitive or other reasons, the Company may decide not to raise local prices to fully offset the dollar’s strengthening, or at all, which would adversely affect the U.S. dollar value of the Company’s foreign currency-denominated sales and earnings. Conversely, a strengthening of foreign currencies relative to the U.S. dollar, while generally beneficial to the Company’s foreign currency-denominated sales and earnings, could cause the Company to reduce international pricing and incur losses on its foreign currency derivative instruments, thereby limiting the benefit. Additionally, strengthening of foreign currencies may increase the Company’s cost of product components denominated in those currencies, thus adversely affecting gross margins.
The Company uses derivative instruments, such as foreign currency forward and option contracts, to hedge certain exposures to fluctuations in foreign currency exchange rates. The use of such hedging activities may not offset any, or more than a portion, of the adverse financial effects of unfavorable movements in foreign exchange rates over the limited time the hedges are in place.
The Company is exposed to credit risk and fluctuations in the market values of its investment portfolio.
Given the global nature of its business, the Company has both domestic and international investments. Credit ratings and pricing of the Company’s investments can be negatively affected by liquidity, credit deterioration, financial results, economic risk, political risk, sovereign risk or other factors. As a result, the value and liquidity of the Company’s cash, cash equivalents and marketable securities may fluctuate substantially. Therefore, although the Company has not realized any significant losses on its cash, cash equivalents and marketable securities, future fluctuations in their value could result in significant realized losses.
The Company is exposed to credit risk on its trade accounts receivable, vendor non-trade receivables and prepayments related to long-term supply agreements, and this risk is heightened during periods when economic conditions worsen.
The Company distributes its products through third-party cellular network carriers, wholesalers, retailers and value-added resellers. The Company also sells its products directly to small and mid-sized businesses and education, enterprise and government customers. A substantial majority of the Company’s outstanding trade receivables are not covered by collateral, third-party financing arrangements or credit insurance. The Company’s exposure to credit and collectability risk on its trade receivables is higher in certain international markets and its ability to mitigate such risks may be limited. The Company also has unsecured vendor non-trade receivables resulting from purchases of components by outsourcing partners and other vendors that manufacture sub-assemblies or assemble final products for the Company. In addition, the Company has made prepayments associated with long-term supply agreements to secure supply of inventory components. As of
September 30, 2017
, a significant portion of the Company’s trade receivables was concentrated within cellular network carriers, and its vendor non-trade receivables and prepayments related to long-term supply agreements were concentrated among a few individual vendors located primarily in Asia. While the Company has procedures to monitor and limit exposure to credit risk on its trade and vendor non-trade receivables, as well as long-term prepayments, there can be no assurance such procedures will effectively limit its credit risk and avoid losses.
The Company could be subject to changes in its tax rates, the adoption of new U.S. or international tax legislation or exposure to additional tax liabilities.
The Company is subject to taxes in the U.S. and numerous foreign jurisdictions, including Ireland, where a number of the Company’s subsidiaries are organized. Due to economic and political conditions, tax rates in various jurisdictions may be subject to significant change. The Company’s effective tax rates could be affected by changes in the mix of earnings in countries with differing statutory tax rates, changes in the valuation of deferred tax assets and liabilities, or changes in tax laws or their interpretation, including in the U.S. and Ireland.
The Company is also subject to the examination of its tax returns and other tax matters by the U.S. Internal Revenue Service (the “IRS”) and other tax authorities and governmental bodies. The Company regularly assesses the likelihood of an adverse outcome resulting from these examinations to determine the adequacy of its provision for taxes. There can be no assurance as to the outcome of these examinations. If the Company’s effective tax rates were to increase, particularly in the U.S. or Ireland, or if the ultimate determination of the Company’s taxes owed is for an amount in excess of amounts previously accrued, the Company’s financial condition, operating results and cash flows could be adversely affected.
|
Item 1B.
|
Unresolved Staff Comments
|
None.
Apple Inc. | 2017 Form 10-K |
16
|
Item 2.
|
Properties
|
The Company’s headquarters are located in Cupertino, California. As of
September 30, 2017
, the Company owned 13.4 million square feet and leased 23.0 million square feet of building space, primarily in the U.S. Additionally, the Company owned a total of 4,928 acres of land, primarily in the U.S.
As of
September 30, 2017
, the Company owned facilities and land for corporate functions, R&D and data centers at various locations throughout the U.S. Outside the U.S., the Company owned additional facilities and land for various purposes.
The Company believes its existing facilities and equipment, which are used by all operating segments, are in good operating condition and are suitable for the conduct of its business. The Company has invested in internal capacity and strategic relationships with outside manufacturing vendors and continues to make investments in capital equipment as needed to meet anticipated demand for its products.
|
Item 3.
|
Legal Proceedings
|
The Company is subject to legal proceedings and claims that have not been fully resolved and that have arisen in the ordinary course of business. In the opinion of management, there was not at least a reasonable possibility the Company may have incurred a material loss, or a material loss in excess of a recorded accrual, with respect to loss contingencies for asserted legal and other claims. However, the outcome of legal proceedings and claims brought against the Company is subject to significant uncertainty. Therefore, although management considers the likelihood of such an outcome to be remote, if one or more of these legal matters were resolved against the Company in a reporting period for amounts in excess of management’s expectations, the Company’s consolidated financial statements for that reporting period could be materially adversely affected. See the risk factor “
The Company could be impacted by unfavorable results of legal proceedings, such as being found to have infringed on intellectual property rights
” in Part I, Item 1A of this Form 10-K under the heading “Risk Factors.” The Company settled certain matters during the fourth quarter of
2017
that did not individually or in the aggregate have a material impact on the Company’s financial condition or operating results.
|
Item 4.
|
Mine Safety Disclosures
|
Not applicable.
Apple Inc. | 2017 Form 10-K |
17
|
Item 5.
|
Market for Registrant’s Common Equity, Related Stockholder Matters and Issuer Purchases of Equity Securities
|
The Company’s common stock is traded on the Nasdaq Stock Market LLC (“Nasdaq”) under the symbol AAPL.
Price Range of Common Stock
The price range per share of common stock presented below represents the highest and lowest intraday sales prices for the Company’s common stock on the Nasdaq during each quarter of the two most recent years.
|
Fourth Quarter
|
Third Quarter
|
Second Quarter
|
First Quarter
|
||||
|
2017 price range per share
|
$164.94 – $142.41
|
$156.65 – $140.06
|
$144.50 – $114.76
|
$118.69 – $104.08
|
|||
|
2016 price range per share
|
$116.18 – $91.50
|
$112.39 – $89.47
|
$109.43 – $92.39
|
$123.82 – $105.57
|
|||
Holders
As of
October 20, 2017
, there were 25,333 shareholders of record.
Dividends
The Company paid a total of
$12.6 billion
and
$12.0 billion
in dividends during
2017
and
2016
, respectively, and expects to pay quarterly dividends of
$0.63
per common share each quarter, subject to declaration by the Board of Directors. The Company also plans to increase its dividend on an annual basis, subject to declaration by the Board of Directors.
Apple Inc. | 2017 Form 10-K |
18
Purchases of Equity Securities by the Issuer and Affiliated Purchasers
Share repurchase activity during the three months ended
September 30, 2017
was as follows (in millions, except number of shares, which are reflected in thousands, and per share amounts):
|
Periods
|
Total Number
of Shares Purchased
|
Average
Price
Paid Per Share
|
Total Number of Shares
Purchased as Part of Publicly
Announced Plans or Programs
|
Approximate Dollar Value of
Shares That May Yet Be Purchased
Under the Plans or Programs
(1)
|
||||||||||
|
July 2, 2017 to August 5, 2017:
|
||||||||||||||
|
Open market and privately negotiated purchases
|
10,076
|
|
$
|
148.87
|
|
10,076
|
|
|||||||
|
August 6, 2017 to September 2, 2017:
|
||||||||||||||
|
May 2017 ASR
|
4,510
|
|
(2)
|
|
4,510
|
|
||||||||
|
August 2017 ASR
|
15,069
|
|
(3)
|
(3)
|
|
15,069
|
|
(3)
|
||||||
|
Open market and privately negotiated purchases
|
9,684
|
|
$
|
160.06
|
|
9,684
|
|
|||||||
|
September 3, 2017 to September 30, 2017:
|
||||||||||||||
|
Open market and privately negotiated purchases
|
9,313
|
|
$
|
155.69
|
|
9,313
|
|
|||||||
|
Total
|
48,652
|
|
$
|
44,023
|
|
|||||||||
|
(1)
|
In
May 2017
, the Company’s Board of Directors increased the Company’s share repurchase authorization from $175 billion to
$210 billion
of the Company’s common stock, of which
$166 billion
had been utilized as of
September 30, 2017
. The remaining
$44 billion
in the table represents the amount available to repurchase shares under the authorized repurchase program as of
September 30, 2017
. The Company’s share repurchase program does not obligate it to acquire any specific number of shares. Under the program, shares may be repurchased in privately negotiated and/or open market transactions, including under plans complying with Rule 10b5-1 under the Exchange Act.
|
|
(2)
|
In May 2017, the Company entered into an accelerated share repurchase arrangement (“ASR”) to purchase up to
$3.0 billion
of the Company’s common stock. In August 2017, the purchase period for this ASR ended and an additional
4.5 million
shares were delivered and retired. In total,
20.1 million
shares were delivered under this ASR at an average repurchase price of
$149.20
.
|
|
(3)
|
In August 2017, the Company entered into a new ASR to purchase up to
$3.0 billion
of the Company’s common stock. In exchange for an up-front payment of
$3.0 billion
, the financial institution party to the arrangement committed to deliver shares to the Company during the ASR’s purchase period, which will end in
November 2017
. The total number of shares ultimately delivered, and therefore the average price paid per share, will be determined at the end of the applicable purchase period based on the volume-weighted average price of the Company’s common stock during that period.
|
Apple Inc. | 2017 Form 10-K |
19
Company Stock Performance
The following graph shows a comparison of cumulative total shareholder return, calculated on a dividend reinvested basis, for the Company, the S&P 500 Index, the S&P Information Technology Index and the Dow Jones U.S. Technology Supersector Index for the five years ended
September 30, 2017
. The graph assumes $100 was invested in each of the Company’s common stock, the S&P 500 Index, the S&P Information Technology Index and the Dow Jones U.S. Technology Supersector Index as of the market close on September 28, 2012. Note that historic stock price performance is not necessarily indicative of future stock price performance.
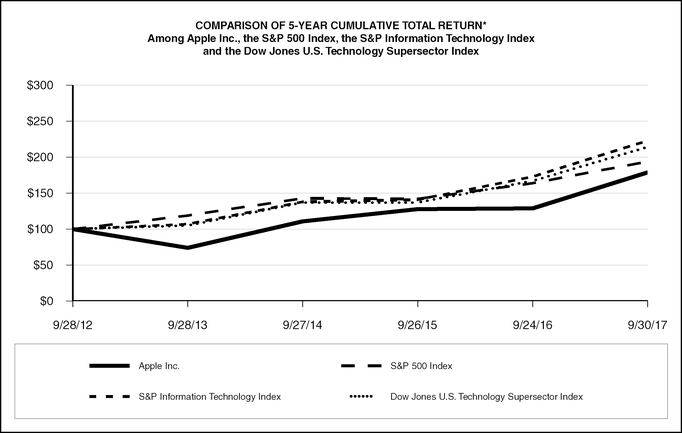
|
*
|
$100 invested on 9/28/12 in stock or index, including reinvestment of dividends. Data points are the last day of each fiscal year for the Company’s common stock and September 30th for indexes.
|
Copyright
©
2017 S&P, a division of McGraw Hill Financial. All rights reserved.
Copyright
©
2017 Dow Jones & Co. All rights reserved.
|
September
2012
|
September
2013
|
September
2014
|
September
2015
|
September
2016
|
September
2017
|
|||||||||||||||||||
|
Apple Inc.
|
$
|
100
|
|
$
|
74
|
|
$
|
111
|
|
$
|
128
|
|
$
|
129
|
|
$
|
179
|
|
||||||
|
S&P 500 Index
|
$
|
100
|
|
$
|
119
|
|
$
|
143
|
|
$
|
142
|
|
$
|
164
|
|
$
|
194
|
|
||||||
|
S&P Information Technology Index
|
$
|
100
|
|
$
|
107
|
|
$
|
138
|
|
$
|
141
|
|
$
|
173
|
|
$
|
223
|
|
||||||
|
Dow Jones U.S. Technology Supersector Index
|
$
|
100
|
|
$
|
105
|
|
$
|
137
|
|
$
|
137
|
|
$
|
167
|
|
$
|
214
|
|
||||||
Apple Inc. | 2017 Form 10-K |
20
|
Item 6.
|
Selected Financial Data
|
The information set forth below for the five years ended
September 30, 2017
, is not necessarily indicative of results of future operations, and should be read in conjunction with Part II, Item 7, “Management’s Discussion and Analysis of Financial Condition and Results of Operations” and the consolidated financial statements and related notes thereto included in Part II, Item 8 of this Form 10-K to fully understand factors that may affect the comparability of the information presented below (in millions, except number of shares, which are reflected in thousands, and per share amounts).
|
2017
|
2016
|
2015
|
2014
|
2013
|
|||||||||||||||
|
Net sales
|
$
|
229,234
|
|
$
|
215,639
|
|
$
|
233,715
|
|
$
|
182,795
|
|
$
|
170,910
|
|
||||
|
Net income
|
$
|
48,351
|
|
$
|
45,687
|
|
$
|
53,394
|
|
$
|
39,510
|
|
$
|
37,037
|
|
||||
|
Earnings per share:
|
|||||||||||||||||||
|
Basic
|
$
|
9.27
|
|
$
|
8.35
|
|
$
|
9.28
|
|
$
|
6.49
|
|
$
|
5.72
|
|
||||
|
Diluted
|
$
|
9.21
|
|
$
|
8.31
|
|
$
|
9.22
|
|
$
|
6.45
|
|
$
|
5.68
|
|
||||
|
Cash dividends declared per share
|
$
|
2.40
|
|
$
|
2.18
|
|
$
|
1.98
|
|
$
|
1.82
|
|
$
|
1.64
|
|
||||
|
Shares used in computing earnings per share:
|
|||||||||||||||||||
|
Basic
|
5,217,242
|
|
5,470,820
|
|
5,753,421
|
|
6,085,572
|
|
6,477,320
|
|
|||||||||
|
Diluted
|
5,251,692
|
|
5,500,281
|
|
5,793,069
|
|
6,122,663
|
|
6,521,634
|
|
|||||||||
|
Total cash, cash equivalents and marketable securities
|
$
|
268,895
|
|
$
|
237,585
|
|
$
|
205,666
|
|
$
|
155,239
|
|
$
|
146,761
|
|
||||
|
Total assets
|
$
|
375,319
|
|
$
|
321,686
|
|
$
|
290,345
|
|
$
|
231,839
|
|
$
|
207,000
|
|
||||
|
Commercial paper
|
$
|
11,977
|
|
$
|
8,105
|
|
$
|
8,499
|
|
$
|
6,308
|
|
$
|
—
|
|
||||
|
Total term debt
(1)
|
$
|
103,703
|
|
$
|
78,927
|
|
$
|
55,829
|
|
$
|
28,987
|
|
$
|
16,960
|
|
||||
|
Other long-term obligations
(2)
|
$
|
40,415
|
|
$
|
36,074
|
|
$
|
33,427
|
|
$
|
24,826
|
|
$
|
20,208
|
|
||||
|
Total liabilities
|
$
|
241,272
|
|
$
|
193,437
|
|
$
|
170,990
|
|
$
|
120,292
|
|
$
|
83,451
|
|
||||
|
Total shareholders’ equity
|
$
|
134,047
|
|
$
|
128,249
|
|
$
|
119,355
|
|
$
|
111,547
|
|
$
|
123,549
|
|
||||
|
(1)
|
Includes current and long-term portion of term debt.
|
|
(2)
|
Excludes non-current deferred revenue.
|
Apple Inc. | 2017 Form 10-K |
21
|
Item 7.
|
Management’s Discussion and Analysis of Financial Condition and Results of Operations
|
This section and other parts of this Annual Report on Form 10-K (“Form 10-K”) contain forward-looking statements, within the meaning of the Private Securities Litigation Reform Act of 1995, that involve risks and uncertainties. Forward-looking statements provide current expectations of future events based on certain assumptions and include any statement that does not directly relate to any historical or current fact. Forward-looking statements can also be identified by words such as “future,” “anticipates,” “believes,” “estimates,” “expects,” “intends,” “plans,” “predicts,” “will,” “would,” “could,” “can,” “may,” and similar terms. Forward-looking statements are not guarantees of future performance and the Company’s actual results may differ significantly from the results discussed in the forward-looking statements. Factors that might cause such differences include, but are not limited to, those discussed in Part I, Item 1A of this Form 10-K under the heading “Risk Factors,” which are incorporated herein by reference. The following discussion should be read in conjunction with the consolidated financial statements and notes thereto included in Part II, Item 8 of this Form 10-K. All information presented herein is based on the Company’s fiscal calendar. Unless otherwise stated, references to particular years, quarters, months or periods refer to the Company’s fiscal years ended in September and the associated quarters, months and periods of those fiscal years. Each of the terms the “Company” and “Apple” as used herein refers collectively to Apple Inc. and its wholly-owned subsidiaries, unless otherwise stated. The Company assumes no obligation to revise or update any forward-looking statements for any reason, except as required by law.
Overview and Highlights
The Company designs, manufactures and markets mobile communication and media devices and personal computers, and sells a variety of related software, services, accessories, networking solutions and third-party digital content and applications. The Company’s products and services include iPhone, iPad, Mac, Apple Watch, Apple TV, a portfolio of consumer and professional software applications, iOS, macOS, watchOS and tvOS operating systems, iCloud, Apple Pay and a variety of accessory, service and support offerings. The Company sells and delivers digital content and applications through the iTunes Store, App Store, Mac App Store, TV App Store, iBooks Store and Apple Music (collectively “Digital Content and Services”). The Company sells its products worldwide through its retail stores, online stores and direct sales force, as well as through third-party cellular network carriers, wholesalers, retailers and value-added resellers. In addition, the Company sells a variety of third-party Apple-compatible products, including application software and various accessories through its retail and online stores. The Company sells to consumers, small and mid-sized businesses and education, enterprise and government customers.
Fiscal Period
The Company’s fiscal year is the 52 or 53-week period that ends on the last Saturday of September. The Company’s fiscal year 2017 included 53 weeks and ended on
September 30, 2017
. A 14th week was included in the first quarter of 2017, as is done every five or six years, to realign the Company’s fiscal quarters with calendar quarters. The Company’s fiscal years 2016 and 2015 ended on
September 24, 2016
and
September 26, 2015
, respectively, and spanned 52 weeks each.
Fiscal 2017 Highlights
Net sales increased 6% or $13.6 billion during 2017 compared to 2016, primarily driven by growth in Services, iPhone and Mac. The year-over-year increase in net sales reflected growth in each of the geographic operating segments, with the exception of Greater China. The weakness in foreign currencies relative to the U.S. dollar had an unfavorable impact on net sales during 2017 compared to 2016. In May 2017, the Company announced an increase to its capital return program by raising the expected total size of the program from $250 billion to $300 billion through March 2019. This included increasing its share repurchase authorization from $175 billion to $210 billion and raising its quarterly dividend from $0.57 to $0.63 per share beginning in May 2017. During 2017, the Company spent
$33.0 billion
to repurchase shares of its common stock and paid dividends and dividend equivalents of
$12.8 billion
. Additionally, the Company issued $24.0 billion of U.S. dollar-denominated term debt, €2.5 billion of euro-denominated term debt and C$2.5 billion of Canadian dollar-denominated term debt during 2017.
Fiscal 2016 Highlights
Net sales declined 8% or $18.1 billion during 2016 compared to 2015, primarily driven by a year-over-year decrease in iPhone net sales and the effect of weakness in most foreign currencies relative to the U.S. dollar, partially offset by an increase in Services. In April 2016, the Company announced an increase to its capital return program by raising the expected total size of the program from $200 billion to $250 billion through March 2018. This included increasing its share repurchase authorization from $140 billion to $175 billion and raising its quarterly dividend from $0.52 to $0.57 per share beginning in May 2016. During 2016, the Company spent $29.0 billion to repurchase shares of its common stock and paid dividends and dividend equivalents of $12.2 billion. Additionally, the Company issued $23.9 billion of U.S. dollar-denominated term debt and A$1.4 billion of Australian dollar-denominated term debt during 2016.
Apple Inc. | 2017 Form 10-K |
22
Sales Data
The following table shows net sales by operating segment and net sales and unit sales by product for
2017
,
2016
and
2015
(dollars in millions and units in thousands):
|
2017
|
Change
|
2016
|
Change
|
2015
|
|||||||||||||
|
Net Sales by Operating Segment:
|
|||||||||||||||||
|
Americas
|
$
|
96,600
|
|
12
|
%
|
$
|
86,613
|
|
(8
|
)%
|
$
|
93,864
|
|
||||
|
Europe
|
54,938
|
|
10
|
%
|
49,952
|
|
(1
|
)%
|
50,337
|
|
|||||||
|
Greater China
|
44,764
|
|
(8
|
)%
|
48,492
|
|
(17
|
)%
|
58,715
|
|
|||||||
|
Japan
|
17,733
|
|
5
|
%
|
16,928
|
|
8
|
%
|
15,706
|
|
|||||||
|
Rest of Asia Pacific
|
15,199
|
|
11
|
%
|
13,654
|
|
(10
|
)%
|
15,093
|
|
|||||||
|
Total net sales
|
$
|
229,234
|
|
6
|
%
|
$
|
215,639
|
|
(8
|
)%
|
$
|
233,715
|
|
||||
|
Net Sales by Product:
|
|||||||||||||||||
|
iPhone
(1)
|
$
|
141,319
|
|
3
|
%
|
$
|
136,700
|
|
(12
|
)%
|
$
|
155,041
|
|
||||
|
iPad
(1)
|
19,222
|
|
(7
|
)%
|
20,628
|
|
(11
|
)%
|
23,227
|
|
|||||||
|
Mac
(1)
|
25,850
|
|
13
|
%
|
22,831
|
|
(10
|
)%
|
25,471
|
|
|||||||
|
Services
(2)
|
29,980
|
|
23
|
%
|
24,348
|
|
22
|
%
|
19,909
|
|
|||||||
|
Other Products
(1)(3)
|
12,863
|
|
16
|
%
|
11,132
|
|
11
|
%
|
10,067
|
|
|||||||
|
Total net sales
|
$
|
229,234
|
|
6
|
%
|
$
|
215,639
|
|
(8
|
)%
|
$
|
233,715
|
|
||||
|
Unit Sales by Product:
|
|||||||||||||||||
|
iPhone
|
216,756
|
|
2
|
%
|
211,884
|
|
(8
|
)%
|
231,218
|
|
|||||||
|
iPad
|
43,753
|
|
(4
|
)%
|
45,590
|
|
(17
|
)%
|
54,856
|
|
|||||||
|
Mac
|
19,251
|
|
4
|
%
|
18,484
|
|
(10
|
)%
|
20,587
|
|
|||||||
|
(1)
|
Includes deferrals and amortization of related software upgrade rights and non-software services.
|
|
(2)
|
Includes revenue from Digital Content and Services, AppleCare, Apple Pay, licensing and other services. Services net sales in the fourth quarter of 2017 included a favorable one-time adjustment of $640 million due to a change in estimate based on the availability of additional supporting information.
|
|
(3)
|
Includes sales of Apple TV, Apple Watch, Beats products, iPod touch and Apple-branded and third-party accessories.
|
Apple Inc. | 2017 Form 10-K |
23
Product Performance
iPhone
The following table presents iPhone net sales and unit sales information for
2017
,
2016
and
2015
(dollars in millions and units in thousands):
|
2017
|
Change
|
2016
|
Change
|
2015
|
|||||||||||||
|
Net sales
|
$
|
141,319
|
|
3
|
%
|
$
|
136,700
|
|
(12
|
)%
|
$
|
155,041
|
|
||||
|
Percentage of total net sales
|
62
|
%
|
|
|
63
|
%
|
66
|
%
|
|||||||||
|
Unit sales
|
216,756
|
|
2
|
%
|
211,884
|
|
(8
|
)%
|
231,218
|
|
|||||||
iPhone net sales increased during 2017 compared to 2016 due to higher iPhone unit sales and a different mix of iPhones with higher average selling prices. The weakness in foreign currencies relative to the U.S. dollar had an unfavorable impact on iPhone net sales during 2017 compared to 2016.
iPhone net sales decreased during 2016 compared to 2015. The Company believes the sales decline was due primarily to a lower rate of iPhone upgrades during 2016 compared to 2015 and challenging macroeconomic conditions in a number of major markets in 2016. Average selling prices for iPhone were lower year-over-year during 2016 due primarily to a different mix of iPhones, including the iPhone SE introduced in 2016, and the effect of weakness in most foreign currencies relative to the U.S. dollar.
iPad
The following table presents iPad net sales and unit sales information for
2017
,
2016
and
2015
(dollars in millions and units in thousands):
|
2017
|
Change
|
2016
|
Change
|
2015
|
|||||||||||||
|
Net sales
|
$
|
19,222
|
|
(7
|
)%
|
$
|
20,628
|
|
(11
|
)%
|
$
|
23,227
|
|
||||
|
Percentage of total net sales
|
8
|
%
|
10
|
%
|
10
|
%
|
|||||||||||
|
Unit sales
|
43,753
|
|
(4
|
)%
|
45,590
|
|
(17
|
)%
|
54,856
|
|
|||||||
iPad net sales decreased during 2017 compared to 2016 due to lower iPad unit sales and a different mix of iPads with lower average selling prices. The weakness in foreign currencies relative to the U.S. dollar had an unfavorable impact on iPad net sales during 2017 compared to 2016.
iPad net sales decreased during 2016 compared to 2015 primarily due to lower unit sales and the effect of weakness in most foreign currencies relative to the U.S. dollar, partially offset by higher average selling price due to a shift in mix to higher-priced iPads.
Mac
The following table presents Mac net sales and unit sales information for
2017
,
2016
and
2015
(dollars in millions and units in thousands):
|
2017
|
Change
|
2016
|
Change
|
2015
|
|||||||||||||
|
Net sales
|
$
|
25,850
|
|
13
|
%
|
$
|
22,831
|
|
(10
|
)%
|
$
|
25,471
|
|
||||
|
Percentage of total net sales
|
11
|
%
|
11
|
%
|
11
|
%
|
|||||||||||
|
Unit sales
|
19,251
|
|
4
|
%
|
18,484
|
|
(10
|
)%
|
20,587
|
|
|||||||
Mac net sales increased during 2017 compared to 2016 due primarily to a different mix of Macs with higher average selling prices and higher Mac unit sales. The weakness in foreign currencies relative to the U.S. dollar had an unfavorable impact on Mac net sales during 2017 compared to 2016.
Mac net sales decreased during 2016 compared to 2015 primarily due to lower year-over-year Mac unit sales, which declined at rates similar to the overall market. The effect of weakness in most foreign currencies relative to the U.S. dollar also negatively impacted Mac net sales.
Apple Inc. | 2017 Form 10-K |
24
Services
The following table presents Services net sales information for
2017
,
2016
and
2015
(dollars in millions):
|
2017
|
Change
|
2016
|
Change
|
2015
|
|||||||||||||
|
Net sales
|
$
|
29,980
|
|
23
|
%
|
$
|
24,348
|
|
22
|
%
|
$
|
19,909
|
|
||||
|
Percentage of total net sales
|
13
|
%
|
11
|
%
|
9
|
%
|
|||||||||||
The year-over-year growth in Services net sales in 2017 was due primarily to increases in App Store and licensing sales. Services net sales in the fourth quarter of 2017 included a favorable one-time adjustment of $640 million due to a change in estimate based on the availability of additional supporting information.
The year-over-year increase in Services net sales in 2016 was due primarily to growth from the App Store, licensing and AppleCare sales, partially offset by the effect of weakness in most foreign currencies relative to the U.S. dollar. During the first quarter of 2016, the Company received $548 million from Samsung Electronics Co., Ltd. related to its patent infringement lawsuit, which was recorded as licensing net sales within Services.
Segment Operating Performance
The Company manages its business primarily on a geographic basis. The Company’s reportable segments consist of the Americas, Europe, Greater China, Japan and Rest of Asia Pacific. Americas includes both North and South America. Europe includes European countries, as well as India, the Middle East and Africa. Greater China includes China, Hong Kong and Taiwan. Rest of Asia Pacific includes Australia and those Asian countries not included in the Company’s other reportable segments. Although the reportable segments provide similar hardware and software products and similar services, each one is managed separately to better align with the location of the Company’s customers and distribution partners and the unique market dynamics of each geographic region. Further information regarding the Company’s reportable segments can be found in Part II, Item 8 of this Form 10-K in the Notes to Consolidated Financial Statements in Note 11, “Segment Information and Geographic Data.”
Americas
The following table presents Americas net sales information for
2017
,
2016
and
2015
(dollars in millions):
|
2017
|
Change
|
2016
|
Change
|
2015
|
|||||||||||||
|
Net sales
|
$
|
96,600
|
|
12
|
%
|
$
|
86,613
|
|
(8
|
)%
|
$
|
93,864
|
|
||||
|
Percentage of total net sales
|
42
|
%
|
40
|
%
|
40
|
%
|
|||||||||||
Americas net sales increased during 2017 compared to 2016 due primarily to higher net sales of iPhone, Services and Mac.
Americas net sales decreased during 2016 compared to 2015 due primarily to lower net sales of iPhone.
Europe
The following table presents Europe net sales information for
2017
,
2016
and
2015
(dollars in millions):
|
2017
|
Change
|
2016
|
Change
|
2015
|
|||||||||||||
|
Net sales
|
$
|
54,938
|
|
10
|
%
|
$
|
49,952
|
|
(1
|
)%
|
$
|
50,337
|
|
||||
|
Percentage of total net sales
|
24
|
%
|
23
|
%
|
22
|
%
|
|||||||||||
Europe net sales increased during 2017 compared to 2016 due primarily to higher net sales of iPhone and Services. The weakness in foreign currencies relative to the U.S. dollar had an unfavorable impact on Europe net sales during 2017 compared to 2016.
Europe net sales decreased during 2016 compared to 2015 driven primarily by the effect of weakness in foreign currencies relative to the U.S. dollar and a decrease in net sales of Mac, largely offset by an increase in iPhone unit sales and Services.
Apple Inc. | 2017 Form 10-K |
25
Greater China
The following table presents Greater China net sales information for
2017
,
2016
and
2015
(dollars in millions):
|
2017
|
Change
|
2016
|
Change
|
2015
|
|||||||||||||
|
Net sales
|
$
|
44,764
|
|
(8
|
)%
|
$
|
48,492
|
|
(17
|
)%
|
$
|
58,715
|
|
||||
|
Percentage of total net sales
|
20
|
%
|
22
|
%
|
25
|
%
|
|||||||||||
Greater China net sales decreased during 2017 compared to 2016 due primarily to lower net sales of iPhone, partially offset by higher net sales of Services. The weakness in foreign currencies relative to the U.S. dollar had an unfavorable impact on Greater China net sales during 2017 compared to 2016.
Greater China net sales decreased during 2016 compared to 2015 due primarily to lower net sales of iPhone and the effect of weakness in foreign currencies relative to the U.S. dollar.
Japan
The following table presents Japan net sales information for
2017
,
2016
and
2015
(dollars in millions):
|
2017
|
Change
|
2016
|
Change
|
2015
|
|||||||||||||
|
Net sales
|
$
|
17,733
|
|
5
|
%
|
$
|
16,928
|
|
8
|
%
|
$
|
15,706
|
|
||||
|
Percentage of total net sales
|
8
|
%
|
8
|
%
|
7
|
%
|
|||||||||||
The year-over-year increase in Japan net sales in 2017 and 2016 was due primarily to higher net sales of Services and the strength in the Japanese yen relative to the U.S. dollar.
Rest of Asia Pacific
The following table presents Rest of Asia Pacific net sales information for
2017
,
2016
and
2015
(dollars in millions):
|
2017
|
Change
|
2016
|
Change
|
2015
|
|||||||||||||
|
Net sales
|
$
|
15,199
|
|
11
|
%
|
$
|
13,654
|
|
(10
|
)%
|
$
|
15,093
|
|
||||
|
Percentage of total net sales
|
7
|
%
|
6
|
%
|
6
|
%
|
|||||||||||
Rest of Asia Pacific net sales increased during 2017 compared to 2016 due primarily to higher net sales of iPhone, Services and Mac. The strength in foreign currencies relative to the U.S. dollar had a favorable impact on Rest of Asia Pacific net sales during 2017 compared to 2016.
Rest of Asia Pacific net sales decreased during 2016 compared to 2015 due primarily to lower net sales of iPhone and the effect of weakness in foreign currencies relative to the U.S. dollar.
Gross Margin
Gross margin for
2017
,
2016
and
2015
was as follows (dollars in millions):
|
2017
|
2016
|
2015
|
|||||||||
|
Net sales
|
$
|
229,234
|
|
$
|
215,639
|
|
$
|
233,715
|
|
||
|
Cost of sales
|
141,048
|
|
131,376
|
|
140,089
|
|
|||||
|
Gross margin
|
$
|
88,186
|
|
$
|
84,263
|
|
$
|
93,626
|
|
||
|
Gross margin percentage
|
38.5
|
%
|
39.1
|
%
|
40.1
|
%
|
|||||
Gross margin percentage decreased in 2017 compared to 2016 due primarily to higher product costs, partially offset by a favorable shift in mix to services. Year-over-year gross margin increased due primarily to a shift in mix to services and an overall increase in product volumes. The weakness in foreign currencies relative to the U.S. dollar had an unfavorable impact on gross margin percentage and gross margin during 2017 compared to 2016.
Gross margin percentage decreased in 2016 compared to 2015 due primarily to the effect of weakness in most foreign currencies relative to the U.S. dollar and, to a lesser extent, unfavorable leverage on fixed costs from lower net sales, partially offset by a favorable shift in mix to services.
Apple Inc. | 2017 Form 10-K |
26
The Company anticipates gross margin percentage during the first quarter of
2018
to be between 38.0% and 38.5%. The foregoing statement regarding the Company’s expected gross margin percentage in the first quarter of
2018
is forward-looking and could differ from actual results. The Company’s future gross margins can be impacted by multiple factors including, but not limited to, those set forth in Part I, Item 1A of this Form 10-K under the heading “Risk Factors” and those described in this paragraph. In general, the Company believes gross margins will remain under downward pressure due to a variety of factors, including continued industry-wide global product pricing pressures, increased competition, compressed product life cycles, product transitions, potential increases in the cost of components, and potential strengthening of the U.S. dollar, as well as potential increases in the costs of outside manufacturing services and a potential shift in the Company’s sales mix towards products with lower gross margins. In response to competitive pressures, the Company expects it will continue to take product pricing actions, which would adversely affect gross margins. Gross margins could also be affected by the Company’s ability to manage product quality and warranty costs effectively and to stimulate demand for certain of its products. Due to the Company’s significant international operations, its financial condition and operating results, including gross margins, could be significantly affected by fluctuations in exchange rates.
Operating Expenses
Operating expenses for
2017
,
2016
and
2015
were as follows (dollars in millions):
|
2017
|
Change
|
2016
|
Change
|
2015
|
|||||||||||||
|
Research and development
|
$
|
11,581
|
|
15
|
%
|
$
|
10,045
|
|
25
|
%
|
$
|
8,067
|
|
||||
|
Percentage of total net sales
|
5
|
%
|
5
|
%
|
3
|
%
|
|||||||||||
|
Selling, general and administrative
|
$
|
15,261
|
|
8
|
%
|
$
|
14,194
|
|
(1
|
)%
|
$
|
14,329
|
|
||||
|
Percentage of total net sales
|
7
|
%
|
7
|
%
|
6
|
%
|
|||||||||||
|
Total operating expenses
|
$
|
26,842
|
|
11
|
%
|
$
|
24,239
|
|
8
|
%
|
$
|
22,396
|
|
||||
|
Percentage of total net sales
|
12
|
%
|
11
|
%
|
10
|
%
|
|||||||||||
Research and Development
The year-over-year growth in R&D expense in 2017 and 2016 was driven primarily by increases in headcount-related expenses and material costs to support expanded R&D activities. The Company continues to believe that focused investments in R&D are critical to its future growth and competitive position in the marketplace, and to the development of new and updated products and services that are central to the Company’s core business strategy.
Selling, General and Administrative
The year-over-year growth in selling, general and administrative expense in 2017 compared to 2016 was driven primarily by an increase in headcount-related expenses, variable selling expenses and infrastructure-related costs. The decrease in selling, general and administrative expense in 2016 compared to 2015 was due primarily to lower discretionary expenditures and advertising costs, partially offset by an increase in headcount-related expenses.
Other Income/(Expense), Net
Other income/(expense), net for
2017
,
2016
and
2015
was as follows (dollars in millions):
|
2017
|
Change
|
2016
|
Change
|
2015
|
|||||||||||||
|
Interest and dividend income
|
$
|
5,201
|
|
$
|
3,999
|
|
$
|
2,921
|
|
||||||||
|
Interest expense
|
(2,323
|
)
|
(1,456
|
)
|
(733
|
)
|
|||||||||||
|
Other expense, net
|
(133
|
)
|
(1,195
|
)
|
(903
|
)
|
|||||||||||
|
Total other income/(expense), net
|
$
|
2,745
|
|
104
|
%
|
$
|
1,348
|
|
5
|
%
|
$
|
1,285
|
|
||||
The year-over-year increase in other income/(expense), net during 2017 was due primarily to higher interest income and the favorable impact of foreign exchange-related items, partially offset by higher interest expense on debt. The year-over-year increase in other income/(expense), net during 2016 was due primarily to higher interest income, partially offset by higher interest expense on debt and the unfavorable impact of foreign exchange-related items. The weighted-average interest rate earned by the Company on its cash, cash equivalents and marketable securities was 1.99%, 1.73% and 1.49% in
2017
,
2016
and
2015
, respectively.
Apple Inc. | 2017 Form 10-K |
27
Provision for Income Taxes
Provision for income taxes and effective tax rates for
2017
,
2016
and
2015
were as follows (dollars in millions):
|
2017
|
2016
|
2015
|
|||||||||
|
Provision for income taxes
|
$
|
15,738
|
|
$
|
15,685
|
|
$
|
19,121
|
|
||
|
Effective tax rate
|
24.6
|
%
|
25.6
|
%
|
26.4
|
%
|
|||||
The Company’s effective tax rates for
2017
,
2016
and
2015
differ from the statutory federal income tax rate of 35% due primarily to certain undistributed foreign earnings, a substantial portion of which was generated by subsidiaries organized in Ireland, for which no U.S. taxes are provided when such earnings are intended to be indefinitely reinvested outside the U.S. The lower effective tax rate in 2017 compared to 2016 was due to a different geographic mix of earnings and higher U.S. R&D tax credits. The lower effective tax rate in 2016 compared to 2015 was due primarily to greater R&D tax credits.
As of
September 30, 2017
, the Company had deferred tax assets arising from deductible temporary differences, tax losses and tax credits of $3.9 billion and deferred tax liabilities of
$31.5 billion
. Management believes it is more likely than not that forecasted income, including income that may be generated as a result of certain tax planning strategies, together with future reversals of existing taxable temporary differences, will be sufficient to fully recover the deferred tax assets. The Company will continue to evaluate the realizability of deferred tax assets quarterly by assessing the need for and the amount of a valuation allowance.
The IRS concluded its review of the years 2010 through 2012 during the third quarter of 2017. All years prior to 2013 are closed, and the IRS is currently examining the years 2013 through 2015. The Company is also subject to audits by state, local and foreign tax authorities. In major states and major foreign jurisdictions, the years subsequent to 2003 generally remain open and could be subject to examination by the taxing authorities. Management believes that adequate provisions have been made for any adjustments that may result from tax examinations. However, the outcome of tax audits cannot be predicted with certainty. If any issues addressed in the Company’s tax audits are resolved in a manner not consistent with management’s expectations, the Company could be required to adjust its provision for income taxes in the period such resolution occurs.
On August 30, 2016, the European Commission announced its decision that Ireland granted state aid to the Company by providing tax opinions in 1991 and 2007 concerning the tax allocation of profits of the Irish branches of two subsidiaries of the Company (the “State Aid Decision”). The State Aid Decision orders Ireland to calculate and recover additional taxes from the Company for the period June 2003 through December 2014. Irish legislative changes, effective as of January 2015, eliminated the application of the tax opinions from that date forward. The Company believes the State Aid Decision to be without merit and appealed to the General Court of the Court of Justice of the European Union. Ireland has also appealed the State Aid Decision. Although Ireland is still computing the recovery amount, the Company expects the amount to be in line with the European Commission’s announced recovery amount of
€13 billion
, plus interest of
€1 billion
. Once the recovery amount is finalized by Ireland, the Company anticipates funding it, including interest, out of foreign cash. These amounts are expected to be placed into escrow in 2018, where they will remain pending conclusion of all appeals. The Company believes that any incremental Irish corporate income taxes potentially due related to the State Aid Decision would be creditable against U.S. taxes.
Recent Accounting Pronouncements
Hedging
In August 2017, the Financial Accounting Standards Board (“FASB”) issued Accounting Standards Update (“ASU”) No. 2017-12, Derivatives and Hedging (Topic 815): Targeted Improvements to Accounting for Hedging Activities (“ASU 2017-12”). ASU 2017-12 expands component and fair value hedging, specifies the presentation of the effects of hedging instruments, and eliminates the separate measurement and presentation of hedge ineffectiveness. The Company will adopt ASU 2017-12 in its first quarter of 2020 utilizing the modified retrospective transition method and is currently evaluating the impact of adoption on its consolidated financial statements.
Restricted Cash
In November 2016, the FASB issued ASU No. 2016-18, Statement of Cash Flows (Topic 230): Restricted Cash (“ASU 2016-18”), which enhances and clarifies the guidance on the classification and presentation of restricted cash in the statement of cash flows. The Company will adopt ASU 2016-18 in its first quarter of 2019 utilizing the retrospective transition method. Currently, the Company’s restricted cash balance is not significant.
Apple Inc. | 2017 Form 10-K |
28
Income Taxes
In October 2016, the FASB issued ASU No. 2016-16, Income Taxes (Topic 740): Intra-Entity Transfers of Assets Other Than Inventory (“ASU 2016-16”), which requires the recognition of the income tax consequences of an intra-entity transfer of an asset, other than inventory, when the transfer occurs. The Company will adopt ASU 2016-16 in its first quarter of 2019 utilizing the modified retrospective transition method. Currently, the Company anticipates recording up to $9 billion of net deferred tax assets on its Consolidated Balance Sheets upon adoption. However, the ultimate impact of adopting ASU 2016-16 will depend on the balance of intellectual property transferred between its subsidiaries as of the adoption date. The Company will recognize incremental deferred income tax expense thereafter as these deferred tax assets are utilized.
Stock Compensation
In March 2016, the FASB issued ASU No. 2016-09, Compensation – Stock Compensation (Topic 718): Improvements to Employee Share-Based Payment Accounting (“ASU 2016-09”), which modifies certain aspects of the accounting for share-based payment transactions, including income taxes, classification of awards, and classification in the statement of cash flows. The Company will adopt ASU 2016-09 in its first quarter of 2018. Currently, excess tax benefits or deficiencies from the Company’s equity awards are recorded as additional paid-in capital in its Consolidated Balance Sheets. Upon adoption, the Company will record any excess tax benefits or deficiencies from its equity awards in its Consolidated Statements of Operations in the reporting periods in which vesting occurs. As a result, subsequent to adoption the Company’s income tax expense and associated effective tax rate will be impacted by fluctuations in stock price between the grant dates and vesting dates of equity awards.
Leases
In February 2016, the FASB issued ASU No. 2016-02, Leases (Topic 842) (“ASU 2016-02”), which modifies lease accounting for lessees to increase transparency and comparability by recording lease assets and liabilities for operating leases and disclosing key information about leasing arrangements. The Company will adopt ASU 2016-02 in its first quarter of 2020 utilizing the modified retrospective transition method. While the Company is currently evaluating the timing and impact of adopting ASU 2016-02, currently the Company anticipates recording lease assets and liabilities in excess of
$9.5 billion
on its Consolidated Balance Sheets, with no material impact to its Consolidated Statements of Operations. However, the ultimate impact of adopting ASU 2016-02 will depend on the Company’s lease portfolio as of the adoption date.
Financial Instruments
In January 2016, the FASB issued ASU No. 2016-01, Financial Instruments – Overall (Subtopic 825-10): Recognition and Measurement of Financial Assets and Financial Liabilities (“ASU 2016-01”), which updates certain aspects of recognition, measurement, presentation and disclosure of financial instruments. The Company will adopt ASU 2016-01 in its first quarter of 2019 utilizing the modified retrospective transition method. Based on the composition of the Company’s investment portfolio, the adoption of ASU 2016-01 is not expected to have a material impact on its consolidated financial statements.
In June 2016, the FASB issued ASU No. 2016-13, Financial Instruments – Credit Losses (Topic 326): Measurement of Credit Losses on Financial Instruments (“ASU 2016-13”), which modifies the measurement of expected credit losses of certain financial instruments. The Company will adopt ASU 2016-13 in its first quarter of 2021 utilizing the modified retrospective transition method. Based on the composition of the Company’s investment portfolio, current market conditions, and historical credit loss activity, the adoption of ASU 2016-13 is not expected to have a material impact on its consolidated financial statements.
Revenue Recognition
In May 2014, the FASB issued ASU No. 2014-09, Revenue from Contracts with Customers (Topic 606) (“ASU 2014-09”), which amends the existing accounting standards for revenue recognition. ASU 2014-09 is based on principles that govern the recognition of revenue at an amount an entity expects to be entitled when products are transferred to customers.
Subsequently, the FASB has issued the following standards related to ASU 2014-09: ASU No. 2016-08, Revenue from Contracts with Customers (Topic 606): Principal versus Agent Considerations (“ASU 2016-08”); ASU No. 2016-10, Revenue from Contracts with Customers (Topic 606): Identifying Performance Obligations and Licensing (“ASU 2016-10”); ASU No. 2016-12, Revenue from Contracts with Customers (Topic 606): Narrow-Scope Improvements and Practical Expedients (“ASU 2016-12”); and ASU No. 2016-20, Technical Corrections and Improvements to Topic 606, Revenue from Contracts with Customers (“ASU 2016-20”). The Company must adopt ASU 2016-08, ASU 2016-10, ASU 2016-12 and ASU 2016-20 with ASU 2014-09 (collectively, the “new revenue standards”).
The new revenue standards may be applied retrospectively to each prior period presented or retrospectively with the cumulative effect recognized as of the date of adoption. The Company will adopt the new revenue standards in its first quarter of 2019 utilizing the full retrospective transition method. The new revenue standards are not expected to have a material impact on the amount and timing of revenue recognized in the Company’s consolidated financial statements.
Apple Inc. | 2017 Form 10-K |
29
Liquidity and Capital Resources
The following table presents selected financial information and statistics as of and for the years ended
September 30, 2017
,
September 24, 2016
and
September 26, 2015
(in millions):
|
2017
|
2016
|
2015
|
|||||||||
|
Cash, cash equivalents and marketable securities
|
$
|
268,895
|
|
$
|
237,585
|
|
$
|
205,666
|
|
||
|
Property, plant and equipment, net
|
$
|
33,783
|
|
$
|
27,010
|
|
$
|
22,471
|
|
||
|
Commercial paper
|
$
|
11,977
|
|
$
|
8,105
|
|
$
|
8,499
|
|
||
|
Total term debt
|
$
|
103,703
|
|
$
|
78,927
|
|
$
|
55,829
|
|
||
|
Working capital
|
$
|
27,831
|
|
$
|
27,863
|
|
$
|
8,768
|
|
||
|
Cash generated by operating activities
|
$
|
63,598
|
|
$
|
65,824
|
|
$
|
81,266
|
|
||
|
Cash used in investing activities
|
$
|
(46,446
|
)
|
$
|
(45,977
|
)
|
$
|
(56,274
|
)
|
||
|
Cash used in financing activities
|
$
|
(17,347
|
)
|
$
|
(20,483
|
)
|
$
|
(17,716
|
)
|
||
The Company believes its existing balances of cash, cash equivalents and marketable securities will be sufficient to satisfy its working capital needs, capital asset purchases, outstanding commitments and other liquidity requirements associated with its existing operations over the next 12 months. The Company currently anticipates the cash used for future dividends, the share repurchase program and debt repayments will come from its current domestic cash, cash generated from ongoing U.S. operating activities and from borrowings.
As of
September 30, 2017
and
September 24, 2016
, the Company’s cash, cash equivalents and marketable securities held by foreign subsidiaries were
$252.3 billion
and
$216.0 billion
, respectively, and are generally based in U.S. dollar-denominated holdings. Amounts held by foreign subsidiaries are generally subject to U.S. income taxation on repatriation to the U.S. In connection with the State Aid Decision, Ireland is still computing the recovery amount. The Company expects the amount to be in line with the European Commission’s announced recovery amount of
€13 billion
, plus interest of
€1 billion
. Once the recovery amount is finalized by Ireland, the Company anticipates funding it, including interest, out of foreign cash. These amounts are expected to be placed into escrow in 2018, where they will remain pending conclusion of all appeals.
The Company’s marketable securities investment portfolio is primarily invested in highly-rated securities, and its investment policy generally limits the amount of credit exposure to any one issuer. The policy generally requires investments to be investment grade, with the primary objective of minimizing the potential risk of principal loss.
During
2017
, cash generated by operating activities of
$63.6 billion
was a result of
$48.4 billion
of net income, non-cash adjustments to net income of
$20.8 billion
and a decrease in the net change in operating assets and liabilities of
$5.6 billion
, which included a one-time payment of $1.9 billion related to a multi-year license agreement. Cash used in investing activities of
$46.4 billion
during
2017
consisted primarily of cash used for purchases of marketable securities, net of sales and maturities, of
$33.1 billion
and cash used to acquire property, plant and equipment of
$12.5 billion
. Cash used in financing activities of
$17.3 billion
during
2017
consisted primarily of cash used to repurchase common stock of
$32.9 billion
, cash used to pay dividends and dividend equivalents of
$12.8 billion
and cash used to repay term debt of
$3.5 billion
, partially offset by proceeds from the issuance of term debt, net of
$28.7 billion
and proceeds from commercial paper, net of
$3.9 billion
.
During
2016
, cash generated by operating activities of
$65.8 billion
was a result of
$45.7 billion
of net income and non-cash adjustments to net income of
$20.1 billion
. Cash used in investing activities of
$46.0 billion
during
2016
consisted primarily of cash used for purchases of marketable securities, net of sales and maturities, of
$30.6 billion
and cash used to acquire property, plant and equipment of
$12.7 billion
. Cash used in financing activities of
$20.5 billion
during
2016
consisted primarily of cash used to repurchase common stock of
$29.7 billion
, cash used to pay dividends and dividend equivalents of
$12.2 billion
and cash used to repay term debt of
$2.5 billion
, partially offset by proceeds from the issuance of term debt, net of
$25.0 billion
.
Capital Assets
The Company’s capital expenditures were
$14.9 billion
during
2017
. The Company anticipates utilizing approximately $16.0 billion for capital expenditures during
2018
, which includes product tooling and manufacturing process equipment; data centers; corporate facilities and infrastructure, including information systems hardware, software and enhancements; and retail store facilities.
Debt
The Company issues unsecured short-term promissory notes (“Commercial Paper”) pursuant to a commercial paper program. The Company uses the net proceeds from the commercial paper program for general corporate purposes, including dividends and share repurchases. As of
September 30, 2017
, the Company had
$12.0 billion
of Commercial Paper outstanding, with a weighted-average interest rate of
1.20%
and maturities generally less than
nine months
.
Apple Inc. | 2017 Form 10-K |
30
As of
September 30, 2017
, the Company had outstanding floating- and fixed-rate notes with varying maturities for an aggregate principal amount of
$104.0 billion
(collectively the “Notes”). During
2017
, the Company repaid
$3.5 billion
of its Notes upon maturity. The Company has entered, and in the future may enter, into interest rate swaps to manage interest rate risk on the Notes. In addition, the Company has entered, and in the future may enter, into foreign currency swaps to manage foreign currency risk on the Notes. The future principal payments for the Company’s Notes as of
September 30, 2017
are as follows (in millions):
|
2018
|
$
|
6,500
|
|
|
2019
|
8,863
|
|
|
|
2020
|
9,220
|
|
|
|
2021
|
7,750
|
|
|
|
2022
|
10,297
|
|
|
|
Thereafter
|
61,391
|
|
|
|
Total term debt
|
$
|
104,021
|
|
Further information regarding the Company’s debt issuances and related hedging activity can be found in Part II, Item 8 of this Form 10-K in the Notes to Consolidated Financial Statements in Note 2, “Financial Instruments” and Note 6, “Debt.”
Capital Return Program
In
May 2017
, the Company’s Board of Directors increased the total capital return program from $250 billion to
$300 billion
, which included an increase in the share repurchase authorization from $175 billion to
$210 billion
of the Company’s common stock. Additionally, the Company announced that the Board of Directors raised the Company’s quarterly cash dividend from $0.57 to $0.63 per share, beginning with the dividend paid during the third quarter of 2017. The Company intends to increase its dividend on an annual basis, subject to declaration by the Board of Directors.
As of
September 30, 2017
,
$166 billion
of the share repurchase program had been utilized. The Company’s share repurchase program does not obligate it to acquire any specific number of shares. Under the program, shares may be repurchased in privately negotiated or open market transactions, including under plans complying with Rule 10b5-1 under the Exchange Act.
The following table presents the Company’s dividends, dividend equivalents, share repurchases and net share settlement activity from the start of the capital return program in August 2012 through
September 30, 2017
(in millions):
|
Dividends and
Dividend Equivalents Paid
|
Accelerated Share
Repurchases
|
Open Market
Share Repurchases
|
Taxes Related to Settlement
of Equity Awards
|
Total
|
|||||||||||||||
|
2017
|
$
|
12,769
|
|
$
|
15,000
|
|
$
|
18,001
|
|
$
|
1,874
|
|
$
|
47,644
|
|
||||
|
2016
|
12,150
|
|
12,000
|
|
17,000
|
|
1,570
|
|
42,720
|
|
|||||||||
|
2015
|
11,561
|
|
6,000
|
|
30,026
|
|
1,499
|
|
49,086
|
|
|||||||||
|
2014
|
11,126
|
|
21,000
|
|
24,000
|
|
1,158
|
|
57,284
|
|
|||||||||
|
2013
|
10,564
|
|
13,950
|
|
9,000
|
|
1,082
|
|
34,596
|
|
|||||||||
|
2012
|
2,488
|
|
—
|
|
—
|
|
56
|
|
2,544
|
|
|||||||||
|
Total
|
$
|
60,658
|
|
$
|
67,950
|
|
$
|
98,027
|
|
$
|
7,239
|
|
$
|
233,874
|
|
||||
The Company expects to execute its capital return program by the end of March 2019 by paying dividends and dividend equivalents, repurchasing shares and remitting withheld taxes related to net share settlement of restricted stock units. The Company plans to continue to access the domestic and international debt markets to assist in funding its capital return program.
Off-Balance Sheet Arrangements and Contractual Obligations
The Company has not entered into any transactions with unconsolidated entities whereby the Company has financial guarantees, subordinated retained interests, derivative instruments, or other contingent arrangements that expose the Company to material continuing risks, contingent liabilities, or any other obligation under a variable interest in an unconsolidated entity that provides financing, liquidity, market risk, or credit risk support to the Company, or engages in leasing, hedging, or R&D services with the Company.
Apple Inc. | 2017 Form 10-K |
31
The following table presents certain payments due by the Company as of
September 30, 2017
, and excludes amounts already recorded on the Consolidated Balance Sheet, except for term debt (in millions):
|
Payments Due
in Less Than
1 Year
|
Payments Due
in 1-3 Years
|
Payments Due
in 4-5 Years
|
Payments Due
in More Than
5 Years
|
Total
|
|||||||||||||||
|
Term debt
|
$
|
6,500
|
|
$
|
18,083
|
|
$
|
18,047
|
|
$
|
61,391
|
|
$
|
104,021
|
|
||||
|
Operating leases
|
1,223
|
|
2,295
|
|
1,904
|
|
4,123
|
|
9,545
|
|
|||||||||
|
Manufacturing purchase obligations
(1)
|
32,787
|
|
2,632
|
|
2,147
|
|
—
|
|
37,566
|
|
|||||||||
|
Other purchase obligations
|
4,019
|
|
1,669
|
|
417
|
|
14
|
|
6,119
|
|
|||||||||
|
Total
|
$
|
44,529
|
|
$
|
24,679
|
|
$
|
22,515
|
|
$
|
65,528
|
|
$
|
157,251
|
|
||||
|
(1)
|
Represents amount expected to be paid under manufacturing-related supplier arrangements, substantially all of which is noncancelable.
|
Operating Leases
As of
September 30, 2017
, the Company’s total future minimum lease payments under noncancelable operating leases were
$9.5 billion
. The Company’s retail store and other facility leases typically have original terms not exceeding 10 years and generally contain multi-year renewal options.
Manufacturing Purchase Obligations
The Company utilizes several outsourcing partners to manufacture sub-assemblies for the Company’s products and to perform final assembly and testing of finished products. These outsourcing partners acquire components and build product based on demand information supplied by the Company, which typically covers periods up to
150 days
. The Company also obtains individual components for its products from a wide variety of individual suppliers. As of
September 30, 2017
, the Company expects to pay
$37.6 billion
under manufacturing-related supplier arrangements, substantially all of which is noncancelable.
Other Purchase Obligations
The Company’s other purchase obligations consisted of noncancelable obligations to acquire capital assets, including product tooling and manufacturing process equipment, and noncancelable obligations related to advertising, licensing, R&D, internet and telecommunications services and other obligations. As of
September 30, 2017
, the Company had other purchase obligations of
$6.1 billion
.
The Company’s other non-current liabilities in the Consolidated Balance Sheets consist primarily of deferred tax liabilities, gross unrecognized tax benefits and the related gross interest and penalties. As of
September 30, 2017
, the Company had deferred tax liabilities of
$31.5 billion
, gross unrecognized tax benefits of
$8.4 billion
and an additional
$1.2 billion
for gross interest and penalties. At this time, the Company is unable to make a reasonably reliable estimate of the timing of payments due to uncertainties in the timing of tax audit outcomes; therefore, such amounts are not included in the above contractual obligation table.
Indemnification
Agreements entered into by the Company sometimes include indemnification provisions which may subject the Company to costs and damages in the event of a claim against an indemnified third party. In the opinion of management, there was not at least a reasonable possibility the Company may have incurred a material loss, or a material loss in excess of a recorded accrual, with respect to indemnification of third parties.
The Company offers an iPhone Upgrade Program, which is available to customers who purchase a qualifying iPhone in the U.S., the U.K. and mainland China. The iPhone Upgrade Program provides customers the right to trade in that iPhone for a specified amount when purchasing a new iPhone, provided certain conditions are met. The Company accounts for the trade-in right as a guarantee liability and recognizes arrangement revenue net of the fair value of such right, with subsequent changes to the guarantee liability recognized within revenue.
The Company has entered into indemnification agreements with its directors and executive officers. Under these agreements, the Company has agreed to indemnify such individuals to the fullest extent permitted by law against liabilities that arise by reason of their status as directors or officers of the Company and to advance expenses incurred by such individuals in connection with related legal proceedings. It is not possible to determine the maximum potential amount of payments the Company could be required to make under these agreements due to the limited history of prior indemnification claims and the unique facts and circumstances involved in each claim. While the Company maintains directors and officers liability insurance coverage, such insurance coverage may be insufficient to cover all losses or all types of claims that may arise.
Apple Inc. | 2017 Form 10-K |
32
Critical Accounting Policies and Estimates
The preparation of financial statements and related disclosures in conformity with U.S. generally accepted accounting principles (“GAAP”) and the Company’s discussion and analysis of its financial condition and operating results require the Company’s management to make judgments, assumptions and estimates that affect the amounts reported in its consolidated financial statements and accompanying notes. Note 1, “Summary of Significant Accounting Policies,” of the Notes to Consolidated Financial Statements in Part II, Item 8 of this Form 10-K describes the significant accounting policies and methods used in the preparation of the Company’s consolidated financial statements. Management bases its estimates on historical experience and on various other assumptions it believes to be reasonable under the circumstances, the results of which form the basis for making judgments about the carrying values of assets and liabilities. Actual results may differ from these estimates, and such differences may be material.
Management believes the Company’s critical accounting policies and estimates are those related to revenue recognition, valuation and impairment of marketable securities, inventory valuation, valuation of manufacturing-related assets and estimation of purchase commitment cancellation fees, warranty costs, income taxes, and legal and other contingencies. Management considers these policies critical because they are both important to the portrayal of the Company’s financial condition and operating results, and they require management to make judgments and estimates about inherently uncertain matters. The Company’s senior management has reviewed these critical accounting policies and related disclosures with the Audit and Finance Committee of the Company’s Board of Directors.
Revenue Recognition
Net sales consist primarily of revenue from the sale of hardware, software, digital content and applications, accessories, and service and support contracts. The Company recognizes revenue when persuasive evidence of an arrangement exists, delivery has occurred, the sales price is fixed or determinable and collection is probable. Product is considered delivered to the customer once it has been shipped and title, risk of loss and rewards of ownership have been transferred. For most of the Company’s product sales, these criteria are met at the time the product is shipped. For online sales to individuals, for some sales to education customers in the U.S., and for certain other sales, the Company defers revenue until the customer receives the product because the Company retains a portion of the risk of loss on these sales during transit. For payment terms in excess of the Company’s standard payment terms, revenue is recognized as payments become due unless the Company has positive evidence that the sales price is fixed or determinable, such as a successful history of collection, without concession, on comparable arrangements. The Company recognizes revenue from the sale of hardware products, software bundled with hardware that is essential to the functionality of the hardware and third-party digital content sold on the iTunes Store in accordance with general revenue recognition accounting guidance. The Company recognizes revenue in accordance with industry-specific software accounting guidance for the following types of sales transactions: (i) standalone sales of software products, (ii) sales of software upgrades and (iii) sales of software bundled with hardware not essential to the functionality of the hardware.
For multi-element arrangements that include hardware products containing software essential to the hardware product’s functionality, undelivered software elements that relate to the hardware product’s essential software and/or undelivered non-software services, the Company allocates revenue to all deliverables based on their relative selling prices. In such circumstances, the Company uses a hierarchy to determine the selling price to be used for allocating revenue to deliverables: (i) vendor-specific objective evidence of fair value (“VSOE”), (ii) third-party evidence of selling price (“TPE”) and (iii) best estimate of selling price (“ESP”). VSOE generally exists only when the Company sells the deliverable separately and is the price actually charged by the Company for that deliverable. ESPs reflect the Company’s best estimates of what the selling prices of elements would be if they were sold regularly on a stand-alone basis.
For sales of qualifying versions of iOS devices, Mac, Apple Watch and Apple TV, the Company has indicated it may from time to time provide future unspecified software upgrades to the device’s essential software and/or non-software services free of charge. Because the Company has neither VSOE nor TPE for the unspecified software upgrade rights or the non-software services, revenue is allocated to these rights and services based on the Company’s ESPs. Revenue allocated to the unspecified software upgrade rights and non-software services based on the Company’s ESPs is deferred and recognized on a straight-line basis over the estimated period the software upgrades and non-software services are expected to be provided.
The Company’s process for determining ESPs involves management’s judgment and considers multiple factors that may vary over time depending upon the unique facts and circumstances related to each deliverable. Should future facts and circumstances change, the Company’s ESPs and the future rate of related amortization for unspecified software upgrades and non-software services related to future sales of these devices could change. Factors subject to change include the unspecified software upgrade rights and non-software services offered, the estimated value of unspecified software upgrade rights and non-software services and the estimated period unspecified software upgrades and non-software services are expected to be provided.
Apple Inc. | 2017 Form 10-K |
33
The Company records reductions to revenue for estimated commitments related to price protection and other customer incentive programs. For transactions involving price protection, the Company recognizes revenue net of the estimated amount to be refunded, provided the refund amount can be reasonably and reliably estimated and the other conditions for revenue recognition have been met. The Company’s policy requires that, if refunds cannot be reliably estimated, revenue is not recognized until reliable estimates can be made or the price protection lapses. For the Company’s other customer incentive programs, the estimated cost is recognized at the later of the date at which the Company has sold the product or the date at which the program is offered. The Company also records reductions to revenue for expected future product returns based on the Company’s historical experience. Future market conditions and product transitions may require the Company to increase customer incentive programs that could result in reductions to future revenue. Additionally, certain customer incentive programs require management to estimate the number of customers who will actually redeem the incentive. Management’s estimates are based on historical experience and the specific terms and conditions of particular incentive programs. If a greater than estimated proportion of customers redeems such incentives, the Company would be required to record additional reductions to revenue, which would have an adverse impact on the Company’s operating results.
Valuation and Impairment of Marketable Securities
The Company’s investments in available-for-sale securities are reported at fair value. Unrealized gains and losses related to changes in the fair value of securities are recognized in accumulated other comprehensive income, net of tax, in the Company’s Consolidated Balance Sheets. Changes in the fair value of available-for-sale securities impact the Company’s net income only when such securities are sold or an other-than-temporary impairment is recognized. Realized gains and losses on the sale of securities are determined by specific identification of each security’s cost basis. The Company regularly reviews its investment portfolio to determine if any security is other-than-temporarily impaired, which would require the Company to record an impairment charge in the period any such determination is made. In making this determination, the Company evaluates, among other things, the duration and extent to which the fair value of a security is less than its cost; the financial condition of the issuer and any changes thereto; and the Company’s intent to sell, or whether it will more likely than not be required to sell, the security before recovery of its amortized cost basis. The Company’s assessment of whether a security is other-than-temporarily impaired could change in the future due to new developments or changes in assumptions related to any particular security, which would have an adverse impact on the Company’s financial condition and operating results.
Inventory Valuation, Valuation of Manufacturing-Related Assets and Estimation of Purchase Commitment Cancellation Fees
The Company must purchase components and build inventory in advance of product shipments and has invested in manufacturing-related assets, including capital assets held at its suppliers’ facilities. In addition, the Company has made prepayments to certain of its suppliers associated with long-term supply agreements to secure supply of inventory components. The Company records a write-down for inventories of components and products, including third-party products held for resale, which have become obsolete or are in excess of anticipated demand or net realizable value. The Company performs a regular review of inventory that considers multiple factors including demand forecasts, product life cycle status, product development plans, current sales levels and component cost trends. The Company also reviews its manufacturing-related capital assets and inventory prepayments for impairment whenever events or circumstances indicate the carrying amount of such assets may not be recoverable. If the Company determines that an asset is not recoverable, it records an impairment loss equal to the amount by which the carrying value of such an asset exceeds its fair value.
The industries in which the Company competes are subject to a rapid and unpredictable pace of product and component obsolescence and demand changes. In certain circumstances the Company may be required to record additional write-downs of inventory and/or impairments of manufacturing-related assets or inventory prepayments. These circumstances include future demand or market conditions for the Company’s products being less favorable than forecasted, unforeseen technological changes or changes to the Company’s product development plans that negatively impact the utility of any of these assets, or significant deterioration in the financial condition of one or more of the Company’s suppliers that hold any of the Company’s manufacturing-related assets or to whom the Company has made an inventory prepayment. Such write-downs would adversely affect the Company’s financial condition and operating results in the period when the additional write-downs were recorded.
The Company accrues for estimated purchase commitment cancellation fees related to inventory orders that have been canceled or are expected to be canceled. Manufacturing purchase obligations typically cover the Company’s forecasted component and manufacturing requirements for periods up to
150 days
. If there is an abrupt and substantial decline in demand for one or more of the Company’s products, a change in the Company’s product development plans, or an unanticipated change in technological requirements for any of the Company’s products, the Company may be required to record additional accruals for cancellation fees that would adversely affect its results of operations in the period when the cancellation fees were identified and recorded.
Apple Inc. | 2017 Form 10-K |
34
Warranty Costs
The Company accrues for the estimated cost of warranties in the period the related revenue is recognized based on historical and projected warranty claim rates, historical and projected cost per claim and knowledge of specific product failures that are outside of the Company’s typical experience. The Company regularly reviews these estimates and the current installed base of products subject to warranty protection to assess the appropriateness of its recorded warranty liabilities and adjusts the amounts as necessary. If actual product failure rates or repair costs differ from estimates, revisions to the estimated warranty liabilities could be required and could materially affect the Company’s financial condition and operating results.
Income Taxes
The Company records a tax provision for the anticipated tax consequences of its reported operating results. The provision for income taxes is computed using the asset and liability method, under which deferred tax assets and liabilities are recognized for the expected future tax consequences of temporary differences between the financial reporting and tax bases of assets and liabilities, and for operating losses and tax credit carryforwards. Deferred tax assets and liabilities are measured using the currently enacted tax rates that apply to taxable income in effect for the years in which those tax assets and liabilities are expected to be realized or settled. The Company records a valuation allowance to reduce deferred tax assets to the amount that is believed more likely than not to be realized.
The Company recognizes tax benefits from uncertain tax positions only if it is more likely than not that the tax position will be sustained on examination by the taxing authorities, based on the technical merits of the position. The tax benefits recognized in the financial statements from such positions are then measured based on the largest benefit that has a greater than 50% likelihood of being realized upon ultimate settlement.
Management believes it is more likely than not that forecasted income, including income that may be generated as a result of certain tax planning strategies, together with future reversals of existing taxable temporary differences, will be sufficient to fully recover the Company’s deferred tax assets. In the event that the Company determines all or part of its net deferred tax assets are not realizable in the future, the Company will record an adjustment to the valuation allowance that would be charged to earnings in the period such determination is made. In addition, the calculation of tax liabilities involves significant judgment in estimating the impact of uncertainties in the application of GAAP and complex tax laws. Resolution of these uncertainties in a manner inconsistent with management’s expectations could have a material impact on the Company’s financial condition and operating results.
Legal and Other Contingencies
As discussed in Part I, Item 3 of this Form 10-K under the heading “Legal Proceedings” and in Part II, Item 8 of this Form 10-K in the Notes to Consolidated Financial Statements in Note 10, “Commitments and Contingencies,” the Company is subject to various legal proceedings and claims that arise in the ordinary course of business. The Company records a liability when it is probable that a loss has been incurred and the amount is reasonably estimable, the determination of which requires significant judgment. In the opinion of management, there was not at least a reasonable possibility the Company may have incurred a material loss, or a material loss in excess of a recorded accrual, with respect to loss contingencies for asserted legal and other claims. However, the outcome of legal proceedings and claims brought against the Company is subject to significant uncertainty. Therefore, although management considers the likelihood of such an outcome to be remote, if one or more of these legal matters were resolved against the Company in a reporting period for amounts in excess of management’s expectations, the Company’s consolidated financial statements for that reporting period could be materially adversely affected.
Apple Inc. | 2017 Form 10-K |
35
|
Item 7A.
|
Quantitative and Qualitative Disclosures About Market Risk
|
Interest Rate and Foreign Currency Risk Management
The Company regularly reviews its foreign exchange forward and option positions and interest rate swaps, both on a stand-alone basis and in conjunction with its underlying foreign currency and interest rate exposures. Given the effective horizons of the Company’s risk management activities and the anticipatory nature of the exposures, there can be no assurance these positions will offset more than a portion of the financial impact resulting from movements in either foreign exchange or interest rates. Further, the recognition of the gains and losses related to these instruments may not coincide with the timing of gains and losses related to the underlying economic exposures and, therefore, may adversely affect the Company’s financial condition and operating results.
Interest Rate Risk
The Company’s exposure to changes in interest rates relates primarily to the Company’s investment portfolio and outstanding debt. While the Company is exposed to global interest rate fluctuations, the Company’s interest income and expense are most sensitive to fluctuations in U.S. interest rates. Changes in U.S. interest rates affect the interest earned on the Company’s cash, cash equivalents and marketable securities and the fair value of those securities, as well as costs associated with hedging and interest paid on the Company’s debt.
The Company’s investment policy and strategy are focused on preservation of capital and supporting the Company’s liquidity requirements. The Company uses a combination of internal and external management to execute its investment strategy and achieve its investment objectives. The Company typically invests in highly-rated securities, and its investment policy generally limits the amount of credit exposure to any one issuer. The policy generally requires investments to be investment grade, with the primary objective of minimizing the potential risk of principal loss. To provide a meaningful assessment of the interest rate risk associated with the Company’s investment portfolio, the Company performed a sensitivity analysis to determine the impact a change in interest rates would have on the value of the investment portfolio assuming a 100 basis point parallel shift in the yield curve. Based on investment positions as of
September 30, 2017
and
September 24, 2016
, a hypothetical 100 basis point increase in interest rates across all maturities would result in a $6.0 billion and $4.9 billion incremental decline in the fair market value of the portfolio, respectively. Such losses would only be realized if the Company sold the investments prior to maturity.
As of
September 30, 2017
and
September 24, 2016
, the Company had outstanding floating- and fixed-rate notes with varying maturities for an aggregate carrying amount of
$103.7 billion
and
$78.9 billion
, respectively. The Company has entered, and in the future may enter, into interest rate swaps to manage interest rate risk on its outstanding term debt. Interest rate swaps allow the Company to effectively convert fixed-rate payments into floating-rate payments or floating-rate payments into fixed-rate payments. Gains and losses on term debt are generally offset by the corresponding losses and gains on the related hedging instrument. A 100 basis point increase in market interest rates would cause interest expense on the Company’s debt as of
September 30, 2017
and
September 24, 2016
to increase by $376 million and $271 million on an annualized basis, respectively.
Further details regarding the Company’s debt is provided in Part II, Item 8 of this Form 10-K in the Notes to Consolidated Financial Statements in Note 6, “Debt.”
Foreign Currency Risk
In general, the Company is a net receiver of currencies other than the U.S. dollar. Accordingly, changes in exchange rates, and in particular a strengthening of the U.S. dollar, will negatively affect the Company’s net sales and gross margins as expressed in U.S. dollars. There is a risk that the Company will have to adjust local currency product pricing due to competitive pressures when there has been significant volatility in foreign currency exchange rates.
The Company may enter into foreign currency forward and option contracts with financial institutions to protect against foreign exchange risks associated with certain existing assets and liabilities, certain firmly committed transactions, forecasted future cash flows and net investments in foreign subsidiaries. In addition, the Company has entered, and in the future may enter, into foreign currency contracts to partially offset the foreign currency exchange gains and losses on its foreign-denominated debt issuances. The Company typically hedges portions of its forecasted foreign currency exposure associated with revenue and inventory purchases, typically for up to 12 months. However, the Company may choose not to hedge certain foreign exchange exposures for a variety of reasons, including but not limited to accounting considerations and the prohibitive economic cost of hedging particular exposures.
Apple Inc. | 2017 Form 10-K |
36
To provide a meaningful assessment of the foreign currency risk associated with certain of the Company’s foreign currency derivative positions, the Company performed a sensitivity analysis using a value-at-risk (“VAR”) model to assess the potential impact of fluctuations in exchange rates. The VAR model consisted of using a Monte Carlo simulation to generate thousands of random market price paths assuming normal market conditions. The VAR is the maximum expected loss in fair value, for a given confidence interval, to the Company’s foreign currency derivative positions due to adverse movements in rates. The VAR model is not intended to represent actual losses but is used as a risk estimation and management tool. Forecasted transactions, firm commitments and assets and liabilities denominated in foreign currencies were excluded from the model. Based on the results of the model, the Company estimates with 95% confidence, a maximum one-day loss in fair value of $485 million as of
September 30, 2017
compared to a maximum one-day loss in fair value of $434 million as of
September 24, 2016
. Because the Company uses foreign currency instruments for hedging purposes, the loss in fair value incurred on those instruments are generally offset by increases in the fair value of the underlying exposures.
Actual future gains and losses associated with the Company’s investment portfolio and derivative positions may differ materially from the sensitivity analyses performed as of
September 30, 2017
due to the inherent limitations associated with predicting the timing and amount of changes in interest rates, foreign currency exchange rates and the Company’s actual exposures and positions.
Apple Inc. | 2017 Form 10-K |
37
|
Item 8.
|
Financial Statements and Supplementary Data
|
|
Index to Consolidated Financial Statements
|
Page
|
|
All financial statement schedules have been omitted, since the required information is not applicable or is not present in amounts sufficient to require submission of the schedule, or because the information required is included in the consolidated financial statements and notes thereto.
Apple Inc. | 2017 Form 10-K |
38
Apple Inc.
(In millions, except number of shares which are reflected in thousands and per share amounts)
|
Years ended
|
|||||||||||
|
September 30,
2017 |
September 24,
2016 |
September 26,
2015 |
|||||||||
|
Net sales
|
$
|
229,234
|
|
$
|
215,639
|
|
$
|
233,715
|
|
||
|
Cost of sales
|
141,048
|
|
131,376
|
|
140,089
|
|
|||||
|
Gross margin
|
88,186
|
|
|
84,263
|
|
|
93,626
|
|
|||
|
Operating expenses:
|
|||||||||||
|
Research and development
|
11,581
|
|
10,045
|
|
8,067
|
|
|||||
|
Selling, general and administrative
|
15,261
|
|
14,194
|
|
14,329
|
|
|||||
|
Total operating expenses
|
26,842
|
|
|
24,239
|
|
|
22,396
|
|
|||
|
Operating income
|
61,344
|
|
60,024
|
|
71,230
|
|
|||||
|
Other income/(expense), net
|
2,745
|
|
1,348
|
|
1,285
|
|
|||||
|
Income before provision for income taxes
|
64,089
|
|
|
61,372
|
|
|
72,515
|
|
|||
|
Provision for income taxes
|
15,738
|
|
15,685
|
|
19,121
|
|
|||||
|
Net income
|
$
|
48,351
|
|
|
$
|
45,687
|
|
|
$
|
53,394
|
|
|
Earnings per share:
|
|||||||||||
|
Basic
|
$
|
9.27
|
|
$
|
8.35
|
|
$
|
9.28
|
|
||
|
Diluted
|
$
|
9.21
|
|
$
|
8.31
|
|
$
|
9.22
|
|
||
|
Shares used in computing earnings per share:
|
|||||||||||
|
Basic
|
5,217,242
|
|
5,470,820
|
|
5,753,421
|
|
|||||
|
Diluted
|
5,251,692
|
|
5,500,281
|
|
5,793,069
|
|
|||||
|
Cash dividends declared per share
|
$
|
2.40
|
|
$
|
2.18
|
|
$
|
1.98
|
|
||
See accompanying Notes to Consolidated Financial Statements.
Apple Inc. | 2017 Form 10-K |
39
Apple Inc.
CONSOLIDATED STATEMENTS OF COMPREHENSIVE INCOME
(In millions)
|
Years ended
|
|||||||||||
|
September 30,
2017 |
September 24,
2016 |
September 26,
2015 |
|||||||||
|
Net income
|
$
|
48,351
|
|
$
|
45,687
|
|
$
|
53,394
|
|
||
|
Other comprehensive income/(loss):
|
|||||||||||
|
Change in foreign currency translation, net of tax effects of $(77), $8 and $201, respectively
|
224
|
|
75
|
|
(411
|
)
|
|||||
|
Change in unrealized gains/losses on derivative instruments:
|
|||||||||||
|
Change in fair value of derivatives, net of tax benefit/(expense) of $(478), $(7) and $(441), respectively
|
1,315
|
|
7
|
|
2,905
|
|
|||||
|
Adjustment for net (gains)/losses realized and included in net income, net of tax expense/(benefit) of $475, $131 and $630, respectively
|
(1,477
|
)
|
(741
|
)
|
(3,497
|
)
|
|||||
|
Total change in unrealized gains/losses on derivative instruments, net of tax
|
(162
|
)
|
|
(734
|
)
|
|
(592
|
)
|
|||
|
Change in unrealized gains/losses on marketable securities:
|
|||||||||||
|
Change in fair value of marketable securities, net of tax benefit/(expense) of $425, $(863) and $264, respectively
|
(782
|
)
|
1,582
|
|
(483
|
)
|
|||||
|
Adjustment for net (gains)/losses realized and included in net income, net of tax expense/(benefit) of $35, $(31) and $(32), respectively
|
(64
|
)
|
56
|
|
59
|
|
|||||
|
Total change in unrealized gains/losses on marketable securities, net of tax
|
(846
|
)
|
|
1,638
|
|
|
(424
|
)
|
|||
|
Total other comprehensive income/(loss)
|
(784
|
)
|
|
979
|
|
|
(1,427
|
)
|
|||
|
Total comprehensive income
|
$
|
47,567
|
|
|
$
|
46,666
|
|
|
$
|
51,967
|
|
See accompanying Notes to Consolidated Financial Statements.
Apple Inc. | 2017 Form 10-K |
40
Apple Inc.
(In millions, except number of shares which are reflected in thousands and par value)
|
September 30,
2017 |
September 24,
2016 |
||||||
|
ASSETS:
|
|||||||
|
Current assets:
|
|||||||
|
Cash and cash equivalents
|
$
|
20,289
|
|
$
|
20,484
|
|
|
|
Short-term marketable securities
|
53,892
|
|
46,671
|
|
|||
|
Accounts receivable, less allowances of
$58
and $53, respectively
|
17,874
|
|
15,754
|
|
|||
|
Inventories
|
4,855
|
|
2,132
|
|
|||
|
Vendor non-trade receivables
|
17,799
|
|
13,545
|
|
|||
|
Other current assets
|
13,936
|
|
8,283
|
|
|||
|
Total current assets
|
128,645
|
|
106,869
|
|
|||
|
Long-term marketable securities
|
194,714
|
|
170,430
|
|
|||
|
Property, plant and equipment, net
|
33,783
|
|
27,010
|
|
|||
|
Goodwill
|
5,717
|
|
5,414
|
|
|||
|
Acquired intangible assets, net
|
2,298
|
|
3,206
|
|
|||
|
Other non-current assets
|
10,162
|
|
8,757
|
|
|||
|
Total assets
|
$
|
375,319
|
|
$
|
321,686
|
|
|
|
LIABILITIES AND SHAREHOLDERS’ EQUITY:
|
|||||||
|
Current liabilities:
|
|||||||
|
Accounts payable
|
$
|
49,049
|
|
$
|
37,294
|
|
|
|
Accrued expenses
|
25,744
|
|
22,027
|
|
|||
|
Deferred revenue
|
7,548
|
|
8,080
|
|
|||
|
Commercial paper
|
11,977
|
|
8,105
|
|
|||
|
Current portion of long-term debt
|
6,496
|
|
3,500
|
|
|||
|
Total current liabilities
|
100,814
|
|
79,006
|
|
|||
|
Deferred revenue, non-current
|
2,836
|
|
2,930
|
|
|||
|
Long-term debt
|
97,207
|
|
75,427
|
|
|||
|
Other non-current liabilities
|
40,415
|
|
36,074
|
|
|||
|
Total liabilities
|
241,272
|
|
193,437
|
|
|||
|
Commitments and contingencies
|
|
|
|||||
|
Shareholders’ equity:
|
|||||||
|
Common stock and additional paid-in capital, $0.00001 par value: 12,600,000 shares authorized; 5,126,201 and 5,336,166 shares issued and outstanding, respectively
|
35,867
|
|
31,251
|
|
|||
|
Retained earnings
|
98,330
|
|
96,364
|
|
|||
|
Accumulated other comprehensive income/(loss)
|
(150
|
)
|
634
|
|
|||
|
Total shareholders’ equity
|
134,047
|
|
128,249
|
|
|||
|
Total liabilities and shareholders’ equity
|
$
|
375,319
|
|
|
$
|
321,686
|
|
See accompanying Notes to Consolidated Financial Statements.
Apple Inc. | 2017 Form 10-K |
41
Apple Inc.
CONSOLIDATED STATEMENTS OF SHAREHOLDERS’ EQUITY
(In millions, except number of shares which are reflected in thousands)
|
Common Stock and
Additional Paid-In Capital
|
Retained Earnings
|
Accumulated Other
Comprehensive Income/(Loss)
|
Total Shareholders’ Equity
|
|||||||||||||||
|
Shares
|
Amount
|
|||||||||||||||||
|
Balances as of September 27, 2014
|
5,866,161
|
|
$
|
23,313
|
|
$
|
87,152
|
|
$
|
1,082
|
|
$
|
111,547
|
|
||||
|
Net income
|
—
|
|
—
|
|
53,394
|
|
—
|
|
53,394
|
|
||||||||
|
Other comprehensive income/(loss)
|
—
|
|
—
|
|
—
|
|
(1,427
|
)
|
(1,427
|
)
|
||||||||
|
Dividends and dividend equivalents declared
|
—
|
|
—
|
|
(11,627
|
)
|
—
|
|
(11,627
|
)
|
||||||||
|
Repurchase of common stock
|
(325,032
|
)
|
—
|
|
(36,026
|
)
|
—
|
|
(36,026
|
)
|
||||||||
|
Share-based compensation
|
—
|
|
3,586
|
|
—
|
|
—
|
|
3,586
|
|
||||||||
|
Common stock issued, net of shares withheld for employee taxes
|
37,624
|
|
(231
|
)
|
(609
|
)
|
—
|
|
(840
|
)
|
||||||||
|
Tax benefit from equity awards, including transfer pricing adjustments
|
—
|
|
748
|
|
—
|
|
—
|
|
748
|
|
||||||||
|
Balances as of September 26, 2015
|
5,578,753
|
|
27,416
|
|
92,284
|
|
(345
|
)
|
119,355
|
|
||||||||
|
Net income
|
—
|
|
—
|
|
45,687
|
|
—
|
|
45,687
|
|
||||||||
|
Other comprehensive income/(loss)
|
—
|
|
—
|
|
—
|
|
979
|
|
979
|
|
||||||||
|
Dividends and dividend equivalents declared
|
—
|
|
—
|
|
(12,188
|
)
|
—
|
|
(12,188
|
)
|
||||||||
|
Repurchase of common stock
|
(279,609
|
)
|
—
|
|
(29,000
|
)
|
—
|
|
(29,000
|
)
|
||||||||
|
Share-based compensation
|
—
|
|
4,262
|
|
—
|
|
—
|
|
4,262
|
|
||||||||
|
Common stock issued, net of shares withheld for employee taxes
|
37,022
|
|
(806
|
)
|
(419
|
)
|
—
|
|
(1,225
|
)
|
||||||||
|
Tax benefit from equity awards, including transfer pricing adjustments
|
—
|
|
379
|
|
—
|
|
—
|
|
379
|
|
||||||||
|
Balances as of September 24, 2016
|
5,336,166
|
|
31,251
|
|
96,364
|
|
634
|
|
128,249
|
|
||||||||
|
Net income
|
—
|
|
—
|
|
48,351
|
|
—
|
|
48,351
|
|
||||||||
|
Other comprehensive income/(loss)
|
—
|
|
—
|
|
—
|
|
(784
|
)
|
(784
|
)
|
||||||||
|
Dividends and dividend equivalents declared
|
—
|
|
—
|
|
(12,803
|
)
|
—
|
|
(12,803
|
)
|
||||||||
|
Repurchase of common stock
|
(246,496
|
)
|
—
|
|
(33,001
|
)
|
—
|
|
(33,001
|
)
|
||||||||
|
Share-based compensation
|
—
|
|
4,909
|
|
—
|
|
—
|
|
4,909
|
|
||||||||
|
Common stock issued, net of shares withheld for employee taxes
|
36,531
|
|
(913
|
)
|
(581
|
)
|
—
|
|
(1,494
|
)
|
||||||||
|
Tax benefit from equity awards, including transfer pricing adjustments
|
—
|
|
620
|
|
—
|
|
—
|
|
620
|
|
||||||||
|
Balances as of September 30, 2017
|
5,126,201
|
|
$
|
35,867
|
|
$
|
98,330
|
|
$
|
(150
|
)
|
$
|
134,047
|
|
||||
See accompanying Notes to Consolidated Financial Statements.
Apple Inc. | 2017 Form 10-K |
42
Apple Inc.
(In millions)
|
Years ended
|
|||||||||||
|
September 30,
2017 |
September 24,
2016 |
September 26,
2015 |
|||||||||
|
Cash and cash equivalents, beginning of the year
|
$
|
20,484
|
|
$
|
21,120
|
|
$
|
13,844
|
|
||
|
Operating activities:
|
|||||||||||
|
Net income
|
48,351
|
|
45,687
|
|
53,394
|
|
|||||
|
Adjustments to reconcile net income to cash generated by operating activities:
|
|||||||||||
|
Depreciation and amortization
|
10,157
|
|
10,505
|
|
11,257
|
|
|||||
|
Share-based compensation expense
|
4,840
|
|
4,210
|
|
3,586
|
|
|||||
|
Deferred income tax expense
|
5,966
|
|
4,938
|
|
1,382
|
|
|||||
|
Other
|
(166
|
)
|
486
|
|
385
|
|
|||||
|
Changes in operating assets and liabilities:
|
|||||||||||
|
Accounts receivable, net
|
(2,093
|
)
|
527
|
|
417
|
|
|||||
|
Inventories
|
(2,723
|
)
|
217
|
|
(238
|
)
|
|||||
|
Vendor non-trade receivables
|
(4,254
|
)
|
(51
|
)
|
(3,735
|
)
|
|||||
|
Other current and non-current assets
|
(5,318
|
)
|
1,055
|
|
(283
|
)
|
|||||
|
Accounts payable
|
9,618
|
|
1,837
|
|
5,001
|
|
|||||
|
Deferred revenue
|
(626
|
)
|
(1,554
|
)
|
1,042
|
|
|||||
|
Other current and non-current liabilities
|
(154
|
)
|
(2,033
|
)
|
9,058
|
|
|||||
|
Cash generated by operating activities
|
63,598
|
|
|
65,824
|
|
|
81,266
|
|
|||
|
Investing activities:
|
|||||||||||
|
Purchases of marketable securities
|
(159,486
|
)
|
(142,428
|
)
|
(166,402
|
)
|
|||||
|
Proceeds from maturities of marketable securities
|
31,775
|
|
21,258
|
|
14,538
|
|
|||||
|
Proceeds from sales of marketable securities
|
94,564
|
|
90,536
|
|
107,447
|
|
|||||
|
Payments made in connection with business acquisitions, net
|
(329
|
)
|
(297
|
)
|
(343
|
)
|
|||||
|
Payments for acquisition of property, plant and equipment
|
(12,451
|
)
|
(12,734
|
)
|
(11,247
|
)
|
|||||
|
Payments for acquisition of intangible assets
|
(344
|
)
|
(814
|
)
|
(241
|
)
|
|||||
|
Payments for strategic investments, net
|
(395
|
)
|
(1,388
|
)
|
—
|
|
|||||
|
Other
|
220
|
|
(110
|
)
|
(26
|
)
|
|||||
|
Cash used in investing activities
|
(46,446
|
)
|
|
(45,977
|
)
|
|
(56,274
|
)
|
|||
|
Financing activities:
|
|||||||||||
|
Proceeds from issuance of common stock
|
555
|
|
495
|
|
543
|
|
|||||
|
Excess tax benefits from equity awards
|
627
|
|
407
|
|
749
|
|
|||||
|
Payments for taxes related to net share settlement of equity awards
|
(1,874
|
)
|
(1,570
|
)
|
(1,499
|
)
|
|||||
|
Payments for dividends and dividend equivalents
|
(12,769
|
)
|
(12,150
|
)
|
(11,561
|
)
|
|||||
|
Repurchases of common stock
|
(32,900
|
)
|
(29,722
|
)
|
(35,253
|
)
|
|||||
|
Proceeds from issuance of term debt, net
|
28,662
|
|
24,954
|
|
27,114
|
|
|||||
|
Repayments of term debt
|
(3,500
|
)
|
(2,500
|
)
|
—
|
|
|||||
|
Change in commercial paper, net
|
3,852
|
|
(397
|
)
|
2,191
|
|
|||||
|
Cash used in financing activities
|
(17,347
|
)
|
|
(20,483
|
)
|
|
(17,716
|
)
|
|||
|
Increase/(Decrease) in cash and cash equivalents
|
(195
|
)
|
(636
|
)
|
7,276
|
|
|||||
|
Cash and cash equivalents, end of the year
|
$
|
20,289
|
|
|
$
|
20,484
|
|
|
$
|
21,120
|
|
|
Supplemental cash flow disclosure:
|
|||||||||||
|
Cash paid for income taxes, net
|
$
|
11,591
|
|
$
|
10,444
|
|
$
|
13,252
|
|
||
|
Cash paid for interest
|
$
|
2,092
|
|
$
|
1,316
|
|
$
|
514
|
|
||
See accompanying Notes to Consolidated Financial Statements.
Apple Inc. | 2017 Form 10-K |
43
Apple Inc.
Notes to Consolidated Financial Statements
Apple Inc. and its wholly-owned subsidiaries (collectively “Apple” or the “Company”) designs, manufactures and markets mobile communication and media devices and personal computers, and sells a variety of related software, services, accessories, networking solutions and third-party digital content and applications. The Company’s products and services include iPhone, iPad, Mac, Apple Watch, Apple TV, a portfolio of consumer and professional software applications, iOS, macOS, watchOS and tvOS operating systems, iCloud, Apple Pay and a variety of accessory, service and support offerings. The Company sells and delivers digital content and applications through the iTunes Store, App Store, Mac App Store, TV App Store, iBooks Store and Apple Music (collectively “Digital Content and Services”). The Company sells its products worldwide through its retail stores, online stores and direct sales force, as well as through third-party cellular network carriers, wholesalers, retailers and value-added resellers. In addition, the Company sells a variety of third-party Apple-compatible products, including application software and various accessories through its retail and online stores. The Company sells to consumers, small and mid-sized businesses and education, enterprise and government customers.
Basis of Presentation and Preparation
The accompanying consolidated financial statements include the accounts of the Company. Intercompany accounts and transactions have been eliminated. In the opinion of the Company’s management, the consolidated financial statements reflect all adjustments, which are normal and recurring in nature, necessary for fair financial statement presentation. The preparation of these consolidated financial statements in conformity with U.S. generally accepted accounting principles (“GAAP”) requires management to make estimates and assumptions that affect the amounts reported in these consolidated financial statements and accompanying notes. Actual results could differ materially from those estimates. Certain prior period amounts in the consolidated financial statements have been reclassified to conform to the current period’s presentation.
The Company’s fiscal year is the 52 or 53-week period that ends on the last Saturday of September. The Company’s fiscal year 2017 included 53 weeks and ended on
September 30, 2017
. A 14th week was included in the first fiscal quarter of 2017, as is done every five or six years, to realign the Company’s fiscal quarters with calendar quarters. The Company’s fiscal years 2016 and 2015 ended on
September 24, 2016
and
September 26, 2015
, respectively, and spanned 52 weeks each. Unless otherwise stated, references to particular years, quarters, months and periods refer to the Company’s fiscal years ended in September and the associated quarters, months and periods of those fiscal years.
Revenue Recognition
Net sales consist primarily of revenue from the sale of hardware, software, digital content and applications, accessories, and service and support contracts. The Company recognizes revenue when persuasive evidence of an arrangement exists, delivery has occurred, the sales price is fixed or determinable and collection is probable. Product is considered delivered to the customer once it has been shipped and title, risk of loss and rewards of ownership have been transferred. For most of the Company’s product sales, these criteria are met at the time the product is shipped. For online sales to individuals, for some sales to education customers in the U.S., and for certain other sales, the Company defers revenue until the customer receives the product because the Company retains a portion of the risk of loss on these sales during transit. For payment terms in excess of the Company’s standard payment terms, revenue is recognized as payments become due unless the Company has positive evidence that the sales price is fixed or determinable, such as a successful history of collection, without concession, on comparable arrangements. The Company recognizes revenue from the sale of hardware products, software bundled with hardware that is essential to the functionality of the hardware and third-party digital content sold on the iTunes Store in accordance with general revenue recognition accounting guidance. The Company recognizes revenue in accordance with industry-specific software accounting guidance for the following types of sales transactions: (i) standalone sales of software products, (ii) sales of software upgrades and (iii) sales of software bundled with hardware not essential to the functionality of the hardware.
For the sale of most third-party products, the Company recognizes revenue based on the gross amount billed to customers because the Company establishes its own pricing for such products, retains related inventory risk for physical products, is the primary obligor to the customer and assumes the credit risk for amounts billed to its customers. For third-party applications sold through the App Store and Mac App Store and certain digital content sold through the iTunes Store, the Company does not determine the selling price of the products and is not the primary obligor to the customer. Therefore, the Company accounts for such sales on a net basis by recognizing in net sales only the commission it retains from each sale. The portion of the gross amount billed to customers that is remitted by the Company to third-party app developers and certain digital content owners is not reflected in the Company’s Consolidated Statements of Operations.
Apple Inc. | 2017 Form 10-K |
44
The Company records deferred revenue when it receives payments in advance of the delivery of products or the performance of services. This includes amounts that have been deferred for unspecified and specified software upgrade rights and non-software services that are attached to hardware and software products. The Company sells gift cards redeemable at its retail and online stores, and also sells gift cards redeemable on iTunes Store, App Store, Mac App Store, TV App Store and iBooks Store for the purchase of digital content and software. The Company records deferred revenue upon the sale of the card, which is relieved upon redemption of the card by the customer. Revenue from AppleCare service and support contracts is deferred and recognized over the service coverage periods. AppleCare service and support contracts typically include extended phone support, repair services, web-based support resources and diagnostic tools offered under the Company’s standard limited warranty.
The Company records reductions to revenue for estimated commitments related to price protection and other customer incentive programs. For transactions involving price protection, the Company recognizes revenue net of the estimated amount to be refunded. For the Company’s other customer incentive programs, the estimated cost of these programs is recognized at the later of the date at which the Company has sold the product or the date at which the program is offered. The Company also records reductions to revenue for expected future product returns based on the Company’s historical experience. Revenue is recorded net of taxes collected from customers that are remitted to governmental authorities, with the collected taxes recorded as current liabilities until remitted to the relevant government authority.
Revenue Recognition for Arrangements with Multiple Deliverables
For multi-element arrangements that include hardware products containing software essential to the hardware product’s functionality, undelivered software elements that relate to the hardware product’s essential software, and undelivered non-software services, the Company allocates revenue to all deliverables based on their relative selling prices. In such circumstances, the Company uses a hierarchy to determine the selling price to be used for allocating revenue to deliverables: (i) vendor-specific objective evidence of fair value (“VSOE”), (ii) third-party evidence of selling price (“TPE”) and (iii) best estimate of selling price (“ESP”). VSOE generally exists only when the Company sells the deliverable separately and is the price actually charged by the Company for that deliverable. ESPs reflect the Company’s best estimates of what the selling prices of elements would be if they were sold regularly on a stand-alone basis. For multi-element arrangements accounted for in accordance with industry-specific software accounting guidance, the Company allocates revenue to all deliverables based on the VSOE of each element, and if VSOE does not exist revenue is recognized when elements lacking VSOE are delivered.
For sales of qualifying versions of iPhone, iPad, iPod touch, Mac, Apple Watch and Apple TV, the Company has indicated it may from time to time provide future unspecified software upgrades to the device’s essential software and/or non-software services free of charge. The Company has identified up to
three
deliverables regularly included in arrangements involving the sale of these devices. The first deliverable, which represents the substantial portion of the allocated sales price, is the hardware and software essential to the functionality of the hardware device delivered at the time of sale. The second deliverable is the embedded right included with qualifying devices to receive, on a when-and-if-available basis, future unspecified software upgrades relating to the product’s essential software. The third deliverable is the non-software services to be provided to qualifying devices. The Company allocates revenue between these deliverables using the relative selling price method. Because the Company has neither VSOE nor TPE for these deliverables, the allocation of revenue is based on the Company’s ESPs. Revenue allocated to the delivered hardware and the related essential software is recognized at the time of sale, provided the other conditions for revenue recognition have been met. Revenue allocated to the embedded unspecified software upgrade rights and the non-software services is deferred and recognized on a straight-line basis over the estimated period the software upgrades and non-software services are expected to be provided. Cost of sales related to delivered hardware and related essential software, including estimated warranty costs, are recognized at the time of sale. Costs incurred to provide non-software services are recognized as cost of sales as incurred, and engineering and sales and marketing costs are recognized as operating expenses as incurred.
The Company’s process for determining its ESP for deliverables without VSOE or TPE considers multiple factors that may vary depending upon the unique facts and circumstances related to each deliverable including, where applicable, prices charged by the Company and market trends in the pricing for similar offerings, product-specific business objectives, estimated cost to provide the non-software services and the relative ESP of the upgrade rights and non-software services as compared to the total selling price of the product.
Shipping Costs
Amounts billed to customers related to shipping and handling are classified as revenue, and the Company’s shipping and handling costs are classified as cost of sales.
Warranty Costs
The Company generally provides for the estimated cost of hardware and software warranties in the period the related revenue is recognized. The Company assesses the adequacy of its accrued warranty liabilities and adjusts the amounts as necessary based on actual experience and changes in future estimates.
Apple Inc. | 2017 Form 10-K |
45
Software Development Costs
Research and development (“R&D”) costs are expensed as incurred. Development costs of computer software to be sold, leased, or otherwise marketed are subject to capitalization beginning when a product’s technological feasibility has been established and ending when a product is available for general release to customers. In most instances, the Company’s products are released soon after technological feasibility has been established and as a result software development costs were expensed as incurred.
Advertising Costs
Advertising costs are expensed as incurred and included in selling, general and administrative expenses.
Share-based Compensation
The Company recognizes expense related to share-based payment transactions in which it receives employee services in exchange for (a) equity instruments of the Company or (b) liabilities that are based on the fair value of the Company’s equity instruments or that may be settled by the issuance of such equity instruments. Share-based compensation expense for restricted stock units (“RSUs”) and restricted stock is measured based on the closing fair market value of the Company’s common stock on the date of grant. The Company estimates forfeitures expected to occur and recognizes share-based compensation expense for those equity awards expected to vest. The Company recognizes share-based compensation expense over the award’s requisite service period on a straight-line basis for time-based RSUs and on a graded basis for RSUs that are contingent on the achievement of performance conditions. The Company recognizes a benefit from share-based compensation in the Consolidated Statements of Shareholders’ Equity if an excess tax benefit is realized. In addition, the Company recognizes the indirect effects of share-based compensation on R&D tax credits, foreign tax credits and domestic manufacturing deductions in the Consolidated Statements of Operations. Further information regarding share-based compensation can be found in Note 9, “Benefit Plans.”
Income Taxes
The provision for income taxes is computed using the asset and liability method, under which deferred tax assets and liabilities are recognized for the expected future tax consequences of temporary differences between the financial reporting and tax bases of assets and liabilities and for operating losses and tax credit carryforwards. Deferred tax assets and liabilities are measured using the currently enacted tax rates that apply to taxable income in effect for the years in which those tax assets and liabilities are expected to be realized or settled. The Company records a valuation allowance to reduce deferred tax assets to the amount that is believed more likely than not to be realized.
The Company recognizes the tax benefit from an uncertain tax position only if it is more likely than not the tax position will be sustained on examination by the taxing authorities, based on the technical merits of the position. The tax benefits recognized in the financial statements from such positions are then measured based on the largest benefit that has a greater than
50%
likelihood of being realized upon settlement. See Note 5, “Income Taxes” for additional information.
Earnings Per Share
Basic earnings per share is computed by dividing income available to common shareholders by the weighted-average number of shares of common stock outstanding during the period. Diluted earnings per share is computed by dividing income available to common shareholders by the weighted-average number of shares of common stock outstanding during the period increased to include the number of additional shares of common stock that would have been outstanding if the potentially dilutive securities had been issued. Potentially dilutive securities include unvested RSUs, unvested restricted stock, outstanding stock options and shares to be purchased by employees under the Company’s employee stock purchase plan. The dilutive effect of potentially dilutive securities is reflected in diluted earnings per share by application of the treasury stock method. Under the treasury stock method, an increase in the fair market value of the Company’s common stock can result in a greater dilutive effect from potentially dilutive securities.
Apple Inc. | 2017 Form 10-K |
46
The following table shows the computation of basic and diluted earnings per share for
2017
,
2016
and
2015
(net income in millions and shares in thousands):
|
2017
|
2016
|
2015
|
|||||||||
|
Numerator:
|
|||||||||||
|
Net income
|
$
|
48,351
|
|
$
|
45,687
|
|
$
|
53,394
|
|
||
|
Denominator:
|
|||||||||||
|
Weighted-average shares outstanding
|
5,217,242
|
|
5,470,820
|
|
5,753,421
|
|
|||||
|
Effect of dilutive securities
|
34,450
|
|
29,461
|
|
39,648
|
|
|||||
|
Weighted-average diluted shares
|
5,251,692
|
|
5,500,281
|
|
|
5,793,069
|
|
||||
|
Basic earnings per share
|
$
|
9.27
|
|
$
|
8.35
|
|
$
|
9.28
|
|
||
|
Diluted earnings per share
|
$
|
9.21
|
|
$
|
8.31
|
|
$
|
9.22
|
|
||
Potentially dilutive securities whose effect would have been antidilutive are excluded from the computation of diluted earnings per share.
Financial Instruments
Cash Equivalents and Marketable Securities
All highly liquid investments with maturities of three months or less at the date of purchase are classified as cash equivalents. The Company’s marketable debt and equity securities have been classified and accounted for as available-for-sale. Management determines the appropriate classification of its investments at the time of purchase and reevaluates the classifications at each balance sheet date. The Company classifies its marketable debt securities as either short-term or long-term based on each instrument’s underlying contractual maturity date. Marketable debt securities with maturities of 12 months or less are classified as short-term and marketable debt securities with maturities greater than 12 months are classified as long-term. Marketable equity securities, including mutual funds, are classified as either short-term or long-term based on the nature of each security and its availability for use in current operations. The Company’s marketable debt and equity securities are carried at fair value, with unrealized gains and losses, net of taxes, reported as a component of accumulated other comprehensive income/(loss) (“AOCI”) in shareholders’ equity, with the exception of unrealized losses believed to be other-than-temporary which are reported in earnings in the current period. The cost of securities sold is based upon the specific identification method.
Derivative Financial Instruments
The Company accounts for its derivative instruments as either assets or liabilities and carries them at fair value.
For derivative instruments that hedge the exposure to variability in expected future cash flows that are designated as cash flow hedges, the effective portion of the gain or loss on the derivative instrument is reported as a component of AOCI in shareholders’ equity and reclassified into earnings in the same period or periods during which the hedged transaction affects earnings. The ineffective portion of the gain or loss on the derivative instrument, if any, is recognized in earnings in the current period. To receive hedge accounting treatment, cash flow hedges must be highly effective in offsetting changes to expected future cash flows on hedged transactions. For options designated as cash flow hedges, changes in the time value are excluded from the assessment of hedge effectiveness and are recognized in earnings.
For derivative instruments that hedge the exposure to changes in the fair value of an asset or a liability and that are designated as fair value hedges, both the net gain or loss on the derivative instrument as well as the offsetting gain or loss on the hedged item are recognized in earnings in the current period.
For derivative instruments and foreign currency debt that hedge the exposure to changes in foreign currency exchange rates used for translation of the net investment in a foreign operation and that are designated as a net investment hedge, the net gain or loss on the effective portion of the derivative instrument is reported in the same manner as a foreign currency translation adjustment. For forward exchange contracts designated as net investment hedges, the Company excludes changes in fair value relating to changes in the forward carry component from its definition of effectiveness. Accordingly, any gains or losses related to this forward carry component are recognized in earnings in the current period.
Derivatives that do not qualify as hedges are adjusted to fair value through earnings in the current period.
Apple Inc. | 2017 Form 10-K |
47
Allowance for Doubtful Accounts
The Company records its allowance for doubtful accounts based upon its assessment of various factors, including historical experience, age of the accounts receivable balances, credit quality of the Company’s customers, current economic conditions and other factors that may affect the customers’ abilities to pay.
Inventories
Inventories are stated at the lower of cost, computed using the first-in, first-out method, and net realizable value. Any adjustments to reduce the cost of inventories to their net realizable value are recognized in earnings in the current period.
Property, Plant and Equipment
Property, plant and equipment are stated at cost. Depreciation is computed by use of the straight-line method over the estimated useful lives of the assets, which for buildings is the lesser of
30 years
or the remaining life of the underlying building; between
one
and
five years
for machinery and equipment, including product tooling and manufacturing process equipment; and the shorter of lease term or useful life for leasehold improvements. The Company capitalizes eligible costs to acquire or develop internal-use software that are incurred subsequent to the preliminary project stage. Capitalized costs related to internal-use software are amortized using the straight-line method over the estimated useful lives of the assets, which range from
three
to
five years
. Depreciation and amortization expense on property and equipment was
$8.2 billion
,
$8.3 billion
and
$9.2 billion
during
2017
,
2016
and
2015
, respectively.
Long-Lived Assets Including Goodwill and Other Acquired Intangible Assets
The Company reviews property, plant and equipment, inventory component prepayments and identifiable intangibles, excluding goodwill and intangible assets with indefinite useful lives, for impairment. Long-lived assets are reviewed for impairment whenever events or changes in circumstances indicate the carrying amount of an asset may not be recoverable. Recoverability of these assets is measured by comparison of their carrying amounts to future undiscounted cash flows the assets are expected to generate. If property, plant and equipment, inventory component prepayments and certain identifiable intangibles are considered to be impaired, the impairment to be recognized equals the amount by which the carrying value of the asset exceeds its fair value.
The Company does not amortize goodwill and intangible assets with indefinite useful lives; rather, such assets are required to be tested for impairment at least annually or sooner if events or changes in circumstances indicate that the assets may be impaired. The Company performs its goodwill and intangible asset impairment tests in the fourth quarter of each year. The Company did
not
recognize any impairment charges related to goodwill or indefinite lived intangible assets during
2017
,
2016
and
2015
. For purposes of testing goodwill for impairment, the Company established reporting units based on its current reporting structure. Goodwill has been allocated to these reporting units to the extent it relates to each reporting unit. In
2017
and
2016
, the Company’s goodwill was primarily allocated to the Americas and Europe reporting units.
The Company amortizes its intangible assets with definite useful lives over their estimated useful lives and reviews these assets for impairment. The Company typically amortizes its acquired intangible assets with definite useful lives over periods from
three
to
seven years
.
Fair Value Measurements
The Company applies fair value accounting for all financial assets and liabilities and non-financial assets and liabilities that are recognized or disclosed at fair value in the financial statements on a recurring basis. The Company defines fair value as the price that would be received from selling an asset or paid to transfer a liability in an orderly transaction between market participants at the measurement date. When determining the fair value measurements for assets and liabilities that are required to be recorded at fair value, the Company considers the principal or most advantageous market in which the Company would transact and the market-based risk measurements or assumptions that market participants would use to price the asset or liability, such as risks inherent in valuation techniques, transfer restrictions and credit risk. Fair value is estimated by applying the following hierarchy, which prioritizes the inputs used to measure fair value into three levels and bases the categorization within the hierarchy upon the lowest level of input that is available and significant to the fair value measurement:
Level 1
– Quoted prices in active markets for identical assets or liabilities.
Level 2
– Observable inputs other than quoted prices in active markets for identical assets and liabilities, quoted prices for identical or similar assets or liabilities in inactive markets, or other inputs that are observable or can be corroborated by observable market data for substantially the full term of the assets or liabilities.
Level 3
– Inputs that are generally unobservable and typically reflect management’s estimate of assumptions that market participants would use in pricing the asset or liability.
Apple Inc. | 2017 Form 10-K |
48
The Company’s valuation techniques used to measure the fair value of money market funds and certain marketable equity securities were derived from quoted prices in active markets for identical assets or liabilities. The valuation techniques used to measure the fair value of the Company’s debt instruments and all other financial instruments, all of which have counterparties with high credit ratings, were valued based on quoted market prices or model-driven valuations using significant inputs derived from or corroborated by observable market data.
In accordance with the fair value accounting requirements, companies may choose to measure eligible financial instruments and certain other items at fair value. The Company has not elected the fair value option for any eligible financial instruments.
Foreign Currency Translation and Remeasurement
The Company translates the assets and liabilities of its non-U.S. dollar functional currency subsidiaries into U.S. dollars using exchange rates in effect at the end of each period. Revenue and expenses for these subsidiaries are translated using rates that approximate those in effect during the period. Gains and losses from these translations are recognized in foreign currency translation included in AOCI in shareholders’ equity. The Company’s subsidiaries that use the U.S. dollar as their functional currency remeasure monetary assets and liabilities at exchange rates in effect at the end of each period, and inventories, property and nonmonetary assets and liabilities at historical rates.
Cash, Cash Equivalents and Marketable Securities
The following tables show the Company’s cash and available-for-sale securities by significant investment category as of
September 30, 2017
and
September 24, 2016
(in millions):
|
2017
|
|||||||||||||||||||||||||||
|
Adjusted
Cost
|
Unrealized
Gains
|
Unrealized
Losses
|
Fair
Value
|
Cash and
Cash
Equivalents
|
Short-Term
Marketable
Securities
|
Long-Term
Marketable
Securities
|
|||||||||||||||||||||
|
Cash
|
$
|
7,982
|
|
$
|
—
|
|
$
|
—
|
|
$
|
7,982
|
|
$
|
7,982
|
|
$
|
—
|
|
$
|
—
|
|
||||||
|
Level 1:
|
|||||||||||||||||||||||||||
|
Money market funds
|
6,534
|
|
—
|
|
—
|
|
6,534
|
|
6,534
|
|
—
|
|
—
|
|
|||||||||||||
|
Mutual funds
|
799
|
|
—
|
|
(88
|
)
|
711
|
|
—
|
|
711
|
|
—
|
|
|||||||||||||
|
Subtotal
|
7,333
|
|
—
|
|
(88
|
)
|
7,245
|
|
6,534
|
|
711
|
|
—
|
|
|||||||||||||
|
Level 2:
|
|||||||||||||||||||||||||||
|
U.S. Treasury securities
|
55,254
|
|
58
|
|
(230
|
)
|
55,082
|
|
865
|
|
17,228
|
|
36,989
|
|
|||||||||||||
|
U.S. agency securities
|
5,162
|
|
2
|
|
(9
|
)
|
5,155
|
|
1,439
|
|
2,057
|
|
1,659
|
|
|||||||||||||
|
Non-U.S. government securities
|
7,827
|
|
210
|
|
(37
|
)
|
8,000
|
|
9
|
|
123
|
|
7,868
|
|
|||||||||||||
|
Certificates of deposit and time deposits
|
5,832
|
|
—
|
|
—
|
|
5,832
|
|
1,142
|
|
3,918
|
|
772
|
|
|||||||||||||
|
Commercial paper
|
3,640
|
|
—
|
|
—
|
|
3,640
|
|
2,146
|
|
1,494
|
|
—
|
|
|||||||||||||
|
Corporate securities
|
152,724
|
|
969
|
|
(242
|
)
|
153,451
|
|
172
|
|
27,591
|
|
125,688
|
|
|||||||||||||
|
Municipal securities
|
961
|
|
4
|
|
(1
|
)
|
964
|
|
—
|
|
114
|
|
850
|
|
|||||||||||||
|
Mortgage- and asset-backed securities
|
21,684
|
|
35
|
|
(175
|
)
|
21,544
|
|
—
|
|
656
|
|
20,888
|
|
|||||||||||||
|
Subtotal
|
253,084
|
|
1,278
|
|
(694
|
)
|
253,668
|
|
5,773
|
|
53,181
|
|
194,714
|
|
|||||||||||||
|
Total
|
$
|
268,399
|
|
$
|
1,278
|
|
$
|
(782
|
)
|
$
|
268,895
|
|
$
|
20,289
|
|
$
|
53,892
|
|
$
|
194,714
|
|
||||||
Apple Inc. | 2017 Form 10-K |
49
|
2016
|
|||||||||||||||||||||||||||
|
Adjusted
Cost
|
Unrealized
Gains
|
Unrealized
Losses
|
Fair
Value
|
Cash and
Cash
Equivalents
|
Short-Term
Marketable
Securities
|
Long-Term
Marketable
Securities
|
|||||||||||||||||||||
|
Cash
|
$
|
8,601
|
|
$
|
—
|
|
$
|
—
|
|
$
|
8,601
|
|
$
|
8,601
|
|
$
|
—
|
|
$
|
—
|
|
||||||
|
Level 1:
|
|||||||||||||||||||||||||||
|
Money market funds
|
3,666
|
|
—
|
|
—
|
|
3,666
|
|
3,666
|
|
—
|
|
—
|
|
|||||||||||||
|
Mutual funds
|
1,407
|
|
—
|
|
(146
|
)
|
1,261
|
|
—
|
|
1,261
|
|
—
|
|
|||||||||||||
|
Subtotal
|
5,073
|
|
—
|
|
(146
|
)
|
4,927
|
|
3,666
|
|
1,261
|
|
—
|
|
|||||||||||||
|
Level 2:
|
|||||||||||||||||||||||||||
|
U.S. Treasury securities
|
41,697
|
|
319
|
|
(4
|
)
|
42,012
|
|
1,527
|
|
13,492
|
|
26,993
|
|
|||||||||||||
|
U.S. agency securities
|
7,543
|
|
16
|
|
—
|
|
7,559
|
|
2,762
|
|
2,441
|
|
2,356
|
|
|||||||||||||
|
Non-U.S. government securities
|
7,609
|
|
259
|
|
(27
|
)
|
7,841
|
|
110
|
|
818
|
|
6,913
|
|
|||||||||||||
|
Certificates of deposit and time deposits
|
6,598
|
|
—
|
|
—
|
|
6,598
|
|
1,108
|
|
3,897
|
|
1,593
|
|
|||||||||||||
|
Commercial paper
|
7,433
|
|
—
|
|
—
|
|
7,433
|
|
2,468
|
|
4,965
|
|
—
|
|
|||||||||||||
|
Corporate securities
|
131,166
|
|
1,409
|
|
(206
|
)
|
132,369
|
|
242
|
|
19,599
|
|
112,528
|
|
|||||||||||||
|
Municipal securities
|
956
|
|
5
|
|
—
|
|
961
|
|
—
|
|
167
|
|
794
|
|
|||||||||||||
|
Mortgage- and asset-backed securities
|
19,134
|
|
178
|
|
(28
|
)
|
19,284
|
|
—
|
|
31
|
|
19,253
|
|
|||||||||||||
|
Subtotal
|
222,136
|
|
2,186
|
|
(265
|
)
|
224,057
|
|
8,217
|
|
45,410
|
|
170,430
|
|
|||||||||||||
|
Total
|
$
|
235,810
|
|
$
|
2,186
|
|
$
|
(411
|
)
|
$
|
237,585
|
|
$
|
20,484
|
|
$
|
46,671
|
|
$
|
170,430
|
|
||||||
The Company may sell certain of its marketable securities prior to their stated maturities for strategic reasons including, but not limited to, anticipation of credit deterioration and duration management. The maturities of the Company’s long-term marketable securities generally range from
one
to
five years
.
The Company considers the declines in market value of its marketable securities investment portfolio to be temporary in nature. The Company typically invests in highly-rated securities, and its investment policy generally limits the amount of credit exposure to any one issuer. The policy generally requires investments to be investment grade, with the primary objective of minimizing the potential risk of principal loss. Fair values were determined for each individual security in the investment portfolio. When evaluating an investment for other-than-temporary impairment, the Company reviews factors such as the length of time and extent to which fair value has been below its cost basis, the financial condition of the issuer and any changes thereto, changes in market interest rates and the Company’s intent to sell, or whether it is more likely than not it will be required to sell the investment before recovery of the investment’s cost basis. As of
September 30, 2017
, the Company does not consider any of its investments to be other-than-temporarily impaired.
Derivative Financial Instruments
The Company may use derivatives to partially offset its business exposure to foreign currency and interest rate risk on expected future cash flows, on net investments in certain foreign subsidiaries and on certain existing assets and liabilities. However, the Company may choose not to hedge certain exposures for a variety of reasons including, but not limited to, accounting considerations and the prohibitive economic cost of hedging particular exposures. There can be no assurance the hedges will offset more than a portion of the financial impact resulting from movements in foreign currency exchange or interest rates.
To help protect gross margins from fluctuations in foreign currency exchange rates, certain of the Company’s subsidiaries whose functional currency is the U.S. dollar may hedge a portion of forecasted foreign currency revenue, and subsidiaries whose functional currency is not the U.S. dollar and who sell in local currencies may hedge a portion of forecasted inventory purchases not denominated in the subsidiaries’ functional currencies. The Company may enter into forward contracts, option contracts or other instruments to manage this risk and may designate these instruments as cash flow hedges. The Company typically hedges portions of its forecasted foreign currency exposure associated with revenue and inventory purchases, typically for up to
12 months
.
To help protect the net investment in a foreign operation from adverse changes in foreign currency exchange rates, the Company may enter into foreign currency forward and option contracts to offset the changes in the carrying amounts of these investments due to fluctuations in foreign currency exchange rates. In addition, the Company may use non-derivative financial instruments, such as its foreign currency-denominated debt, as economic hedges of its net investments in certain foreign subsidiaries. In both of these cases, the Company designates these instruments as net investment hedges.
Apple Inc. | 2017 Form 10-K |
50
The Company may also enter into non-designated foreign currency contracts to partially offset the foreign currency exchange gains and losses generated by the remeasurement of certain assets and liabilities denominated in non-functional currencies.
The Company may enter into interest rate swaps, options, or other instruments to manage interest rate risk. These instruments may offset a portion of changes in income or expense, or changes in fair value of the Company’s term debt or investments. The Company designates these instruments as either cash flow or fair value hedges. The Company’s hedged interest rate transactions as of
September 30, 2017
are expected to be recognized within
10 years
.
The Company may enter into foreign currency swaps to manage currency risk on its foreign currency-denominated term debt. These instruments may offset a portion of the foreign currency remeasurement gains or losses on the Company’s term debt and related interest payments. The Company designates these instruments as cash flow hedges. The Company’s hedged term debt-related foreign currency transactions as of
September 30, 2017
are expected to be recognized within
25 years
.
Cash Flow Hedges
The effective portions of cash flow hedges are recorded in AOCI until the hedged item is recognized in earnings. Deferred gains and losses associated with cash flow hedges of foreign currency revenue are recognized as a component of net sales in the same period as the related revenue is recognized, and deferred gains and losses related to cash flow hedges of inventory purchases are recognized as a component of cost of sales in the same period as the related costs are recognized. Deferred gains and losses associated with cash flow hedges of interest income or expense are recognized in other income/(expense), net in the same period as the related income or expense is recognized. The ineffective portions and amounts excluded from the effectiveness testing of cash flow hedges are recognized in other income/(expense), net.
Derivative instruments designated as cash flow hedges must be de-designated as hedges when it is probable the forecasted hedged transaction will not occur in the initially identified time period or within a subsequent two-month time period. Deferred gains and losses in AOCI associated with such derivative instruments are reclassified into other income/(expense), net in the period of de-designation. Any subsequent changes in fair value of such derivative instruments are reflected in other income/(expense), net unless they are re-designated as hedges of other transactions.
Net Investment Hedges
The effective portions of net investment hedges are recorded in other comprehensive income/(loss) (“OCI”) as a part of the cumulative translation adjustment. The ineffective portions and amounts excluded from the effectiveness testing of net investment hedges are recognized in other income/(expense), net.
Fair Value Hedges
Gains and losses related to changes in fair value hedges are recognized in earnings along with a corresponding loss or gain related to the change in value of the underlying hedged item.
Non-Designated Derivatives
Derivatives that are not designated as hedging instruments are adjusted to fair value through earnings in the financial statement line item to which the derivative relates. As a result, the Company recognized a gain of
$20 million
in net sales, a loss of
$40 million
in cost of sales and a gain of
$606 million
in other income/(expense), net for
2017
.
The Company records all derivatives in the Consolidated Balance Sheets at fair value. The Company’s accounting treatment for these derivative instruments is based on its hedge designation. The following tables show the Company’s derivative instruments at gross fair value as of
September 30, 2017
and
September 24, 2016
(in millions):
|
2017
|
|||||||||||
|
Fair Value of
Derivatives Designated
as Hedge Instruments
|
Fair Value of
Derivatives Not Designated
as Hedge Instruments
|
Total
Fair Value
|
|||||||||
|
Derivative assets
(1)
:
|
|||||||||||
|
Foreign exchange contracts
|
$
|
1,049
|
|
$
|
363
|
|
$
|
1,412
|
|
||
|
Interest rate contracts
|
$
|
218
|
|
$
|
—
|
|
$
|
218
|
|
||
|
Derivative liabilities
(2)
:
|
|||||||||||
|
Foreign exchange contracts
|
$
|
759
|
|
$
|
501
|
|
$
|
1,260
|
|
||
|
Interest rate contracts
|
$
|
303
|
|
$
|
—
|
|
$
|
303
|
|
||
Apple Inc. | 2017 Form 10-K |
51
|
2016
|
|||||||||||
|
Fair Value of
Derivatives Designated
as Hedge Instruments
|
Fair Value of
Derivatives Not Designated
as Hedge Instruments
|
Total
Fair Value
|
|||||||||
|
Derivative assets
(1)
:
|
|||||||||||
|
Foreign exchange contracts
|
$
|
518
|
|
$
|
153
|
|
$
|
671
|
|
||
|
Interest rate contracts
|
$
|
728
|
|
$
|
—
|
|
$
|
728
|
|
||
|
Derivative liabilities
(2)
:
|
|||||||||||
|
Foreign exchange contracts
|
$
|
935
|
|
$
|
134
|
|
$
|
1,069
|
|
||
|
Interest rate contracts
|
$
|
7
|
|
$
|
—
|
|
$
|
7
|
|
||
|
(1)
|
The fair value of derivative assets is measured using Level 2 fair value inputs and is recorded as other current assets and other non-current assets in the Consolidated Balance Sheets.
|
|
(2)
|
The fair value of derivative liabilities is measured using Level 2 fair value inputs and is recorded as accrued expenses and other non-current liabilities in the Consolidated Balance Sheets.
|
The following table shows the pre-tax gains and losses of the Company’s derivative and non-derivative instruments designated as cash flow, net investment and fair value hedges in OCI and the Consolidated Statements of Operations for
2017
,
2016
and
2015
(in millions):
|
2017
|
2016
|
2015
|
|||||||||
|
Gains/(Losses) recognized in OCI – effective portion:
|
|||||||||||
|
Cash flow hedges:
|
|||||||||||
|
Foreign exchange contracts
|
$
|
1,797
|
|
$
|
109
|
|
$
|
3,592
|
|
||
|
Interest rate contracts
|
7
|
|
(57
|
)
|
(111
|
)
|
|||||
|
Total
|
$
|
1,804
|
|
|
$
|
52
|
|
|
$
|
3,481
|
|
|
Net investment hedges:
|
|||||||||||
|
Foreign exchange contracts
|
$
|
—
|
|
$
|
—
|
|
$
|
167
|
|
||
|
Foreign currency debt
|
67
|
|
(258
|
)
|
(71
|
)
|
|||||
|
Total
|
$
|
67
|
|
|
$
|
(258
|
)
|
|
$
|
96
|
|
|
Gains/(Losses) reclassified from AOCI into net income – effective portion:
|
|||||||||||
|
Cash flow hedges:
|
|||||||||||
|
Foreign exchange contracts
|
$
|
1,958
|
|
$
|
885
|
|
$
|
4,092
|
|
||
|
Interest rate contracts
|
(2
|
)
|
(11
|
)
|
(17
|
)
|
|||||
|
Total
|
$
|
1,956
|
|
|
$
|
874
|
|
|
$
|
4,075
|
|
|
Gains/(Losses) on derivative instruments:
|
|||||||||||
|
Fair value hedges:
|
|||||||||||
|
Interest rate contracts
|
$
|
(810
|
)
|
$
|
341
|
|
$
|
337
|
|
||
|
Gains/(Losses) related to hedged items:
|
|||||||||||
|
Fair value hedges:
|
|||||||||||
|
Fixed-rate debt
|
$
|
810
|
|
$
|
(341
|
)
|
$
|
(337
|
)
|
||
Apple Inc. | 2017 Form 10-K |
52
The following table shows the notional amounts of the Company’s outstanding derivative instruments and credit risk amounts associated with outstanding or unsettled derivative instruments as of
September 30, 2017
and
September 24, 2016
(in millions):
|
2017
|
2016
|
||||||||||||||
|
Notional
Amount
|
Credit Risk
Amount
|
Notional
Amount
|
Credit Risk
Amount
|
||||||||||||
|
Instruments designated as accounting hedges:
|
|||||||||||||||
|
Foreign exchange contracts
|
$
|
56,156
|
|
$
|
1,049
|
|
$
|
44,678
|
|
$
|
518
|
|
|||
|
Interest rate contracts
|
$
|
33,000
|
|
$
|
218
|
|
$
|
24,500
|
|
$
|
728
|
|
|||
|
Instruments not designated as accounting hedges:
|
|||||||||||||||
|
Foreign exchange contracts
|
$
|
69,774
|
|
$
|
363
|
|
$
|
54,305
|
|
$
|
153
|
|
|||
The notional amounts for outstanding derivative instruments provide one measure of the transaction volume outstanding and do not represent the amount of the Company’s exposure to credit or market loss. The credit risk amounts represent the Company’s gross exposure to potential accounting loss on derivative instruments that are outstanding or unsettled if all counterparties failed to perform according to the terms of the contract, based on then-current currency or interest rates at each respective date. The Company’s exposure to credit loss and market risk will vary over time as currency and interest rates change. Although the table above reflects the notional and credit risk amounts of the Company’s derivative instruments, it does not reflect the gains or losses associated with the exposures and transactions that the instruments are intended to hedge. The amounts ultimately realized upon settlement of these financial instruments, together with the gains and losses on the underlying exposures, will depend on actual market conditions during the remaining life of the instruments.
The Company generally enters into master netting arrangements, which are designed to reduce credit risk by permitting net settlement of transactions with the same counterparty. To further limit credit risk, the Company generally enters into collateral security arrangements that provide for collateral to be received or posted when the net fair value of certain financial instruments fluctuates from contractually established thresholds. The Company presents its derivative assets and derivative liabilities at their gross fair values in its Consolidated Balance Sheets. The net cash collateral received by the Company related to derivative instruments under its collateral security arrangements was
$35 million
and
$163 million
as of
September 30, 2017
and
September 24, 2016
, respectively, which were recorded as accrued expenses in the Consolidated Balance Sheets.
Under master netting arrangements with the respective counterparties to the Company’s derivative contracts, the Company is allowed to net settle transactions with a single net amount payable by one party to the other. As of
September 30, 2017
and
September 24, 2016
, the potential effects of these rights of set-off associated with the Company’s derivative contracts, including the effects of collateral, would be a reduction to both derivative assets and derivative liabilities of
$1.4 billion
and
$1.5 billion
, respectively, resulting in net derivative assets of
$32 million
and
$160 million
, respectively.
Accounts Receivable
Trade Receivables
The Company has considerable trade receivables outstanding with its third-party cellular network carriers, wholesalers, retailers, value-added resellers, small and mid-sized businesses and education, enterprise and government customers. The Company generally does not require collateral from its customers; however, the Company will require collateral in certain instances to limit credit risk. In addition, when possible, the Company attempts to limit credit risk on trade receivables with credit insurance for certain customers or by requiring third-party financing, loans or leases to support credit exposure. These credit-financing arrangements are directly between the third-party financing company and the end customer. As such, the Company generally does not assume any recourse or credit risk sharing related to any of these arrangements.
As of
September 30, 2017
, the Company had
two
customers that individually represented 10% or more of total trade receivables, each of which accounted for
10%
. As of
September 24, 2016
, the Company had
one
customer that represented 10% or more of total trade receivables, which accounted for
10%
. The Company’s cellular network carriers accounted for
59%
and
63%
of trade receivables as of
September 30, 2017
and
September 24, 2016
, respectively.
Vendor Non-Trade Receivables
The Company has non-trade receivables from certain of its manufacturing vendors resulting from the sale of components to these vendors who manufacture sub-assemblies or assemble final products for the Company. The Company purchases these components directly from suppliers. As of
September 30, 2017
, the Company had
three
vendors that individually represented 10% or more of total vendor non-trade receivables, which accounted for
42%
,
19%
and
10%
. As of
September 24, 2016
, the Company had
two
vendors that individually represented 10% or more of total vendor non-trade receivables, which accounted for
47%
and
21%
.
Apple Inc. | 2017 Form 10-K |
53
The following tables show the Company’s consolidated financial statement details as of
September 30, 2017
and
September 24, 2016
(in millions):
Property, Plant and Equipment, Net
|
2017
|
2016
|
||||||
|
Land and buildings
|
$
|
13,587
|
|
$
|
10,185
|
|
|
|
Machinery, equipment and internal-use software
|
54,210
|
|
44,543
|
|
|||
|
Leasehold improvements
|
7,279
|
|
6,517
|
|
|||
|
Gross property, plant and equipment
|
75,076
|
|
61,245
|
|
|||
|
Accumulated depreciation and amortization
|
(41,293
|
)
|
(34,235
|
)
|
|||
|
Total property, plant and equipment, net
|
$
|
33,783
|
|
$
|
27,010
|
|
|
Other Non-Current Liabilities
|
2017
|
2016
|
||||||
|
Deferred tax liabilities
|
$
|
31,504
|
|
$
|
26,019
|
|
|
|
Other non-current liabilities
|
8,911
|
|
10,055
|
|
|||
|
Total other non-current liabilities
|
$
|
40,415
|
|
$
|
36,074
|
|
|
Other Income/(Expense), Net
The following table shows the detail of other income/(expense), net for
2017
,
2016
and
2015
(in millions):
|
2017
|
2016
|
2015
|
|||||||||
|
Interest and dividend income
|
$
|
5,201
|
|
$
|
3,999
|
|
$
|
2,921
|
|
||
|
Interest expense
|
(2,323
|
)
|
(1,456
|
)
|
(733
|
)
|
|||||
|
Other expense, net
|
(133
|
)
|
(1,195
|
)
|
(903
|
)
|
|||||
|
Total other income/(expense), net
|
$
|
2,745
|
|
$
|
1,348
|
|
$
|
1,285
|
|
||
The Company’s acquired intangible assets with definite useful lives primarily consist of patents and licenses. The following table summarizes the components of acquired intangible asset balances as of
September 30, 2017
and
September 24, 2016
(in millions):
|
2017
|
2016
|
||||||||||||||||||||||
|
Gross
Carrying Amount
|
Accumulated
Amortization
|
Net
Carrying Amount
|
Gross
Carrying Amount
|
Accumulated
Amortization
|
Net
Carrying Amount
|
||||||||||||||||||
|
Definite-lived and amortizable acquired intangible assets
|
$
|
7,507
|
|
$
|
(5,309
|
)
|
$
|
2,198
|
|
$
|
8,912
|
|
$
|
(5,806
|
)
|
$
|
3,106
|
|
|||||
|
Indefinite-lived and non-amortizable acquired intangible assets
|
100
|
|
—
|
|
100
|
|
100
|
|
—
|
|
100
|
|
|||||||||||
|
Total acquired intangible assets
|
$
|
7,607
|
|
|
$
|
(5,309
|
)
|
|
$
|
2,298
|
|
|
$
|
9,012
|
|
|
$
|
(5,806
|
)
|
|
$
|
3,206
|
|
Apple Inc. | 2017 Form 10-K |
54
Amortization expense related to acquired intangible assets was
$1.2 billion
,
$1.5 billion
and
$1.3 billion
in
2017
,
2016
and
2015
, respectively. As of
September 30, 2017
, the remaining weighted-average amortization period for acquired intangible assets is
3.4 years
. The expected annual amortization expense related to acquired intangible assets as of
September 30, 2017
, is as follows (in millions):
|
2018
|
$
|
948
|
|
|
2019
|
505
|
|
|
|
2020
|
323
|
|
|
|
2021
|
222
|
|
|
|
2022
|
131
|
|
|
|
Thereafter
|
69
|
|
|
|
Total
|
$
|
2,198
|
|
The provision for income taxes for
2017
,
2016
and
2015
, consisted of the following (in millions):
|
2017
|
2016
|
2015
|
|||||||||
|
Federal:
|
|||||||||||
|
Current
|
$
|
7,842
|
|
$
|
7,652
|
|
$
|
11,730
|
|
||
|
Deferred
|
5,980
|
|
5,043
|
|
3,408
|
|
|||||
|
Total
(1)
|
13,822
|
|
|
12,695
|
|
|
15,138
|
|
|||
|
State:
|
|||||||||||
|
Current
|
259
|
|
990
|
|
1,265
|
|
|||||
|
Deferred
|
2
|
|
(138
|
)
|
(220
|
)
|
|||||
|
Total
|
261
|
|
|
852
|
|
|
1,045
|
|
|||
|
Foreign:
|
|||||||||||
|
Current
|
1,671
|
|
2,105
|
|
4,744
|
|
|||||
|
Deferred
|
(16
|
)
|
33
|
|
(1,806
|
)
|
|||||
|
Total
|
1,655
|
|
|
2,138
|
|
|
2,938
|
|
|||
|
Provision for income taxes
|
$
|
15,738
|
|
|
$
|
15,685
|
|
|
$
|
19,121
|
|
|
(1)
|
Includes taxes of
$7.9 billion
,
$6.7 billion
and
$7.3 billion
provided on foreign pre-tax earnings in
2017
,
2016
and
2015
, respectively.
|
The foreign provision for income taxes is based on foreign pre-tax earnings of
$44.7 billion
,
$41.1 billion
and
$47.6 billion
in
2017
,
2016
and
2015
, respectively. The Company’s consolidated financial statements provide for any related tax liability on undistributed earnings that the Company does not intend to be indefinitely reinvested outside the U.S. Substantially all of the Company’s undistributed international earnings intended to be indefinitely reinvested in operations outside the U.S. were generated by subsidiaries organized in Ireland, which has a statutory tax rate of
12.5%
. As of
September 30, 2017
, U.S. income taxes have not been provided on a cumulative total of
$128.7 billion
of such earnings. The amount of unrecognized deferred tax liability related to these temporary differences is estimated to be
$42.2 billion
.
As of
September 30, 2017
and
September 24, 2016
,
$252.3 billion
and
$216.0 billion
, respectively, of the Company’s cash, cash equivalents and marketable securities were held by foreign subsidiaries and are generally based in U.S. dollar-denominated holdings. Amounts held by foreign subsidiaries are generally subject to U.S. income taxation on repatriation to the U.S.
Apple Inc. | 2017 Form 10-K |
55
A reconciliation of the provision for income taxes, with the amount computed by applying the statutory federal income tax rate (
35%
in
2017
,
2016
and
2015
) to income before provision for income taxes for
2017
,
2016
and
2015
, is as follows (dollars in millions):
|
2017
|
2016
|
2015
|
|||||||||
|
Computed expected tax
|
$
|
22,431
|
|
$
|
21,480
|
|
$
|
25,380
|
|
||
|
State taxes, net of federal effect
|
185
|
|
553
|
|
680
|
|
|||||
|
Indefinitely invested earnings of foreign subsidiaries
|
(6,135
|
)
|
(5,582
|
)
|
(6,470
|
)
|
|||||
|
Domestic production activities deduction
|
(209
|
)
|
(382
|
)
|
(426
|
)
|
|||||
|
Research and development credit, net
|
(678
|
)
|
(371
|
)
|
(171
|
)
|
|||||
|
Other
|
144
|
|
(13
|
)
|
128
|
|
|||||
|
Provision for income taxes
|
$
|
15,738
|
|
|
$
|
15,685
|
|
|
$
|
19,121
|
|
|
Effective tax rate
|
24.6
|
%
|
25.6
|
%
|
26.4
|
%
|
|||||
The Company’s income taxes payable have been reduced by the tax benefits from employee stock plan awards. For RSUs, the Company receives an income tax benefit upon the award’s vesting equal to the tax effect of the underlying stock’s fair market value. The Company had net excess tax benefits from equity awards of
$620 million
,
$379 million
and
$748 million
in
2017
,
2016
and
2015
, respectively, which were reflected as increases to common stock.
As of
September 30, 2017
and
September 24, 2016
, the significant components of the Company’s deferred tax assets and liabilities were (in millions):
|
2017
|
2016
|
||||||
|
Deferred tax assets:
|
|||||||
|
Accrued liabilities and other reserves
|
$
|
4,019
|
|
$
|
4,135
|
|
|
|
Basis of capital assets
|
1,230
|
|
2,107
|
|
|||
|
Deferred revenue
|
1,521
|
|
1,717
|
|
|||
|
Deferred cost sharing
|
667
|
|
667
|
|
|||
|
Share-based compensation
|
703
|
|
601
|
|
|||
|
Other
|
834
|
|
788
|
|
|||
|
Total deferred tax assets, net of valuation allowance of $0
|
8,974
|
|
10,015
|
|
|||
|
Deferred tax liabilities:
|
|||||||
|
Unremitted earnings of foreign subsidiaries
|
36,355
|
|
31,436
|
|
|||
|
Other
|
207
|
|
485
|
|
|||
|
Total deferred tax liabilities
|
36,562
|
|
31,921
|
|
|||
|
Net deferred tax liabilities
|
$
|
(27,588
|
)
|
|
$
|
(21,906
|
)
|
Deferred tax assets and liabilities reflect the effects of tax losses, credits and the future income tax effects of temporary differences between the consolidated financial statement carrying amounts of existing assets and liabilities and their respective tax bases and are measured using enacted tax rates that apply to taxable income in the years in which those temporary differences are expected to be recovered or settled.
Uncertain Tax Positions
Tax positions are evaluated in a two-step process. The Company first determines whether it is more likely than not that a tax position will be sustained upon examination. If a tax position meets the more-likely-than-not recognition threshold it is then measured to determine the amount of benefit to recognize in the financial statements. The tax position is measured as the largest amount of benefit that is greater than
50%
likely of being realized upon ultimate settlement. The Company classifies gross interest and penalties and unrecognized tax benefits that are not expected to result in payment or receipt of cash within one year as non-current liabilities in the Consolidated Balance Sheets.
As of
September 30, 2017
, the total amount of gross unrecognized tax benefits was
$8.4 billion
, of which
$2.5 billion
, if recognized, would affect the Company’s effective tax rate. As of
September 24, 2016
, the total amount of gross unrecognized tax benefits was
$7.7 billion
, of which
$2.8 billion
, if recognized, would have affected the Company’s effective tax rate.
Apple Inc. | 2017 Form 10-K |
56
The aggregate changes in the balance of gross unrecognized tax benefits, which excludes interest and penalties, for
2017
,
2016
and
2015
, is as follows (in millions):
|
2017
|
2016
|
2015
|
|||||||||
|
Beginning balances
|
$
|
7,724
|
|
$
|
6,900
|
|
$
|
4,033
|
|
||
|
Increases related to tax positions taken during a prior year
|
333
|
|
1,121
|
|
2,056
|
|
|||||
|
Decreases related to tax positions taken during a prior year
|
(952
|
)
|
(257
|
)
|
(345
|
)
|
|||||
|
Increases related to tax positions taken during the current year
|
1,880
|
|
1,578
|
|
1,278
|
|
|||||
|
Decreases related to settlements with taxing authorities
|
(539
|
)
|
(1,618
|
)
|
(109
|
)
|
|||||
|
Decreases related to expiration of statute of limitations
|
(39
|
)
|
—
|
|
(13
|
)
|
|||||
|
Ending balances
|
$
|
8,407
|
|
$
|
7,724
|
|
$
|
6,900
|
|
||
The Company includes interest and penalties related to unrecognized tax benefits within the provision for income taxes. As of
September 30, 2017
and
September 24, 2016
, the total amount of gross interest and penalties accrued was
$1.2 billion
and
$1.0 billion
, respectively, which is classified as non-current liabilities in the Consolidated Balance Sheets. In connection with tax matters, the Company recognized interest and penalty expense in
2017
,
2016
and
2015
of
$165 million
,
$295 million
and
$709 million
, respectively.
The Company is subject to taxation and files income tax returns in the U.S. federal jurisdiction and in many state and foreign jurisdictions. The U.S. Internal Revenue Service (the “IRS”) concluded its review of the years 2010 through 2012 during the third quarter of 2017. All years prior to 2013 are closed, and the IRS is currently examining the years 2013 through 2015. The Company is also subject to audits by state, local and foreign tax authorities. In major states and major foreign jurisdictions, the years subsequent to 2003 generally remain open and could be subject to examination by the taxing authorities.
The Company believes that an adequate provision has been made for any adjustments that may result from tax examinations. However, the outcome of tax audits cannot be predicted with certainty. If any issues addressed in the Company’s tax audits are resolved in a manner not consistent with its expectations, the Company could be required to adjust its provision for income taxes in the period such resolution occurs. Although timing of the resolution and/or closure of audits is not certain, the Company does not believe it is reasonably possible that its gross unrecognized tax benefits would materially change in the next 12 months.
On August 30, 2016, the European Commission announced its decision that Ireland granted state aid to the Company by providing tax opinions in 1991 and 2007 concerning the tax allocation of profits of the Irish branches of
two
subsidiaries of the Company (the “State Aid Decision”). The State Aid Decision orders Ireland to calculate and recover additional taxes from the Company for the period June 2003 through December 2014. Irish legislative changes, effective as of January 2015, eliminated the application of the tax opinions from that date forward. The Company believes the State Aid Decision to be without merit and appealed to the General Court of the Court of Justice of the European Union. Ireland has also appealed the State Aid Decision. Although Ireland is still computing the recovery amount, the Company expects the amount to be in line with the European Commission’s announced recovery amount of
€13 billion
, plus interest of
€1 billion
. Once the recovery amount is finalized by Ireland, the Company anticipates funding it, including interest, out of foreign cash. These amounts are expected to be placed into escrow in 2018, where they will remain pending conclusion of all appeals. The Company believes that any incremental Irish corporate income taxes potentially due related to the State Aid Decision would be creditable against U.S. taxes.
Apple Inc. | 2017 Form 10-K |
57
Commercial Paper
The Company issues unsecured short-term promissory notes (“Commercial Paper”) pursuant to a commercial paper program. The Company uses net proceeds from the commercial paper program for general corporate purposes, including dividends and share repurchases. As of
September 30, 2017
and
September 24, 2016
, the Company had
$12.0 billion
and
$8.1 billion
of Commercial Paper outstanding, respectively, with maturities generally less than
nine months
. The weighted-average interest rate of the Company’s Commercial Paper was
1.20%
as of
September 30, 2017
and
0.45%
as of
September 24, 2016
.
The following table provides a summary of cash flows associated with the issuance and maturities of Commercial Paper for
2017
and
2016
(in millions):
|
2017
|
2016
|
||||||
|
Maturities less than 90 days:
|
|||||||
|
Proceeds from/(Repayments of) commercial paper, net
|
$
|
(1,782
|
)
|
$
|
(869
|
)
|
|
|
Maturities greater than 90 days:
|
|||||||
|
Proceeds from commercial paper
|
17,932
|
|
3,632
|
|
|||
|
Repayments of commercial paper
|
(12,298
|
)
|
(3,160
|
)
|
|||
|
Proceeds from/(Repayments of) commercial paper, net
|
5,634
|
|
|
472
|
|
||
|
Total change in commercial paper, net
|
$
|
3,852
|
|
|
$
|
(397
|
)
|
As of
September 30, 2017
, the Company had outstanding floating- and fixed-rate notes with varying maturities for an aggregate principal amount of
$104.0 billion
(collectively the “Notes”). The Notes are senior unsecured obligations, and interest is payable in arrears, quarterly for the U.S. dollar-denominated and Australian dollar-denominated floating-rate notes, semi-annually for the U.S. dollar-denominated, Australian dollar-denominated, British pound-denominated, Japanese yen-denominated and Canadian dollar-denominated fixed-rate notes and annually for the euro-denominated and Swiss franc-denominated fixed-rate notes. The following table provides a summary of the Company’s term debt as of
September 30, 2017
and
September 24, 2016
:
|
Maturities
|
2017
|
2016
|
|||||||||||||||||||||
|
Amount
(in millions)
|
Effective
Interest Rate
|
Amount
(in millions)
|
Effective
Interest Rate
|
||||||||||||||||||||
|
2013 debt issuance of $17.0 billion:
|
|||||||||||||||||||||||
|
Floating-rate notes
|
2018
|
2018
|
$
|
2,000
|
|
1.10%
|
1.10
|
%
|
$
|
2,000
|
|
1.10%
|
1.10
|
%
|
|||||||||
|
Fixed-rate 1.000% – 3.850% notes
|
2018
|
–
|
2043
|
12,500
|
|
1.08%
|
–
|
3.91
|
%
|
12,500
|
|
1.08%
|
–
|
3.91
|
%
|
||||||||
|
2014 debt issuance of $12.0 billion:
|
|||||||||||||||||||||||
|
Floating-rate notes
|
2019
|
2019
|
1,000
|
|
1.61%
|
1.61
|
%
|
2,000
|
|
0.86%
|
–
|
1.09
|
%
|
||||||||||
|
Fixed-rate 2.100% – 4.450% notes
|
2019
|
–
|
2044
|
8,500
|
|
1.61%
|
–
|
4.48
|
%
|
10,000
|
|
0.85%
|
–
|
4.48
|
%
|
||||||||
|
2015 debt issuances of $27.3 billion:
|
|||||||||||||||||||||||
|
Floating-rate notes
|
2019
|
–
|
2020
|
1,549
|
|
1.56%
|
–
|
1.87
|
%
|
1,781
|
|
0.87%
|
–
|
1.87
|
%
|
||||||||
|
Fixed-rate 0.350% – 4.375% notes
|
2019
|
–
|
2045
|
24,522
|
|
0.28%
|
–
|
4.51
|
%
|
25,144
|
|
0.28%
|
–
|
4.51
|
%
|
||||||||
|
2016 debt issuances of $24.9 billion:
|
|||||||||||||||||||||||
|
Floating-rate notes
|
2019
|
–
|
2021
|
1,350
|
|
1.45%
|
–
|
2.44
|
%
|
1,350
|
|
0.91%
|
–
|
1.95
|
%
|
||||||||
|
Fixed-rate 1.100% – 4.650% notes
|
2018
|
–
|
2046
|
23,645
|
|
1.13%
|
–
|
4.78
|
%
|
23,609
|
|
1.13%
|
–
|
4.58
|
%
|
||||||||
Apple Inc. | 2017 Form 10-K |
58
|
Maturities
|
2017
|
2016
|
|||||||||||||||||||||
|
(Continued)
|
Amount
(in millions)
|
Effective
Interest Rate
|
Amount
(in millions)
|
Effective
Interest Rate
|
|||||||||||||||||||
|
Second quarter 2017 debt issuance of $10.0 billion:
|
|||||||||||||||||||||||
|
Floating-rate notes
|
2019
|
500
|
|
1.39
|
%
|
—
|
|
—
|
%
|
||||||||||||||
|
Floating-rate notes
|
2020
|
500
|
|
1.51
|
%
|
—
|
|
—
|
%
|
||||||||||||||
|
Floating-rate notes
|
2022
|
1,000
|
|
1.81
|
%
|
—
|
|
—
|
%
|
||||||||||||||
|
Fixed-rate 1.550% notes
|
2019
|
500
|
|
1.59
|
%
|
—
|
|
—
|
%
|
||||||||||||||
|
Fixed-rate 1.900% notes
|
2020
|
1,000
|
|
1.51
|
%
|
—
|
|
—
|
%
|
||||||||||||||
|
Fixed-rate 2.500% notes
|
2022
|
1,500
|
|
1.80
|
%
|
—
|
|
—
|
%
|
||||||||||||||
|
Fixed-rate 3.000% notes
|
2024
|
1,750
|
|
2.11
|
%
|
—
|
|
—
|
%
|
||||||||||||||
|
Fixed-rate 3.350% notes
|
2027
|
2,250
|
|
2.25
|
%
|
—
|
|
—
|
%
|
||||||||||||||
|
Fixed-rate 4.250% notes
|
2047
|
1,000
|
|
4.26
|
%
|
—
|
|
—
|
%
|
||||||||||||||
|
Second quarter 2017 debt issuance of $1.0 billion:
|
|||||||||||||||||||||||
|
Fixed-rate 4.300% notes
|
2047
|
1,000
|
|
4.30
|
%
|
—
|
|
—
|
%
|
||||||||||||||
|
Third quarter 2017 debt issuance of $7.0 billion:
|
|||||||||||||||||||||||
|
Floating-rate notes
|
2020
|
500
|
|
1.38
|
%
|
—
|
|
—
|
%
|
||||||||||||||
|
Floating-rate notes
|
2022
|
750
|
|
1.66
|
%
|
—
|
|
—
|
%
|
||||||||||||||
|
Fixed-rate 1.800% notes
|
2020
|
1,000
|
|
1.84
|
%
|
—
|
|
—
|
%
|
||||||||||||||
|
Fixed-rate 2.300% notes
|
2022
|
1,000
|
|
2.34
|
%
|
—
|
|
—
|
%
|
||||||||||||||
|
Fixed-rate 2.850% notes
|
2024
|
1,750
|
|
2.25
|
%
|
—
|
|
—
|
%
|
||||||||||||||
|
Fixed-rate 3.200% notes
|
2027
|
2,000
|
|
2.43
|
%
|
—
|
|
—
|
%
|
||||||||||||||
|
Third quarter 2017 euro-denominated debt issuance of €2.5 billion:
|
|||||||||||||||||||||||
|
Fixed-rate 0.875% notes
|
2025
|
1,469
|
|
3.03
|
%
|
—
|
|
—
|
%
|
||||||||||||||
|
Fixed-rate 1.375% notes
|
2029
|
1,469
|
|
3.37
|
%
|
—
|
|
—
|
%
|
||||||||||||||
|
Third quarter 2017 debt issuance of $1.0 billion:
|
|||||||||||||||||||||||
|
Fixed-rate 3.000% notes
|
2027
|
1,000
|
|
3.03
|
%
|
—
|
|
—
|
%
|
||||||||||||||
|
Fourth quarter 2017 Canadian dollar-denominated debt issuance of C$2.5 billion:
|
|||||||||||||||||||||||
|
Fixed-rate 2.513% notes
|
2024
|
2,017
|
|
2.66
|
%
|
—
|
|
—
|
%
|
||||||||||||||
|
Fourth quarter 2017 debt issuance of $5.0 billion:
|
|||||||||||||||||||||||
|
Fixed-rate 1.500% notes
|
2019
|
1,000
|
|
1.54
|
%
|
—
|
|
—
|
%
|
||||||||||||||
|
Fixed-rate 2.100% notes
|
2022
|
1,000
|
|
1.92
|
%
|
—
|
|
—
|
%
|
||||||||||||||
|
Fixed-rate 2.900% notes
|
2027
|
2,000
|
|
2.55
|
%
|
—
|
|
—
|
%
|
||||||||||||||
|
Fixed-rate 3.750% notes
|
2047
|
1,000
|
|
3.78
|
%
|
—
|
|
—
|
%
|
||||||||||||||
|
Total term debt
|
104,021
|
|
78,384
|
|
|||||||||||||||||||
|
Unamortized premium/(discount) and issuance costs, net
|
(225
|
)
|
(174
|
)
|
|||||||||||||||||||
|
Hedge accounting fair value adjustments
|
(93
|
)
|
717
|
|
|||||||||||||||||||
|
Less: Current portion of long-term debt
|
(6,496
|
)
|
(3,500
|
)
|
|||||||||||||||||||
|
Total long-term debt
|
$
|
97,207
|
|
$
|
75,427
|
|
|||||||||||||||||
To manage interest rate risk on certain of its U.S. dollar-denominated fixed- or floating-rate notes, the Company has entered into interest rate swaps to effectively convert the fixed interest rates to floating interest rates or the floating interest rates to fixed interest rates on a portion of these notes. Additionally, to manage foreign currency risk on certain of its foreign currency-denominated notes, the Company has entered into foreign currency swaps to effectively convert these notes to U.S. dollar-denominated notes.
A portion of the Company’s Japanese yen-denominated notes is designated as a hedge of the foreign currency exposure of the Company’s net investment in a foreign operation. As of
September 30, 2017
and
September 24, 2016
, the carrying value of the debt designated as a net investment hedge was
$1.6 billion
and
$1.9 billion
, respectively.
For further discussion regarding the Company’s use of derivative instruments see the Derivative Financial Instruments section of Note 2, “Financial Instruments.”
Apple Inc. | 2017 Form 10-K |
59
The effective interest rates for the Notes include the interest on the Notes, amortization of the discount or premium and, if applicable, adjustments related to hedging. The Company recognized
$2.2 billion
,
$1.4 billion
and
$722 million
of interest expense on its term debt for
2017
,
2016
and
2015
, respectively.
The future principal payments for the Company’s Notes as of
September 30, 2017
are as follows (in millions):
|
2018
|
$
|
6,500
|
|
|
2019
|
8,863
|
|
|
|
2020
|
9,220
|
|
|
|
2021
|
7,750
|
|
|
|
2022
|
10,297
|
|
|
|
Thereafter
|
61,391
|
|
|
|
Total term debt
|
$
|
104,021
|
|
As of
September 30, 2017
and
September 24, 2016
, the fair value of the Company’s Notes, based on Level 2 inputs, was
$106.1 billion
and
$81.7 billion
, respectively.
Dividends
The Company declared and paid cash dividends per share during the periods presented as follows:
|
Dividends
Per Share
|
Amount
(in millions)
|
||||||
|
2017:
|
|||||||
|
Fourth quarter
|
$
|
0.63
|
|
$
|
3,252
|
|
|
|
Third quarter
|
0.63
|
|
3,281
|
|
|||
|
Second quarter
|
0.57
|
|
2,988
|
|
|||
|
First quarter
|
0.57
|
|
3,042
|
|
|||
|
Total cash dividends declared and paid
|
$
|
2.40
|
|
$
|
12,563
|
|
|
|
2016:
|
|||||||
|
Fourth quarter
|
$
|
0.57
|
|
$
|
3,071
|
|
|
|
Third quarter
|
0.57
|
|
3,117
|
|
|||
|
Second quarter
|
0.52
|
|
2,879
|
|
|||
|
First quarter
|
0.52
|
|
2,898
|
|
|||
|
Total cash dividends declared and paid
|
$
|
2.18
|
|
$
|
11,965
|
|
|
Future dividends are subject to declaration by the Board of Directors.
Share Repurchase Program
In
May 2017
, the Company’s Board of Directors increased the share repurchase authorization from
$175 billion
to
$210 billion
of the Company’s common stock, of which
$166 billion
had been utilized as of
September 30, 2017
. The Company’s share repurchase program does not obligate it to acquire any specific number of shares. Under the program, shares may be repurchased in privately negotiated and/or open market transactions, including under plans complying with Rule 10b5-1 under the Securities Exchange Act of 1934, as amended (the “Exchange Act”).
The Company has entered, and in the future may enter, into accelerated share repurchase arrangements (“ASRs”) with financial institutions. In exchange for up-front payments, the financial institutions deliver shares of the Company’s common stock during the purchase periods of each ASR. The total number of shares ultimately delivered, and therefore the average repurchase price paid per share, is determined at the end of the applicable purchase period of each ASR based on the volume-weighted average price of the Company’s common stock during that period. The shares received are retired in the periods they are delivered, and the up-front payments are accounted for as a reduction to shareholders’ equity in the Company’s Consolidated Balance Sheets in the periods the payments are made. The Company reflects the ASRs as a repurchase of common stock in the period delivered for purposes of calculating earnings per share and as forward contracts indexed to its own common stock. The ASRs met all of the applicable criteria for equity classification, and therefore were not accounted for as derivative instruments.
Apple Inc. | 2017 Form 10-K |
60
The following table shows the Company’s ASR activity and related information during the years ended
September 30, 2017
and
September 24, 2016
:
|
Purchase Period
End Date
|
Number of
Shares
(in thousands)
|
Average
Repurchase
Price Per Share
|
ASR
Amount
(in millions)
|
|||||||||
|
August 2017 ASR
|
November 2017
|
15,069
|
|
(1)
|
(1)
|
|
$
|
3,000
|
|
|||
|
May 2017 ASR
|
August 2017
|
20,108
|
|
(2)
|
$
|
149.20
|
|
$
|
3,000
|
|
||
|
February 2017 ASR
|
May 2017
|
20,949
|
|
$
|
143.20
|
|
$
|
3,000
|
|
|||
|
November 2016 ASR
|
February 2017
|
51,157
|
|
$
|
117.29
|
|
$
|
6,000
|
|
|||
|
August 2016 ASR
|
November 2016
|
26,850
|
|
$
|
111.73
|
|
$
|
3,000
|
|
|||
|
May 2016 ASR
|
August 2016
|
60,452
|
|
$
|
99.25
|
|
$
|
6,000
|
|
|||
|
November 2015 ASR
|
April 2016
|
29,122
|
|
$
|
103.02
|
|
$
|
3,000
|
|
|||
|
(1)
|
“Number of Shares” represents those shares delivered at the beginning of the purchase period and does not represent the final number of shares to be delivered under the ASR. The total number of shares ultimately delivered, and therefore the average repurchase price paid per share, will be determined at the end of the purchase period based on the volume-weighted average price of the Company’s common stock during that period. The August 2017 ASR purchase period will end in
November 2017
.
|
|
(2)
|
Includes
15.6 million
shares delivered and retired at the beginning of the purchase period, which began in the third quarter of 2017, and
4.5 million
shares delivered and retired at the end of the purchase period, which concluded in the fourth quarter of 2017.
|
Additionally, the Company repurchased shares of its common stock in the open market, which were retired upon repurchase, during the periods presented as follows:
|
Number of
Shares
(in thousands)
|
Average
Repurchase
Price Per Share
|
Amount
(in millions)
|
||||||||
|
2017:
|
||||||||||
|
Fourth quarter
|
29,073
|
|
$
|
154.78
|
|
$
|
4,500
|
|
||
|
Third quarter
|
30,356
|
|
$
|
148.24
|
|
4,500
|
|
|||
|
Second quarter
|
31,070
|
|
$
|
128.74
|
|
4,001
|
|
|||
|
First quarter
|
44,333
|
|
$
|
112.78
|
|
5,000
|
|
|||
|
Total open market common stock repurchases
|
134,832
|
|
$
|
18,001
|
|
|||||
|
2016:
|
||||||||||
|
Fourth quarter
|
28,579
|
|
$
|
104.97
|
|
$
|
3,000
|
|
||
|
Third quarter
|
41,238
|
|
$
|
97.00
|
|
4,000
|
|
|||
|
Second quarter
|
71,766
|
|
$
|
97.54
|
|
7,000
|
|
|||
|
First quarter
|
25,984
|
|
$
|
115.45
|
|
3,000
|
|
|||
|
Total open market common stock repurchases
|
167,567
|
|
$
|
17,000
|
|
|||||
Comprehensive income consists of two components, net income and OCI. OCI refers to revenue, expenses, and gains and losses that under GAAP are recorded as an element of shareholders’ equity but are excluded from net income. The Company’s OCI consists of foreign currency translation adjustments from those subsidiaries not using the U.S. dollar as their functional currency, net deferred gains and losses on certain derivative instruments accounted for as cash flow hedges and unrealized gains and losses on marketable securities classified as available-for-sale.
Apple Inc. | 2017 Form 10-K |
61
The following table shows the pre-tax amounts reclassified from AOCI into the Consolidated Statements of Operations, and the associated financial statement line item, for
2017
and
2016
(in millions):
|
Comprehensive Income Components
|
Financial Statement Line Item
|
2017
|
2016
|
|||||||
|
Unrealized (gains)/losses on derivative instruments:
|
||||||||||
|
Foreign exchange contracts
|
Revenue
|
$
|
(662
|
)
|
$
|
(865
|
)
|
|||
|
Cost of sales
|
(654
|
)
|
(130
|
)
|
||||||
|
Other income/(expense), net
|
(638
|
)
|
111
|
|
||||||
|
Interest rate contracts
|
Other income/(expense), net
|
2
|
|
12
|
|
|||||
|
(1,952
|
)
|
(872
|
)
|
|||||||
|
Unrealized (gains)/losses on marketable securities
|
Other income/(expense), net
|
(99
|
)
|
87
|
|
|||||
|
Total amounts reclassified from AOCI
|
$
|
(2,051
|
)
|
$
|
(785
|
)
|
||||
The following table shows the changes in AOCI by component for
2017
and
2016
(in millions):
|
Cumulative Foreign
Currency Translation
|
Unrealized Gains/Losses
on Derivative Instruments
|
Unrealized Gains/Losses
on Marketable Securities
|
Total
|
||||||||||||
|
Balances as of September 26, 2015
|
$
|
(653
|
)
|
$
|
772
|
|
$
|
(464
|
)
|
$
|
(345
|
)
|
|||
|
Other comprehensive income/(loss) before reclassifications
|
67
|
|
14
|
|
2,445
|
|
2,526
|
|
|||||||
|
Amounts reclassified from AOCI
|
—
|
|
(872
|
)
|
87
|
|
(785
|
)
|
|||||||
|
Tax effect
|
8
|
|
124
|
|
(894
|
)
|
(762
|
)
|
|||||||
|
Other comprehensive income/(loss)
|
75
|
|
|
(734
|
)
|
|
1,638
|
|
|
979
|
|
||||
|
Balances as of September 24, 2016
|
(578
|
)
|
38
|
|
1,174
|
|
634
|
|
|||||||
|
Other comprehensive income/(loss) before reclassifications
|
301
|
|
1,793
|
|
(1,207
|
)
|
887
|
|
|||||||
|
Amounts reclassified from AOCI
|
—
|
|
(1,952
|
)
|
(99
|
)
|
(2,051
|
)
|
|||||||
|
Tax effect
|
(77
|
)
|
(3
|
)
|
460
|
|
380
|
|
|||||||
|
Other comprehensive income/(loss)
|
224
|
|
|
(162
|
)
|
|
(846
|
)
|
|
(784
|
)
|
||||
|
Balances as of September 30, 2017
|
$
|
(354
|
)
|
|
$
|
(124
|
)
|
|
$
|
328
|
|
|
$
|
(150
|
)
|
2014 Employee Stock Plan
In the second quarter of 2014, shareholders approved the 2014 Employee Stock Plan (the “2014 Plan”) and terminated the Company’s authority to grant new awards under the 2003 Employee Stock Plan (the “2003 Plan”). The 2014 Plan provides for broad-based equity grants to employees, including executive officers, and permits the granting of RSUs, stock grants, performance-based awards, stock options and stock appreciation rights, as well as cash bonus awards. RSUs granted under the 2014 Plan generally vest over
four years
, based on continued employment, and are settled upon vesting in shares of the Company’s common stock on a
one
-for-one basis. Each share issued with respect to RSUs granted under the 2014 Plan reduces the number of shares available for grant under the plan by
two
shares. RSUs canceled and shares withheld to satisfy tax withholding obligations increase the number of shares available for grant under the 2014 Plan utilizing a factor of
two
times the number of RSUs canceled or shares withheld. Currently, all RSUs granted under the 2014 Plan have dividend equivalent rights (“DERs”), which entitle holders of RSUs to the same dividend value per share as holders of common stock. DERs are subject to the same vesting and other terms and conditions as the corresponding unvested RSUs. DERs are accumulated and paid when the underlying shares vest. Upon approval of the 2014 Plan, the Company reserved
385 million
shares plus the number of shares remaining that were reserved but not issued under the 2003 Plan. Shares subject to outstanding awards under the 2003 Plan that expire, are canceled or otherwise terminate, or are withheld to satisfy tax withholding obligations with respect to RSUs, will also be available for awards under the 2014 Plan. As of
September 30, 2017
, approximately
327.9 million
shares were reserved for future issuance under the 2014 Plan.
Apple Inc. | 2017 Form 10-K |
62
2003 Employee Stock Plan
The 2003 Plan is a shareholder approved plan that provided for broad-based equity grants to employees, including executive officers. The 2003 Plan permitted the granting of incentive stock options, nonstatutory stock options, RSUs, stock appreciation rights, stock purchase rights and performance-based awards. Options granted under the 2003 Plan generally expire
seven
to
ten years
after the grant date and generally become exercisable over a period of
four years
, based on continued employment, with either annual, semi-annual or quarterly vesting. RSUs granted under the 2003 Plan generally vest over
two
to
four years
, based on continued employment and are settled upon vesting in shares of the Company’s common stock on a
one
-for-one basis. All RSUs, other than RSUs held by the Chief Executive Officer, granted under the 2003 Plan have DERs. DERs are subject to the same vesting and other terms and conditions as the corresponding unvested RSUs. DERs are accumulated and paid when the underlying shares vest. In the second quarter of 2014, the Company terminated the authority to grant new awards under the 2003 Plan.
1997 Director Stock Plan
The 1997 Director Stock Plan (the “Director Plan”) is a shareholder approved plan that (i) permits the Company to grant awards of RSUs or stock options to the Company’s non-employee directors, (ii) provides for automatic initial grants of RSUs upon a non-employee director joining the Board of Directors and automatic annual grants of RSUs at each annual meeting of shareholders, and (iii) permits the Board of Directors to prospectively change the relative mixture of stock options and RSUs for the initial and annual award grants and the methodology for determining the number of shares of the Company’s common stock subject to these grants without shareholder approval. Each share issued with respect to RSUs granted under the Director Plan reduces the number of shares available for grant under the plan by
two
shares. The Director Plan expires
November 9, 2019
. All RSUs granted under the Director Plan are entitled to DERs. DERs are subject to the same vesting and other terms and conditions as the corresponding unvested RSUs. DERs are accumulated and paid when the underlying shares vest. As of
September 30, 2017
, approximately
1.1 million
shares were reserved for future issuance under the Director Plan.
Rule 10b5-1 Trading Plans
During the three months ended
September 30, 2017
, Section 16 officers Angela Ahrendts, Timothy D. Cook, Luca Maestri, Daniel Riccio and Philip Schiller had equity trading plans in place in accordance with Rule 10b5-1(c)(1) under the Exchange Act. An equity trading plan is a written document that pre-establishes the amounts, prices and dates (or formula for determining the amounts, prices and dates) of future purchases or sales of the Company’s stock, including shares acquired pursuant to the Company’s employee and director equity plans.
Employee Stock Purchase Plan
The Employee Stock Purchase Plan (the “Purchase Plan”) is a shareholder approved plan under which substantially all employees may purchase the Company’s common stock through payroll deductions at a price equal to
85%
of the lower of the fair market values of the stock as of the beginning or the end of
six
-month offering periods. An employee’s payroll deductions under the Purchase Plan are limited to
10%
of the employee’s compensation and employees may not purchase more than
$25,000
of stock during any calendar year. As of
September 30, 2017
, approximately
41.5 million
shares were reserved for future issuance under the Purchase Plan.
401(k) Plan
The Company’s 401(k) Plan is a deferred salary arrangement under Section 401(k) of the Internal Revenue Code. Under the 401(k) Plan, participating U.S. employees may defer a portion of their pre-tax earnings, up to the IRS annual contribution limit (
$18,000
for calendar year 2017). The Company matches
50%
to
100%
of each employee’s contributions, depending on length of service, up to a maximum
6%
of the employee’s eligible earnings.
Apple Inc. | 2017 Form 10-K |
63
Restricted Stock Units
A summary of the Company’s RSU activity and related information for
2017
,
2016
and
2015
, is as follows:
|
Number of
RSUs
(in thousands)
|
Weighted-Average
Grant Date Fair
Value Per Share
|
Aggregate Fair Value
(in millions)
|
||||||||
|
Balance as of September 27, 2014
|
103,822
|
|
$
|
70.98
|
|
|||||
|
RSUs granted
|
45,587
|
|
$
|
105.51
|
|
|||||
|
RSUs vested
|
(41,684
|
)
|
$
|
71.32
|
|
|||||
|
RSUs canceled
|
(6,258
|
)
|
$
|
80.34
|
|
|||||
|
Balance as of September 26, 2015
|
101,467
|
|
$
|
85.77
|
|
|||||
|
RSUs granted
|
49,468
|
|
$
|
109.28
|
|
|||||
|
RSUs vested
|
(46,313
|
)
|
$
|
84.44
|
|
|||||
|
RSUs canceled
|
(5,533
|
)
|
$
|
96.48
|
|
|||||
|
Balance as of September 24, 2016
|
99,089
|
|
$
|
97.54
|
|
|||||
|
RSUs granted
|
50,112
|
|
$
|
121.65
|
|
|||||
|
RSUs vested
|
(45,735
|
)
|
$
|
95.48
|
|
|||||
|
RSUs canceled
|
(5,895
|
)
|
$
|
106.87
|
|
|||||
|
Balance as of September 30, 2017
|
97,571
|
|
$
|
110.33
|
|
$
|
15,038
|
|
||
The fair value as of the respective vesting dates of RSUs was
$6.1 billion
,
$5.1 billion
and
$4.8 billion
for
2017
,
2016
and
2015
, respectively. The majority of RSUs that vested in
2017
,
2016
and
2015
were net share settled such that the Company withheld shares with value equivalent to the employees’ minimum statutory obligation for the applicable income and other employment taxes, and remitted the cash to the appropriate taxing authorities. The total shares withheld were approximately
15.4 million
,
15.9 million
and
14.1 million
for
2017
,
2016
and
2015
, respectively, and were based on the value of the RSUs on their respective vesting dates as determined by the Company’s closing stock price. Total payments for the employees’ tax obligations to taxing authorities were
$2.0 billion
,
$1.7 billion
and
$1.6 billion
in
2017
,
2016
and
2015
, respectively, and are reflected as a financing activity within the Consolidated Statements of Cash Flows. These net share settlements had the effect of share repurchases by the Company as they reduced the number of shares that would have otherwise been issued as a result of the vesting and did not represent an expense to the Company.
Share-based Compensation
The following table shows a summary of the share-based compensation expense included in the Consolidated Statements of Operations for
2017
,
2016
and
2015
(in millions):
|
2017
|
2016
|
2015
|
|||||||||
|
Cost of sales
|
$
|
877
|
|
$
|
769
|
|
$
|
575
|
|
||
|
Research and development
|
2,299
|
|
1,889
|
|
1,536
|
|
|||||
|
Selling, general and administrative
|
1,664
|
|
1,552
|
|
1,475
|
|
|||||
|
Total share-based compensation expense
|
$
|
4,840
|
|
|
$
|
4,210
|
|
|
$
|
3,586
|
|
The income tax benefit related to share-based compensation expense was
$1.6 billion
,
$1.4 billion
and
$1.2 billion
for
2017
,
2016
and
2015
, respectively. As of
September 30, 2017
, the total unrecognized compensation cost related to outstanding RSUs, restricted stock and stock options was
$8.1 billion
, which the Company expects to recognize over a weighted-average period of
2.5 years
.
Accrued Warranty and Indemnification
The following table shows changes in the Company’s accrued warranties and related costs for
2017
,
2016
and
2015
(in millions):
|
2017
|
2016
|
2015
|
|||||||||
|
Beginning accrued warranty and related costs
|
$
|
3,702
|
|
$
|
4,780
|
|
$
|
4,159
|
|
||
|
Cost of warranty claims
|
(4,322
|
)
|
(4,663
|
)
|
(4,401
|
)
|
|||||
|
Accruals for product warranty
|
4,454
|
|
3,585
|
|
5,022
|
|
|||||
|
Ending accrued warranty and related costs
|
$
|
3,834
|
|
|
$
|
3,702
|
|
|
$
|
4,780
|
|
Apple Inc. | 2017 Form 10-K |
64
Agreements entered into by the Company sometimes include indemnification provisions which may subject the Company to costs and damages in the event of a claim against an indemnified third party. In the opinion of management, there was not at least a reasonable possibility the Company may have incurred a material loss, or a material loss in excess of a recorded accrual, with respect to indemnification of third parties.
The Company offers an iPhone Upgrade Program, which is available to customers who purchase a qualifying iPhone in the U.S., the U.K. and mainland China. The iPhone Upgrade Program provides customers the right to trade in that iPhone for a specified amount when purchasing a new iPhone, provided certain conditions are met. The Company accounts for the trade-in right as a guarantee liability and recognizes arrangement revenue net of the fair value of such right, with subsequent changes to the guarantee liability recognized within revenue.
The Company has entered into indemnification agreements with its directors and executive officers. Under these agreements, the Company has agreed to indemnify such individuals to the fullest extent permitted by law against liabilities that arise by reason of their status as directors or officers of the Company and to advance expenses incurred by such individuals in connection with related legal proceedings. It is not possible to determine the maximum potential amount of payments the Company could be required to make under these agreements due to the limited history of prior indemnification claims and the unique facts and circumstances involved in each claim. While the Company maintains directors and officers liability insurance coverage, such insurance coverage may be insufficient to cover all losses or all types of claims that may arise.
Concentrations in the Available Sources of Supply of Materials and Product
Although most components essential to the Company’s business are generally available from multiple sources, a few components are currently obtained from single or limited sources. In addition, the Company competes for various components with other participants in the markets for mobile communication and media devices and personal computers. Therefore, many components used by the Company, including those that are available from multiple sources, are at times subject to industry-wide shortage and significant pricing fluctuations that could materially adversely affect the Company’s financial condition and operating results.
The Company uses some custom components that are not commonly used by its competitors, and new products introduced by the Company often utilize custom components available from only one source. When a component or product uses new technologies, initial capacity constraints may exist until the suppliers’ yields have matured or manufacturing capacity has increased. If the Company’s supply of components for a new or existing product were delayed or constrained, or if an outsourcing partner delayed shipments of completed products to the Company, the Company’s financial condition and operating results could be materially adversely affected. The Company’s business and financial performance could also be materially adversely affected depending on the time required to obtain sufficient quantities from the original source, or to identify and obtain sufficient quantities from an alternative source. Continued availability of these components at acceptable prices, or at all, may be affected if those suppliers decide to concentrate on the production of common components instead of components customized to meet the Company’s requirements.
The Company has entered into agreements for the supply of many components; however, there can be no guarantee that the Company will be able to extend or renew these agreements on similar terms, or at all. Therefore, the Company remains subject to significant risks of supply shortages and price increases that could materially adversely affect its financial condition and operating results.
Substantially all of the Company’s hardware products are manufactured by outsourcing partners that are located primarily in Asia, with some Mac computers manufactured in the U.S. and Ireland. A significant concentration of this manufacturing is currently performed by a small number of outsourcing partners, often in single locations. Certain of these outsourcing partners are the sole-sourced suppliers of components and manufacturers for many of the Company’s products. Although the Company works closely with its outsourcing partners on manufacturing schedules, the Company’s operating results could be adversely affected if its outsourcing partners were unable to meet their production commitments. The Company’s manufacturing purchase obligations typically cover its requirements for periods up to
150 days
.
Other Off-Balance Sheet Commitments
Operating Leases
The Company leases various equipment and facilities, including retail space, under noncancelable operating lease arrangements. The Company does not currently utilize any other off-balance sheet financing arrangements. As of
September 30, 2017
, the Company’s total future minimum lease payments under noncancelable operating leases were
$9.5 billion
. The Company’s retail store and other facility leases typically have original terms not exceeding
10 years
and generally contain multi-year renewal options.
Apple Inc. | 2017 Form 10-K |
65
Rent expense under all operating leases, including both cancelable and noncancelable leases, was
$1.1 billion
,
$939 million
and
$794 million
in
2017
,
2016
and
2015
, respectively. Future minimum lease payments under noncancelable operating leases having initial or remaining terms in excess of one year as of
September 30, 2017
, are as follows (in millions):
|
2018
|
$
|
1,223
|
|
|
2019
|
1,187
|
|
|
|
2020
|
1,108
|
|
|
|
2021
|
1,033
|
|
|
|
2022
|
871
|
|
|
|
Thereafter
|
4,123
|
|
|
|
Total
|
$
|
9,545
|
|
Unconditional Purchase Obligations
The Company has entered into certain off-balance sheet arrangements which require the future purchase of goods or services (“Unconditional Purchase Obligations”). The Company’s Unconditional Purchase Obligations primarily consist of payments for supplier arrangements, internet and telecommunication services and intellectual property licenses. Future payments under noncancelable Unconditional Purchase Obligations having a remaining term in excess of one year as of
September 30, 2017
, are as follows (in millions):
|
2018
|
$
|
1,798
|
|
|
2019
|
2,675
|
|
|
|
2020
|
1,626
|
|
|
|
2021
|
1,296
|
|
|
|
2022
|
1,268
|
|
|
|
Thereafter
|
14
|
|
|
|
Total
|
$
|
8,677
|
|
Contingencies
The Company is subject to various legal proceedings and claims that have arisen in the ordinary course of business and that have not been fully adjudicated, as further discussed in Part I, Item 1A of this Form 10-K under the heading “Risk Factors” and in Part I, Item 3 of this Form 10-K under the heading “Legal Proceedings.” In the opinion of management, there was not at least a reasonable possibility the Company may have incurred a material loss, or a material loss in excess of a recorded accrual, with respect to loss contingencies for asserted legal and other claims. However, the outcome of litigation is inherently uncertain. Therefore, although management considers the likelihood of such an outcome to be remote, if one or more of these legal matters were resolved against the Company in a reporting period for amounts in excess of management’s expectations, the Company’s consolidated financial statements for that reporting period could be materially adversely affected.
Apple Inc. v. Samsung Electronics Co., Ltd., et al.
On August 24, 2012, a jury returned a verdict awarding the Company
$1.05 billion
in its lawsuit against Samsung Electronics Co., Ltd. and affiliated parties in the United States District Court, Northern District of California, San Jose Division. On March 6, 2014, the District Court entered final judgment in favor of the Company in the amount of approximately
$930 million
. On May 18, 2015, the U.S. Court of Appeals for the Federal Circuit affirmed in part, and reversed in part, the decision of the District Court. As a result, the Court of Appeals ordered entry of final judgment on damages in the amount of approximately
$548 million
, with the District Court to determine supplemental damages and interest, as well as damages owed for products subject to the reversal in part. Samsung paid
$548 million
to the Company in December 2015, which was included in net sales in the Consolidated Statement of Operations. On December 6, 2016, the U.S. Supreme Court remanded the case to the U.S. Court of Appeals for the Federal Circuit for further proceedings related to the
$548 million
in damages. On February 7, 2017, the U.S. Court of Appeals for the Federal Circuit remanded the case to the District Court to determine what additional proceedings, if any, are needed. On October 22, 2017, on remand from the U.S. Supreme Court, the District Court ordered a new trial on damages.
Apple Inc. | 2017 Form 10-K |
66
The Company reports segment information based on the “management” approach. The management approach designates the internal reporting used by management for making decisions and assessing performance as the source of the Company’s reportable segments.
The Company manages its business primarily on a geographic basis. The Company’s reportable segments consist of the Americas, Europe, Greater China, Japan and Rest of Asia Pacific. Americas includes both North and South America. Europe includes European countries, as well as India, the Middle East and Africa. Greater China includes China, Hong Kong and Taiwan. Rest of Asia Pacific includes Australia and those Asian countries not included in the Company’s other reportable segments. Although the reportable segments provide similar hardware and software products and similar services, each one is managed separately to better align with the location of the Company’s customers and distribution partners and the unique market dynamics of each geographic region. The accounting policies of the various segments are the same as those described in Note 1, “Summary of Significant Accounting Policies.”
The Company evaluates the performance of its reportable segments based on net sales and operating income. Net sales for geographic segments are generally based on the location of customers and sales through the Company’s retail stores located in those geographic locations. Operating income for each segment includes net sales to third parties, related cost of sales and operating expenses directly attributable to the segment. Advertising expenses are generally included in the geographic segment in which the expenditures are incurred. Operating income for each segment excludes other income and expense and certain expenses managed outside the reportable segments. Costs excluded from segment operating income include various corporate expenses such as R&D, corporate marketing expenses, certain share-based compensation expenses, income taxes, various nonrecurring charges and other separately managed general and administrative costs. The Company does not include intercompany transfers between segments for management reporting purposes.
The following table shows information by reportable segment for
2017
,
2016
and
2015
(in millions):
|
2017
|
2016
|
2015
|
|||||||||
|
Americas:
|
|||||||||||
|
Net sales
|
$
|
96,600
|
|
$
|
86,613
|
|
$
|
93,864
|
|
||
|
Operating income
|
$
|
30,684
|
|
$
|
28,172
|
|
$
|
31,186
|
|
||
|
Europe:
|
|||||||||||
|
Net sales
|
$
|
54,938
|
|
$
|
49,952
|
|
$
|
50,337
|
|
||
|
Operating income
|
$
|
16,514
|
|
$
|
15,348
|
|
$
|
16,527
|
|
||
|
Greater China:
|
|||||||||||
|
Net sales
|
$
|
44,764
|
|
$
|
48,492
|
|
$
|
58,715
|
|
||
|
Operating income
|
$
|
17,032
|
|
$
|
18,835
|
|
$
|
23,002
|
|
||
|
Japan:
|
|||||||||||
|
Net sales
|
$
|
17,733
|
|
$
|
16,928
|
|
$
|
15,706
|
|
||
|
Operating income
|
$
|
8,097
|
|
$
|
7,165
|
|
$
|
7,617
|
|
||
|
Rest of Asia Pacific:
|
|||||||||||
|
Net sales
|
$
|
15,199
|
|
$
|
13,654
|
|
$
|
15,093
|
|
||
|
Operating income
|
$
|
5,304
|
|
$
|
4,781
|
|
$
|
5,518
|
|
||
A reconciliation of the Company’s segment operating income to the Consolidated Statements of Operations for
2017
,
2016
and
2015
is as follows (in millions):
|
2017
|
2016
|
2015
|
|||||||||
|
Segment operating income
|
$
|
77,631
|
|
$
|
74,301
|
|
$
|
83,850
|
|
||
|
Research and development expense
|
(11,581
|
)
|
(10,045
|
)
|
(8,067
|
)
|
|||||
|
Other corporate expenses, net
|
(4,706
|
)
|
(4,232
|
)
|
(4,553
|
)
|
|||||
|
Total operating income
|
$
|
61,344
|
|
$
|
60,024
|
|
$
|
71,230
|
|
||
Apple Inc. | 2017 Form 10-K |
67
The U.S. and China were the only countries that accounted for more than 10% of the Company’s net sales in 2017, 2016 and 2015. There was no single customer that accounted for more than 10% of net sales in 2017, 2016 and 2015. Net sales for
2017
,
2016
and
2015
and long-lived assets as of
September 30, 2017
and
September 24, 2016
were as follows (in millions):
|
2017
|
2016
|
2015
|
|||||||||
|
Net sales:
|
|||||||||||
|
U.S.
|
$
|
84,339
|
|
$
|
75,667
|
|
$
|
81,732
|
|
||
|
China
(1)
|
44,764
|
|
48,492
|
|
58,715
|
|
|||||
|
Other countries
|
100,131
|
|
91,480
|
|
93,268
|
|
|||||
|
Total net sales
|
$
|
229,234
|
|
|
$
|
215,639
|
|
|
$
|
233,715
|
|
|
2017
|
2016
|
||||||
|
Long-lived assets:
|
|||||||
|
U.S.
|
$
|
20,637
|
|
$
|
16,364
|
|
|
|
China
(1)
|
10,211
|
|
7,875
|
|
|||
|
Other countries
|
2,935
|
|
2,771
|
|
|||
|
Total long-lived assets
|
$
|
33,783
|
|
$
|
27,010
|
|
|
|
(1)
|
China includes Hong Kong and Taiwan. Long-lived assets located in China consist primarily of product tooling and manufacturing process equipment and assets related to retail stores and related infrastructure.
|
Net sales by product for
2017
,
2016
and
2015
were as follows (in millions):
|
2017
|
2016
|
2015
|
|||||||||
|
iPhone
(1)
|
$
|
141,319
|
|
$
|
136,700
|
|
$
|
155,041
|
|
||
|
iPad
(1)
|
19,222
|
|
20,628
|
|
23,227
|
|
|||||
|
Mac
(1)
|
25,850
|
|
22,831
|
|
25,471
|
|
|||||
|
Services
(2)
|
29,980
|
|
24,348
|
|
19,909
|
|
|||||
|
Other Products
(1)(3)
|
12,863
|
|
11,132
|
|
10,067
|
|
|||||
|
Total net sales
|
$
|
229,234
|
|
|
$
|
215,639
|
|
|
$
|
233,715
|
|
|
(1)
|
Includes deferrals and amortization of related software upgrade rights and non-software services.
|
|
(2)
|
Includes revenue from Digital Content and Services, AppleCare, Apple Pay, licensing and other services. Services net sales in the fourth quarter of 2017 included a favorable one-time adjustment of
$640 million
due to a change in estimate based on the availability of additional supporting information.
|
|
(3)
|
Includes sales of Apple TV, Apple Watch, Beats products, iPod touch and Apple-branded and third-party accessories.
|
The following tables show a summary of the Company’s quarterly financial information for each of the four quarters of
2017
and
2016
(in millions, except per share amounts):
|
Fourth Quarter
|
Third Quarter
|
Second Quarter
|
First Quarter
|
||||||||||||
|
2017:
|
|||||||||||||||
|
Net sales
|
$
|
52,579
|
|
$
|
45,408
|
|
$
|
52,896
|
|
$
|
78,351
|
|
|||
|
Gross margin
|
$
|
19,931
|
|
$
|
17,488
|
|
$
|
20,591
|
|
$
|
30,176
|
|
|||
|
Net income
|
$
|
10,714
|
|
$
|
8,717
|
|
$
|
11,029
|
|
$
|
17,891
|
|
|||
|
Earnings per share
(1)
:
|
|||||||||||||||
|
Basic
|
$
|
2.08
|
|
$
|
1.68
|
|
$
|
2.11
|
|
$
|
3.38
|
|
|||
|
Diluted
|
$
|
2.07
|
|
$
|
1.67
|
|
$
|
2.10
|
|
$
|
3.36
|
|
|||
Apple Inc. | 2017 Form 10-K |
68
|
Fourth Quarter
|
Third Quarter
|
Second Quarter
|
First Quarter
|
||||||||||||
|
2016:
|
|||||||||||||||
|
Net sales
|
$
|
46,852
|
|
$
|
42,358
|
|
$
|
50,557
|
|
$
|
75,872
|
|
|||
|
Gross margin
|
$
|
17,813
|
|
$
|
16,106
|
|
$
|
19,921
|
|
$
|
30,423
|
|
|||
|
Net income
|
$
|
9,014
|
|
$
|
7,796
|
|
$
|
10,516
|
|
$
|
18,361
|
|
|||
|
Earnings per share
(1)
:
|
|||||||||||||||
|
Basic
|
$
|
1.68
|
|
$
|
1.43
|
|
$
|
1.91
|
|
$
|
3.30
|
|
|||
|
Diluted
|
$
|
1.67
|
|
$
|
1.42
|
|
$
|
1.90
|
|
$
|
3.28
|
|
|||
|
(1)
|
Basic and diluted earnings per share are computed independently for each of the quarters presented. Therefore, the sum of quarterly basic and diluted per share information may not equal annual basic and diluted earnings per share.
|
Apple Inc. | 2017 Form 10-K |
69
Report of Ernst & Young LLP, Independent Registered Public Accounting Firm
The Board of Directors and Shareholders of Apple Inc.
We have audited the accompanying consolidated balance sheets of Apple Inc. as of
September 30, 2017
and
September 24, 2016
, and the related consolidated statements of operations, comprehensive income, shareholders’ equity and cash flows for each of the three years in the period ended
September 30, 2017
. These financial statements are the responsibility of the Company’s management. Our responsibility is to express an opinion on these financial statements based on our audits.
We conducted our audits in accordance with the standards of the Public Company Accounting Oversight Board (United States). Those standards require that we plan and perform the audit to obtain reasonable assurance about whether the financial statements are free of material misstatement. An audit includes examining, on a test basis, evidence supporting the amounts and disclosures in the financial statements. An audit also includes assessing the accounting principles used and significant estimates made by management, as well as evaluating the overall financial statement presentation. We believe that our audits provide a reasonable basis for our opinion.
In our opinion, the financial statements referred to above present fairly, in all material respects, the consolidated financial position of Apple Inc. at
September 30, 2017
and
September 24, 2016
, and the consolidated results of its operations and its cash flows for each of the three years in the period ended
September 30, 2017
, in conformity with U.S. generally accepted accounting principles.
We also have audited, in accordance with the standards of the Public Company Accounting Oversight Board (United States), Apple Inc.’s internal control over financial reporting as of
September 30, 2017
, based on criteria established in
Internal Control – Integrated Framework
issued by the Committee of Sponsoring Organizations of the Treadway Commission (2013 framework) and our report dated
November 3, 2017
expressed an unqualified opinion thereon.
|
/s/ Ernst & Young LLP
|
||
San Jose, California
November 3, 2017
Apple Inc. | 2017 Form 10-K |
70
Report of Ernst & Young LLP, Independent Registered Public Accounting Firm
The Board of Directors and Shareholders of Apple Inc.
We have audited Apple Inc.’s internal control over financial reporting as of
September 30, 2017
, based on criteria established in
Internal Control – Integrated Framework
issued by the Committee of Sponsoring Organizations of the Treadway Commission (2013 framework) (“the COSO criteria”). Apple Inc.’s management is responsible for maintaining effective internal control over financial reporting, and for its assessment of the effectiveness of internal control over financial reporting included in the accompanying Management’s Annual Report on Internal Control Over Financial Reporting. Our responsibility is to express an opinion on the Company’s internal control over financial reporting based on our audit.
We conducted our audit in accordance with the standards of the Public Company Accounting Oversight Board (United States). Those standards require that we plan and perform the audit to obtain reasonable assurance about whether effective internal control over financial reporting was maintained in all material respects. Our audit included obtaining an understanding of internal control over financial reporting, assessing the risk that a material weakness exists, testing and evaluating the design and operating effectiveness of internal control based on the assessed risk, and performing such other procedures as we considered necessary in the circumstances. We believe that our audit provides a reasonable basis for our opinion.
A company’s internal control over financial reporting is a process designed to provide reasonable assurance regarding the reliability of financial reporting and the preparation of financial statements for external purposes in accordance with generally accepted accounting principles. A company’s internal control over financial reporting includes those policies and procedures that (1) pertain to the maintenance of records that, in reasonable detail, accurately and fairly reflect the transactions and dispositions of the assets of the company; (2) provide reasonable assurance that transactions are recorded as necessary to permit preparation of financial statements in accordance with generally accepted accounting principles, and that receipts and expenditures of the company are being made only in accordance with authorizations of management and directors of the company; and (3) provide reasonable assurance regarding prevention or timely detection of unauthorized acquisition, use, or disposition of the company’s assets that could have a material effect on the financial statements.
Because of its inherent limitations, internal control over financial reporting may not prevent or detect misstatements. Also, projections of any evaluation of effectiveness to future periods are subject to the risk that controls may become inadequate because of changes in conditions, or that the degree of compliance with the policies or procedures may deteriorate.
In our opinion, Apple Inc. maintained, in all material respects, effective internal control over financial reporting as of
September 30, 2017
, based on the COSO criteria.
We also have audited, in accordance with the standards of the Public Company Accounting Oversight Board (United States), the
2017
consolidated financial statements of Apple Inc. and our report dated
November 3, 2017
expressed an unqualified opinion thereon.
|
/s/ Ernst & Young LLP
|
||
San Jose, California
November 3, 2017
Apple Inc. | 2017 Form 10-K |
71
|
Item 9.
|
Changes in and Disagreements with Accountants on Accounting and Financial Disclosure
|
None.
|
Item 9A.
|
Controls and Procedures
|
Evaluation of Disclosure Controls and Procedures
Based on an evaluation under the supervision and with the participation of the Company’s management, the Company’s principal executive officer and principal financial officer have concluded that the Company’s disclosure controls and procedures as defined in Rules 13a-15(e) and 15d-15(e) under the Exchange Act were effective as of
September 30, 2017
to provide reasonable assurance that information required to be disclosed by the Company in reports that it files or submits under the Exchange Act is (i) recorded, processed, summarized and reported within the time periods specified in the SEC rules and forms and (ii) accumulated and communicated to the Company’s management, including its principal executive officer and principal financial officer, as appropriate to allow timely decisions regarding required disclosure.
Inherent Limitations Over Internal Controls
The Company’s internal control over financial reporting is designed to provide reasonable assurance regarding the reliability of financial reporting and the preparation of financial statements for external purposes in accordance with U.S. generally accepted accounting principles (“GAAP”). The Company’s internal control over financial reporting includes those policies and procedures that:
|
(i)
|
pertain to the maintenance of records that, in reasonable detail, accurately and fairly reflect the transactions and dispositions of the Company’s assets;
|
|
(ii)
|
provide reasonable assurance that transactions are recorded as necessary to permit preparation of financial statements in accordance with GAAP, and that the Company’s receipts and expenditures are being made only in accordance with authorizations of the Company’s management and directors; and
|
|
(iii)
|
provide reasonable assurance regarding prevention or timely detection of unauthorized acquisition, use, or disposition of the Company’s assets that could have a material effect on the financial statements.
|
Management, including the Company’s Chief Executive Officer and Chief Financial Officer, does not expect that the Company’s internal controls will prevent or detect all errors and all fraud. A control system, no matter how well designed and operated, can provide only reasonable, not absolute, assurance that the objectives of the control system are met. Further, the design of a control system must reflect the fact that there are resource constraints, and the benefits of controls must be considered relative to their costs. Because of the inherent limitations in all control systems, no evaluation of internal controls can provide absolute assurance that all control issues and instances of fraud, if any, have been detected. Also, any evaluation of the effectiveness of controls in future periods are subject to the risk that those internal controls may become inadequate because of changes in business conditions, or that the degree of compliance with the policies or procedures may deteriorate.
Management’s Annual Report on Internal Control Over Financial Reporting
The Company’s management is responsible for establishing and maintaining adequate internal control over financial reporting (as defined in Rule 13a-15(f) under the Exchange Act). Management conducted an assessment of the effectiveness of the Company’s internal control over financial reporting based on the criteria set forth in Internal Control – Integrated Framework issued by the Committee of Sponsoring Organizations of the Treadway Commission (2013 framework). Based on the Company’s assessment, management has concluded that its internal control over financial reporting was effective as of
September 30, 2017
to provide reasonable assurance regarding the reliability of financial reporting and the preparation of financial statements in accordance with GAAP. The Company’s independent registered public accounting firm, Ernst & Young LLP, has issued an audit report on the Company’s internal control over financial reporting, which appears in Part II, Item 8 of this Form 10-K.
Changes in Internal Control Over Financial Reporting
There were no changes in the Company’s internal control over financial reporting during the fourth quarter of
2017
, which were identified in connection with management’s evaluation required by paragraph (d) of Rules 13a-15 and 15d-15 under the Exchange Act, that have materially affected, or are reasonably likely to materially affect, the Company’s internal control over financial reporting.
|
Item 9B.
|
Other Information
|
Not applicable.
Apple Inc. | 2017 Form 10-K |
72
|
Item 10.
|
Directors, Executive Officers and Corporate Governance
|
The information required by this Item is set forth under the headings “Corporate Governance,” “Directors,” “Executive Officers” and “Other Information—Security Ownership of Certain Beneficial Owners and Management” in the Company’s
2018
Proxy Statement to be filed with the SEC within 120 days after
September 30, 2017
in connection with the solicitation of proxies for the Company’s
2018
annual meeting of shareholders and is incorporated herein by reference.
The Company has a code of ethics, “Business Conduct: The way we do business worldwide,” that applies to all employees, including the Company’s principal executive officer, principal financial officer, and principal accounting officer, as well as to the members of the Board of Directors of the Company. The code is available at investor.apple.com/corporate-governance.cfm. The Company intends to disclose any changes in, or waivers from, this code by posting such information on the same website or by filing a Form 8-K, in each case to the extent such disclosure is required by rules of the SEC or Nasdaq.
|
Item 11.
|
Executive Compensation
|
The information required by this Item is set forth under the heading “Executive Compensation,” under the subheadings “Board Oversight of Risk Management” and “Compensation Committee Interlocks and Insider Participation” under the heading “Corporate Governance” and under the subheadings “Compensation of Directors” and “Director Compensation—
2017
” under the heading “Directors” in the Company’s
2018
Proxy Statement to be filed with the SEC within 120 days after
September 30, 2017
and is incorporated herein by reference.
|
Item 12.
|
Security Ownership of Certain Beneficial Owners and Management and Related Stockholder Matters
|
The information required by this Item is set forth under the headings “Other Information—Security Ownership of Certain Beneficial Owners and Management” and “Other Information—Equity Compensation Plan Information” in the Company’s
2018
Proxy Statement to be filed with the SEC within 120 days after
September 30, 2017
and is incorporated herein by reference.
|
Item 13.
|
Certain Relationships and Related Transactions, and Director Independence
|
The information required by this Item is set forth under the subheadings “Board Committees”, “Review, Approval, or Ratification of Transactions with Related Persons” and “Transactions with Related Persons” under the heading “Corporate Governance” in the Company’s
2018
Proxy Statement to be filed with the SEC within 120 days after
September 30, 2017
and is incorporated herein by reference.
|
Item 14.
|
Principal Accounting Fees and Services
|
The information required by this Item is set forth under the subheadings “Fees Paid to Auditors” and “Policy on Audit Committee Pre-Approval of Audit and Non-Audit Services Performed by the Independent Registered Public Accounting Firm” under the proposal “Ratification of Appointment of Independent Registered Public Accounting Firm” in the Company’s
2018
Proxy Statement to be filed with the SEC within 120 days after
September 30, 2017
and is incorporated herein by reference.
Apple Inc. | 2017 Form 10-K |
73
|
Item 15.
|
Exhibits, Financial Statement Schedules
|
|
(a)
|
Documents filed as part of this report
|
|
(1)
|
All financial statements
|
|
Index to Consolidated Financial Statements
|
Page
|
|
|
(2)
|
Financial Statement Schedules
|
All financial statement schedules have been omitted, since the required information is not applicable or is not present in amounts sufficient to require submission of the schedule, or because the information required is included in the consolidated financial statements and notes thereto included in this Form 10-K.
|
(3)
|
Exhibits required by Item 601 of Regulation S-K
(1)
|
|
Incorporated by Reference
|
||||||||
|
Exhibit Number
|
Exhibit Description
|
Form
|
Exhibit
|
Filing Date/
Period End Date
|
||||
|
3.1
|
8-K
|
3.1
|
6/6/14
|
|||||
|
3.2
|
8-K
|
3.2
|
12/15/16
|
|||||
|
4.1
|
10-Q
|
4.1
|
12/30/06
|
|||||
|
4.2
|
S-3
|
4.1
|
4/29/13
|
|||||
|
4.3
|
8-K
|
4.1
|
5/3/13
|
|||||
|
4.4
|
8-K
|
4.1
|
5/6/14
|
|||||
|
4.5
|
8-K
|
4.1
|
11/10/14
|
|||||
|
4.6
|
8-K
|
4.1
|
2/9/15
|
|||||
|
4.7
|
8-K
|
4.1
|
5/13/15
|
|||||
|
4.8
|
8-K
|
4.1
|
6/10/15
|
|||||
Apple Inc. | 2017 Form 10-K |
74
|
Incorporated by Reference
|
||||||||
|
Exhibit Number
|
Exhibit Description
|
Form
|
Exhibit
|
Filing Date/
Period End Date
|
||||
|
4.9
|
8-K
|
4.1
|
7/31/15
|
|||||
|
4.10
|
8-K
|
4.1
|
9/17/15
|
|||||
|
4.11
|
8-K
|
4.1
|
2/23/16
|
|||||
|
4.12
|
8-K
|
4.1
|
3/24/16
|
|||||
|
4.13
|
8-K
|
4.1
|
6/22/16
|
|||||
|
4.14
|
8-K
|
4.1
|
8/4/16
|
|||||
|
4.15
|
8-K
|
4.1
|
2/9/17
|
|||||
|
4.16
|
8-K
|
4.1
|
3/3/17
|
|||||
|
4.17
|
8-K
|
4.1
|
5/11/17
|
|||||
|
4.18
|
8-K
|
4.1
|
5/24/17
|
|||||
|
4.19
|
8-K
|
4.1
|
6/20/17
|
|||||
|
4.20
|
8-K
|
4.1
|
8/18/17
|
|||||
|
4.21
|
8-K
|
4.1
|
9/12/17
|
|||||
|
10.1*
|
8-K
|
10.1
|
3/13/15
|
|||||
|
10.2*
|
10-Q
|
10.2
|
6/27/09
|
|||||
|
10.3*
|
10-Q
|
10.3
|
12/28/13
|
|||||
|
10.4*
|
8-K
|
10.1
|
3/1/10
|
|||||
|
10.5*
|
10-Q
|
10.10
|
12/25/10
|
|||||
|
10.6*
|
10-Q
|
10.8
|
3/31/12
|
|||||
|
10.7*
|
10-Q
|
10.8
|
6/30/12
|
|||||
|
10.8*, **
|
||||||||
|
10.9*
|
8-K
|
10.2
|
3/5/14
|
|||||
|
10.10*
|
8-K
|
10.3
|
3/5/14
|
|||||
|
10.11*
|
10-K
|
10.11
|
9/27/14
|
|||||
Apple Inc. | 2017 Form 10-K |
75
|
Incorporated by Reference
|
||||||||
|
Exhibit Number
|
Exhibit Description
|
Form
|
Exhibit
|
Filing Date/
Period End Date
|
||||
|
10.12*
|
10-K
|
10.12
|
9/27/14
|
|||||
|
10.13*
|
10-K
|
10.13
|
9/27/14
|
|||||
|
10.14*
|
10-Q
|
10.14
|
12/27/14
|
|||||
|
10.15*
|
10-Q
|
10.15
|
12/26/15
|
|||||
|
10.16*
|
10-Q
|
10.16
|
3/26/16
|
|||||
|
10.17*
|
10-Q
|
10.17
|
3/26/16
|
|||||
|
10.18*
|
10-K
|
10.18
|
9/24/16
|
|||||
|
10.19*
|
10-K
|
10.19
|
9/24/16
|
|||||
|
10.20*, **
|
||||||||
|
10.21*, **
|
||||||||
|
12.1**
|
||||||||
|
21.1**
|
||||||||
|
23.1**
|
||||||||
|
24.1**
|
||||||||
|
31.1**
|
||||||||
|
31.2**
|
||||||||
|
32.1***
|
||||||||
|
101.INS**
|
XBRL Instance Document.
|
|||||||
|
101.SCH**
|
XBRL Taxonomy Extension Schema Document.
|
|||||||
|
101.CAL**
|
XBRL Taxonomy Extension Calculation Linkbase Document.
|
|||||||
|
101.DEF**
|
XBRL Taxonomy Extension Definition Linkbase Document.
|
|||||||
|
101.LAB**
|
XBRL Taxonomy Extension Label Linkbase Document.
|
|||||||
|
101.PRE**
|
XBRL Taxonomy Extension Presentation Linkbase Document.
|
|||||||
|
*
|
Indicates management contract or compensatory plan or arrangement.
|
|
**
|
Filed herewith.
|
|
***
|
Furnished herewith.
|
|
(1)
|
Certain instruments defining the rights of holders of long-term debt securities of the Registrant are omitted pursuant to Item 601(b)(4)(iii) of Regulation S-K. The Registrant hereby undertakes to furnish to the SEC, upon request, copies of any such instruments.
|
|
Item 16.
|
Form 10-K Summary
|
None.
Apple Inc. | 2017 Form 10-K |
76
SIGNATURES
Pursuant to the requirements of Section 13 or 15(d) of the Securities Exchange Act of 1934, the Registrant has duly caused this report to be signed on its behalf by the undersigned, thereunto duly authorized.
Date:
November 3, 2017
|
Apple Inc.
|
|||
|
By:
|
/s/ Luca Maestri
|
||
|
Luca Maestri
|
|||
|
Senior Vice President,
Chief Financial Officer
|
|||
Power of Attorney
KNOW ALL PERSONS BY THESE PRESENTS, that each person whose signature appears below constitutes and appoints Timothy D. Cook and Luca Maestri, jointly and severally, his or her attorneys-in-fact, each with the power of substitution, for him or her in any and all capacities, to sign any amendments to this Annual Report on Form 10-K, and to file the same, with exhibits thereto and other documents in connection therewith, with the Securities and Exchange Commission, hereby ratifying and confirming all that each of said attorneys-in-fact, or his substitute or substitutes, may do or cause to be done by virtue hereof.
Pursuant to the requirements of the Securities Exchange Act of 1934, this report has been signed below by the following persons on behalf of the Registrant and in the capacities and on the dates indicated:
|
Name
|
Title
|
Date
|
||
|
/s/ Timothy D. Cook
|
Chief Executive Officer and Director
(Principal Executive Officer)
|
November 3, 2017
|
||
|
TIMOTHY D. COOK
|
||||
|
/s/ Luca Maestri
|
Senior Vice President, Chief Financial Officer
(Principal Financial Officer)
|
November 3, 2017
|
||
|
LUCA MAESTRI
|
||||
|
/s/ Chris Kondo
|
Senior Director of Corporate Accounting
(Principal Accounting Officer)
|
November 3, 2017
|
||
|
CHRIS KONDO
|
||||
|
/s/ James A. Bell
|
Director
|
November 3, 2017
|
||
|
JAMES A. BELL
|
||||
|
/s/ Al Gore
|
Director
|
November 3, 2017
|
||
|
AL GORE
|
||||
|
/s/ Robert A. Iger
|
Director
|
November 3, 2017
|
||
|
ROBERT A. IGER
|
||||
|
/s/ Andrea Jung
|
Director
|
November 3, 2017
|
||
|
ANDREA JUNG
|
||||
|
/s/ Arthur D. Levinson
|
Director
|
November 3, 2017
|
||
|
ARTHUR D. LEVINSON
|
||||
|
/s/ Ronald D. Sugar
|
Director
|
November 3, 2017
|
||
|
RONALD D. SUGAR
|
||||
|
/s/ Susan L. Wagner
|
Director
|
November 3, 2017
|
||
|
SUSAN L. WAGNER
|
||||
Apple Inc. | 2017 Form 10-K |
77
TABLE OF CONTENTS
Part IItem 1. BusinessItem 1A. Risk FactorsItem 1B. Unresolved Staff CommentsItem 2. PropertiesItem 3. Legal ProceedingsItem 4. Mine Safety DisclosuresPart IIItem 5. Market For Registrant S Common Equity, Related Stockholder Matters and Issuer Purchases Of Equity SecuritiesItem 6. Selected Financial DataItem 7. Management S Discussion and Analysis Of Financial Condition and Results Of OperationsItem 7A. Quantitative and Qualitative Disclosures About Market RiskItem 8. Financial Statements and Supplementary DataNote 1 Summary Of Significant Accounting PoliciesNote 2 Financial InstrumentsNote 3 Consolidated Financial Statement DetailsNote 4 Acquired Intangible AssetsNote 5 Income TaxesNote 6 DebtNote 7 Shareholders EquityNote 8 Comprehensive IncomeNote 9 Benefit PlansNote 10 Commitments and ContingenciesNote 11 Segment Information and Geographic DataNote 12 Selected Quarterly Financial Information (unaudited)Item 9. Changes in and Disagreements with Accountants on Accounting and Financial DisclosureItem 9A. Controls and ProceduresItem 9B. Other InformationPart IIIItem 10. Directors, Executive Officers and Corporate GovernanceItem 11. Executive CompensationItem 12. Security Ownership Of Certain Beneficial Owners and Management and Related Stockholder MattersItem 13. Certain Relationships and Related Transactions, and Director IndependenceItem 14. Principal Accounting Fees and ServicesPart IVItem 15. Exhibits, Financial Statement SchedulesItem 16. Form 10-k Summary