ALLIANCEBERNSTEIN HOLDING L.P.
10-Ks and 10-Qs
|
|
|
|
|
UNITED STATES
SECURITIES AND EXCHANGE COMMISSION
WASHINGTON, D.C. 20549
FORM 10-K
|
T
|
ANNUAL REPORT PURSUANT TO SECTION 13 OR 15(d) OF THE SECURITIES EXCHANGE ACT OF 1934
|
For the Fiscal Year Ended December 31, 2010
OR
|
¨
|
TRANSITION REPORT PURSUANT TO SECTION 13 OR 15(d) OF THE SECURITIES EXCHANGE ACT OF 1934
|
For the transition period from to
Commission file number 001-09818
ALLIANCEBERNSTEIN HOLDING L.P.
(Exact name of registrant as specified in its charter)
|
Delaware
|
13-3434400
|
|
(State or other jurisdiction of incorporation or organization)
|
(I.R.S. Employer Identification No.)
|
|
|
|
|
1345 Avenue of the Americas, New York, N.Y.
|
10105
|
|
(Address of principal executive offices)
|
(Zip Code)
|
Registrant’s telephone number, including area code:
(212) 969-1000
Securities registered pursuant to Section 12(b) of the Act:
|
Title of Class
|
Name of each exchange on which registered
|
|
|
units representing assignments of beneficial ownership of limited partnership interests
|
New York Stock Exchange
|
Securities registered pursuant to Section 12(g) of the Act:
None
Indicate by check mark if the registrant is a well-known seasoned issuer, as defined in Rule 405 of the Securities Act. Yes
T
No
¨
Indicate by check mark if the registrant is not required to file reports pursuant to Section 13 or Section 15(d) of the Act. Yes
¨
No
T
Indicate by check mark whether the registrant (1) has filed all reports required to be filed by Section 13 or 15(d) of the Securities Exchange Act of 1934 during the preceding 12 months (or for such shorter period that the registrant was required to file such reports), and (2) has been subject to such filing requirements for the past 90 days. Yes
T
No
¨
Indicate by check mark whether the registrant has submitted electronically and posted on its corporate Web site, if any, every Interactive Data File required to be submitted and posted pursuant to Rule 405 of Regulation S-T (§232.405 of this chapter) during the preceding 12 months (or for such shorter period that the registrant was required to submit and post such files). Yes
T
No
o
Indicate by check mark if disclosure of delinquent filers pursuant to Item 405 of Regulation S-K (§229.405 of this chapter) is not contained herein, and will not be contained, to the best of registrant’s knowledge, in definitive proxy or information statements incorporated by reference in Part III of this Form 10-K or any amendment to this Form 10-K.
T
Indicate by check mark whether the registrant is a large accelerated filer, an accelerated filer, a non-accelerated filer or a smaller reporting company. See definitions of “accelerated filer”, “large accelerated filer” and “smaller reporting company” in Rule 12b-2 of the Exchange Act. (Check one):
|
Large accelerated filer
T
|
Accelerated filer
¨
|
Non-accelerated filer
¨
|
Smaller reporting company
¨
|
Indicate by check mark whether the registrant is a shell company (as defined in Rule 12b-2 of the Act). Yes
¨
No
T
The aggregate market value of the units representing assignments of beneficial ownership of limited partnership interests held by non-affiliates computed by reference to the price at which such units were last sold on the New York Stock Exchange as of June 30, 2010 was approximately $2.52 billion.
The number of units representing assignments of beneficial ownership of limited partnership interests outstanding as of December 31, 2010 was 105,086,799. (This figure includes 100,000 units of general partnership interest having economic interests equivalent to the economic interests of the units representing assignments of beneficial ownership of limited partnership interests.)
DOCUMENTS INCORPORATED BY REFERENCE
This Form 10-K does not incorporate any document by reference.
Table
of Contents
|
ii
|
||
|
Part I
|
||
|
Item 1.
|
1
|
|
|
1
|
||
|
4
|
||
|
4
|
||
|
5
|
||
|
5
|
||
|
6
|
||
|
14
|
||
|
15
|
||
|
15
|
||
|
15
|
||
|
16
|
||
|
17
|
||
|
18
|
||
|
Item 1A.
|
19
|
|
|
Item 1B.
|
26
|
|
|
Item 2.
|
27
|
|
|
Item 3.
|
28
|
|
|
Item 4.
|
29
|
|
|
Part II
|
||
|
Item 5.
|
30
|
|
|
Item 6.
|
32
|
|
|
32
|
||
|
33
|
||
|
Item 7.
|
34
|
|
|
34
|
||
|
36
|
||
|
38
|
||
|
Item 7A.
|
56
|
|
|
56
|
||
|
56
|
||
|
Item 8.
|
58
|
|
|
58
|
||
|
70
|
||
|
Item 9.
|
105
|
|
|
Item 9A.
|
106
|
|
|
Item 9B.
|
107
|
|
|
Part III
|
||
|
Item 10.
|
108
|
|
|
Item 11.
|
116
|
|
|
Item 12.
|
132
|
|
|
Item 13.
|
136
|
|
|
Item 14.
|
139
|
|
|
Part IV
|
||
|
Item 15.
|
140
|
|
|
142
|
Gloss
ary of Certain Defined Terms
“AllianceBernstein”
– AllianceBernstein L.P. (Delaware limited partnership formerly known as Alliance Capital Management L.P.,
“Alliance Capital”
), the operating partnership, and its subsidiaries and, where appropriate, its predecessors, Holding and ACMC, Inc. and their respective subsidiaries.
“AllianceBernstein Investments”
– AllianceBernstein Investments, Inc. (Delaware corporation), a wholly-owned subsidiary of AllianceBernstein that services retail clients and distributes company-sponsored mutual funds.
“AllianceBernstein Partnership Agreement”
– the Amended and Restated Agreement of Limited Partnership of AllianceBernstein, dated as of October 29, 1999 and as amended February 24, 2006.
“AllianceBernstein Units”
– units of limited partnership interest in AllianceBernstein.
“AUM”
– assets under management for clients.
“AXA”
– AXA (
société anonyme
organized under the laws of France), the holding company for an international group of insurance and related financial services companies engaged in the financial protection and wealth management businesses.
“AXA Equitable”
– AXA Equitable Life Insurance Company (New York stock life insurance company), an indirect wholly-owned subsidiary of AXA Financial, and its subsidiaries other than AllianceBernstein and its subsidiaries.
“AXA Financial”
– AXA Financial, Inc. (Delaware corporation), a wholly-owned subsidiary of AXA.
“Bernstein GWM”
– Bernstein Global Wealth Management, a unit of AllianceBernstein that services private clients.
“Bernstein Transaction”
– on October 2, 2000, AllianceBernstein’s acquisition of the business and assets of SCB Inc., formerly known as Sanford C. Bernstein Inc., and assumption of the liabilities of that business.
“Exchange Act”
– the Securities Exchange Act of 1934, as amended.
“ERISA”
– the Employee Retirement Income Security Act of 1974, as amended.
“General Partner”
– AllianceBernstein Corporation (Delaware corporation), the general partner of AllianceBernstein and Holding and a wholly-owned subsidiary of AXA Equitable, and, where appropriate, ACMC, Inc., its predecessor.
“Holding”
– AllianceBernstein Holding L.P. (Delaware limited partnership).
“Holding Partnership Agreement”
– the Amended and Restated Agreement of Limited Partnership of Holding, dated as of October 29, 1999 and as amended February 24, 2006.
“Holding Units”
– units representing assignments of beneficial ownership of limited partnership interests in Holding.
“Investment Advisers Act”
– the Investment Advisers Act of 1940, as amended.
“Investment Company Act”
– the Investment Company Act of 1940, as amended.
“NYSE”
– the New York Stock Exchange, Inc.
“Partnerships”
– AllianceBernstein and Holding together.
“SCB”
– SCB LLC, SCBL and Sanford C. Bernstein, a unit of AllianceBernstein Hong Kong Limited, together.
“SCB LLC”
– Sanford C. Bernstein & Co., LLC (Delaware limited liability company), a wholly-owned subsidiary of AllianceBernstein that provides Bernstein research services in the United States.
“SCBL”
– Sanford C. Bernstein Limited (U.K. company), a wholly-owned subsidiary of AllianceBernstein that provides Bernstein research services primarily in Europe.
“SEC”
– the United States Securities and Exchange Commission.
“Securities Act”
– the Securities Act of 1933, as amended.
|
Item
1.
|
Business
|
The words
“
we
”
and
“
our
”
in this Form 10-K refer collectively to Holding and AllianceBernstein, or to their officers and employees. Similarly, the words
“
company
”
and
“
firm
”
refer to both Holding and AllianceBernstein. Where the context requires distinguishing between Holding and AllianceBernstein, we identify which of them is being discussed. Cross-references are in italics.
We use
“
global
”
in this Form 10-K to refer to all nations, including the United States; we use
“
international
”
or
“
non-U.S.
”
to refer to nations other than the United States.
We use
“
emerging markets
”
in this Form 10-K to refer to countries considered to be developing countries by the international financial community and countries included in the Morgan Stanley Capital International (
“MSCI”
) emerging markets index. As of December 31, 2010, examples of such countries were Brazil, Chile, China, Columbia, Czech Republic, Egypt, Hungary, India, Indonesia, Israel, Malaysia, Mexico, Morocco, Peru, the Philippines, Poland, Russia, South Africa, South Korea, Taiwan, Thailand and Turkey.
We use the term “
hedge funds
” in this Form 10-K to refer to private investment partnerships we sponsor that utilize various alternative strategies such as leverage, short selling of securities, and utilizing forward contracts, currency options and other derivatives.
Gen
eral
Mission
Our firm’s mission is to be the most trusted investment firm in the world by placing our clients’ interests first and foremost, utilizing our research capabilities to have more knowledge than any other investment firm, and using and sharing knowledge better than our competitors to help our clients achieve financial peace of mind and investment success.
Clients
AllianceBernstein provides research, diversified investment management and related services globally to a broad range of clients, including:
|
|
•
|
institutional clients, including unaffiliated corporate and public employee pension funds, endowment funds, domestic and foreign institutions and governments, and various affiliates;
|
|
|
•
|
retail clients, including U.S. and offshore mutual funds, variable annuities, insurance products and sub-advisory relationships;
|
|
|
•
|
private clients, including high-net-worth individuals, trusts and estates, charitable foundations, partnerships, private and family corporations, and other entities; and
|
|
|
•
|
institutional investors seeking high-quality research, portfolio analysis and brokerage-related services, and issuers of publicly-traded securities seeking equity capital markets services.
|
We also provide distribution, shareholder servicing and administrative services to our sponsored mutual funds.
Research
Our high-quality, in-depth research is the foundation of our business. We believe that our global team of research professionals gives us a competitive advantage in achieving investment success for our clients.
Our research disciplines include fundamental research, quantitative research, economic research and currency forecasting. In addition, we have several specialized research initiatives, including research examining global strategic changes that can affect multiple industries and geographies.
Products and Services
We offer a broad range of investment products and services to our clients:
|
|
•
|
To our institutional clients, we offer separately-managed accounts, sub-advisory relationships, structured products, collective investment trusts, mutual funds, hedge funds and other investment vehicles (
“Institutional Services”
);
|
|
|
•
|
To our retail clients, we offer retail mutual funds sponsored by AllianceBernstein, our subsidiaries and our affiliated joint venture companies, sub-advisory services to mutual funds sponsored by third parties, separately-managed account programs sponsored by financial intermediaries worldwide (
“Separately-Managed Account Programs”
) and other investment vehicles (collectively,
“Retail Services”
);
|
|
|
•
|
To our private clients, we offer diversified investment management services through separately-managed accounts, hedge funds, mutual funds and other investment vehicles (
“Private Client Services”
); and
|
|
|
•
|
To institutional investors, we offer research, portfolio analysis and brokerage-related services, and, to issuers of publicly-traded securities, we offer equity capital markets services (
“Bernstein Research Services”
).
|
These services are provided by teams of investment professionals with significant expertise in their respective disciplines (
see “Employees” in this Item 1
). Our buy-side research analysts support our portfolio managers and, together, they oversee a number of different types of investment services within various vehicles (
discussed above
) and strategies (
discussed below
). Our sell-side research analysts provide the foundation for our Bernstein Research Services.
Our services include:
|
|
•
|
Value equities, generally targeting stocks that are out of favor and considered undervalued;
|
|
|
•
|
Growth equities, generally targeting stocks with under-appreciated growth potential;
|
|
|
•
|
Fixed income securities, including taxable and tax-exempt securities;
|
|
|
•
|
Blend strategies, combining style-pure investment components with systematic rebalancing;
|
|
|
•
|
Passive management, including both index and enhanced index strategies;
|
|
|
•
|
Alternative investments, including hedge funds, currency management strategies and private capital (
e.g.,
direct real estate investing); and
|
|
|
•
|
Asset allocation services, by which we offer strategies specifically-tailored for our clients (
e.g
., customized target-date fund retirement services for defined contribution (
“DC”
) plan sponsors and our Dynamic Asset Allocation service, which is designed to mitigate the effects of extreme market volatility on a portfolio in order to deliver more consistent returns).
|
Sub-advisory client mandates span our investment strategies, including growth, value, fixed income and blend. We serve as sub-adviser for retail mutual funds, insurance products, retirement platforms and institutional investment products.
We provide our services using various investment disciplines, including market capitalization (
e.g
., large-, mid- and small-cap equities), term (
e.g
., long-, intermediate- and short-duration debt securities), and geographic location (
e.g
., U.S., international, global and emerging markets), as well as local and regional disciplines in major markets around the world.
We market and distribute alternative investment products globally to high-net-worth clients and institutional investors. Alternative product AUM totaled $12.7 billion as of December 31, 2010, $11.0 billion of which was institutional AUM and $1.6 billion of which was private client AUM. In October 2010, we announced that we had acquired SunAmerica’s alternative investments group, a team that manages a portfolio of hedge fund and private equity fund investments. Additionally, in October 2010, we launched a real estate fund focused on opportunistic real estate investments. These initiatives have helped us expand our alternative investment capabilities.
In August 2008, we created an initiative called AllianceBernstein Defined Contribution Investments (
“ABDC”
) focused on expanding our firm’s capabilities in the DC market. ABDC seeks to provide the most effective DC investment solutions in the industry, as measured by product features, reliability, cost and flexibility, to meet specialized client needs by integrating research and investment design, product strategy, strategic partnerships (
e.g.,
record-keeper partnerships and operations collaboration), and client implementation and service. In November 2010, we introduced Secure Retirement Strategies
(
"SRS"
)
, a multi-manager target-date solution. SRS provides guaranteed lifetime retirement income backed by multiple insurers to participants of large DC plans.
As of December 31, 2010, our DC assets under management, which are distributed in all three of our buy-side distribution channels, totaled approximately $26 billion.
In April 2009, we were selected by the U.S. Treasury Department as one of only three firms to manage its portfolio of assets issued by banks and other institutions taking part in the Capital Purchase Program of the Troubled Assets Relief Program. In addition, we were selected by the U.S. Treasury Department as one of nine pre-qualified fund managers under the Public-Private Investment Program and, during the fourth quarter of 2009, we were one of five firms that closed an initial Public-Private Investment Fund of at least $500 million. As of December 31, 2010, we had raised the second most capital ($1.15 billion) of the nine fund managers chosen by the U.S. Treasury Department.
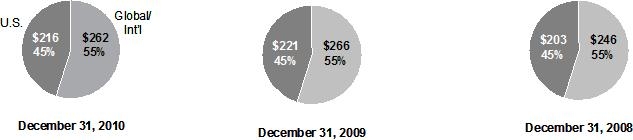
Global Reach
We serve clients in major global markets through operations in 44 cities in 23 countries. Our client base includes investors throughout the Americas, Europe, Asia, Africa and Australia. We utilize an integrated global investment platform that provides our clients with access to local (country-specific), international, and global research and investment strategies.
Assets under management by client domicile and investment service as of December 31, 2010, 2009 and 2008 were as follows:
By Client Domicile ($ in billions):
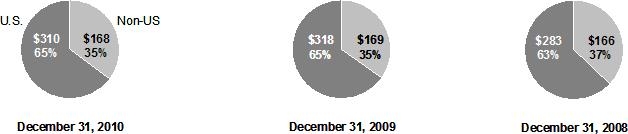
By Investment Service ($ in billions):
Revenues
We earn revenues primarily by charging fees for managing the investment assets of, and providing research to, our clients.
We generally calculate investment advisory fees as a percentage of the value of AUM at a specific date or as a percentage of the value of average AUM for the applicable billing period, with these percentages varying by type of investment service, size of account and total amount of assets we manage for a particular client. Accordingly, fee income generally increases or decreases as AUM increases or decreases. Increases in AUM generally result from market appreciation, positive investment performance for clients, net asset inflows from new and existing clients, or acquisitions. Similarly, decreases in AUM generally result from market depreciation, negative investment performance for clients, or net asset outflows due to client redemptions, account terminations or asset withdrawals.
We are eligible to earn performance-based fees on hedge fund services, as well as some long-only services provided to our institutional clients. In these situations, we charge a base advisory fee and are eligible to earn an additional performance-based fee or incentive allocation that is calculated as either a percentage of absolute investment results or a percentage of investment results in excess of a stated benchmark over a specified period of time. In addition, some performance-based fees include a high-watermark provision, which generally provides that if a client account underperforms relative to its performance target (whether absolute or relative to a specified benchmark), it must gain back such underperformance before we can collect future performance-based fees. Therefore, if we fail to achieve our performance target for a particular period, we will not earn a performance-based fee for that period and, for accounts with a high-watermark provision, our ability to earn future performance-based fees will be impaired. If the percentage of our AUM subject to performance-based fees grows, seasonality and volatility of revenue and earnings are likely to become more significant. Our performance-based fees in 2010, 2009 and 2008 were $20.5 million, $29.8 million and $13.4 million, respectively. For additional information about performance-based fees,
see “Risk Factors” in Item 1A
and
“Management’s Discussion and Analysis of Financial Condition and Results of Operations” in Item 7
.
We sometimes experience periods when the number of new accounts or the amount of AUM increases or decreases significantly. These changes result from wide-ranging factors, including conditions of financial markets, our investment performance for clients, the experience of the portfolio manager (both with our firm and in the industry generally), the client’s overall relationship with us, consultant recommendations, and changes in our clients’ investment preferences, risk tolerances and liquidity needs.
Our Bernstein Research Services generate revenues from clients to whom we provide research, portfolio analysis and brokerage-related services, primarily in the form of transaction fees calculated as either “cents per share” (generally in the U.S. market) or a percentage of the value of the securities traded (generally outside of the U.S.) for these clients. In 2009, we re-launched our equity capital markets business, through which we earn revenues from issuers of publicly-traded securities to which we provide these services in the form of underwriting fees, management fees and/or selling concessions, depending on our role in the offering.
Our revenues may fluctuate for a number of reasons;
see “Risk Factors” in Item 1A
and
“Management’s Discussion and Analysis of Financial Condition and Results of Operations” in Item 7
.
Employees
Our firm’s 4,256 full-time employees, who are located in 23 countries, include 292 research analysts, 159 portfolio managers, 47 traders and 20 professionals with other investment-related responsibilities. We have employed these professionals for an average period of approximately eight years, and their average investment experience is approximately 17 years. We consider our employee relations to be good.
Insti
tutional Services
We serve our institutional clients primarily through AllianceBernstein Institutional Investments (
“Institutional Investments”
), a unit of AllianceBernstein, and through other units in our international subsidiaries and one of our joint ventures (institutional relationships of less than $25 million are generally serviced by Bernstein GWM, our Private Client channel,
discussed below
). Institutional Services include actively managed equity accounts (including growth, value and blend accounts), fixed income accounts and balanced accounts (which combine equity and fixed income), as well as passive management of index and enhanced index accounts. These services are provided through separately-managed accounts, sub-advisory relationships, structured products, collective investment trusts, mutual funds and other investment vehicles. As of December 31, 2010, institutional AUM was $273 billion, or 57% of our company-wide AUM as compared to $291 billion, or 60%, as of December 31, 2009 and $278 billion, or 62%, as of December 31, 2008. For more information concerning institutional AUM, revenues and fees,
see “Assets Under Management, Revenues and Fees” in this Item 1
.
Our institutional client base includes unaffiliated corporate and public employee pension funds, endowment funds, domestic and foreign institutions and governments, and certain of our affiliates (AXA and its subsidiaries), as well as certain sub-advisory relationships with unaffiliated sponsors of various other investment products. We manage approximately 1,376 mandates for these clients, which are located in 43 countries. As of December 31, 2010, we managed employee benefit plan assets for
31 of the Fortune 100 companies, and we managed public pension fund assets for 35
states and/or municipalities in those states.
Retail
Services
We provide investment management and related services to a wide variety of individual retail investors, both in the U.S. and internationally, through retail mutual funds sponsored by our company, our subsidiaries and affiliated joint venture companies; mutual fund sub-advisory relationships; Separately-Managed Account Programs; and other investment vehicles (
“Retail Products and Services”
). As of December 31, 2010, retail AUM was $127 billion, or 27% of our company-wide AUM as compared to $121 billion, or 25%, as of December 31, 2009 and $102 billion, or 23%, as of December 31, 2008. For more information concerning retail AUM, revenues and fees,
see “Assets Under Management, Revenues and Fees” in this Item 1
.
Our Retail Products and Services are designed to provide disciplined, research-based investments that contribute to a well-diversified investment portfolio. We distribute these products and services through financial intermediaries, including broker-dealers, insurance sales representatives, banks, registered investment advisers and financial planners.
Our Retail Products and Services include open-end and closed-end funds that are either (i) registered as investment companies under the Investment Company Act (
“U.S. Funds”
), or (ii) not registered under the Investment Company Act and generally not offered to United States persons (
“Non-U.S. Funds”
and collectively with the U.S. Funds,
“AllianceBernstein Funds”
). They provide a broad range of investment options, including local and global growth equities, value equities, blend strategies and fixed income securities. They also include Separately-Managed Account Programs, which are sponsored by financial intermediaries and generally charge an all-inclusive fee covering investment management, trade execution, asset allocation, and custodial and administrative services. We also provide distribution, shareholder servicing, and administrative services for our Retail Products and Services.
Our U.S. Funds, which include retail funds, our variable products series fund (a component of an insurance product) and the retail share classes of the Sanford C. Bernstein Funds (principally Private Client Services products), currently offer 115 different portfolios to U.S. investors. As of December 31, 2010, retail U.S. Funds AUM was approximately $46 billion, or 36% of total retail AUM as compared to $45 billion, or 37%, as of December 31, 2009 and $39 billion, or 38%, as of December 31, 2008. Because of the way they are marketed and serviced, we report substantially all of the AUM in the Sanford C. Bernstein Funds
(
“SCB Funds”
)
, which totaled $30 billion as of December 31, 2010, as private client AUM.
Our Non-U.S. Funds are distributed internationally by local financial intermediaries to non-U.S. investors in most major international markets by means of distribution agreements. As of December 31, 2010, these funds consisted of 93 different portfolios and AUM in these funds was $28 billion. We also offer local-market funds that we distribute in Japan through financial intermediaries. As of December 31, 2010, retail AUM in these funds was $4 billion.
AllianceBernstein Investments serves as the principal underwriter and distributor of the U.S. Funds. AllianceBernstein Investments employs 134 sales representatives who devote their time exclusively to promoting the sale of U.S. Funds and certain other Retail Products and Services offered by financial intermediaries.
AllianceBernstein (Luxembourg) S.A. (
“AllianceBernstein Luxembourg”
), a Luxembourg management company and one of our wholly-owned subsidiaries, generally serves as the distributor for the Non-U.S. Funds.
We have an international sales force of 66 sales representatives who devote some or all of their time to promoting the sale of Non-U.S. Funds and other Retail Products and Services offered by financial intermediaries.
Privat
e Client Services
Through Bernstein GWM, we provide Private Client Services to high-net-worth individuals, trusts and estates, charitable foundations, partnerships, private and family corporations, and other entities by means of separately-managed accounts, hedge funds, mutual funds and other investment vehicles. As of December 31, 2010, private client AUM was $78 billion, or 16% of our company-wide AUM as compared to $75 billion, or 15%, as of December 31, 2009 and $69 billion, or 15%, as of December 31, 2008. For more information concerning private client AUM, revenues and fees,
see “Assets Under Management, Revenues and Fees” in this Item 1
.
Our Private Client Services are built on a sales effort that involves
approximately 300 financial advisors based in 18 cities in the U.S. and in London, England. These advisors do not manage money, but work with private clients and their tax, legal and other advisors to assist them in determining a suitable mix of U.S. and non-U.S. equity securities and fixed income investments. The diversified portfolio created for each client is intended to maximize after-tax investment returns, in light of the client’s individual investment goals, income requirements, risk tolerance, tax situation and other relevant factors. In creating these portfolios, we utilize our research reports, investment planning services, Dynamic Asset Allocation and the Wealth Management Group, which has in-depth knowledge of trust, estate and tax planning strategies.
Bernst
ein Research Services
Bernstein Research Services consist of fundamental research, quantitative services and brokerage-related services in equities and listed options provided to institutional investors such as pension fund, hedge fund and mutual fund managers, and other institutional investors. Brokerage-related services are provided by SCB LLC in the United States and SCBL primarily in Europe, with research services also provided by Sanford C. Bernstein, a unit of AllianceBernstein Hong Kong Limited (a wholly-owned subsidiary of AllianceBernstein,
“
AB Hong Kong
”
), in Asia. For more information concerning the revenues we derive from Bernstein Research Services,
see “Assets Under Management, Revenues and Fees” in this Item 1
.
We provide fundamental company and industry research along with disciplined research into securities valuation and factors affecting stock-price movements. Our analysts are consistently among the highest ranked research analysts in industry surveys conducted by third-party organizations.
Additionally, we provide equity capital markets services to issuers of publicly-traded securities, primarily in initial public offerings and follow-on offerings, acting as manager, syndicate member or selling group member.
Ass
ets Under Management, Revenues and Fees
The following tables summarize our AUM and revenues by distribution channel:
End of Period Assets Under Management
(1)
|
December 31,
|
% Change
|
|||||||||||||||||||
|
2010
|
2009
|
2008
|
2010-09 | 2009-08 | ||||||||||||||||
| (in millions) | ||||||||||||||||||||
|
Institutional Services
(2)
|
$ | 272,928 | $ | 291,233 | $ | 278,218 | (6.3 | )% | 4.7 | % | ||||||||||
|
Retail Services
|
127,045 | 120,697 | 101,643 | 5.3 | 18.7 | |||||||||||||||
|
Private Client Services
|
78,046 | 74,753 | 68,947 | 4.4 | 8.4 | |||||||||||||||
|
Total
|
$ | 478,019 | $ | 486,683 | $ | 448,808 | (1.8 | ) | 8.4 | |||||||||||
_____________
|
(1)
|
Excludes certain non-discretionary client relationships.
|
|
(2)
|
Previously reported preliminary assets under management for December 31, 2010 and prior periods have been adjusted by removing from our AUM an affiliated account for which we serve in an advisory capacity and do not have discretionary trading authority. This adjustment lowered previously reported AUM by $7.8 billion, $8.8 billion and $13.1 billion as of December 31, 2010, 2009 and 2008, respectively.
|
Average Assets Under Management
|
Years Ended December 31,
|
% Change
|
|||||||||||||||||||
|
2010
|
2009
|
2008
|
2010-09
|
2009-08
|
||||||||||||||||
|
(in millions)
|
||||||||||||||||||||
|
Institutions
(1)
|
$ | 277,109 | $ | 272,569 | $ | 415,480 | 1.7 | % | (34.4 | )% | ||||||||||
|
Retail
|
122,756 | 105,137 | 145,444 | 16.8 | (27.7 | ) | ||||||||||||||
|
Private Client
|
74,686 | 68,613 | 93,161 | 8.9 | (26.4 | ) | ||||||||||||||
|
Total
|
$ | 474,551 | $ | 446,319 | $ | 654,085 | 6.3 | (31.8 | ) | |||||||||||
_____________
|
(1)
|
Previously reported preliminary assets under management for December 31, 2010 and prior periods have been adjusted by removing from our AUM an affiliated account for which we serve in an advisory capacity and do not have discretionary trading authority.
|
Revenues
|
Years Ended December 31,
|
% Change
|
|||||||||||||||||||
|
2010
|
2009
|
2008
|
2010-09 | 2009-08 | ||||||||||||||||
| (in thousands) | ||||||||||||||||||||
|
Institutional Services
|
$ | 764,847 | $ | 811,164 | $ | 1,240,636 | (5.7 | )% | (34.6 | )% | ||||||||||
|
Retail Services
|
1,068,869 | 888,256 | 1,227,538 | 20.3 | (27.6 | ) | ||||||||||||||
|
Private Client Services
|
651,218 | 589,665 | 849,830 | 10.4 | (30.6 | ) | ||||||||||||||
|
Bernstein Research Services
|
430,521 | 434,605 | 471,716 | (0.9 | ) | (7.9 | ) | |||||||||||||
|
Other
(1)
|
36,650 | 187,600 | (239,037 | ) | (80.5 | ) | n/m | |||||||||||||
|
Total Revenues
|
2,952,105 | 2,911,290 | 3,550,683 | 1.4 | (18.0 | ) | ||||||||||||||
|
Less: Interest Expense
|
3,548 | 4,411 | 36,524 | (19.6 | ) | (87.9 | ) | |||||||||||||
|
Net Revenues
|
$ | 2,948,557 | $ | 2,906,879 | $ | 3,514,159 | 1.4 | (17.3 | ) | |||||||||||
|
(1)
|
Other revenues primarily consist of dividend and interest income and investment gains (losses). For additional information,
see “Management’s Discussion and Analysis of Financial Condition and Results of Operations” in Item 7
.
|
|
AXA and its subsidiaries, whose AUM consists primarily of fixed income investments, together constitute our largest client. Our affiliates represented approximately 22%, 20% and 18% of our company-wide AUM as of December 31, 2010, 2009 and 2008, respectively. We earned approximately 5% of our company-wide net revenues from our affiliates for each of 2010, 2009 and 2008. Affiliated AUM is included in our Institutions and Retail buy-side distribution channels.
|
Institutional Services
The following tables summarize our Institutional Services AUM and revenues:
Institutional Services Assets Under Management
(1)
(by Investment Service)
|
December 31,
|
% Change
|
|||||||||||||||||||
|
2010
|
2009
|
2008
|
2010-09 | 2009-08 | ||||||||||||||||
|
(in millions)
|
||||||||||||||||||||
|
Value Equity:
|
||||||||||||||||||||
|
U.S.
|
$ | 13,955 | $ | 19,028 | $ | 22,598 | (26.7 | )% | (15.8 | )% | ||||||||||
|
Global and International
|
74,668 | 88,758 | 84,787 | (15.9 | ) | 4.7 | ||||||||||||||
| 88,623 | 107,786 | 107,385 | (17.8 | ) | 0.4 | |||||||||||||||
|
Growth Equity:
|
||||||||||||||||||||
|
U.S.
|
10,921 | 18,124 | 16,075 | (39.7 | ) | 12.7 | ||||||||||||||
|
Global and International
|
22,507 | 34,762 | 38,034 | (35.3 | ) | (8.6 | ) | |||||||||||||
| 33,428 | 52,886 | 54,109 | (36.8 | ) | (2.3 | ) | ||||||||||||||
|
Fixed Income:
|
||||||||||||||||||||
|
U.S.
|
78,101 | 71,832 | 66,151 | 8.7 | 8.6 | |||||||||||||||
|
Global and International
|
44,766 | 41,083 | 37,900 | 9.0 | 8.4 | |||||||||||||||
| 122,867 | 112,915 | 104,051 | 8.8 | 8.5 | ||||||||||||||||
|
Other
(2)(3)
:
|
||||||||||||||||||||
|
U.S.
|
9,980 | 9,677 | 6,617 | 3.1 | 46.2 | |||||||||||||||
|
Global and International
|
18,030 | 7,969 | 6,056 | 126.3 | 31.6 | |||||||||||||||
| 28,010 | 17,646 | 12,673 | 58.7 | 39.2 | ||||||||||||||||
|
Total:
|
||||||||||||||||||||
|
U.S.
|
112,957 | 118,661 | 111,441 | (4.8 | ) | 6.5 | ||||||||||||||
|
Global and International
|
159,971 | 172,572 | 166,777 | (7.3 | ) | 3.5 | ||||||||||||||
|
Total
|
$ | 272,928 | $ | 291,233 | $ | 278,218 | (6.3 | ) | 4.7 | |||||||||||
|
Affiliated
|
$ | 74,672 | $ | 69,734 | $ | 60,653 | 7.1 | 15.0 | ||||||||||||
|
Non-affiliated
|
198,256 | 221,499 | 217,565 | (10.5 | ) | 1.8 | ||||||||||||||
|
Total
|
$ | 272,928 | $ | 291,233 | $ | 278,218 | (6.3 | ) | 4.7 | |||||||||||
_____________
|
(1)
|
Excludes certain non-discretionary client relationships.
|
|
(2)
|
Includes index, structured, asset allocation services and other non-actively managed AUM.
|
|
(3)
|
Previously reported preliminary assets under management for December 31, 2010 and prior periods have been adjusted by removing from our AUM an affiliated account for which we serve in an advisory capacity and do not have discretionary trading authority. This adjustment lowered previously reported AUM by $7.8 billion, $8.8 billion and $13.1 billion as of December 31, 2010, 2009 and 2008, respectively.
|
Revenues from Institutional Services
(by Investment Service)
|
Years Ended December 31,
|
% Change
|
|||||||||||||||||||
|
2010
|
2009
|
2008
|
2010-09 | 2009-08 | ||||||||||||||||
|
(in thousands)
|
||||||||||||||||||||
|
Investment Advisory and Services Fees:
|
||||||||||||||||||||
|
Value Equity:
|
||||||||||||||||||||
|
U.S.
|
$ | 47,126 | $ | 57,596 | $ | 108,921 | (18.2 | )% | (47.1 | )% | ||||||||||
|
Global and International
|
336,600 | 375,914 | 607,431 | (10.5 | ) | (38.1 | ) | |||||||||||||
| 383,726 | 433,510 | 716,352 | (11.5 | ) | (39.5 | ) | ||||||||||||||
|
Growth Equity:
|
||||||||||||||||||||
|
U.S.
|
46,510 | 51,017 | 70,119 | (8.8 | ) | (27.2 | ) | |||||||||||||
|
Global and International
|
119,300 | 150,612 | 276,676 | (20.8 | ) | (45.6 | ) | |||||||||||||
| 165,810 | 201,629 | 346,795 | (17.8 | ) | (41.9 | ) | ||||||||||||||
|
Fixed Income:
|
||||||||||||||||||||
|
U.S.
|
103,855 | 89,598 | 84,133 | 15.9 | 6.5 | |||||||||||||||
|
Global and International
|
94,434 | 73,316 | 77,640 | 28.8 | (5.6 | ) | ||||||||||||||
| 198,289 | 162,914 | 161,773 | 21.7 | 0.7 | ||||||||||||||||
|
Other
(1)
:
|
||||||||||||||||||||
|
U.S.
|
3,436 | 3,095 | 4,083 | 11.0 | (24.2 | ) | ||||||||||||||
|
Global and International
|
12,866 | 9,343 | 11,633 | 37.7 | (19.7 | ) | ||||||||||||||
| 16,302 | 12,438 | 15,716 | 31.1 | (20.9 | ) | |||||||||||||||
|
Total Investment Advisory and Services Fees:
|
||||||||||||||||||||
|
U.S.
|
200,927 | 201,306 | 267,256 | (0.2 | ) | (24.7 | ) | |||||||||||||
|
Global and International
|
563,200 | 609,185 | 973,380 | (7.5 | ) | (37.4 | ) | |||||||||||||
| 764,127 | 810,491 | 1,240,636 | (5.7 | ) | (34.7 | ) | ||||||||||||||
|
Shareholder Servicing Fees
(2)
|
720 | 673 | — | 7.0 | n/m | |||||||||||||||
|
Total
|
$ | 764,847 | $ | 811,164 | $ | 1,240,636 | (5.7 | ) | (34.6 | ) | ||||||||||
|
Affiliated
|
$ | 88,248 | $ | 85,598 | $ | 96,855 | 3.1 | (11.6 | ) | |||||||||||
|
Non-affiliated
|
676,599 | 725,566 | 1,143,781 | (6.7 | ) | (36.6 | ) | |||||||||||||
|
Total
|
$ | 764,847 | $ | 811,164 | $ | 1,240,636 | (5.7 | ) | (34.6 | ) | ||||||||||
_____________
|
(1)
|
Includes index, structured, asset allocation services and other non-actively managed AUM.
|
|
(2)
|
For a description of shareholder servicing fees,
see “Retail Services” below
.
|
As of December 31, 2010, 2009 and 2008, Institutional Services represented approximately 57%, 60% and 62%, respectively, of our company-wide AUM. The fees we earned from these services represented approximately 26%, 28% and 35% of our company-wide net revenues for 2010, 2009 and 2008, respectively.
AXA and its subsidiaries together constitute our largest institutional client. Their AUM accounted for approximately 27%, 24% and 22% of our total institutional AUM as of December 31, 2010, 2009 and 2008, respectively, and approximately 12%, 11% and 8% of our total institutional revenues for 2010, 2009 and 2008, respectively.
The institutional AUM we manage for our affiliates, along with our nine other largest institutional accounts, accounted for approximately 42% of our total institutional AUM as of December 31, 2010 and approximately 20% of our total institutional revenues for the year ended December 31, 2010. No single institutional client other than AXA and its subsidiaries accounted for more than approximately 1% of our company-wide net revenues for the year ended December 31, 2010.
We manage the assets of our institutional clients through written investment management agreements or other arrangements, all of which are generally terminable at any time or upon relatively short notice by either party. In general, our written investment management agreements may not be assigned without client consent.
We are compensated principally on the basis of investment advisory fees calculated as a percentage of AUM. The percentage we charge varies with the type of investment service, the size of the account and the total amount of assets we manage for a particular client.
We are eligible to earn performance-based fees on approximately 12% of institutional AUM, which are primarily invested in long-only equity and fixed income services. Performance-based fees provide for a relatively low asset-based fee plus an additional fee based on investment performance. For additional information about performance-based fees,
see “General—Revenues” in this Item 1
and “
Risk Factors
”
in Item 1A
.
Retail Services
The following tables summarize our Retail Services AUM and revenues:
Retail Services Assets Under Management
(by Investment Service)
|
December 31,
|
% Change
|
|||||||||||||||||||
|
2010
|
2009
|
2008
|
2010-09 | 2009-08 | ||||||||||||||||
|
(in millions)
|
||||||||||||||||||||
|
Value Equity:
|
||||||||||||||||||||
|
U.S.
|
$ | 10,772 | $ | 11,253 | $ | 12,086 | (4.3 | )% | (6.9 | )% | ||||||||||
|
Global and International
|
20,107 | 26,232 | 28,053 | (23.3 | ) | (6.5 | ) | |||||||||||||
| 30,879 | 37,485 | 40,139 | (17.6 | ) | (6.6 | ) | ||||||||||||||
|
Growth Equity:
|
||||||||||||||||||||
|
U.S.
|
9,789 | 9,552 | 8,494 | 2.5 | 12.5 | |||||||||||||||
|
Global and International
|
14,002 | 14,339 | 11,544 | (2.4 | ) | 24.2 | ||||||||||||||
| 23,791 | 23,891 | 20,038 | (0.4 | ) | 19.2 | |||||||||||||||
|
Fixed Income:
|
||||||||||||||||||||
|
U.S.
|
8,442 | 9,635 | 9,857 | (12.4 | ) | (2.3 | ) | |||||||||||||
|
Global and International
|
40,754 | 30,263 | 20,178 | 34.7 | 50.0 | |||||||||||||||
| 49,196 | 39,898 | 30,035 | 23.3 | 32.8 | ||||||||||||||||
|
Other
(1)
:
|
||||||||||||||||||||
|
U.S.
|
18,466 | 16,416 | 9,851 | 12.5 | 66.6 | |||||||||||||||
|
Global and International
|
4,713 | 3,007 | 1,580 | 56.7 | 90.3 | |||||||||||||||
| 23,179 | 19,423 | 11,431 | 19.3 | 69.9 | ||||||||||||||||
|
Total:
|
||||||||||||||||||||
|
U.S.
|
47,469 | 46,856 | 40,288 | 1.3 | 16.3 | |||||||||||||||
|
Global and International
|
79,576 | 73,841 | 61,355 | 7.8 | 20.4 | |||||||||||||||
|
Total
|
$ | 127,045 | $ | 120,697 | $ | 101,643 | 5.3 | 18.7 | ||||||||||||
|
Affiliated
|
$ | 29,841 | $ | 29,940 | $ | 21,804 | (0.3 | ) | 37.3 | |||||||||||
|
Non-affiliated
|
97,204 | 90,757 | 79,839 | 7.1 | 13.7 | |||||||||||||||
|
Total
|
$ | 127,045 | $ | 120,697 | $ | 101,643 | 5.3 | 18.7 | ||||||||||||
_____________
|
(1)
|
Includes index, structured, asset allocation services and other non-actively managed AUM.
|
Revenues from Retail Services
(by Investment Service)
|
Years Ended December 31,
|
% Change
|
|||||||||||||||||||
|
2010
|
2009
|
2008
|
2010-09 | 2009-08 | ||||||||||||||||
|
(in thousands)
|
||||||||||||||||||||
|
Investment Advisory and Services Fees:
|
||||||||||||||||||||
|
Value Equity:
|
||||||||||||||||||||
|
U.S.
|
$ | 45,862 | $ | 45,211 | $ | 88,394 | 1.4 | % | (48.9 | )% | ||||||||||
|
Global and International
|
112,252 | 121,514 | 216,561 | (7.6 | ) | (43.9 | ) | |||||||||||||
| 158,114 | 166,725 | 304,955 | (5.2 | ) | (45.3 | ) | ||||||||||||||
|
Growth Equity:
|
||||||||||||||||||||
|
U.S.
|
45,752 | 46,672 | 84,651 | (2.0 | ) | (44.9 | ) | |||||||||||||
|
Global and International
|
97,973 | 85,583 | 130,247 | 14.5 | (34.3 | ) | ||||||||||||||
| 143,725 | 132,255 | 214,898 | 8.7 | (38.5 | ) | |||||||||||||||
|
Fixed Income:
|
||||||||||||||||||||
|
U.S.
|
31,723 | 30,219 | 30,888 | 5.0 | (2.2 | ) | ||||||||||||||
|
Global and International
|
282,845 | 175,595 | 195,373 | 61.1 | (10.1 | ) | ||||||||||||||
| 314,568 | 205,814 | 226,261 | 52.8 | (9.0 | ) | |||||||||||||||
|
Other
(1)
:
|
||||||||||||||||||||
|
U.S.
|
11,672 | 8,972 | 3,702 | 30.1 | 142.4 | |||||||||||||||
|
Global and International
|
11,798 | 9,429 | 1,297 | 25.1 | 627.0 | |||||||||||||||
| 23,470 | 18,401 | 4,999 | 27.5 | 268.1 | ||||||||||||||||
|
Total Investment Advisory and Services Fees:
|
||||||||||||||||||||
|
U.S.
|
135,009 | 131,074 | 207,635 | 3.0 | (36.9 | ) | ||||||||||||||
|
Global and International
|
504,868 | 392,121 | 543,478 | 28.8 | (27.8 | ) | ||||||||||||||
| 639,877 | 523,195 | 751,113 | 22.3 | (30.3 | ) | |||||||||||||||
|
Distribution Revenues
(2)
|
336,204 | 275,372 | 376,372 | 22.1 | (26.8 | ) | ||||||||||||||
|
Shareholder Servicing Fees
(2)
|
92,788 | 89,689 | 100,053 | 3.5 | (10.4 | ) | ||||||||||||||
|
Total
|
$ | 1,068,869 | $ | 888,256 | $ | 1,227,538 | 20.3 | (27.6 | ) | |||||||||||
|
Affiliated
|
$ | 46,756 | $ | 45,584 | $ | 84,342 | 2.6 | (46.0 | ) | |||||||||||
|
Non-affiliated
|
1,022,113 | 842,672 | 1,143,196 | 21.3 | (26.3 | ) | ||||||||||||||
|
Total
|
$ | 1,068,869 | $ | 888,256 | $ | 1,227,538 | 20.3 | (27.6 | ) | |||||||||||
_____________
|
(1)
|
Includes index, structured, asset allocation services and other non-actively managed AUM.
|
|
(2)
|
For a description of distribution revenues and shareholder servicing fees,
see below
.
|
Investment advisory fees and distribution fees for our Retail Products and Services are generally charged as a percentage of average daily AUM. In the past, as certain of the U.S. Funds grew, we revised our fee schedules to provide lower incremental fees above certain asset levels. Fees paid by the U.S. Funds, EQ Advisors Trust (
“EQAT”
), AXA Enterprise Multimanager Funds Trust (
“AXA Enterprise Trust”
) and AXA Premier VIP Trust are reflected in the applicable investment management agreement, which generally must be approved annually by the boards of directors or trustees of those funds, including by a majority of the independent directors or trustees. Increases in these fees must be approved by fund shareholders; decreases need not be, including any decreases implemented by a fund’s directors or trustees. In general, each investment management agreement with the AllianceBernstein Funds, EQAT, AXA Enterprise Trust and AXA Premier VIP Trust provides for termination by either party
at any time upon 60 days’ notice.
Fees paid by Non-U.S. Funds are reflected in investment management agreements that continue until they are terminated. Increases in these fees generally must be approved by the relevant regulatory authority, depending on the domicile and structure of the fund, and Non-U.S. Fund shareholders must be given advance notice of any fee increases.
Revenues from Retail Services represented approximately 36%, 31% and 35% of our company-wide net revenues for the years ended December 31, 2010, 2009 and 2008, respectively.
Our Retail Products and Services include open-end mutual funds designed to fund benefits under variable annuity contracts and variable life insurance policies offered by unaffiliated life insurance companies (“Variable Product Series Fund”), and we sub-advise variable product mutual funds sponsored by affiliates. As of December 31, 2010, we managed or sub-advised approximately $35 billion of Variable Product Series Fund AUM.
The mutual funds we sub-advise for AXA and its subsidiaries together constitute our largest retail client. They accounted for approximately 23%, 25% and 21% of our total retail AUM as of December 31, 2010, 2009 and 2008, respectively, and approximately 4%, 5% and 7% of our total retail revenues for 2010, 2009 and 2008, respectively.
Our mutual fund distribution system (the
“System”
) includes a multi-class share structure that permits open-end AllianceBernstein Funds to offer investors various options for the purchase of mutual fund shares, including both front-end load shares and back-end load shares. For front-end load shares, AllianceBernstein Investments generally pays sales commissions to financial intermediaries distributing the funds from the front-end sales charge it receives from investors at the time of the sale. For back-end load shares, AllianceBernstein Investments pays sales commissions to financial intermediaries at the time of sale and also receives higher ongoing distribution services fees from the mutual funds. In addition, investors who redeem back-end load shares before the expiration of the minimum holding period (which ranges from one year to four years) pay a contingent deferred sales charge (
“CDSC”
) to AllianceBernstein Investments. We expect to recover sales commissions for back-end load shares over periods not exceeding five and one-half years through receipt of a CDSC and/or the higher ongoing distribution services fees we receive from holders of back-end load shares. Payments of sales commissions made to financial intermediaries in connection with the sale of back-end load shares under the System, net of CDSC received of $20.0 million, $18.7 million and $33.7 million, totaled approximately $33.4 million, $31.6 million and $9.1 million during 2010, 2009 and 2008, respectively. We have not offered back-end load shares to new investors in U.S. Funds since January 31, 2009.
The rules of the Financial Industry Regulatory Authority, Inc. (
“FINRA”
) effectively cap the aggregate sales charges that may be received from each open-end U.S. Fund by AllianceBernstein Investments at 6.25% of cumulative gross sales (plus interest at the prime rate plus 1% per annum).
Most open-end U.S. Funds have adopted a plan under Rule 12b-1 of the Investment Company Act that allows the fund to pay, out of assets of the fund, distribution and service fees for the distribution and sale of its shares (
“Rule 12b-1 Fees”
). The open-end AllianceBernstein Funds have entered into agreements with AllianceBernstein Investments under which they pay a distribution services fee to AllianceBernstein Investments. AllianceBernstein Investments has entered into selling and distribution agreements pursuant to which it pays sales commissions to the financial intermediaries that distribute our open-end U.S. Funds. These agreements are terminable by either party upon notice (generally 30 days) and do not obligate the financial intermediary to sell any specific amount of fund shares.
In addition to Rule 12b-1 Fees, AllianceBernstein Investments, at its own expense, currently provides additional payments under distribution services and educational support agreements to financial intermediaries that sell shares of our funds, a practice sometimes referred to as revenue sharing. Although the amount of payments made in any given year may vary, the total amount paid to a financial intermediary in connection with the sale of shares of U.S. Funds will generally not exceed the sum of (i) 0.25% of the current year’s fund sales by that firm, and (ii) 0.10% of average daily net assets attributable to that firm over the course of the year.
Financial intermediaries that provide accounting or record-keeping services with respect to their customers’ investments in AllianceBernstein Funds may receive specified payments from these funds or from affiliates of AllianceBernstein, including AllianceBernstein Investor Services, Inc. (one of our wholly-owned subsidiaries,
“AllianceBernstein Investor Services”
) and AllianceBernstein Investments.
During 2010, the 10 financial intermediaries responsible for the largest volume of sales of open-end AllianceBernstein Funds were responsible for 50% of such sales. AXA Advisors, LLC (
“AXA Advisors”
), a wholly-owned subsidiary of AXA Financial that utilizes members of AXA Equitable’s insurance sales force as its registered representatives, was responsible for approximately 2%, 2% and 4% of total sales of shares of open-end AllianceBernstein Funds in 2010, 2009 and 2008, respectively. AXA Advisors is under no obligation to sell a specific amount of AllianceBernstein Fund shares and also sells shares of mutual funds sponsored by other affiliates and unaffiliated organizations.
During 2010, Nomura Asset Management Co. Ltd., UBS AG and Citibank (or their respective subsidiaries) were responsible for approximately 12%, 6% and 5%, respectively, of our open-end mutual fund sales. None of these companies are under any obligation to sell a specific amount of AllianceBernstein Fund shares and each also sells shares of mutual funds that it sponsors and that are sponsored by unaffiliated organizations.
Based on industry sales data reported by the Investment Company Institute, our market share in the U.S. mutual fund industry was approximately 1% of total industry assets in the U.S. during 2010. The investment performance of the U.S. Funds is an important factor in the sale of their shares, but there are also other factors, including the level and quality of our shareholder services (
see below
) and the amounts and types of distribution assistance and administrative services payments we make to financial intermediaries, which we believe are competitive with others in the industry.
AllianceBernstein Investor Services, which operates in San Antonio, Texas, provides transfer agency and related services for each open-end U.S. Fund (except the SCB Funds) and provides shareholder servicing for each open-end U.S. Fund’s shareholder accounts (approximately 3.3 million accounts in total), for which it receives a monthly fee under servicing agreements with each open-end U.S. Fund based on the number and type of shareholder accounts serviced. Each servicing agreement must be approved annually by the relevant open-end U.S. Fund’s board of directors or trustees, including a majority of the independent directors or trustees, and may be terminated by either party without penalty upon 60 days’ notice.
AllianceBernstein Funds utilize our personnel to perform most legal, clerical and accounting services. Payments to us by the U.S. Funds and certain Non-U.S. Funds for these services, which approximate $6 million per year, must be specifically approved in advance by each fund’s board of directors or trustees.
A unit of AllianceBernstein Luxembourg (
“ABIS Lux”
) is the transfer agent for substantially all of the Non-U.S. Funds. ABIS Lux, based in Luxembourg and supported by operations in Singapore, Hong Kong and the United States, receives a monthly asset-based fee for its transfer agency services and a transaction-based fee under various services agreements with the Non-U.S. Funds. Each agreement may be terminated by either party upon 60 days’ notice.
Private Client Services
The following tables summarize Private Client Services AUM and revenues:
Private Client Services Assets Under Management
(by Investment Service)
|
December 31,
|
% Change
|
|||||||||||||||||||
|
2010
|
2009
|
2008
|
2010-09
|
2009-08
|
||||||||||||||||
| (in millions) | ||||||||||||||||||||
|
Value Equity:
|
||||||||||||||||||||
|
U.S.
|
$ | 13,082 | $ | 14,137 | $ | 13,254 | (7.5 | )% | 6.7 | % | ||||||||||
|
Global and International
|
11,714 | 11,751 | 11,627 | (0.3 | ) | 1.1 | ||||||||||||||
| 24,796 | 25,888 | 24,881 | (4.2 | ) | 4.0 | |||||||||||||||
|
Growth Equity:
|
||||||||||||||||||||
|
U.S.
|
9,626 | 10,384 | 8,425 | (7.3 | ) | 23.3 | ||||||||||||||
|
Global and International
|
7,492 | 6,941 | 5,709 | 7.9 | 21.6 | |||||||||||||||
| 17,118 | 17,325 | 14,134 | (1.2 | ) | 22.6 | |||||||||||||||
|
Fixed Income:
|
||||||||||||||||||||
|
U.S.
|
32,485 | 30,862 | 29,287 | 5.3 | 5.4 | |||||||||||||||
|
Global and International
|
1,658 | 621 | 606 | 167.0 | 2.5 | |||||||||||||||
| 34,143 | 31,483 | 29,893 | 8.4 | 5.3 | ||||||||||||||||
|
Other
(1)
:
|
||||||||||||||||||||
|
U.S.
|
236 | 15 | 21 | n/m | (28.6 | ) | ||||||||||||||
|
Global and International
|
1,753 | 42 | 18 | n/m | 133.3 | |||||||||||||||
| 1,989 | 57 | 39 | n/m | 46.2 | ||||||||||||||||
|
Total:
|
||||||||||||||||||||
|
U.S.
|
55,429 | 55,398 | 50,987 | 0.1 | 8.7 | |||||||||||||||
|
Global and International
|
22,617 | 19,355 | 17,960 | 16.9 | 7.8 | |||||||||||||||
|
Total
|
$ | 78,046 | $ | 74,753 | $ | 68,947 | 4.4 | 8.4 | ||||||||||||
_____________
|
(1)
|
Includes index, structured, asset allocation services and other non-actively managed AUM.
|
Revenues from Private Client Services
(by Investment Service)
|
Years Ended December 31,
|
% Change
|
|||||||||||||||||||
|
2010
|
2009
|
2008
|
2010-09
|
2009-08
|
||||||||||||||||
|
(in thousands)
|
||||||||||||||||||||
|
Investment Advisory and Services Fees:
|
||||||||||||||||||||
|
Value Equity:
|
||||||||||||||||||||
|
U.S.
|
$ | 143,591 | $ | 143,390 | $ | 232,662 | 0.1 | % | (38.4 | )% | ||||||||||
|
Global and International
|
116,254 | 113,908 | 191,805 | 2.1 | (40.6 | ) | ||||||||||||||
| 259,845 | 257,298 | 424,467 | 1.0 | (39.4 | ) | |||||||||||||||
|
Growth Equity:
|
||||||||||||||||||||
|
U.S.
|
114,081 | 106,131 | 159,622 | 7.5 | (33.5 | ) | ||||||||||||||
|
Global and International
|
79,651 | 68,693 | 106,358 | 16.0 | (35.4 | ) | ||||||||||||||
| 193,732 | 174,824 | 265,980 | 10.8 | (34.3 | ) | |||||||||||||||
|
Fixed Income:
|
||||||||||||||||||||
|
U.S.
|
177,310 | 152,205 | 154,936 | 16.5 | (1.8 | ) | ||||||||||||||
|
Global and International
|
7,141 | 2,126 | 2,336 | 235.9 | (9.0 | ) | ||||||||||||||
| 184,451 | 154,331 | 157,272 | 19.5 | (1.9 | ) | |||||||||||||||
|
Other
(1)
:
|
||||||||||||||||||||
|
U.S.
|
292 | 17 | 15 | n/m | 13.3 | |||||||||||||||
|
Global and International
|
9,368 | 176 | 43 | n/m | 309.3 | |||||||||||||||
| 9,660 | 193 | 58 | n/m | 232.8 | ||||||||||||||||
|
Total Investment Advisory and Services Fees:
|
||||||||||||||||||||
|
U.S.
|
435,274 | 401,743 | 547,235 | 8.3 | (26.6 | ) | ||||||||||||||
|
Global and International
|
212,414 | 184,903 | 300,542 | 14.9 | (38.5 | ) | ||||||||||||||
| 647,688 | 586,646 | 847,777 | 10.4 | (30.8 | ) | |||||||||||||||
|
Distribution Revenues
(2)
|
2,393 | 1,956 | 2,053 | 22.3 | (4.7 | ) | ||||||||||||||
|
Shareholder Servicing Fees
(2)
|
1,137 | 1,063 | — | 7.0 | n/m | |||||||||||||||
|
Total
|
$ | 651,218 | $ | 589,665 | $ | 849,830 | 10.4 | (30.6 | ) | |||||||||||
_____________
|
(1)
|
Includes index, structured, asset allocation services and other non-actively managed AUM.
|
|
(2)
|
For a description of distribution revenues and shareholder servicing fees,
see “Retail Services” above
.
|
|
Private client accounts generally are managed pursuant to a written investment advisory agreement among the client, AllianceBernstein and SCB LLC, which usually is terminable at any time or upon relatively short notice by any party. In general, these contracts may not be assigned without the consent of the client. We are compensated under these contracts by fees calculated as a percentage of AUM at a specific date or as a percentage of the value of average assets under management for the applicable billing period, with these fees varying based on the types of investment services and the size of the account. The aggregate fees we charge for managing hedge funds may be higher than the fees we charge for managing other assets in private client accounts because hedge fund fees include performance-based fees, incentive allocations or carried interests in addition to asset-based fees. We are eligible to earn performance-based fees on approximately 3% of private client AUM, substantially all of which is held in hedge funds.
|
Revenues from Private Client Services represented approximately 22%, 20% and 24% of our company-wide net revenues for the years ended December 31, 2010, 2009 and 2008, respectively.
Bernstein Research Services
The following table summarizes Bernstein Research Services revenues:
Revenues from Bernstein Research Services
|
Years Ended December 31,
|
% Change
|
|||||||||||||||||||
|
2010
|
2009
|
2008
|
2010-09
|
2009-08
|
||||||||||||||||
|
(in thousands)
|
||||||||||||||||||||
|
Bernstein Research Services
|
$ | 430,521 | $ | 434,605 | $ | 471,716 | (0.9 | )% | (7.9 | )% | ||||||||||
We earn revenues for providing investment research to, and executing brokerage transactions for, institutional clients. These clients compensate us principally by directing SCB LLC and SCBL to execute brokerage transactions on their behalf, for which we earn transaction charges. These services accounted for approximately 15%, 15% and 13% of our company-wide net revenues for the years ended December 31, 2010, 2009 and 2008, respectively.
Fee rates charged for brokerage transactions have declined significantly in recent years, but increases in transaction volume in both the U.S. and Europe have often offset these decreases. For additional information,
see “Risk Factors” in Item 1A and “Management’s Discussion and Analysis of Financial Condition and Results of Operations” in Item 7
.
We also earn revenues from the equity capital markets services we provide to issuers of publicly-traded securities. Depending on our role in a particular equity issuance, these revenues may take the form of underwriting fees, management fees and/or selling concessions.
Custod
y and Brokerage
Custody
SCB LLC acts as custodian for the majority of
AllianceBernstein’s private client AUM and some of AllianceBernstein’s institutional AUM. Other custodial arrangements are maintained by client-designated banks, trust companies, brokerage firms or custodians.
Brokerage
AllianceBernstein generally has the discretion to select the broker-dealers that execute securities transactions for client accounts. When selecting brokers, we are required to obtain “best execution”. Although there is no single statutory definition, SEC releases and other legal guidelines make clear that the duty to obtain best execution requires us to seek “the most advantageous terms reasonably available under the circumstances for a customer’s account”. In addition to commission rate, we take into account such factors as current market conditions, the broker’s financial strength, and the ability and willingness of the broker to commit capital by taking positions in order to execute transactions.
While we select brokers primarily on the basis of their execution capabilities, we may also take into consideration the quality and amount of research services a broker provides to us for the benefit of our clients. These research services, which are paid for with client commissions and which we purchase to augment our own research capabilities, are governed by Section 28(e) of the Exchange Act. We use broker-dealers that provide these services in consideration for commissions paid for the execution of client trades, subject at all times to our duty to seek best execution, and with respect to which we reasonably conclude, in good faith, that the value of the execution and other services we receive from the broker-dealer is reasonable in relation to the amount of commissions paid. The commissions charged by these full-service brokers are generally higher than those charged by electronic trading networks and other “low-touch” trading venues.
We regularly execute transactions for our private clients through SCB LLC or SCBL, our affiliated broker-dealers, because these clients have generally subscribed to an all-inclusive package of services that includes brokerage, custody and investment advice. We sometimes execute institutional client transactions through SCB LLC or SCBL. We do so only when our clients have consented to our use of affiliated broker-dealers or we are otherwise permitted to do so, and only when we can execute these transactions in accordance with applicable law (
i.e.
, our obligation to obtain best execution).
We may use third-party brokers to execute client transactions that also sell shares of AllianceBernstein Funds or third party funds we sub-advise; however, we prohibit our investment professionals who place trades from considering these other relationships or the sale of fund shares as a factor when selecting brokers.
Our Brokerage Allocation Committee has principal oversight responsibility for evaluating equity-related brokerage matters, including how to use research services we receive in a manner that is in the best interests of our clients and consistent with current regulatory requirements.
Servi
ce Marks
We have registered a number of service marks with the U.S. Patent and Trademark Office and various foreign trademark offices, including the combination of an “AB” design logo with the mark “AllianceBernstein”.
In connection with the Bernstein Transaction, we acquired all of the rights and title in, and to, the Bernstein service marks, including the mark “Bernstein”.
Reg
ulation
Virtually all aspects of our business are subject to various federal and state laws and regulations, rules of various securities regulators and exchanges, and laws in the foreign countries in which our subsidiaries and joint ventures conduct business. These laws and regulations are primarily intended to benefit clients and fund shareholders and generally grant supervisory agencies broad administrative powers, including the power to limit or restrict the carrying on of business for failure to comply with such laws and regulations. Possible sanctions that may be imposed include the suspension of individual employees, limitations on engaging in business for specific periods, the revocation of the registration as an investment adviser or broker-dealer, censures and fines.
AllianceBernstein, Holding, the General Partner, SCB LLC, AllianceBernstein Global Derivatives Corporation (a wholly-owned subsidiary of AllianceBernstein,
“Global Derivatives”
) and Alliance Corporate Finance Group Incorporated (a wholly-owned subsidiary of AllianceBernstein) are investment advisers registered under the Investment Advisers Act. SCB LLC and Global Derivatives are also registered with the Commodity Futures Trading Commission as commodity pool operators.
Each U.S. Fund is registered with the SEC under the Investment Company Act and the shares of most U.S. Funds are qualified for sale in all states in the United States and the District of Columbia, except for U.S. Funds offered only to residents of a particular state. AllianceBernstein Investor Services is registered with the SEC as a transfer and servicing agent.
SCB LLC and AllianceBernstein Investments are registered with the SEC as broker-dealers, and both are members of FINRA. SCB LLC is also a member of the NYSE and other principal U.S. exchanges. SCBL is a broker regulated by the Financial Services Authority of the United Kingdom (
“FSA”
) and is a member of the London Stock Exchange. Sanford C. Bernstein, a unit of AB Hong Kong, is regulated by the Hong Kong Securities and Futures Commission.
AllianceBernstein Trust Company, LLC (
“ABTC”
), a wholly-owned subsidiary of AllianceBernstein, is a non-depository trust company chartered under New Hampshire law as a limited liability company. ABTC is authorized to act as trustee, executor, transfer agent, assignee, receiver, custodian, investment adviser and in any other capacity authorized for a trust company under New Hampshire law. As a state-chartered trust company exercising fiduciary powers, ABTC must comply with New Hampshire laws applicable to trust company operations (such as New Hampshire Revised Statutes Annotated Part 392), certain federal laws (such as ERISA and sections of the Bank Secrecy Act), and New Hampshire banking laws. The primary fiduciary activities of ABTC consist of serving as trustee to a series of collective investment funds, the investors of which currently are defined benefit and defined contribution retirement plans.
Holding Units are listed on the NYSE and trade publicly under the ticker symbol “AB”. As an NYSE listed company, Holding is subject to applicable regulations promulgated by the NYSE.
Our relationships with AXA and its subsidiaries are subject to applicable provisions of the insurance laws and regulations of New York and other states. Under such laws and regulations, the terms of certain investment advisory and other agreements we enter into with AXA or its subsidiaries are required to be fair and equitable, charges or fees for services performed must be reasonable, and, in some cases, are subject to regulatory approval.
Some of our subsidiaries are subject to the oversight of regulatory authorities in Europe, including the FSA in the U.K., and in Asia, including the Financial Services Agency in Japan, the Securities and Futures Commission in Hong Kong and the Monetary Authority of Singapore. While the requirements of these foreign regulators are often comparable to the requirements of the SEC and other U.S. regulators, they are sometimes more restrictive and may cause us to incur substantial expenditures of time and money in our efforts to comply. As of December 31, 2010, each of our subsidiaries subject to a minimum net capital requirement satisfied the applicable requirement.
Tax
es
Holding, having elected under Section 7704(g) of the Internal Revenue Code of 1986, as amended (
“Code”
), to be subject to a 3.5% federal tax on partnership gross income from the active conduct of a trade or business, is a “grandfathered” publicly-traded partnership for federal income tax purposes. Holding is also subject to the 4.0% New York City unincorporated business tax (
“UBT”
), net of credits for UBT paid by AllianceBernstein. In order to preserve Holding’s status as a “grandfathered” publicly-traded partnership for federal income tax purposes, management ensures that Holding does not directly or indirectly (through AllianceBernstein) enter into a substantial new line of business. A “new line of business” would be any business that is not closely related to AllianceBernstein’s historical business of providing research and diversified investment management and related services to its clients. A new line of business is “substantial” when a partnership derives more than 15% of its gross income from, or uses more than 15% of its total assets to support the new line of business.
AllianceBernstein is a private partnership for federal income tax purposes and, accordingly, is not subject to federal and state corporate income taxes. However, AllianceBernstein is subject to the 4.0% UBT. Domestic corporate subsidiaries of AllianceBernstein, which are subject to federal, state and local income taxes, are generally included in the filing of a consolidated federal income tax return with separate state and local income tax returns also being filed. Foreign corporate subsidiaries are generally subject to taxes at higher rates in the foreign jurisdictions where they are located so, as our business increasingly operates in countries other than the U.S., our effective tax rate continues to increase.
For additional information,
see “Risk Factors” in Item 1A
.
Histo
ry and Structure
We have been in the investment research and management business for approximately 40 years. Alliance Capital was founded in 1971 when the investment management department of Donaldson, Lufkin & Jenrette, Inc. (since November 2000, a part of Credit Suisse Group) merged with the investment advisory business of Moody’s Investor Services, Inc. Bernstein was founded in 1967.
In April 1988, Holding “went public” as a master limited partnership. Holding Units, which trade under the ticker symbol “AB”, have been listed on the NYSE since that time.
In October 1999, Holding reorganized by transferring its business and assets to AllianceBernstein, a newly-formed operating partnership, in exchange for all of the AllianceBernstein Units (
“Reorganization”
). Since the date of the Reorganization, AllianceBernstein has conducted the business formerly conducted by Holding and Holding’s activities have consisted of owning AllianceBernstein Units and engaging in related activities. As stated above, Holding Units trade publicly; AllianceBernstein Units do not trade publicly and are subject to significant restrictions on transfer. The General Partner is the general partner of both AllianceBernstein and Holding.
In October 2000, our two legacy firms, Alliance Capital and Bernstein, combined, bringing together Alliance Capital’s expertise in growth equity and corporate fixed income investing, and its family of retail mutual funds, with Bernstein’s expertise in value equity and tax-exempt fixed income management, and its private client and Bernstein Research services businesses. For additional details about this business combination,
see Note 2 to AllianceBernstein’s consolidated financial statements in Item 8
.
As of December 31, 2010, the condensed ownership structure of AllianceBernstein was as follows (for a more complete description of our ownership structure,
see “Principal Security Holders” in Item 12
):

_____________
|
(1)
|
Direct and indirect ownership including unallocated Holding Units held in a trust for our long-term incentive compensation plans.
|
The ownership of Holding by AllianceBernstein directors, officers and employees increased to 28.5% as of December 31, 2010 from 21.1% as of December 31, 2009, with a corresponding decrease in public ownership. This shift reflects the grant of 13.1 million restricted Holding Units to directors, officers and employees during 2010, funded partially by our open-market purchases of 7.4 million Holding Units during 2010. Any future restricted Holding Unit issuances as long-term incentive compensation will further increase employee ownership and decrease public ownership.
The General Partner, an indirect wholly-owned subsidiary of AXA, owns 100,000 general partnership units in Holding and a 1% general partnership interest in AllianceBernstein. Including these general partnership interests, AXA, through certain of its subsidiaries (
see “Principal Security Holders” in Item 12
), had an approximate 61.4% economic interest in AllianceBernstein as of December 31, 2010.
AXA and its subsidiaries own all of the issued and outstanding shares of the common stock of AXA Financial. AXA Financial indirectly owns all of the issued and outstanding shares of AXA Equitable.
See “Principal Security Holders” in Item 12
.
AXA, a
société anonyme
organized under the laws of France, is the holding company for an international group of insurance and related financial services companies engaged in the financial protection and wealth management businesses. AXA’s operations are diverse geographically, with major operations in Western Europe, North America and the Asia/Pacific regions and, to a lesser extent, in other regions including the Middle East and Africa. AXA has five operating business segments: life and savings, property and casualty, international insurance, asset management and other financial services.
Com
petition
The financial services industry is intensely competitive and new entrants are continually attracted to it. No single or small group of competitors is dominant in the industry.
We compete in all aspects of our business with numerous investment management firms, mutual fund sponsors, brokerage and investment banking firms, insurance companies, banks, savings and loan associations, and other financial institutions that often provide investment products that have similar features and objectives as those we offer. Our competitors offer a wide range of financial services to the same customers that we seek to serve. Some of our competitors are larger, have a broader range of product choices and investment capabilities, conduct business in more markets, and have substantially greater resources than we do. These factors may place us at a competitive disadvantage, and we can give no assurance that our strategies and efforts to maintain and enhance our current client relationships, and create new ones, will be successful.
AXA and its subsidiaries provide financial services, some of which compete with those we offer. The AllianceBernstein Partnership Agreement specifically allows AXA Financial and its subsidiaries (other than the General Partner) to compete with AllianceBernstein and to exploit opportunities that may be available to us. AXA, AXA Financial, AXA Equitable and certain of their respective subsidiaries have substantially greater financial resources than we do and are not obligated to provide resources to us.
To grow our business, we must be able to compete effectively for AUM. Key competitive factors include:
|
|
•
|
our investment performance for clients;
|
|
|
•
|
our commitment to place the interests of our clients first;
|
|
|
•
|
the quality of our research;
|
|
|
•
|
our ability to attract, retain and motivate highly skilled, and often highly specialized, personnel;
|
|
|
•
|
the array of investment products we offer;
|
|
|
•
|
the fees we charge;
|
|
|
•
|
Morningstar/Lipper rankings for the AllianceBernstein Funds;
|
|
|
•
|
our operational effectiveness;
|
|
|
•
|
our ability to further develop and market our brand; and
|
|
|
•
|
our global presence.
|
Increased competition could reduce the demand for our products and services, which could have a material adverse effect on our financial condition, results of operations and business prospects.
Competition is an important risk that our business faces and should be considered along with the other risk factors we discuss
in Item 1A below
.
AllianceBernstein and Holding file or furnish annual reports on Form 10-K, quarterly reports on Form 10-Q, current reports on Form 8-K and other reports required to comply with federal securities laws. The public may read and copy any materials filed with the SEC in the SEC’s conventional reading rooms, which are located within the SEC’s Headquarters Office at 100 F Street, NE, Washington, DC 20549. The public may obtain information on the operation of these rooms by calling the SEC at (202) 551-8090. The SEC also maintains an Internet site (http://www.sec.gov) that contains reports, proxy and information statements, and other information regarding issuers that file electronically with the SEC.
AllianceBernstein and Holding maintain an Internet site (http://www.alliancebernstein.com). The portion of the site at “Investor & Media Relations” and “Reports & SEC Filings” links to both companies’ annual reports on Form 10-K, quarterly reports on Form 10-Q, current reports on Form 8-K, Section 16 beneficial ownership reports on Forms 3, 4 and 5, registration statements on Form S-8, proxy statements and amendments to such filings. These reports are available through the site free of charge as soon as reasonably practicable after such material is filed with, or furnished to, the SEC.
|
Item
1A.
|
Risk Factors
|
Please read this section along with the description of our business
in Item 1
, the competition section just above and AllianceBernstein’s financial information
contained in Items 6, 7 and 8
. The majority of the risk factors discussed below directly affect AllianceBernstein. These risk factors also affect Holding because Holding’s principal source of income and cash flow is attributable to its investment in AllianceBernstein.
See also “Cautions Regarding Forward-Looking Statements” in Item 7
.
Poor investment performance may lead to loss of clients and a decline in AUM and revenues.
Our ability to achieve investment returns for clients that meet or exceed investment returns for comparable asset classes and competing investment services is a key consideration when clients decide to keep their assets with us or invest additional assets, and when a prospective client is deciding whether to invest with us. Our inability to meet or exceed relevant investment benchmarks could result in clients withdrawing assets and in prospective clients choosing to invest with competitors. The resulting lower AUM levels could lead to lower investment management fees, including minimal or no performance-based fees, which could result in a decline in our revenues.
Throughout 2008, and in particular during the fourth quarter, we underperformed benchmarks in virtually all of our services, in some cases by substantial amounts. Although in 2009 we experienced generally very good performance across our services, in 2010, poor performance in the second quarter, when volatility and market correlations were at their highest, impacted full-year performance. As a result, many of our equity services underperformed their benchmarks for the full year. Accordingly, we failed to meet client expectations, which contributed to net outflows across each of our three buy-side distribution channels in 2010, particularly in our Institutions channel.
We believe that our net outflows should improve in 2011. However, this positive development will depend on a number of factors, including our ability to deliver consistent, competitive investment performance, which cannot be assured, conditions of the financial markets, consultant recommendations, and changes in our clients’ investment preferences, risk tolerances and liquidity needs. Substantial net outflows for an extended period may have a significantly adverse effect on our results of operations and business prospects.
Changes in financial market levels have a direct and significant impact on our AUM; a significant reduction in AUM has a material adverse effect on our results of operations and business prospects.
Performance of financial markets (both domestic and international), global economic conditions, industry trends, interest rates, inflation rates, tax regulation changes and other factors that are difficult to predict affect the mix, market value and level of our AUM. Investment advisory and services fees, the largest component of our revenues, are generally calculated as a percentage of the value of AUM and vary with the type of account managed. Accordingly, fee income generally increases or decreases as assets under management increase or decrease and is affected by market appreciation or depreciation, inflow of new client assets (including purchases of mutual fund shares) and outflow of client assets (including redemption of mutual fund shares). In addition, changing market conditions and investment trends, particularly with respect to retirement savings, may reduce interest in certain of our investment products and may result in a reduction in AUM.
Significant weakness and volatility in global credit markets, particularly the rapid deterioration of the mortgage markets in the United States and Europe, during the second half of 2007 and early in 2008 was followed by global economic turmoil during the second half of 2008 and early in 2009. These conditions had a significant adverse affect on our 2009 and 2008 results of operations. Heightened volatility and risk aversion, particularly in the second quarter of 2010, combined to drive market correlations to levels experienced during the depths of the financial crisis. In this environment, with stocks rising and falling almost in unison in response to various macro-economic concerns (
e.g.
, the possibility of deflation, a “double-dip” recession and debt-related troubles in some European nations) and not based on their fundamentals, our stock-selection discipline went largely unrewarded. When the markets settled and correlations declined in the third and particularly the fourth quarter of 2010, the performance of our equity services relative to both benchmarks and peer averages recovered well. However, poor performance in the second quarter, when volatility and correlations were at their highest, impacted full-year performance. As a result, many of our equity services underperformed their benchmarks for the full year.
Although global markets improved during the second half of 2010 and the first several weeks of 2011, there can be no assurance that such improvement will continue or that market conditions will not deteriorate again, which could have a significant adverse effect on our results of operations and business prospects.
Prolonged weakness in asset values may result in impairment of goodwill, intangible assets and the deferred sales commission asset.
If market conditions deteriorate significantly and securities valuations are depressed for prolonged periods of time (factors that are beyond our control), our AUM, revenues, profitability and unit price may be adversely affected. As a result, goodwill, intangible assets and/or the deferred sales commission asset may become impaired. The occurrence of an impairment would require a material charge to our earnings. For additional information about our impairment testing,
see Item 7
.
Our business is dependent on investment advisory, selling and distribution agreements that are subject to termination or non-renewal on short notice.
We derive most of our revenues pursuant to written investment management agreements (or other arrangements) with institutional investors, mutual funds and private clients, and selling and distribution agreements between AllianceBernstein Investments and financial intermediaries that distribute AllianceBernstein Funds. Generally, the investment management agreements (and other arrangements) are terminable at any time or upon relatively short notice by either party. The selling and distribution agreements are terminable by either party upon notice (generally 30 days) and do not obligate the financial intermediary to sell any specific amount of fund shares. In addition, investors in AllianceBernstein Funds can redeem their investments without notice. Any termination of, or failure to renew, a significant number of these agreements, or a significant increase in redemption rates, could have a material adverse effect on our results of operations and business prospects.
Furthermore, the investment management agreements pursuant to which we manage the U.S. Funds must be renewed and approved by the Funds’ boards of directors annually. A significant majority of the directors are independent. Consequently, there can be no assurance that the board of directors of each fund will approve the fund’s investment management agreement each year, or will not condition its approval on revised terms that may be adverse to us.
Our ability to establish new client relationships and maintain existing ones is partly dependent on our relationships with various financial intermediaries and consultants that are not obligated to continue to work with us.
Our ability to market our Retail Products and Services, sub-advisory services and certain other investment services is partly dependent on our access to securities firms, brokers, banks and other intermediaries. These intermediaries generally offer their clients investment products that compete with our products. In addition, certain institutional investors rely on consultants to advise them on choosing an investment adviser, and our Institutional Services are not always considered among the best choices by consultants. Also, our Private Client Services group relies on referrals from financial planners, registered investment advisers and other professionals. We cannot be certain that we will continue to have access to, or receive referrals from, these third parties. Loss of such access or referrals could have a material adverse effect on our results of operations and business prospects. For example, a number of investment consultants have advised their clients to move their assets away from us to other investment advisers, which has contributed to significant net outflows. This trend may continue.
We may be unable to continue to attract and retain key personnel.
Our business depends on our ability to attract, retain and motivate highly skilled, and often highly specialized, technical, managerial and executive personnel; there is no assurance that we will be able to do so.
The market for qualified research analysts, portfolio managers, financial advisers, traders and other professionals is extremely competitive and is characterized by frequent movement of these investment professionals among different firms. In 2010, some of our senior professionals left the firm; additional departures may occur. Portfolio managers and financial advisers often maintain strong, personal relationships with their clients so their departure could cause us to lose client accounts, which could have a material adverse effect on our results of operations and business prospects.
We may enter into more performance-based fee arrangements with our clients in the future, which could cause greater fluctuations in our revenues.
We sometimes charge our clients performance-based fees. In these situations, we charge a base advisory fee and are eligible to earn an additional performance-based fee or incentive allocation that is calculated as either a percentage of absolute investment results or a percentage of investment results in excess of a stated benchmark over a specified period of time. In addition, some performance-based fees include a high-watermark provision, which generally provides that if a client account underperforms relative to its performance target (whether absolute or relative to a specified benchmark), it must gain back such underperformance before we can collect future performance-based fees. Therefore, if we fail to achieve the performance target for a particular period, we will not earn a performance-based fee for that period and, for accounts with a high-watermark provision, our ability to earn future performance-based fees will be impaired. We are eligible to earn performance-based fees on approximately 12% of the assets we manage for institutional clients and approximately 3% of the assets we manage for private clients (in total, approximately 8% of our company-wide AUM). If the percentage of our AUM subject to performance-based fees grows, seasonality and volatility of revenue and earnings are likely to become more significant. Our performance-based fees in 2010, 2009 and 2008 were $20.5 million, $29.8 million and $13.4 million, respectively.
Approximately 73% of our hedge fund AUM is subject to high-watermarks, and we ended the fourth quarter of 2010 with approximately 84% of this AUM below high-watermarks by 10% or more. This will make it very difficult for us to earn performance-based fees on these hedge funds in 2011.
If we are unable to maintain our fee levels, or if our mix of AUM changes, our results of operations may be adversely affected.
A shift from active equity services towards fixed income services and passive services may result in a corresponding decline in revenues and income because we generally earn higher fees from assets invested in our active equity services than in our fixed income services or passive services. A shift from global and international services to U.S. services may have a similar effect. The global economic turmoil experienced during the second half of 2008, early in 2009 and again during the second quarter of 2010 caused some investors to shift their investment preferences from active equities to fixed income, passive and money market products (some of which we do not offer), and this trend may continue or accelerate.
In addition, we may be required to reduce our fee levels, or restructure the fees we charge, because of, among other things, regulatory initiatives (whether industry-wide or specifically targeted), court decisions and competitive considerations. A reduction in fees will reduce our revenues. A reduction in revenues, without a commensurate reduction in expenses, will adversely affect our results of operations.
We may engage in strategic transactions that could pose risks.
As part of our business strategy, we consider potential strategic transactions, including acquisitions, dispositions, consolidations, joint ventures and similar transactions, some of which may be material. These transactions, if undertaken, may involve a number of risks and present financial, managerial and operational challenges, including:
|
|
·
|
adverse effects on our earnings if acquired intangible assets or goodwill become impaired;
|
|
|
·
|
existence of unknown liabilities or contingencies that arise after closing; and
|
|
|
·
|
potential disputes with counterparties.
|
Acquisitions also pose the risk that any business we acquire may lose customers or employees or could underperform relative to expectations. Additionally, the acquisition of investment personnel (such as the alternative investments group we acquired in October 2010) poses the risk that we may lose the AUM we expected to manage, which could adversely affect our results of operations. Furthermore, strategic transactions may require us to increase our leverage or, if we issue AllianceBernstein Units or Holding Units to fund an acquisition, dilute the holdings of our existing Unitholders.
Because many of our subsidiary operations are located outside of the United States and have functional currencies other than the U.S. dollar, changes in exchange rates to the U.S. dollar affect our reported financial results from one period to the next.
Although significant portions of our net revenues and expenses, as well as our AUM, are presently derived from the United States, we have subsidiaries outside of the United States with functional currencies other than the U.S. dollar. As a result, fluctuations in exchange rates to the U.S. dollar affect our reported financial results from one period to the next. We may not be successful in our efforts to hedge our exposure to such fluctuations, which could have a negative effect on our reported financial results.
The individuals, counterparties or issuers on which we rely in the course of performing services for us or our clients may be unable or unwilling to honor their contractual obligations to us.
We rely on various third party counterparties and other vendors to fulfill their obligations to us, whether specified by contract, course of dealing or otherwise. Default rates, downgrades and disputes with counterparties as to the valuation of collateral increase significantly in times of market stress. Furthermore, disruptions in the financial markets and other economic challenges, like those presented by the global financial turmoil in 2008 and early 2009, may cause our counterparties and other vendors to experience significant cash flow problems or even render them insolvent, which may expose us to significant costs.
Maintaining adequate liquidity for our general business needs depends upon certain factors, including operating cash flows and our access to credit on reasonable terms.
Our financial condition is dependent on our cash flow from operations, which is subject to the performance of the capital markets, our ability to maintain and grow client assets under management and other factors beyond our control. Our ability to issue public or private debt on reasonable terms may be limited by adverse market conditions, our profitability, our creditworthiness as perceived by lenders and changes in government regulations, including tax rates and interest rates. Furthermore, our access to bank credit or the debt markets depends significantly on our credit ratings. A downgrade to our credit ratings could increase our borrowing costs and limit our access to the capital markets. If we are unable to obtain funds and/or financing, we may be forced to incur unanticipated costs or revise our strategic plans, which could have a material adverse effect on our financial condition, results of operations and business prospects.
Unpredictable events, including natural disaster, dangerous weather conditions, technology failure, terrorist attack and political unrest, may adversely affect our ability to conduct business.
War, terrorist attack, political unrest in the Middle East, the Pacific Rim and elsewhere, power failure, natural disaster and rapid spread of serious disease could interrupt our operations by:
|
|
•
|
causing disruptions in U.S. or global economic conditions, thereby decreasing investor confidence and making investment products generally less attractive;
|
|
|
•
|
inflicting loss of life;
|
|
|
•
|
triggering massive technology failures or delays; and
|
|
|
•
|
requiring substantial capital expenditures and operating expenses to remediate damage and restore operations.
|
Our operations require experienced, professional staff. Loss of a substantial number of such persons or an inability to provide properly equipped places for them to work may, by disrupting our operations, adversely affect our financial condition, results of operations and business prospects.
We depend on various systems and technologies for our business to function properly and to safeguard confidential information.
We utilize software and related technologies throughout our business, including both proprietary systems and those provided by outside vendors. Although we have established and tested business continuity plans, we may experience system delays and interruptions and it is not possible to predict with certainty all of the adverse effects that could result from our failure, or the failure of a third party, to efficiently address and resolve these problems. These adverse effects could include the inability to perform critical business functions or failure to comply with financial reporting and other regulatory requirements, which could lead to loss of client confidence, harm to our reputation, exposure to disciplinary action and liability to our clients. Accordingly, potential system failures and the cost necessary to correct those failures could have a material adverse effect on our results of operations and business prospects.
In addition, we could be subject to losses if we fail to properly safeguard sensitive and confidential information. As part of our normal operations, we maintain and transmit confidential information about our clients as well as proprietary information relating to our business operations. Our systems could be damaged by unauthorized users or corrupted by computer viruses or other malicious software code, or authorized persons could inadvertently or intentionally release confidential or proprietary information. Such disclosure could, among other things, allow competitors access to our proprietary business information and require significant time and expense to investigate and remediate the breach.
The quantitative models we use in certain of our investment services may contain errors, resulting in imprecise risk assessments and unintended output.
We use quantitative models in a variety of our investment services, generally in combination with fundamental research. Our quantitative models are validated by senior quantitative professionals. In 2010, we formed our Model Risk Working Group, the purpose of which is to formalize and oversee a quantitative model governance framework, including minimum validation standards. However, due to the complexity of such models, it is possible that errors in the models could exist and our controls could fail to detect such errors. Failure to detect errors could result in client losses and damage to our reputation.
Our own operational failures or those of third parties we rely on, including failures arising out of human error, could disrupt our business, damage our reputation and reduce our revenues.
Weaknesses or failures in our internal processes or systems could lead to disruption of our operations, liability to clients, exposure to disciplinary action or harm to our reputation. Our business is highly dependent on our ability to process, on a daily basis, large numbers of transactions, many of which are highly complex, across numerous and diverse markets. These transactions generally must comply with investment guidelines, as well as stringent legal and regulatory standards.
Despite the contingency plans and facilities we have in place, our ability to conduct business may be adversely affected by a disruption in the infrastructure that supports our operations and the communities in which they are located. This may include a disruption involving electrical, communications, transportation or other services we may use or third parties with which we conduct business. If a disruption occurs in one location and our employees in that location are unable to occupy our offices or communicate with or travel to other locations, our ability to conduct business with and on behalf of our clients may suffer, and we may not be able to successfully implement contingency plans that depend on communication or travel.
Our obligations to clients require us to exercise skill, care and prudence in performing our services. Despite our employees being highly trained and skilled, the large number of transactions we process makes it highly likely that errors will occasionally occur. Should we make a mistake in performing our services that costs a client money, we have a duty to act promptly to put the client in the position the client would have been in had we not made the error. The occurrence of mistakes, particularly significant ones, can have a material adverse effect on our reputation, results of operations and business prospects.
We may not accurately value the securities we hold on behalf of our discretionary clients or our company investments.
In accordance with applicable regulatory requirements, our obligations under investment management agreements with our clients and, if the client is a U.S. Fund, the approval and direction of the U.S. Fund’s board of directors or trustees, we employ procedures for the pricing and valuation of securities and other positions held in client accounts or for company investments. We have established a Valuation Committee, composed of senior officers and employees, which oversees pricing controls and valuation processes. Where market quotations for a security are not readily available, the Valuation Committee determines a fair value for the security.
Extraordinary volatility in financial markets, significant liquidity constraints or our not adequately accounting for one or more factors when fair valuing a security based on information with limited market observability could result in our failing to properly value securities we hold for our clients or investments accounted for on our balance sheet. Improper valuation would likely result in our basing fee calculations on inaccurate AUM figures, our striking incorrect net asset values for company-sponsored mutual funds, hedge funds or, in the case of company investments, our inaccurately calculating and reporting our financial condition and operating results. Although the overall percentage of our AUM that we fair value based on information with limited market observability is not significant, inaccurate fair value determinations can harm our clients, create regulatory issues and negatively affect our reputation.
We may not have sufficient information to confirm or review the accuracy of valuations provided to us by underlying external managers for the funds in which certain of our alternative investment products invest.
Certain of our alternative investment products invest in funds managed by external managers
(
“External Managers”
) rather than investing directly in securities and other instruments. As a result, our abilities will be limited to (i) monitor such investments, (ii) regularly obtain complete, accurate and current information with respect to such investments and (iii) exercise control over such investments. Accordingly, we may not have sufficient information to confirm or review the accuracy of valuations provided to us by External Managers. In addition, we will be required to rely on External Managers’ compliance with any applicable investment guidelines and restrictions. Any failure of an External Manager to operate within such guidelines or to provide accurate information with respect to the investment, could subject our alternative investment products to losses and cause damage to our reputation.
Our business is based on the trust and confidence of our clients; any damage to that trust and confidence can cause AUM to decline.
We are dedicated to earning and maintaining the trust and confidence of our clients; the good reputation created thereby is essential to our business. Damage to our reputation could substantially impair our ability to maintain or grow our business.
Our substantial underperformance in virtually all of our investment services during 2008 and in our largest equity investment services during the second quarter of 2010 injured our reputation among many clients, prospects and consultants. We are focused on improving the investment performance we deliver in 2011 and, in so doing, rebuilding our reputation. Failure in this endeavor, however, could have a material adverse effect on our reputation, results of operations and business prospects.
We may not always successfully manage actual and potential conflicts of interest that arise in our business.
Our reputation is one of our most important assets. As our business and client base expands, we increasingly must manage actual and potential conflicts of interest, including situations where our services to a particular client conflict, or are perceived to conflict, with the interests of another client, as well as situations where certain of our employees have access to material non-public information that may not be shared with all employees of our firm. Failure to adequately address potential conflicts of interest could adversely affect our reputation, results of operations and business prospects.
We have procedures and controls that are designed to address and manage conflicts of interest, including those designed to prevent the improper sharing of information. However, appropriately managing conflicts of interest is complex and difficult, and our reputation could be damaged and the willingness of clients to enter into transactions in which such a conflict might arise may be affected if we fail, or appear to fail, to deal appropriately with conflicts of interest. In addition, potential or perceived conflicts could give rise to litigation or regulatory enforcement actions.
Rates we charge for brokerage transactions have declined significantly in recent years, and we expect those declines to continue. In addition, turmoil in global capital markets and economies may reduce market volumes. Combined, these two factors may adversely affect Bernstein Research Services revenue.
Electronic, or “low-touch”, trading approaches represent a growing percentage of buy-side trading activity and produce transaction fees for execution-only services that are a small fraction of traditional full service fee rates. As a result, blended pricing for the industry and SCB has declined in recent years. In addition, fee rates charged by SCB and other brokers for traditional brokerage services have also historically experienced price pressure, and we expect these trends to continue. While increases in transaction volume and market share have in the past often offset decreases in rates, this may not continue. Recent economic and market turmoil has severely impacted much of SCB’s client base, which in the near-term may adversely affect transaction volume generally.
Despite our efforts to manage exposures from principal positions taken by our sell-side business, these positions are subject to market risk.
Our sell-side business may use the firm’s capital to facilitate customer transactions, primarily relating to our trading activities in listed options. The resulting principal positions are exposed to market risk. We seek to manage this risk both by engaging in transactions designed to hedge the market risk and by maintaining a risk platform that includes the measurement and monitoring of financial exposures and operational processes. Our ability to manage this risk may be limited, however, by adverse changes in the liquidity of the security or the hedging instrument and in the correlation of price movements between the security and the hedging instrument. Similarly, the risk monitoring and risk mitigation techniques we employ and the related judgments we make cannot anticipate every possible economic and financial circumstance and outcome. Consequently, we may incur losses, which would require us to increase our regulatory capital and could adversely affect our results of operations.
Our insurance policies may be insufficient to protect us against large losses.
We can make no assurance that a claim or claims will be covered by our insurance policies or, if covered, will not exceed the limits of available insurance coverage, or that our insurers will remain solvent and meet their obligations.
Our business is subject to pervasive global regulation, the compliance with which could involve substantial expenditures of time and money, and the violation of which may result in material adverse consequences.
Virtually all aspects of our business are subject to federal and state laws and regulations, rules of securities regulators and exchanges, and laws in the foreign countries in which our subsidiaries conduct business. If we violate these laws or regulations, we could be subject to civil liability, criminal liability or sanction, including revocation of our and our subsidiaries’ registrations as investment advisers or broker-dealers, revocation of the licenses of our employees, censures, fines, or temporary suspension or permanent bar from conducting business. Any such liability or sanction could have a material adverse effect on our financial condition, results of operations, and business prospects. A regulatory proceeding, even if it does not result in a finding of wrongdoing or sanction, could require substantial expenditures of time and money.
These laws and regulations generally grant supervisory agencies and bodies broad administrative powers, including, in some cases, the power to limit or restrict doing business for failure to comply with such laws and regulations. Moreover, regulators in non-U.S. jurisdictions could change their policies or laws in a manner that might restrict or otherwise impede our ability to market, distribute, or register investment products in their respective markets. These local requirements could increase the expenses we incur in a specific jurisdiction without any corresponding increase in revenues from operating in the jurisdiction.
Regulation of the financial services industry is evolving.
As an investment firm, we are subject to financial services laws, regulations, corporate governance requirements, administrative actions and policies in each location in which we operate. In 2009 and 2010, as many emergency government programs slowed or wound down, global regulatory and legislative focus generally moved to a second phase of broader reform and a restructuring of financial institution regulation. While the final nature, scope and extent of this second phase of initiatives are still evolving, many of the principal jurisdictions where we conduct business have considered or enacted major, and in some cases transformational, changes to the way financial institutions are regulated. In the United States, Congress has enacted the Dodd-Frank Wall Street Reform and Consumer Protection Act (
“Dodd-Frank Act”
), which fundamentally changes the U.S. financial regulatory landscape. The full scope of the regulatory changes imposed by the Dodd-Frank Act will only be determined once extensive rules and regulations have been proposed and become effective, which may result in significant changes in the manner in which our operations are regulated.
Changes to the rules governing Rule 12b-1 Fees may affect the revenues we derive from our Retail Services.
In July 2010, the SEC proposed a new rule and rule amendments that would alter Rule 12b-1 Fees. The new rule and amendments would continue to allow funds to bear promotional costs within certain limits and would also preserve the ability of funds to provide investors with alternatives for paying sales charges (
e.g.,
at the time of purchase, at the time of redemption or through a continuing fee charged to fund assets). Unlike the current Rule 12b-1 framework, however, the proposed rules would limit the cumulative sales charges each investor pays, regardless of how they are imposed.
If rules are adopted as proposed, changes in Rule 12b-1 Fees for a number of share classes offered by company-sponsored mutual funds would be required, which would reduce the net fund distribution revenues we receive from company-sponsored mutual funds. The impact of this rule change is dependent upon the final rules adopted by the SEC, any phase-in or grandfathering period, and any other changes made with respect to share class distribution arrangements.
The financial services industry is intensely competitive.
We compete on the basis of a number of factors, including our array of investment services, our investment performance for our clients, innovation, reputation and price. By having a global presence, we may face competitors with more experience and more established relationships with clients, regulators and industry participants in the relevant market, which could adversely affect our ability to expand. Furthermore, our poor investment performance during 2008 and the second quarter of 2010, and what may be diminished confidence in our services on the part of clients and consultants, may make it more difficult for us to compete effectively. For additional information regarding competitive factors,
see “Competition” in Item 1
.
We are involved in various legal proceedings and regulatory matters and may be involved in such proceedings in the future, any one or combination of which could have a material adverse effect on our financial condition, results of operations and business prospects.
We are involved in various matters, including regulatory inquiries, administrative proceedings and litigation, some of which allege substantial damages, and we may be involved in additional matters in the future. Litigation is subject to significant uncertainties, particularly when plaintiffs allege substantial or indeterminate damages, or when the litigation is highly complex or broad in scope. We have described pending material legal proceedings
in Item
3
.
Structure-related Risks
The partnership structure of Holding and AllianceBernstein limits unitholders’ abilities to influence the management and operation of AllianceBernstein’s business and is highly likely to prevent a change in control of Holding and AllianceBernstein.
The General Partner, as general partner of both Holding and AllianceBernstein, generally has the exclusive right and full authority and responsibility to manage, conduct, control and operate their respective businesses, except as otherwise expressly stated in their respective Amended and Restated Agreements of Limited Partnership. Holding and AllianceBernstein Unitholders have more limited voting rights on matters affecting AllianceBernstein than do holders of common stock in a corporation. Both Amended and Restated Agreements of Limited Partnership provide that unitholders do not have any right to vote for directors of the General Partner and that unitholders can only vote on certain extraordinary matters (including removal of the General Partner under certain extraordinary circumstances). Additionally, the AllianceBernstein Partnership Agreement includes significant restrictions on transfers of AllianceBernstein Units and provisions that have the practical effect of preventing the removal of the General Partner, which are highly likely to prevent a change in control of AllianceBernstein’s management.
AllianceBernstein Units are illiquid.
There is no public trading market for AllianceBernstein Units and AllianceBernstein does not anticipate that a public trading market will ever develop. The AllianceBernstein Partnership Agreement restricts our ability to participate in a public trading market or anything substantially equivalent to one by providing that any transfer which may cause AllianceBernstein to be classified as a “publicly traded partnership” as defined in Section 7704 of the Code shall be deemed void and shall not be recognized by AllianceBernstein. In addition, AllianceBernstein Units are subject to significant restrictions on transfer; all transfers of AllianceBernstein Units are subject to the written consent of AXA Equitable and the General Partner pursuant to the AllianceBernstein Partnership Agreement. Generally, neither AXA Equitable nor the General Partner will permit any transfer that it believes would create a risk that AllianceBernstein would be treated as a corporation for tax purposes. AXA Equitable and the General Partner have implemented a transfer program that requires a seller to locate a purchaser, and imposes annual volume restrictions on transfers. You may request a copy of the transfer program from our corporate secretary (
corporate_secretary@alliancebernstein.com
). Also, we have filed the transfer program as Exhibit 10.06 to this Form 10-K.
Changes in the partnership structure of Holding and AllianceBernstein and/or changes in the tax law governing partnerships would have significant tax ramifications.
Holding, having elected under Section 7704(g) of the Code, to be subject to a 3.5% federal tax on partnership gross income from the active conduct of a trade or business, is a “grandfathered” publicly-traded partnership (
“PTP”
) for federal income tax purposes. Holding is also subject to the 4.0% UBT, net of credits for UBT paid by AllianceBernstein. In order to preserve Holding’s status as a “grandfathered” publicly-traded partnership for federal income tax purposes, management ensures that Holding does not directly or indirectly (through AllianceBernstein) enter into a substantial new line of business. A “new line of business” would be any business that is not closely related to AllianceBernstein’s historical business of providing research and diversified investment management and related services to its clients. A new line of business is “substantial” when a partnership derives more than 15% of its gross income from, or uses more than 15% of its total assets in, the new line of business.
AllianceBernstein is a private partnership for federal income tax purposes and, accordingly, is not subject to federal and state corporate income taxes. However, AllianceBernstein is subject to the 4.0% UBT. Domestic corporate subsidiaries of AllianceBernstein, which are subject to federal, state and local income taxes, are generally included in the filing of a consolidated federal income tax return with separate state and local income tax returns being filed. Foreign corporate subsidiaries are generally subject to taxes in the foreign jurisdiction where they are located. As our business increasingly operates in countries other than the U.S., our effective tax rate continues to increase because our international subsidiaries are subject to corporate level taxes in the jurisdictions where they are located.
In order to preserve AllianceBernstein’s status as a private partnership for federal income tax purposes, AllianceBernstein Units must not be considered publicly traded. The AllianceBernstein Partnership Agreement provides that all transfers of AllianceBernstein Units must be approved by AXA Equitable and the General Partner; AXA Equitable and the General Partner approve only those transfers permitted pursuant to one or more of the safe harbors contained in relevant treasury regulations. If such units were considered readily tradable, AllianceBernstein would be subject to federal and state corporate income tax on its net income. Furthermore, as noted above, should AllianceBernstein enter into a substantial new line of business, Holding, by virtue of its ownership of AllianceBernstein, would lose its status as a grandfathered publicly-traded partnership and would become subject to corporate income tax as set forth above.
In years prior to 2010, Congress proposed tax legislation that would have caused certain PTPs to be taxed as corporations, thus subjecting their income to a higher level of income tax. Holding is a PTP that derives its income from asset manager or investment management services through its ownership interest in AllianceBernstein. The legislation, in the form proposed, would not have affected Holding’s tax status. However, we cannot predict whether, or in what form, tax legislation will be proposed in future years, and are unable to determine what effect any new legislation might have on us. If Holding were to lose its federal tax status as a grandfathered PTP, it would be subject to corporate income tax, which would reduce materially its net income and quarterly distributions to Holding Unitholders.
The proposed legislation discussed above would not have affected AllianceBernstein because it is a private partnership.
|
Item
1B.
|
Unresolved Staff Comments
|
Neither AllianceBernstein nor Holding has unresolved comments from the staff of the SEC to report
.
|
Item
2.
|
Properties
|
Our principal executive offices at 1345 Avenue of the Americas, New York, New York are occupied pursuant to a lease expiring in 2019 with options to extend to 2029. At this location, we currently lease approximately 1,033,984 square feet of space, within which we currently occupy 867,275 square feet of space and have sub-let (or are seeking to sub-let) 166,709 square feet of space. We also lease approximately 312,301 square feet of space at 135 West 50
th
Street, New York, New York under a lease expiring in 2019 with options to extend to 2029. Within our leased space at 135 West 50
th
Street, we currently occupy 59,367 square feet of space and have sub-let (or are seeking to sub-let) 252,934 square feet of space.
In addition, we lease approximately 263,083 square feet of space at One North Lexington, White Plains, New York under a lease expiring in 2021 with options to extend to 2031. At this location, we currently occupy 247,099 square feet of space and have sub-let (or are seeking to sub-let) 15,984 square feet of space.
AllianceBernstein Investments and AllianceBernstein Investor Services occupy approximately 92,067 square feet of space in San Antonio, Texas under a lease expiring in 2019 with options to extend to 2029.
We also lease space in 18 other cities in the United States.
Our subsidiaries and joint venture companies lease space in 26 cities outside the United States, the most significant of which are in London, England under leases expiring between 2013 and 2022, and in Tokyo, Japan under a lease expiring in 2018. In London, we currently lease approximately 174,362 square feet of space, within which we currently occupy 162,702 square feet of space and have sub-let 11,660 square feet of space. In Tokyo, we currently lease approximately 56,941 square feet of space.
|
Legal Proceedings
|
With respect to all significant litigation matters, we consider the likelihood of a negative outcome. If we determine the likelihood of a negative outcome is probable, and the amount of the loss can be reasonably estimated, we record an estimated loss for the expected outcome of the litigation. If the likelihood of a negative outcome is reasonably possible and we are able to determine an estimate of the possible loss or range of loss, we disclose that fact together with the estimate of the possible loss or range of loss. However, it is difficult to predict the outcome or estimate a possible loss or range of loss because litigation is subject to significant uncertainties, particularly when plaintiffs allege substantial or indeterminate damages, or when the litigation is highly complex or broad in scope.
We have previously reported the filing of a purported class action complaint entitled
Hindo, et al. v. AllianceBernstein Growth & Income Fund, et al.
and our involvement in various other market timing-related matters. There have been no significant developments in these matters since we filed our Form 10-Q for the quarter ended September 30, 2010, in which these matters are more completely described. These matters are also described
in Note 7 to Holding’s financial statements in Item 8.
We are involved in various other matters, including regulatory inquiries, administrative proceedings and litigation, some of which allege substantial damages. While any inquiry, proceeding or litigation has the element of uncertainty, management believes that the outcome of any one of the other regulatory inquiries, administrative proceedings, lawsuits or claims that is pending or threatened, or all of them combined, will not have a material adverse effect on our results of operations or financial condition.
|
Item
4.
|
(Removed and Reserved)
|
|
Item
5.
|
Market for Registrant’s Common Equity, Related Stockholder Matters and Issuer Purchases of Equity Securities
|
Market for Holding Units and AllianceBernstein Units; Cash Distributions
Holding Units are listed on the NYSE and trade publicly under the ticker symbol “AB”.
There is no established public trading market for AllianceBernstein Units, which are subject to significant restrictions on transfer. In general, transfers of AllianceBernstein Units will be allowed only with the written consent of both AXA Equitable and the General Partner. Generally, neither AXA Equitable nor the General Partner will permit any transfer that it believes would create a risk that AllianceBernstein would be treated as a corporation for tax purposes. AXA Equitable and the General Partner have implemented a transfer program, a copy of which you may request from our corporate secretary (
corporate_secretary@alliancebernstein.com
). Also, we have filed the transfer program as Exhibit 10.06 to this Form 10-K.
Each of Holding and AllianceBernstein distributes on a quarterly basis all of its Available Cash Flow, as defined in the Holding Partnership Agreement and the AllianceBernstein Partnership Agreement, to its unitholders and the General Partner. For additional information concerning distribution of Available Cash Flow by Holding,
see Note 2 to Holding’s financial statements in Item 8
. For additional information concerning distribution of Available Cash Flow by AllianceBernstein,
see Note 2 to AllianceBernstein’s consolidated financial statements in Item 8
.
Holding’s principal source of income and cash flow is attributable to its limited partnership interests in AllianceBernstein.
The tables set forth below provide the distributions of Available Cash Flow made by AllianceBernstein and Holding during 2010 and 2009 and the high and low sale prices of Holding Units reflected on the NYSE composite transaction tape during 2010 and 2009:
|
Quarters Ended 2010
|
||||||||||||||||||||
|
December 31
|
September 30
|
June 30
|
March 31
|
Total
|
||||||||||||||||
|
Cash distributions per AllianceBernstein Unit
(1)
|
$ | 0.49 | $ | 0.18 | $ | 0.38 | $ | 0.53 | $ | 1.58 | ||||||||||
|
Cash distributions per Holding Unit
(1)
|
$ | 0.42 | $ | 0.12 | $ | 0.31 | $ | 0.46 | $ | 1.31 | ||||||||||
|
Holding Unit prices:
|
||||||||||||||||||||
|
High
|
$ | 27.59 | $ | 29.12 | $ | 35.00 | $ | 31.17 | ||||||||||||
|
Low
|
$ | 22.16 | $ | 23.50 | $ | 23.00 | $ | 24.69 | ||||||||||||
|
Quarters Ended 2009
|
||||||||||||||||||||
|
December 31
|
September 30
|
June 30
|
March 31
|
Total
|
||||||||||||||||
|
Cash distributions per AllianceBernstein Unit
(1)
|
$ | 0.70 | $ | 0.74 | $ | 0.48 | $ | 0.14 | $ | 2.06 | ||||||||||
|
Cash distributions per Holding Unit
(1)
|
$ | 0.62 | $ | 0.67 | $ | 0.41 | $ | 0.07 | $ | 1.77 | ||||||||||
|
Holding Unit prices:
|
||||||||||||||||||||
|
High
|
$ | 28.91 | $ | 27.81 | $ | 22.62 | $ | 23.27 | ||||||||||||
|
Low
|
$ | 24.40 | $ | 17.83 | $ | 14.28 | $ | 10.12 | ||||||||||||
_____________
|
(1)
|
Declared and paid during the following quarter.
|
On December 31, 2010, the closing price of a Holding Unit on the NYSE was $23.33 per Unit and there were 1,148 Holding Unitholders of record for approximately 80,000 beneficial owners. On December 31, 2010, there were 504 AllianceBernstein Unitholders of record, and we do not believe there are substantial additional beneficial owners.
Recent Sales of Unregistered Securities; Use of Proceeds from Registered Securities
We did not engage in any unregistered sales of our securities during the last three years.
Purchases of Equity Securities by the Issuer and Affiliated Purchasers
The following table provides information relating to any Holding Units bought by us or one of our affiliates in the fourth quarter of the fiscal year covered by this report:
Issuer Purchases of Equity Securities
|
(a)
Total Number of Holding Units Purchased
|
(b)
Average Price Paid Per Holding Unit, net of Commissions
|
(c)
Total Number of Holding Units Purchased as Part of Publicly Announced Plans or Programs
|
(d)
Maximum Number (or Approximate Dollar Value) of Holding Units that May Yet Be Purchased Under the Plans or Programs
|
|||||||||||||
|
Period
|
||||||||||||||||
|
10/1/10-10/31/10
(1)(2)
|
76,425 | $ | 24.46 | — | — | |||||||||||
|
11/1/10-11/30/10
(2)
|
1,578,900 | 24.15 | — | — | ||||||||||||
|
12/1/10-12/31/10
(2)(3)
|
2,133,502 | 23.21 | — | — | ||||||||||||
|
Total
|
3,788,827 | $ | 23.63 | — | — | |||||||||||
_____________
|
(1)
|
During October 2010, we purchased from employees 625 Holding Units to allow them to fulfill statutory withholding tax requirements at the time of distribution of long-term incentive compensation awards.
|
|
(2)
|
Between October 29, 2010 and December 15, 2010, we purchased 2,502,300 Holding Units on the open market to help fund anticipated obligations under our incentive compensation award program.
|
|
(3)
|
During December 2010, we purchased from employees 1,285,902 Holding Units to allow them to fulfill statutory withholding tax requirements at the time of distribution of long-term incentive compensation awards.
|
The following table provides information relating to any AllianceBernstein Units bought by us or one of our affiliates in the fourth quarter of the fiscal year covered by this report:
Issuer Purchases of Equity Securities
|
|
(a)
Total Number of AllianceBernstein Units Purchased
|
(b)
Average Price Paid Per AllianceBernstein Unit, net of Commissions
|
(c)
Total Number of AllianceBernstein Units Purchased as Part of Publicly Announced Plans or Programs
|
(d)
Maximum Number (or Approximate Dollar Value) of AllianceBernstein Units that May Yet Be Purchased Under the Plans or Programs
|
||||||||||||
|
|
||||||||||||||||
|
Period
|
||||||||||||||||
|
10/1/10-10/31/10
|
— | $ | — | — | — | |||||||||||
|
11/1/10-11/30/10
|
— | — | — | — | ||||||||||||
|
12/1/10-12/31/10
(1)
|
365,410 | 23.32 | — | — | ||||||||||||
|
Total
|
365,410 | $ | 23.32 | — | — | |||||||||||
_____________
|
(1)
|
On December 14, 2010, we purchased 365,410 AllianceBernstein Units in a private transaction.
|
|
Item
6.
|
Selected Financial Data
|
Alli
anceBernstein Holding L.P.
Selected Financial Data
|
Years Ended December 31,
|
||||||||||||||||||||
|
2010
|
2009
(1)
|
2008
(1)
|
2007
(1)
|
2006
(1)
|
||||||||||||||||
|
(in thousands, except per unit amounts)
|
||||||||||||||||||||
|
INCOME STATEMENT DATA:
|
||||||||||||||||||||
|
Equity in net income attributable to AllianceBernstein Unitholders
|
$ | 162,217 | $ | 192,513 | $ | 278,636 | $ | 415,256 | $ | 359,469 | ||||||||||
|
Income taxes
|
28,059 | 25,324 | 33,910 | 39,104 | 34,473 | |||||||||||||||
|
Net income
|
$ | 134,158 | $ | 167,189 | $ | 244,726 | $ | 376,152 | $ | 324,996 | ||||||||||
|
Basic net income per unit
|
$ | 1.33 | $ | 1.80 | $ | 2.79 | $ | 4.35 | $ | 3.85 | ||||||||||
|
Diluted net income per unit
|
$ | 1.32 | $ | 1.80 | $ | 2.79 | $ | 4.32 | $ | 3.82 | ||||||||||
|
CASH DISTRIBUTIONS PER UNIT
(2)
|
$ | 1.31 | $ | 1.77 | $ | 2.68 | $ | 4.33 | $ | 4.02 | ||||||||||
|
BALANCE SHEET DATA AT PERIOD END:
|
||||||||||||||||||||
|
Total assets
|
$ | 1,787,568 | $ | 1,800,075 | $ | 1,566,810 | $ | 1,583,762 | $ | 1,564,223 | ||||||||||
|
Partners’ capital
|
$ | 1,787,110 | $ | 1,797,892 | $ | 1,561,523 | $ | 1,575,988 | $ | 1,555,377 | ||||||||||
_____________
|
(1)
|
Certain prior-year amounts have been reclassified to conform to our 2010 presentation.
See Note 2 to
AllianceBernstein Holding’s consolidated financial statements in Item 8
for a discussion of reclassifications.
|
|
(2)
|
Holding is required to distribute all of its Available Cash Flow, as defined in the Holding Partnership Agreement, to its unitholders.
|
Allianc
eBernstein L.P.
Selected Consolidated Financial Data
|
Years Ended December 31,
|
||||||||||||||||||||
|
2010
|
2009
(1)
|
2008
(1)
|
2007
(1)
|
2006
(1)
|
||||||||||||||||
|
(in thousands, except per unit amounts and unless otherwise indicated)
|
||||||||||||||||||||
|
INCOME STATEMENT DATA:
|
||||||||||||||||||||
|
Revenues:
|
||||||||||||||||||||
|
Investment advisory and services fees
|
$ | 2,051,692 | $ | 1,920,332 | $ | 2,839,526 | $ | 3,386,188 | $ | 2,890,229 | ||||||||||
|
Bernstein research services
|
430,521 | 434,605 | 471,716 | 423,553 | 375,075 | |||||||||||||||
|
Distribution revenues
|
338,597 | 277,328 | 378,425 | 473,435 | 421,045 | |||||||||||||||
|
Dividend and interest income
|
22,902 | 26,730 | 91,752 | 284,014 | 266,520 | |||||||||||||||
|
Investment gains (losses)
|
(1,410 | ) | 144,447 | (349,172 | ) | 29,690 | 62,200 | |||||||||||||
|
Other revenues
|
109,803 | 107,848 | 118,436 | 122,869 | 123,171 | |||||||||||||||
|
Total revenues
|
2,952,105 | 2,911,290 | 3,550,683 | 4,719,749 | 4,138,240 | |||||||||||||||
|
Less: interest expense
|
3,548 | 4,411 | 36,524 | 194,432 | 187,833 | |||||||||||||||
|
Net revenues
|
2,948,557 | 2,906,879 | 3,514,159 | 4,525,317 | 3,950,407 | |||||||||||||||
|
Expenses:
|
||||||||||||||||||||
|
Employee compensation and benefits
|
1,322,522 | 1,298,053 | 1,454,691 | 1,833,796 | 1,547,627 | |||||||||||||||
|
Promotion and servicing:
|
||||||||||||||||||||
|
Distribution-related payments
|
286,676 | 234,203 | 307,890 | 378,547 | 331,335 | |||||||||||||||
|
Amortization of deferred sales commissions
|
47,397 | 54,922 | 79,111 | 95,481 | 100,370 | |||||||||||||||
|
Other
|
192,096 | 176,703 | 200,375 | 215,997 | 180,495 | |||||||||||||||
|
General and administrative:
|
||||||||||||||||||||
|
General and administrative
|
515,884 | 520,072 | 512,798 | 567,562 | 574,904 | |||||||||||||||
|
Real estate charges
|
101,698 | 8,276 | — | — | — | |||||||||||||||
|
Interest on borrowings
|
2,078 | 2,696 | 13,077 | 23,970 | 23,124 | |||||||||||||||
|
Amortization of intangible assets
|
21,344 | 21,126 | 20,716 | 20,716 | 20,710 | |||||||||||||||
|
Total expenses
|
2,489,695 | 2,316,051 | 2,588,658 | 3,136,069 | 2,778,565 | |||||||||||||||
|
Operating income
|
458,862 | 590,828 | 925,501 | 1,389,248 | 1,171,842 | |||||||||||||||
|
Non-operating income
|
6,760 | 33,657 | 18,728 | 15,756 | 20,196 | |||||||||||||||
|
Income before income taxes
|
465,622 | 624,485 | 944,229 | 1,405,004 | 1,192,038 | |||||||||||||||
|
Income taxes
|
38,523 | 45,977 | 95,803 | 127,845 | 75,045 | |||||||||||||||
|
Net income
|
427,099 | 578,508 | 848,426 | 1,277,159 | 1,116,993 | |||||||||||||||
|
Net loss (income) of consolidated entities attributable to non-controlling interests
|
15,320 | (22,381 | ) | (9,186 | ) | (16,715 | ) | (8,392 | ) | |||||||||||
|
Net income attributable to AllianceBernstein Unitholders
|
$ | 442,419 | $ | 556,127 | $ | 839,240 | $ | 1,260,444 | $ | 1,108,601 | ||||||||||
|
Basic net income per AllianceBernstein Unit
|
$ | 1.59 | $ | 2.07 | $ | 3.18 | $ | 4.80 | $ | 4.26 | ||||||||||
|
Diluted net income per AllianceBernstein Unit
|
$ | 1.58 | $ | 2.07 | $ | 3.18 | $ | 4.77 | $ | 4.22 | ||||||||||
|
Operating margin
(2)
|
16.1 | % | 19.6 | % | 26.1 | % | 30.3 | % | 29.5 | % | ||||||||||
|
CASH DISTRIBUTIONS PER ALLIANCEBERNSTEIN UNIT
(3)
|
$ | 1.58 | $ | 2.06 | $ | 3.07 | $ | 4.77 | $ | 4.42 | ||||||||||
|
BALANCE SHEET DATA AT PERIOD END:
|
||||||||||||||||||||
|
Total assets
|
$ | 7,579,387 | $ | 7,214,940 | $ | 8,503,459 | $ | 9,368,754 | $ | 10,601,105 | ||||||||||
|
Debt
|
$ | 224,991 | $ | 248,987 | $ | 284,779 | $ | 533,872 | $ | 334,901 | ||||||||||
|
Total Capital
|
$ | 4,493,151 | $ | 4,701,955 | $ | 4,486,826 | $ | 4,688,878 | $ | 4,624,512 | ||||||||||
|
ASSETS UNDER MANAGEMENT AT PERIOD END (in millions)
(4)
|
$ | 478,019 | $ | 486,683 | $ | 448,808 | $ | 790,478 | $ | 705,920 | ||||||||||
_____________
|
(1)
|
Certain prior-year amounts have been reclassified to conform to our 2010 presentation.
See Note 2 to
AllianceBernstein’s c
onsolidated financial statements in Item 8
for a discussion of reclassifications.
|
|
(2)
|
Operating income including net (income) loss attributable to non-controlling interests as a percentage of net revenues.
|
|
(3)
|
AllianceBernstein is required to distribute all of its Available Cash Flow, as defined in the AllianceBernstein Partnership Agreement, to its unitholders and the General Partner.
|
|
(4)
|
Previously reported preliminary assets under management for December 31, 2010 and prior periods have been adjusted by removing from our AUM an affiliated account for which we serve in an advisory capacity and do not have discretionary trading authority.
|
|
Management’s Discussion and Analysis of Financial Condition and Results of Operations
|
Percentage change figures are calculated using assets under management rounded to the nearest million and financial statement amounts rounded to the nearest thousand.
Exec
utive Overview
Our firm continued to grow in 2010, with improvement in our average assets under management (
“AUM”
) and higher gross sales. Net outflows still present a challenge for us, mainly in our equity services within the Institutions channel, but in general our firm’s recovery continues, with a reduction in net outflows of 19.4% from 2009 to 2010.
The capital markets in 2010 ended on a positive note, but the year overall was challenging. Volatility was the dominant theme throughout, initiated by the Greek sovereign debt crisis and amplified over the year by other macro-economic concerns, including the possibility of deflation, a double-dip recession and finally the Irish debt situation. These macro threats further strengthened the widespread risk aversion among investors still recovering from the historic market drop in 2008. As a result, general de-risking continued in 2010, with asset flows directed primarily towards investments like fixed income and cash. Our focus on expanding our fixed income franchise benefited in this regard, as did our continued product innovation around risk-mitigating services, including Dynamic Asset Allocation and Secure Retirement Strategies, a new “guaranteed income” solution backed by multiple insurers for defined contribution plan sponsors.
Investment performance over the year varied by service and by time period. In Fixed Income, we continued to outperform benchmarks across almost all of our services, both for the year and the fourth quarter. In equities, the heightened volatility and risk aversion combined to drive market correlations to levels experienced during the depths of the 2008 financial crisis. In this environment, with stocks rising and falling almost in unison in response to various macro-economic concerns and not based on their fundamentals, our stock-selection discipline went largely unrewarded. When the markets settled and correlations declined in the third and particularly the fourth quarter of 2010, the performance of our equity services relative to both benchmarks and peer averages recovered well. However, poor performance in the second quarter, when volatility and correlations were at their highest, impacted full year performance. As a result, many of our equity services underperformed their benchmarks for the full year.
Our total AUM as of December 31, 2010 was $478.0 billion, down $8.7 billion, or 1.8%, during 2010. This decrease in AUM was driven by net outflows of $56.2 billion, partly offset by market appreciation of $39.5 billion and an additional inflow of $8.0 billion in October 2010 from the acquisition of an alternative investments group (
“Alternatives Acquisition”
). Net outflows occurred in our Value and Growth Equity services and primarily in our Institutions channel, while our Fixed Income and Other services experienced modest net inflows.
Institutional AUM decreased $18.3 billion, or 6.3%, to $272.9 billion during 2010, primarily due to net outflows of $46.9 billion partly offset by market appreciation of $20.8 billion and the additional inflow of $8.0 billion in October 2010 from the Alternatives Acquisition. Our pipeline of won but unfunded mandates increased to $6.4 billion from $3.6 billion during 2010.
Retail AUM increased $6.3 billion, or 5.3%, to $127.0 billion, during 2010 due to market appreciation of $13.7 billion partly offset by net outflows of $7.4 billion. Gross sales in Retail were up 44% year over year, with much of that growth attributable to fixed income services and non-U.S. markets, particularly Asian markets.
Private Client AUM increased $3.3 billion, or 4.4%, to $78.1 billion during 2010 primarily due to market appreciation of $5.0 billion, partly offset by net outflows of $1.9 billion. We experienced little client attrition in this business despite the volatility experienced in the markets, largely due to the trust clients have in their Bernstein advisors and our holistic approach to planning. The roll-out of Dynamic Asset Allocation, our risk-mitigating overlay service, also played a role. The launch of this service proved to be a great success, with over 50% of eligible clients transitioning to the service in the first year of its implementation.
Bernstein Research Services revenues during 2010 were $430.5 million, down $4.1 million, or 0.9%, as compared to 2009. The decrease was driven by lower equity market transaction volumes in the U.S., partially offset by higher aggregate value of securities traded in Europe. We continue to expand this channel globally, making strategic investments in our Asian research and global trading platforms.
Our full year 2010 net revenues increased $41.7 million, or 1.4%, compared to 2009, primarily due to a $131.4 million, or 6.8%, increase in investment advisory and services fees and a $61.3 million, or 22.1%, increase in distribution revenues. Offsetting these increases was a negative impact from investment gains (losses) of $145.9 million, primarily a result of lower deferred compensation investment gains and incremental mark-to-market losses related to our consolidated venture capital fund investments. Full year 2010 operating expenses increased $173.6 million, or 7.5%, compared to 2009 primarily due to increases of $93.4 million and $60.4 million, respectively, in real estate charges and promotion and servicing expenses, reflecting higher distribution-related expenses. Accordingly, 2010 diluted net income per Holding Unit fell to $1.32, down 26.7% compared to $1.80 for 2009. In addition, our operating margin decreased 350 basis points from 19.6% in 2009 to 16.1% in 2010. In comparison, our adjusted income per Holding Unit of $1.60 in 2010 reflects a year-over-year increase of 15.9% compared to $1.38 in 2009, while our adjusted operating margin improved from 18.4% in 2009 to 21.3% in 2010.
For additional information regarding our adjusted results, see “Non-GAAP Measures” in this Item 7
.
AllianceBernstein continues to maintain a solid balance sheet, with no long-term debt and strong credit ratings. During 2010, we repurchased 8.8 million Holding Units for $226.4 million (reflecting open-market purchases of 7.4 million Holding Units for $195.3 million and the remainder primarily relating to employee tax withholding purchases), which minimized the dilutive effect of granting restricted Holding Unit incentive compensation awards. Finally, as a Master Limited Partnership, we generally distribute 100% of earnings, which, in 2010, translated into a dividend yield of 6.5% as of December 31, 2010, based on distributions paid in 2010 and the December 31, 2010 Holding Unit price. As ever, we remain focused on delivering long-term value for all of our stakeholders.
Hol
ding
Holding’s principal source of income and cash flow is attributable to its investment in AllianceBernstein limited partnership Units. The Holding financial statements and notes and management’s discussion and analysis of financial condition and results of operations (
“MD&A”
) should be read in conjunction with those of AllianceBernstein.
Results of Operations
|
Years Ended December 31,
|
% Change
|
|||||||||||||||||||
|
2010
|
2009
|
2008
|
2010-09 | 2009-08 | ||||||||||||||||
|
(in thousands, except per unit amounts)
|
||||||||||||||||||||
|
Net income attributable to AllianceBernstein Unitholders
|
$ | 442,419 | $ | 556,127 | $ | 839,240 | (20.4 | )% | (33.7 | )% | ||||||||||
|
Weighted average equity ownership interest
|
36.7 | % | 34.6 | % | 33.2 | % | ||||||||||||||
|
Equity in net income attributable to AllianceBernstein Unitholders
|
$ | 162,217 | $ | 192,513 | $ | 278,636 | (15.7 | ) | (30.9 | ) | ||||||||||
|
Net income of Holding
|
$ | 134,158 | $ | 167,189 | $ | 244,726 | (19.8 | ) | (31.7 | ) | ||||||||||
|
Diluted net income per Holding Unit
|
$ | 1.32 | $ | 1.80 | $ | 2.79 | (26.7 | ) | (35.5 | ) | ||||||||||
|
Distribution per Holding Unit
(1)
|
$ | 1.31 | $ | 1.77 | $ | 2.68 | (26.0 | ) | (34.0 | ) | ||||||||||
_____________
|
(1)
|
2008 distribution excludes a $35.3 million insurance reimbursement.
|
Net income in 2010 decreased $33.0 million to $134.2 million from net income of $167.2 million in 2009. Net income in 2009 decreased $77.5 million to $167.2 million from net income of $244.7 million in 2008. The decreases reflect lower net income attributable to AllianceBernstein Unitholders, partially offset by a higher ownership interest in AllianceBernstein resulting from the acquisition of additional AllianceBernstein Units in connection with the issuance of Holding Units to AllianceBernstein to fund deferred compensation plan awards.
Holding’s income taxes represent a 3.5% federal tax on its partnership gross income from the active conduct of a trade or business. Holding’s partnership gross income is derived from its interest in AllianceBernstein. Holding’s income tax is computed by multiplying its ownership interest in AllianceBernstein by 3.5% of certain AllianceBernstein revenues (primarily investment advisory fees and SCB LLC transaction charges). During 2010, both AllianceBernstein’s revenues and Holding’s ownership interest in AllianceBernstein increased as compared to 2009, which increased Holding’s income tax provision in 2010 as compared to the prior year. In addition, AllianceBernstein’s net income decreased significantly in 2010 primarily as a result of a real estate charge in the third quarter of 2010, reducing Holding’s equity earnings in 2010 compared to the corresponding period in 2009. As a result of these factors, Holding’s effective tax rate increased from 13.2% in 2009 to 17.3% in 2010. During 2009, Holding’s ownership interest in AllianceBernstein increased while AllianceBernstein’s revenues decreased as compared to 2008. As a result, Holding’s effective tax rate increased from 12.2% in 2008 to 13.2% in 2009.
As supplemental information, AllianceBernstein provides the performance measures “Adjusted net revenue”, “Adjusted operating income” and “Adjusted operating margin”, which are the principle metrics management uses in evaluating and comparing the period-to-period operating performance of AllianceBernstein. Such measures are not based on generally accepted accounting principles (
“non-GAAP measures”
). The impact of these non-GAAP measures on Holding’s net income and diluted net income per Holding Unit are as follows:
|
Years Ended December 31,
|
||||||||||||
|
2010
|
2009
|
2008
|
||||||||||
|
(in thousands, except per unit amounts)
|
||||||||||||
|
|
|
|
||||||||||
|
Net income – diluted, GAAP basis
|
$ | 135,798 | $ | 167,517 | $ | 245,859 | ||||||
|
Impact on net income of AllianceBernstein non-GAAP adjustments
|
28,378 | (38,830 | ) | 54,022 | ||||||||
|
Adjusted net income - diluted
|
$ | 164,176 | $ | 128,687 | $ | 299,881 | ||||||
|
Diluted net income per Holding Unit, GAAP basis
|
$ | 1.32 | $ | 1.80 | $ | 2.79 | ||||||
|
Impact of AllianceBernstein non-GAAP adjustments
|
0.28 | (0.42 | ) | 0.61 | ||||||||
|
Adjusted diluted net income per Holding Unit
|
$ | 1.60 | $ | 1.38 | $ | 3.40 | ||||||
These non-GAAP measures are provided in addition to, and not as substitutes for, net revenues, operating income and operating margin, and they may not be comparable to non-GAAP measures presented by other companies. Management uses both the GAAP and non-GAAP measures in evaluating our financial performance. The non-GAAP measures alone may pose limitations because they do not include all of our revenues and expenses.
Proposed Tax Legislation
See “Risk Factors” in Item 1A.
Capital Resources and Liquidity
During the year ended December 31, 2010, net cash provided by operating activities was $151.4 million, compared to $133.1 million during the corresponding 2009 period. The increase was primarily due to higher cash distributions received from AllianceBernstein of $22.3 million. During the year ended December 31, 2009, net cash provided by operating activities was $133.1 million, compared to $301.4 million during the corresponding 2008 period. The decrease was primarily due to lower cash distributions received from AllianceBernstein of $178.3 million.
During the years ended December 31, 2010, 2009 and 2008, net cash used in investing activities was $8.3 million, zero and $13.5 million, respectively, reflecting investments in AllianceBernstein with proceeds from exercises of compensatory options to buy Holding Units.
During the year ended December 31, 2010, net cash used in financing activities was $143.1 million, compared to $133.1 million during the corresponding 2009 period. The increase was due to higher cash distributions paid to unitholders of $18.3 million, offset by proceeds from the exercise of compensatory options to buy Holding Units during 2010 of $8.3 million. During the year ended December 31, 2009, net cash used in financing activities was $133.1 million, compared to $287.9 million during the corresponding 2008 period. The decrease was due to lower cash distributions paid to unitholders of $168.3 million, offset by proceeds from the exercise of compensatory options to buy Holding Units during 2008 of $13.5 million.
Holding is required to distribute all of its Available Cash Flow, as defined in the Holding Partnership Agreement, to its unitholders (including the General Partner). Typically, Available Cash Flow is the diluted earnings per unit for the quarter multiplied by the number of units outstanding at the end of the quarter. However, the General Partner, in its sole discretion, can retain cash flow for use in the business.
See Note 2 to Holding’s financial statements in Item 8
for a description of Available Cash Flow. Management believes that the cash flow realized from its investment in AllianceBernstein will provide Holding with the resources to meet its financial obligations.
Commitments and Contingencies
See Note 7 to Holding’s financial statements in Item 8.
Allia
nceBernstein
Assets Under Management
Assets under management by distribution channel were as follows:
|
As of December 31,
|
% Change
|
|||||||||||||||||||
|
2010
|
2009
|
2008
|
2010-09 | 2009-08 | ||||||||||||||||
|
(in billions)
|
||||||||||||||||||||
|
|
|
|
||||||||||||||||||
|
Institutions
(1)
|
$ | 272.9 | $ | 291.2 | $ | 278.2 | (6.3 | )% | 4.7 | % | ||||||||||
|
Retail
|
127.0 | 120.7 | 101.6 | 5.3 | 18.7 | |||||||||||||||
|
Private Client
|
78.1 | 74.8 | 69.0 | 4.4 | 8.4 | |||||||||||||||
|
Total
|
$ | 478.0 | $ | 486.7 | $ | 448.8 | (1.8 | ) | 8.4 | |||||||||||
|
(1)
|
Previously reported preliminary assets under management for December 31, 2010 and prior periods have been adjusted by removing from our AUM an affiliated account for which we serve in an advisory capacity and do not have discretionary trading authority.
|
Assets under management by investment service were as follows:
|
As of December 31,
|
% Change
|
|||||||||||||||||||
|
2010
|
2009
|
2008
|
2010-09 | 2009-08 | ||||||||||||||||
|
(in billions)
|
||||||||||||||||||||
|
Equity
|
||||||||||||||||||||
|
Value:
|
||||||||||||||||||||
|
U.S.
|
$ | 37.8 | $ | 44.4 | $ | 47.9 | (14.9 | )% | (7.3 | )% | ||||||||||
|
Global & international
|
106.5 | 126.8 | 124.5 | (16.0 | ) | 1.8 | ||||||||||||||
| 144.3 | 171.2 | 172.4 | (15.7 | ) | (0.7 | ) | ||||||||||||||
|
Growth:
|
||||||||||||||||||||
|
U.S.
|
30.3 | 38.1 | 33.0 | (20.3 | ) | 15.4 | ||||||||||||||
|
Global & international
|
44.0 | 56.0 | 55.3 | (21.5 | ) | 1.4 | ||||||||||||||
| 74.3 | 94.1 | 88.3 | (21.0 | ) | 6.6 | |||||||||||||||
|
Total Equity
|
218.6 | 265.3 | 260.7 | (17.6 | ) | 1.8 | ||||||||||||||
|
Fixed Income:
|
||||||||||||||||||||
|
U.S.
|
119.0 | 112.3 | 105.3 | 6.0 | 6.7 | |||||||||||||||
|
Global & international
|
87.2 | 72.0 | 58.7 | 21.1 | 22.6 | |||||||||||||||
| 206.2 | 184.3 | 164.0 | 11.9 | 12.4 | ||||||||||||||||
|
Other
(1)(2)
:
|
||||||||||||||||||||
|
U.S.
|
28.7 | 26.1 | 16.5 | 9.9 | 58.3 | |||||||||||||||
|
Global & international
|
24.5 | 11.0 | 7.6 | 122.3 | 44.0 | |||||||||||||||
| 53.2 | 37.1 | 24.1 | 43.2 | 53.8 | ||||||||||||||||
|
Total:
|
||||||||||||||||||||
|
U.S.
|
215.8 | 220.9 | 202.7 | (2.3 | ) | 9.0 | ||||||||||||||
|
Global & international
|
262.2 | 265.8 | 246.1 | (1.4 | ) | 8.0 | ||||||||||||||
|
Total
|
$ | 478.0 | $ | 486.7 | $ | 448.8 | (1.8 | ) | 8.4 | |||||||||||
_____________
|
(1)
|
Previously reported preliminary assets under management for December 31, 2010 and prior periods have been adjusted by removing from our AUM an affiliated account for which we serve in an advisory capacity and do not have discretionary trading authority.
|
|
(2)
|
Includes index, structured, asset allocation services and other non-actively managed AUM.
|
Changes in assets under management during 2010 and 2009 were as follows:
|
Distribution Channel
|
Investment Service
|
|||||||||||||||||||||||||||||||||||
|
Institutions
(1)
|
Retail
|
Private
Client
|
Total
|
Value
Equity
|
Growth
Equity
|
Fixed
Income
|
Other
(1)(2)
|
Total
|
||||||||||||||||||||||||||||
|
(in billions)
|
||||||||||||||||||||||||||||||||||||
|
Balance as of December 31, 2009
|
$ | 291.2 | $ | 120.7 | $ | 74.8 | $ | 486.7 | $ | 171.2 | $ | 94.1 | $ | 184.3 | $ | 37.1 | $ | 486.7 | ||||||||||||||||||
|
Long-term flows:
|
||||||||||||||||||||||||||||||||||||
|
Sales/new accounts
|
19.2 | 33.2 | 7.6 | 60.0 | 11.0 | 5.6 | 39.3 | 4.1 | 60.0 | |||||||||||||||||||||||||||
|
Redemptions/terminations
|
(52.1 | ) | (32.3 | ) | (6.0 | ) | (90.4 | ) | (38.5 | ) | (26.2 | ) | (23.7 | ) | (2.0 | ) | (90.4 | ) | ||||||||||||||||||
|
Cash flow/unreinvested dividends
|
(14.0 | ) | (8.3 | ) | (3.5 | ) | (25.8 | ) | (12.4 | ) | (7.3 | ) | (6.6 | ) | 0.5 | (25.8 | ) | |||||||||||||||||||
|
Net long-term (outflows) inflows
|
(46.9 | ) | (7.4 | ) | (1.9 | ) | (56.2 | ) | (39.9 | ) | (27.9 | ) | 9.0 | 2.6 | (56.2 | ) | ||||||||||||||||||||
|
Transfers
|
(0.2 | ) | — | 0.2 | — | — | — | — | — | — | ||||||||||||||||||||||||||
|
Acquisition
|
8.0 | — | — | 8.0 | — | — | — | 8.0 | 8.0 | |||||||||||||||||||||||||||
|
Market appreciation
|
20.8 | 13.7 | 5.0 | 39.5 | 13.0 | 8.1 | 12.9 | 5.5 | 39.5 | |||||||||||||||||||||||||||
|
Net change
|
(18.3 | ) | 6.3 | 3.3 | (8.7 | ) | (26.9 | ) | (19.8 | ) | 21.9 | 16.1 | (8.7 | ) | ||||||||||||||||||||||
|
Balance as of December 31, 2010
|
$ | 272.9 | $ | 127.0 | $ | 78.1 | $ | 478.0 | $ | 144.3 | $ | 74.3 | $ | 206.2 | $ | 53.2 | $ | 478.0 | ||||||||||||||||||
|
|
Distribution Channel
|
Investment Service
|
||||||||||||||||||||||||||||||||||
|
Institutions
(1)
|
Retail
|
Private
Client
|
Total
|
Value
Equity
|
Growth
Equity
|
Fixed
Income
|
Other
(1)(2)
|
Total
|
||||||||||||||||||||||||||||
|
|
(in billions)
|
|||||||||||||||||||||||||||||||||||
|
|
||||||||||||||||||||||||||||||||||||
|
Balance as of December 31, 2008
|
$ | 278.2 | $ | 101.6 | $ | 69.0 | $ | 448.8 | $ | 172.4 | $ | 88.3 | $ | 164.0 | $ | 24.1 | $ | 448.8 | ||||||||||||||||||
|
Long-term flows:
|
||||||||||||||||||||||||||||||||||||
|
Sales/new accounts
|
16.2 | 23.0 | 7.5 | 46.7 | 8.7 | 6.4 | 24.6 | 7.0 | 46.7 | |||||||||||||||||||||||||||
|
Redemptions/terminations
|
(56.2 | ) | (25.8 | ) | (8.0 | ) | (90.0 | ) | (46.3 | ) | (22.2 | ) | (19.9 | ) | (1.6 | ) | (90.0 | ) | ||||||||||||||||||
|
Cash flow/unreinvested dividends
|
(13.5 | ) | (6.4 | ) | (6.5 | ) | (26.4 | ) | (11.8 | ) | (6.1 | ) | (7.9 | ) | (0.6 | ) | (26.4 | ) | ||||||||||||||||||
|
Net long-term (outflows) inflows
|
(53.5 | ) | (9.2 | ) | (7.0 | ) | (69.7 | ) | (49.4 | ) | (21.9 | ) | (3.2 | ) | 4.8 | (69.7 | ) | |||||||||||||||||||
|
Transfers
|
0.2 | — | (0.2 | ) | — | — | — | — | — | — | ||||||||||||||||||||||||||
|
Market appreciation
|
66.3 | 28.3 | 13.0 | 107.6 | 48.2 | 27.7 | 23.5 | 8.2 | 107.6 | |||||||||||||||||||||||||||
|
Net change
|
13.0 | 19.1 | 5.8 | 37.9 | (1.2 | ) | 5.8 | 20.3 | 13.0 | 37.9 | ||||||||||||||||||||||||||
|
Balance as of December 31, 2009
|
$ | 291.2 | $ | 120.7 | $ | 74.8 | $ | 486.7 | $ | 171.2 | $ | 94.1 | $ | 184.3 | $ | 37.1 | $ | 486.7 | ||||||||||||||||||
_____________
|
(1)
|
Previously reported preliminary assets under management for December 31, 2010 and prior periods have been adjusted by removing from our AUM an affiliated account for which we serve in an advisory capacity and do not have discretionary trading authority.
|
|
(2)
|
Includes index, structured, asset allocation services and other non-actively managed AUM.
|
Average assets under management by distribution channel and investment service were as follows:
|
Years Ended December 31,
|
% Change
|
|||||||||||||||||||
|
2010
|
2009
|
2008
|
2010-09 | 2009-08 | ||||||||||||||||
|
(in billions)
|
||||||||||||||||||||
|
Distribution Channel:
|
||||||||||||||||||||
|
Institutions
(1)
|
$ | 277.1 | $ | 272.6 | $ | 415.5 | 1.7 | % | (34.4 | )% | ||||||||||
|
Retail
|
122.8 | 105.1 | 145.4 | 16.8 | (27.7 | ) | ||||||||||||||
|
Private Client
|
74.7 | 68.6 | 93.2 | 8.9 | (26.4 | ) | ||||||||||||||
|
Total
|
$ | 474.6 | $ | 446.3 | $ | 654.1 | 6.3 | (31.8 | ) | |||||||||||
|
Investment Service:
|
||||||||||||||||||||
|
Value Equity
|
$ | 153.5 | $ | 160.6 | $ | 297.9 | (4.4 | )% | (46.1 | )% | ||||||||||
|
Growth Equity
|
81.3 | 86.1 | 152.6 | (5.5 | ) | (43.6 | ) | |||||||||||||
|
Fixed Income
|
198.9 | 170.8 | 182.2 | 16.4 | (6.2 | ) | ||||||||||||||
|
Other
(1)(2)
|
40.9 | 28.8 | 21.4 | 41.7 | 34.6 | |||||||||||||||
|
Total
|
$ | 474.6 | $ | 446.3 | $ | 654.1 | 6.3 | (31.8 | ) | |||||||||||
_____________
|
(1)
|
Previously reported preliminary assets under management for December 31, 2010 and prior periods have been adjusted by removing from our AUM an affiliated account for which we serve in an advisory capacity and do not have discretionary trading authority.
|
|
(2)
|
Includes index, structured, asset allocation services and other non-actively managed AUM.
|
Our Institutions channel AUM began 2008 at $498.2 billion and ended the year at $278.2 billion. This $220.0 billion decrease in AUM during 2008 was primarily driven by market depreciation of $194.1 billion and net outflows of $15.2 billion. The market depreciation and net outflows increased during the second half of 2008 resulting in an average AUM of $415.5 billion. AUM declined significantly in the first two months of 2009, resulting in AUM of $235.5 billion at February 28, 2009. The decline was primarily driven by market depreciation of $32.5 billion and net outflows of $10.4 billion. During the remainder of 2009, AUM increased to $291.2 billion at December 31, 2009, resulting in average AUM of $272.6 billion for 2009. The increase in AUM of $13.0 billion during 2009 was primarily due to market appreciation of $66.3 billion, partly offset by net outflows $53.5 billion occurring across all services. Institutional AUM ended 2010 at $272.9 billion with an average AUM of $277.1 billion for 2010. The $18.3 billion decrease in AUM was primarily due to net outflows of $46.9 billion, partly offset by market appreciation of $20.8 billion and an additional inflow of $8.0 billion in October 2010 from the acquisition of an alternative investments group. Market appreciation occurred across all services. We experienced net outflows in all services except Fixed Income.
Our Retail channel AUM began 2008 at $183.2 billion and ended the year at $101.6 billion. This $81.6 billion decrease in AUM was primarily the result of market depreciation of $67.1 billion and net outflows of $25.1 billion. The market depreciation and net outflows increased during the second half of 2008 resulting in an average AUM of $145.4 billion. AUM declined significantly in the first two months of 2009, resulting in Retail AUM of $85.3 billion at February 28, 2009. The decline was primarily driven by market depreciation of $12.9 billion. During the remainder of 2009, AUM increased to $120.7 billion at December 31, 2009, resulting in average AUM of $105.1 billion for 2009. The increase in AUM of $19.1 billion during 2009 was primarily the result of market appreciation of $28.3 billion, partly offset by net outflows of $9.2 billion. The market appreciation was across all services. Net outflows were in Value Equity and Growth Equity, partly offset by net inflows in Fixed Income and Other services. Retail AUM ended 2010 at $127.0 billion for an average AUM of $122.8 billion. During 2010, Retail AUM reached a high of $128.4 billion at April 30, 2010 and a low of $116.2 billion at June 30, 2010. The $6.3 billion increase in AUM during 2010 was due to market appreciation of $13.7 billion, partly offset by net outflows of $7.4 billion. Market appreciation occurred across all services. Net outflows were in Value Equity and Growth Equity services, partly offset by net inflows in Fixed Income and Other services.
Our Private Client channel AUM began 2008 at $109.1 billion and ended the year at $69.0 billion. This $40.1 billion decrease in AUM was the result of market depreciation of $35.4 billion and net outflows of $4.7 billion. The market depreciation and net outflows increased during the second half of 2008 resulting in an average AUM of $93.2 billion for the year. AUM declined significantly during the first two months of 2009 resulting in Private Client AUM of $60.6 billion at February 28, 2009. The decline was primarily driven by market depreciation of $6.3 billion. During the remainder of 2009, Private Client AUM increased to $74.8 billion at December 31, 2009, resulting in average AUM of $68.6 billion. The increase in AUM of $5.8 billion during 2009 was primarily the result of market appreciation of $13.0 billion, partly offset by net outflows of $7.0 billion. The market appreciation was across all services, while net outflows were across all services except Other services. Private Client AUM declined from $74.8 billion at December 31, 2009 to $70.9 billion at June 30, 2010. During the remainder of 2010, Private Client AUM increased to $78.1 billion at December 31, 2010, resulting in average AUM of $74.7 billion for 2010. The $3.3 billion increase in AUM was primarily due to market appreciation of $5.0 billion, partly offset by net outflows of $1.9 billion. The market appreciation was across all services. Net outflows were in Value Equity and Growth Equity services, partly offset by net inflows in Fixed Income and Other services.
Annualized absolute investment composite returns and relative performance compared to benchmarks for certain representative Value, Growth, Blend and Fixed Income services were as follows for the years ended December 31:
|
2010
|
2009
|
2008
|
||||||||||
|
Global Value
|
||||||||||||
|
Annualized return
|
6.5 | % | 35.8 | % | (50.8 | ) % | ||||||
|
Relative return (vs. MSCI World Index – net)
|
(5.3 | ) | 5.8 | (10.1 | ) | |||||||
|
International Value
|
||||||||||||
|
Annualized return
|
3.4 | 36.1 | (50.7 | ) | ||||||||
|
Relative return (vs. MSCI EAFE Index – net)
|
(4.4 | ) | 4.3 | (7.3 | ) | |||||||
|
Japan Value
|
||||||||||||
|
Annualized return
|
19.1 | 12.5 | (34.7 | ) | ||||||||
|
Relative return (vs. TOPIX)
|
3.3 | 7.7 | (7.9 | ) | ||||||||
|
U.S. Diversified Value
|
||||||||||||
|
Annualized return
|
12.6 | 21.2 | (41.2 | ) | ||||||||
|
Relative return (vs. Russell 1000 Value Index)
|
(2.9 | ) | 1.5 | (4.3 | ) | |||||||
|
Global Research Growth
|
||||||||||||
|
Annualized return
|
8.8 | 31.9 | (52.8 | ) | ||||||||
|
Relative return (vs. MSCI World Index – net)
|
(3.0 | ) | 1.9 | (12.1 | ) | |||||||
|
Global Thematic Research Growth
|
||||||||||||
|
Annualized return
|
20.0 | 55.4 | n/a | |||||||||
|
Relative return (vs. MCSI ACWI
–
net)
|
7.3 | 20.7 | n/a | |||||||||
|
International Large Cap Growth
|
||||||||||||
|
Annualized return
|
4.2 | 32.3 | (50.7 | ) | ||||||||
|
Relative return (vs. MSCI EAFE Index – net)
|
(3.6 | ) | 0.5 | (7.3 | ) | |||||||
|
U.S. Large Cap Growth
|
||||||||||||
|
Annualized return
|
9.8 | 36.9 | (40.1 | ) | ||||||||
|
Relative return (vs. Russell 1000 Growth Index)
|
(6.9 | ) | (0.3 | ) | (1.7 | ) | ||||||
|
Global Blend
|
||||||||||||
|
Annualized return
|
7.2 | 34.3 | (51.9 | ) | ||||||||
|
Relative return (vs. MSCI World Index – net)
|
(4.6 | ) | 4.3 | (11.2 | ) | |||||||
|
International Blend
|
||||||||||||
|
Annualized return
|
4.2 | 34.5 | (50.3 | ) | ||||||||
|
Relative return (vs. MSCI EAFE Index – net)
|
(3.5 | ) | 2.8 | (6.9 | ) | |||||||
|
Emerging Market Blend
|
||||||||||||
|
Annualized return
|
14.7 | 88.8 | (56.8 | ) | ||||||||
|
Relative return (vs. MSCI EM Index – net)
|
(4.2 | ) | 10.3 | (3.4 | ) | |||||||
|
Strategic Core Plus (fixed income)
|
||||||||||||
|
Annualized return
|
9.5 | 18.8 | (5.4 | ) | ||||||||
|
Relative return (vs. Custom Index)
|
2.9 | 12.4 | (10.1 | ) | ||||||||
|
Global Plus (fixed income)
|
||||||||||||
|
Annualized return
|
8.4 | 17.8 | (8.1 | ) | ||||||||
|
Relative return (vs. Barclays Global Aggregate)
|
2.8 | 10.9 | (12.9 | ) | ||||||||
|
Emerging Market Debt (fixed income)
|
||||||||||||
|
Annualized return
|
15.1 | 44.3 | (18.0 | ) | ||||||||
|
Relative return (vs. JMP EMBI Global)
|
3.1 | 16.2 | (7.1 | ) | ||||||||
Consolidated Results of Operations
|
Years Ended December 31,
|
% Change
|
|||||||||||||||||||
|
2010
|
2009
|
2008
|
2010-09 | 2009-08 | ||||||||||||||||
|
(in millions, except per unit amounts)
|
||||||||||||||||||||
|
Net revenues
|
$ | 2,948.6 | $ | 2,906.9 | $ | 3,514.2 | 1.4 | % | (17.3 | )% | ||||||||||
|
Expenses
|
2,489.7 | 2,316.1 | 2,588.7 | 7.5 | (10.5 | ) | ||||||||||||||
|
Operating income
|
458.9 | 590.8 | 925.5 | (22.3 | ) | (36.2 | ) | |||||||||||||
|
Non-operating income
|
6.7 | 33.7 | 18.7 | (79.9 | ) | 79.7 | ||||||||||||||
|
Income before income taxes
|
465.6 | 624.5 | 944.2 | (25.4 | ) | (33.9 | ) | |||||||||||||
|
Income taxes
|
38.5 | 46.0 | 95.8 | (16.2 | ) | (52.0 | ) | |||||||||||||
|
Net income
|
427.1 | 578.5 | 848.4 | (26.2 | ) | (31.8 | ) | |||||||||||||
|
Net loss (income) of consolidated entities attributable to non-controlling interests
|
15.3 | (22.4 | ) | (9.2 | ) | n/m | 143.6 | |||||||||||||
|
Net income attributable to AllianceBernstein Unitholders
|
$ | 442.4 | $ | 556.1 | $ | 839.2 | (20.4 | ) | (33.7 | ) | ||||||||||
|
Diluted net income per AllianceBernstein Unit
|
$ | 1.58 | $ | 2.07 | $ | 3.18 | (23.7 | ) | (34.9 | ) | ||||||||||
|
Distributions per AllianceBernstein Unit
(1)
|
$ | 1.58 | $ | 2.06 | $ | 3.07 | (23.3 | ) | (32.9 | ) | ||||||||||
|
Operating margin
(2)
|
16.1 | % | 19.6 | % | 26.1 | % | ||||||||||||||
_____________
|
(1)
|
2008 distribution excludes a $35.3 million insurance reimbursement.
|
|
(2)
|
Operating income including net loss (income) attributable to non-controlling interests as a percentage of net revenues.
|
Net income attributable to AllianceBernstein Unitholders for the year ended December 31, 2010 decreased $113.7 million, or 20.4%, from the year ended December 31, 2009. The decrease was primarily due to (in millions):
| $ | (93.4 | ) |
Lower deferred compensation investments gains
|
| (93.4 | ) |
Higher real estate charges
|
|
| (31.0 | ) |
Higher incentive compensation
|
|
| (27.0 | ) |
Lower non-operating income
|
|
| (11.8 | ) |
Higher travel and entertainment
|
|
| (11.4 | ) |
Higher other employment costs (recruitment, temporary help and training)
|
|
| (9.8 | ) |
Lower seed money investment gains
|
|
| (9.3 | ) |
Lower performance fees
|
|
| (7.7 | ) |
Higher fringe benefits (payroll taxes and medical insurance)
|
|
| (5.1 | ) |
Higher commissions
|
|
| (4.1 | ) |
Lower Bernstein research services revenues
|
|
| 140.7 |
Higher investment advisory base fees
|
||
| 30.7 |
Lower base compensation (salaries and severance)
|
||
| 16.3 |
Higher distribution revenues (net of plan payments and amortization)
|
||
| 7.5 |
Lower income taxes
|
||
| (4.9 | ) |
Other
|
|
| $ | (113.7 | ) |
Net income attributable to AllianceBernstein Unitholders for the year ended December 31, 2009 decreased $283.1 million, or 33.7%, from the year ended December 31, 2008. The decrease was primarily due to (in millions):
| $ | (935.6 | ) |
Lower investment advisory base fees
|
| (143.3 | ) |
Higher incentive compensation expense
|
|
| (37.1 | ) |
Lower Bernstein Research Services revenues
|
|
| (35.3 | ) |
2008 insurance reimbursement
|
|
| (20.5 | ) |
Lower foreign exchange gains
|
|
| 493.7 |
Higher investment gains, primarily deferred compensation $445.5 million
|
||
| 168.6 |
Lower commission expense
|
||
| 131.4 |
Lower base, fringes and other compensation expenses
|
||
| 49.8 |
Lower income taxes
|
||
| 23.7 |
Lower other promotion and servicing expenses
|
||
| 14.8 |
Lower office and related expenses
|
||
| 6.7 |
Other
|
||
| $ | (283.1 | ) |
Real Estate Charges
During 2010, we performed a comprehensive review of our real estate requirements in New York in connection with our workforce reductions since 2008. As a result, during 2010 we decided to sub-lease over 380,000 square feet in New York (approximately half of which has occurred) and largely consolidate our New York-based employees into two office locations from three. We therefore recorded a pre-tax real estate charge of $89.6 million in the third quarter of 2010 that reflected the net present value of the difference between the amount of our on-going contractual operating lease obligations for this space and our estimate of current market rental rates, as well as the write-off of leasehold improvements, furniture and equipment related to this space. Based on existing sub-leases, our current assumptions of when we can sub-lease the remaining space and current market rental rates, we estimate that this charge will lower our occupancy costs on existing real estate by approximately $21 million in 2011 and approximately $23 million in 2012 and subsequent years. Including a charge taken in the first quarter of 2010, total real estate charges in 2010 were $101.7 million.
For additional information, see "Cautions Regarding Forward-Looking Statements" in this Item 7.
Non-GAAP Measures
We are providing the non-GAAP measures “Adjusted net revenues”, “Adjusted operating income” and “Adjusted operating margin” which we believe are useful to investors. These non-GAAP measures are the principle metrics management uses in evaluating and comparing period-to-period operating performance.
|
Years Ended December 31,
|
||||||||||||
|
2010
|
2009
|
2008
|
||||||||||
|
(in thousands)
|
||||||||||||
|
Net revenues, GAAP basis
|
$ | 2,948,557 | $ | 2,906,879 | $ | 3,514,159 | ||||||
|
Exclude:
|
||||||||||||
|
Deferred compensation-related investment (gains) losses
|
(27,053 | ) | (120,501 | ) | 325,003 | |||||||
|
Deferred compensation-related dividends and interest
|
(6,513 | ) | (8,526 | ) | (10,935 | ) | ||||||
|
90% of consolidated venture capital fund investments (gains) losses
|
16,527 | (20,630 | ) | (2,365 | ) | |||||||
|
Distribution-related payments
|
(286,676 | ) | (234,203 | ) | (307,890 | ) | ||||||
|
Amortization of deferred sales commissions
|
(47,397 | ) | (54,922 | ) | (79,111 | ) | ||||||
|
Adjusted net revenues
|
$ | 2,597,445 | $ | 2,468,097 | $ | 3,438,861 | ||||||
|
Operating income, GAAP basis
|
$ | 458,862 | $ | 590,828 | $ | 925,501 | ||||||
|
Exclude:
|
||||||||||||
|
Deferred compensation-related investment (gains) losses
|
(27,053 | ) | (120,501 | ) | 325,003 | |||||||
|
Deferred compensation-related dividends and interest
|
(6,513 | ) | (8,526 | ) | (10,935 | ) | ||||||
|
Deferred compensation-related mark-to-market vesting expense (credit)
|
2,791 | (2,147 | ) | (157,187 | ) | |||||||
|
Deferred compensation-related dividends and interest expense
|
8,540 | 7,734 | 10,171 | |||||||||
|
Net impact of deferred compensation-related investments
|
(22,235 | ) | (123,440 | ) | 167,052 | |||||||
|
Real estate charges
|
101,698 | 8,276 | — | |||||||||
|
Total exclusions
|
79,463 | (115,164 | ) | 167,052 | ||||||||
|
Include:
|
||||||||||||
|
Net (income) loss of consolidated entities attributable to non-controlling interests
|
15,320 | (22,381 | ) | (9,186 | ) | |||||||
|
Adjusted operating income
|
$ | 553,645 | $ | 453,283 | $ | 1,083,367 | ||||||
|
Adjusted operating margin
|
21.3 | % | 18.4 | % | 31.5 | % | ||||||
Adjusted operating income for the year ended December 31, 2010 increased $100.4 million, or 22.1%, from the year ended December 31, 2009, primarily as a result of higher investment advisory fees and net distribution revenues (net of plan payments and amortization), partially offset by lower non-operating income and higher employee compensation expense (excluding the impact of deferred compensation mark-to-market and dividends). Adjusted operating income for the year ended December 31, 2009 decreased $630.1 million, or 58.2%, from the year ended December 31, 2008, primarily as a result of lower investment advisory fees, lower Bernstein Research Services revenues and the 2008 $35.3 million insurance reimbursement, partially offset by lower employee compensation and benefits expenses (excluding the impact of deferred compensation mark-to-market and dividends).
These non-GAAP measures are provided in addition to, and not as substitutes for, net revenues, operating income and operating margin, and they may not be comparable to non-GAAP measures presented by other companies. Management uses both the GAAP and non-GAAP measures in evaluating our financial performance. The non-GAAP measures alone may pose limitations because they do not include all of our revenues and expenses.
Adjusted Net Revenues
Adjusted net revenues exclude investment gains and losses and dividends and interest on deferred compensation-related investments, and 90% of the investment gains and losses of our consolidated venture capital fund attributable to non-controlling interests. In addition, adjusted net revenues offset distribution-related payments to third parties as well as amortization of deferred sales commissions against distribution revenues. We believe the offset of distribution-related payments from net revenues is useful for our investors and other users of our financial statements because such presentation appropriately reflects the nature of these costs as pass-through payments to third parties who perform functions on behalf of our sponsored mutual funds and/or shareholders of these funds. Amortization of deferred sales commissions is offset against net revenues because such costs, over time, offset distribution revenues earned by the company.
Adjusted Operating Income
Adjusted operating income represents operating income on a GAAP basis (1) excluding the impact on net revenues and compensation expense of the mark-to-market gains and losses (as well as the dividends and interest) associated with employee deferred compensation-related investments, (2) excluding real estate charges, and (3) including the net loss or income of consolidated entities attributable to non-controlling interests.
Prior to 2009, a large proportion of employee compensation was in the form of deferred awards that were notionally invested in AllianceBernstein investment services and generally vested over a period of four years. AllianceBernstein has economically hedged the exposure to market movements by purchasing and holding these investments on its balance sheet. The full value of the investments’ appreciation (depreciation) is recorded within investment gains and losses on the income statement in the current period. U.S. GAAP requires the appreciation (depreciation) in the compensation liability to be expensed over the award vesting period in proportion to the vested amount of the award as part of compensation expense. This creates a timing difference between the recognition of the compensation expense and the investment gain or loss impacting operating income, which will fluctuate over the life of the award and net to zero at the end of the multi-year vesting period. Although during periods of high market volatility these timing differences have an impact on operating income and operating margin, over the life of the award any impact is ultimately offset. Because these plans are economically hedged, management believes it is useful to reflect the offset ultimately achieved from hedging the investments’ market exposure in the calculation of adjusted operating income, adjusted operating margin and adjusted diluted net income per Holding Unit, which will produce core operating results from period to period. The non-GAAP measures exclude gains and losses and dividends and interest on deferred compensation-related investments included in revenues and compensation expense, thus eliminating the timing differences created by different treatment under U.S. GAAP of the market movement on the expense and the investments.
Real estate charges have been excluded because they are not considered part of our core operating results when comparing financial results from period to period and to industry peers.
Most of the net income or loss of consolidated entities attributable to non-controlling interests relates to the 90% limited partner interests held by third parties in our consolidated venture capital fund. We own a 10% limited partner interest in the fund. Because we are the general partner of the venture capital fund and are deemed to have a controlling interest, U.S. GAAP requires us to consolidate the financial results of the fund. However, recognizing 100% of the gains or losses in operating income while only retaining 10% is not reflective of our underlying financial results at the operating income level. As a result, we are excluding the 90% limited partner interests we do not own from our adjusted operating income. Similarly, net income of joint ventures attributable to non-controlling interests, although not significant, is excluded because it does not reflect the economic interest attributable to AllianceBernstein.
Adjusted Operating Margin
Adjusted operating margin allows us to monitor our financial performance and efficiency from period to period and to compare our performance to industry peers without the volatility noted above in our discussion of adjusted operating income. Adjusted operating margin is derived by dividing adjusted operating income by adjusted net revenues.
Units Outstanding
In December 2009, we issued approximately 8.5 million Holding Units to fund 2009 restricted Holding Unit awards to eligible employees. The dilutive effect to net income per Holding Unit and per Unit distributions in 2010 was approximately 3%.
AllianceBernstein engages in open-market purchases of Holding Units to help fund anticipated obligations under its incentive compensation award program and purchases of Holding Units from employees to allow them to fulfill statutory tax requirements at the time of distribution of long-term incentive compensation awards. During 2010, AllianceBernstein purchased 8.8 million Holding Units for $226.4 million, reflecting open-market purchases of 7.4 million Holding Units for $195.3 million and the remainder primarily relating to employee tax withholding purchases. We intend to continue to engage in open-market purchases of Holding Units, from time to time, to help fund anticipated obligations under our incentive compensation award program.
We granted 13.1 million restricted Holding Unit awards to employees during 2010. To fund these awards, Holding newly issued 3.2 million Holding Units and we allocated 9.9 million previously repurchased Holding Units that had been held in the consolidated rabbi trust. There were approximately 30,000 unallocated Holding Units remaining in the consolidated rabbi trust as of December 31, 2010.
Net Revenues
The following table summarizes the components of net revenues:
|
Years Ended December 31,
|
% Change
|
|||||||||||||||||||
|
2010
|
2009
|
2008
|
2010-09 | 2009-08 | ||||||||||||||||
|
(in millions)
|
||||||||||||||||||||
|
Investment advisory and services fees:
|
||||||||||||||||||||
|
Institutions:
|
||||||||||||||||||||
|
Base fees
|
$ | 745.5 | $ | 792.4 | $ | 1,229.1 | (5.9 | )% | (35.5 | )% | ||||||||||
|
Performance-based fees
|
18.7 | 18.1 | 11.5 | 3.3 | 56.6 | |||||||||||||||
| 764.2 | 810.5 | 1,240.6 | (5.7 | ) | (34.7 | ) | ||||||||||||||
|
Retail:
|
||||||||||||||||||||
|
Base fees
|
639.8 | 522.8 | 751.0 | 22.4 | (30.4 | ) | ||||||||||||||
|
Performance-based fees
|
0.1 | 0.4 | 0.1 | (76.2 | ) | 394.6 | ||||||||||||||
| 639.9 | 523.2 | 751.1 | 22.3 | (30.3 | ) | |||||||||||||||
|
Private Client:
|
||||||||||||||||||||
|
Base fees
|
645.9 | 575.3 | 846.0 | 12.3 | (32.0 | ) | ||||||||||||||
|
Performance-based fees
|
1.7 | 11.3 | 1.8 | (84.5 | ) | 521.3 | ||||||||||||||
| 647.6 | 586.6 | 847.8 | 10.4 | (30.8 | ) | |||||||||||||||
|
Total:
|
||||||||||||||||||||
|
Base fees
|
2,031.2 | 1,890.5 | 2,826.1 | 7.4 | (33.1 | ) | ||||||||||||||
|
Performance-based fees
|
20.5 | 29.8 | 13.4 | (31.2 | ) | 121.8 | ||||||||||||||
| 2,051.7 | 1,920.3 | 2,839.5 | 6.8 | (32.4 | ) | |||||||||||||||
|
Bernstein research services
|
430.5 | 434.6 | 471.7 | (0.9 | ) | (7.9 | ) | |||||||||||||
|
Distribution revenues
|
338.6 | 277.3 | 378.4 | 22.1 | (26.7 | ) | ||||||||||||||
|
Dividend and interest income
|
22.9 | 26.7 | 91.8 | (14.3 | ) | (70.9 | ) | |||||||||||||
|
Investment gains (losses)
|
(1.4 | ) | 144.5 | (349.2 | ) | n/m | n/m | |||||||||||||
|
Other revenues
|
109.8 | 107.9 | 118.5 | 1.8 | (8.9 | ) | ||||||||||||||
|
Total revenues
|
2,952.1 | 2,911.3 | 3,550.7 | 1.4 | (18.0 | ) | ||||||||||||||
|
Less: Interest expense
|
3.5 | 4.4 | 36.5 | (19.6 | ) | (87.9 | ) | |||||||||||||
|
Net revenues
|
$ | 2,948.6 | $ | 2,906.9 | $ | 3,514.2 | 1.4 | (17.3 | ) | |||||||||||
Investment Advisory and Services Fees
Investment advisory and services fees are the largest component of our revenues. These fees are generally calculated as a percentage of the value of AUM as of a specified date, or as a percentage of the value of average AUM for the applicable billing period, and vary with the type of investment service, the size of account and the total amount of assets we manage for a particular client. Accordingly, fee income generally increases or decreases as average AUM increase or decrease and is therefore affected by market appreciation or depreciation, the addition of new client accounts or client contributions of additional assets to existing accounts, withdrawals of assets from and termination of client accounts, purchases and redemptions of mutual fund shares, shifts of assets between accounts or products with different fee structures and acquisitions. Our average basis points realized (investment advisory fees divided by average AUM) generally approximate 50 basis points for equity services, 30 basis points for fixed income services and less than 10 basis points for index or passive services. As such, a shift of client assets from active equity services toward fixed income services and/or passive services would result in a decline in revenues just as a shift of assets toward active equity services would increase revenues.
We calculate AUM using established fair valuation methodologies, including market-based valuation methods and fair valuation methods. Market-based valuation methods include: last sale/settle prices from an exchange for actively-traded listed equities, options and futures; evaluated bid prices from recognized pricing vendors for fixed income, asset-backed or mortgage-backed issues; mid prices from recognized pricing vendors and brokers for credit default swaps; and quoted bids or spreads from pricing vendors and brokers for other derivative products. Fair valuation methods include discounted cash flow models, evaluation of assets versus liabilities or any other methodology that is validated and approved by our Valuation Committee. Fair valuation methods are used only where AUM cannot be valued using market-based valuation methods, such as in the case of private equity or illiquid securities. Investments utilizing fair value methods typically make up less than 1% of our total AUM. Market volatility has not had a significant effect on our ability to acquire market data and, accordingly, our ability to use market-based valuation methods.
The Valuation Committee, which is composed of senior officers and employees, is responsible for overseeing the pricing and valuation of all investments held in client and AllianceBernstein portfolios. The Valuation Committee has adopted a Statement of Pricing Policies describing principles and policies that apply to pricing and valuing investments held in client and AllianceBernstein portfolios. We have also established a Pricing Group, which reports to the Valuation Committee. The Valuation Committee has delegated to the Pricing Group responsibility for overseeing the pricing process for all investments.
We sometimes charge our clients performance-based fees. In these situations, we charge a base advisory fee and are eligible to earn an additional performance-based fee or incentive allocation that is calculated as either a percentage of absolute investment results or a percentage of investment results in excess of a stated benchmark over a specified period of time. Some performance-based fees include a high-watermark provision, which generally provides that if a client account underperforms relative to its performance target (whether absolute or relative to a specified benchmark), it must gain back such underperformance before we can collect future performance-based fees. Therefore, if we fail to achieve our performance target for a particular period, we will not earn a performance-based fee for that period and, for accounts with a high-watermark provision, our ability to earn future performance-based fees will be impaired. We are eligible to earn performance-based fees on approximately 12% of the assets we manage for institutional clients and approximately 3% of the assets we manage for private clients (in total, approximately 8% of our company-wide AUM). If the percentage of our AUM subject to performance-based fees grows, seasonality and volatility of revenue and earnings are likely to become more significant. Approximately 73% of our hedge fund AUM is subject to high-watermarks and we ended 2010 with approximately 84% of this AUM below high-watermarks by 10% or more. Accordingly, it is very unlikely we will earn performance-based fees on these hedge funds in 2011.
Our investment advisory and services fees increased $131.4 million, or 6.8%, in 2010 due to an increase in base fees of $140.7 million, which primarily resulted from a 6.3% increase in average assets under management, partially offset by a decrease in performance-based fees of $9.3 million. Our investment advisory and services fees decreased $919.2 million, or 32.4%, in 2009, primarily due to lower base fees of $935.6 million, which resulted from a 31.8% decrease in average AUM.
Institutional investment advisory and services fees decreased $46.3 million, or 5.7%, in 2010, primarily due to a negative shift in product mix from Equities to Fixed Income products. Average AUM for Equity services decreased 9.0% while average AUM for Fixed Income and Other services increased 11.6% and 41.3%, respectively. Institutional investment advisory and services fees decreased $430.1 million, or 34.7%, in 2009, primarily as a result of a decrease of 34.4% in average AUM and the impact of a shift in product mix.
Retail investment advisory and services fees increased $116.7 million, or 22.3%, in 2010, primarily due to a 16.8% increase in average AUM and the impact of significant net sales of long-term non-U.S. global fixed income mutual funds, which have higher relative fees as compared to long-term U.S. mutual funds. Retail investment advisory and services fees decreased $227.9 million, or 30.3%, in 2009, as average AUM decreased 27.7% and fee realization rates declined due to product mix changes.
Private Client investment advisory and services fees increased by $61.0 million, or 10.4%, in 2010, primarily as a result of higher base fees of $70.6 million, reflecting an increase in average billable AUM of 9.8%, offset by a decrease in performance-based fees of $9.6 million. Private Client investment advisory and services fees decreased $261.2 million, or 30.8%, in 2009, primarily as a result of lower base fees reflecting a decrease in billable AUM of 27.6% and the impact of product mix changes.
Bernstein Research Services
Bernstein Research Services revenue consists principally of transaction charges received for providing equity research and brokerage-related services to institutional investors. Bernstein Research Services also earns revenues in the form of underwriting fees, management fees, payments for research services and/or selling concessions from issuers of publicly-traded securities to which we provide equity capital markets services.
Revenues from Bernstein Research Services decreased $4.1 million, or 0.9%, in 2010. The decrease in 2010 was driven by lower equity market transaction volumes in the U.S., partially offset by higher aggregate value of securities traded in Europe. Revenues from Bernstein Research Services decreased $37.1 million, or 7.9%, in 2009. Revenue in 2009 declined due to lower global levels of client trading activity and lower security valuations in Europe, where commissions on trades are priced in basis points.
Distribution Revenues
AllianceBernstein Investments and AllianceBernstein (Luxembourg) S.A. (each a wholly-owned subsidiary of AllianceBernstein) act as distributor and/or placing agent of company-sponsored mutual funds and receive distribution services fees from certain of those funds as partial reimbursement of the distribution expenses they incur. Period-over-period fluctuations of distribution revenues are typically in-line with fluctuations of Retail average AUM.
Distribution revenues increased $61.3 million, or 22.1%, in 2010, which is essentially in line with the 16.8% increase in Retail average AUM, but also reflects a higher increase in the Retail AUM in which we receive distribution fees compared to sub-advisory AUM in which we do not receive distribution fees. Distribution revenues decreased $101.1 million, or 26.7%, in 2009, which is essentially in line with the 27.7% decrease in Retail average AUM.
The SEC has proposed a rule amendment that would significantly change and restrict the ability of U.S. mutual funds to pay distribution and servicing fees (
“12b-1 fees”
) to financial services firms for distributing their shares. If rules are adopted as proposed, changes in existing 12b-1 fee arrangements for a number of share classes offered by company-sponsored mutual funds would be required, which would reduce the net fund distribution revenues we receive from company-sponsored mutual funds. The impact of this rule change, which we do not anticipate being material, is dependent upon the final rules adopted by the SEC, any phase-in or grandfathering period, and any other changes made with respect to share class distribution arrangements.
For additional information, see “Risk Factors” in Item 1A and “Cautions Regarding Forward-Looking Statements" in this Item 7
.
Dividend and Interest Income and Interest Expense
Dividend and interest income consists primarily of investment income and interest earned on customer margin balances and U.S. Treasury Bills. Interest expense principally reflects interest accrued on cash balances in customers’ brokerage accounts. Dividend and interest income, net of interest expense, decreased $2.9 million, or 13.3%, and $33.0 million, or 59.6%, in 2010 and 2009, respectively, due primarily to lower interest earned on U.S. Treasury Bill balances, reflecting lower interest rates and lower average balances, partially offset by lower interest expense reflecting lower balances in customers’ brokerage accounts and lower interest rates.
Investment Gains (Losses)
Investment gains (losses) consist primarily of realized and unrealized investment gains or losses on deferred compensation-related investments and investments owned by our consolidated venture capital fund. Investment gains (losses) also include realized and unrealized gains or losses on U.S. Treasury Bills, broker-dealer over-the-counter trading, exchange-traded options, seed money investments and derivatives, realized gains or losses on the sale of seed money investments classified as available-for-sale securities, and equity in earnings of proprietary investments in limited partnership hedge funds that we sponsor and manage.
Investment gains (losses) are as follows:
|
Years Ended December 31,
|
||||||||||||
|
2010
|
2009
|
2008
|
||||||||||
|
(in millions)
|
||||||||||||
|
Deferred compensation-related investments
|
||||||||||||
|
Realized gains (losses)
|
$ | (12.0 | ) | $ | (63.9 | ) | $ | (70.3 | ) | |||
|
Unrealized gains (losses)
|
39.1 | 184.4 | (254.7 | ) | ||||||||
|
Consolidated private equity fund investments
|
||||||||||||
|
Realized gains (losses)
|
21.2 | 17.2 | 0.8 | |||||||||
|
Unrealized gains (losses)
|
(39.6 | ) | 5.8 | 1.8 | ||||||||
|
Seed capital and other investments
|
||||||||||||
|
Realized gains (losses)
|
(19.9 | ) | (5.9 | ) | (10.7 | ) | ||||||
|
Unrealized gains (losses)
|
9.8 | 6.9 | (16.1 | ) | ||||||||
| $ | (1.4 | ) | $ | 144.5 | $ | (349.2 | ) | |||||
Realized gains or losses on deferred compensation-related investments typically occur in December of each year, as well as the first quarter, as award tranches vest and related investments are sold to provide cash for payments to employees. The 2010 realized losses primarily relate to the liquidation of hedge fund investments, while the 2009 losses relate 62% to mutual fund sales and the remainder to hedge funds. The 2008 losses relate entirely to mutual fund sales. The unrealized gains on deferred compensation-related investments during 2010 and 2009 reflect the favorable financial markets during those periods, while the unrealized losses in 2008 reflect the unfavorable financial markets in 2008.
Our consolidated private equity fund during 2010, incurred higher mark-to-market losses relating to publicly-traded securities held by the fund. Also, 2010 and 2009 reflect gains on the sale of securities in those years. During 2009, our consolidated private equity fund incurred higher mark-to-market gains relating to privately held securities as well as higher realized gains from the sale of a portion of our publicly-traded securities.
Other Revenues
Other revenues consist of fees earned for transfer agency services provided to company-sponsored mutual funds, fees earned for administration and recordkeeping services provided to company-sponsored mutual funds and the general accounts of AXA and its subsidiaries, and other miscellaneous revenues. Other revenues increased 1.8% in 2010, due primarily to higher shareholder servicing fees. Other revenues decreased 8.9% in 2009, due primarily to lower shareholder servicing fees as a result of fewer shareholder accounts.
Expenses
The following table summarizes the components of expenses:
|
Years Ended December 31,
|
% Change
|
|||||||||||||||||||
|
2010
|
2009
|
2008
|
2010-09
|
2009-08
|
||||||||||||||||
|
(in millions)
|
|
|
||||||||||||||||||
|
|
|
|
|
|
||||||||||||||||
|
Employee compensation and benefits
|
$ | 1,322.5 | $ | 1,298.1 | $ | 1,454.7 | 1.9 | % | (10.8 | )% | ||||||||||
|
Promotion and servicing:
|
||||||||||||||||||||
|
Distribution-related payments
|
286.7 | 234.2 | 307.9 | 22.4 | (23.9 | ) | ||||||||||||||
|
Amortization of deferred sales commissions
|
47.4 | 54.9 | 79.1 | (13.7 | ) | (30.6 | ) | |||||||||||||
|
Other
|
192.1 | 176.7 | 200.4 | 8.7 | (11.8 | ) | ||||||||||||||
| 526.2 | 465.8 | 587.4 | 13.0 | (20.7 | ) | |||||||||||||||
|
General and administrative:
|
||||||||||||||||||||
|
General and administrative
|
515.9 | 520.1 | 512.8 | (0.8 | ) | 1.4 | ||||||||||||||
|
Real estate charges
|
101.7 | 8.3 | — | 1,128.8 | n/m | |||||||||||||||
| 617.6 | 528.4 | 512.8 | 16.9 | 3.0 | ||||||||||||||||
|
Interest
|
2.1 | 2.7 | 13.1 | (22.9 | ) | (79.4 | ) | |||||||||||||
|
Amortization of intangible assets
|
21.3 | 21.1 | 20.7 | 1.0 | 2.0 | |||||||||||||||
|
Total
|
$ | 2,489.7 | $ | 2,316.1 | $ | 2,588.7 | 7.5 | (10.5 | ) | |||||||||||
Employee Compensation and Benefits
We had 4,256 full-time employees as of December 31, 2010 compared to 4,369 as of year-end 2009 and 4,997 as of year-end 2008. Employee compensation and benefits consist of salaries (including severance), annual cash incentive awards, annual expense associated with the accrual of unvested deferred incentive compensation awards (net of forfeitures), commissions, fringe benefits and other employment costs (including recruitment, training, temporary help and meals).
Compensation expense as a percentage of net revenues was 44.9%, 44.7% and 41.4% for the years ended December 31, 2010, 2009 and 2008, respectively. Compensation expense generally is determined on a discretionary basis and is primarily a function of our firm’s financial performance. Amounts are awarded to help us achieve our goal of attracting, motivating and retaining top talent while also helping ensure that our firm’s unitholders receive an appropriate return on their investment. Senior management, with the approval of the Compensation Committee of the Board, confirmed that the appropriate metric to consider in determining the amount of incentive compensation for 2010 was the ratio of adjusted employee compensation and benefits expense to adjusted revenues. (We define adjusted employee compensation and benefits expense as employee compensation and benefits expense minus other employment costs such as recruitment, meals, temporary help, training and seminars. We define adjusted revenues as net revenues minus distribution revenues.) Senior management, with the approval of the Compensation Committee, also confirmed that adjusted employee compensation and benefits expense should not exceed 50% of our adjusted revenues except in unexpected or unusual circumstances. Our ratios of adjusted compensation expense as a percentage of adjusted revenues were 49.3% and 48.5%, respectively, for the years ended December 31, 2010 and 2009. The increase in the compensation ratio in 2010 compared to 2009 resulted from a decline in adjusted revenues of 0.7% and an increase in adjusted compensation expense of 1.0%.
In 2010, base compensation, fringe benefits and other employment costs decreased $11.6 million, or 2.0%, primarily due to lower severance and salaries offset by higher recruitment costs and payroll taxes. Incentive compensation increased $31.0 million, or 6.1%, primarily due to higher cash compensation. Commission expense increased $5.1 million, or 2.5%, primarily due to higher retail sales volume. In 2009, base compensation, fringe benefits and other employment costs decreased $131.4 million, or 18.3%, compared to 2008 primarily from workforce reductions. Incentive compensation increased $143.3 million, or 39.0%, primarily due to higher deferred compensation expense resulting from mark-to-market gains on related investments. Commission expense decreased by $168.6 million, or 45.5%, as a result of lower sales volume and revenues across all distribution channels.
Since 2009, all deferred compensation awards to eligible employees, which typically vest ratably over four years, have been made in the form of restricted Holding Units. Prior to 2009, employees receiving deferred compensation awards had the option to allocate a portion of their awards to notional investments in company-sponsored investment products (primarily mutual funds). Increases in the value of the notional investments in company-sponsored investment products increase the company’s compensation liability to employees, while decreases in the value of the investments decrease the company’s liability. The company generally purchased an amount of these investments equivalent to the notional investments and held them in a consolidated rabbi trust to economically hedge its exposure to valuation changes on its future obligations. Mark-to-market gains or losses on these investments are recognized in investment gains and losses as they occur. However, the impact of cumulative mark-to-market gains or losses is recognized as increases or decreases in compensation expense ratably over the remaining vesting period. As a result, there is not a direct correlation between current period deferred compensation-related investment gains or losses recognized in revenues and the amortization of cumulative mark-to-market investment gains or losses recognized in compensation expense. Although there can be significant volatility from period to period as the value of these investments change, if a participant remains employed by the company over the entire vesting period of the award, mark-to-market investment gains or losses recognized in revenues will, over that vesting period, equal mark-to-market investment gains or losses recognized in compensation expense.
The investment gains and losses on deferred compensation-related investments recognized in net revenues as compared to the amortization of deferred compensation awards notionally invested in company-sponsored investment products are as follows:
|
Years Ended December 31,
|
||||||||||||
|
2010
|
2009
|
2008
|
||||||||||
|
(in millions)
|
||||||||||||
|
Investment gains (losses)
|
$ | 27.1 | $ | 120.5 | $ | (325.0 | ) | |||||
|
Amortization of awards notionally invested in company-sponsored investments products:
|
||||||||||||
|
Original award
|
119.7 | 159.2 | 198.5 | |||||||||
|
Prior periods mark-to-market
|
(12.0 | ) | (50.0 | ) | (22.8 | ) | ||||||
|
Current period mark-to-market
|
14.8 | 47.9 | (134.4 | ) | ||||||||
|
Total
|
122.5 | 157.1 | 41.3 | |||||||||
|
Net operating income impact
|
$ | (95.4 | ) | $ | (36.6 | ) | $ | (366.3 | ) | |||
The amortization of the original awards will continue to decline due to deferred compensation awards being in the form of restricted Holding Units commencing in 2009. Mark-to-market amortization of prior-period losses has decreased in 2010 as compared to 2009 reflecting the improvement in financial markets relative to the economic crisis of 2008 and early 2009. Current period mark-to-market amortization generally correlates (within a range) to the investment mark-to-market gains and losses for the applicable period.
Promotion and Servicing
Promotion and servicing expenses include distribution-related payments to financial intermediaries for distribution of AllianceBernstein mutual funds and amortization of deferred sales commissions paid to financial intermediaries for the sale of back-end load shares of AllianceBernstein mutual funds. Also included in this expense category are costs related to travel and entertainment, advertising and promotional materials.
Promotion and servicing expenses increased $60.4 million, or 13.0%, in 2010. The increase reflects higher distribution-related payments of $52.5 million, an increase of 22.4%, which is generally in line with the 22.1% increase in distribution revenues. In addition, travel and entertainment increased $11.8 million, which was partially offset by a decrease in amortization of deferred sales commission of $7.5 million. Promotion and servicing expenses decreased $121.6 million, or 20.7%, in 2009. The decrease reflects lower distribution-related payments of $73.7 million, a decrease of 23.9%, which is generally in line with the 26.7% decrease in distribution revenues. In addition, amortization of deferred sales commissions decreased $24.2 million and travel and entertainment decreased $16.6 million. Our deferred sales commission asset will decline because, since January 31, 2009, our U.S.-registered investment companies have not offered back-end loaded shares to new investors.
General and Administrative
General and administrative expenses include technology, professional fees, occupancy, communications and similar expenses. General and administrative expenses as a percentage of net revenues were 20.9% (17.5% excluding real estate charges), 18.2% (17.9% excluding real estate charges) and 14.6% for the years ended December 31, 2010, 2009 and 2008, respectively. General and administrative expenses increased $89.2 million, or 16.9%, in 2010, primarily due to higher real estate charges of $93.4 million offset by lower professional fees. General and administrative expenses increased $15.6 million, or 3.0%, in 2009, primarily due to insurance reimbursements of $35.3 million received in 2008 and foreign exchange losses in 2009 compared to gains in 2008, partially offset by lower office-related and technology expenses.
Interest on Borrowings
Interest on our borrowings decreased $0.6 million, or 22.9%, and $10.4 million, or 79.4%, in 2010 and 2009, respectively, primarily as a result of lower average balances and interest rates.
Non-Operating Income
Non-operating income consists of contingent purchase price payments earned from the disposition in 2005 of our cash management services. Non-operating income decreased $27.0 million, or 79.9%, in 2010, due to lower contingent payments resulting from the cessation of payments during the second quarter of 2010 pursuant to our agreement with Federated Inc. Non-operating income increased $15.0 million, or 79.7%, in 2009, primarily due to a one-time $10.0 million contingent payment we earned during the third quarter of 2009.
Income Taxes
AllianceBernstein, a private limited partnership, is not subject to federal or state corporate income taxes. However, we are subject to the New York City unincorporated business tax. Our domestic corporate subsidiaries are subject to federal, state and local income taxes, and are generally included in the filing of a consolidated federal income tax return. Separate state and local income tax returns are also filed. Foreign corporate subsidiaries are generally subject to taxes in the foreign jurisdictions where they are located.
Income tax expenses decreased $7.5 million, or 16.2%, in 2010 compared to 2009. The decrease is primarily the result of lower pre-tax earnings, partially offset by a higher effective tax rate due to a higher proportion of pre-tax earnings from our foreign subsidiaries where tax rates are generally higher. Income tax expense decreased $49.8 million, or 52.0%, in 2009 compared to 2008. The decrease was primarily the result of lower pre-tax earnings and a lower effective tax rate, reflecting lower pre-tax earnings of our foreign subsidiaries where tax rates are generally higher.
Net Income in Consolidated Entities Attributable to Non-Controlling Interests
Net loss (income) of consolidated entities attributable to non-controlling interests consists of limited partner interests owned by other investors representing 90% of the total limited partner interests in our consolidated venture capital fund and the 50% interest owned by AXA and its subsidiaries in our consolidated joint venture in Australia. In 2010, we had a net loss of consolidated entities attributable to non-controlling interests of $15.3 million as compared to net income of $22.4 million in 2009. The venture capital fund experienced net losses of $18.4 million in 2010 as compared to gains of $23.0 million in 2009, which was the primary driver of a net loss of the consolidated venture capital fund attributable to non-controlling interests of $18.9 million in 2010 as compared to a corresponding net gain of $18.7 million in 2009. Net income in consolidated entities attributable to non-controlling interests increased $13.2 million in 2009 to $22.4 million from $9.2 million in 2008. The venture fund experienced net gains of $23.0 million in 2009 compared to net gains of $2.6 million in 2008, which was the primary driver for the increase.
Capital Resources and Liquidity
During 2010, net cash provided by operating activities was $832.3 million, compared with $625.5 million during 2009. The increase was primarily due to higher non-cash adjustments to reconcile net income to net cash provided of $263.4 million, more than offsetting lower net income of $151.4 million. In addition, accrued expenses increased $76.2 million as a result of the 2010 real estate charges. During 2009, net cash provided by operating activities was $625.5 million, compared with $1.4 billion in 2008. The decrease was primarily due to higher unrealized deferred compensation-related investment gains of $439.1 million and lower net income of $269.9 million.
During 2010, net cash used in investing activities was $33.5 million, compared to $57.2 million during 2009. Our net additions to furniture, equipment and leasehold improvements decreased $30.3 million in 2010 as compared to 2009 as a result of lower infrastructure needs due to workforce reductions. The decrease also reflects net proceeds from sales of investments of $4.3 million during 2010 as compared to net purchases of investments of $3.5 million during 2009. Offsetting these decreases was our purchase of SunAmerica’s alternative investments group in the fourth quarter of 2010 for $14.3 million. During 2009, net cash used in investing activities was $57.2 million, compared to $54.2 million during 2008. The increase reflects net purchases of investments of $3.5 million during 2009 compared to $21.0 million of net proceeds from sales of investments in 2008. This was offset by a decrease in our net additions to furniture, equipment and leasehold improvements of $21.4 million as compared to 2008 as a result of lower infrastructure needs due to workforce reductions.
During 2010, net cash used in financing activities was $762.8 million, compared to $544.5 million during 2009. The increase reflects higher purchases of Holding Units to fund deferred compensation plans of $219.4 million and higher distributions to the General Partner and unitholders of $30.4 million as a result of higher earnings (distributions on earnings are paid one quarter in arrears), offset by an increase of $32.1 million in overdrafts payable and lower repayment of commercial paper (net of issuances) of $12.5 million. During 2009, net cash used in financing activities was $544.5 million, compared to $1.3 billion during 2008. The decrease reflects lower distributions to the General Partner and unitholders of $554.9 million as a result of lower earnings and lower repayment of commercial paper (net of issuances) of $223.4 million.
Debt and Credit Facilities
At December 31, 2010 and 2009, AllianceBernstein had $225.0 million and $249.0 million, respectively, in commercial paper outstanding with weighted average interest rates of approximately 0.3% and 0.2%, respectively. The fair value of commercial paper and amounts outstanding under the revolving credit facility are short-term in nature, and as such, recorded value is estimated to approximate fair value. Average daily borrowings of commercial paper during 2010 and 2009 were $104.2 million and $147.2 million, respectively, with weighted average interest rates of approximately 0.2% and 0.5%, respectively.
On December 9, 2010, AllianceBernstein entered into a committed, unsecured three-year senior revolving credit facility (the
“2010 Credit Facility”
) with a group of commercial banks and other lenders in an original principal amount of $1.0 billion with SCB LLC as an additional borrower.
The 2010 Credit Facility replaces AllianceBernstein’s existing $1.95 billion of committed credit lines (comprised of two separate lines – a $1.0 billion committed, unsecured revolving credit facility in the name of AllianceBernstein, which had a scheduled expiration date of February 17, 2011, and SCB LLC’s $950 million committed, unsecured revolving credit facility, which had a scheduled expiration date of January 25, 2011), both of which were terminated upon the effectiveness of the 2010 Credit Facility. AllianceBernstein has agreed to guarantee the obligations of SCB LLC under the 2010 Credit Facility.
The 2010 Credit Facility will be available for AllianceBernstein’s and SCB LLC’s business purposes, including the support of AllianceBernstein’s $1.0 billion commercial paper program. Both AllianceBernstein and SCB LLC can draw directly under the 2010 Credit Facility and management expects to draw on the 2010 Credit Facility from time to time.
The 2010 Credit Facility contains affirmative, negative and financial covenants, which are customary for facilities of this type, including, among other things, restrictions on dispositions of assets, restrictions on liens, a minimum interest coverage ratio and a maximum leverage ratio. The 2010 Credit Facility also includes customary events of default (with customary grace periods, as applicable), including provisions under which, upon the occurrence of an event of default, all outstanding loans may be accelerated and/or lender’s commitments may be terminated. Also, under such provisions, upon the occurrence of certain insolvency or bankruptcy-related events of default, all amounts payable under the 2010 Credit Facility would automatically become immediately due and payable, and the lender’s commitments would automatically terminate.
The 2010 Credit Facility provides for possible increases in principal amount by up to an aggregate incremental amount of $250 million, any such increase being subject to the consent of the affected lenders. Amounts under the 2010 Credit Facility may be borrowed, repaid and re-borrowed by us from time to time until the maturity of the facility. Voluntary prepayments and commitment reductions requested by us are permitted at any time without fee (other than customary breakage costs relating to the prepayment of any drawn loans) upon proper notice and subject to a minimum dollar requirement. Borrowings under the 2010 Credit Facility bear interest at a rate per annum, which will be, at our option, a rate equal to an applicable margin, which is subject to adjustment based on the credit ratings of AllianceBernstein, plus one of the following indexes: London Interbank Offered Rate; a floating base rate; or the Federal Funds rate.
As of December 31, 2010 and 2009, we had no amounts outstanding under the 2010 Credit Facility or the previous revolving credit facilities, respectively. Average daily borrowings under the revolving credit facility outstanding during 2010 and 2009 were $65.6 million and $65.4 million, respectively, with weighted average interest rates of approximately 0.3% for both years.
In addition, SCB LLC has five uncommitted lines of credit with four financial institutions. Two of these lines of credit permit us to borrow up to an aggregate of approximately $125.0 million while three lines have no stated limit.
Our financial condition and access to public and private debt markets should provide adequate liquidity for our general business needs. Management believes that cash flow from operations and the issuance of debt and AllianceBernstein Units or Holding Units will provide us with the resources necessary to meet our financial obligations.
See “Risk Factors” in Item 1A and “Cautions Regarding Forward-Looking Statements” in this Item 7
for a discussion of credit markets and our ability to renew our credit facilities at expiration.
Off-Balance Sheet Arrangements and Aggregate Contractual Obligations
We have no off-balance sheet arrangements other than the guarantees and contractual obligations that are discussed below.
Guarantees
Under various circumstances, AllianceBernstein guarantees the obligations of its consolidated subsidiaries.
In December 2010, AllianceBernstein executed a guarantee in connection with the $1.0 billion 2010 Credit Facility. If SCB LLC is unable to meet its obligations, AllianceBernstein will pay the obligations when due or on demand.
In February 2002, AllianceBernstein signed an agreement with a commercial bank, under which we guaranteed $125 million of obligations in the ordinary course of business of SCBL. In the event SCBL is unable to meet its obligations in full when due, AllianceBernstein will pay the obligations within three days of being notified of SCBL’s failure to pay. This agreement is continuous and remains in effect until payment in full of any such obligation has been made by SCBL.
During 2010, AllianceBernstein executed three additional agreements with commercial banks, under which we guaranteed $503 million of obligations in the ordinary course of business of SCBL. In the event SCBL is unable to meet its obligations, AllianceBernstein will pay the obligations when due.
We also have two smaller guarantees totaling approximately $3 million, under which we guaranteed certain obligations in the ordinary course of business of two foreign subsidiaries.
We have not been required to perform under any of the above agreements and currently have no liability in connection with these agreements.
Aggregate Contractual Obligations
The following table summarizes our contractual obligations as of December 31, 2010:
|
Contractual Obligations
|
||||||||||||||||||||
|
Total
|
Less than
1 Year
|
1-3 Years
|
3-5 Years
|
More than
5 Years
|
||||||||||||||||
|
(in millions)
|
||||||||||||||||||||
|
Commercial paper
|
$ | 225.0 | $ | 225.0 | $ | — | $ | — | $ | — | ||||||||||
|
Operating leases, net of sublease commitments
|
1,964.3 | 133.9 | 271.8 | 265.2 | 1,293.4 | |||||||||||||||
|
Funding commitments
|
36.0 | 11.0 | 14.0 | 11.0 | — | |||||||||||||||
|
Accrued compensation and benefits
|
315.4 | 174.8 | 77.8 | 33.1 | 29.7 | |||||||||||||||
|
Unrecognized tax benefits
|
5.3 | 2.6 | 1.9 | 0.8 | — | |||||||||||||||
|
Total
|
$ | 2,546.0 | $ | 547.3 | $ | 365.5 | $ | 310.1 | $ | 1,323.1 | ||||||||||
During July 2009, we entered into a subscription agreement under which we committed to invest up to $40 million in a venture capital fund over a six-year period. As of December 31, 2010, we have funded $7.0 million of this commitment. In January 2011, we received a capital call of $0.8 million. Also during July 2009, we were selected by the U.S. Treasury Department as one of nine pre-qualified investment managers under the Public-Private Investment Program. As part of the program, each investment manager is required to invest a minimum of $20 million in the Public-Private Investment Fund they manage. As of December 31, 2010, we had funded $17.0 million of this commitment.
Accrued compensation and benefits amounts in the table above exclude our accrued pension obligation. Any amounts reflected on the consolidated balance sheet as payables (to broker-dealers, brokerage clients and company-sponsored mutual funds) and accounts payable and accrued expenses are excluded from the table above.
We expect to make contributions to our qualified profit sharing plan of approximately $17 million in each of the next four years. We currently estimate that we will contribute $6.9 million to the Retirement Plan during 2011.
Contingencies
See Note 12 to our consolidated financial statements in Item 8
for a discussion of our capital commitments and certain legal proceedings to which we are a party.
Critical Accounting Estimates
The preparation of the consolidated financial statements and notes to consolidated financial statements requires management to make estimates and judgments that affect the reported amounts of assets, liabilities, revenues and expenses.
Management believes that the critical accounting policies and estimates discussed below involve significant management judgment due to the sensitivity of the methods and assumptions used.
Variable Interest Entities
In June 2009, the FASB issued ASU 2009-17,
Consolidations (Topic 810) – Improvements to Financial Reporting by Enterprises Involved with Variable Interest Entities
, effective January 1, 2010. This standard changed how a company determines when an entity that is insufficiently capitalized or is not controlled through voting should be consolidated. The determination of whether a company is required to consolidate an entity is based on, among other things, an entity’s purpose and design, a company’s ability to direct the activities of the entity that most significantly impact the entity’s economic performance, and whether a company is obligated to absorb losses or receive benefits that could potentially be significant to the entity. The standard also requires ongoing assessments of whether a company is the primary beneficiary of a VIE.
Significant judgment is required in the determination of whether we are the primary beneficiary of a VIE. If we, together with our related party relationships, are determined to be the primary beneficiary of a VIE, the entity will be consolidated within our consolidated financial statements. In order to determine whether we are the primary beneficiary of a VIE, management must make significant estimates and assumptions of probable future cash flows and assign probabilities to different cash flow scenarios. Assumptions made in such analyses include, but are not limited to, market prices of securities, market interest rates, potential credit defaults on individual securities or default rates on a portfolio of securities, gain realization, liquidity or marketability of certain securities, discount rates and the probability of certain other outcomes.
Goodwill
We test goodwill annually, as of September 30, for impairment. The carrying value of goodwill is also reviewed if facts and circumstances, such as significant declines in assets under management, revenues, earnings or our Holding Unit price, occur, suggesting possible impairment. As of September 30, 2010, the impairment test indicated that goodwill was not impaired.
The impairment analysis is a two-step process. The first step involves determining whether the estimated fair value of AllianceBernstein, the reporting unit, exceeds its book value. If the fair value of the company exceeds its book value, goodwill is not impaired. However, if the book value exceeds the fair value of the company, goodwill may be impaired and additional analysis is required. The second step compares the fair value of the company to the aggregated fair values of its individual assets and liabilities to determine the amount of impairment, if any.
There are several methods of estimating AllianceBernstein’s fair value, including valuation techniques such as discounted expected cash flows and market valuation (AllianceBernstein Units outstanding multiplied by Holding Unit price). Determining estimated fair value using a discounted cash flow valuation technique consists of applying business growth rate assumptions over the estimated life of the goodwill asset and then discounting the resulting expected cash flows to arrive at a present value amount that approximates fair value. In our tests, our discounted expected cash flow model uses management’s current business plan, which factors in current market conditions and all material events that have impacted, or that we believed at the time could potentially impact, future expected cash flows for the first four years and a compounded annual growth rate thereafter.
To the extent that securities valuations are depressed for prolonged periods of time, our assets under management, revenues, profitability and unit price would likely be adversely affected. As a result, subsequent impairment tests may be based upon different assumptions and future cash flow projections, which may result in an impairment of this asset. Any impairment could reduce materially the recorded amount of goodwill with a corresponding charge to our earnings.
Retirement Plan
We maintain a qualified, noncontributory, defined benefit retirement plan covering current and former employees who were employed by the company in the United States prior to October 2, 2000. The amounts recognized in the consolidated financial statements related to the retirement plan are determined from actuarial valuations. Inherent in these valuations are assumptions including expected return on plan assets, discount rates at which liabilities could be settled, rates of annual salary increases and mortality rates. The assumptions are reviewed annually and may be updated to reflect the current environment. Key assumptions are
described in Note 15 to AllianceBernstein’s consolidated financial statements in Item 8
. In accordance with U.S. generally accepted accounting principles, actual results that differ from those assumed are accumulated and amortized over future periods and, therefore, affect expense recognized and liabilities recorded in future periods.
As of December 31, 2008, we amended the retirement plan to provide that participants will not accrue any additional benefits (
i.e
., service and compensation after December 31, 2008 will not be taken into account in determining participants’ retirement benefits).
In developing the expected long-term rate of return on plan assets of 8.0%, we considered the historical returns and future expectations for returns for each asset category, as well as the target asset allocation of the portfolio. The expected long-term rate of return on assets is based on weighted average expected returns for each asset class. We assumed a target allocation weighting of 50% to 70% for equity securities, 20% to 40% for debt securities, and 0% to 10% for real estate investment trusts. Exposure of the total portfolio to cash equivalents on average should not exceed 5% of the portfolio’s value on a market value basis. The plan seeks to provide a rate of return that exceeds applicable benchmarks over rolling five-year periods. The benchmark for the plan’s large cap domestic equity investment strategy is the S&P 500 Index; the small cap domestic equity investment strategy is measured against the Russell 2000 Index; the international equity investment strategy is measured against the MSCI EAFE Index; and the fixed income investment strategy is measured against the Barclays Aggregate Bond Index. The actual rates of return on plan assets were 9.8%, 29.4% and (45.8)% in 2010, 2009 and 2008, respectively. A 25 basis point adjustment, up or down, in the expected long-term rate of return on plan assets would have decreased or increased the 2010 net pension expense of $0.3 million by approximately $0.1 million.
The objective of our discount rate assumption was to reflect the rate at which our pension obligations could be effectively settled. In making this determination, we took into account the timing and amount of benefits that would be payable under the plan’s lump sum option. Our methodology for selecting the discount rate as of December 31, 2010 was to match the plan’s cash flows to that of a yield curve that provides the equivalent yields on zero-coupon corporate bonds for each maturity. Benefit cash flows due in a particular year can be “settled” theoretically by “investing” them in the zero-coupon bond that matures in the same year. The discount rate is the single rate that produces the same present value of cash flows. The selection of the 5.50% discount rate as of December 31, 2010 represents the Mercer Human Resources yield curve (to the nearest five basis points). The discount rate as of December 31, 2009 was 6.05%, which was used in developing the 2010 net pension charge. A lower discount rate increases pension expense and the present value of benefit obligations. A 25 basis point adjustment, up or down, in the discount rate (along with a corresponding adjustment in the assumed lump sum interest rate) would have decreased or increased the 2010 net pension expense of $0.3 million by approximately $0.1 million.
Loss Contingencies
Management continuously reviews with legal counsel the status of regulatory matters and pending or threatened litigation. We evaluate the likelihood that a loss contingency exists and record a loss contingency if it is probable and reasonably estimable as of the date of the financial statements.
See Note 12 to AllianceBernstein’s consolidated financial statements in Item 8
.
Accounting Pronouncements
See Note 23 to AllianceBernstein’s consolidated financial statements in Item 8.
Cautions Regarding Forward-Looking Statements
Certain statements provided by management in this report are “forward-looking statements” within the meaning of the Private Securities Litigation Reform Act of 1995. Such forward-looking statements are subject to risks, uncertainties and other factors that could cause actual results to differ materially from future results expressed or implied by such forward-looking statements. The most significant of these factors include, but are not limited to, the following: the performance of financial markets, the investment performance of sponsored investment products and separately-managed accounts, general economic conditions, industry trends, future acquisitions, competitive conditions and government regulations, including changes in tax regulations and rates and the manner in which the earnings of publicly-traded partnerships are taxed. We caution readers to carefully consider such factors. Further, such forward-looking statements speak only as of the date on which such statements are made; we undertake no obligation to update any forward-looking statements to reflect events or circumstances after the date of such statements. For further information regarding these forward-looking statements and the factors that could cause actual results to differ,
see “Risk Factors” in Item 1A
. Any or all of the forward-looking statements that we make in this Form 10-K, other documents we file with or furnish to the SEC, and any other public statements we issue, may turn out to be wrong. It is important to remember that other factors besides those listed in “Risk Factors” and those listed below could also adversely affect our revenues, financial condition, results of operations and business prospects.
The forward-looking statements referred to in the preceding paragraph include statements regarding:
|
|
•
|
Our belief that the cash flow Holding realizes from its investment in AllianceBernstein will provide Holding with the resources necessary to meet its financial obligations
:
Holding’s cash flow is dependent on the quarterly cash distributions it receives from AllianceBernstein. Accordingly, Holding’s ability to meet its financial obligations is dependent on AllianceBernstein’s cash flow from its operations, which is subject to the performance of the capital markets and other factors beyond our control.
|
|
|
•
|
Our financial condition and ability to issue public and private debt providing adequate liquidity for our general business needs
:
Our financial condition is dependent on our cash flow from operations, which is subject to the performance of the capital markets, our ability to maintain and grow client assets under management and other factors beyond our control. Our ability to issue public and private debt on reasonable terms, as well as the market for such debt or equity, may be limited by adverse market conditions, our profitability and changes in government regulations, including tax rates and interest rates.
|
|
|
•
|
The possibility that prolonged weakness in the value of client assets under management may result in impairment of goodwill
:
To the extent that securities valuations are depressed for prolonged periods of time, client assets under management and our revenues, profitability and unit price may be adversely affected. As a result, subsequent impairment tests may be based upon different assumptions and future cash flow projections, which may result in an impairment of goodwill.
|
|
|
•
|
The outcome of litigation
:
Litigation is inherently unpredictable, and excessive damage awards do occur. Though we have stated that we do not expect certain legal proceedings to have a material adverse effect on our results of operations or financial condition, any settlement or judgment with respect to a legal proceeding could be significant, and could have such an effect.
|
|
|
•
|
Our anticipation that the proposed 12b-1 fee-related rule changes will not have a material effect on us
:
The impact of this rule change is dependent upon the final rules adopted by the SEC, any phase-in or grandfathering period, and any other changes made with respect to share class distribution arrangements.
|
|
|
•
|
Our intention to continue to engage in open market purchases of Holding Units, from time to time, to help fund anticipated obligations under our incentive compensation award program
:
The number of Holding Units needed in future periods to make incentive compensation awards is dependent upon various factors, some of which are beyond our control, including the fluctuation in the price of a Holding Unit (NYSE: AB).
|
|
|
•
|
Our determination that adjusted employee compensation expense should not exceed 50% of our adjusted revenues
:
Aggregate employee compensation reflects employee performance and competitive compensation levels. Fluctuations in our revenues and/or changes in competitive compensation levels could result in adjusted employee compensation expense being higher than 50% of our adjusted revenues.
|
|
|
•
|
The degree to which the $89.6 million real estate charge we recorded during the third quarter of 2010 will reduce occupancy costs on existing real estate in 2011 and subsequent years
:
The charge we recorded during the third quarter and our estimates of reduced occupancy costs in future years are based on existing sub-leases, as well as our current assumptions of when we can sub-lease the remaining space and current market rental rates, which are factors largely beyond our control. If our assumptions prove to be incorrect, we may be forced to take an additional charge and/or our estimated occupancy cost reductions may be less than we currently anticipate.
|
|
|
•
|
The pipeline of new institutional mandates not yet funded
: Before they are funded, institutional mandates do not represent legally binding commitments to fund and, accordingly, the possibility exists that not all mandates will be funded in the amounts and at the times currently anticipated.
|
|
|
•
|
Our belief that our net outflows should improve in 2011
: An improvement in net outflows depends on a number of factors, including our ability to deliver consistent, competitive investment performance, which cannot be assured, conditions of financial markets, changes and volatility in political, economic, capital market or industry conditions, consultant recommendations, and changes in our clients’ investment preferences, risk tolerances and liquidity needs.
|
|
Item
7A.
|
Quantitative and Qualitative Disclosures about Market Risk
|
Ho
lding
Market Risk, Risk Management and Derivative Financial Instruments
Holding’s sole investment is AllianceBernstein Units. Holding did not own, nor was it a party to, any derivative financial instruments during the years ended December 31, 2010, 2009 and 2008.
Allian
ceBernstein
Market Risk, Risk Management and Derivative Financial Instruments
AllianceBernstein’s investments consist of trading and available-for-sale investments, and other investments. Trading and available-for-sale investments include United States Treasury Bills, mutual funds, exchange-traded options and various separately-managed portfolios consisting of equity and fixed income securities. Trading investments are purchased for short-term investment, principally to fund liabilities related to deferred compensation plans and to seed new investment services. Although available-for-sale investments are purchased for long-term investment, the portfolio strategy considers them available-for-sale from time to time due to changes in market interest rates, equity prices and other relevant factors. Other investments include investments in hedge funds sponsored by AllianceBernstein, our consolidated venture capital fund and other private equity investment vehicles.
We enter into various futures, forwards and swaps to economically hedge our seed money investments. In addition, we have currency forwards that (i) represent seed money that our investment teams are using to develop new products and services for our clients, (ii) economically hedge certain cash accounts, and (iii) economically hedge certain foreign investment advisory fees. We do not hold any derivatives designated in a formal hedge relationship under ASC 815-10,
Derivatives and Hedging. See Note 7 to our consolidated financial statements in Item 8.
Trading and Non-Trading Market Risk Sensitive Instruments
Investments with Interest Rate Risk—Fair Value
The table below provides our potential exposure with respect to our fixed income investments, measured in terms of fair value, to an immediate 100 basis point increase in interest rates at all maturities from the levels prevailing as of December 31, 2010 and 2009. Such a fluctuation in interest rates is a hypothetical rate scenario used to calibrate potential risk and does not represent our view of future market changes. While these fair value measurements provide a representation of interest rate sensitivity of our investments in fixed income mutual funds and fixed income hedge funds, they are based on our exposures at a particular point in time and may not be representative of future market results. These exposures will change as a result of ongoing changes in investments in response to our assessment of changing market conditions and available investment opportunities:
|
As of December 31,
|
||||||||||||||||
|
2010
|
2009
|
|||||||||||||||
|
Fair Value
|
Effect of +100
Basis Point
Change
|
Fair Value
|
Effect of +100
Basis Point
Change
|
|||||||||||||
|
(in thousands)
|
||||||||||||||||
|
Fixed Income Investments:
|
||||||||||||||||
|
Trading
|
$ | 208,129 | $ | (10,219 | ) | $ | 125,906 | $ | (5,766 | ) | ||||||
|
Available-for-sale and other investments
|
6,536 | (321 | ) | 178 | (8 | ) | ||||||||||
Investments with Equity Price Risk—Fair Value
Our investments also include investments in equity securities, mutual funds and hedge funds. The following table provides our potential exposure with respect to our equity investments, measured in terms of fair value, to an immediate 10% drop in equity prices from those prevailing as of December 31, 2010 and 2009. A 10% decrease in equity prices is a hypothetical scenario used to calibrate potential risk and does not represent our view of future market changes. While these fair value measurements provide a representation of equity price sensitivity of our investments in equity securities, mutual funds and hedge funds, they are based on our exposures at a particular point in time and may not be representative of future market results. These exposures will change as a result of ongoing portfolio activities in response to our assessment of changing market conditions and available investment opportunities:
|
As of December 31,
|
||||||||||||||||
|
2010
|
2009
|
|||||||||||||||
|
Fair Value
|
Effect of -10%
Equity Price
Change
|
Fair Value
|
Effect of -10%
Equity Price
Change
|
|||||||||||||
|
(in thousands)
|
||||||||||||||||
|
Equity Investments:
|
||||||||||||||||
|
Trading
|
$ | 297,481 | $ | (29,748 | ) | $ | 358,676 | $ | (35,868 | ) | ||||||
|
Available-for-sale and other investments
|
244,409 | (24,441 | ) | 290,069 | (29,007 | ) | ||||||||||
|
Item
8.
|
Financial Statements and Supplementary Data
|
All
ianceBernstein Holding L.P.
Statements of Financial Condition
|
December 31,
|
||||||||
|
2010
|
2009
|
|||||||
|
(in thousands, except unit
amounts)
|
||||||||
|
ASSETS
|
||||||||
|
Investment in AllianceBernstein
|
$ | 1,786,291 | $ | 1,800,065 | ||||
|
Due from AllianceBernstein
|
1,277 | — | ||||||
|
Other assets
|
— | 10 | ||||||
|
Total assets
|
$ | 1,787,568 | $ | 1,800,075 | ||||
|
LIABILITIES AND PARTNERS’ CAPITAL
|
||||||||
|
Liabilities:
|
||||||||
|
Payable to AllianceBernstein
|
$ | — | $ | 1,484 | ||||
|
Other liabilities
|
458 | 699 | ||||||
|
Total liabilities
|
458 | 2,183 | ||||||
|
Commitments and contingencies (
See Note 7
)
|
||||||||
|
Partners’ capital:
|
||||||||
|
General Partner: 100,000 general partnership units issued and outstanding
|
1,648 | 1,668 | ||||||
|
Limited partners: 104,986,799 and 101,251,749 limited partnership units issued and outstanding
|
1,997,642 | 1,927,991 | ||||||
|
Holding Units held by AllianceBernstein to fund deferred compensation plans
|
(200,284 | ) | (123,783 | ) | ||||
|
Accumulated other comprehensive income (loss)
|
(11,896 | ) | (7,984 | ) | ||||
|
Total partners’ capital
|
1,787,110 | 1,797,892 | ||||||
|
Total liabilities and partners’ capital
|
$ | 1,787,568 | $ | 1,800,075 | ||||
See Accompanying Notes to Financial Statements.
Allia
nce
Bernstein Holding L.P.
Statements of Income
|
Years Ended December 31,
|
||||||||||||
|
2010
|
2009
|
2008
|
||||||||||
|
(in thousands, except per unit amounts)
|
||||||||||||
|
Equity in net income attributable to AllianceBernstein Unitholders
|
$ | 162,217 | $ | 192,513 | $ | 278,636 | ||||||
|
Income taxes
|
28,059 | 25,324 | 33,910 | |||||||||
|
Net income
|
$ | 134,158 | $ | 167,189 | $ | 244,726 | ||||||
|
Net income per unit:
|
||||||||||||
|
Basic
|
$ | 1.33 | $ | 1.80 | $ | 2.79 | ||||||
|
Diluted
|
$ | 1.32 | $ | 1.80 | $ | 2.79 | ||||||
See Accompanying Notes to Financial Statements.
AllianceBernstein Holding L.P.
Statements of Changes in Partners’ Capital and Comprehensive Income
|
Years Ended December 31,
|
||||||||||||
|
2010
|
2009
|
2008
|
||||||||||
|
(in thousands)
|
||||||||||||
|
General Partner’s Capital
|
||||||||||||
|
Balance, beginning of year
|
$ | 1,668 | $ | 1,633 | $ | 1,698 | ||||||
|
Net income
|
131 | 179 | 280 | |||||||||
|
Cash distributions to unitholders
|
(151 | ) | (144 | ) | (345 | ) | ||||||
|
Balance, end of year
|
1,648 | 1,668 | 1,633 | |||||||||
|
Limited Partners’ Capital
|
||||||||||||
|
Balance, beginning of year
|
1,927,991 | 1,621,168 | 1,593,361 | |||||||||
|
Net income
|
134,027 | 167,010 | 244,446 | |||||||||
|
Cash distributions to unitholders
|
(151,208 | ) | (132,929 | ) | (301,031 | ) | ||||||
|
Issuance of Holding Units to fund deferred compensation plan awards
|
78,545 | 272,167 | 70,867 | |||||||||
|
Proceeds from exercise of compensatory options to buy Holding Units
|
8,287 | — | 13,525 | |||||||||
|
Other
|
— | 575 | — | |||||||||
|
Balance, end of year
|
1,997,642 | 1,927,991 | 1,621,168 | |||||||||
|
Holding Units held by AllianceBernstein to fund deferred compensation plans
|
||||||||||||
|
Balance, beginning of year
|
(123,783 | ) | (36,815 | ) | (36,621 | ) | ||||||
|
Holding Units held by AllianceBernstein to fund deferred compensation plans
|
(76,501 | ) | (86,968 | ) | (194 | ) | ||||||
|
Balance, end of year
|
(200,284 | ) | (123,783 | ) | (36,815 | ) | ||||||
|
Accumulated Other Comprehensive Income (Loss)
|
||||||||||||
|
Balance, beginning of year
|
(7,984 | ) | (24,463 | ) | 17,550 | |||||||
|
Unrealized gain (loss) on investments, net of tax
|
139 | 1,461 | (1,188 | ) | ||||||||
|
Foreign currency translation adjustment, net of tax
|
(147 | ) | 13,043 | (32,464 | ) | |||||||
|
Changes in employee benefit related items, net of tax
|
(3,904 | ) | 1,975 | (8,361 | ) | |||||||
|
Balance, end of year
|
(11,896 | ) | (7,984 | ) | (24,463 | ) | ||||||
|
Total Partners’ Capital
|
$ | 1,787,110 | $ | 1,797,892 | $ | 1,561,523 | ||||||
See Accompanying Notes to Financial Statements.
AllianceBernstein Holding L.P.
Statements of Cash Flows
|
Years Ended December 31,
|
||||||||||||
|
2010
|
2009
|
2008
|
||||||||||
|
(in thousands)
|
||||||||||||
|
Cash flows from operating activities:
|
||||||||||||
|
Net income
|
$ | 134,158 | $ | 167,189 | $ | 244,726 | ||||||
|
Adjustments to reconcile net income to net cash used in operating activities:
|
||||||||||||
|
Equity in net income attributable to AllianceBernstein Unitholders
|
(162,217 | ) | (192,513 | ) | (278,636 | ) | ||||||
|
Cash distributions received from AllianceBernstein
|
182,410 | 160,114 | 338,448 | |||||||||
|
Changes in assets and liabilities:
|
||||||||||||
|
(Increase) in due from AllianceBernstein
|
(1,277 | ) | — | — | ||||||||
|
Decrease (increase) in other assets
|
10 | 1,387 | (675 | ) | ||||||||
|
(Decrease) in payable to AllianceBernstein
|
(1,484 | ) | (3,341 | ) | (2,635 | ) | ||||||
|
(Decrease) increase in other liabilities
|
(241 | ) | 237 | 148 | ||||||||
|
Net cash provided by operating activities
|
151,359 | 133,073 | 301,376 | |||||||||
|
Cash flows from investing activities:
|
||||||||||||
|
Investments in AllianceBernstein with proceeds from exercises of compensatory options to buy Holding Units
|
(8,287 | ) | — | (13,525 | ) | |||||||
|
Net cash used in investing activities
|
(8,287 | ) | — | (13,525 | ) | |||||||
|
Cash flows from financing activities:
|
||||||||||||
|
Cash distributions to unitholders
|
(151,359 | ) | (133,073 | ) | (301,376 | ) | ||||||
|
Proceeds from exercise of compensatory options to buy Holding Units
|
8,287 | — | 13,525 | |||||||||
|
Net cash used in financing activities
|
(143,072 | ) | (133,073 | ) | (287,851 | ) | ||||||
|
Change in cash and cash equivalents
|
— | — | — | |||||||||
|
Cash and cash equivalents as of beginning of the year
|
— | — | — | |||||||||
|
Cash and cash equivalents as of end of the year
|
$ | — | $ | — | $ | — | ||||||
|
Cash paid:
|
||||||||||||
|
Income taxes
|
$ | 28,305 | $ | 24,749 | $ | 34,410 | ||||||
|
Non-cash investing activities:
|
||||||||||||
|
Changes in accumulated other comprehensive income (loss)
|
(3,912 | ) | 16,479 | (42,013 | ) | |||||||
|
Issuance of Holding Units to fund deferred compensation plan awards
|
78,545 | 272,167 | 70,867 | |||||||||
See Accompanying Notes to Financial Statements.
AllianceBernstein Holding L.P.
Notes to Financial Statements
The words
“we”
and
“our”
refer collectively to AllianceBernstein Holding L.P. (
“Holding”
) and AllianceBernstein L.P. and its subsidiaries (
“AllianceBernstein”
), or to their officers and employees. Similarly, the word
“company”
refers to both Holding and AllianceBernstein. Where the context requires distinguishing between Holding and AllianceBernstein, we identify which of them is being discussed. Cross-references are in italics.
1. Business Description and Organization
Holding’s principal source of income and cash flow is attributable to its investment in AllianceBernstein limited partnership interests.
AllianceBernstein provides research, diversified investment management and related services globally to a broad range of clients. Its principal services include:
|
|
•
|
Institutional Services—servicing its institutional clients, including unaffiliated corporate and public employee pension funds, endowment funds, domestic and foreign institutions and governments, and affiliates such as AXA and certain of its insurance company subsidiaries, by means of separately-managed accounts, sub-advisory relationships, structured products, collective investment trusts, mutual funds, hedge funds and other investment vehicles.
|
|
|
•
|
Retail Services—servicing its retail clients, primarily by means of retail mutual funds sponsored by AllianceBernstein or an affiliated company, sub-advisory relationships with mutual funds sponsored by third parties, separately-managed account programs sponsored by financial intermediaries worldwide and other investment vehicles.
|
|
|
•
|
Private Client Services—servicing its private clients, including high-net-worth individuals, trusts and estates, charitable foundations, partnerships, private and family corporations, and other entities, by means of separately-managed accounts, hedge funds, mutual funds and other investment vehicles.
|
|
|
•
|
Bernstein Research Services—servicing institutional investors seeking research, portfolio analysis and brokerage-related services, and issuers of publicly-traded securities seeking equity capital markets services.
|
AllianceBernstein also provides distribution, shareholder servicing and administrative services to the mutual funds it sponsors.
AllianceBernstein’s in-depth research is the foundation of its business. AllianceBernstein’s research disciplines include fundamental research, quantitative research, economic research and currency forecasting. In addition, AllianceBernstein has created several specialized research initiatives, research examining global strategic changes that can affect multiple industries and geographies.
AllianceBernstein provides a broad range of investment services with expertise in:
|
|
•
|
Value equities, generally targeting stocks that are out of favor and considered undervalued;
|
|
|
•
|
Growth equities, generally targeting stocks with under-appreciated growth potential;
|
|
|
•
|
Fixed income securities, including taxable and tax-exempt securities;
|
|
|
•
|
Blend strategies, combining style-pure investment components with systematic rebalancing;
|
|
|
•
|
Passive management, including both index and enhanced index strategies;
|
|
|
•
|
Alternative investments, including hedge funds, currency management strategies and private capital (
e.g.
, direct real estate investing); and
|
|
|
•
|
Asset allocation services, by which AllianceBernstein offers strategies specifically-tailored for its clients (
e.g
., customized target-date fund retirement services for defined contribution plan sponsors and our Dynamic Asset Allocation service, which is designed to mitigate the effects of extreme market volatility on a portfolio in order to deliver more consistent returns).
|
AllianceBernstein manages these services using various investment disciplines, including market capitalization (
e.g
., large-, mid- and small-cap equities), term (
e.g
., long-, intermediate- and short-duration debt securities), and geographic location (
e.g
., U.S., international, global and emerging markets), as well as local and regional disciplines in major markets around the world.
AllianceBernstein markets and distributes alternative investment products globally to high-net-worth clients and institutional investors. In October 2010, AllianceBernstein acquired SunAmerica’s alternative investments group, a team that manages a portfolio of hedge fund and private equity fund investments. Additionally, in October 2010, AllianceBernstein launched a real estate fund focused on opportunistic real estate investments. These initiatives have helped AllianceBernstein expand its alternative investment capabilities.
In 2008, AllianceBernstein created an initiative called AllianceBernstein Defined Contribution Investments (
“ABDC”
) focused on expanding its capabilities in the defined contribution market. ABDC seeks to provide the most effective defined contribution investment solutions in the industry, as measured by product features, reliability, cost and flexibility, to meet specialized client needs by integrating research and investment design, product strategy, strategic partnerships (
e.g.
, record-keeper partnerships and operations collaboration), and client implementation and service. In November 2010, AllianceBernstein introduced Secure Retirement Strategies (
"SRS"
), a multi-manager target-date solution. SRS provides guaranteed lifetime retirement income backed by multiple insurers to participants of large defined contribution plans.
During 2009, AllianceBernstein was selected by the U.S. Treasury Department as one of only three firms to manage its portfolio of assets issued by banks and other institutions taking part in the Capital Purchase Program of the Troubled Assets Relief Program. In addition, AllianceBernstein was selected by the U.S. Treasury Department as one of nine pre-qualified fund managers under the Public-Private Investment Program and, during the fourth quarter of 2009, AllianceBernstein was one of five firms that closed an initial Public-Private Investment Fund (
“PPIF”
) of at least $500 million. In April 2010, AllianceBernstein’s PPIF closed with over $1.1 billion raised.
As of December 31, 2010, AXA, a
société anonyme
organized under the laws of France and the holding company for an international group of insurance and related financial services companies, through certain of its subsidiaries (
“AXA and its subsidiaries”
) owned approximately 1.4% of the issued and outstanding units representing assignments of beneficial ownership of limited partnership interests in Holding (
“Holding Units”
).
As of December 31, 2010, the ownership structure of AllianceBernstein, expressed as a percentage of general and limited partnership interests, was as follows:
|
AXA and its subsidiaries
|
60.9 | % | ||
|
Holding
|
37.4 | |||
|
Unaffiliated Holders
|
1.7 | |||
| 100.0 | % |
AllianceBernstein Corporation (an indirect wholly-owned subsidiary of AXA,
“General Partner”
) is the general partner of both Holding and AllianceBernstein. AllianceBernstein Corporation owns 100,000 general partnership units in Holding and a 1% general partnership interest in AllianceBernstein. Including both the general partnership and limited partnership interests in Holding and AllianceBernstein, AXA and its subsidiaries had an approximate 61.4% economic interest in AllianceBernstein as of December 31, 2010.
2. Summary of Significant Accounting Policies
Basis of Presentation
The financial statements have been prepared in accordance with accounting principles generally accepted in the United States of America. The preparation of the financial statements requires management to make certain estimates and assumptions that affect the reported amounts of assets and liabilities and disclosure of contingent assets and liabilities at the dates of the financial statements and the reported amounts of revenues and expenses during the reporting periods. Actual results could differ from those estimates.
Holding’s financial statements and notes should be read in conjunction with the consolidated financial statements and notes of AllianceBernstein. AllianceBernstein’s consolidated financial statements and notes and management’s discussion and analysis of financial condition and results of operations are included in Holding’s Form 10-K.
Change in Presentation
During the first quarter of 2010, we changed the presentation in the prior periods of Holding’s proportionate share of the Holding Units held by AllianceBernstein to fund deferred compensation plans as a reduction of Holding’s partners’ capital. We consider this change, which has the effect of reducing Holding’s investment in AllianceBernstein, to be a better presentation of Holding’s proportionate share of AllianceBernstein’s capital transactions and we do not consider this change to be significant.
In addition, we appropriately revised the presentation of cash distributions received from AllianceBernstein from cash inflows from investing activities in the statements of cash flows to cash inflows from operating activities. We consider this change to be a better presentation of Holding’s operating and investing activities and we do not consider this change to be significant.
Investment in AllianceBernstein
We record our investment in AllianceBernstein using the equity method of accounting. Our investment is increased to reflect our proportionate share of income of AllianceBernstein and decreased to reflect our proportionate share of losses of AllianceBernstein and cash distributions made by AllianceBernstein to its unitholders. In addition, our investment is adjusted to reflect our proportionate share of certain capital transactions of AllianceBernstein.
Cash Distributions
Holding is required to distribute all of its Available Cash Flow, as defined in the Amended and Restated Agreement of Limited Partnership of Holding (
“Holding Partnership Agreement”
), to its unitholders
pro rata
in accordance with their percentage interests in Holding. Available Cash Flow is defined as the cash distributions Holding receives from AllianceBernstein minus such amounts as the General Partner determines, in its sole discretion, should be retained by Holding for use in its business.
On February 10, 2011, the General Partner declared a distribution of $44.1 million, or $0.42 per unit, representing Available Cash Flow for the three months ended December 31, 2010. Each general partnership unit in Holding is entitled to receive distributions equal to those received by each Holding Unit. The distribution is payable on March 3, 2011 to holders of record at the close of business on February 22, 2011.
Total cash distributions per Unit paid to unitholders during 2010, 2009 and 2008 were $1.51, $1.44 and $3.45, respectively.
Compensatory Unit Awards and Option Plans
AllianceBernstein maintains certain compensation plans under which grants of restricted Holding Units and options to buy Holding Units have been granted to employees of AllianceBernstein and independent directors of the General Partner.
AllianceBernstein funds its restricted Holding Unit awards to employees either by purchasing newly-issued Holding Units from Holding or purchasing Holding Units on the open market, all of which are held in a consolidated rabbi trust until they are distributed to employees upon vesting. In accordance with the Holding Partnership Agreement, when Holding issues Holding Units to AllianceBernstein, Holding is required to use the proceeds it receives from AllianceBernstein to purchase the equivalent number of newly-issued AllianceBernstein Units, thus increasing its percentage ownership interest in AllianceBernstein. Holding Units held in the consolidated rabbi trust are corporate assets in the name of the trust and are available to the general creditors of AllianceBernstein.
AllianceBernstein engages in open-market purchases of Holding Units to help fund anticipated obligations under its incentive compensation award program and purchases Holding Units from employees to allow them to fulfill statutory tax requirements at the time of distribution of long-term incentive compensation awards. During 2010, AllianceBernstein purchased 8.8 million Holding Units for $226.4 million, reflecting open-market purchases of 7.4 million Holding Units for $195.3 million and the remainder primarily relating to employee tax withholding purchases. AllianceBernstein intends to continue to engage in open-market purchases of Holding Units, from time to time, to help fund anticipated obligations under its incentive compensation award program.
AllianceBernstein granted 13.1 million restricted Holding Unit awards to employees during 2010. To fund these awards, Holding newly issued 3.2 million Holding Units and AllianceBernstein allocated 9.9 million previously repurchased Holding Units that had been held in the consolidated rabbi trust. There were approximately 30,000 unallocated Holding Units remaining in the consolidated rabbi trust as of December 31, 2010.
New Holding Units are also issued upon exercise of options. Proceeds received by Holding upon exercise of options are used to acquire newly-issued AllianceBernstein Units, increasing Holding’s percentage ownership interest in AllianceBernstein. As of December 31, 2010, there were 10,217,871 options to buy Holding Units outstanding, of which 2,714,386 were exercisable.
AllianceBernstein recognizes compensation expense related to these grants in its financial statements using the fair value method. Under the fair value method, compensatory expense is measured at the grant date based on the estimated fair value of the award and is recognized over the vesting period. Fair value of restricted Holding Unit awards is the closing price of a Holding Unit on the grant date; fair value of options is determined using the Black-Scholes option valuation model.
On July 26, 2010, the Amended and Restated 1997 Long Term Incentive Plan expired. Effective as of July 1, 2010, we established the 2010 Long Term Incentive Plan (
“2010 Plan”
), which was adopted by Holding Unitholders at a special meeting held on June 30, 2010. The following forms of awards may be granted to employees and independent directors of the General Partner under the 2010 Plan: (i) restricted Holding Units or phantom restricted Holding Units (a “phantom” award is a contractual right to receive Holding Units at a later date or upon a specified event); (ii) options to buy Holding Units; and (iii) other Holding Unit-based awards (including, without limitation, Holding Unit appreciation rights and performance awards). The 2010 Plan will expire on June 30, 2020, and no awards under the 2010 Plan will be made after that date. Under the 2010 Plan, the number of newly-issued Holding Units with respect to which awards may be granted is 30 million. The 2010 Plan also permits AllianceBernstein to award an additional 30 million Holding Units if the Holding Units are acquired on the open market or through private purchases. During 2010, AllianceBernstein granted 12.5 million Holding Unit awards under the 2010 Plan. As of December 31, 2010, 27.1 million newly-issued Holding Units and 20.4 million repurchased Holding Units are available for grant.
3. Net Income Per Unit
Basic net income per unit is derived by dividing net income by the basic weighted average number of units outstanding for each year. Diluted net income per unit is derived by adjusting net income for the assumed dilutive effect of compensatory options (“Net income—diluted”) and dividing by the diluted weighted average number of units outstanding for each year.
|
Years Ended December 31,
|
||||||||||||
|
2010
|
2009
|
2008
|
||||||||||
|
(in thousands, except per unit amounts)
|
||||||||||||
|
Net income—basic
|
$ | 134,158 | $ | 167,189 | $ | 244,726 | ||||||
|
Additional allocation of equity in net income attributable to AllianceBernstein resulting from assumed dilutive effect of compensatory options
|
1,640 | 328 | 1,133 | |||||||||
|
Net income—diluted
|
$ | 135,798 | $ | 167,517 | $ | 245,859 | ||||||
|
Weighted average units outstanding—basic
|
101,162 | 92,906 | 87,571 | |||||||||
|
Dilutive effect of compensatory options
|
1,639 | 244 | 531 | |||||||||
|
Weighted average units outstanding—diluted
|
102,801 | 93,150 | 88,102 | |||||||||
|
Basic net income per unit
|
$ | 1.33 | $ | 1.80 | $ | 2.79 | ||||||
|
Diluted net income per unit
|
$ | 1.32 | $ | 1.80 | $ | 2.79 | ||||||
As of December 31, 2010, 2009 and 2008, we excluded 4,783,472, 5,752,877 and 5,050,605, respectively, out-of-the-money options (
i.e.
, options with an exercise price greater than the weighted average closing price of a unit for the relevant period) from the diluted net income per unit computation due to their anti-dilutive effect.
4. Investment in AllianceBernstein
Changes in Holding’s investment in AllianceBernstein for the years ended December 31, 2010 and 2009 were as follows:
|
2010
|
2009
|
|||||||
|
(in thousands)
|
||||||||
|
Investment in AllianceBernstein as of January 1,
|
$ | 1,800,065 | $ | 1,565,413 | ||||
|
Equity in net income attributable to AllianceBernstein Unitholders
|
162,217 | 192,513 | ||||||
|
Additional investments with proceeds from exercises of compensatory options to buy Holding Units, net
|
8,287 | — | ||||||
|
Changes in accumulated other comprehensive income (loss)
|
(3,912 | ) | 16,479 | |||||
|
Cash distributions received from AllianceBernstein
|
(182,410 | ) | (160,114 | ) | ||||
|
Issuance of Holding Units to AllianceBernstein to fund deferred compensation plan awards
|
78,545 | 272,167 | ||||||
|
Change in Holding Units held by AllianceBernstein for deferred compensation plans
|
(76,501 | ) | (86,968 | ) | ||||
|
Other
|
— | 575 | ||||||
|
Investment in AllianceBernstein as of December 31,
|
$ | 1,786,291 | $ | 1,800,065 | ||||
5. Units Outstanding
Changes in Holding Units outstanding for the years ended December 31, 2010 and 2009 were as follows:
|
2010
|
2009
|
|||||||
|
Outstanding as of January 1,
|
101,351,749 | 90,323,767 | ||||||
|
Options exercised
|
486,017 | — | ||||||
|
Units issued
|
3,249,861 | 11,030,983 | ||||||
|
Units forfeited
|
(828 | ) | (3,001 | ) | ||||
|
Outstanding as of December 31,
|
105,086,799 | 101,351,749 | ||||||
Units issued pertain to Holding Units newly issued under either our Amended and Restated 1997 Long Term Incentive Plan or our 2010 Plan and could include: (i) restricted Holding Unit awards to independent members of the Board of Directors of the General Partner, (ii) restricted Holding Unit awards to eligible employees, (iii) restricted Holding Unit awards for recruitment, and (iv) restricted Holding Unit issuances in connection with certain employee separation agreements.
6. Income Taxes
Holding is a publicly-traded partnership for federal tax purposes and, accordingly, is not subject to federal or state corporate income taxes. However, Holding is subject to the 4.0% New York City unincorporated business tax (
“UBT”
), net of credits for UBT paid by AllianceBernstein, and to a 3.5% federal tax on partnership gross income from the active conduct of a trade or business. Holding’s partnership gross income is derived from its interest in AllianceBernstein.
The principal reasons for the difference between Holding’s effective tax rates and the UBT statutory tax rate of 4.0% are as follows:
|
Years Ended December 31,
|
||||||||||||||||||||||||
|
2010
|
2009
|
2008
|
||||||||||||||||||||||
|
(in thousands)
|
||||||||||||||||||||||||
|
UBT statutory rate
|
$ | 6,489 | 4.0 | % | $ | 7,701 | 4.0 | % | $ | 11,145 | 4.0 | % | ||||||||||||
|
Federal tax on partnership gross business income
|
28,059 | 17.3 | 25,324 | 13.2 | 33,910 | 12.2 | ||||||||||||||||||
|
Credit for UBT paid by AllianceBernstein
|
(6,489 | ) | (4.0 | ) | (7,701 | ) | (4.0 | ) | (11,145 | ) | (4.0 | ) | ||||||||||||
|
Income tax expense and effective tax rate
|
$ | 28,059 | 17.3 | $ | 25,324 | 13.2 | $ | 33,910 | 12.2 | |||||||||||||||
Holding’s income taxes represent a 3.5% federal tax on its partnership gross income from the active conduct of a trade or business. Holding's partnership gross income is derived from its interest in AllianceBernstein. Holding's income tax is computed by multiplying its ownership interest in AllianceBernstein by 3.5% of certain AllianceBernstein revenues (primarily investment advisory fees and SCB LLC transaction charges). During 2010, both AllianceBernstein’s revenues and Holding’s ownership interest in AllianceBernstein increased as compared to 2009, which increased Holding’s income tax provision in 2010 as compared to the prior year. In addition, AllianceBernstein’s net income decreased significantly in 2010 primarily as a result of a real estate charge in the third quarter of 2010, reducing Holding’s equity earnings in 2010 compared to the corresponding period in 2009. As a result of these factors, Holding’s effective tax rate increased from 13.2% in 2009 to 17.3% in 2010. During 2009, Holding’s ownership interest in AllianceBernstein increased while AllianceBernstein’s revenues decreased as compared to 2008. As a result, Holding’s effective tax rate increased from 12.2% in 2008 to 13.2% in 2009.
In order to preserve Holding’s status as a “grandfathered” publicly-traded partnership for federal income tax purposes, management ensures that Holding does not directly or indirectly (through AllianceBernstein) enter into a substantial new line of business. If Holding were to lose its status as a “grandfathered” publicly-traded partnership, it would be subject to corporate income tax, which would reduce materially Holding’s net income and its quarterly distributions to Holding unitholders. For additional information regarding Holding’s tax status,
see “Business—Taxes” in Item 1 and “Risk Factors” in Item 1A
.
The effect of a tax position is recognized in the financial statements only if, as of the reporting date, it is “more likely than not” to be sustained based solely on its technical merits. In making this assessment, a company must assume that the taxing authority will examine the tax position and have full knowledge of all relevant information. Accordingly, we have no liability for unrecognized tax benefits as of December 31, 2010, 2009 and 2008. A liability for unrecognized tax benefits, if required, would be recorded in income tax expense and affect the company’s effective tax rate.
We are no longer subject to federal, state and local income tax examinations by tax authorities for all years prior to 2007. Currently, there are no examinations in progress and to date we have not been notified of any future examinations by applicable taxing authorities.
7. Commitments and Contingencies
Legal and regulatory matters described below pertain to AllianceBernstein and are included here due to their potential significance to Holding’s investment in AllianceBernstein.
With respect to all significant litigation matters, we consider the likelihood of a negative outcome. If we determine the likelihood of a negative outcome is probable, and the amount of the loss can be reasonably estimated, we record an estimated loss for the expected outcome of the litigation. If the likelihood of a negative outcome is reasonably possible and we are able to determine an estimate of the possible loss or range of loss, we disclose that fact together with the estimate of the possible loss or range of loss. However, it is difficult to predict the outcome or estimate a possible loss or range of loss because litigation is subject to inherent uncertainties, particularly when plaintiffs allege substantial or indeterminate damages, or when the litigation is highly complex or broad in scope. In such cases, we disclose that we are unable to predict the outcome or estimate a possible loss or range of loss.
On October 2, 2003, a purported class action complaint entitled
Hindo, et al. v. AllianceBernstein Growth & Income Fund, et al.
(
“Hindo Complaint”
) was filed against, among others, AllianceBernstein, Holding and the General Partner. The Hindo Complaint alleges that certain defendants failed to disclose that they improperly allowed certain hedge funds and other unidentified parties to engage in “late trading” and “market timing” of certain of our U.S. mutual fund securities, violating various securities laws.
Following October 2, 2003, additional lawsuits making factual allegations generally similar to those in the Hindo Complaint were filed in various federal and state courts against AllianceBernstein and certain other defendants. On September 29, 2004, plaintiffs filed consolidated amended complaints with respect to four claim types: mutual fund shareholder claims; mutual fund derivative claims; derivative claims brought on behalf of Holding; and claims brought under the Employee Retirement Income Security Act of 1974, as amended (
“ERISA”
) by participants in the Profit Sharing Plan for Employees of AllianceBernstein.
On April 21, 2006, AllianceBernstein and attorneys for the plaintiffs in the mutual fund shareholder claims, mutual fund derivative claims and ERISA claims entered into a confidential memorandum of understanding containing their agreement to settle these claims. The agreement was documented by a stipulation of settlement, which has been approved by the court. The settlement amount ($30 million), which we previously expensed and disclosed, has been disbursed. The derivative claims brought on behalf of Holding, in which plaintiffs seek an unspecified amount of damages, remain pending.
We intend to vigorously defend against the lawsuit involving derivative claims brought on behalf of Holding. At the present time, we are unable to predict the outcome or estimate a possible loss or range of loss in respect of this matter because of the inherent uncertainty regarding the outcome of complex litigation, and the fact that the plaintiffs did not specify an amount of damages sought in their complaint.
We are involved in various other matters, including regulatory inquiries, administrative proceedings and litigation, some of which allege significant damages. While any inquiry, proceeding or litigation has the element of uncertainty, management believes that the outcome of any one of the other regulatory inquiries, administrative proceedings, lawsuits or claims that is pending or threatened, or all of them combined, will not have a material adverse effect on our results of operations or financial condition.
8. Quarterly Financial Data (Unaudited)
|
Quarters Ended
|
||||||||||||||||
|
December 31
|
September 30
|
June 30
|
March 31
|
|||||||||||||
|
(in thousands, except per unit amounts)
|
||||||||||||||||
|
2010:
|
||||||||||||||||
|
Equity in net income attributable to AllianceBernstein Unitholders
|
$ | 50,168 | $ | 18,914 | $ | 38,925 | $ | 54,210 | ||||||||
|
Net income
|
$ | 42,925 | $ | 12,215 | $ | 31,772 | $ | 47,246 | ||||||||
|
Basic net income per unit
(1)
|
$ | 0.43 | $ | 0.12 | $ | 0.31 | $ | 0.47 | ||||||||
|
Diluted net income per unit
(1)
|
$ | 0.42 | $ | 0.12 | $ | 0.31 | $ | 0.46 | ||||||||
|
Cash distributions per unit
(2)
|
$ | 0.42 | $ | 0.12 | $ | 0.31 | $ | 0.46 | ||||||||
|
2009:
|
||||||||||||||||
|
Equity in net income attributable to AllianceBernstein Unitholders
|
$ | 67,086 | $ | 68,723 | $ | 44,092 | $ | 12,612 | ||||||||
|
Net income
|
$ | 59,671 | $ | 62,530 | $ | 38,253 | $ | 6,735 | ||||||||
|
Basic net income per unit
(1)
|
$ | 0.63 | $ | 0.67 | $ | 0.41 | $ | 0.07 | ||||||||
|
Diluted net income per unit
(1)
|
$ | 0.62 | $ | 0.67 | $ | 0.41 | $ | 0.07 | ||||||||
|
Cash distributions per unit
(2)
|
$ | 0.62 | $ | 0.67 | $ | 0.41 | $ | 0.07 | ||||||||
_____________
|
(1)
|
Basic and diluted net income per unit are computed independently for each of the periods presented. Accordingly, the sum of the quarterly net income per unit amounts may not agree to the total for the year.
|
|
(2)
|
Declared and paid during the following quarter.
|
Report of Independent Registered Public Accounting Firm
To the General Partner and Unitholders
AllianceBernstein Holding L.P.:
In our opinion, the accompanying statements of financial condition and the related statements of income, changes in partners’ capital and comprehensive income and cash flows present fairly, in all material respects, the financial position of AllianceBernstein Holding L.P. (“AllianceBernstein Holding”) at December 31, 2010 and 2009, and the results of its operations and its cash flows for each of the three years in the period ended December 31, 2010 in conformity with accounting principles generally accepted in the United States of America. Also in our opinion, AllianceBernstein Holding maintained, in all material respects, effective internal control over financial reporting as of December 31, 2010, based on criteria established in
Internal Control-Integrated Framework
issued by the Committee of Sponsoring Organizations of the Treadway Commission (COSO). AllianceBernstein Holding’s management is responsible for these financial statements, for maintaining effective internal control over financial reporting and for its assessment of the effectiveness of internal control over financial reporting, included in
Management’s Report on Internal Control over Financial Reporting
appearing under Item 9A. Our responsibility is to express opinions on these financial statements and on AllianceBernstein Holding’s internal control over financial reporting based on our integrated audits. We conducted our audits in accordance with the standards of the Public Company Accounting Oversight Board (United States). Those standards require that we plan and perform the audits to obtain reasonable assurance about whether the financial statements are free of material misstatement and whether effective internal control over financial reporting was maintained in all material respects. Our audits of the financial statements included examining, on a test basis, evidence supporting the amounts and disclosures in the financial statements, assessing the accounting principles used and significant estimates made by management, and evaluating the overall financial statement presentation. Our audit of internal control over financial reporting included obtaining an understanding of internal control over financial reporting, assessing the risk that a material weakness exists, and testing and evaluating the design and operating effectiveness of internal control based on the assessed risk. Our audits also included performing such other procedures as we considered necessary in the circumstances. We believe that our audits provide a reasonable basis for our opinions.
A company’s internal control over financial reporting is a process designed to provide reasonable assurance regarding the reliability of financial reporting and the preparation of financial statements for external purposes in accordance with generally accepted accounting principles. A company’s internal control over financial reporting includes those policies and procedures that (i) pertain to the maintenance of records that, in reasonable detail, accurately and fairly reflect the transactions and dispositions of the assets of the company; (ii) provide reasonable assurance that transactions are recorded as necessary to permit preparation of financial statements in accordance with generally accepted accounting principles, and that receipts and expenditures of the company are being made only in accordance with authorizations of management and directors of the company; and (iii) provide reasonable assurance regarding prevention or timely detection of unauthorized acquisition, use, or disposition of the company’s assets that could have a material effect on the financial statements.
Because of its inherent limitations, internal control over financial reporting may not prevent or detect misstatements. Also, projections of any evaluation of effectiveness to future periods are subject to the risk that controls may become inadequate because of changes in conditions, or that the degree of compliance with the policies or procedures may deteriorate.
|
/s/ PricewaterhouseCoopers LLP
|
New York, New York
February 10, 2011
AllianceBernstein L.P. and Subsidiaries
Consolidated Statements of Financial Condition
|
December 31,
|
||||||||
|
2010
|
2009
|
|||||||
|
(in thousands, except unit
amounts)
|
||||||||
|
ASSETS
|
||||||||
|
Cash and cash equivalents
|
$ | 650,191 | $ | 614,216 | ||||
|
Cash and securities segregated, at fair value (cost $1,109,785 and $985,213)
|
1,109,891 | 985,331 | ||||||
|
Receivables, net:
|
||||||||
|
Brokers and dealers
|
299,314 | 170,148 | ||||||
|
Brokerage clients
|
747,049 | 582,248 | ||||||
|
Fees
|
343,473 | 346,482 | ||||||
|
Investments:
|
||||||||
|
Deferred compensation-related
|
298,705 | 400,959 | ||||||
|
Other
|
457,850 | 373,870 | ||||||
|
Furniture, equipment and leasehold improvements, net
|
300,442 | 359,674 | ||||||
|
Goodwill
|
2,939,170 | 2,893,029 | ||||||
|
Intangible assets, net
|
205,862 | 223,992 | ||||||
|
Deferred sales commissions, net
|
76,156 | 90,187 | ||||||
|
Other assets
|
151,284 | 174,804 | ||||||
|
Total assets
|
$ | 7,579,387 | $ | 7,214,940 | ||||
|
LIABILITIES AND CAPITAL
|
||||||||
|
Liabilities:
|
||||||||
|
Payables:
|
||||||||
|
Brokers and dealers
|
$ | 221,370 | $ | 120,574 | ||||
|
Securities sold not yet purchased
|
50,539 | 31,806 | ||||||
|
Brokerage clients
|
1,750,737 | 1,430,835 | ||||||
|
AllianceBernstein mutual funds
|
77,179 | 86,054 | ||||||
|
Accounts payable and accrued expenses
|
422,860 | 278,398 | ||||||
|
Accrued compensation and benefits
|
338,560 | 316,331 | ||||||
|
Debt
|
224,991 | 248,987 | ||||||
|
Total liabilities
|
3,086,236 | 2,512,985 | ||||||
|
Commitments and contingencies
(See Note 12
)
|
||||||||
|
Capital:
|
||||||||
|
General Partner
|
48,964 | 48,671 | ||||||
|
Limited partners: 278,115,232 and 274,745,592 units issued and outstanding
|
4,902,854 | 4,862,158 | ||||||
|
Capital contributions receivable from General Partner
|
(15,973 | ) | (19,664 | ) | ||||
|
Holding Units held for deferred compensation plans
|
(535,410 | ) | (338,941 | ) | ||||
|
Accumulated other comprehensive income (loss)
|
(31,801 | ) | (21,862 | ) | ||||
|
Partners’ capital attributable to AllianceBernstein Unitholders
|
4,368,634 | 4,530,362 | ||||||
|
Non-controlling interests in consolidated entities
|
124,517 | 171,593 | ||||||
|
Total capital
|
4,493,151 | 4,701,955 | ||||||
|
Total liabilities and capital
|
$ | 7,579,387 | $ | 7,214,940 | ||||
See Accompanying Notes to Consolidated Financial Statements.
AllianceBernstein L.P. and Subsidiaries
Consolidated Statements of Income
|
Years Ended December 31,
|
||||||||||||
|
2010
|
2009
|
2008
|
||||||||||
|
(in thousands, except per unit amounts)
|
||||||||||||
|
Revenues:
|
||||||||||||
|
Investment advisory and services fees
|
$ | 2,051,692 | $ | 1,920,332 | $ | 2,839,526 | ||||||
|
Bernstein research services
|
430,521 | 434,605 | 471,716 | |||||||||
|
Distribution revenues
|
338,597 | 277,328 | 378,425 | |||||||||
|
Dividend and interest income
|
22,902 | 26,730 | 91,752 | |||||||||
|
Investment gains (losses)
|
(1,410 | ) | 144,447 | (349,172 | ) | |||||||
|
Other revenues
|
109,803 | 107,848 | 118,436 | |||||||||
|
Total revenues
|
2,952,105 | 2,911,290 | 3,550,683 | |||||||||
|
Less: Interest expense
|
3,548 | 4,411 | 36,524 | |||||||||
|
Net revenues
|
2,948,557 | 2,906,879 | 3,514,159 | |||||||||
|
Expenses:
|
||||||||||||
|
Employee compensation and benefits
|
1,322,522 | 1,298,053 | 1,454,691 | |||||||||
|
Promotion and servicing:
|
||||||||||||
|
Distribution-related payments
|
286,676 | 234,203 | 307,890 | |||||||||
|
Amortization of deferred sales commissions
|
47,397 | 54,922 | 79,111 | |||||||||
|
Other
|
192,096 | 176,703 | 200,375 | |||||||||
|
General and administrative:
|
||||||||||||
|
General and administrative
|
515,884 | 520,072 | 512,798 | |||||||||
|
Real estate charges
|
101,698 | 8,276 | — | |||||||||
|
Interest on borrowings
|
2,078 | 2,696 | 13,077 | |||||||||
|
Amortization of intangible assets
|
21,344 | 21,126 | 20,716 | |||||||||
|
Total expenses
|
2,489,695 | 2,316,051 | 2,588,658 | |||||||||
|
Operating income
|
458,862 | 590,828 | 925,501 | |||||||||
|
Non-operating income
|
6,760 | 33,657 | 18,728 | |||||||||
|
Income before income taxes
|
465,622 | 624,485 | 944,229 | |||||||||
|
Income taxes
|
38,523 | 45,977 | 95,803 | |||||||||
|
Net income
|
427,099 | 578,508 | 848,426 | |||||||||
|
Net loss (income) of consolidated entities attributable to non-controlling interests
|
15,320 | (22,381 | ) | (9,186 | ) | |||||||
|
Net income attributable to AllianceBernstein Unitholders
|
$ | 442,419 | $ | 556,127 | $ | 839,240 | ||||||
|
Net income per AllianceBernstein Unit:
|
||||||||||||
|
Basic
|
$ | 1.59 | $ | 2.07 | $ | 3.18 | ||||||
|
Diluted
|
$ | 1.58 | $ | 2.07 | $ | 3.18 | ||||||
See Accompanying Notes to Consolidated Financial Statements.
AllianceBernstein L.P. and Subsidiaries
Consolidated Statements of Changes in Partners’ Capital and Comprehensive Income
|
Year Ended December 31,
|
||||||||||||
|
2010
|
2009
|
2008
|
||||||||||
|
(in thousands)
|
||||||||||||
|
General Partner’s Capital
|
||||||||||||
|
Balance, beginning of year
|
$ | $48,671 | $ | 45,010 | $ | 45,932 | ||||||
|
Net income
|
4,424 | 5,561 | 8,392 | |||||||||
|
Cash distributions to General Partner
|
(4,978 | ) | (4,647 | ) | (10,197 | ) | ||||||
|
Issuances of Holding Units to fund deferred compensation plan awards, net of forfeitures
|
785 | 2,728 | 732 | |||||||||
|
Retirement of AllianceBernstein Units
|
(85 | ) | — | — | ||||||||
|
Compensation plan accrual
|
12 | 14 | 17 | |||||||||
|
Additional investment by Holding with proceeds from exercise of compensatory options to buy Holding Units
|
83 | — | 135 | |||||||||
|
Re-valuation of Holding Units held in Rabbi Trust
|
52 | — | — | |||||||||
|
Other
|
— | 5 | (1 | ) | ||||||||
|
Balance, end of year
|
48,964 | 48,671 | 45,010 | |||||||||
|
Limited Partners' Capital
|
||||||||||||
|
Balance, beginning of year
|
4,862,158 | 4,493,496 | 4,567,270 | |||||||||
|
Net income
|
437,995 | 550,566 | 830,848 | |||||||||
|
Cash distributions to unitholders
|
(490,118 | ) | (460,086 | ) | (1,009,482 | ) | ||||||
|
Issuance of Holding Units to fund deferred compensation plan awards, net of forfeitures
|
77,721 | 270,087 | 72,384 | |||||||||
|
Retirement of AllianceBernstein Units
|
(8,436 | ) | — | — | ||||||||
|
Re-valuation of Holding Units held in Rabbi Trust
|
5,090 | (5,750 | ) | 9,754 | ||||||||
|
Compensatory Holding Unit options expense
|
9,064 | 11,889 | 7,737 | |||||||||
|
Compensation plan accrual
|
1,176 | 1,387 | 1,642 | |||||||||
|
Additional investment by Holding with proceeds from exercise of compensatory options to buy Holding Units
|
8,204 | — | 13,390 | |||||||||
|
Other
|
— | 569 | (47 | ) | ||||||||
|
Balance, end of year
|
4,902,854 | 4,862,158 | 4,493,496 | |||||||||
|
Capital Contributions Receivable
|
||||||||||||
|
Balance, beginning of year
|
(19,664 | ) | (23,168 | ) | (26,436 | ) | ||||||
|
Capital contributions from General Partner
|
4,879 | 4,905 | 4,927 | |||||||||
|
Compensation plan accrual
|
(1,188 | ) | (1,401 | ) | (1,659 | ) | ||||||
|
Balance, end of year
|
(15,973 | ) | (19,664 | ) | (23,168 | ) | ||||||
|
Holding Units held for Deferred Compensation Plans
|
||||||||||||
|
Balance, beginning of year
|
(338,941 | ) | (125,532 | ) | (98,645 | ) | ||||||
|
Purchases of Holding Units to fund deferred compensation plans, net
|
(226,370 | ) | (7,555 | ) | (2,358 | ) | ||||||
|
Issuance of Holding Units to fund deferred compensation plan awards, net of forfeitures
|
(78,506 | ) | (272,815 | ) | (73,116 | ) | ||||||
|
Amortization of deferred compensation awards
|
113,548 | 61,211 | 58,341 | |||||||||
|
Re-valuation of Holding Units held in Rabbi Trust
|
(5,141 | ) | 5,750 | (9,754 | ) | |||||||
|
Balance, end of year
|
(535,410 | ) | (338,941 | ) | (125,532 | ) | ||||||
|
Accumulated Other Comprehensive Income (Loss)
|
||||||||||||
|
Balance, beginning of year
|
(21,862 | ) | (72,147 | ) | 53,105 | |||||||
|
Unrealized gain (loss) on investments, net of tax
|
348 | 4,232 | (3,511 | ) | ||||||||
|
Foreign currency translation adjustment, net of tax
|
(199 | ) | 39,098 | (96,978 | ) | |||||||
|
Changes in employee benefit related items, net of tax
|
(10,088 | ) | 6,955 | (24,763 | ) | |||||||
|
Balance, end of year
|
(31,801 | ) | (21,862 | ) | (72,147 | ) | ||||||
|
Total Partners' Capital attributable to AllianceBernstein Unitholders
|
4,368,634 | 4,530,362 | 4,317,659 | |||||||||
|
Non-controlling Interests in Consolidated Entities
|
||||||||||||
|
Balance, beginning of year
|
171,593 | 169,167 | 147,652 | |||||||||
|
Net (loss) income
|
(15,320 | ) | 22,381 | 9,186 | ||||||||
|
Unrealized gain (loss) on investments
|
108 | 159 | (451 | ) | ||||||||
|
Foreign currency translation adjustment
|
3,159 | 4,074 | (3,290 | ) | ||||||||
|
Cash distributions to joint venture partners
|
— | — | (10,387 | ) | ||||||||
|
Contributions from (distributions to) non-controlling interests of our consolidated venture capital fund activities
|
(35,023 | ) | (24,188 | ) | 26,457 | |||||||
|
Balance, end of year
|
124,517 | 171,593 | 169,167 | |||||||||
|
Total Capital
|
$ | 4,493,151 | $ | 4,701,955 | $ | 4,486,826 | ||||||
See Accompanying Notes to Consolidated Financial Statements.
AllianceBernstein L.P. and Subsidiaries
Consolidated Statements of Cash Flows
|
Years Ended December 31,
|
||||||||||||
|
2010
|
2009
|
2008
|
||||||||||
|
(in thousands)
|
||||||||||||
|
Cash flows from operating activities:
|
||||||||||||
|
Net income
|
$ | 427,099 | $ | 578,508 | $ | 848,426 | ||||||
|
Adjustments to reconcile net income to net cash provided by operating activities:
|
||||||||||||
|
Amortization of deferred sales commissions
|
47,397 | 54,922 | 79,111 | |||||||||
|
Amortization of non-cash deferred compensation
|
122,612 | 73,101 | 66,078 | |||||||||
|
Depreciation and other amortization
|
81,697 | 83,851 | 97,746 | |||||||||
|
Unrealized (gains) losses on deferred compensation-related investments
|
(39,094 | ) | (184,384 | ) | 254,686 | |||||||
|
Unrealized loss (gain) on consolidated venture capital fund
|
39,534 | (5,762 | ) | (1,815 | ) | |||||||
|
Real estate asset write-off charges
|
25,521 | 3,219 | — | |||||||||
|
Other, net
|
(6,692 | ) | (17,324 | ) | 14,897 | |||||||
|
Changes in assets and liabilities:
|
||||||||||||
|
(Increase) decrease in segregated cash and securities
|
(124,560 | ) | 1,587,238 | (132,792 | ) | |||||||
|
(Increase) decrease in receivables
|
(399,549 | ) | 66,314 | 331,916 | ||||||||
|
Decrease (increase) in investments
|
24,062 | 19,787 | (34,189 | ) | ||||||||
|
(Increase) in deferred sales commissions
|
(33,366 | ) | (31,568 | ) | (9,081 | ) | ||||||
|
Decrease (increase) in other assets
|
27,151 | (18,626 | ) | 6,223 | ||||||||
|
Increase (decrease) in payables
|
543,638 | (1,520,959 | ) | 4,658 | ||||||||
|
Increase (decrease) in accounts payable and accrued expenses
|
87,844 | (21,493 | ) | (50,740 | ) | |||||||
|
Increase (decrease) in accrued compensation and benefits
|
9,045 | (41,361 | ) | (110,346 | ) | |||||||
|
Net cash provided by operating activities
|
832,339 | 625,463 | 1,364,778 | |||||||||
|
Cash flows from investing activities:
|
||||||||||||
|
Purchases of investments
|
(73 | ) | (10,378 | ) | (22,221 | ) | ||||||
|
Proceeds from sales of investments
|
4,349 | 6,924 | 43,229 | |||||||||
|
Additions to furniture, equipment and leasehold improvements
|
(23,501 | ) | (53,763 | ) | (75,208 | ) | ||||||
|
Purchase of alternative investments group
|
(14,298 | ) | — | — | ||||||||
|
Net cash used in investing activities
|
(33,523 | ) | (57,217 | ) | (54,200 | ) | ||||||
|
Cash flows from financing activities:
|
||||||||||||
|
(Repayment) of commercial paper, net
|
(24,247 | ) | (36,751 | ) | (260,146 | ) | ||||||
|
Increase (decrease) in overdrafts payable
|
15,278 | (16,860 | ) | (11,524 | ) | |||||||
|
Distributions to General Partner and unitholders
|
(495,096 | ) | (464,733 | ) | (1,019,679 | ) | ||||||
|
Distributions to Joint Venture Partners
|
— | — | (10,387 | ) | ||||||||
|
(Distributions to) contributions from non-controlling interests in consolidated entities
|
(35,023 | ) | (24,188 | ) | 26,457 | |||||||
|
Capital contributions from General Partner
|
4,879 | 4,905 | 4,927 | |||||||||
|
Additional investment by Holding with proceeds from exercise of compensatory options to buy Holding Units
|
8,287 | — | 13,525 | |||||||||
|
Purchases of Holding Units to fund deferred compensation plans, net
|
(226,370 | ) | (6,981 | ) | (2,358 | ) | ||||||
|
Purchase of AllianceBernstein Units
|
(8,521 | ) | — | — | ||||||||
|
Debt issuance costs
|
(1,932 | ) | — | — | ||||||||
|
Other
|
(51 | ) | 132 | — | ||||||||
|
Net cash used in financing activities
|
(762,796 | ) | (544,476 | ) | (1,259,185 | ) | ||||||
|
Effect of exchange rate changes on cash and cash equivalents
|
(45 | ) | 37,869 | (75,232 | ) | |||||||
|
Net increase (decrease) in cash and cash equivalents
|
35,975 | 61,639 | (23,839 | ) | ||||||||
|
Cash and cash equivalents as of beginning of the period
|
614,216 | 552,577 | 576,416 | |||||||||
|
Cash and cash equivalents as of end of the period
|
$ | 650,191 | $ | 614,216 | $ | 552,577 | ||||||
|
Cash paid:
|
||||||||||||
|
Interest
|
$ | 3,721 | $ | 5,433 | $ | 47,933 | ||||||
|
Income taxes
|
43,072 | 64,085 | 132,491 | |||||||||
| Non-cash investing activities: | ||||||||||||
| Fair value of assets acquired | 49,041 | — | — | |||||||||
| Fair value of liabilities assumed | (34,743 | ) | — | — | ||||||||
See Accompanying Notes to Consolidated Financial Statements.
AllianceBernstein L.P. and Subsidiaries
Notes to Consolidated Financial Statements
The words
“we”
and
“our”
refer collectively to AllianceBernstein Holding L.P. (
“Holding”
) and AllianceBernstein L.P. and its subsidiaries (
“AllianceBernstein”
), or to their officers and employees. Similarly, the word
“company”
refers to both Holding and AllianceBernstein. Where the context requires distinguishing between Holding and AllianceBernstein, we identify which of them is being discussed. Cross-references are in italics.
1. Business Description and Organization
We provide research, diversified investment management and related services globally to a broad range of clients. Our principal services include:
|
|
•
|
Institutional Services—servicing our institutional clients, including unaffiliated corporate and public employee pension funds, endowment funds, domestic and foreign institutions and governments, and affiliates such as AXA and certain of its insurance company subsidiaries, by means of separately-managed accounts, sub-advisory relationships, structured products, collective investment trusts, mutual funds, hedge funds and other investment vehicles.
|
|
|
•
|
Retail Services—servicing our retail clients, primarily by means of retail mutual funds sponsored by AllianceBernstein or an affiliated company, sub-advisory relationships with mutual funds sponsored by third parties, separately-managed account programs sponsored by financial intermediaries worldwide and other investment vehicles.
|
|
|
•
|
Private Client Services—servicing our private clients, including high-net-worth individuals, trusts and estates, charitable foundations, partnerships, private and family corporations, and other entities, by means of separately-managed accounts, hedge funds, mutual funds and other investment vehicles.
|
|
|
•
|
Bernstein Research Services—servicing institutional investors seeking research, portfolio analysis and brokerage-related services, and issuers of publicly-traded securities seeking equity capital markets services.
|
We also provide distribution, shareholder servicing and administrative services to the mutual funds we sponsor.
Our in-depth research is the foundation of our business. Our research disciplines include fundamental research, quantitative research, economic research and currency forecasting. In addition, we have created several specialized research initiatives, including research examining global strategic changes that can affect multiple industries and geographies.
We provide a broad range of services with expertise in:
|
|
•
|
Value equities, generally targeting stocks that are out of favor and considered undervalued;
|
|
|
•
|
Growth equities, generally targeting stocks with under-appreciated growth potential;
|
|
|
•
|
Fixed income securities, including taxable and tax-exempt securities;
|
|
|
•
|
Blend strategies, combining style-pure investment components with systematic rebalancing;
|
|
|
•
|
Passive management, including index and enhanced index strategies;
|
|
|
•
|
Alternative investments, including hedge funds, currency management strategies and private capital (
e.g.
, direct real estate investing); and
|
|
|
•
|
Asset allocation services, by which we offer strategies specifically-tailored for its clients (
e.g
., customized target-date fund retirement services for defined contribution plan sponsors and our Dynamic Asset Allocation service, which is designed to mitigate the effects of extreme market volatility on a portfolio in order to deliver more consistent returns).
|
We manage these services using various investment disciplines, including market capitalization (
e.g
., large-, mid- and small-cap equities), term (
e.g
., long-, intermediate- and short-duration debt securities), and geographic location (
e.g
., U.S., international, global and emerging markets), as well as local and regional disciplines in major markets around the world.
We market and distribute alternative investment products globally to high-net-worth clients and institutional investors. In October 2010, we acquired SunAmerica’s alternative investments group, a team that manages a portfolio of hedge fund and private equity fund investments. Additionally, in October 2010, we launched a real estate fund focused on opportunistic real estate investments. These initiatives have helped us expand our alternative investment capabilities.
In 2008, we created an initiative called AllianceBernstein Defined Contribution Investments (
“ABDC”
) focused on expanding our capabilities in the defined contribution market. ABDC seeks to provide the most effective defined contribution investment solutions in the industry, as measured by product features, reliability, cost and flexibility, to meet specialized client needs by integrating research and investment design, product strategy, strategic partnerships (
e.g.
, record-keeper partnerships and operations collaboration), and client implementation and service. In November 2010, we introduced Secure Retirement Strategies (
"
SRS"
), a multi-manager target-date solution. SRS provides guaranteed lifetime retirement income backed by multiple insurers to participants of large defined contribution plans.
During 2009, we were selected by the U.S. Treasury Department as one of only three firms to manage its portfolio of assets issued by banks and other institutions taking part in the Capital Purchase Program of the Troubled Assets Relief Program. In addition, we were selected by the U.S. Treasury Department as one of nine pre-qualified fund managers under the Public-Private Investment Program and, during the fourth quarter of 2009, we were one of five firms that closed an initial Public-Private Investment Fund (
“PPIF”
) of at least $500 million. In April 2010, we closed our PPIF with over $1.1 billion raised.
As of December 31, 2010, AXA, a
société anonyme
organized under the laws of France and the holding company for an international group of insurance and related financial services companies, through certain of its subsidiaries (
“AXA and its subsidiaries”
) owned approximately 1.4% of the issued and outstanding units representing assignments of beneficial ownership of limited partnership interests in Holding (
“Holding Units”
).
As of December 31, 2010, the ownership structure of AllianceBernstein, expressed as a percentage of general and limited partnership interests, was as follows:
|
AXA and its subsidiaries
|
60.9 | % | ||
|
Holding
|
37.4 | |||
|
Unaffiliated holders
|
1.7 | |||
|
|
100.0 | % |
AllianceBernstein Corporation (an indirect wholly-owned subsidiary of AXA,
“General Partner”
) is the general partner of both Holding and AllianceBernstein. AllianceBernstein Corporation owns 100,000 general partnership units in Holding and a 1% general partnership interest in AllianceBernstein. Including both the general partnership and limited partnership interests in Holding and AllianceBernstein, AXA and its subsidiaries had an approximate 61.4% economic interest in AllianceBernstein as of December 31, 2010.
2. Summary of Significant Accounting Policies
Basis of Presentation
The consolidated financial statements have been prepared in accordance with accounting principles generally accepted in the United States of America. The preparation of the consolidated financial statements requires management to make certain estimates and assumptions that affect the reported amounts of assets and liabilities and disclosure of contingent assets and liabilities at the dates of the consolidated financial statements and the reported amounts of revenues and expenses during the reporting periods. Actual results could differ from those estimates.
Principles of Consolidation
The consolidated financial statements include AllianceBernstein and its majority-owned and/or controlled subsidiaries. All significant inter-company transactions and balances among the consolidated entities have been eliminated.
Reclassifications
Certain prior period amounts have been reclassified to conform to the current year’s presentation. These include: (i) Holding Units owned by AllianceBernstein not yet awarded under deferred compensation plans, previously included in limited partners’ capital in the consolidated statement of financial position, have been reclassified to Holding Units held for deferred compensation plans, (ii) Bernstein Research Services transaction costs, previously included in general and administrative expenses in the consolidated statements of income, have been reclassified to other promotion and servicing expenses, (iii) certain distribution services expenses, previously included in other promotion and servicing expenses in the consolidated statements of income, have been reclassified to distribution-related payments, (iv) unrealized losses (gains) on consolidated venture capital fund, previously included in other adjustments to reconcile net income to net cash provided by operating activities in the consolidated statement of cash flows, is currently shown separately, and (v) real estate asset write-off charges, previously included in other adjustments to reconcile net income to net cash provided by operating activities, is currently shown separately.
Variable Interest Entities
In June 2009, the Financial Accounting Standards Board (
“FASB”
) issued Accounting Standards Update (
“ASU”
) 2009-17,
Consolidations (Topic 810) – Improvements to Financial Reporting by Enterprises Involved with Variable Interest Entities
, effective January 1, 2010. This standard changed how a company determines when an entity that is insufficiently capitalized or is not controlled through voting should be consolidated. The determination of whether a company is required to consolidate an entity is based on, among other things, an entity’s purpose and design, a company’s ability to direct the activities of the entity that most significantly impact the entity’s economic performance, and whether a company is obligated to absorb losses or receive benefits that could potentially be significant to the entity. The standard also requires ongoing assessments of whether a company is the primary beneficiary of a variable interest entity (
“VIE”
). The provisions of this standard were effective January 1, 2010. In January 2010, the FASB deferred portions of ASU 2009-17 that relate to asset managers. We determined that all entities for which we are a sponsor and/or investment manager, other than collateralized debt obligations and collateralized loan obligations (collectively
“CDOs”
), qualify for the scope deferral and will continue to be assessed for consolidation under prior accounting guidance for consolidation of variable interest entities.
As of December 31, 2010, we are the investment manager for seven CDOs that meet the definition of a VIE due primarily to the lack of unilateral decision-making authority of the equity holders. The CDOs are alternative investment vehicles created for the sole purpose of issuing collateralized debt instruments that offer investors the opportunity for returns that vary with the risk level of their investment. Our management fee structure for these CDOs will typically include a senior management fee, and may also include subordinated and incentive management fees. We hold no equity interest in any of these CDOs. For each of the CDOs, we evaluated the management fee structure, the current and expected economic performance of the entities and other provisions included in the governing documents of the CDOs that might restrict or guarantee an expected loss or residual return. In accordance with ASC 810, we concluded that our investment management contract does not represent a variable interest in five of the seven CDOs. As such, we are not required to consolidate these entities.
For the two remaining CDOs, we concluded our collateral management agreement represented a variable interest primarily due to the level of subordinated fees. We evaluated whether we possessed both of the following characteristics of a controlling financial interest: (1) the power to direct the activities of the VIE that most significantly impacts the entity’s economic performance, and (2) the obligation to absorb losses of the entity or the right to receive benefits from the entity that could potentially be significant to the VIE. In both instances, we determined that we possessed the decision-making power noted in criteria (1) above.
In evaluating criteria (2) above, we considered all facts regarding the design, terms and characteristics of the CDOs and concluded that we do not meet the criteria. Our conclusion was based on the following quantitative and qualitative factors: (a) we have no involvement with the CDOs beyond providing investment management services, (b) we hold no equity or debt interests in the CDOs, (c) we are not a transferor of any of the assets of the CDOs, (d) our expected aggregate fees in future periods are insignificant relative to the expected cash flows of the CDOs, (e) the variability of our expected fees in relation to the expected cash flows of the CDOs is insignificant, (f) our maximum exposure to loss for these CDOs is our investment management fee, which is based upon the fair value of the CDOs’ assets, (g) the CDOs have no recourse against us for any losses sustained in the CDO structure, (h) we have not provided, nor expect to provide, any financial or other support to the CDO, and (i) there are no liquidity arrangements, guarantees and/or other commitments by third parties that would impact our variable interest in the CDOs. As such, we do not have a controlling financial interest in either of the two CDOs and we should not consolidate the CDOs into our consolidated financial statements.
The cash, collateral investments (at fair value) and notes payable (at amortized cost) as of December 31, 2010 of these two unconsolidated CDOs are $32.4 million, $357.3 million and $363.6 million, respectively.
For the entities that meet the scope deferral, management reviews its agreements quarterly and its investments in, and other financial arrangements with, certain entities that hold client assets under management (
“AUM”
) to determine the variable interest entities that the company is required to consolidate. These entities include certain mutual fund products, hedge funds, structured products, group trusts, collective investment trusts and limited partnerships. We earn investment management fees on client assets under management of these entities, but we derive no other benefit from these assets and cannot use them in our operations.
As of December 31, 2010, we have significant variable interests in certain structured products and hedge funds with approximately $25.2 million in AUM. However, these variable interest entities do not require consolidation because management has determined that we are not the primary beneficiary of the expected losses or expected residual returns of these entities. Our maximum exposure to loss is limited to our investment of $0.1 million in these entities.
Cash and Cash Equivalents
Cash and cash equivalents include cash on hand, demand deposits, money market accounts, overnight commercial paper and highly liquid investments with original maturities of three months or less. Due to the short-term nature of these instruments, the recorded value has been determined to approximate fair value.
Fees Receivable, Net
Fees receivable are shown net of allowances. An allowance for doubtful accounts related to investment advisory and services fees is determined through an analysis of the aging of receivables, assessments of collectibility based on historical trends and other qualitative and quantitative factors, including the following: our relationship with the client, the financial health (or ability to pay) of the client, current economic conditions and whether the account is closed or active.
Collateralized Securities Transactions
Customers’ securities transactions are recorded on a settlement date basis, with related commission income and expenses reported on a trade date basis. Receivables from and payables to customers include amounts due on cash and margin transactions. Securities owned by customers are held as collateral for receivables; such collateral is not reflected in the consolidated financial statements. Principal securities transactions and related expenses are recorded on a trade date basis.
Securities borrowed and securities loaned by Sanford C. Bernstein & Co., LLC (
“SCB LLC”
) and Sanford C. Bernstein Limited (
“SCBL”
), both wholly-owned subsidiaries, are recorded at the amount of cash collateral advanced or received in connection with the transaction and are included in receivables from and payables to brokers and dealers in the consolidated statements of financial condition. Securities borrowed transactions require SCB LLC and SCBL to deposit cash collateral with the lender. As of December 31, 2010, cash collateral on deposit with lenders was $72.5 million. With respect to securities loaned, SCB LLC and SCBL receive cash collateral from the borrower. As of December 31, 2010, cash collateral received from borrowers was $42.2 million. The initial collateral advanced or received approximates or is greater than the fair value of securities borrowed or loaned. SCB LLC and SCBL monitor the fair value of the securities borrowed and loaned on a daily basis and request additional collateral or return excess collateral, as appropriate. As of December 31, 2010, there is no allowance provision required for the collateral advanced. Income or expense is recognized over the life of the transactions.
As of December 31, 2010, we have $16.5 million of cash on deposit with clearing organizations for trade facilitation purposes.
Investments
Investments include United States Treasury Bills, unconsolidated mutual funds and limited partnership hedge funds we sponsor and manage, various separately-managed portfolios comprised of equity and fixed income securities, exchange-traded options and investments owned by a consolidated venture capital fund in which we own a controlling interest as the general partner and in which we hold a 10% limited partnership interest. Investments also include derivative instruments such as futures, forwards, interest rate swaps, credit default swaps and total return swaps.
Investments in United States Treasury Bills, mutual funds, and equity and fixed income securities are classified as either trading or available-for-sale securities. Trading investments are stated at fair value with unrealized gains and losses reported in net income. Available-for-sale investments are stated at fair value with unrealized gains and losses reported as a separate component of accumulated other comprehensive income in partners’ capital. Realized gains and losses on the sale of investments are included in income in the current period. Average cost is used to determine realized gain or loss on investments sold.
We use the equity method of accounting for investments in limited partnership hedge funds. The equity in earnings of our limited partnership hedge fund investments is included in investment gains and losses on the consolidated statements of income.
The investments owned by our consolidated venture capital fund are generally illiquid and are initially valued at cost. These investments are adjusted to fair value to reflect the occurrence of “significant developments” (
i.e.
, capital transactions or business, economic or market events). Adjustments to fair value are included in investment gains and losses on the consolidated statements of income. There are three private equity investments that we own directly outside of our consolidated venture capital fund. Two of the investments are accounted for using the cost method.
See Note 8
for a description of how we measure the fair value of our investments.
Furniture, Equipment and Leasehold Improvements, Net
Furniture, equipment and leasehold improvements are stated at cost, less accumulated depreciation and amortization. Depreciation is recognized on a straight-line basis over the estimated useful lives of eight years for furniture and three to six years for equipment and software. Leasehold improvements are amortized on a straight-line basis over the lesser of their estimated useful lives or the terms of the related leases.
Goodwill
In 2000, AllianceBernstein acquired the business and assets of SCB Inc., an investment research and management company formerly known as Sanford C. Bernstein Inc. (
“Bernstein”
), and assumed the liabilities of Bernstein (
“Bernstein Transaction”
). The purchase price consisted of a cash payment of approximately $1.5 billion and 40.8 million newly-issued AllianceBernstein Units. The Bernstein Transaction was accounted for under the purchase method and the cost of the acquisition was allocated on the basis of the estimated fair value of the assets acquired and the liabilities assumed. The excess of the purchase price over the fair value of identifiable assets acquired, net of liabilities assumed, resulted in the recognition of goodwill of approximately $3.0 billion.
On October 1, 2010, we acquired SunAmerica’s alternative investment group, an experienced team that manages a portfolio of hedge fund and private equity fund investments. The purchase price of this acquisition, accounted for under ASC 805,
Business Combinations
, was $49.0 million, consisting of $14.3 million of cash payments, $2.5 million of assumed deferred compensation liabilities and $32.2 million of net contingent consideration payable. The net contingent consideration payable consists of the net present value of three annual payments of $1.5 million to SunAmerica based on its assets under management transferred to us in the acquisition and the net present value of projected revenue sharing payments of $35.5 million based on newly-raised assets under management by the acquired group. This contingent consideration payable was offset by $4.1 million of performance-based fees earned in 2010 determined to be pre-acquisition consideration. The excess of the purchase price over the fair value of identifiable assets acquired resulted in the recognition of $46.1 million of goodwill.
We test our goodwill annually, as of September 30, for impairment. The carrying value of goodwill is also reviewed if facts and circumstances, such as significant declines in assets under management, revenues, earnings or the Holding Unit price, occur, suggesting possible impairment. As of September 30, 2010, the impairment test indicated that goodwill was not impaired.
To the extent that securities valuations are depressed for prolonged periods of time, our assets under management, revenues, profitability and unit price may be adversely affected. As a result, subsequent impairment tests may be based upon different assumptions and future cash flow projections, which may result in an impairment of this asset. Any impairment could reduce materially the recorded amount of goodwill with a corresponding charge to our earnings.
Intangible Assets, Net
Intangible assets consist primarily of costs assigned to acquired investment management contracts of SCB Inc. based on their estimated fair value at the time of acquisition, less accumulated amortization. Intangible assets are recognized at fair value and are amortized on a straight-line basis over their estimated useful life of approximately 20 years. The gross carrying amount of intangible assets totaled $419.2 million as of December 31, 2010 and $415.9 million as of December 31, 2009, and accumulated amortization was $213.3 million as of December 31, 2010 and $191.9 million as of December 31, 2009, resulting in the net carrying amount of intangible assets subject to amortization of $205.9 million as of December 31, 2010 and $224.0 million as of December 31, 2009. Amortization expense was $21.3 million for 2010, $21.1 million for 2009 and $20.7 million for 2008, and estimated annual amortization expense for each of the next five years is approximately $22 million.
We periodically review intangible assets for impairment as events or changes in circumstances indicate that the carrying value may not be recoverable. If the carrying value exceeds fair value, additional impairment tests are performed to measure the amount of the impairment loss, if any.
Deferred Sales Commissions, Net
We pay commissions to financial intermediaries in connection with the sale of shares of open-end company-sponsored mutual funds sold without a front-end sales charge (
“back-end load shares”
). These commissions are capitalized as deferred sales commissions and amortized over periods not exceeding five and one-half years for U.S. fund shares and four years for non-U.S. fund shares, the periods of time during which deferred sales commissions are generally recovered. We recover these commissions from distribution services fees received from those funds and from contingent deferred sales commissions (
“CDSC”
) received from shareholders of those funds upon the redemption of their shares. CDSC cash recoveries are recorded as reductions of unamortized deferred sales commissions when received. Since January 31, 2009, our U.S. mutual funds have not offered back-end load shares to new investors.
We periodically review the deferred sales commission asset for impairment as events or changes in circumstances indicate that the carrying value may not be recoverable. If the carrying value exceeds fair value, additional impairment tests are performed to measure the amount of the impairment loss, if any.
Loss Contingencies
With respect to all significant litigation matters, we consider the likelihood of a negative outcome. If we determine the likelihood of a negative outcome is probable, and the amount of the loss can be reasonably estimated, we record an estimated loss for the expected outcome of the litigation. If the likelihood of a negative outcome is reasonably possible and we are able to determine an estimate of the possible loss or range of loss, we disclose that fact together with the estimate of the possible loss or range of loss. However, it is difficult to predict the outcome or estimate a possible loss or range of loss because litigation is subject to inherent uncertainties, particularly when plaintiffs allege substantial or indeterminate damages, or when the litigation is highly complex or broad in scope. In such cases, we disclose that we are unable to predict the outcome or estimate a possible loss or range of loss.
Revenue Recognition
Investment advisory and services fees, generally calculated as a percentage of AUM, are recorded as revenue as the related services are performed. Certain investment advisory contracts, including those associated with hedge funds, provide for a performance-based fee, in addition to or in lieu of a base fee, which is calculated as either a percentage of absolute investment results or a percentage of investment results in excess of a stated benchmark over a specified period of time. Performance-based fees are recorded as a component of revenue at the end of each contract’s measurement period.
We calculate AUM using established fair valuation methodologies, including market-based valuation methods and fair valuation methods. Market-based valuation methods include: last sale/settle prices from an exchange for actively-traded listed equities, options and futures; evaluated bid prices from recognized pricing vendors for fixed income, asset-backed or mortgage-backed issues; mid prices from recognized pricing vendors and brokers for credit default swaps; and quoted bids or spreads from pricing vendors and brokers for other derivative products. Fair valuation methods include discounted cash flow models, evaluation of assets versus liabilities or any other methodology that is validated and approved by our Valuation Committee. Fair valuation methods are used only where AUM cannot be valued using market-based valuation methods, such as in the case of private equity or illiquid securities. Investments utilizing fair valuation methods typically make up less than 1% of our total AUM. Recent market volatility has not had a significant effect on our ability to acquire market data and, accordingly, our ability to use market-based valuation methods.
The Valuation Committee, which is composed of senior officers and employees, is responsible for overseeing the pricing and valuation of all investments held in client and AllianceBernstein portfolios. The Valuation Committee has adopted a Statement of Pricing Policies describing principles and policies that apply to pricing and valuing investments held in client and AllianceBernstein portfolios. We have also established a Pricing Group, which reports to the Valuation Committee. The Valuation Committee has delegated to the Pricing Group responsibility for overseeing the pricing process for all investments.
Bernstein Research Services revenue consists primarily of brokerage transaction charges for research and brokerage-related services provided to institutional investors. Brokerage transaction charges earned and related expenses are recorded on a trade-date basis. Bernstein Research Services also consists of underwriting fees, management fees, payments for research services and/or selling concessions from equity capital markets activities, which are recognized as the related services are performed.
Distribution revenues, shareholder servicing fees, and dividend and interest income are accrued as earned.
Mutual Fund Underwriting Activities
Purchases and sales of shares of company-sponsored mutual funds in connection with the underwriting activities of our subsidiaries, including related commission income, are recorded on trade date. Receivables from brokers and dealers for sale of shares of company-sponsored mutual funds are generally realized within three business days from trade date, in conjunction with the settlement of the related payables to company-sponsored mutual funds for share purchases. Distribution plan and other promotion and servicing payments are recognized as expense when incurred.
Deferred Compensation Plans
We maintain several unfunded, non-qualified deferred compensation plans under which annual awards to employees are generally made in the fourth quarter. For awards made before 2009, participants were permitted to allocate their awards: (i) among notional investments in Holding Units, certain of the investment services we provide to our clients, and a money market fund, (ii) restricted Holding Units or (iii) under certain circumstance, in options to buy Holding Units. Awards in 2010 and 2009 consisted solely of restricted Holding Units. We typically make investments in our services that were notionally elected by the participants and maintain them in a consolidated rabbi trust or separate custodial account. Awards generally vest over four years but can vest more quickly depending on the terms of the individual award, the age of the participant, or the terms of participant’s employment, separation or retirement agreement. Upon vesting, awards are distributed to participants unless they have made a voluntary long-term election to defer receipt. Quarterly cash distributions on unvested Holding Units or restricted Holding Units for which a long-term deferral election has not been made are paid currently to participants. For awards made prior to December 2009, quarterly cash distributions on notional investments in Holding Units and income credited on notional investments in our investment services or the money market fund for which a long-term deferral election has been made are reinvested and distributed as elected by participants. For awards made in December 2010 and 2009, quarterly cash distributions on vested and unvested restricted Holding Units for which a long-term deferral election has been made are paid currently to participants.
Compensation expense for awards under the plans, including changes in participant account balances resulting from gains and losses on related investments (other than in Holding Units and options to buy Holding Units), is recognized on a straight-line basis over the applicable vesting periods. Mark-to-market gains or losses on investments made to fund deferred compensation obligations (other than in Holding Units and options to buy Holding Units) are recognized currently as investment gains (losses) in the consolidated statements of income. In addition, our equity in the earnings of investments in limited partnership hedge funds made to fund deferred compensation obligations is recognized currently as investment gains (losses) in the consolidated statements of income.
Compensatory Unit Awards and Option Plans
We recognize compensation expense related to grants of restricted Holding Units and options to buy Holding Units in the financial statements using the fair value method. Under the fair value method, compensatory expense is measured at the grant date based on the estimated fair value of the award and is recognized over the vesting period. Fair value of restricted Holding Unit awards is the closing price of a Holding Unit on the grant date; fair value of options is determined using the Black-Scholes option valuation model.
We fund our restricted Holding Unit awards to employees either by purchasing newly-issued Holding Units from Holding or purchasing Holding Units on the open market, all of which are held in a consolidated rabbi trust until they are distributed to employees upon vesting. In accordance with the AllianceBernstein Partnership Agreement, when Holding issues Holding Units to AllianceBernstein, Holding is required to use the proceeds it receives from AllianceBernstein to purchase the equivalent number of newly-issued AllianceBernstein Units, thus increasing its percentage ownership interest in AllianceBernstein. Holding Units held in the consolidated rabbi trust are corporate assets in the name of the trust and are available to the general creditors of AllianceBernstein.
We engage in open-market purchases of Holding Units to help fund anticipated obligations under our incentive compensation award program and purchase Holding Units from employees to allow them to fulfill statutory tax requirements at the time of distribution of long-term incentive compensation awards. During 2010, we purchased 8.8 million Holding Units for $226.4 million, reflecting open-market purchases of 7.4 million Holding Units for $195.3 million and the remainder primarily relating to employee tax withholding purchases. We intend to continue to engage in open-market purchases of Holding Units, from time to time, to help fund anticipated obligations under our incentive compensation award program.
We granted 13.1 million restricted Holding Unit awards to employees during 2010. To fund these awards, Holding issued 3.2 million Holding Units and we used 9.9 million Holding Units held in the consolidated rabbi trust. There were approximately 30,000 unallocated Holding Units remaining in the consolidated rabbi trust as of December 31, 2010.
New Holding Units are also issued by Holding upon exercise of options. Proceeds received by Holding upon exercise of options are used to acquire newly-issued AllianceBernstein Units, increasing Holding’s percentage ownership interest in AllianceBernstein.
On July 26, 2010, the Amended and Restated 1997 Long Term Incentive Plan expired. Effective as of July 1, 2010, we established the 2010 Long Term Incentive Plan (
“2010 Plan”
), which was adopted by Holding Unitholders at a special meeting of Holding Unitholders held on June 30, 2010. The following forms of awards may be granted to employees and independent directors of the General Partner under the 2010 Plan: (i) restricted Holding Units or phantom restricted Holding Units (a “phantom” award is a contractual right to receive Holding Units at a later date or upon a specified event); (ii) options to buy Holding Units; and (iii) other Holding Unit-based awards (including, without limitation, Holding Unit appreciation rights and performance awards). The 2010 Plan will expire on June 30, 2020, and no awards under the 2010 Plan will be made after that date. Under the 2010 Plan, the number of newly-issued Holding Units with respect to which awards may be granted is 30 million. The 2010 Plan also permits us to award an additional 30 million Holding Units if we acquire the Holding Units on the open market or through private purchases. During 2010, we granted 12.5 million Holding Unit awards under the 2010 Plan. As of December 31, 2010, 27.1 million newly-issued Holding Units and 20.4 million repurchased Holding Units are available for grant.
Foreign Currency Translation
Assets and liabilities of foreign subsidiaries are translated into United States dollars (
“US$”
) at exchange rates in effect at the balance sheet dates, and related revenues and expenses are translated into US$ at average exchange rates in effect during each period. Net foreign currency gains and losses resulting from the translation of assets and liabilities of foreign operations into US$ are reported as a separate component of accumulated other comprehensive income in the consolidated statements of changes in partners’ capital and comprehensive income. Net foreign currency transaction gains (losses) were $1.3 million, $(0.4) million and $20.1 million for 2010, 2009 and 2008, respectively.
Cash Distributions
AllianceBernstein is required to distribute all of its Available Cash Flow, as defined in the Amended and Restated Agreement of Limited Partnership of AllianceBernstein (
“AllianceBernstein Partnership Agreement”
), to its unitholders and to the General Partner. Available Cash Flow can be summarized as the cash flow received by AllianceBernstein from operations minus such amounts as the General Partner determines, in its sole discretion, should be retained by AllianceBernstein for use in its business.
The General Partner computes cash flow received from operations by determining the sum of:
|
|
•
|
net cash provided by operating activities of AllianceBernstein,
|
|
|
•
|
proceeds from borrowings and from sales or other dispositions of assets in the ordinary course of business, and
|
|
|
•
|
income from investments in marketable securities, liquid investments and other financial instruments that are acquired for investment purposes and that have a value that may be readily established,
|
and then subtracting from this amount the sum of:
|
|
•
|
payments in respect of the principal of borrowings, and
|
|
|
•
|
amounts expended for the purchase of assets in the ordinary course of business.
|
On February 10, 2011, the General Partner declared a distribution of $137.7 million, or $0.49 per AllianceBernstein Unit, representing a distribution of Available Cash Flow for the three months ended December 31, 2010. The General Partner, as a result of its 1% general partnership interest, is entitled to receive 1% of each distribution. The distribution is payable on March 3, 2011 to holders of record on February 22, 2011.
Total cash distributions per Unit paid to the General Partner and unitholders during 2010, 2009 and 2008 were $1.79, $1.73 and $3.87, respectively.
Real Estate Charges
During 2010, we performed a comprehensive review of our real estate requirements in New York in connection with our workforce reductions since 2008. As a result, during 2010 we decided to sub-lease over 380,000 square feet in New York (approximately half of which has occurred) and largely consolidate our New York-based employees into two office locations from three. We recorded pre-tax real estate charges of $101.7 million in 2010 that reflected the net present value of the difference between the amount of our on-going contractual operating lease obligations for this space and our estimate of current market rental rates ($76.2 million), as well as the write-off of leasehold improvements, furniture and equipment related to this space ($25.5 million). The following table summarizes the activity in the liability account relating to this charge for the year ended December 31, 2010 (in thousands):
|
Balance as of December 31, 2009
|
$ | — | ||
|
Expense incurred
|
76,177 | |||
|
Deferred rent reclassification
|
22,954 | |||
|
Payments made
|
(9,814 | ) | ||
|
Interest accretion
|
476 | |||
|
Balance as December 31, 2010
|
$ | 89,793 |
Comprehensive Income
We report all changes in comprehensive income in the consolidated statements of changes in partners’ capital and comprehensive income. Comprehensive income includes net income, as well as unrealized gains and losses on investments classified as available-for-sale, foreign currency translation adjustments, and unrecognized actuarial net losses and transition assets, all net of tax.
3. Cash and Securities Segregated Under Federal Regulations and Other Requirements
As of December 31, 2010 and 2009, $1.1 billion and $0.9 billion, respectively, of United States Treasury Bills were segregated in a special reserve bank custody account for the exclusive benefit of brokerage customers of SCB LLC under Rule 15c3-3 of the Securities Exchange Act of 1934, as amended (
“Exchange Act”
).
AllianceBernstein Investments, Inc. (
“AllianceBernstein Investments”
), a wholly-owned subsidiary of AllianceBernstein and the distributor of company-sponsored mutual funds, maintains several special bank accounts for the exclusive benefit of customers. As of December 31, 2010 and 2009, $25.3 million and $37.4 million, respectively, of cash were segregated in these bank accounts.
4. Net Income Per Unit
Basic net income per unit is derived by reducing net income for the 1% general partnership interest and dividing the remaining 99% by the basic weighted average number of units outstanding for each year. Diluted net income per unit is derived by reducing net income for the 1% general partnership interest and dividing the remaining 99% by the total of the basic weighted average number of units outstanding and the dilutive unit equivalents resulting from outstanding compensatory options to buy Holding Units as follows:
|
Years Ended December 31,
|
||||||||||||
|
2010
|
2009
|
2008
|
||||||||||
|
(in thousands, except per unit amounts)
|
||||||||||||
|
Net income attributable to AllianceBernstein Unitholders
|
$ | 442,419 | $ | 556,127 | $ | 839,240 | ||||||
|
Weighted average units outstanding—basic
|
275,415 | 266,300 | 260,965 | |||||||||
|
Dilutive effect of compensatory options to buy Holding Units
|
1,639 | 244 | 531 | |||||||||
|
Weighted average units outstanding—diluted
|
277,054 | 266,544 | 261,496 | |||||||||
|
Basic net income per AllianceBernstein Unit
|
$ | 1.59 | $ | 2.07 | $ | 3.18 | ||||||
|
Diluted net income per AllianceBernstein Unit
|
$ | 1.58 | $ | 2.07 | $ | 3.18 | ||||||
For the years ended December 31, 2010, 2009 and 2008, we excluded 4,783,472, 5,752,877 and 5,050,605, respectively, out-of-the-money options (
i.e.
, options with an exercise price greater than the weighted average closing price of a unit for the relevant period) from the diluted net income per unit computation due to their anti-dilutive effect.
5. Fees Receivables, Net
Fees receivable, net consists of:
|
December 31,
|
||||||||
|
2010
|
2009
|
|||||||
|
(in thousands)
|
||||||||
|
|
|
|||||||
|
AllianceBernstein mutual funds
|
$ | 128,480 | $ | 112,535 | ||||
|
Unaffiliated clients (net of allowance of $876 in 2010 and $1,393 in 2009)
|
196,339 | 222,660 | ||||||
|
Affiliated clients
|
18,654 | 11,287 | ||||||
|
Total fees receivables, net
|
$ | 343,473 | $ | 346,482 | ||||
6. Investments
Investments consist of:
|
December 31,
|
||||||||
|
2010
|
2009
|
|||||||
|
(in thousands)
|
||||||||
|
|
|
|||||||
|
Available-for-sale
|
$ | 16,588 | $ | 18,246 | ||||
|
Trading:
|
||||||||
|
Deferred compensation-related
|
239,787 | 326,364 | ||||||
|
United States Treasury Bills
|
52,975 | 28,000 | ||||||
|
Seed money
|
177,589 | 107,136 | ||||||
|
Other
|
35,259 | 23,082 | ||||||
|
Investments in limited partnership hedge funds:
|
||||||||
|
Deferred compensation-related
|
58,918 | 74,595 | ||||||
|
Other
|
47,735 | 16,579 | ||||||
|
Consolidated private equity fund
|
101,360 | 162,747 | ||||||
|
Private equity
|
17,803 | 10,000 | ||||||
|
Other
|
8,541 | 8,080 | ||||||
|
Total investments
|
$ | 756,555 | $ | 774,829 | ||||
Total investments related to deferred compensation obligations of $298.7 million and $401.0 million as of December 31, 2010 and 2009, respectively, consist of company-sponsored mutual funds and limited partnership hedge funds. We typically make investments in our services that are notionally elected by deferred compensation plan participants and maintain them in a consolidated rabbi trust or separate custodial account. The rabbi trust and custodial account enable us to hold such investments separate from our other assets for the purpose of settling our obligations to participants. The investments held in the rabbi trust and custodial account remain available to the general creditors of AllianceBernstein.
The underlying investments of the limited partnership hedge funds in which we invest include long and short positions in equity securities, fixed income securities (including various agency and non-agency asset-based securities), currencies, commodities and derivatives (including various swaps and forward contracts). These investments are valued at quoted market prices or, where quoted market prices are not available, are fair valued based on the pricing policies and procedures of the underlying funds.
United States Treasury Bills are held by SCB LLC in their investment account, the majority of which are pledged as collateral with clearing organizations.
We provide seed money to our investment teams to develop new products and services for our clients.
The following is a summary of the cost and fair value of available-for-sale and trading investments held as of December 31, 2010 and 2009:
|
Amortized
Cost
|
Gross
Unrealized
Gains
|
Gross
Unrealized
Losses
|
Fair
Value
|
|||||||||||||
|
(in thousands)
|
||||||||||||||||
|
December 31, 2010:
|
|
|
|
|
||||||||||||
|
Available-for-sale:
|
|
|
|
|
||||||||||||
|
Equity investments
|
$ | 9,695 | $ | 1,380 | $ | (1,023 | ) | $ | 10,052 | |||||||
|
Fixed income investments
|
6,267 | 282 | (13 | ) | 6,536 | |||||||||||
| $ | 15,962 | $ | 1,662 | $ | (1,036 | ) | $ | 16,588 | ||||||||
|
Trading:
|
||||||||||||||||
|
Equity investments
|
$ | 269,529 | $ | 34,211 | $ | (6,259 | ) | $ | 297,481 | |||||||
|
Fixed income investments
|
207,436 | 2,894 | (2,201 | ) | 208,129 | |||||||||||
| $ | 476,965 | $ | 37,105 | $ | (8,460 | ) | $ | 505,610 | ||||||||
|
December 31, 2009:
|
||||||||||||||||
|
Available-for-sale:
|
||||||||||||||||
|
Equity investments
|
$ | 12,827 | $ | 5,241 | $ | — | $ | 18,068 | ||||||||
|
Fixed income investments
|
153 | 27 | (2 | ) | 178 | |||||||||||
| $ | 12,980 | $ | 5,268 | $ | (2 | ) | $ | 18,246 | ||||||||
|
Trading:
|
||||||||||||||||
|
Equity investments
|
$ | 217,076 | $ | 141,950 | $ | (350 | ) | $ | 358,676 | |||||||
|
Fixed income investments
|
114,606 | 12,278 | (978 | ) | 125,906 | |||||||||||
| $ | 331,682 | $ | 154,228 | $ | (1,328 | ) | $ | 484,582 | ||||||||
Proceeds from sales of available-for-sale investments were approximately $4.3 million, $6.9 million and $42.0 million in 2010, 2009 and 2008, respectively. Realized gains from our sales of available-for-sale investments were $0.5 million in 2010 and zero in both 2009 and 2008. Realized losses from our sales of available-for-sale investments were $0.4 million in 2010, $2.5 million in 2009 and $6.4 million in 2008. We assess valuation declines to determine the extent to which such declines are fundamental to the underlying investment or attributable to temporary market-related factors. Based on our assessment, we do not believe the declines are other than temporary as of December 31, 2010.
7. Derivative Instruments
We enter into various futures, forwards and swaps to economically hedge our seed money investments. In addition, we have currency forwards that (i) represent seed money that our investment teams are using to develop new products and services for our clients, (ii) economically hedge certain cash accounts, and (iii) economically hedge certain foreign investment advisory fees. We do not hold any derivatives designated in a formal hedge relationship under ASC 815-10,
Derivatives and Hedging
.
The following table presents the notional value, fair value and gains and losses recognized in investment gains (losses) in the consolidated statement of income as of December 31, 2010 for derivative instruments not designated as hedging instruments:
|
Notional Value
|
Derivative
Assets
|
Derivative
Liabilities
|
Gains (Losses)
|
|||||||||||||
|
(in thousands)
|
||||||||||||||||
|
December 31, 2010:
|
||||||||||||||||
|
Exchange-traded futures
|
$ | 16,973 | $ | 16 | $ | 318 | $ | (5,532 | ) | |||||||
|
Currency forwards
|
133,471 | 249 | 1,000 | 929 | ||||||||||||
|
Interest rate swaps
|
43,210 | 1,197 | 239 | (1,601 | ) | |||||||||||
|
Credit default swaps
|
74,915 | 182 | 1,036 | (1,155 | ) | |||||||||||
|
Total return swaps
|
28,975 | — | 960 | (8,264 | ) | |||||||||||
|
Total derivatives
|
$ | 297,544 | $ | 1,644 | $ | 3,553 | $ | (15,623 | ) | |||||||
The following table presents the notional value, fair value and gains and losses recognized in investment gains (losses) in the consolidated statement of income as of December 31, 2009 for derivative instruments not designated as hedging instruments:
|
Notional Value
|
Derivative
Assets
|
Derivative
Liabilities
|
Gains (Losses)
|
|||||||||||||
|
(in thousands)
|
||||||||||||||||
|
December 31, 2009:
|
||||||||||||||||
|
Exchange-traded futures
|
$ | 21,309 | $ | (15 | ) | $ | — | $ | 1,121 | |||||||
|
Currency forwards
|
60,621 | 612 | — | 1,392 | ||||||||||||
|
Interest rate swaps
|
16,995 | 955 | — | 879 | ||||||||||||
|
Credit default swaps
|
22,475 | 175 | — | (508 | ) | |||||||||||
|
Total derivatives
|
$ | 121,400 | $ | 1,727 | $ | — | $ | 2,884 | ||||||||
As of December 31, 2010, the derivative assets and liabilities are included in both receivables and payables to brokers and dealers on our consolidated statement of financial condition. As of December 31, 2009, the futures and forwards contracts were included in receivables to brokers and dealers and the swaps were included in investments on our consolidated statement of financial condition.
We may be exposed to credit-related losses in the event of nonperformance by counterparties to derivative financial instruments. We control and minimize our counterparty exposure through a credit review and approval process. In addition, we executed various collateral arrangements with counterparties to the over-the-counter derivative transactions that require both pledging and accepting collateral in the form of cash. As of December 31, 2010, we held $6.9 million of cash collateral delivered by trade counterparties. This cash collateral is reported in cash and cash equivalents, and the obligation to return it is reported in payables to brokers and dealers in our consolidated statement of financial condition.
Although notional amount is the most commonly used measure of volume in the derivative market, it is not used as a measure of credit risk. Generally, the current credit exposure of our derivative contracts is limited to the net positive estimated fair value of derivative contracts at the reporting date after taking into consideration the existence of netting agreements and any collateral received. A derivative with positive value (a derivative asset) indicates existence of credit risk because the counterparty would owe us if the contract were closed. Alternatively, a derivative contract with negative value (a derivative liability) indicates we would owe money to the counterparty if the contract were closed. Generally if there is more than one derivative transaction with a single counterparty, a master netting arrangement exists with respect to derivative transactions with that counterparty to provide for net settlement.
Certain of our standardized contracts for over-the-counter derivative transactions (
“ISDA Master Agreements”
) contain credit risk related contingent provisions related to the counterparties’ credit rating. In some ISDA Master Agreements, if the counterparties’ credit rating (or in some agreements, our assets under management) falls below a specified threshold, either a default or a termination event permitting the counterparty to terminate the ISDA Master Agreement would be triggered. In all agreements that provide for collateralization, various levels of collateralization of net liability positions are applicable, depending upon the credit rating of the counterparty. As of December 31, 2010, we delivered $9.3 million of cash collateral into brokerage accounts, which is reported in cash and cash equivalents in our consolidated statement of financial condition.
8. Fair Value
Fair value is defined as the price that would be received to sell an asset or paid to transfer a liability (
i.e.
, the
“exit price”
) in an orderly transaction between market participants at the measurement date. The three broad levels of fair value hierarchy are as follows:
|
|
•
|
Level 1—Quoted prices in active markets are available for identical assets or liabilities as of the reported date.
|
|
|
•
|
Level 2—Quoted prices in markets that are not active or other pricing inputs that are either directly or indirectly observable as of the reported date.
|
|
|
•
|
Level 3—Prices or valuation techniques that are both significant to the fair value measurement and unobservable as of the reported date. These financial instruments do not have two-way markets and are measured using management’s best estimate of fair value, where the inputs into the determination of fair value require significant management judgment or estimation.
|
Assets Measured at Fair Value on a Recurring Basis
Effective January 1, 2010, we adopted ASU 2010-06,
Improving Disclosures about Fair Value Measurements
. This standard required additional disclosures about fair value measurements including transfers in and out of Levels 1 and 2 and a higher level of disaggregation for the different types of financial instruments. Transfers into and out of all levels of the fair value hierarchy are reflected at end-of-period fair values.
The following table summarizes the valuation of our financial instruments by pricing observability levels as of December 31, 2010:
|
Level 1
|
Level 2
|
Level 3
|
Total
|
|||||||||||||
|
(in thousands)
|
||||||||||||||||
|
Money markets
|
$ | 323,104 | $ | — | $ | — | $ | 323,104 | ||||||||
|
U.S. Treasury bills
|
— | 1,137,578 | — | 1,137,578 | ||||||||||||
|
U.K. Treasury bills
|
— | 7,911 | — | 7,911 | ||||||||||||
|
Equity securities
|
||||||||||||||||
|
Growth
|
97,161 | 188 | 69 | 97,418 | ||||||||||||
|
Value
|
73,579 | — | — | 73,579 | ||||||||||||
|
Blend
|
93,590 | — | — | 93,590 | ||||||||||||
|
Other
(1)
|
28,868 | 5,051 | — | 33,919 | ||||||||||||
|
Fixed Income securities
|
||||||||||||||||
|
Taxable
(2)
|
130,122 | 21,491 | — | 151,613 | ||||||||||||
|
Tax-exempt
(3)
|
9,310 | 750 | — | 10,060 | ||||||||||||
|
Other
|
17 | — | — | 17 | ||||||||||||
|
Derivatives
|
16 | 1,628 | — | 1,644 | ||||||||||||
|
Long exchange-traded options
|
9,027 | — | — | 9,027 | ||||||||||||
|
Private equity
|
24,432 | 23,811 | 59,345 | 107,588 | ||||||||||||
|
Total assets measured at fair value
|
$ | 789,226 | $ | 1,198,408 | $ | 59,414 | $ | 2,047,048 | ||||||||
|
Securities sold not yet purchased
|
||||||||||||||||
|
Short equities-corporate
|
$ | 42,914 | $ | — | $ | — | $ | 42,914 | ||||||||
|
Short exchange-traded options
|
7,622 | — | — | 7,622 | ||||||||||||
|
Other
|
3 | — | — | 3 | ||||||||||||
|
Derivatives
|
318 | 3,235 | — | 3,553 | ||||||||||||
|
Total liabilities measured at fair value
|
$ | 50,857 | $ | 3,235 | $ | — | $ | 54,092 | ||||||||
_____________
|
(1)
|
Primarily long positions in corporate equities traded through our options desk.
|
|
(2)
|
Primarily corporate and government securities.
|
|
(3)
|
Primarily municipal bonds.
|
The following table summarizes the valuation of our financial instruments by pricing observability levels as of December 31, 2009:
|
Level 1
|
Level 2
|
Level 3
|
Total
|
|||||||||||||
|
(in thousands)
|
||||||||||||||||
|
Money markets
|
$ | 178,875 | $ | — | $ | — | $ | 178,875 | ||||||||
|
U.S. Treasury bills
|
— | 975,888 | — | 975,888 | ||||||||||||
|
U.K. Treasury bills
|
— | 177,772 | — | 177,772 | ||||||||||||
|
Equity securities
|
365,017 | 4,504 | 650 | 370,171 | ||||||||||||
|
Fixed income securities
|
69,608 | 27,266 | 81 | 96,955 | ||||||||||||
|
Long exchange-traded options
|
6,572 | — | — | 6,572 | ||||||||||||
|
Derivatives
|
(15 | ) | 1,742 | — | 1,727 | |||||||||||
|
Private equity
|
2,913 | 62,006 | 97,828 | 162,747 | ||||||||||||
|
Total assets measured at fair value
|
$ | 622,970 | $ | 1,249,178 | $ | 98,559 | $ | 1,970,707 | ||||||||
|
Securities sold not yet purchased
|
||||||||||||||||
|
Short equities-corporate
|
$ | 28,641 | $ | — | $ | — | $ | 28,641 | ||||||||
|
Short exchange-traded options
|
3,165 | — | — | 3,165 | ||||||||||||
|
Total liabilities measured at fair value
|
$ | 31,806 | $ | — | $ | — | $ | 31,806 | ||||||||
Following is a description of the fair value methodologies used for instruments measured at fair value, as well as the general classification of such instruments pursuant to the valuation hierarchy:
|
|
•
|
Money markets:
We invest excess cash in various money market funds that are valued based on quoted prices in active markets; these are included in Level 1 of the valuation hierarchy.
|
|
|
•
|
Treasury bills:
We hold United States Treasury Bills, which are segregated in a special reserve bank custody account as required by Rule 15c3-3 of the Exchange Act. We also hold United Kingdom Treasury Bills. These securities are valued based on quoted yields in secondary markets and are included in Level 2 of the valuation hierarchy.
|
|
|
•
|
Derivatives:
We hold exchange-traded futures with counterparties that are included in Level 1 of the valuation hierarchy. In addition, we also hold currency forward contracts, interest rate swaps, credit default swaps and total return swaps with counterparties that are included in Level 2 of the valuation hierarchy.
|
|
|
•
|
Equity and fixed income securities:
Our equity and fixed income securities consist principally of company-sponsored mutual funds with exchange listed net asset values and various separately-managed portfolios consisting primarily of equity and fixed income securities with quoted prices in active markets, which are included in Level 1 of the valuation hierarchy. In addition, some securities are valued based on observable inputs from recognized pricing vendors, which are included in Level 2 of the valuation hierarchy. Also, an insignificant amount of securities are included in Level 3 of the valuation hierarchy. During 2010, $0.2 million of securities were transferred from a Level 3 classification to a Level 2 classification.
|
|
|
•
|
Options:
We hold long exchange-traded options that are included in Level 1 of the valuation hierarchy.
|
|
|
•
|
Private equity:
The valuation of non-public private equity investments owned by our consolidated venture capital fund requires significant management judgment due to the absence of quoted market prices, inherent lack of liquidity and the long-term nature of such investments. Private equity investments are valued initially at cost. The carrying values of private equity investments are adjusted either up or down from cost to reflect expected exit values as evidenced by financing and sale transactions with third parties, or when determination of a valuation adjustment is confirmed through ongoing review in accordance with our valuation policies and procedures. A variety of factors are reviewed and monitored to assess positive and negative changes in valuation including, but not limited to, current operating performance and future expectations of investee companies, industry valuations of comparable public companies, changes in market outlooks and the third party financing environment over time. In determining valuation adjustments resulting from the investment review process, particular emphasis is placed on current company performance and market conditions. Non-public equity investments are included in Level 3 of the valuation hierarchy because they trade infrequently and, therefore, their fair value is unobservable. Publicly-traded equity investments are included in Level 1 of the valuation hierarchy. If they contain trading restrictions, publicly-traded equity investments are included in Level 2 of the valuation hierarchy. During 2010, the trading restriction period expired on two of our publicly-traded equity investments and $41.2 million of securities were transferred from a Level 2 classification to a Level 1 classification as of December 31, 2010. In addition, one of our private securities went public in the fourth quarter of 2010 and due to a trading restriction period $23.8 million was transferred from a Level 3 classification to a Level 2 classification.
|
|
|
•
|
Securities sold not yet purchased:
Securities sold not yet purchased, primarily reflecting short positions in equities and exchange-traded options, are included in Level 1 of the valuation hierarchy.
|
The following table summarizes the changes in carrying value associated with Level 3 financial instruments carried at fair value:
|
December 31,
2010
|
December 31,
2009
|
|||||||
|
(in thousands)
|
||||||||
|
Balance as of beginning of period
|
$ | 98,559 | $ | 162,552 | ||||
|
Transfers in (out), net
|
(23,974 | ) | (85,606 | ) | ||||
|
Purchases (sales), net
|
(27,678 | ) | 8,170 | |||||
|
Realized gains (losses), net
|
16,802 | (1,739 | ) | |||||
|
Unrealized gains (losses), net
|
(4,295 | ) | 15,182 | |||||
|
Balance as of end of period
|
$ | 59,414 | $ | 98,559 | ||||
Realized and unrealized gains and losses on Level 3 financial instruments are recorded in investment gains and losses in the consolidated statements of income. Substantially all of the Level 3 investments are private equity investments owned by our consolidated venture capital fund, of which we own 10% and non-controlling interests own 90%.
Assets Measured at Fair Value on a Nonrecurring Basis
There were no impairments recognized for goodwill, intangible assets or other long-lived assets as of December 31, 2010.
9. Furniture, Equipment and Leasehold Improvements, Net
Furniture, equipment and leasehold improvements, net consist of:
|
December 31,
|
||||||||
|
2010
|
2009
|
|||||||
|
(in thousands)
|
||||||||
|
Furniture and equipment
|
$ | 547,961 | $ | 544,493 | ||||
|
Leasehold improvements
|
330,448 | 348,222 | ||||||
| 878,409 | 892,715 | |||||||
|
Less: Accumulated depreciation and amortization
|
(577,967 | ) | (533,041 | ) | ||||
|
Furniture, equipment and leasehold improvements, net
|
$ | 300,442 | $ | 359,674 | ||||
Depreciation and amortization expense on furniture, equipment and leasehold improvements were $59.6 million, $61.4 million and $65.6 million for the years ended December 31, 2010, 2009 and 2008, respectively.
During 2010, we recorded $101.7 million in pre-tax real estate charges in connection with our workforce reductions commencing in 2008. Included in the charges was $25.5 million worth of leasehold improvements, furniture and equipment we wrote off related to the space.
See Note 2
for further discussion of the real estate charges.
10. Deferred Sales Commissions, Net
The components of deferred sales commissions, net for the years ended December 31, 2010 and 2009 were as follows:
|
December 31,
(1)
|
||||||||
|
2010
|
2009
|
|||||||
|
(in thousands)
|
||||||||
|
|
|
|||||||
|
Carrying amount of deferred sales commissions
|
$ | 624,995 | $ | 571,599 | ||||
|
Less: Accumulated amortization
|
(397,095 | ) | (349,697 | ) | ||||
|
Cumulative CDSC received
|
(151,744 | ) | (131,715 | ) | ||||
|
Deferred sales commissions, net
|
$ | 76,156 | $ | 90,187 | ||||
_____________
|
(1)
|
Excludes amounts related to fully amortized deferred sales commissions.
|
Amortization expense was $47.4 million, $54.9 million and $79.1 million for the years ended December 31, 2010, 2009 and 2008, respectively. Estimated future amortization expense related to the December 31, 2010 net asset balance, assuming no additional CDSC is received in future periods, is as follows (in thousands):
|
2011
|
$ | 34,499 | ||
|
2012
|
19,997 | |||
|
2013
|
14,665 | |||
|
2014
|
6,100 | |||
|
2015
|
789 | |||
|
2016
|
106 | |||
| $ | 76,156 |
11. Debt
At December 31, 2010 and 2009, AllianceBernstein had $225.0 million and $249.0 million, respectively, in commercial paper outstanding with weighted average interest rates of approximately 0.3% and 0.2%, respectively. The fair value of commercial paper and amounts outstanding under the revolving credit facility are short-term in nature, and as such, recorded value is estimated to approximate fair value. Average daily borrowings of commercial paper during 2010 and 2009 were $104.2 million and $147.2 million, respectively, with weighted average interest rates of approximately 0.2% and 0.5%, respectively.
On December 9, 2010, AllianceBernstein entered into a committed, unsecured three-year senior revolving credit facility (the
“2010
Credit Facility”
) with a group of commercial banks and other lenders in an original principal amount of $1.0 billion with SCB LLC as an additional borrower.
The 2010 Credit Facility replaces AllianceBernstein’s existing $1.95 billion of committed credit lines (comprised of two separate lines – a $1.0 billion committed, unsecured revolving credit facility in the name of AllianceBernstein, which had a scheduled expiration date of February 17, 2011, and SCB LLC’s $950 million committed, unsecured revolving credit facility, which had a scheduled expiration date of January 25, 2011), both of which were terminated upon the effectiveness of the 2010 Credit Facility. AllianceBernstein has agreed to guarantee the obligations of SCB LLC under the 2010 Credit Facility.
The 2010 Credit Facility will be available for AllianceBernstein’s and SCB LLC’s business purposes, including the support of AllianceBernstein’s $1.0 billion commercial paper program. Both AllianceBernstein and SCB LLC can draw directly under the 2010 Credit Facility and management expects to draw on the 2010 Credit Facility from time to time.
The 2010 Credit Facility contains affirmative, negative and financial covenants, which are customary for facilities of this type, including, among other things, restrictions on dispositions of assets, restrictions on liens, a minimum interest coverage ratio and a maximum leverage ratio. The 2010 Credit Facility also includes customary events of default (with customary grace periods, as applicable), including provisions under which, upon the occurrence of an event of default, all outstanding loans may be accelerated and/or lender’s commitments may be terminated. Also, under such provisions, upon the occurrence of certain insolvency or bankruptcy related events of default, all amounts payable under the 2010 Credit Facility would automatically become immediately due and payable, and the lender’s commitments would automatically terminate.
The 2010 Credit Facility provides for possible increases in principal amount by up to an aggregate incremental amount of $250 million, any such increase being subject to the consent of the affected lenders. Amounts under the 2010 Credit Facility may be borrowed, repaid and re-borrowed by us from time to time until the maturity of the facility. Voluntary prepayments and commitment reductions requested by us are permitted at any time without fee (other than customary breakage costs relating to the prepayment of any drawn loans) upon proper notice and subject to a minimum dollar requirement. Borrowings under the 2010 Credit Facility bear interest at a rate per annum, which will be, at our option, a rate equal to an applicable margin, which is subject to adjustment based on the credit ratings of AllianceBernstein, plus one of the following indexes: London Interbank Offered Rate; a floating base rate; or the Federal Funds rate.
As of December 31, 2010 and 2009, we had no amounts outstanding under the 2010 Credit Facility or the previous revolving credit facilities, respectively. Average daily borrowings under the revolving credit facility outstanding during 2010 and 2009 were $65.6 million and $65.4 million, respectively, with weighted average interest rates of approximately 0.3% for both years.
In addition, SCB LLC has five uncommitted lines of credit with four financial institutions. Two of these lines of credit permit us to borrow up to an aggregate of approximately $125.0 million while three lines have no stated limit.
12. Commitments and Contingencies
Operating Leases
We lease office space, furniture and office equipment under various operating leases. The future minimum payments under non-cancelable leases, sublease commitments and related payments we are obligated to make, net of sublease commitments of third party lessees to make payments to us, as of December 31, 2010 are as follows:
|
Payments
|
Sublease
Receipts
|
Net
Payments
|
||||||||||
|
(in millions)
|
||||||||||||
|
|
|
|
||||||||||
|
2011
|
$ | 140.7 | $ | 6.8 | $ | 133.9 | ||||||
|
2012
|
149.5 | 12.5 | 137.0 | |||||||||
|
2013
|
148.7 | 13.9 | 134.8 | |||||||||
|
2014
|
148.2 | 13.7 | 134.5 | |||||||||
|
2015
|
144.5 | 13.8 | 130.7 | |||||||||
|
2016 and thereafter
|
1,350.0 | 56.6 | 1,293.4 | |||||||||
|
Total future minimum payments
|
$ | 2,081.6 | $ | 117.3 | $ | 1,964.3 | ||||||
Office leases contain escalation clauses that provide for the pass through of increases in operating expenses and real estate taxes. Rent expense, which is amortized on a straight-line basis over the life of the lease, was $121.5 million, $133.6 million and $125.7 million, respectively, for the years ended December 31, 2010, 2009 and 2008, net of sublease income of $3.2 million, $3.4 million and $3.3 million, respectively, for the years ended December 31, 2010, 2009 and 2008. In addition, we accelerated rent of $76.2 million in 2010.
See Note 2
for further discussion of the real estate charges.
Legal Proceedings
On October 2, 2003, a purported class action complaint entitled
Hindo, et al. v. AllianceBernstein Growth & Income Fund, et al.
(
“Hindo Complaint”
) was filed against, among others, AllianceBernstein, Holding and the General Partner. The Hindo Complaint alleges that certain defendants failed to disclose that they improperly allowed certain hedge funds and other unidentified parties to engage in “late trading” and “market timing” of certain of our U.S. mutual fund securities, violating various securities laws.
Following October 2, 2003, additional lawsuits making factual allegations generally similar to those in the Hindo Complaint were filed in various federal and state courts against AllianceBernstein and certain other defendants. On September 29, 2004, plaintiffs filed consolidated amended complaints with respect to four claim types: mutual fund shareholder claims; mutual fund derivative claims; derivative claims brought on behalf of Holding; and claims brought under the Employee Retirement Income Security Act of 1974, as amended (
“ERISA”
) by participants in the Profit Sharing Plan for Employees of AllianceBernstein.
On April 21, 2006, AllianceBernstein and attorneys for the plaintiffs in the mutual fund shareholder claims, mutual fund derivative claims and ERISA claims entered into a confidential memorandum of understanding containing their agreement to settle these claims. The agreement was documented by a stipulation of settlement, which has been approved by the court. The settlement amount ($30 million), which we previously expensed and disclosed, has been disbursed. The derivative claims brought on behalf of Holding, in which plaintiffs seek an unspecified amount of damages, remain pending.
We intend to vigorously defend against the lawsuit involving derivative claims brought on behalf of Holding. At the present time, we are unable to predict the outcome or estimate a possible loss or range of loss in respect of this matter because of the inherent uncertainty regarding the outcome of complex litigation, and the fact that the plaintiffs did not specify an amount of damages sought in their complaint.
We are involved in various other matters, including regulatory inquiries, administrative proceedings and litigation, some of which allege significant damages. While any inquiry, proceeding or litigation has the element of uncertainty, management believes that the outcome of any one of the other regulatory inquiries, administrative proceedings, lawsuits or claims that is pending or threatened, or all of them combined, will not have a material adverse effect on our results of operations or financial condition.
Other
During July 2009, we entered into a subscription agreement under which we committed to invest up to $40 million in a venture capital fund over a six-year period. As of December 31, 2010, we had funded $7.0 million of this commitment. In January 2011, we received a capital call of $0.8 million.
Also during July 2009, we were selected by the U.S. Treasury Department as one of nine pre-qualified investment managers under the Public-Private Investment Program. As part of the program, each investment manager is required to invest a minimum of $20 million in the Public-Private Investment Fund they manage. As of December 31, 2010, we funded $17.0 million of this commitment.
13. Net Capital
SCB LLC, a broker-dealer and a member organization of the New York Stock Exchange (
“NYSE”
), is subject to the Uniform Net Capital Rule 15c3-1 of the Exchange Act. SCB LLC computes its net capital under the alternative method permitted by the rule, which requires that minimum net capital, as defined, equal the greater of $1 million, or two percent of aggregate debit items arising from customer transactions, as defined. As of December 31, 2010, SCB LLC had net capital of $173.3 million, which was $158.6 million in excess of the minimum net capital requirement of $14.7 million. Advances, dividend payments and other equity withdrawals by SCB LLC are restricted by the regulations of the U.S. Securities and Exchange Commission (
“SEC”
), the Financial Industry Regulatory Authority, Inc., and other securities agencies.
SCBL is a member of the London Stock Exchange. As of December 31, 2010, SCBL was subject to financial resources requirements of $15.1 million imposed by the Financial Services Authority of the United Kingdom and had aggregate regulatory financial resources of $41.5 million, an excess of $26.4 million.
AllianceBernstein Investments serves as distributor and/or underwriter for certain company-sponsored mutual funds. AllianceBernstein Investments is registered as a broker-dealer under the Exchange Act and is subject to the minimum net capital requirements imposed by the SEC. AllianceBernstein Investments’ net capital as of December 31, 2010 was $51.0 million, which was $45.9 million in excess of its required net capital of $5.1 million.
Many of our subsidiaries around the world are subject to minimum net capital requirements by the local laws and regulations to which they are subject. As of December 31, 2010, each of our subsidiaries subject to a minimum net capital requirement satisfied the applicable requirement.
14. Counterparty Risk
Customer Activities
In the normal course of business, brokerage activities involve the execution, settlement and financing of various customer securities trades, which may expose SCB LLC and SCBL to off-balance sheet risk by requiring SCB LLC and SCBL to purchase or sell securities at prevailing market prices in the event the customer is unable to fulfill its contracted obligations.
SCB LLC’s customer securities activities are transacted on either a cash or margin basis. In margin transactions, SCB LLC extends credit to the customer, subject to various regulatory and internal margin requirements. These transactions are collateralized by cash or securities in the customer’s account. In connection with these activities, SCB LLC may execute and clear customer transactions involving the sale of securities not yet purchased. SCB LLC seeks to control the risks associated with margin transactions by requiring customers to maintain collateral in compliance with the aforementioned regulatory and internal guidelines. SCB LLC monitors required margin levels daily and, pursuant to such guidelines, requires customers to deposit additional collateral, or reduce positions, when necessary. A majority of SCB LLC’s customer margin accounts are managed on a discretionary basis whereby AllianceBernstein maintains control over the investment activity in the accounts. For these discretionary accounts, SCB LLC’s margin deficiency exposure is minimized through maintaining a diversified portfolio of securities in the accounts and by virtue of AllianceBernstein’s discretionary authority and SCB LLC’s role as custodian.
SCB LLC may enter into forward foreign currency contracts on behalf of accounts for which SCB LLC acts as custodian. SCB LLC minimizes credit risk associated with these contracts by monitoring these positions on a daily basis, as well as by virtue of AllianceBernstein’s discretionary authority and SCB LLC’s role as custodian.
In accordance with industry practice, SCB LLC and SCBL record customer transactions on a settlement date basis, which is generally three business days after trade date. SCB LLC and SCBL are exposed to risk of loss on these transactions in the event of the customer’s or broker’s inability to meet the terms of their contracts, in which case SCB LLC and SCBL may have to purchase or sell financial instruments at prevailing market prices. The risks assumed by SCB LLC and SCBL in connection with these transactions are not expected to have a material effect upon AllianceBernstein’s, SCB LLC’s, or SCBL’s financial condition or results of operations.
Other Counterparties
SCB LLC and SCBL are engaged in various brokerage activities on behalf of clients in which counterparties primarily include broker-dealers, banks and other financial institutions. In the event counterparties do not fulfill their obligations, SCB LLC and SCBL may be exposed to risk. The risk of default depends on the creditworthiness of the counterparty or issuer of the instrument. It is SCB LLC’s and SCBL’s policy to review, as necessary, each counterparty’s credit worthiness.
In connection with SCB LLC’s security borrowing and lending arrangements, SCB LLC enters into collateralized agreements which may result in credit exposure in the event the counterparty to a transaction is unable to fulfill its contractual obligations. Security borrowing arrangements require SCB LLC to deposit cash collateral with the lender. With respect to security lending arrangements, SCB LLC receives collateral in the form of cash in amounts generally in excess of the market value of the securities loaned. SCB LLC minimizes credit risk associated with these activities by establishing credit limits for each broker and monitoring these limits on a daily basis. Additionally, security borrowing and lending collateral is marked to market on a daily basis, and additional collateral is deposited by or returned to SCB LLC as necessary.
15. Qualified Employee Benefit Plans
We maintain a qualified profit sharing plan covering U.S. employees and certain foreign employees. Employer contributions are discretionary and generally limited to the maximum amount deductible for federal income tax purposes. Aggregate contributions for 2010, 2009 and 2008 were $14.6 million, $15.2 million and $24.5 million, respectively.
We maintain several defined contribution plans for foreign employees in our subsidiaries in the United Kingdom, Australia, Japan and other foreign entities. Employer contributions are generally consistent with regulatory requirements and tax limits. Defined contribution expense for foreign entities was $7.1 million, $7.7 million and $10.6 million in 2010, 2009 and 2008, respectively.
We maintain a qualified, noncontributory, defined benefit retirement plan (
“Retirement Plan”
) covering current and former employees who were employed by AllianceBernstein in the United States prior to October 2, 2000. Benefits are based on years of credited service, average final base salary (as defined in the Retirement Plan), and primary Social Security benefits. Service and compensation after December 31, 2008 are not taken into account in determining participants’ retirement benefits.
Our policy is to satisfy our funding obligation for each year in an amount not less than the minimum required by ERISA and not greater than the maximum amount we can deduct for federal income tax purposes. We contributed $6.1 million to the Retirement Plan during 2010. We currently estimate that we will contribute $6.9 million to the Retirement Plan during 2011. Contribution estimates, which are subject to change, are based on regulatory requirements, future market conditions and assumptions used for actuarial computations of the Retirement Plan’s obligations and assets. Management, at the present time, has not determined the amount, if any, of additional future contributions that may be required.
The Retirement Plan’s projected benefit obligation, fair value of plan assets, and funded status (amounts recognized in the consolidated statements of financial condition) were as follows:
|
Years Ended December 31,
|
||||||||
|
2010
|
2009
|
|||||||
|
(in thousands)
|
||||||||
|
Change in projected benefit obligation:
|
||||||||
|
Projected benefit obligation at beginning of year
|
$ | 77,164 | $ | 72,230 | ||||
|
Interest cost
|
4,600 | 4,420 | ||||||
|
Actuarial loss
|
9,634 | 3,427 | ||||||
|
Benefits paid
|
(3,665 | ) | (2,913 | ) | ||||
|
Projected benefit obligation at end of year
|
87,733 | 77,164 | ||||||
|
Change in plan assets:
|
||||||||
|
Plan assets at fair value at beginning of year
|
56,592 | 33,383 | ||||||
|
Actual return on plan assets
|
5,600 | 13,368 | ||||||
|
Employer contribution
|
6,100 | 12,754 | ||||||
|
Benefits paid
|
(3,665 | ) | (2,913 | ) | ||||
|
Plan assets at fair value at end of year
|
64,627 | 56,592 | ||||||
|
Funded status
|
$ | (23,106 | ) | $ | (20,572 | ) | ||
The amounts recognized in other comprehensive income (loss), net of taxes, for 2010 and 2009 were as follows:
|
2010
|
2009
|
|||||||
|
(in thousands)
|
||||||||
|
Unrecognized net gain (loss) from experience different from that assumed and effects of changes and assumptions
|
$ | (8,164 | ) | $ | 7,098 | |||
|
Unrecognized net plan assets as of January 1, 1987 being recognized over 26.3 years
|
(133 | ) | (143 | ) | ||||
|
Other comprehensive (loss) income
|
$ | (8,297 | ) | $ | 6,955 | |||
The amounts included in accumulated other comprehensive income (loss), net of taxes, as of December 31, 2010 and 2009 were as follows:
|
2010
|
2009
|
|||||||
|
(in thousands)
|
||||||||
|
Unrecognized net loss from experience different from that assumed and effects of changes and assumptions
|
$ | (23,315 | ) | $ | (15,151 | ) | ||
|
Unrecognized net plan assets as of January 1, 1987 being recognized over 26.3 years
|
326 | 459 | ||||||
|
Accumulated other comprehensive loss
|
$ | (22,989 | ) | $ | (14,692 | ) | ||
The estimated initial plan assets and amortization of loss for the Retirement Plan that will be amortized from accumulated other comprehensive income over the next year is $143,017 and $430,445, respectively. The accumulated benefit obligation for the plan was $87.7 million and $77.2 million, respectively, as of December 31, 2010 and 2009.
The discount rate used to determine benefit obligations as of December 31, 2010 and 2009 (measurement dates) were 5.5% and 6.05%, respectively.
The following benefit payments, which reflect expected future service, are expected to be paid as follows (in thousands):
|
2011
|
$ | 3,525 | ||
|
2012
|
3,672 | |||
|
2013
|
3,305 | |||
|
2014
|
3,500 | |||
|
2015
|
4,438 | |||
|
2016-2020
|
25,358 |
Net expense under the Retirement Plan consisted of:
|
Years Ended December 31,
|
||||||||||||
|
2010
|
2009
|
2008
|
||||||||||
|
(in thousands)
|
||||||||||||
|
Service cost
|
$ | — | $ | — | $ | 2,995 | ||||||
|
Interest cost on projected benefit obligations
|
4,600 | 4,419 | 4,996 | |||||||||
|
Expected return on plan assets
|
(4,453 | ) | (3,110 | ) | (4,590 | ) | ||||||
|
Amortization of prior service credit
|
— | — | (431 | ) | ||||||||
|
Amortization of transition asset
|
(143 | ) | (143 | ) | (143 | ) | ||||||
|
Curtailment gain recognized
|
— | — | (3,510 | ) | ||||||||
|
Recognized actuarial loss
|
262 | 431 | — | |||||||||
|
Net pension charge (benefit)
|
$ | 266 | $ | 1,597 | $ | (683 | ) | |||||
Actuarial computations used to determine net periodic costs were made utilizing the following weighted-average assumptions:
|
Years Ended December 31,
|
||||||||||||
|
2010
|
2009
|
2008
|
||||||||||
|
Discount rate on benefit obligations
|
6.05 | % | 6.20 | % | 6.55 | % | ||||||
|
Expected long-term rate of return on plan assets
|
8.00 | 8.00 | 8.00 | |||||||||
|
Annual salary increases
|
— | — | 3.14 | |||||||||
The Retirement Plan’s asset allocation percentages consisted of:
|
December 31,
|
||||||||
|
2010
|
2009
|
|||||||
|
Equity securities
|
60 | % | 61 | % | ||||
|
Debt securities
|
32 | 31 | ||||||
|
Real estate
|
8 | 8 | ||||||
| 100 | % | 100 | % | |||||
In developing the expected long-term rate of return on plan assets of 8.0%, management considered the historical returns and future expectations for returns for each asset category, as well as the target asset allocation of the portfolio. The expected long-term rate of return on assets is based on weighted average expected returns for each asset class.
The guidelines regarding allocation of assets formalized in the Investment Policy Statement were adopted by the Investment Committee for the Retirement Plan to reflect the Plan’s liquidity requirements, funded status, growth expectations and risk tolerance. The guidelines specify an allocation weighting of 50% to 70% for global equity securities (target of 60%), 20% to 40% for fixed income securities (target of 30%) and 0% to 10% for real estate investment trusts (target of 10%). Alternative investments are permitted under the guidelines, with such investments to be allocated to one or more of the above security classes and subject to the indicated tactical ranges.
Exposure of the total portfolio to cash equivalents on average should not exceed 5% of the portfolio’s value on a market value basis. The plan seeks to provide a rate of return that exceeds applicable benchmarks over rolling five-year periods. The benchmark for the plan’s large cap domestic equity investment strategy is the S&P 500 Index; the small cap domestic equity investment strategy is measured against the Russell 2000 Index; the international equity investment strategy is measured against the MSCI EAFE Index; and the fixed income investment strategy is measured against the Barclays Aggregate Bond Index.
The following table summarizes the valuation of our Retirement Plan assets by pricing observability levels as of December 31, 2010:
|
Level 1
|
Level 2
|
Level 3
|
Total
|
|||||||||||||
|
(in thousands)
|
||||||||||||||||
|
Cash
|
$
|
63
|
$
|
—
|
$
|
—
|
$
|
63
|
||||||||
|
Government securities
|
||||||||||||||||
|
U.S. Treasury bills
|
—
|
1,898
|
—
|
1,898
|
||||||||||||
|
Agency Discount notes
|
—
|
580
|
—
|
580
|
||||||||||||
|
Real Estate mutual fund
|
5,345
|
—
|
—
|
5,345
|
||||||||||||
|
Offshore hedge funds
|
||||||||||||||||
|
Fixed/equity securities
|
—
|
5,515
|
—
|
5,515
|
||||||||||||
|
Private investment trusts
|
||||||||||||||||
|
Fixed securities
|
—
|
14,015
|
—
|
14,015
|
||||||||||||
|
Equity securities
|
—
|
37,211
|
—
|
37,211
|
||||||||||||
|
Total assets measured at fair value
|
$
|
5,408
|
$
|
59,219
|
$
|
—
|
$
|
64,627
|
||||||||
The following table summarizes the valuation of our Retirement Plan assets by pricing observability levels as of December 31, 2009:
|
Level 1
|
Level 2
|
Level 3
|
Total
|
|||||||||||||
|
(in thousands)
|
||||||||||||||||
|
Cash
|
$
|
12
|
$
|
—
|
$
|
—
|
$
|
12
|
||||||||
|
Government securities
|
||||||||||||||||
|
U.S. Treasury bills
|
—
|
1,075
|
—
|
1,075
|
||||||||||||
|
Agency Discount notes
|
—
|
360
|
—
|
360
|
||||||||||||
|
Real Estate mutual fund
|
4,233
|
—
|
—
|
4,233
|
||||||||||||
|
Offshore hedge funds
|
||||||||||||||||
|
Fixed/equity securities
|
—
|
4,636
|
—
|
4,636
|
||||||||||||
|
Equity securities
|
—
|
1,903
|
—
|
1,903
|
||||||||||||
|
Private investment trusts
|
||||||||||||||||
|
Fixed securities
|
—
|
13,125
|
—
|
13,125
|
||||||||||||
|
Equity securities
|
—
|
31,248
|
—
|
31,248
|
||||||||||||
|
Total assets measured at fair value
|
$
|
4,245
|
$
|
52,347
|
$
|
—
|
$
|
56,592
|
||||||||
See Note 8
for a description of how we measure the fair value of our plan assets.
The Retirement Plan invests in a mutual fund which is an open-end fund that seeks total return from long-term growth of capital and income. Typically the mutual fund invests at least 80% of its net assets in real estate investment trusts (
“REITs”
) and other real estate industry companies. The mutual fund is subject to certain risks associated with the direct ownership of real estate and with the real estate industry in general. To the extent that assets underlying the mutual fund’s investments are concentrated geographically, by property type or in certain other respects, the mutual fund may be subject to additional risks.
Additionally, the Retirement Plan invests in two offshore hedge funds and two private investment trusts. One of the hedge funds seeks to deliver long-term returns in excess of balanced allocations of equities and fixed income instruments with comparable volatility over time, while the other hedge fund attempts to significantly outperform the returns of global markets over full market cycles. One of the private investment trusts invests primarily in investment grade, U.S. dollar-denominated fixed income securities. The other private investment trust primarily invests in equity securities of companies located around the world.
The government securities held by the Retirement Plan consist of United States Treasury bills and Agency Discount notes.
We provide postretirement medical benefits which allow retirees between the ages of 55 and 65 meeting certain service requirements, at their election, to continue to participate in our group medical program by paying 100% of the applicable group premium. Retirees older than 65 may also continue to participate in our group medical program, but are required to pay the full expected cost of benefits. To the extent that retirees’ medical costs exceed premiums paid, we incur the cost of providing a postretirement medical benefit. During 2010, our net periodic benefit cost was $0.6 million, and our aggregate benefit obligation as of December 31, 2010 is
$6.2 million.
16. Long-term Incentive Compensation Plans
We maintain an unfunded, non-qualified incentive compensation program known as the Post-July 1, 2010 AllianceBernstein Incentive Compensation Award Program (the
“Incentive Compensation Program”
) under which annual awards may be granted to eligible employees.
All 2010 and 2009 awards under the Incentive Compensation Program were in the form of restricted Holding Units, which generally vest ratably over four years. The Incentive Compensation Program includes a “rule of 65” retirement provision (employees must have attained age 55 and completed at least 10 years of service) that allows qualified employees to retire from the company and continue to vest in their award provided they continue to comply with covenants and agreements contained in the award agreement (
e.g.
, non-competition and non-solicitation) until the award has fully vested and been distributed. Upon vesting, awards are distributed to participants unless a voluntary election to defer receipt has been made. Quarterly cash distributions on vested and unvested restricted Holding Units are paid currently to participants. As an eligible employee’s total compensation increases, the percentage of his or her annual incentive compensation paid in equity awards increases relative to lower-paid employees.
Prior to 2009, participants in the Incentive Compensation Program (which was then known as the Partners Compensation Plan) allocated their awards among notional investments in Holding Units and certain of our investment services, and in certain instances in options to buy Holding Units. The Compensation Committee of the Board of Directors (
“Board”
) of the General Partner had the discretion to determine each calendar year a minimum and a maximum percentage of each award that could have been treated as notionally invested in Holding Units or certain of our investment services, or, under certain circumstances, allocated to options to buy Holding Units.
For 2001 through 2008 awards, vesting periods range from four years to immediate depending on the age of the participant at the time of the award. Upon vesting, awards are distributed to participants unless a voluntary election to defer receipt has been made. Quarterly cash distributions on unvested Holding Units for which a deferral election has not been made are paid currently to participants. Quarterly cash distributions on vested and unvested Holding Units for which a deferral election had been made and income earned on notional investments in company-sponsored mutual funds are treated as fully vested and are reinvested and distributed as elected by participants.
We made awards in 2010, 2009 and 2008 aggregating $275.6 million, $223.1 million and $236.0 million, respectively. In January 2009, $22.9 million of the 2008 award was allocated to options to buy Holding Units (
see Note 17
). The amounts charged to employee compensation and benefits expense for the years ended December 31, 2010, 2009 and 2008 were $205.9 million, $199.7 million and $59.9 million, respectively.
During December 2008, Lewis A. Sanders, our former Chairman and CEO, retired from the Company. Based on his employment and retirement agreements, unvested deferred compensation awards fully vested in 2008. The amounts charged to employee compensation and benefits expense under his agreements for the year ended December 31, 2008 was $40.9 million.
During 2005, we established the AllianceBernstein Financial Advisor Wealth Accumulation Plan (
“Wealth Accumulation Plan”
), a voluntary unfunded, non-qualified incentive plan. The Wealth Accumulation Plan was established to attract and retain eligible employees expected to make significant contributions to the future growth and success of Bernstein Global Wealth Management, the unit of AllianceBernstein that services private clients. Participants designate the percentage of their awards to be notionally invested in Holding Units or certain of our investment services. No more than 50% of the award may be notionally invested in Holding Units. All awards vest annually on a pro rata basis over the term of the award. There were no awards granted under this plan in 2010. We made awards totaling $16.5 million in 2009 and $15.2 million in 2008. The amounts charged to employee compensation and benefits expense for the years ended December 31, 2010, 2009 and 2008 were $8.5 million, $9.5 million and $8.7 million, respectively.
During 2003, we established the AllianceBernstein Commission Substitution Plan (
“Commission Substitution Plan”
), an unfunded, non-qualified incentive plan. Employees whose principal duties are to sell or market the products or services of AllianceBernstein and whose compensation is entirely or mostly commission-based were eligible for an award under this plan. Participants designated the percentage of their awards to be allocated to notional investments in Holding Units or in certain of our investment services. Awards vested ratably over a three-year period and were amortized as employee compensation expense. The Commission Substitution Plan was terminated in 2007 and no awards have been made since 2006. The amounts charged to employee compensation and benefits expense for the years ended December 31, 2010, 2009 and 2008 were $0.1 million, $10.5 million and $21.7 million, respectively.
We maintain an unfunded, non-qualified deferred compensation plan known as the Capital Accumulation Plan and also have assumed obligations under contractual unfunded deferred compensation arrangements covering certain executives (
“Contractual Arrangements”
). The Capital Accumulation Plan was frozen on December 31, 1987 and no additional awards have been made. The Board may terminate the Capital Accumulation Plan at any time without cause, in which case our liability would be limited to benefits that have vested. Payment of vested benefits under both the Capital Accumulation Plan and the Contractual Arrangements will generally be made over a ten-year period commencing at retirement age. The General Partner is obligated to make capital contributions to AllianceBernstein in amounts equal to benefits paid under the Capital Accumulation Plan and the Contractual Arrangements. Amounts included in employee compensation and benefits expense for the Capital Accumulation Plan and the Contractual Arrangements for the years ended December 31, 2010, 2009 and 2008 were $1.2 million, $1.4 million and $1.7 million, respectively.
17. Compensatory Unit Awards and Option Plans
On July 26, 2010, the Amended and Restated 1997 Long Term Incentive Plan expired. Effective as of July 1, 2010, we established the AllianceBernstein 2010 Long Term Incentive Plan (
“2010 Plan”
), which was adopted by Holding Unitholders at a special meeting of Holding Unitholders held on June 30, 2010. The following forms of awards may be granted to employees and independent directors of the General Partner under the 2010 Plan: (i) restricted Holding Units or phantom restricted Holding Units (a “phantom” award is a contractual right to receive Holding Units at a later date or upon a specified event); (ii) options to buy Holding Units; and (iii) other Holding Unit-based awards (including, without limitation, Holding Unit appreciation rights and performance awards). The purpose of the 2010 Plan is to promote the interest of AllianceBernstein by: (i) attracting and retaining talented officers, employees and directors, (ii) motivating such officers, employees and directors by means of performance-related incentives to achieve longer-range business and operational goals, (iii) enabling such officers, employees and directors to participate in the long-term growth and financial success of AllianceBernstein, and (iv) aligning the interests of such officers, employees and directors with those of Holding Unitholders. The 2010 Plan will expire on June 30, 2020, and no awards under the 2010 Plan will be made after that date. Under the 2010 Plan, the number of newly-issued Holding Units with respect to which awards may be granted is 30 million. The 2010 Plan also permits us to award an additional 30 million Holding Units if we acquire the Holding Units on the open market or through private purchases. During 2010, we granted 25,910 options to buy Holding Units and 12,459,205 restricted Holding Units, net of forfeitures, under the 2010 Plan. As a result, Holding Unit-based awards (including options) in respect of 47,514,885 Holding Units are available for grant as of December 31, 2010.
In 1997, we established the 1997 Long Term Incentive Plan (
“1997 Plan”
), under which options to buy Holding Units, restricted Holding Units and phantom restricted Holding Units, performance awards, and other Holding Unit-based awards may be granted to key employees and independent directors of the General Partner for terms established at the time of grant (generally 10 years). Options granted to employees are generally exercisable at a rate of 20% of the Holding Units subject to such options on each of the first five anniversary dates of the date of grant (except for certain options awarded under the Special Option Program, which are
described below
); options granted to independent directors are generally exercisable at a rate of 33.3% of the Holding Units subject to such options on each of the first three anniversary dates of the date of grant. Restricted Holding Units awarded to independent directors of the General Partner vest on the third anniversary of the grant date or immediately upon a director’s resignation. Restricted Holding Units awarded to our CEO (
as described below under “Restricted Holding Unit Awards”
) vest 20% on each of the first five anniversary dates of the grant date. Restricted Holding Units awarded under the Incentive Compensation Program vest 25% on December 1
st
of the subsequent four years. The 1997 Plan expired on July 26, 2010.
In 1993, we established the 1993 Unit Option Plan (
“1993 Plan”
), under which options to buy Holding Units were granted to key employees and independent directors of the General Partner for terms of up to 10 years. Each option has an exercise price of not less than the fair market value of Holding Units on the date of grant. Options are exercisable at a rate of 20% of the Holding Units subject to such options on each of the first five anniversary dates of the date of grant. No options or other awards have been granted under the 1993 Plan since it expired in 2003.
Option Awards
In 2007, the Compensation Committee of the Board (
“Compensation Committee”
) approved the Special Option Program, under which selected senior officers voluntarily allocate a specified portion of their annual long-term incentive compensation award to options to buy Holding Units. On January 23, 2009, the Compensation Committee granted an award of options to buy 6,534,182 Holding Units to 67 selected senior officers. The exercise price is $17.05, the closing price of Holding Units on the grant date, and the fair value is $3.51 per option.
The equity needed to fund awards under the Special Option Program was taken from the 1997 Plan (and reduced amounts available for grant under that plan accordingly). Future awards under the Special Option Program, if any, will take equity from the 2010 Plan or any successor equity compensation plan (and will reduce amounts available for grant under such plans accordingly).
Options to buy Holding Units (including grants to independent directors) were granted as follows: 387,661 options were granted during 2010, 6,565,302 options were granted during 2009 and 13,825 options were granted during 2008. The weighted average fair value of options to buy Holding Units granted during 2010, 2009 and 2008 was $6.18, $3.52 and $10.85, respectively, on the date of grant, determined using the Black-Scholes option valuation model with the following assumptions:
|
2010
|
2009
|
2008
|
||||||||||
|
Risk-free interest rate
|
2.2 – 2.3 | % | 1.6 – 2.1 | % | 3.2 | % | ||||||
|
Expected cash distribution yield
|
7.2 – 8.2 | % | 5.2 – 6.1 | % | 5.4 | % | ||||||
|
Historical volatility factor
|
46.2 – 46.6 | % | 40.0 – 44.6 | % | 29.3 | % | ||||||
|
Expected term
|
6.0 years
|
6.0 – 6.5 years
|
6.0 years
|
|||||||||
Due to a lack of sufficient historical data, we have chosen to use the simplified method to calculate the expected term of options.
The following table summarizes the activity in our option plan during 2010:
|
Options to Buy Holding
Units
|
Weighted
Average
Exercise Price
Per Option
|
Weighted
Average
Remaining
Contractual
Term (Years)
|
Aggregate
Intrinsic Value
|
|||||||||||||
|
(in thousands)
|
||||||||||||||||
|
Outstanding as of December 31, 2009
|
12,047,522 | $ | 41.79 | 7.3 | ||||||||||||
|
Granted
|
387,661 | 27.52 | ||||||||||||||
|
Exercised
|
(486,017 | ) | 17.05 | |||||||||||||
|
Forfeited
|
(955,116 | ) | 46.68 | |||||||||||||
|
Expired
|
(776,179 | ) | 51.39 | |||||||||||||
|
Outstanding as of December 31, 2010
|
10,217,871 | 41.24 | 6.9 | $ | — | |||||||||||
|
Exercisable as of December 31, 2010
|
2,714,386 | 44.94 | 4.7 | — | ||||||||||||
|
Vested or expected to vest as of December 31, 2010
|
8,899,963 | 42.44 | 6.8 | — | ||||||||||||
The aggregate intrinsic value as of December 31, 2010 on options outstanding, exercisable and expected to vest is negative, and is therefore presented as zero in the table above. The total intrinsic value of options exercised during 2010, 2009 and 2008 was $5.6 million, zero and $6.3 million, respectively.
Under the fair value method, compensation expense is measured at the grant date based on the estimated fair value of the options awarded (determined using the Black-Scholes option valuation model) and is recognized over the vesting period. We recorded compensation expense relating to option grants of $9.1 million, $11.9 million and $7.7 million, respectively, for the years ended December 31, 2010, 2009 and 2008. As of December 31, 2010, there was $34.5 million of compensation cost related to unvested option grants not yet recognized in the consolidated statement of income. The cost is expected to be recognized over a weighted average period of 3.5 years.
Restricted Holding Unit Awards
In 2010, 2009 and 2008, restricted Holding Units were awarded to the independent members of the Board. These Holding Units give the directors, in most instances, all the rights of other Holding Unitholders subject to such restrictions on transfer as the Board may impose. We awarded 5,275, 8,210 and 2,335 restricted Holding Units, respectively, in 2010, 2009 and 2008 with grant date fair values of $28.46, $18.27 and $64.24, respectively, per restricted Holding Unit. All of the restricted Holding Units vest on the third anniversary of grant date or immediately upon a director’s resignation. We fully expensed these awards on each grant date.
In accordance with the terms of the employment agreement between Mr. Kraus, Chairman and CEO, the General Partner, Holding and AllianceBernstein dated December 19, 2008, Mr. Kraus was granted 2,722,052 restricted Holding Units with a grant date fair value of $19.20. Subject to accelerated vesting provisions in Mr. Kraus’s employment agreement, his restricted Holding Units vest ratably on each of the first five anniversaries of December 19, 2008, commencing December 19, 2009, provided, with respect to each installment, Mr. Kraus continues to be employed by AllianceBernstein on the vesting date. The agreement provides for immediate vesting upon AXA ceasing to control the management of AllianceBernstein’s business or Holding ceasing to be publicly-traded and certain qualifying terminations of employment, including termination of Mr. Kraus’s employment (i) by AllianceBernstein without cause, (ii) by Mr. Kraus for good reason (“good reason” generally means actions taken by AllianceBernstein resulting in a material negative change in Mr. Kraus’s employment relationship, including assignment to Mr. Kraus of duties materially inconsistent with his position or a requirement that Mr. Kraus report to an officer or employee of AllianceBernstein instead of reporting directly to the Board), and (iii) due to death or disability.
In 1993, we established the Century Club Plan, under which employees of AllianceBernstein whose primary responsibilities are to assist in the distribution of company-sponsored mutual funds and who meet certain sales targets, are eligible to receive an award of restricted Holding Units. Awards vest ratably over three years and are amortized over the vesting period as employee compensation expense. We awarded 95,531, 46,163 and 46,030 restricted Holding Units in 2010, 2009 and 2008, respectively. The grant date fair values of theses awards were $27.45 and $23.72 in 2010, $12.17 in 2009 and $62.05 in 2008 per Holding Unit.
Beginning in 2009, we awarded restricted Holding Units under the Incentive Compensation Program (
see
Note 16
). Restricted Holding Unit awards generally vest ratably over four years and are amortized over the vesting period as employee compensation expense. We awarded 11,594,207 and 8,345,805 restricted Holding Units in 2010 and 2009, respectively, with grant date fair values ranging between $23.72 and $32.06 for 2010 and $26.73 in 2009 per restricted Holding Unit.
We also award restricted Holding Units in connection with certain employment and separation agreements with vesting schedules ranging between two to five years. The fair value of the restricted Holding Units is amortized over the required service period as employee compensation expense. We awarded 1,369,751 and 1,443,227 Holding Units in 2010 and 2009, respectively, with grant date fair values ranging between $23.72 and $28.37 in 2010 and $16.79 and $28.38 in 2009 per restricted Holding Unit.
The following table summarizes the activity of unvested restricted Holding Units during 2010:
|
|
Holding
Units
|
Weighted Average
Grant Date Fair
Value
|
||||||
|
|
||||||||
|
Unvested as of December 31, 2009
|
12,055,684 | $ | 25.03 | |||||
|
Granted
|
13,064,764 | 24.10 | ||||||
|
Vested
|
(3,143,739 | ) | 25.25 | |||||
|
Forfeited
|
(649,850 | ) | 26.75 | |||||
|
Unvested as of December 31, 2010
|
21,326,859 | 24.37 | ||||||
The total grant date fair value of restricted Holding Units that vested during 2010, 2009 and 2008 was $73.4 million, $14.7 million and $2.3 million, respectively.
We recorded compensation expense relating to restricted Holding Unit awards of $93.2 million, $30.5 million and $2.9 million, respectively, for the years ended December 31, 2010, 2009 and 2008. As of December 31, 2010, there was $418.5 million of compensation cost related to unvested restricted Holding Unit awards granted and not yet recognized in the consolidated statement of income. The cost is expected to be recognized over a weighted average period of 3.5 years.
18. Units Outstanding
Changes in units outstanding for the years ended December 31, 2010 and 2009 were as follows:
|
2010
|
2009
|
|||||||
|
Outstanding as of January 1,
|
274,745,592 | 263,717,610 | ||||||
|
Options exercised
|
486,017 | — | ||||||
|
Units issued
|
3,249,861 | 11,030,983 | ||||||
|
Units retired
|
(365,410 | ) | — | |||||
|
Units forfeited
|
(828 | ) | (3,001 | ) | ||||
|
Outstanding as of December 31,
|
278,115,232 | 274,745,592 | ||||||
In accordance with the Holding Partnership Agreement, when Holding issues Holding Units to AllianceBernstein, Holding is required to use the proceeds it receives from AllianceBernstein to purchase the equivalent number of newly-issued AllianceBernstein Units. Holding Units issued pertain to Holding Units newly issued under either the 1997 Plan or the 2010 Plan and could include: (i) restricted Holding Unit awards to independent members of the Board of Directors of the General Partner, (ii) restricted Holding Unit awards to eligible employees, (iii) restricted Holding Unit awards for recruitment, and (iv) restricted Holding Unit issuances in connection with certain employee separation agreements.
On December 14, 2010, we purchased 365,410 AllianceBernstein Units in a private transaction and retired them.
19. Income Taxes
AllianceBernstein is a private partnership for federal income tax purposes and, accordingly, is not subject to federal or state corporate income taxes. However, AllianceBernstein is subject to a 4.0% New York City unincorporated business tax (
“UBT”
). Domestic corporate subsidiaries of AllianceBernstein, which are subject to federal, state and local income taxes, are generally included in the filing of a consolidated federal income tax return with separate state and local income tax returns being filed. Foreign corporate subsidiaries are generally subject to taxes in the foreign jurisdictions where they are located.
In order to preserve AllianceBernstein’s status as a private partnership for federal income tax purposes, AllianceBernstein Units must not be considered publicly traded. The AllianceBernstein Partnership Agreement provides that all transfers of AllianceBernstein Units must be approved by AXA Equitable and the General Partner; AXA Equitable and the General Partner approve only those transfers permitted pursuant to one or more of the safe harbors contained in relevant treasury regulations. If AllianceBernstein Units were considered readily tradable, AllianceBernstein’s net income would be subject to federal and state corporate income tax. Furthermore, should AllianceBernstein enter into a substantial new line of business, Holding, by virtue of its ownership of AllianceBernstein, would lose its status as a “grandfathered” publicly-traded partnership and would become subject to corporate income tax, which would reduce materially Holding’s net income and its quarterly distributions to Holding unitholders.
Earnings before income taxes and income tax expense consist of:
|
Years Ended December 31,
|
||||||||||||
|
2010
|
2009
|
2008
|
||||||||||
|
(in thousands)
|
||||||||||||
|
Earnings before income taxes:
|
||||||||||||
|
United States
|
$ | 382,463 | $ | 539,002 | $ | 669,205 | ||||||
|
Foreign
|
83,159 | 85,483 | 275,024 | |||||||||
|
Total
|
$ | 465,622 | $ | 624,485 | $ | 944,229 | ||||||
|
Income tax expense:
|
||||||||||||
|
Partnership UBT
|
$ | 10,363 | $ | 2,420 | $ | 9,945 | ||||||
|
Corporate subsidiaries:
|
||||||||||||
|
Federal
|
2,570 | 5,550 | 13,713 | |||||||||
|
State and local
|
1,401 | 632 | 1,762 | |||||||||
|
Foreign
|
25,144 | 32,001 | 78,367 | |||||||||
|
Current tax expense
|
39,478 | 40,603 | 103,787 | |||||||||
|
Deferred tax expense (benefit)
|
(955 | ) | 5,374 | (7,984 | ) | |||||||
|
Income tax expense
|
$ | 38,523 | $ | 45,977 | $ | 95,803 | ||||||
The principal reasons for the difference between the effective tax rates and the UBT statutory tax rate of 4.0% are as follows:
|
|
Years Ended December 31,
|
|||||||||||||||||||||||
|
|
2010
|
2009
|
2008
|
|||||||||||||||||||||
|
|
(in thousands)
|
|||||||||||||||||||||||
|
|
||||||||||||||||||||||||
|
UBT statutory rate
|
$ | 18,625 | 4.0 | % | $ | 24,979 | 4.0 | % | $ | 37,769 | 4.0 | % | ||||||||||||
|
Corporate subsidiaries’ federal, state, local and foreign income taxes
|
25,544 | 5.5 | 32,585 | 5.2 | 77,732 | 8.2 | ||||||||||||||||||
|
Effect of ASC 740 adjustments, miscellaneous taxes, and other
|
1,445 | 0.3 | (1,988 | ) | (0.3 | ) | (11,929 | ) | (1.3 | ) | ||||||||||||||
|
Income not taxable resulting from use of UBT business apportionment factors
|
(7,091 | ) | (1.5 | ) | (9,599 | ) | (1.5 | ) | (7,769 | ) | (0.8 | ) | ||||||||||||
|
Income tax expense and effective tax rate
|
$ | 38,523 | 8.3 | $ | 45,977 | 7.4 | $ | 95,803 | 10.1 | |||||||||||||||
We recognize the effects of a tax position in the financial statements only if, as of the reporting date, it is “more likely than not” to be sustained based solely on its technical merits. In making this assessment, we assume that the taxing authority will examine the tax position and have full knowledge of all relevant information.
A reconciliation of the beginning and ending amount of unrecognized tax benefits is as follows:
|
Years Ended December 31,
|
||||||||||||
|
2010
|
2009
|
2008
|
||||||||||
|
(in thousands)
|
||||||||||||
|
Balance as of beginning of period
|
$ | 7,365 | $ | 8,805 | $ | 19,016 | ||||||
|
Additions for prior year tax positions
|
- | 174 | 324 | |||||||||
|
Reductions for prior year tax positions
|
- | - | (603 | ) | ||||||||
|
Additions for current year tax positions
|
823 | 1,182 | 1,649 | |||||||||
|
Reductions for current year tax positions
|
- | (52 | ) | (715 | ) | |||||||
|
Reductions related to closed years/settlements with tax authorities
|
(2,862 | ) | (2,744 | ) | (10,866 | ) | ||||||
|
Balance as of end of period
|
$ | 5,326 | $ | 7,365 | $ | 8,805 | ||||||
The amount of unrecognized tax benefits as of December 31, 2010, 2009 and 2008 when recognized, is recorded as a reduction to income tax expense and reduces the company’s effective tax rate.
Interest and penalties, if any, relating to tax positions are recorded in income tax expense on the consolidated statements of income. The total amount of interest expense (credit) recorded in income tax expense during 2010, 2009 and 2008 was $(0.1) million, $(0.1) million and $(1.4) million, respectively. The total amount of accrued interest recorded on the consolidated statements of financial condition as of December 31, 2010, 2009 and 2008 are $0.7 million, $0.8 million and $0.9 million, respectively. There were no accrued penalties as of December 31, 2010, 2009 or 2008.
The company is generally no longer subject to U.S. federal, or state and local income tax examinations by tax authorities for any year prior to 2007, except as follows. The Internal Revenue Service (
“IRS”
) completed an examination of our domestic corporate subsidiaries’ federal tax returns for 2005 and 2006 in the second quarter of 2009. This examination was settled resulting in a tax payment to the U.S. Treasury in the amount of $0.2 million. The IRS has not indicated whether they will examine our domestic corporate subsidiaries’ federal tax returns for the years subsequent to 2006. The examination of AllianceBernstein’s New York City Partnership tax returns for the years 2003 through 2005 were formerly settled in December 2008. As a result, we recognized approximately $12.1 million of net unrecognized tax benefits, including accrued interest, during the fourth quarter of 2008.
During 2010, the National Tax Agency notified us of an examination of AllianceBernstein’s Japanese subsidiary tax returns for the years 2007 to 2009. The examination commenced in January 2011. The taxing authorities in France have also begun an examination of AllianceBernstein’s French subsidiary tax returns. Both of these examinations are in the preliminary stages and we do not believe an increase in the reserve is necessary. In addition, examination of two AllianceBernstein’s US corporate subsidiaries was initiated in 2010 by state and local tax authorities. We do not believe an increase in the reserve is necessary.
The State of New York began an examination of the Partnership’s tax returns for the years 2005 and 2006 during 2009. This examination remains in progress and we do not believe an increase to the reserve is necessary. In addition, an assessment has been received resulting from a state and local examination of AllianceBernstein’s corporate subsidiary tax returns for years 2001 through 2004. This matter is in the appeal stage, however, we do not believe an increase in the reserve is necessary.
The Canadian Revenue Agency continues their examination of AllianceBernstein’s Canadian subsidiary tax returns for the years 2005-2007. We do not believe an increase to the reserve is necessary. Currently, there are no other income tax examinations at our significant non-U.S. subsidiaries except as noted above. Years that remain open and may be subject to examination vary under local law, and range from one to seven years.
Adjustment to the reserve could occur in light of changing facts and circumstances with respect to aforementioned on-going examinations.
Subject to the results of the examinations for the tax year 2007, under our existing policy for determining whether a tax position is effectively settled for purposes of recognizing previously unrecognized tax benefits, there is the possibility that recognition of unrecognized tax benefits of approximately $2.6 million including accrued interest could occur over the next twelve months.
Deferred income taxes reflect the net tax effect of temporary differences between the carrying amounts of assets and liabilities for financial reporting purposes and the amounts used for income tax purposes. The tax effect of significant items comprising the net deferred tax asset (liability) is as follows:
|
December 31,
|
||||||||
|
2010
|
2009
|
|||||||
|
(in thousands)
|
||||||||
|
Deferred tax asset:
|
|
|
||||||
|
Differences between book and tax basis:
|
|
|
||||||
|
Deferred compensation plans
|
$ | 15,431 | $ | 9,593 | ||||
|
Charge for mutual fund matters, legal proceedings and claims processing contingency
|
— | 71 | ||||||
|
Other, primarily accrued expenses deductible when paid
|
7,183 | 11,489 | ||||||
|
Deferred tax asset
|
22,614 | 21,153 | ||||||
|
Deferred tax liability:
|
||||||||
|
Differences between book and tax basis:
|
||||||||
|
Intangible assets
|
14,575 | 14,056 | ||||||
|
Translation adjustment
|
8,303 | 5,902 | ||||||
|
Other, primarily undistributed earnings of certain foreign subsidiaries
|
2,979 | 4,576 | ||||||
|
Deferred tax liability
|
25,857 | 24,534 | ||||||
|
Net deferred tax liability
|
$ | (3,243 | ) | $ | (3,381 | ) | ||
The deferred tax asset is included in other assets. Management has determined that realization of the deferred tax asset is more likely than not based on anticipated future taxable income.
The company provides income taxes on the undistributed earnings of non-U.S. corporate subsidiaries except to the extent that such earnings are permanently invested outside the United States. As of December 31, 2010, $580.1 million of accumulated undistributed earnings of non-U.S. corporate subsidiaries were permanently invested. At existing applicable income tax rates, additional taxes of approximately $29.0 million, net of foreign tax credits, would need to be provided if such earnings were remitted.
20. Business Segment Information
Management has assessed the requirements of ASC 280,
Segment Reporting
, and determined that, because we utilize a consolidated approach to assess performance and allocate resources, we have only one operating segment. Enterprise-wide disclosures as of and for the years ended, December 31, 2010, 2009 and 2008 were as follows:
Services
Net revenues derived from our investment management, research and related services were as follows:
|
Years Ended December 31,
|
||||||||||||
|
2010
|
2009
|
2008
|
||||||||||
|
(in millions)
|
||||||||||||
|
Institutions
|
$ | 765 | $ | 811 | $ | 1,241 | ||||||
|
Retail
|
1,069 | 888 | 1,227 | |||||||||
|
Private client
|
651 | 590 | 850 | |||||||||
|
Bernstein research services
|
431 | 435 | 472 | |||||||||
|
Other
|
37 | 187 | (239 | ) | ||||||||
|
Total revenues
|
2,953 | 2,911 | 3,551 | |||||||||
|
Less: Interest expense
|
4 | 4 | 37 | |||||||||
|
Net revenues
|
$ | 2,949 | $ | 2,907 | $ | 3,514 | ||||||
Our AllianceBernstein Global High Yield Portfolio, an open-end fund incorporated in Luxembourg (ACATEUH: LX), generated approximately 7% of our investment advisory and service fees and 8% of our net revenues during 2010.
Geographic Information
Net revenues and long-lived assets, related to our U.S. and international operations, as of and for the years ended December 31, were:
|
2010
|
2009
|
2008
|
||||||||||
|
(in millions)
|
||||||||||||
|
Net revenues:
|
||||||||||||
|
United States
|
$ | 1,933 | $ | 2,038 | $ | 2,258 | ||||||
|
International
|
1,016 | 869 | 1,256 | |||||||||
|
Total
|
$ | 2,949 | $ | 2,907 | $ | 3,514 | ||||||
|
Long-lived assets:
|
||||||||||||
|
United States
|
$ | 3,448 | $ | 3,488 | $ | 3,576 | ||||||
|
International
|
74 | 79 | 40 | |||||||||
|
Total
|
$ | 3,522 | $ | 3,567 | $ | 3,616 | ||||||
Major Customers
Company-sponsored mutual funds are distributed to individual investors through broker-dealers, insurance sales representatives, banks, registered investment advisers, financial planners and other financial intermediaries. AXA Advisors, LLC (
“AXA Advisors”
), a wholly-owned subsidiary of AXA Financial that uses members of the AXA Equitable insurance agency sales force as its registered representatives, has entered into a selected dealer agreement with AllianceBernstein Investments and has been responsible for 2%, 2% and 4% of our open-end mutual fund sales in 2010, 2009 and 2008, respectively. During 2010, Nomura Asset Management Co. Ltd., UBS AG and Citibank (or their respective subsidiaries) were responsible for approximately 12%, 6% and 5%, respectively, of our open-end mutual fund sales. Neither AXA nor these unaffiliated companies are under any obligation to sell a specific amount of AllianceBernstein Fund shares and each also sells shares of mutual funds that it sponsors and that are sponsored by unaffiliated organizations.
AXA and the general and separate accounts of AXA Equitable (including investments by the separate accounts of AXA Equitable in the funding vehicle EQ Advisors Trust) accounted for approximately 5% of total revenues for each of the years ended December 31, 2010, 2009 and 2008, respectively. No single institutional client other than AXA and its subsidiaries accounted for more than 1% of total revenues for the years ended December 31, 2010, 2009 and 2008.
21. Related Party Transactions
Mutual Funds
Investment management, distribution, shareholder and administrative, and brokerage services are provided to individual investors by means of retail mutual funds sponsored by our company, our subsidiaries and our affiliated joint venture companies. Substantially all of these services are provided under contracts that set forth the services to be provided and the fees to be charged. The contracts are subject to annual review and approval by each of the mutual funds’ boards of directors or trustees and, in certain circumstances, by the mutual funds’ shareholders. Revenues for services provided or related to the mutual funds are as follows:
|
Years Ended December 31,
|
||||||||||||
|
2010
|
2009
|
2008
|
||||||||||
|
(in thousands)
|
||||||||||||
|
Investment advisory and services fees
|
$ | 809,387 | $ | 643,953 | $ | 863,624 | ||||||
|
Distribution revenues
|
338,597 | 277,328 | 378,425 | |||||||||
|
Shareholder servicing fees
|
93,148 | 90,141 | 99,022 | |||||||||
|
Other revenues
|
5,726 | 6,962 | 6,868 | |||||||||
|
Bernstein research services
|
121 | 1,138 | 1,233 | |||||||||
AXA and its Subsidiaries
We provide investment management and certain administration services to AXA and its subsidiaries. In addition, AXA and its subsidiaries distribute company-sponsored mutual funds, for which they receive commissions and distribution payments. Sales of company-sponsored mutual funds through AXA and its subsidiaries, excluding cash management products, aggregated approximately $0.5 billion, $0.3 billion and $0.7 billion for the years ended December 31, 2010, 2009 and 2008, respectively. Also, we are covered by various insurance policies maintained by AXA subsidiaries and we pay fees for technology and other services provided by AXA and its subsidiaries that are included in General and Administrative expenses. Aggregate amounts included in the consolidated financial statements for transactions with AXA and its subsidiaries are as follows:
|
Years Ended December 31,
|
||||||||||||
|
2010
|
2009
|
2008
|
||||||||||
|
(in thousands)
|
||||||||||||
|
Revenues:
|
||||||||||||
|
Investment advisory and services fees
|
$ | 135,004 | $ | 131,181 | $ | 181,197 | ||||||
|
Bernstein research services
|
492 | 71 | 225 | |||||||||
|
Other revenues
|
583 | 568 | 697 | |||||||||
| $ | 136,079 | $ | 131,820 | $ | 182,119 | |||||||
|
Expenses:
|
||||||||||||
|
Commissions and distribution payments to financial intermediaries
|
$ | 6,896 | $ | 6,918 | $ | 9,408 | ||||||
|
Other promotion and servicing
|
2,143 | 1,935 | 703 | |||||||||
|
General and administrative
|
21,256 | 17,285 | 13,843 | |||||||||
| $ | 30,295 | $ | 26,138 | $ | 23,954 | |||||||
|
Balance Sheet:
|
||||||||||||
|
Institutional investment advisory and services fees receivable
|
$ | 18,654 | $ | 11,287 | $ | 7,349 | ||||||
|
Other due (to) from AXA and its subsidiaries
|
(4,732 | ) | (3,888 | ) | (2,679 | ) | ||||||
| $ | 13,922 | $ | 7,399 | $ | 4,670 | |||||||
AllianceBernstein and AXA Asia Pacific Holdings Limited (
“AXA Asia Pacific”
) own an investment management company and we include its financial results in our consolidated results of operations. Investment advisory and services fees earned by this company were approximately $37.1 million, $40.9 million and $68.3 million, for the years ended December 31, 2010, 2009 and 2008, respectively, of which approximately $12.8 million, $14.0 million and $19.6 million, respectively, were from AXA affiliates and are included in the table above. Minority interest recorded for this company was $3.6 million, $3.7 million and $9.7 million for the years ended December 31, 2010, 2009 and 2008, respectively.
AllianceBernstein Venture Fund I, L.P. was launched during 2006. It seeks to achieve its investment objective, which is long-term capital appreciation through equity and equity-related investments, by acquiring early-stage growth companies in private transactions. One of our subsidiaries is the general partner of the fund and, as a result, the fund is included in our consolidated financial statements, with approximately $101 million, $163 million and $167 million of investments on the consolidated statement of financial condition as of December 31, 2010, 2009 and 2008, respectively. AXA Equitable holds a 10% limited partnership interest in this fund.
The General Partner is obligated to make capital contributions to AllianceBernstein in amounts equal to benefits paid under the Capital Accumulation Plan and the Contractual Arrangements (
see Note 16
). Amounts paid by the General Partner to AllianceBernstein for the Capital Accumulation Plan and the Contractual Arrangements for the years ended December 31, 2010, 2009 and 2008 was $4.9 million.
Other Related Parties
The consolidated statements of financial condition include a net receivable or payable from Holding as a result of cash transactions for fees and expense reimbursements. The net balance included in the consolidated statements of financial condition as of December 31, 2010, 2009 and 2008 are as follows:
|
December 31,
|
||||||||||||
|
2010
|
2009
|
2008
|
||||||||||
|
(in thousands)
|
||||||||||||
|
|
|
|
||||||||||
|
Due to Holding, net
|
$ | 1,277 | $ | — | $ | — | ||||||
|
Due from Holding, net
|
$ | — | $ | 1,484 | $ | 4,825 | ||||||
22. Comprehensive Income
Comprehensive income consisted of:
|
Years Ended December 31,
|
||||||||||||
|
2010
|
2009
|
2008
|
||||||||||
|
(in thousands)
|
||||||||||||
|
Net income
|
$ | 427,099 | $ | 578,508 | $ | 848,426 | ||||||
|
Other comprehensive income (loss), net of tax:
|
||||||||||||
|
Unrealized gains (losses) on investments
|
456 | 4,391 | (3,962 | ) | ||||||||
|
Foreign currency translation adjustment
|
2,960 | 43,172 | (100,268 | ) | ||||||||
|
Changes in retirement plan related items
|
(10,088 | ) | 6,955 | (24,763 | ) | |||||||
|
Comprehensive income
|
420,427 | 633,026 | 719,433 | |||||||||
|
Comprehensive loss (income) in consolidated entities attributable to non-controlling interests
|
12,053 | (26,614 | ) | (5,445 | ) | |||||||
|
Comprehensive income attributable to AllianceBernstein Unitholders
|
$ | 432,480 | $ | 606,412 | $ | 713,988 | ||||||
23. Accounting Pronouncements
In January 2010, the FASB issued ASU 2010-06,
Improving Disclosures about Fair Value Measurements
. This standard has two parts, the first of which we adopted on January 1, 2010. The first part required additional disclosures about fair value measurements including transfers in and out of Levels 1 and 2 and a higher level of disaggregation for the different types of financial instruments. The second portion of the standard requires a reconciliation of Level 3 fair value measurements, with information about purchases, sales, issuances and settlements presented separately. The second portion of the standard is effective for fiscal years beginning after December 15, 2010 and is not expected to have a material impact on our consolidated financial statements.
24. Quarterly Financial Data (Unaudited)
|
|
Quarters Ended 2010
|
|||||||||||||||
|
|
December 31
|
September 30
|
June 30
|
March 31
|
||||||||||||
|
|
(in thousands, except per unit amounts)
|
|||||||||||||||
|
|
||||||||||||||||
|
Net revenues
|
$ | 777,561 | $ | 757,567 | $ | 688,343 | $ | 725,086 | ||||||||
|
Net income attributable to AllianceBernstein Unitholders
|
$ | 136,519 | $ | 51,515 | $ | 106,119 | $ | 148,266 | ||||||||
|
Basic net income per AllianceBernstein Unit
(1)
|
$ | 0.49 | $ | 0.19 | $ | 0.38 | $ | 0.53 | ||||||||
|
Diluted net income per AllianceBernstein Unit
(1)
|
$ | 0.49 | $ | 0.18 | $ | 0.38 | $ | 0.53 | ||||||||
|
Cash distributions per AllianceBernstein Unit
(2)
|
$ | 0.49 | $ | 0.18 | $ | 0.38 | $ | 0.53 | ||||||||
|
|
Quarters Ended 2009
|
|||||||||||||||
|
|
December 31
|
September 30
|
June 30
|
March 31
|
||||||||||||
|
|
(in thousands, except per unit amounts)
|
|||||||||||||||
|
|
||||||||||||||||
|
Net revenues
|
$ | 781,861 | $ | 806,014 | $ | 721,440 | $ | 597,564 | ||||||||
|
Net income attributable to AllianceBernstein Unitholders
|
$ | 191,640 | $ | 199,341 | $ | 128,295 | $ | 36,851 | ||||||||
|
Basic net income per AllianceBernstein Unit
(1)
|
$ | 0.71 | $ | 0.74 | $ | 0.48 | $ | 0.14 | ||||||||
|
Diluted net income per AllianceBernstein Unit
(1)
|
$ | 0.70 | $ | 0.74 | $ | 0.48 | $ | 0.14 | ||||||||
|
Cash distributions per AllianceBernstein Unit
(2)
|
$ | 0.70 | $ | 0.74 | $ | 0.48 | $ | 0.14 | ||||||||
_____________
|
(1)
|
Basic and diluted net income per unit are computed independently for each of the periods presented. Accordingly, the sum of the quarterly net income per unit amounts may not agree to the total for the year.
|
|
(2)
|
Declared and paid during the following quarter.
|
Report of Independent Registered Public Accounting Firm
To
the General Partner and Unitholders
AllianceBernstein L.P.:
In our opinion, the accompanying consolidated statements of financial condition and the related consolidated statements of income, changes in partners’ capital and comprehensive income and cash flows present fairly, in all material respects, the financial position of AllianceBernstein L.P. and its subsidiaries (“AllianceBernstein”) at December 31, 2010 and 2009, and the results of their operations and their cash flows for each of the three years in the period ended December 31, 2010 in conformity with accounting principles generally accepted in the United States of America. Also in our opinion, AllianceBernstein maintained, in all material respects, effective internal control over financial reporting as of December 31, 2010, based on criteria established in
Internal Control-Integrated Framework
issued by the Committee of Sponsoring Organizations of the Treadway Commission (COSO). AllianceBernstein’s management is responsible for these financial statements, for maintaining effective internal control over financial reporting and for its assessment of the effectiveness of internal control over financial reporting, included in
Management’s Report on Internal Control over Financial Reporting
appearing under Item 9A. Our responsibility is to express opinions on these financial statements and on AllianceBernstein’s internal control over financial reporting based on our integrated audits. We conducted our audits in accordance with the standards of the Public Company Accounting Oversight Board (United States). Those standards require that we plan and perform the audits to obtain reasonable assurance about whether the financial statements are free of material misstatement and whether effective internal control over financial reporting was maintained in all material respects. Our audits of the financial statements included examining, on a test basis, evidence supporting the amounts and disclosures in the financial statements, assessing the accounting principles used and significant estimates made by management, and evaluating the overall financial statement presentation. Our audit of internal control over financial reporting included obtaining an understanding of internal control over financial reporting, assessing the risk that a material weakness exists, and testing and evaluating the design and operating effectiveness of internal control based on the assessed risk. Our audits also included performing such other procedures as we considered necessary in the circumstances. We believe that our audits provide a reasonable basis for our opinions.
A company’s internal control over financial reporting is a process designed to provide reasonable assurance regarding the reliability of financial reporting and the preparation of financial statements for external purposes in accordance with generally accepted accounting principles. A company’s internal control over financial reporting includes those policies and procedures that (i) pertain to the maintenance of records that, in reasonable detail, accurately and fairly reflect the transactions and dispositions of the assets of the company; (ii) provide reasonable assurance that transactions are recorded as necessary to permit preparation of financial statements in accordance with generally accepted accounting principles, and that receipts and expenditures of the company are being made only in accordance with authorizations of management and directors of the company; and (iii) provide reasonable assurance regarding prevention or timely detection of unauthorized acquisition, use, or disposition of the company’s assets that could have a material effect on the financial statements.
Because of its inherent limitations, internal control over financial reporting may not prevent or detect misstatements. Also, projections of any evaluation of effectiveness to future periods are subject to the risk that controls may become inadequate because of changes in conditions, or that the degree of compliance with the policies or procedures may deteriorate.
|
/s/ PricewaterhouseCoopers LLP
|
New York, New York
February 10, 2011
|
Item
9.
|
Changes in and Disagreements with Accountants on Accounting and Financial Disclosure
|
Neither AllianceBernstein nor Holding had any changes in or disagreements with accountants in respect of accounting or financial disclosure.
|
Item
9A.
|
Controls and Procedures
|
Disclosure Controls and Procedures
Each of Holding and AllianceBernstein maintains a system of disclosure controls and procedures that is designed to ensure that information required to be disclosed in our reports under the Exchange Act is (i) recorded, processed, summarized and reported in a timely manner, and (ii) accumulated and communicated to management, including the Chief Executive Officer and the Chief Financial Officer, to permit timely decisions regarding our disclosure.
As of the end of the period covered by this report, management carried out an evaluation, under the supervision and with the participation of the Chief Executive Officer and the Chief Financial Officer, of the effectiveness of the design and operation of disclosure controls and procedures. Based on this evaluation, the Chief Executive Officer and the Chief Financial Officer concluded that the disclosure controls and procedures are effective.
Management’s Report on Internal Control Over Financial Reporting
Management acknowledges its responsibility for establishing and maintaining adequate internal control over financial reporting for each of Holding and AllianceBernstein.
Internal control over financial reporting is a process designed by, or under the supervision of, a company’s principal executive officer and principal financial officer, to provide reasonable assurance regarding the reliability of financial reporting and the preparation of financial statements for external purposes in accordance with U.S. generally accepted accounting principles (“GAAP”) and includes those policies and procedures that:
|
|
•
|
Pertain to the maintenance of records that, in reasonable detail, accurately and fairly reflect the transactions and dispositions of the assets of the company;
|
|
|
•
|
Provide reasonable assurance that transactions are recorded as necessary to permit preparation of financial statements in accordance with GAAP and receipts and expenditures of the company are being made only in accordance with authorizations of management and directors of the company; and
|
|
|
•
|
Provide reasonable assurance regarding prevention or timely detection of unauthorized acquisition, use or disposition of the company’s assets that could have a material effect on the financial statements.
|
All internal control systems, no matter how well designed, have inherent limitations. Therefore, even those internal control systems determined to be effective can provide only reasonable assurance with respect to the reliability of financial statement preparation and presentation. Because of these inherent limitations, internal control over financial reporting may not prevent or detect misstatements. Projections of any evaluation of effectiveness of internal control to future periods are subject to the risk that controls may become inadequate because of changes in conditions, or that the degree of compliance with the policies or procedures may deteriorate.
Management assessed the effectiveness of Holding’s and AllianceBernstein’s internal control over financial reporting as of December 31, 2010. In making its assessment, management used the criteria set forth by the Committee of Sponsoring Organizations of the Treadway Commission in
Internal Control-Integrated Framework
(
“COSO criteria”
).
Based on its assessment, management concluded that, as of December 31, 2010, each of Holding and AllianceBernstein maintained effective internal control over financial reporting based on the COSO criteria.
PricewaterhouseCoopers LLP, the independent registered public accounting firm that audited the 2010 financial statements included in this Form 10-K, has issued an attestation report on the effectiveness of each of Holding’s and AllianceBernstein’s internal control over financial reporting as of December 31, 2010. These reports can be found
in Item 8
.
Changes in Internal Control Over Financial Reporting
No change in our internal control over financial reporting occurred during the fourth quarter of 2010 that materially affected, or is reasonably likely to materially affect, our internal control over financial reporting.
|
Item
9B.
|
Other Information
|
Both AllianceBernstein and Holding reported all information required to be disclosed on Form 8-K during the fourth quarter of 2010.
|
Item
10.
|
Directors, Executive Officers and Corporate Governance
|
General Partner
The Partnerships’ activities are managed and controlled by the General Partner. The Board of the General Partner (
“Board”
) acts as the Board of each of the Partnerships. The General Partner has agreed that it will conduct no active business other than managing the Partnerships, although it may make certain investments for its own account. Neither AllianceBernstein Unitholders nor Holding Unitholders have any rights to manage or control the Partnerships, or to elect directors of the General Partner. The General Partner is an indirect, wholly-owned subsidiary of AXA.
The General Partner does not receive any compensation from the Partnerships for services rendered to them as their general partner. The General Partner holds a 1% general partnership interest in AllianceBernstein and 100,000 units of general partnership interest in Holding. Each general partnership unit in Holding is entitled to receive distributions equal to those received by each Holding Unit.
The General Partner is entitled to reimbursement by AllianceBernstein for any expenses it incurs in carrying out its activities as general partner of the Partnerships, including compensation paid by the General Partner to its directors and officers (to the extent such persons are not compensated directly by AllianceBernstein).
Board of Directors
Our Board currently consists of 14 members, including our Chief Executive Officer, six senior executives of AXA and certain of its other subsidiaries, one former senior executive of AXA Financial, and six independent members. While we do not have a formal, written diversity policy in place, we believe that an effective board consists of a diverse group of individuals who bring together a variety of complementary skills and perspectives with a view towards having a board with the needed leadership and experience to successfully guide our Company. As set forth in its charter, the Corporate Governance Committee of the Board (
“Governance Committee”
) assists the Board in identifying and evaluating such candidates, determining Board composition, developing and monitoring a process to assess Board effectiveness, developing and implementing corporate governance guidelines, and reviewing programs relating to matters of corporate responsibility.
As indicated below, our directors have a combined wealth of leadership experience derived from extensive service leading large, complex organizations in their roles as either senior executives or board members and in government and academia. Each has the integrity, business judgment, collegiality and commitment that are among the essential characteristics for a member of our Board. Collectively, they have substantive knowledge and skills applicable to our business, including expertise in the regulatory; public accounting and financial reporting; finance; risk management; business development; operations; strategic planning; management development, succession planning and compensation; corporate governance; investor relations; public policy; international; and financial services areas.
As of February 10, 2011, the members of the Board were as follows:
Peter S. Kraus
Mr. Kraus, age 58, was elected Chairman of the Board of the General Partner and Chief Executive Officer of the General Partner, AllianceBernstein and Holding in December 2008. Mr. Kraus has in-depth experience in the financial markets, including investment banking, asset management and private wealth management. He served as an executive vice president, the head of global strategy and a member of the Management Committee of Merrill Lynch & Company Inc. (
“Merrill Lynch”
) from September 2008 through December 2008. Mr. Kraus spent 22 years with Goldman Sachs Group Inc. (
“Goldman”
), where he most recently served as co-head of the Investment Management Division and a member of the Management Committee, as well as head of firm-wide strategy and chairman of the Strategy Committee. Mr. Kraus also served as co-head of the Financial Institutions Group. He was named a partner at Goldman in 1994 and managing director in 1996. In April 2010, Mr. Kraus was appointed a member of the Management Committee of AXA, which was formed by Mr. de Castries in April 2010 to assist him with the operational management of AXA. He was named a Director of AXA Financial, Inc. (a wholly-owned subsidiary of AXA,
“AXA Financial”
), AXA Equitable, MONY Life Insurance Company (a wholly-owned subsidiary of AXA Financial,
“MONY”
) and MONY Life Insurance Company of America (a wholly-owned subsidiary of MONY,
“MLOA”
) in February 2009. He is not compensated for serving in these roles for AXA and its subsidiaries. Mr. Kraus is also Chairman of the Investment Committee of Trinity College, Chairman of the Board of Overseers of CalArts, Co-Chair of the Friends of the Carnegie International, a member of the board of directors of Lincoln Center for the Performing Arts and the chairman of Lincoln Center’s Art Committee, a member of the board of Keewaydin Camp, and a member of the board of Young Audiences, Inc., a non-profit organization that works with educational systems, the arts community and private and public sectors to provide arts education to children.
Mr. Kraus brings to the Board extensive knowledge of our industry and in-depth experience in the financial markets, including experience as co-head of the Investment Management Division and head of firm-wide strategy at Goldman.
Dominique Carrel-Billiard
Mr. Carrel-Billiard, age 44, was elected a Director of the General Partner in July 2004. He has been Chief Executive Officer of AXA Investment Managers S.A. (
“AXA IM”
), a subsidiary of AXA, since June 2006 and was named to the AXA Group Executive Committee in January 2009. He joined AXA in June 2004 as the Senior Vice President-Business Support and Development in charge of AXA Financial, asset management and reinsurance. Prior to joining AXA, Mr. Carrel-Billiard was a Partner of McKinsey & Company (
“McKinsey”
), a strategic consulting firm, where he specialized in the financial services industry. During the 12 years he spent at McKinsey, Mr. Carrel-Billiard worked on a broad array of topics (including insurance, asset gathering and management, and corporate and investment banking) for the top management of international banks, insurance companies, including AXA, and other financial services groups. Mr. Carrel-Billiard is a member of the boards of directors of various other privately-held subsidiaries and affiliates of the AXA Group.
Mr. Carrel-Billiard brings to the Board extensive financial services and strategic planning experience, as well as a strong global perspective as the Chief Executive Officer of AXA IM, an asset management firm and subsidiary of AXA.
Christopher M. Condron
Mr. Condron, age 63, was elected a Director of the General Partner in May 2001.
Formerly Director, President and Chief Executive Officer of AXA Financial since May 2001, he retired from his AXA positions effective January 1, 2011. Prior to retiring, he was also Chairman of the Board, Chief Executive Officer and President of AXA Equitable and a member of the Management Committee of AXA. In addition, Mr. Condron was Chairman of the Board, President and Chief Executive Officer of MONY and MLOA, which AXA Financial acquired in July 2004. During 2010, he assumed the additional responsibility of overseeing AXA’s Global Life & Savings and Health businesses. Prior to joining AXA Financial, Mr. Condron served as both President and Chief Operating Officer of Mellon Financial Corporation (
“Mellon”
), from 1999, and as Chairman and Chief Executive Officer of The Dreyfus Corporation, a subsidiary of Mellon, from 1995. Mr. Condron has been a member of the Board of Directors of Keefe Bruyette & Woods, Inc. (NYSE: KBW), a full-service investment bank and broker-dealer, since January 2007. He also serves as Chairman of Keefe Bruyette & Woods's compensation committee and as a member of its audit committee and its corporate governance and nominating committee. Mr. Condron is also a member of the board of directors of the Financial Services Round Table.
Mr. Condron brings to the Board extensive financial services, insurance, sales and sell-side experience achieved from his service to AXA and Mellon, as well as his directorship at Keefe Bruyette & Woods.
Henri de Castries
Mr. de Castries, age 56, was elected a Director of the General Partner in October 1993. In April 2010, in connection with a change in AXA’s governance structure from dual boards (the Supervisory Board and the Management Board) to a single Board of Directors, Mr. de Castries was appointed Chairman and Chief Executive Officer of AXA. From May 2000 up until the change in governance, Mr. de Castries was Chairman of the AXA Management Board. Prior thereto, he served AXA in various capacities, including Vice Chairman of the AXA Management Board; Senior Executive Vice President-Financial Services and Life Insurance Activities in the United States, Germany, the United Kingdom and Benelux from 1996 to 2000; Senior Executive Vice President-Financial Services and Life Insurance Activities from 1993 to 1996; Corporate Secretary from 1991 to 1993; and Central Director of Finances from 1989 to 1991. Before joining AXA, Mr. de Castries was part of the French Finance Ministry Inspection Office. He is a director or officer of AXA Financial, AXA Equitable and various other subsidiaries and affiliates of the AXA Group. Mr. de Castries was elected Vice Chairman of AXA Financial in February 1996 and was elected Chairman of AXA Financial in April 1998.
Mr. de Castries brings to the Board his extensive experience as an AXA executive and, prior thereto, his financial and public sector experience gained from working in French government. The Board also benefits from his invaluable perspective as the Chairman and Chief Executive Officer of AXA.
Denis Duverne
Mr. Duverne, age 57, was elected a Director of the General Partner in February 1996. In April 2010, he was appointed the Deputy Chief Executive Officer of AXA and a member of the Board of Directors of AXA. In January 2010, he was selected to oversee AXA Group strategy, finance and operations with AXA’s Chief Operating Officer, Chief Financial Officer and Chief Risk Officer reporting to him. Mr. Duverne was a member of the AXA Management Board from February 2003 until AXA’s change in governance in April 2010. He was Chief Financial Officer of AXA from May 2003 through December 2009. From January 2000 to May 2003, Mr. Duverne served as Group Executive Vice President-Finance, Control and Strategy. Mr. Duverne joined AXA as Senior Vice President in 1995. He is a Director of AXA Financial, AXA Equitable and various other subsidiaries and affiliates of the AXA Group.
Mr. Duverne brings to the Board the highly diverse experience he has garnered throughout the years from the many key roles he has served for AXA.
Richard S. Dziadzio
Mr. Dziadzio, age 47, was re-elected a Director of the General Partner in May 2007. (He had previously served on the Board from February 2001 to May 2004.) The Chief Financial Officer of AXA Financial and AXA Equitable since January 2007, Mr. Dziadzio was elected Senior Executive Vice President of AXA Equitable in January 2010. He joined AXA Financial and AXA Equitable in July 2004 and was elected Executive Vice President in September 2004. He became Deputy Chief Financial Officer of AXA Financial and AXA Equitable in September 2005. Prior to joining AXA Financial, Mr. Dziadzio held various positions with subsidiaries and affiliates of the AXA Group, which he originally joined in 1994 as a senior analyst in the corporate finance department, working primarily on mergers and acquisitions (
“M&A”
). In 1997, he was promoted to corporate finance officer, handling corporate finance activities for the group in insurance and asset management in the U.S. and U.K. In 1998, Mr. Dziadzio became head of finance and administration for AXA Real Estate Investment Managers, a subsidiary of AXA. From February 2001 to June 2004, he was responsible for business support and development for AXA Financial, AllianceBernstein and AXA IM.
Mr. Dziadzio brings to the Board financial, M&A and investment expertise from the various diverse positions he has held within AXA’s family of companies. As a former Business Support and Development representative, he also brings to the Board expertise on how our Company can operate most efficiently and consistently with AXA’s overall objectives and strategy.
Steven G. Elliott
Mr. Elliott, age 64, was elected a Director of the General Partner in January 2011. Until his retirement in December 2010, Mr. Elliott had served as Senior Vice Chairman of The Bank of New York Mellon (
“BNY Mellon”
) since 1998. In this role, he helped oversee numerous company-wide growth initiatives and co-headed the integration of The Bank of New York and Mellon from 2007 to 2009. Mr. Elliott was Chief Financial Officer of Mellon from 1990 to 2002 and Head of Finance from 1987 to 1990, while also leading some of Mellon’s diverse lines of business, including asset servicing, securities lending, global cash management and institutional banking. Before joining BNY Mellon, he held senior positions at First Commerce Corporation (1986-87), Crocker National Bank (1984-86), Continental Illinois National Bank (1977-84) and United California Bank (1974-77). A certified public accountant since 1973, Mr. Elliott is a member of the American Institute of Certified Public Accountants and the Financial Executives Institute. Since January 2011, he has been a member of the boards of directors of Huntington Bancshares Inc. (NYSE: HBAN) and PPL Corporation (NYSE: PPL). Mr. Elliott served as a director of Mellon (NYSE: MEL) from 2001 to the July 2007 merger with The Bank of New York and then as a director of BNY Mellon (NYSE: BK) through July 2008.
Mr. Elliott, who joins our Board as an audit committee financial expert, brings to the Board the four decades of auditing and banking expertise he gained in the financial services industry.
Deborah S. Hechinger
Ms. Hechinger, age 60, was elected a Director of the General Partner in May 2007. Currently an independent consultant on non-profit governance, she was President and Chief Executive Officer of BoardSource, a leading governance resource for non-profit organizations, from 2003 to 2007. From 2004 to 2007, Ms. Hechinger also served as co-convener of the Governance and Fiduciary Responsibilities work group, one of the five groups established by the Panel on the Nonprofit Sector to make recommendations to Congress on ways to improve the governance and accountability of non-profit organizations. She also served on the Advisory Board for the Center for Effective Philanthropy and was a Member of the Ethics and Accountability Committee at Independent Sector. Prior to joining BoardSource, Ms. Hechinger was the Executive Vice President of the World Wildlife Fund, a large, global conservation organization, where she oversaw all fundraising, communication and operations activities. She has also served as a Deputy Comptroller and as Director of the Securities and Corporate Practices Division at the Office of the Comptroller of the Currency and has held senior executive positions in the Division of Enforcement at the SEC. A graduate of Georgetown Law School, Ms. Hechinger has been a member in good standing of the District of Columbia Bar Association since 1975.
Ms. Hechinger brings to the Board the significant knowledge of corporate governance matters and public policy she has achieved through her extensive experience in both the private and public sectors.
Weston M. Hicks
Mr. Hicks, age 54, was elected a Director of the General Partner in July 2005. He has been a Director and the President and chief executive officer of Alleghany Corporation (NYSE: Y,
“Alleghany”
), an insurance and diversified financial services holding company, since December 2004 and was Executive Vice President of Alleghany from October 2002 until December 2004. From March 2001 through October 2002, Mr. Hicks was Executive Vice President and Chief Financial Officer of The Chubb Corporation.
Mr. Hicks brings to the Board extensive financial expertise, including his unique perspective as the chief executive officer of an unaffiliated publicly-traded company, his background as a professional investor and CFA charter holder, and his ten years of experience as an equity research analyst.
Kevin Molloy
Mr. Molloy, age 40, was elected a Director of the General Partner in January 2011. He has been the Business Support and Development representative for AXA Equitable, AXA IM and AllianceBernstein since January 2011. From April 2010 to December 2010, Mr. Molloy was the Chief Financial Officer of AXA Global Life, a company formed by AXA to accelerate global synergies throughout its Life & Savings business. Prior to serving in this role, he was Senior Vice President of Distribution & Service Finance at AXA Equitable. From November 2003 to April 2007, Mr. Molloy served as Vice President and Head of AXA’s North American Investor Relations office. Mr. Molloy joined AXA Equitable in 1999 as Director of Corporate Finance after beginning his career in 1993 as an economist and corporate profits analyst with The United States Department of Commerce’s Bureau of Economic Analysis.
Mr. Molloy brings to the Board the finance and investor relations experience he has developed through the key roles he has served for AXA and the in-depth knowledge of global economies he gained while working for the U.S. government.
Mark Pearson
Mr. Pearson, age 52, was elected a Director of the General Partner in February 2011. On February 11, 2011, he will succeed Mr. Condron as Director, President and Chief Executive Officer of AXA Financial, and as Chairman and Chief Executive Officer of AXA Equitable. Mr. Pearson is a member of the Executive Committee and the Management Committee of AXA, which he joined in 1995 when AXA acquired National Mutual Funds Management Limited (presently AXA Asia Pacific Holdings Limited). He was appointed Regional Chief Executive of AXA Asia Life in 2001 and, in 2008, was named President and Chief Executive Officer of AXA Japan Holding Co., Ltd. and AXA Life Insurance Co., Ltd. Prior to joining AXA, Mr. Pearson spent approximately 20 years in the insurance sector, holding several senior management positions at National Mutual and Friends Provident.
Mr. Pearson brings to the Board the in-depth knowledge of Asian markets and diverse experience he has developed through the key roles he has served for AXA.
Lorie A. Slutsky
Ms. Slutsky, age 58, was elected a Director of the General Partner in July 2002. Since January 1990, she has been President and Chief Executive Officer of The New York Community Trust, a community foundation that manages a $2 billion endowment and annually grants more than $150 million to non-profit organizations. Ms. Slutsky is Treasurer and a board member of the Independent Sector and co-chaired its National Panel on the Non-Profit Sector, which focused on reducing abuse and improving governance practices at non-profits. She served on the Board of Directors of BoardSource from 1999 to 2008 and served as its Chair from 2005 to 2007. Ms. Slutsky also served as Trustee and Chair of the Budget Committee of Colgate University from 1989 to 1997 and as Chair of the Council on Foundations from 1989 to 1995. She has been a Director of AXA Financial (as well as a member of its Audit Committee and Organization and Compensation Committee), AXA Equitable, MONY and MLOA since September 2006.
Ms. Slutsky brings to the Board extensive corporate governance experience achieved through her executive and managerial roles at The New York Community Trust, BoardSource and various other non-profit organizations. She also brings valuable insight gained from serving on boards and board committees at certain of our parent companies.
A.W. (Pete) Smith, Jr.
Mr. Smith, age 67, was elected a Director of the General Partner in July 2005. The former CEO of Watson Wyatt Worldwide (now Towers Watson), he was also President of the Private Sector Council, a non-profit public service organization dedicated to improving the efficiency of the federal government, from September 2000 until May 2005. Mr. Smith has been President of Smith Compensation Consulting, a privately-held company specializing in executive compensation consulting, since June 2005.
Mr. Smith brings to the Board extensive financial services expertise, compensation expertise and leadership skills obtained through his wealth of experience as Towers Watson’s chief executive and the head of his own firm.
Peter J. Tobin
Mr. Tobin, age 66, was elected a Director of the General Partner in May 2000. From September 2003 to June 2005, he was Special Assistant to the President of St. John’s University. Prior thereto, Mr. Tobin served as Dean of the Tobin College of Business of St. John’s University from August 1998 to September 2003. As Dean, Mr. Tobin was the chief executive and academic leader of the College of Business. Mr. Tobin was Chief Financial Officer at The Chase Manhattan Corporation from 1996 to 1997. Prior thereto, he was Chief Financial Officer of Chemical Bank (which merged with Chase in 1996) from 1991 to 1996 and Chief Financial Officer of Manufacturers Hanover Trust (which merged with Chemical in 1991) from 1985 to 1991. Mr. Tobin has served on the board of directors of CIT Group Inc. (NYSE: CIT) since 1985 (except for one year during which CIT Group was owned by Tyco). He has been a Director of AXA Financial and AXA Equitable since March 1999 and also serves on AXA Financial’s Audit Committee, Investment Committee, Investment and Finance Committee, Organization and Compensation Committee, and Executive Committee.
Mr. Tobin brings to the Board invaluable expertise as an audit committee financial expert and key leadership and analytical skills from his positions in academia.
Executive Officers (other than Mr. Kraus)
Laurence E. Cranch, General Counsel
Mr. Cranch, age 64, has been our General Counsel since he joined our firm in 2004. Prior to joining AllianceBernstein, Mr. Cranch was a partner of Clifford Chance, an international law firm. Mr. Cranch joined Clifford Chance in 2000 when Rogers & Wells, a New York law firm of which he was Managing Partner, merged with Clifford Chance.
Edward J. Farrell, Controller and Interim Chief Financial Officer
Mr. Farrell, age 50, joined our firm in 2003 as Senior Vice President and Controller. He was appointed our firm’s Interim Chief Financial Officer in January 2011. Mr. Farrell also serves as the Chief Financial Officer of SCB LLC. From 1994 to 2003, he worked at Nomura Securities International, Inc. (
“Nomura”
) where he was a Managing Director and held various senior finance positions, including Chief Financial Officer. Prior to joining Nomura, Mr. Farrell spent 10 years in various finance positions at Salomon Brothers Inc. A Certified Public Accountant, he also worked at PricewaterhouseCoopers LLP.
James A. Gingrich, Chairman and Chief Executive Officer of SCB LLC
Mr. Gingrich, age 52, joined our firm in 1999 as a senior research analyst on the sell-side and has been Chairman and Chief Executive Officer of SCB LLC since February 2007. Prior to becoming Chairman and CEO of SCB LLC, Mr. Gingrich had served as Global Director of Research from December 2002 to January 2007.
Lori A. Massad, Head—Human Capital and Chief Talent Officer
Ms. Massad, age 46, joined our firm in 2006 as Chief Talent Officer. In February 2009, her role was expanded to include oversight of Human Capital in addition to Talent Development. Prior to joining our firm, Ms. Massad served as Chief Talent Officer and Chief Operating Officer at Marakon Associates, a strategy consulting firm from 2004 to 2006. Before Marakon, Ms. Massad was a founding member of two start-ups: Spencer Stuart Talent Network (in 2001) and EmployeeMatters, a human resources outsourcing firm (in 2000). Before that, she spent eight years at The Boston Consulting Group, where she became a senior manager on the consulting staff and leader of the firm’s recruiting, training and development programs. While with The Boston Consulting Group, Ms. Massad was also an adjunct professor at New York University’s Leonard Stern School of Business.
David A. Steyn, Chief Operating Officer
Mr. Steyn, age 51, joined our firm in 1999, having been the founding co-Chief Executive Officer of Bernstein’s London office, and has been Chief Operating Officer of AllianceBernstein since July 2009. As COO, the heads of Distribution Services (Institutions, Retail and Private Client) and the heads of Corporate and Fiduciary Services (IT, Operations, and Legal & Compliance) report to him. In addition, he has oversight for our Company’s Alternative Strategies group. Mr. Steyn was the Global Head of Distribution Services from April 2007 through July 2009, prior to which he had been Head of Institutions since November 2003.
Board Meetings
In 2010, the Board held regular quarterly meetings in February, May, July and November; the Board held one special meeting during 2010. Beginning in 2011, the Board will hold six meetings, generally in February, April, May, July or August, September, and November. In addition, the Board holds special meetings or takes action by unanimous written consent as circumstances warrant. The Board has standing Executive, Audit, Corporate Governance, Compensation and Special Committees, each of which
is described in further detail below
. Of the members of the Board, Messrs. Carrel-Billiard and de Castries attended fewer than 75% of the aggregate of all Board and committee meetings which each was entitled to attend in 2010.
Committees of the Board
In 2010, the Executive Committee of the Board (
“Executive Committee”
) was composed of Ms. Slutsky and Messrs. Condron, Duverne, Kraus (Chair) and Tobin. In February 2011, the Board elected Mr. de Castries as an additional member. The Executive Committee exercises all of the powers and authority of the Board (with limited exceptions) when the Board is not in session, or when it is impractical to assemble the full Board. The Executive Committee held two meetings in 2010.
In 2010, the Governance Committee was composed of Mr. Condron, Ms. Hechinger (Chair), Mr. Kraus and Ms. Slutsky. In February 2011, the Board elected Mr. Duverne as an additional member. The Governance Committee (i) assists the Board and the sole stockholder of the General Partner in (1) identifying and evaluating qualified individuals to become Board members and (2) determining the composition of the Board and its committees, and (ii) assists the Board in (1) developing and monitoring a process to assess Board effectiveness, (2) developing and implementing our corporate governance guidelines and (3) reviewing our policies and programs that relate to matters of corporate responsibility of the General Partner and the Partnerships. The Governance Committee held three meetings in 2010.
In 2010, the Audit Committee of the Board (
“Audit Committee”
) was composed of Messrs. Hicks, Smith and Tobin (Chair). In February 2011, the Board elected Mr. Elliott as an additional member. The primary purposes of the Audit Committee are to: (i) assist the Board in its oversight of (1) the integrity of the financial statements of the Partnerships, (2) the Partnerships’ status and system of compliance with legal and regulatory requirements and business conduct, (3) the independent registered public accounting firm’s qualification and independence, and (4) the performance of the Partnerships’ internal audit function; and (ii) oversee the appointment, retention, compensation, evaluation and termination of the Partnerships’ independent registered public accounting firm. Consistent with this function, the Audit Committee encourages continuous improvement of, and fosters adherence to, the Partnerships’ policies, procedures and practices at all levels. With respect to these matters, the Audit Committee provides an open avenue of communication among the independent registered public accounting firm, senior management, the Internal Audit Department and the Board. The Audit Committee held seven meetings in 2010.
In 2010, the Compensation Committee was composed of Mr. Condron (Chair), Mr. Kraus, Ms. Slutsky and Mr. Smith. In February 2011, the Board elected Messrs. de Castries, Duverne and Elliott as additional members. For additional information about the Compensation Committee,
see “Compensation Discussion & Analysis—Compensation Committee” in Executive Compensation
.
The functions of each of the committees discussed above are more fully described in each committee’s charter. The charters are available on our Internet site (
http://www.alliancebernstein.com).
The Special Committee of the Board (
“Special Committee”
) is composed of all of the independent members of the Board and in 2010 included Ms. Hechinger, Mr. Hicks, Ms. Slutsky, Mr. Smith and Mr. Tobin (Chair). As a result of his election to the Board in January 2011, Mr. Elliott is also a member of the Special Committee. The Special Committee has the authority to direct and oversee any matters referred to it by the Board and/or management including, but not limited to, matters relating to conflicts of interest and the relationship among AllianceBernstein, Holding and AXA. The members of the Special Committee do not receive any additional compensation for their service on the Special Committee, apart from the ordinary meeting fees
described in “Director Compensation” in Executive Compensation
. The Special Committee did not meet in 2010.
Audit Committee Financial Experts
In February 2010, the Governance Committee, after reviewing materials prepared by management, recommended that the Board determine that Peter J. Tobin is an “audit committee financial expert” within the meaning of Item 407(d) of Regulation S-K. The Board so determined at its regular meeting in February 2010. The Board also determined at this meeting that each member of the Audit Committee (Messrs. Hicks, Smith and Tobin) is financially literate and possesses accounting or related financial management expertise, as contemplated by Section 303A.07(a) of the NYSE Listed Company Manual.
In January 2011, the Governance Committee, after reviewing materials prepared by management, recommended that the Board determine that each of Steven G. Elliott and Peter J. Tobin is an “audit committee financial expert” within the meaning of Item 407(d) of Regulation S-K. The Board so determined at its regular meeting in February 2011. The Board also determined at this meeting that each member of the Audit Committee (Messrs. Elliott, Hicks, Smith and Tobin) is financially literate and possesses accounting or related financial management expertise, as contemplated by Section 303A.07(a) of the NYSE Listed Company Manual.
Independence of Certain Directors
In February 2010, the Governance Committee, after reviewing materials prepared by management, recommended that the Board determine that each of Ms. Hechinger, Mr. Hicks, Ms. Slutsky, Mr. Smith and Mr. Tobin is “independent” within the meaning of Section 303A.02 of the NYSE Listed Company Manual. The Board considered immaterial relationships of Ms. Hechinger (relating to her service as an executive officer of BoardSource concurrently with Ms. Slutsky serving as that company’s Chairperson), Mr. Hicks (relating to Alleghany Corporation being a client of SCB LLC and Mr. Hicks having been employed by Bernstein from 1991 to 1999), Ms. Slutsky (relating to contributions formerly made by AllianceBernstein to The New York Community Trust, of which she is President and Chief Executive Officer, and the fact that she is a member of the boards of directors of AXA Financial and AXA Equitable) and Mr. Tobin (relating to the fact that, like Ms. Slutsky, he is a member of the boards of directors of AXA Financial and AXA Equitable.) and then determined, at its February 2010 regular meeting, that each of Ms. Hechinger, Mr. Hicks, Ms. Slutsky, Mr. Smith and Mr. Tobin is independent within the meaning of the relevant rules.
In January 2011, the Governance Committee, after reviewing materials prepared by management, recommended that the Board determine that each of Mr. Elliott, Ms. Hechinger, Mr. Hicks, Ms. Slutsky, Mr. Smith and Mr. Tobin is “independent” within the meaning of Section 303A.02 of the NYSE Listed Company Manual. The Board considered immaterial relationships of Mr. Elliott (relating to AllianceBernstein and its family of mutual funds being clients of BNY Mellon and Mr. Elliott’s equity stake in BNY Mellon), Mr. Hicks (relating to Alleghany Corporation being a client of SCB LLC and Mr. Hicks having been employed by Bernstein from 1991 to 1999), Ms. Slutsky (relating to contributions formerly made by AllianceBernstein to The New York Community Trust, of which she is President and Chief Executive Officer, and the fact that she is a member of the boards of directors of AXA Financial and AXA Equitable) and Mr. Tobin (relating to the fact that, like Ms. Slutsky, he is a member of the boards of directors of AXA Financial and AXA Equitable) and then determined, at its February 2011 regular meeting, that each of Mr. Elliott, Ms. Hechinger, Mr. Hicks, Ms. Slutsky, Mr. Smith and Mr. Tobin is independent within the meaning of the relevant rules.
Board Leadership Structure and Role in Risk Oversight
Leadership
The Board, together with the Governance Committee, is responsible for reviewing the Board’s leadership structure. In determining the appropriate individual to serve as our Chairman and Chief Executive Officer, the Board and the Governance Committee consider, among other things, the composition of the Board, the role of the Board’s lead director (
discussed more fully below)
, our Company’s strong corporate governance practices, and the challenges and opportunities specific to our Company.
We believe that the positions of Chairman and Chief Executive Officer are best shared by one individual, but only if a company has sufficient counter-balancing governance in place. We see significant value in having the leader in the Board room also manage the affairs of our Company, and we believe any potential doubts as to our Board’s objectivity in evaluating management are offset by the lead independent director we have in place and the fact that the affirmative consent of our largest Unitholder is required in order for any action taken by the Executive Committee or the Compensation Committee to be effective.
Lead Independent Director
Our lead independent director, Peter J. Tobin, was appointed unanimously by our Board in November 2005. He presides at all executive sessions of non-management and independent directors and makes himself available, if requested by Unitholders, for consultation and communication. Interested parties wishing to communicate directly with Mr. Tobin may send an e-mail, with “confidential” in the subject line, to
corporate_secretary@alliancebernstein.com
. Upon receipt, our Corporate Secretary will promptly forward all such e-mails to Mr. Tobin. Interested parties may also address mail to Mr. Tobin in care of Corporate Secretary, AllianceBernstein Corporation, 1345 Avenue of the Americas, New York, NY 10105, and the Corporate Secretary will promptly forward such mail to Mr. Tobin. We have posted this information in the “Management & Governance” section of our Internet site (
http://www.alliancebernstein.com
).
Risk Oversight
The Board, together with the Audit Committee, has oversight for our Company’s risk management framework, both investment risk and operational risk, and is responsible for helping to ensure that our Company’s risks are managed in a sound manner. The Board has delegated to the Audit Committee, which is composed entirely of independent directors, the responsibility to consider our Company’s policies and practices with respect to operational risk assessment and operational risk management, including discussing with management the major financial risk exposures and the steps taken to monitor and control such exposures. The Global Head of Operational and Credit/Counterparty Risk, whose team is responsible for identifying, managing and controlling the array of operational risks inherent in our Company’s business and operations, makes annual reports to the Audit Committee, including an annual risk review which addresses operational risk identification, assessment and monitoring. The Head of Investment Risk, whose expertise encompasses both quantitative research and associated investment risks, reports directly to our Chairman and Chief Executive Officer and makes annual presentations to the Board.
The Board has determined that its leadership and risk oversight are appropriate for our Company. Mr. Kraus’s in-depth knowledge of financial services and extensive executive experience in the investment management industry make him uniquely suited to serve as our Chairman and Chief Executive Officer, while Mr. Tobin’s leadership and expertise have proven invaluable at enhancing the overall functioning of the Board. The Board believes that the combination of a single Chairman and Chief Executive Officer, a lead independent director, the Audit Committee, specialized management teams to handle investment risk and operational risk, and significant involvement from our largest Unitholder (AXA) provide the appropriate leadership to help ensure effective risk oversight by the Board.
Code of Ethics and Related Policies
All of our directors, officers and employees are subject to our Code of Business Conduct and Ethics. The code is intended to comply with Section 303A.10 of the NYSE Listed Company Manual, Rule 204A-1 under the Investment Advisers Act of 1940, as amended, and Rule 17j-1 under the Investment Company Act of 1940, as amended, as well as with recommendations issued by the Investment Company Institute regarding, among other things, practices and standards with respect to securities transactions of investment professionals. The Code of Business Conduct and Ethics establishes certain guiding principles for all of our employees, including sensitivity to our fiduciary obligations and ensuring that we meet those obligations. Our Code of Business Conduct and Ethics may be found in the “Management & Governance” section of our Internet site (
http://www.alliancebernstein.com
).
We have adopted a Code of Ethics for the Chief Executive Officer and Senior Financial Officers, which is intended to comply with Section 406 of the Sarbanes-Oxley Act of 2002 (
“Item 406 Code”
). The Item 406 Code was adopted on October 28, 2004 by the Executive Committee. We intend to satisfy the disclosure requirements under Item 5.05 of Form 8-K regarding certain amendments to, or waivers from, provisions of the Item 406 Code that apply to the Chief Executive Officer, Chief Financial Officer and Controller by posting such information on our Internet site (
http://www.alliancebernstein.com
). To date, there have been no such amendments or waivers.
NYSE Governance Matters
Section 303A.00 of the NYSE Listed Company Manual exempts limited partnerships from compliance with the following sections of the Manual: Section 303A.01 (board must have a majority of independent directors), 303A.04 (corporate governance committee must have only independent directors as its members), and 303A.05 (compensation committee must have only independent directors as its members). Holding is a limited partnership (as is AllianceBernstein). In addition, because the General Partner is a wholly-owned subsidiary of AXA, and the General Partner controls Holding (and AllianceBernstein), we believe we would also qualify for the “controlled company” exemption. Notwithstanding the foregoing, the Board has adopted a Corporate Governance Committee Charter that complies with Section 303A.04 and a Compensation Committee Charter that complies with Section 303A.05. However, not all members of these committees are independent.
Our Corporate Governance Guidelines (
“Guidelines”
) promote the effective functioning of the Board and its committees, promote the interests of the Partnerships’ respective Unitholders, with appropriate regard to the Board’s duties to the sole stockholder of the General Partner, and set forth a common set of expectations as to how the Board, its various committees, individual directors and management should perform their functions. The Guidelines may be found in the “Management & Governance” section of our Internet site (
http://www.alliancebernstein.com
).
The Governance Committee is responsible for considering any request for a waiver under the Code of Business Conduct and Ethics, the Item 406 Code, the AXA Group Compliance and Ethics Guide, and the AXA Financial Policy Statement on Ethics from any director or executive officer of the General Partner. Any such waiver that has been granted would be set forth in the “Management & Governance” section of our Internet site (
http://www.alliancebernstein.com
).
Our Internet site (
http://www.alliancebernstein.com
), under the heading “Meet our Directors”, provides an e-mail address for any interested party, including Unitholders, to communicate with the Board of Directors. Our Corporate Secretary reviews e-mails sent to that address and has some discretion in determining how or whether to respond, and in determining to whom such e-mails should be forwarded. In our experience, substantially all of the e-mails received are ordinary client requests for administrative assistance that are best addressed by management or solicitations of various kinds.
The 2010 Certification by our Chief Executive Officer under NYSE Listed Company Manual Section 303A.12(a) was submitted to the NYSE on March 2, 2010.
Certifications by our Chief Executive Officer and Chief Financial Officer pursuant to Section 302 of the Sarbanes-Oxley Act of 2002 have been furnished as exhibits to this Form 10-K.
Holding Unitholders and AllianceBernstein Unitholders may request a copy of any committee charter, the Guidelines, the Code of Business Conduct and Ethics, and the Item 406 Code by contacting our Company’s Corporate Secretary (
corporate_secretary@alliancebernstein.com
). The charters and memberships of the Executive, Audit, Governance and Compensation Committees may be found in the “Management & Governance” section of our Internet site (
http://www.alliancebernstein.com
).
Fiduciary Culture
We maintain a robust fiduciary culture and, as a fiduciary, we place the interests of our clients first and foremost. We are committed to the fair and equitable treatment of all our clients, and to compliance
with all applicable rules and regulations and internal policies to which our business is subject. We pursue these goals through education of our employees to promote awareness of our fiduciary obligations, incentives that align employees’ interests with those of our clients, and a range of measures, including active monitoring, to ensure regulatory compliance. Specific steps we have taken to help us achieve these goals include:
|
|
•
|
establishing two committees, the Code of Ethics Oversight Committee (
“Ethics Committee”
) and the Internal Compliance Controls Committee (
“Compliance Committee”
), composed of our executive officers and other senior executives to oversee and resolve code of ethics and compliance-related issues;
|
|
|
•
|
creating an ombudsman office, where employees and others can voice concerns on a confidential basis;
|
|
|
•
|
initiating firm-wide compliance and ethics training programs; and
|
|
|
•
|
appointing a Conflicts Officer and establishing a Conflicts Committee to identify and manage conflicts of interest.
|
The Ethics Committee oversees all matters relating to issues arising under the AllianceBernstein Code of Business Conduct and Ethics. The Ethics Committee meets on a quarterly basis and at such other times as circumstances warrant. The Ethics Committee and its subcommittee, the Personal Trading Subcommittee, have oversight of personal trading by our employees.
The Compliance Committee reviews compliance issues throughout our Company, endeavors to develop solutions to those issues as they may arise from time to time, and oversees implementation of those solutions. The Compliance Committee meets on a quarterly basis and at such other times as circumstances warrant.
Section 16(a) Beneficial Ownership Reporting Compliance
Section 16(a) of the Exchange Act requires directors of the General Partner and executive officers of the Partnerships, and persons who own more than 10% of the Holding Units or AllianceBernstein Units, to file with the Commission initial reports of ownership and reports of changes in ownership of Holding Units or AllianceBernstein Units. To the best of management’s knowledge, during 2010: (i) all Section 16(a) filing requirements relating to Holding were complied with
;
and (ii) all Section 16(a) filing requirements relating to AllianceBernstein were complied with. Our Section 16 filings can be found under “Investor & Media Relations”/“Reports & SEC Filings” on our Internet site (
http://www.alliancebernstein.com
).
|
Item
11.
|
Executive Compensation
|
Compensation Discussion and Analysis (“CD&A”)
Overview of Compensation Philosophy and Program
The intellectual capital of our employees is collectively the most important asset of our firm. We invest in people—we hire qualified people, train them, encourage them to give their best thinking to the firm and our clients, and compensate them in a manner designed to motivate and retain them. As a result, the costs of employee compensation and benefits are significant, comprising approximately 53% of our operating expenses and representing approximately 49% of our revenues (as
part of our adjusted compensation ratio defined below
) for 2010. Although these percentages are not unusual for companies in the financial services industry, the magnitude of these costs requires that it be monitored by management, and overseen by the Board, with the particular attention of the Compensation Committee.
We believe that the quality, skill and dedication of our executives are critical to enhancing the long-term value of our Company. Our key compensation goals are to attract and retain highly-qualified executive talent, provide rewards for the past year’s performance and provide incentives for future performance, and align our executives’ long-term interests with those of our clients and Unitholders. We believe that success in achieving good results for the firm, and for our Unitholders, flows from achieving investment success for our clients.
We utilize a variety of compensation elements to achieve the goals described above, including base salary, annual short-term incentive compensation awards (cash bonuses), a long-term incentive compensation award program under which awards of restricted Holding Units are made and a defined contribution plan, all of which are
discussed in more detail below
.
Although estimates are developed for budgeting and strategic planning purposes, executive compensation is not correlated with meeting any specific targets. (Some of our salespeople have compensation incentives based on sales levels.)
In addition to the compensation goals
discussed above
,
we are also focused on ensuring our compensation practices are competitive with industry peers and provide sufficient potential for wealth creation for our executives and employees in order to attract, motivate and retain top talent. As a result, we changed our approach regarding long-term incentive compensation in 2009. Specifically, since 2009, all long-term incentive compensation awards have been in the form of restricted Holding Units and, accordingly, unlike in previous years, executives (and employees) were not able to notionally allocate any of their 2010 or 2009 awards to our investment services.
Consideration of Risk Matters in Determining Compensation
We have considered whether our compensation practices encourage unnecessary or excessive risk-taking and whether any risks arising from our compensation practices are reasonably likely to have a material adverse effect on our Company. For the reasons set forth below, we have determined that our current compensation practices do not incentivize or encourage our employees to engage in unnecessary or excessively risky activities and such practices do not create risks that are reasonably likely to have a material adverse effect on our Company.
In our effort to foster the spirit of partnership among our employees and better align their interests with those of Holding Unitholders and our clients, all eligible employees now receive their deferred compensation awards in the form of restricted Holding Units, with multiple-year vesting periods (generally, four years). Our Chairman and Chief Executive Officer firmly believes that compensating key employees with equity ownership fosters a true partnership community, one that will help us grow and achieve our firm’s goals. And, as our employees become more focused on partnering with each other to achieve our firm’s overall goals, they will serve as checks and balances on each other in assessing risk and performance.
Our approach to long-term incentive compensation is designed to reflect the overall performance of the firm and the specific performance of each individual employee. By denominating our employees’ long-term incentive compensation in Holding Units and deferring receipt, our employees are sensitized to risk outcomes and disinclined to embrace excessive risks as the value of a significant portion of the compensation they receive fluctuates with the price of a Holding Unit.
Overview of 2010 Incentive Compensation Program
Our 2010 incentive compensation, generally consisting of annual cash bonuses and restricted Holding Unit awards, is intended to reward our executives (and any other employee with 2010 total compensation in excess of $200,000) for their performance and encourage them to remain with the firm. Annual cash bonuses generally reflect individual performance and the financial performance of the firm and provide a shorter-term incentive to remain through year-end because such bonuses are typically paid during the last week of the year.
Restricted Holding Unit awards provide future earnings potential and encourage longer-term retention because such awards vest over time and are subject to forfeiture; recipients are therefore encouraged to remain with the firm.
The aggregate amount of incentive compensation (
i.e.,
the amount available to pay annual cash bonuses and make restricted Holding Unit awards to executives and other employees) generally is determined on a discretionary basis and is primarily a function of our firm’s financial performance. Amounts are awarded to help us achieve our goal of attracting, motivating and retaining top talent while also helping ensure that our Unitholders receive an appropriate return on their investment. Senior management, with the approval of the Compensation Committee, confirmed that the appropriate metric to consider in determining the amount of incentive compensation for 2010 is the ratio of adjusted employee compensation and benefits expense to adjusted revenues. (We define adjusted employee compensation and benefits expense as employee compensation and benefits expense minus other employment costs such as recruitment, meals, temporary help, and training and seminars. We define adjusted revenues as net revenues minus distribution revenues.) Senior management, with the approval of the Compensation Committee, also confirmed that adjusted employee compensation and benefits expense should not exceed 50% of our adjusted revenues, except in unexpected or unusual circumstances.
As shown in the table below, in 2010, adjusted employee compensation and benefits expense amounted to 49.3% of adjusted revenues (in thousands):
|
Net Revenues
|
$ | 2,948,557 | ||
|
Distribution Revenues
|
(338,597 | ) | ||
|
Adjusted Revenues
|
$ | 2,609,960 | ||
|
Employee Compensation & Benefits Expense
|
$ | 1,322,522 | ||
|
Other Employment Costs
|
(35,228 | ) | ||
|
Adjusted Employee Compensation & Benefits Expense
|
$ | 1,287,294 | ||
|
Adjusted Compensation Ratio
|
49.3 | % |
Our 2010 adjusted compensation ratio is nearly 50%, reflecting the need to keep compensation levels competitive with industry peers. In determining the appropriate level of compensation for the firm’s executives, senior management retained McLagan Partners (
“McLagan”
) and Johnson Associates, Inc. (
“Johnson”
), which provided compensation benchmarking data that included comparisons of estimated 2010 executive compensation to executive compensation in 2009; both McLagan and Johnson predicted increases in average incentive compensation within the asset management industry in 2010.
Employees with total compensation in excess of $200,000 received a portion of their 2010 incentive compensation in the form of a cash bonus and a portion in the form of restricted Holding Units. The split between cash bonus and restricted Holding Units varied depending on the employee’s total compensation, with lower-paid employees receiving a greater percentage of their incentive compensation as cash bonuses than more highly-paid employees. Quarterly cash distributions on vested and unvested restricted Holding Units are paid currently to award recipients.
Overview of our Chief Executive Officer’s Compensation
On December 19, 2008, Peter S. Kraus, the General Partner, AllianceBernstein and Holding entered into an agreement (
“Kraus Employment Agreement”
) pursuant to which Mr. Kraus serves as Chairman of the Board of the General Partner and CEO of the General Partner, AllianceBernstein and Holding until January 2, 2014 (
“Employment Term”
) unless the Kraus Employment Agreement is terminated in accordance with its terms.
In connection with the commencement of Mr. Kraus’s employment, on December 19, 2008, he was granted 2,722,052 restricted Holding Units (
“Restricted Holding Unit Grant”
). Subject to accelerated vesting clauses in the Kraus Employment Agreement, Mr. Kraus’s restricted Holding Units vest ratably on each of the first five anniversaries of December 19, 2008, commencing December 19, 2009, provided, with respect to each installment, Mr. Kraus continues to be employed by AllianceBernstein on the vesting date. The agreement provides for immediate vesting upon AXA ceasing to control the management of AllianceBernstein’s business or Holding ceasing to be publicly traded and certain qualifying terminations of employment, including termination of Mr. Kraus’s employment (i) by AllianceBernstein without cause (“cause” means, among other things, (1) the continued, willful failure by Mr. Kraus to perform substantially his duties with AllianceBernstein after a written demand for substantial performance is delivered to him by the Board; (2) Mr. Kraus’s conviction of, or plea of guilty or
nolo contendere
to, a crime that constitutes a felony; (3) the willful engaging by Mr. Kraus in misconduct that is materially and demonstrably injurious to AllianceBernstein or any of its affiliates; and (4) Mr. Kraus’s failure to comply with a material written Company workplace policy applicable to him), (ii) by Mr. Kraus for good reason (“good reason” generally means actions taken by AllianceBernstein resulting in a material negative change in Mr. Kraus’s employment relationship, including assignment to Mr. Kraus of duties materially inconsistent with his position or a requirement that Mr. Kraus report to an officer or employee of AllianceBernstein instead of reporting directly to the Board), and (iii) due to death or disability. During the Employment Term, Mr. Kraus will be paid the cash distributions payable with respect to his unvested restricted Holding Units and a dollar amount equal to the cash distributions payable with respect to the number of any Holding Units that are withheld by AllianceBernstein to cover Mr. Kraus’s withholding tax obligations as the Holding Units vest. These cash distributions will be paid at the time distributions are made to Holding Unitholders generally, provided that no such payments to Mr. Kraus will be required with respect to any cash distribution with a record date following the earlier of (i) the termination of Mr. Kraus’s employment for any reason, and (ii) December 19, 2013.
Mr. Kraus is paid an annual base salary of $275,000. The $275,000 base salary is in line with our firm’s policy to keep base salaries low in relation to total compensation.
During the Employment Term, AllianceBernstein has no commitment to pay any cash bonuses to Mr. Kraus beyond the $6 million he was paid in 2009 (with any additional bonuses being entirely in the discretion of the Board) or to make any additional equity-based awards to him. Consequently, for years after 2009 during the Employment Term, the totality of Mr. Kraus’s compensation (other than his salary and absent any additional awards the Board may choose to grant) is dependent on the level of cash distributions on the restricted Holding Units granted to him and the evolution of the trading price of Holding Units, thereby directly aligning Mr. Kraus’s interests with those of other Holding Unitholders. He received neither a cash bonus nor a long-term incentive compensation award in 2010.
Mr. Kraus is also entitled to receive perquisites and benefits, including full tax gross-ups by AllianceBernstein with respect to personal air travel on Company aircraft, personal use of a Company car and driver, any continued medical coverage due to termination by death or disability, and any payments for COBRA coverage due to termination of employment by AllianceBernstein without cause or by Mr. Kraus for good reason.
The terms of the Kraus Employment Agreement were the result of arm’s-length negotiations between Mr. Kraus and a member of the Compensation Committee. These terms, including the compensation elements, were discussed and approved by the Compensation Committee and the full Board on December 19, 2008 and reflect their decision to structure the allocation of Mr. Kraus’s compensation more heavily toward a restricted Holding Unit award. As a result, Mr. Kraus’s compensation consists almost entirely of the Restricted Holding Unit Grant.
The amount of compensation ultimately realized by Mr. Kraus from the Restricted Holding Unit Grant will depend on the future market price of Holding Units and the amount of cash distributions paid on Holding Units, both of which are partially dependent on the financial and operating results of AllianceBernstein. Given the five-year vesting schedule, Mr. Kraus has a strong incentive to remain with our firm for the full five-year term of the Kraus Employment Agreement and to cause our firm to have strong financial performance during each of those five years. Thus, his long-term interests are directly aligned with the interests of our Unitholders and also indirectly aligned with the interests of our clients, as strong performance for our clients generally contributes directly to increases in assets under management and thus improved financial performance for the firm. The size of the Restricted Holding Unit Grant, which had a value of approximately $52 million based on the market price of a Holding Unit on December 19, 2008, reflected the determination by Mr. Kraus and the Board that this was a reasonable and appropriate amount of long-term incentive compensation in view of Mr. Kraus’s expertise and experience, his past compensation, the compensation of his predecessor and the compensation of other chief executive officers of comparable asset management companies.
The $6 million cash bonus paid to Mr. Kraus in 2009 represented the amount which Mr. Kraus and the Board agreed represented a reasonable and appropriate short-term financial inducement for Mr. Kraus to join AllianceBernstein based on these same factors and reflected the significant uncertainty surrounding the level of 2009 quarterly cash distributions on Holding Units when he was hired; it most directly reflects the goal of attracting highly qualified executive talent. The terms of the perquisites and benefits received by Mr. Kraus reflect the results of the arm’s-length negotiation process.
Factors Considered when Determining Executive Compensation
Decisions about executive compensation are based primarily on our assessment of each executive’s leadership, operational performance and potential to enhance investment returns and service for our clients, all of which contribute to long-term Unitholder value. We do not utilize quantitative formulas when determining the compensation of our Chief Executive Officer, our Chief Financial Officer and our other three most highly-compensated executives (
“named executive officers”
), but rather rely on our judgment about each executive’s performance and whether each particular payment or award provides an appropriate reward for the current year’s performance. We begin this process by determining the total incentive compensation amounts available for a particular year (
as more fully explained above in “Overview of 2010 Incentive Compensation Program”
). We then consider a number of key factors for each of the named executive officers (other than Mr. Kraus, our CEO, whose compensation
is described above in “Overview of our Chief Executive Officer’s Compensation”
). These factors include: total compensation paid to the named executive officer in the previous year; the increase or decrease in the current year’s total incentive compensation amounts available; the named executive officer’s performance compared to individual business and operational goals established at the beginning of the year; the nature, scope and level of responsibilities of the named executive officer; the contribution to our overall financial results; and the contribution of the executive’s business unit to our Company’s fiduciary culture in which clients’ interests are paramount. In 2010, we also considered data provided by McLagan and Johnson to benchmark the total compensation paid to each of our named executive officers.
This process, which is conducted by the Chief Executive Officer working with other members of senior management, results in specific incentive compensation recommendations to the Compensation Committee supported by the factors considered. The Compensation Committee then makes the final incentive compensation decisions. The Compensation Committee did not analyze quantifiable goals relating to the firm’s business units in determining the cash bonus of each of the named executive officers.
The priorities of our named executive officers (other than Mr. Kraus) generally include a robust set of factors relating to our firm’s financial performance, its strategic and operational considerations, the specific business or function headed by each named executive officer, and each named executive officer’s management effectiveness, talent development and adherence to our firm’s culture, including risk/control management and regulatory compliance. Because specific factors will vary among business units, among individuals and during different business cycles, we do not adopt any specific weighting or formula under which these metrics are applied.
We have described below the business and operational goals established in 2010 for our named executive officers (other than Mr. Kraus) and the contribution to our Company each made in achieving these goals:
|
|
•
|
For Mr. Steyn, our Company’s Chief Operating Officer, the main elements of his business and operational goals included: maintaining financial leverage at our firm through the right-sizing, rationalization and re-engineering of the Distribution Services’ units (Private Client, Institutions and Retail) and the Corporate and Fiduciary Services’ units (Legal and Compliance, IT and Operations); leading the collaboration and co-operation of the three distribution channels; focusing the distribution channels on key strategic initiatives and new product launches; and establishing our firm’s Alternative Strategies Unit.
|
|
|
•
|
Mr. Steyn was successful in achieving these goals in 2010. The distribution units – Private Client, Institutions and Retail – co-operated on a daily basis. Product development increased its profile, with major new launches in all three distribution channels. Alternative products have become our Company’s most important new strategic initiative. Mr. Steyn’s compensation reflected Mr. Kraus’s and the Compensation Committee’s judgment in assessing the importance of these contributions to our Company.
|
|
|
•
|
For Mr. Gingrich, the Chairman and CEO of SCB LLC, the main elements of his business and operational goals included: optimizing the revenue and profit contribution of our Bernstein Research Services unit; further enhancing this unit’s research capabilities, trading services and product array; extending this unit’s geographic platform; and attracting, motivating and retaining top talent.
|
|
|
•
|
Mr. Gingrich was successful in meeting these goals in 2010. The most significant contributions made by Mr. Gingrich toward achieving these goals included leading our sell-side business to: strong market share and profitability; excellent results in third party surveys; further expansion of the European trading platform; significant progress in establishing the Asia business; and further expansion of the equity derivatives and equity capital markets initiatives. Mr. Gingrich’s compensation reflected Mr. Kraus’s and the Compensation Committee’s judgment in assessing the importance of these contributions to our Company.
|
|
|
•
|
For Mr. Cranch, our Company’s General Counsel, the main elements of his business and operational goals included: maintaining the Company’s good compliance record; sustaining and improving the Legal and Compliance Department’s level of client service; recruiting, developing and retaining high-quality talent within the department; and minimizing the risk of litigation and regulatory actions against the Company.
|
|
|
•
|
Mr. Cranch was successful in meeting these goals in 2010. The most significant contributions made by Mr. Cranch toward achieving these goals included: his strong leadership and advocacy at all levels of our Company, and particularly within the Legal and Compliance Department, in requiring strict adherence to our compliance policies and procedures and ensuring that our Company fulfills its fiduciary duties to its clients; leading the design and implementation of a new client service model within the Legal and Compliance Department with a view toward achieving a consistent level of service excellence; and his leadership in identifying practices and circumstances that risk exposing our Company to litigation and regulatory enforcement proceedings, and taking steps to proactively mitigate that risk. Mr. Cranch’s compensation reflected Mr. Kraus’s and the Compensation Committee’s judgment in assessing the importance of these contributions to our Company.
|
|
|
•
|
For Mr. Howard, our Company’s Chief Financial Officer as of December 31, 2010, the main elements of his business and operational goals included: assuming his new responsibilities as Chief Financial Officer in a seamless manner; enhancing both internal and external financial reporting to provide more useful information to the Board, management and our Unitholders (including introduction of non-GAAP performance measures); reviewing our global real estate footprint to rationalize our occupancy expenses; working with Human Capital to improve the infrastructure supporting the monitoring and management of employee compensation; reviewing our firm’s global liquidity requirements in preparation for entry into a new revolving credit facility at the end of 2010; reorganizing our firm’s Finance function, and hiring new senior leaders in Finance, to improve the level of finance services provided to our Company; and identifying and developing our firm’s next generation of Finance leaders.
|
|
|
•
|
Mr. Howard was successful in meeting these goals in 2010. The most significant contributions made by Mr. Howard toward achieving these goals included: introducing new non-GAAP performance measures in the second quarter of 2010 such as “adjusted net revenues”, “adjusted operating income” and “adjusted operating margin”, which are the principle metrics management uses in evaluating and comparing period-to-period operating performance; completing the firm-wide occupancy review, resulting in the Company’s decision to sub-lease over 380,000 square feet of space in the New York City area and taking a real estate charge of approximately $90 million in the third quarter of 2010; enhancing our firm’s infrastructure supporting the monitoring and management of employee compensation; completing a review of our firm’s liquidity requirements and, working with our firm’s bank syndicate, successfully completing a $1 billion credit facility renewal in December 2010; and adding senior leaders to the Finance team and reorganizing Finance to provide better finance services to our organization. Mr. Howard’s compensation reflected Mr. Kraus’s and the Compensation Committee’s judgment in assessing the importance of these contributions to our Company.
|
|
|
•
|
For Mr. Joseph, our Company’s former Chief Financial Officer, the main elements of his business and operational goals were to assist with the recruitment of a successor and facilitate the transition of his responsibilities as Chief Financial Officer to that successor.
|
|
|
•
|
Mr. Joseph was successful in meeting these goals in 2010. The most significant contributions made by Mr. Joseph toward achieving these goals included: participating in the process of finding a successor and playing a significant role in the seamless transition of his Chief Financial Officer responsibilities to Mr. Howard. Mr. Joseph’s compensation, including the terms of the Joseph Retirement Agreement (
as defined below in “Compensation Elements for Executive Officers – Former Chief Financial Officer Arrangements”
), reflected Mr. Kraus’s and the Compensation Committee’s judgment in assessing the importance of these contributions to our Company.
|
Consistent with the management approach taken by AllianceBernstein for its executives generally, the 2010 goals of our named executive officers (other than Mr. Kraus, whose compensation
is described above in “Overview of our Chief Executive Officer’s Compensation”
) did not include specific revenue or profit targets. By their nature, the business and operational goals for each of these other named executive officers are difficult to measure quantitatively and thus management uses discretion to determine whether those goals and objectives have been met. In the case of each of these five named executive officers, management determined that the main elements of the established business and operational goals had been met in 2010.
In addition to considering the extent to which our named executive officers met their business and operational goals, we consider each executive’s current salary, and prior-year short-term and long-term incentive compensation awards, and the compensation paid to the executive’s peers within our Company. In general, we believe that key employees should be well-compensated for strong performance, but that significant portions of compensation should be deferred and earned for service in future periods, which provides an incentive for key employees to remain with the firm.
Furthermore, during the fourth quarter of 2010, McLagan and Johnson provided us with comparative compensation benchmarking data, which summarized compensation levels for the prior year at selected asset management companies and banks comparable to ours. This data provides ranges of compensation levels for executive positions at these companies similar to those held by our named executive officers, including salary, total cash compensation and total compensation. The comparable companies are selected by management with input from the compensation consultants in order to provide appropriate comparables for the size and business mix of AllianceBernstein and the roles played by the named executive officers.
In 2010, the McLagan data we used to benchmark the compensation of our named executive officers was based on compensation comparisons from the following asset management companies and banks: Bank of America Merrill Lynch, Barclays Capital Group, BlackRock Financial Management, Credit Suisse, Deutsche Bank, Franklin Templeton, Goldman Sachs & Co., Goldman Sachs Asset Management, Invesco Plc, JPMorgan Asset Management, JPMorgan Chase, Morgan Stanley, Morgan Stanley Investment Management, Nomura Securities, PIMCO Advisors, T. Rowe Price Associates, UBS and The Vanguard Group.
In 2010, the Johnson benchmarking data we used was based on compensation comparisons from asset management companies and banks, including: Affiliated Managers, Ameriprise Financial, Bank of America Merrill Lynch, Barclays Global Investors, BlackRock, Citigroup, Credit Suisse Asset Management, Deutsche Bank, Eaton Vance, Federated Investors, Franklin Templeton, Goldman Sachs Asset Management, Invesco, Janus Capital Group, Legg Mason, Morgan Stanley Investment Management, Northern Trust, PIMCO Advisors, State Street, T. Rowe Price, UBS Asset Management, and Waddell & Reed.
Total compensation paid to our named executive officers fell within the ranges of total compensation paid to executives in similar positions by the companies included in the McLagan and Johnson data. Additionally, the Board, when it reviewed and approved the Kraus Employment Agreement on December 19, 2008, considered McLagan data indicating that Mr. Kraus’s compensation arrangement was fully competitive, reasonble and appropriate given our size, scope and complexity, and Mr. Kraus’s experience, credentials and proven track record.
Our Chief Executive Officer, and the Compensation Committee, retain discretion as to how to utilize the McLagan and Johnson benchmarking data. The data is not used in a formulaic or mechanical way to determine named executive officer compensation levels. The Compensation Committee considered McLagan and Johnson data in concluding that the compensation levels paid in 2010 to our named executive officers were appropriate and reasonable.
Compensation Elements for Executive Officers
Below we describe the major elements of our executive compensation.
1.
Base Salary.
Base salaries comprise a relatively small portion of executives’ total compensation and are maintained at levels generally lower than the salaries of executives at peer firms. Within the relatively narrow range of base salaries paid to executives, we consider individual experience, responsibilities and tenure with the firm. The salaries we paid during 2010 to our named executive officers are shown in column (c) of the Summary Compensation Table.
2.
Short-term Incentive Compensation (Cash Bonus).
In 2010, we paid annual cash bonuses in late December to reward individual performance for the year. These bonuses are based on management’s evaluation (subject to the Compensation Committee’s review and approval) of each executive’s performance during the year, and the performance of the executive’s business unit or function, compared to business and operational goals established at the beginning of the year, and in the context of the firm’s overall financial performance. The cash bonuses we awarded in 2010 to our named executive officers are shown in column (d) of the Summary Compensation Table.
3.
Long-term Incentive Compensation.
In 2010, we granted annual long-term incentive compensation awards in December to supplement cash bonuses and to encourage retention of our executives. These awards are made under an unfunded, non-qualified incentive compensation plan under which awards may be granted to eligible employees.
As discussed above in “Overview of 2010 Incentive Compensation Program”
, all long-term incentive compensation awards are made in the form of restricted Holding Units. We employ this structure to directly align our executives’ long-term interests with the interests of our Unitholders while also indirectly aligning our executives’ long-term interests with the interests of our clients, as strong performance for our clients generally contributes directly to increases in assets under management and thus improved financial performance for the firm. The 2010 restricted Holding Unit awards granted to our named executive officers are shown in column (e) of the Summary Compensation Table and column (i) of the Grants of Plan-based Awards Table.
Restricted Holding Units were awarded as part of total incentive compensation based on a customized set of goals for each executive. The relative level of cash bonus compared to restricted Holding Units is generally fixed using a sliding scale based on the total compensation level of the executive, with lower-paid executives receiving a greater percentage of their incentive compensation as cash bonuses than more highly-paid executives.
In 2010, the value used for the awards of restricted Holding Units was the closing price of a Holding Unit as reported for NYSE composite transactions on December 10, 2010, the day the Compensation Committee approved the awards.
Awards of restricted Holding Units generally vest ratably over four years. However, if the recipient of such an award is at least 55 years old and has at least ten years of service, the award recipient qualifies for “Retirement”. Any award recipient who qualifies for Retirement continues to vest in the award post-Retirement, provided the award recipient complies with agreements and covenants contained in the award agreement (including covenants not to compete with AllianceBernstein, not to solicit AllianceBernstein’s clients or employees, to maintain confidentiality of AllianceBernstein’s trade secrets and proprietary information, and not to disparage AllianceBernstein) until the Holding Units have fully vested. Of the named executive officers, only Mr. Joseph qualified for Retirement as of December 31, 2010.
Withdrawals prior to vesting are not permitted. Upon vesting, awards are distributed to participants unless the participant has, in advance, voluntarily elected to defer receipt to future periods. Quarterly cash distributions on vested and unvested restricted Holding Units are paid currently to participants and are included in column (i) of the Summary Compensation Table. For awards made prior to 2009, quarterly cash distributions on vested and unvested Holding Units for which a voluntary deferral election has been made, and earnings credited on investment services, are reinvested and distributed as elected by participants. These are shown as “earnings” in column (d) of the Non-Qualified Deferred Compensation Table.
4.
Defined Contribution Plan.
Employees of AllianceBernstein are eligible to participate in the Profit Sharing Plan for Employees of AllianceBernstein L.P. (as amended and restated as of January 1, 2010,
“Profit Sharing Plan”
), a tax-qualified retirement plan. The Compensation Committee determines the amount of Company contributions (both the level of annual matching by the firm of an employee’s pre-tax salary deferral contributions and the annual Company profit sharing contribution). For 2010, the Compensation Committee determined that employee deferral contributions would be matched on a one-to-one basis up to five percent of eligible compensation and there would be no profit sharing contribution. Company contributions to the Profit Sharing Plan on behalf of the named executive officers are shown in column (i) of the Summary Compensation Table.
5.
CEO Arrangements.
See
“
Overview of our Chief Executive Officer’s Compensation
“
above.
6.
Former Chief Financial Officer Arrangements.
|
(a)
|
John B. Howard
|
As Chief Financial Officer of AllianceBernstein, Mr. Howard was paid an annual salary of $200,000. For 2010, his total year-end cash bonus and long-term incentive compensation award (pursuant to the Post-July 1, 2010 AllianceBernstein Incentive Compensation Award Program (
“ICAP”
), which is filed as Exhibit 10.02 to this Form 10-K) was $2,300,000, which was allocated between cash and deferred compensation in accordance with the formula we generally use for employees. In addition, Mr. Howard was granted, at year-end 2010, in accordance with the terms and conditions of the ICAP, an additional award of $2,500,000 as replacement equity for awards he forfeited by leaving AQR Capital Management (
“AQR Capital”
).
On January 12, 2011, we announced that Mr. Howard would leave AllianceBernstein on February 15, 2011 to return to his former employer, AQR Capital, to resume his former role as Chief Operating Officer. As a result of his resignation, Mr. Howard forfeits any equity and deferred compensation awards we granted to him (including the Holding Units we awarded to him as replacement equity).
|
(b)
|
Robert H. Joseph, Jr.
|
On March 22, 2010, we announced that Mr. Joseph would retire, effective December 31, 2010 (
“Joseph Retirement Date”
).
Pursuant to our agreement with Mr. Joseph (
“Joseph Retirement Agreement”
, which is filed as Exhibit 10.04 to this Form 10-K) and in recognition of his years of service to our firm and his assistance with transitioning his responsibilities, Mr. Joseph will continue to be paid his base salary of $195,000 through June 30, 2011. In addition, Mr. Joseph received, subject to his continued compliance with the agreements and covenants in the Joseph Retirement Agreement, a 2010 year-end compensation award of $805,000, which was allocated between cash and deferred compensation in accordance with the formula we generally use for employees. The deferred portion of Mr. Joseph’s award will vest and be distributed to him in accordance with the terms of ICAP.
In addition, Mr. Joseph was awarded 26,975 restricted Holding Units, which, as required by the Joseph Retirement Agreement, was determined by dividing his $625,000 severance payment by the closing price on the NYSE of a Holding Unit on December 1, 2010 ($23.17), and rounded up to the nearest whole number. These restricted Holding Units will vest ratably on December 1 in each of 2011, 2012, 2013 and 2014, provided, with respect to each installment, Mr. Joseph is in compliance with the agreements and covenants in the Joseph Retirement Agreement. Mr. Joseph will also receive, through June 30, 2011, continuing medical and dental coverage under AllianceBernstein’s group plans, as described in the Joseph Retirement Agreement.
Compensation Committee
In 2010, the Compensation Committee consisted of Mr. Condron (Chairman), Mr. Kraus, Ms. Slutsky and Mr. Smith. In February 2011, the Board elected Messrs. de Castries, Duverne and Elliott as additional members. As discussed above (
see “Corporate Governance—NYSE
Governance Matters”
), because it is a limited partnership, Holding is exempt from NYSE rules that require public companies to have a compensation committee made up solely of independent directors. AXA owns, indirectly, an approximate 61.4% economic interest in AllianceBernstein (as of December 31, 2010), and compensation expense is a significant component of our financial results. For these reasons, Mr. de Castries, Chief Executive Officer of AXA, and Mr. Duverne, Deputy Chief Executive Officer of AXA, are members of the Compensation Committee, and any action taken by the Compensation Committee requires the affirmative vote or consent of an executive officer of one or more of our parent companies. (Presently, Messrs. de Castries and Duverne are the only members of the Compensation Committee who are also executive officers of one or more of our parent companies.)
The Compensation Committee has general oversight of compensation and compensation-related matters, including:
(i) determining cash bonuses;
(ii) determining contributions and awards under incentive plans or other compensation arrangements (whether qualified or non-qualified) for employees of AllianceBernstein and its subsidiaries, and amending or terminating such plans or arrangements or any welfare benefit plan or arrangement or making recommendations to the Board with respect to adopting any new incentive compensation plan, including equity-based plans;
(iii) reviewing and approving corporate goals and objectives relevant to the compensation of our Chief Executive Officer, evaluating his performance in light of those goals and objectives, and determining and approving his compensation level based on this evaluation (our Chief Executive Officer will recuse himself from voting on his own compensation); and
(iv) reviewing and discussing the CD&A, and recommending to the Board its inclusion in the Partnerships’ Forms 10-K and, when applicable, proxy statements.
In December 2007, the Compensation Committee delegated responsibility for managing AllianceBernstein’s non-qualified plans to the Omnibus Committee for Non-Qualified Plans (
“Omnibus Committee”
), consisting of five members who are senior officers of AllianceBernstein. The Compensation Committee held five meetings in 2010. The Omnibus Committee held one meeting and acted by unanimous written consent once in 2010.
The Compensation Committee’s year-end process has generally focused on the cash bonuses and long-term incentive compensation awards granted to senior management. Mr. Kraus plays an active role in the work of the Compensation Committee. Mr. Kraus, working with other members of senior management, provides recommendations for individual employee awards to the Compensation Committee for its consideration. As part of this process, management provides the Committee with compensation benchmarking data from McLagan and Johnson. For 2010, we paid $15,000 and $28,066 to McLagan and Johnson, respectively, for executive compensation benchmarking data and an additional $240,918 and $10,276, respectively, for survey and consulting services relating to the amount and form of compensation paid to employees other than executives.
The Compensation Committee held its regularly-scheduled meeting regarding year-end compensation on December 10, 2010, at which it discussed and approved senior management’s compensation recommendations. The Compensation Committee has not retained its own consultants.
The Compensation Committee’s functions are more fully described in the committee’s charter, which is available online in the “Management & Governance” section of our Internet site (
http://www.alliancebernstein.com
)
.
Other Compensation-Related Matters
AllianceBernstein and Holding are, respectively, private and public limited partnerships, and are subject to taxes other than federal and state corporate income tax. (
See “Business – Taxes” in Item 1 and “Structure-related Risks” in Item 1A
.) Accordingly, Section 162(m) of the Code, which limits tax deductions relating to executive compensation otherwise available to entities taxed as corporations, is not applicable to either AllianceBernstein or Holding.
We have amended our qualified and non-qualified plans to the extent necessary to comply with applicable law.
For long-term incentive compensation awards made during or before 2008, we typically purchased the investments that were notionally elected by plan participants and held these investments in a consolidated rabbi trust. Effective January 1, 2009, investments we previously made in our investment services offered to clients are held in a custodial account, while we continue to hold investments in Holding Units in the rabbi trust. These investments are subject to the general creditors of AllianceBernstein.
All compensation awards that involve the issuance of Holding Units were made under the 1997 Plan or the 2010 Plan.
Compensation Committee Interlocks and Insider Participation
Mr. de Castries is the Chief Executive Officer of AXA, the ultimate parent of the General Partner.
Mr. Duverne is the Deputy Chief Executive Officer of AXA.
Mr. Condron served as the Chairman of the Board, President and Chief Executive Officer of AXA Equitable, the sole stockholder of the General Partner, until his retirement on January 1, 2011.
As of December 31, 2010, AXA Equitable and its affiliates owned an aggregate 61.4% economic interest in AllianceBernstein.
Mr. Kraus is Chairman of the Board and Chief Executive Officer of the General Partner and, accordingly, also serves in that capacity for AllianceBernstein and Holding. Mr. Kraus is also a director of AXA Financial, AXA Equitable, MONY and MLOA. No other executive officer of AllianceBernstein served as a member of a compensation committee or a director of another entity an executive officer of which served as a member of AllianceBernstein’s Compensation Committee or Board.
Compensation Committee Report
The members of the Compensation Committee reviewed and discussed with management the Compensation Discussion and Analysis set forth above and, based on such review and discussion, recommended its inclusion in this Form 10-K.
|
Christopher M. Condron (Chair)
|
Henri de Castries
|
|
Denis Duverne
|
Steven G. Elliott
|
|
Peter S. Kraus
|
Lorie A. Slutsky
|
|
A.W. (Pete) Smith, Jr.
|
Summary Compensation Table
The following table summarizes the total compensation of our named executive officers for 2010, 2009 and 2008, as applicable (including Mr. Howard, who is no longer an executive officer as a result of his resignation in January 2011, and Mr. Joseph, who is no longer an executive officer as a result of his retirement during 2010):
|
Name and
Principal
Position
|
Year
|
Salary
($)
|
Bonus
($)
|
Stock
Awards
(1)
($)
|
Option
Awards
(1)
($)
|
Non-Equity
Incentive
Plan
Compen-
sation
($)
|
Change in
Pension
Value and
Nonqualified
Deferred
Compen-
sation
Earnings
($)
|
All Other
Compen-
sation
($)
|
Total
($)
|
|||||||||||||||||||||||||
|
(a)
|
(b)
|
(c)
|
(d)
|
(e)
|
(f)
|
(g)
|
(h)
|
(i)
|
(j)
|
|||||||||||||||||||||||||
|
|
||||||||||||||||||||||||||||||||||
|
Peter S. Kraus
(2)
Chairman and Chief Executive Officer
|
2010
|
275,000 | — | — | — | — | — | 4,328,020 | 4,603,020 | |||||||||||||||||||||||||
|
2009
|
275,000 | 6,000,000 | — | — | — | — | 4,175,132 | 10,450,132 | ||||||||||||||||||||||||||
|
2008
|
— | — | 52,263,398 | — | — | — | — | 52,263,398 | ||||||||||||||||||||||||||
|
David A. Steyn
(3)
Chief Operating Officer
|
2010
|
401,342 | 1,655,864 | 3,541,776 | — | — | — | 252,692 | 5,851,674 | |||||||||||||||||||||||||
|
2009
|
176,048 | 1,672,503 | 3,904,799 | — | — | — | 16,569 | 5,769,919 | ||||||||||||||||||||||||||
|
James A. Gingrich
(3)
Chairman and CEO of SCB LLC
|
2010
|
400,000 | 1,311,092 | 2,638,921 | — | — | — | 155,586 | 4,505,599 | |||||||||||||||||||||||||
|
2009
|
200,000 | 1,270,000 | 2,529,995 | 925,000 | — | — | 10,414 | 4,935,409 | ||||||||||||||||||||||||||
|
Laurence E. Cranch
(3)
General Counsel
|
2010
|
400,000 | 601,250 | 1,123,759 | — | — | — | 71,624 | 2,196,633 | |||||||||||||||||||||||||
|
2009
|
200,000 | 770,000 | 1,030,014 | 275,000 | — | — | 11,188 | 2,286,202 | ||||||||||||||||||||||||||
|
John B. Howard
(4)
Chief Financial Officer
|
2010
|
153,077 | 927,877 | 3,872,124 | — | — | — | 138 | 4,953,216 | |||||||||||||||||||||||||
|
Robert H. Joseph, Jr.
(4)
Former Chief Financial Officer
|
2010
|
195,000 | 395,000 | 410,000 | — | — | 63,326 | 707,795 | 1,771,121 | |||||||||||||||||||||||||
|
2009
|
195,000 | 395,000 | 410,011 | — | — | 47,830 | 38,977 | 1,086,818 | ||||||||||||||||||||||||||
|
2008
|
195,000 | 400,000 | — | — | — | 63,612 | 692,285 | 1,350,897 | ||||||||||||||||||||||||||
_____________
|
(1)
|
The figures in columns (e) and (f) of the above table provide the aggregate grant date fair value of the awards calculated in accordance with FASB ASC Topic 718. For the assumptions made in determining these values,
see Note 17 to AllianceBernstein’s consolidated financial statements in Item 8.
|
|
(2)
|
Mr. Kraus joined AllianceBernstein in December 2008. Accordingly, Mr. Kraus did not receive any compensation in 2008, other than his Restricted Holding Unit Grant. His compensation structure is set forth in the Kraus Employment Agreement, the terms of which are
described above in
“Compensation Discussion and Analysis—Overview of our Chief Executive Officer’s Compensation” and below in “Potential Payments upon Termination or Change in Control”
.
|
|
(3)
|
We have not provided 2008 compensation because Messrs. Steyn, Gingrich and Cranch were not named executive officers in 2008.
|
|
(4)
|
On March 22, 2010, John B. Howard joined our firm and succeeded Mr. Joseph as our firm’s Chief Financial Officer. We did not pay Mr. Howard any compensation during 2009 or 2008. On January 12, 2011, we announced that Mr. Howard will leave AllianceBernstein on February 15, 2011 to rejoin his former employer, AQR Capital.
|
For information about how salary and bonus relate to total compensation,
see “Compensation Elements for Executive Officers” above
. Mr. Steyn’s compensation is paid in U.K. pounds sterling. For column (c), the amount of U.K. pounds sterling was converted to U.S. dollars each month using the month-end spot rate. For column (d), the amount of U.K. pounds sterling was converted to U.S. dollars using the average month-end spot rate for the period October 2009 through September 2010. For column (e), the amount of U.K. pounds sterling was converted to U.S. dollars using the spot rate on December 10, 2010, the grant date of the award.
Mr. Steyn’s compensation reflects his role as Chief Operating Officer of AllianceBernstein and the contribution he makes in maintaining financial leverage at the firm, leading continued collaboration and co-operation among our three buy-side distribution channels, focusing those channels on key strategic initiatives and new product launches, and establishing our firm's Alternative Strategies Unit.
Mr. Gingrich’s compensation reflects his role as Chief Executive Officer of SCB LLC and his leadership role in optimizing the revenue and profit contribution of our sell-side business, further enhancing that business’s research capabilities, trading services and product array, and extending the business's geographic platform.
Mr. Cranch’s compensation reflects his role as General Counsel of AllianceBernstein and the contribution he makes in maintaining a good compliance record, sustaining and improving the Legal and Compliance Department's level of client service and minimizing litigation against the firm.
Mr. Howard’s compensation reflects his former role as Chief Financial Officer of AllianceBernstein and the contribution he made in assuming his new responsibilities as Chief Financial Officer in a seamless manner, enhancing both internal and external financial reporting to provide more useful information to the Board, management and our unitholders (including introduction of non-GAAP performance measures), and identifying and developing our firm’s next generation of Finance leaders. As a result of his resignation, Mr. Howard forfeits the equity or deferred compensation awards we granted to him, which are shown in column (e).
Column (h) reflects the change in pension value for Mr. Joseph, the only named executive officer who participates in the Amended and Restated Retirement Plan for Employees of AllianceBernstein L.P. (
“Retirement Plan”
). Benefits under the Retirement Plan for all participants ceased accruing as of December 31, 2008. The value of Mr. Joseph’s pension may change from year to year notwithstanding the fact that benefits under the Retirement Plan ceased accruing as of December 31, 2008 due to increases in interest paid, and to the extent the discount rate decreases. For additional information about the Retirement Plan,
see Note 15 to AllianceBernstein’s consolidated financial statements in Item 8 and “Pension Benefits in 2010” below
.
Column (i) reflects 2008 awards under the ICAP and items similar to those described below with respect to 2010. We report ICAP awards granted prior to 2009 under column (i) because, while they were designed to provide incentives to recipients, they could not be categorized as having been granted under an “incentive plan” under relevant SEC rules because there were no specific performance measures that were required to be met before a participant could receive his or her award. Also,
as described in Note 16 to AllianceBernstein’s consolidated financial statements in Item 8 and “Compensation Discussion and Analysis—Overview of Compensation Philosophy and Program” above
, any allocation of awards by recipients to equity of the firm was voluntary; until 2009, we did not unilaterally make awards of Holding Units to the named executive officers. In addition, awards granted under the ICAP before 2009 were not accounted for under FASB ASC Topic 718,
Compensation—Stock Compensation
.
During 2010, we owned a fractional interest in an aircraft with an aggregate operating cost of $1,991,450 (including $545,146 in maintenance fees, $1,093,648 in usage fees and $352,656 of amortization based on the original cost of our fractional interest, less estimated residual value). The unamortized value of the fractional interest as of December 31, 2010 was $3,753,496. We also leased an aircraft during 2010 with an aggregate operating cost of $4,287,337 (including $858,000 in leasing costs, $886,151 in maintenance fees and $2,543,186 in usage fees).
Our interests in aircraft facilitate business travel of senior management. In 2010, we permitted our Chief Executive Officer to use the aircraft for personal travel. His personal travel constituted approximately 10.6% of our actual use of the aircraft in 2010.
Our methodology for determining the reported value of personal use of aircraft includes fees paid to the managers of the aircraft (fees take into account the aircraft type and weight, number of miles flown, flight time, number of passengers, and a variable fee), but excludes our fixed costs (amortization of original cost less estimated residual value and monthly maintenance fees). We included such amounts in column (i).
We use the Standard Industry Fare Level (
“SIFL”
) methodology to calculate the amount to include in the taxable income of executives for the personal use of Company-owned aircraft. Using the SIFL methodology, which was approved by our Compensation Committee, limits our ability to deduct the full cost of personal use of Company-owned aircraft by our executive officers. Taxable income for the 12 months ended October 31, 2010 for personal use imputed to Mr. Kraus is $65,168. Messrs. Steyn, Gingrich, Cranch and Howard did not make personal use of Company-owned aircraft during those 12 months, so no income was imputed to them.
Column (i) also includes the aggregate incremental cost to our Company of certain other expenses and perquisites, including leased cars, drivers, contributions to the Profit Sharing Plan, life insurance premiums, medical and dental coverage, office space, administrative assistance, business club dues and parking, as applicable.
In accordance with the Kraus Employment Agreement and the Restricted Holding Unit Grant, Mr. Kraus is paid the cash distributions payable with respect to his unvested restricted Holding Units and a dollar amount equal to the cash distributions payable with respect to the number of any Holding Units that are withheld by AllianceBernstein to cover Mr. Kraus’s withholding tax obligations as the Holding Units vest.
For 2010, column (i) includes:
for Mr. Kraus, $3,711,437 for quarterly distributions related to his Restricted Holding Unit Grant ($3,288,239 of which was paid on Holding Units Mr. Kraus owned and $423,198 of which was paid on Holding Units that had been withheld to cover taxes), $348,141 for personal use of aircraft, $181,610 for personal use of a car and driver (including lease costs ($25,732), driver compensation ($134,579) and other car-related costs ($21,299), such as parking, gas, tolls, and repairs and maintenance) and $74,582 for gross-ups related to imputed income for personal use of aircraft and car, and a $12,250 contribution to the Profit Sharing Plan.
for Mr. Steyn, $220,585 for quarterly distributions on Holding Units awarded as long-term incentive compensation and a $32,107 contribution to the Alliance Trust Full Self Invested Personal Pension (a profit sharing plan for our U.K. employees).
for Mr. Gingrich, $142,922 for quarterly distributions on Holding Units awarded as long-term incentive compensation, a $12,250 contribution to the Profit Sharing Plan and $414 of life insurance premiums.
for Mr. Cranch, $58,186 for quarterly distributions on Holding Units awarded as long-term incentive compensation, a $12,250 contribution to the Profit Sharing Plan and $1,188 of life insurance premiums.
For Mr. Howard, $138 of life insurance premiums.
for Mr. Joseph, $625,011 in severance, $38,288 for quarterly distributions on Holding Units awarded as long-term incentive compensation, $20,037 for personal use of a car (including lease costs ($6,000) and other car-related costs ($14,037), such as parking, gas, tolls, and repairs and maintenance), a $9,750 contribution to the Profit Sharing Plan, $7,326 of life insurance premiums and $7,383 in business club dues.
Grants of Plan-based Awards in 2010
The following table describes each grant of an award made to a named executive officer during 2010 under the 2010 Plan, an equity compensation plan:
|
Estimated Future
Payouts
Under
Non-Equity
Incentive Plan
Awards
|
Estimated Future
Payouts
Under
Equity Incentive
Plan Awards
|
|||||||||||||||||||||||||||||||||||||||||||
|
Name
|
Grant
Date
|
Thres-
hold
($)
|
Target
($)
|
Maximum
($)
|
Thres-
hold
(#)
|
Target
(#)
|
Maximum
(#)
|
All
Other
Stock
Awards:
Number
of
Shares of
Stock or
Units
(#)
|
All
Other
Option
Awards:
Number of
Securities
Under-
lying
Options
(#)
|
Exercise
or Base
Price
of
Option
Awards
($/Sh)
|
Grant
Date
Fair
Value
of Stock
and
Option
Awards
($)
|
|||||||||||||||||||||||||||||||||
|
(a)
|
(b)
|
(c)
|
(d)
|
(e)
|
(f)
|
(g)
|
(h)
|
(i)
|
(j)
|
(k)
|
(l)
|
|||||||||||||||||||||||||||||||||
|
Peter S. Kraus
|
— | — | — | — | — | — | — | — | — | — | — | |||||||||||||||||||||||||||||||||
|
David A. Steyn
(1)
|
12/10/10
|
— | — | — | — | — | — | 149,316 | — | — | 3,541,776 | |||||||||||||||||||||||||||||||||
|
James A. Gingrich
(1)
|
12/10/10
|
— | — | — | — | — | — | 111,253 | — | — | 2,638,921 | |||||||||||||||||||||||||||||||||
|
Laurence E. Cranch
(1)
|
12/10/10
|
— | — | — | — | — | — | 47,376 | — | — | 1,123,759 | |||||||||||||||||||||||||||||||||
|
John B. Howard
(1)
|
12/10/10
|
— | — | — | — | — | — | 163,243 | — | — | 3,872,124 | |||||||||||||||||||||||||||||||||
|
Robert H. Joseph, Jr.
(2)
|
12/10/10
|
— | — | — | — | — | — | 17,285 | — | — | 410,000 | |||||||||||||||||||||||||||||||||
|
12/01/10
|
— | — | — | — | — | — | 26,975 | — | — | 625,011 | ||||||||||||||||||||||||||||||||||
|
(1)
|
Except as described below in footnote (2), amounts shown in column (l) reflect 2010 awards under the ICAP and the 2010 Plan, an equity compensation plan, and can also be found in column (e) of the Summary Compensation Table.
|
|
(2)
|
Mr. Joseph’s amounts in column (l) also reflect 2010 awards under the ICAP and the 2010 Plan. However, the $410,000 award, which constitutes a portion of his 2010 year-end compensation, is reflected in column (e) of the Summary Compensation Table while the $625,011 award, which constitutes his severance payment, is reflected in column (i) of the Summary Compensation Table.
For additional information regarding Mr. Joseph’s compensation, see “Compensation Elements for Executive Officers – Former Chief Financial Officer Arrangements” in this Item 11
.
|
Outstanding Equity Awards at 2010 Fiscal Year-End
The following table describes any outstanding equity awards as of December 31, 2010 of our named executive officers:
|
Option Awards
|
Holding Unit Awards
|
|||||||||||||||||||||||||||||||||||
|
Name
|
Number of
Securities
Underlying
Unexercised
Options
Exercisable
(#)
|
Number of
Securities
Underlying
Unexercised
Options
Unexercisable
(#)
|
Equity
Incentive
Plan
Awards:
Number of
Securities
Underlying
Unexercised
Unearned
Options
(#)
|
Option
Exercise
Price
($)
|
Option
Expiration
Date
|
Number
of Shares
or Units
of Stock
That
Have Not
Vested
(#)
|
Market
Value
of Shares
or Units
of Stock
That
Have
Not
Vested
($)
|
Equity
Incentive
Plan
Awards:
Number of
Unearned
Shares,
Units or
Other
Rights
That Have
Not
Vested
(#)
|
Equity
Incentive
Plan
Awards:
Market
or Payout
Value of
Unearned
Shares,
Units or
Other
Rights
That
Have Not
Vested
($)
|
|||||||||||||||||||||||||||
|
(a)
|
(b)
|
(c)
|
(d)
|
(e)
|
(f)
|
(g)
|
(h)
|
(i)
|
(j)
|
|||||||||||||||||||||||||||
|
|
||||||||||||||||||||||||||||||||||||
|
Peter S. Kraus
(1)
|
— | — | — | — | — | 1,633,231 | 38,103,279 | — | — | |||||||||||||||||||||||||||
|
David A. Steyn
(2)
|
— | — | — | — | — | 258,877 | 6,039,600 | — | — | |||||||||||||||||||||||||||
|
James A. Gingrich
(3)(4)
|
52,706 | 210,827 | — | 17.05 |
1/23/19
|
182,241 | 4,251,683 | — | — | |||||||||||||||||||||||||||
|
Laurence E. Cranch
(5)(6)
|
15,669 | 62,679 | — | 17.05 |
1/23/19
|
76,276 | 1,779,519 | — | — | |||||||||||||||||||||||||||
|
John B. Howard
(7)
|
— | — | — | — | — | 163,243 | 3,808,459 | — | — | |||||||||||||||||||||||||||
|
Robert H. Joseph, Jr.
(8)
|
— | — | — | — | — | — | — | — | — | |||||||||||||||||||||||||||
_____________
|
(1)
|
Mr. Kraus’s Restricted Holding Unit Grant vested in 20% increments on each of December 19, 2009 and 2010 and is scheduled to vest in additional 20% increments on each of December 19, 2011, 2012 and 2013.
|
|
(2)
|
Mr. Steyn was awarded (i) 149,316 restricted Holding Units in December 2010 that vest in 25% increments on each of December 1, 2011, 2012, 2013 and 2014, and (ii) 146,083 restricted Holding Units in December 2009, 25% of which vested on December 1, 2010 and the remainder of which are scheduled to vest in additional 25% increments on each of December 1, 2011, 2012 and 2013.
|
|
(3)
|
Mr. Gingrich was awarded (i) 111,253 restricted Holding Units in December 2010 that vest in 25% increments on each of December 1, 2011, 2012, 2013 and 2014, and (ii) 94,650 restricted Holding Units in December 2009, 25% of which vested on December 1, 2010 and the remainder of which are scheduled to vest in additional 25% increments on each of December 1, 2011, 2012 and 2013.
|
|
(4)
|
Mr. Gingrich was granted 263,533 options to buy Holding Units in January 2009, 20% of which vested and became exercisable on each of January 23, 2010 and 2011 and the remainder of which are scheduled to vest and become exercisable in additional 20% increments on each of January 23, 2012, 2013 and 2014.
|
|
(5)
|
Mr. Cranch was awarded (i) 47,376 restricted Holding Units in December 2010 that vest in 25% increments on each of December 1, 2011, 2012, 2013 and 2014, and (ii) 38,534 restricted Holding Units in December 2009, 25% of which vested on December 1, 2010 and the remainder of which are scheduled to vest in additional 25% increments on each of December 1, 2011, 2012 and 2013.
|
|
(6)
|
Mr. Cranch was granted 78,348 options to buy Holding Units in January 2009, all of which are deemed to have vested as of December 31, 2010 because Mr. Cranch qualifies for retirement under a “Rule of 70” provision included in the award agreement. As a result, Mr. Cranch’s options are deemed not to be subject to a substantial risk of forfeiture. Mr. Cranch qualified for retirement under the Rule of 70 as of December 31, 2010 because he was at least 55 years old and his age (64), when added to his years of service (6), equaled 70. However, like Mr. Gingrich, 20% of Mr. Cranch’s options became exercisable on each of January 23, 2010 and 2011 and the remainder of Mr. Cranch’s options are scheduled to become exercisable in additional 20% increments on each of January 23, 2012, 2013 and 2014.
|
|
(7)
|
Mr. Howard was awarded 163,243 restricted Holding Units in December 2010 that were scheduled to vest in 25% increments on each of December 1, 2011, 2012, 2013 and 2014. However, he forfeits these restricted Holding Units as a result of his resignation.
|
|
(8)
|
As a result of his retirement on December 31, 2010, Mr. Joseph forfeited his outstanding option awards.
|
Option Exercises and Holding Units Vested in 2010
The following table describes any Holding Units held by our named executive officers that vested during 2010:
|
Option Awards
|
Holding Unit Awards
|
|||||||||||||||
|
Name
|
Number of Units
Acquired on Exercise
(#)
|
Value Realized
on Exercise
($)
|
Number of Holding Units
Acquired on Vesting
(#)
|
Value Realized
on Vesting
($)
|
||||||||||||
|
(a)
|
(b)
|
(c)
|
(d)
|
(e)
|
||||||||||||
|
|
|
|
|
|
||||||||||||
|
Peter S. Kraus
|
— | — | 544,411 | 12,314,577 | ||||||||||||
|
David A. Steyn
|
— | — | 36,521 | 846,192 | ||||||||||||
|
James A. Gingrich
|
— | — | 23,663 | 548,272 | ||||||||||||
|
Laurence E. Cranch
|
— | — | 9,634 | 223,220 | ||||||||||||
|
John B. Howard
|
— | — | — | — | ||||||||||||
|
Robert H. Joseph, Jr.
(1)
|
— | — | 44,260 | 1,035,011 | ||||||||||||
__________________
|
(1)
|
As a result of the terms of Mr. Joseph’s retirement, he is deemed not to have a substantial risk of forfeiting the restricted Holding Unit awards he received as part of his 2010 compensation. We have therefore disclosed these amounts in columns (d) and (e) of this table. The 44,260 restricted Holding Units are scheduled to be distributed in 25% increments on each of December 1, 2011, 2012, 2013 and 2014, contingent on Mr. Joseph’s continued compliance with the agreements and covenants in the Joseph Retirement Agreement.
|
Pension Benefits for 2010
The following table describes the accumulated benefit under our Company pension plan, the Retirement Plan, belonging to each of our named executive officers as of December 31, 2010, if any:
|
Name
|
Plan Name
|
Number of Years
Credited Service
(#)
|
Present
Value of
Accumulated
Benefit
($)
|
Payments During
Last Fiscal Year
($)
|
||||||||||||
|
(a)
|
(b)
|
(c)
|
(d)
|
(e)
|
||||||||||||
|
|
|
|
|
|
||||||||||||
|
Peter S. Kraus
|
n/a | — | — | — | ||||||||||||
|
David A. Steyn
|
n/a | — | — | — | ||||||||||||
|
James A. Gingrich
|
n/a | — | — | — | ||||||||||||
|
Laurence E. Cranch
|
n/a | — | — | — | ||||||||||||
|
John B. Howard
|
n/a | — | — | — | ||||||||||||
|
Robert H. Joseph, Jr.
|
Retirement Plan
|
24 | 601,298 | (1) | — | |||||||||||
_____________
|
(1)
|
The Executive Committee determined that no new benefits will be accrued under the Retirement Plan, effective as of the close of business on December 31, 2008.
|
The Retirement Plan is a qualified, noncontributory, defined benefit retirement plan covering current and former employees who were employed in the United States prior to October 2, 2000. Each participant’s benefits are determined under a formula which takes into account years of credited service through December 31, 2008, the participant’s average compensation over prescribed periods and Social Security covered compensation. The maximum annual benefit payable under the Retirement Plan may not exceed the lesser of $100,000 or 100% of a participant’s average aggregate compensation for the three consecutive years in which he or she received the highest aggregate compensation from us or such lower limit as may be imposed by the Code on certain participants by reason of their coverage under another qualified retirement plan we maintain. The Retirement Plan generally provides for payments to, or on behalf of, each vested employee upon such employee’s retirement at the normal retirement age provided under the plan or later, although provision is made for payment of early retirement benefits on an actuarially reduced basis. Normal retirement age under the plan is 65. Death benefits are payable to the surviving spouse of an employee who dies with a vested benefit under the Retirement Plan. For additional information regarding interest rates and actuarial assumptions,
see Note 15 to AllianceBernstein’s consolidated financial statements in Item 8.
A participant in the Retirement Plan is eligible for early retirement upon termination of employment if the participant is at least age 55 and the sum of the participant’s age and years of credited service equals at least 80. Mr. Joseph’s employment terminated as of December 31, 2010. At that time, he had attained age 63 and earned 26 years of service. (For purposes of determining early retirement eligibility, years of service after benefits under the Retirement Plan ceased accruing are included.) Because the total of Mr. Joseph’s age and years of service exceeded 80, he was eligible for early retirement as of his termination date.
The early retirement benefit is “actuarially” reduced for each month that payments begin before age 65. The reduction to the pension is made because it costs more money to provide payments over a longer period of time. In other words, the monthly benefit commencing at the early retirement date has the same value as a monthly benefit beginning at age 65. The actuarial adjustment factors are based on the UP-1984 mortality table, with a one-year age set-back, and a 6% interest rate, as specified in the Retirement Plan. For example, a 63 year old participant (like Mr. Joseph) would receive approximately 82% of the accrued benefit that would have been payable at age 65 and a 64 year old participant would receive approximately 90% of the accrued benefit.
Non-Qualified Deferred Compensation for 2010
The following table describes our named executive officers’ non-qualified deferred compensation contributions, earnings and distributions during 2010 and their non-qualified deferred compensation plan balances as of December 31, 2010:
|
Name
|
Executive
Contributions
in Last FY
($)
|
Registrant
Contributions
in Last FY
($)
|
Aggregate
Earnings
in Last FY
($)
|
Aggregate
Withdrawals/
Distributions
($)
|
Aggregate
Balance at
Last FYE
($)
|
|||||||||||||||
|
(a)
|
(b)
|
(c)
|
(d)
|
(e)
|
(f)
|
|||||||||||||||
|
Peter S. Kraus
|
— | — | — | — | — | |||||||||||||||
|
David A. Steyn
|
— | — | 126,466 | (1,312,483 | ) | 5,533,558 | ||||||||||||||
|
James A. Gingrich
|
— | — | 215,339 | (1,217,254 | ) | 3,324,549 | ||||||||||||||
|
Laurence E. Cranch
|
— | — | 237,777 | — | 2,681,858 | |||||||||||||||
|
John B. Howard
|
— | — | — | — | — | |||||||||||||||
|
Robert H. Joseph, Jr.
|
— | — | 45,286 | (1,201,629 | ) | 2,805,663 | ||||||||||||||
For Messrs. Steyn, Gingrich, Cranch and Joseph, amounts shown reflect their respective interests from pre-2009 awards under the ICAP. For additional information about the ICAP,
see Note 16 to AllianceBernstein’s consolidated financial statements in Item 8
. For individuals (Messrs. Gingrich, Cranch and Joseph) with notional investments in Holding Units, amounts of quarterly distributions on such Holding Units are reflected as earnings in column (d) and, to the extent distributed to the named executive officer, as distributions in column (e). Column (f) includes the value of all notional investments as of the close of business on December 31, 2010. As of that date, Messrs. Gingrich, Cranch and Joseph notionally held 16,566 Holding Units, 8,139 Holding Units and 42,883 Holding Units, respectively, as a result of pre-2009 awards under the ICAP. Mr. Steyn did not notionally hold any Holding Units.
Potential Payments upon Termination or Change in Control
In connection with the commencement of Mr. Kraus’s employment, on December 19, 2008, he received the Restricted Holding Unit Grant. During Mr. Kraus’s Employment Term, AllianceBernstein has no commitment to pay any cash bonuses to Mr. Kraus beyond the $6 million in 2009 (with any additional bonuses being entirely at the discretion of the Board) or to make any additional equity-based awards to him. Consequently, for 2010 and subsequent years during the Employment Term, the totality of Mr. Kraus’s compensation (other than his salary and absent any additional awards the Board may choose to grant) will be dependent on the level of cash distributions on the restricted Holding Units granted to him and the evolution of the trading price of Holding Units, thereby directly aligning Mr. Kraus’s interests with those of other holders of Holding Units. For additional information about Mr. Kraus’s compensation,
see “Overview of our Chief Executive Officer’s Compensation” above
.
The Kraus Employment Agreement contains a number of accelerated vesting clauses, including immediate vesting upon a “change in control” of our firm (
i.e.,
AXA, our parent company, ceasing to control the management of AllianceBernstein’s business or Holding ceasing to be publicly traded); and immediate vesting upon certain qualifying terminations of employment, including termination of Mr. Kraus’s employment (i) by AllianceBernstein “without cause”, (ii) by Mr. Kraus for “good reason” and (iii) due to death or disability.
The change-in-control provisions in the Kraus Employment Agreement were required by Mr. Kraus as part of his negotiation in order to assure him that AllianceBernstein would continue to be operated as a separately-managed entity, and with a certain degree of independence, and that Holding would continue as a publicly-traded entity. Both AXA and Mr. Kraus believe that this arrangement adds significant value to AllianceBernstein. The Board understood that AXA had no intention of changing this arrangement during the term of Mr. Kraus’s Employment Term and thus concluded that the change-in-control provisions were acceptable and necessary in order to recruit Mr. Kraus.
The provisions requiring accelerated vesting upon termination without cause or for good reason were required by Mr. Kraus in order to preserve the value of his long-term incentive compensation arrangement. The Board agreed to these provisions because they were typical of executive compensation agreements for executives at Mr. Kraus’s level and because the Board concluded that they were necessary to recruit Mr. Kraus.
The Board concluded that the change-in-control and termination provisions in the Kraus Employment Agreement fit into AllianceBernstein’s overall compensation objectives because they permitted AllianceBernstein to attract and retain a highly-qualified chief executive officer, were consistent with AXA’s and the Board’s expectations with respect to the manner in which AllianceBernstein and Holding would be operated from 2009 to 2013, were consistent with the Board’s expectations that Mr. Kraus would not be terminated without cause and that no steps would be taken that would provide him with the ability to terminate the agreement with good reason (and thus that there was no inconsistency between these provisions and AllianceBernstein’s goal of providing Mr. Kraus with effective incentives for future performance), and to align his long-term interests with those of AllianceBernstein’s Unitholders and clients.
It is the current intention and expectation of AllianceBernstein’s management and the Board that provisions similar to those included in the Kraus Employment Agreement, such as change-in-control, termination by AllianceBernstein without cause and termination by an executive for good reason, will not be included in employment agreements with other executives of AllianceBernstein, and thus that the decisions made with respect to the Kraus Employment Agreement should not affect the decisions made in the future regarding compensation elements for other executives.
There are no other amounts payable to the named executive officers upon a change in control of our Company or a qualified termination, except death, disability and retirement.
The following table sets forth estimated payments and benefits to which our named executive officers would have been entitled upon a change in control of AllianceBernstein or the specified terminations of employment as of December 31, 2010:
|
Name
|
Cash
Payments
(1)
($)
|
Acceleration
or Grant of
Restricted
Holding
Unit
Awards
(2)
($)
|
Acceleration
of Option
Awards
(3)
($)
|
Other
Benefits
($)
|
||||||||||||
| (a) |
(b)
|
(c) | (d) | (e) | ||||||||||||
|
Peter S. Kraus
Change in control
|
— | 38,103,279 | — | 20,473 | ||||||||||||
|
Termination by AllianceBernstein without cause
|
— | 38,103,279 | — | 20,473 | ||||||||||||
|
Termination by Mr. Kraus for good reason
|
— | 38,103,279 | — | 20,473 | ||||||||||||
|
Death or disability
(4)(5)
|
— | 38,103,279 | — | 20,473 | ||||||||||||
|
David A. Steyn
Death or disability
(6)
|
2,539,623 | 6,039,600 | — | — | ||||||||||||
|
James A. Gingrich
Death or disability
(6)
|
896,463 | 4,330,774 | 1,323,994 | — | ||||||||||||
|
Laurence E. Cranch
Death or disability
(6)
|
265,722 | 1,805,729 | — | — | ||||||||||||
|
John B. Howard
Death or disability
(6)
|
— | 3,808,459 | — | — | ||||||||||||
|
Robert H. Joseph, Jr.
(7)
Retirement
|
97,500 | 625,011 | — | 5,099 | ||||||||||||
_____________
|
(1)
|
For Messrs. Steyn, Gingrich and Cranch, amounts shown represent pre-2009 awards under the ICAP. In addition, it is our expectation that each would receive a cash severance payment on the termination of his employment. As the amounts of any such cash severance payments would be determined at the time of such termination, we are unable to estimate such amounts. For Mr. Joseph, the amount shown represents the six months of salary continuation to which he is entitled under the Joseph Retirement Agreement.
|
|
(2)
|
Restricted Holding Unit awards made in December 2010 to Messrs. Steyn, Gingrich, Cranch, Howard and Joseph are subject to a “Rule of 65” retirement provision. An award recipient qualifies for “retirement” if the recipient is at least 55 years old and has completed at least 10 years of service. Any award recipient who qualifies for “retirement” retains the right to receive distribution of the underlying Holding Units post-retirement provided the recipient complies with agreements and covenants in the award agreement until the Holding Units have fully vested. Of our named executive officers, only Mr. Joseph qualifies for retirement under the Rule of 65.
|
|
(3)
|
Options awarded to Messrs. Gingrich and Cranch, which are
set forth in the “Outstanding Equity Awards at 2010 Fiscal Year-End” table above
, are subject to a “Rule of 70” retirement provision. An award recipient qualifies for retirement if the recipient: (i) is at least 65 years old; or (ii) is at least 55 years old and the recipient’s age and years of service added together equal or exceed 70. An award recipient who qualifies for retirement continues to vest post-retirement provided the recipient complies with any agreements and covenants enforced by AllianceBernstein.
Mr. Gingrich did not qualify for retirement under the Rule of 70. Mr. Cranch did qualify for retirement under the Rule of 70 because, as of December 31, 2010, his age (64), when added to his years of service (6), equaled 70. The amount reflected in column (d) for Mr. Cranch is zero because his 78,348 options are deemed to have vested as of December 31, 2010. The intrinsic value of Mr. Cranch’s unexercisable options is $393,624 as of December 31, 2010. Of his 78,348 options, 20% became exercisable on each of January 23, 2010 and 2011 and the remainder are scheduled to become exercisable on each of January 23, 2012, 2013 and 2014.
|
|
(4)
|
The Kraus Employment Agreement defines “Disability” as a good faith determination by AllianceBernstein that Mr. Kraus is physically or mentally incapacitated and has been unable for a period of 120 days in the aggregate during any twelve-month period to perform substantially all of the duties for which he is responsible immediately before the commencement of the incapacity.
|
|
(5)
|
Upon termination of Mr. Kraus’s employment due to death or disability, AllianceBernstein will provide at its expense continued health and welfare benefits for Mr. Kraus, his spouse and his dependants through the end of the calendar year in which termination occurs. Thereafter, until the date Mr. Kraus (or, in the case of his spouse, his spouse) reaches age 65, AllianceBernstein will provide Mr. Kraus and his spouse with access to participation in AllianceBernstein’s medical plans at Mr. Kraus’s (or his spouse’s) sole expense based on a reasonably determined fair market value premium rate.
|
|
(6)
|
“Disability” is defined in the Incentive Compensation Program award agreements of Messrs. Steyn, Gingrich, Cranch, Howard and Joseph, and in the Special Option Program award agreements of Messrs. Gingrich and Cranch, as the inability to engage in any substantial gainful activity by reason of any medically determinable physical or mental impairment that can be expected to last for a continuous period of not less than 12 months, as determined by the carrier of the long-term disability insurance program maintained by AllianceBernstein or its affiliate that covers the executive officer.
|
|
(7)
|
Mr. Joesph retired on December 31, 2010. For additional information relating to Mr. Joseph’s $625,011 severance payment and other benefits that he received in connection with his retirement,
see “Compensation Elements for Executive Officers—Former Chief Financial Officer Arrangements” above
.
|
Director Compensation in 2010
The following table describes how we compensated our independent directors during 2010:
|
Name
|
Fees
Earned or
Paid in
Cash
($)
|
Stock
Awards
(1)(3)
($)
|
Option
Awards
(2)(3)
($)
|
Non-Equity
Incentive
Plan
Compensation
($)
|
Change in
Pension
Value and
Nonqualified
Deferred
Compensation
Earnings
($)
|
All Other
Compensation
($)
|
Total
($)
|
|||||||||||||||||||||
|
(a)
|
(b)
|
(c)
|
(d)
|
(e)
|
(f)
|
(g)
|
(h)
|
|||||||||||||||||||||
|
|
|
|
|
|
|
|
|
|||||||||||||||||||||
|
Deborah S. Hechinger
|
55,750 | 30,000 | 30,000 | — | — | — | 115,750 | |||||||||||||||||||||
|
Weston M. Hicks
|
55,000 | 30,000 | 30,000 | — | — | — | 115,000 | |||||||||||||||||||||
|
Lorie A. Slutsky
|
66,250 | 30,000 | 30,000 | — | — | — | 126,250 | |||||||||||||||||||||
|
A.W. (Pete) Smith, Jr.
|
65,500 | 30,000 | 30,000 | — | — | — | 125,500 | |||||||||||||||||||||
|
Peter J. Tobin
|
80,500 | 30,000 | 30,000 | — | — | — | 140,500 | |||||||||||||||||||||
_____________
|
(1)
|
As of December 31, 2010, our independent directors had outstanding restricted Holding Unit awards in the following amounts: Ms. Hechinger held 3,505 Holding Units, Mr. Hicks held 8,967 Holding Units, Ms. Slutsky held 5,416 Holding Units, Mr. Smith held 5,486 Holding Units and Mr. Tobin held 4,628 Holding Units.
|
|
(2)
|
As of December 31, 2010, our independent directors had outstanding option awards in the following amounts: Ms. Hechinger held options to buy 16,127 Holding Units, Mr. Hicks held options to buy 18,555 Holding Units, Ms. Slutsky held options to buy 47,706 Holding Units, Mr. Smith held options to buy 18,555 Holding Units and Mr. Tobin held options to buy 62,956 Holding Units.
|
|
(3)
|
Reflects the aggregate grant date fair value of the awards calculated in accordance with FASB ASC Topic 718. For the assumptions made in determining these values,
see Note 17 to AllianceBernstein’s consolidated financial statements in Item 8.
|
The General Partner only pays fees, and makes equity awards, to directors who are not employed by our Company or by any of our affiliates. Through December 31, 2010, these fees and awards consisted of:
|
|
•
|
an annual retainer of $40,000 (paid quarterly after any quarter during which a director serves on the Board);
|
|
|
•
|
a fee of $1,500 for participating in a meeting of the Board, or any duly constituted committee of the Board, whether in person or by telephone;
|
|
|
•
|
an annual retainer of $15,000 for acting as Chair of the Audit Committee;
|
|
|
•
|
an annual retainer of $7,500 for acting as Chair of the Governance Committee; and
|
|
|
•
|
an annual equity-based grant under an equity compensation plan consisting of:
|
|
|
•
|
restricted Holding Units having a value of $30,000 based on the closing price of a Holding Unit on the grant date as reported for NYSE composite transactions; and
|
|
|
•
|
options to buy Holding Units with a grant date value of $30,000 calculated using the Black-Scholes method.
|
During 2010, at a regularly-scheduled meeting of the Board, 1,055 restricted Holding Units and options to buy 5,182 Holding Units at $28.46 per Unit were granted to each of Ms. Hechinger, Mr. Hicks, Ms. Slutsky, Mr. Smith and Mr. Tobin. Such grants have generally been made at the May meeting of the Board. The date of the meeting was set at a Board meeting in 2009. The exercise price of the options was the closing price on the NYSE on June 3, 2010. For information about how the Black-Scholes value was calculated,
see Note 17 to AllianceBernstein’s consolidated financial statements in Item 8
. Options granted to independent directors become exercisable ratably over three years. Restricted Holding Units granted to independent directors “cliff” vest after three years (
i.e.
, 100% of the award is distributed on the third anniversary of the grant date). In order to avoid any perception that our directors’ independence might be impaired, these options and restricted Holding Units are not forfeitable. Accordingly, vesting and exercisability of options continues following a director’s resignation from the Board. Restricted Holding Units vest and are distributed as soon as administratively feasible following an independent director’s resignation from the Board.
The General Partner may reimburse any director for reasonable expenses incurred in participating in Board meetings. Holding and AllianceBernstein, in turn, reimburse the General Partner for expenses incurred by the General Partner on their behalf, including amounts in respect of directors’ fees and expenses. These reimbursements are subject to any relevant provisions of the Holding Partnership Agreement and AllianceBernstein Partnership Agreement.
On July 30, 2010, at a regularly-scheduled meeting of the Board, the Board increased the independent directors’ annual retainer from $40,000 to $50,000, the restricted Holding Unit award value from $30,000 to $60,000 and the option value from $30,000 to $60,000. These increases were effective as of January 1, 2011.
|
Item
12
.
|
Security Ownership of Certain Beneficial Owners and Management and Related Stockholder Matters
|
Securities Authorized for Issuance under Equity Compensation Plans
The following table summarizes the Holding Units to be issued pursuant to our equity compensation plans as of December 31, 2010:
Equity Compensation Plan Information
|
Plan Category
|
Number of
securities to be
issued upon
exercise of
outstanding
options, warrants
and rights
|
Weighted average
exercise price of
outstanding
options, warrants
and rights
|
Number of
securities
remaining
available for future
issuance
(1)
|
|||||||||
|
(a)
|
(b)
|
(c)
|
||||||||||
|
Equity compensation plans approved by security holders
|
10,217,871 | $ | 41.24 | 47,514,885 | ||||||||
|
Equity compensation plans not approved by security holders
|
— | — | — | |||||||||
|
Total
|
10,217,871 | $ | 41.24 | 47,514,885 | ||||||||
_____________
|
(1)
|
All Holding Units remaining available for future issuance are under the 2010 Plan.
|
There are no AllianceBernstein Units to be issued pursuant to an equity compensation plan.
For information about our equity compensation plans (1993 Unit Option Plan, 1997 Plan, 2010 Plan, Century Club Plan),
see Note 17 to AllianceBernstein’s consolidated financial statements in Item 8.
Principal Security Holders
As of December 31, 2010, we had no information that any person beneficially owned more than 5% of the outstanding Holding Units.
As of December 31, 2010, we had no information that any person beneficially owned more than 5% of the outstanding AllianceBernstein Units except AXA and certain of its wholly-owned subsidiaries as reported on Schedule 13D/A, Forms 3 and Forms 4 filed with the SEC on April 1, 2009 pursuant to the Exchange Act.
The table below and the notes following it have been prepared in reliance upon such filings for the nature of ownership and an explanation of overlapping ownership.
|
Name and Address of
Beneficial Owner
|
Amount and Nature of Beneficial
Ownership Reported on Schedule
|
Percent of Class
|
|
|
AXA
(1)(2)(3)(4)
|
25 avenue Matignon 75008
Paris, France
|
170,121,745
(4)(5)
|
61.2%
(4)(5)
|
_____________
|
(1)
|
Based on information provided by AXA Financial, on December 31, 2010, AXA and certain of its subsidiaries beneficially owned all of AXA Financial’s outstanding common stock. For insurance regulatory purposes the shares of common stock of AXA Financial beneficially owned by AXA and its subsidiaries have been deposited into a voting trust (
“Voting Trust”
), the term of which has been extended until May 12, 2012. The trustees of the Voting Trust
(
“Voting Trustees”
) are Henri de Castries, Denis Duverne and Christopher M. Condron. Messrs. de Castries and Duverne serve on the Board of Directors of AXA, while Mr. Condron served on the Management Committee of AXA until his retirement on January 1, 2011. The Voting Trustees have agreed to exercise their voting rights to protect the legitimate economic interests of AXA, but with a view to ensuring that certain minority shareholders of AXA do not exercise control over AXA Financial or certain of its insurance subsidiaries.
|
|
(2)
|
Based on information provided by AXA, as of December 31, 2010, 13.94% of the issued ordinary shares (representing 21.87% of the voting power) of AXA were owned directly and indirectly by two French mutual insurance companies engaged in the Property & Casualty insurance business and the Life & Savings insurance business in France
(
“Mutuelles AXA”
).
|
|
(3)
|
The Voting Trustees and the Mutuelles AXA, as a group, may be deemed to be beneficial owners of all AllianceBernstein Units beneficially owned by AXA and its subsidiaries. By virtue of the provisions of the Voting Trust Agreement, AXA may be deemed to have shared voting power with respect to the AllianceBernstein Units. AXA and its subsidiaries have the power to dispose or direct the disposition of all shares of the capital stock of AXA Financial deposited in the Voting Trust. The Mutuelles AXA, as a group, may be deemed to share the power to vote or to direct the vote and to dispose or to direct the disposition of all the AllianceBernstein Units beneficially owned by AXA and its subsidiaries. The address of each of AXA and the Voting Trustees is 25 avenue Matignon, 75008 Paris, France. The address of the Mutuelles AXA is 26, rue Drouot, 75009 Paris, France.
|
|
(4)
|
By reason of their relationships, AXA, the Voting Trustees, the Mutuelles AXA, AXA America Holdings, Inc. (a wholly-owned subsidiary of AXA), AXA IM Rose Inc. (a 95.27%-owned subsidiary of AXA), AXA Financial, AXA Equitable, AXA Financial (Bermuda) Ltd. (a wholly-owned subsidiary of AXA Financial), Coliseum Reinsurance Company (a wholly-owned subsidiary of AXA Financial), ACMC Inc. (a wholly-owned subsidiary of AXA Financial), MONY and MLOA may be deemed to share the power to vote or to direct the vote and to dispose or direct the disposition of all or a portion of the 170,121,745 AllianceBernstein Units.
|
|
(5)
|
As indicated above in note 4, AXA owns approximately 95.27% of AXA IM Rose Inc., meaning that approximately 4.73% of the AllianceBernstein Units beneficially owned by AXA IM Rose Inc. as of December 31, 2010 were not beneficially owned by AXA. As a result, as of December 31, 2010, AXA beneficially owned 168,139,878 AllianceBernstein Units, or 60.46% of the issued and outstanding AllianceBernstein Units.
|
As of December 31, 2010, Holding was the record owner of 105,086,799, or 37.8%, of the issued and outstanding AllianceBernstein Units.
Management
The following table sets forth, as of December 31, 2010, the beneficial ownership of Holding Units by each director and named executive officer of the General Partner and by all directors and executive officers as a group:
|
Name of Beneficial Owner
|
Number of Holding
Units and Nature of
Beneficial Ownership
|
Percent of Class
|
||||||
|
|
|
|||||||
|
Peter S. Kraus
(1)(2)
|
2,164,302 | 2.1 | % | |||||
|
Dominique Carrel-Billiard
(1)
|
— | * | ||||||
|
Christopher M. Condron
(1)
|
40,000 | * | ||||||
|
Henri de Castries
(1)
|
2,000 | * | ||||||
|
Denis Duverne
(1)
|
2,000 | * | ||||||
|
Richard S. Dziadzio
(1)
|
— | * | ||||||
|
Steven G. Elliott
|
— | * | ||||||
|
Deborah S. Hechinger
(3)
|
9,377 | * | ||||||
|
Weston M. Hicks
(4)
|
17,267 | * | ||||||
|
Nick Lane
(1)
|
100 | * | ||||||
|
Kevin Molloy
(1)
|
370 | * | ||||||
|
Mark Pearson
(1)
|
— | * | ||||||
|
Lorie A. Slutsky
(1)(5)
|
42,867 | * | ||||||
|
A.W. (Pete) Smith, Jr.
(6)
|
13,786 | * | ||||||
|
Peter J. Tobin
(1)(7)
|
57,329 | * | ||||||
|
David A. Steyn
(1)(8)
|
286,351 | * | ||||||
|
James A. Gingrich
(1)(9)
|
365,987 | * | ||||||
|
Laurence E. Cranch
(1)(10)
|
125,386 | * | ||||||
|
John B. Howard
(1)(11)
|
163,243 | * | ||||||
|
Robert H. Joseph, Jr.
(12)
|
156,132 | * | ||||||
|
All directors and executive officers of the General Partner as a group (21 persons)
(13)(14)
|
3,530,125 | 3.4 | % | |||||
_____________
|
*
|
Number of Holding Units listed represents less than 1% of the Units outstanding.
|
|
(1)
|
Excludes Holding Units beneficially owned by AXA and its subsidiaries. Ms. Slutsky and Messrs. Kraus, Carrel-Billiard, de Castries, Duverne, Dziadzio, Lane, Molloy, Pearson and Tobin are directors and/or officers of AXA, AXA IM, AXA Financial, and/or AXA Equitable. Messrs. Kraus, Steyn, Gingrich, Cranch and Howard are directors and/or officers of the General Partner.
|
|
(2)
|
In connection with the commencement of Mr. Kraus’s employment, on December 19, 2008, he was granted 2,722,052 restricted Holding Units. Subject to accelerated vesting clauses in the Kraus Employment Agreement (
e.g.
, immediate vesting upon AXA ceasing to control the management of AllianceBernstein’s business or Holding ceasing to be publicly traded and certain qualifying terminations of employment), Mr. Kraus’s restricted Holding Units will continue to vest ratably on each of the first five anniversaries of December 19, 2008, which commenced December 19, 2009, provided, with respect to each installment, Mr. Kraus continues to be employed by AllianceBernstein on the vesting date. AllianceBernstein withheld 280,263 Holding Units and 277,487 Holding Units, respectively, from Mr. Kraus’s distributions when the 2009 and 2010 tranches of his Restricted Holding Unit Grant vested to cover withholding tax obligations.
|
|
(3)
|
Includes 5,872 Holding Units Ms. Hechinger can acquire within 60 days under an AllianceBernstein option plan.
|
|
(4)
|
Includes 8,300 Holding Units Mr. Hicks can acquire within 60 days under an AllianceBernstein option plan.
|
|
(5
)
|
Includes 37,451 Holding Units Ms. Slutsky can acquire within 60 days under an AllianceBernstein option plan.
|
|
(6)
|
Includes 8,300 Holding Units Mr. Smith can acquire within 60 days under an AllianceBernstein option plan.
|
|
(7)
|
Includes 52,701 Holding Units Mr. Tobin can acquire within 60 days under an AllianceBernstein option plan.
|
|
(8)
|
Includes 258,877 restricted Holding Units awarded to Mr. Steyn as long-term incentive compensation that have not yet vested or been distributed to him, and 27,474 Holding Units held by Alliance Trust SIPP f/b/o Mr. Steyn.
|
|
(9)
|
Includes 105,413 Holding Units Mr. Gingrich can acquire within 60 days under an AllianceBernstein option plan and 222,468 restricted Holding Units awarded to Mr. Gingrich as long-term incentive compensation that have not yet vested or been distributed to him.
|
|
(10)
|
Represents 31,339 Holding Units Mr. Cranch can acquire within 60 days under an AllianceBernstein option plan and 94,047 restricted Holding Units awarded to Mr. Cranch as long-term incentive compensation that have not yet vested or been distributed to him.
|
|
(11)
|
Represents 163,243 restricted Holding Units awarded to Mr. Howard in December 2010. Mr. Howard forfeits these restricted Holding Units as a result of his resignation in January 2011.
|
|
(12)
|
Includes 98,647 restricted Holding Units awarded to Mr. Joseph as long-term incentive compensation that have not yet vested or been distributed to him. These restricted Holding Units will vest and be distributed to Mr. Joseph in accordance with the terms of ICAP provided he continues to comply with the agreements and covenants in the Joseph Retirement Agreement. For additional information regarding the Joseph Retirement Agreement,
see “Compensation Elements for Executive Officers—Former Chief Financial Officer Arrangements” above
.
|
|
(13)
|
Includes 249,376 Holding Units the directors and executive officers as a group can acquire within 60 days under AllianceBernstein option plans.
|
|
(14)
|
Includes 2,547,098 restricted Holding Units awarded to the executive officers as a group as long-term incentive compensation that have not yet vested or been distributed to them.
|
As of December 31, 2010, our directors and executive officers did not beneficially own any AllianceBernstein Units.
The following table sets forth, as of December 31, 2010, the beneficial ownership of the common stock of AXA by each director and named executive officer of the General Partner and by all directors and executive officers as a group:
AXA Common Stock
(1)
|
Name of Beneficial Owner
|
Number of Shares
and Nature of
Beneficial Ownership
|
Percent of Class
|
||||||
|
|
|
|
||||||
|
Peter S. Kraus
|
— | * | ||||||
|
Dominique Carrel-Billiard
(2)
|
149,331 | * | ||||||
|
Christopher M. Condron
(3)
|
3,808,490 | * | ||||||
|
Henri de Castries
(4)
|
5,912,487 | * | ||||||
|
Denis Duverne
(5)
|
2,590,692 | * | ||||||
|
Richard S. Dziadzio
(6)
|
242,468 | * | ||||||
|
Steven G. Elliott
|
— | * | ||||||
|
Deborah S. Hechinger
|
— | * | ||||||
|
Weston M. Hicks
|
— | * | ||||||
|
Nick Lane
(7)
|
45,143 | * | ||||||
|
Kevin Molloy
(8)
|
34,395 | * | ||||||
|
Mark Pearson
(9)
|
123,325 | * | ||||||
|
Lorie A. Slutsky
(10)
|
11,544 | * | ||||||
|
A.W. (Pete) Smith, Jr.
|
— | * | ||||||
|
Peter J. Tobin
(11)
|
32,531 | * | ||||||
|
David A. Steyn
|
— | * | ||||||
|
James A. Gingrich
|
— | * | ||||||
|
Laurence E. Cranch
|
— | * | ||||||
|
John B. Howard
|
— | * | ||||||
|
Robert H. Joseph, Jr.
|
— | * | ||||||
|
All directors and executive officers of the General Partner as a group (21 persons)
(12)
|
12,950,406 | * | ||||||
_____________
|
*
|
Number of shares listed represents less than 1% of the outstanding AXA common stock.
|
|
(1)
|
Holdings of AXA American Depositary Shares (
“ADS”
) are expressed as their equivalent in AXA common stock. Each AXA ADS represents the right to receive one AXA ordinary share.
|
|
(2)
|
Includes 108,568 shares Mr. Carrel-Billiard can acquire within 60 days under option plans. Also includes 268 unvested AXA IM performance shares, which are paid out when vested based on the price of AXA at that time.
|
|
(3)
|
Includes 2,909,219 shares Mr. Condron can acquire within 60 days under option plans. Also includes 181,117 unvested performance units, which are paid out when vested based on the price of ADSs at that time and are subject to achievement of internal performance conditions. Also includes 342,654 deferred restricted ADS units under AXA’s Variable Deferred Compensation Plan for Executives.
|
|
(4)
|
Includes 4,155,967 shares Mr. de Castries can acquire within 60 days under option plans. Also includes 220,742 unvested AXA performance shares, which are paid out when vested based on the price of AXA at that time and are subject to achievement of internal performance conditions.
|
|
(5)
|
Includes 1,689,202 shares Mr. Duverne can acquire within 60 days under option plans. Also includes 178,598 unvested AXA performance shares, which are paid out when vested based on the price of AXA at that time and are subject to achievement of internal performance conditions.
|
|
(6)
|
Includes 194,240 shares Mr. Dziadzio can acquire within 60 days under option plans. Also includes 28,764 unvested performance units, which are paid out when vested based on the price of ADSs at that time and are subject to achievement of internal performance conditions.
|
|
(7)
|
Includes 10,672 shares Mr. Lane can acquire within 60 days under options plans. Also includes 10,996 unvested performance units, which are paid out when vested based on the price of AXA at that time and are subject to achievement of internal performance conditions.
|
|
(8)
|
Includes 15,280 shares Mr. Molloy can acquire within 60 days under options plans. Also includes 8,291 unvested performance units, which are paid out when vested based on the price of AXA at that time and are subject to achievement of internal performance conditions.
|
|
(9)
|
Includes 50,247 shares Mr. Pearson can acquire within 60 days under options plans. Also includes 28,251 unvested performance units, which are paid out when vested based on the price of AXA at that time and are subject to achievement of internal performance conditions.
|
|
(10)
|
Includes 1,270 shares Ms. Slutsky can acquire within 60 days under option plans.
|
|
(11)
|
Includes 5,881 shares Mr. Tobin can acquire within 60 days under option plans.
|
|
(12)
|
Includes 9,140,546 shares the directors and executive officers as a group can acquire within 60 days under option plans.
|
Partnership Matters
The General Partner makes all decisions relating to the management of AllianceBernstein and Holding. The General Partner has agreed that it will conduct no business other than managing AllianceBernstein and Holding, although it may make certain investments for its own account. Conflicts of interest, however, could arise between AllianceBernstein and Holding, the General Partner and the Unitholders
of both Partnerships.
Section 17-403(b) of the Delaware Revised Uniform Limited Partnership Act (
“Delaware Act”
) states in substance that, except as provided in the Delaware Act or the applicable partnership agreement, a general partner of a limited partnership has the liabilities of a general partner in a general partnership governed by the Delaware Uniform Partnership Law (as in effect on July 11, 1999) to the partnership and to the other partners. Accordingly, while under Delaware law a general partner of a limited partnership is liable as a fiduciary to the other partners, those fiduciary obligations may be altered by the terms of the applicable partnership agreement. The AllianceBernstein Partnership Agreement and Holding Partnership Agreement both set forth limitations on the duties and liabilities of the General Partner. Each partnership agreement provides that the General Partner is not liable for monetary damages for errors in judgment or for breach of fiduciary duty (including breach of any duty of care or loyalty) unless it is established (the person asserting such liability having the burden of proof) that the General Partner’s action or failure to act involved an act or omission undertaken with deliberate intent to cause injury, with reckless disregard for the best interests of the Partnerships or with actual bad faith on the part of the General Partner, or constituted actual fraud. Whenever the AllianceBernstein Partnership Agreement and the Holding Partnership Agreement provide that the General Partner is permitted or required to make a decision (i) in its “discretion” or under a grant of similar authority or latitude, the General Partner is entitled to consider only such interests and factors as it desires and has no duty or obligation to consider any interest of or other factors affecting the Partnerships or any Unitholder of AllianceBernstein or Holding or (ii) in its “good faith” or under another express standard, the General Partner will act under that express standard and will not be subject to any other or different standard imposed by the AllianceBernstein Partnership Agreement and the Holding Partnership Agreement or applicable law or in equity or otherwise. The partnership agreements further provide that to the extent that, at law or in equity, the General Partner has duties (including fiduciary duties) and liabilities relating thereto to either Partnership or any partner, the General Partner acting under the AllianceBernstein Partnership Agreement or the Holding Partnership Agreement, as applicable, will not be liable to the Partnerships or any partner for its good faith reliance on the provisions of the partnership agreement.
In addition, the AllianceBernstein Partnership Agreement and the Holding Partnership Agreement grant broad rights of indemnification to the General Partner and its directors and affiliates and authorize AllianceBernstein and Holding to enter into indemnification agreements with the directors, officers, partners, employees and agents of AllianceBernstein and its affiliates and Holding and its affiliates. The Partnerships have granted broad rights of indemnification to officers and employees of AllianceBernstein and Holding. The foregoing indemnification provisions are not exclusive, and the Partnerships are authorized to enter into additional indemnification arrangements. AllianceBernstein and Holding have obtained directors and officers/errors and omissions liability insurance.
The AllianceBernstein Partnership Agreement and the Holding Partnership Agreement also allow transactions between AllianceBernstein and Holding and the General Partner or its affiliates if the transactions are on terms determined by the General Partner to be comparable to (or more favorable to AllianceBernstein or Holding than) those that would prevail with an unaffiliated party. The partnership agreements provide that those transactions are deemed to meet that standard if such transactions are approved by a majority of those directors of the General Partner who are not directors, officers or employees of any affiliate of the General Partner (other than AllianceBernstein and its subsidiaries or Holding) or, if in the reasonable and good faith judgment of the General Partner, the transactions are on terms substantially comparable to (or more favorable to AllianceBernstein or Holding than) those that would prevail in a transaction with an unaffiliated party.
The AllianceBernstein Partnership Agreement and the Holding Partnership Agreement expressly permit all affiliates of the General Partner (including AXA Equitable and its other subsidiaries) to compete, directly or indirectly, with AllianceBernstein and Holding, to engage in any business or other activity and to exploit any opportunity, including those that may be available to AllianceBernstein and Holding. AXA, AXA Financial, AXA Equitable and certain of their subsidiaries currently compete with AllianceBernstein. (
See “Business—Competition” in Item 1
.) The partnership agreements further provide that, except to the extent that a decision or action by the General Partner is taken with the specific intent of providing an improper benefit to an affiliate of the General Partner to the detriment of AllianceBernstein or Holding, there is no liability or obligation with respect to, and no challenge of, decisions or actions of the General Partner that would otherwise be subject to claims or other challenges as improperly benefiting affiliates of the General Partner to the detriment of the Partnerships or otherwise involving any conflict of interest or breach of a duty of loyalty or similar fiduciary obligation.
Section 17-1101(c) of the Delaware Act provides that it is the policy of the Delaware Act to give maximum effect to the principle of freedom of contract and to the enforceability of partnership agreements. Further, Section 17-1101(d) of the Delaware Act provides in part that to the extent that, at law or in equity, a partner has duties (including fiduciary duties) to a limited partnership or to another partner, those duties may be expanded, restricted, or eliminated by provisions in a partnership agreement (provided that a partnership agreement may not eliminate the implied contractual covenant of good faith and fair dealing). In addition, Section 17-1101(f) of the Delaware Act provides that a partnership agreement may limit or eliminate any or all liability of a partner to a limited partnership or another partner for breach of contract or breach of duties (including fiduciary duties); provided, however, that a partnership agreement may not limit or eliminate liability for any act or omission that constitutes a bad faith violation of the implied contractual covenant of good faith and fair dealing. Decisions of the Delaware courts have recognized the right of parties, under the above provisions of the Delaware Act, to alter by the terms of a partnership agreement otherwise applicable fiduciary duties and liability for breach of duties. However, the Delaware courts have required that a partnership agreement make clear the intent of the parties to displace otherwise applicable fiduciary duties (the otherwise applicable fiduciary duties often being referred to as “default” fiduciary duties). Judicial inquiry into whether a partnership agreement is sufficiently clear to displace default fiduciary duties is necessarily fact driven and is made on a case by case basis. Accordingly, the effectiveness of displacing default fiduciary obligations and liabilities of general partners continues to be a developing area of the law and it is not certain to what extent the foregoing provisions of the AllianceBernstein Partnership Agreement and the Holding Partnership Agreement are enforceable under Delaware law.
|
Item
13.
|
Certain Relationships and Related Transactions, and Director Independence
|
Policies and Procedures Regarding Transactions with Related Persons
Each of the Holding Partnership Agreement and the AllianceBernstein Partnership Agreement expressly permits AXA and its affiliates, which includes AXA Equitable and its affiliates (collectively,
“AXA Affiliates”
), to provide services to AllianceBernstein and Holding if the terms of the transaction are approved by the General Partner in good faith as being comparable to (or more favorable to each such partnership than) those that would prevail in a transaction with an unaffiliated party. This requirement is conclusively presumed to be satisfied as to any transaction or arrangement that (i) in the reasonable and good faith judgment of the General Partner, meets that unaffiliated party standard, or (ii) has been approved by a majority of those directors of the General Partner who are not also directors, officers or employees of an affiliate of the General Partner.
In practice, our management pricing committees review investment advisory agreements with AXA Affiliates, which is the manner in which the General Partner reaches a judgment regarding the appropriateness of the fees. Other transactions with AXA Affiliates are submitted to the Audit Committee for their review and approval; in 2010, the unanimous consent of the Audit Committee constituted the consent of three of five independent directors on the Board. We are not aware of any transaction during 2010 between our company and any related person with respect to which these procedures were not followed.
We do not have written policies regarding the employment of immediate family members of any of our related persons. Compensation and benefits for all of our employees is established in accordance with our employment and compensation practices applicable to employees with equivalent qualifications and responsibilities who hold similar positions.
Financial Arrangements with AXA Affiliates
The General Partner has, in its reasonable and good faith judgment (based on its knowledge of, and inquiry with respect to, comparable arrangements with or between unaffiliated parties), approved the following arrangements with AXA Equitable and its affiliates as being comparable to, or more favorable to AllianceBernstein than, those that would prevail in a transaction with an unaffiliated party.
The following tables summarize transactions between AllianceBernstein and related persons during 2010. The first table summarizes services we provide to related persons, and the second table summarizes services our related persons provide to us:
|
Parties
(1)
|
General Description of Relationship
(2)
|
Amounts Received
or Accrued for in 2010
|
||||
|
|
|
|||||
|
AXA Equitable
(3)
|
We provide investment management services and ancillary accounting, valuation, reporting, treasury and other services to the general and separate accounts of AXA Equitable and its insurance company subsidiaries.
|
$ |
31,899,000
(of which $449,000 relates to the ancillary services)
|
|||
|
EQAT, AXA Enterprise Trust and AXA Premier VIP Trust
|
We serve as sub-adviser to these open-end mutual funds, each of which is sponsored by a subsidiary of AXA Financial.
|
$ | 31,332,000 | |||
|
AXA Asia Pacific
(3)
|
|
$ | 30,104,000 | |||
|
AXA Life Japan Limited
(3)
|
|
$ | 10,599,000 | |||
|
MONY Life Insurance Company and its subsidiaries
(3)(4)
|
We provide investment management services and ancillary accounting services.
|
$ |
8,907,000
(of which $133,000 relates to the ancillary services)
|
|||
|
AXA Bermuda
(3)
|
|
$ | 4,863,000 | |||
|
AXA Sun Life
(3)
|
|
$ | 2,895,000 | |||
|
AXA Winterthur
(3)
|
|
$ | 2,456,000 | |||
|
AXA France
(3)
|
|
$ | 2,197,000 | |||
|
AXA Rosenberg Investment Management Asia Pacific
(3)
|
|
$ | 1,997,000 | |||
|
AXA Belgium
(3)
|
|
$ | 1,881,000 | |||
|
AXA (Canada)
(3)
|
|
$ | 1,731,000 | |||
|
AXA U.K. Group Pension Scheme
|
|
$ | 1,394,000 | |||
|
AXA Corporate Solutions
(3)
|
|
$ | 1,347,000 | |||
|
AXA Germany
(3)
|
|
$ | 1,254,000 | |||
|
AXA Investment Managers Ltd. Paris
(3)
|
$ | 435,000 | ||||
|
AXA Mediterranean
(3)
|
$ | 195,000 | ||||
|
AXA Reinsurance Company
(3)
|
|
$ | 185,000 | |||
|
AXA General Insurance Hong Kong Ltd.
(3)
|
|
$ | 162,000 | |||
|
AXA Foundation, Inc., a subsidiary of AXA Financial
|
|
$ | 145,000 | |||
_____________
|
(1)
|
AllianceBernstein or one of its subsidiaries is a party to each transaction.
|
|
(2)
|
We provide investment management services unless otherwise indicated.
|
|
(3)
|
This entity is a subsidiary of AXA. AXA is an indirect parent of AllianceBernstein.
|
|
(4)
|
Subsidiaries include MONY Life Insurance Company of America and U.S. Financial Life Insurance Company.
|
|
Parties
(1)(2)
|
General Description of Relationship
|
Amounts Paid
or Accrued for in 2010
|
||||
|
|
|
|||||
|
AXA Business Services Pvt. Ltd.
|
AXA Business Services provides data processing services and support for certain investment operations functions.
|
$ | 9,088,000 | |||
|
AXA Advisors
|
AXA Advisors distributes certain of our Retail Products and provides Private Client referrals.
|
$ | 6,896,000 | |||
|
AXA Equitable
|
We are covered by various insurance policies maintained by AXA Equitable.
|
$ | 4,495,000 | |||
|
AXA Technology Services India Pvt. Ltd.
|
AXA Technology Services India Pvt. Ltd. provides certain data processing services and functions.
|
$ | 3,966,000 | |||
|
AXA Group Solutions Pvt. Ltd.
|
AXA Group Solution Pvt. Ltd provides maintenance and development support for applications.
|
$ | 2,679,000 | |||
|
AXA Advisors
|
AXA Advisors sells shares of our mutual funds under Distribution Services and Educational Support agreements.
|
$ | 2,143,000 | |||
|
GIE Informatique AXA (“GIE”)
|
GIE provides cooperative technology development and procurement services to us and to various other subsidiaries of AXA.
|
$ | 1,028,000 | |||
_____________
|
(1)
|
AllianceBernstein is a party to each transaction.
|
|
(2)
|
Each entity is a subsidiary of AXA. AXA is an indirect parent of AllianceBernstein.
|
Additional Transactions with Related Persons
On February 1, 2001, AllianceBernstein and AXA Asia Pacific entered into a Subscription and Shareholders Agreement under which they established two investment management companies in Australia and New Zealand named AllianceBernstein Australia Limited and AllianceBernstein New Zealand Limited, respectively. AXA Asia Pacific and AllianceBernstein each own fifty percent (50%) of the equity of each company and have equal representation on the boards. These companies currently manage approximately $24.2 billion in client assets, and earned approximately $37.1 million in management fees in 2010 (of which $12.8 million is included in the table above). During the first quarter of 2010, AllianceBernstein and AXA Asia Pacific combined their New Zealand operations (including client service, portfolio management and operations) with and into their Australia operations.
AXA Advisors was our
14
th
largest distributor of U.S. Funds in 2010, for which we paid AXA Advisors sales concessions on sales of approximately $507 million. Various subsidiaries of AXA distribute certain of our Non-U.S. Funds, for which such entities received aggregate distribution payments of approximately $114,000 in 2010.
AXA Equitable and its affiliates are not obligated to provide funds to us, except for ACMC Inc.’s and the General Partner’s obligation to fund certain of our incentive compensation and employee benefit plan obligations. ACMC Inc. and the General Partner are obligated, subject to certain limitations, to make capital contributions to AllianceBernstein in an amount equal to the payments AllianceBernstein is required to make as incentive compensation under the employment agreements entered into in connection with AXA Equitable’s 1985 acquisition of Donaldson, Lufkin and Jenrette Securities Corporation (since November 2000, a part of Credit Suisse Group) as well as obligations of AllianceBernstein to various employees and their beneficiaries under AllianceBernstein’s Capital Accumulation Plan. In 2010, ACMC Inc. made capital contributions to AllianceBernstein in the amount of approximately $4.9 million in respect of these obligations. ACMC Inc.’s obligations to make these contributions are guaranteed by
Equitable Holdings, LLC (a wholly-owned subsidiary of AXA Equitable), subject to certain limitations. All tax deductions with respect to these obligations, to the extent funded by ACMC Inc., the General Partner or Equitable Holdings, LLC, will be allocated to ACMC Inc. or the General Partner.
Arrangements with Immediate Family Members of Related Persons
During 2010, we did not have arrangements with immediate family members of our directors and executive officers.
Director Independence
See “Corporate Governance—Independence of Certain Directors” in Item 10.
|
Item
14.
|
Principal Accounting Fees and Services
|
The following table presents fees for professional audit services rendered by PricewaterhouseCoopers LLP (
“PwC”
) for the audit of AllianceBernstein’s and Holding’s annual financial statements for 2010 and 2009, respectively, and fees for other services rendered by PwC ($ in thousands):
|
2010
|
2009
|
|||||||
|
Audit fees
(1)
|
$ | 4,703 | $ | 6,173 | ||||
|
Audit related fees
(2)
|
2,952 | 2,439 | ||||||
|
Tax fees
(3)
|
2,487 | 2,167 | ||||||
|
All other fees
(4)
|
5 | 5 | ||||||
|
Total
|
$ | 10,147 | $ | 10,784 | ||||
_____________
|
(1)
|
Includes $68,330 and $87,675 paid for audit services to Holding in 2010 and 2009, respectively.
|
|
(2)
|
Audit related fees consist principally of fees for audits of financial statements of certain employee benefit plans, internal control reviews and accounting consultation.
|
|
(3)
|
Tax fees consist of fees for tax consultation and tax compliance services.
|
|
(4)
|
All other fees in 2010 and 2009 consisted of miscellaneous non-audit services.
|
On November 9, 2005, the Audit Committee adopted a policy to pre-approve audit and non-audit service engagements with the independent registered public accounting firm. This policy was revised on August 3, 2006. The independent registered public accounting firm is to provide annually a comprehensive and detailed schedule of each proposed audit and non-audit service to be performed. The Audit Committee then affirmatively indicates its approval of the listed engagements. Engagements that are not listed, but that are of similar scope and size to those listed and approved, may be deemed to be approved, if the fee for such service is less than $100,000. In addition, the Audit Committee has delegated to its chairman the ability to approve any permissible non-audit engagement where the fees are expected to be less than $100,000.
|
Item
15.
|
Exhibits, Financial Statement Schedules
|
|
(a)
|
There is no document filed as part of this Form 10-K.
|
Financial Statement Schedule.
Attached to this Form 10-K is a schedule describing Valuation and Qualifying Account-Allowance for Doubtful Accounts for the three years ended December 31, 2010, 2009 and 2008. PwC’s report regarding the schedule is also attached.
|
(b)
|
Exhibits.
|
The following exhibits required to be filed by Item 601 of Regulation S-K are filed herewith or incorporated by reference herein, as indicated:
|
Exhibit
|
Description
|
|
3.01
|
Amended and Restated Certificate of Limited Partnership dated February 24, 2006 of Holding (incorporated by reference to Exhibit 99.06 to Form 8-K, as filed February 24, 2006).
|
|
3.02
|
Amendment No. 1 dated February 24, 2006 to Amended and Restated Agreement of Limited Partnership of Holding (incorporated by reference to Exhibit 3.1 to Form 10-Q for the quarterly period ended September 30, 2006, as filed November 8, 2006).
|
|
3.03
|
Amended and Restated Agreement of Limited Partnership dated October 29, 1999 of Alliance Capital Management Holding L.P. (incorporated by reference to Exhibit 3.2 to Form 10-K for the fiscal year ended December 31, 2003, as filed March 10, 2004).
|
|
3.04
|
Amended and Restated Certificate of Limited Partnership dated February 24, 2006 of AllianceBernstein (incorporated by reference to Exhibit 99.07 to Form 8-K, as filed February 24, 2006).
|
|
3.05
|
Amendment No. 1 dated February 24, 2006 to Amended and Restated Agreement of Limited Partnership of AllianceBernstein (incorporated by reference to Exhibit 3.2 to Form 10-Q for the quarterly period ended September 30, 2006, as filed November 8, 2006).
|
|
3.06
|
Amended and Restated Agreement of Limited Partnership dated October 29, 1999 of Alliance Capital Management L.P. (incorporated by reference to Exhibit 3.3 to Form 10-K for the fiscal year ended December 31, 2003, as filed March 10, 2004).
|
|
3.07
|
Certificate of Amendment to the Certificate of Incorporation of AllianceBernstein Corporation (incorporated by reference to Exhibit 99.08 to Form 8-K, as filed February 24, 2006).
|
|
3.08
|
AllianceBernstein Corporation By-Laws with amendments through February 24, 2006 (incorporated by reference to Exhibit 99.09 to Form 8-K, as filed February 24, 2006).
|
|
10.01
|
AllianceBernstein L.P. 2010 Long Term Incentive Plan.*
|
|
10.02
|
Post-July 1, 2010 AllianceBernstein Incentive Compensation Award Program.*
|
|
10.03
|
Form of 2010 Award Agreement under Incentive Compensation Award Program and 2010 Long Term Incentive Plan.*
|
|
10.04
|
Retirement Agreement between Robert H. Joseph, Jr., AllianceBernstein Corporation and AllianceBernstein L.P., dated as of March 3, 2010.*
|
|
10.05
|
Summary of AllianceBernstein L.P.’s Lease at 1345 Avenue of the Americas, New York, New York 10105.
|
|
10.06
|
Guidelines for Transfer of AllianceBernstein L.P. Units.
|
|
10.07
|
Revolving Credit Agreement, dated as of December 9, 2010, among AllianceBernstein L.P., Sanford C. Bernstein & Co., LLC, Bank of America, N.A., as Administrative Agent, Merrill Lynch, Pierce, Fenner & Smith Incorporated, J.P. Morgan Securities LLC and Citigroup Global Markets Inc., as Joint Lead Arrangers and Joint Book Managers, and the other lenders party thereto (incorporated by reference to Exhibit 10.01 to Form 8-K , as filed December 13, 2010).
|
|
10.08
|
Form of Award Agreement under the Special Option Program (incorporated by reference to Exhibit 10.05 to Form 10-K for the fiscal year ended December 31, 2008, as filed February 23, 2009).*
|
|
10.09
|
Amended and Restated Commercial Paper Dealer Agreement, dated as of February 10, 2009, among Banc of America Securities LLC, Merrill Lynch Money Markets Inc., Deutsche Bank Securities Inc. and AllianceBernstein L.P. (incorporated by reference to Exhibit 10.11 to Form 10-K for the fiscal year ended December 31, 2008, as filed February 23, 2009).
|
|
10.10
|
Employment Agreement among Peter S. Kraus, AllianceBernstein Corporation, AllianceBernstein Holding L.P. and AllianceBernstein L.P., dated as of December 19, 2008 (incorporated by reference to Exhibit 99.02 to Form 8-K, as filed December 24, 2008).*
|
|
10.11
|
Amended and Restated 1997 Long Term Incentive Plan, as amended through November 28, 2007 (incorporated by reference to Exhibit 10.02 to Form 10-K for the fiscal year ended December 31, 2007, as filed February 25, 2008).*
|
|
Exhibit
|
Description
|
|
10.12
|
Amended and Restated Issuing and Paying Agency Agreement, dated as of May 3, 2006 (incorporated by reference to Exhibit 10.2 to Form 10-Q for the quarterly period ended March 31, 2006, as filed May 8, 2006).
|
|
10.13
|
Investment Advisory and Management Agreement for MONY Life Insurance Company (incorporated by reference to Exhibit 10.4 to Form 10-K for the fiscal year ended December 31, 2004, as filed March 15, 2005).
|
|
10.14
|
Investment Advisory and Management Agreement for the General Account of AXA Equitable Life Insurance Company (incorporated by reference to Exhibit 10.5 to Form 10-K for the fiscal year ended December 31, 2004, as filed March 15, 2005).
|
|
10.15
|
Alliance Capital Management L.P. Partners Plan of Repurchase adopted as of February 20, 2003 (incorporated by reference to Exhibit 10.2 to Form 10-K for the fiscal year ended December 31, 2002, as filed March 27, 2003).
|
|
10.16
|
Services Agreement dated as of April 22, 2001 between Alliance Capital Management L.P. and AXA Equitable Life Insurance Company (incorporated by reference to Exhibit 10.19 to Form 10-K for the fiscal year ended December 31, 2001, as filed March 28, 2002).
|
|
10.17
|
Alliance Capital Management L.P. Annual Elective Deferral Plan (incorporated by reference to Exhibit 99 to Form S-8, as filed November 6, 2000).*
|
|
10.18
|
Extendible Commercial Notes Dealer Agreement, dated as of December 14, 1999 (incorporated by reference to Exhibit 10.10 to the Form 10-K for the fiscal year ended December 31, 1999, as filed March 28, 2000).
|
|
10.19
|
Amended and Restated Investment Advisory and Management Agreement dated January 1, 1999 among Alliance Capital Management Holding L.P., Alliance Corporate Finance Group Incorporated, and AXA Equitable Life Insurance Company (incorporated by reference to Exhibit (a)(6) to Form 10-Q/A for the quarterly period ended September 30, 1999, as filed on September 28, 2000).
|
|
10.20
|
Amended and Restated Accounting, Valuation, Reporting and Treasury Services Agreement dated January 1, 1999 between Alliance Capital Management Holding L.P., Alliance Corporate Finance Group Incorporated, and AXA Equitable Life Insurance Company (incorporated by reference to Exhibit (a)(7) to the Form 10-Q/A for the quarterly period ended September 30, 1999, as filed September 28, 2000).
|
|
10.21
|
Alliance Capital Accumulation Plan (incorporated by reference to Exhibit 10.11 to Form 10-K for the fiscal year ended December 31, 1988, as filed March 31, 1989).*
|
|
12.01
|
AllianceBernstein Consolidated Ratio of Earnings to Fixed Charges in respect of the years ended December 31, 2010, 2009 and 2008.
|
|
Subsidiaries of AllianceBernstein.
|
|
|
Consents of PricewaterhouseCoopers LLP.
|
|
|
Certification of Mr. Kraus furnished pursuant to Section 302 of the Sarbanes-Oxley Act of 2002.
|
|
|
Certification of Mr. Farrell furnished pursuant to Section 302 of the Sarbanes-Oxley Act of 2002.
|
|
|
Certification of Mr. Kraus furnished for the purpose of complying with Rule 13a-14(b) or Rule 15d-14(b) of the Securities Exchange Act of 1934 and 18 U.S.C. Section 1350, as adopted pursuant to Section 906 of the Sarbanes-Oxley Act of 2002.
|
|
|
Certification of Mr. Farrell furnished for the purpose of complying with Rule 13a-14(b) or Rule 15d-14(b) of the Securities Exchange Act of 1934 and 18 U.S.C. Section 1350, as adopted pursuant to Section 906 of the Sarbanes-Oxley Act of 2002.
|
|
|
101.INS
|
XBRL Instance Document.
|
|
101.SCH
|
XBRL Taxonomy Extension Schema.
|
|
101.CAL
|
XBRL Taxonomy Extension Calculation Linkbase.
|
|
101.LAB
|
XBRL Taxonomy Extension Label Linkbase.
|
|
101.PRE
|
XBRL Taxonomy Extension Presentation Linkbase.
|
|
*
|
Denotes a compensatory plan or arrangement
|
Sign
atures
Pursuant to the requirements of Section 13 or 15(d) of the Exchange Act, the Registrant has duly caused this report to be signed on its behalf by the undersigned, thereunto duly authorized.
|
AllianceBernstein Holding L.P.
|
||
|
Date: February 10, 2011
|
By:
|
/s/ Peter S. Kraus
|
|
Peter S. Kraus
|
||
|
Chairman of the Board and Chief Executive Officer
|
||
Pursuant to the requirements of the Exchange Act, this report has been signed by the following persons on behalf of the Registrant and in the capacities and on the dates indicated.
|
Date: February 10, 2011
|
/s/ Edward J. Farrell
|
|
Edward J. Farrell
|
|
|
Chief Accounting Officer and
Interim Chief Financial Officer
|
Directors
|
/s/ Peter S. Kraus
|
/s/ Deborah S. Hechinger
|
|
|
Peter S. Kraus
|
Deborah S. Hechinger
|
|
|
Chairman of the Board
|
Director
|
|
|
/s/ Dominique Carrel-Billiard
|
/s/ Weston M. Hicks
|
|
|
Dominique Carrel-Billiard
|
Weston M. Hicks
|
|
|
Director
|
Director
|
|
|
/s/ Christopher M. Condron
|
/s/ Kevin Molloy
|
|
|
Christopher M. Condron
|
Kevin Molloy
|
|
|
Director
|
Director
|
|
|
/s/ Henri de Castries
|
/s/ Mark Pearson
|
|
|
Henri de Castries
|
Mark Pearson
|
|
|
Director
|
Director
|
|
|
/s/ Denis Duverne
|
/s/ Lorie A. Slutsky
|
|
|
Denis Duverne
|
Lorie A. Slutsky
|
|
|
Director
|
Director
|
|
|
/s/ Richard S. Dziadzio
|
/s/ A.W. (Pete) Smith, Jr.
|
|
|
Richard S. Dziadzio
|
A.W. (Pete) Smith, Jr.
|
|
|
Director
|
Director
|
|
|
/s/ Steven G. Elliott
|
/s/ Peter J. Tobin
|
|
|
Steven G. Elliott
|
Peter J. Tobin
|
|
|
Director
|
Director
|
SCHEDULE I I
AllianceBernstein L.P.
Valuation and Qualifying Account - Allowance for Doubtful Accounts
For the Three Years Ending December 31, 2010, 2009 and 2008
|
Description
|
Balance at
Beginning of
Period
|
Credited to
Costs and
Expenses
|
Deductions
|
Balance at
End of Period
|
||||||||||||
|
(in thousands)
|
||||||||||||||||
|
For the year ended December 31, 2008
|
$ | 1,792 | $ | (192 | ) | $ | 112 | (a) | $ | 1,488 | ||||||
|
For the year ended December 31, 2009
|
$ | 1,488 | $ | (88 | ) | $ | 7 | (b) | $ | 1,393 | ||||||
|
For the year ended December 31, 2010
|
$ | 1,393 | $ | (504 | ) | $ | 13 | (c) | $ | 876 | ||||||
(a) Includes accounts written-off as uncollectible of $31 and a net reduction to the allowance balance of $81.
(b) Includes accounts written-off as uncollectible of $41 and a net addition to the allowance balance of $34.
(c) Includes accounts written-off as uncollectible of $48 and a net addition to the allowance balance of $35.
Report of Independent Registered Public Accounting Firm on
Financial Statement Schedule
To the General Partner and Unitholders
AllianceBernstein L.P.:
Our audits of the consolidated financial statements and of the effectiveness of internal control over financial reporting referred to in our report dated February 10, 2011 also included an audit of the financial statement schedule listed in Item 15(a) of this Form 10-K. In our opinion, this financial statement schedule presents fairly, in all material respects, the information set forth therein when read in conjunction with the related consolidated financial statements.
/s/ PricewaterhouseCoopers LLP
New York, New York
February 10, 2011
TABLE OF CONTENTS
Part IItem 1. BusinessItem 1A. Risk FactorsItem 1B. Unresolved Staff CommentsItem 2. PropertiesItem 3. Legal ProceedingsItem 4. (removed and Reserved)Part IIItem 5. Market For Registrant S Common Equity, Related Stockholder Matters and Issuer Purchases Of Equity SecuritiesItem 6. Selected Financial DataItem 7. Management S Discussion and Analysis Of Financial Condition and Results Of OperationsItem 7A. Quantitative and Qualitative Disclosures About Market RiskItem 8. Financial Statements and Supplementary DataItem 9. Changes in and Disagreements with Accountants on Accounting and Financial DisclosureItem 9A. Controls and ProceduresItem 9B. Other InformationPart IIIItem 10. Directors, Executive Officers and Corporate GovernanceItem 11. Executive CompensationItem 12 . Security Ownership Of Certain Beneficial Owners and Management and Related Stockholder MattersItem 13. Certain Relationships and Related Transactions, and Director IndependenceItem 14. Principal Accounting Fees and ServicesPart IVItem 15. Exhibits, Financial Statement Schedules