ALLIANCEBERNSTEIN HOLDING L.P.
10-Ks and 10-Qs
|
|
|
|
|
UNITED STATES
SECURITIES AND EXCHANGE COMMISSION
WASHINGTON, D.C. 20549
________________________________________________________________________________________________________________________________
FORM 10-K
|
x
|
ANNUAL REPORT PURSUANT TO SECTION 13 OR 15(d) OF THE SECURITIES EXCHANGE ACT OF 1934
|
For the Fiscal Year Ended
December 31, 2015
OR
|
o
|
TRANSITION REPORT PURSUANT TO SECTION 13 OR 15(d) OF THE SECURITIES EXCHANGE ACT OF 1934
|
For the transition period from to
Commission file number 001-09818
________________________________________________________________________________________________________________________________
ALLIANCEBERNSTEIN HOLDING L.P.
(Exact name of registrant as specified in its charter)
|
Delaware
|
|
13-3434400
|
|
(State or other jurisdiction of incorporation or organization)
|
|
(I.R.S. Employer Identification No.)
|
|
|
|
|
|
1345 Avenue of the Americas, New York, N.Y.
|
|
10105
|
|
(Address of principal executive offices)
|
|
(Zip Code)
|
Registrant’s telephone number, including area code: (212) 969-1000
Securities registered pursuant to Section 12(b) of the Act:
|
Title of Class
|
|
Name of each exchange on which registered
|
|
units representing assignments of beneficial ownership of limited partnership interests
|
|
New York Stock Exchange
|
Securities registered pursuant to Section 12(g) of the Act: None
Indicate by check mark if the registrant is a well-known seasoned issuer, as defined in Rule 405 of the Securities Act. Yes
x
No
o
Indicate by check mark if the registrant is not required to file reports pursuant to Section 13 or Section 15(d) of the Act. Yes
o
No
x
Indicate by check mark whether the registrant (1) has filed all reports required to be filed by Section 13 or 15(d) of the Securities Exchange Act of 1934 during the preceding 12 months (or for such shorter period that the registrant was required to file such reports), and (2) has been subject to such filing requirements for the past 90 days. Yes
x
No
o
Indicate by check mark whether the registrant has submitted electronically and posted on its corporate Web site, if any, every Interactive Data File required to be submitted and posted pursuant to Rule 405 of Regulation S-T (§232.405 of this chapter) during the preceding 12 months (or for such shorter period that the registrant was required to submit and post such files). Yes
x
No
o
Indicate by check mark if disclosure of delinquent filers pursuant to Item 405 of Regulation S-K (§229.405 of this chapter) is not contained herein, and will not be contained, to the best of registrant’s knowledge, in definitive proxy or information statements incorporated by reference in Part III of this Form 10-K or any amendment to this Form 10-K.
x
Indicate by check mark whether the registrant is a large accelerated filer, an accelerated filer, a non-accelerated filer or a smaller reporting company. See definitions of “accelerated filer”, “large accelerated filer” and “smaller reporting company” in Rule 12b-2 of the Exchange Act.
(Check one):
|
Large accelerated filer
x
|
Accelerated filer
o
|
Non-accelerated filer
o
|
Smaller reporting company
o
|
Indicate by check mark whether the registrant is a shell company (as defined in Rule 12b-2 of the Act). Yes
o
No
x
The aggregate market value of the units representing assignments of beneficial ownership of limited partnership interests held by non-affiliates computed by reference to the price at which such units were last sold on the New York Stock Exchange as of June 30, 2015 was approximately $2.8 billion.
The number of units representing assignments of beneficial ownership of limited partnership interests outstanding as of
December 31, 2015
was 100,044,485. (This figure includes 100,000 general partnership units having economic interests equivalent to the economic interests of the units representing assignments of beneficial ownership of limited partnership interests.)
DOCUMENTS INCORPORATED BY REFERENCE
This Form 10-K does not incorporate any document by reference.
Table of Contents
|
Glossary of Certain Defined Terms
|
ii
|
|
|
Part I
|
||
|
Item 1.
|
||
|
Item 1A.
|
||
|
Item 1B.
|
||
|
Item 2.
|
||
|
Item 3.
|
||
|
Item 4.
|
||
|
Part II
|
||
|
Item 5.
|
||
|
Item 6.
|
||
|
Item 7.
|
||
|
Item 7A.
|
||
|
Item 8.
|
||
|
Item 9.
|
||
|
Item 9A.
|
||
|
Item 9B.
|
||
|
Part III
|
||
|
Item 10.
|
||
|
Item 11.
|
||
|
Item 12.
|
||
|
Item 13.
|
||
|
Item 14.
|
||
|
Part IV
|
||
|
Item 15.
|
||
i
Glossary of Certain Defined Terms
“
AB
” – AllianceBernstein L.P. (Delaware limited partnership formerly known as Alliance Capital Management L.P., “
Alliance Capital
”), the operating partnership, and its subsidiaries and, where appropriate, its predecessors, AB Holding and ACMC, Inc. and their respective subsidiaries.
“
AB Holding
” – AllianceBernstein Holding L.P. (Delaware limited partnership).
“
AB Holding Partnership Agreement
” – the Amended and Restated Agreement of Limited Partnership of AB Holding, dated as of October 29, 1999 and as amended February 24, 2006.
“
AB Holding Units
” – units representing assignments of beneficial ownership of limited partnership interests in AB Holding.
“
AB Partnership Agreement
” – the Amended and Restated Agreement of Limited Partnership of AB, dated as of October 29, 1999 and as amended February 24, 2006.
“
AB Units
” – units of limited partnership interest in AB.
“
AUM
” – AB's assets under management.
“
AXA
” – AXA (
société anonyme
organized under the laws of France) is the holding company for the AXA Group, a worldwide leader in financial protection. AXA operates primarily in Europe, North America, the Asia/Pacific regions and, to a lesser extent, in other regions, including the Middle East, Africa and Latin America. AXA has five operating business segments: Life and Savings, Property and Casualty, International Insurance, Asset Management and Banking.
“
AXA Equitable
” – AXA Equitable Life Insurance Company (New York stock life insurance company), a subsidiary of AXA Financial, and its subsidiaries other than AB and its subsidiaries.
“
AXA Financial
” – AXA Financial, Inc. (Delaware corporation), a subsidiary of AXA.
“
Bernstein Transaction
” – AB's acquisition of the business and assets of SCB Inc., formerly known as Sanford C. Bernstein Inc., and the related assumption of the liabilities of that business, completed on October 2, 2000.
“
Exchange Act
” – the Securities Exchange Act of 1934, as amended.
“
ERISA
” – the Employee Retirement Income Security Act of 1974, as amended.
“
General Partner
” – AllianceBernstein Corporation (Delaware corporation), the general partner of AB and AB Holding and a subsidiary of AXA Equitable, and, where appropriate, ACMC, LLC, its predecessor.
“
Investment Advisers Act
” – the Investment Advisers Act of 1940, as amended.
“
Investment Company Act
” – the Investment Company Act of 1940, as amended.
“
NYSE
” – the New York Stock Exchange, Inc.
“
Partnerships
” – AB and AB Holding together.
“
SEC
” – the United States Securities and Exchange Commission.
“
Securities Act
” – the Securities Act of 1933, as amended.
“
WPS Acquisition
” – AB's acquisition of W.P. Stewart & Co., Ltd. (“
WPS
”), a concentrated growth equity investment manager, completed on December 12, 2013.
The words “
we
” and “
our
” in this Form 10-K refer collectively to AB Holding and AB and its subsidiaries, or to their officers and employees. Similarly, the words “
company
” and “
firm
” refer to both AB Holding and AB. Where the context requires distinguishing between AB Holding and AB, we identify which company is being discussed. Cross-references are in italics.
We use “
global
” in this Form 10-K to refer to all nations, including the United States; we use “
international
” or “
non-U.S.
” to refer to nations other than the United States.
We use “
emerging markets
” in this Form 10-K to refer to countries included in the Morgan Stanley Capital International (“
MSCI
”) emerging markets index, which are, as of December 31, 2015, Brazil, Chile, China, Colombia, Czech Republic, Egypt, Greece, Hungary, India, Indonesia, Malaysia, Mexico, Peru, the Philippines, Poland, Qatar, Russia, South Africa, South Korea, Taiwan, Thailand, Turkey and the United Arab Emirates.
Clients
We provide research, diversified investment management and related services globally to a broad range of clients through our three buy-side distribution channels: Institutions, Retail and Private Wealth Management, and our sell-side business, Bernstein Research Services.
See “Distribution Channels” in this Item 1
for additional information.
As of
December 31, 2015
,
2014
and
2013
, our AUM were $467 billion, $474 billion and $450 billion, respectively, and our net revenues for the years ended
December 31, 2015
,
2014
and
2013
were $3.0 billion, $3.0 billion and $2.9 billion, respectively.
AXA, our parent company, and its subsidiaries, whose AUM consist primarily of fixed income investments, together constitute our largest client. Our affiliates represented approximately 24%, 23% and 23% of our AUM as of
December 31, 2015
,
2014
and
2013
, respectively, and we earned approximately 5% of our net revenues from services we provided to our affiliates in each of
2015
,
2014
and
2013
, respectively.
See “Distribution Channels” below and “Assets Under Management” and “Net Revenues” in Item 7
for additional information regarding our AUM and net revenues.
Generally, we are compensated for our investment services on the basis of investment advisory and services fees calculated as a percentage of AUM. For additional information about our investment advisory and services fees, including performance-based fees,
see
“
Risk Factors
”
in Item 1A and “Net Revenues – Investment Advisory and Services Fees” in Item 7
.
Research
Our high-quality, in-depth research is the foundation of our business. We believe that our global team of research professionals, whose disciplines include economic, fundamental equity, fixed income and quantitative research, gives us a competitive advantage in achieving investment success for our clients. We also have experts focused on multi-asset strategies, wealth management and alternative investments.
Investment Services
Our broad range of investment services includes:
|
•
|
Actively-managed equity strategies with global and regional portfolios across capitalization ranges and investment strategies, including value, growth and core equities;
|
|
•
|
Actively-managed traditional and unconstrained fixed income strategies, including taxable and tax-exempt strategies;
|
|
•
|
Passive management, including index and enhanced index strategies;
|
|
•
|
Alternative investments, including hedge funds, fund of funds and private equity (
e.g.,
direct real estate investing); and
|
|
•
|
Multi-asset services and solutions, including dynamic asset allocation, customized target-date funds and target-risk funds.
|
Our services span various investment disciplines, including market capitalization (
e.g
., large-, mid- and small-cap equities), term (
e.g
., long-, intermediate- and short-duration debt securities), and geographic location (
e.g
., U.S., international, global, emerging markets, regional and local), in major markets around the world.
1
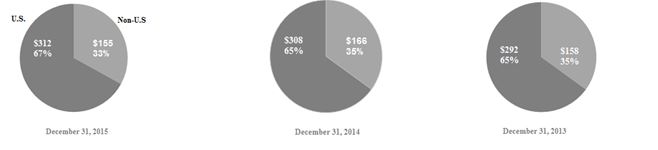
Our AUM by client domicile and investment service as of
December 31, 2015
,
2014
and
2013
were as follows:
By Client Domicile ($ in billions):
By Investment Service ($ in billions):

Distribution Channels
Institutions
We offer to our institutional clients, which include private and public pension plans, foundations and endowments, insurance companies, central banks and governments worldwide, and various of our affiliates, separately-managed accounts, sub-advisory relationships, structured products, collective investment trusts, mutual funds, hedge funds and other investment vehicles (“
Institutional Services
”).
We manage the assets of our institutional clients pursuant to written investment management agreements or other arrangements, which generally are terminable at any time or upon relatively short notice by either party. In general, our written investment management agreements may not be assigned without the client's consent. For information about our institutional investment advisory and services fees, including performance-based fees,
see
“
Risk Factors
”
in Item 1A and “Net Revenues – Investment Advisory and Services Fees” in Item 7
.
AXA and its subsidiaries together constitute our largest institutional client. AXA's AUM accounted for approximately 33%, 32% and 31% of our institutional AUM as of
December 31, 2015
,
2014
and
2013
, respectively, and approximately 26%, 22% and 22% of our institutional revenues for
2015
,
2014
and
2013
, respectively. No single institutional client other than AXA and its subsidiaries accounted for more than approximately 1% of our net revenues for the year ended
December 31, 2015
.
As of
December 31, 2015
,
2014
and
2013
, Institutional Services represented approximately 51%, 50% and 50%, respectively, of our AUM, and the fees we earned from providing these services represented approximately 14%, 14% and 15% of our net revenues for
2015
,
2014
and
2013
, respectively. Our AUM and revenues are as follows:
2
Institutional Services Assets Under Management
(by Investment Service)
|
December 31,
|
% Change
|
||||||||||||||||
|
2015
|
2014
|
2013
|
2015-14
|
2014-13
|
|||||||||||||
|
(in millions)
|
|||||||||||||||||
|
Equity Actively Managed:
|
|||||||||||||||||
|
U.S.
|
$
|
9,156
|
|
$
|
9,631
|
|
$
|
8,438
|
|
(4.9
|
)%
|
14.1
|
%
|
||||
|
Global & Non-US
|
16,705
|
|
19,522
|
|
21,100
|
|
(14.4
|
)
|
(7.5
|
)
|
|||||||
|
Total
|
25,861
|
|
29,153
|
|
29,538
|
|
(11.3
|
)
|
(1.3
|
)
|
|||||||
|
Equity Passively Managed
(1)
:
|
|||||||||||||||||
|
U.S.
|
15,573
|
|
16,196
|
|
14,111
|
|
(3.8
|
)
|
14.8
|
|
|||||||
|
Global & Non-US
|
4,250
|
|
5,818
|
|
6,555
|
|
(27.0
|
)
|
(11.2
|
)
|
|||||||
|
Total
|
19,823
|
|
22,014
|
|
20,666
|
|
(10.0
|
)
|
6.5
|
|
|||||||
|
Total Equity
|
45,684
|
|
51,167
|
|
50,204
|
|
(10.7
|
)
|
1.9
|
|
|||||||
|
Fixed Income Taxable:
|
|||||||||||||||||
|
U.S.
|
88,997
|
|
84,079
|
|
81,823
|
|
5.8
|
|
2.8
|
|
|||||||
|
Global & Non-US
|
54,897
|
|
64,086
|
|
58,647
|
|
(14.3
|
)
|
9.3
|
|
|||||||
|
Total
|
143,894
|
|
148,165
|
|
140,470
|
|
(2.9
|
)
|
5.5
|
|
|||||||
|
Fixed Income Tax-Exempt:
|
|||||||||||||||||
|
U.S.
|
1,920
|
|
1,796
|
|
1,611
|
|
6.9
|
|
11.5
|
|
|||||||
|
Global & Non-US
|
—
|
|
—
|
|
—
|
|
—
|
|
—
|
|
|||||||
|
Total
|
1,920
|
|
1,796
|
|
1,611
|
|
6.9
|
|
11.5
|
|
|||||||
|
Fixed Income Passively Managed
(1)
:
|
|||||||||||||||||
|
U.S.
|
64
|
|
67
|
|
63
|
|
(4.5
|
)
|
6.3
|
|
|||||||
|
Global & Non-US
|
18
|
|
185
|
|
194
|
|
(90.3
|
)
|
(4.6
|
)
|
|||||||
|
Total
|
82
|
|
252
|
|
257
|
|
(67.5
|
)
|
(1.9
|
)
|
|||||||
|
Total Fixed Income
|
145,896
|
|
150,213
|
|
142,338
|
|
(2.9
|
)
|
5.5
|
|
|||||||
|
Other
(2)
:
|
|||||||||||||||||
|
U.S.
|
2,939
|
|
2,268
|
|
1,211
|
|
29.6
|
|
87.3
|
|
|||||||
|
Global & Non-US
|
41,683
|
|
33,393
|
|
32,237
|
|
24.8
|
|
3.6
|
|
|||||||
|
Total
|
44,622
|
|
35,661
|
|
33,448
|
|
25.1
|
|
6.6
|
|
|||||||
|
Total:
|
|||||||||||||||||
|
U.S.
|
118,649
|
|
114,037
|
|
107,257
|
|
4.0
|
|
6.3
|
|
|||||||
|
Global & Non-US
|
117,553
|
|
123,004
|
|
118,733
|
|
(4.4
|
)
|
3.6
|
|
|||||||
|
Total
|
$
|
236,202
|
|
$
|
237,041
|
|
$
|
225,990
|
|
(0.4
|
)
|
4.9
|
|
||||
|
Affiliated
|
$
|
78,048
|
|
$
|
75,241
|
|
$
|
69,619
|
|
3.7
|
|
8.1
|
|
||||
|
Non-affiliated
|
158,154
|
|
161,800
|
|
156,371
|
|
(2.3
|
)
|
3.5
|
|
|||||||
|
Total
|
$
|
236,202
|
|
$
|
237,041
|
|
$
|
225,990
|
|
(0.4
|
)
|
4.9
|
|
||||
________________________________________________________________________________________________________________________
|
(1)
|
Includes index and enhanced index services.
|
|
(2)
|
Includes multi-asset solutions and services and certain alternative investments.
|
3
Revenues from Institutional Services
(by Investment Service)
|
Years Ended December 31,
|
% Change
|
||||||||||||||||
|
2015
|
2014
|
2013
|
2015-14
|
2014-13
|
|||||||||||||
|
(in thousands)
|
|||||||||||||||||
|
Equity Actively Managed:
|
|||||||||||||||||
|
U.S.
|
$
|
54,150
|
|
$
|
54,176
|
|
$
|
48,328
|
|
—
|
%
|
12.1
|
%
|
||||
|
Global & Non-US
|
88,096
|
|
88,777
|
|
98,552
|
|
(0.8
|
)
|
(9.9
|
)
|
|||||||
|
Total
|
142,246
|
|
142,953
|
|
146,880
|
|
(0.5
|
)
|
(2.7
|
)
|
|||||||
|
Equity Passively Managed
(1)
:
|
|||||||||||||||||
|
U.S.
|
2,824
|
|
2,841
|
|
2,720
|
|
(0.6
|
)
|
4.4
|
|
|||||||
|
Global & Non-US
|
4,295
|
|
4,333
|
|
5,359
|
|
(0.9
|
)
|
(19.1
|
)
|
|||||||
|
Total
|
7,119
|
|
7,174
|
|
8,079
|
|
(0.8
|
)
|
(11.2
|
)
|
|||||||
|
Total Equity
|
149,365
|
|
150,127
|
|
154,959
|
|
(0.5
|
)
|
(3.1
|
)
|
|||||||
|
Fixed Income Taxable:
|
|||||||||||||||||
|
U.S.
|
94,272
|
|
92,250
|
|
96,125
|
|
2.2
|
|
(4.0
|
)
|
|||||||
|
Global & Non-US
|
125,888
|
|
125,596
|
|
117,041
|
|
0.2
|
|
7.3
|
|
|||||||
|
Total
|
220,160
|
|
217,846
|
|
213,166
|
|
1.1
|
|
2.2
|
|
|||||||
|
Fixed Income Tax-Exempt:
|
|||||||||||||||||
|
U.S.
|
2,361
|
|
2,250
|
|
1,993
|
|
4.9
|
|
12.9
|
|
|||||||
|
Global & Non-US
|
—
|
|
—
|
|
—
|
|
—
|
|
—
|
|
|||||||
|
Total
|
2,361
|
|
2,250
|
|
1,993
|
|
4.9
|
|
12.9
|
|
|||||||
|
Fixed Income Passively Managed
(1)
:
|
|||||||||||||||||
|
U.S.
|
68
|
|
69
|
|
76
|
|
(1.4
|
)
|
(9.2
|
)
|
|||||||
|
Global & Non-US
|
81
|
|
142
|
|
227
|
|
(43.0
|
)
|
(37.4
|
)
|
|||||||
|
Total
|
149
|
|
211
|
|
303
|
|
(29.4
|
)
|
(30.4
|
)
|
|||||||
|
Fixed Income Servicing
(2)
:
|
|||||||||||||||||
|
U.S.
|
13,510
|
|
11,468
|
|
14,051
|
|
17.8
|
|
(18.4
|
)
|
|||||||
|
Global & Non-US
|
1,715
|
|
2,011
|
|
1,789
|
|
(14.7
|
)
|
12.4
|
|
|||||||
|
Total
|
15,225
|
|
13,479
|
|
15,840
|
|
13.0
|
|
(14.9
|
)
|
|||||||
|
Total Fixed Income
|
237,895
|
|
233,786
|
|
231,302
|
|
1.8
|
|
1.1
|
|
|||||||
|
Other
(3)
:
|
|||||||||||||||||
|
U.S.
|
23,130
|
|
18,643
|
|
11,952
|
|
24.1
|
|
56.0
|
|
|||||||
|
Global & Non-US
|
24,070
|
|
30,551
|
|
39,895
|
|
(21.2
|
)
|
(23.4
|
)
|
|||||||
|
Total
|
47,200
|
|
49,194
|
|
51,847
|
|
(4.1
|
)
|
(5.1
|
)
|
|||||||
|
Total Investment Advisory and Services Fees:
|
|||||||||||||||||
|
U.S.
|
190,315
|
|
181,697
|
|
175,245
|
|
4.7
|
|
3.7
|
|
|||||||
|
Global & Non-US
|
244,145
|
|
251,410
|
|
262,863
|
|
(2.9
|
)
|
(4.4
|
)
|
|||||||
|
434,460
|
|
433,107
|
|
438,108
|
|
0.3
|
|
(1.1
|
)
|
||||||||
|
Distribution Revenues
|
248
|
|
340
|
|
305
|
|
(27.1
|
)
|
11.5
|
|
|||||||
|
Shareholder Servicing Fees
|
497
|
|
634
|
|
533
|
|
(21.6
|
)
|
18.9
|
|
|||||||
|
Total
|
$
|
435,205
|
|
$
|
434,081
|
|
$
|
438,946
|
|
0.3
|
|
(1.1
|
)
|
||||
|
Affiliated
|
$
|
113,162
|
|
$
|
95,231
|
|
$
|
96,729
|
|
18.8
|
|
(1.5
|
)
|
||||
|
Non-affiliated
|
322,043
|
|
338,850
|
|
342,217
|
|
(5.0
|
)
|
(1.0
|
)
|
|||||||
|
Total
|
$
|
435,205
|
|
$
|
434,081
|
|
$
|
438,946
|
|
0.3
|
|
(1.1
|
)
|
||||
________________________________________________________________________________________________________________________
|
(1)
|
Includes index and enhanced index services.
|
|
(2)
|
Fixed Income Servicing includes advisory-related services fees that are not based on AUM, including derivative transaction fees, capital purchase program-related advisory services and other fixed income advisory services.
|
|
(3)
|
Includes multi-asset solutions and services and certain alternative services.
|
4
Retail
We provide investment management and related services to a wide variety of individual retail investors, both in the U.S. and internationally, through retail mutual funds we sponsor, mutual fund sub-advisory relationships, separately-managed account programs (
see below
), and other investment vehicles (“
Retail Products and Services
”).
We distribute our Retail Products and Services through financial intermediaries, including broker-dealers, insurance sales representatives, banks, registered investment advisers and financial planners. These products and services include open-end and closed-end funds that are either (i) registered as investment companies under the Investment Company Act (“
U.S. Funds
”), or (ii) not registered under the Investment Company Act and generally not offered to United States persons (“
Non-U.S. Funds
” and, collectively with the U.S. Funds, “
AB Funds
”). They also include separately-managed account programs, which are sponsored by financial intermediaries and generally charge an all-inclusive fee covering investment management, trade execution, asset allocation, and custodial and administrative services. In addition, we provide distribution, shareholder servicing, transfer agency services and administrative services for our Retail Products and Services.
See “Net Revenues – Investment Advisory and Services Fees” in Item 7
for information about our retail investment advisory and services fees.
See Note 2 to AB’s consolidated financial statements in Item 8
for a discussion of the commissions we pay to financial intermediaries in connection with the sale of open-end AB Funds.
Fees paid by the U.S. Funds are reflected in the applicable investment management agreement, which generally must be approved annually by the boards of directors or trustees of those funds, including by a majority of the independent directors or trustees. Increases in these fees must be approved by fund shareholders; decreases need not be, including any decreases implemented by a fund’s directors or trustees. In general, each investment management agreement with the U.S. Funds provides for termination by either party
at any time upon 60 days’ notice.
Fees paid by Non-U.S. Funds are reflected in investment management agreements that continue until they are terminated. Increases in these fees generally must be approved by the relevant regulatory authority, depending on the domicile and structure of the fund, and Non-U.S. Fund shareholders must be given advance notice of any fee increases.
The mutual funds we sub-advise for AXA and its subsidiaries together constitute our largest retail client. They accounted for approximately 22%, 21% and 23% of our retail AUM as of
December 31, 2015
,
2014
and
2013
, respectively, and approximately 3%, 3% and 2% of our retail net revenues as of
2015
,
2014
and
2013
, respectively.
Certain subsidiaries of AXA, including AXA Advisors, LLC (“
AXA Advisors
”), a subsidiary of AXA Financial, were responsible for approximately 4%, 3% and 2% of total sales of shares of open-end AB Funds in
2015
,
2014
and
2013
, respectively. UBS AG was responsible for approximately 8%, 11% and 12% of our open-end AB Fund sales in
2015
,
2014
and
2013
, respectively. Neither our affiliates nor UBS AG are under any obligation to sell a specific amount of AB Fund shares and each also sells shares of mutual funds that it sponsors and that are sponsored by unaffiliated organizations. No other entity accounted for 10% or more of our open-end AB Fund sales.
Most open-end U.S. Funds have adopted a plan under Rule 12b-1 of the Investment Company Act that allows the fund to pay, out of assets of the fund, distribution and service fees for the distribution and sale of its shares (“
Rule 12b-1 Fees
”). The open-end U.S. Funds have entered into such agreements with us, and we have entered into selling and distribution agreements pursuant to which we pay sales commissions to the financial intermediaries that distribute our open-end U.S. Funds. These agreements are terminable by either party upon notice (generally 30 days) and do not obligate the financial intermediary to sell any specific amount of fund shares.
As of
December 31, 2015
, retail U.S. Fund AUM were approximately $45 billion, or 29% of retail AUM, as compared to $49 billion, or 30%, as of
December 31, 2014
, and $47 billion, or 31%, as of
December 31, 2013
. Non-U.S. Fund AUM, as of
December 31, 2015
, totaled $52 billion, or 33% of retail AUM, as compared to $57 billion, or 36%, as of
December 31, 2014
, and $56 billion, or 36%, as of
December 31, 2013
.
Our Retail Services represented approximately 33%, 34% and 34% of our AUM as of
December 31, 2015
,
2014
and
2013
, respectively, and the fees we earned from providing these services represented approximately 45%, 46% and 47% of our net revenues for the years ended
December 31, 2015
,
2014
and
2013
, respectively. Our AUM and revenues are as follows:
5
Retail Services Assets Under Management
(by Investment Service)
|
December 31,
|
% Change
|
||||||||||||||||
|
2015
|
2014
|
2013
|
2015-14
|
2014-13
|
|||||||||||||
|
(in millions)
|
|||||||||||||||||
|
Equity Actively Managed:
|
|||||||||||||||||
|
U.S.
|
$
|
31,481
|
|
$
|
29,449
|
|
$
|
27,656
|
|
6.9
|
%
|
6.5
|
%
|
||||
|
Global & Non-US
|
14,810
|
|
15,920
|
|
13,997
|
|
(7.0
|
)
|
13.7
|
|
|||||||
|
Total
|
46,291
|
|
45,369
|
|
41,653
|
|
2.0
|
|
8.9
|
|
|||||||
|
Equity Passively Managed
(1)
:
|
|||||||||||||||||
|
U.S.
|
19,483
|
|
21,268
|
|
21,514
|
|
(8.4
|
)
|
(1.1
|
)
|
|||||||
|
Global & Non-US
|
6,664
|
|
6,600
|
|
6,615
|
|
1.0
|
|
(0.2
|
)
|
|||||||
|
Total
|
26,147
|
|
27,868
|
|
28,129
|
|
(6.2
|
)
|
(0.9
|
)
|
|||||||
|
Total Equity
|
72,438
|
|
73,237
|
|
69,782
|
|
(1.1
|
)
|
5.0
|
|
|||||||
|
Fixed Income Taxable:
|
|||||||||||||||||
|
U.S.
|
5,905
|
|
5,934
|
|
4,597
|
|
(0.5
|
)
|
29.1
|
|
|||||||
|
Global & Non-US
|
47,891
|
|
55,059
|
|
56,304
|
|
(13.0
|
)
|
(2.2
|
)
|
|||||||
|
Total
|
53,796
|
|
60,993
|
|
60,901
|
|
(11.8
|
)
|
0.2
|
|
|||||||
|
Fixed Income Tax-Exempt:
|
|||||||||||||||||
|
U.S.
|
11,601
|
|
10,432
|
|
8,243
|
|
11.2
|
|
26.6
|
|
|||||||
|
Global & Non-US
|
12
|
|
14
|
|
14
|
|
(14.3
|
)
|
—
|
|
|||||||
|
Total
|
11,613
|
|
10,446
|
|
8,257
|
|
11.2
|
|
26.5
|
|
|||||||
|
Fixed Income Passively Managed
(1)
:
|
|||||||||||||||||
|
U.S.
|
5,010
|
|
4,917
|
|
4,531
|
|
1.9
|
|
8.5
|
|
|||||||
|
Global & Non-US
|
4,492
|
|
4,483
|
|
4,179
|
|
0.2
|
|
7.3
|
|
|||||||
|
Total
|
9,502
|
|
9,400
|
|
8,710
|
|
1.1
|
|
7.9
|
|
|||||||
|
Total Fixed Income
|
74,911
|
|
80,839
|
|
77,868
|
|
(7.3
|
)
|
3.8
|
|
|||||||
|
Other
(2)
:
|
|||||||||||||||||
|
U.S.
|
5,116
|
|
5,349
|
|
3,208
|
|
(4.4
|
)
|
66.7
|
|
|||||||
|
Global & Non-US
|
1,903
|
|
2,072
|
|
2,132
|
|
(8.2
|
)
|
(2.8
|
)
|
|||||||
|
Total
|
7,019
|
|
7,421
|
|
5,340
|
|
(5.4
|
)
|
39.0
|
|
|||||||
|
Total:
|
|||||||||||||||||
|
U.S.
|
78,596
|
|
77,349
|
|
69,749
|
|
1.6
|
|
10.9
|
|
|||||||
|
Global & Non-US
|
75,772
|
|
84,148
|
|
83,241
|
|
(10.0
|
)
|
1.1
|
|
|||||||
|
Total
|
$
|
154,368
|
|
$
|
161,497
|
|
$
|
152,990
|
|
(4.4
|
)
|
5.6
|
|
||||
|
Affiliated
|
$
|
33,364
|
|
$
|
34,693
|
|
$
|
35,194
|
|
(3.8
|
)
|
(1.4
|
)
|
||||
|
Non-affiliated
|
121,004
|
|
126,804
|
|
117,796
|
|
(4.6
|
)
|
7.6
|
|
|||||||
|
Total
|
$
|
154,368
|
|
$
|
161,497
|
|
$
|
152,990
|
|
(4.4
|
)
|
5.6
|
|
||||
________________________________________________________________________________________________________________________
|
(1)
|
Includes index and enhanced index services.
|
|
(2)
|
Includes multi-asset solutions and services and certain alternative investments.
|
6
Revenues from Retail Services
(by Investment Service)
|
Years Ended December 31,
|
% Change
|
||||||||||||||||
|
2015
|
2014
|
2013
|
2015-14
|
2014-13
|
|||||||||||||
|
(in thousands)
|
|||||||||||||||||
|
Equity Actively Managed:
|
|||||||||||||||||
|
U.S.
|
$
|
184,904
|
|
$
|
182,008
|
|
$
|
134,311
|
|
1.6
|
%
|
35.5
|
%
|
||||
|
Global & Non-US
|
105,768
|
|
94,491
|
|
96,338
|
|
11.9
|
|
(1.9
|
)
|
|||||||
|
Total
|
290,672
|
|
276,499
|
|
230,649
|
|
5.1
|
|
19.9
|
|
|||||||
|
Equity Passively Managed
(1)
:
|
|||||||||||||||||
|
U.S.
|
8,188
|
|
10,066
|
|
10,957
|
|
(18.7
|
)
|
(8.1
|
)
|
|||||||
|
Global & Non-US
|
5,268
|
|
6,924
|
|
4,670
|
|
(23.9
|
)
|
48.3
|
|
|||||||
|
Total
|
13,456
|
|
16,990
|
|
15,627
|
|
(20.8
|
)
|
8.7
|
|
|||||||
|
Total Equity
|
304,128
|
|
293,489
|
|
246,276
|
|
3.6
|
|
19.2
|
|
|||||||
|
Fixed Income Taxable:
|
|||||||||||||||||
|
U.S.
|
20,294
|
|
20,680
|
|
16,074
|
|
(1.9
|
)
|
28.7
|
|
|||||||
|
Global & Non-US
|
393,315
|
|
429,409
|
|
483,171
|
|
(8.4
|
)
|
(11.1
|
)
|
|||||||
|
Total
|
413,609
|
|
450,089
|
|
499,245
|
|
(8.1
|
)
|
(9.8
|
)
|
|||||||
|
Fixed Income Tax-Exempt:
|
|||||||||||||||||
|
U.S.
|
44,916
|
|
38,317
|
|
35,993
|
|
17.2
|
|
6.5
|
|
|||||||
|
Global & Non-US
|
73
|
|
78
|
|
78
|
|
(6.4
|
)
|
—
|
|
|||||||
|
Total
|
44,989
|
|
38,395
|
|
36,071
|
|
17.2
|
|
6.4
|
|
|||||||
|
Fixed Income Passively Managed
(1)
:
|
|||||||||||||||||
|
U.S.
|
5,663
|
|
2,836
|
|
2,153
|
|
99.7
|
|
31.7
|
|
|||||||
|
Global & Non-US
|
8,201
|
|
8,438
|
|
8,605
|
|
(2.8
|
)
|
(1.9
|
)
|
|||||||
|
Total
|
13,864
|
|
11,274
|
|
10,758
|
|
23.0
|
|
4.8
|
|
|||||||
|
Total Fixed Income
|
472,462
|
|
499,758
|
|
546,074
|
|
(5.5
|
)
|
(8.5
|
)
|
|||||||
|
Other
(2)
:
|
|||||||||||||||||
|
U.S.
|
71,129
|
|
64,452
|
|
22,819
|
|
10.4
|
|
182.4
|
|
|||||||
|
Global & Non-US
|
8,334
|
|
9,277
|
|
9,785
|
|
(10.2
|
)
|
(5.2
|
)
|
|||||||
|
Total
|
79,463
|
|
73,729
|
|
32,604
|
|
7.8
|
|
126.1
|
|
|||||||
|
Total Investment Advisory and Services Fees:
|
|||||||||||||||||
|
U.S.
|
335,094
|
|
318,359
|
|
222,307
|
|
5.3
|
|
43.2
|
|
|||||||
|
Global & Non-US
|
520,959
|
|
548,617
|
|
602,647
|
|
(5.0
|
)
|
(9.0
|
)
|
|||||||
|
856,053
|
|
866,976
|
|
824,954
|
|
(1.3
|
)
|
5.1
|
|
||||||||
|
Distribution Revenues
|
423,410
|
|
440,961
|
|
461,944
|
|
(4.0
|
)
|
(4.5
|
)
|
|||||||
|
Shareholder Servicing Fees
|
83,078
|
|
89,198
|
|
89,472
|
|
(6.9
|
)
|
(0.3
|
)
|
|||||||
|
Total
|
$
|
1,362,541
|
|
$
|
1,397,135
|
|
$
|
1,376,370
|
|
(2.5
|
)
|
1.5
|
|
||||
|
Affiliated
|
$
|
47,663
|
|
$
|
47,910
|
|
$
|
43,264
|
|
(0.5
|
)
|
10.7
|
|
||||
|
Non-affiliated
|
1,314,878
|
|
1,349,225
|
|
1,333,106
|
|
(2.5
|
)
|
1.2
|
|
|||||||
|
Total
|
$
|
1,362,541
|
|
$
|
1,397,135
|
|
$
|
1,376,370
|
|
(2.5
|
)
|
1.5
|
|
||||
________________________________________________________________________________________________________________________
|
(1)
|
Includes index and enhanced index services.
|
|
(2)
|
Includes multi-asset solutions and services and certain alternative investments.
|
7
Private Wealth Management
We offer to our private wealth clients, which include high-net-worth individuals and families, trusts and estates, charitable foundations, partnerships, private and family corporations, and other entities, separately-managed accounts, hedge funds, mutual funds and other investment vehicles (“
Private Wealth Services
”).
We manage these accounts pursuant to written investment advisory agreements, which generally are terminable at any time or upon relatively short notice by any party and may not be assigned without the client's consent. For information about our investment advisory and services fees, including performance-based fees,
see
“
Risk Factors
”
in Item 1A and “Net Revenues – Investment Advisory and Services Fees” in Item 7
.
Our Private Wealth Services represented approximately 16% of our AUM as of each of
December 31, 2015
,
2014
and
2013
, and the fees we earned from providing these services represented approximately 23%, 22% and 20% of our net revenues for
2015
,
2014
and
2013
, respectively. Our AUM and revenues are as follows:
8
Private Wealth Services Assets Under Management
(by Investment Service)
|
December 31,
|
% Change
|
||||||||||||||||
|
2015
|
2014
|
2013
|
2015-14
|
2014-13
|
|||||||||||||
|
(in millions)
|
|||||||||||||||||
|
Equity Actively Managed:
|
|||||||||||||||||
|
U.S.
|
$
|
22,873
|
|
$
|
22,842
|
|
$
|
21,620
|
|
0.1
|
%
|
5.7
|
%
|
||||
|
Global & Non-US
|
15,595
|
|
15,125
|
|
15,003
|
|
3.1
|
|
0.8
|
|
|||||||
|
Total
|
38,468
|
|
37,967
|
|
36,623
|
|
1.3
|
|
3.7
|
|
|||||||
|
Equity Passively Managed
(1)
:
|
|||||||||||||||||
|
U.S.
|
177
|
|
172
|
|
83
|
|
2.9
|
|
107.2
|
|
|||||||
|
Global & Non-US
|
210
|
|
402
|
|
397
|
|
(47.8
|
)
|
1.3
|
|
|||||||
|
Total
|
387
|
|
574
|
|
480
|
|
(32.6
|
)
|
19.6
|
|
|||||||
|
Total Equity
|
38,855
|
|
38,541
|
|
37,103
|
|
0.8
|
|
3.9
|
|
|||||||
|
Fixed Income Taxable:
|
|||||||||||||||||
|
U.S.
|
6,742
|
|
7,396
|
|
7,468
|
|
(8.8
|
)
|
(1.0
|
)
|
|||||||
|
Global & Non-US
|
3,053
|
|
2,871
|
|
2,128
|
|
6.3
|
|
34.9
|
|
|||||||
|
Total
|
9,795
|
|
10,267
|
|
9,596
|
|
(4.6
|
)
|
7.0
|
|
|||||||
|
Fixed Income Tax-Exempt:
|
|||||||||||||||||
|
U.S.
|
19,973
|
|
19,401
|
|
18,843
|
|
2.9
|
|
3.0
|
|
|||||||
|
Global & Non-US
|
3
|
|
3
|
|
2
|
|
—
|
|
50.0
|
|
|||||||
|
Total
|
19,976
|
|
19,404
|
|
18,845
|
|
2.9
|
|
3.0
|
|
|||||||
|
Fixed Income Passively Managed
(1)
:
|
|||||||||||||||||
|
U.S.
|
4
|
|
5
|
|
11
|
|
(20.0
|
)
|
(54.5
|
)
|
|||||||
|
Global & Non-US
|
372
|
|
402
|
|
357
|
|
(7.5
|
)
|
12.6
|
|
|||||||
|
Total
|
376
|
|
407
|
|
368
|
|
(7.6
|
)
|
10.6
|
|
|||||||
|
Total Fixed Income
|
30,147
|
|
30,078
|
|
28,809
|
|
0.2
|
|
4.4
|
|
|||||||
|
Other
(2)
:
|
|||||||||||||||||
|
U.S.
|
2,439
|
|
1,902
|
|
1,375
|
|
28.2
|
|
38.3
|
|
|||||||
|
Global & Non-US
|
5,429
|
|
4,968
|
|
4,144
|
|
9.3
|
|
19.9
|
|
|||||||
|
Total
|
7,868
|
|
6,870
|
|
5,519
|
|
14.5
|
|
24.5
|
|
|||||||
|
Total:
|
|||||||||||||||||
|
U.S.
|
52,208
|
|
51,718
|
|
49,400
|
|
0.9
|
|
4.7
|
|
|||||||
|
Global & Non-US
|
24,662
|
|
23,771
|
|
22,031
|
|
3.7
|
|
7.9
|
|
|||||||
|
Total
|
$
|
76,870
|
|
$
|
75,489
|
|
$
|
71,431
|
|
1.8
|
|
5.7
|
|
||||
________________________________________________________________________________________________________________________
|
(1)
|
Includes index and enhanced index services.
|
|
(2)
|
Includes multi-asset solutions and services and certain alternative investments.
|
9
Revenues From Private Wealth Services
(by Investment Service)
|
Years Ended December 31,
|
% Change
|
||||||||||||||||
|
2015
|
2014
|
2013
|
2015-14
|
2014-13
|
|||||||||||||
|
(in thousands)
|
|||||||||||||||||
|
Equity Actively Managed:
|
|||||||||||||||||
|
U.S.
|
$
|
260,997
|
|
$
|
250,415
|
|
$
|
211,927
|
|
4.2
|
%
|
18.2
|
%
|
||||
|
Global & Non-US
|
170,810
|
|
169,472
|
|
153,062
|
|
0.8
|
|
10.7
|
|
|||||||
|
Total
|
431,807
|
|
419,887
|
|
364,989
|
|
2.8
|
|
15.0
|
|
|||||||
|
Equity Passively Managed
(1)
:
|
|||||||||||||||||
|
U.S.
|
1,229
|
|
695
|
|
316
|
|
76.8
|
|
119.9
|
|
|||||||
|
Global & Non-US
|
834
|
|
1,839
|
|
1,800
|
|
(54.6
|
)
|
2.2
|
|
|||||||
|
Total
|
2,063
|
|
2,534
|
|
2,116
|
|
(18.6
|
)
|
19.8
|
|
|||||||
|
Total Equity
|
433,870
|
|
422,421
|
|
367,105
|
|
2.7
|
|
15.1
|
|
|||||||
|
Fixed Income Taxable:
|
|||||||||||||||||
|
U.S.
|
36,748
|
|
39,811
|
|
44,260
|
|
(7.7
|
)
|
(10.1
|
)
|
|||||||
|
Global & Non-US
|
20,429
|
|
15,778
|
|
13,029
|
|
29.5
|
|
21.1
|
|
|||||||
|
Total
|
57,177
|
|
55,589
|
|
57,289
|
|
2.9
|
|
(3.0
|
)
|
|||||||
|
Fixed Income Tax-Exempt:
|
|||||||||||||||||
|
U.S.
|
106,161
|
|
102,509
|
|
104,867
|
|
3.6
|
|
(2.2
|
)
|
|||||||
|
Global & Non-US
|
35
|
|
27
|
|
18
|
|
29.6
|
|
50.0
|
|
|||||||
|
Total
|
106,196
|
|
102,536
|
|
104,885
|
|
3.6
|
|
(2.2
|
)
|
|||||||
|
Fixed Income Passively Managed
(1)
:
|
|||||||||||||||||
|
U.S.
|
11
|
|
9
|
|
88
|
|
22.2
|
|
(89.8
|
)
|
|||||||
|
Global & Non-US
|
4,299
|
|
3,446
|
|
3,105
|
|
24.8
|
|
11.0
|
|
|||||||
|
Total
|
4,310
|
|
3,455
|
|
3,193
|
|
24.7
|
|
8.2
|
|
|||||||
|
Total Fixed Income
|
167,683
|
|
161,580
|
|
165,367
|
|
3.8
|
|
(2.3
|
)
|
|||||||
|
Other
(2)
:
|
|||||||||||||||||
|
U.S.
|
22,177
|
|
16,566
|
|
12,699
|
|
33.9
|
|
30.5
|
|
|||||||
|
Global & Non-US
|
59,594
|
|
57,600
|
|
40,872
|
|
3.5
|
|
40.9
|
|
|||||||
|
Total
|
81,771
|
|
74,166
|
|
53,571
|
|
10.3
|
|
38.4
|
|
|||||||
|
Total Investment Advisory and Services Fees:
|
|||||||||||||||||
|
U.S.
|
427,323
|
|
410,005
|
|
374,157
|
|
4.2
|
|
9.6
|
|
|||||||
|
Global & Non-US
|
256,001
|
|
248,162
|
|
211,886
|
|
3.2
|
|
17.1
|
|
|||||||
|
Total
|
683,324
|
|
658,167
|
|
586,043
|
|
3.8
|
|
12.3
|
|
|||||||
|
Distribution Revenues
|
3,498
|
|
3,669
|
|
3,175
|
|
(4.7
|
)
|
15.6
|
|
|||||||
|
Shareholder Servicing Fees
|
3,031
|
|
2,488
|
|
2,140
|
|
21.8
|
|
16.3
|
|
|||||||
|
Total
|
$
|
689,853
|
|
$
|
664,324
|
|
$
|
591,358
|
|
3.8
|
|
12.3
|
|
||||
________________________________________________________________________________________________________________________
|
(1)
|
Includes index and enhanced index services.
|
|
(2)
|
Includes multi-asset solutions and services and certain alternative investments.
|
10
Bernstein Research Services
We offer high-quality fundamental research, quantitative services and brokerage-related services in equities and listed options to institutional investors, such as pension fund, hedge fund and mutual fund managers, and other institutional investors (“
Bernstein Research Services
”). We serve our clients, which are based in the United States and in other major markets around the world, through our trading professionals, who primarily are based in New York, London and Hong Kong, and our sell-side analysts, who provide fundamental company and industry research along with quantitative research into securities valuation and factors affecting stock-price movements.
We earn revenues for providing investment research to, and executing brokerage transactions for, institutional clients. These clients compensate us principally by directing us to execute brokerage transactions on their behalf, for which we earn commissions. These services accounted for approximately 16%, 16% and 15% of our net revenues for the years ended
December 31, 2015
,
2014
and
2013
, respectively.
For information regarding trends in fee rates charged for brokerage transactions,
see “Risk Factors” in Item 1A
.
Our Bernstein Research Services revenues are as follows:
Revenues From Bernstein Research Services
|
Years Ended December 31,
|
% Change
|
||||||||||||||||
|
2015
|
2014
|
2013
|
2015-14
|
2014-13
|
|||||||||||||
|
(in thousands)
|
|
|
|
|
|||||||||||||
|
Bernstein Research Services
|
$
|
493,463
|
|
$
|
482,538
|
|
$
|
445,083
|
|
2.3
|
%
|
8.4
|
%
|
||||
Custody
Our U.S.-based broker-dealer subsidiary acts as custodian for the majority of our Private Wealth Management AUM and some of our Institutions AUM. Other custodial arrangements are maintained by client-designated banks, trust companies, brokerage firms or custodians.
Employees
As of
December 31, 2015
, our firm had 3,600 full-time employees, representing a 3.2% increase compared to the end of
2014
. We consider our employee relations to be good.
Service Marks
We have registered a number of service marks with the U.S. Patent and Trademark Office and various foreign trademark offices, including the mark “AllianceBernstein”. The logo
set forth below
and “Ahead of Tomorrow” are service marks of AB:
In January 2015, we established two new brand identities. Although the legal names of our corporate entities did not change, our company, and our Institutions and Retail businesses, now are referred to as “AB”. Private Wealth Management and Bernstein Research Services now are referred to as “AB Bernstein”. Also, we adopted the logo and “Ahead of Tomorrow” service marks
described above
.
In connection with the Bernstein Transaction, we acquired all of the rights in, and title to, the Bernstein service marks, including the mark “Bernstein”.
In connection with the WPS Acquisition, we acquired all of the rights in, and title to, the WPS service marks, including the logo “WPSTEWART”.
See “W.P. Stewart” in this Item 1
for information regarding the WPS Acquisition.
11
Regulation
Virtually all aspects of our business are subject to various federal and state laws and regulations, rules of various securities regulators and exchanges, and laws in the foreign countries in which our subsidiaries conduct business. These laws and regulations primarily are intended to protect clients and fund shareholders and generally grant supervisory agencies broad administrative powers, including the power to limit or restrict the carrying on of business for failure to comply with such laws and regulations. Possible sanctions that may be imposed on us include the suspension of individual employees, limitations on engaging in business for specific periods, the revocation of the registration as an investment adviser or broker-dealer, censures and fines.
AB, AB Holding, the General Partner and five of our subsidiaries (Sanford C. Bernstein & Co., LLC (“
SCB LLC
”), AllianceBernstein Global Derivatives Corporation (“
Global Derivatives
”
)
, AB Private Credit Investors LLC, WPS and W.P. Stewart Asset Management LLC) are registered with the SEC as investment advisers under the Investment Advisers Act. Additionally, AB Holding is an NYSE-listed company and, accordingly, is subject to applicable regulations promulgated by the NYSE. In addition, AB, SCB LLC and Global Derivatives are registered with the Commodity Futures Trading Commission (“
CFTC
”) as commodity pool operators and commodity trading advisers; SCB LLC also is registered with the CFTC as a futures commissions merchant.
Each U.S. Fund is registered with the SEC under the Investment Company Act and each Non-U.S. Fund is subject to the laws in the jurisdiction in which the fund is registered. For example, our platform of Luxembourg-based funds operates pursuant to Luxembourg laws and regulations, including Undertakings for the Collective Investment in Transferable Securities Directives, and is authorized and supervised by the Commission de Surveillance du Secteur Financier (“
CSSF
”), the primary regulator in Luxembourg. AllianceBernstein Investor Services, Inc., one of our subsidiaries, is registered with the SEC as a transfer and servicing agent.
SCB LLC and another of our subsidiaries, AllianceBernstein Investments, Inc., are registered with the SEC as broker-dealers, and both are members of the Financial Industry Regulatory Authority. In addition, SCB LLC is a member of the NYSE and other principal U.S. exchanges.
Many of our subsidiaries are subject to the oversight of regulatory authorities in the jurisdictions outside the United States in which they operate, including the European Securities and Markets Authority, the Financial Conduct Authority in the U.K., the CSSF in Luxembourg, the Financial Services Agency in Japan, the Securities & Futures Commission in Hong Kong, the Monetary Authority of Singapore, the Financial Services Commission in South Korea and the Financial Supervisory Commission in Taiwan. While these regulatory requirements often may be comparable to the requirements of the SEC and other U.S. regulators, they are sometimes more restrictive and may cause us to incur substantial expenditures of time and money related to our compliance efforts.
Iran Threat Reduction and Syria Human Rights Act
AB, AB Holding and their global subsidiaries had no transactions or activities requiring disclosure under the Iran Threat Reduction and Syria Human Rights Act (“
Iran Act
”), nor were they involved in the AXA Group matters
described immediately below
.
The non-U.S. based subsidiaries of AXA operate in compliance with applicable laws and regulations of the various jurisdictions in which they operate, including applicable international (United Nations and European Union) laws and regulations. While AXA Group companies based and operating outside the United States generally are not subject to U.S. law, as an international group, AXA has in place policies and standards (including the AXA Group International Sanctions Policy) that apply to all AXA Group companies worldwide and often impose requirements that go well beyond local law. For additional information regarding AXA,
see "Principal Security Holders" in Item 12
.
AXA has informed us that AXA Konzern AG ("
AXA Konzern
"), an AXA insurance subsidiary organized under the laws of Germany, had a German client designated under Executive Order 13382. The client had a pension savings contract with AXA Konzern with an annual premium of approximately $15,000. The related annual net profit associated with this contract, which is difficult to calculate with precision, was estimated to be $1,500. This contract was terminated in March 2015.
AXA also has informed us that AXA Konzern provides car insurance to two diplomats based at the Iranian embassy in Berlin, Germany. The total annual premium of these policies is approximately $13,000 and the annual net profit arising from these policies, which is difficult to calculate with precision, is estimated to be $1,950. These policies were underwritten by a broker who specializes in providing insurance coverage for diplomats. Provision of motor vehicle insurance is mandatory in Germany
12
and cannot be cancelled until the policies expire.
In addition, AXA has informed us that AXA Insurance Ireland, an AXA insurance subsidiary, provides statutorily required car insurance under three separate policies to the Iranian embassy in Dublin, Ireland. AXA has informed us that compliance with the Declined Cases Agreement of the Irish Government prohibits the cancellation of these policies unless another insurer is willing to assume the coverage. The total annual premium for these policies is approximately $3,750 and the annual net profit arising from these policies, which is difficult to calculate with precision, is estimated to be $563.
Also, AXA has informed us that AXA Sigorta, a subsidiary of AXA organized under the laws of Turkey, provides car insurance coverage for vehicle pools of the Iranian General Consulate and the Iranian embassy in Istanbul, Turkey. Motor liability insurance coverage is mandatory in Turkey and cannot be cancelled unilaterally. The total annual premium in respect of these policies is approximately $3,150 and the annual net profit, which is difficult to calculate with precision, is estimated to be $473.
In addition, AXA has informed us that AXA Ukraine, an AXA insurance subsidiary, provides car insurance for the Attaché of the Embassy of Iran in Ukraine. Motor liability insurance coverage cannot be cancelled under Ukrainian law. The total annual premium in respect of this policy is approximately $1,000 and the annual net profit, which is difficult to calculate with precision, is estimated to be $150.
Lastly, AXA previously informed us about a pension contract that had been in place between a subsidiary in Hong Kong, AXA China Region Trustees Limited ("
AXA CRT
"), and an entity listed as a Specially Designated National ("
SDN
") with the identifier [IRAN] by the Office of Foreign Assets Control ("
OFAC
"). The pension contract was entered into in May 2012 and the individual enrolled in the pension contract was listed by OFAC as a designated SDN with the identifier [IRAN] in May 2013. Local authorities had informed AXA CRT that the pension contract could not be cancelled. In May 2015, however, the individual enrolled in the pension contract permanently departed Hong Kong and, as a result, claimed withdrawal of any accrued pension benefits. The annual pension contributions received under this pension contract had totaled approximately $7,800 and the related net profit, which is difficult to calculate with precision, was estimated to be $780.
The aggregate annual premiums for the above-referenced insurance policies and pension contracts are approximately $43,700, representing approximately 0.00004% of AXA’s 2015 consolidated revenues, which are likely to be approximately $100 billion. The related net profit, which is difficult to calculate with precision, is estimated to be $5,416, representing approximately 0.0001% of AXA’s 2015 aggregate net profit.
History and Structure
We have been in the investment research and management business for nearly 50 years. Alliance Capital was founded in 1971 when the investment management department of Donaldson, Lufkin & Jenrette, Inc. (since November 2000, a part of Credit Suisse Group) merged with the investment advisory business of Moody’s Investor Services, Inc. Bernstein was founded in 1967.
In April 1988, AB Holding “went public” as a master limited partnership. AB Holding Units, which trade under the ticker symbol “AB”, have been listed on the NYSE since that time.
In October 1999, AB Holding reorganized by transferring its business and assets to AB, a newly-formed operating partnership, in exchange for all of the AB Units (“
Reorganization
”). Since the date of the Reorganization, AB has conducted the business formerly conducted by AB Holding and AB Holding’s activities have consisted of owning AB Units and engaging in related activities. Unlike AB Holding Units, AB Units do not trade publicly and are subject to significant restrictions on transfer. The General Partner is the general partner of both AB and AB Holding.
In October 2000, our two legacy firms, Alliance Capital and Bernstein, combined, bringing together Alliance Capital’s expertise in growth equity and corporate fixed income investing and its family of retail mutual funds, with Bernstein’s expertise in value equity investing, tax-exempt fixed income management, and its Private Wealth Management and Bernstein Research Services businesses. For additional details about this business combination,
see Note 2 to AB’s consolidated financial statements in Item 8
.
As of
December 31, 2015
, the condensed ownership structure of AB is as follows (for a more complete description of our ownership structure,
see “Principal Security Holders” in Item 12
):
13
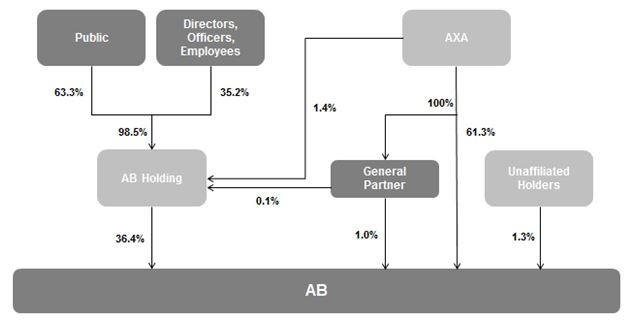
The General Partner owns 100,000 general partnership units in AB Holding and a 1% general partnership interest in AB. Including these general partnership interests, AXA, through certain of its subsidiaries (
see “Principal Security Holders” in Item 12
), had an approximate 62.8% economic interest in AB as of
December 31, 2015
.
Competition
We compete in all aspects of our business with numerous investment management firms, mutual fund sponsors, brokerage and investment banking firms, insurance companies, banks, savings and loan associations, and other financial institutions that often provide investment products that have similar features and objectives as those we offer. Our competitors offer a wide range of financial services to the same customers that we seek to serve. Some of our competitors are larger, have a broader range of product choices and investment capabilities, conduct business in more markets, and have substantially greater resources than we do. These factors may place us at a competitive disadvantage, and we can give no assurance that our strategies and efforts to maintain and enhance our current client relationships, and create new ones, will be successful.
In addition, AXA and its subsidiaries provide financial services, some of which compete with those we offer. The AB Partnership Agreement specifically allows AXA and its subsidiaries (other than the General Partner) to compete with AB and to pursue opportunities that may be available to us. AXA, AXA Financial, AXA Equitable and certain of their respective subsidiaries have substantially greater financial resources than we do and are not obligated to provide resources to us.
To grow our business, we believe we must be able to compete effectively for AUM. Key competitive factors include:
|
•
|
our investment performance for clients;
|
|
•
|
our commitment to place the interests of our clients first;
|
|
•
|
the quality of our research;
|
|
•
|
our ability to attract, motivate and retain highly skilled, and often highly specialized, personnel;
|
|
•
|
the array of investment products we offer;
|
|
•
|
the fees we charge;
|
|
•
|
Morningstar/Lipper rankings for the AB Funds;
|
|
•
|
our ability to sell our actively-managed investment services despite the fact that many investors favor passive services;
|
|
•
|
our operational effectiveness;
|
|
•
|
our ability to further develop and market our brand; and
|
|
•
|
our global presence.
|
14
Competition is an important risk that our business faces and should be considered along with the other risk factors we discuss
in “Risk Factors” in Item 1A
.
Available Information
AB and AB Holding file or furnish annual reports on Form 10-K, quarterly reports on Form 10-Q, current reports on Form 8-K, amendments to such reports, and other reports (and amendments thereto) required to comply with federal securities laws, including Section 16 beneficial ownership reports on Forms 3, 4 and 5, registration statements and proxy statements. We maintain an Internet site (
http://www.abglobal.com
) where the public can view these reports, free of charge, as soon as reasonably practicable after each report is filed with, or furnished to, the SEC. In addition, the SEC maintains an Internet site (
http://www.sec.gov
) that contains reports, proxy and information statements, and other information regarding issuers that file electronically with the SEC.
W.P. Stewart
On December 12, 2013, we acquired WPS, an equity investment manager that managed, as of December 12, 2013, approximately $2.1 billion in U.S., Global and Europe, Australasia (Australia and New Zealand) and Far East (“
EAFE
”) concentrated growth equity strategies for its clients, primarily in the U.S. and Europe. On the date of the WPS Acquisition, each of approximately 4.9 million outstanding shares of WPS common stock (other than certain specified shares, as previously disclosed in Amendment No. 2 to Form S-4 filed by AB on November 8, 2013) was converted into the right to receive $12.00 per share and one transferable contingent value right (“
CVRs
”) entitling the holders to an additional $4.00 per share cash payment if the Assets Under Management (as such term is defined in the Contingent Value Rights Agreement (“
CVR Agreement
”) dated as of December 12, 2013, a copy of which we filed as Exhibit 4.01 (“
Exhibit 4.01
”) to our Form 10-K for the year ended December 31, 2013) in the acquired WPS investment services exceed $5 billion on or before December 12, 2016, subject to measurement procedures and limitations set forth in the CVR Agreement.
See the definition of AUM Milestone in the CVR Agreement filed as Exhibit 4.01
. The foregoing description of the CVR Agreement does not purport to be complete and is qualified in its entirety by the full text of the CVR Agreement.
As of
December 31, 2015
, the Assets Under Management are approximately $4.0 billion. Accordingly, management has determined that the AUM Milestone did not occur during the fourth quarter of
2015
.
15
Please consider this section along with the description of our business
in Item 1
, the competition section
immediately above
and AB’s financial information
contained in Items 6, 7 and 8
. The majority of the risk factors discussed below directly affect AB. These risk factors also affect AB Holding because AB Holding’s principal source of income and cash flow is attributable to its investment in AB.
See also “Cautions Regarding Forward-Looking Statements” in Item 7
.
Business-related Risks
Our revenues and results of operations depend on the market value and composition of our AUM, which can fluctuate significantly based on various factors, including many factors outside of our control.
We derive most of our revenues from investment advisory and services fees, which typically are calculated as a percentage of the value of AUM as of a specified date, or as a percentage of the value of average AUM for the applicable billing period, and vary with the type of investment service, the size of the account and the total amount of assets we manage for a particular client. The value and composition of our AUM can be adversely affected by several factors, including:
|
•
|
Market Factors
. Declining equity markets during the second half of 2015, which resulted from, among other factors, concerns regarding growth in China and other international economies, rapidly declining commodity prices, particularly oil, fixed income market liquidity and a possible slowdown in the rate of growth of the global economy, caused our AUM and revenues to decline. This trend may continue. Additionally, increases in interest rates, particularly if rapid, likely would decrease the total return of many bond investments due to lower market valuations of existing bonds. These factors could have a significant adverse effect on our revenues and results of operations as AUM in our fixed income investments comprise a major component of our total AUM.
|
|
•
|
Client Preferences
. Generally, our clients may withdraw their assets at any time and on short notice. Also, changing market dynamics and investment trends, particularly with respect to sponsors of defined benefit plans choosing to invest in less risky investments and the significant shift, which continued in 2015, from active equity investments to passive equity investments, may reduce interest in some of the investment products we offer, and/or clients and prospects may seek investment products that we may not currently offer. Also, the market forces
described above
and the resulting increased volatility of the securities markets have caused many investors to withdraw assets from riskier asset classes, such as equities and high yield debt, which has resulted in declines in our AUM and net flows. Loss of, or decreases in, AUM reduces our investment advisory and services fees and revenues.
|
|
•
|
Our Investment Performance
. Our ability to achieve investment returns for clients that meet or exceed investment returns for comparable asset classes and competing investment services is a key consideration when clients decide to keep their assets with us or invest additional assets, and when a prospective client is deciding whether to invest with us. Poor investment performance, both in absolute terms and/or relative to peers and stated benchmarks, may result in clients withdrawing assets and in prospective clients choosing to invest with competitors.
|
|
•
|
Investing Trends
. Our fee rates vary significantly among the various investment products and services we offer to our clients. For example, we generally earn higher fees from assets invested in our actively-managed equity services than in our actively-managed fixed income services or passive services. Also, we often earn higher fees from global and international services than we do from U.S. services (
see “Net Revenues” in Item 7
for additional information regarding our fee rates). If our clients choose to invest in actively-managed fixed income services and/or passive services, which generally have lower fees, instead of actively-managed equity services, which generally have higher fees, our investment advisory and services fees and revenues will decline.
|
|
•
|
Service Changes
. We may be required to reduce our fee levels, restructure the fees we charge and/or adjust the services we offer to our clients because of, among other things, regulatory initiatives (whether industry-wide or specifically targeted), changing technology in the asset management business (including algorithmic strategies), court decisions and competitive considerations. A reduction in fees would reduce our revenues.
|
A decrease in the value of our AUM, or a decrease in the amount of AUM we manage, or an adverse mix shift in our AUM, would adversely affect our investment advisory and services fees and revenues. A reduction in revenues, without a commensurate reduction in expenses, adversely affects our results of operations.
Our reputation could suffer if we are unable to deliver consistent, competitive investment performance.
Our business is based on the trust and confidence of our clients. Damage to our reputation, resulting from poor or inconsistent investment performance, among other factors, can reduce substantially our AUM and impair our ability to maintain or grow our business.
16
Maintaining adequate liquidity for our general business needs depends on certain factors, including operating cash flows and our access to credit on reasonable terms.
Our financial condition is dependent on our cash flow from operations, which is subject to the performance of the capital markets, our ability to maintain and grow AUM and other factors beyond our control. Our ability to issue public or private debt on reasonable terms may be limited by adverse market conditions, our profitability, our creditworthiness as perceived by lenders and changes in government regulations, including tax rates and interest rates. Furthermore, our access to credit on reasonable terms is partially dependent on our firm’s credit ratings.
Standard & Poor’s Rating Service and Moody’s Investors Service, Inc. each affirmed AB’s long-term and short-term credit ratings in 2015 and also affirmed its stable outlook. Future changes in our credit ratings are possible and any downgrade to our ratings is likely to increase our borrowing costs and limit our access to the capital markets. If this occurs, we may be forced to incur unanticipated costs or revise our strategic plans, which could have a material adverse effect on our financial condition, results of operations and business prospects.
Our business is dependent on investment advisory agreements with clients, and selling and distribution agreements with various financial intermediaries and consultants, which generally are subject to termination or non-renewal on short notice.
We derive most of our revenues pursuant to written investment management agreements (or other arrangements) with institutional investors, mutual funds and private wealth clients, and selling and distribution agreements with financial intermediaries that distribute AB Funds. Generally, the investment management agreements (and other arrangements), including our agreements with AXA and its subsidiaries (our largest client), are terminable at any time or upon relatively short notice by either party. The investment management agreements pursuant to which we manage the U.S. Funds must be renewed and approved by the Funds’ boards of directors annually. A significant majority of the directors are independent. Consequently, there can be no assurance that the board of directors of each fund will approve the fund’s investment management agreement each year, or will not condition its approval on revised terms that may be adverse to us. In addition, investors in AB Funds can redeem their investments without notice. Any termination of, or failure to renew, a significant number of these agreements, or a significant increase in redemption rates, could have a material adverse effect on our results of operations and business prospects.
Similarly, the selling and distribution agreements with securities firms, brokers, banks and other financial intermediaries (including our agreement with UBS AG, with respect to which UBS AG was responsible for approximately 8% of our open-end AB Fund sales in 2015) are terminable by either party upon notice (generally 30 days) and do not obligate the financial intermediary to sell any specific amount of fund shares. These intermediaries generally offer their clients investment products that compete with our products. In addition, certain institutional investors rely on consultants to advise them about choosing an investment adviser and some of our services may not be considered among the best choices by these consultants. As a result, investment consultants may advise their clients to move their assets invested with us to other investment advisers, which could result in significant net outflows.
Lastly, our Private Wealth Services rely on referrals from financial planners, registered investment advisers and other professionals. We cannot be certain that we will continue to have access to, or receive referrals from, these third parties. Loss of such access or referrals could have a material adverse effect on our results of operations and business prospects.
We may be unable to continue to attract, motivate and retain key personnel, and the cost to retain key personnel could put pressure on our adjusted operating margin.
Our business depends on our ability to attract, motivate and retain highly skilled, and often highly specialized, technical, managerial and executive personnel and there is no assurance that we will be able to do so.
The market for qualified research analysts, portfolio managers, financial advisors, traders, executive officers and other professionals is extremely competitive and is characterized by frequent movement of these professionals among different firms. Portfolio managers, financial advisors and executive officers often maintain strong, personal relationships with investors in our products and other members of the business community so their departure may cause us to lose client accounts or result in fewer opportunities to win new business, either of which could have a material adverse effect on our results of operations and business prospects.
Also, a decline in revenues may limit our ability to pay our employees at competitive levels, and maintaining (or increasing) compensation without a revenue increase, in order to retain key personnel, may adversely affect our adjusted operating margin.
17
As a result, in response to recent declines in our AUM and revenues, we are taking steps to reduce costs and will continue to be vigilant about aligning our cost structure (including headcount) with our revenue base. For additional information regarding our compensation practices,
see "Compensation Discussion and Analysis" in Item 11.
Performance-based fee arrangements with our clients cause greater fluctuations in our net revenues.
We sometimes charge our clients performance-based fees, whereby we charge a base advisory fee and are eligible to earn an additional performance-based fee or incentive allocation that is calculated as either a percentage of absolute investment results or a percentage of investment results in excess of a stated benchmark over a specified period of time. Some performance-based fees include a high-watermark provision, which generally provides that if a client account underperforms relative to its performance target (whether in absolute terms or relative to a specified benchmark), it must gain back such underperformance before we can collect future performance-based fees. Therefore, if we fail to achieve the performance target for a particular period, we will not earn a performance-based fee for that period and, for accounts with a high-watermark provision, our ability to earn future performance-based fees will be impaired.
We are eligible to earn performance-based fees on 10.1%, 4.2% and 1.1% of the assets we manage for institutional clients, private wealth clients and retail clients, respectively (in total, 6.1% of our AUM). If the percentage of our AUM subject to performance-based fees grows, seasonality and volatility of revenue and earnings are likely to become more significant. Our performance-based fees in
2015
,
2014
and
2013
were $23.7 million, $53.2 million and $53.6 million, respectively. For 2015, the decrease in performance-based fees primarily resulted from the fact that major equity markets were down slightly for the year.
An impairment of goodwill may occur.
Determining whether an impairment of the goodwill asset exists requires management to exercise a substantial amount of judgment. In addition, to the extent that securities valuations are depressed for prolonged periods of time and/or market conditions continue to experience declines commensurate with the second half of 2015 and early in 2016, or if we experience significant net redemptions, our AUM, revenues, profitability and unit price will continue to be adversely affected. Although the price of an AB Holding Unit is just one factor in the calculation of fair value, if AB Holding Unit price levels continue to decline significantly, reaching the conclusion that fair value exceeds carrying value will, over time, become more difficult. In addition, control premiums, industry earnings multiples and discount rates are impacted by economic conditions. As a result, subsequent impairment tests may occur more frequently and be based on more negative assumptions and future cash flow projections, and may result in an impairment of goodwill. An impairment may result in a material charge to our earnings. For additional information about our impairment testing,
see Item 7
.
We may engage in strategic transactions that could pose risks.
As part of our business strategy, we consider from time to time potential strategic transactions, including acquisitions, dispositions, consolidations, joint ventures and similar transactions, some of which may be material. These transactions, if undertaken, may involve a number of risks and present financial, managerial and operational challenges, including:
|
•
|
adverse effects on our earnings if acquired intangible assets or goodwill become impaired;
|
|
•
|
existence of unknown liabilities or contingencies that arise after closing; and
|
|
•
|
potential disputes with counterparties.
|
Acquisitions also pose the risk that any business we acquire may lose customers or employees or could underperform relative to expectations. Additionally, the loss of investment personnel poses the risk that we may lose the AUM we expected to manage, which could adversely affect our results of operations. Furthermore, strategic transactions may require us to increase our leverage or, if we issue AB Units or AB Holding Units to fund an acquisition, would dilute the holdings of our existing Unitholders.
Fluctuations in the exchange rates between the U.S. dollar and various other currencies can adversely affect our AUM, revenues and results of operations.
Although significant portions of our net revenues and expenses, as well as our AUM, presently are denominated in U.S. dollars, we have subsidiaries and clients outside of the United States with functional currencies other than the U.S. dollar. Weakening of these currencies relative to the U.S. dollar adversely affects the value in U.S. dollar terms of our subsidiaries' revenues and
18
our AUM denominated in these other currencies. Accordingly, fluctuations in U.S. dollar exchange rates may affect our AUM, revenues and reported financial results from one period to the next.
We may not be successful in our efforts to hedge our exposure to such fluctuations, which could negatively impact our revenues and reported financial results.
Our seed capital investments are subject to market risk. While we enter into various futures, forwards and swap contracts to economically hedge many of these investments, we also may be exposed to market risk and credit-related losses in the event of non-performance by counterparties to these derivative instruments.
We have a seed investment program for the purpose of building track records and assisting with the marketing initiatives pertaining to our firm's new products. As our new product launches have increased in recent years, so too has our use of seed capital for investment purposes. These seed capital investments are subject to market risk. Our risk management team oversees a seed hedging program that attempts to minimize this risk, subject to practical and cost considerations. Also, not all seed investments are deemed appropriate to hedge, and in those cases we are exposed to market risk. In addition, we may be subject to basis risk in that we cannot always hedge with precision our market exposure and, as a result, we may be subject to relative spreads between market sectors. As a result, volatility in the capital markets may cause significant changes in our period-to-period financial and operating results.
We use various derivative instruments, including futures, forwards and swap contracts, in conjunction with our seed hedging program. While in most cases broad market risks are hedged, our hedges are imperfect and some market risk remains. In addition, our use of derivatives results in counterparty risk (
i.e.,
the risk that we may be exposed to credit-related losses in the event of non-performance by counterparties to these derivative instruments), regulatory risk (
e.g.
, short selling restrictions) and cash/synthetic basis risk (
i.e.,
the risk that the underlying positions do not move identically to the related derivative instruments).
The revenues generated by Bernstein Research Services may be adversely affected by circumstances beyond our control, including declines in brokerage transaction rates, declines in global market volumes and failure to settle our trades by significant counterparties.
Electronic, or “low-touch”, trading approaches represent a significant percentage of buy-side trading activity and typically produce transaction fees for execution-only services that are approximately one-third the price of traditional full service fee rates. As a result, blended pricing throughout our industry is lower now than it was historically, and price declines may continue. In addition, fee rates we charge and charged by other brokers for traditional brokerage services have historically experienced price pressure, and we expect these trends to continue. Also, while increases in transaction volume and market share often can offset decreases in rates, this may not continue. For example, global market volumes have declined in recent years, and we expect this may continue, especially considering recent increases in passive investing.
In addition, the failure or inability of any of our broker-dealer's significant counterparties to perform could expose us to substantial expenditures and adversely affect our revenues. For example, SCB LLC, as a member of clearing and settlement exchanges, would be required to settle open trades of any non-performing counterparty. This exposes us to the mark-to-market adjustment on the trades between trade date and settlement date, which could be significant, especially during periods of severe market volatility. Lastly, our ability to access cash in such situations may be limited by what our liquidity relationships are able to offer us at such times.
The individuals, third-party vendors or issuers on whom we rely to perform services for us or our clients may be unable or unwilling to honor their contractual obligations to us.
We rely on various counterparties and other third-party vendors to augment our existing investment, operational, financial and technological capabilities, but the use of a third-party vendor does not diminish AB's responsibility to ensure that client and regulatory obligations are met. In addition, default rates, downgrades and disputes with counterparties as to the valuation of collateral increase significantly in times of market stress. Disruptions in the financial markets and other economic challenges may cause our counterparties and other third-party vendors to experience significant cash flow problems or even render them insolvent, which may expose us to significant costs.
Also, weaknesses or failures within a third-party vendor's internal processes or systems can materially disrupt our business operations and third-party vendors may lack the necessary technology or resources to effectively safeguard our confidential data. If we are unable to effectively manage the risks associated with such third-party relationships, we may suffer fines, disciplinary action and harm to our reputation.
19
We may not accurately value the securities we hold on behalf of our clients or our company investments.
In accordance with applicable regulatory requirements, contractual obligations or client direction, we employ procedures for the pricing and valuation of securities and other positions held in client accounts or for company investments. We have established a Valuation Committee, composed of senior officers and employees, which oversees pricing controls and valuation processes. If market quotations for a security are not readily available, the Valuation Committee determines a fair value for the security.
Extraordinary volatility in financial markets, significant liquidity constraints or our failure to adequately consider one or more factors when determining the fair value of a security based on information with limited market observability could result in our failing to properly value securities we hold for our clients or investments accounted for on our balance sheet. Improper valuation likely would result in our basing fee calculations on inaccurate AUM figures, our striking incorrect net asset values for company-sponsored mutual funds or hedge funds or, in the case of company investments, our inaccurately calculating and reporting our financial condition and operating results. Although the overall percentage of our AUM that we fair value based on information with limited market observability is not significant, inaccurate fair value determinations can harm our clients, create regulatory issues and damage our reputation.
We may not have sufficient information to confirm or review the accuracy of valuations provided to us by underlying external managers for the funds in which certain of our alternative investment products invest.
Certain of our alternative investment services invest in funds managed by external managers (“
External Managers
”) rather than investing directly in securities and other instruments. As a result, our abilities will be limited with regard to (i) monitoring such investments, (ii) regularly obtaining complete, accurate and current information with respect to such investments and (iii) exercising control over such investments. Accordingly, we may not have sufficient information to confirm or review the accuracy of valuations provided to us by External Managers. In addition, we will be required to rely on External Managers’ compliance with any applicable investment guidelines and restrictions. Any failure of an External Manager to operate within such guidelines or to provide accurate information with respect to the investment could subject our alternative investment products to losses and cause damage to our reputation.
The quantitative models we use in certain of our investment services may contain errors, resulting in imprecise risk assessments and unintended output.
We use quantitative models in a variety of our investment services, generally in combination with fundamental research. Our quantitative models are validated by senior quantitative professionals. We have a Model Risk Working Group to formalize and oversee a quantitative model governance framework, including minimum validation standards. However, due to the complexity of such models, it is possible that errors in the models could exist and our controls could fail to detect such errors. Failure to detect errors could result in client losses and damage to our reputation.
We may not always successfully manage actual and potential conflicts of interest that arise in our business.
Increasingly, we must manage actual and potential conflicts of interest, including situations where our services to a particular client conflict, or are perceived to conflict, with the interests of another client. Failure to adequately address potential conflicts of interest could adversely affect our reputation, results of operations and business prospects.
We have procedures and controls that are designed to identify and mitigate conflicts of interest, including those designed to prevent the improper sharing of information. However, appropriately managing conflicts of interest is complex. Our reputation could be damaged and the willingness of clients to enter into transactions in which such a conflict might arise may be affected if we fail, or appear to fail, to deal appropriately with actual or perceived conflicts of interest. In addition, potential or perceived conflicts could give rise to litigation or regulatory enforcement actions.
Unpredictable events, including natural disaster, dangerous weather conditions, technology failure, terrorist attack and political unrest, may adversely affect our ability to conduct business.
War, terrorist attack, political unrest, power failure, climate change, natural disaster and rapid spread of infectious diseases could interrupt our operations by:
20
|
•
|
causing disruptions in global economic conditions, thereby decreasing investor confidence and making investment products generally less attractive;
|
|
•
|
inflicting loss of life;
|
|
•
|
triggering large-scale technology failures or delays; and
|
|
•
|
requiring substantial capital expenditures and operating expenses to remediate damage and restore operations.
|
Despite the contingency plans and facilities we have in place, including system security measures, information back-up and disaster recovery processes, our ability to conduct business may be adversely affected by a disruption in the infrastructure that supports our operations and the communities in which they are located. This may include a disruption involving electrical, communications, transportation or other services we may use or third parties with which we conduct business. If a disruption occurs in one location and our employees in that location are unable to occupy our offices or communicate with or travel to other locations, our ability to conduct business with and on behalf of our clients may suffer, and we may not be able to successfully implement contingency plans that depend on communication or travel. Furthermore, unauthorized access to our systems as a result of a security breach, the failure of our systems, or the loss of data could give rise to legal proceedings or regulatory penalties under laws protecting the privacy of personal information, disrupt operations, and damage our reputation.
Our operations require experienced, professional staff. Loss of a substantial number of such persons or an inability to provide properly equipped places for them to work may, by disrupting our operations, adversely affect our financial condition, results of operations and business prospects. In addition, our property and business interruption insurance may not be adequate to compensate us for all losses, failures, or breaches that may occur.
Technology failures can significantly constrain our operations and result in significant time and expense to remediate, whether caused by “cyber attack”, another type of security breach or inadvertent system error.
We are highly dependent on software and related technologies throughout our business, including both proprietary systems and those provided by third-party vendors. We use our technology to, among other things, obtain securities pricing information, process client transactions, and provide reports and other services to our clients. Although we take protective measures, including measures designed to effectively secure information through system security technology and established and tested business continuity plans, we may still experience system delays and interruptions as a result of natural disasters, hardware failures, software defects, power outages, acts of war (cyber or conventional) and third-party failures. We cannot predict with certainty all of the adverse effects that could result from our failure, or the failure of a third party, to efficiently address and resolve these delays and interruptions. These adverse effects could include the inability to perform critical business functions or failure to comply with financial reporting and other regulatory requirements, which could lead to loss of client confidence, reputational damage, exposure to disciplinary action and liability to our clients. Accordingly, potential system failures and the cost necessary to correct those failures could have a material adverse effect on our results of operations and business prospects.
In addition, we could be subject to losses if we fail to properly safeguard sensitive and confidential information. As part of our normal operations, we maintain and transmit confidential information about our clients as well as proprietary information relating to our business operations. Although we take protective measures, our systems still could be vulnerable to cyber attack or other forms of unauthorized access (including computer viruses) that have a security impact, such as an authorized employee or vendor inadvertently or intentionally causing us to release confidential or proprietary information. Such disclosure could, among other things, allow competitors access to our proprietary business information and require significant time and expense to investigate and remediate the breach. Moreover, loss of confidential client information could harm our reputation and subject us to liability under laws that protect confidential personal data, resulting in increased costs or loss of revenues.
Also, many of the software applications that we use in our business are licensed from, and supported, upgraded and maintained by, third-party vendors. A suspension or termination of certain of these licenses or the related support, upgrades and maintenance could cause temporary system delays or interruption. Additionally, technology rapidly evolves and we cannot guarantee that our competitors may not implement more advanced technology platforms for their products and services, which may place us at a competitive disadvantage and adversely affect our results of operations and business prospects.
Our own operational failures or those of third parties on which we rely, including failures arising out of human error, could disrupt our business, damage our reputation and reduce our revenues.
Weaknesses or failures in our internal processes or systems could lead to disruption of our operations, liability to clients, exposure to disciplinary action or harm to our reputation. Our business is highly dependent on our ability to process, on a daily
21
basis, large numbers of transactions, many of which are highly complex, across numerous and diverse markets. These transactions generally must comply with client investment guidelines, as well as stringent legal and regulatory standards.
Our obligations to clients require us to exercise skill, care and prudence in performing our services. Despite our employees being highly trained and skilled, the large number of transactions we process makes it highly likely that errors will occasionally occur. If we make a mistake in performing our services that causes financial harm to a client, we have a duty to act promptly to put the client in the position the client would have been in had we not made the error. The occurrence of mistakes, particularly significant ones, can have a material adverse effect on our reputation, results of operations and business prospects.
Our insurance policies may be insufficient to protect us against large losses.
We can make no assurance that a claim or claims will be covered by our insurance policies or, if covered, will not exceed the limits of available insurance coverage, or that our insurers will remain solvent and meet their obligations.
Our business is subject to pervasive, complex and continuously evolving global regulation, compliance with which involves substantial expenditures of time and money, and violation of which may result in material adverse consequences.
Virtually all aspects of our business are subject to federal and state laws and regulations, rules of securities regulators and exchanges, and laws and regulations in the foreign jurisdictions in which our subsidiaries conduct business. If we violate these laws or regulations, we could be subject to civil liability, criminal liability or sanction, including restriction or revocation of our and our subsidiaries’ professional licenses or registrations, revocation of the licenses of our employees, censures, fines, or temporary suspension or permanent bar from conducting business. Any such liability or sanction could have a material adverse effect on our financial condition, results of operations and business prospects. A regulatory proceeding, even if it does not result in a finding of wrongdoing or sanction, could require substantial expenditures of time and money and could potentially damage our reputation.
Moreover, regulators sometimes change their policies or laws in a manner that may make compliance more expensive and/or restrict or otherwise impede our ability to register, market and distribute our investment products. For example, the Financial Supervisory Commission in Taiwan (“
FSC
”) has implemented new limits on the degree to which local investors can own an offshore investment product, which limits were effective as of January 1, 2015. While certain exemptions have been available to us, should we not continue to qualify, the FSC’s new rules could force some of our local resident investors to redeem their investments in our funds sold in Taiwan (and/or prevent further sales of those funds in Taiwan), some of which funds have local ownership levels substantially above the new FSC limits. This could lead to significant declines in our investment advisory and services fees and revenues earned from these funds.
In addition, pending legislation in the U.S. and Europe could pose significant challenges to AB, including rules proposed by the U.S. Department of Labor ("
DOL
"), which are expected to become effective (at least in part) by the end of 2016. If enacted, the DOL's proposed rules, which impose fiduciary duties on financial advisors employed by broker-dealers, who provide investment advice pertaining to roll-overs of 401(k) balances and investments in individual retirement accounts, would change dramatically how investment advice is provided to clients industry-wide and will affect how AB compensates financial intermediaries that sell its mutual funds. The new rules also would adversely affect our ability to distribute our mutual funds to individual retirement accounts through subsidiaries of AXA, including AXA Advisors.
In Europe, the second installment of the Markets in Financial Instruments Directive II (“
MiFID II
”), enactment of which is expected to be delayed until January 1, 2018, would prohibit investment managers from receiving inducements, including research, from broker-dealers, in exchange for securities transaction execution commissions. As a result, MiFID II, if enacted as currently drafted, could substantially reduce the revenues of our U.K.-based broker-dealer, which would no longer be compensated for its research through soft-dollar payments by third party buy-side firms. Furthermore, AB's European buy-side subsidiaries could be required to pay hard dollars to purchase research, which would increase our expenses.
MiFID II, as currently drafted, would permit buy-side firms to purchase research through the use of client-funded research payment accounts. Also, the language of the recently-proposed Delegated Act under MiFID II appears to permit the funding of these accounts in a manner that would permit the continued use of traditional commission sharing agreements, which would significantly reduce the financial impact on buy-side and sell-side firms of the MiFID II prohibition on inducements. However, significant operational changes would be required to implement the rule. The ultimate impact of MiFID II on payments for research currently is uncertain.
22
We are involved in various legal proceedings and regulatory matters and may be involved in such proceedings in the future, any one or combination of which could have a material adverse effect on our reputation, financial condition, results of operations and business prospects.
We may be involved in various matters, including regulatory inquiries, administrative proceedings and litigation, some of which allege significant damages, and we may be involved in additional matters in the future. Litigation is subject to significant uncertainties, particularly when plaintiffs allege substantial or indeterminate damages, the litigation is in its early stages, or when the litigation is highly complex or broad in scope.
The financial services industry is intensely competitive.
We compete on the basis of a number of factors, including our investment performance for our clients, our array of investment services, innovation, reputation and price. By having a global presence, we may face competitors with more experience and more established relationships with clients, regulators and industry participants in the relevant market, which could adversely affect our ability to expand. Furthermore, if we are unable to maintain and/or continue to improve our investment performance, our client flows may be adversely affected, which may make it more difficult for us to compete effectively.
Also, increased competition could reduce the demand for our products and services, which could have a material adverse effect on our financial condition, results of operations and business prospects. For additional information regarding competitive factors,
see “Competition” in Item 1
.
A major factor in our competitive environment is the perception that active equity managers have, on average over the past decade, underperformed passive services, which invest based on market indices rather than individual stock selection. This perception has resulted in significant outflows from actively-managed services and corresponding significant inflows into passive services. In the resulting environment, organic growth through positive net inflows is difficult to achieve for active equity managers, such as AB, and requires taking market share from other active managers.
Structure-related Risks
The partnership structure of AB Holding and AB limits Unitholders’ abilities to influence the management and operation of AB’s business and is highly likely to prevent a change in control of AB Holding and AB.
The General Partner, as general partner of both AB Holding and AB, generally has the exclusive right and full authority and responsibility to manage, conduct, control and operate their respective businesses, except as otherwise expressly stated in their respective Amended and Restated Agreements of Limited Partnership. AB Holding and AB Unitholders have more limited voting rights on matters affecting AB than do holders of common stock in a corporation. Both Amended and Restated Agreements of Limited Partnership provide that Unitholders do not have any right to vote for directors of the General Partner and that Unitholders only can vote on certain extraordinary matters (including removal of the General Partner under certain extraordinary circumstances). Additionally, the AB Partnership Agreement includes significant restrictions on the transfer of AB Units and provisions that have the practical effect of preventing the removal of the General Partner, which provisions are highly likely to prevent a change in control of AB’s management.
AB Units are illiquid and subject to significant transfer restrictions.
There is no public trading market for AB Units and we do not anticipate that a public trading market will develop. The AB Partnership Agreement restricts our ability to participate in a public trading market or anything substantially equivalent to one by providing that any transfer that may cause AB to be classified as a “publicly traded partnership” (“
PTP
”) as defined in Section 7704 of the Internal Revenue Code of 1986, as amended (“
Code
”), shall be deemed void and shall not be recognized by AB. In addition, AB Units are subject to significant restrictions on transfer, such as obtaining the written consent of AXA Equitable and the General Partner pursuant to the AB Partnership Agreement. Generally, neither AXA Equitable nor the General Partner will permit any transfer that it believes would create a risk that AB would be treated as a corporation for tax purposes. AXA Equitable and the General Partner have implemented a transfer program that requires a seller to locate a purchaser and imposes annual volume restrictions on transfers. You may request a copy of the transfer program from our Corporate Secretary (
corporate_secretary@abglobal.com
). Also, we have filed the transfer program as Exhibit 10.07 to this Form 10-K.
23
Changes in the partnership structure of AB Holding and AB and/or changes in the tax law governing partnerships would have significant tax ramifications.
AB Holding, having elected under Section 7704(g) of the Code to be subject to a 3.5% federal tax on partnership gross income from the active conduct of a trade or business, is a “grandfathered” PTP for federal income tax purposes. AB Holding is also subject to the 4.0% New York City unincorporated business tax (“
UBT
”), net of credits for UBT paid by AB. In order to preserve AB Holding’s status as a “grandfathered” PTP for federal income tax purposes, management ensures that AB Holding does not directly or indirectly (through AB) enter into a substantial new line of business. A “new line of business” includes any business that is not closely related to AB’s historical business of providing research and diversified investment management and related services to its clients. A new line of business is “substantial” when a partnership derives more than 15% of its gross income from, or uses more than 15% of its total assets in, the new line of business.
AB is a private partnership for federal income tax purposes and, accordingly, is not subject to federal and state corporate income taxes. However, AB is subject to the 4.0% UBT. Domestic corporate subsidiaries of AB, which are subject to federal, state and local income taxes, generally are included in the filing of a consolidated federal income tax return with separate state and local income tax returns being filed. Foreign corporate subsidiaries generally are subject to taxes in the foreign jurisdiction where they are located. If our business increasingly operates in countries other than the U.S., AB’s effective tax rate will increase over time because our international subsidiaries are subject to corporate taxes in the jurisdictions where they are located.
In order to preserve AB’s status as a private partnership for federal income tax purposes, AB Units must not be considered publicly traded. If such units were to be considered readily tradable, AB would be subject to federal and state corporate income tax on its net income. Furthermore,
as noted above
, should AB enter into a substantial new line of business, AB Holding, by virtue of its ownership of AB, would lose its status as a grandfathered PTP and would become subject to corporate income tax
as set forth above
. For information about the significant restrictions on transfer of AB Units,
see the risk factor immediately above
.
In addition, recent decisions by members of Congress and their staffs regarding the need for fundamental tax reform and possible tax law changes to raise additional revenue have included suggestions that all large partnerships (which would include both AB and AB Holding) should be taxed as corporations and that a process should be implemented to address repatriating the non-U.S. earnings of U.S. companies. We cannot predict whether, or in what form, tax legislation will be proposed in the future and are unable to determine what effect any new legislation might have on us. If our subsidiaries' non-U.S. earnings are repatriated to the U.S. at unfavorable tax rates, our tax liability may increase substantially. Furthermore, if AB Holding and AB were to lose their federal tax status as partnerships, they would be subject to corporate income tax, which would reduce materially their net income and quarterly distributions to Unitholders.
If, pursuant to the Bipartisan Budget Act of 2015 ("2015 Act"), any audit by the Internal Revenue Services ("IRS") of our income tax returns for any fiscal year beginning after December 31, 2017 results in any adjustments, the IRS may collect any resulting taxes, including any applicable penalties and interest, directly from us, in which case our net income and the cash available for quarterly Unitholder distributions may be substantially reduced.
Although the IRS, under current law, generally determines tax adjustments at the partnership level when it audits the income tax return of a partnership, the IRS is required to collect any additional taxes, interest and penalties from the partnership's individual partners.
As discussed immediately below
, the 2015 Act modifies this procedure for fiscal years beginning after December 31, 2017.
Under the 2015 Act, if any audit by the IRS of our income tax returns for any fiscal year beginning after December 31, 2017 results in any adjustments, the IRS may collect any resulting taxes, including any applicable penalties and interest, directly from us. Generally, we will have the ability to collect such tax liability from our Unitholders in accordance with their percentage interests during the year under audit, but there can be no assurance that we will elect to do so or be able to do so under all circumstances. If we do not collect such tax liability from our Unitholders in accordance with their percentage interests in the tax year under audit, our net income and the available cash for quarterly distributions to current Unitholders may be substantially reduced. Accordingly, our current Unitholders may bear some or all of the tax liability resulting from such audit adjustment, even if such Unitholders did not own Units during the tax year under audit.
Further guidance from the IRS is expected, which may significantly impact the application of these rules.
24
Neither AB nor AB Holding has unresolved comments from the staff of the SEC to report.
25
Our principal executive offices located at 1345 Avenue of the Americas, New York, New York are occupied pursuant to a lease expiring in 2019 with options to extend to 2029. At this location, we currently lease 1,033,984 square feet of space, within which we currently occupy approximately 599,265 square feet of space and have sub-let approximately 434,719 square feet of space. We also lease space at two other locations in New York City; we acquired one of these leases in connection with the WPS Acquisition.
In addition, we lease approximately 263,083 square feet of space at One North Lexington, White Plains, New York under a lease expiring in 2021 with options to extend to 2031. At this location, we currently occupy approximately 69,013 square feet of space and have sub-let (or are seeking to sub-let) approximately 194,070 square feet of space.
We also lease 92,067 square feet of space in San Antonio, Texas under a lease expiring in 2019 with options to extend to 2029. At this location, we currently occupy approximately 59,004 square feet of space and have sub-let approximately 33,063 square feet of space.
In addition, we lease space in 20 other cities in the United States.
Our subsidiaries lease space in 28 cities outside the United States, the most significant of which are in London, England, under a lease expiring in 2022, and in Tokyo, Japan, under a lease expiring in 2018. In London, we currently lease 87,250 square feet of space, within which we currently occupy approximately 54,746 square feet of space and have sub-let (or are seeking to sub-let) approximately 32,504 square feet of space. In Tokyo, we currently lease and occupy approximately 34,615 square feet of space.
With respect to all significant litigation matters, we consider the likelihood of a negative outcome. If we determine the likelihood of a negative outcome is probable and the amount of the loss can be reasonably estimated, we record an estimated loss for the expected outcome of the litigation. If the likelihood of a negative outcome is reasonably possible and we are able to determine an estimate of the possible loss or range of loss in excess of amounts already accrued, if any, we disclose that fact together with the estimate of the possible loss or range of loss. However, it is often difficult to predict the outcome or estimate a possible loss or range of loss because litigation is subject to inherent uncertainties, particularly when plaintiffs allege substantial or indeterminate damages. Such is also the case when the litigation is in its early stages or when the litigation is highly complex or broad in scope. In these cases, we disclose that we are unable to predict the outcome or estimate a possible loss or range of loss.
During the first quarter of 2012, we received a legal letter of claim (“
Letter of Claim
”) sent on behalf of Philips Pension Trustees Limited and Philips Electronics U.K. Limited (“
Philips
”), a former pension fund client, alleging that AllianceBernstein Limited (one of our subsidiaries organized in the U.K.) was negligent and failed to meet certain applicable standards of care with respect to the initial investment in, and management of, a £500 million portfolio of U.S. mortgage-backed securities. Philips has alleged damages ranging between $177 million and $234 million, plus compound interest on an alleged $125 million of realized losses in the portfolio. On January 2, 2014, Philips filed a claim form (“
Claim
”) in the High Court of Justice in London, England, which formally commenced litigation with respect to the allegations in the Letter of Claim.
We believe that any losses to Philips resulted from adverse developments in the U.S. housing and mortgage market that precipitated the financial crisis in 2008 and not from any negligence or other failure or malfeasance on our part. We believe that we have strong defenses to these claims, which are set forth in our October 12, 2012 response to the Letter of Claim and our June 27, 2014 Statement of Defence in response to the Claim, and intend to defend this matter vigorously.
In addition to the Claim
discussed immediately above
, we are involved in various other matters, including regulatory inquiries, administrative proceedings and litigation, some of which allege significant damages.
In management’s opinion, an adequate accrual has been made as of
December 31, 2015
to provide for any probable losses regarding any litigation matters for which we can reasonably estimate an amount of loss. It is reasonably possible that we could incur additional losses pertaining to these matters, but currently we cannot estimate any such additional losses.
Management, after consultation with legal counsel, currently believes that the outcome of any individual matter that is pending or threatened, or all of them combined, will not have a material adverse effect on our results of operations, financial condition or liquidity. However, any inquiry, proceeding or litigation has an element of uncertainty; management cannot determine whether further developments relating to any individual matter that is pending or threatened, or all of them combined, will have a material adverse effect on our results of operations, financial condition or liquidity in any future reporting period.
Not applicable.
26
Market for AB Holding Units and AB Units; Cash Distributions
AB Holding Units are listed on the NYSE and trade publicly under the ticker symbol “AB”. There is no established public trading market for AB Units, which are subject to significant restrictions on transfer. For information about these transfer restrictions,
see “Structure-related Risks” in Item 1A
.
AB Holding’s principal source of income and cash flow is attributable to its limited partnership interests in AB.
Each of AB Holding and AB distributes on a quarterly basis all of its Available Cash Flow, as defined in the AB Holding Partnership Agreement and the AB Partnership Agreement, respectively, to its Unitholders and the General Partner. For additional information concerning distribution of Available Cash Flow by AB Holding,
see Note 2 to AB Holding’s financial statements in Item 8
. For additional information concerning distribution of Available Cash Flow by AB,
see Note 2 to AB’s consolidated financial statements in Item 8.
The distributions of Available Cash Flow made by AB and AB Holding during
2015
and
2014
and the high and low sale prices of AB Holding Units reflected on the NYSE composite transaction tape during
2015
and
2014
are as follows:
|
Quarters Ended 2015
|
|||||||||||||||||||
|
December
31
|
September
30
|
June
30
|
March
31
|
Total
|
|||||||||||||||
|
Cash distributions per AB Unit
(1)
|
$
|
0.56
|
|
$
|
0.50
|
|
$
|
0.54
|
|
$
|
0.51
|
|
$
|
2.11
|
|
||||
|
Cash distributions per AB Holding Unit
(1)
|
$
|
0.50
|
|
$
|
0.43
|
|
$
|
0.48
|
|
$
|
0.45
|
|
$
|
1.86
|
|
||||
|
AB Holding Unit prices:
|
|||||||||||||||||||
|
High
|
$
|
27.70
|
|
$
|
30.07
|
|
$
|
32.74
|
|
$
|
31.00
|
|
|
|
|||||
|
Low
|
$
|
21.23
|
|
$
|
22.00
|
|
$
|
28.79
|
|
$
|
24.04
|
|
|
|
|||||
|
Quarters Ended 2014
|
|||||||||||||||||||
|
December
31
|
September
30
|
June
30
|
March
31
|
Total
|
|||||||||||||||
|
Cash distributions per AB Unit
(1)
|
$
|
0.63
|
|
$
|
0.51
|
|
$
|
0.50
|
|
$
|
0.44
|
|
$
|
2.08
|
|
||||
|
Cash distributions per AB Holding Unit
(1)
|
$
|
0.57
|
|
$
|
0.45
|
|
$
|
0.45
|
|
$
|
0.39
|
|
$
|
1.86
|
|
||||
|
AB Holding Unit prices:
|
|||||||||||||||||||
|
High
|
$
|
27.39
|
|
$
|
28.18
|
|
$
|
26.69
|
|
$
|
26.00
|
|
|||||||
|
Low
|
$
|
22.40
|
|
$
|
25.00
|
|
$
|
22.71
|
|
$
|
20.98
|
|
|||||||
______________________________________________________________________________________________________________________
|
(1)
|
Declared and paid during the following quarter.
|
On
December 31, 2015
, the closing price of an AB Holding Unit on the NYSE was $23.85 per Unit and there were 915 AB Holding Unitholders of record for approximately 81,000 beneficial owners. On
December 31, 2015
, there were 409 AB Unitholders of record, and we do not believe there are substantial additional beneficial owners.
Recent Sales of Unregistered Securities; Use of Proceeds from Registered Securities
We did not engage in any unregistered sales of our securities during the years ended December 31,
2015
,
2014
and
2013
.
Purchases of Equity Securities by the Issuer and Affiliated Purchasers
Each quarter since the third quarter of 2011, AB has implemented plans to repurchase AB Holding Units pursuant to Rule 10b5-1 under the Exchange Act. The plan adopted during the fourth quarter of
2015
expired at the close of business on February 10, 2016. AB may adopt additional Rule 10b5-1 plans in the future to engage in open-market purchases of AB
27
Holding Units to help fund anticipated obligations under the firm’s incentive compensation award program and for other corporate purposes. For additional information about Rule 10b5-1 plans,
see “Units Outstanding” in Item 7
.
AB Holding Units bought by us or one of our affiliates during the fourth quarter of
2015
are as follows:
Issuer Purchases of Equity Securities
|
|
Total
Number of
AB Holding
Units
Purchased
|
Average
Price Paid
Per AB
Holding Unit,
net of
Commissions
|
Total
Number of
AB Holding
Units
Purchased as
Part of
Publicly
Announced
Plans or
Programs
|
Maximum
Number (or
Approximate
Dollar Value)
of AB
Holding
Units that
May Yet Be
Purchased
Under the
Plans or
Programs
|
||||||||
|
Period
|
||||||||||||
|
10/1/15-10/31/15
(1)(2)
|
530,341
|
|
$
|
26.52
|
|
—
|
|
—
|
|
|||
|
11/1/15-11/30/15
(2)
|
201,900
|
|
25.58
|
|
—
|
|
—
|
|
||||
|
12/1/15-12/31/15
(1)(2)
|
3,995,806
|
|
23.94
|
|
—
|
|
—
|
|
||||
|
Total
|
4,728,047
|
|
$
|
24.30
|
|
—
|
|
—
|
|
|||
________________________________________________________________________________________________________________________
|
(1)
|
During the fourth quarter of
2015
, we purchased 2,697,752 AB Holding Units from employees to allow them to fulfill statutory withholding tax requirements at the time of distribution of long-term incentive compensation awards.
|
|
(2)
|
During the fourth quarter of
2015
, we purchased 2,030,295 AB Holding Units on the open market pursuant to a Rule 10b5-1 plan to help fund anticipated obligations under our incentive compensation award program.
|
AB Units bought by us or one of our affiliates during the fourth quarter of
2015
are as follows:
Issuer Purchases of Equity Securities
|
Total Number
of
AB
Units
Purchased
|
Average
Price Paid
Per
AB
Unit, net of
Commissions
|
Total
Number of
AB
Units Purchased as
Publicly
Announced
Plans or
Programs
|
Maximum
Number (or
Approximate
Dollar Value)
of AB
Units that
May Yet Be
Purchased
Under the
Plans or
Programs
|
|||||||||
|
Period
|
||||||||||||
|
10/1/15-10/31/15
|
—
|
|
$
|
—
|
|
—
|
|
—
|
|
|||
|
11/1/15-11/30/15
|
—
|
|
—
|
|
—
|
|
—
|
|
||||
|
12/1/15-12/31/15
(1)
|
120
|
|
24.43
|
|
—
|
|
—
|
|
||||
|
Total
|
120
|
|
$
|
24.43
|
|
—
|
|
—
|
|
|||
________________________________________________________________________________________________________________________
|
(1)
|
During December
2015
, we purchased 120 AB Units in private transactions.
|
28
AllianceBernstein Holding L.P.
|
Years Ended December 31,
|
|||||||||||||||||||
|
2015
|
2014
|
2013
|
2012
|
2011
|
|||||||||||||||
|
(in thousands, except per unit amounts)
|
|||||||||||||||||||
|
INCOME STATEMENT DATA:
|
|||||||||||||||||||
|
Equity in net income (loss) attributable to AB Unitholders
|
$
|
212,498
|
|
$
|
203,277
|
|
$
|
185,912
|
|
$
|
70,807
|
|
$
|
(65,581
|
)
|
||||
|
Income taxes
|
24,320
|
|
22,463
|
|
20,410
|
|
19,722
|
|
27,687
|
|
|||||||||
|
Net income (loss)
|
$
|
188,178
|
|
$
|
180,814
|
|
$
|
165,502
|
|
$
|
51,085
|
|
$
|
(93,268
|
)
|
||||
|
Basic net income (loss) per unit
|
$
|
1.89
|
|
$
|
1.87
|
|
$
|
1.72
|
|
$
|
0.51
|
|
$
|
(0.90
|
)
|
||||
|
Diluted net income (loss) per unit
|
$
|
1.89
|
|
$
|
1.86
|
|
$
|
1.71
|
|
$
|
0.51
|
|
$
|
(0.90
|
)
|
||||
|
CASH DISTRIBUTIONS PER UNIT
(1)
|
$
|
1.86
|
|
$
|
1.86
|
|
$
|
1.79
|
|
$
|
1.23
|
|
$
|
1.14
|
|
||||
|
|
|
|
|
|
|
|
|
|
|
|
|||||||||
|
Total assets
|
$
|
1,589,965
|
|
$
|
1,627,892
|
|
$
|
1,533,654
|
|
$
|
1,566,493
|
|
$
|
1,628,984
|
|
||||
|
Partners’ capital
|
$
|
1,589,691
|
|
$
|
1,627,510
|
|
$
|
1,532,878
|
|
$
|
1,560,082
|
|
$
|
1,626,173
|
|
||||
________________________
|
(1)
|
AB Holding is required to distribute all of its Available Cash Flow, as defined in the AB Holding Partnership Agreement, to its Unitholders; 2015, 2014 and 2013 distributions reflect the impact of AB’s non-GAAP adjustments; 2012 distributions exclude the impact of AB’s $207.0 million non-cash real estate charges recorded in the third and fourth quarters of 2012; 2011 distributions exclude the impact of AB’s $587.1 million one-time, non-cash long-term incentive compensation charge.
|
29
AllianceBernstein L.P.
Selected Consolidated Financial Data
|
|
Years Ended December 31,
|
||||||||||||||||||
|
|
2015
|
2014
|
2013
|
2012
|
2011
|
||||||||||||||
|
|
(in thousands, except per unit amounts and unless otherwise indicated)
|
||||||||||||||||||
|
INCOME STATEMENT DATA:
|
|||||||||||||||||||
|
Revenues:
|
|||||||||||||||||||
|
Investment advisory and services fees
|
$
|
1,973,837
|
|
$
|
1,958,250
|
|
$
|
1,849,105
|
|
$
|
1,764,475
|
|
$
|
1,907,318
|
|
||||
|
Bernstein research services
|
493,463
|
|
482,538
|
|
445,083
|
|
413,707
|
|
437,414
|
|
|||||||||
|
Distribution revenues
|
427,156
|
|
444,970
|
|
465,424
|
|
409,488
|
|
360,722
|
|
|||||||||
|
Dividend and interest income
|
24,872
|
|
22,322
|
|
19,962
|
|
21,286
|
|
21,499
|
|
|||||||||
|
Investment gains (losses)
|
3,551
|
|
(9,076
|
)
|
33,339
|
|
29,202
|
|
(82,081
|
)
|
|||||||||
|
Other revenues
|
101,169
|
|
108,788
|
|
105,058
|
|
101,801
|
|
107,569
|
|
|||||||||
|
Total revenues
|
3,024,048
|
|
3,007,792
|
|
2,917,971
|
|
2,739,959
|
|
2,752,441
|
|
|||||||||
|
Less: interest expense
|
3,321
|
|
2,426
|
|
2,924
|
|
3,222
|
|
2,550
|
|
|||||||||
|
Net revenues
|
3,020,727
|
|
3,005,366
|
|
2,915,047
|
|
2,736,737
|
|
2,749,891
|
|
|||||||||
|
Expenses:
|
|
|
|
|
|
|
|
|
|
|
|||||||||
|
Employee compensation and benefits:
|
|||||||||||||||||||
|
Employee compensation and benefits
|
1,267,926
|
|
1,265,664
|
|
1,212,011
|
|
1,168,645
|
|
1,246,898
|
|
|||||||||
|
Long-term incentive compensation charge
|
—
|
|
—
|
|
—
|
|
—
|
|
587,131
|
|
|||||||||
|
Promotion and servicing:
|
|
|
|
|
|
|
|
|
|
|
|||||||||
|
Distribution-related payments
|
393,033
|
|
413,054
|
|
426,824
|
|
370,865
|
|
306,368
|
|
|||||||||
|
Amortization of deferred sales commissions
|
49,145
|
|
41,508
|
|
41,279
|
|
40,262
|
|
37,675
|
|
|||||||||
|
Other promotion and servicing
|
223,415
|
|
224,576
|
|
204,568
|
|
198,416
|
|
215,513
|
|
|||||||||
|
General and administrative:
|
|
|
|
|
|
|
|
|
|
|
|||||||||
|
General and administrative
|
431,635
|
|
426,960
|
|
423,043
|
|
507,682
|
|
532,896
|
|
|||||||||
|
Real estate charges
|
998
|
|
52
|
|
28,424
|
|
223,038
|
|
7,235
|
|
|||||||||
|
Contingent payment arrangements
|
(5,441
|
)
|
(2,782
|
)
|
(10,174
|
)
|
682
|
|
682
|
|
|||||||||
|
Interest on borrowings
|
3,119
|
|
2,797
|
|
2,962
|
|
3,429
|
|
2,545
|
|
|||||||||
|
Amortization of intangible assets
|
25,798
|
|
24,916
|
|
21,859
|
|
21,353
|
|
21,417
|
|
|||||||||
|
Total expenses
|
2,389,628
|
|
2,396,745
|
|
2,350,796
|
|
2,534,372
|
|
2,958,360
|
|
|||||||||
|
Operating income (loss)
|
631,099
|
|
608,621
|
|
564,251
|
|
202,365
|
|
(208,469
|
)
|
|||||||||
|
Income taxes
|
38,122
|
|
37,782
|
|
36,829
|
|
13,764
|
|
3,098
|
|
|||||||||
|
Net income (loss)
|
592,977
|
|
570,839
|
|
527,422
|
|
188,601
|
|
(211,567
|
)
|
|||||||||
|
Net income (loss) of consolidated entities attributable to non-controlling interests
|
6,375
|
|
456
|
|
9,746
|
|
(315
|
)
|
(36,799
|
)
|
|||||||||
|
Net income (loss) attributable to AB Unitholders
|
$
|
586,602
|
|
$
|
570,383
|
|
$
|
517,676
|
|
$
|
188,916
|
|
$
|
(174,768
|
)
|
||||
|
Basic net income (loss) per AB Unit
|
$
|
2.14
|
|
$
|
2.10
|
|
$
|
1.89
|
|
$
|
0.67
|
|
$
|
(0.62
|
)
|
||||
|
Diluted net income (loss) per AB Unit
|
$
|
2.13
|
|
$
|
2.09
|
|
$
|
1.88
|
|
$
|
0.67
|
|
$
|
(0.62
|
)
|
||||
|
Operating margin
(1)
|
20.7
|
%
|
20.2
|
%
|
19.0
|
%
|
7.4
|
%
|
n/m
|
|
|||||||||
30
|
CASH DISTRIBUTIONS PER AB UNIT
(2)
|
$
|
2.11
|
|
$
|
2.08
|
|
$
|
1.97
|
|
$
|
1.36
|
|
$
|
1.38
|
|
||||
|
BALANCE SHEET DATA AT PERIOD END:
|
|
|
|
|
|
|
|
|
|
|
|||||||||
|
Total assets
|
$
|
7,435,967
|
|
$
|
7,378,453
|
|
$
|
7,385,851
|
|
$
|
8,115,050
|
|
$
|
7,708,389
|
|
||||
|
Debt
|
$
|
583,946
|
|
$
|
488,988
|
|
$
|
268,398
|
|
$
|
323,163
|
|
$
|
444,903
|
|
||||
|
Total capital
|
$
|
4,054,917
|
|
$
|
4,115,861
|
|
$
|
4,069,726
|
|
$
|
3,803,268
|
|
$
|
4,029,487
|
|
||||
|
ASSETS UNDER MANAGEMENT AT PERIOD END (in millions)
|
$
|
467,440
|
|
$
|
474,027
|
|
$
|
450,411
|
|
$
|
430,017
|
|
$
|
405,897
|
|
||||
|
(1)
|
Operating income excluding net income (loss) attributable to non-controlling interests as a percentage of net revenues.
|
|
(2)
|
AB is required to distribute all of its Available Cash Flow, as defined in the AB Partnership Agreement, to its Unitholders and the General Partner; 2015, 2014 and 2013 distributions reflect the impact of non-GAAP adjustments; 2012 distributions exclude a total of $207.0 million of non-cash real estate charges recorded in the third and fourth quarters of 2012; 2011 distributions exclude the $587.1 million one-time, non-cash long-term incentive compensation charge.
|
31
Percentage change figures are calculated using assets under management rounded to the nearest million and financial statement amounts rounded to the nearest thousand.
Executive Overview
Our total assets under management (“
AUM
”) as of December 31, 2015 were $467.4 billion, down $6.6 billion, or 1.4%, during 2015. The decrease was driven by market depreciation of $9.8 billion, offset by net inflows of $3.2 billion (Institutional inflows of $6.9 billion, offset by Retail outflows of $3.5 billion and Private Wealth Management outflows of $0.2 billion).
Institutional AUM decreased $0.8 billion, or 0.4%, to $236.2 billion during 2015, primarily due to market depreciation of $7.5 billion, offset by net inflows of $6.9 billion. Gross sales increased $5.9 billion, or 24.7%, from $23.9 billion in 2014 to $29.8 billion in 2015. Redemptions and terminations increased $5.7 billion, or 53.0%, from $10.7 billion in 2014 to $16.4 billion in 2015.
Retail AUM decreased $7.1 billion, or 4.4%, to $154.4 billion during 2015, primarily due to net outflows of $3.5 billion and market depreciation of $3.2 billion. Gross sales decreased $6.3 billion, or 14.9%, from $42.1 billion in 2014 to $35.8 billion in 2015. Redemptions and terminations decreased $1.5 billion, or 3.9%, from $37.5 billion in 2014 to $36.0 billion in 2015.
Private Wealth Management AUM increased $1.3 billion, or 1.8%, to $76.8 billion during 2015, due to market appreciation of $0.9 billion and transfers/adjustments of $0.6 billion, offset by net outflows of $0.2 billion. Gross sales decreased $1.2 billion, or 19.1%, from $6.5 billion in 2014 to $5.3 billion in 2015. Redemptions and terminations decreased $3.7 billion, or 68.2%, from $5.5 billion in 2014 to $1.8 billion in 2015.
Bernstein Research Services revenue increased $10.9 million, or 2.3%, in 2015. The increase was the result of growth in the U.S. and Asia, partially offset by a combination of pricing pressure in Europe and weakness in European currencies compared to the U.S. dollar.
Our 2015 revenues increased $15.4 million, or 0.5%, to $3.0 billion primarily as a result of a $45.1 million increase in base advisory fees, the $12.6 million difference between 2015 investment gains of $3.5 million and 2014 investments losses of $9.1 million, and a $10.9 million increase in Bernstein Research Services revenue, offset by a decrease of $29.5 million in performance-based fees, a decrease of $17.8 million in distribution revenues and a decrease of $7.6 million in other revenues. Our operating expenses decreased $7.1 million, or 0.3%, primarily due to a $13.5 million decrease in promotion and servicing expenses, offset by a $5.6 million increase in general and administrative expenses and a $2.3 million increase in employee compensation benefits expenses. Our operating income increased $22.5 million, or 3.7%, to $631.1 million from $608.6 million in 2014 and our operating margin increased from 20.2% (24.2% on an adjusted basis) in 2014 to 20.7% (24.5% on an adjusted basis) in 2015.
Market Environment
During the second half of 2015, concerns regarding growth in China and other international economies, rapidly declining commodity prices, particularly oil, fixed income market liquidity and a possible slowdown in the global economic growth rate, among other factors, contributed to global equity market declines, which negatively affected our AUM and revenue levels. These market forces have created greater volatility in the securities markets, causing many investors to withdraw money from riskier asset classes, such as equities and high yield debt, and reallocate from actively-managed services to passive services that are perceived as “safer” investments. These factors have also contributed to our AUM and revenue declines.
For additional information,
please refer to “Risk Factors” in Item 1A.
Subsequent Event
On February 3, 2016, Cisco Systems, Inc. announced its agreement to acquire Jasper Technologies, Inc. (“
Jasper
”), a company in which we own a 7.6% equity interest. Jasper management has informed us that, based on this interest, we should expect to receive approximately $85 million in cash, subject to final transaction costs and working capital adjustments. We expect to receive approximately $77 million at the close of the transaction and the remaining $8 million after this amount is retained in escrow for 18 months. We anticipate that this transaction, which is subject to customary closing conditions, will close during the third quarter of 2016.
As of December 31, 2015, our investment in Jasper is recorded on our consolidated statement of financial condition (under the cost basis of accounting) at $10.2 million. We currently intend to exclude this investment gain from adjusted net income
32
because it is not part of our core operating results. This gain will be recognized in our US GAAP net income as of the closing date of the transaction.
AB Holding
AB Holding’s principal source of income and cash flow is attributable to its investment in AB Units. The AB Holding financial statements and notes and management’s discussion and analysis of financial condition and results of operations (“
MD&A
”) should be read in conjunction with those of AB.
33
Results of Operations
|
Years Ended December 31,
|
% Change
|
||||||||||||||||
|
2015
|
2014
|
2013
|
2015-14
|
2014-13
|
|||||||||||||
|
(in thousands, except per unit amounts)
|
|||||||||||||||||
|
Net income attributable to AB Unitholders
|
$
|
586,602
|
|
$
|
570,383
|
|
$
|
517,676
|
|
2.8
|
%
|
10.2
|
%
|
||||
|
Weighted average equity ownership interest
|
36.2
|
%
|
35.6
|
%
|
35.9
|
%
|
|||||||||||
|
Equity in net income attributable to AB Unitholders
|
$
|
212,498
|
|
$
|
203,277
|
|
$
|
185,912
|
|
4.5
|
|
9.3
|
|
||||
|
Income taxes
|
24,320
|
|
22,463
|
|
20,410
|
|
8.3
|
|
10.1
|
|
|||||||
|
Net income of AB Holding
|
$
|
188,178
|
|
$
|
180,814
|
|
$
|
165,502
|
|
4.1
|
|
9.3
|
|
||||
|
Diluted net income per AB Holding Unit
|
$
|
1.89
|
|
$
|
1.86
|
|
$
|
1.71
|
|
1.6
|
|
8.8
|
|
||||
|
Distributions per AB Holding Unit
(1)
|
$
|
1.86
|
|
$
|
1.86
|
|
$
|
1.79
|
|
—
|
|
3.9
|
|
||||
________________________
|
(1)
|
Distributions reflect the impact of AB’s non-GAAP adjustments.
|
AB Holding had net income of $188.2 million in 2015 as compared to $180.8 million in 2014. The increase reflects higher net income attributable to AB Unitholders and a higher weighted average equity ownership interest. AB Holding had net income of $180.8 million in 2014 as compared to $165.5 million in 2013. The increase reflects higher net income attributable to AB Unitholders.
AB Holding’s income taxes represent a 3.5% federal tax on its partnership gross income from the active conduct of a trade or business. AB Holding’s partnership gross income is derived from its interest in AB. AB Holding’s income tax is computed by multiplying certain AB qualifying revenues (primarily U.S. investment advisory fees and brokerage commissions) by AB Holding’s ownership interest in AB (adjusted for AB Holding Units owned by AB’s consolidated rabbi trust), multiplied by the 3.5% tax rate. AB Holding’s effective tax rate was 11.4% in 2015, 11.1% in 2014 and 11.0% in 2013.
See Note 6 to AB Holding’s financial statements in Item 8
for a further description.
As supplemental information, AB provides the performance measures “adjusted net revenues”, “adjusted operating income” and “adjusted operating margin”, which are the principal metrics management uses in evaluating and comparing the period-to-period operating performance of AB. Management principally uses these metrics in evaluating performance because they present a clearer picture of its operating performance and allow management to see long-term trends without the distortion primarily caused by long-term incentive compensation-related mark-to-market adjustments, real estate consolidation charges and other adjustment items. Similarly, management believes that these management operating metrics help investors better understand the underlying trends in AB's results and, accordingly, provide a valuable perspective for investors. Such measures are not based on generally accepted accounting principles (“
non-GAAP measures
”). These non-GAAP measures are provided in addition to, and not as substitutes for, net revenues, operating income and operating margin, and they may not be comparable to non-GAAP measures presented by other companies. Management uses both the GAAP and non-GAAP measures in evaluating the company’s financial performance. The non-GAAP measures alone may pose limitations because they do not include all of AB’s revenues and expenses. Further, adjusted diluted net income per AB Holding Unit is not a liquidity measure and should not be used in place of cash flow measures.
See “Management Operating Metrics” in this Item 7
.
34
The impact of these adjustments on AB Holding’s net income and diluted net income per AB Holding Unit are as follows:
|
Years Ended December 31,
|
|||||||||||
|
2015
|
2014
|
2013
|
|||||||||
|
(in thousands, except per unit amounts)
|
|||||||||||
|
AB non-GAAP adjustments, before taxes
|
$
|
(6,083
|
)
|
$
|
(665
|
)
|
$
|
20,552
|
|
||
|
Income tax credit (expense) on non-GAAP adjustments
|
367
|
|
610
|
|
(1,514
|
)
|
|||||
|
AB non-GAAP adjustments, after taxes
|
(5,716
|
)
|
(55
|
)
|
19,038
|
|
|||||
|
AB Holding’s weighted average equity ownership interest in AB
|
36.2
|
%
|
35.6
|
%
|
35.9
|
%
|
|||||
|
Impact on AB Holding’s net income of AB non-GAAP adjustments
|
$
|
(2,071
|
)
|
$
|
(20
|
)
|
$
|
6,837
|
|
||
|
Net income - diluted, GAAP basis
|
$
|
189,577
|
|
$
|
182,350
|
|
$
|
166,668
|
|
||
|
Impact on AB Holding’s net income of AB non-GAAP adjustments
|
(2,071
|
)
|
(20
|
)
|
6,837
|
|
|||||
|
Adjusted net income - diluted
|
$
|
187,506
|
|
$
|
182,330
|
|
$
|
173,505
|
|
||
|
Diluted net income per AB Holding Unit, GAAP basis
|
$
|
1.89
|
|
$
|
1.86
|
|
$
|
1.71
|
|
||
|
Impact of AB non-GAAP adjustments
|
(0.02
|
)
|
—
|
|
0.07
|
|
|||||
|
Adjusted diluted net income per AB Holding Unit
|
$
|
1.87
|
|
$
|
1.86
|
|
$
|
1.78
|
|
||
The impact on AB Holding’s net income of AB’s non-GAAP adjustments reflects AB Holding’s share (based on its ownership percentage of AB over the applicable period) of the impact of AB’s non-GAAP adjustments to its net income.
Proposed Tax Legislation
For a discussion of proposed tax legislation,
see “Risk Factors - Structure-related Risks” in Item 1A
.
Capital Resources and Liquidity
During the year ended December 31, 2015, net cash provided by operating activities was $192.8 million, compared to $180.9 million during the corresponding 2014 period. The increase primarily resulted from higher cash distributions received from AB of $13.1 million. During the year ended December 31, 2014, net cash provided by operating activities was $180.9 million, compared to $155.5 million during the corresponding 2013 period. The increase was primarily due to higher cash distributions received from AB of $37.6 million, offset by a decrease in working capital of $10.1 million.
During the years ended December 31, 2015, 2014 and 2013, net cash used in investing activities was $9.2 million, $19.0 million and $29.2 million, respectively, reflecting investments in AB with proceeds from exercises of compensatory options to buy AB Holding Units (in all years) and from cash distributions paid to the AB consolidated rabbi trust (in 2013).
During the year ended December 31, 2015, net cash used in financing activities was $183.6 million, compared to $162.0 million during the corresponding 2014 period. The increase was due to lower proceeds from exercises of compensatory options to buy AB Holding Units of $9.7 million and higher cash distributions to Unitholders of $9.6 million. During the year ended December 31, 2014, net cash used in financing activities was $162.0 million, compared to $126.2 million during the corresponding 2013 period. The increase was primarily due to higher cash distributions paid to Unitholders of $39.8 million.
Management believes that AB Holding will have the resources it needs to meet its financial obligations as a result of the cash flow AB Holding realizes from its investment in AB.
Cash Distributions
AB Holding is required to distribute all of its Available Cash Flow, as defined in the AB Holding Partnership Agreement, to its Unitholders (including the General Partner). Available Cash Flow typically is the adjusted diluted net income per unit for the quarter multiplied by the number of units outstanding at the end of the quarter. Management anticipates that Available Cash Flow will continue to be based on adjusted diluted net income per unit, unless management determines that one or more of the non-GAAP adjustments that are made for adjusted net income should not be made with respect to the Available Cash Flow calculation.
See Note 2 to AB Holding’s financial statements in Item 8
for a description of Available Cash Flow.
Commitments and Contingencies
For a discussion of commitments and contingencies,
see Note 7 to AB Holding’s financial statements in Item 8
.
35
AB
Assets Under Management
Assets under management by distribution channel are as follows:
|
|
As of December 31,
|
% Change
|
|||||||||||||||
|
|
2015
|
2014
|
2013
|
2015-14
|
2014-13
|
||||||||||||
|
|
(in billions)
|
|
|
|
|
||||||||||||
|
Institutions
|
$
|
236.2
|
|
$
|
237.0
|
|
$
|
226.0
|
|
(0.4
|
)%
|
4.9
|
%
|
||||
|
Retail
|
154.4
|
|
161.5
|
|
153.0
|
|
(4.4
|
)
|
5.6
|
|
|||||||
|
Private Wealth Management
|
76.8
|
|
75.5
|
|
71.4
|
|
1.8
|
|
5.7
|
|
|||||||
|
Total
|
$
|
467.4
|
|
$
|
474.0
|
|
$
|
450.4
|
|
(1.4
|
)
|
5.2
|
|
||||
Assets under management by investment service are as follows:
|
|
As of December 31,
|
% Change
|
|||||||||||||||
|
|
2015
|
2014
|
2013
|
2015-14
|
2014-13
|
||||||||||||
|
|
(in billions)
|
|
|
|
|
||||||||||||
|
Equity
|
|
|
|
|
|||||||||||||
|
Actively Managed
|
$
|
110.6
|
|
$
|
112.5
|
|
$
|
107.8
|
|
(1.7
|
)%
|
4.3
|
%
|
||||
|
Passively Managed
(1)
|
46.4
|
|
50.4
|
|
49.3
|
|
(8.1
|
)
|
2.4
|
|
|||||||
|
Total Equity
|
157.0
|
|
162.9
|
|
157.1
|
|
(3.7
|
)
|
3.7
|
|
|||||||
|
Fixed Income
|
|
|
|
|
|
|
|
|
|
|
|||||||
|
Actively Managed
|
|
|
|
|
|
|
|
|
|
|
|||||||
|
Taxable
|
207.4
|
|
219.4
|
|
211.0
|
|
(5.4
|
)
|
4.0
|
|
|||||||
|
Tax-exempt
|
33.5
|
|
31.6
|
|
28.7
|
|
5.9
|
|
10.2
|
|
|||||||
|
|
240.9
|
|
251.0
|
|
239.7
|
|
(4.0
|
)
|
4.8
|
|
|||||||
|
Passively Managed
(1)
|
10.0
|
|
10.1
|
|
9.3
|
|
(1.0
|
)
|
7.7
|
|
|||||||
|
Total Fixed Income
|
250.9
|
|
261.1
|
|
249.0
|
|
(3.9
|
)
|
4.9
|
|
|||||||
|
Other
(2)
|
59.5
|
|
50.0
|
|
44.3
|
|
19.1
|
|
12.7
|
|
|||||||
|
Total
|
$
|
467.4
|
|
$
|
474.0
|
|
$
|
450.4
|
|
(1.4
|
)
|
5.2
|
|
||||
|
(1)
|
Includes index and enhanced index services.
|
|
(2)
|
Includes multi-asset solutions and services and certain alternative investments.
|
36
Changes in assets under management during 2015 and 2014 are as follows:
|
|
Distribution Channel
|
||||||||||||||
|
|
Institutions
|
Retail
|
Private
Wealth
Management
|
Total
|
|||||||||||
|
|
(in billions)
|
||||||||||||||
|
Balance as of December 31, 2014
|
$
|
237.0
|
|
$
|
161.5
|
|
$
|
75.5
|
|
$
|
474.0
|
|
|||
|
Long-term flows:
|
|
|
|
|
|
|
|
|
|||||||
|
Sales/new accounts
|
29.8
|
|
35.8
|
|
5.3
|
|
70.9
|
|
|||||||
|
Redemptions/terminations
|
(16.4
|
)
|
(36.0
|
)
|
(1.8
|
)
|
(54.2
|
)
|
|||||||
|
Cash flow/unreinvested dividends
|
(6.5
|
)
|
(3.3
|
)
|
(3.7
|
)
|
(13.5
|
)
|
|||||||
|
Net long-term inflows (outflows)
|
6.9
|
|
(3.5
|
)
|
(0.2
|
)
|
3.2
|
|
|||||||
|
Transfers
|
(0.3
|
)
|
(0.1
|
)
|
0.4
|
|
—
|
|
|||||||
|
AUM adjustment
(3)
|
0.1
|
|
(0.3
|
)
|
0.2
|
|
—
|
|
|||||||
|
Market (depreciation) appreciation
|
(7.5
|
)
|
(3.2
|
)
|
0.9
|
|
(9.8
|
)
|
|||||||
|
Net change
|
(0.8
|
)
|
(7.1
|
)
|
1.3
|
|
(6.6
|
)
|
|||||||
|
Balance as of December 31, 2015
|
$
|
236.2
|
|
$
|
154.4
|
|
$
|
76.8
|
|
$
|
467.4
|
|
|||
|
Balance as of December 31, 2013
|
$
|
226.0
|
|
$
|
153.0
|
|
$
|
71.4
|
|
$
|
450.4
|
|
|||
|
Long-term flows:
|
|
|
|
|
|
|
|
|
|||||||
|
Sales/new accounts
|
23.9
|
|
42.1
|
|
6.5
|
|
72.5
|
|
|||||||
|
Redemptions/terminations
|
(10.7
|
)
|
(37.5
|
)
|
(5.5
|
)
|
(53.7
|
)
|
|||||||
|
Cash flow/unreinvested dividends
|
(7.7
|
)
|
(5.1
|
)
|
(0.9
|
)
|
(13.7
|
)
|
|||||||
|
Net long-term inflows (outflows)
|
5.5
|
|
(0.5
|
)
|
0.1
|
|
5.1
|
|
|||||||
|
Acquisitions
|
0.1
|
|
2.8
|
|
—
|
|
2.9
|
|
|||||||
|
Transfers
|
0.3
|
|
(0.4
|
)
|
0.1
|
|
—
|
|
|||||||
|
AUM adjustment
(3)
|
(1.1
|
)
|
(0.5
|
)
|
—
|
|
(1.6
|
)
|
|||||||
|
Market appreciation
|
6.2
|
|
7.1
|
|
3.9
|
|
17.2
|
|
|||||||
|
Net change
|
11.0
|
|
8.5
|
|
4.1
|
|
23.6
|
|
|||||||
|
Balance as of December 31, 2014
|
$
|
237.0
|
|
$
|
161.5
|
|
$
|
75.5
|
|
$
|
474.0
|
|
|||
37
|
|
Investment Service
|
||||||||||||||||||||||||||
|
|
Equity
Actively
Managed
|
Equity
Passively
Managed
(1)
|
Fixed
Income
Actively
Managed
- Taxable
|
Fixed
Income
Actively
Managed -
Tax-
Exempt
|
Fixed
Income
Passively
Managed
(1)
|
Other
(2)
|
Total
|
||||||||||||||||||||
|
(in billions)
|
|||||||||||||||||||||||||||
|
Balance as of December 31, 2014
|
$
|
112.5
|
|
$
|
50.4
|
|
$
|
219.4
|
|
$
|
31.6
|
|
$
|
10.1
|
|
$
|
50.0
|
|
$
|
474.0
|
|
||||||
|
Long-term flows:
|
|
|
|
|
|
|
|
|
|
|
|
|
|||||||||||||||
|
Sales/new accounts
|
17.0
|
|
0.9
|
|
34.5
|
|
4.8
|
|
0.6
|
|
13.1
|
|
70.9
|
|
|||||||||||||
|
Redemptions/terminations
|
(13.8
|
)
|
(1.3
|
)
|
(33.0
|
)
|
(2.8
|
)
|
(0.5
|
)
|
(2.8
|
)
|
(54.2
|
)
|
|||||||||||||
|
Cash flow/unreinvested dividends
|
(5.5
|
)
|
(2.7
|
)
|
(4.5
|
)
|
(0.9
|
)
|
(0.1
|
)
|
0.2
|
|
(13.5
|
)
|
|||||||||||||
|
Net long-term (outflows) inflows
|
(2.3
|
)
|
(3.1
|
)
|
(3.0
|
)
|
1.1
|
|
—
|
|
10.5
|
|
3.2
|
|
|||||||||||||
|
AUM adjustment
(3)
|
0.1
|
|
—
|
|
—
|
|
(0.1
|
)
|
—
|
|
—
|
|
—
|
|
|||||||||||||
|
Market appreciation (depreciation)
|
0.3
|
|
(0.9
|
)
|
(9.0
|
)
|
0.9
|
|
(0.1
|
)
|
(1.0
|
)
|
(9.8
|
)
|
|||||||||||||
|
Net change
|
(1.9
|
)
|
(4.0
|
)
|
(12.0
|
)
|
1.9
|
|
(0.1
|
)
|
9.5
|
|
(6.6
|
)
|
|||||||||||||
|
Balance as of December 31, 2015
|
$
|
110.6
|
|
$
|
46.4
|
|
$
|
207.4
|
|
$
|
33.5
|
|
$
|
10.0
|
|
$
|
59.5
|
|
$
|
467.4
|
|
||||||
|
Balance as of December 31, 2013
|
$
|
107.8
|
|
$
|
49.3
|
|
$
|
211.0
|
|
$
|
28.7
|
|
$
|
9.3
|
|
$
|
44.3
|
|
$
|
450.4
|
|
||||||
|
Long-term flows:
|
|
|
|
|
|
|
|
|
|
|
|
|
|
|
|||||||||||||
|
Sales/new accounts
|
15.2
|
|
1.7
|
|
43.3
|
|
4.6
|
|
0.6
|
|
7.1
|
|
72.5
|
|
|||||||||||||
|
Redemptions/terminations
|
(14.9
|
)
|
(1.0
|
)
|
(29.4
|
)
|
(3.4
|
)
|
(0.7
|
)
|
(4.3
|
)
|
(53.7
|
)
|
|||||||||||||
|
Cash flow/unreinvested dividends
|
(5.0
|
)
|
(3.4
|
)
|
(7.4
|
)
|
0.1
|
|
0.6
|
|
1.4
|
|
(13.7
|
)
|
|||||||||||||
|
Net long-term (outflows) inflows
|
(4.7
|
)
|
(2.7
|
)
|
6.5
|
|
1.3
|
|
0.5
|
|
4.2
|
|
5.1
|
|
|||||||||||||
|
Acquisitions
|
2.9
|
|
—
|
|
—
|
|
—
|
|
—
|
|
—
|
|
2.9
|
|
|||||||||||||
|
AUM adjustment
(3)
|
(0.1
|
)
|
—
|
|
(1.4
|
)
|
—
|
|
—
|
|
(0.1
|
)
|
(1.6
|
)
|
|||||||||||||
|
Market appreciation
|
6.6
|
|
3.8
|
|
3.3
|
|
1.6
|
|
0.3
|
|
1.6
|
|
17.2
|
|
|||||||||||||
|
Net change
|
4.7
|
|
1.1
|
|
8.4
|
|
2.9
|
|
0.8
|
|
5.7
|
|
23.6
|
|
|||||||||||||
|
Balance as of December 31, 2014
|
$
|
112.5
|
|
$
|
50.4
|
|
$
|
219.4
|
|
$
|
31.6
|
|
$
|
10.1
|
|
$
|
50.0
|
|
$
|
474.0
|
|
||||||
|
(1)
|
Includes index and enhanced index services.
|
|
(2)
|
Includes multi-asset solutions and services and certain alternative investments.
|
|
(3)
|
Represents adjustments to reported AUM for reporting methodology changes that do not represent inflows or outflows.
|
38
Average assets under management by distribution channel and investment service are as follows:
|
|
Years Ended December 31,
|
% Change
|
|||||||||||||||
|
|
2015
|
2014
|
2013
|
2015-14
|
2014-13
|
||||||||||||
|
|
(in billions)
|
|
|
|
|
||||||||||||
|
Distribution Channel:
|
|
|
|
|
|||||||||||||
|
Institutions
|
$
|
242.9
|
|
$
|
234.3
|
|
$
|
225.4
|
|
3.6
|
%
|
4.0
|
%
|
||||
|
Retail
|
160.6
|
|
159.6
|
|
149.4
|
|
0.6
|
|
6.8
|
|
|||||||
|
Private Wealth Management
|
77.2
|
|
73.6
|
|
67.9
|
|
4.9
|
|
8.4
|
|
|||||||
|
Total
|
$
|
480.7
|
|
$
|
467.5
|
|
$
|
442.7
|
|
2.8
|
|
5.6
|
|
||||
|
Investment Service:
|
|
|
|
|
|
|
|
|
|
|
|||||||
|
Equity Actively Managed
|
$
|
113.2
|
|
$
|
111.2
|
|
$
|
100.0
|
|
1.7
|
|
11.2
|
|
||||
|
Equity Passively Managed
(1)
|
49.3
|
|
49.6
|
|
45.1
|
|
(0.6
|
)
|
9.9
|
|
|||||||
|
Fixed Income Actively Managed – Taxable
|
217.7
|
|
219.5
|
|
221.4
|
|
(0.8
|
)
|
(0.9
|
)
|
|||||||
|
Fixed Income Actively Managed – Tax-exempt
|
32.6
|
|
30.4
|
|
30.1
|
|
7.2
|
|
1.3
|
|
|||||||
|
Fixed Income Passively Managed
(1)
|
10.1
|
|
9.7
|
|
8.6
|
|
4.1
|
|
12.6
|
|
|||||||
|
Other
(2)
|
57.8
|
|
47.1
|
|
37.5
|
|
22.7
|
|
25.5
|
|
|||||||
|
Total
|
$
|
480.7
|
|
$
|
467.5
|
|
$
|
442.7
|
|
2.8
|
|
5.6
|
|
||||
|
(1)
|
Includes index and enhanced index services.
|
|
(2)
|
Includes multi-asset solutions and services and certain alternative investments.
|
During 2015, our Institutional channel average AUM of $242.9 billion increased $8.6 billion, or 3.6%, compared to 2014; however, our Institutional AUM decreased $0.8 billion, or 0.4%, to $236.2 billion over the last twelve months. The $0.8 billion decrease in AUM for 2015 primarily resulted from market depreciation of $7.5 billion, which was concentrated in the third quarter of 2015, offset by net inflows of $6.9 billion, consisting of inflows of $9.7 billion in other and $1.7 billion in fixed income, offset by outflows of $4.5 billion in equity services.
During 2014, our Institutions channel average AUM of $234.3 billion increased by $8.9 billion, or 4.0%, compared to 2013, primarily due to our Institutional AUM increasing $11.0 billion, or 4.9%, during 2014 to $237.0 billion at December 31, 2014. The $11.0 billion increase in AUM during 2014 primarily was due to market appreciation of $6.2 billion and $5.5 billion of net inflows (consisting of inflows of $6.4 billion in fixed income services and $1.4 billion in other services, offset by outflows of $2.3 billion in equity services), offset by the $1.1 billion AUM adjustment we made in the third quarter of 2014.
During 2015, our Retail channel average AUM of $160.6 billion increased $1.0 billion, or 0.6%, compared to 2014; however, our Retail channel AUM decreased $7.1 billion, or 4.4%, to $154.4 billion over the last twelve months. The $7.1 billion decrease in AUM for 2015 primarily resulted from net outflows of $3.5 billion (primarily fixed income) and market depreciation of $3.2 billion (market depreciation during the third quarter of 2015 was $8.6 billion). During 2014, our Retail channel average AUM of $159.6 billion increased by $10.2 billion, or 6.8%, compared to 2013, primarily due to our Retail AUM increasing $8.5 billion, or 5.6%, during 2014 to $161.5 billion at December 31, 2014. The $8.5 billion increase in AUM during 2014 primarily was due to market appreciation of $7.1 billion and $2.8 billion of new assets from acquisitions, offset by net outflows of $0.5 billion (consisting of outflows of $4.0 billion in equity services, offset by inflows of $1.9 billion in fixed income services and $1.6 billion in other services) and the $0.5 billion AUM adjustment we made in the fourth quarter of 2014.
During 2015, our Private Wealth Management channel average AUM of $77.2 billion increased $3.6 billion, or 4.9%, compared to 2014. In addition, our Private Wealth Management channel AUM increased $1.3 billion, or 1.8%, to $76.8 billion over the last twelve months. The $1.3 billion increase in AUM for 2015 primarily resulted from $0.9 billion in market appreciation (although $3.2 billion of market depreciation occurred in the third quarter of 2015), offset by net outflows of $0.2 billion. During 2014, our Private Wealth Management channel average AUM of $73.6 billion increased by $5.7 billion, or 8.4%, compared to 2013, primarily due to our Private Wealth Management AUM increasing $4.1 billion, or 5.7%, during 2014 to $75.5 billion at December 31, 2014. The $4.1 billion increase in AUM during 2014 was primarily due to $3.9 billion of market
39
appreciation and net inflows of $0.1 billion (consisting of inflows of $1.2 billion in other services, offset by outflows of $1.1 billion in equity services).
Absolute investment composite returns, gross of fees, and relative performance as of December 31, 2015 compared to benchmarks for certain representative Institutional equity and fixed income services are as follows:
|
|
1-Year
|
3-Year
|
5-Year
|
|||||
|
Global High Income - Hedged (fixed income)
|
||||||||
|
Absolute return
|
(3.5
|
)%
|
2.3
|
%
|
5.4
|
%
|
||
|
Relative return (vs. Barclays Global High Yield Index - Hedged)
|
(2.8
|
)
|
(0.4
|
)
|
(0.6
|
)
|
||
|
Global Fixed Income (fixed income)
|
||||||||
|
Absolute return
|
(3.3
|
)
|
(2.8
|
)
|
1.4
|
|
||
|
Relative return (vs. CITI WLD GV BD-USD/JPM GLBL BD)
|
0.3
|
|
(0.1
|
)
|
1.5
|
|
||
|
Intermediate Municipal Bonds (fixed income)
|
||||||||
|
Absolute return
|
2.7
|
|
2.2
|
|
3.5
|
|
||
|
Relative return (vs. Lipper Short/Int. Blended Muni Fund Avg)
|
1.1
|
|
0.8
|
|
0.7
|
|
||
|
U.S. Strategic Core Plus (fixed income)
|
||||||||
|
Absolute return
|
0.9
|
|
2.0
|
|
3.9
|
|
||
|
Relative return (vs. Barclays U.S. Aggregate Index)
|
0.3
|
|
0.6
|
|
0.6
|
|
||
|
Emerging Market Debt (fixed income)
|
||||||||
|
Absolute return
|
(2.4
|
)
|
(1.1
|
)
|
4.5
|
|
||
|
Relative return (vs. JPM EMBI Global/JPM EMBI)
|
(3.6
|
)
|
(1.1
|
)
|
(0.6
|
)
|
||
|
Global Plus (fixed income)
|
||||||||
|
Absolute return
|
(3.5
|
)
|
(1.9
|
)
|
1.2
|
|
||
|
Relative return (vs. Barclays Global Aggregate Index)
|
(0.3
|
)
|
(0.2
|
)
|
0.3
|
|
||
|
Emerging Markets Value
|
||||||||
|
Absolute return
|
(16.5
|
)
|
(7.4
|
)
|
(6.5
|
)
|
||
|
Relative return (vs. MSCI EM Index)
|
(1.6
|
)
|
(0.6
|
)
|
(1.7
|
)
|
||
|
Global Strategic Value
|
||||||||
|
Absolute return
|
(3.1
|
)
|
12.1
|
|
6.2
|
|
||
|
Relative return (vs. MSCI ACWI Index)
|
(0.8
|
)
|
4.4
|
|
0.1
|
|
||
|
U.S. Small & Mid Cap Value
|
||||||||
|
Absolute return
|
(4.7
|
)
|
13.4
|
|
10.1
|
|
||
|
Relative return (vs. Russell 2500 Value Index)
|
0.8
|
|
2.9
|
|
0.9
|
|
||
|
U.S. Strategic Value
|
||||||||
|
Absolute return
|
(7.1
|
)
|
14.1
|
|
9.6
|
|
||
|
Relative return (vs. Russell 1000 Value Index)
|
(3.3
|
)
|
1.0
|
|
(1.6
|
)
|
||
|
U.S. Small Cap Growth
|
||||||||
|
Absolute return
|
0.1
|
|
13.5
|
|
12.3
|
|
||
|
Relative return (vs. Russell 2000 Growth Index)
|
1.5
|
|
(0.8
|
)
|
1.6
|
|
||
|
U.S. Large Cap Growth
|
||||||||
|
Absolute return
|
11.9
|
|
21.3
|
|
15.5
|
|
||
|
Relative return (vs. Russell 1000 Growth Index)
|
6.2
|
|
4.5
|
|
2.0
|
|
||
|
U.S. Small & Mid Cap Growth
|
||||||||
|
Absolute return
|
0.1
|
|
13.4
|
|
12.1
|
|
||
|
Relative return (vs. Russell 2500 Growth Index)
|
0.3
|
|
(1.2
|
)
|
0.6
|
|
||
40
|
1-Year
|
3-Year
|
5-Year
|
||||||
|
Concentrated U.S. Growth
|
||||||||
|
Absolute return
|
1.9
|
|
17.8
|
|
14.7
|
|
||
|
Relative return (vs. S&P 500 Index)
|
0.5
|
|
2.6
|
|
2.1
|
|
||
|
Select U.S. Equity
|
|
|
|
|
|
|
||
|
Absolute return
|
2.1
|
|
15.5
|
|
13.8
|
|
||
|
Relative return (vs. S&P 500 Index)
|
0.7
|
|
0.4
|
|
1.2
|
|
||
|
Strategic Equities (inception June 30, 2012)
|
||||||||
|
Absolute return
|
3.7
|
|
16.2
|
|
N/A
|
|
||
|
Relative return (vs. All Cap Index)
|
2.7
|
|
1.3
|
|
N/A
|
|
||
|
Global Core Equity (inception June 30, 2011)
|
||||||||
|
Absolute return
|
(1.7
|
)
|
9.3
|
|
N/A
|
|
||
|
Relative return (vs. MSCI ACWI Index)
|
0.7
|
|
1.6
|
|
N/A
|
|
||
Consolidated Results of Operations
|
|
Years Ended December 31,
|
% Change
|
|||||||||||||||
|
|
2015
|
2014
|
2013
|
2015-14
|
2014-13
|
||||||||||||
|
|
(in thousands, except per unit amounts)
|
|
|
|
|
||||||||||||
|
Net revenues
|
$
|
3,020,727
|
|
$
|
3,005,366
|
|
$
|
2,915,047
|
|
0.5
|
%
|
3.1
|
%
|
||||
|
Expenses
|
2,389,628
|
|
2,396,745
|
|
2,350,796
|
|
(0.3
|
)
|
2.0
|
|
|||||||
|
Operating income
|
631,099
|
|
608,621
|
|
564,251
|
|
3.7
|
|
7.9
|
|
|||||||
|
Income taxes
|
38,122
|
|
37,782
|
|
36,829
|
|
0.9
|
|
2.6
|
|
|||||||
|
Net income
|
592,977
|
|
570,839
|
|
527,422
|
|
3.9
|
|
8.2
|
|
|||||||
|
Net income of consolidated entities attributable to non-controlling interests
|
6,375
|
|
456
|
|
9,746
|
|
1,298.0
|
|
(95.3
|
)
|
|||||||
|
Net income attributable to AB Unitholders
|
$
|
586,602
|
|
$
|
570,383
|
|
$
|
517,676
|
|
2.8
|
|
10.2
|
|
||||
|
Diluted net income per AB Unit
|
$
|
2.13
|
|
$
|
2.09
|
|
$
|
1.88
|
|
1.9
|
|
11.2
|
|
||||
|
Distributions per AB Unit
|
$
|
2.11
|
|
$
|
2.08
|
|
$
|
1.97
|
|
1.4
|
|
5.6
|
|
||||
|
Operating margin
(1)
|
20.7
|
%
|
20.2
|
%
|
19.0
|
%
|
|
|
|
|
|||||||
|
(1)
|
Operating income excluding net income (loss) attributable to non-controlling interests as a percentage of net revenues.
|
Net income attributable to AB Unitholders for the year ended December 31, 2015 increased $16.2 million from the year ended December 31, 2014. The increase is primarily due to (in millions):
|
Higher base advisory fees
|
$
|
45.1
|
|
|
2015 investment gains compared to 2014 investment losses
|
12.6
|
|
|
|
Higher Bernstein Research Services revenues
|
10.9
|
|
|
|
Lower performance-based fees
|
(29.5
|
)
|
|
|
Lower other revenues
|
(7.6
|
)
|
|
|
Higher net income of consolidated entities attributable to non-controlling interests
|
(5.9
|
)
|
|
|
Higher general and administrative expenses
|
(5.6
|
)
|
|
|
Other
|
(3.8
|
)
|
|
|
|
$
|
16.2
|
|
41
Net income attributable to AB Unitholders for the year ended December 31, 2014 increased $52.7 million from the year ended December 31, 2013. The increase is primarily due to (in millions):
|
Higher base advisory fees
|
$
|
109.5
|
|
|
Higher Bernstein Research Services revenues
|
37.4
|
|
|
|
Lower real estate charges
|
28.3
|
|
|
|
Higher employee compensation and benefits
|
(53.7
|
)
|
|
|
2014 investment losses compared to 2013 investment gains
|
(42.3
|
)
|
|
|
Higher other promotion and servicing
|
(20.0
|
)
|
|
|
Other
|
(6.5
|
)
|
|
|
|
$
|
52.7
|
|
Real Estate Charges
During 2010, we performed a comprehensive review of our real estate requirements in New York in connection with our workforce reductions, which commenced in 2008. As a result, during 2010 we decided to sub-lease over 380,000 square feet in New York (all of this space has been sublet) and consolidate our New York-based employees into two office locations from three. During the third quarter of 2012, in an effort to further reduce our global real estate footprint, we completed a comprehensive review of our worldwide office locations and began implementing a global space consolidation plan. As a result, our intention is to sub-lease approximately 510,000 square feet of office space (in excess of 90% of this space has been sublet), more than 70% of which is New York office space (in addition to the 380,000 square feet space reduction in 2010), with the remainder consisting of office space in England, Australia and various U.S. locations.
During 2013, we recorded pre-tax real estate charges of $28.4 million, comprising $17.4 million from a change in estimates related to previously recorded real estate charges, new real estate charges of $6.6 million and $4.4 million for the write-off of leasehold improvements, furniture and equipment.
During 2014, we recorded pre-tax real estate charges of $0.1 million, comprising $5.5 million for the write-off of leasehold improvements, furniture and equipment, offset by $4.7 million from a change in estimates related to previously recorded real estate charges and $0.7 million in credits related to other items.
During 2015, we recorded pre-tax real estate charges of $1.0 million, resulting from a change in estimates related to previously recorded real estate charges.
During the first quarter of 2016, we will vacate and market for sublease two floors in New York. We currently expect to record real estate charges of approximately $29 million, which we anticipate will generate approximately $3.5 million of annualized savings assuming we can successfully sublease the office space based upon our current assumptions.
Units Outstanding
Each quarter, we implement plans to repurchase AB Holding Units pursuant to Rule 10b5-1 under the Securities Exchange Act of 1934, as amended (“
Exchange Act
”). A Rule 10b5-1 plan allows a company to repurchase its shares at times when it otherwise might be prevented from doing so because of self-imposed trading blackout periods or because it possesses material non-public information. Each broker we select has the authority under the terms and limitations specified in the plan to repurchase AB Holding Units on our behalf in accordance with the terms of the plan. Repurchases are subject to regulations promulgated by the SEC as well as certain price, market volume and timing constraints specified in the plan. The plan adopted during the fourth quarter of 2015 expired at the close of business on February 10, 2016. We may adopt additional Rule 10b5-1 plans in the future to engage in open-market purchases of AB Holding Units to help fund anticipated obligations under our incentive compensation award program and for other corporate purposes.
Cash Distributions
We are required to distribute all of our Available Cash Flow, as defined in the AB Partnership Agreement, to our Unitholders and the General Partner. Available Cash Flow typically is the adjusted diluted net income per unit for the quarter multiplied by the number of general and limited partnership interests at the end of the quarter. In future periods, management anticipates that Available Cash Flow will continue to be based on adjusted diluted net income per unit, unless management determines that one or more non-GAAP adjustments that are made for adjusted net income should not be made with respect to the Available Cash Flow calculation.
See Note 2 to our consolidated financial statements contained in Item 8
for a description of Available Cash Flow.
42
Management Operating Metrics
We are providing the non-GAAP measures “adjusted net revenues”, “adjusted operating income” and “adjusted operating margin” because they are the principal operating metrics management uses in evaluating and comparing period-to-period operating performance. Management principally uses these metrics in evaluating performance because they present a clearer picture of our operating performance and allow management to see long-term trends without the distortion primarily caused by long-term incentive compensation-related mark-to-market adjustments, real estate consolidation charges and other adjustment items. Similarly, we believe that these management operating metrics help investors better understand the underlying trends in our results and, accordingly, provide a valuable perspective for investors.
These non-GAAP measures are provided in addition to, and not as substitutes for, net revenues, operating income and operating margin, and they may not be comparable to non-GAAP measures presented by other companies. Management uses both accounting principles generally accepted in the United States of America ("
US GAAP
") and non-GAAP measures in evaluating our financial performance. The non-GAAP measures alone may pose limitations because they do not include all of our revenues and expenses.
|
Years Ended December 31,
|
|||||||||||
|
2015
|
2014
|
2013
|
|||||||||
|
(in thousands)
|
|||||||||||
|
Net revenues, US GAAP basis
|
$
|
3,020,727
|
|
$
|
3,005,366
|
|
$
|
2,915,047
|
|
||
|
Exclude:
|
|
|
|
|
|
|
|||||
|
Long-term incentive compensation-related investment losses (gains)
|
1,903
|
|
(2,184
|
)
|
(16,842
|
)
|
|||||
|
Long-term incentive compensation-related dividends and interest
|
(1,938
|
)
|
(3,083
|
)
|
(2,557
|
)
|
|||||
|
90% of consolidated venture capital fund investment (gains)
|
(7,117
|
)
|
(1,165
|
)
|
(10,609
|
)
|
|||||
|
Distribution-related payments
|
(393,033
|
)
|
(413,054
|
)
|
(426,824
|
)
|
|||||
|
Amortization of deferred sales commissions
|
(49,145
|
)
|
(41,508
|
)
|
(41,279
|
)
|
|||||
|
Pass-through fees and expenses
|
(47,479
|
)
|
(38,852
|
)
|
(32,879
|
)
|
|||||
|
Adjusted net revenues
|
$
|
2,523,918
|
|
$
|
2,505,520
|
|
$
|
2,384,057
|
|
||
|
Operating income, US GAAP basis
|
$
|
631,099
|
|
$
|
608,621
|
|
$
|
564,251
|
|
||
|
Exclude:
|
|
|
|
|
|
|
|||||
|
Long-term incentive compensation-related items
|
131
|
|
210
|
|
(405
|
)
|
|||||
|
Real estate charges
|
998
|
|
52
|
|
28,424
|
|
|||||
|
Acquisition-related expenses
|
—
|
|
3,448
|
|
3,373
|
|
|||||
|
Contingent payment arrangements
|
(7,212
|
)
|
(4,375
|
)
|
(10,840
|
)
|
|||||
|
Sub-total of non-GAAP adjustments
|
(6,083
|
)
|
(665
|
)
|
20,552
|
|
|||||
|
Less: Net income of consolidated entities attributable to non-controlling interests
|
6,375
|
|
456
|
|
9,746
|
|
|||||
|
Adjusted operating income
|
$
|
618,641
|
|
$
|
607,500
|
|
$
|
575,057
|
|
||
|
Adjusted operating margin
|
24.5
|
%
|
24.2
|
%
|
24.1
|
%
|
|||||
Adjusted operating income for the year ended December 31, 2015 increased $11.1 million, or 1.8%, from the year ended December 31, 2014, primarily due to higher investment advisory base fees of $36.5 million, higher Bernstein Research Services revenue of $10.9 million and lower investment losses of $10.8 million, offset by lower performance-based fees of $29.5 million, higher employee compensation expense (excluding the impact of long-term incentive compensation-related items) of $10.3 million and lower other revenues of $7.6 million. Adjusted operating income for the year ended December 31, 2014 increased $32.4 million, or 5.6%, from the year ended December 31, 2013, primarily as a result of higher investment advisory base fees of $107.0 million and higher Bernstein Research Services revenue of $37.4 million, offset by higher employee compensation expense (excluding the impact of long-term incentive compensation-related items) of $65.8 million, higher other promotion and servicing expenses of $16.5 million, investment losses in 2014 compared to investment gains in 2013 of $18.3 million and lower net distribution revenues of $6.9 million.
43
Adjusted Net Revenues
Adjusted net revenues exclude investment gains and losses and dividends and interest on employee long-term incentive compensation-related investments, and the 90% of the investment gains and losses of our consolidated venture capital fund attributable to non-controlling interests. In addition, adjusted net revenues offset distribution-related payments to third parties as well as amortization of deferred sales commissions against distribution revenues. We believe offsetting net revenues by distribution-related payments is useful for our investors and other users of our financial statements because such presentation appropriately reflects the nature of these costs as pass-through payments to third parties who perform functions on behalf of our sponsored mutual funds and/or shareholders of these funds. We offset amortization of deferred sales commissions against net revenues because such costs, over time, essentially offset our distribution revenues. We also exclude additional pass-through expenses we incur (primarily through our transfer agency) that are reimbursed and recorded as fees in revenues. These fees have no impact on operating income, but they do have an impact on our operating margin. As such, we exclude these fees from adjusted net revenues.
Adjusted Operating Income
Adjusted operating income represents operating income on a US GAAP basis excluding (1) the impact on net revenues and compensation expense of the investment gains and losses (as well as the dividends and interest) associated with employee long-term incentive compensation-related investments, (2) real estate charges, (3) acquisition-related expenses, (4) adjustments to contingent payment arrangements and (5) the net income or loss of consolidated entities attributable to non-controlling interests.
Prior to 2009, a significant portion of employee compensation was in the form of employee long-term incentive compensation awards that were notionally invested in AB investment services and generally vested over a period of four years. AB economically hedged the exposure to market movements by purchasing and holding these investments on its balance sheet. All such investments had vested as of year-end 2012 and the investments have been distributed to the participants, except for those investments with respect to which the participant elected a long-term deferral. Fluctuation in the value of these investments is recorded within investment gains and losses on the income statement and also impacts compensation expense. Management believes it is useful to reflect the offset achieved from economically hedging the market exposure of these investments in the calculation of adjusted operating income and adjusted operating margin. The non-GAAP measures exclude gains and losses and dividends and interest on employee long-term incentive compensation-related investments included in revenues and compensation expense.
Real estate charges have been excluded because they are not considered part of our core operating results when comparing financial results from period to period and to industry peers.
Acquisition-related expenses, primarily severance and professional fees incurred as a result of our acquisitions in the fourth quarter of 2013 and the second quarter of 2014, have been excluded because they are not considered part of our core operating results when comparing financial results from period to period and to industry peers.
The recording of changes in estimates of the contingent consideration payable with respect to contingent payment arrangements associated with our 2014 and 2010 acquisitions are not considered part of our core operating results and, accordingly, have been excluded.
Most of the net income or loss of consolidated entities attributable to non-controlling interests relates to the 90% limited partner interests held by third parties in our consolidated venture capital fund. We own a 10% limited partner interest in the fund. Because we are the general partner of the venture capital fund and are deemed to have a controlling interest, US GAAP requires that we consolidate the financial results of the fund. However, recognizing 100% of the gains or losses in operating income while only retaining 10% is not reflective of our underlying financial results at the operating income level. As a result, we exclude the 90% limited partner interests we do not own from our adjusted operating income. Similarly, net income of joint ventures attributable to non-controlling interests, although not significant, is excluded because it does not reflect the economic interest attributable to AB.
Adjusted Operating Margin
Adjusted operating margin allows us to monitor our financial performance and efficiency from period to period without the volatility
noted above in our discussion of adjusted operating income
and to compare our performance to industry peers on a basis that better reflects our performance in our core business. Adjusted operating margin is derived by dividing adjusted operating income by adjusted net revenues.
44
Net Revenues
The components of net revenues are as follows:
|
|
Years Ended December 31,
|
% Change
|
|||||||||||||||
|
|
2015
|
2014
|
2013
|
2015-14
|
2014-13
|
||||||||||||
|
|
(in thousands)
|
|
|
|
|
||||||||||||
|
Investment advisory and services fees:
|
|
|
|
|
|||||||||||||
|
Institutions:
|
|
|
|
|
|||||||||||||
|
Base fees
|
$
|
421,964
|
|
$
|
410,139
|
|
$
|
401,979
|
|
2.9
|
%
|
2.0
|
%
|
||||
|
Performance-based fees
|
12,496
|
|
22,967
|
|
36,129
|
|
(45.6
|
)
|
(36.4
|
)
|
|||||||
|
|
434,460
|
|
433,106
|
|
438,108
|
|
0.3
|
|
(1.1
|
)
|
|||||||
|
Retail:
|
|
|
|
|
|
|
|||||||||||
|
Base fees
|
847,246
|
|
846,418
|
|
817,595
|
|
0.1
|
|
3.5
|
|
|||||||
|
Performance-based fees
|
8,807
|
|
20,559
|
|
7,359
|
|
(57.2
|
)
|
179.4
|
|
|||||||
|
|
856,053
|
|
866,977
|
|
824,954
|
|
(1.3
|
)
|
5.1
|
|
|||||||
|
Private Wealth Management:
|
|
|
|
|
|
|
|||||||||||
|
Base fees
|
680,881
|
|
648,457
|
|
575,956
|
|
5.0
|
|
12.6
|
|
|||||||
|
Performance-based fees
|
2,443
|
|
9,710
|
|
10,087
|
|
(74.8
|
)
|
(3.7
|
)
|
|||||||
|
|
683,324
|
|
658,167
|
|
586,043
|
|
3.8
|
|
12.3
|
|
|||||||
|
Total:
|
|
|
|
|
|
|
|||||||||||
|
Base fees
|
1,950,091
|
|
1,905,014
|
|
1,795,530
|
|
2.4
|
|
6.1
|
|
|||||||
|
Performance-based fees
|
23,746
|
|
53,236
|
|
53,575
|
|
(55.4
|
)
|
(0.6
|
)
|
|||||||
|
|
1,973,837
|
|
1,958,250
|
|
1,849,105
|
|
0.8
|
|
5.9
|
|
|||||||
|
Bernstein Research Services
|
493,463
|
|
482,538
|
|
445,083
|
|
2.3
|
|
8.4
|
|
|||||||
|
Distribution revenues
|
427,156
|
|
444,970
|
|
465,424
|
|
(4.0
|
)
|
(4.4
|
)
|
|||||||
|
Dividend and interest income
|
24,872
|
|
22,322
|
|
19,962
|
|
11.4
|
|
11.8
|
|
|||||||
|
Investment gains (losses)
|
3,551
|
|
(9,076
|
)
|
33,339
|
|
n/m
|
|
n/m
|
|
|||||||
|
Other revenues
|
101,169
|
|
108,788
|
|
105,058
|
|
(7.0
|
)
|
3.6
|
|
|||||||
|
Total revenues
|
3,024,048
|
|
3,007,792
|
|
2,917,971
|
|
0.5
|
|
3.1
|
|
|||||||
|
Less: Interest expense
|
3,321
|
|
2,426
|
|
2,924
|
|
36.9
|
|
(17.0
|
)
|
|||||||
|
Net revenues
|
$
|
3,020,727
|
|
$
|
3,005,366
|
|
$
|
2,915,047
|
|
0.5
|
|
3.1
|
|
||||
Investment Advisory and Services Fees
Investment advisory and services fees are the largest component of our revenues. These fees generally are calculated as a percentage of the value of AUM as of a specified date, or as a percentage of the value of average AUM for the applicable billing period, and vary with the type of investment service, the size of account and the total amount of assets we manage for a particular client. Accordingly, fee income generally increases or decreases as AUM increase or decrease and is affected by market appreciation or depreciation, the addition of new client accounts or client contributions of additional assets to existing accounts, withdrawals of assets from and termination of client accounts, purchases and redemptions of mutual fund shares, shifts of assets between accounts or products with different fee structures, and acquisitions. Our average basis points realized (investment advisory and services fees divided by average AUM) generally approximate 50 to 70 basis points for actively-managed equity services, 15 to 50 basis points for actively-managed fixed income services and 5 to 20 basis points for passively-managed services. Average basis points realized for other services range from 5 basis points for certain Institutional asset allocation services to over 100 basis points for certain Retail and Private Wealth Management alternative services.
We calculate AUM using established market-based valuation methods and fair valuation (non-observable market) methods. Market-based valuation methods include: last sale/settle prices from an exchange for actively-traded listed equities, options and futures; evaluated bid prices from recognized pricing vendors for fixed income, asset-backed or mortgage-backed issues; mid prices from recognized pricing vendors and brokers for credit default swaps; and quoted bids or spreads from pricing vendors and brokers for other derivative products. Fair valuation methods include: discounted cash flow models, evaluation of assets versus liabilities or any other methodology that is validated and approved by our Valuation Committee (
see paragraph immediately below
for more information regarding our Valuation Committee). Fair valuation methods are used only where
45
AUM cannot be valued using market-based valuation methods, such as in the case of private equity or illiquid securities. Investments utilizing fair valuation methods comprise an insignificant amount of our total AUM.
The Valuation Committee, which is composed of senior officers and employees, is responsible for overseeing the pricing and valuation of all investments held in client and AB portfolios. The Valuation Committee has adopted a Statement of Pricing Policies describing principles and policies that apply to pricing and valuing investments held in these portfolios. We also have a Pricing Group, which reports to the Valuation Committee, and is responsible for overseeing the pricing process for all investments.
We sometimes charge our clients performance-based fees. In these situations, we charge a base advisory fee and are eligible to earn an additional performance-based fee or incentive allocation that is calculated as either a percentage of absolute investment results or a percentage of investment results in excess of a stated benchmark over a specified period of time. Some performance-based fees include a high-watermark provision, which generally provides that if a client account underperforms relative to its performance target (whether absolute or relative to a specified benchmark), it must gain back such underperformance before we can collect future performance-based fees. Therefore, if we fail to achieve our performance target for a particular period, we will not earn a performance-based fee for that period and, for accounts with a high-watermark provision, our ability to earn future performance-based fees will be impaired. We are eligible to earn performance-based fees on 10.1%, 4.2% and 1.1% of the assets we manage for institutional clients, private wealth clients and retail clients, respectively (in total, 6.1% of our AUM).
Our investment advisory and services fees increased $15.6 million, or 0.8%, in 2015, primarily due to a $45.1 million, or 2.4%, increase in base fees, which primarily resulted from a 2.8% increase in average AUM. The increase in base fees was partially offset by a $29.5 million, or 55.4%, decrease in performance-based fees. The decrease in performance-based fees primarily resulted from major equity market declines during the year. Our investment advisory and services fees increased $109.1 million, or 5.9%, in 2014, primarily due to a $109.5 million, or 6.1%, increase in base fees, which primarily resulted from a 5.6% increase in average AUM.
Institutional investment advisory and services fees increased $1.4 million, or 0.3%, in 2015, primarily due to an $11.8 million, or 2.9%, increase in base fees, which primarily resulted from a 3.6% increase in average AUM. The increase in base fees was partially offset by a $10.4 million, or 45.6%, decrease in performance-based fees. Institutional investment advisory and services fees decreased $5.0 million, or 1.2%, in 2014, due to a $13.1 million decrease in performance-based fees, offset by an $8.1 million, or 2.0%, increase in base fees. The base fee increase primarily resulted from a 4.0% increase in average AUM.
Retail investment advisory and services fees decreased $10.9 million, or 1.3%, in 2015, primarily due to an $11.7 million, or 57.2%, decrease in performance based fees, offset by a $0.8 million, or 0.1%, increase in base fees. Retail average AUM increased 0.6% in 2015. Retail investment advisory and services fees increased $42.0 million, or 5.1%, in 2014, due to a $28.9 million, or 3.5%, increase in base fees and a $13.1 million increase in performance-based fees. The base fee increase primarily was the result of a 6.8% increase in average AUM. The increase in base fees as compared to the increase in average AUM primarily is due to a shift in product mix from long-term non-U.S. global fixed income mutual funds to long-term U.S. mutual funds and other Retail products and services, which generally have lower fees as compared to long-term non-U.S. global fixed income mutual funds.
Private Wealth Management investment advisory and services fees increased $25.2 million, or 3.8%, in 2015, primarily due to a $32.4 million, or 5.0%, increase in base fees, which primarily resulted from an increase in average billable AUM of 4.7%. The increase in base fees was partially offset by a $7.2 million decrease in performance-based fees. Private Wealth Management investment advisory and services fees increased $72.1 million, or 12.3%, in 2014, due to a $72.5 million, or 12.6%, increase in base fees, which primarily resulted from an 8.7% increase in average billable AUM. Base fees were favorably impacted by a shift in product mix toward actively-managed equity and other services.
Bernstein Research Services
Bernstein Research Services revenue consists principally of equity commissions received for providing equity research and brokerage-related services to institutional investors.
Revenue from Bernstein Research Services increased $10.9 million, or 2.3%, in 2015. The increase was the result of growth in the U.S. and Asia, partially offset by a combination of pricing pressure in Europe and weakness in European currencies compared to the U.S. dollar. Revenues from Bernstein Research Services increased $37.4 million, or 8.4%, in 2014 as a result of strong growth across all regions and trading services.
46
Distribution Revenues
Two of our subsidiaries act as distributors and/or placement agents of company-sponsored mutual funds and receive distribution services fees from certain of those funds as partial reimbursement of the distribution expenses they incur. Period-over-period fluctuations of distribution revenues typically are in line with fluctuations of the corresponding average AUM of these mutual funds.
Distribution revenues decreased $17.8 million, or 4.0%, in 2015, while the corresponding average AUM of these mutual funds decreased 2.8%. Distribution revenues decreased $20.4 million, or 4.4%, in 2014, while the corresponding average AUM of these mutual funds decreased 3.0%. Average AUM of non B-share and non C-share mutual funds (which have lower distribution fee rates than B-share and C-share mutual funds) decreased 2.5%, while average AUM of B-share and C-share mutual funds decreased by 5.8%.
Dividend and Interest Income and Interest Expense
Dividend and interest income consists primarily of investment income and interest earned on customer margin balances and U.S. Treasury Bills. Interest expense principally reflects interest accrued on cash balances in customers’ brokerage accounts. Dividend and interest income, net of interest expense, increased $1.7 million and $2.8 million, respectively, in 2015 and 2014.
Investment Gains (Losses)
Investment gains (losses) consist primarily of realized and unrealized investment gains or losses on: (i) employee long-term incentive compensation-related investments, (ii) investments owned by our consolidated venture capital fund, (iii) U.S. Treasury Bills, (iv) market-making in exchange-traded options and equities, (v) seed capital investments and (vi) derivatives. Investment gains (losses) also include realized gains or losses on the sale of seed capital investments classified as available-for-sale securities and equity in earnings of proprietary investments in limited partnership hedge funds that we sponsor and manage.
Investment gains (losses) are as follows:
|
|
Years Ended December 31,
|
||||||||||
|
|
2015
|
2014
|
2013
|
||||||||
|
|
(in thousands)
|
||||||||||
|
Long-term incentive compensation-related investments
|
|||||||||||
|
Realized gains (losses)
|
$
|
3,687
|
|
$
|
3,089
|
|
$
|
1,857
|
|
||
|
Unrealized gains (losses)
|
(5,589
|
)
|
(905
|
)
|
14,985
|
|
|||||
|
Consolidated private equity fund investments
|
|||||||||||
|
Realized gains (losses)
|
|||||||||||
|
Non-public investments
|
1,983
|
|
—
|
|
(6,578
|
)
|
|||||
|
Public securities
|
(5,500
|
)
|
7,052
|
|
(3,781
|
)
|
|||||
|
|
(3,517
|
)
|
7,052
|
|
(10,359
|
)
|
|||||
|
Unrealized gains (losses)
|
|
|
|
|
|
|
|||||
|
Non-public investments
|
1,396
|
|
5,065
|
|
11,368
|
|
|||||
|
Public securities
|
10,028
|
|
(10,822
|
)
|
10,780
|
|
|||||
|
|
11,424
|
|
(5,757
|
)
|
22,148
|
|
|||||
|
Seed capital investments
|
|
|
|
|
|
|
|||||
|
Realized gains (losses)
|
|
|
|
|
|
|
|||||
|
Seed capital
|
23,007
|
|
22,336
|
|
21,289
|
|
|||||
|
Derivatives
|
11,448
|
|
(18,662
|
)
|
(20,665
|
)
|
|||||
|
|
34,455
|
|
3,674
|
|
624
|
|
|||||
|
Unrealized gains (losses)
|
|
|
|
|
|
|
|||||
|
Seed capital
|
(34,830
|
)
|
(7,421
|
)
|
9,938
|
|
|||||
|
Derivatives
|
3,724
|
|
(615
|
)
|
1,557
|
|
|||||
|
|
(31,106
|
)
|
(8,036
|
)
|
11,495
|
|
|||||
|
Brokerage-related investments
|
|
|
|
|
|
|
|||||
|
Realized gains (losses)
|
(5,653
|
)
|
(9,728
|
)
|
(7,605
|
)
|
|||||
|
Unrealized gains (losses)
|
(150
|
)
|
1,535
|
|
194
|
|
|||||
|
|
$
|
3,551
|
|
$
|
(9,076
|
)
|
$
|
33,339
|
|
||
Other Revenues
Other revenues consist of fees earned for transfer agency services provided to company-sponsored mutual funds, fees earned for administration and recordkeeping services provided to company-sponsored mutual funds and the general accounts of AXA and its subsidiaries, and other miscellaneous revenues. Other revenues decreased $7.6 million, or 7.0%, in 2015 primarily due to lower shareholder servicing fees and mutual fund reimbursements. Other revenues increased $3.8 million, or 3.6%, in 2014 primarily due to higher brokerage income and mutual fund reimbursements.
47
Expenses
The components of expenses are as follows:
|
|
Years Ended December 31,
|
% Change
|
|||||||||||||||
|
|
2015
|
2014
|
2013
|
2015-14
|
2014-13
|
||||||||||||
|
|
(in thousands)
|
|
|
|
|
||||||||||||
|
Employee compensation and benefits
|
$
|
1,267,926
|
|
$
|
1,265,664
|
|
$
|
1,212,011
|
|
0.2
|
%
|
4.4
|
%
|
||||
|
Promotion and servicing:
|
|
|
|
|
|
|
|
|
|
|
|||||||
|
Distribution-related payments
|
393,033
|
|
413,054
|
|
426,824
|
|
(4.8
|
)
|
(3.2
|
)
|
|||||||
|
Amortization of deferred sales commissions
|
49,145
|
|
41,508
|
|
41,279
|
|
18.4
|
|
0.6
|
|
|||||||
|
Other promotion and servicing
|
223,415
|
|
224,576
|
|
204,568
|
|
(0.5
|
)
|
9.8
|
|
|||||||
|
|
665,593
|
|
679,138
|
|
672,671
|
|
(2.0
|
)
|
1.0
|
|
|||||||
|
General and administrative:
|
|
|
|
|
|
|
|
|
|
|
|||||||
|
General and administrative
|
431,635
|
|
426,960
|
|
423,043
|
|
1.1
|
|
0.9
|
|
|||||||
|
Real estate charges
|
998
|
|
52
|
|
28,424
|
|
1,819.2
|
|
(99.8
|
)
|
|||||||
|
|
432,633
|
|
427,012
|
|
451,467
|
|
1.3
|
|
(5.4
|
)
|
|||||||
|
Contingent payment arrangements
|
(5,441
|
)
|
(2,782
|
)
|
(10,174
|
)
|
95.6
|
|
(72.7
|
)
|
|||||||
|
Interest
|
3,119
|
|
2,797
|
|
2,962
|
|
11.5
|
|
(5.6
|
)
|
|||||||
|
Amortization of intangible assets
|
25,798
|
|
24,916
|
|
21,859
|
|
3.5
|
|
14.0
|
|
|||||||
|
Total
|
$
|
2,389,628
|
|
$
|
2,396,745
|
|
$
|
2,350,796
|
|
(0.3
|
)
|
2.0
|
|
||||
Employee Compensation and Benefits
Employee compensation and benefits consist of base compensation (including salaries and severance), annual short-term incentive compensation awards (cash bonuses), annual long-term incentive compensation awards, commissions, fringe benefits and other employment costs (including recruitment, training, temporary help and meals).
Compensation expense as a percentage of net revenues was 42.0%, 42.1% and 41.6% for the years ended December 31, 2015, 2014 and 2013, respectively. Compensation expense generally is determined on a discretionary basis and is primarily a function of our firm’s current-year financial performance. The amounts of incentive compensation we award are designed to motivate, reward and retain top talent while aligning our executives' interests with the interests of our Unitholders. Senior management, with the approval of the Compensation Committee of the Board of Directors of AllianceBernstein Corporation (“
Compensation Committee
”), periodically confirms that the appropriate metric to consider in determining the amount of incentive compensation is the ratio of adjusted employee compensation and benefits expense to adjusted net revenues. Adjusted net revenues used in the adjusted compensation ratio are the same as the adjusted net revenues presented as a non-GAAP measure (
discussed earlier in this Item 7
). Adjusted employee compensation and benefits expense is total employee compensation and benefits expense minus other employment costs such as recruitment, training, temporary help and meals (which were 1.3%, 1.2% and 1.1% of adjusted net revenues for 2015, 2014 and 2013, respectively), and excludes the impact of mark-to-market vesting expense, as well as dividends and interest expense, associated with employee long-term incentive compensation-related investments. Senior management, with the approval of the Compensation Committee, has established as an objective that adjusted employee compensation and benefits expense generally should not exceed 50% of our adjusted net revenues, except in unexpected or unusual circumstances. Our ratios of adjusted compensation expense as a percentage of adjusted net revenues were 48.9%, 49.1% and 48.7%, respectively, for the years ended December 31, 2015, 2014 and 2013.
In 2015, employee compensation and benefits expense increased $2.3 million, or 0.2%, primarily due to higher base compensation ($16.3 million) and fringes/other ($6.0 million), offset by lower commissions ($14.0 million) and incentive compensation ($6.0 million). In 2014, employee compensation and benefits expense increased $53.7 million, or 4.4%, primarily due to higher incentive compensation ($33.3 million) and base compensation ($30.8 million), offset by lower commissions ($13.8 million).
Promotion and Servicing
Promotion and servicing expenses include distribution-related payments to financial intermediaries for distribution of AB mutual funds and amortization of deferred sales commissions paid to financial intermediaries for the sale of back-end load
48
shares of AB mutual funds. Also included in this expense category are costs related to travel and entertainment, advertising and promotional materials.
Promotion and servicing expenses decreased $13.5 million, or 2.0%, in 2015. The decrease primarily was the result of lower distribution-related payments of $20.0 million, lower marketing of $3.2 million and lower travel and entertainment of $1.6 million, offset by higher amortization of deferred sales commissions of $7.6 million and higher trade execution and clearing costs of $3.7 million. Promotion and servicing expenses increased $6.4 million, or 1.0%, in 2014. The increase primarily was the result of higher trade execution and clearing costs of $8.7 million, higher marketing and communications costs of $7.2 million, higher transfer fees of $2.2 million and higher travel and entertainment of $1.9 million, offset by lower distribution-related payments of $13.8 million.
General and Administrative
General and administrative expenses include portfolio services expenses, technology expenses, professional fees and office-related expenses (occupancy, communications and similar expenses). General and administrative expenses as a percentage of net revenues were 14.3%, 14.2% and 15.5% (14.5% excluding real estate charges) for the years ended December 31, 2015, 2014 and 2013, respectively. General and administrative expenses increased $5.6 million, or 1.3%, in 2015, primarily due to higher portfolio services expenses of $8.5 million and higher technology expenses of $3.6 million, offset by lower office-related expenses of $3.1 million and lower impact of foreign exchange rates of $2.7 million (the result of current year gains compared to prior year losses). General and administrative expenses decreased $24.4 million, or 5.4%, in 2014, primarily due to lower real estate charges of $28.3 million, offset by higher portfolio services expenses of $5.0 million.
Contingent Payment Arrangements
Contingent payment arrangements reflect changes in estimates of contingent payment liabilities associated with acquisitions in previous periods, as well as accretion expense of these liabilities. The credit to operating expenses of $5.4 million in 2015 reflects changes in estimate of the contingent consideration payable relating to our 2014 and 2010 acquisitions of $7.2 million recorded in the fourth quarter of 2015, offset by the accretion expense of $1.8 million. The credit to operating expenses of $2.8 million in 2014 reflects the change in estimate of the contingent consideration payable relating to a 2010 acquisition of $4.4 million recorded in the fourth quarter of 2014, offset by the accretion expense of $1.6 million. The credit to operating expenses of $10.2 million in 2013 reflects the change in estimate of the contingent consideration payable relating to a 2010 acquisition of $10.8 million recorded in the fourth quarter of 2013, offset by accretion expense of $0.6 million.
Income Taxes
AB, a private limited partnership, is not subject to federal or state corporate income taxes, but is subject to a 4.0% New York City unincorporated business tax (“
UBT
”). Our domestic corporate subsidiaries are subject to federal, state and local income taxes and generally are included in the filing of a consolidated federal income tax return. Separate state and local income tax returns also are filed. Foreign corporate subsidiaries generally are subject to taxes in the jurisdictions where they are located.
Income tax expense increased $0.3 million, or 0.9%, in 2015 compared to 2014 primarily due to higher pre-tax income, partially offset by a lower effective tax rate in the current year of 6.0% compared to 6.2% in 2014. The tax rate declined primarily because we generated a greater portion of our income in jurisdictions with lower tax rates.
Income tax expense increased $1.0 million, or 2.6%, in 2014 compared to 2013 primarily due to higher pre-tax income in 2014, partially offset by a lower effective tax rate in 2014 of 6.2% compared to 6.5% in 2013. The lower effective tax rate in 2014 primarily is due to a valuation allowance release of $10.7 million in one of our foreign subsidiaries, partially offset by an increase in tax reserves for uncertain tax positions of $7.4 million.
Net Income (Loss) of Consolidated Entities Attributable to Non-Controlling Interests
Net income (loss) of consolidated entities attributable to non-controlling interests primarily consists of limited partner interests owned by other investors representing 90% of the total limited partner interests in our consolidated venture capital fund. In 2015, we had $6.4 million of net income of consolidated entities attributable to non-controlling interests, primarily due to a $7.9 million net investment gain attributable to our consolidated venture capital fund (of which 90% belongs to non-controlling interests) and management fees of $1.2 million. In 2014, we had $0.5 million of net income of consolidated entities attributable to non-controlling interests, primarily due to a $1.3 million net investment gain attributable to our consolidated venture capital fund and management fees of $0.7 million.
49
Capital Resources and Liquidity
During 2015, net cash provided by operating activities was $667.2 million, compared to $630.1 million during 2014. The change primarily was due to lower deferred sales commissions paid of $59.3 million, lower seed capital purchases, offset by lower net broker-dealer redemptions of $54.5 million, a decrease in fees receivable of $40.7 million and higher cash provided by net income of $37.7 million, partially offset by a larger increase in broker-dealer related receivables (net of payables and segregated U.S. Treasury Bills activity) of $160.9 million. During 2014, net cash provided by operating activities was $630.1 million, compared to $505.6 million during 2013. The change primarily was due to a smaller decrease in broker-dealer related payables (net of receivables and segregated U.S. Treasury Bills activity) of $129.8 million and higher cash provided by net income of $114.0 million, partially offset by higher deferred sales commissions paid of $72.8 million and a decrease in accrued compensation and benefits of $42.2 million.
During 2015, net cash used in investing activities was $26.1 million, compared to $86.2 million during 2014. The decrease primarily resulted from the purchase of a business, net of cash acquired, during 2014 of $60.6 million. During 2014, net cash used in investing activities was $86.2 million, compared to $57.1 million during 2013, reflecting higher acquisition costs (cash paid, net of cash acquired) of $22.0 million.
During 2015, net cash used in financing activities was $644.7 million, compared to $478.2 million during 2014. The change reflects lower net issuances of commercial paper of $126.0 million, higher repurchases of AB Holding Units of $123.3 million, higher distributions to the General Partner and Unitholders of $25.5 million as a result of higher earnings (distributions on earnings are paid one quarter in arrears) and lower proceeds from the exercise of options to buy AB Holding Units of $9.7 million, offset by an increase in overdrafts payable of $118.5 million. During 2014, net cash used in financing activities was $478.2 million, compared to $562.4 million during 2013. The change reflects the issuance of commercial paper in 2014 as compared to repayments in 2013 (impact of $275.6 million) and lower purchases of AB Holding Units to fund deferred compensation plans of $21.5 million, partially offset by higher distributions to the General Partner and Unitholders of $111.1 million as a result of higher earnings (distributions on earnings are paid one quarter in arrears) and a decrease in overdrafts payable of $91.2 million.
As of December 31, 2015, AB had $541.5 million of cash and cash equivalents, all of which are available for liquidity, but consist primarily of cash on deposit for our broker-dealers to comply with various customer clearing activities and cash held by foreign subsidiaries for which a permanent investment election for U.S. tax purposes is taken. If the cash held at our foreign subsidiaries of $392.1 million, which includes cash on deposit for our foreign broker-dealers, is repatriated to the U.S., we would be required to accrue and pay U.S. income taxes on these funds, based on the unremitted amount. We currently intend to permanently reinvest these earnings outside the U.S.
As of December 31, 2015 and 2014, AB had $583.9 million and $489.0 million, respectively, in commercial paper outstanding with weighted average interest rates of approximately 0.5% and 0.3%, respectively. The commercial paper is short term in nature, and as such, recorded value is estimated to approximate fair value (and considered a Level 2 security in the fair value hierarchy). Average daily borrowings of commercial paper during 2015 and 2014 were $387.9 million and $335.0 million, respectively, with weighted average interest rates of approximately 0.3% and 0.2%, respectively.
AB has a $1.0 billion committed, unsecured senior revolving credit facility (the “
Credit Facility
”) with a group of commercial banks and other lenders. The Credit Facility provides for possible increases in the principal amount by up to an aggregate incremental amount of $250 million; any such increase is subject to the consent of the affected lenders. The Credit Facility is available for AB and Sanford C. Bernstein & Co., LLC (“
SCB LLC
”) business purposes, including the support of AB’s $1.0 billion commercial paper program. Both AB and SCB LLC can draw directly under the Credit Facility and management may draw on the Credit Facility from time to time. AB has agreed to guarantee the obligations of SCB LLC under the Credit Facility.
The Credit Facility contains affirmative, negative and financial covenants, which are customary for facilities of this type, including restrictions on dispositions of assets, restrictions on liens, a minimum interest coverage ratio and a maximum leverage ratio. As of December 31, 2015, we were in compliance with these covenants. The Credit Facility also includes customary events of default (with customary grace periods, as applicable), including provisions under which, upon the occurrence of an event of default, all outstanding loans may be accelerated and/or lender’s commitments may be terminated. Also, under such provisions, upon the occurrence of certain insolvency- or bankruptcy-related events of default, all amounts payable under the Credit Facility would automatically become immediately due and payable, and the lender’s commitments automatically would terminate.
50
Amounts under the Credit Facility may be borrowed, repaid and re-borrowed by us from time to time until the maturity of the facility. Voluntary prepayments and commitment reductions requested by us are permitted at any time without fee (other than customary breakage costs relating to the prepayment of any drawn loans) upon proper notice and subject to a minimum dollar requirement. Borrowings under the Credit Facility bear interest at a rate per annum, which will be, at our option, a rate equal to an applicable margin, which is subject to adjustment based on the credit ratings of AB, plus one of the following indexes: London Interbank Offered Rate; a floating base rate; or the Federal Funds rate.
On October 22, 2014, as part of an amendment and restatement, the maturity date of the Credit Facility was extended from January 17, 2017 to October 22, 2019. There were no other significant changes included in the amendment.
As of December 31, 2015 and 2014, we had no amounts outstanding under the Credit Facility. During 2015 and 2014, we did not draw upon the Credit Facility.
In addition, SCB LLC has three uncommitted lines of credit with three financial institutions. Two of these lines of credit permit us to borrow up to an aggregate of approximately $200 million, with AB named as an additional borrower, while one line has no stated limit. As of December 31, 2015 and 2014, SCB LLC had no bank loans outstanding. Average daily borrowings of bank loans during 2015 and 2014 were $3.9 million and $5.5 million, respectively, with weighted average interest rates of approximately 1.2% and 1.1%, respectively.
Our financial condition and access to public and private debt markets should provide adequate liquidity for our general business needs. Management believes that cash flow from operations and the issuance of debt and AB Units or AB Holding Units will provide us with the resources we need to meet our financial obligations.
See “Risk Factors” in Item 1A and “Cautions Regarding Forward-Looking Statements” in this Item 7
for a discussion of credit markets and our ability to renew our credit facilities at expiration.
Off-Balance Sheet Arrangements and Aggregate Contractual Obligations
Guarantees
Under various circumstances, AB guarantees the obligations of its consolidated subsidiaries.
AB maintains a guarantee in connection with the Credit Facility. If SCB LLC is unable to meet its obligations, AB will pay the obligations when due or on demand. In addition, AB maintains guarantees totaling $400 million for SCB LLC’s three uncommitted lines of credit.
AB maintains a guarantee with a commercial bank, under which we guarantee the obligations in the ordinary course of business of each of SCB LLC, our U.K.-based broker-dealer and our Cayman subsidiary. We also maintain three additional guarantees with other commercial banks under which we guarantee approximately $361 million of obligations for our U.K-based broker-dealer. In the event that any of these three entities is unable to meet its obligations, AB will pay the obligations when due or on demand.
We also have three smaller guarantees with a commercial bank totaling approximately $3 million, under which we guarantee certain obligations in the ordinary course of business of two foreign subsidiaries.
We have not been required to perform under any of the above agreements and currently have no liability in connection with these agreements.
In December 2015, we provided a 60-day guarantee to a commercial bank for borrowings by a company-sponsored fund up to a maximum of $50.0 million. The bank provided the fund with a limited partner subscription line for the unfunded commitments of the fund's limited partners. The fund is expected to repay the bank by calling capital from the limited partners. To the extent the fund is not able to repay the loan to the bank, we will repay the loan under the guarantee, up to $50.0 million. The fund will repay us for all amounts paid by us under the guaranty. We have not been required to perform under this guarantee and currently have no liability in connection with this guarantee.
51
Aggregate Contractual Obligations
Our contractual obligations as of December 31, 2015 are as follows:
|
|
Payments Due by Period
|
||||||||||||||||||
|
|
Total
|
Less than
1 Year
|
1-3 Years
|
3-5 Years
|
More than
5 Years
|
||||||||||||||
|
|
(in millions)
|
||||||||||||||||||
|
Commercial paper
|
$
|
583.9
|
|
$
|
583.9
|
|
$
|
—
|
|
$
|
—
|
|
$
|
—
|
|
||||
|
Operating leases, net of sublease commitments
|
1,078.0
|
|
94.2
|
|
184.7
|
|
160.7
|
|
638.4
|
|
|||||||||
|
Funding commitments
|
36.8
|
|
7.1
|
|
17.1
|
|
12.6
|
|
—
|
|
|||||||||
|
Accrued compensation and benefits
|
232.0
|
|
135.1
|
|
54.4
|
|
13.6
|
|
28.9
|
|
|||||||||
|
Unrecognized tax benefits
|
12.0
|
|
—
|
|
9.2
|
|
2.8
|
|
—
|
|
|||||||||
|
Total
|
$
|
1,942.7
|
|
$
|
820.3
|
|
$
|
265.4
|
|
$
|
189.7
|
|
$
|
667.3
|
|
||||
During 2009, we entered into a subscription agreement, under which we committed to invest up to $35.0 million, as amended in 2011, in a venture capital fund over a six-year period. As of December 31, 2015, we had funded $32.1 million of this commitment.
During 2010, as general partner of AllianceBernstein U.S. Real Estate L.P. (“
Real Estate Fund
”), we committed to invest $25.0 million in the Real Estate Fund. As of December 31, 2015, we had funded $19.6 million of this commitment. During 2014, as general partner of AllianceBernstein U.S. Real Estate II L.P. (“
Real Estate Fund II
”), we committed to invest $28.0 million, as amended in 2015, in the Real Estate Fund II. As of December 31, 2015, we had funded $1.4 million of this commitment.
During 2012, we entered into an investment agreement under which we committed to invest up to $8.0 million in an oil and gas fund over a three-year period. As of December 31, 2015, we had funded $6.1 million of this commitment.
Accrued compensation and benefits amounts
in the table above
exclude our accrued pension obligation. Offsetting our accrued compensation obligations are long-term incentive compensation-related investments and money market investments we funded totaling $83.5 million, which are included in our consolidated statement of financial condition. Any amounts reflected on the consolidated statement of financial condition as payables (to broker-dealers, brokerage clients and company-sponsored mutual funds) and accounts payable and accrued expenses are excluded
from
the table above
.
We expect to make contributions to our qualified profit sharing plan of approximately $14.0 million in each of the next four years. We currently do not plan to make a contribution to our qualified, defined benefit retirement plan during 2016.
Contingencies
See Note 13 to our consolidated financial statements in Item 8
for a discussion of our commitments and contingencies.
Critical Accounting Estimates
The preparation of the consolidated financial statements and notes to consolidated financial statements requires management to make estimates and judgments that affect the reported amounts of assets, liabilities, revenues and expenses.
Management believes that the critical accounting policies and estimates
discussed below
involve significant management judgment due to the sensitivity of the methods and assumptions used.
Variable Interest Entities
In accordance with ASU 2009-17,
Consolidations (Topic 810) – Improvements to Financial Reporting by Enterprises Involved with Variable Interest Entities,
the determination of whether a company is required to consolidate an entity is based on, among other things, an entity’s purpose and design, a company’s ability to direct the activities of the entity that most significantly impact the entity’s economic performance, and whether a company is obligated to absorb losses or receive benefits that could potentially be significant to the entity. The standard also requires ongoing assessments of whether a company is the primary beneficiary of a variable interest entity (“
VIE
”).
52
Significant judgment is required in the determination of whether we are the primary beneficiary of a VIE. If we, together with our related party relationships, are determined to be the primary beneficiary of a VIE, the entity will be consolidated within our consolidated financial statements. In order to determine whether we are the primary beneficiary of a VIE, management must make significant estimates and assumptions of probable future cash flows and assign probabilities to different cash flow scenarios. Assumptions made in such analyses include, but are not limited to, market prices of securities, market interest rates, potential credit defaults on individual securities or default rates on a portfolio of securities, gain realization, liquidity or marketability of certain securities, discount rates and the probability of certain other outcomes.
We provide seed capital to our investment teams to develop new products and services for our clients. Initially, we may be the sole investor in our new products as a result of our seed investments and, from one reporting period to the next, our ownership fluctuates as our clients invest and withdraw assets. Our seed investment portfolio has a weighted average age of approximately 17 months and we turn over approximately 50% of the seed investments annually. These investments are temporary in nature. Our larger seed capital investments range from $1 million to $35 million, with an average size of $10 million. The Audit Committee of the Board has established a ceiling of $650 million for the seed investment program. We evaluate our seed investments on a quarterly basis and consolidate such investments as required pursuant to US GAAP.
Goodwill
As of December 31, 2015, we had goodwill of $3.0 billion on the consolidated statement of financial condition. We have determined that AB has only one reporting segment and reporting unit. We test our goodwill annually, as of September 30, for impairment. As of September 30, 2015, the impairment test indicated that goodwill was not impaired. The carrying value of goodwill is also reviewed if facts and circumstances occur that suggest possible impairment, such as significant declines in AUM, revenues, earnings or the price of an AB Holding Unit.
On an annual basis, or when circumstances warrant, we perform step one of our two-step goodwill impairment test. The first step of the goodwill impairment test is used to identify potential impairment by comparing the fair value of AB, the reporting unit, with its carrying value, including goodwill. If the fair value of the reporting unit exceeds its carrying value, goodwill is not considered to be impaired and the second step of the impairment test is not performed. However, if the carrying value of the reporting unit exceeds its fair value, the second step of the goodwill impairment test is performed to measure the amount of impairment loss, if any. The second step compares the implied fair value of the reporting unit to the aggregated fair values of its individual assets and liabilities to determine the amount of impairment, if any.
AB estimates its fair value under both the market approach and income approach. Under the market approach, the fair value of the reporting unit is based on its unadjusted market valuation (AB Units outstanding multiplied by the price of an AB Holding Unit) and adjusted market valuations assuming a control premium and earnings multiples. The price of a publicly-traded AB Holding Unit serves as a reasonable starting point for valuing an AB Unit because each represents the same fractional interest in our underlying business. Our market approach analysis also includes control premiums, which are based on an analysis of control premiums for relevant recent acquisitions, and comparable industry earnings multiples applied to our earnings forecast. Under the income approach, the fair value of the reporting unit is based on the present value of estimated future cash flows. Determining estimated fair value using a discounted cash flow valuation technique consists of applying business growth rate assumptions over the estimated life of the goodwill asset and then discounting the resulting expected cash flows using an estimated weighted average cost of capital of market participants to arrive at a present value amount that approximates fair value.
Real Estate Charges
During 2010 and 2012, we performed comprehensive reviews of our office real estate requirements and determined to consolidate office space and sublease the excess office space. As a result, we recorded real estate charges that reflect the net present value of the difference between the amount of our on-going contractual lease obligations for the vacated floors and our estimate of current market rental rates for such floors. The charges we recorded were based on current assumptions at the time of the charges regarding sublease marketing periods, costs to prepare the properties to market, market rental rates, broker commissions and subtenant allowances/incentives, all of which are factors largely beyond our control. If our assumptions prove to be incorrect, we may need to record additional charges or reduce previously recorded charges. We review the assumptions and estimates we used in recording these charges on a quarterly basis.
Loss Contingencies
Management continuously reviews with legal counsel the status of regulatory matters and pending or threatened litigation. We evaluate the likelihood that a loss contingency exists and record a loss contingency if it is both probable and reasonably estimable as of the date of the financial statements.
See Note 13 to our consolidated financial statements in Item 8
.
53
Accounting Pronouncements
See Note 2 to our consolidated financial statements in Item 8.
Cautions Regarding Forward-Looking Statements
Certain statements provided by management in this report are “forward-looking statements” within the meaning of the Private Securities Litigation Reform Act of 1995. Such forward-looking statements are subject to risks, uncertainties and other factors that could cause actual results to differ materially from future results expressed or implied by such forward-looking statements. The most significant of these factors include, but are not limited to, the following: the performance of financial markets, the investment performance of sponsored investment products and separately-managed accounts, general economic conditions, industry trends, future acquisitions, integration of acquired companies, competitive conditions and government regulations, including changes in tax regulations and rates and the manner in which the earnings of publicly-traded partnerships are taxed. We caution readers to carefully consider such factors. Further, these forward-looking statements speak only as of the date on which such statements are made; we undertake no obligation to update any forward-looking statements to reflect events or circumstances after the date of such statements. For further information regarding these forward-looking statements and the factors that could cause actual results to differ,
see “Risk Factors” in Item 1A
. Any or all of the forward-looking statements that we make in this Form 10-K, other documents we file with or furnish to the SEC, and any other public statements we issue, may turn out to be wrong. It is important to remember that other factors besides
those listed in “Risk Factors” and those listed below
could also adversely impact our revenues, financial condition, results of operations and business prospects.
The forward-looking statements referred to in
the preceding paragraph
, most of which directly affect AB but also affect AB Holding because AB Holding’s principal source of income and cash flow is attributable to its investment in AB, include statements regarding:
|
•
|
Our belief that the cash flow AB Holding realizes from its investment in AB will provide AB Holding with the resources it needs to meet its financial obligations:
AB Holding’s cash flow is dependent on the quarterly cash distributions it receives from AB. Accordingly, AB Holding’s ability to meet its financial obligations is dependent on AB’s cash flow from its operations, which is subject to the performance of the capital markets and other factors beyond our control.
|
|
•
|
Our financial condition and ability to access the public and private capital markets providing adequate liquidity for our general business needs:
Our financial condition is dependent on our cash flow from operations, which is subject to the performance of the capital markets, our ability to maintain and grow client assets under management and other factors beyond our control. Our ability to access public and private capital markets on reasonable terms may be limited by adverse market conditions, our firm’s credit ratings, our profitability and changes in government regulations, including tax rates and interest rates.
|
|
•
|
The outcome of litigation:
Litigation is inherently unpredictable, and excessive damage awards do occur. Though we have stated that we do not expect certain pending legal proceedings to have a material adverse effect on our results of operations, financial condition or liquidity, any settlement or judgment with respect to a pending or future legal proceeding could be significant, and could have such an effect.
|
|
•
|
The possibility that we will engage in open market purchases of AB Holding Units to help fund anticipated obligations under our incentive compensation award program:
The number of AB Holding Units AB may decide to buy in future periods, if any, to help fund incentive compensation awards depends on various factors, some of which are beyond our control, including the fluctuation in the price of an AB Holding Unit (NYSE: AB) and the availability of cash to make these purchases.
|
|
•
|
Our determination that adjusted employee compensation expense generally should not exceed 50% of our adjusted net revenues:
Aggregate employee compensation reflects employee performance and competitive compensation levels. Fluctuations in our revenues and/or changes in competitive compensation levels could result in adjusted employee compensation expense exceeding 50% of our adjusted net revenues.
|
54
|
•
|
Our expectation that, as a result of vacating and marketing for sublease two floors in New York during the first quarter of 2016, we will record real estate charges totaling approximately $29 million, which we believe will generate approximately $3.5 million of annualized savings:
Any charges we record are based on our current assumptions regarding sublease marketing periods, costs to prepare the properties to market, market rental rates, broker commissions and subtenant allowances/incentives, all of which are factors largely beyond our control. If our assumptions prove to be incorrect, we may be forced to record additional charges, which may result in annual savings different from our current expectation.
|
55
Item 7A. Quantitative and Qualitative Disclosures about Market Risk
AB Holding
Market Risk, Risk Management and Derivative Financial Instruments
AB Holding’s sole investment is AB Units. AB Holding did not own, nor was it a party to, any derivative financial instruments during the years ended December 31,
2015
,
2014
and
2013
.
Market Risk, Risk Management and Derivative Financial Instruments
Our investments consist of trading, available-for-sale investments and other investments. Trading and available-for-sale investments include U.S. Treasury Bills, mutual funds, exchange-traded options and various separately-managed portfolios consisting of equity and fixed income securities. Trading investments are purchased for short-term investment, principally to fund liabilities related to long-term incentive compensation plans and to seed new investment services. Although available-for-sale investments are purchased for long-term investment, the portfolio strategy considers them available-for-sale from time to time due to changes in market interest rates, equity prices and other relevant factors. Other investments include investments in hedge funds we sponsor, our consolidated venture capital fund and other private equity investment vehicles.
We enter into various futures, forwards and swaps primarily to economically hedge our seed capital investments. We do not hold any derivatives designated in a formal hedge relationship under ASC 815-10,
Derivatives and Hedging. See Note 7 to our consolidated financial statements in Item 8.
Trading and Non-Trading Market Risk Sensitive Instruments
Investments with Interest Rate Risk—Fair Value
The table below
provides our potential exposure with respect to our fixed income investments, measured in terms of fair value, to an immediate 100 basis point increase in interest rates at all maturities from the levels prevailing as of December 31, 2015 and 2014. Such a fluctuation in interest rates is a hypothetical rate scenario used to calibrate potential risk and does not represent our view of future market movements. While these fair value measurements provide a representation of interest rate sensitivity of our investments in fixed income mutual funds and fixed income hedge funds, they are based on our exposures at a particular point in time and may not be representative of future market results. These exposures will change as a result of ongoing changes in investments in response to our assessment of changing market conditions and available investment opportunities:
|
|
As of December 31,
|
||||||||||||||
|
|
2015
|
2014
|
|||||||||||||
|
|
Fair Value
|
Effect of
+100
Basis Point
Change
|
Fair Value
|
Effect of
+100
Basis Point
Change
|
|||||||||||
|
|
(in thousands)
|
||||||||||||||
|
Fixed Income Investments:
|
|||||||||||||||
|
Trading
|
$
|
207,730
|
|
$
|
(11,446
|
)
|
$
|
196,041
|
|
$
|
(10,684
|
)
|
|||
|
Available-for-sale
|
183
|
|
(10
|
)
|
221
|
|
(12
|
)
|
|||||||
Investments with Equity Price Risk—Fair Value
Our investments also include investments in equity securities, mutual funds and hedge funds. The following table provides our potential exposure with respect to our equity investments, measured in terms of fair value, to an immediate 10% drop in equity prices from those prevailing as of December 31, 2015 and 2014. A 10% decrease in equity prices is a hypothetical scenario used to calibrate potential risk and does not represent our view of future market movements. While these fair value measurements provide a representation of equity price sensitivity of our investments in equity securities, mutual funds and hedge funds, they are based on our exposures at a particular point in time and may not be representative of future market results. These exposures will change as a result of ongoing portfolio activities in response to our assessment of changing market conditions and available investment opportunities:
|
|
As of December 31,
|
||||||||||||||
|
|
2015
|
2014
|
|||||||||||||
|
|
Fair Value
|
Effect of -10%
Equity Price
Change
|
Fair Value
|
Effect of -10%
Equity Price
Change
|
|||||||||||
|
|
(in thousands)
|
||||||||||||||
|
Equity Investments:
|
|||||||||||||||
|
Trading
|
$
|
332,178
|
|
$
|
(33,218
|
)
|
$
|
409,792
|
|
$
|
(40,979
|
)
|
|||
|
Available-for-sale and other investments
|
129,709
|
|
(12,971
|
)
|
157,421
|
|
(15,742
|
)
|
|||||||
56
Report of Independent Registered Public Accounting Firm
To the General Partner and Unitholders of
AllianceBernstein Holding L.P.:
In our opinion, the accompanying statements of financial condition and the related statements of income, comprehensive income, changes in partners’ capital and cash flows present fairly, in all material respects, the financial position of AllianceBernstein Holding L.P. (“AB Holding”) at December 31, 2015 and 2014, and the results of its operations and its cash flows for each of the three years in the period ended December 31, 2015 in conformity with accounting principles generally accepted in the United States of America. Also in our opinion, AB Holding maintained, in all material respects, effective internal control over financial reporting as of December 31, 2015, based on criteria established in
Internal Control-Integrated Framework
(2013)
issued by the Committee of Sponsoring Organizations of the Treadway Commission (COSO). AB Holding’s management is responsible for these financial statements, for maintaining effective internal control over financial reporting and for its assessment of the effectiveness of internal control over financial reporting, included in
Management’s Report on Internal Control over Financial Reporting
appearing under Item 9A. Our responsibility is to express opinions on these financial statements and on AB Holding’s internal control over financial reporting based on our integrated audits. We conducted our audits in accordance with the standards of the Public Company Accounting Oversight Board (United States). Those standards require that we plan and perform the audits to obtain reasonable assurance about whether the financial statements are free of material misstatement and whether effective internal control over financial reporting was maintained in all material respects. Our audits of the financial statements included examining, on a test basis, evidence supporting the amounts and disclosures in the financial statements, assessing the accounting principles used and significant estimates made by management, and evaluating the overall financial statement presentation. Our audit of internal control over financial reporting included obtaining an understanding of internal control over financial reporting, assessing the risk that a material weakness exists, and testing and evaluating the design and operating effectiveness of internal control based on the assessed risk. Our audits also included performing such other procedures as we considered necessary in the circumstances. We believe that our audits provide a reasonable basis for our opinions.
A company’s internal control over financial reporting is a process designed to provide reasonable assurance regarding the reliability of financial reporting and the preparation of financial statements for external purposes in accordance with generally accepted accounting principles. A company’s internal control over financial reporting includes those policies and procedures that (i) pertain to the maintenance of records that, in reasonable detail, accurately and fairly reflect the transactions and dispositions of the assets of the company; (ii) provide reasonable assurance that transactions are recorded as necessary to permit preparation of financial statements in accordance with generally accepted accounting principles, and that receipts and expenditures of the company are being made only in accordance with authorizations of management and directors of the company; and (iii) provide reasonable assurance regarding prevention or timely detection of unauthorized acquisition, use, or disposition of the company’s assets that could have a material effect on the financial statements.
Because of its inherent limitations, internal control over financial reporting may not prevent or detect misstatements. Also, projections of any evaluation of effectiveness to future periods are subject to the risk that controls may become inadequate because of changes in conditions, or that the degree of compliance with the policies or procedures may deteriorate.
/s/ PricewaterhouseCoopers LLP
New York, New York
February 11, 2016
57
AllianceBernstein Holding L.P.
Statements of Financial Condition
|
December 31,
|
|||||||
|
2015
|
2014
|
||||||
|
(in thousands,
except unit amounts)
|
|||||||
|
ASSETS
|
|||||||
|
Investment in AB
|
$
|
1,589,965
|
|
$
|
1,627,740
|
|
|
|
Other assets
|
—
|
|
152
|
|
|||
|
Total assets
|
$
|
1,589,965
|
|
$
|
1,627,892
|
|
|
|
LIABILITIES AND PARTNERS’ CAPITAL
|
|||||||
|
Liabilities:
|
|||||||
|
Other liabilities
|
$
|
274
|
|
$
|
382
|
|
|
|
Total liabilities
|
274
|
|
382
|
|
|||
|
Commitments and contingencies (
See Note 7
)
|
|
|
|
|
|||
|
Partners’ capital:
|
|||||||
|
General Partner: 100,000 general partnership units issued and outstanding
|
1,370
|
|
1,374
|
|
|||
|
Limited partners: 99,944,485 and 100,656,999 limited partnership units issued and outstanding
|
1,633,673
|
|
1,668,585
|
|
|||
|
AB Holding Units held by AB to fund long-term incentive compensation plans
|
(10,669
|
)
|
(13,280
|
)
|
|||
|
Accumulated other comprehensive loss
|
(34,683
|
)
|
(29,169
|
)
|
|||
|
Total partners’ capital
|
1,589,691
|
|
1,627,510
|
|
|||
|
Total liabilities and partners’ capital
|
$
|
1,589,965
|
|
$
|
1,627,892
|
|
|
See Accompanying Notes to Financial Statements.
58
AllianceBernstein Holding L.P.
Statements of Income
|
|
Years Ended December 31,
|
||||||||||
|
|
2015
|
2014
|
2013
|
||||||||
|
|
(in thousands, except per unit amounts)
|
||||||||||
|
Equity in net income attributable to AB Unitholders
|
$
|
212,498
|
|
$
|
203,277
|
|
$
|
185,912
|
|
||
|
Income taxes
|
24,320
|
|
22,463
|
|
20,410
|
|
|||||
|
Net income
|
$
|
188,178
|
|
$
|
180,814
|
|
$
|
165,502
|
|
||
|
Net income per unit:
|
|||||||||||
|
Basic
|
$
|
1.89
|
|
$
|
1.87
|
|
$
|
1.72
|
|
||
|
Diluted
|
$
|
1.89
|
|
$
|
1.86
|
|
$
|
1.71
|
|
||
See Accompanying Notes to Financial Statements.
59
AllianceBernstein Holding L.P.
Statements of Comprehensive Income
|
Years Ended December 31,
|
|||||||||||
|
2015
|
2014
|
2013
|
|||||||||
|
(in thousands)
|
|||||||||||
|
Net income
|
$
|
188,178
|
|
$
|
180,814
|
|
$
|
165,502
|
|
||
|
Other comprehensive (loss) income:
|
|
|
|
|
|
|
|||||
|
Foreign currency translation adjustments, before reclassification and tax
|
(5,508
|
)
|
(7,655
|
)
|
(4,479
|
)
|
|||||
|
Less: reclassification adjustment for gains included in net income upon liquidation
|
561
|
|
—
|
|
—
|
|
|||||
|
Foreign currency translation adjustments, before tax
|
(6,069
|
)
|
(7,655
|
)
|
(4,479
|
)
|
|||||
|
Income tax benefit (expense)
|
11
|
|
(78
|
)
|
146
|
|
|||||
|
Foreign currency translation adjustments, net of tax
|
(6,058
|
)
|
(7,733
|
)
|
(4,333
|
)
|
|||||
|
Unrealized (losses) gains on investments:
|
|
|
|
|
|
|
|||||
|
Unrealized (losses) gains arising during period
|
(132
|
)
|
602
|
|
210
|
|
|||||
|
Less: reclassification adjustments for gains included in net income
|
457
|
|
7
|
|
1,670
|
|
|||||
|
Changes in unrealized (losses) gains on investments
|
(589
|
)
|
595
|
|
(1,460
|
)
|
|||||
|
Income tax benefit (expense)
|
256
|
|
(283
|
)
|
430
|
|
|||||
|
Unrealized (losses) gains on investments, net of tax
|
(333
|
)
|
312
|
|
(1,030
|
)
|
|||||
|
Changes in employee benefit related items:
|
|
|
|
|
|
|
|||||
|
Amortization of transition asset
|
—
|
|
—
|
|
(18
|
)
|
|||||
|
Amortization of prior service cost
|
(326
|
)
|
(1,841
|
)
|
2,077
|
|
|||||
|
Recognized actuarial gain (loss)
|
1,264
|
|
(7,486
|
)
|
9,144
|
|
|||||
|
Changes in employee benefit related items
|
938
|
|
(9,327
|
)
|
11,203
|
|
|||||
|
Income tax (expense) benefit
|
(61
|
)
|
113
|
|
(173
|
)
|
|||||
|
Employee benefit related items, net of tax
|
877
|
|
(9,214
|
)
|
11,030
|
|
|||||
|
Other comprehensive (loss) income
|
(5,514
|
)
|
(16,635
|
)
|
5,667
|
|
|||||
|
Comprehensive income
|
$
|
182,664
|
|
$
|
164,179
|
|
$
|
171,169
|
|
||
See Accompanying Notes to Financial Statements.
60
AllianceBernstein Holding L.P.
Statements of Changes in Partners’ Capital
|
Years Ended December 31,
|
|||||||||||
|
2015
|
2014
|
2013
|
|||||||||
|
(in thousands)
|
|||||||||||
|
General Partner’s Capital
|
|||||||||||
|
Balance, beginning of year
|
$
|
1,374
|
|
$
|
1,377
|
|
$
|
1,369
|
|
||
|
Net income
|
189
|
|
186
|
|
167
|
|
|||||
|
Cash distributions to Unitholders
|
(193
|
)
|
(189
|
)
|
(159
|
)
|
|||||
|
Balance, end of year
|
1,370
|
|
1,374
|
|
1,377
|
|
|||||
|
Limited Partners’ Capital
|
|
|
|
|
|
|
|||||
|
Balance, beginning of year
|
1,668,585
|
|
1,558,080
|
|
1,723,172
|
|
|||||
|
Net income
|
187,989
|
|
180,628
|
|
165,335
|
|
|||||
|
Cash distributions to Unitholders
|
(192,106
|
)
|
(182,535
|
)
|
(142,793
|
)
|
|||||
|
Retirement of AB Holding Units
|
(155,073
|
)
|
(14,577
|
)
|
(287,303
|
)
|
|||||
|
Issuance of AB Holding Units to fund long-term incentive compensation plan awards
|
115,045
|
|
108,034
|
|
84,531
|
|
|||||
|
Exercise of compensatory options to buy AB Holding Units
|
9,233
|
|
18,955
|
|
15,138
|
|
|||||
|
Balance, end of year
|
1,633,673
|
|
1,668,585
|
|
1,558,080
|
|
|||||
|
AB Holding Units held by AB to fund long-term incentive compensation plans
|
|
|
|
|
|
|
|||||
|
Balance, beginning of year
|
(13,280
|
)
|
(14,045
|
)
|
(146,258
|
)
|
|||||
|
AB Holding Units held by AB to fund long-term incentive compensation plans
|
2,611
|
|
765
|
|
132,213
|
|
|||||
|
Balance, end of year
|
(10,669
|
)
|
(13,280
|
)
|
(14,045
|
)
|
|||||
|
Accumulated Other Comprehensive Income (Loss)
|
|
|
|
|
|
|
|||||
|
Balance, beginning of year
|
(29,169
|
)
|
(12,534
|
)
|
(18,201
|
)
|
|||||
|
Unrealized (loss) gain on investments, net of tax
|
(333
|
)
|
312
|
|
(1,030
|
)
|
|||||
|
Foreign currency translation adjustment, net of tax
|
(6,058
|
)
|
(7,733
|
)
|
(4,333
|
)
|
|||||
|
Changes in employee benefit related items, net of tax
|
877
|
|
(9,214
|
)
|
11,030
|
|
|||||
|
Balance, end of year
|
(34,683
|
)
|
(29,169
|
)
|
(12,534
|
)
|
|||||
|
Total Partners’ Capital
|
$
|
1,589,691
|
|
$
|
1,627,510
|
|
$
|
1,532,878
|
|
||
See Accompanying Notes to Financial Statements.
61
AllianceBernstein Holding L.P.
Statements of Cash Flows
|
Years Ended December 31,
|
|||||||||||
|
2015
|
2014
|
2013
|
|||||||||
|
(in thousands)
|
|||||||||||
|
Cash flows from operating activities:
|
|||||||||||
|
Net income
|
$
|
188,178
|
|
$
|
180,814
|
|
$
|
165,502
|
|
||
|
Adjustments to reconcile net income to net cash provided by operating activities:
|
|||||||||||
|
Equity in net income attributable to AB Unitholders
|
(212,498
|
)
|
(203,277
|
)
|
(185,912
|
)
|
|||||
|
Cash distributions received from AB
|
217,065
|
|
203,919
|
|
166,324
|
|
|||||
|
Changes in assets and liabilities:
|
|||||||||||
|
Decrease (increase) in other assets
|
152
|
|
(152
|
)
|
5,957
|
|
|||||
|
Increase in due to AB
|
—
|
|
—
|
|
3,173
|
|
|||||
|
(Decrease) increase in other liabilities
|
(108
|
)
|
(394
|
)
|
418
|
|
|||||
|
Net cash provided by operating activities
|
192,789
|
|
180,910
|
|
155,462
|
|
|||||
|
Cash flows from investing activities:
|
|||||||||||
|
Investments in AB from cash distributions paid to AB consolidated rabbi trust
|
—
|
|
—
|
|
(14,076
|
)
|
|||||
|
Investments in AB with proceeds from exercises of compensatory options to buy AB Holding Units
|
(9,233
|
)
|
(18,955
|
)
|
(15,138
|
)
|
|||||
|
Net cash used in investing activities
|
(9,233
|
)
|
(18,955
|
)
|
(29,214
|
)
|
|||||
|
Cash flows from financing activities:
|
|||||||||||
|
Cash distributions to Unitholders
|
(192,299
|
)
|
(182,724
|
)
|
(142,952
|
)
|
|||||
|
Capital contributions (to) from AB
|
(490
|
)
|
1,814
|
|
1,566
|
|
|||||
|
Proceeds from exercise of compensatory options to buy AB Holding Units
|
9,233
|
|
18,955
|
|
15,138
|
|
|||||
|
Net cash used in financing activities
|
(183,556
|
)
|
(161,955
|
)
|
(126,248
|
)
|
|||||
|
Change in cash and cash equivalents
|
—
|
|
—
|
|
—
|
|
|||||
|
Cash and cash equivalents as of beginning of the year
|
—
|
|
—
|
|
—
|
|
|||||
|
Cash and cash equivalents as of end of the year
|
$
|
—
|
|
$
|
—
|
|
$
|
—
|
|
||
|
Cash paid:
|
|||||||||||
|
Income taxes
|
$
|
24,276
|
|
$
|
23,009
|
|
$
|
19,981
|
|
||
|
Non-cash investing activities:
|
|||||||||||
|
Issuance of AB Holding Units to fund long-term incentive compensation plan awards
|
115,045
|
|
108,034
|
|
84,531
|
|
|||||
|
Retirement of AB Holding Units
|
(155,073
|
)
|
(14,577
|
)
|
(287,303
|
)
|
|||||
See Accompanying Notes to Financial Statements.
62
AllianceBernstein Holding L.P.
Notes to Financial Statements
The words “
we
” and “
our
” refer collectively to AllianceBernstein Holding L.P. (“
AB Holding
”) and AllianceBernstein L.P. and its subsidiaries (“
AB
”), or to their officers and employees. Similarly, the word “
company
” refers to both AB Holding and AB. Where the context requires distinguishing between AB Holding and AB, we identify which of them is being discussed. Cross-references are in italics.
1. Business Description and Organization
AB Holding’s principal source of income and cash flow is attributable to its investment in AB limited partnership interests.
AB provides research, diversified investment management and related services globally to a broad range of clients. Its principal services include:
|
•
|
Institutional Services—servicing its institutional clients, including private and public pension plans, foundations and endowments, insurance companies, central banks and governments worldwide, and affiliates such as AXA and its subsidiaries, by means of separately-managed accounts, sub-advisory relationships, structured products, collective investment trusts, mutual funds, hedge funds and other investment vehicles.
|
|
•
|
Retail Services—servicing its retail clients, primarily by means of retail mutual funds sponsored by AB or an affiliated company, sub-advisory relationships with mutual funds sponsored by third parties, separately-managed account programs sponsored by financial intermediaries worldwide and other investment vehicles.
|
|
•
|
Private Wealth Management Services—servicing its private clients, including high-net-worth individuals and families, trusts and estates, charitable foundations, partnerships, private and family corporations, and other entities, by means of separately-managed accounts, hedge funds, mutual funds and other investment vehicles.
|
|
•
|
Bernstein Research Services—servicing institutional investors, such as pension fund, hedge fund and mutual fund managers, seeking high-quality fundamental research, quantitative services and brokerage-related services in equities and listed options.
|
AB also provides distribution, shareholder servicing, transfer agency services and administrative services to the mutual funds it sponsors.
AB’s high-quality, in-depth research is the foundation of its business. AB’s research disciplines include economic, fundamental equity, fixed income and quantitative research. In addition, AB has experts focused on multi-asset strategies, wealth management and alternative investments.
AB provides a broad range of investment services with expertise in:
|
•
|
Actively-managed equity strategies, with global and regional portfolios across capitalization ranges and investment strategies, including value, growth and core equities;
|
|
•
|
Actively-managed traditional and unconstrained fixed income strategies, including taxable and tax-exempt strategies;
|
|
•
|
Passive management, including index and enhanced index strategies;
|
|
•
|
Alternative investments, including hedge funds, fund of funds and private equity (
e.g.
, direct real estate investing); and
|
|
•
|
Multi-asset solutions and services, including dynamic asset allocation, customized target-date funds and target-risk funds.
|
AB’s services span various investment disciplines, including market capitalization (
e.g
., large-, mid- and small-cap equities), term (
e.g
., long-, intermediate- and short-duration debt securities), and geographic location (
e.g
., U.S., international, global, emerging markets, regional and local), in major markets around the world.
63
As of
December 31, 2015
, AXA, a
société anonyme
organized under the laws of France and the holding company for the AXA Group, a worldwide leader in financial protection, through certain of its subsidiaries (“
AXA and its subsidiaries
”) owns approximately
1.4%
of the issued and outstanding units representing assignments of beneficial ownership of limited partnership interests in AB Holding (“
AB Holding Units
”).
As of
December 31, 2015
, the ownership structure of AB, expressed as a percentage of general and limited partnership interests, is as follows:
|
AXA and its subsidiaries
|
62.3
|
%
|
|
AB Holding
|
36.4
|
|
|
Unaffiliated holders
|
1.3
|
|
|
100.0
|
%
|
|
AllianceBernstein Corporation (an indirect wholly-owned subsidiary of AXA, “
General Partner
”) is the general partner of both AB Holding and AB. AllianceBernstein Corporation owns
100,000
general partnership units in AB Holding and a
1%
general partnership interest in AB. Including both the general partnership and limited partnership interests in AB Holding and AB, AXA and its subsidiaries have an approximate
62.8%
economic interest in AB as of
December 31, 2015
.
2. Summary of Significant Accounting Policies
Basis of Presentation
The financial statements have been prepared in accordance with accounting principles generally accepted in the United States of America. The preparation of the financial statements requires management to make certain estimates and assumptions that affect the reported amounts of assets and liabilities and disclosure of contingent assets and liabilities at the dates of the financial statements and the reported amounts of revenues and expenses during the reporting periods. Actual results could differ from those estimates.
AB Holding’s financial statements and notes should be read in conjunction with the consolidated financial statements and notes of AB, which are included in this Form 10-K.
Investment in AB
AB Holding records its investment in AB using the equity method of accounting. AB Holding’s investment is increased to reflect its proportionate share of income of AB and decreased to reflect its proportionate share of losses of AB and cash distributions made by AB to its Unitholders. In addition, AB Holding's investment is adjusted to reflect its proportionate share of certain capital transactions of AB.
Cash Distributions
AB Holding is required to distribute all of its Available Cash Flow, as defined in the Amended and Restated Agreement of Limited Partnership of AB Holding (“
AB Holding Partnership Agreement
”), to its Unitholders
pro rata
in accordance with their percentage interests in AB Holding. Available Cash Flow is defined as the cash distributions AB Holding receives from AB minus such amounts as the General Partner determines, in its sole discretion, should be retained by AB Holding for use in its business or plus such amounts as the General Partner determines, in its sole discretion, should be released from previously retained cash flow.
On
February 11, 2016
, the General Partner declared a distribution of
$0.50
per unit, representing a distribution of Available Cash Flow for the three months ended
December 31, 2015
. Each general partnership unit in AB Holding is entitled to receive distributions equal to those received by each AB Holding Unit. The distribution is payable on
March 10, 2016
to holders of record at the close of business on
February 22, 2016
.
Total cash distributions per Unit paid to Unitholders during
2015
,
2014
and
2013
were
$1.93
,
$1.89
and
$1.59
, respectively.
64
Long-term Incentive Compensation Plans
AB maintains several unfunded, non-qualified long-term incentive compensation plans, under which the company grants awards of restricted AB Holding Units and options to buy AB Holding Units to its employees and members of the Board of Directors, who are not employed by AB or by any of AB’s affiliates (“
Eligible Directors
”).
AB funds its restricted AB Holding Unit awards either by purchasing AB Holding Units on the open market or purchasing newly-issued AB Holding Units from AB Holding, and then keeping all of these AB Holding Units in a consolidated rabbi trust until distributing them to employees or retiring them. In accordance with the AB Holding Partnership Agreement, when AB purchases newly-issued AB Holding Units from AB Holding, AB Holding is required to use the proceeds it receives from AB to purchase the equivalent number of newly-issued AB Units, thus increasing its percentage ownership interest in AB. AB Holding Units held in the consolidated rabbi trust are corporate assets in the name of the trust and are available to the general creditors of AB.
During
2015
and
2014
, AB purchased
8.5 million
and
3.6 million
AB Holding Units for
$218.3 million
and
$92.8 million
, respectively (on a trade date basis). These amounts reflect open-market purchases of
5.8 million
and
0.3 million
AB Holding Units for
$151.1 million
and
$7.2 million
, respectively, with the remainder relating to purchases of AB Holding Units from employees to allow them to fulfill statutory tax withholding requirements at the time of distribution of long-term incentive compensation awards.
Each quarter, AB implements plans to repurchase AB Holding Units pursuant to Rule 10b5-1 under the Securities Exchange Act of 1934, as amended (“
Exchange Act
”). A Rule 10b5-1 plan allows a company to repurchase its shares at times when it otherwise might be prevented from doing so because of self-imposed trading blackout periods or because it possesses material non-public information. Each broker selected by AB has the authority under the terms and limitations specified in the plan to repurchase AB Holding Units on AB’s behalf in accordance with the terms of the plan. Repurchases are subject to regulations promulgated by the U.S. Securities and Exchange Commission (“
SEC
”) as well as certain price, market volume and timing constraints specified in the plan. The plan adopted during the fourth quarter of
2015
expired at the close of business on February 10, 2016. AB may adopt additional Rule 10b5-1 plans in the future to engage in open-market purchases of AB Holding Units to help fund anticipated obligations under its incentive compensation award program and for other corporate purposes.
During
2015
, AB granted to employees and Eligible Directors
7.4 million
restricted AB Holding Unit awards (including
7.0 million
granted in December for
2015
year-end awards). During
2014
, AB granted to employees and Eligible Directors
7.6 million
restricted AB Holding Unit awards (including
6.6 million
granted in December for
2014
year-end awards).
During
2015
and
2014
, AB Holding issued
0.5 million
and
1.1 million
AB Holding Units, respectively, upon exercise of options to buy AB Holding Units. AB Holding used the proceeds of
$9.2 million
and
$19.0 million
, respectively, received from employees as payment in cash for the exercise price to purchase the equivalent number of newly-issued AB Units.
3. Net Income Per Unit
Basic net income per unit is derived by dividing net income by the basic weighted average number of units outstanding for each year. Diluted net income per unit is derived by adjusting net income for the assumed dilutive effect of compensatory options (“
Net income - diluted
”) and dividing by the diluted weighted average number of units outstanding for each year.
65
|
Years Ended December 31,
|
|||||||||||
|
2015
|
2014
|
2013
|
|||||||||
|
(in thousands, except per unit amounts)
|
|||||||||||
|
Net income - basic
|
$
|
188,178
|
|
$
|
180,814
|
|
$
|
165,502
|
|
||
|
Additional allocation of equity in net income attributable to AB resulting from assumed dilutive effect of compensatory options
|
1,399
|
|
1,536
|
|
1,166
|
|
|||||
|
Net income - diluted
|
$
|
189,577
|
|
$
|
182,350
|
|
$
|
166,668
|
|
||
|
Weighted average units outstanding - basic
|
99,475
|
|
96,802
|
|
96,461
|
|
|||||
|
Dilutive effect of compensatory options
|
1,037
|
|
1,148
|
|
961
|
|
|||||
|
Weighted average units outstanding - diluted
|
100,512
|
|
97,950
|
|
97,422
|
|
|||||
|
Basic net income per unit
|
$
|
1.89
|
|
$
|
1.87
|
|
$
|
1.72
|
|
||
|
Diluted net income per unit
|
$
|
1.89
|
|
$
|
1.86
|
|
$
|
1.71
|
|
||
For the years ended
December 31, 2015
,
2014
and
2013
, we excluded
2,409,499
,
2,806,033
and
2,923,035
options, respectively, from the diluted net income per unit computation due to their anti-dilutive effect. Weighted average units outstanding do not include AB Holding’s proportional share (
35.9%
in 2013) of the unallocated AB Holding Units then held by AB in its consolidated rabbi trust.
4. Investment in AB
Changes in AB Holding’s investment in AB for the years ended
December 31, 2015
and
2014
are as follows:
|
|
2015
|
2014
|
|||||
|
|
(in thousands)
|
||||||
|
Investment in AB as of January 1,
|
$
|
1,627,740
|
|
$
|
1,533,654
|
|
|
|
Equity in net income attributable to AB Unitholders
|
212,498
|
|
203,277
|
|
|||
|
Changes in accumulated other comprehensive income (loss)
|
(5,514
|
)
|
(16,635
|
)
|
|||
|
Cash distributions received from AB
|
(217,065
|
)
|
(203,919
|
)
|
|||
|
Additional investments with proceeds from exercises of compensatory options to buy AB Holding Units, net
|
9,233
|
|
18,955
|
|
|||
|
Capital contributions to (from) AB
|
490
|
|
(1,814
|
)
|
|||
|
AB Holding Units retired
|
(155,073
|
)
|
(14,577
|
)
|
|||
|
AB Holding Units issued to fund long-term incentive compensation plans
|
115,045
|
|
108,034
|
|
|||
|
Change in AB Holding Units held by AB for long-term incentive compensation plans
|
2,611
|
|
765
|
|
|||
|
Investment in AB as of December 31,
|
$
|
1,589,965
|
|
$
|
1,627,740
|
|
|
5. Units Outstanding
Changes in AB Holding Units outstanding for the years ended
December 31, 2015
and
2014
are as follows:
|
|
2015
|
2014
|
|||
|
Outstanding as of January 1,
|
100,756,999
|
|
96,028,494
|
|
|
|
Options exercised
|
541,073
|
|
1,110,070
|
|
|
|
Units issued
|
4,600,583
|
|
4,193,445
|
|
|
|
Units retired
|
(5,854,170
|
)
|
(575,010
|
)
|
|
|
Outstanding as of December 31,
|
100,044,485
|
|
100,756,999
|
|
|
66
6. Income Taxes
AB Holding is a “grandfathered” publicly-traded partnership ("
PTP
") for federal tax purposes and, accordingly, is not subject to federal or state corporate income taxes. However, AB Holding is subject to the
4.0%
New York City unincorporated business tax (“
UBT
”), net of credits for UBT paid by AB, and to a
3.5%
federal tax on partnership gross income from the active conduct of a trade or business. AB Holding’s partnership gross income is derived from its interest in AB.
The principal reasons for the difference between AB Holding’s effective tax rates and the UBT statutory tax rate of
4.0%
are as follows:
|
Years Ended December 31,
|
||||||||||||||||||||
|
2015
|
2014
|
2013
|
||||||||||||||||||
|
(in thousands)
|
||||||||||||||||||||
|
UBT statutory rate
|
$
|
8,500
|
|
4.0
|
%
|
$
|
8,131
|
|
4.0
|
%
|
$
|
7,490
|
|
4.0
|
%
|
|||||
|
Federal tax on partnership gross business income
|
23,845
|
|
11.2
|
|
22,131
|
|
10.9
|
|
19,944
|
|
10.7
|
|
||||||||
|
State income taxes
|
475
|
|
0.2
|
|
332
|
|
0.2
|
|
466
|
|
0.3
|
|
||||||||
|
Credit for UBT paid by AB
|
(8,500
|
)
|
(4.0
|
)
|
(8,131
|
)
|
(4.0
|
)
|
(7,490
|
)
|
(4.0
|
)
|
||||||||
|
Income tax expense and effective tax rate
|
$
|
24,320
|
|
11.4
|
|
$
|
22,463
|
|
11.1
|
|
$
|
20,410
|
|
11.0
|
|
|||||
AB Holding’s income tax is computed by multiplying certain AB qualifying revenues (primarily U.S. investment advisory fees and brokerage commissions) by AB Holding’s ownership interest in AB, multiplied by the
3.5%
tax rate. AB Holding Units in AB’s consolidated rabbi trust are not treated as outstanding for purposes of calculating AB Holding’s ownership interest in AB.
|
Years Ended December 31,
|
% Change
|
||||||||||||||||
|
2015
|
2014
|
2013
|
2015-14
|
2014-13
|
|||||||||||||
|
(in thousands)
|
|||||||||||||||||
|
Net income attributable to AB Unitholders
|
$
|
586,602
|
|
$
|
570,383
|
|
$
|
517,676
|
|
2.8
|
%
|
10.2
|
%
|
||||
|
Multiplied by: weighted average equity ownership interest
|
36.2
|
%
|
35.6
|
%
|
35.9
|
%
|
|||||||||||
|
Equity in net income attributable to AB Unitholders
|
$
|
212,498
|
|
$
|
203,277
|
|
$
|
185,912
|
|
4.5
|
|
9.3
|
|
||||
|
AB qualifying revenues
|
$
|
2,214,077
|
|
$
|
2,153,317
|
|
$
|
2,041,642
|
|
2.8
|
|
5.5
|
|
||||
|
Multiplied by: weighted average equity ownership interest for calculating tax
|
30.8
|
%
|
29.4
|
%
|
27.9
|
%
|
|||||||||||
|
Multiplied by: federal tax
|
3.5
|
%
|
3.5
|
%
|
3.5
|
%
|
|||||||||||
|
Federal income taxes
|
23,845
|
|
22,131
|
|
19,944
|
|
|||||||||||
|
State income taxes
|
475
|
|
332
|
|
466
|
|
|||||||||||
|
Total income taxes
|
$
|
24,320
|
|
$
|
22,463
|
|
$
|
20,410
|
|
8.3
|
|
10.1
|
|
||||
In order to preserve AB Holding’s status as a “grandfathered” PTP for federal income tax purposes, management seeks to ensure that AB Holding does not directly or indirectly (through AB) enter into a substantial new line of business. If AB Holding were to lose its status as a “grandfathered” PTP, it would be subject to corporate income tax, which would reduce materially AB Holding’s net income and its quarterly distributions to AB Holding Unitholders.
The effect of a tax position is recognized in the financial statements only if, as of the reporting date, it is “more likely than not” to be sustained based solely on its technical merits. In making this assessment, a company must assume that the taxing authority will examine the tax position and have full knowledge of all relevant information. We have
no
liability for unrecognized tax benefits as of
December 31, 2015
and
2014
. A liability for unrecognized tax benefits, if required, would be recorded in income tax expense and affect the company’s effective tax rate.
67
We are no longer subject to federal, state and local income tax examinations by tax authorities for all years prior to 2012. Currently, there are no examinations in progress and to date we have not been notified of any future examinations by applicable taxing authorities.
7. Commitments and Contingencies
Legal and regulatory matters described below pertain to AB and are included here due to their potential significance to AB Holding’s investment in AB.
With respect to all significant litigation matters, we consider the likelihood of a negative outcome. If we determine the likelihood of a negative outcome is probable and the amount of the loss can be reasonably estimated, we record an estimated loss for the expected outcome of the litigation. If the likelihood of a negative outcome is reasonably possible and we are able to determine an estimate of the possible loss or range of loss in excess of amounts already accrued, if any, we disclose that fact together with the estimate of the possible loss or range of loss. However, it is often difficult to predict the outcome or estimate a possible loss or range of loss because litigation is subject to inherent uncertainties, particularly when plaintiffs allege substantial or indeterminate damages. Such is also the case when the litigation is in its early stages or when the litigation is highly complex or broad in scope. In these cases, we disclose that we are unable to predict the outcome or estimate a possible loss or range of loss.
During the first quarter of 2012, AB received a legal letter of claim (the “
Letter of Claim
”) sent on behalf of Philips Pension Trustees Limited and Philips Electronic U.K. Limited (“
Philips
”), a former pension fund client, alleging that AllianceBernstein Limited (one of AB’s subsidiaries organized in the U.K.) was negligent and failed to meet certain applicable standards of care with respect to the initial investment in, and management of, a
£500 million
portfolio of U.S. mortgage-backed securities. Philips has alleged damages ranging between
$177 million
and
$234 million
, plus compound interest on an alleged
$125 million
of realized losses in the portfolio. On January 2, 2014, Philips filed a claim form (“
Claim
”) in the High Court of Justice in London, England, which formally commenced litigation with respect to the allegations in the Letter of Claim.
We believe that any losses to Philips resulted from adverse developments in the U.S. housing and mortgage market that precipitated the financial crisis in 2008 and not from any negligence or other failure or malfeasance on our part. We believe that we have strong defenses to these claims, which were set forth in our October 12, 2012 response to the Letter of Claim and our June 27, 2014 Statement of Defence in response to the Claim, and intend to defend this matter vigorously.
In addition to the Claim
discussed immediately above,
AB is involved in various other matters, including regulatory inquiries, administrative proceedings and litigation, some of which allege significant damages.
In the opinion of AB’s management, an adequate accrual has been made as of
December 31, 2015
to provide for any probable losses regarding any litigation matters for which management can reasonably estimate an amount of loss. It is reasonably possible that AB could incur additional losses pertaining to these matters, but currently management cannot estimate any such additional losses.
Management, after consultation with legal counsel, currently believes that the outcome of any individual matter that is pending or threatened, or all of them combined, will not have a material adverse effect on our results of operations, financial condition or liquidity. However, any inquiry, proceeding or litigation has the element of uncertainty; management cannot determine whether further developments relating to any individual matter that is pending or threatened, or all of them combined, will have a material adverse effect on our results of operations, financial condition or liquidity in any future reporting period.
68
8. Quarterly Financial Data (Unaudited)
|
|
Quarters Ended
|
||||||||||||||
|
|
December 31
|
September 30
|
June 30
|
March 31
|
|||||||||||
|
|
(in thousands, except per unit amounts)
|
||||||||||||||
|
2015:
|
|||||||||||||||
|
Equity in net income attributable to AB Unitholders
|
$
|
57,485
|
|
$
|
48,988
|
|
$
|
54,409
|
|
$
|
51,616
|
|
|||
|
Net income
|
$
|
51,682
|
|
$
|
42,687
|
|
$
|
48,224
|
|
$
|
45,585
|
|
|||
|
Basic net income per unit
(1)
|
$
|
0.53
|
|
$
|
0.43
|
|
$
|
0.48
|
|
$
|
0.45
|
|
|||
|
Diluted net income per unit
(1)
|
$
|
0.53
|
|
$
|
0.43
|
|
$
|
0.48
|
|
$
|
0.45
|
|
|||
|
Cash distributions per unit
(2)(3)
|
$
|
0.50
|
|
$
|
0.43
|
|
$
|
0.48
|
|
$
|
0.45
|
|
|||
|
2014:
|
|
|
|
|
|
|
|
|
|||||||
|
Equity in net income attributable to AB Unitholders
|
$
|
63,563
|
|
$
|
49,876
|
|
$
|
48,467
|
|
$
|
41,371
|
|
|||
|
Net income
|
$
|
57,667
|
|
$
|
44,134
|
|
$
|
42,854
|
|
$
|
36,159
|
|
|||
|
Basic net income per unit
(1)
|
$
|
0.59
|
|
$
|
0.45
|
|
$
|
0.44
|
|
$
|
0.38
|
|
|||
|
Diluted net income per unit
(1)
|
$
|
0.59
|
|
$
|
0.45
|
|
$
|
0.44
|
|
$
|
0.38
|
|
|||
|
Cash distributions per unit
(2)(3)
|
$
|
0.57
|
|
$
|
0.45
|
|
$
|
0.45
|
|
$
|
0.39
|
|
|||
|
(1)
|
Basic and diluted net income per unit are computed independently for each of the periods presented. Accordingly, the sum of the quarterly net income per unit amounts may not agree to the total for the year.
|
|
(2)
|
Declared and paid during the following quarter.
|
|
(3)
|
Cash distributions reflect the impact of AB’s non-GAAP adjustments.
|
69
Report of Independent Registered Public Accounting Firm
To the General Partner and Unitholders of
AllianceBernstein L.P.:
In our opinion, the accompanying consolidated statements of financial condition and the related consolidated statements of income, comprehensive income, changes in partners’ capital and cash flows present fairly, in all material respects, the financial position of AllianceBernstein L.P. and its subsidiaries (“AB”) at December 31, 2015 and 2014, and the results of their operations and their cash flows for each of the three years in the period ended December 31, 2015 in conformity with accounting principles generally accepted in the United States of America. In addition, in our opinion, the financial statement schedule listed in the index appearing under item 15(a) presents fairly, in all material respects, the information set forth therein when read in conjunction with the related consolidated financial statements. Also in our opinion, AB maintained, in all material respects, effective internal control over financial reporting as of December 31, 2015, based on criteria established in
Internal Control-Integrated Framework
(2013)
issued by the Committee of Sponsoring Organizations of the Treadway Commission (COSO). AB’s management is responsible for these financial statements and financial statement schedule, for maintaining effective internal control over financial reporting and for its assessment of the effectiveness of internal control over financial reporting, included in
Management’s Report on Internal Control over Financial Reporting
appearing under Item 9A. Our responsibility is to express opinions on these financial statements, on the financial statement schedule, and on AB’s internal control over financial reporting based on our integrated audits. We conducted our audits in accordance with the standards of the Public Company Accounting Oversight Board (United States). Those standards require that we plan and perform the audits to obtain reasonable assurance about whether the financial statements are free of material misstatement and whether effective internal control over financial reporting was maintained in all material respects. Our audits of the financial statements included examining, on a test basis, evidence supporting the amounts and disclosures in the financial statements, assessing the accounting principles used and significant estimates made by management, and evaluating the overall financial statement presentation. Our audit of internal control over financial reporting included obtaining an understanding of internal control over financial reporting, assessing the risk that a material weakness exists, and testing and evaluating the design and operating effectiveness of internal control based on the assessed risk. Our audits also included performing such other procedures as we considered necessary in the circumstances. We believe that our audits provide a reasonable basis for our opinions.
A company’s internal control over financial reporting is a process designed to provide reasonable assurance regarding the reliability of financial reporting and the preparation of financial statements for external purposes in accordance with generally accepted accounting principles. A company’s internal control over financial reporting includes those policies and procedures that (i) pertain to the maintenance of records that, in reasonable detail, accurately and fairly reflect the transactions and dispositions of the assets of the company; (ii) provide reasonable assurance that transactions are recorded as necessary to permit preparation of financial statements in accordance with generally accepted accounting principles, and that receipts and expenditures of the company are being made only in accordance with authorizations of management and directors of the company; and (iii) provide reasonable assurance regarding prevention or timely detection of unauthorized acquisition, use, or disposition of the company’s assets that could have a material effect on the financial statements.
Because of its inherent limitations, internal control over financial reporting may not prevent or detect misstatements. Also, projections of any evaluation of effectiveness to future periods are subject to the risk that controls may become inadequate because of changes in conditions, or that the degree of compliance with the policies or procedures may deteriorate.
/s/ PricewaterhouseCoopers LLP
New York, New York
February 11, 2016
70
AllianceBernstein L.P. and Subsidiaries
Consolidated Statements of Financial Condition
|
December 31,
|
|||||||
|
2015
|
2014
|
||||||
|
(in thousands,
except unit amounts) |
|||||||
|
ASSETS
|
|||||||
|
Cash and cash equivalents
|
$
|
541,483
|
|
$
|
555,503
|
|
|
|
Cash and securities segregated, at fair value (cost $565,264 and $476,275)
|
565,274
|
|
476,277
|
|
|||
|
Receivables, net:
|
|
|
|
|
|||
|
Brokers and dealers
|
411,174
|
|
378,467
|
|
|||
|
Brokerage clients
|
1,328,406
|
|
1,243,667
|
|
|||
|
Fees
|
257,091
|
|
292,901
|
|
|||
|
Investments:
|
|
|
|
|
|||
|
Long-term incentive compensation-related
|
78,154
|
|
98,779
|
|
|||
|
Other
|
591,646
|
|
664,696
|
|
|||
|
Furniture, equipment and leasehold improvements, net
|
160,360
|
|
160,956
|
|
|||
|
Goodwill
|
3,044,807
|
|
3,044,807
|
|
|||
|
Intangible assets, net
|
145,710
|
|
171,407
|
|
|||
|
Deferred sales commissions, net
|
99,070
|
|
118,290
|
|
|||
|
Other assets
|
212,792
|
|
172,703
|
|
|||
|
Total assets
|
$
|
7,435,967
|
|
$
|
7,378,453
|
|
|
|
LIABILITIES AND CAPITAL
|
|
|
|
|
|||
|
Liabilities:
|
|
|
|
|
|||
|
Payables:
|
|
|
|
|
|||
|
Brokers and dealers
|
$
|
191,990
|
|
$
|
302,484
|
|
|
|
Securities sold not yet purchased
|
16,097
|
|
88,902
|
|
|||
|
Brokerage clients
|
1,715,096
|
|
1,501,227
|
|
|||
|
AB mutual funds
|
137,886
|
|
141,132
|
|
|||
|
Accounts payable and accrued expenses
|
469,753
|
|
432,355
|
|
|||
|
Accrued compensation and benefits
|
253,079
|
|
291,000
|
|
|||
|
Debt
|
583,946
|
|
488,988
|
|
|||
|
Total liabilities
|
3,367,847
|
|
3,246,088
|
|
|||
|
Commitments and contingencies (See Note 13)
|
|||||||
|
Redeemable non-controlling interest
|
13,203
|
|
16,504
|
|
|||
|
Capital:
|
|
|
|
|
|||
|
General Partner
|
40,875
|
|
41,381
|
|
|||
|
Limited partners: 272,301,827 and 273,040,452 units issued and outstanding
|
4,128,752
|
|
4,176,637
|
|
|||
|
Receivables from affiliates
|
(14,498
|
)
|
(16,359
|
)
|
|||
|
AB Holding Units held for long-term incentive compensation plans
|
(29,332
|
)
|
(36,351
|
)
|
|||
|
Accumulated other comprehensive loss
|
(95,353
|
)
|
(79,843
|
)
|
|||
|
Partners’ capital attributable to AB Unitholders
|
4,030,444
|
|
4,085,465
|
|
|||
|
Non-controlling interests in consolidated entities
|
24,473
|
|
30,396
|
|
|||
|
Total capital
|
4,054,917
|
|
4,115,861
|
|
|||
|
Total liabilities and capital
|
$
|
7,435,967
|
|
$
|
7,378,453
|
|
|
See Accompanying Notes to Consolidated Financial Statements.
71
AllianceBernstein L.P. and Subsidiaries
Consolidated Statements of Income
|
Years Ended December 31,
|
|||||||||||
|
2015
|
2014
|
2013
|
|||||||||
|
(in thousands, except per unit amounts)
|
|||||||||||
|
Revenues:
|
|||||||||||
|
Investment advisory and services fees
|
$
|
1,973,837
|
|
$
|
1,958,250
|
|
$
|
1,849,105
|
|
||
|
Bernstein research services
|
493,463
|
|
482,538
|
|
445,083
|
|
|||||
|
Distribution revenues
|
427,156
|
|
444,970
|
|
465,424
|
|
|||||
|
Dividend and interest income
|
24,872
|
|
22,322
|
|
19,962
|
|
|||||
|
Investment gains (losses)
|
3,551
|
|
(9,076
|
)
|
33,339
|
|
|||||
|
Other revenues
|
101,169
|
|
108,788
|
|
105,058
|
|
|||||
|
Total revenues
|
3,024,048
|
|
3,007,792
|
|
2,917,971
|
|
|||||
|
Less: Interest expense
|
3,321
|
|
2,426
|
|
2,924
|
|
|||||
|
Net revenues
|
3,020,727
|
|
3,005,366
|
|
2,915,047
|
|
|||||
|
Expenses:
|
|
|
|
|
|
|
|||||
|
Employee compensation and benefits
|
1,267,926
|
|
1,265,664
|
|
1,212,011
|
|
|||||
|
Promotion and servicing:
|
|
|
|
|
|
|
|||||
|
Distribution-related payments
|
393,033
|
|
413,054
|
|
426,824
|
|
|||||
|
Amortization of deferred sales commissions
|
49,145
|
|
41,508
|
|
41,279
|
|
|||||
|
Other promotion and servicing
|
223,415
|
|
224,576
|
|
204,568
|
|
|||||
|
General and administrative:
|
|
|
|
|
|
|
|||||
|
General and administrative
|
431,635
|
|
426,960
|
|
423,043
|
|
|||||
|
Real estate charges
|
998
|
|
52
|
|
28,424
|
|
|||||
|
Contingent payment arrangements
|
(5,441
|
)
|
(2,782
|
)
|
(10,174
|
)
|
|||||
|
Interest on borrowings
|
3,119
|
|
2,797
|
|
2,962
|
|
|||||
|
Amortization of intangible assets
|
25,798
|
|
24,916
|
|
21,859
|
|
|||||
|
Total expenses
|
2,389,628
|
|
2,396,745
|
|
2,350,796
|
|
|||||
|
Operating income
|
631,099
|
|
608,621
|
|
564,251
|
|
|||||
|
Income tax
|
38,122
|
|
37,782
|
|
36,829
|
|
|||||
|
Net income
|
592,977
|
|
570,839
|
|
527,422
|
|
|||||
|
Net income of consolidated entities attributable to non-controlling interests
|
6,375
|
|
456
|
|
9,746
|
|
|||||
|
Net income attributable to AB Unitholders
|
$
|
586,602
|
|
$
|
570,383
|
|
$
|
517,676
|
|
||
|
Net income per AB Unit:
|
|
|
|
|
|
|
|||||
|
Basic
|
$
|
2.14
|
|
$
|
2.10
|
|
$
|
1.89
|
|
||
|
Diluted
|
$
|
2.13
|
|
$
|
2.09
|
|
$
|
1.88
|
|
||
See Accompanying Notes to Consolidated Financial Statements.
72
AllianceBernstein L.P. and Subsidiaries
Consolidated Statements of Comprehensive Income
|
Years Ended December 31,
|
|||||||||||
|
2015
|
2014
|
2013
|
|||||||||
|
(in thousands)
|
|||||||||||
|
Net income
|
$
|
592,977
|
|
$
|
570,839
|
|
$
|
527,422
|
|
||
|
Other comprehensive (loss) income:
|
|||||||||||
|
Foreign currency translation adjustments, before reclassification and tax:
|
(15,396
|
)
|
(20,872
|
)
|
(12,422
|
)
|
|||||
|
Less: reclassification adjustment for gains included in net income upon liquidation
|
1,542
|
|
—
|
|
—
|
|
|||||
|
Foreign currency translation adjustments, before tax
|
(16,938
|
)
|
(20,872
|
)
|
(12,422
|
)
|
|||||
|
Income tax benefit
|
—
|
|
—
|
|
—
|
|
|||||
|
Foreign currency translation adjustments, net of tax
|
(16,938
|
)
|
(20,872
|
)
|
(12,422
|
)
|
|||||
|
Unrealized (losses) gains on investments:
|
|||||||||||
|
Unrealized (losses) gains arising during period
|
(357
|
)
|
1,649
|
|
819
|
|
|||||
|
Less: reclassification adjustment for gains included in net income
|
1,256
|
|
19
|
|
4,715
|
|
|||||
|
Changes in unrealized (losses) gains on investments
|
(1,613
|
)
|
1,630
|
|
(3,896
|
)
|
|||||
|
Income tax benefit (expense)
|
701
|
|
(766
|
)
|
1,130
|
|
|||||
|
Unrealized (losses) gains on investments, net of tax
|
(912
|
)
|
864
|
|
(2,766
|
)
|
|||||
|
Changes in employee benefit related items:
|
|
|
|
|
|
|
|||||
|
Amortization of transition asset
|
—
|
|
—
|
|
(47
|
)
|
|||||
|
Amortization of prior service cost
|
(895
|
)
|
(5,197
|
)
|
5,828
|
|
|||||
|
Recognized actuarial gain (loss)
|
3,267
|
|
(19,656
|
)
|
22,853
|
|
|||||
|
Changes in employee benefit related items
|
2,372
|
|
(24,853
|
)
|
28,634
|
|
|||||
|
Income tax (expense) benefit
|
(165
|
)
|
298
|
|
(444
|
)
|
|||||
|
Employee benefit related items, net of tax
|
2,207
|
|
(24,555
|
)
|
28,190
|
|
|||||
|
Other comprehensive (loss) income
|
(15,643
|
)
|
(44,563
|
)
|
13,002
|
|
|||||
|
Less: Comprehensive income in consolidated entities attributable to non-controlling interests
|
6,242
|
|
355
|
|
9,603
|
|
|||||
|
Comprehensive income attributable to AB Unitholders
|
$
|
571,092
|
|
$
|
525,921
|
|
$
|
530,821
|
|
||
See Accompanying Notes to Consolidated Financial Statements.
73
AllianceBernstein L.P. and Subsidiaries
Consolidated Statements of Changes in Partners’ Capital
|
Years Ended December 31,
|
|||||||||||
|
2015
|
2014
|
2013
|
|||||||||
|
(in thousands)
|
|||||||||||
|
General Partner’s Capital
|
|||||||||||
|
Balance, beginning of year
|
$
|
41,381
|
|
$
|
40,382
|
|
$
|
41,213
|
|
||
|
Net income
|
5,866
|
|
5,704
|
|
5,178
|
|
|||||
|
Cash distributions to General Partner
|
(5,986
|
)
|
(5,732
|
)
|
(4,623
|
)
|
|||||
|
Long-term incentive compensation plans activity
|
14
|
|
92
|
|
642
|
|
|||||
|
(Retirement) issuance of AB Units, net
|
(400
|
)
|
935
|
|
(2,028
|
)
|
|||||
|
Balance, end of year
|
40,875
|
|
41,381
|
|
40,382
|
|
|||||
|
Limited Partners' Capital
|
|||||||||||
|
Balance, beginning of year
|
4,176,637
|
|
4,078,676
|
|
4,165,461
|
|
|||||
|
Net income
|
580,736
|
|
564,679
|
|
512,498
|
|
|||||
|
Cash distributions to Unitholders
|
(591,886
|
)
|
(566,616
|
)
|
(456,659
|
)
|
|||||
|
Long-term incentive compensation plans activity
|
1,598
|
|
8,929
|
|
59,924
|
|
|||||
|
(Retirement) issuance of AB Units, net
|
(40,433
|
)
|
90,969
|
|
(202,548
|
)
|
|||||
|
Other
|
2,100
|
|
—
|
|
—
|
|
|||||
|
Balance, end of year
|
4,128,752
|
|
4,176,637
|
|
4,078,676
|
|
|||||
|
Receivables from Affiliates
|
|||||||||||
|
Balance, beginning of year
|
(16,359
|
)
|
(16,542
|
)
|
(8,441
|
)
|
|||||
|
Capital contributions from General Partner
|
1,551
|
|
2,325
|
|
3,386
|
|
|||||
|
Compensation plan accrual
|
(187
|
)
|
(323
|
)
|
(695
|
)
|
|||||
|
Reclassification of receivable from AB Holding
|
—
|
|
—
|
|
(9,226
|
)
|
|||||
|
Capital contributions to AB Holding
|
497
|
|
(1,819
|
)
|
(1,566
|
)
|
|||||
|
Balance, end of year
|
(14,498
|
)
|
(16,359
|
)
|
(16,542
|
)
|
|||||
|
AB Holding Units held for Long-term Incentive Compensation Plans
|
|||||||||||
|
Balance, beginning of year
|
(36,351
|
)
|
(39,649
|
)
|
(389,941
|
)
|
|||||
|
Purchases of AB Holding Units to fund long-term compensation plans, net
|
(216,970
|
)
|
(90,143
|
)
|
(111,619
|
)
|
|||||
|
Reclassification from liability-based awards
|
—
|
|
—
|
|
130,777
|
|
|||||
|
(Issuance) retirement of AB Units, net
|
40,028
|
|
(93,457
|
)
|
202,772
|
|
|||||
|
Long-term incentive compensation awards expense
|
176,040
|
|
176,916
|
|
162,771
|
|
|||||
|
Re-valuation of AB Holding Units held in rabbi trust
|
7,921
|
|
9,982
|
|
(34,409
|
)
|
|||||
|
Balance, end of year
|
(29,332
|
)
|
(36,351
|
)
|
(39,649
|
)
|
|||||
|
Accumulated Other Comprehensive Income (Loss)
|
|||||||||||
|
Balance, beginning of year
|
(79,843
|
)
|
(35,381
|
)
|
(48,526
|
)
|
|||||
|
Unrealized gain (loss) on investments, net of tax
|
(912
|
)
|
864
|
|
(2,766
|
)
|
|||||
|
Foreign currency translation adjustment, net of tax
|
(16,805
|
)
|
(20,771
|
)
|
(12,279
|
)
|
|||||
|
Changes in employee benefit related items, net of tax
|
2,207
|
|
(24,555
|
)
|
28,190
|
|
|||||
|
Balance, end of year
|
(95,353
|
)
|
(79,843
|
)
|
(35,381
|
)
|
|||||
|
Total Partners' Capital attributable to AB Unitholders
|
4,030,444
|
|
4,085,465
|
|
4,027,486
|
|
|||||
|
Non-controlling Interests in Consolidated Entities
|
|
|
|
|
|
|
|||||
|
Balance, beginning of year
|
30,396
|
|
42,240
|
|
43,502
|
|
|||||
|
Net income (loss)
|
6,375
|
|
456
|
|
9,746
|
|
|||||
|
Foreign currency translation adjustment
|
(133
|
)
|
(101
|
)
|
(143
|
)
|
|||||
|
Distributions to non-controlling interests of our consolidated venture capital fund activities
|
(12,165
|
)
|
(12,199
|
)
|
(10,865
|
)
|
|||||
|
Balance, end of year
|
24,473
|
|
30,396
|
|
42,240
|
|
|||||
|
Total Capital
|
$
|
4,054,917
|
|
$
|
4,115,861
|
|
$
|
4,069,726
|
|
||
See Accompanying Notes to Consolidated Financial Statements.
74
AllianceBernstein L.P. and Subsidiaries
Consolidated Statements of Cash Flows
|
Years Ended December 31,
|
|||||||||||
|
2015
|
2014
|
2013
|
|||||||||
|
(in thousands)
|
|||||||||||
|
Cash flows from operating activities:
|
|||||||||||
|
Net income
|
$
|
592,977
|
|
$
|
570,839
|
|
$
|
527,422
|
|
||
|
Adjustments to reconcile net income to net cash provided by operating activities:
|
|||||||||||
|
Amortization of deferred sales commissions
|
49,145
|
|
41,508
|
|
41,279
|
|
|||||
|
Non-cash long-term incentive compensation expense
|
176,160
|
|
176,636
|
|
159,020
|
|
|||||
|
Depreciation and other amortization
|
56,426
|
|
62,515
|
|
60,009
|
|
|||||
|
Unrealized losses (gains) on investments
|
29,281
|
|
13,343
|
|
(42,080
|
)
|
|||||
|
Losses on real estate asset write-offs
|
—
|
|
429
|
|
3,837
|
|
|||||
|
Other, net
|
(2,888
|
)
|
(1,819
|
)
|
(70
|
)
|
|||||
|
Changes in assets and liabilities:
|
|||||||||||
|
(Increase) decrease in segregated cash and securities
|
(88,997
|
)
|
504,307
|
|
570,742
|
|
|||||
|
(Increase) decrease in receivables
|
(121,985
|
)
|
(444,536
|
)
|
140,254
|
|
|||||
|
Decrease (increase) in investments
|
58,053
|
|
3,563
|
|
(10,781
|
)
|
|||||
|
(Increase) in deferred sales commissions
|
(29,925
|
)
|
(89,224
|
)
|
(16,423
|
)
|
|||||
|
(Increase) decrease in other assets
|
(42,690
|
)
|
(6,375
|
)
|
755
|
|
|||||
|
Increase (decrease) in payables
|
65,309
|
|
(85,226
|
)
|
(867,447
|
)
|
|||||
|
(Decrease) in accounts payable and accrued expenses
|
(39,047
|
)
|
(64,588
|
)
|
(51,880
|
)
|
|||||
|
(Decrease) in accrued compensation and benefits
|
(34,645
|
)
|
(51,283
|
)
|
(9,076
|
)
|
|||||
|
Net cash provided by operating activities
|
667,174
|
|
630,089
|
|
505,561
|
|
|||||
|
Cash flows from investing activities:
|
|||||||||||
|
Purchases of investments
|
(168
|
)
|
(492
|
)
|
(7,702
|
)
|
|||||
|
Proceeds from sales of investments
|
4,240
|
|
140
|
|
10,884
|
|
|||||
|
Purchases of furniture, equipment and leasehold improvements
|
(30,217
|
)
|
(25,433
|
)
|
(21,615
|
)
|
|||||
|
Proceeds from sales of furniture, equipment and leasehold improvements
|
2
|
|
176
|
|
12
|
|
|||||
|
Purchase of businesses, net of cash acquired
|
—
|
|
(60,610
|
)
|
(38,636
|
)
|
|||||
|
Net cash used in investing activities
|
(26,143
|
)
|
(86,219
|
)
|
(57,057
|
)
|
|||||
|
Cash flows from financing activities:
|
|||||||||||
|
Issuance (repayment) of commercial paper, net
|
93,867
|
|
219,818
|
|
(55,754
|
)
|
|||||
|
Increase (decrease) in overdrafts payable
|
79,540
|
|
(38,967
|
)
|
52,277
|
|
|||||
|
Distributions to General Partner and Unitholders
|
(597,872
|
)
|
(572,348
|
)
|
(461,282
|
)
|
|||||
|
Distributions to non-controlling interests in consolidated entities
|
(12,165
|
)
|
(12,199
|
)
|
(10,865
|
)
|
|||||
|
Capital contributions from affiliates
|
2,041
|
|
511
|
|
1,820
|
|
|||||
|
Payments of contingent payment arrangements/purchase of shares
|
(5,027
|
)
|
(759
|
)
|
(4,426
|
)
|
|||||
|
Additional investments by AB Holding with proceeds from exercise of compensatory options to buy AB Holding Units
|
9,233
|
|
18,955
|
|
15,138
|
|
|||||
|
Additional investments by AB Holding from distributions paid to AB consolidated rabbi trust
|
—
|
|
—
|
|
14,076
|
|
|||||
|
Purchases of AB Holding Units to fund long-term incentive compensation plan awards, net
|
(213,484
|
)
|
(90,143
|
)
|
(111,619
|
)
|
|||||
75
|
Purchases of AB Units
|
(805
|
)
|
(1,553
|
)
|
(1,805
|
)
|
|||||
|
Other
|
(26
|
)
|
(1,546
|
)
|
62
|
|
|||||
|
Net cash used in financing activities
|
(644,698
|
)
|
(478,231
|
)
|
(562,378
|
)
|
|||||
|
Effect of exchange rate changes on cash and cash equivalents
|
(10,353
|
)
|
(20,027
|
)
|
(3,417
|
)
|
|||||
|
Net (decrease) increase in cash and cash equivalents
|
(14,020
|
)
|
45,612
|
|
(117,291
|
)
|
|||||
|
Cash and cash equivalents as of beginning of the period
|
555,503
|
|
509,891
|
|
627,182
|
|
|||||
|
Cash and cash equivalents as of end of the period
|
$
|
541,483
|
|
$
|
555,503
|
|
$
|
509,891
|
|
||
|
Cash paid:
|
|||||||||||
|
Interest paid
|
$
|
3,984
|
|
$
|
3,148
|
|
$
|
3,692
|
|
||
|
Income taxes paid
|
25,999
|
|
42,028
|
|
13,423
|
|
|||||
|
Non-cash investing activities:
|
|||||||||||
|
Fair value of assets acquired
|
—
|
|
87,821
|
|
81,929
|
|
|||||
|
Fair value of liabilities assumed
|
—
|
|
1,342
|
|
26,193
|
|
|||||
|
Fair value of redeemable non-controlling interest recorded
|
—
|
|
16,504
|
|
—
|
|
|||||
|
Non-cash financing activities:
|
|||||||||||
|
Payables recorded under contingent payment arrangements
|
—
|
|
9,365
|
|
17,100
|
|
|||||
See Accompanying Notes to Consolidated Financial Statements.
76
AllianceBernstein L.P. and Subsidiaries
Notes to Consolidated Financial Statements
The words “
we
” and “
our
” refer collectively to AllianceBernstein L.P. and its subsidiaries (“
AB
”), or to their officers and employees. Similarly, the word “
company
” refers to AB. Cross-references are in italics.
1. Business Description and Organization
We provide research, diversified investment management and related services globally to a broad range of clients. Our principal services include:
|
•
|
Institutional Services—servicing our institutional clients, including private and public pension plans, foundations and endowments, insurance companies, central banks and governments worldwide, and affiliates such as AXA and its subsidiaries, by means of separately-managed accounts, sub-advisory relationships, structured products, collective investment trusts, mutual funds, hedge funds and other investment vehicles.
|
|
•
|
Retail Services—servicing our retail clients, primarily by means of retail mutual funds sponsored by AB or an affiliated company, sub-advisory relationships with mutual funds sponsored by third parties, separately-managed account programs sponsored by financial intermediaries worldwide and other investment vehicles.
|
|
•
|
Private Wealth Management Services—servicing our private clients, including high-net-worth individuals and families, trusts and estates, charitable foundations, partnerships, private and family corporations, and other entities, by means of separately-managed accounts, hedge funds, mutual funds and other investment vehicles.
|
|
•
|
Bernstein Research Services—servicing institutional investors, such as pension fund, hedge fund and mutual fund managers, seeking high-quality fundamental research, quantitative services and brokerage-related services in equities and listed options.
|
We also provide distribution, shareholder servicing, transfer agency services and administrative services to the mutual funds we sponsor.
Our high-quality, in-depth research is the foundation of our business. Our research disciplines include economic, fundamental equity, fixed income and quantitative research. In addition, we have experts focused on multi-asset strategies, wealth management and alternative investments.
We provide a broad range of investment services with expertise in:
|
•
|
Actively-managed equity strategies, with global and regional portfolios across capitalization ranges and investment strategies, including value, growth and core equities
;
|
|
•
|
Actively-managed traditional and unconstrained fixed income strategies, including taxable and tax-exempt strategies;
|
|
•
|
Passive management, including index and enhanced index strategies;
|
|
•
|
Alternative investments, including hedge funds, fund of funds and private equity (
e.g.
, direct real estate investing); and
|
|
•
|
Multi-asset solutions and services, including dynamic asset allocation, customized target-date funds and target-risk funds.
|
Our services span various investment disciplines, including market capitalization (
e.g
., large-, mid- and small-cap equities), term (
e.g
., long-, intermediate- and short-duration debt securities), and geographic location (
e.g
., U.S., international, global, emerging markets, regional and local), in major markets around the world.
As of December 31, 2015, AXA, a
société anonyme
organized under the laws of France and the holding company for the AXA Group, a worldwide leader in financial protection, through certain of its subsidiaries (“
AXA and its subsidiaries
”) owns approximately 1.4% of the issued and outstanding units representing assignments of beneficial ownership of limited partnership interests in AllianceBernstein Holding L.P. (“
AB Holding Units
”).
77
As of December 31, 2015, the ownership structure of AB, expressed as a percentage of general and limited partnership interests, is as follows:
|
AXA and its subsidiaries
|
62.3
|
%
|
|
AB Holding
|
36.4
|
|
|
Unaffiliated holders
|
1.3
|
|
|
100.0
|
%
|
|
AllianceBernstein Corporation (an indirect wholly-owned subsidiary of AXA, “
General Partner
”) is the general partner of both AllianceBernstein Holding L.P. (“
AB Holding
”) and AB. AllianceBernstein Corporation owns 100,000 general partnership units in AB Holding and a 1% general partnership interest in AB. Including both the general partnership and limited partnership interests in AB Holding and AB, AXA and its subsidiaries had an approximate 62.8% economic interest in AB as of December 31, 2015.
2. Summary of Significant Accounting Policies
Basis of Presentation
The consolidated financial statements have been prepared in accordance with accounting principles generally accepted in the United States of America (“
US GAAP
”). The preparation of the consolidated financial statements requires management to make certain estimates and assumptions that affect the reported amounts of assets and liabilities and disclosure of contingent assets and liabilities at the dates of the consolidated financial statements and the reported amounts of revenues and expenses during the reporting periods. Actual results could differ from those estimates.
Principles of Consolidation
The consolidated financial statements include AB and its majority-owned and/or controlled subsidiaries. All significant inter-company transactions and balances among the consolidated entities have been eliminated.
Accounting Pronouncements Not Yet Adopted
In May 2014, the Financial Accounting Standards Board (“
FASB
”) issued Accounting Standards Update (“
ASU
”) 2014-09,
Revenue from Contracts with Customers
. The amendment is effective retrospectively for fiscal years (and interim reporting periods within those years) beginning after December 15, 2017. Management currently is evaluating the impact that the adoption of this standard will have on our consolidated financial statements.
In June 2014, the FASB issued ASU 2014-12,
Accounting for Share-Based Payments When the Terms of an Award Provide That a Performance Target Could Be Achieved After the Requisite Service Period
. The amendment is effective prospectively or retrospectively for fiscal years (and interim periods within those years) beginning after December 15, 2015 and is not expected to have a material impact on our financial condition or results of operations.
In February 2015, the FASB issued ASU 2015-02,
Consolidation – Amendments to the Consolidation Analysis
. The amendment is effective retrospectively for fiscal years (and interim reporting periods within those years) beginning after December 15, 2015 and is not expected to have a material impact on our financial condition or results of operations.
In April 2015, the FASB issued ASU 2015-03,
Simplifying the Presentation of Debt Issuance Costs
, which requires debt issuance costs to be presented in the balance sheet as a direct deduction from the carrying value of the associated debt liability, consistent with the presentation of a debt discount. The amendment is effective retrospectively for fiscal years (and interim periods within those years) beginning after December 15, 2015 and is not expected to have a material impact on our financial condition or results of operations.
In May 2015, the FASB issued ASU 2015-07,
Fair Value Measurement (Topic 820): Disclosures for Investments in Certain Entities That Calculate Net Asset Value per Share (or Its Equivalent)
. Under the new guidance, investments measured at net asset value (“
NAV
”), as a practical expedient for fair value, are excluded from the fair value hierarchy. Removing investments measured using the practical expedient from the fair value hierarchy is intended to eliminate the diversity in practice that currently exists with respect to the categorization of these investments. The only criterion for categorizing investments in the fair value hierarchy will be the observability of the inputs. The amendment is effective retrospectively for fiscal years (and interim periods within those years) beginning after December 15, 2015 and is not expected to have a material impact on our financial condition or results of operations.
78
In September 2015, the FASB issued ASU 2015-16,
Simplifying the Accounting for Measurement-Period Adjustments
, which eliminates the requirement to restate prior period financial statements for measurement period adjustments. The new guidance requires that the cumulative impact of a measurement period adjustment (including the impact on prior periods) be recognized in the reporting period in which the adjustment is identified. The amendment is effective prospectively for fiscal years (and interim periods within those years) beginning after December 15, 2015 and is not expected to have a material impact on our financial condition or results of operations.
In January 2016, the FASB issued ASU 2016-01,
Recognition and Measurement of Financial Assets and Financial Liabilities
. The amendment addresses certain aspects of recognition, measurement, presentation and disclosure of financial instruments. The amendment is effective for fiscal years (and interim periods within those years) beginning after December 15, 2017 and will result in a cumulative-effect adjustment to the balance sheet as of the beginning of the fiscal year of adoption, except for one provision relating to equity securities without readily determinable fair values, which provision will be applied prospectively. The amendment is not expected to have a material impact on our financial condition or results of operations.
Variable Interest Entities
In accordance with ASU 2009-17,
Consolidation (Topic 810) – Improvements to Financial Reporting by Enterprises Involved with Variable Interest Entities
, the determination of whether a company is required to consolidate an entity is based on, among other things, an entity’s purpose and design, a company’s ability to direct the activities of the entity that most significantly impact the entity’s economic performance, and whether a company is obligated to absorb losses or receive benefits that could potentially be significant to the entity. The standard also requires ongoing assessments of whether a company is the primary beneficiary of a variable interest entity (“
VIE
”). In January 2010, the FASB deferred portions of ASU 2009-17 that relate to asset managers. We determined that all entities for which we are a sponsor and/or investment manager, other than collateralized debt obligations and collateralized loan obligations (collectively, “
CDOs
”), qualify for the scope deferral and will continue to be assessed for consolidation under prior accounting guidance for consolidation of VIEs.
For all new investment products and entities developed by the company (other than CDOs), we first determine whether the entity is a VIE, which involves determining an entity’s variability and variable interests, identifying the holders of the equity investment at risk and assessing the five characteristics of a VIE. Once an entity has been determined to be a VIE, we then identify the primary beneficiary of the VIE. If we are deemed to be the primary beneficiary of the VIE, we consolidate the entity.
We provide seed capital to our investment teams to develop new products and services for our clients. Initially, we may be the sole investor in our new products as a result of our seed investments and, from one reporting period to the next, our ownership fluctuates as our clients invest and withdraw assets. Our seed investment portfolio has a weighted average age of approximately 17 months and we turn over approximately 50% of the seed investments annually. These investments are temporary in nature. Our larger seed capital investments range from $1 million to $35 million, with an average size of $10 million. The Audit Committee of the Board of Directors has established a ceiling of $650 million for the seed investment program. We evaluate our seed investments on a quarterly basis and consolidate such investments as required pursuant to US GAAP.
As of December 31, 2015, we were the investment manager for one CDO that meets the definition of a VIE primarily due to the lack of unilateral decision-making authority of the equity holders. The CDO is an alternative investment vehicle created for the sole purpose of issuing collateralized debt instruments that offer investors the opportunity for returns that vary with the risk level of their investment. Our management fee structure for this CDO includes a senior management fee and subordinated incentive management fee. We hold no equity interest in this CDO. We evaluated the management fee structure, the current and expected economic performance of the entity and other provisions included in the governing documents of the CDO that might restrict or guarantee an expected loss or residual return. In accordance with ASC 810,
Consolidation
, we concluded that our collateral management agreement represented a variable interest primarily due to the level of subordinated fees. We evaluated whether we possessed both of the following characteristics of a controlling financial interest: (1) the power to direct the activities of the VIE that most significantly impact the entity’s economic performance, and (2) the obligation to absorb losses of the entity or the right to receive benefits from the entity that could potentially be significant to the VIE. We determined that we possessed the decision-making power noted in criterion (1).
In evaluating criteria (2), we considered all facts regarding the design, terms and characteristics of the CDO and concluded that we do not meet the criterion. Our conclusion was based on the following quantitative and qualitative factors: (a) we have no involvement with the CDO beyond providing investment management services, (b) we hold no equity or debt interests in the CDO, (c) we are not a transferor of any of the assets of the CDO, (d) our expected aggregate fees in future periods are insignificant relative to the expected cash flows of the CDO, (e) the variability of our expected fees in relation to the expected cash flows of the CDO is insignificant, (f) our maximum exposure to loss for the CDO is our investment management fee,
79
which is based upon the fair value of the CDO’s assets, (g) the CDO has no recourse against us for any losses sustained in the CDO structure, (h) we have not provided, nor do we expect to provide, any financial or other support to the CDO, and (i) there are no liquidity arrangements, guarantees and/or other commitments by third parties that would impact our variable interest in the CDO. As such, we do not have a controlling financial interest in the CDO and we do not consolidate the CDO into our consolidated financial statements. The cash, collateral investments (at fair value) and notes payable (at amortized cost) as of December 31, 2015 of this CDO are $9.4 million, $52.3 million and $53.4 million, respectively.
For the entities that meet the scope deferral, management reviews its agreements quarterly and its investments in, and other financial arrangements with, certain entities that hold client assets under management (“
AUM
”) to determine the VIEs that we are required to consolidate. These entities include certain mutual fund products, hedge funds, structured products, group trusts, collective investment trusts and limited partnerships. We earn investment management fees on AUM of these entities, but we derive no other benefit from the AUM and cannot use the AUM in our operations.
As of December 31, 2015, we have significant variable interests in certain structured products and hedge funds with approximately $28.3 million in AUM. However, these VIEs do not require consolidation because management has determined that we are not the primary beneficiary of the expected residual returns or expected losses of these entities. Our maximum exposure to loss is limited to our investment of $0.2 million in these entities.
Cash and Cash Equivalents
Cash and cash equivalents include cash on hand, demand deposits, money market accounts, overnight commercial paper and highly liquid investments with original maturities of three months or less. Due to the short-term nature of these instruments, the recorded value has been determined to approximate fair value.
Fees Receivable, Net
Fees receivable are shown net of allowances. An allowance for doubtful accounts related to investment advisory and services fees is determined through an analysis of the aging of receivables, assessments of collectability based on historical trends and other qualitative and quantitative factors, including our relationship with the client, the financial health (or ability to pay) of the client, current economic conditions and whether the account is active or closed. The allowance for doubtful accounts is not material to fees receivable.
Collateralized Securities Transactions
Customers’ securities transactions are recorded on a settlement date basis, with related commission income and expenses reported on a trade date basis. Receivables from and payables to clients include amounts due on cash and margin transactions. Securities owned by customers are held as collateral for receivables; such collateral is not reflected in the consolidated financial statements. We have the ability by contract or custom to sell or re-pledge this collateral, and have done so at various times. As of December 31, 2015, the fair value of these securities re-pledged was $0.5 million. Principal securities transactions and related expenses are recorded on a trade date basis.
Securities borrowed and securities loaned by our broker-dealer subsidiaries are recorded at the amount of cash collateral advanced or received in connection with the transaction and are included in receivables from and payables to brokers and dealers in the consolidated statements of financial condition. Securities borrowed transactions require us to deposit cash collateral with the lender. With respect to securities loaned, we receive cash collateral from the borrower.
See Note 8
for securities borrowed and loaned amounts recorded in our consolidated statements of financial condition as of December 31, 2015 and 2014. The initial collateral advanced or received approximates or is greater than the fair value of securities borrowed or loaned. We monitor the fair value of the securities borrowed and loaned on a daily basis and request additional collateral or return excess collateral, as appropriate. As of December 31, 2015 and 2014, there is no allowance provision required for the collateral advanced. Income or expense is recognized over the life of the transactions.
As of December 31, 2015 and 2014, we had $81.4 million and $26.3 million, respectively, of cash on deposit with clearing organizations for trade facilitation purposes. In addition, as of December 31, 2015 and 2014, we held U.S. Treasury Bills with values totaling $24.9 million and $29.0 million, respectively, in our investment account that are pledged as collateral with clearing organizations. These clearing organizations have the ability by contract or custom to sell or re-pledge this collateral.
Investments
Investments include U.S. Treasury Bills, unconsolidated mutual funds and limited partnership hedge funds we sponsor and manage, various separately-managed portfolios comprised of equity and fixed income securities, exchange-traded options and investments owned by a consolidated venture capital fund in which we own a controlling interest as the general partner and a 10% limited partnership interest.
80
Investments in U.S. Treasury Bills, mutual funds, and equity and fixed income securities are classified as either trading or available-for-sale securities. Trading investments are stated at fair value with unrealized gains and losses reported in investment gains and losses on the consolidated statements of income. Available-for-sale investments are stated at fair value with unrealized gains and losses reported as a separate component of accumulated other comprehensive income in partners’ capital. Realized gains and losses on the sale of investments are reported in investment gains and losses on the consolidated statements of income. Average cost is used to determine realized gain or loss on investments sold.
We use the equity method of accounting for investments in limited partnership hedge funds. The equity in earnings of our limited partnership hedge fund investments is reported in investment gains and losses on the consolidated statements of income.
The investments owned by our consolidated venture capital fund generally are illiquid and initially are valued at cost. These investments are adjusted to fair value to reflect the occurrence of “significant developments” (
i.e.
, capital transactions or business, economic or market events). Adjustments to fair value are reported in investment gains and losses on the consolidated statements of income. There are three private equity investments that we own directly outside of our consolidated venture capital fund. One of the investments is accounted for using the cost method and the other two are accounted for at fair value.
See Note 9
for a description of how we measure the fair value of our investments.
Furniture, Equipment and Leasehold Improvements, Net
Furniture, equipment and leasehold improvements are stated at cost, less accumulated depreciation and amortization. Depreciation is recognized on a straight-line basis over the estimated useful lives of eight years for furniture and three to six years for equipment and software. Leasehold improvements are amortized on a straight-line basis over the lesser of their estimated useful lives or the terms of the related leases.
Goodwill
In 2000, AB acquired SCB Inc., an investment research and management company formerly known as Sanford C. Bernstein Inc. (“
Bernstein
”). The Bernstein acquisition was accounted for under the purchase method and the cost of the acquisition was allocated on the basis of the estimated fair value of the assets acquired and the liabilities assumed. The excess of the purchase price over the fair value of identifiable assets acquired, net of liabilities assumed, resulted in the recognition of goodwill of approximately $3.0 billion.
As of December 31, 2015, goodwill of $3.0 billion on the consolidated statement of financial condition included $2.8 billion as a result of the Bernstein acquisition and $244 million in regard to various smaller acquisitions. We have determined that AB has only one reporting segment and reporting unit.
We test our goodwill annually, as of September 30, for impairment. As of September 30, 2015, the impairment test indicated that goodwill was not impaired. We also review the carrying value of goodwill if facts and circumstances occur that suggest possible impairment, such as significant declines in AUM, revenues, earnings or the price of an AB Holding Unit. There were no facts or circumstances occurring in the fourth quarter of 2015 suggesting possible impairment.
Intangible Assets, Net
Intangible assets consist primarily of costs assigned to acquired investment management contracts of Bernstein based on their estimated fair value at the time of acquisition, less accumulated amortization. Intangible assets are recognized at fair value and generally are amortized on a straight-line basis over their estimated useful life ranging from six years to 20 years.
As of December 31, 2015, intangible assets, net of accumulated amortization, of $145.7 million on the consolidated statement of financial condition consisted of $132.2 million of definite-lived intangible assets subject to amortization, of which $98.3 million relates to the Bernstein acquisition, and $13.5 million of indefinite-lived intangible assets not subject to amortization in regard to other acquisitions. As of December 31, 2014, intangible assets, net of accumulated amortization, of $171.4 million on the consolidated statement of financial condition consisted of $157.9 million of definite-lived intangible assets subject to amortization, of which $119.0 million related to the Bernstein acquisition, and $13.5 million of indefinite-lived intangible assets not subject to amortization in regard to other acquisitions. The gross carrying amount of definite-lived intangible assets totaled $460.8 million as of December 31, 2015 and $460.7 million as of December 31, 2014, and accumulated amortization was $328.6 million as of December 31, 2015 and $302.8 million as of December 31, 2014. Amortization expense was $25.8 million for 2015, $24.9 million for 2014 and $21.9 million for 2013. Estimated annual amortization expense for each of the next five years is approximately $26 million.
81
We periodically review intangible assets for impairment as events or changes in circumstances indicate that the carrying value may not be recoverable. If the carrying value exceeds fair value, we perform additional impairment tests to measure the amount of the impairment loss, if any.
Deferred Sales Commissions, Net
We pay commissions to financial intermediaries in connection with the sale of shares of open-end company-sponsored mutual funds sold without a front-end sales charge (“
back-end load shares
”). These commissions are capitalized as deferred sales commissions and amortized over periods not exceeding five and one-half years for U.S. fund shares and four years for Non-U.S. Fund shares, the periods of time during which deferred sales commissions generally are recovered. We recover these commissions from distribution services fees received from those funds and from contingent deferred sales commissions (“
CDSC
”) received from shareholders of those funds upon the redemption of their shares. CDSC cash recoveries are recorded as reductions of unamortized deferred sales commissions when received. Since January 31, 2009, our U.S. mutual funds have not offered back-end load shares to new investors. However, our Non-U.S. Funds continue to offer back-end load shares.
We periodically review the deferred sales commission asset for impairment as events or changes in circumstances indicate that the carrying value may not be recoverable. If the carrying value exceeds fair value, we perform additional impairment tests to measure the amount of the impairment loss, if any.
Loss Contingencies
With respect to all significant litigation matters, we consider the likelihood of a negative outcome. If we determine the likelihood of a negative outcome is probable and the amount of the loss can be reasonably estimated, we record an estimated loss for the expected outcome of the litigation. If the likelihood of a negative outcome is reasonably possible and we are able to determine an estimate of the possible loss or range of loss in excess of amounts already accrued, if any, we disclose that fact together with the estimate of the possible loss or range of loss. However, it is often difficult to predict the outcome or estimate a possible loss or range of loss because litigation is subject to inherent uncertainties, particularly when plaintiffs allege substantial or indeterminate damages. Such is also the case when the litigation is in its early stages or when the litigation is highly complex or broad in scope. In these cases, we disclose that we are unable to predict the outcome or estimate a possible loss or range of loss.
Revenue Recognition
We record as revenue investment advisory and services fees, which we generally calculate as a percentage of AUM, as we perform the related services. Certain investment advisory contracts, including those associated with hedge funds or other alternative investments, provide for a performance-based fee, in addition to a base advisory fee, which is calculated as either a percentage of absolute investment results or a percentage of investment results in excess of a stated benchmark over a specified period of time. We record performance-based fees as a component of revenue at the end of each contract’s measurement period.
We calculate AUM using established market-based valuation methods and fair valuation (non-observable market) methods. Market-based valuation methods include: last sale/settle prices from an exchange for actively-traded listed equities, options and futures; evaluated bid prices from recognized pricing vendors for fixed income, asset-backed or mortgage-backed issues; mid prices from recognized pricing vendors and brokers for credit default swaps; and quoted bids or spreads from pricing vendors and brokers for other derivative products. Fair valuation methods include: discounted cash flow models, evaluation of assets versus liabilities or any other methodology that is validated and approved by our Valuation Committee (
see paragraph immediately below
for additional information about our Valuation Committee). Fair valuation methods are used only where AUM cannot be valued using market-based valuation methods, such as in the case of private equity or illiquid securities. Investments utilizing fair valuation methods typically make up an insignificant amount of our total AUM.
The Valuation Committee, which consists of senior officers and employees, is responsible for overseeing the pricing and valuation of all investments held in client and AB portfolios. The Valuation Committee has adopted a Statement of Pricing Policies describing principles and policies that apply to pricing and valuing investments held in these portfolios. We also have a Pricing Group, which reports to the Valuation Committee, and is responsible for overseeing the pricing process for all investments.
Bernstein Research Services revenues consist primarily of brokerage commissions for research and brokerage-related services provided to institutional investors. Brokerage commissions earned and related expenses are recorded on a trade-date basis.
Distribution revenues, shareholder servicing fees (included in other revenues), and dividend and interest income are accrued as earned.
82
Contingent Payment Arrangements
We periodically enter into contingent payment arrangements in connection with our business combinations. In these arrangements, we agree to pay additional consideration to the sellers to the extent that certain performance targets are achieved. We estimate the fair value of these potential future obligations at the time a business combination is consummated and record a liability on our consolidated statements of financial condition. We then accrete the obligation to its expected payment amount over the measurement period. If our expected payment amount subsequently changes, the obligation is modified in the current period resulting in a gain or loss. Both gains and losses resulting from changes to expected payments and the accretion of these obligations to their expected payment amounts are reflected within contingent payment arrangements in our consolidated statements of income.
Mutual Fund Underwriting Activities
Purchases and sales of shares of company-sponsored mutual funds in connection with the underwriting activities of our subsidiaries, including related commission income, are recorded on trade date. Receivables from brokers and dealers for sale of shares of company-sponsored mutual funds generally are realized within three business days from trade date, in conjunction with the settlement of the related payables to company-sponsored mutual funds for share purchases. Distribution plan and other promotion and servicing payments are recognized as expense when incurred.
Long-term Incentive Compensation Plans
We maintain several unfunded, non-qualified long-term incentive compensation plans, under which we grant annual awards to employees, generally in the fourth quarter.
Awards granted in December 2015, 2014 and 2013 allowed participants to allocate their awards between restricted AB Holding Units and deferred cash. Participants (except certain members of senior management) generally could allocate up to 50% of their awards to deferred cash, not to exceed a total of $250,000 per award. Each of our employees based outside of the United States (other than expatriates), who received an award of $100,000 or less, could have allocated up to 100% of his or her award to deferred cash. Participants allocated their awards prior to the date on which the Compensation Committee granted awards in December 2015, 2014 and 2013. For these awards, the number of AB Holding Units awarded was based on the closing price of an AB Holding Unit on the grant date. For awards granted in 2015, 2014 and 2013:
|
•
|
We engaged in open-market purchases of AB Holding Units or purchased newly-issued AB Holding Units from AB Holding that were awarded to participants and keep them in a consolidated rabbi trust.
|
|
•
|
Quarterly distributions on vested and unvested AB Holding Units are paid currently to participants, regardless of whether or not a long-term deferral election has been made.
|
|
•
|
Interest on deferred cash is accrued monthly based on our monthly weighted average cost of funds.
|
We recognize compensation expense related to equity compensation grants in the financial statements using the fair value method. Fair value of restricted AB Holding Unit awards is the closing price of an AB Holding Unit on the grant date; fair value of options is determined using the Black-Scholes option valuation model. Under the fair value method, compensatory expense is measured at the grant date based on the estimated fair value of the award and is recognized over the required service period. For year-end long-term incentive compensation awards, employees who resign or are terminated without cause may retain their awards, subject to compliance with certain agreements and restrictive covenants set forth in the applicable award agreement, including restrictions on competition and employee and client solicitation, and a claw-back for failing to follow existing risk management policies. Because there is no service requirement, we fully expense these awards on grant date. Most equity replacement, sign-on or similar deferred compensation awards included in separate employment agreements or arrangements include a required service period. Regardless of whether or not the award agreement includes employee service requirements, AB Holding Units typically are distributed to employees ratably over four years, unless the employee has made a long-term deferral election.
Grants of restricted AB Holding Units and options to buy AB Holding Units typically are awarded during the second quarter to members of the Board of Directors of the General Partner, who are not employed by our company or by any of our affiliates (“
Eligible Directors
”). Restricted AB Holding Units are distributed on the third anniversary of the grant date and the options become exercisable ratably over three years. These restricted AB Holding Units and options are not forfeitable (except if the Eligible Director is terminated for “Cause”, as that term is defined in the applicable award agreement). Because there is no service requirement, we fully expense these awards on grant date.
83
We fund our restricted AB Holding Unit awards either by purchasing AB Holding Units on the open market or purchasing newly-issued AB Holding Units from AB Holding, and then keeping all of these AB Holding Units in a consolidated rabbi trust until distributing them to employees or retiring them. In accordance with the Amended and Restated Agreement of Limited Partnership of AB (“
AB Partnership Agreement
”), when AB purchases newly-issued AB Holding Units from AB Holding, AB Holding is required to use the proceeds it receives from AB to purchase the equivalent number of newly-issued AB Units, thus increasing its percentage ownership interest in AB. AB Holding Units held in the consolidated rabbi trust are corporate assets in the name of the trust and are available to the general creditors of AB.
During 2015 and 2014, we purchased 8.5 million and 3.6 million AB Holding Units for $218.3 million and $92.8 million, respectively (on a trade date basis). These amounts reflect open-market purchases of 5.8 million and 0.3 million AB Holding Units for $151.1 million and $7.2 million, respectively, with the remainder relating to purchases of AB Holding Units from employees to allow them to fulfill statutory tax withholding requirements at the time of distribution of long-term incentive compensation awards. Purchases of AB Holding Units reflected on the consolidated statements of cash flows are net of AB Holding Units purchased by employees as part of a distribution reinvestment election.
Each quarter, we implement plans to repurchase AB Holding Units pursuant to Rule 10b5-1 under the Securities Exchange Act of 1934, as amended (“
Exchange Act
”). A Rule 10b5-1 plan allows a company to repurchase its shares at times when it otherwise might be prevented from doing so because of self-imposed trading blackout periods or because it possesses material non-public information. Each broker we select has the authority under the terms and limitations specified in the plan to repurchase AB Holding Units on our behalf in accordance with the terms of the plan. Repurchases are subject to regulations promulgated by the SEC as well as certain price, market volume and timing constraints specified in the plan. The plan adopted during the fourth quarter of 2015 expired at the close of business on February 10, 2016. We may adopt additional Rule 10b5-1 plans in the future to engage in open-market purchases of AB Holding Units to help fund anticipated obligations under our incentive compensation award program and for other corporate purposes.
During 2015, we granted to employees and Eligible Directors 7.4 million restricted AB Holding Unit awards (including 7.0 million granted in December for 2015 year-end awards to employees). During 2014, we granted to employees and Eligible Directors 7.6 million restricted AB Holding Unit awards (including 6.6 million granted in December for 2014 year-end awards to employees).
During 2015 and 2014, AB Holding issued 0.5 million and 1.1 million AB Holding Units, respectively, upon exercise of options to buy AB Holding Units. AB Holding used the proceeds of $9.2 million and $19.0 million, respectively, received from employees as payment in cash for the exercise price to purchase the equivalent number of newly-issued AB Units.
Foreign Currency Translation and Transactions
Assets and liabilities of foreign subsidiaries are translated from the functional currencies into United States dollars (“
US$
”) at exchange rates in effect at the balance sheet dates, and related revenues and expenses are translated into US$ at average exchange rates in effect during each period. Net foreign currency gains and losses resulting from the translation of assets and liabilities of foreign operations into US$ are reported as a separate component of other comprehensive income in the consolidated statements of comprehensive income. Net foreign currency transaction gains (losses) were $1.0 million, $(1.6) million, and $(3.1) million for 2015, 2014 and 2013, respectively, and are reported in general and administrative expenses on the consolidated statements of income.
Cash Distributions
AB is required to distribute all of its Available Cash Flow, as defined in the AB Partnership Agreement, to its Unitholders and to the General Partner. Available Cash Flow can be summarized as the cash flow received by AB from operations minus such amounts as the General Partner determines, in its sole discretion, should be retained by AB for use in its business, or plus such amounts as the General Partner determines, in its sole discretion, should be released from previously retained cash flow.
Typically, Available Cash Flow has been the adjusted diluted net income per unit for the quarter multiplied by the number of general and limited partnership interests at the end of the quarter. In future periods, management anticipates that Available Cash Flow will be based on adjusted diluted net income per unit, unless management determines that one or more non-GAAP adjustments that are made for adjusted net income should not be made with respect to the Available Cash Flow calculation.
On February 11, 2016, the General Partner declared a distribution of $0.56 per AB Unit, representing a distribution of Available Cash Flow for the three months ended December 31, 2015. The General Partner, as a result of its 1% general partnership interest, is entitled to receive 1% of each distribution. The distribution is payable on March 10, 2016 to holders of record on February 22, 2016.
84
Total cash distributions per Unit paid to the General Partner and Unitholders during 2015, 2014 and 2013 were $2.18, $2.11 and $1.69, respectively.
Comprehensive Income
We report all changes in comprehensive income in the consolidated statements of comprehensive income. Comprehensive income includes net income, as well as unrealized gains and losses on investments classified as available-for-sale, foreign currency translation adjustments, and unrecognized actuarial net losses and transition assets. Deferred taxes are not recognized on foreign currency translation adjustments for foreign subsidiaries whose earnings are considered permanently invested outside the United States.
3. Real Estate Charges
During 2010, we performed a comprehensive review of our real estate requirements in New York in connection with our workforce reductions, which commenced in 2008. As a result, during 2010 we decided to sub-lease over 380,000 square feet in New York (all of this space has been sublet) and consolidate our New York-based employees into two office locations from three. During the third quarter of 2012, in an effort to further reduce our global real estate footprint, we completed a comprehensive review of our worldwide office locations and began implementing a global space consolidation plan. As a result, our intention is to sub-lease approximately 510,000 square feet of office space (in excess of 90% of this space has been sublet), more than 70% of which is New York office space (in addition to the 380,000 square feet space reduction in 2010), with the remainder consisting of office space in England, Australia and various U.S. locations.
During 2013, we recorded pre-tax real estate charges of $28.4 million, comprising $17.4 million from a change in estimates related to previously recorded real estate charges ($17.0 million related to the 2010 and 2012 plans and $0.4 million related to other real estate charges), new real estate charges of $6.6 million ($1.3 million related to the 2012 plan and $5.3 million related to other real estate charges) and $4.4 million for the write-off of leasehold improvements, furniture and equipment.
During 2014, we recorded pre-tax real estate charges of $0.1 million, comprising $5.5 million for the write-off of leasehold improvements, furniture and equipment ($5.0 million related to the 2012 plan and $0.5 million related to other real estate charges), offset by $4.7 million from a change in estimates related to previously recorded real estate charges (primarily relating to the 2010 and 2012 plans) and $0.7 million in credits related to other items.
During 2015, we recorded pre-tax real estate charges of $1.0 million, resulting from a change in estimates related to previously recorded real estate charges.
The activity in the liability account relating to our 2010 and 2012 office space consolidation initiatives for the following periods is as follows:
|
Year Ended December 31,
|
|||||||
|
2015
|
2014
|
||||||
|
(in thousands)
|
|||||||
|
Balance as of January 1,
|
$
|
148,429
|
|
$
|
199,527
|
|
|
|
Expense (credit) incurred
|
2,258
|
|
(4,755
|
)
|
|||
|
Payments made
|
(38,920
|
)
|
(50,893
|
)
|
|||
|
Interest accretion
|
4,297
|
|
4,550
|
|
|||
|
Balance as of end of period
|
$
|
116,064
|
|
$
|
148,429
|
|
|
4. Net Income Per Unit
Basic net income per unit is derived by reducing net income for the 1% general partnership interest and dividing the remaining 99% by the basic weighted average number of units outstanding for each year. Diluted net income per unit is derived by reducing net income for the 1% general partnership interest and dividing the remaining 99% by the total of the diluted weighted average number of units outstanding for each year.
85
|
Year Ended December 31,
|
|||||||||||
|
2015
|
2014
|
2013
|
|||||||||
|
(in thousands, except per unit amounts)
|
|||||||||||
|
Net income attributable to AB Unitholders
|
$
|
586,602
|
|
$
|
570,383
|
|
$
|
517,676
|
|
||
|
Weighted average units outstanding—basic
|
271,745
|
|
269,118
|
|
271,258
|
|
|||||
|
Dilutive effect of compensatory options to buy AB Holding Units
|
1,037
|
|
1,148
|
|
961
|
|
|||||
|
Weighted average units outstanding—diluted
|
272,782
|
|
270,266
|
|
272,219
|
|
|||||
|
Basic net income per AB Unit
|
$
|
2.14
|
|
$
|
2.10
|
|
$
|
1.89
|
|
||
|
Diluted net income per AB Unit
|
$
|
2.13
|
|
$
|
2.09
|
|
$
|
1.88
|
|
||
For the years ended December 31, 2015, 2014 and 2013, we excluded 2,409,499, 2,806,033 and 2,923,035 options, respectively, from the diluted net income per unit computation due to their anti-dilutive effect.
5. Cash and Securities Segregated Under Federal Regulations and Other Requirements
As of December 31, 2015 and 2014, $0.5 billion and $0.4 billion, respectively, of U.S. Treasury Bills were segregated in a special reserve bank custody account for the exclusive benefit of our brokerage customers under Rule 15c3-3 of the Exchange Act.
One of our subsidiaries, which serves as the distributor of our U.S. mutual funds, maintains several special bank accounts for the exclusive benefit of customers. As of December 31, 2015 and 2014, $55.4 million and $61.3 million, respectively, of cash was segregated in these bank accounts.
6. Investments
Investments consist of:
|
December 31,
|
|||||||
|
2015
|
2014
|
||||||
|
(in thousands)
|
|||||||
|
Available-for-sale (primarily seed capital)
|
$
|
364
|
|
$
|
6,172
|
|
|
|
Trading:
|
|||||||
|
Long-term incentive compensation-related
|
59,150
|
|
74,095
|
|
|||
|
U.S. Treasury Bills
|
24,942
|
|
28,982
|
|
|||
|
Seed capital
|
406,322
|
|
400,746
|
|
|||
|
Equities
|
43,584
|
|
79,720
|
|
|||
|
Exchange-traded options
|
5,910
|
|
22,290
|
|
|||
|
Investments in limited partnership hedge funds:
|
|||||||
|
Long-term incentive compensation-related
|
19,004
|
|
24,684
|
|
|||
|
Seed capital
|
20,082
|
|
33,951
|
|
|||
|
Consolidated private equity fund (10% seed capital)
|
23,897
|
|
32,604
|
|
|||
|
Private equity (seed capital)
|
48,761
|
|
48,734
|
|
|||
|
Other
|
17,784
|
|
11,497
|
|
|||
|
Total investments
|
$
|
669,800
|
|
$
|
763,475
|
|
|
Total investments related to long-term incentive compensation obligations of $78.2 million and $98.8 million as of December 31, 2015 and 2014, respectively, consist of company-sponsored mutual funds and hedge funds. For long-term incentive compensation awards granted before 2009, we typically made investments in our services that were notionally elected by plan participants and maintained them (and continue to maintain them) in a consolidated rabbi trust or separate custodial account. The rabbi trust and custodial account enable us to hold such investments separate from our other assets for the purpose
86
of settling our obligations to participants. The investments held in the rabbi trust and custodial account remain available to the general creditors of AB.
The underlying investments of hedge funds in which we invest include long and short positions in equity securities, fixed income securities (including various agency and non-agency asset-based securities), currencies, commodities and derivatives (including various swaps and forward contracts). These investments are valued at quoted market prices or, where quoted market prices are not available, are fair valued based on the pricing policies and procedures of the underlying funds.
U.S. Treasury Bills, the majority of which are pledged as collateral with clearing organizations, are held in our investment account. These clearing organizations have the ability by contract or custom to sell or re-pledge this collateral.
We allocate seed capital to our investment teams to help develop new products and services for our clients. The seed capital trading investments are equity and fixed income products, primarily in the form of separately-managed account portfolios, U.S. mutual funds, Luxembourg funds, Japanese investment trust management funds or Delaware business trusts. We also may allocate seed capital to investments in private equity funds, such as our consolidated venture capital fund, which holds technology, media, telecommunications, healthcare and clean-tech investments, and a third-party venture capital fund that invests in communications, consumer, digital media, healthcare and information technology markets.
Trading securities also include long positions in corporate equities, an exchange-traded fund and long exchange-traded options traded through our options desk.
The cost and fair value of available-for-sale and trading investments held as of December 31, 2015 and 2014 were as follows:
|
Amortized
Cost
|
Gross
Unrealized
Gains
|
Gross
Unrealized
Losses
|
Fair
Value
|
||||||||||||
|
(in thousands)
|
|||||||||||||||
|
December 31, 2015:
|
|||||||||||||||
|
Available-for-sale:
|
|||||||||||||||
|
Equity investments
|
$
|
1,778
|
|
$
|
9
|
|
$
|
(1,606
|
)
|
$
|
181
|
|
|||
|
Fixed income investments
|
197
|
|
3
|
|
(17
|
)
|
183
|
|
|||||||
|
$
|
1,975
|
|
$
|
12
|
|
$
|
(1,623
|
)
|
$
|
364
|
|
||||
|
Trading:
|
|
|
|
|
|
|
|
|
|||||||
|
Equity investments
|
$
|
357,844
|
|
$
|
2,230
|
|
$
|
(27,896
|
)
|
$
|
332,178
|
|
|||
|
Fixed income investments
|
215,122
|
|
391
|
|
(7,783
|
)
|
207,730
|
|
|||||||
|
$
|
572,966
|
|
$
|
2,621
|
|
$
|
(35,679
|
)
|
$
|
539,908
|
|
||||
|
December 31, 2014:
|
|
|
|
|
|
|
|
|
|||||||
|
Available-for-sale:
|
|
|
|
|
|
|
|
|
|||||||
|
Equity investments
|
$
|
4,339
|
|
$
|
1,625
|
|
$
|
(13
|
)
|
$
|
5,951
|
|
|||
|
Fixed income investments
|
202
|
|
19
|
|
—
|
|
221
|
|
|||||||
|
$
|
4,541
|
|
$
|
1,644
|
|
$
|
(13
|
)
|
$
|
6,172
|
|
||||
|
Trading:
|
|
|
|
|
|
|
|
|
|||||||
|
Equity investments
|
$
|
411,898
|
|
$
|
18,370
|
|
$
|
(20,476
|
)
|
$
|
409,792
|
|
|||
|
Fixed income investments
|
199,645
|
|
2,646
|
|
(6,250
|
)
|
196,041
|
|
|||||||
|
$
|
611,543
|
|
$
|
21,016
|
|
$
|
(26,726
|
)
|
$
|
605,833
|
|
||||
Proceeds from sales of available-for-sale investments were approximately $4.2 million, $0.1 million and $10.9 million in 2015, 2014 and 2013, respectively. Realized gains from our sales of available-for-sale investments were $1.3 million in 2015, zero in 2014 and $4.7 million in 2013. Realized losses from our sales of available-for-sale investments were zero in 2015, 2014 and 2013, respectively. We assess valuation declines to determine the extent to which such declines are fundamental to the underlying investment or attributable to temporary market-related factors. Based on our assessment as of December 31, 2015, we do not believe the declines are other than temporary.
87
The portion of trading gains (losses) related to trading securities held as of December 31, 2015 and 2014 were as follows:
|
December 31,
|
|||||||
|
2015
|
2014
|
||||||
|
(in thousands)
|
|||||||
|
Net (losses) gains recognized during the period
|
$
|
(27,246
|
)
|
$
|
12,461
|
|
|
|
Less: net gains recognized during the period on trading securities sold during the period
|
5,812
|
|
18,171
|
|
|||
|
Unrealized (losses) recognized during the period on trading securities held
|
$
|
(33,058
|
)
|
$
|
(5,710
|
)
|
|
7. Derivative Instruments
We enter into various futures, forwards and swaps to economically hedge certain seed capital investments. Also, we have currency forwards that economically hedge certain cash accounts and exchange-traded futures to economically hedge a foreign investment. In addition, our options desk trades long and short exchange-traded equity options. We do not hold any derivatives designated in a formal hedge relationship under Accounting Standards Codification (“
ASC
”) 815-10,
Derivatives and Hedging
.
The notional value, fair value and gains and losses recognized in investment gains (losses) as of December 31, 2015 and 2014 for derivative instruments (excluding our options desk trading activities
discussed below
) not designated as hedging instruments were as follows:
|
Notional
Value
|
Derivative
Assets
|
Derivative
Liabilities
|
Gains
(Losses)
|
||||||||||||
|
(in thousands)
|
|||||||||||||||
|
December 31, 2015
|
|||||||||||||||
|
Exchange-traded futures
|
$
|
160,755
|
|
$
|
1,539
|
|
$
|
2,651
|
|
$
|
8,572
|
|
|||
|
Currency forwards
|
262,873
|
|
4,604
|
|
4,077
|
|
7,445
|
|
|||||||
|
Interest rate swaps
|
65,484
|
|
2,945
|
|
3,745
|
|
(443
|
)
|
|||||||
|
Credit default swaps
|
29,421
|
|
2,089
|
|
774
|
|
(253
|
)
|
|||||||
|
Option swaps
|
24
|
|
9
|
|
2
|
|
11
|
|
|||||||
|
Total return swaps
|
146,001
|
|
1,402
|
|
972
|
|
(160
|
)
|
|||||||
|
Total derivatives
|
$
|
664,558
|
|
$
|
12,588
|
|
$
|
12,221
|
|
$
|
15,172
|
|
|||
|
December 31, 2014
|
|||||||||||||||
|
Exchange-traded futures
|
$
|
149,863
|
|
$
|
571
|
|
$
|
2,438
|
|
$
|
(3,766
|
)
|
|||
|
Currency forwards
|
149,282
|
|
1,782
|
|
333
|
|
3,160
|
|
|||||||
|
Interest rate swaps
|
50,591
|
|
1,507
|
|
2,679
|
|
(2,941
|
)
|
|||||||
|
Credit default swaps
|
32,745
|
|
1,432
|
|
110
|
|
(826
|
)
|
|||||||
|
Option swaps
|
11
|
|
107
|
|
88
|
|
(338
|
)
|
|||||||
|
Total return swaps
|
125,913
|
|
1,388
|
|
3,744
|
|
(14,566
|
)
|
|||||||
|
Total derivatives
|
$
|
508,405
|
|
$
|
6,787
|
|
$
|
9,392
|
|
$
|
(19,277
|
)
|
|||
As of December 31, 2015 and 2014, the derivative assets and liabilities are included in both receivables and payables to brokers and dealers on our consolidated statements of financial condition. Gains and losses on derivative instruments are reported in investment gains and losses on the consolidated statements of income.
We may be exposed to credit-related losses in the event of nonperformance by counterparties to derivative financial instruments. We minimize our counterparty exposure through a credit review and approval process. In addition, we executed various collateral arrangements with counterparties to the over-the-counter derivative transactions that require both pledging and accepting collateral in the form of cash. As of December 31, 2015 and 2014, we held $1.5 million and $1.0 million,
88
respectively, of cash collateral payable to trade counterparties. This obligation to return cash is reported in payables to brokers and dealers in our consolidated statements of financial condition.
Although notional amount is the most commonly used measure of volume in the derivatives market, it is not used as a measure of credit risk. Generally, the current credit exposure of our derivative contracts is limited to the net positive estimated fair value of derivative contracts at the reporting date after taking into consideration the existence of netting agreements and any collateral received. A derivative with positive value (a derivative asset) indicates existence of credit risk because the counterparty would owe us if the contract were closed. Alternatively, a derivative contract with negative value (a derivative liability) indicates we would owe money to the counterparty if the contract were closed. Generally, if there is more than one derivative transaction with a single counterparty, a master netting arrangement exists with respect to derivative transactions with that counterparty to provide for aggregate net settlement.
Certain of our standardized contracts for over-the-counter derivative transactions (“
ISDA Master Agreements
”) contain credit risk related contingent provisions pertaining to each counterparty's credit rating. In some ISDA Master Agreements, if the counterparty’s credit rating, or in some agreements, our AUM, falls below a specified threshold, either a default or a termination event permitting the counterparty to terminate the ISDA Master Agreement would be triggered. In all agreements that provide for collateralization, various levels of collateralization of net liability positions are applicable, depending on the credit rating of the counterparty. As of December 31, 2015 and 2014, we delivered $12.8 million and $13.2 million, respectively, of cash collateral into brokerage accounts. We report this cash collateral in cash and cash equivalents in our consolidated statements of financial condition.
As of December 31, 2015 and 2014, we held $5.9 million and $22.3 million, respectively, of long exchange-traded equity options, which are classified as trading investments and included in our other investments on our consolidated statements of financial condition. In addition, as of December 31, 2015 and 2014, we had $0.8 million and $7.1 million, respectively, of short exchange-traded equity options, which are included in securities sold not yet purchased on our consolidated statements of financial condition. Our options desk provides our clients with equity derivative strategies and execution for exchange-traded options on single stocks, exchange-traded funds and indices. While predominately agency-based, the options desk may commit capital to facilitate a client's transaction. Our options desk hedges the risk associated with this activity by taking offsetting positions in equities. For the years ended December 31, 2015 and 2014, respectively, we recognized $65.0 million and $140.0 million, respectively, of losses on equity options activity. These losses are recognized in investment gains (losses) in the consolidated statements of income.
8. Offsetting Assets and Liabilities
Offsetting of assets as of December 31, 2015 and 2014 was as follows:
|
Gross
Amounts of Recognized Assets |
Gross
Amounts Offset in the Statement of Financial Position |
Net
Amounts of Assets Presented in the Statement of Financial Position |
Financial
Instruments |
Cash
Collateral Received |
Net
Amount |
||||||||||||||||||
|
(in thousands)
|
|||||||||||||||||||||||
|
December 31, 2015
|
|||||||||||||||||||||||
|
Securities borrowed
|
$
|
75,274
|
|
$
|
—
|
|
$
|
75,274
|
|
$
|
—
|
|
$
|
(75,274
|
)
|
$
|
—
|
|
|||||
|
Derivatives
|
$
|
12,588
|
|
$
|
—
|
|
$
|
12,588
|
|
$
|
—
|
|
$
|
(1,518
|
)
|
$
|
11,070
|
|
|||||
|
Long exchange-traded options
|
$
|
5,910
|
|
$
|
—
|
|
$
|
5,910
|
|
$
|
—
|
|
$
|
—
|
|
$
|
5,910
|
|
|||||
|
December 31, 2014
|
|||||||||||||||||||||||
|
Securities borrowed
|
$
|
158,147
|
|
$
|
—
|
|
$
|
158,147
|
|
$
|
—
|
|
$
|
(158,147
|
)
|
$
|
—
|
|
|||||
|
Derivatives
|
$
|
6,787
|
|
$
|
—
|
|
$
|
6,787
|
|
$
|
—
|
|
$
|
(990
|
)
|
$
|
5,797
|
|
|||||
|
Long exchange-traded options
|
$
|
22,290
|
|
$
|
—
|
|
$
|
22,290
|
|
$
|
—
|
|
$
|
—
|
|
$
|
22,290
|
|
|||||
89
Offsetting of liabilities as of December 31, 2015 and 2014 was as follows:
|
Gross
Amounts of Recognized Liabilities |
Gross
Amounts Offset in the Statement of Financial Position |
Net
Amounts of Liabilities Presented in the Statement of Financial Position |
Financial
Instruments |
Cash
Collateral Pledged |
Net
Amount |
||||||||||||||||||
|
(in thousands)
|
|||||||||||||||||||||||
|
December 31, 2015
|
|||||||||||||||||||||||
|
Securities loaned
|
$
|
9,518
|
|
$
|
—
|
|
$
|
9,518
|
|
$
|
—
|
|
$
|
(9,518
|
)
|
$
|
—
|
|
|||||
|
Derivatives
|
$
|
12,221
|
|
$
|
—
|
|
$
|
12,221
|
|
$
|
—
|
|
$
|
(12,221
|
)
|
$
|
—
|
|
|||||
|
Short exchange-traded options
|
$
|
843
|
|
$
|
—
|
|
$
|
843
|
|
$
|
—
|
|
$
|
—
|
|
$
|
843
|
|
|||||
|
December 31, 2014
|
|||||||||||||||||||||||
|
Securities loaned
|
$
|
33,645
|
|
$
|
—
|
|
$
|
33,645
|
|
$
|
—
|
|
$
|
(33,645
|
)
|
$
|
—
|
|
|||||
|
Derivatives
|
$
|
9,392
|
|
$
|
—
|
|
$
|
9,392
|
|
$
|
—
|
|
$
|
(9,392
|
)
|
$
|
—
|
|
|||||
|
Short exchange-traded options
|
$
|
7,118
|
|
$
|
—
|
|
$
|
7,118
|
|
$
|
—
|
|
$
|
—
|
|
$
|
7,118
|
|
|||||
Cash collateral, whether pledged or received on derivative instruments, is not considered material and, accordingly, is not disclosed by counterparty.
9. Fair Value
Fair value is defined as the price that would be received to sell an asset or paid to transfer a liability (
i.e.
, the
“exit price”
) in an orderly transaction between market participants at the measurement date. The three broad levels of fair value hierarchy are as follows:
|
•
|
Level 1—Quoted prices in active markets are available for identical assets or liabilities as of the reported date.
|
|
•
|
Level 2—Quoted prices in markets that are not active or other pricing inputs that are either directly or indirectly observable as of the reported date.
|
|
•
|
Level 3—Prices or valuation techniques that are both significant to the fair value measurement and unobservable as of the reported date. These financial instruments do not have two-way markets and are measured using management’s best estimate of fair value, where the inputs into the determination of fair value require significant management judgment or estimation.
|
90
Assets and Liabilities Measured at Fair Value on a Recurring Basis
Valuation of our financial instruments by pricing observability levels as of December 31, 2015 and 2014 was as follows (in thousands):
|
Level 1
|
Level 2
|
Level 3
|
Total
|
||||||||||||
|
December 31, 2015:
|
|||||||||||||||
|
Money markets
|
$
|
116,445
|
|
$
|
—
|
|
$
|
—
|
|
$
|
116,445
|
|
|||
|
U.S. Treasury Bills
|
—
|
|
485,121
|
|
—
|
|
485,121
|
|
|||||||
|
Available-for-sale
|
|||||||||||||||
|
Equity securities
|
181
|
|
—
|
|
—
|
|
181
|
|
|||||||
|
Fixed income securities
|
183
|
|
—
|
|
—
|
|
183
|
|
|||||||
|
Trading
|
|||||||||||||||
|
Equity securities
|
304,083
|
|
22,070
|
|
116
|
|
326,269
|
|
|||||||
|
Fixed income securities
|
180,194
|
|
2,594
|
|
—
|
|
182,788
|
|
|||||||
|
Long exchange-traded options
|
5,910
|
|
—
|
|
—
|
|
5,910
|
|
|||||||
|
Derivatives
|
1,539
|
|
11,049
|
|
—
|
|
12,588
|
|
|||||||
|
Private equity
|
14,305
|
|
—
|
|
48,102
|
|
62,407
|
|
|||||||
|
Total assets measured at fair value
|
$
|
622,840
|
|
$
|
520,834
|
|
$
|
48,218
|
|
$
|
1,191,892
|
|
|||
|
Securities sold not yet purchased
|
|||||||||||||||
|
Short equities – corporate
|
$
|
15,254
|
|
$
|
—
|
|
$
|
—
|
|
$
|
15,254
|
|
|||
|
Short exchange-traded options
|
843
|
|
—
|
|
—
|
|
843
|
|
|||||||
|
Derivatives
|
2,651
|
|
9,570
|
|
—
|
|
12,221
|
|
|||||||
|
Contingent payment arrangements
|
—
|
|
—
|
|
31,399
|
|
31,399
|
|
|||||||
|
Total liabilities measured at fair value
|
$
|
18,748
|
|
$
|
9,570
|
|
$
|
31,399
|
|
$
|
59,717
|
|
|||
|
December 31, 2014:
|
|||||||||||||||
|
Money markets
|
$
|
89,566
|
|
$
|
—
|
|
$
|
—
|
|
$
|
89,566
|
|
|||
|
U.S. Treasury Bills
|
—
|
|
444,152
|
|
—
|
|
444,152
|
|
|||||||
|
Available-for-sale
|
|||||||||||||||
|
Equity securities
|
5,951
|
|
—
|
|
—
|
|
5,951
|
|
|||||||
|
Fixed income securities
|
221
|
|
—
|
|
—
|
|
221
|
|
|||||||
|
Trading
|
|||||||||||||||
|
Equity securities
|
387,495
|
|
7
|
|
—
|
|
387,502
|
|
|||||||
|
Fixed income securities
|
164,317
|
|
2,742
|
|
—
|
|
167,059
|
|
|||||||
|
Long exchange-traded options
|
22,290
|
|
—
|
|
—
|
|
22,290
|
|
|||||||
|
Derivatives
|
571
|
|
6,216
|
|
—
|
|
6,787
|
|
|||||||
|
Private equity
|
12,162
|
|
—
|
|
58,926
|
|
71,088
|
|
|||||||
|
Total assets measured at fair value
|
$
|
682,573
|
|
$
|
453,117
|
|
$
|
58,926
|
|
$
|
1,194,616
|
|
|||
|
Securities sold not yet purchased
|
|||||||||||||||
|
Short equities – corporate
|
$
|
81,784
|
|
$
|
—
|
|
$
|
—
|
|
$
|
81,784
|
|
|||
|
Short exchange-traded options
|
7,118
|
|
—
|
|
—
|
|
7,118
|
|
|||||||
|
Derivatives
|
2,438
|
|
6,954
|
|
—
|
|
9,392
|
|
|||||||
|
Contingent payment arrangements
|
—
|
|
—
|
|
42,436
|
|
42,436
|
|
|||||||
|
Total liabilities measured at fair value
|
$
|
91,340
|
|
$
|
6,954
|
|
$
|
42,436
|
|
$
|
140,730
|
|
|||
91
Included in Note 6, Investments,
but excluded in the above fair value table, are the following investments:
•
Limited partnership hedge funds, which are recorded using the equity method of accounting;
• One private equity investment, which is recorded using the cost method of accounting; and
• Other investments, which primarily include miscellaneous investments recorded using the cost or equity method of accounting and long-term deposits.
We
provide below
a description of the fair value methodologies used for instruments measured at fair value, as well as the general classification of such instruments pursuant to the valuation hierarchy:
|
•
|
Money markets:
We invest excess cash in various money market funds that are valued based on quoted prices in active markets; these are included in Level 1 of the valuation hierarchy.
|
|
•
|
Treasury Bills:
We hold U.S. Treasury Bills, which are primarily segregated in a special reserve bank custody account as required by Rule 15c3-3 of the Exchange Act. These securities are valued based on quoted yields in secondary markets and are included in Level 2 of the valuation hierarchy.
|
|
•
|
Equity and fixed income securities:
Our equity and fixed income securities consist principally of company-sponsored mutual funds with net asset values and various separately-managed portfolios consisting primarily of equity and fixed income securities with quoted prices in active markets, which are included in Level 1 of the valuation hierarchy. In addition, some securities are valued based on observable inputs from recognized pricing vendors, which are included in Level 2 of the valuation hierarchy.
|
|
•
|
Derivatives:
We hold exchange-traded futures with counterparties that are included in Level 1 of the valuation hierarchy. In addition, we hold currency forward contracts, interest rate swaps, credit default swaps, option swaps and total return swaps with counterparties that are included in Level 2 of the valuation hierarchy.
|
|
•
|
Options:
We hold long exchange-traded options that are included in Level 1 of the valuation hierarchy.
|
|
•
|
Private equity:
Generally, the valuation of private equity investments owned by our consolidated venture capital fund or by us directly (regarding an investment in a private equity fund focused exclusively on the energy sector) requires significant management judgment due to the absence of quoted market prices, inherent lack of liquidity and the long-term nature of such investments. Private equity investments are valued initially at cost. The carrying values of private equity investments are adjusted either up or down from cost to reflect expected exit values as evidenced by financing and sale transactions with third parties, or when determination of a valuation adjustment is confirmed through ongoing review in accordance with our valuation policies and procedures. A variety of factors are reviewed and monitored to assess positive and negative changes in valuation, including current operating performance and future expectations of investee companies, industry valuations of comparable public companies, changes in market outlooks, and the third party financing environment over time. In determining valuation adjustments resulting from the investment review process, particular emphasis is placed on current company performance and market conditions. For these reasons, which make the fair value of private equity investments unobservable, equity investments are included in Level 3 of the valuation hierarchy. We also invest in a third-party venture capital fund in which fair value is based on our capital account balance provided by the partnership and is included in Level 3 of the valuation hierarchy. If private equity investments owned by our consolidated venture capital fund become publicly-traded, they are included in Level 1 of the valuation hierarchy. Also, if they contain trading restrictions, publicly-traded equity investments are included in Level 2 of the valuation hierarchy until the trading restrictions expire. During the first quarter of 2014, the trading restriction period for one of our public securities lapsed and, as a result, $3.0 million was transferred from a Level 2 classification to a Level 1 classification. During the second quarter of 2014, the trading restriction period for one of our public securities lapsed and, as a result, $4.0 million was transferred from a Level 2 classification to a Level 1 classification. During the third quarter of 2014, one of our investments began actively trading and, as a result, $1.6 million was transferred from a Level 3 classification to a Level 1 classification. During the first quarter of 2015, $26,000 was transferred from a Level 3 classification to a Level 1 classification.
|
|
•
|
Securities sold not yet purchased:
Securities sold not yet purchased, primarily reflecting short positions in equities and exchange-traded options, are included in Level 1 of the valuation hierarchy.
|
|
•
|
Contingent payment arrangements:
Contingent payment arrangements relate to contingent payment liabilities assocaited with acquisitions in 2010, 2013 and 2014. At each reporting date, we estimate the fair values of the
|
92
contingent consideration expected to be paid upon probability-weighted AUM and revenue projections, using observable market data inputs, which are included in Level 3 of the valuation hierarchy.
The change in carrying value associated with Level 3 financial instruments carried at fair value, classified as private equity investments and trading equity securities, is as follows:
|
December 31, 2015
|
December 31, 2014
|
||||||
|
(in thousands)
|
|||||||
|
Balance as of beginning of period
|
$
|
58,926
|
|
$
|
52,081
|
|
|
|
Transfers out
|
(26
|
)
|
(1,594
|
)
|
|||
|
Purchases
|
198
|
|
7,976
|
|
|||
|
Sales
|
(18,069
|
)
|
(1,121
|
)
|
|||
|
Realized gains (losses), net
|
4,921
|
|
721
|
|
|||
|
Unrealized gains (losses), net
|
2,268
|
|
863
|
|
|||
|
Balance as of end of period
|
$
|
48,218
|
|
$
|
58,926
|
|
|
Transfers into and out of all levels of the fair value hierarchy are reflected at end-of-period fair values. Realized and unrealized gains and losses on Level 3 financial instruments are recorded in investment gains and losses in the consolidated statements of income. Approximately 20% of the Level 3 investments are private equity investments owned by our consolidated venture capital fund, of which we own 10% and non-controlling interests own 90%.
Quantitative information about private equity Level 3 fair value measurements as of December 31, 2015 and 2014 is as follows:
|
Fair Value as of December 31, 2015
|
Valuation Technique
|
Unobservable Input
|
Range
|
|||||||
|
(in thousands)
|
||||||||||
|
Technology, Media and Telecommunications
|
$
|
9,527
|
|
Market comparable companies
|
Revenue multiple
|
2.5 – 4.8
|
|
|||
|
Marketability discount
|
30
|
%
|
||||||||
Also, as of December 31, 2015, we have an investment in a private equity fund focused exclusively on the energy sector (fair value of $6.5 million) that is classified as Level 3. This investment's valuation is based on a market approach, considering recent transactions of the fund and the industry.
One of our private equity investments is a venture capital fund (fair value of $32.0 million and unfunded commitment of $2.9 million as of December 31, 2015) that invests in communications, consumer, digital media, healthcare and information technology markets. In addition, one of the investments included in our consolidated private equity fund (fair value of $0.1 million and no unfunded commitment as of December 31, 2015) is a venture capital fund investing in clean energy, resource and energy efficiency and other sustainable industries. The fair value of each of these investments has been estimated using the capital account balances provided by the partnerships. The interests in these partnerships cannot be redeemed.
93
|
Fair Value as of December 31, 2014
|
Valuation Technique
|
Unobservable Input
|
Range
|
|||||||
|
(in thousands)
|
||||||||||
|
Technology, Media and Telecommunications
|
$
|
20,112
|
|
Market comparable companies
|
Revenue multiple
|
2.0 – 3.5
|
|
|||
|
Discount rate
|
18
|
%
|
||||||||
|
Discount years
|
2.0
|
|
||||||||
In addition, as of December 31, 2014, there were two private equity investments (with a combined fair value of $0.2 million) in the Healthcare and Clean-tech category that are classified as Level 3. The first investment is valued based on liquidation value and the second investment is a warrant valued using the Black-Scholes option valuation model. Also, we have an investment in a private equity fund focused exclusively on the energy sector (fair value of $7.5 million) that is classified as Level 3. This investment’s valuation is based on a market approach, considering recent transactions of the fund and the industry.
One of our private equity investments was a venture capital fund (fair value of $31.0 million and unfunded commitment of $2.9 million as of December 31, 2014) that invests in communications, consumer, digital media, healthcare and information technology markets. In addition, one of the investments included in our consolidated private equity fund (fair value of $0.1 million and no unfunded commitment as of December 31, 2014) is a venture capital fund investing in clean energy, resource and energy efficiency and other sustainable industries. The fair value of each of these investments has been estimated using the capital account balances provided by the partnerships. The interests in these partnerships cannot be redeemed.
The significant unobservable inputs used in the fair value measurement of the reporting entities’ venture capital securities in the Technology, Media and Telecommunications areas are enterprise value to revenue multiples and a discount rate to account for liquidity and various risk factors. Significant increases (decreases) in the enterprise value to revenue multiple inputs in isolation would result in a significantly higher (lower) fair value measurement. Significant increases (decreases) in the discount rate would result in a significantly lower (higher) fair value measurement.
The change in carrying value associated with Level 3 financial instruments carried at fair value, classified as contingent payment arrangements, is as follows:
|
December 31, 2015
|
December 31, 2014
|
||||||
|
(in thousands)
|
|||||||
|
Balance as of beginning of period
|
$
|
42,436
|
|
$
|
38,205
|
|
|
|
Addition
|
—
|
|
9,365
|
|
|||
|
Accretion
|
1,770
|
|
1,593
|
|
|||
|
Changes in estimates
|
(7,211
|
)
|
(4,375
|
)
|
|||
|
Payments
|
(5,596
|
)
|
(2,352
|
)
|
|||
|
Balance as of end of period
|
$
|
31,399
|
|
$
|
42,436
|
|
|
Our three acquisition-related contingent consideration liabilities (with a combined fair value of $31.4 million and $42.4 million as of December 31, 2015 and 2014, respectively) currently are valued using a projected AUM weighted average growth rate of 46%, a revenue growth rate of 43%, and a discount rate of 3% (using a cost of debt assumption). During the fourth quarters of 2015 and 2014, we recorded changes in estimates of the contingent consideration payable relating to recent acquisitions of $7.2 million and $4.4 million, respectively.
Assets and Liabilities Measured at Fair Value on a Nonrecurring Basis
We did not have any material assets or liabilities that were measured at fair value for impairment on a nonrecurring basis during the years ended December 31, 2015 or 2014.
94
10. Furniture, Equipment and Leasehold Improvements, Net
Furniture, equipment and leasehold improvements, net consist of:
|
December 31,
|
|||||||
|
2015
|
2014
|
||||||
|
(in thousands)
|
|||||||
|
Furniture and equipment
|
$
|
529,488
|
|
$
|
532,512
|
|
|
|
Leasehold improvements
|
258,280
|
|
259,588
|
|
|||
|
787,768
|
|
792,100
|
|
||||
|
Less: Accumulated depreciation and amortization
|
(627,408
|
)
|
(631,144
|
)
|
|||
|
Furniture, equipment and leasehold improvements, net
|
$
|
160,360
|
|
$
|
160,956
|
|
|
Depreciation and amortization expense on furniture, equipment and leasehold improvements were $29.0 million, $36.2 million and $36.5 million for the years ended December 31, 2015, 2014 and 2013, respectively.
During 2015, 2014 and 2013, we recorded $1.0 million, $0.1 million and $28.4 million, respectively, in pre-tax real estate charges. Included in these charges during 2014 and 2013 were $5.5 million and $4.4 million, respectively, worth of leasehold improvements, furniture and equipment we wrote off related to the respective spaces.
See Note 3
for further discussion of the real estate charges.
11. Deferred Sales Commissions, Net
The components of deferred sales commissions, net for the years ended December 31, 2015 and 2014 were as follows (excluding amounts related to fully amortized deferred sales commissions):
|
December 31,
|
|||||||
|
2015
|
2014
|
||||||
|
(in thousands)
|
|||||||
|
Carrying amount of deferred sales commissions
|
$
|
970,671
|
|
$
|
918,270
|
|
|
|
Less: Accumulated amortization
|
(606,963
|
)
|
(557,818
|
)
|
|||
|
Cumulative CDSC received
|
(264,638
|
)
|
(242,162
|
)
|
|||
|
Deferred sales commissions, net
|
$
|
99,070
|
|
$
|
118,290
|
|
|
Amortization expense was $49.1 million, $41.5 million and $41.3 million for the years ended December 31, 2015, 2014 and 2013, respectively. Estimated future amortization expense related to the December 31, 2015 net asset balance, assuming no additional CDSC is received in future periods, is as follows (in thousands):
|
2016
|
$
|
41,359
|
|
|
2017
|
31,647
|
|
|
|
2018
|
21,021
|
|
|
|
2019
|
4,646
|
|
|
|
2020
|
344
|
|
|
|
2021
|
53
|
|
|
|
$
|
99,070
|
|
|
12. Debt
As of December 31, 2015 and 2014, AB had $583.9 million and $489.0 million, respectively, in commercial paper outstanding with weighted average interest rates of approximately 0.5% and 0.3%, respectively. The commercial paper is short term in nature, and as such, recorded value is estimated to approximate fair value (and considered a Level 2 security in the fair value hierarchy). Average daily borrowings of commercial paper during 2015 and 2014 were $387.9 million and $335.0 million, respectively, with weighted average interest rates of approximately 0.3% and 0.2%, respectively.
95
AB has a $1.0 billion committed, unsecured senior revolving credit facility (“
Credit Facility
”) with a group of commercial banks and other lenders. The Credit Facility provides for possible increases in the principal amount by up to an aggregate incremental amount of $250 million; any such increase is subject to the consent of the affected lenders. The Credit Facility is available for AB’s and Sanford C. Bernstein & Co., LLC's ("
SCB LLC
") business purposes, including the support of AB’s $1.0 billion commercial paper program. Both AB and SCB LLC can draw directly under the Credit Facility and management may draw on the Credit Facility from time to time. AB has agreed to guarantee the obligations of SCB LLC under the Credit Facility.
The Credit Facility contains affirmative, negative and financial covenants, which are customary for facilities of this type, including, restrictions on dispositions of assets, restrictions on liens, a minimum interest coverage ratio and a maximum leverage ratio. As of December 31, 2015, we were in compliance with these covenants. The Credit Facility also includes customary events of default (with customary grace periods, as applicable), including provisions under which, upon the occurrence of an event of default, all outstanding loans may be accelerated and/or lender’s commitments may be terminated. Also, under such provisions, upon the occurrence of certain insolvency- or bankruptcy-related events of default, all amounts payable under the Credit Facility would automatically become immediately due and payable, and the lender’s commitments automatically would terminate.
Amounts under the Credit Facility may be borrowed, repaid and re-borrowed by us from time to time until the maturity of the facility. Voluntary prepayments and commitment reductions requested by us are permitted at any time without fee (other than customary breakage costs relating to the prepayment of any drawn loans) upon proper notice and subject to a minimum dollar requirement. Borrowings under the Credit Facility bear interest at a rate per annum, which will be, at our option, a rate equal to an applicable margin, which is subject to adjustment based on the credit ratings of AB, plus one of the following indices: London Interbank Offered Rate; a floating base rate; or the Federal Funds rate.
On October 22, 2014, as part of an amendment and restatement, the maturity date of the Credit Facility was extended from January 17, 2017 to October 22, 2019. There were no other significant changes included in the amendment.
As of December 31, 2015 and 2014, we had no amounts outstanding under the Credit Facility. During 2015 and 2014, we did not draw upon the Credit Facility.
In addition, SCB LLC has three uncommitted lines of credit with three financial institutions. Two of these lines of credit permit us to borrow up to an aggregate of approximately $200 million, with AB named as an additional borrower, while one line has no stated limit. As of December 31, 2015 and 2014, SCB LLC had no bank loans outstanding. Average daily borrowings of bank loans during 2015 and 2014 were $3.9 million and $5.5 million, respectively, with weighted average interest rates of approximately 1.2% and 1.1%, respectively.
13. Commitments and Contingencies
Operating Leases
We lease office space, furniture and office equipment under various operating leases. The future minimum payments under non-cancelable leases, sublease commitments and related payments we are obligated to make, net of sublease commitments of third party lessees to make payments to us, as of December 31, 2015, are as follows:
|
Payments
|
Sublease
Receipts |
Net
Payments |
|||||||||
|
(in millions)
|
|||||||||||
|
2016
|
$
|
137.9
|
|
$
|
43.7
|
|
$
|
94.2
|
|
||
|
2017
|
139.0
|
|
42.5
|
|
96.5
|
|
|||||
|
2018
|
130.0
|
|
41.8
|
|
88.2
|
|
|||||
|
2019
|
124.1
|
|
41.2
|
|
82.9
|
|
|||||
|
2020
|
102.5
|
|
24.7
|
|
77.8
|
|
|||||
|
2021 and thereafter
|
740.5
|
|
102.1
|
|
638.4
|
|
|||||
|
Total future minimum payments
|
$
|
1,374.0
|
|
$
|
296.0
|
|
$
|
1,078.0
|
|
||
Office leases contain escalation clauses that provide for the pass through of increases in operating expenses and real estate taxes. Rent expense, which is amortized on a straight-line basis over the life of the lease, was $70.7 million, $73.0 million and $74.7 million, respectively, for the years ended December 31, 2015, 2014 and 2013, net of sublease income of $2.9 million,
96
$3.3 million and $3.4 million, respectively, for the years ended December 31, 2015, 2014 and 2013. During 2015 and 2013, we accelerated rent of $1.0 million and $24.0 million, respectively, relating to our real estate consolidation plans. In addition, we had rent credits of $5.4 million during 2014.
See Note 3
for further discussion of the real estate charges.
Legal Proceedings
During the first quarter of 2012, we received a legal letter of claim (“
Letter of Claim
”) sent on behalf of Philips Pension Trustees Limited and Philips Electronics U.K. Limited (“
Philips
”), a former pension fund client, alleging that AllianceBernstein Limited (one of our subsidiaries organized in the U.K.) was negligent and failed to meet certain applicable standards of care with respect to the initial investment in, and management of, a £500 million portfolio of U.S. mortgage-backed securities. Philips has alleged damages ranging between $177 million and $234 million, plus compound interest on an alleged $125 million of realized losses in the portfolio. On January 2, 2014, Philips filed a claim form (“
Claim
”) in the High Court of Justice in London, England, which formally commenced litigation with respect to the allegations in the Letter of Claim.
We believe that any losses to Philips resulted from adverse developments in the U.S. housing and mortgage market that precipitated the financial crisis in 2008 and not from any negligence or other failure or malfeasance on our part. We believe that we have strong defenses to these claims, which are set forth in our October 12, 2012 response to the Letter of Claim and our June 27, 2014 Statement of Defence in response to the Claim, and intend to defend this matter vigorously.
In addition to the Claim
discussed immediately above
, we are involved in various other matters, including regulatory inquiries, administrative proceedings and litigation, some of which allege significant damages.
In management’s opinion, an adequate accrual has been made as of December 31, 2015 to provide for any probable losses regarding any litigation matters for which we can reasonably estimate an amount of loss. It is reasonably possible that we could incur additional losses pertaining to these matters, but currently we cannot estimate any such additional losses.
Management, after consultation with legal counsel, currently believes that the outcome of any individual matter that is pending or threatened, or all of them combined, will not have a material adverse effect on our results of operations, financial condition or liquidity. However, any inquiry, proceeding or litigation has an element of uncertainty; management cannot determine whether further developments relating to any individual matter that is pending or threatened, or all of them combined, will have a material adverse effect on our results of operation, financial condition or liquidity in any future reporting period.
Other
During 2009, we entered into a subscription agreement, under which we committed to invest up to $35.0 million, as amended in 2011, in a venture capital fund over a six-year period. As of December 31, 2015, we had funded $32.1 million of this commitment.
During 2010, as general partner of AllianceBernstein U.S. Real Estate L.P. (“
Real Estate Fund
”), we committed to invest $25.0 million in the Real Estate Fund. As of December 31, 2015, we had funded $19.6 million of this commitment. During 2014, as general partner of AllianceBernstein U.S. Real Estate II L.P. (“
Real Estate Fund II
”), we committed to invest $28.0 million, as amended in 2015, in the Real Estate Fund II. As of December 31, 2015, we had funded $1.4 million of this commitment.
During 2012, we entered into an investment agreement under which we committed to invest up to $8.0 million in an oil and gas fund over a three-year period, as amended. As of December 31, 2015, we had funded $6.1 million of this commitment.
In December 2015, we provided a 60-day guarantee to a commercial bank for borrowings by a company-sponsored fund up to a maximum of $50.0 million. The bank provided the fund with a limited partner subscription line for the unfunded commitments of the fund's limited partners. The fund is expected to repay the bank by calling capital from the limited partners. To the extent the fund is not able to repay the loan to the bank, we will repay the loan under the guarantee, up to $50.0 million. The fund will repay us for all amounts paid by us under the guaranty. We have not been required to perform under this guarantee and currently have no liability in connection with this guarantee.
14. Net Capital
SCB LLC is registered as a broker-dealer under the Exchange Act and is subject to minimum net capital requirements imposed by the U.S. Securities and Exchange Commission ("
SEC
"). SCB LLC computes its net capital under the alternative method permitted by the applicable rule, which requires that minimum net capital, as defined, equals the greater of $1 million or two percent of aggregate debit items arising from customer transactions, as defined. As of December 31, 2015, SCB LLC had net capital of $199.6 million, which was $171.8 million in excess of the minimum net capital requirement of $27.8 million.
97
Advances, dividend payments and other equity withdrawals by SCB LLC are restricted by regulations imposed by the SEC, the Financial Industry Regulatory Authority, Inc., and other securities agencies.
Our U.K.-based broker-dealer is a member of the London Stock Exchange. As of December 31, 2015, it was subject to financial resources requirements of $24.1 million imposed by the Financial Conduct Authority of the United Kingdom and had aggregate regulatory financial resources of $45.1 million, an excess of $21.0 million.
AllianceBernstein Investments, Inc., another one of our subsidiaries and the distributor and/or underwriter for certain company-sponsored mutual funds, is registered as a broker-dealer under the Exchange Act and is subject to the minimum net capital requirements imposed by the SEC. As of December 31, 2015, it had net capital of $49.0 million, which was $48.7 million in excess of its required net capital of $0.3 million.
Many of our subsidiaries around the world are subject to minimum net capital requirements by the local laws and regulations to which they are subject. As of December 31, 2015, each of our subsidiaries subject to a minimum net capital requirement satisfied the applicable requirement.
15. Counterparty Risk
Customer Activities
In the normal course of business, brokerage activities involve the execution, settlement and financing of various customer securities trades, which may expose our broker-dealer operations to off-balance sheet risk by requiring us to purchase or sell securities at prevailing market prices in the event the customer is unable to fulfill its contractual obligations.
Our customer securities activities are transacted on either a cash or margin basis. In margin transactions, we extend credit to the customer, subject to various regulatory and internal margin requirements. These transactions are collateralized by cash or securities in the customer’s account. In connection with these activities, we may execute and clear customer transactions involving the sale of securities not yet purchased. We seek to control the risks associated with margin transactions by requiring customers to maintain collateral in compliance with the aforementioned regulatory and internal guidelines. We monitor required margin levels daily and, pursuant to such guidelines, require customers to deposit additional collateral, or reduce positions, when necessary. A majority of our customer margin accounts are managed on a discretionary basis whereby we maintain control over the investment activity in the accounts. For these discretionary accounts, our margin deficiency exposure is minimized through maintaining a diversified portfolio of securities in the accounts and by virtue of our discretionary authority and our U.S-based broker-dealer's role as custodian.
In accordance with industry practice, we record customer transactions on a settlement date basis, which, during 2015, generally was three business days after trade date for our U.S. operations and two business days after trade date for our U.K. operations. We are exposed to risk of loss on these transactions in the event of the customer’s or broker’s inability to meet the terms of their contracts, in which case we may have to purchase or sell financial instruments at prevailing market prices. The risks we assume in connection with these transactions are not expected to have a material adverse effect on our financial condition or results of operations.
Other Counterparties
We are engaged in various brokerage activities on behalf of clients, in which counterparties primarily include broker-dealers, banks and other financial institutions. In the event these counterparties do not fulfill their obligations, we may be exposed to loss. The risk of default depends on the creditworthiness of the counterparty or issuer of the instrument. It is our policy to review, as necessary, each counterparty’s creditworthiness.
In connection with security borrowing and lending arrangements, we enter into collateralized agreements, which may result in potential loss in the event the counterparty to a transaction is unable to fulfill its contractual obligations. Security borrowing arrangements require us to deposit cash collateral with the lender. With respect to security lending arrangements, we receive collateral in the form of cash in amounts generally in excess of the market value of the securities loaned. We attempt to mitigate credit risk associated with these activities by establishing credit limits for each broker and monitoring these limits on a daily basis. Additionally, security borrowing and lending collateral is marked to market on a daily basis, and additional collateral is deposited by or returned to us as necessary.
We enter into various futures, forwards and swaps primarily to economically hedge certain of our seed money investments. We may be exposed to credit losses in the event of nonperformance by counterparties to these derivative financial instruments.
See Note 7, Derivative Instruments
for further discussion.
98
16. Qualified Employee Benefit Plans
We maintain a qualified profit sharing plan covering U.S. employees and certain foreign employees. Employer contributions are discretionary and generally limited to the maximum amount deductible for federal income tax purposes. Aggregate contributions for 2015, 2014 and 2013 were $14.2 million, $13.5 million and $12.8 million, respectively.
We maintain several defined contribution plans for foreign employees working for our subsidiaries in the United Kingdom, Australia, Japan and other locations outside the United States. Employer contributions generally are consistent with regulatory requirements and tax limits. Defined contribution expense for foreign entities was $7.9 million, $7.3 million and $6.0 million in 2015, 2014 and 2013, respectively.
We maintain a qualified, noncontributory, defined benefit retirement plan (“
Retirement Plan
”) covering current and former employees who were employed by AB in the United States prior to October 2, 2000. Benefits are based on years of credited service, average final base salary (as defined in the Retirement Plan) and primary Social Security benefits. Service and compensation after December 31, 2008 are not taken into account in determining participants’ retirement benefits.
Our policy is to satisfy our funding obligation for each year in an amount not less than the minimum required by the Employee Retirement Income Security Act of 1974, as amended, and not greater than the maximum amount we can deduct for federal income tax purposes. We did not make a contribution to the Retirement Plan during 2015. We currently do not plan to make a contribution to the Retirement Plan during 2016. Contribution estimates, which are subject to change, are based on regulatory requirements, future market conditions and assumptions used for actuarial computations of the Retirement Plan’s obligations and assets. Management, at the present time, has not determined the amount, if any, of additional future contributions that may be required.
The Retirement Plan’s projected benefit obligation, fair value of plan assets, and funded status (amounts recognized in the consolidated statements of financial condition) were as follows:
|
Years Ended December 31,
|
|||||||
|
2015
|
2014
|
||||||
|
(in thousands)
|
|||||||
|
Change in projected benefit obligation:
|
|||||||
|
Projected benefit obligation at beginning of year
|
$
|
113,733
|
|
$
|
93,548
|
|
|
|
Interest cost
|
4,816
|
|
4,895
|
|
|||
|
Plan amendments
|
827
|
|
—
|
|
|||
|
Actuarial (gain) loss
|
(6,698
|
)
|
19,909
|
|
|||
|
Benefits paid
|
(4,894
|
)
|
(4,619
|
)
|
|||
|
Projected benefit obligation at end of year
|
107,784
|
|
113,733
|
|
|||
|
Change in plan assets:
|
|||||||
|
Plan assets at fair value at beginning of year
|
90,320
|
|
83,831
|
|
|||
|
Actual return on plan assets
|
866
|
|
5,108
|
|
|||
|
Employer contribution
|
—
|
|
6,000
|
|
|||
|
Benefits paid
|
(4,894
|
)
|
(4,619
|
)
|
|||
|
Plan assets at fair value at end of year
|
86,292
|
|
90,320
|
|
|||
|
Funded status
|
$
|
(21,492
|
)
|
$
|
(23,413
|
)
|
|
Effective December 31, 2015, the Retirement Plan was amended to change the actuarial basis used for converting a life annuity benefit to optional forms of payment and converting benefits payable at age 65 to earlier commencement dates. This prior service cost will be amortized over future years.
99
The amounts recognized in other comprehensive income (loss) for the Retirement Plan for 2015, 2014 and 2013 were as follows:
|
2015
|
2014
|
2013
|
|||||||||
|
(in thousands)
|
|||||||||||
|
Unrecognized net gain (loss) from experience different from that assumed and effects of changes and assumptions
|
$
|
2,882
|
|
$
|
(20,803
|
)
|
$
|
22,871
|
|
||
|
Prior service cost
|
(895
|
)
|
—
|
|
—
|
|
|||||
|
Unrecognized net plan assets as of January 1, 1987 being recognized over 26.3 years
|
—
|
|
—
|
|
(47
|
)
|
|||||
|
1,987
|
|
(20,803
|
)
|
22,824
|
|
||||||
|
Income tax (expense) benefit
|
(99
|
)
|
232
|
|
(388
|
)
|
|||||
|
Other comprehensive income (loss)
|
$
|
1,888
|
|
$
|
(20,571
|
)
|
$
|
22,436
|
|
||
The gain of $1.9 million recognized in 2015 primarily was due to changes in the discount rate and lump sum interest rates ($5.6 million) and changes in the mortality assumption ($1.4 million), offset by expected earnings on plan assets exceeding actual earnings ($5.3 million). The loss of $20.6 million recognized in 2014 primarily was due to changes in the discount rate ($12.0 million) and changes in the mortality assumption ($7.5 million). The gain of $22.4 million recognized in 2013 primarily was due to changes in the discount rate ($16.1 million) and earnings of plan assets exceeding expectations ($6.2 million).
Foreign retirement plans and an individual's retirement plan maintained by AB are not material to AB's consolidated financial statements. As such, disclosure for these plans are not necessary. The reconciliation of the 2015 amounts recognized in other comprehensive income for the Retirement Plan as compared to the consolidated statement of comprehensive income ("OCI Statement") is as follows:
|
Retirement Plan
|
Retired Individual Plan
|
Foreign Retirement Plans
|
OCI Statement
|
||||||||||||
|
(in thousands)
|
|||||||||||||||
|
Recognized actuarial (loss) gain
|
$
|
2,882
|
|
$
|
96
|
|
$
|
289
|
|
$
|
3,267
|
|
|||
|
Amortization of prior service cost
|
(895
|
)
|
—
|
|
—
|
|
(895
|
)
|
|||||||
|
Changes in employee benefit related items
|
1,987
|
|
96
|
|
289
|
|
2,372
|
|
|||||||
|
Income tax (expense) benefit
|
(99
|
)
|
(2
|
)
|
(64
|
)
|
(165
|
)
|
|||||||
|
Employee benefit related items, net of tax
|
$
|
1,888
|
|
$
|
94
|
|
$
|
225
|
|
$
|
2,207
|
|
|||
The amounts included in accumulated other comprehensive income (loss) for the Retirement Plan as of December 31, 2015 and 2014 were as follows:
|
2015
|
2014
|
||||||
|
(in thousands)
|
|||||||
|
Unrecognized net loss from experience different from that assumed and effects of changes and assumptions
|
$
|
(43,314
|
)
|
$
|
(46,196
|
)
|
|
|
Prior service cost
|
(895
|
)
|
—
|
|
|||
|
(44,209
|
)
|
(46,196
|
)
|
||||
|
Income tax benefit
|
468
|
|
567
|
|
|||
|
Accumulated other comprehensive loss
|
$
|
(43,741
|
)
|
$
|
(45,629
|
)
|
|
The amortization period over which we are amortizing the loss for the Retirement Plan from accumulated other comprehensive income is 36 years. The estimated prior service cost and amortization of loss for the Retirement Plan that will be amortized from accumulated other comprehensive income over the next year are $23,416 and $936,295, respectively.
100
The accumulated benefit obligation for the plan was $107.8 million and $113.7 million, respectively, as of December 31, 2015 and 2014.
The discount rates used to determine benefit obligations as of December 31, 2015 and 2014 (measurement dates) were 4.75% and 4.3%, respectively.
Benefit payments are expected to be paid as follows (in thousands):
|
2016
|
$
|
5,599
|
|
|
2017
|
4,400
|
|
|
|
2018
|
5,195
|
|
|
|
2019
|
5,920
|
|
|
|
2020
|
4,889
|
|
|
|
2021-2025
|
35,655
|
|
|
Net (benefit) expense under the Retirement Plan consisted of:
|
Year Ended December 31,
|
|||||||||||
|
2015
|
2014
|
2013
|
|||||||||
|
(in thousands)
|
|||||||||||
|
Interest cost on projected benefit obligations
|
$
|
4,816
|
|
$
|
4,895
|
|
$
|
4,640
|
|
||
|
Expected return on plan assets
|
(6,176
|
)
|
(6,493
|
)
|
(5,347
|
)
|
|||||
|
Amortization of transition asset
|
—
|
|
—
|
|
(47
|
)
|
|||||
|
Recognized actuarial loss
|
979
|
|
490
|
|
1,109
|
|
|||||
|
Net pension (benefit) expense
|
$
|
(381
|
)
|
$
|
(1,108
|
)
|
$
|
355
|
|
||
Actuarial computations used to determine net periodic costs were made utilizing the following weighted-average assumptions:
|
Years Ended December 31,
|
||||||||
|
2015
|
2014
|
2013
|
||||||
|
Discount rate on benefit obligations
|
4.3
|
%
|
5.3
|
%
|
4.4
|
%
|
||
|
Expected long-term rate of return on plan assets
|
7.0
|
|
7.5
|
|
7.5
|
|
||
In developing the expected long-term rate of return on plan assets of 7.0%, management considered the historical returns and future expectations for returns for each asset category, as well as the target asset allocation of the portfolio. The expected long-term rate of return on assets is based on weighted average expected returns for each asset class.
As of December 31, 2015, the mortality assumption has been updated to the published Society of Actuaries (“
SOA
”) Study RP-2014 table adjusted to 2006 and projected with MP-2015 improvement scale. Previously, mortality had been assumed using the RP-2014 table and mortality improvement scale.
It is expected that the Internal Revenue Service (“
IRS
”) will update the mortality tables used to calculate lump sums to reflect the final tables published by the SOA. Since the current mortality tables have been published for plan years through 2016, updated tables will not be effective before 2017. For results for fiscal year-end 2015, we reflected the current IRS tables through 2016 and the new SOA tables with generational improvements for lump sum payments projected to begin in 2017 and later.
101
The Retirement Plan’s asset allocation percentages consisted of:
|
December 31,
|
|||||
|
2015
|
2014
|
||||
|
Equity
|
56
|
%
|
62
|
%
|
|
|
Debt securities
|
24
|
|
18
|
|
|
|
Other
|
20
|
|
20
|
|
|
|
100
|
%
|
100
|
%
|
||
The guidelines regarding allocation of assets are formalized in the Investment Policy Statement adopted by the Investment Committee for the Retirement Plan. The objective of the investment program is to enhance the portfolio of the Retirement Plan through total return (capital appreciation and income), thereby promoting the ongoing ability of the plan to meet future liabilities and obligations, while minimizing the need for additional contributions. The guidelines specify an allocation weighting of 30% to 60% for return seeking investments (target of 40%), 10% to 30% for risk mitigating investments (target of 15%), 0% to 25% for diversifying investments (target of 17%) and 18% to 38% for dynamic asset allocation (target of 28%). Investments in mutual funds, hedge funds (and other alternative investments), and other commingled investment vehicles are permitted under the guidelines. Investments are permitted in overlay portfolios (regulated mutual funds) to complement the long-term strategic asset allocation. This portfolio overlay strategy is designed to manage short-term portfolio risk and mitigate the effect of extreme outcomes by varying the asset allocation of a portfolio through investment in the overlay portfolios.
See Note 9, Fair Value
for a description of how we measure the fair value of our plan assets.
The valuation of our Retirement Plan assets by pricing observability levels as of December 31, 2015 and 2014 was as follows (in thousands):
|
Level 1
|
Level 2
|
Level 3
|
Total
|
||||||||||||
|
December 31, 2015:
|
|||||||||||||||
|
Cash
|
$
|
445
|
|
$
|
—
|
|
$
|
—
|
|
$
|
445
|
|
|||
|
Hedge fund
|
—
|
|
9,129
|
|
—
|
|
9,129
|
|
|||||||
|
Fixed income mutual funds
|
21,555
|
|
—
|
|
—
|
|
21,555
|
|
|||||||
|
Equity mutual fund
|
21,660
|
|
—
|
|
—
|
|
21,660
|
|
|||||||
|
Equity securities
|
23,529
|
|
—
|
|
—
|
|
23,529
|
|
|||||||
|
Equity private investment trusts
|
—
|
|
9,974
|
|
—
|
|
9,974
|
|
|||||||
|
Total assets measured at fair value
|
$
|
67,189
|
|
$
|
19,103
|
|
$
|
—
|
|
$
|
86,292
|
|
|||
|
December 31, 2014:
|
|||||||||||||||
|
Cash
|
$
|
715
|
|
$
|
—
|
|
$
|
—
|
|
$
|
715
|
|
|||
|
Hedge fund
|
—
|
|
9,249
|
|
—
|
|
9,249
|
|
|||||||
|
Fixed income mutual funds
|
22,040
|
|
—
|
|
—
|
|
22,040
|
|
|||||||
|
Equity mutual fund
|
23,220
|
|
—
|
|
—
|
|
23,220
|
|
|||||||
|
Equity securities
|
25,163
|
|
—
|
|
—
|
|
25,163
|
|
|||||||
|
Equity private investment trusts
|
—
|
|
9,933
|
|
—
|
|
9,933
|
|
|||||||
|
Total assets measured at fair value
|
$
|
71,138
|
|
$
|
19,182
|
|
$
|
—
|
|
$
|
90,320
|
|
|||
The Retirement Plan’s investments include the following:
|
•
|
two fixed income mutual funds, each of which seeks to generate income consistent with preservation of capital. One mutual fund invests in a portfolio of fixed income securities of U.S. and non-U.S. companies and U.S. and non-U.S. government securities and supranational entities, including lower-rated securities, while the second fund invests in a broad range of fixed income securities in both developed and emerging markets with a range of maturities from short- to long-duration;
|
102
|
•
|
separate equity and fixed income mutual funds, which seek to moderate the volatility of equity and fixed income oriented asset allocation over the long term, as part of an investor’s overall asset allocation managed by AB;
|
|
•
|
a multi-style, multi-cap integrated portfolio adding incremental U.S. equity diversification to its value and growth equity selections, designed to deliver a long-term premium to the S&P 500 with greater consistency across a range of market environments;
|
|
•
|
two equity private investment trusts, one of which invests primarily in equity securities of non-U.S. companies located in emerging market countries, and the other of which invests in equity securities of established non-U.S. companies located in the countries comprising the MSCI EAFE Index, plus Canada; and
|
|
•
|
a hedge fund that seeks to provide attractive risk-adjusted returns over full market cycles with less volatility than the broad equity markets by allocating all or substantially all of its assets among portfolio managers through portfolio funds that employ a broad range of investment strategies.
|
17. Long-term Incentive Compensation Plans
We maintain an unfunded, non-qualified incentive compensation program known as the AllianceBernstein Incentive Compensation Award Program (“
Incentive Compensation Program
”), under which annual awards may be granted to eligible employees.
See Note 2, "Summary of Significant Accounting Policies – Long-Term Incentive Compensation Plans"
for a discussion of the award provisions.
Under the Incentive Compensation Program, we made awards in 2015, 2014 and 2013 aggregating $178.8 million, $176.5 million and $157.7 million, respectively. The amounts charged to employee compensation and benefits for the years ended December 31, 2015, 2014 and 2013 were $171.7 million, $173.2 million and $162.3 million, respectively.
Effective as of July 1, 2010, we established the AllianceBernstein 2010 Long Term Incentive Plan, as amended (“
2010 Plan
”), which was adopted by AB Holding Unitholders at a special meeting of AB Holding Unitholders held on June 30, 2010. Since the 2010 Plan was adopted, the following forms of awards have been available for grant to employees and Eligible Directors: (i) restricted AB Holding Units or phantom restricted AB Holding Units (a “phantom” award is a contractual right to receive AB Holding Units at a later date or upon a specified event); (ii) options to buy AB Holding Units; and (iii) other AB Holding Unit-based awards (including, without limitation, AB Holding Unit appreciation rights and performance awards). The purpose of the 2010 Plan is to promote the interest of AB by: (i) attracting and retaining talented officers, employees and directors, (ii) motivating such officers, employees and directors by means of performance-related incentives to achieve longer-range business and operational goals, (iii) enabling such officers, employees and directors to participate in the long-term growth and financial success of AB, and (iv) aligning the interests of such officers, employees and directors with those of AB Holding Unitholders. The 2010 Plan will expire on June 30, 2020, and no awards under the 2010 Plan will be made after that date. Under the 2010 Plan, the aggregate number of AB Holding Units with respect to which awards may be granted is 60 million, including no more than 30 million newly-issued AB Holding Units.
The 2010 Plan was amended by the Board in May 2011, expanding the universe of persons eligible to receive awards under the 2010 Plan to include any member of the Board who is a former executive or former employee of an affiliate of AB Holding. For purposes of this amendment, “
affiliate
” includes any company or other entity that directly, or indirectly through one or more intermediaries, controls, is controlled by or is under common control with, AB.
The 2010 Plan was further amended by the Compensation Committee of the Board (“
Compensation Committee
”) in December 2011, clarifying that, where duly authorized by the Compensation Committee or the Board, continued vesting of awards after a Termination (as those terms are defined in the 2010 Plan or the applicable award agreement) in circumstances where such continued vesting is conditioned on compliance with (A) one or more restrictive covenants, and/or (B) a standard of conduct regarding appropriate consideration of risk set forth in the applicable award agreement, shall count towards satisfying the minimum vesting requirement set forth in Section 6(b)(i) of the 2010 Plan.
The 2010 Plan was further amended by the Board in May 2012, when the Board authorized management to reacquire on the open market or otherwise all 60 million AB Holding Units available for awards under the 2010 Plan (less one AB Holding Unit for every newly-issued AB Holding Unit already awarded under the 2010 Plan), while maintaining the 30 million AB Holding Unit limitation on newly-issued AB Holding Units available for awards under the 2010 Plan.
As of December 31, 2015, 302,443 options to buy AB Holding Units had been granted and 47,158,745 AB Holding Units, net of forfeitures, were subject to other AB Holding Unit awards made under the 2010 Plan or an equity compensation plan with similar terms that expired in 2010. AB Holding Unit-based awards (including options) in respect of 12,538,812 AB Holding Units were available for grant as of December 31, 2015.
103
Options granted to employees generally are exercisable at a rate of 20% of the AB Holding Units subject to such options on each of the first five anniversary dates of the date of grant; options granted to Eligible Directors generally are exercisable at a rate of 33.3% of the AB Holding Units subject to such options on each of the first three anniversary dates of the date of grant. Restricted AB Holding Units awarded to our CEO pursuant to his employment agreements (
as described below under “Restricted AB Holding Unit Awards”
) vest ratably over his employment terms. Restricted AB Holding Units awarded under the Incentive Compensation Program vest 25% on December 1
st
of the subsequent four years.
Option Awards
Options to buy AB Holding Units (including grants to Eligible Directors) were granted as follows: 29,056 options were granted during 2015, 25,106 options were granted during 2014 and 37,690 options were granted during 2013. The weighted average fair value of options to buy AB Holding Units granted during 2015, 2014 and 2013 was $4.13, $4.78 and $5.44, respectively, on the date of grant, determined using the Black-Scholes option valuation model with the following assumptions:
|
2015
|
2014
|
2013
|
|||||
|
Risk-free interest rate
|
1.5
|
%
|
1.5
|
%
|
0.8-1.7%
|
||
|
Expected cash distribution yield
|
7.1
|
%
|
8.4
|
%
|
8.0 - 8.3%
|
||
|
Historical volatility factor
|
32.1
|
%
|
48.9
|
%
|
49.7 - 49.8%
|
||
|
Expected term
|
6.0 years
|
|
6.0 years
|
|
6.0 years
|
||
Due to a lack of sufficient historical data, we have chosen to use the simplified method to calculate the expected term of options.
The activity in our option plan during 2015 is as follows:
|
Options to Buy
AB Holding
Units
|
Weighted
Average
Exercise
Price
Per Option
|
Weighted
Average
Remaining
Contractual
Term (Years)
|
Aggregate
Intrinsic
Value
|
|||||||||
|
Outstanding as of December 31, 2014
|
5,942,411
|
|
$
|
45.03
|
|
3.9
|
||||||
|
Granted
|
29,056
|
|
31.74
|
|
||||||||
|
Exercised
|
(541,073
|
)
|
17.06
|
|
||||||||
|
Forfeited
|
(23,121
|
)
|
83.95
|
|
||||||||
|
Expired
|
(8,802
|
)
|
45.45
|
|
||||||||
|
Outstanding as of December 31, 2015
|
5,398,471
|
|
47.59
|
|
2.9
|
$
|
—
|
|
||||
|
Exercisable as of December 31, 2015
|
4,736,653
|
|
43.04
|
|
2.9
|
—
|
|
|||||
|
Vested or expected to vest as of December 31, 2015
|
5,398,471
|
|
47.59
|
|
2.9
|
—
|
|
|||||
The aggregate intrinsic value as of December 31, 2015 of options outstanding, exercisable and expected to vest is negative, and is therefore presented as zero in the table above. The total intrinsic value of options exercised during 2015, 2014 and 2013 was $7.0 million, $9.1 million and $5.0 million, respectively.
Under the fair value method, compensation expense is measured at the grant date based on the estimated fair value of the options awarded (determined using the Black-Scholes option valuation model) and is recognized over the required service period. We recorded compensation expense (credit) relating to option grants of $0.1 million, $(0.3) million and $(3.8) million, respectively, for the years ended December 31, 2015, 2014 and 2013. As of December 31, 2015, there was no compensation cost related to unvested option grants not yet recognized in the consolidated statement of income.
104
Restricted AB Holding Unit Awards
In 2015, 2014 and 2013, the Board granted restricted AB Holding Unit awards to Eligible Directors. These AB Holding Units give the Eligible Directors, in most instances, all the rights of other AB Holding Unitholders subject to such restrictions on transfer as the Board may impose. We awarded 26,468, 31,320 and 28,693 restricted AB Holding Units, respectively, in 2015, 2014 and 2013 with grant date fair values per restricted AB Holding Unit of $31.74 in 2015, $22.99 in 2014 and $26.44 and $20.12 in 2013 (representing annual awards in May 2013 and special awards in September 2013 to two Eligible Directors who joined the Board in July 2013). All of the restricted AB Holding Units vest on the third anniversary of grant date or immediately if a director leaves the Board for any reason other than “cause”, as defined in the applicable award agreement. We fully expensed these awards on each grant date. We recorded compensation expense relating to these awards of $0.8 million, $0.7 million and $0.7 million, respectively, for the years ended December 31, 2015, 2014 and 2013.
In connection with the commencement of Mr. Kraus’s employment as our Chief Executive Officer (“
CEO
”) on December 19, 2008, he was granted 2.7 million restricted AB Holding Units with a grant date fair value per Unit of $19.20. Mr. Kraus’s restricted AB Holding Units vested ratably on each of the first five anniversaries of December 19, 2008, commencing December 19, 2009, subject to his continued employment by AB on the vesting dates. During June 2012, Mr. Kraus entered into an agreement (“
Kraus Employment Agreement
”) pursuant to which Mr. Kraus continues to serve as our CEO. The Kraus Employment Agreement commenced on January 3, 2014 and terminates on January 2, 2019 (“
Employment Term
”), unless it is terminated earlier in accordance with its terms. In connection with the signing of the Kraus Employment Agreement, Mr. Kraus was granted 2.7 million restricted AB Holding Units, vesting ratably over the Employment Term. Under US GAAP, the compensation expense for the AB Holding Unit award under the Kraus Employment Agreement of $33.1 million (based on the $12.17 grant date AB Holding Unit price) must be amortized on a straight-line basis over 6.5 years, beginning on the grant date. As a result, although Mr. Kraus did not receive any incremental cash compensation or cash distributions related to the restricted AB Holding Unit award pursuant to the Kraus Employment Agreement prior to the commencement of the Employment Term, we incurred $2.5 million of incremental compensation expense during the second half of 2012 and $5.1 million of such expense during 2013. We recorded compensation expense relating to the CEO restricted AB Holding Unit grants of $5.1 million, $5.1 million and $15.5 million, respectively, for the years ended December 31, 2015, 2014 and 2013.
In 1993, we established the Century Club Plan, under which employees of AB whose primary responsibilities are to assist in the distribution of company-sponsored mutual funds and who meet certain sales targets, are eligible to receive an award of restricted AB Holding Units. Awards granted prior to December 2010 vested ratably over three years and subsequent awards vest ratably over four years. The service requirement for Century Club participants was affected in the same manner as other long-term incentive compensation awards by the amendment to the employee long-term incentive compensation award program in December 2011. The 2014 awards were deferred until 2015. We awarded 38,000 AB Holding Units in 2015 and 55,000 AB Holding Units in 2013. The grant date fair values per AB Holding Unit of these awards were $23.02 in 2015 and $21.67 in 2013. We recorded compensation expense (credit) relating to the Century Club Plan grants of $0.8 million, $(0.1) million and $1.1 million, respectively, for the years ended December 31, 2015, 2014 and 2013. Management has decided not to grant new awards under the Century Club Plan after December 2015.
Since 2009, we have awarded restricted AB Holding Units under the Incentive Compensation Program. We awarded 7.2 million restricted AB Holding Units in 2015 (which included 7.0 million restricted AB Holding Units in December for the 2015 year-end awards and 0.2 million additional restricted AB Holding Units granted during the year relating to the 2014 year-end awards), 6.8 million restricted AB Holding Units in 2014 (which included 6.6 million restricted AB Holding Units in December for the 2014 year-end awards and 0.2 million additional restricted AB Holding Units granted during the year relating to the 2013 year-end awards) and 13.2 million restricted AB Holding Units in 2013 (which included 6.5 million restricted AB Holding Units granted in January 2013 for 2012 year-end awards, 0.2 million additional restricted AB Holding Units granted in the second quarter of 2013 relating to the 2012 year-end awards and 6.5 million restricted AB Holding Units in December 2013 for the 2013 year-end awards) with grant date fair values per restricted AB Holding Unit of $23.02 and $24.24 in 2015, $21.67 and $24.24 in 2014 and ranging between $19.80 and $25.30 in 2013.
We also award restricted AB Holding Units in connection with certain employment and separation agreements with vesting schedules ranging between two and five years. The fair value of the restricted AB Holding Units is amortized over the required service period as employee compensation expense. We awarded 0.2 million, 0.7 million and 0.6 million restricted AB Holding Units in 2015, 2014 and 2013, respectively, with grant date fair values per restricted AB Holding Unit ranging between $25.36 and $32.71 in 2015, $21.07 and $27.40 in 2014 and $12.13 and $24.15 in 2013. We recorded compensation expense relating to restricted AB Holding Unit grants in connection with certain employment and separation agreements of $9.9 million, $13.2 million and $19.0 million, respectively, for the years ended December 31, 2015, 2014 and 2013.
105
Changes in unvested restricted AB Holding Units during 2015 are as follows:
|
AB Holding
Units
|
Weighted Average
Grant Date Fair
Value per AB Holding
Unit
|
|||||
|
Unvested as of December 31, 2014
|
20,661,359
|
|
$
|
20.63
|
|
|
|
Granted
|
7,428,103
|
|
23.26
|
|
||
|
Vested
|
(8,010,453
|
)
|
19.52
|
|
||
|
Forfeited
|
(299,195
|
)
|
21.48
|
|
||
|
Unvested as of December 31, 2015
|
19,779,814
|
|
22.05
|
|
||
The total grant date fair value of restricted AB Holding Units that vested during 2015, 2014 and 2013 was $156.4 million, $170.9 million and $197.3 million, respectively. As of December 31, 2015, the 19,779,814 unvested restricted AB Holding Units consist of 16,976,688 restricted AB Holding Units that do not have a service requirement and have been fully expensed on the grant date and 2,803,126 restricted AB Holding Units that have a service requirement and will be expensed over the required service period. As of December 31, 2015, there was $35.6 million of compensation expense related to unvested restricted AB Holding Unit awards granted and not yet recognized in the consolidated statement of income. We expect to recognize the expense over a weighted average period of 3.2 years.
18. Units Outstanding
Changes in AB Units outstanding for the years ended December 31, 2015 and 2014 were as follows:
|
2015
|
2014
|
||||
|
Outstanding as of January 1,
|
273,040,452
|
|
268,373,419
|
|
|
|
Options exercised
|
541,073
|
|
1,110,070
|
|
|
|
Units issued
|
4,600,583
|
|
4,193,445
|
|
|
|
Units retired
|
(5,880,281
|
)
|
(636,482
|
)
|
|
|
Outstanding as of December 31,
|
272,301,827
|
|
273,040,452
|
|
|
During 2015 and 2014, we purchased 26,111 and 61,472 AB Units, respectively, in private transactions and retired them.
19. Income Taxes
AB is a private partnership for federal income tax purposes and, accordingly, is not subject to federal or state corporate income taxes. However, AB is subject to a 4.0% New York City unincorporated business tax (“
UBT
”). Domestic corporate subsidiaries of AB, which are subject to federal, state and local income taxes, generally are included in the filing of a consolidated federal income tax return with separate state and local income tax returns being filed. Foreign corporate subsidiaries are generally subject to taxes in the jurisdictions where they are located.
In order to preserve AB’s status as a private partnership for federal income tax purposes, AB Units must not be considered publicly traded. The AB Partnership Agreement provides that all transfers of AB Units must be approved by AXA Equitable Life Insurance Company (a subsidiary of AXA, “
AXA Equitable
”) and the General Partner; AXA Equitable and the General Partner approve only those transfers permitted pursuant to one or more of the safe harbors contained in relevant treasury regulations. If AB Units were considered readily tradable, AB’s net income would be subject to federal and state corporate income tax, significantly reducing its quarterly distribution to AB Holding. Furthermore, should AB enter into a substantial new line of business, AB Holding, by virtue of its ownership of AB, would lose its status as a “grandfathered” publicly-traded partnership and would become subject to corporate income tax, which would reduce materially AB Holding’s net income and its quarterly distributions to AB Holding Unitholders.
106
Earnings before income taxes and income tax expense consist of:
|
Years Ended December 31,
|
|||||||||||
|
2015
|
2014
|
2013
|
|||||||||
|
(in thousands)
|
|||||||||||
|
Earnings before income taxes:
|
|||||||||||
|
United States
|
$
|
520,282
|
|
$
|
493,311
|
|
$
|
471,813
|
|
||
|
Foreign
|
110,817
|
|
115,310
|
|
92,438
|
|
|||||
|
Total
|
$
|
631,099
|
|
$
|
608,621
|
|
$
|
564,251
|
|
||
|
Income tax expense:
|
|||||||||||
|
Partnership UBT
|
$
|
6,855
|
|
$
|
9,356
|
|
$
|
4,403
|
|
||
|
Corporate subsidiaries:
|
|||||||||||
|
Federal
|
2,576
|
|
6,321
|
|
7,032
|
|
|||||
|
State and local
|
539
|
|
1,326
|
|
2,318
|
|
|||||
|
Foreign
|
26,822
|
|
31,625
|
|
26,139
|
|
|||||
|
Current tax expense
|
36,792
|
|
48,628
|
|
39,892
|
|
|||||
|
Deferred tax (benefit)
|
1,330
|
|
(10,846
|
)
|
(3,063
|
)
|
|||||
|
Income tax expense
|
$
|
38,122
|
|
$
|
37,782
|
|
$
|
36,829
|
|
||
The principal reasons for the difference between the effective tax rates and the UBT statutory tax rate of 4.0% are as follows:
|
Years Ended December 31,
|
||||||||||||||||||||
|
2015
|
2014
|
2013
|
||||||||||||||||||
|
(in thousands)
|
||||||||||||||||||||
|
UBT statutory rate
|
$
|
25,244
|
|
4.0
|
%
|
$
|
24,345
|
|
4.0
|
%
|
$
|
22,570
|
|
4.0
|
%
|
|||||
|
Corporate subsidiaries’ federal, state, local and foreign income taxes
|
25,720
|
|
4.1
|
|
24,516
|
|
4.0
|
|
27,766
|
|
4.9
|
|
||||||||
|
Effect of ASC 740 adjustments, miscellaneous taxes, and other
|
2,643
|
|
0.4
|
|
2,586
|
|
0.4
|
|
(687
|
)
|
(0.1
|
)
|
||||||||
|
Income not taxable resulting from use of UBT business apportionment factors
|
(15,485
|
)
|
(2.5
|
)
|
(13,665
|
)
|
(2.2
|
)
|
(12,820
|
)
|
(2.3
|
)
|
||||||||
|
Income tax expense and effective tax rate
|
$
|
38,122
|
|
6.0
|
|
$
|
37,782
|
|
6.2
|
|
$
|
36,829
|
|
6.5
|
|
|||||
We recognize the effects of a tax position in the financial statements only if, as of the reporting date, it is “more likely than not” to be sustained based solely on its technical merits. In making this assessment, we assume that the taxing authority will examine the tax position and have full knowledge of all relevant information.
A reconciliation of the beginning and ending amount of unrecognized tax benefits is as follows:
|
Years Ended December 31,
|
|||||||||||
|
2015
|
2014
|
2013
|
|||||||||
|
(in thousands)
|
|||||||||||
|
Balance as of beginning of period
|
$
|
11,311
|
|
$
|
2,975
|
|
$
|
3,672
|
|
||
|
Additions for prior year tax positions
|
—
|
|
2,838
|
|
—
|
|
|||||
|
Reductions for prior year tax positions
|
—
|
|
—
|
|
(580
|
)
|
|||||
|
Additions for current year tax positions
|
693
|
|
5,498
|
|
706
|
|
|||||
|
Reductions for current year tax positions
|
—
|
|
—
|
|
—
|
|
|||||
|
Reductions related to closed years/settlements with tax authorities
|
—
|
|
—
|
|
(823
|
)
|
|||||
|
Balance as of end of period
|
$
|
12,004
|
|
$
|
11,311
|
|
$
|
2,975
|
|
||
The amount of unrecognized tax benefits as of December 31, 2015, 2014 and 2013, when recognized, is recorded as a reduction to income tax expense and reduces the company’s effective tax rate.
107
Interest and penalties, if any, relating to tax positions are recorded in income tax expense on the consolidated statements of income. The total amount of interest expense (credit) recorded in income tax expense during 2015, 2014 and 2013 was $0.4 million, $0.4 million and $0.1 million, respectively. The total amount of accrued interest payable recorded on the consolidated statements of financial condition as of December 31, 2015, 2014 and 2013 were $1.0 million, $0.6 million and $0.2 million, respectively. There were no accrued penalties as of December 31, 2015, 2014 or 2013.
Generally, the company is no longer subject to U.S. federal, state or local income tax examinations by tax authorities for any year prior to 2012, except as set forth below.
During the third quarter of 2014, the City of New York notified us of an examination of AB’s UBT returns for the years 2010 and 2011. The examination is ongoing.
Currently, there are no income tax examinations at our significant non-U.S. subsidiaries. Years that remain open and may be subject to examination vary under local law, and range from one to seven years.
At December 31, 2015, it is reasonably possible that $5.5 million of our unrecognized tax benefits will change within the next twelve months due to completion of tax authority exams.
Deferred income taxes reflect the net tax effect of temporary differences between the carrying amounts of assets and liabilities for financial reporting purposes and the amounts used for income tax purposes. The tax effect of significant items comprising the net deferred tax asset (liability) is as follows:
|
December 31,
|
|||||||
|
2015
|
2014
|
||||||
|
(in thousands)
|
|||||||
|
Deferred tax asset:
|
|||||||
|
Differences between book and tax basis:
|
|||||||
|
Benefits from net operating loss carryforwards
|
$
|
18,887
|
|
$
|
23,539
|
|
|
|
Long-term incentive compensation plans
|
17,092
|
|
18,694
|
|
|||
|
Other, primarily accrued expenses deductible when paid
|
18,490
|
|
19,737
|
|
|||
|
54,469
|
|
61,970
|
|
||||
|
Less: valuation allowance
|
(13,709
|
)
|
(13,927
|
)
|
|||
|
Deferred tax asset
|
40,760
|
|
48,043
|
|
|||
|
Deferred tax liability:
|
|
|
|
|
|||
|
Differences between book and tax basis:
|
|
|
|
|
|||
|
Intangible assets
|
6,520
|
|
6,874
|
|
|||
|
Investment in foreign subsidiaries
|
8,220
|
|
8,725
|
|
|||
|
Other
|
766
|
|
1,900
|
|
|||
|
Deferred tax liability
|
15,506
|
|
17,499
|
|
|||
|
Net deferred tax asset
|
$
|
25,254
|
|
$
|
30,544
|
|
|
Valuation allowances of $13.7 million and $13.9 million were established as of December 31, 2015 and 2014, respectively, primarily due to the uncertainty of realizing certain net operating loss (“
NOL
”) carryforwards given the future losses expected to be incurred by the applicable subsidiaries. We had NOL carryforwards at December 31, 2015 of approximately $80.9 million in certain foreign locations with an indefinite expiration period and $135.7 million in certain domestic locations with expiration periods between 15 and 20 years. As of December 31, 2014, we had NOL carryforwards of approximately $86.9 million in certain foreign locations with an indefinite expiration period and $135.7 million in certain domestic locations with expiration periods between 15 and 20 years.
The deferred tax asset is included in other assets. Management has determined that realization of the net deferred tax asset is more likely than not based on anticipated future taxable income.
We provide income taxes on the undistributed earnings of non-U.S. corporate subsidiaries except to the extent that such earnings are permanently invested outside the United States. As of December 31, 2015, $892.0 million of accumulated undistributed earnings of non-U.S. corporate subsidiaries were permanently invested outside the U.S. At existing applicable income tax rates, additional taxes of approximately $74.8 million, net of foreign tax credits, would need to be provided if such earnings were remitted.
108
20. Business Segment Information
Management has assessed the requirements of ASC 280,
Segment Reporting
, and determined that, because we utilize a consolidated approach to assess performance and allocate resources, we have only one operating segment. Enterprise-wide disclosures as of and for the years ended December 31, 2015, 2014 and 2013, were as follows:
Services
Net revenues derived from our investment management, research and related services were as follows:
|
Years Ended December 31,
|
|||||||||||
|
2015
|
2014
|
2013
|
|||||||||
|
(in thousands)
|
|||||||||||
|
Institutions
|
$
|
435,205
|
|
$
|
434,081
|
|
$
|
438,946
|
|
||
|
Retail
|
1,362,541
|
|
1,397,135
|
|
1,376,370
|
|
|||||
|
Private Wealth Management
|
689,853
|
|
664,324
|
|
591,358
|
|
|||||
|
Bernstein Research Services
|
493,463
|
|
482,538
|
|
445,083
|
|
|||||
|
Other
|
42,986
|
|
29,714
|
|
66,214
|
|
|||||
|
Total revenues
|
3,024,048
|
|
3,007,792
|
|
2,917,971
|
|
|||||
|
Less: Interest expense
|
3,321
|
|
2,426
|
|
2,924
|
|
|||||
|
Net revenues
|
$
|
3,020,727
|
|
$
|
3,005,366
|
|
$
|
2,915,047
|
|
||
Our AllianceBernstein Global High Yield Portfolio, an open-end fund incorporated in Luxembourg (ACATEUH: LX), generated approximately 11%, 12% and 14% of our investment advisory and service fees and 12%, 13% and 14% of our net revenues during 2015, 2014 and 2013, respectively.
Geographic Information
Net revenues and long-lived assets, related to our U.S. and international operations, as of and for the years ended December 31, were as follows:
|
2015
|
2014
|
2013
|
|||||||||
|
(in thousands)
|
|||||||||||
|
Net revenues:
|
|||||||||||
|
United States
|
$
|
1,829,518
|
|
$
|
1,779,422
|
|
$
|
1,722,640
|
|
||
|
International
|
1,191,209
|
|
1,225,944
|
|
1,192,407
|
|
|||||
|
Total
|
$
|
3,020,727
|
|
$
|
3,005,366
|
|
$
|
2,915,047
|
|
||
|
Long-lived assets:
|
|
|
|
|
|
|
|||||
|
United States
|
$
|
3,410,491
|
|
$
|
3,454,301
|
|
|
|
|||
|
International
|
39,456
|
|
41,159
|
|
|
|
|||||
|
Total
|
$
|
3,449,947
|
|
$
|
3,495,460
|
|
|
|
|||
Major Customers
Company-sponsored mutual funds are distributed to individual investors through broker-dealers, insurance sales representatives, banks, registered investment advisers, financial planners and other financial intermediaries. Certain subsidiaries of AXA, including AXA Advisors, LLC, have entered into selected dealer agreements with AllianceBernstein Investments and have been responsible for 4%, 3% and 2% of our open-end mutual fund sales in 2015, 2014 and 2013, respectively. UBS AG was responsible for approximately 8%, 11% and 12% of our open-end mutual fund sales in 2015, 2014 and 2013, respectively. Neither AXA nor UBS AG is under any obligation to sell a specific amount of AB Fund shares and each also sells shares of mutual funds that it sponsors and that are sponsored by unaffiliated organizations.
AXA and the general and separate accounts of AXA Equitable (including investments by the separate accounts of AXA Equitable in the funding vehicle EQ Advisors Trust) accounted for approximately 5% of our total revenues for each of the years ended December 31, 2015, 2014 and 2013. No single institutional client other than AXA and its subsidiaries accounted for more than 1% of our total revenues for the years ended December 31, 2015, 2014 and 2013.
109
21. Related Party Transactions
Mutual Funds
We provide investment management, distribution, shareholder, administrative and brokerage services to individual investors by means of retail mutual funds sponsored by our company, our subsidiaries and our affiliated joint venture companies. We provide substantially all of these services under contracts that specify the services to be provided and the fees to be charged. The contracts are subject to annual review and approval by each mutual fund’s board of directors or trustees and, in certain circumstances, by the mutual fund’s shareholders. Revenues for services provided or related to the mutual funds are as follows:
|
Years Ended December 31,
|
|||||||||||
|
2015
|
2014
|
2013
|
|||||||||
|
(in thousands)
|
|||||||||||
|
Investment advisory and services fees
|
$
|
1,056,227
|
|
$
|
1,061,677
|
|
$
|
1,009,901
|
|
||
|
Distribution revenues
|
415,380
|
|
433,063
|
|
455,327
|
|
|||||
|
Shareholder servicing fees
|
85,207
|
|
91,020
|
|
90,718
|
|
|||||
|
Other revenues
|
4,939
|
|
6,694
|
|
5,682
|
|
|||||
|
Bernstein Research Services
|
4
|
|
13
|
|
113
|
|
|||||
Also, we have receivables from AB mutual funds recorded in our consolidated statements of financial condition of $160.7 million and $174.1 million as of December 31, 2015 and 2014, respectively.
AXA and its Subsidiaries
We provide investment management and certain administration services to AXA and its subsidiaries. In addition, AXA and its subsidiaries distribute company-sponsored mutual funds, for which they receive commissions and distribution payments. Sales of company-sponsored mutual funds through AXA and its subsidiaries aggregated approximately $1.1 billion, $1.1 billion and $0.7 billion for the years ended December 31, 2015, 2014 and 2013, respectively. Also, we are covered by various insurance policies maintained by AXA and its subsidiaries and we pay fees for technology and other services provided by AXA and its subsidiaries. Aggregate amounts included in the consolidated financial statements for transactions with AXA and its subsidiaries, as of and for the years ended December 31, are as follows:
|
2015
|
2014
|
2013
|
|||||||||
|
(in thousands)
|
|||||||||||
|
Revenues:
|
|||||||||||
|
Investment advisory and services fees
|
$
|
149,035
|
|
$
|
131,317
|
|
$
|
129,937
|
|
||
|
Bernstein Research Services
|
694
|
|
958
|
|
1,152
|
|
|||||
|
Distribution revenues
|
11,541
|
|
11,590
|
|
9,823
|
|
|||||
|
Other revenues
|
887
|
|
1,041
|
|
815
|
|
|||||
|
$
|
162,157
|
|
$
|
144,906
|
|
$
|
141,727
|
|
|||
|
Expenses:
|
|
|
|
|
|
|
|||||
|
Commissions and distribution payments to financial intermediaries
|
$
|
16,140
|
|
$
|
16,255
|
|
$
|
13,338
|
|
||
|
General and administrative
|
17,680
|
|
20,176
|
|
18,311
|
|
|||||
|
Other
|
1,483
|
|
1,457
|
|
1,425
|
|
|||||
|
$
|
35,303
|
|
$
|
37,888
|
|
$
|
33,074
|
|
|||
|
Balance Sheet:
|
|
|
|
|
|||||||
|
Institutional investment advisory and services fees receivable
|
$
|
12,622
|
|
$
|
9,681
|
|
|||||
|
Prepaid expenses
|
1,431
|
|
1,483
|
|
|||||||
|
Other due to AXA and its subsidiaries
|
(6,231
|
)
|
(5,510
|
)
|
|||||||
|
$
|
7,822
|
|
$
|
5,654
|
|
||||||
AllianceBernstein Venture Fund I, L.P. was launched during 2006. It seeks to achieve its investment objective, which is long-term capital appreciation through equity and equity-related investments, by acquiring early-stage growth companies in private
110
transactions. One of our subsidiaries is the general partner of the fund and, as a result, the fund is included in our consolidated financial statements, with approximately $23.9 million and $32.6 million of investments in the consolidated statements of financial condition as of December 31, 2015 and 2014, respectively. AXA Equitable holds a 10% limited partnership interest in this fund.
We maintain an unfunded, non-qualified long-term incentive compensation plan known as the Capital Accumulation Plan and also have assumed obligations under contractual unfunded long-term incentive compensation arrangements covering certain former executives (“
Contractual Arrangements
”). The Capital Accumulation Plan was frozen on December 31, 1987, since which date no additional awards have been made. The Board may terminate the Capital Accumulation Plan at any time without cause, in which case our liability would be limited to benefits that have vested. Payment of vested benefits under both the Capital Accumulation Plan and the Contractual Arrangements generally will be made over a ten-year period commencing at retirement age. The General Partner is obligated to make capital contributions to AB in amounts equal to benefits paid under the Capital Accumulation Plan and the Contractual Arrangements. Amounts paid by the General Partner to AB for the Capital Accumulation Plan and the Contractual Arrangements for the years ended December 31, 2015, 2014 and 2013 were $1.6 million, $2.3 million and $3.4 million, respectively.
Other Related Parties
The consolidated statements of financial condition include a net receivable from AB Holding as a result of cash transactions for fees and expense reimbursements. The net receivable balance included in the consolidated statements of financial condition as of December 31, 2015 and 2014 was $12.1 million and $12.6 million, respectively.
22. Acquisitions
Acquisitions are accounted for under ASC 805,
Business Combinations
.
On June 20, 2014, we acquired an 81.7% ownership interest in CPH Capital Fondsmaeglerselskab A/S (“
CPH
”), a Danish asset management firm that managed approximately $3 billion in global core equity assets for institutional investors, for a cash payment of $64.4 million and a contingent consideration payable of $9.4 million. The excess of the purchase price over the fair value of identifiable assets acquired resulted in the recognition of $58.1 million of goodwill. We recorded $24.1 million of definite-lived intangible assets relating to separately-managed account relationships and $3.5 million of indefinite-lived intangible assets relating to an acquired fund’s investment contract. We also recorded redeemable non-controlling interests of $16.5 million relating to the fair value of the portion of CPH we do not own. During 2015, we purchased additional shares of CPH, bringing our ownership interest to 85.4% as of December 31, 2015.
On December 12, 2013, we acquired W.P. Stewart & Co., Ltd. (“
WPS
”), an equity investment manager that managed approximately $2.1 billion in U.S., Global and EAFE concentrated growth equity strategies for its clients, primarily in the U.S. and Europe. On the acquisition date, we made a cash payment of $12 per share for the approximate 4.9 million WPS shares outstanding and issued to WPS shareholders transferable contingent value rights (“
CVRs
”), entitling the holders to an additional $4 per share if the assets under management in the acquired WPS investment services exceed $5 billion on or before the third anniversary of the acquisition date. The excess of the purchase price over the fair value of identifiable assets acquired resulted in the recognition of $32.4 million of goodwill. We also recorded $7.5 million of indefinite-lived intangible assets relating to the acquired fund’s investment contracts and $14.0 million of definite-lived intangible assets relating to separately-managed account relationships. As of the acquisition date, we recorded a contingent consideration payable of $17.1 million in regard to the CVRs.
The 2014 and 2013 acquisitions have not had a significant impact on 2015 or 2014 revenues and earnings. As a result, we have not provided supplemental pro forma information.
23. Subsequent Event
On February 3, 2016, Cisco Systems, Inc. announced its agreement to acquire Jasper Technologies, Inc. (“
Jasper
”), a company in which we own a 7.6% equity interest. Jasper management has informed us that, based on this interest, we should expect to receive approximately $85 million in cash, subject to final transaction costs and working capital adjustments. We expect to receive approximately $77 million at the close of the transaction and the remaining $8 million after this amount is retained in escrow for 18 months. We anticipate that this transaction, which is subject to customary closing conditions, will close during the third quarter of 2016. As of December 31, 2015, our investment in Jasper is recorded on our consolidated statement of financial condition (under the cost basis of accounting) at $10.2 million.
111
24. Quarterly Financial Data (Unaudited)
|
Quarters Ended 2015
|
|||||||||||||||
|
December 31
|
September 30
|
June 30
|
March 31
|
||||||||||||
|
(in thousands, except per unit amounts)
|
|||||||||||||||
|
Net revenues
|
$
|
726,726
|
|
$
|
738,693
|
|
$
|
792,737
|
|
$
|
762,571
|
|
|||
|
Net income attributable to AB Unitholders
|
$
|
161,063
|
|
$
|
134,976
|
|
$
|
149,094
|
|
$
|
141,469
|
|
|||
|
Basic net income per AB Unit
(1)
|
$
|
0.59
|
|
$
|
0.49
|
|
$
|
0.54
|
|
$
|
0.51
|
|
|||
|
Diluted net income per AB Unit
(1)
|
$
|
0.59
|
|
$
|
0.49
|
|
$
|
0.54
|
|
$
|
0.51
|
|
|||
|
Cash distributions per AB Unit
(2)(3)
|
$
|
0.56
|
|
$
|
0.50
|
|
$
|
0.54
|
|
$
|
0.51
|
|
|||
|
Quarters Ended 2014
|
|||||||||||||||
|
December 31
|
September 30
|
June 30
|
March 31
|
||||||||||||
|
(in thousands, except per unit amounts)
|
|||||||||||||||
|
Net revenues
|
$
|
787,352
|
|
$
|
749,748
|
|
$
|
753,648
|
|
$
|
714,618
|
|
|||
|
Net income attributable to AB Unitholders
|
$
|
177,425
|
|
$
|
139,798
|
|
$
|
136,435
|
|
$
|
116,725
|
|
|||
|
Basic net income per AB Unit
(1)
|
$
|
0.65
|
|
$
|
0.51
|
|
$
|
0.50
|
|
$
|
0.43
|
|
|||
|
Diluted net income per AB Unit
(1)
|
$
|
0.65
|
|
$
|
0.51
|
|
$
|
0.50
|
|
$
|
0.43
|
|
|||
|
Cash distributions per AB Unit
(2)(3)
|
$
|
0.63
|
|
$
|
0.51
|
|
$
|
0.50
|
|
$
|
0.44
|
|
|||
|
(1)
|
Basic and diluted net income per unit are computed independently for each of the periods presented. Accordingly, the sum of the quarterly net income per unit amounts may not agree to the total for the year.
|
|
(2)
|
Declared and paid during the following quarter.
|
|
(3)
|
Cash distributions reflect the impact of our non-GAAP adjustments.
|
112
Neither AB nor AB Holding had any changes in or disagreements with accountants in respect of accounting or financial disclosure.
Disclosure Controls and Procedures
Each of AB Holding and AB maintains a system of disclosure controls and procedures that is designed to ensure that information required to be disclosed in our reports under the Exchange Act is (i) recorded, processed, summarized and reported in a timely manner, and (ii) accumulated and communicated to management, including the Chief Executive Officer (“
CEO
”) and the Chief Financial Officer (“
CFO
”), to permit timely decisions regarding our disclosure.
As of the end of the period covered by this report, management carried out an evaluation, under the supervision and with the participation of the CEO and the CFO, of the effectiveness of the design and operation of disclosure controls and procedures. Based on this evaluation, the CEO and the CFO concluded that the disclosure controls and procedures are effective.
Management’s Report on Internal Control Over Financial Reporting
Management acknowledges its responsibility for establishing and maintaining adequate internal control over financial reporting for each of AB Holding and AB.
Internal control over financial reporting is a process designed by, or under the supervision of, a company’s CEO and CFO, to provide reasonable assurance regarding the reliability of financial reporting and the preparation of financial statements for external purposes in accordance with accounting principles generally accepted in the United States of America (“
US
GAAP
”) and includes those policies and procedures that:
|
•
|
Pertain to the maintenance of records that, in reasonable detail, accurately and fairly reflect the transactions and dispositions of the assets of the company;
|
|
•
|
Provide reasonable assurance that transactions are recorded as necessary to permit preparation of financial statements in accordance with US GAAP and receipts and expenditures of the company are being made only in accordance with authorizations of management and directors of the company; and
|
|
•
|
Provide reasonable assurance regarding prevention or timely detection of unauthorized acquisition, use or disposition of the company’s assets that could have a material effect on the financial statements.
|
All internal control systems, no matter how well designed, have inherent limitations. Therefore, even those internal control systems determined to be effective can provide only reasonable assurance with respect to the reliability of financial statement preparation and presentation. Because of these inherent limitations, internal control over financial reporting may not prevent or detect misstatements. Projections of any evaluation of effectiveness of internal control to future periods are subject to the risk that controls may become inadequate because of changes in conditions, or that the degree of compliance with the policies or procedures may deteriorate.
Management assessed the effectiveness of AB Holding’s and AB’s internal control over financial reporting as of
December 31, 2015
. In making its assessment, management used the criteria set forth by the Committee of Sponsoring Organizations of the Treadway Commission in
Internal Control-Integrated Framework
(2013)
(“
COSO criteria
”).
Based on its assessment, management concluded that, as of
December 31, 2015
, each of AB Holding and AB maintained effective internal control over financial reporting based on the COSO criteria.
PricewaterhouseCoopers LLP, the independent registered public accounting firm that audited the
2015
financial statements included in this Form 10-K, has issued an attestation report on the effectiveness of each of AB Holding’s and AB’s internal control over financial reporting as of
December 31, 2015
. These reports can be found
in Item 8
.
113
Changes in Internal Control Over Financial Reporting
No changes in our internal control over financial reporting occurred during the fourth quarter of
2015
that materially affected, or are reasonably likely to materially affect, our internal control over financial reporting.
114
Both AB and AB Holding reported all information required to be disclosed on Form 8-K during the fourth quarter of
2015
.
115
We use “
Internet Site
” in Items 10 and 11 to refer to our company’s internet site,
www.abglobal.com
.
To contact our company’s Corporate Secretary, you may send an email to
corporate_secretary@abglobal.com
or write to Corporate Secretary, AllianceBernstein L.P., 1345 Avenue of the Americas, New York, New York 10105.
General Partner
The Partnerships’ activities are managed and controlled by the General Partner. The Board of the General Partner acts as the Board of each of the Partnerships. Neither AB Unitholders nor AB Holding Unitholders have any rights to manage or control the Partnerships or to elect directors of the General Partner. The General Partner is a subsidiary of AXA.
The General Partner does not receive any compensation from the Partnerships for services rendered to them as their general partner. The General Partner holds a 1% general partnership interest in AB and 100,000 units of general partnership interest in AB Holding. Each general partnership unit in AB Holding is entitled to receive distributions equal to those received by each AB Holding Unit.
The General Partner is entitled to reimbursement by AB for any expenses it incurs in carrying out its activities as general partner of the Partnerships, including compensation paid by the General Partner to its directors and officers (to the extent such persons are not compensated directly by AB).
Board of Directors
Our Board currently consists of 12 members, including our CEO, three senior executives of AXA and certain of its subsidiaries, and eight independent directors. While we do not have a formal, written diversity policy in place, we believe that an effective board consists of a diverse group of individuals who collectively possess a variety of complementary skills and perspectives and who will work together to provide a board with the needed leadership and experience to successfully guide our company. As set forth in its charter, the Corporate Governance Committee of the Board (“
Governance Committee
”) assists the Board in identifying and evaluating such candidates, determining Board composition, developing and monitoring a process to assess Board effectiveness, developing and implementing corporate governance guidelines, and reviewing programs relating to matters of corporate responsibility.
As we indicate below
, our directors have a combined wealth of leadership experience derived from extensive service leading large, complex organizations in their roles as either senior executives or board members and in government. Each has the integrity, business judgment, collegiality and commitment that are among the essential characteristics for a member of our Board. Collectively, they have substantive knowledge and skills applicable to our business, including expertise in areas such as regulation; public accounting and financial reporting; finance; risk management; business development; operations; technology; strategic planning; management development, succession planning and compensation; corporate governance; public policy; and international matters.
As of
February 11, 2016
, our directors are as follows:
Peter S. Kraus
Mr. Kraus, age 63, was elected Chairman of the Board and CEO in December 2008. Mr. Kraus has in-depth experience in financial services, including investment banking, asset management and private wealth management. From September 2008 through December 2008, he served as an executive vice president, the head of global strategy and a member of the Management Committee of Merrill Lynch & Company Inc. (“
Merrill Lynch
”). Prior to joining Merrill Lynch, Mr. Kraus spent 22 years with Goldman Sachs Group Inc. (“
Goldman Sachs
”), where he most recently served as co-head of the Investment Management Division and a member of the Management Committee, as well as head of firm-wide strategy and chairman of the Strategy Committee. Mr. Kraus also served as a co-head of the Financial Institutions Group. He was named a partner at Goldman Sachs in 1994 and managing director in 1996.
In April 2010, Mr. Kraus was appointed a member of the Management Committee of AXA, which was formed by Henri de Castries, Chairman of the Board and Chief Executive Officer of AXA, in April 2010 to assist him with the operational management of AXA. He has been a Director of AXA Financial, AXA Equitable and MONY Life Insurance Company of America (a subsidiary of AXA Financial, “
MLOA
”) since February 2009. He is not compensated for serving in these roles for
116
AXA and its subsidiaries. Mr. Kraus is also Chairman of the Investment Committee of Trinity College, Chairman of the Board of Overseers of the California Institute of the Arts, Co-Chair of the Friends of Carnegie International, a member of the Board of Directors of Lincoln Center for the Performing Arts and the Chairman of Lincoln Center’s Art Committee, a member of the Board of Camp Keewaydin, and a member of the Board of Young Audiences, Inc., a non-profit organization that works with educational systems, the arts community and private and public sectors to provide arts education to children.
Mr. Kraus brings to the Board extensive knowledge of our industry and in-depth experience in financial services, including experience as our CEO for the past seven years and, previously, as co-head of the Investment Management Division and head of firm-wide strategy at Goldman Sachs.
Christopher M. Condron
Mr. Condron, age 68, was elected a Director of the General Partner in May 2001. Effective January 1, 2011, he retired as Director, CEO and President of AXA Financial, a post he had held since May 2001. Prior to retiring, he was also Chairman of the Board, CEO and President of AXA Equitable and a member of the Management Committee of AXA. During 2010, he assumed the additional responsibility of overseeing AXA’s Global Life & Savings and Health businesses. Prior to joining AXA Financial, Mr. Condron served as both President and Chief Operating Officer ("
COO
") of Mellon Financial Corporation (“
Mellon
”), from 1999, and as Chairman and CEO of The Dreyfus Corporation, a subsidiary of Mellon, from 1995. Mr. Condron sits on the board of directors and the executive committee, and serves as chairman of the compensation committee, of The American Ireland Fund.
Mr. Condron brings to the Board extensive financial services, insurance and sales experience obtained throughout his career.
Denis Duverne
Mr. Duverne, age 62, was elected a Director of the General Partner in February 1996. In April 2010, he was appointed Deputy CEO of AXA and a member of the Board of Directors of AXA. In January 2010, he was selected to oversee AXA Group strategy, finance and operations with AXA’s COO, CFO and Chief Risk Officer reporting to him. Mr. Duverne was a member of the AXA Management Board from February 2003 through the change in AXA’s governance structure in April 2010. He was CFO of AXA from May 2003 through December 2009. From January 2000 to May 2003, Mr. Duverne served as Group Executive Vice President-Finance, Control and Strategy. Mr. Duverne joined AXA as Senior Vice President in 1995. He is a director of AXA Financial, AXA Equitable and various other privately-held subsidiaries and affiliates of the AXA Group.
Mr. Duverne brings to the Board the highly diverse experience he has attained from the many key roles he has served for AXA.
Steven G. Elliott
Mr. Elliott, age 69, was elected a Director of the General Partner in January 2011. Until his retirement in December 2010, Mr. Elliott had served as Senior Vice Chairman of The Bank of New York Mellon (“
BNY Mellon
”) since 1998. In this role, he helped oversee numerous company-wide growth initiatives and co-headed the integration of The Bank of New York and Mellon from 2007 to 2009. Mr. Elliott was CFO of Mellon from 1990 to 2002 and Head of Finance from 1987 to 1990, while also leading some of Mellon’s diverse lines of business, including asset servicing, securities lending, global cash management and institutional banking. Before joining Mellon, he held senior positions at First Commerce Corporation (1986-87), Crocker National Bank (1984-86), Continental Illinois National Bank (1977-84) and United California Bank (1974-77). Since January 2011, he has been a member of the boards of directors of Huntington Bancshares Inc. (NASDAQ: HBAN) and PPL Corporation (NYSE: PPL). Since April 2011, he has served as Chairman of Huntington Bancshares’s risk oversight committee and, since January 2012, he has served as chairman of PPL Corporation’s audit committee. Mr. Elliott served as a director of Mellon (NYSE: MEL) from 2001 to the July 2007 merger with The Bank of New York and then as a director of BNY Mellon (NYSE: BK) through July 2008.
Mr. Elliott, an audit committee financial expert, brings to the Board the vast auditing and banking expertise he has gained in the financial services industry.
Deborah S. Hechinger
Ms. Hechinger, age 65, was elected a Director of the General Partner in May 2007. Currently an independent consultant on non-profit governance, she was President and CEO of BoardSource, a leading governance resource for non-profit organizations, from 2003 to 2007. From 2004 to 2007, Ms. Hechinger also served as co-convener of the Governance and Fiduciary Responsibilities work group, one of the five groups established by the Panel on the Nonprofit Sector to make recommendations to Congress on ways to improve the governance and accountability of non-profit organizations. She also served on the Advisory Board for the Center for Effective Philanthropy and was a Member of the Ethics and Accountability Committee at Independent Sector, a leading coalition of non-profits, foundations and corporate giving programs committed to advancing the common good in America. Prior to joining BoardSource, Ms. Hechinger was the Executive Vice President of the
117
World Wildlife Fund, a large, global conservation organization, where she oversaw all fundraising, communication and operations activities. She also has served as a Deputy Comptroller and as Director of the Securities and Corporate Practices Division at the Office of the Comptroller of the Currency and has held senior executive positions in the Division of Enforcement at the SEC.
Ms. Hechinger brings to the Board the significant knowledge of corporate governance matters and public policy she has gained through her extensive experience in both the private and public sectors.
Weston M. Hicks
Mr. Hicks, age 59, was elected a Director of the General Partner in July 2005. He has been a director and the President and CEO of Alleghany Corporation (NYSE: Y, “
Alleghany
”), an insurance and diversified financial services holding company, since December 2004 and was Executive Vice President of Alleghany from October 2002 until December 2004. From March 2001 through October 2002, Mr. Hicks was Executive Vice President and CFO of The Chubb Corporation. Prior to joining Chubb, he was an equity research analyst with Bernstein Research Services. Also, Mr. Hicks recently joined the Investment Committee of The New York Community Trust (“
NYCT
”), a community foundation that manages a $2.5 billion endowment and annually grants more than $140 million to non-profit organizations.
Mr. Hicks brings to the Board extensive financial expertise, including his unique perspective as the chief executive of an unaffiliated publicly-traded company, his background as a professional investor and CFA charter holder, and his decade of experience as an equity research analyst.
Heidi S. Messer
Ms. Messer, age 46, was elected a Director of the General Partner in February 2015. Since 2007, she has served as Co-Founder and Chairman of Cross Commerce Media, host to Collective[i], a network built around proprietary technology designed to transform what is currently referred to as “Big Data” into insights and intelligence delivered by applications designed for sales and other business users. In addition, Ms. Messer has served as Co-Founder and CEO of World Evolved, a platform for global investment and expansion, and she also is one of the founding members of the Zokei Network, a global network that encourages innovation across art, science, business and technology. Ms. Messer serves on the board of Partnership Fund for New York City, the board and the Operating Committee of the Brown Entrepreneurship Program, and the advisory board of the Department of Physics and Astronomy at Johns Hopkins.
Prior to joining Collective[i], Ms. Messer co-founded LinkShare Corporation, host to one of the world’s largest on-line affiliate networks representing many on-line publishers and merchants. She served as a board member and as President and COO of LinkShare Corporation until its sale to Rakuten, Inc. in 2005. A graduate of Harvard Law School, Ms. Messer has been a member in good standing of the New York Bar Association since 1997.
Ms. Messer brings to the Board extensive technology, investment and executive experience achieved through her roles in the formation and management of various technology companies.
Mark Pearson
Mr. Pearson, age 57, was elected a Director of the General Partner in February 2011. Also during February 2011, he succeeded Mr. Condron as Director, CEO and President of AXA Financial, and as Chairman and CEO of AXA Equitable. In September 2013, Mr. Pearson became President of AXA Equitable. In addition, he has been a member of the Management Committee of AXA since 2011 and the Executive Committee of AXA since 2008.
Mr. Pearson joined AXA in 1995 when AXA acquired National Mutual Funds Management Limited (presently AXA Asia Pacific Holdings Limited) and was appointed Regional Chief Executive of AXA Asia Life in 2001. In 2008, Mr. Pearson was named President and CEO of AXA Japan Holding Co., Ltd. (“
AXA Japan
”). Prior to joining AXA, Mr. Pearson spent approximately 20 years in the insurance sector, holding several senior management positions at National Mutual Holdings and Friends Provident.
Mr. Pearson brings to the Board the diverse financial services experience he has developed through his service as an executive, including as CEO, with AXA Financial, AXA Japan and other AXA affiliates.
Scott A. Schoen
Mr. Schoen, age 57, was elected a Director of the General Partner in July 2013. He has served as CEO of Baylon Capital Partners, L.P. (“
Baylon
”), a private family investment office, since April 2013. In addition, Mr. Schoen has served as a Senior Advisor to Thomas Lee Partners, L.P. (“
THL
”), a private equity firm, since 2012 and, prior thereto, held various senior management roles with THL, including Vice Chairman from 2010 to 2011, Co-President from 2003 to 2009 and Senior
118
Managing Director from 1998 to 2003. Mr. Schoen began his career in the investment banking group at Goldman Sachs. He serves as chairman of the board of trustees of Partners Continuing Care and Spaulding Rehabilitation Hospital, a member of the board of trustees of Partners Healthcare System, a member of the President’s Council of Massachusetts General Hospital, and a director of Share Our Strength.
Mr. Schoen, an audit committee financial expert, brings to the Board extensive private equity and investment banking experience, as well as his executive experience as the CEO of Baylon.
Lorie A. Slutsky
Ms. Slutsky, age 63, was elected a Director of the General Partner in July 2002. Since January 1990, she has been President and CEO of NYCT. Ms. Slutsky recently resigned as Treasurer and a board member of Independent Sector and formerly co-chaired its National Panel on the Non-Profit Sector, which focused on reducing abuse and improving governance practices at non-profit organizations. She served on the Board of Directors of BoardSource from 1999 to 2008 and served as its Chair from 2005 to 2007. Ms. Slutsky served as Trustee and Chair of the Budget Committee of Colgate University from 1989 to 1997 and as a member of the Council on Foundations from 1989 to 1995, for which she also served as Chair from 1993 to 1995. She has been a Director of AXA Financial, AXA Equitable and MLOA since September 2006. In addition, Ms. Slutsky was a member of AXA Financial’s Audit Committee from 2006 through 2010. She has been a member of AXA Financial’s Organization and Compensation Committee since 2006 and was elected Chair of the Organization and Compensation Committee in February 2012.
Ms. Slutsky brings to the Board extensive corporate governance experience achieved through her executive and managerial roles at NYCT, BoardSource, Independent Sector and various other non-profit organizations. She also brings valuable insight gained from serving on boards and board committees at certain of our parent companies.
Christian Thimann
Mr. Thimann, age 49, was elected a Director of the General Partner in February 2014. In January 2014, he joined AXA as Group Head of Strategy, Sustainability and Public Affairs and as a member of AXA’s Executive Committee. Prior to joining AXA, Mr. Thimann held several senior positions spanning 15 years with the European Central Bank, including, most recently, Director General and Adviser to the President from November 2008 until December 2013. From 1995 to 1998, he worked with the International Monetary Fund. Mr. Thimann is trustee of the Max-Planck-Institute for Tax Law and Public Finance and has published numerous articles on international finance, monetary economics and macroeconomics. He earned a PhD in economics in 1995.
Mr. Thimann brings to the Board his vast experience in public affairs and international finance.
Joshua A. Weinreich
Mr. Weinreich, age 55, was elected a Director of the General Partner in July 2013. A career finance executive, Mr. Weinreich retired in 2004 after 20 years with Bankers Trust/Deutsche Bank where he held numerous positions, including Global Head of Hedge Funds, CEO of Deutsche Asset Management, Americas, and Chief Investment Officer and Co-Head of Bankers Trust Private Bank. He plays key roles on several boards, which roles currently include Chairman of the Board of the Community FoodBank of New Jersey and Chairman of the Overlook Hospital Foundation Investment Committee. In addition, he is a director of Skybridge Capital Hedge Fund Portfolios and Houseparty Inc.
Mr. Weinreich brings to the Board the financial expertise and managerial skills he developed while working with Bankers Trust/Deutsche Bank and the philanthropic experiences he has cultivated since his retirement.
Executive Officers (other than Mr. Kraus)
Laurence E. Cranch, General Counsel
Mr. Cranch, age 69, has been our General Counsel since he joined our firm in 2004. Prior to joining AB, Mr. Cranch was a partner of Clifford Chance, an international law firm. Mr. Cranch joined Clifford Chance in 2000 when Rogers & Wells, a New York law firm of which he was Managing Partner, merged with Clifford Chance.
James A. Gingrich, COO
Mr. Gingrich, age 57, joined our firm in 1999 as a senior research analyst with Bernstein Research Services and has been our firm’s COO since December 2011. Prior to becoming COO, Mr. Gingrich held senior managerial positions in Bernstein Research Services, including Chairman and CEO from February 2007 to November 2011 and Global Director of Research from December 2002 to January 2007.
119
Robert P. van Brugge, Chairman and CEO of Bernstein Research Services
Mr. van Brugge, age 47, has been Chairman of the Board and CEO of Bernstein Research Services since December 2011. Prior to becoming Chairman and CEO, Mr. van Brugge served as Global Director of Research from January 2008 to December 2011. He joined our firm in 2002 as a senior research analyst with Bernstein Research Services.
John C. Weisenseel, CFO
Mr. Weisenseel, age 56, joined our firm in May 2012 as Senior Vice President and CFO. From 2004 to April 2012, he worked at The McGraw Hill Companies (“
McGraw Hill
”), where he served initially as Senior Vice President and Corporate Treasurer and, since 2007, as CFO of the firm’s Standard & Poor’s subsidiary. Prior to joining McGraw Hill, Mr. Weisenseel was Vice President and Corporate Treasurer for Barnes & Noble, Inc. Prior to joining Barnes & Noble, he spent ten years in various derivatives trading and financial positions at Citigroup. A Certified Public Accountant, Mr. Weisenseel also worked at KPMG LLP.
Resignation of Directors and Changes in Executive Officers
The following changes to our directors and executive officers occurred since we filed our Form 10-K for the year ended December 31, 2014:
|
•
|
On July 24, 2015, Henri de Castries, Chairman and CEO of AXA, resigned from the Board due to competing demands on his time pertaining to his other job-related responsibilities.
|
|
•
|
Lori A. Massad, formerly AB's Head of Human Capital and Chief Talent Officer, has transitioned to a part-time role assisting Messrs. Kraus and Gingrich with discrete projects. As a result, Ms. Massad is no longer deemed an Executive Officer of the firm.
|
Board Meetings
In
2015
, the Board held:
|
•
|
regular meetings in February, April, May, July, September and November.
|
Generally, the Board holds six meetings annually: in February, April, May, July or August, September and November. In addition, the Board holds special meetings or takes action by unanimous written consent as circumstances warrant. The Board has standing Executive, Audit, Governance, Compensation and Special Committees, each of which
is described in further detail below
. Each member of the Board attended 75% or more of the aggregate of all Board and committee meetings that he or she was entitled to attend in
2015
.
Committees of the Board
The Executive Committee of the Board (“
Executive Committee
”) consists of Mses. Messer and Slutsky and Messrs. Condron, Duverne, Kraus (Chair) and Elliott.
The Executive Committee exercises all of the powers and authority of the Board (with limited exceptions) when the Board is not in session, or when it is impractical to assemble the full Board. The Executive Committee held three meetings in
2015
.
The Governance Committee consists of Mses. Hechinger (Chair) and Slutsky and Messrs. Condron, Duverne and Kraus. The Governance Committee:
|
•
|
assists the Board and the sole stockholder of the General Partner in:
|
|
|
•
|
identifying and evaluating qualified individuals to become Board members; and
|
|
|
•
|
determining the composition of the Board and its committees, and
|
|
|
•
|
assists the Board in:
|
|
|
•
|
developing and monitoring a process to assess Board effectiveness;
|
|
|
•
|
developing and implementing our Corporate Governance Guidelines; and
|
|
|
•
|
reviewing our policies and programs that relate to matters of corporate responsibility of the General Partner and the Partnerships.
|
|
The Governance Committee held two meetings in
2015
.
120
The Audit Committee of the Board (“
Audit Committee
”) consists of Messrs. Elliott (Chair), Hicks, Schoen and Weinreich. The primary purposes of the Audit Committee are to:
|
•
|
assist the Board in its oversight of:
|
|
|
•
|
the integrity of the financial statements of the Partnerships;
|
|
|
•
|
the Partnerships’ status and system of compliance with legal and regulatory requirements and business conduct;
|
|
|
•
|
the independent registered public accounting firm’s qualification and independence; and
|
|
|
•
|
the performance of the Partnerships’ internal audit function; and
|
|
|
•
|
oversee the appointment, retention, compensation, evaluation and termination of the Partnerships’ independent registered public accounting firm.
|
|
Consistent with these functions, the Audit Committee encourages continuous improvement of, and fosters adherence to, the Partnerships’ policies, procedures and practices at all levels. With respect to these matters, the Audit Committee provides an open avenue of communication among the independent registered public accounting firm, senior management, the Internal Audit Department and the Board. The Audit Committee held seven meetings in
2015
.
The Compensation Committee consists of Ms. Slutsky and Messrs. Condron (Chair), Duverne, Elliott and Kraus. The Compensation Committee held three meetings in
2015
. For additional information about the Compensation Committee,
see “Compensation Discussion and Analysis—Compensation Committee” in Item 11
.
The functions of each of the committees
discussed above
are more fully described in each committee’s charter. The charters are available on our Internet Site.
The Special Committee of the Board (“
Special Committee
”) consists of all of the independent directors and, in
2015
, included Mses. Hechinger, Messer and Slutsky and Messrs. Condron, Elliott (Chair), Hicks, Schoen and Weinreich. The Special Committee has the authority to direct and oversee any matters referred to it by the Board and/or management including, but not limited to, matters relating to conflicts of interest and the relationship among AB, AB Holding and AXA. The members of the Special Committee do not receive any compensation for their service on the Special Committee, apart from the ordinary meeting fees
described in “Director Compensation in 2015” in Item 11
. The Special Committee did not meet in
2015
.
Audit Committee Financial Experts; Financial Literacy
In January
2015
, the Governance Committee, after reviewing materials prepared by management, recommended that the Board determine that each of Messrs. Elliott and Schoen is an “audit committee financial expert” within the meaning of Item 407(d) of Regulation S-K. The Board so determined at its regular meeting in February
2015
.
In January
2016
, the Governance Committee, after reviewing materials prepared by management, recommended that the Board determine that each of Messrs. Elliott and Schoen is an “audit committee financial expert” within the meaning of Item 407(d) of Regulation S-K. The Board so determined at its regular meeting in February
2016
.
In January
2015
, the Governance Committee, after reviewing materials prepared by management, recommended that the Board determine that each of Messrs. Elliott, Hicks, Schoen and Weinreich is financially literate and possesses accounting or related financial management expertise, as contemplated by Section 303A.07(a) of the NYSE Listed Company Manual (“
Financially Literate
”). The Board so determined at its regular meeting in February
2015
.
In January
2016
, the Governance Committee, after reviewing materials prepared by management, recommended that the Board determine that each of Messrs. Elliott, Hicks, Schoen and Weinreich is Financially Literate. The Board so determined at its regular meeting in February
2016
.
Independence of Certain Directors
In January
2015
, the Governance Committee, after reviewing materials prepared by management, recommended that the Board determine that each of Mses. Hechinger, Messer and Slutsky and Messrs. Condron, Elliott, Hicks, Schoen and Weinreich is independent. The Board considered immaterial relationships of Mr. Hicks (relating to the fact that Alleghany is a client of SCB LLC) and Ms. Slutsky (relating to a contribution AB made to NYCT in February 2014 and the fact that she is a member of the boards of directors of AXA Financial and AXA Equitable), and determined, at its February
2015
regular meeting, that each of
121
Mses. Hechinger, Messer and Slutsky and Messrs. Condron, Elliott, Hicks, Schoen and Weinreich is independent within the meaning of the relevant rules.
In January
2016
, the Governance Committee, after reviewing materials prepared by management, recommended that the Board determine that each of Mses. Hechinger, Messer and Slutsky and Messrs. Condron, Elliott, Hicks, Schoen and Weinreich is independent. The Board considered immaterial relationships of Mr. Hicks (relating to the fact that Alleghany is a client of SCB LLC) and Ms. Slutsky (relating to a contribution AB made to NYCT in February 2015 and the fact that she is a member of the boards of directors of AXA Financial and AXA Equitable), and determined, at its February
2016
regular meeting, that each of Mses. Hechinger, Messer and Slutsky and Messrs. Condron, Elliott, Hicks, Schoen and Weinreich is independent within the meaning of the relevant rules.
Board Leadership Structure and Role in Risk Oversight
Leadership
The Board, together with the Governance Committee, is responsible for reviewing the Board’s leadership structure. In determining the appropriate individual to serve as our Chairman and CEO, the Board and the Governance Committee consider, among other things, the composition of the Board, the role of the Board’s lead independent director (
discussed more fully below)
, our company’s strong corporate governance practices, and the challenges and opportunities specific to AB.
We believe that our company derives significant benefits from having one individual hold the positions of both Chairman and CEO, provided we have sufficient counter-balancing governance in place. We see significant value in having the leader in the Board room also manage the affairs of our company, and we believe any potential doubts as to our Board’s objectivity in evaluating management are offset by the lead independent director we have in place and the fact that the affirmative consent of our largest Unitholder (AXA) is required in order for any action taken by the Executive Committee or the Compensation Committee to be effective.
Lead Independent Director
Our lead independent director, Steven G. Elliott, was appointed unanimously by our Board in February 2014. He presides at all executive sessions of non-management and independent directors and makes himself available, if requested by Unitholders, for consultation and communication. Interested parties wishing to communicate directly with Mr. Elliott may send an e-mail, with “confidential” in the subject line, to our Corporate Secretary or address mail to Mr. Elliott in care of our Corporate Secretary. Our Corporate Secretary will promptly forward such e-mail or mail to Mr. Elliott. We have posted this information in the “Management & Governance” section of our Internet Site.
Risk Oversight
The Board, together with the Audit Committee, has oversight for our company’s risk management framework, which includes investment risk, credit and counterparty risk, and operational risk, and is responsible for helping to ensure that these risks are managed in a sound manner. The Board has delegated to the Audit Committee, which consists entirely of independent directors, the responsibility to consider our company’s policies and practices with respect to investment, credit and counterparty, and operational risk assessment and risk management, including discussing with management the major financial risk exposures and the steps taken to monitor and control such exposures. Members of the company's risk management team, who are responsible for identifying, managing and controlling the array of risks inherent in our company’s business and operations, make quarterly reports to the Audit Committee, which address investment, credit and counterparty, and operational risk identification, assessment and monitoring. The Chief Risk Officer, whose expertise encompasses both quantitative research and associated investment risks, makes periodic presentations to the Board. He reports directly to our Chairman and CEO and, since 2013, has had a reporting line to the Audit Committee.
The Board has determined that its leadership and risk oversight are appropriate for our company. Mr. Kraus’s in-depth knowledge of financial services and extensive executive experience in the investment management industry make him uniquely suited to serve as our Chairman and CEO, while Mr. Elliott’s leadership and expertise have proven invaluable at enhancing the overall functioning of the Board and the Audit Committee. The Board believes that the combination of a single Chairman and CEO, a lead independent director, the Audit Committee, a specialized risk management team and significant involvement from our largest Unitholder (AXA) provide the appropriate leadership to help ensure effective risk oversight by the Board.
122
Code of Ethics and Related Policies
All of our directors, officers and employees are subject to our Code of Business Conduct and Ethics. The code is intended to comply with Section 303A.10 of the NYSE Listed Company Manual, Rule 204A-1 under the Investment Advisers Act and Rule 17j-1 under the Investment Company Act, as well as with recommendations issued by the Investment Company Institute regarding, among other things, practices and standards with respect to securities transactions of investment professionals. The Code of Business Conduct and Ethics establishes certain guiding principles for all of our employees, including sensitivity to our fiduciary obligations and ensuring that we meet those obligations. Our Code of Business Conduct and Ethics may be found in the “Management & Governance” section of our Internet Site.
We have adopted a Code of Ethics for the CEO and Senior Financial Officers, which is intended to comply with Section 406 of the Sarbanes-Oxley Act of 2002 (“
Item 406 Code
”). The Item 406 Code, which may be found in the “Management & Governance” section of our Internet Site, was adopted in October 2004 by the Executive Committee. We intend to satisfy the disclosure requirements under Item 5.05 of Form 8-K regarding certain amendments to, or waivers from, provisions of the Item 406 Code that apply to the CEO, the CFO and the Chief Accounting Officer by posting such information on our Internet Site. To date, there have been no such amendments or waivers.
NYSE Governance Matters
Section 303A.00 of the NYSE Listed Company Manual exempts limited partnerships from compliance with the following sections of the Manual, some of which we comply with voluntarily: Section 303A.01 (board must have a majority of independent directors), 303A.04 (corporate governance committee must have only independent directors as its members and must have a charter that addresses, among other things, the committee’s purpose and responsibilities), and 303A.05 (compensation committee must have only independent directors as its members and must have a charter that addresses, among other things, the committee’s purpose and responsibilities).
AB Holding is a limited partnership (as is AB). In addition, because the General Partner is a subsidiary of AXA, and the General Partner controls AB Holding (and AB), we believe we also would qualify for the “controlled company” exemption. However, we comply voluntarily with the charter requirements set forth in Sections 303A.04 and 303A.05.
Our Corporate Governance Guidelines (“
Guidelines
”) promote the effective functioning of the Board and its committees, promote the interests of the Partnerships’ respective Unitholders (with appropriate regard to the Board’s duties to the sole stockholder of the General Partner), and set forth a common set of expectations as to how the Board, its various committees, individual directors and management should perform their functions. The Guidelines may be found in the “Management & Governance” section of our Internet Site.
The Governance Committee is responsible for considering any request for a waiver under the Code of Business Conduct and Ethics, the Item 406 Code, the AXA Group Compliance and Ethics Guide, and the AXA Financial Policy Statement on Ethics from any director or executive officer of the General Partner. No such waiver has been granted to date and, if a waiver is granted in the future, such waiver would be described in the “Management & Governance” section of our Internet Site.
Our Internet Site, under the heading “Contact our Directors”, provides an e-mail address for any interested party, including Unitholders, to communicate with the Board. Our Corporate Secretary reviews e-mails sent to that address and has some discretion in determining how or whether to respond, and in determining to whom such e-mails should be forwarded. In our experience, substantially all of the e-mails received are ordinary client requests for administrative assistance that are best addressed by management, or solicitations of various kinds.
The
2015
Certification by our CEO under NYSE Listed Company Manual Section 303A.12(a) was submitted to the NYSE on February 19,
2015
.
Certifications by our CEO and CFO pursuant to Section 302 of the Sarbanes-Oxley Act of 2002 have been furnished as exhibits to this Form 10-K.
AB Holding Unitholders and AB Unitholders may request a copy of any committee charter, the Guidelines, the Code of Business Conduct and Ethics, and the Item 406 Code by contacting our Corporate Secretary. The charters and memberships of the Executive, Audit, Governance and Compensation Committees may be found in the “Management & Governance” section of our Internet Site.
123
Fiduciary Culture
We maintain a robust fiduciary culture and, as a fiduciary, we place the interests of our clients first and foremost. We are committed to the fair and equitable treatment of all our clients, and to compliance
with all applicable rules and regulations and internal policies to which our business is subject. We pursue these goals through education of our employees to promote awareness of our fiduciary obligations, incentives that align employees’ interests with those of our clients, and a range of measures, including active monitoring, to ensure regulatory compliance. Our compliance framework includes:
|
•
|
the Code of Ethics Oversight Committee (“
Ethics Committee
”) and the Internal Compliance Controls Committee (“
Compliance Committee
”), each of which consists of our executive officers and other senior executives;
|
|
•
|
an ombudsman office, where employees and others can voice concerns on a confidential basis;
|
|
•
|
firm-wide compliance and ethics training programs; and
|
|
•
|
a Conflicts Officer and a Conflicts Committee, which help to identify and mitigate conflicts of interest.
|
The Ethics Committee oversees all matters relating to issues arising under our Code of Business Conduct and Ethics and meets on a quarterly basis and at such other times as circumstances warrant. The Ethics Committee and its subcommittee, the Personal Trading Subcommittee, have oversight of personal trading by our employees.
The Compliance Committee reviews compliance issues throughout our firm, endeavors to develop solutions to those issues as they may arise from time to time and oversees implementation of those solutions. The Compliance Committee meets on a quarterly basis and at such other times as circumstances warrant.
Section 16(a) Beneficial Ownership Reporting Compliance
Section 16(a) of the Exchange Act requires directors of the General Partner and executive officers of the Partnerships, and persons who own more than 10% of the AB Holding Units or AB Units, to file with the SEC initial reports of ownership and reports of changes in ownership of AB Holding Units or AB Units. To the best of our knowledge, during 2015, we complied with all Section 16(a) filing requirements. Our Section 16 filings can be found under “Investor & Media Relations” / “Reports & SEC Filings” on our Internet Site.
124
Compensation Discussion and Analysis (“CD&A”)
Compensation Philosophy and Goals
The intellectual capital of our employees is collectively the most important asset of our firm. We invest in people—we hire qualified people, train them, encourage them to give their best thinking to the firm and our clients, and compensate them in a manner designed to motivate, reward and retain them while aligning their interests with the interests of our Unitholders. As a result, the costs of employee compensation and benefits are significant, comprising, for 2015, approximately 53.1% of our operating expenses and representing approximately 42.0% of our net revenues (48.9% of our adjusted net revenues,
as defined below in “Overview of 2015 Incentive Compensation Program”
). Although these percentages are not unusual for companies in the financial services industry, our management, Board and Compensation Committee are sensitive to these costs and actively monitor and oversee our employee compensation programs.
We structure our named executive officer compensation programs with the intent of enhancing firm-wide and individual performance and Unitholder value. Our "
named executive officers
" are:
|
Chief Executive Officer (“
CEO
”)
|
Peter S. Kraus
|
|
Chief Financial Officer (“
CFO
”)
|
John C. Weisenseel
|
|
Three other most highly-compensated executive officers
|
James A. Gingrich, Chief Operating Officer
Robert P. van Brugge, Chairman and CEO of Bernstein Research Services Laurence E. Cranch, General Counsel
|
We also are focused on ensuring that our compensation practices are competitive with industry peers and provide sufficient potential for wealth creation for our named executive officers and our employees generally, which we believe will enable us to meet the following key compensation goals:
|
•
|
attract, motivate and retain highly-qualified executive talent;
|
|
•
|
reward prior year performance;
|
|
•
|
incentivize future performance;
|
|
•
|
recognize and support outstanding individual performance and behaviors that demonstrate and foster our firm’s culture of Relentless Ingenuity, which includes the core competencies of relentlessness, ingeniousness, collaboration and accountability; and
|
|
•
|
align our executives’ long-term interests with those of our Unitholders and clients.
|
Compensation Elements for Named Executive Officers
We utilize a variety of compensation elements to achieve the goals
described above
, consisting of base salary, annual short-term incentive compensation awards (cash bonuses), a long-term incentive compensation award program, a defined contribution plan and certain other benefits, each of which we
discuss in detail below
:
Base Salaries
Base salaries comprise a relatively small portion of our named executive officers’ total compensation. We consider individual experience, responsibilities and tenure with the firm when determining the narrow range of base salaries paid to our executives.
Annual Short-Term Incentive Compensation Awards (Cash Bonuses)
We provide our named executive officers, other than Mr. Kraus (for information relating to Mr. Kraus's compensation elements,
please refer to "Overview of Our CEO's Compensation" below
), with annual short-term incentive compensation awards in the form of cash bonuses.
We believe that annual cash bonuses, which generally reflect individual performance and the firm’s current year financial performance, provide a short-term retention mechanism for our named executive officers, other than Mr. Kraus, because such bonuses typically are paid during the last week of the year.
125
In 2015, we paid annual cash bonuses in late December. These bonuses, and the 2015 long-term incentive compensation awards
described immediately below
, were based on management’s evaluation, subject to the Compensation Committee’s review and approval, of each named executive officer’s performance during the year, the performance of the executive’s business unit or function compared to business and operational goals established at the beginning of the year, and the firm's current-year financial performance. For more information regarding the factors considered when determining cash bonuses for executives,
see “Other Factors Considered When Determining Named Executive Officer Compensation” below
.
Long-Term Incentive Compensation Awards
A substantial portion of long-term incentive compensation awards generally is denominated in restricted AB Holding Units. We utilize this structure to align our named executive officers’ long-term interests directly with the interests of our Unitholders and indirectly with the interests of our clients, as strong performance for our clients generally contributes directly to increases in assets under management and improved financial performance for the firm.
We believe that annual long-term incentive compensation awards provide a long-term retention mechanism for our named executive officers because such awards generally vest ratably over four years. In 2015, these awards, which were granted in December to each named executive officer (other than Mr. Kraus), were made pursuant to the Incentive Compensation Program, an unfunded, non-qualified incentive compensation plan, and, when the award is AB Holding Unit-based, the 2010 Plan, our equity compensation plan.
Employees, except certain members of senior management, can elect to diversify their long-term incentive compensation awards by allocating up to 50% of their awards to cash, up to a maximum cash amount of $250,000 (“
Deferred Cash
”). The portion of an award allocated to Deferred Cash is subject to the same multi-year vesting periods (generally, four years) as the portion of the award allocated to restricted AB Holding Units.
With respect to both restricted AB Holding Units and Deferred Cash, award recipients who resign or are terminated without cause continue to vest in their long-term incentive compensation awards if the award recipients comply with certain agreements and restrictive covenants set forth in the applicable award agreement, including restrictions on competition, restrictions on employee and client solicitation, and a claw-back for failing to follow existing risk management policies. As such, for accounting purposes, there is no employee service requirement and awards are fully expensed when granted. (As used in this Item 11, “vest” refers to the time at which the awards are no longer subject to forfeiture for breach of these restrictions or risk management policies, which we
discuss further below in “Consideration of Risk Matters in Determining Compensation”.
)
Prior to vesting, withdrawals of the restricted AB Holding Units and/or Deferred Cash underlying an award are not permitted. Upon vesting, the AB Holding Units and/or Deferred Cash underlying an award are distributed unless the award recipient has, in advance, voluntarily elected to defer receipt to future periods. Quarterly cash distributions on vested and unvested restricted AB Holding Units are paid to award recipients when distributed generally. If Deferred Cash is elected, interest accrues monthly based on our monthly weighted average cost of funds and is credited to the award recipient annually. Our weighted average cost of funds during 2015 was approximately 0.3%, representing a nominal return.
Defined Contribution Plan
U.S. employees of AB, including each of our named executive officers, are eligible to participate in the Profit Sharing Plan for Employees of AB (as amended and restated as of January 1, 2015, “
Profit Sharing Plan
”), a tax-qualified retirement plan. The Compensation Committee determines the amount of company contributions (both the level of annual matching by the firm of an employee’s pre-tax salary deferral contributions and the annual company profit sharing contribution, if any).
For 2015, the Compensation Committee determined that employee deferral contributions would be matched on a dollar-for-dollar basis up to 5% of eligible compensation and that there would be no profit sharing contribution.
Other Benefits
Our firm provides our named executive officers with access to the following additional benefits:
•
Life Insurance
: the firm pays the premiums associated with life insurance policies purchased on behalf of our named executive officers.
126
Consideration of Risk Matters in Determining Compensation
In 2015, we considered whether our compensation practices for employees, including our named executive officers, encourage unnecessary or excessive risk-taking and whether any risks arising from our compensation practices are reasonably likely to have a material adverse effect on our firm. For the reasons
set forth below
, we have determined that our current compensation practices do not create risks that are reasonably likely to have a material adverse effect on our firm.
As described above in “Compensation Elements for Named Executive Officers – Long-Term Incentive Compensation Awards”
, a substantial portion of each long-term incentive compensation award granted to an eligible employee is denominated in AB Holding Units that are not distributed until subsequent years, so the ultimate value that the employee derives from the award depends on the long-term performance of the firm. Denominating a substantial portion of the award in restricted AB Holding Units and deferring their delivery sensitizes employees to risk outcomes and discourages them from taking excessive risks that could lead to a decrease in the value of the AB Holding Units. Furthermore,
and as noted above in “Compensation Elements for Named Executive Officers – Long-Term Incentive Compensation Awards”
, generally all outstanding long-term incentive compensation awards include a provision permitting us to “claw-back” the unvested portion of an employee’s long-term incentive compensation award (whether denominated in restricted AB Holding Units or Deferred Cash) if the Compensation Committee determines that (i) the employee failed to follow existing risk management policies and (ii) as a result of the employee’s failure, there has been or reasonably could be expected to be a material adverse impact on our firm or the employee’s business unit.
Overview of 2015 Incentive Compensation Program
In 2015, each of our named executive officers, other than Mr. Kraus, received a portion of his incentive compensation in the form of an annual cash bonus and a portion in the form of long-term incentive compensation (
as described above
, at least 50% of which must have been allocated to restricted AB Holding Units). The split between the annual cash bonus and long-term incentive compensation varied depending on the named executive officer’s total compensation, with lower-paid executives receiving a greater percentage of their incentive compensation as cash bonuses than more highly-paid executives. (For additional information about these compensatory elements,
see “Compensation Elements for Named Executive Officers” above
.)
Although estimates are developed for budgeting and strategic planning purposes, incentive compensation is not correlated with meeting any specific targets (except that the compensation incentives for some of our salespeople are based on sales levels). Instead, the aggregate amount of incentive compensation generally is determined on a discretionary basis and primarily is a function of our firm’s current year financial performance. Amounts are awarded to help us achieve our goal of attracting, motivating and retaining top talent while also helping to ensure that our executives' goals are appropriately aligned with the goal of increasing our Unitholders' return on their investment.
Senior management, with the approval of the Compensation Committee, confirmed that the appropriate metric to consider in determining the amount of incentive compensation for 2015 is the ratio of adjusted employee compensation and benefits expense to adjusted net revenues, which terms
are described immediately below
:
|
•
|
Adjusted employee compensation and benefits expense
is our total employee compensation and benefits expense minus other employment costs such as recruitment, training, temporary help and meals, and excludes the impact of mark-to-market vesting expense, as well as dividends and interest expense, associated with employee long-term incentive compensation-related investments.
|
|
•
|
Adjusted net revenues
(
see our discussion of “Management Operating Metrics” in Item 7
)
exclude investment gains and losses and dividends and interest on employee long-term incentive compensation-related investments and the 90% of the investment gains and losses of our consolidated venture capital fund attributable to non-controlling interests. In addition, adjusted net revenues offset distribution-related payments to third parties as well as amortization of deferred sales commissions against distribution revenues. We also exclude from adjusted net revenues additional pass-through expenses we incur (primarily through our transfer agent) that are reimbursed and recorded as fees in revenues.
|
127
Also, senior management, with the approval of the Compensation Committee, determined that the firm’s adjusted employee compensation and benefits expense generally should not exceed 50.0% of our adjusted net revenues, except in unexpected or unusual circumstances.
As the table below indicates
, in 2015, adjusted employee compensation and benefits expense amounted to approximately 48.9% of adjusted net revenues (in thousands):
|
Net Revenues
|
$
|
3,020,727
|
|
|
Adjustments (
see above
)
|
(496,809
|
)
|
|
|
Adjusted Net Revenues
|
$
|
2,523,918
|
|
|
|
|
|
|
|
Employee Compensation & Benefits Expense
|
$
|
1,267,926
|
|
|
Adjustments (
see above
)
|
(32,621
|
)
|
|
|
Adjusted Employee Compensation & Benefits Expense
|
$
|
1,235,305
|
|
|
Adjusted Compensation Ratio
|
48.9
|
%
|
|
Our 2015 adjusted compensation ratio of approximately 48.9% reflects the need to keep compensation levels competitive with industry peers in order to attract, motivate and retain highly-qualified executive talent.
Benchmarking
In 2015, we retained McLagan Partners (“
McLagan
”) to provide compensation benchmarking data for our named executive officers ("
McLagan Data
"). The McLagan Data summarized 2014 compensation levels and 2015 salaries at selected asset management companies and banks comparable to ours in terms of size and business mix (“
Comparable Companies
”), to assist us in determining the appropriate level of compensation for the firm’s named executive officers, other than Mr. Kraus.
The McLagan Data provided ranges of compensation levels at the Comparable Companies for executive positions similar to those held by our named executive officers, including base salary, total cash compensation and total compensation.
The Comparable Companies, which management selected with input from McLagan, included:
|
Bank of America Merrill Lynch
|
Barclays Capital Group
|
BlackRock Financial Management, Inc.
|
|
Citigroup Inc.
|
Credit Suisse Group AG
|
Deutsche Bank AG
|
|
Franklin Resources, Inc.
|
Goldman Sachs Group, Inc.
|
Goldman Sachs Asset Management, L.P.
|
|
Invesco Ltd.
|
JPMorgan Chase & Co.
|
JPMorgan Asset Management Inc.
|
|
Morgan Stanley
|
Morgan Stanley Investment Management Inc.
|
PIMCO LLC
|
|
T. Rowe Price Group, Inc.
|
UBS AG
|
The Vanguard Group, Inc.
|
The McLagan Data indicated that the total compensation paid to our named executive officers in 2015 fell within or below the ranges of total compensation paid to executives at the Comparable Companies.
The Compensation Committee considered this information in concluding that the compensation levels paid in 2015 to our named executive officers were appropriate and reasonable.
Other Factors Considered When Determining Named Executive Officer Compensation
We base decisions about the compensation of our named executive officers, other than Mr. Kraus, primarily on our assessment of each executive’s leadership, operational performance, and potential to enhance investment returns and service for our clients, all of which contribute to long-term Unitholder value. We do not utilize quantitative formulas when determining the compensation of our named executive officers. Instead, we rely on our judgment about each executive’s performance in light of business and operational goals established at the beginning of the year and reviewed in the context of the current-year financial performance of the firm. We begin this process, which is conducted by the CEO and the COO working with other members of senior management, by determining the total incentive compensation amounts available for a particular year (
as more fully explained above in “Overview of 2015 Incentive Compensation Program”
).
128
We then consider a number of key factors for each of the named executive officers (other than Mr. Kraus, our CEO, whose compensation is
described below in "Overview of Our CEO's Compensation"
). Specific factors will vary among business units, among individuals and during different business cycles, so we do not adopt any specific weighting or formula under which these metrics are applied. Key factors we consider include:
|
•
|
the firm’s financial performance in the current year;
|
|
•
|
the named executive officer’s performance compared to individual business and operational goals established at the beginning of the year;
|
|
•
|
the firm’s strategic and operational considerations;
|
|
•
|
total compensation awarded to the named executive officer in the previous year;
|
|
•
|
the increase or decrease in the current year’s total incentive compensation amounts available;
|
|
•
|
the contribution of the named executive officer to our overall financial results;
|
|
•
|
the nature, scope and level of responsibilities of the named executive officer;
|
|
•
|
the named executive officer’s execution of our firm’s culture of Relentless Ingenuity; and
|
|
•
|
the named executive officer’s management effectiveness, talent development, and adherence to risk management and regulatory compliance.
|
We then provided specific incentive compensation recommendations to the Compensation Committee, which recommendations were supported by the factors
listed above
. We also provided the Compensation Committee with the McLagan Data, which was not used in a formulaic or mechanical way to determine named executive officer compensation levels, but rather,
as noted above
, provided the Compensation Committee with compensation levels paid to executives at the Comparable Companies. The Compensation Committee then made the final incentive compensation decisions.
We have
described in the table below
the business and operational goals established at the beginning of 2015 for our named executive officers, other than Mr. Kraus, and their achievements during 2015:
|
Named Executive Officer
|
2015 Business and Operational Goals
|
2015 Goals Achieved
|
|
James A. Gingrich
COO
|
− increase operating efficiency;
− optimize Retail, Institutions and Private Wealth strategy and sales efforts;
− enhance planning and organizational processes;
− optimize revenue and profitability of Bernstein Research Services;
− foster a culture of meritocracy, empowerment and accountability among business leaders; and
− recruit and retain top talent.
|
− contained operating costs;
− implemented processes to better manage costs;
− implemented organizational changes within distribution functions designed to enhance product development, marketing effectiveness and sales productivity;
− helped improve Bernstein Research Services revenues and margins; and
− helped recruit new personnel in several key positions.
|
|
Robert P. van Brugge
Chairman and CEO,
Bernstein Research Services
|
− optimize revenue and profitability of Bernstein Research Services;
− further enhance this unit’s research capabilities, trading services and product array;
− extend this unit’s geographic platform; and
− attract, motivate and retain top talent.
|
− increased Bernstein Research Services profitability;
− achieved excellent results in third-party research and trading surveys;
− increased the commercial success of our firm's sell-side trading platform; and
− continued to expand the sell-side business in Asia.
|
129
|
Named Executive Officer
|
2015 Business and Operational Goals
|
2015 Goals Achieved
|
|
Laurence E. Cranch General Counsel
|
− maintain and improve our firm's good compliance record;
− improve the Legal and Compliance Department's level of client service;
− develop and retain high quality talent in the Legal and Compliance Department;
− manage the firm's legal and compliance risks; and
− continue to aggressively manage outside counsel and other expenses.
|
− required strict adherence to our firm's compliance policies and procedures and ensured our firm fulfills its fiduciary duties to clients;
− identified several areas that presented particular risk to AB with respect to compliance and adopted new processes and procedures to address these risks;
− enhanced AB's due diligence and compliance monitoring processes with respect to new products that involve particular compliance challenges;
− received positive evaluations from senior business leaders with respect to the performance of the Legal and Compliance Department;
− supervised an ongoing process within the Legal and Compliance Department focused on identifying practices and circumstances that risk exposing the firm to litigation and regulatory enforcement proceedings and took steps to mitigate this risk; and
− continued to actively manage outside counsel expenses.
|
|
John C. Weisenseel
CFO
|
− increase the firm's profitability by controlling expenses; − evaluate and support new business development opportunities;
− manage business funding requirements within the context of the firm’s capital and liquidity;
− assess financial processes and systems;
− ensure adherence to internal control structure and financial reporting standards;
− continue communications with the firm's investors and credit rating agencies; and
− identify and develop the next generation of leaders in the Finance and Administrative Services Departments.
|
− decreased non-compensation expenses compared to 2014;
− provided accounting and tax guidance in structuring, integrating and funding business development opportunities;
− repurchased AB Holding Units to offset earnings per unit dilution, which otherwise would result from employee equity-based compensation awards;
− improved the efficiency of internal financial reporting through the design and testing of a new, robust financial reporting system;
− enhanced internal financial reporting, including an increased focus on management operating metrics, to provide more useful information to senior management;
− maintained active dialogue with AB's investor community and credit rating agencies and sponsored the asset management industry annual CFO roundtable; and
− implemented several staffing changes in the Finance and Administrative Services Departments, providing better client service within our firm while reducing costs.
|
As indicated in the table above
, each of the named executive officers included in the table successfully achieved his goals in 2015. The compensation of each of these named executive officers reflected Mr. Kraus’s and the Compensation Committee’s judgment in assessing the importance of his achievements to our firm’s financial results.
130
Overview of Our CEO’s Compensation
In 2015, Mr. Kraus was compensated for his services as Chairman of the Board and CEO based on the terms set forth in his employment agreement dated as of June 21, 2012 (“
Kraus Employment Agreement
”). The Kraus Employment Agreement commenced on January 3, 2014 and terminates on January 2, 2019 (“
Employment Term
”), unless it is terminated earlier in accordance with its terms. Although the Employment Term did not commence until January 3, 2014, certain provisions of the Kraus Employment Agreement became effective on June 21, 2012, the date the agreement was signed, including those provisions
summarized below
pertaining to the grant of 2,722,052 restricted AB Holding Units to Mr. Kraus (“
June 2012 Grant
”) and termination of his employment.
The terms of the Kraus Employment Agreement were the result of arm’s-length negotiations between Mr. Kraus, members of the Compensation Committee, who discussed this matter during four Special Meetings of the Compensation Committee held in 2012, and other members of the Board. In addition, the Compensation Committee considered comparative compensation benchmarking data (“
Johnson Data
”) from Johnson Associates, Inc., a compensation consultant engaged by the Compensation Committee. The Johnson Data provided ranges of CEO compensation levels for 2011 at selected asset management companies and banks comparable to ours in terms of size and business mix, including salary, cash bonus, total cash compensation and total compensation. The comparable companies, which management selected with input from Johnson Associates, included:
|
Affiliated Managers Group, Inc.
|
Ameriprise Financial, Inc.
|
The Bank of New York Mellon Corp.
|
|
BlackRock Financial Management, Inc.
|
Credit Suisse Asset Management LLC
|
Eaton Vance Corp.
|
|
Federated Investors, Inc.
|
Franklin Resources, Inc.
|
Invesco Ltd.
|
|
Janus Capital Group Inc.
|
JPMorgan Asset Management Inc.
|
Lazard Ltd.
|
|
Legg Mason, Inc.
|
Morgan Stanley
|
Northern Trust Corporation
|
|
State Street Global Advisors Ltd.
|
T. Rowe Price Group, Inc.
|
|
In addition, the Johnson Data indicated that the compensation terms for Mr. Kraus set forth in the Kraus Employment Agreement were fully competitive and consistent with industry standards given our firm's size, scope and complexity, the importance of CEO continuity, Mr. Kraus's experience and integral role in the ongoing execution of our firm's long-term growth strategy, and the allocation of Mr. Kraus's compensation more heavily to restricted equity.
The Compensation Committee and the Executive Committee, based on the Johnson Data and other inquiry as needed, decided to structure the allocation of Mr. Kraus’s compensation under the Kraus Employment Agreement heavily toward the June 2012 Grant. For information regarding the Executive Committee,
see “Committees of the Board” in Item 10.
Compensation Elements
Base Salary
Mr. Kraus’s annual base salary under the Kraus Employment Agreement, which originally was set at $275,000, was increased to $400,000 by the Compensation Committee, effective January 1, 2014. This amount is comparable to the annual base salary paid to our most senior executives generally and is consistent with our firm’s policy to keep base salaries of executives and other highly-compensated employees low in relation to total compensation. Any future increase to Mr. Kraus's base salary is entirely in the discretion of the Compensation Committee.
Cash Bonus
Mr. Kraus did not receive a cash bonus for 2015, nor is he entitled to receive a future cash bonus during the remainder of the Employment Term. Any future cash bonus that may be paid to Mr. Kraus is entirely in the discretion of the Compensation Committee.
Restricted AB Holding Units
Mr. Kraus was awarded the June 2012 Grant upon execution of the Kraus Employment Agreement, on June 21, 2012. The size of the June 2012 Grant, which had a value of approximately $33 million based on the market price of an AB Holding Unit on June 21, 2012, reflected the determination by Mr. Kraus and the Board that this was a reasonable and appropriate amount of long-term incentive compensation in view of Mr. Kraus’s expertise and experience, his past compensation, and the compensation of the CEOs included in the Johnson Data.
Subject to accelerated vesting clauses in the Kraus Employment Agreement (
e.g.,
immediate vesting upon a “change in control” of our firm,
as discussed in detail below
), the June 2012 Grant vests ratably on each of the first five anniversaries of December
131
19, 2013, commencing December 19, 2014, provided, with respect to each installment, Mr. Kraus continues to be employed by AB on the vesting date. However, Mr. Kraus elected to delay delivery of all of the restricted AB Holding Units until December 19, 2018, the final vesting date, subject to acceleration upon a “change in control” of our firm and certain qualifying events of termination of employment (
see “Terms Relating to Change in Control and Termination of Employment” below
).
During the Employment Term, Mr. Kraus is paid the cash distributions payable with respect to his unvested and vested restricted AB Holding Units until the AB Holding Units are delivered or forfeited. These cash distributions generally are paid at the time distributions are made to AB Holding Unitholders.
As noted above
, Mr. Kraus did not receive an equity-based award for 2015, nor is he entitled to receive a future equity award during the remainder of the Employment Term. Accordingly, during the Employment Term, the totality of Mr. Kraus's compensation (other than his base salary) is and, absent any additional awards the Compensation Committee may choose to grant, will continue to be, dependent on the level of cash distributions on the restricted AB Holding Units granted to Mr. Kraus and the evolution of the trading price of an AB Holding Unit, both of which are partially dependent on the financial and operating results of our firm. Therefore, his long-term interests are, and will continue to be, aligned directly with the interests of our Unitholders and indirectly with the interests of our clients, as strong performance for our clients generally contributes directly to increases in assets under management and improved financial performance for the firm.
Perquisites and Benefits
Under the Kraus Employment Agreement, Mr. Kraus is entitled to receive the following perquisites and benefits:
|
•
|
personal use of company aircraft (provided he reimburses the company for any incremental cost resulting from such use), and the ability to have family members accompany him on company aircraft when Mr. Kraus travels for business purposes (provided that taxable income is imputed to him for any business flight on which family members are aboard);
|
|
•
|
personal use of a company car and driver;
|
|
•
|
following termination of his employment due to death or disability, continued health and welfare benefits (
see note 6 to “Potential Payments upon Termination or Change in Control” table below
for additional information); and
|
|
•
|
following termination of his employment by AB without cause or by Mr. Kraus for good reason, payments equal to the cost of COBRA coverage for the period for which he is entitled to COBRA.
|
Terms Relating to Change in Control and Termination of Employment
The June 2012 Grant will vest immediately upon a “change in control” of our firm. A change in control is defined as:
|
•
|
AXA ceasing to control the management of AB’s business; or
|
|
•
|
AB Holding ceasing to be publicly traded.
|
Mr. Kraus negotiated the change-in-control provisions
described immediately above
in order to ensure that AB would continue to be operated as a separately-managed entity and with a certain degree of independence and that AB Holding would continue as a publicly-traded entity. Both AXA and Mr. Kraus believed that these arrangements added significant value to AB. The Board understood that AXA had no intention of changing these arrangements during the Employment Term and, accordingly, concluded that the change-in-control provisions were acceptable and necessary in order to retain Mr. Kraus.
The Kraus Employment Agreement also provides for the immediate vesting of the next two installments of restricted AB Holding Units (or the final installment, if only one installment remains unvested as of the termination date) upon certain qualifying terminations of employment, including termination of Mr. Kraus’s employment:
132
|
•
|
by AB without cause, where “
cause
” includes, among other things:
|
|
|
•
|
the continued, willful failure by Mr. Kraus to perform substantially his duties with AB after a written demand for substantial performance is delivered to him by the Board;
|
|
|
•
|
Mr. Kraus’s conviction of, or plea of guilty or
nolo contendere
to, a crime that constitutes a felony;
|
|
|
•
|
the willful engaging by Mr. Kraus in misconduct that is materially and demonstrably injurious to AB or any of its affiliates;
|
|
|
•
|
the willful breach by Mr. Kraus of the covenant not to disclose any confidential information pertaining to AB or its affiliates or the covenant not to compete with AB or its affiliates; or
|
|
|
•
|
Mr. Kraus’s failure to comply with a material written company workplace policy applicable to him, and
|
|
|
•
|
by Mr. Kraus for good reason, where “
good reason
” generally includes actions taken by AB resulting in a material negative change in Mr. Kraus’s employment relationship, such as:
|
|
|
•
|
assignment to Mr. Kraus of duties materially inconsistent with his position;
|
|
|
•
|
any material breach of the Kraus Employment Agreement by AB;
|
|
|
•
|
a requirement by AB that Mr. Kraus be based at any office or location more than 25 miles commuting distance from company headquarters; or
|
|
|
•
|
a requirement that Mr. Kraus report to an officer or employee of AB instead of reporting directly to the Board and the CEO of AXA.
|
|
In addition, if Mr. Kraus dies or becomes disabled during the Employment Term, Mr. Kraus immediately will vest in a pro-rated portion of any restricted AB Holding Units otherwise due to vest on the next vesting date.
Mr. Kraus negotiated the provisions
described immediately above
in order to preserve the value of his long-term incentive compensation arrangement. The Board agreed to these provisions because they were typical of executive compensation agreements for executives at Mr. Kraus’s level, they provided Mr. Kraus with effective incentives for future performance, and because the Board concluded that they were necessary to retain Mr. Kraus.
The Board also concluded that the change-in-control and termination provisions in the Kraus Employment Agreement fit within AB’s overall compensation objectives because these provisions, which aligned with AB’s goal of providing Mr. Kraus with effective incentives for future performance:
|
•
|
permitted AB to retain a highly-qualified chief executive officer;
|
|
|
•
|
aligned Mr. Kraus’s long-term interests with those of AB’s Unitholders and clients;
|
|
|
•
|
were consistent with AXA’s and the Board’s expectations with respect to the manner in which AB and AB Holding would be operated during Mr. Kraus’s tenure; and
|
|
|
•
|
were consistent with the Board’s expectations that Mr. Kraus would not be terminated without cause and that no steps would be taken that would provide him with the ability to terminate the agreement for good reason.
|
|
Compensation Committee
In 2015, the Compensation Committee consisted of Ms. Slutsky and Messrs. Condron (Chair), Duverne, Elliott and Kraus. The Compensation Committee held three meetings in 2015.
As discussed in “NYSE Governance Matters” in Item 10
, AB Holding, as a limited partnership, is exempt from NYSE rules that require public companies to have a compensation committee consisting solely of independent directors. AXA owns, indirectly, an approximate 62.8% economic interest in AB (as of December 31, 2015), and compensation expense is a significant component of our financial results. For these reasons, Mr. Duverne, Deputy CEO of AXA, is a member of the Compensation Committee, and any action taken by the Compensation Committee requires the affirmative vote or consent of an executive officer of one or more of our parent companies. (Presently, Mr. Duverne is the only member of the Compensation Committee who is also an executive officer of one or more of our parent companies.)
The Compensation Committee has general oversight of compensation and compensation-related matters, including:
133
|
•
|
determining cash bonuses;
|
|
•
|
determining contributions and awards under incentive plans or other compensation arrangements (whether qualified or non-qualified) for employees of AB and its subsidiaries, and amending or terminating such plans or arrangements or any welfare benefit plan or arrangement or making recommendations to the Board with respect to adopting any new incentive compensation plan, including equity-based plans;
|
|
•
|
reviewing and approving the compensation of our CEO, evaluating his performance, and determining and approving his compensation level based on this evaluation; and
|
|
•
|
reviewing and discussing the CD&A, and recommending to the Board its inclusion in the Partnerships’ Forms 10-K and, when applicable, proxy statements.
|
The Compensation Committee’s year-end process generally has focused on the cash bonuses and long-term incentive compensation awards granted to senior management. Mr. Kraus is an active member of the Compensation Committee, but he does not participate in any committee discussions or votes regarding his own compensation. Mr. Kraus, working with the COO and other members of senior management, provides recommendations for individual employee awards to the Compensation Committee for its consideration. As part of this process, management provides the committee with compensation benchmarking data from one or more compensation consultants. For 2015, we paid $26,750 to McLagan for executive compensation benchmarking data and an additional $272,654 for survey and consulting services relating to the amount and form of compensation paid to employees other than executives.
The Compensation Committee held its regularly-scheduled meeting regarding year-end compensation on December 11, 2015, at which meeting it discussed and approved senior management’s compensation recommendations. The Compensation Committee did not retain its own consultants.
The Compensation Committee’s functions are more fully described in the committee’s charter, which is available on-line in the “Management & Governance” section of our Internet Site
.
Other Compensation-Related Matters
AB and AB Holding are, respectively, private and public limited partnerships, and are subject to taxes other than federal and state corporate income tax (
see “Structure-related Risks” in Item 1A and Note 19 to AB’s consolidated financial statements in Item 8
). Accordingly, Section 162(m) of the Code, which limits tax deductions relating to executive compensation otherwise available to entities taxed as corporations, is not applicable to either AB or AB Holding.
Compensation Committee Interlocks and Insider Participation
Mr. Duverne is the Deputy CEO of AXA, the ultimate parent company of the General Partner.
Mr. Kraus is Chairman of the Board and CEO of the General Partner and, accordingly, also serves in that capacity for AB and AB Holding. Mr. Kraus is also a director of AXA Financial, AXA Equitable and MLOA. In addition, Mr. Kraus is a member of the Management Committee of AXA. Other than Mr. Kraus, no executive officer of AB served as (i) a member of a compensation committee or (ii) a director of another entity, an executive officer of which served as a member of AB’s Compensation Committee or Board.
Compensation Committee Report
The members of the Compensation Committee reviewed and discussed with management the Compensation Discussion and Analysis set forth above and, based on such review and discussion, recommended to the Board its inclusion in this Form 10-K.
|
Christopher M. Condron (Chair)
|
Denis Duverne
|
|
Steven G. Elliott
|
Peter S. Kraus
|
|
Lorie A. Slutsky
|
|
134
Summary Compensation Table for 2015
Total compensation of our named executive officers for
2015
,
2014
and
2013
, as applicable, is as follows:
|
Name and
Principal Position
|
Year
|
Salary($)
|
Bonus($)
|
Stock Awards
(1)(2)
($)
|
All Other
Compensation ($)
|
Total($)
|
|||||||||||
|
Peter S. Kraus
(3)
|
2015
|
400,000
|
|
—
|
|
—
|
|
6,544,627
|
|
6,944,627
|
|
||||||
|
Chairman and CEO
|
2014
|
411,539
|
|
—
|
|
—
|
|
6,374,364
|
|
6,785,903
|
|
||||||
|
2013
|
275,000
|
|
—
|
|
—
|
|
3,168,218
|
|
3,443,218
|
|
|||||||
|
James A. Gingrich
|
2015
|
400,000
|
|
3,940,000
|
|
3,660,000
|
|
892,863
|
|
8,892,863
|
|
||||||
|
Chief Operating Officer
|
2014
|
415,385
|
|
3,940,000
|
|
3,660,000
|
|
872,272
|
|
8,887,657
|
|
||||||
|
2013
|
400,000
|
|
3,940,000
|
|
3,660,000
|
|
654,791
|
|
8,654,791
|
|
|||||||
|
Robert P. van Brugge
|
2015
|
400,000
|
|
2,040,000
|
|
1,760,000
|
|
339,762
|
|
4,539,762
|
|
||||||
|
Chairman and CEO of SCB LLC
|
2014
|
415,385
|
|
1,940,000
|
|
1,660,000
|
|
327,253
|
|
4,342,638
|
|
||||||
|
2013
|
400,000
|
|
1,565,000
|
|
1,285,000
|
|
563,175
|
|
3,813,175
|
|
|||||||
|
Laurence E. Cranch
(4)
|
2015
|
400,000
|
|
915,000
|
|
635,000
|
|
334,969
|
|
2,284,969
|
|
||||||
|
General Counsel
|
|
|
|||||||||||||||
|
|
|
||||||||||||||||
|
John C. Weisenseel
|
2015
|
375,000
|
|
915,000
|
|
610,000
|
|
129,559
|
|
2,029,559
|
|
||||||
|
CFO
|
2014
|
389,423
|
|
800,000
|
|
500,000
|
|
135,457
|
|
1,824,880
|
|
||||||
|
2013
|
375,000
|
|
710,000
|
|
440,000
|
|
116,180
|
|
1,641,180
|
|
|||||||
________________________________________________________________________________________________________________________
|
(1)
|
The figures in the “Stock Awards” column provide the aggregate grant date fair value of the awards calculated in accordance with FASB ASC Topic 718. For the assumptions made in determining these values,
see Note 17 to AB’s consolidated financial statements in Item 8.
|
|
(2)
|
See “Grants of Plan-based Awards in 2015” below
for information regarding the 2015 long-term incentive compensation awards granted to our named executive officers.
|
|
(3)
|
Mr. Kraus’s compensation structure is set forth in the Kraus Employment Agreement, the terms of which are
described above in “Overview of Our CEO’s Compensation”
.
|
|
(4)
|
We have not provided 2014 or 2013 compensation for Mr. Cranch because he was not a named executive officer in 2014
|
or 2013.
The “All Other Compensation” column includes the aggregate incremental cost to our company of certain other expenses and perquisites. For 2015, the column includes the following:
|
Name
|
Quarterly Distributions on AB Holding Unit Awards ($)
|
Aircraft-related Imputed Income ($)
|
Personal Use of Car and Driver
($)
|
Contributions to Profit Sharing Plan ($)
|
Life Insurance Premiums
($)
|
Financial Planning Services
($)
|
||||||||||||
|
Peter S. Kraus
|
6,304,272
|
|
49,117
|
|
(1)
|
177,988
|
|
(2)
|
13,250
|
|
—
|
|
—
|
|
||||
|
James A. Gingrich
|
858,033
|
|
—
|
|
—
|
|
13,250
|
|
1,806
|
|
19,774
|
|
||||||
|
Robert P. van Brugge
|
325,882
|
|
—
|
|
—
|
|
13,250
|
|
630
|
|
—
|
|
||||||
|
Laurence E. Cranch
|
318,519
|
|
—
|
|
—
|
|
13,250
|
|
3,200
|
|
—
|
|
||||||
|
John C. Weisenseel
|
114,632
|
|
—
|
|
—
|
|
13,250
|
|
1,677
|
|
—
|
|
||||||
________________________________________________________________________________________________________________________
|
(1)
|
We use the Standard Industry Fare Level ("
SIFL
") methodology to calculate the amount to include in the taxable income of named executive officers for the personal use of company-owned aircraft. Using the SIFL methodology, which was approved by the Compensation Committee, limits our ability to deduct the full cost of personal use of company-owned aircraft by our executive officers. Mr. Kraus reimburses AB for any incremental cost resulting from his personal use of company-owned aircraft. However, taxable income is imputed to Mr. Kraus for business flights on which family members are aboard. The figure in the table represents the taxable income for the 12 months ended October 31, 2015 that was imputed to Mr. Kraus. In addition, AB was unable to deduct approximately $1.4 million of the cost of company-owned
|
135
aircraft, representing a tax cost to AB of $14,340, due to the fact that family members accompanied Mr. Kraus on certain trips on company-owned aircraft taken for business purposes.
|
(2)
|
Includes lease costs ($15,422), driver compensation ($143,657) and other car-related costs ($18,909), such as parking, gas, tolls, and repairs and maintenance.
|
Grants of Plan-based Awards in 2015
Grants of awards under the 2010 Plan, our equity compensation plan, during 2015 made to our named executive officers are as follows:
|
Name
|
Grant Date
|
All Other Stock Awards:
Number of Shares of Stock
or Units (#)
|
Grant Date Fair Value
of Stock Awards ($)
|
||||||
|
Peter S. Kraus
|
—
|
|
—
|
|
—
|
|
|||
|
James A. Gingrich
(1)
|
12/11/2015
|
|
158,992
|
|
3,660,000
|
|
|||
|
Robert P. van Brugge
(1)
|
12/11/2015
|
|
76,455
|
|
1,760,000
|
|
|||
|
Laurence E. Cranch
(1)
|
12/11/2015
|
|
27,585
|
|
635,000
|
|
|||
|
John C. Weisenseel
(1)
|
12/11/2015
|
|
26,499
|
|
610,000
|
|
|||
________________________________________________________________________________________________________________________
|
(1)
|
As discussed above in “Overview of 2015 Incentive Compensation Program” and “Compensation Elements for Named Executive Officers—Long-Term Incentive Compensation Awards”
, long-term incentive compensation awards generally are denominated in restricted AB Holding Units. The 2015 long-term incentive compensation awards granted to our named executive officers under the Incentive Compensation Program and the 2010 Plan are shown in the “All Other Stock Awards” column of this table, the “Stock Awards” column of the Summary Compensation Table and the “AB Holding Unit Awards” columns of the Outstanding Equity Awards at 2015 Fiscal Year-End Table.
|
In 2015, the number of restricted AB Holding Units comprising long-term incentive compensation awards was based on the closing price of an AB Holding Unit as reported for NYSE composite transactions on December 11, 2015, the date on which the Compensation Committee approved the awards.
136
Outstanding Equity Awards at 2015 Fiscal Year-End
Outstanding equity awards held by our named executive officers as of December 31, 2015 are as follows:
|
|
Option Awards
|
AB Holding Unit Awards
|
||||||||||||||||
|
Name
|
Number of Securities
Underlying Unexercised
Options Exercisable (#)
|
Number of Securities Underlying Unexercised Options Unexercisable (#)
|
Option Exercise Price ($)
|
Option Expiration Date
|
Number of Shares
or Units of Stock That
Have Not Vested (#)
|
Market
Value of Shares or
Units of
Stock That Have Not Vested ($)
|
||||||||||||
|
Peter S. Kraus
(1)
|
—
|
|
—
|
|
—
|
|
—
|
|
1,633,231
|
|
38,952,559
|
|
||||||
|
James A. Gingrich
(2)(3)
|
263,533
|
|
—
|
|
17.05
|
|
1/23/2019
|
|
395,675
|
|
9,436,849
|
|
||||||
|
Robert P. van Brugge
(4)
|
—
|
|
—
|
|
—
|
|
—
|
|
177,609
|
|
4,235,975
|
|
||||||
|
Laurence E. Cranch
(5)(6)
|
78,348
|
|
—
|
|
17.05
|
|
1/23/2019
|
|
68,956
|
|
1,644,601
|
|
||||||
|
John C. Weisenseel
(7)
|
—
|
|
—
|
|
—
|
|
—
|
|
55,187
|
|
1,316,210
|
|
||||||
________________________________________________________________________________________________________________________
|
(1)
|
For details regarding the restricted AB Holding Units awarded to Mr. Kraus under the Kraus Employment Agreement,
see “Overview of Our CEO’s Compensation – Compensation Elements – Restricted AB Holding Units” above
.
|
|
(2)
|
Mr. Gingrich was awarded (i) 158,992 restricted AB Holding Units in December 2015 that are scheduled to vest in 25% increments on each of December 1, 2016, 2017, 2018 and 2019, (ii) 150,992 restricted AB Holding Units in December 2014, 25% of which vested on December 1, 2015 and the remainder of which is scheduled to vest in 25% increments on each of December 1, 2016, 2017 and 2018, (iii) 168,897 restricted AB Holding Units in December 2013, 25% of which vested on each of December 1, 2014 and 2015, and the remainder of which is scheduled to vest in additional 25% increments on each of December 1, 2016 and 2017, and (iv) 155,968 restricted AB Holding Units in December 2012, 25% of which vested on each of December 1, 2013, 2014 and 2015, and the remainder of which is scheduled to vest in an additional 25% increment on December 1, 2016.
|
|
(3)
|
Mr. Gingrich was granted 263,533 options to buy AB Holding Units in January 2009, 20% of which vested and became exercisable on each of January 23, 2010, 2011, 2012, 2013 and 2014.
|
|
(4)
|
Mr. van Brugge was awarded (i) 76,455 restricted AB Holding Units in December 2015 that are scheduled to vest in 25% increments on each of December 1, 2016, 2017, 2018 and 2019, (ii) 68,482 restricted AB Holding Units in December 2014, 25% of which vested on December 1, 2015 and the remainder of which is scheduled to vest in 25% increments on each of December 1, 2016, 2017 and 2018, (iii) 59,299 restricted AB Holding Units in December 2013, 25% of which vested on each of December 1, 2014 and 2015, and the remainder of which is scheduled to vest in additional 25% increments on each of December 1, 2016 and 2017, and (iv) 80,574 restricted AB Holding Units in December 2012, 25% of which vested on each of December 1, 2013, 2014 and 2015, and the remainder of which is scheduled to vest in an additional 25% increment on December 1, 2016.
|
|
(5)
|
Mr. Cranch was awarded (i) 27,585 restricted AB Holding Units in December 2015 that are scheduled to vest in 25% increments on each of December 1, 2016, 2017, 2018 and 2019, (ii) 26,197 restricted AB Holding Units in December 2014, 25% of which vested on December 1, 2015 and the remainder of which is scheduled to vest in 25% increments on each of December 1, 2016, 2017 and 2018, (iii) 29,303 restricted AB Holding Units in December 2013, 25% of which vested on each of December 1, 2014 and 2015, and the remainder of which is scheduled to vest in additional 25% increments on each of December 1, 2016 and 2017, and (iv) 28,290 restricted AB Holding Units in December 2012, 25% of which vested on each of December 1, 2013, 2014 and 2015, and the remainder of which is scheduled to vest in an additional 25% increment on December 1, 2016.
|
|
(6)
|
Mr. Cranch was granted 78,348 options to buy AB Holding Units in January 2009, 20% of which vested and became exercisable on each of January 23, 2010, 2011, 2012, 2013 and 2014.
|
|
(7)
|
Mr. Weisenseel was awarded (i) 26,499 restricted AB Holding Units in December 2015 that are scheduled to vest in 25% increments on each of December 1, 2016, 2017, 2018 and 2019, (ii) 20,628 restricted AB Holding Units in December 2014, 25% of which vested on December 1, 2015 and the remainder of which is scheduled to vest in 25% increments on each of December 1, 2016, 2017 and 2018, (iii) 20,305 restricted AB Holding Units in December 2013, 25% of which vested on each of December 1, 2014 and 2015, and the remainder of which is scheduled to vest in additional 25% increments on each of December 1, 2016 and 2017, and (iv) 12,265 restricted AB Holding Units in December 2012, 25% of which vested on each of December 1, 2013, 2014 and 2015, and the remainder of which is scheduled to vest in an additional 25% increment on December 1, 2016.
|
137
Option Exercises and AB Holding Units Vested in 2015
AB Holding Units held by our named executive officers that vested during 2015 are as follows:
|
|
AB Holding Unit Awards
|
|||||
|
Name
|
Number of AB
Holding
Units Acquired on
Vesting (#)
|
Value Realized on
Vesting ($)
|
||||
|
Peter S. Kraus
(1)
|
544,410
|
|
12,679,309
|
|
||
|
James A. Gingrich
|
151,103
|
|
3,635,538
|
|
||
|
Robert P. van Brugge
|
67,697
|
|
1,628,790
|
|
||
|
Laurence E. Cranch
|
30,430
|
|
732,146
|
|
||
|
John C. Weisenseel
|
30,706
|
|
738,786
|
|
||
________________________________________________________________________________________________________________________
|
(1)
|
Mr. Kraus deferred delivery of the 544,410 restricted AB Holding Units that vested in December 2015.
See “Overview of Our CEO’s Compensation – Compensation Elements – Restricted AB Holding Units” above
for additional information.
|
Pension Benefits for 2015
None of our named executive officers are entitled to benefits under the Amended and Restated Retirement Plan for Employees of AB (as amended and restated as of January 1, 2015, “
Retirement Plan
”), our company pension plan. For additional information regarding the Retirement Plan, including interest rates and actuarial assumptions,
see Note 16 to AB’s consolidated financial statements in Item 8.
Non-Qualified Deferred Compensation for 2015
Vested and unvested non-qualified deferred compensation contributions, earnings and distributions of our named executive officers during 2015 and their non-qualified deferred compensation plan balances as of December 31, 2015 are as follows:
|
Name
|
Executive
Contributions in Last FY ($)
|
Aggregate
Earnings in Last FY ($)
|
Aggregate
Withdrawals/
Distributions ($)
|
Aggregate
Balance at
Last FYE ($)
|
||||||||
|
Peter S. Kraus
(1)
|
12,679,318
|
|
(1,850,975
|
)
|
—
|
|
38,952,564
|
|
||||
|
James A. Gingrich
(2)
|
—
|
|
(19,090
|
)
|
(186,278
|
)
|
1,271,564
|
|
||||
|
Robert P. van Brugge
(3)
|
—
|
|
149
|
|
(62,649
|
)
|
—
|
|
||||
|
Laurence E. Cranch
(2)
|
—
|
|
4,717
|
|
(510,946
|
)
|
414,222
|
|
||||
|
John C. Weisenseel
(3)
|
—
|
|
119
|
|
(25,132
|
)
|
25,013
|
|
||||
________________________________________________________________________________________________________________________
|
(1)
|
Mr. Kraus deferred delivery of the 544,410 restricted AB Holding Units that vested in December 2015, the value of which, as of December 19, 2015 (vesting date), is reflected in "Executive Contributions in Last FY", until the earlier of December 19, 2018, his death and the date on which a change in control of AB occurs. "Aggregate Earnings in Last FY" represents the change in the value of these restricted AB Holding Units from December 19, 2015 to December 31, 2015. "Aggregate Balance at Last FYE" represents the aggregate value of the portions of the June 2012 Grant that are scheduled to vest in equal increments on each of December 19, 2016, 2017 and 2018.
See “Overview of Our CEO’s Compensation – Compensation Elements – Restricted AB Holding Units” above
for additional information.
|
|
(2)
|
Amounts shown reflect Messrs. Gingrich's and Cranch's interests from pre-2009 awards under the predecessor plan to the Incentive Compensation Program, under which plan participants were permitted to allocate their awards (i) among notional investments in AB Holding Units, certain of the investment services we provided to clients and a money market fund, or (ii) under limited circumstances, in options to buy AB Holding Units. For additional information about the Incentive Compensation Program,
see Notes 2 and 17 to AB’s consolidated financial statements in Item 8
.
|
|
(3)
|
The amounts shown in “Aggregate Earnings in Last FY” for Messrs. van Brugge and Weisenseel reflect the interest payments associated with the Deferred Cash portions of their respective long-term incentive compensation awards (in 2011 for Mr. van Brugge and in 2012 for Mr. Weisenseel). Interest accrues monthly based on our monthly weighted average cost of funds (approximately 0.3% in 2015) and will be credited to Messrs. van Brugge and Weisenseel annually until the cash
|
138
is distributed to them. The amounts shown in “Aggregate Withdrawals/Distributions” for Messrs. van Brugge and Weisenseel represent their respective Deferred Cash distributions during 2015, and the amounts shown in “Aggregate Balance at Last FYE” represent their respective Deferred Cash balances as of December 31, 2015.
Potential Payments upon Termination or Change in Control
Estimated payments and benefits to which our named executive officers would have been entitled upon a change in control of AB or the specified qualifying events of termination of employment as of December 31, 2015 are as follows:
|
Name
|
Cash
Payments
(1)
($)
|
Acceleration of Restricted
AB Holding Unit
Awards
(2)
($)
|
Other Benefits ($)
|
||||||
|
Peter S. Kraus
(3)
|
|||||||||
|
Change in control
|
—
|
|
38,952,564
|
|
19,855
|
|
|||
|
Termination by AB without cause
|
—
|
|
25,968,376
|
|
19,855
|
|
|||
|
Termination by Mr. Kraus for good reason
|
—
|
|
25,968,376
|
|
19,855
|
|
|||
|
Death or disability
(4)(5)(6)
|
—
|
|
12,984,188
|
|
19,855
|
|
|||
|
James A. Gingrich
|
|
|
|
|
|
|
|||
|
Resignation or termination by AB without cause (complies with applicable agreements and restrictive covenants)
(2)
|
—
|
|
9,436,849
|
|
—
|
|
|||
|
Death or disability
(7)
|
—
|
|
9,436,849
|
|
—
|
|
|||
|
Robert P. van Brugge
|
|
|
|
|
|
|
|||
|
Resignation or termination by AB without cause (complies with applicable agreements and restrictive covenants)
(2)
|
—
|
|
4,235,975
|
|
—
|
|
|||
|
Death or disability
(7)
|
—
|
|
4,235,975
|
|
—
|
|
|||
|
Laurence E. Cranch
|
|
|
|
|
|
|
|||
|
Resignation or termination by AB without cause (complies with applicable agreements and restrictive covenants)
(2)
|
—
|
|
1,644,601
|
|
—
|
|
|||
|
Death or disability
(7)
|
—
|
|
1,644,601
|
|
—
|
|
|||
|
John C. Weisenseel
|
|
|
|
|
|
|
|||
|
Resignation or termination by AB without cause (complies with applicable agreements and restrictive covenants)
(2)
|
25,013
|
|
1,316,210
|
|
—
|
|
|||
|
Death or disability
(7)
|
25,013
|
|
1,316,210
|
|
—
|
|
|||
_________________________________________________________________________________________________________________
|
(1)
|
For Mr. Weisenseel, amounts shown represent the portions of his awards he elected to allocate to Deferred Cash pursuant to the Incentive Compensation Program that were unvested as of December 31, 2015, and the vesting of which would have accelerated had his employment terminated as of such date under the circumstances specified in the table. (Mr. Weisenseel allocated a portion of his 2012 award to Deferred Cash.) In addition, it is possible that each named executive officer, other than Mr. Kraus, could receive a cash severance payment on the termination of his employment. The amounts of any such cash severance payments would be determined at the time of such termination, so we are unable to estimate such amounts.
|
|
(2)
|
See Notes 2 and 17 in AB’s consolidated financial statements in Item 8 and “Compensation Elements for Named Executive Officers – Long-Term Incentive Compensation Awards” above
for a discussion of the terms set forth in long-term incentive compensation award agreements relating to termination of employment
.
|
|
(3)
|
If a change in control of AB or a qualifying event of termination of employment had occurred as of December 31, 2015, Mr. Kraus would have been entitled to receive (i) accelerated vesting under the Kraus Employment Agreement of the portion of the June 2012 Grant that remained unvested (in the case of a change in control of AB), the portions of the June 2012 Grant scheduled to vest on December 19, 2016 and 2017 (in the case of termination by AB without cause or termination by Mr. Kraus for good reason), or a pro-rated portion of the June 2012 Grant scheduled to vest on December 19, 2016 (in the case of termination due to death or disability), as shown in “Acceleration of Restricted AB Holding Unit Awards”, and (ii) a payment of $19,855 for continuing health and welfare benefits, as shown in “Other Benefits”. For additional information, including a detailed description of terms in the Kraus Employment Agreement relating to change in control and qualifying events of termination of employment,
see “Overview of Our CEO’s Compensation” above
.
|
|
(4)
|
The Kraus Employment Agreement indicates that, if Mr. Kraus dies or becomes disabled, he immediately vests in a pro-rated portion of any restricted AB Holding Units otherwise due to vest on the next vesting date.
|
139
|
(5)
|
The Kraus Employment Agreement defines “Disability” as a good faith determination by AB that Mr. Kraus is physically or mentally incapacitated and has been unable for a period of 120 days in the aggregate during any 12-month period to perform substantially all of the duties for which he is responsible immediately before the commencement of the incapacity.
|
|
(6)
|
Under the Kraus Employment Agreement, upon termination of Mr. Kraus’s employment due to death or disability, AB will provide at its expense continued health and welfare benefits for Mr. Kraus, his spouse and his dependents through the end of the calendar year in which termination occurs. Thereafter, until the date Mr. Kraus (or, in the case of his spouse, his spouse) reaches age 65, AB will provide Mr. Kraus and his spouse with access to participation in AB’s medical plans at Mr. Kraus’s (or his spouse’s) sole expense based on a reasonably determined fair market value premium rate.
|
|
(7)
|
“Disability” is defined in the Incentive Compensation Program award agreements of each of Messrs. Gingrich, van Brugge, Cranch and Weisenseel, and in the Special Option Program award agreement of Messrs. Gingrich and Cranch, as the inability to engage in any substantial gainful activity by reason of any medically determinable physical or mental impairment that can be expected to last for a continuous period of not less than 12 months, as determined by the carrier of the long-term disability insurance program maintained by AB or its affiliate that covers the named executive officer.
|
Director Compensation in 2015
During 2015, we compensated our directors, who are not employed by our company or by any of our affiliates (“
Eligible Directors
”), as follows:
|
Name
|
Fees Earned or Paid in Cash($)
|
Stock
Awards
(1)(3)
($)
|
Option
Awards
(2)(3)
($)
|
Total($)
|
||||||||
|
Christopher M. Condron
|
78,500
|
|
60,000
|
|
60,000
|
|
198,500
|
|
||||
|
Steven G. Elliott
|
95,000
|
|
120,000
|
|
—
|
|
215,000
|
|
||||
|
Deborah S. Hechinger
|
69,500
|
|
60,000
|
|
60,000
|
|
189,500
|
|
||||
|
Weston M. Hicks
|
68,000
|
|
120,000
|
|
—
|
|
188,000
|
|
||||
|
Heidi S. Messer
|
48,000
|
|
120,000
|
|
—
|
|
168,000
|
|
||||
|
Scott A. Schoen
|
69,500
|
|
120,000
|
|
—
|
|
189,500
|
|
||||
|
Lorie A. Slutsky
|
69,500
|
|
120,000
|
|
—
|
|
189,500
|
|
||||
|
Joshua A. Weinreich
|
68,000
|
|
120,000
|
|
—
|
|
188,000
|
|
||||
________________________________________________________________________________________________________________________
|
(1)
|
The aggregate number of restricted AB Holding Units underlying awards outstanding at December 31, 2015 was: for Mr. Condron, 6,771 AB Holding Units; for Ms. Hechinger, 4,501 AB Holding Units; for Ms. Messer, 3,781 AB Holding Units; for Mr. Schoen, 11,486 AB Holding Units; for Mr. Weinreich, 10,244 AB Holding Units; and for each of Ms. Slutsky and Messrs. Elliott and Hicks, 13,540 AB Holding Units.
|
|
(2)
|
The aggregate number of options outstanding at December 31, 2015 was: for Mr. Condron, options to buy 64,103 AB Holding Units; for Mr. Elliott, options to buy 26,383 AB Holding Units; for Ms. Hechinger, options to buy 90,868 AB Holding Units; for Mr. Hicks, options to buy 44,938 AB Holding Units; for Ms. Slutsky, options to buy 41,826 AB Holding Units; and for Mr. Weinreich, options to buy 5,774 AB Holding Units. Ms. Messer and Mr. Schoen do not own any options to buy AB Holding Units.
|
|
(3)
|
Reflects the aggregate grant date fair value of the awards calculated in accordance with FASB ASC Topic 718. For the assumptions made in determining these values,
see Note 17 to AB’s consolidated financial statements in Item 8.
|
The General Partner pays fees, and makes equity-based awards, only to Eligible Directors. Through December 31, 2015, these fees and awards consisted of:
|
•
|
an annual retainer of $50,000 (paid quarterly after any quarter during which an Eligible Director serves on the Board);
|
|
•
|
a fee of $1,500 for participating in a meeting of the Board, or any duly constituted committee of the Board, whether in person or by telephone;
|
|
•
|
an annual retainer of $15,000 for acting as Chair of the Audit Committee;
|
|
•
|
an annual retainer of $7,500 for acting as Chair of the Compensation Committee;
|
|
•
|
an annual retainer of $7,500 for acting as Chair of the Governance Committee; and
|
|
•
|
an annual equity-based grant under an equity compensation plan consisting of (at each Eligible Director’s election):
|
|
•
|
restricted AB Holding Units with a grant date value of $120,000;
|
|
•
|
options to buy AB Holding Units with a grant date value of $120,000; or
|
|
•
|
restricted AB Holding Units with a grant date value of $60,000 and options to buy AB Holding Units with a grant date value of $60,000.
|
140
Equity grants to Eligible Directors generally are made at the May meeting of the Board. The date of the May meeting is set by the Board the previous year.
At a regularly-scheduled meeting of the Board held during May 2015, the Board, consistent with elections made by our Eligible Directors during the first quarter of 2015, granted to (i) each of Mr. Condron and Ms. Hechinger, 1,891 restricted AB Holding Units and options to buy 14,528 AB Holding Units at $31.74 per AB Holding Unit, and (ii) each of Mses. Messer and Slutsky and Messrs. Elliott, Hicks, Schoen and Weinreich, 3,781 restricted AB Holding Units. The exercise price of the options was the closing price of an AB Holding Unit as reported for NYSE composite transactions on May 21, 2015, the date on which the Board approved the awards. For information about how the Black-Scholes value was calculated,
see Notes 2 and 17 to AB’s consolidated financial statements in Item 8
.
Options granted to Eligible Directors become exercisable ratably over three years. Restricted AB Holding Units granted to Eligible Directors “cliff” vest after three years (
i.e.
, 100% of the award is distributed on the third anniversary of the grant date). In order to avoid any perception that our directors’ exercise of their fiduciary duties might be impaired, these options and restricted AB Holding Units are not forfeitable, except if the Eligible Director is terminated for “Cause”, as that term is defined in the 2010 Plan or applicable award agreement. Accordingly, vesting and exercisability of options continues following an Eligible Director’s resignation from the Board. Restricted AB Holding Units are distributed as soon as administratively possible following an Eligible Director’s resignation from the Board.
The General Partner may reimburse any director for reasonable expenses incurred in connection with attendance at Board meetings as well as additional Board responsibilities. AB Holding and AB, in turn, reimburse the General Partner for expenses incurred by the General Partner on their behalf, including amounts in respect of directors’ fees and expenses. These reimbursements are subject to any relevant provisions of the AB Holding Partnership Agreement and the AB Partnership Agreement.
At a regularly-scheduled meeting of the Board held during July 2015, the Board approved, effective January 1, 2016, the Eligible Director compensation elements
described immediately below
and agreed to re-consider such compensation elements no less frequently than every five years:
|
•
|
an annual retainer of $75,000 (paid quarterly after any quarter during which an Eligible Director serves on the Board);
|
|
•
|
a fee of $5,000 for participating in any meeting of the Board, whether in person or by telephone, in excess of the six regularly-scheduled Board meetings each year;
|
|
•
|
a fee of $2,000 for participating in any meeting of any duly constituted committee of the Board, whether in person or by telephone, in excess of the number of regularly-scheduled committee meetings each year (
i.e.
, in excess of seven meetings of the Audit Committee and three meetings of each of the Executive Committee, the Compensation Committee and the Governance Committee);
|
|
•
|
an annual retainer of $20,000 for acting as Lead Independent Director;
|
|
•
|
an annual retainer of $25,000 for acting as Chair of the Audit Committee;
|
|
•
|
an annual retainer of $12,500 for acting as Chair of the Compensation Committee;
|
|
•
|
an annual retainer of $12,500 for acting as Chair of the Governance Committee;
|
|
•
|
an annual retainer of $12,500 for serving as a member of the Audit Committee;
|
|
•
|
an annual retainer of $6,000 for serving as a member of the Executive Committee;
|
|
•
|
an annual retainer of $6,000 for serving as a member of the Compensation Committee;
|
|
•
|
an annual retainer of $6,000 for serving as a member of the Governance Committee; and
|
|
•
|
an annual equity-based grant
under an equity compensation plan consisting of (at each Eligible Director’s election):
|
|
•
|
restricted AB Holding Units with a grant date value of $150,000;
|
|
•
|
options to buy AB Holding Units with a grant date value of $150,000; or
|
|
•
|
restricted AB Holding Units with a grant date value of $75,000 and options to buy AB Holding Units with a grant date value of $75,000.
|
The Board also approved the following increases to Eligible Director compensation, effective as of January 1, 2018:
|
•
|
an annual retainer of $85,000 (paid quarterly after any quarter during which the director serves on the Board); and
|
|
•
|
an annual equity-based grant
under an equity compensation plan consisting of (at each Eligible Director’s election):
|
|
•
|
restricted AB Holding Units with a grant date value of $170,000;
|
|
•
|
options to buy AB Holding Units with a grant date value of $170,000; or
|
|
•
|
restricted AB Holding Units with a grant date value of $85,000 and options to buy AB Holding Units with a grant date value of $85,000.
|
141
Securities Authorized for Issuance under Equity Compensation Plans
AB Holding Units to be issued pursuant to our equity compensation plans as of
December 31, 2015
are as follows:
Equity Compensation Plan Information
|
Plan Category
|
Number of securities to be issued upon exercise of outstanding options, warrants and rights
|
Weighted average exercise price of outstanding options, warrants and rights
|
Number of securities remaining available for future issuance
(1)
|
|||||||
|
Equity compensation plans approved by security holders
|
5,398,471
|
|
$
|
47.59
|
|
12,538,812
|
|
|||
|
Equity compensation plans not approved by security holders
|
—
|
|
—
|
|
—
|
|
||||
|
Total
|
5,398,471
|
|
$
|
47.59
|
|
12,538,812
|
|
|||
________________________________________________________________________________________________________________________
|
(1)
|
All AB Holding Units remaining available for future issuance will be issued pursuant to the 2010 Plan.
|
There are no AB Units to be issued pursuant to an equity compensation plan.
For information about our equity compensation plans,
see Note 17 to AB’s consolidated financial statements in Item 8.
Principal Security Holders
As of
December 31, 2015
, we had no information that any person beneficially owned more than 5% of the outstanding AB Holding Units.
As of
December 31, 2015
, we had no information that any person beneficially owned more than 5% of the outstanding AB Units, except as reported by AXA and certain of its subsidiaries on Schedule 13D/A and Forms 4 filed with the SEC on December 20, 2013 pursuant to the Exchange Act. We have prepared the following table, and the notes that follow, in reliance on such filings:
|
Name and Address of Beneficial Owner
|
Amount and Nature of
Beneficial Ownership
Reported on Schedule
|
Percent of Class
|
||||||
|
AXA
(1)(2)(3)(4)(5)
25 avenue Matignon 75008
Paris, France
|
170,121,745
|
|
(4)(5)
|
62.5
|
|
(4)(5)
|
||
________________________________________________________________________________________________________________________
|
(1)
|
Based on information provided by AXA Financial, on
December 31, 2015
, AXA and certain of its subsidiaries beneficially owned all of AXA Financial’s outstanding common stock. For insurance regulatory purposes, the shares of common stock of AXA Financial beneficially owned by AXA and its subsidiaries have been deposited into a voting trust (“
Voting Trust
”), the term of which has been extended until April 29, 2021. The trustees of the Voting Trust (“
Voting Trustees
”) are Henri de Castries, Denis Duverne and Mark Pearson. Messrs. de Castries and Duverne serve on the Board of Directors of AXA, while Mr. Pearson serves on the Management Committee of AXA. The Voting Trustees have agreed to exercise their voting rights to protect the legitimate economic interests of AXA, but with a view to ensuring that certain minority shareholders of AXA do not exercise control over AXA Financial or certain of its insurance subsidiaries.
|
|
(2)
|
Based on information provided by AXA, as of
December 31, 2015
, 14.13% of the issued ordinary shares (representing 23.82% of the voting power) of AXA were owned directly and indirectly by two French mutual insurance companies (AXA Assurances IARD Mutuelle and AXA Assurances Vie Mutuelle) engaged in the Property & Casualty insurance business and the Life & Savings insurance business in France (“
Mutuelles AXA
”).
|
142
|
(3)
|
The Voting Trustees and the Mutuelles AXA, as a group, may be deemed to be beneficial owners of all AB Units beneficially owned by AXA and its subsidiaries. By virtue of the provisions of the Voting Trust Agreement, AXA may be deemed to have shared voting power with respect to the AB Units. AXA and its subsidiaries have the power to dispose or direct the disposition of all shares of the capital stock of AXA Financial deposited in the Voting Trust. The Mutuelles AXA, as a group, may be deemed to share the power to vote or to direct the vote and to dispose or to direct the disposition of all the AB Units beneficially owned by AXA and its subsidiaries. The address of each of AXA and Messrs. de Castries and Duverne is 25 avenue Matignon, 75008 Paris, France. The address of Mr. Pearson is 1290 Avenue of the Americas, New York, NY 10104. The address of the Mutuelles AXA is 313 Terrasses de l’Arche, 92727 Nanterre Cedex, France.
|
|
(4)
|
By reason of their relationships, AXA, the Voting Trustees, the Mutuelles AXA, AXA America Holdings, Inc. (a subsidiary of AXA, “
AXA America
”), AXA Equitable Financial Services, LLC (a subsidiary of AXA America), AXA-IM Holding U.S. (a 96.23%-owned subsidiary of AXA), AXA Financial, AXA Equitable, Coliseum Reinsurance Company (a subsidiary of AXA Financial), ACMC, LLC (a subsidiary of AXA Equitable) and MLOA may be deemed to share the power to vote or to direct the vote and to dispose or direct the disposition of all or a portion of the 170,121,745 issued and outstanding AB Units.
|
|
(5)
|
AXA has reported on Schedule 13D/A and Forms 3 and 4 filed with the SEC on January 5, 2016 that, by reason of its ownership of 100% of the outstanding shares of common stock of AXA America and its ownership of 96.23% of the outstanding shares of common stock of AXA-IM Holding U.S., AXA may be deemed to beneficially own all of the issued and outstanding AB Units owned directly and indirectly by AXA America and AXA-IM Holding U.S.
|
As of
December 31, 2015
, AB Holding was the record owner of 100,044,485, or 36.7%, of the issued and outstanding AB Units.
Management
As of
December 31, 2015
, the beneficial ownership of AB Holding Units by each director and named executive officer of the General Partner and by all directors and executive officers as a group is as follows:
|
Name of Beneficial Owner
|
Number of AB
Holding Units and
Nature of
Beneficial
Ownership
|
Percent of Class
|
||||
|
Peter S. Kraus
(1)(2)
|
4,337,643
|
|
4.3
|
%
|
||
|
Christopher M. Condron
(3)
|
96,303
|
|
*
|
|
||
|
Denis Duverne
(1)
|
2,000
|
|
*
|
|
||
|
Steven G. Elliott
(4)
|
46,798
|
|
*
|
|
||
|
Deborah S. Hechinger
(5)
|
75,757
|
|
*
|
|
||
|
Weston M. Hicks
(6)
|
69,320
|
|
*
|
|
||
|
Heidi S. Messer
|
3,781
|
|
*
|
|
||
|
Mark Pearson
(1)
|
—
|
|
*
|
|
||
|
Scott A. Schoen
|
61,486
|
|
*
|
|
||
|
Lorie A. Slutsky
(1)(7)
|
68,029
|
|
*
|
|
||
|
Christian Thimann
(1)
|
—
|
|
*
|
|
||
|
Joshua A. Weinreich
(8)
|
14,092
|
|
*
|
|
||
|
James A. Gingrich
(1)(9)
|
1,041,853
|
|
1.0
|
|
||
|
Laurence E. Cranch
(1)(10)
|
288,702
|
|
*
|
|
||
|
Robert P. van Brugge
(1)(11)
|
274,962
|
|
*
|
|
||
|
John C. Weisenseel
(1)(12)
|
114,675
|
|
*
|
|
||
|
All directors and executive officers as a group (17 persons)
(13)(14)
|
6,654,900
|
|
6.7
|
%
|
||
________________________________________________________________________________________________________________________
|
*
|
Number of AB Holding Units listed represents less than 1% of the Units outstanding.
|
|
(1)
|
Excludes AB Holding Units beneficially owned by AXA and its subsidiaries. Ms. Slutsky and Messrs. Kraus, Duverne, Pearson and Thimann are directors and/or officers of AXA, AXA Financial and/or AXA Equitable. Messrs. Kraus, Gingrich, Cranch, van Brugge and Weisenseel are directors and/or officers of the General Partner.
|
143
|
(2)
|
Includes 3,266,462 restricted AB Holding Units awarded to Mr. Kraus pursuant to the Kraus Employment Agreement or his previous employment agreement that have not yet vested and/or with respect to which he has deferred delivery.
See “Overview of Our CEO’s Compensation – Compensation Elements – Restricted AB Holding Units” in Item 11
for additional information regarding Mr. Kraus’s AB Holding Unit awards.
|
|
(3)
|
Includes 37,657 AB Holding Units Mr. Condron can acquire within 60 days under an AB option plan.
|
|
(4)
|
Includes 26,383 AB Holding Units Mr. Elliott can acquire within 60 days under an AB option plan.
|
|
(5)
|
Includes 60,876 AB Holding Units Ms. Hechinger can acquire within 60 days under an AB option plan.
|
|
(6)
|
Includes 44,938 AB Holding Units Mr. Hicks can acquire within 60 days under an AB option plan.
|
|
(7)
|
Includes 41,826 AB Holding Units Ms. Slutsky can acquire within 60 days under an AB option plan.
|
|
(8)
|
Includes 3,848 AB Holding Units Mr. Weinreich can acquire within 60 days under an AB option plan.
|
|
(9)
|
Includes 263,533 AB Holding Units Mr. Gingrich can acquire within 60 days under an AB option plan and 471,339 restricted AB Holding Units awarded to Mr. Gingrich as long-term incentive compensation that have not yet vested or with respect to which he has deferred delivery. For information regarding Mr. Gingrich’s long-term incentive compensation awards,
see “Grants of Plan-based Awards in 2015” and “Outstanding Equity Awards at 2015 Fiscal Year-End” in Item 11
.
|
|
(10)
|
Includes 78,348 AB Holding Units Mr. Cranch can acquire within 60 days under an AB option plan and 176,066 restricted AB Holding Units awarded to Mr. Cranch as long-term incentive compensation that have not yet vested or with respect to which he has deferred delivery. For information regarding Mr. Cranch's long-term incentive compensation awards,
see “Grants of Plan-based Awards in 2015” and “Outstanding Equity Awards at 2015 Fiscal Year-End” in Item 11
.
|
|
(11)
|
Includes 177,609 restricted AB Holding Units awarded to Mr. van Brugge as long-term incentive compensation that have not yet vested or with respect to which he has deferred delivery. For information regarding Mr. van Brugge’s long-term incentive compensation awards,
see “Grants of Plan-based Awards in 2015” and “Outstanding Equity Awards at 2015 Fiscal Year-End” in Item 11
.
|
|
(12)
|
Includes 55,188 restricted AB Holding Units awarded to Mr. Weisenseel as long-term incentive compensation that have not yet vested or with respect to which he has deferred delivery. For information regarding Mr. Weisenseel’s long-term incentive compensation awards,
see “Grants of Plan-based Awards in 2015” and “Outstanding Equity Awards at 2015 Fiscal Year-End” in Item 11
.
|
|
(13)
|
Includes 557,409 AB Holding Units the directors and executive officers as a group can acquire within 60 days under AB option plans.
|
|
(14)
|
Includes 4,199,752 restricted AB Holding Units awarded to the executive officers as a group as long-term incentive compensation that have not yet vested and/or with respect to which the executive officer has deferred delivery.
|
As of
December 31, 2015
, our directors and executive officers did not beneficially own any AB Units.
144
As of
December 31, 2015
, the beneficial ownership of the common stock of AXA by each director and named executive officer of the General Partner and by all directors and executive officers as a group is as follows:
AXA Common Stock
(1)
|
Name of Beneficial Owner
|
Number of Shares and
Nature of Beneficial
Ownership
|
Percent of Class
|
|||
|
Peter S. Kraus
|
—
|
|
*
|
||
|
Christopher M. Condron
(2)
|
1,882,312
|
|
*
|
||
|
Denis Duverne
(3)
|
2,124,161
|
|
*
|
||
|
Steven G. Elliott
|
—
|
|
*
|
||
|
Deborah S. Hechinger
|
—
|
|
*
|
||
|
Weston M. Hicks
|
—
|
|
*
|
||
|
Heidi S. Messer
|
—
|
|
*
|
||
|
Mark Pearson
(4)
|
771,392
|
|
*
|
||
|
Scott A. Schoen
|
—
|
|
*
|
||
|
Lorie A. Slutsky
(5)
|
42,307
|
|
*
|
||
|
Christian Thimann
|
—
|
|
*
|
||
|
Joshua A. Weinreich
|
—
|
|
*
|
||
|
James A. Gingrich
|
—
|
|
*
|
||
|
Laurence E. Cranch
|
—
|
|
*
|
||
|
Robert P. van Brugge
|
—
|
|
*
|
||
|
John C. Weisenseel
|
—
|
|
*
|
||
|
All directors and executive officers as a group (17 persons)
(6)
|
4,820,172
|
|
*
|
||
________________________________________________________________________________________________________________________
* Number of shares listed represents less than 1% of the outstanding AXA common stock.
|
(1)
|
Holdings of AXA American Depositary Shares (“
ADS
”) are expressed as their equivalent in AXA common stock. Each AXA ADS represents the right to receive one AXA ordinary share.
|
|
(2)
|
Includes 1,493,230 shares Mr. Condron can acquire within 60 days under option plans. Also includes 265,131 deferred restricted ADS units under AXA’s Variable Deferred Compensation Plan for Executives.
|
|
(3)
|
Includes 1,019,841 shares Mr. Duverne can acquire within 60 days under option plans.
|
|
(4)
|
Includes 373,424 shares Mr. Pearson can acquire within 60 days under options plans. Also includes 257,467 AXA performance shares, which are paid out when vested based on the price of AXA at that time and are subject to achievement of internal performance conditions.
|
|
(5)
|
Includes 7,940 shares Ms. Slutsky can acquire within 60 days under option plans.
|
|
(6)
|
Includes 2,894,435 shares the directors and executive officers as a group can acquire within 60 days under option plans.
|
Partnership Matters
The General Partner makes all decisions relating to the management of AB and AB Holding. The General Partner has agreed that it will conduct no business other than managing AB and AB Holding, although it may make certain investments for its own account. Conflicts of interest, however, could arise between AB and AB Holding, the General Partner and the Unitholders
of both Partnerships.
Section 17-403(b) of the Delaware Revised Uniform Limited Partnership Act (“
Delaware Act
”) states in substance that, except as provided in the Delaware Act or the applicable partnership agreement, a general partner of a limited partnership has the liabilities of a general partner in a general partnership governed by the Delaware Uniform Partnership Law (as in effect on July 11, 1999) to the partnership and to the other partners. Accordingly, while under Delaware law a general partner of a limited partnership is liable as a fiduciary to the other partners, those fiduciary obligations may be altered by the terms of the applicable partnership agreement. Each of the AB Partnership Agreement and AB Holding Partnership Agreement (each a “
Partnership Agreement
” and, together, the “
Partnership Agreements
”) sets forth limitations on the duties and liabilities of the General Partner. Each Partnership Agreement provides that the General Partner is not liable for monetary damages for errors in judgment or for breach of fiduciary duty (including breach of any duty of care or loyalty) unless it is established (the
145
person asserting such liability having the burden of proof) that the General Partner’s action or failure to act involved an act or omission undertaken with deliberate intent to cause injury, with reckless disregard for the best interests of the Partnerships or with actual bad faith on the part of the General Partner, or constituted actual fraud. Whenever the Partnership Agreements provide that the General Partner is permitted or required to make a decision (i) in its “discretion” or under a grant of similar authority or latitude, the General Partner is entitled to consider only such interests and factors as it desires and has no duty or obligation to consider any interest of or other factors affecting the Partnerships or any Unitholder of AB or AB Holding or (ii) in its “good faith” or under another express standard, the General Partner will act under that express standard and will not be subject to any other or different standard imposed by either Partnership Agreement or applicable law or in equity or otherwise. Each Partnership Agreement further provides that to the extent that, at law or in equity, the General Partner has duties (including fiduciary duties) and liabilities relating thereto to either Partnership or any partner, the General Partner acting under either Partnership Agreement, as applicable, will not be liable to the Partnerships or any partner for its good faith reliance on the provisions of the Partnership Agreement.
In addition, each Partnership Agreement grants broad rights of indemnification to the General Partner and its directors, officers and affiliates and authorizes AB and AB Holding to enter into indemnification agreements with the directors, officers, partners, employees and agents of AB and its affiliates and AB Holding and its affiliates. The Partnerships have granted broad rights of indemnification to officers and employees of AB and AB Holding. The foregoing indemnification provisions are not exclusive, and the Partnerships are authorized to enter into additional indemnification arrangements. AB and AB Holding have obtained directors and officers/errors and omissions liability insurance.
Each Partnership Agreement also allows transactions between AB and AB Holding and the General Partner or its affiliates,
as we describe in “Policies and Procedures Regarding Transactions with Related Persons” in Item 13
. The Delaware courts have held that provisions in partnership or limited liability company agreements that permit affiliate transactions so long as they are on an arms-length basis operate to establish a contractually-agreed-to fiduciary duty standard of entire fairness on the part of the general partner or manager in connection with the approval of affiliate transactions. Also, each Partnership Agreement expressly permits all affiliates of the General Partner to compete, directly or indirectly, with AB and AB Holding,
as we discuss in “Competition” in Item 1.
The Partnership Agreements further provide that, except to the extent that a decision or action by the General Partner is taken with the specific intent of providing an improper benefit to an affiliate of the General Partner to the detriment of AB or AB Holding, there is no liability or obligation with respect to, and no challenge of, decisions or actions of the General Partner that would otherwise be subject to claims or other challenges as improperly benefiting affiliates of the General Partner to the detriment of the Partnerships or otherwise involving any conflict of interest or breach of a duty of loyalty or similar fiduciary obligation.
Section 17-1101(c) of the Delaware Act provides that it is the policy of the Delaware Act to give maximum effect to the principle of freedom of contract and to the enforceability of partnership agreements. Further, Section 17-1101(d) of the Delaware Act provides in part that to the extent that, at law or in equity, a partner has duties (including fiduciary duties) to a limited partnership or to another partner, those duties may be expanded, restricted, or eliminated by provisions in a partnership agreement (provided that a partnership agreement may not eliminate the implied contractual covenant of good faith and fair dealing). In addition, Section 17-1101(f) of the Delaware Act provides that a partnership agreement may limit or eliminate any or all liability of a partner to a limited partnership or another partner for breach of contract or breach of duties (including fiduciary duties); provided, however, that a partnership agreement may not limit or eliminate liability for any act or omission that constitutes a bad faith violation of the implied contractual covenant of good faith and fair dealing. Decisions of the Delaware courts have recognized the right of parties, under the above provisions of the Delaware Act, to alter by the terms of a partnership agreement otherwise applicable fiduciary duties and liability for breach of duties. However, the Delaware courts have required that a partnership agreement make clear the intent of the parties to displace otherwise applicable fiduciary duties (the otherwise applicable fiduciary duties often being referred to as “default” fiduciary duties). Judicial inquiry into whether a partnership agreement is sufficiently clear to displace default fiduciary duties is necessarily fact driven and is made on a case by case basis. Accordingly, the effectiveness of displacing default fiduciary obligations and liabilities of general partners continues to be a developing area of the law and it is not certain to what extent the foregoing provisions of the Partnership Agreements are enforceable under Delaware law.
146
Policies and Procedures Regarding Transactions with Related Persons
Each Partnership Agreement expressly permits AXA and its affiliates, which includes AXA Equitable and its affiliates (collectively, “
AXA Affiliates
”), to provide services to AB and AB Holding if the terms of the transaction are approved by the General Partner in good faith as being comparable to (or more favorable to each such Partnership than) those that would prevail in a transaction with an unaffiliated party. This requirement is conclusively presumed to be satisfied as to any transaction or arrangement that (i) in the reasonable and good faith judgment of the General Partner, meets that unaffiliated party standard, or (ii) has been approved by a majority of those directors of the General Partner who are not also directors, officers or employees of an affiliate of the General Partner.
In practice, our management pricing committees review investment advisory agreements with AXA Affiliates, which is the manner in which the General Partner reaches a judgment regarding the appropriateness of the fees. Other transactions with AXA Affiliates are submitted to the Audit Committee for their review and approval. (
See “Committees of the Board” in Item 10
for details regarding the Audit Committee.) We are not aware of any transaction during
2015
between our company and any related person with respect to which these procedures were not followed.
Our relationships with AXA Affiliates also are subject to applicable provisions of the insurance laws and regulations of New York and other states. Under such laws and regulations, the terms of certain investment advisory and other agreements we enter into with AXA Affiliates are required to be fair and equitable and charges or fees for services performed must be reasonable. Also, in some cases, the agreements are subject to regulatory approval.
We have written policies regarding the employment of immediate family members of any of our related persons. Compensation and benefits for all of our employees is established in accordance with our human resources practices, taking into consideration the defined qualifications, responsibilities and nature of the role.
Financial Arrangements with AXA Affiliates
The General Partner has, in its reasonable and good faith judgment (based on its knowledge of, and inquiry with respect to, comparable arrangements with or between unaffiliated parties), approved the following arrangements with AXA Affiliates as being comparable to, or more favorable to AB than, those that would prevail in a transaction with an unaffiliated party.
Transactions between AB and related persons during
2015
are as follows (the first table summarizes services we provide to related persons and the second table summarizes services our related persons provide to us):
|
Parties
(1)
|
General Description of Relationship
(2)
|
Amounts Received
or Accrued for in 2015
|
||
|
|
|
|||
|
AXA Equitable
(3)
|
We provide investment management services and ancillary accounting, valuation, reporting, treasury and other services to the general and separate accounts of AXA Equitable and its insurance company subsidiaries.
|
$
|
54,659,000
|
|
|
EQAT, AXA Enterprise Trust and AXA Premier VIP Trust
|
We serve as sub-adviser to these open-end mutual funds, each of which is sponsored by a subsidiary of AXA Financial.
|
$
|
25,986,000
|
|
|
AXA Life Japan Limited
(3)
|
|
$
|
16,517,000
|
|
|
AXA AB Funds
|
We provide investment management, distribution and shareholder servicing-related services.
|
$
|
15,078,000
|
|
|
AXA Switzerland Life
(3)
|
$
|
10,654,000
|
|
|
|
AXA Re Arizona Company
(3)
|
$
|
8,819,000
|
|
|
|
AXA U.K. Group Pension Scheme
|
$
|
8,308,000
|
|
|
|
AXA Hong Kong Life
(3)
|
$
|
5,840,000
|
|
|
|
AXA France
(3)
|
$
|
5,715,000
|
|
|
147
|
AXA Belgium
(3)
|
$
|
2,757,000
|
|
|
|
AXA Germany
(3)
|
$
|
1,662,000
|
|
|
|
MONY Life Insurance Company of America
(3)
|
$
|
1,411,000
|
|
|
|
AXA Switzerland Property and Casualty
(3)
|
$
|
944,000
|
|
|
|
AXA General Insurance Hong Kong Ltd.
(3)
|
$
|
691,000
|
|
|
|
AXA Corporate Solutions
(3)
|
$
|
645,000
|
|
|
|
AXA Investment Managers Ltd. Paris
(3)
|
$
|
588,000
|
|
|
|
AXA Mediterranean
(3)
|
$
|
497,000
|
|
|
|
U.S. Financial Life Insurance Company
(3)
|
$
|
430,000
|
|
|
|
AIM Deutschland GmbH
(3)
|
$
|
409,000
|
|
|
|
AXA Insurance Company
(3)
|
$
|
142,000
|
|
|
|
Coliseum Reinsurance
(3)
|
$
|
106,000
|
|
|
|
AXA Investment Managers Ltd.
(3)
|
$
|
106,000
|
|
|
|
Parties
(1)(3)
|
General Description of Relationship
|
Amounts Paid
or Accrued for in 2015 |
||
|
AXA Advisors
|
Distributes certain of our Retail Products and provides Private Wealth Management referrals.
|
$
|
16,140,000
|
|
|
AXA Business Services Pvt. Ltd.
|
Provides data processing services and support for certain investment operations functions.
|
$
|
5,453,000
|
|
|
AXA Technology Services India Pvt.
|
Provides certain data processing services and functions.
|
$
|
4,575,000
|
|
|
AXA Equitable
|
We are covered by various insurance policies maintained by AXA Equitable.
|
$
|
3,177,000
|
|
|
AXA Group Solutions Pvt. Ltd.
|
Provides maintenance and development support for applications.
|
$
|
2,830,000
|
|
|
AXA Advisors
|
Sells shares of our mutual funds under Distribution Service and educational Support agreements.
|
$
|
1,483,000
|
|
|
AXA Wealth
|
Provides portfolio-related services for assets we manage under the AXA Corporate Trustee Investment Plan.
|
$
|
1,015,000
|
|
|
GIE Informatique AXA
|
Provides cooperative technology development and procurement services to us and to various other subsidiaries of AXA.
|
$
|
530,000
|
|
________________________________________________________________________________________________________________________
|
(1)
|
AB or one of its subsidiaries is a party to each transaction.
|
|
(2)
|
We provide investment management services unless otherwise indicated.
|
|
(3)
|
This entity is a subsidiary of AXA.
|
Additional Transactions with Related Persons
AXA Equitable and its affiliates are not obligated to provide funds to us, except for ACMC, LLC’s and the General Partner’s obligation to fund certain of our incentive compensation and employee benefit plan obligations. ACMC, LLC and the General Partner are obligated, subject to certain limitations, to make capital contributions to AB in an amount equal to the payments AB is required to make as incentive compensation under the employment agreements entered into in connection with AXA Equitable’s 1985 acquisition of Donaldson, Lufkin and Jenrette Securities Corporation (since November 2000, a part of Credit Suisse Group) as well as obligations of AB to various employees and their beneficiaries under AB’s Capital Accumulation Plan. In
2015
, ACMC, LLC made capital contributions to AB in the amount of approximately $1.6 million in respect of these obligations. ACMC, LLC’s obligations to make these contributions are guaranteed by
Equitable Holdings, LLC (a wholly-owned subsidiary of AXA Equitable), subject to certain limitations. All tax deductions with respect to these obligations, to the extent funded by ACMC, LLC, the General Partner or Equitable Holdings, LLC, will be allocated to ACMC, LLC or the General Partner.
148
Arrangements with Immediate Family Members of Related Persons
During
2015
, we did not have arrangements with immediate family members of our directors and executive officers.
Director Independence
See “Independence of Certain Directors” in Item 10.
149
Fees for professional audit services rendered by PricewaterhouseCoopers LLP (“
PwC
”) for the audit of AB’s and AB Holding’s annual financial statements for
2015
and
2014
, respectively, and fees for other services rendered by PwC are as follows:
|
2015
|
2014
|
||||||
|
(in thousands)
|
|||||||
|
Audit fees
(1)
|
$
|
5,608
|
|
$
|
5,178
|
|
|
|
Audit-related fees
(2)
|
3,195
|
|
3,388
|
|
|||
|
Tax fees
(3)
|
2,155
|
|
2,357
|
|
|||
|
All other fees
(4)
|
5
|
|
5
|
|
|||
|
Total
|
$
|
10,963
|
|
$
|
10,928
|
|
|
________________________________________________________________________________________________________________________
|
(1)
|
Includes $65,563 paid for audit services to AB Holding in both
2015
and
2014
.
|
|
(2)
|
Audit-related fees consist principally of fees for audits of financial statements of certain employee benefit plans, internal control reviews and accounting consultation.
|
|
(3)
|
Tax fees consist of fees for tax consultation and tax compliance services.
|
|
(4)
|
All other fees in
2015
and
2014
consisted of miscellaneous non-audit services.
|
The Audit Committee has a policy to pre-approve audit and non-audit service engagements with the independent registered public accounting firm. The independent registered public accounting firm must provide annually a comprehensive and detailed schedule of each proposed audit and non-audit service to be performed. The Audit Committee then affirmatively indicates its approval of the listed engagements. Engagements that are not listed, but that are of similar scope and size to those listed and approved, may be deemed to be approved, if the fee for such service is less than $100,000. In addition, the Audit Committee has delegated to its chairman the ability to approve any permissible non-audit engagement where the fees are expected to be less than $100,000.
150
|
(a)
|
There is no document filed as part of this Form 10-K.
|
Financial Statement Schedule.
Attached to this Form 10-K is a schedule describing Valuation and Qualifying Account-Allowance for Doubtful Accounts for the three years ended December 31,
2015
,
2014
and
2013
.
|
(b)
|
Exhibits.
|
The following exhibits required to be filed by Item 601 of Regulation S-K are filed herewith or incorporated by reference herein, as indicated:
|
Exhibit
|
Description
|
||
|
3.01
|
|
AllianceBernstein Corporation By-Laws with amendments through November 20, 2015.
|
|
|
3.02
|
|
Amended and Restated Certificate of Limited Partnership dated February 24, 2006 of AB Holding (incorporated by reference to Exhibit 99.06 to Form 8-K, as filed February 24, 2006).
|
|
|
3.03
|
|
Amendment No. 1 dated February 24, 2006 to Amended and Restated Agreement of Limited Partnership of AB Holding (incorporated by reference to Exhibit 3.1 to Form 10-Q for the quarterly period ended September 30, 2006, as filed November 8, 2006).
|
|
|
3.04
|
|
Amended and Restated Agreement of Limited Partnership dated October 29, 1999 of AB Holding (incorporated by reference to Exhibit 3.2 to Form 10-K for the fiscal year ended December 31, 2003, as filed March 10, 2004).
|
|
|
3.05
|
|
Amended and Restated Certificate of Limited Partnership dated February 24, 2006 of AB (incorporated by reference to Exhibit 99.07 to Form 8-K, as filed February 24, 2006).`
|
|
|
3.06
|
|
Amendment No. 1 dated February 24, 2006 to Amended and Restated Agreement of Limited Partnership of AB (incorporated by reference to Exhibit 3.2 to Form 10-Q for the quarterly period ended September 30, 2006, as filed November 8, 2006).
|
|
|
3.07
|
|
Amended and Restated Agreement of Limited Partnership dated October 29, 1999 of AB (incorporated by reference to Exhibit 3.3 to Form 10-K for the fiscal year ended December 31, 2003, as filed March 10, 2004).
|
|
|
3.08
|
|
Certificate of Amendment to the Certificate of Incorporation of AllianceBernstein Corporation (incorporated by reference to Exhibit 99.08 to Form 8-K, as filed February 24, 2006).
|
|
|
4.01
|
|
Contingent Value Rights Agreement, dated as of December 12, 2013, by and between AB and American Stock Transfer & Trust Company, LLC (incorporated by reference to Exhibit 4.01 to Form 10-K for the fiscal year ended December 31, 2013, as filed February 12, 2014).
|
|
|
10.01
|
|
AllianceBernstein 2015 Incentive Compensation Award Program.*
|
|
|
10.02
|
|
AllianceBernstein 2015 Deferred Cash Compensation Program.*
|
|
|
10.03
|
|
Form of Award Agreement under Incentive Compensation Award Program, Deferred Cash Compensation Program and 2010 Long Term Incentive Plan.*
|
|
|
10.04
|
|
Form of Award Agreement under 2010 Long Term Incentive Plan relating to equity compensation awards to Eligible Directors.*
|
|
|
10.05
|
|
Amendment and Restatement of the Profit Sharing Plan for Employees of AllianceBernstein L.P. (as of January 1, 2015).*
|
|
|
10.06
|
|
Amendment and Restatement of the Retirement Plan for Employees of AllianceBernstein L.P. (as of January 1, 2015).*
|
|
|
10.07
|
|
Guidelines for Transfer of AB Units.
|
|
|
10.08
|
|
Commercial Paper Dealer Agreement 4(a)(2) Program, dated as of June 1, 2015, between AllianceBernstein L.P., as Issuer, and Citigroup Global Markets Inc., as Dealer.
|
|
|
10.09
|
|
Commercial Paper Dealer Agreement 4(a)(2) Program, dated as of June 1, 2015, between AllianceBernstein L.P., as Issuer, and Credit Suisse Securities (USA) LLC, as Dealer.
|
|
|
10.10
|
|
Commercial Paper Dealer Agreement 4(a)(2) Program, dated as of June 1, 2015, between AllianceBernstein L.P., as Issuer, and Merrill Lynch, Pierce, Fenner & Smith Incorporated, as Dealer.
|
|
151
|
10.11
|
|
Summary of AB’s Lease at 1345 Avenue of the Americas, New York, New York 10105 (incorporated by reference to Exhibit 10.07 to Form 10-K for the fiscal year ended December 31, 2014, as filed February 12, 2015).
|
|
|
10.12
|
|
AllianceBernstein L.P. 2010 Long Term Incentive Plan, as amended (incorporated by reference to Exhibit 10.03 to Form 10-K for the fiscal year ended December 31, 2014, as filed February 12, 2015).*
|
|
|
10.13
|
|
Revolving Credit Agreement, dated as of December 9, 2010, Amended and Restated as of January 17, 2012 and Further Amended and Restated as of October 22, 2014, among AB and SCB LLC, as Borrowers; Bank of America, N.A., as Administrative Agent; Merrill Lynch, Pierce, Fenner & Smith Incorporated, Citigroup Global Markets Inc., J.P. Morgan Securities LLC, The Bank of Tokyo-Mitsubishi UFJ, Ltd. and HSBC Securities (USA) Inc., as Joint Lead Arrangers and Joint Book Managers, and the other lenders party thereto (incorporated by reference to Exhibit 10.01 to Form 8-K, as filed October 24, 2014).
|
|
|
10.14
|
|
Employment Agreement among Peter S. Kraus, AllianceBernstein Corporation, AB Holding and AB, dated as of June 21, 2012 (incorporated by reference to Exhibit 99.01 to Form 8-K/A, as filed June 26, 2012).*
|
|
|
10.15
|
|
Amendment No. 1 to Employment Agreement dated as of December 19, 2008 among Peter S. Kraus, AllianceBernstein Corporation, AB Holding and AB, dated as of June 21, 2012 (incorporated by reference to Exhibit 99.02 to Form 8-K, as filed June 21, 2012).*
|
|
|
10.16
|
|
Form of Award Agreement under the Special Option Program (incorporated by reference to Exhibit 10.05 to Form 10-K for the fiscal year ended December 31, 2008, as filed February 23, 2009).*
|
|
|
10.17
|
|
Employment Agreement among Peter S. Kraus, AllianceBernstein Corporation, AB Holding and AB, dated as of December 19, 2008 (incorporated by reference to Exhibit 99.02 to Form 8-K, as filed December 24, 2008).*
|
|
|
10.18
|
|
Amended and Restated 1997 Long Term Incentive Plan, as amended through November 28, 2007 (incorporated by reference to Exhibit 10.02 to Form 10-K for the fiscal year ended December 31, 2007, as filed February 25, 2008).*
|
|
|
10.19
|
|
Amended and Restated Issuing and Paying Agency Agreement, dated as of May 3, 2006 (incorporated by reference to Exhibit 10.2 to Form 10-Q for the quarterly period ended March 31, 2006, as filed May 8, 2006).
|
|
|
10.20
|
|
Investment Advisory and Management Agreement for the General Account of AXA Equitable Life Insurance Company (incorporated by reference to Exhibit 10.5 to Form 10-K for the fiscal year ended December 31, 2004, as filed March 15, 2005).
|
|
|
10.21
|
|
AB Partners Plan of Repurchase adopted as of February 20, 2003 (incorporated by reference to Exhibit 10.2 to Form 10-K for the fiscal year ended December 31, 2002, as filed March 27, 2003).
|
|
|
10.22
|
|
Services Agreement dated as of April 22, 2001 between AB and AXA Equitable Life Insurance Company (incorporated by reference to Exhibit 10.19 to Form 10-K for the fiscal year ended December 31, 2001, as filed March 28, 2002).
|
|
|
10.23
|
|
Extendible Commercial Notes Dealer Agreement, dated as of December 14, 1999 (incorporated by reference to Exhibit 10.10 to the Form 10-K for the fiscal year ended December 31, 1999, as filed March 28, 2000).
|
|
|
10.24
|
|
Amended and Restated Investment Advisory and Management Agreement dated January 1, 1999 among AB Holding, Alliance Corporate Finance Group Incorporated, and AXA Equitable Life Insurance Company (incorporated by reference to Exhibit (a)(6) to Form 10-Q/A for the quarterly period ended September 30, 1999, as filed on September 28, 2000).
|
|
|
10.25
|
|
Amended and Restated Accounting, Valuation, Reporting and Treasury Services Agreement dated January 1, 1999 between AB Holding, Alliance Corporate Finance Group Incorporated, and AXA Equitable Life Insurance Company (incorporated by reference to Exhibit (a)(7) to the Form 10-Q/A for the quarterly period ended September 30, 1999, as filed September 28, 2000).
|
|
|
10.26
|
|
Alliance Capital Accumulation Plan (incorporated by reference to Exhibit 10.11 to Form 10-K for the fiscal year ended December 31, 1988, as filed March 31, 1989).*
|
|
|
12.01
|
|
AB Consolidated Ratio of Earnings to Fixed Charges in respect of the years ended December 31, 2015, 2014 and 2013.
|
|
|
21.01
|
|
Subsidiaries of AB.
|
|
|
23.01
|
|
Consents of PricewaterhouseCoopers LLP.
|
|
|
31.01
|
|
Certification of Mr. Kraus furnished pursuant to Section 302 of the Sarbanes-Oxley Act of 2002.
|
|
|
31.02
|
|
Certification of Mr. Weisenseel furnished pursuant to Section 302 of the Sarbanes-Oxley Act of 2002.
|
|
|
32.01
|
|
Certification of Mr. Kraus furnished for the purpose of complying with Rule 13a-14(b) or Rule 15d-14(b) of the Securities Exchange Act of 1934 and 18 U.S.C. Section 1350, as adopted pursuant to Section 906 of the Sarbanes-Oxley Act of 2002.
|
|
|
32.02
|
|
Certification of Mr. Weisenseel furnished for the purpose of complying with Rule 13a-14(b) or Rule 15d-14(b) of the Securities Exchange Act of 1934 and 18 U.S.C. Section 1350, as adopted pursuant to Section 906 of the Sarbanes-Oxley Act of 2002.
|
|
152
|
101.INS
|
|
XBRL Instance Document.
|
|
|
101.SCH
|
|
XBRL Taxonomy Extension Schema.
|
|
|
101.CAL
|
|
XBRL Taxonomy Extension Calculation Linkbase.
|
|
|
101.LAB
|
|
XBRL Taxonomy Extension Label Linkbase.
|
|
|
101.PRE
|
|
XBRL Taxonomy Extension Presentation Linkbase.
|
|
|
101.DEF
|
|
XBRL Taxonomy Extension Definition Linkbase.
|
|
|
*
|
|
Denotes a compensatory plan or arrangement
|
|
153
Signatures
Pursuant to the requirements of Section 13 or 15(d) of the Exchange Act, the Registrant has duly caused this report to be signed on its behalf by the undersigned, thereunto duly authorized.
|
AllianceBernstein Holding L.P.
|
||
|
Date: February 11, 2016
|
By:
|
/s/ Peter S. Kraus
|
|
Peter S. Kraus
|
||
|
Chairman of the Board and Chief Executive Officer
|
||
Pursuant to the requirements of the Exchange Act, this report has been signed by the following persons on behalf of the Registrant and in the capacities and on the dates indicated.
|
Date: February 11, 2016
|
/s/ John C. Weisenseel
|
|
|
|
John C. Weisenseel
|
|
|
|
Chief Financial Officer
|
|
|
Date: February 11, 2016
|
/s/ Edward J. Farrell
|
|
|
|
Edward J. Farrell
|
|
|
|
Chief Accounting Officer
|
|
154
Directors
|
/s/ Peter S. Kraus
|
/s/ Heidi S. Messer
|
|
|
Peter S. Kraus
|
Heidi S. Messer
|
|
|
Chairman of the Board
|
Director
|
|
|
|
|
|
|
/s/ Christopher M. Condron
|
/s/ Mark Pearson
|
|
|
Christopher M. Condron
|
Mark Pearson
|
|
|
Director
|
Director
|
|
|
|
|
|
|
/s/ Denis Duverne
|
/s/ Scott A. Schoen
|
|
|
Denis Duverne
|
Scott A. Schoen
|
|
|
Director
|
Director
|
|
|
|
||
|
/s/ Steven G. Elliott
|
/s/ Lorie A. Slutsky
|
|
|
Steven G. Elliott
|
Lorie A. Slutsky
|
|
|
Director
|
Director
|
|
|
|
|
|
|
/s/ Deborah S. Hechinger
|
/s/ Christian Thimann
|
|
|
Deborah S. Hechinger
|
Christian Thimann
|
|
|
Director
|
Director
|
|
|
|
|
|
|
/s/ Weston M. Hicks
|
/s/ Joshua A. Weinreich
|
|
|
Weston M. Hicks
|
Joshua A. Weinreich
|
|
|
Director
|
Director
|
|
|
|
||
155
SCHEDULE II
AllianceBernstein L.P.
Valuation and Qualifying Account - Allowance for Doubtful Accounts
For the Three Years Ending December 31,
2015
,
2014
and
2013
|
Description
|
Balance at Beginning
of Period
|
Credited to
Costs and
Expenses
|
Deductions
|
|
Balance at End
of Period
|
|||||||||||||
|
|
(in thousands)
|
|||||||||||||||||
|
For the year ended December 31, 2013
|
$
|
844
|
|
$
|
—
|
|
$
|
81
|
|
(a)
|
$
|
763
|
|
|||||
|
For the year ended December 31, 2014
|
$
|
763
|
|
$
|
—
|
|
$
|
38
|
|
(b)
|
$
|
725
|
|
|||||
|
For the year ended December 31, 2015
|
$
|
725
|
|
$
|
100
|
|
$
|
273
|
|
(c)
|
$
|
552
|
|
|||||
|
(a)
|
Includes accounts written-off as uncollectible of
$84
and a net addition to the allowance balance of
$3
.
|
|
(b)
|
Includes accounts written-off as uncollectible of
$28
and a net reduction to the allowance balance of
$10
.
|
|
(c)
|
Includes accounts written-off as uncollectible of $
273
.
|
156
TABLE OF CONTENTS
Part IItem 1. BusinessItem 1A. Risk FactorsItem 1B. Unresolved Staff CommentsItem 2. PropertiesItem 3. Legal ProceedingsItem 4. Mine Safety DisclosuresPart IIItem 5. Market For Registrant S Common Equity, Related Stockholder Matters and Issuer Purchases Of Equity SecuritiesPart OfItem 6. Selected Financial DataItem 7. Management S Discussion and Analysis Of Financial Condition and Results Of OperationsItem 7A. Quantitative and Qualitative Disclosures About Market RiskItem 8. Financial Statements and Supplementary DataItem 9. Changes in and Disagreements with Accountants on Accounting and Financial DisclosureItem 9A. Controls and ProceduresItem 9B. Other InformationPart IIIItem 10. Directors, Executive Officers and Corporate GovernanceItem 406 CodeItem 11. Executive CompensationItem 12. Security Ownership Of Certain Beneficial Owners and Management and Related Stockholder MattersItem 13. Certain Relationships and Related Transactions, and Director IndependenceItem 14. Principal Accounting Fees and ServicesPart IVItem 15. Exhibits, Financial Statement Schedules