ABBVIE INC.
10-Ks and 10-Qs
|
|
|
|
|
|
|
|
|
|
|
|
|
|
|
|
|
|
|
|
|
|
|
|
|
|
|
|
|
|
|
|
|
|
|
|
|
|
|
|
|
|
|
|
|
|
|
UNITED STATES
SECURITIES AND EXCHANGE COMMISSION
WASHINGTON, D. C. 20549
FORM 10-K
|
(MARK ONE)
|
|
|
|
x
|
|
ANNUAL REPORT PURSUANT TO SECTION 13 OR 15(d) OF THE SECURITIES EXCHANGE ACT OF 1934
|
|
OR
|
||
|
o
|
|
TRANSITION REPORT PURSUANT TO SECTION 13 OR 15(d) OF THE SECURITIES EXCHANGE ACT OF 1934
|
|
For the fiscal year ended December 31, 2017
|
||
Commission file number 001-35565

AbbVie Inc.
(Exact name of registrant as specified in its charter)
|
Delaware
(State or other jurisdiction of
incorporation or organization)
|
|
32-0375147
(I.R.S. employer
identification number)
|
|
1 North Waukegan Road
North Chicago, Illinois 60064-6400
(Address of principal executive offices) (Zip Code)
|
|
(847) 932-7900
(Telephone number)
|
Securities Registered Pursuant to Section 12(b) of the Act:
|
Title of Each Class
|
|
Name of Each Exchange on Which Registered
|
|
Common Stock, par value $0.01 per share
|
|
New York Stock Exchange
Chicago Stock Exchange
|
Indicate by check mark if the registrant is a well-known seasoned issuer, as defined in Rule 405 of the Securities Act.
Yes
x
No
o
Indicate by check mark if the registrant is not required to file reports pursuant to Section 13 or 15(d) of the Act.
Yes
o
No
x
Indicate by check mark whether the registrant (1) has filed all reports required to be filed by Section 13 or 15(d) of the Securities Exchange Act of 1934 during the preceding 12 months (or for such shorter period that the registrant was required to file such reports) and (2) has been subject to such filing requirements for the past 90 days.
Yes
x
No
o
Indicate by check mark whether the registrant has submitted electronically and posted on its corporate Web site, if any, every Interactive Data File required to be submitted and posted pursuant to Rule 405 of Regulation S-T during the preceding 12 months (or for such shorter period that the registrant was required to submit and post such files).
Yes
x
No
o
Indicate by check mark if disclosure of delinquent filers pursuant to Item 405 of Regulation S-K (§229.405 of this chapter) is not contained herein, and will not be contained, to the best of registrant's knowledge, in definitive proxy or information statements incorporated by reference in Part III of this Form 10-K or any amendment to this Form 10-K.
x
Indicate by check mark whether the registrant is a large accelerated filer, an accelerated filer, a non-accelerated filer, or a smaller reporting company. See the definitions of "large accelerated filer," "accelerated filer" and "smaller reporting company" in Rule 12b-2 of the Exchange Act.
|
Large Accelerated Filer
x
|
|
Accelerated Filer
o
|
|
Non-accelerated Filer
o
(Do not check if a
smaller reporting company)
|
|
Smaller Reporting Company
o
|
Emerging Growth Company
o
|
|||
If an emerging growth company, indicate by check mark if the registrant has elected not to use the extended transition period for complying with any new or revised financial accounting standards provided pursuant to Section 13(a) of the Exchange Act.
o
Indicate by check mark whether the registrant is a shell company (as defined in Rule 12b-2 of the Act).
Yes
o
No
x
The aggregate market value of the
1,577,814,696
shares of voting stock held by non-affiliates of the registrant, computed by reference to the closing price as reported on the New York Stock Exchange, as of the last business day of AbbVie Inc.'s most recently completed second fiscal quarter (June 30, 2017), was
$114,407,343,607
. AbbVie has no non-voting common equity.
Number of common shares outstanding as of
February 2, 2018
:
1,587,972,655
DOCUMENTS INCORPORATED BY REFERENCE
Portions of the
2018
AbbVie Inc. Proxy Statement are incorporated by reference into Part III. The Definitive Proxy Statement will be filed on or about
March 19, 2018
.
ABBVIE INC.
FORM 10-K
FOR THE YEAR ENDED DECEMBER 31,
2017
TABLE OF CONTENTS
|
Page No.
|
||
|
Item 1.
|
||
|
Item 1A.
|
||
|
Item 1B.
|
||
|
Item 2.
|
||
|
Item 3.
|
||
|
Item 4.
|
||
|
Item 5.
|
||
|
Item 6.
|
||
|
Item 7.
|
||
|
Item 7A.
|
||
|
Item 8.
|
||
|
Item 9.
|
||
|
Item 9A.
|
||
|
Item 9B.
|
||
|
Item 10.
|
||
|
Item 11.
|
||
|
Item 12.
|
||
|
Item 13.
|
||
|
Item 14.
|
||
|
Item 15.
|
||
|
Item 16.
|
||
Overview
AbbVie
(1)
is a global, research-based biopharmaceutical company. AbbVie develops and markets advanced therapies that address some of the world's most complex and serious diseases. AbbVie's products are focused on treating conditions such as chronic autoimmune diseases in rheumatology, gastroenterology and dermatology; oncology, including blood cancers; virology, including hepatitis C virus (HCV) and human immunodeficiency virus (HIV); neurological disorders, such as Parkinson's disease and multiple sclerosis; metabolic diseases, including thyroid disease and complications associated with cystic fibrosis; as well as other serious health conditions. AbbVie also has a pipeline of promising new medicines in clinical development across such important medical specialties as immunology, oncology and neurology, with additional targeted investment in cystic fibrosis and women's health.
AbbVie was incorporated in Delaware on April 10, 2012. On January 1, 2013, AbbVie became an independent company as a result of the distribution by Abbott Laboratories (Abbott) of 100% of the outstanding common stock of AbbVie to Abbott's shareholders.
Segments
AbbVie operates in one business segment—pharmaceutical products. See
Note 15
to the Consolidated Financial Statements and the sales information related to HUMIRA included under
Item 7
, "
Management's Discussion and Analysis of Financial Condition and Results of Operations
—Results of Operations."
Products
AbbVie's portfolio of products includes a broad line of therapies that address some of the world's most complex and serious diseases.
HUMIRA.
HUMIRA (adalimumab) is a biologic therapy administered as a subcutaneous injection. It is approved to treat the following autoimmune diseases in the United States, Canada and Mexico (collectively, North America) and in the European Union:
|
Condition
|
|
Principal Markets
|
|
Rheumatoid arthritis (moderate to severe)
|
|
North America, European Union
|
|
Psoriatic arthritis
|
|
North America, European Union
|
|
Ankylosing spondylitis
|
|
North America, European Union
|
|
Adult Crohn's disease (moderate to severe)
|
|
North America, European Union
|
|
Plaque psoriasis (moderate to severe chronic)
|
|
North America, European Union
|
|
Juvenile idiopathic arthritis (moderate to severe polyarticular)
|
|
North America, European Union
|
|
Ulcerative colitis (moderate to severe)
|
|
North America, European Union
|
|
Axial spondyloarthropathy
|
|
European Union
|
|
Pediatric Crohn's disease (moderate to severe)
|
|
North America, European Union
|
|
Hidradenitis Suppurativa (moderate to severe)
|
|
North America, European Union
|
|
Pediatric enthesitis-related arthritis
|
|
European Union
|
|
Non-infectious intermediate, posterior and panuveitis
|
North America, European Union
|
|
HUMIRA is also approved in Japan for the treatment of intestinal Behçet's disease.
HUMIRA is sold in numerous other markets worldwide, including Japan, China, Brazil and Australia, and accounted for approximately
65%
of AbbVie's total net revenues in
2017
. AbbVie continues to work on HUMIRA formulation and delivery enhancements to improve convenience and the overall patient experience.
_______________________________________________________________________________
|
(1)
|
As used throughout the text of this report on Form 10-K, the terms "AbbVie" or "the company" refer to AbbVie Inc., a Delaware corporation, or AbbVie Inc. and its consolidated subsidiaries, as the context requires.
|
|
2017 Form 10-K
|
 1
1
|
||
Oncology products.
AbbVie’s oncology products target some of the most complex and difficult-to-treat cancers. These products are:
IMBRUVICA.
IMBRUVICA (ibrutinib) is a first-in-class, oral, once-daily therapy that inhibits a protein called Bruton's tyrosine kinase (BTK). IMBRUVICA was one of the first medicines to receive an FDA approval after being granted a Breakthrough Therapy Designation and IMBRUVICA is one of the few therapies to receive four separate designations. IMBRUVICA currently is approved for the treatment of adult patients with:
|
•
|
Chronic lymphocytic leukemia (CLL)/Small lymphocytic lymphoma (SLL) and CLL/SLL with 17p deletion;
|
|
•
|
Mantle cell lymphoma (MCL) who have received at least one prior therapy*;
|
|
•
|
Waldenström’s macroglobulinemia (WM);
|
|
•
|
Marginal zone lymphoma (MZL) who require systemic therapy and have received at least one prior anti-CD20-based therapy*; and
|
|
•
|
Chronic graft versus host disease (cGVHD) after failure of one or more lines of systemic therapy.
|
_______________________________________________________________________________
* Accelerated approval was granted for this indication based on overall response rate. Continued approval for this indication may be contingent upon verification of clinical benefit in confirmatory trials.
VENCLEXTA.
VENCLEXTA (venetoclax) is approved to treat people with CLL with 17p deletion, who have received at least one prior treatment. VENCLEXTA is the first FDA-approved treatment that targets the B-cell lymphoma 2 (BCL-2) protein, which supports cancer cell growth and is overexpressed in many patients with CLL. VENCLEXTA has been approved in the EU for the treatment of CLL in patients with 17p deletion or TP53 mutation and are unsuitable for or have failed a B-cell receptor pathway inhibitor and for the treatment of CLL in absence of 17p deletion or TP53 mutation who have failed both chemoimmunotherapy and a B-cell receptor pathway inhibitor.
Virology Products.
AbbVie's virology products address unmet needs for patients living with HCV and HIV-1.
HCV products.
AbbVie's HCV products are:
VIEKIRA PAK AND TECHNIVIE.
VIEKIRA PAK (ombitasvir, paritaprevir and ritonavir tablets; dasabuvir tablets) is an all-oral, short-course, interferon-free therapy, with or without ribavirin, for the treatment of adult patients with genotype 1 chronic HCV, including those with compensated cirrhosis. In Europe, VIEKIRA PAK is marketed as VIEKIRAX + EXVIERA and is approved for use in patients with genotype 1 and genotype 4 HCV. AbbVie's TECHNIVIE (ombitasvir, paritaprevir and ritonavir) is FDA-approved for use in combination with ribavirin for the treatment of adults with genotype 4 HCV infection in the United States.
MAVYRET/MAVIRET.
MAVYRET (glecaprevir/pibrentasvir) is approved in the United States and European Union (MAVIRET) for the treatment of patients with chronic HCV genotype 1-6 infection without cirrhosis and with compensated cirrhosis (Child-Pugh A). It is also indicated for the treatment of adult patients with HCV genotype 1 infection, who previously have been treated with a regimen containing an HCV NS5A inhibitor or an NS3/4A protease inhibitor, but not both. It is an 8-week, pan-genotypic treatment for patients without cirrhosis and who are new to treatment.
Additional Virology products.
AbbVie's additional virology products include:
KALETRA.
KALETRA (lopinavir/ritonavir), which is also marketed as Aluvia in emerging markets, is a prescription anti-HIV-1 medicine that contains two protease inhibitors: lopinavir and ritonavir. KALETRA is used with other anti-HIV-1 medications as a treatment that maintains viral suppression in people with HIV-1.
NORVIR.
NORVIR (ritonavir) is a protease inhibitor that is indicated in combination with other antiretroviral agents for the treatment of HIV-1 infection.
SYNAGIS.
SYNAGIS (palivizumab) is a product marketed by AbbVie outside of the United States that protects at-risk infants from severe respiratory disease caused by RSV.
|
2
|
2017 Form 10-K
|
||
Metabolics/Hormones products.
Metabolic and hormone products target a number of conditions, including testosterone deficiency due to certain underlying conditions, exocrine pancreatic insufficiency and hypothyroidism. These products include:
AndroGel.
AndroGel (testosterone gel) is a testosterone replacement therapy for males diagnosed with symptomatic low testosterone due to certain underlying conditions that is available in two strengths: 1 percent and 1.62 percent.
CREON.
CREON (pancrelipase) is a pancreatic enzyme therapy for exocrine pancreatic insufficiency, a condition that occurs in patients with cystic fibrosis, chronic pancreatitis and several other conditions.
Synthroid.
Synthroid (levothyroxine sodium tablets, USP) is used in the treatment of hypothyroidism.
AbbVie has the rights to sell AndroGel, CREON and Synthroid only in the United States.
Endocrinology products.
Lupron (leuprolide acetate), which is also marketed as Lucrin and LUPRON DEPOT, is a product for the palliative treatment of advanced prostate cancer, treatment of endometriosis and central precocious puberty and for the preoperative treatment of patients with anemia caused by uterine fibroids. Lupron is approved for daily subcutaneous injection and one-month, three-month, four-month and six-month intramuscular injection.
Other products.
AbbVie's other products include:
Duopa and Duodopa
(carbidopa and levodopa). AbbVie's levodopa-carbidopa intestinal gel for the treatment of advanced Parkinson's disease is marketed as Duopa in the United States and as Duodopa outside of the United States.
Anesthesia products.
Sevoflurane (sold under the trademarks Ultane and Sevorane) is an anesthesia product that AbbVie sells worldwide for human use.
ZINBRYTA.
ZINBRYTA (daclizumab) is a once-monthly, self-administered, subcutaneous treatment for relapsing forms of multiple sclerosis (MS), which was approved by the FDA in May 2016 and by the European Commission in July 2016. Due to the risk of serious liver damage, the use of ZINBRYTA is restricted to adult patients with relapsing forms of MS who have had an inadequate response to at least two disease modifying therapies (DMTs) and for whom treatment with any other DMT is contraindicated or otherwise unsuitable.
Marketing, Sales and Distribution Capabilities
AbbVie utilizes a combination of dedicated commercial resources, regional commercial resources and distributorships to market, sell and distribute its products worldwide.
AbbVie directs its primary marketing efforts toward securing the prescription, or recommendation, of its brand of products by physicians, key opinion leaders and other health care providers. Managed care providers (for example, health maintenance organizations and pharmacy benefit managers), hospitals and state and federal government agencies (for example, the United States Department of Veterans Affairs and the United States Department of Defense) are also important customers. AbbVie also markets directly to consumers themselves, although in the United States all of the company's products must be sold pursuant to a prescription. Outside of the United States, AbbVie focuses its marketing efforts on key opinion leaders, payers, physicians and country regulatory bodies. AbbVie also provides patient support programs closely related to its products.
AbbVie's products are generally sold worldwide directly to wholesalers, distributors, government agencies, health care facilities, specialty pharmacies and independent retailers from AbbVie-owned distribution centers and public warehouses. Although AbbVie's business does not have significant seasonality, AbbVie's product revenues may be affected by end customer and retail buying patterns, fluctuations in wholesaler inventory levels and other factors.
In the United States, AbbVie distributes pharmaceutical products principally through independent wholesale distributors, with some sales directly to pharmacies and patients. In
2017
,
three wholesale distributors (McKesson Corporation, Cardinal Health, Inc. and AmerisourceBergen Corporation) accounted for substantially all of AbbVie's sales in the United States
. No individual wholesaler accounted for greater than
42%
of AbbVie's
2017
gross revenues in the United States. Outside the United States, sales are made either directly to customers or through distributors, depending on the market served. These wholesalers purchase product from AbbVie under standard terms and conditions of sale.
Certain products are co-marketed or co-promoted with other companies. AbbVie has no single customer that, if the customer were lost, would have a material adverse effect on the company's business. No material portion of AbbVie's
|
2017 Form 10-K
|
3
|
||
business is subject to renegotiation of profits or termination of contracts at the election of the government. Orders are generally filled on a current basis and order backlog is not material to AbbVie's business.
Competition
The markets for AbbVie's products are highly competitive. AbbVie competes with other research-based pharmaceuticals and biotechnology companies that discover, manufacture, market and sell proprietary pharmaceutical products and biologics. For example, HUMIRA competes with anti-TNF products and other competitive products intended to treat a number of disease states and AbbVie's virology products compete with other available HCV treatment options. The search for technological innovations in pharmaceutical products is a significant aspect of competition. The introduction of new products by competitors and changes in medical practices and procedures can result in product obsolescence. Price is also a competitive factor. In addition, the substitution of generic pharmaceutical products for branded pharmaceutical products creates competitive pressures on AbbVie's products that do not have patent protection. New products or treatments brought to market by AbbVie’s competitors could cause revenues for AbbVie’s products to decrease due to price reductions and sales volume decreases.
Biosimilars.
Competition for AbbVie’s biologic products is affected by the approval of follow-on biologics, also known as “biosimilars.” Biologics have added major therapeutic options for the treatment of many diseases, including some for which therapies were unavailable or inadequate. The advent of biologics has also raised complex regulatory issues and significant pharmacoeconomic concerns because the cost of developing and producing biologic therapies is typically dramatically higher than for conventional (small molecule) medications, and because many expensive biologic medications are used for ongoing treatment of chronic diseases, such as rheumatoid arthritis or inflammatory bowel disease, or for the treatment of previously untreatable cancer. Significant investments in biologics infrastructure and manufacturing are necessary to produce biologic products, as are significant investments in marketing, distribution, and sales organization activities, which may limit the number of biosimilar competitors.
In the United States, the FDA regulates biologics under the Federal Food, Drug and Cosmetic Act, the Public Health Service Act and implementing regulations. The enactment of federal health care reform legislation in March 2010 provided a pathway for approval of biosimilars under the Public Health Service Act, but the approval process for, and science behind, biosimilars is more complex than the approval process for, and science behind, generic or other follow-on versions of small molecule products. This added complexity is due to steps needed to ensure that the safety and efficacy of biosimilars is highly similar to that of an original biologic, such as HUMIRA. Ultimate approval by the FDA is dependent upon many factors, including a showing that the biosimilar is "highly similar" to the original product and has no clinically meaningful differences from the original product in terms of safety, purity and potency. The types of data that could ordinarily be required in an application to show similarity may include analytical data and studies to demonstrate chemical similarity, animal studies (including toxicity studies) and clinical studies. The law also requires that the biosimilar must be for a condition of use approved for the original biologic and that the manufacturing facility meets the standards necessary to assure that the biosimilar is safe, pure and potent.
Furthermore, the law provides that only a biosimilar product that is determined to be "interchangeable" will be considered substitutable for the original biologic product without the intervention of the health care provider who prescribed the original biologic product. To prove that a biosimilar product is interchangeable, the applicant must demonstrate that the product can be expected to produce the same clinical results as the original biologic product in any given patient, and if the product is administered more than once in a patient, that safety risks and potential for diminished efficacy of alternating or switching between the use of the interchangeable biosimilar biologic product and the original biologic product is no greater than the risk of using the original biologic product without switching. The law continues to be interpreted and implemented by the FDA. As a result, its ultimate impact, implementation and meaning remains subject to substantial uncertainty.
In the European Union, while a pathway for the approval of biosimilars has existed since 2005, the products that have come to market to date have had a mixed impact on the market share of incumbent products, with significant variation by product.
Other Competitive Products.
Although a number of competitive biologic branded products have been approved since HUMIRA was first introduced in 2003, most have gained only a modest share of the worldwide market. AbbVie will continue to face competitive pressure from these biologics and from orally administered products.
Intellectual Property Protection and Regulatory Exclusivity
Generally, upon approval, products may be entitled to certain kinds of exclusivity under applicable intellectual property and regulatory regimes. AbbVie’s intellectual property is materially valuable to the company and AbbVie seeks patent protection, where available, in all significant markets and/or countries for each product in development. In the United States, the expiration date for patents is 20 years after the filing date. Given that patents relating to pharmaceutical products are
|
4
|
2017 Form 10-K
|
||
often obtained early in the development process, and given the amount of time needed to complete clinical trials and other development activities required for regulatory approval, the length of time between product launch and patent expiration is significantly less than 20 years. The Drug Price Competition and Patent Term Restoration Act of 1984 (commonly known as the Hatch-Waxman Act) permits a patent holder to seek a patent extension, commonly called a “patent term restoration,” for patents on products (or processes for making the product) regulated by the Federal Food, Drug, and Cosmetic Act. The length of the patent extension is roughly based on 50 percent of the period of time from the filing of an Investigational New Drug Application (NDA) for a compound to the submission of the NDA for such compound, plus 100 percent of the time period from NDA submission to regulatory approval. The extension, however, cannot exceed five years and the patent term remaining after regulatory approval cannot exceed 14 years. Biological products licensed under the Public Health Service Act are similarly eligible for terms of patent restoration.
Pharmaceutical products may be entitled to other forms of legal or regulatory exclusivity upon approval. The scope, length, and requirements for each of these exclusivities vary both in the United States and in other jurisdictions. In the United States, if the FDA approves a drug product that contains an active ingredient not previously approved, the product is typically entitled to five years of non-patent regulatory exclusivity. Other products may be entitled to three years of exclusivity if approval was based on the FDA’s reliance on new clinical studies essential to approval submitted by the NDA applicant. If the NDA applicant studies the product for use by children, the FDA may grant pediatric exclusivity, which extends by 180 days the longest existing exclusivity (patent or regulatory) related to the product. For products that are either used to treat conditions that afflict a relatively small population or for which there is not a reasonable expectation that the research and development costs will be recovered, the FDA may designate the pharmaceutical as an orphan drug and grant it seven years of market exclusivity.
Applicable laws and regulations dictate the scope of any exclusivity to which a product is entitled upon its approval in any particular country. In certain instances, regulatory exclusivity may protect a product where patent protection is no longer available or for a period of time in excess of patent protection. It is not possible to estimate for each product in development the total period and scope of exclusivity to which it may become entitled until regulatory approval is obtained. However, given the length of time required to complete clinical development of a pharmaceutical product, the periods of exclusivity that might be achieved in any individual case would not be expected to exceed a minimum of three years and a maximum of 14 years. These estimates do not consider other factors, such as the difficulty of recreating the manufacturing process for a particular product or other proprietary knowledge that may delay the introduction of a generic or other follow-on product after the expiration of applicable patent and other regulatory exclusivity periods.
Biologics may be entitled to exclusivity under the Biologics Price Competition and Innovation Act, which was passed on March 23, 2010 as Title VII to the Patient Protection and Affordable Care Act. The law provides a pathway for approval of biosimilars following the expiration of 12 years of exclusivity for the innovator biologic and a potential additional 180 day-extension term for conducting pediatric studies. Biologics are also eligible for orphan drug exclusivity, as discussed above. The law also includes an extensive process for the innovator biologic and biosimilar manufacturer to litigate patent infringement, validity, and enforceability. The European Union has also created a pathway for approval of biosimilars and has published guidelines for approval of certain biosimilar products. The more complex nature of biologics and biosimilar products has led to greater regulatory scrutiny and more rigorous requirements for approval of follow-on biosimilar products than for small molecule generic pharmaceutical products, which can reduce the effect of biosimilars on sales of the innovator biologic as compared to the sales erosion caused by generic versions of small molecule pharmaceutical products.
AbbVie owns or has licensed rights to a substantial number of patents and patent applications. AbbVie licenses or owns a patent portfolio of thousands of patent families, each of which includes United States patent applications and/or issued patents, and may also contain the non-United States counterparts to these patents and applications.
These patents and applications, including various patents that expire during the period 2018 to the late 2030s, in aggregate are believed to be of material importance in the operation of AbbVie’s business. However, AbbVie believes that no single patent, license, trademark (or related group of patents, licenses, or trademarks), except for those related to adalimumab (which is sold under the trademark HUMIRA), are material in relation to the company’s business as a whole. The United States composition of matter (that is, compound) patent covering adalimumab expired in December 2016, and the equivalent European Union patent is expected to expire in the majority of European Union countries in October 2018. In the United States, non-composition of matter patents covering adalimumab expire no earlier than 2022.
In addition, the following patents, licenses, and trademarks are significant: those related to ibrutinib (which is sold under the trademark IMBRUVICA), those related to ombitasvir/paritaprevir/ritonavir and dasabuvir (which are sold under the trademarks VIEKIRA PAK, VIEKIRAX, EXVIERA, and HOLKIRA PAK), those related to glecaprevir and pibrentasvir (which are sold under the trademarks MAVYRET and MAVIRET), and those related to testosterone (which is sold under the trademark AndroGel). The United States composition of matter patent covering ibrutinib is expected to expire in 2027. The United States
|
2017 Form 10-K
|
5
|
||
composition of matter patents covering ombitasvir, paritaprevir and dasabuvir are expected to expire in 2032, 2031 and 2029, respectively. The United States composition of matter patents covering glecaprevir and pibrentasvir are expected to expire in 2032.
AbbVie may rely, in some circumstances, on trade secrets to protect its technology. However, trade secrets are difficult to protect. AbbVie seeks to protect its technology and product candidates, in part, by confidentiality agreements with its employees, consultants, advisors, contractors, and collaborators. These agreements may be breached and AbbVie may not have adequate remedies for any breach. In addition, AbbVie’s trade secrets may otherwise become known or be independently discovered by competitors. To the extent that AbbVie’s employees, consultants, advisors, contractors, and collaborators use intellectual property owned by others in their work for the company, disputes may arise as to the rights in related or resulting know-how and inventions.
Licensing and Other Arrangements
In addition to its independent efforts to develop and market products, AbbVie enters into arrangements such as licensing arrangements, strategic alliances, co-promotion arrangements, co-development and co-marketing agreements, and joint ventures. These licensing and other arrangements typically include, among other terms and conditions, non-refundable upfront license fees, milestone payments and royalty and/or profit sharing obligations. See
Note 5
, "
Licensing, Acquisitions and Other Arrangements
—Other Licensing & Acquisitions Activity," to the
Consolidated Financial Statements
included under
Item 8
, "
Financial Statements and Supplementary Data
."
Third Party Agreements
AbbVie has agreements with third parties for process development, product distribution, analytical services and manufacturing of certain products. AbbVie procures certain products and services from a limited number of suppliers and, in some cases, a single supply source. In addition, AbbVie has agreements with third parties for active pharmaceutical ingredient and product manufacturing, formulation and development services, fill, finish and packaging services, transportation and distribution and logistics services for certain products. AbbVie does not believe that these manufacturing related agreements are material because AbbVie's business is not substantially dependent on any individual agreement. In most cases, AbbVie maintains alternate supply relationships that it can utilize without undue disruption of its manufacturing processes if a third party fails to perform its contractual obligations. AbbVie also maintains sufficient inventory of product to minimize the impact of any supply disruption.
AbbVie is also party to certain collaborations and other arrangements, as discussed in
Note 5
, "
Licensing, Acquisitions and Other Arrangements
—Other Licensing & Acquisitions Activity," to the
Consolidated Financial Statements
included under
Item 8
, "
Financial Statements and Supplementary Data
."
Sources and Availability of Raw Materials
AbbVie purchases, in the ordinary course of business, raw materials and supplies essential to its operations from numerous suppliers around the world. In addition, certain medical devices and components necessary for the manufacture of AbbVie products are provided by unaffiliated third party suppliers. AbbVie has not experienced any recent significant availability problems or supply shortages that impacted fulfillment of product demand.
Research and Development Activities
AbbVie makes a significant investment in research and development and has numerous compounds in clinical development, including potential treatments for complex, life-threatening diseases. AbbVie's ability to discover and develop new compounds is enhanced by the company's use of integrated discovery and development project teams, which include chemists, biologists, physicians and pharmacologists who work on the same compounds as a team. AbbVie also partners with third parties, such as biotechnology companies, other pharmaceutical companies and academic institutions to identify and prioritize promising new treatments that complement and enhance AbbVie’s existing portfolio.
The research and development process generally begins with discovery research which focuses on the identification of a molecule that has a desired effect against a given disease. If preclinical testing of an identified compound proves successful, the compound moves into clinical development which generally includes the following phases:
|
•
|
Phase 1—involves the first human tests in a small number of healthy volunteers or patients to assess safety, tolerability and potential dosing.
|
|
•
|
Phase 2—tests the drug's efficacy against the disease in a relatively small group of patients.
|
|
6
|
2017 Form 10-K
|
||
|
•
|
Phase 3—tests a drug that demonstrates favorable results in the earlier phases in a significantly larger patient population to further demonstrate efficacy and safety based on regulatory criteria.
|
The clinical trials from all of the development phases provide the data required to prepare and submit an NDA, a Biological License Application (BLA) or other submission for regulatory approval to the FDA or similar government agencies outside the United States. The specific requirements (e.g., scope of clinical trials) for obtaining regulatory approval vary across different countries and geographic regions.
The research and development process from discovery through a new drug launch typically takes 8 to 12 years and can be even longer. The research and development of new pharmaceutical products has a significant amount of inherent uncertainty. There is no guarantee when, or if, a molecule will receive the regulatory approval required to launch a new drug or indication.
In addition to the development of new products and new formulations, research and development projects also may include Phase 4 trials, sometimes called post-marketing studies. For such projects, clinical trials are designed and conducted to collect additional data regarding, among other parameters, the benefits and risks of an approved drug.
AbbVie spent approximately
$5.0 billion
in
2017
,
$4.4 billion
in
2016
and
$4.3 billion
in
2015
on research to discover and develop new products, indications and processes and to improve existing products and processes. These expenses consisted primarily of salaries and related expenses for personnel, license fees, consulting payments, contract research, clinical drug supply manufacturing, the costs of laboratory equipment and facilities, clinical trial costs and collaboration fees and expenses.
Regulation—Discovery and Clinical Development
United States.
Securing approval to market a new pharmaceutical product in the United States requires substantial effort and financial resources and takes several years to complete. The applicant must complete preclinical tests and submit protocols to the FDA before commencing clinical trials. Clinical trials are intended to establish the safety and efficacy of the pharmaceutical product and typically are conducted in sequential phases, although the phases may overlap or be combined. If the required clinical testing is successful, the results are submitted to the FDA in the form of an NDA or BLA requesting approval to market the product for one or more indications. The FDA reviews an NDA or BLA to determine whether a product is safe and effective for its intended use and whether its manufacturing is compliant with current Good Manufacturing Practices (cGMP).
Even if an NDA or a BLA receives approval, the applicant must comply with post-approval requirements. For example, holders of an approval must report adverse reactions, provide updated safety and efficacy information and comply with requirements concerning advertising and promotional materials and activities. Also, quality control and manufacturing procedures must continue to conform to cGMP after approval, and certain changes to the manufacturing procedures and finished product must be included in the NDA or BLA, and approved by the FDA. The FDA periodically inspects manufacturing facilities to assess compliance with cGMP, which imposes extensive procedural and record keeping requirements. In addition, as a condition of approval, the FDA may require post-marketing testing and surveillance to further assess and monitor the product's safety or efficacy after commercialization, which may require additional clinical trials or patient registries, or additional work on chemistry, manufacturing and controls. Any post-approval regulatory obligations, and the cost of complying with such obligations, could expand in the future.
Outside the United States.
AbbVie is subject to similar regulatory requirements outside the United States. AbbVie must obtain approval of a clinical trial application or product from the applicable regulatory authorities before it can commence clinical trials or marketing of the product. The approval requirements and process for each country can vary, and the time required to obtain approval may be longer or shorter than that required for FDA approval in the United States. For example, AbbVie may submit marketing authorizations in the European Union under either a centralized or decentralized procedure. The centralized procedure is mandatory for the approval of biotechnology products and many pharmaceutical products and provides for a single marketing authorization that is valid for all European Union member states. Under the centralized procedure, a single marketing authorization application is submitted to the European Medicines Agency (EMA). After the agency evaluates the application, it makes a recommendation to the European Commission, which then makes the final determination on whether to approve the application. The decentralized procedure provides for mutual recognition of individual national approval decisions and is available for products that are not subject to the centralized procedure.
In Japan, applications for approval of a new product are made through the Pharmaceutical and Medical Devices Agency (PMDA). Bridging studies to demonstrate that the non-Japanese clinical data applies to Japanese patients may be required. After completing a comprehensive review, the PMDA reports to the Ministry of Health, Labour and Welfare, which then approves or denies the application.
|
2017 Form 10-K
|
7
|
||
The regulatory process in many emerging markets continues to evolve. Many emerging markets, including those in Asia, generally require regulatory approval to have been obtained in a large developed market (such as the United States or Europe) before the country will begin or complete its regulatory review process. Some countries also require that local clinical studies be conducted in order to obtain regulatory approval in the country.
The requirements governing the conduct of clinical trials and product licensing also vary. In addition, post-approval regulatory obligations such as adverse event reporting and cGMP compliance generally apply and may vary by country. For example, after a marketing authorization has been granted in the European Union, periodic safety reports must be submitted and other pharmacovigilance measures may be required (such as Risk Management Plans).
Regulation—Commercialization, Distribution and Manufacturing
The manufacture, marketing, sale, promotion and distribution of AbbVie's products are subject to comprehensive government regulation. Government regulation by various national, regional, federal, state and local agencies, both in the United States and other countries, addresses (among other matters) inspection of, and controls over, research and laboratory procedures, clinical investigations, product approvals and manufacturing, labeling, packaging, marketing and promotion, pricing and reimbursement, sampling, distribution, quality control, post-marketing surveillance, record keeping, storage and disposal practices. AbbVie's operations are also affected by trade regulations in many countries that limit the import of raw materials and finished products and by laws and regulations that seek to prevent corruption and bribery in the marketplace (including the United States Foreign Corrupt Practices Act and the United Kingdom Bribery Act, which provide guidance on corporate interactions with government officials) and require safeguards for the protection of personal data. In addition, AbbVie is subject to laws and regulations pertaining to health care fraud and abuse, including state and federal anti-kickback and false claims laws in the United States. Prescription drug manufacturers such as AbbVie are also subject to taxes, as well as application, product, user, establishment and other fees.
Compliance with these laws and regulations is costly and materially affects AbbVie's business. Among other effects, health care regulations substantially increase the time, difficulty and costs incurred in obtaining and maintaining approval to market newly developed and existing products. AbbVie expects compliance with these regulations to continue to require significant technical expertise and capital investment to ensure compliance. Failure to comply can delay the release of a new product or result in regulatory and enforcement actions, the seizure or recall of a product, the suspension or revocation of the authority necessary for a product's production and sale and other civil or criminal sanctions, including fines and penalties.
In addition to regulatory initiatives, AbbVie's business can be affected by ongoing studies of the utilization, safety, efficacy and outcomes of health care products and their components that are regularly conducted by industry participants, government agencies and others. These studies can call into question the utilization, safety and efficacy of previously marketed products. In some cases, these studies have resulted, and may in the future result, in the discontinuance of, or limitations on, marketing of such products domestically or worldwide, and may give rise to claims for damages from persons who believe they have been injured as a result of their use.
Access to human health care products continues to be a subject of investigation and action by governmental agencies, legislative bodies and private organizations in the United States and other countries. A major focus is cost containment. Efforts to reduce health care costs are also being made in the private sector, notably by health care payers and providers, which have instituted various cost reduction and containment measures. AbbVie expects insurers and providers to continue attempts to reduce the cost of health care products. Outside the United States, many countries control the price of health care products directly or indirectly, through reimbursement, payment, pricing, coverage limitations, or compulsory licensing. Budgetary pressures in the United States and in other countries may also heighten the scope and severity of pricing pressures on AbbVie's products for the foreseeable future.
United States.
Specifically, U.S. federal laws require pharmaceutical manufacturers to pay certain statutorily-prescribed rebates to state Medicaid programs on prescription drugs reimbursed under state Medicaid plans, and the efforts by states to seek additional rebates affect AbbVie's business. Similarly, the Veterans Health Care Act of 1992, as a prerequisite to participation in Medicaid and other federal health care programs, requires that manufacturers extend additional discounts on pharmaceutical products to various federal agencies, including the United States Department of Veterans Affairs, Department of Defense and Public Health Service entities and institutions. In addition, recent legislative changes would require similarly discounted prices to be offered to TRICARE program beneficiaries. The Veterans Health Care Act of 1992 also established the 340B drug discount program, which requires pharmaceutical manufacturers to provide products at reduced prices to various designated health care entities and facilities.
In the United States, most states also have generic substitution legislation requiring or permitting a dispensing pharmacist to substitute a different manufacturer's generic version of a pharmaceutical product for the one prescribed. In addition, the federal government follows a diagnosis-related group (DRG) payment system for certain institutional services provided under
|
8
|
2017 Form 10-K
|
||
Medicare or Medicaid and has implemented a prospective payment system (PPS) for services delivered in hospital outpatient, nursing home and home health settings. DRG and PPS entitle a health care facility to a fixed reimbursement based on the diagnosis and/or procedure rather than actual costs incurred in patient treatment, thereby increasing the incentive for the facility to limit or control expenditures for many health care products. Medicare reimburses Part B drugs based on average sales price plus a certain percentage to account for physician administration costs, which have been reduced in the hospital outpatient setting. Medicare enters into contracts with private plans to negotiate prices for most patient-administered medicine delivered under Part D.
Under the Patient Protection and Affordable Care Act and the Health Care and Education Reconciliation Act (together, the Affordable Care Act), AbbVie pays a fee related to its pharmaceuticals sales to government programs. In addition, AbbVie provides a discount of 50% for branded prescription drugs sold to patients who fall into the Medicare Part D coverage gap, or "donut hole."
The Affordable Care Act also includes provisions known as the Physician Payments Sunshine Act, which require manufacturers of drugs and biologics covered under Medicare and Medicaid to record any transfers of value to physicians and teaching hospitals and to report this data to the Centers for Medicare and Medicaid Services for subsequent public disclosure. Similar reporting requirements have also been enacted on the state level in the United States, and an increasing number of countries worldwide either have adopted or are considering similar laws requiring disclosure of interactions with health care professionals. Failure to report appropriate data may result in civil or criminal fines and/or penalties.
AbbVie expects debate to continue during
2018
at all government levels worldwide over the marketing, availability, method of delivery and payment for health care products and services. AbbVie believes that future legislation and regulation in the markets it serves could affect access to health care products and services, increase rebates, reduce prices or the rate of price increases for health care products and services, change health care delivery systems, create new fees and obligations for the pharmaceuticals industry, or require additional reporting and disclosure. It is not possible to predict the extent to which AbbVie or the health care industry in general might be affected by the matters discussed above.
AbbVie is subject to a Corporate Integrity Agreement (CIA) entered into by Abbott on May 7, 2012 that requires enhancements to AbbVie's compliance program and contains reporting obligations, including disclosure of financial payments to doctors. If AbbVie fails to comply with the CIA, the Office of Inspector General for the United States Department of Health and Human Services may impose monetary penalties or exclude AbbVie from federal health care programs, including Medicare and Medicaid.
European Union.
The European Union has adopted directives and other legislation governing labeling, advertising, distribution, supply, pharmacovigilance and marketing of pharmaceutical products. Such legislation provides mandatory standards throughout the European Union and permits member states to supplement these standards with additional regulations. European governments also regulate pharmaceutical product prices through their control of national health care systems that fund a large part of the cost of such products to consumers. As a result, patients are unlikely to use a pharmaceutical product that is not reimbursed by the government. In many European countries, the government either regulates the pricing of a new product at launch or subsequent to launch through direct price controls or reference pricing. In recent years, many countries have also imposed new or additional cost containment measures on pharmaceutical products. Differences between national pricing regimes create price differentials within the European Union that can lead to significant parallel trade in pharmaceutical products.
Most governments also promote generic substitution by mandating or permitting a pharmacist to substitute a different manufacturer's generic version of a pharmaceutical product for the one prescribed and by permitting or mandating that health care professionals prescribe generic versions in certain circumstances. In addition, governments use reimbursement lists to limit the pharmaceutical products that are eligible for reimbursement by national health care systems.
Japan.
In Japan, the National Health Insurance system maintains a Drug Price List specifying which pharmaceutical products are eligible for reimbursement, and the Ministry of Health, Labour and Welfare sets the prices of the products on this list. The government generally introduces price cut rounds every other year and also mandates price decreases for specific products. New products judged innovative or useful, that are indicated for pediatric use, or that target orphan or small population diseases, however, may be eligible for a pricing premium. The government has also promoted the use of generics, where available.
Emerging Markets.
Many emerging markets take steps to reduce pharmaceutical product prices, in some cases through direct price controls and in others through the promotion of generic alternatives to branded pharmaceuticals.
Since AbbVie markets its products worldwide, certain products of a local nature and variations of product lines must also meet other local regulatory requirements. Certain additional risks are inherent in conducting business outside the United
|
2017 Form 10-K
|
9
|
||
States, including price and currency exchange controls, changes in currency exchange rates, limitations on participation in local enterprises, expropriation, nationalization and other governmental action.
Environmental Matters
AbbVie believes that its operations comply in all material respects with applicable laws and regulations concerning environmental protection. Regulations under federal and state environmental laws impose stringent limitations on emissions and discharges to the environment from various manufacturing operations. AbbVie's capital expenditures for pollution control in
2017
were approximately
$17 million
and operating expenditures were approximately
$28 million
. In
2018
, capital expenditures for pollution control are estimated to be approximately
$3 million
and operating expenditures are estimated to be approximately
$30 million
.
Abbott was identified as one of many potentially responsible parties in investigations and/or remediations at several locations in the United States, including Puerto Rico, under the Comprehensive Environmental Response, Compensation and Liability Act, commonly known as Superfund. Some of these locations were transferred to AbbVie in connection with the separation and distribution, and AbbVie has become a party to these investigations and remediations. Abbott was also engaged in remediation at several other sites, some of which have been transferred to AbbVie in connection with the separation and distribution, in cooperation with the Environmental Protection Agency or similar agencies. While it is not feasible to predict with certainty the final costs related to those investigations and remediation activities, AbbVie believes that such costs, together with other expenditures to maintain compliance with applicable laws and regulations concerning environmental protection, should not have a material adverse effect on the company's financial position, cash flows, or results of operations.
Employees
AbbVie employed approximately
29,000
persons as of January 31, 2018. Outside the United States, some of AbbVie's employees are represented by unions or works councils. AbbVie believes that it has good relations with its employees.
Internet Information
Copies of AbbVie's Annual Reports on Form 10-K, Quarterly Reports on Form 10-Q, Current Reports on Form 8-K and amendments to those reports filed or furnished pursuant to Section 13(a) or 15(d) of the Securities Exchange Act of 1934 are available free of charge through AbbVie's investor relations website (
www.abbvieinvestor.com
) as soon as reasonably practicable after AbbVie electronically files the material with, or furnishes it to, the Securities and Exchange Commission (SEC).
AbbVie's corporate governance guidelines, outline of directorship qualifications, code of business conduct and the charters of AbbVie's audit committee, compensation committee, nominations and governance committee and public policy committee are all available on AbbVie's investor relations website (
www.abbvieinvestor.com
).
You should carefully consider the following risks and other information in this Form 10-K in evaluating AbbVie and AbbVie's common stock. Any of the following risks could materially and adversely affect AbbVie's results of operations, financial condition or cash flows. The risk factors generally have been separated into two groups: risks related to AbbVie's business and risks related to AbbVie's common stock. Based on the information currently known to it, AbbVie believes that the following information identifies the most significant risk factors affecting it in each of these categories of risks. However, the risks and uncertainties AbbVie faces are not limited to those set forth in the risk factors described below and may not be in order of importance or probability of occurrence. Additional risks and uncertainties not presently known to AbbVie or that AbbVie currently believes to be immaterial may also adversely affect its business. In addition, past financial performance may not be a reliable indicator of future performance and historical trends should not be used to anticipate results or trends in future periods.
If any of the following risks and uncertainties develops into actual events, these events could have a material adverse effect on AbbVie's business, results of operations, financial condition or cash flows. In such case, the trading price of AbbVie's common stock could decline.
|
10
|
2017 Form 10-K
|
||
Risks Related to AbbVie's Business
The expiration or loss of patent protection and licenses may adversely affect AbbVie's future revenues and operating earnings.
AbbVie relies on patent, trademark and other intellectual property protection in the discovery, development, manufacturing and sale of its products. In particular, patent protection is, in the aggregate, important in AbbVie's marketing of pharmaceutical products in the United States and most major markets outside of the United States. Patents covering AbbVie products normally provide market exclusivity, which is important for the profitability of many of AbbVie's products.
As patents for certain of its products expire, AbbVie will or could face competition from lower priced generic products. The expiration or loss of patent protection for a product typically is followed promptly by substitutes that may significantly reduce sales for that product in a short amount of time. If AbbVie's competitive position is compromised because of generics or otherwise, it could have a material adverse effect on AbbVie's business and results of operations. In addition, proposals emerge from time to time for legislation to further encourage the early and rapid approval of generic drugs. Any such proposals that are enacted into law could increase the impact of generic competition.
AbbVie's principal patents and trademarks are described in greater detail in
Item 1
, "
Business
—Intellectual Property Protection and Regulatory Exclusivity" and
Item 7
, "
Management's Discussion and Analysis of Financial Condition and Results of Operations
—Results of Operations," and litigation regarding these patents is described in
Item 3
, "
Legal Proceedings
." The United States composition of matter patent for HUMIRA, which is AbbVie's largest product and had worldwide net revenues of approximately
$18.4 billion
in
2017
, expired in December 2016, and the equivalent European Union patent is expected to expire in the majority of European Union countries in October 2018. Because HUMIRA is a biologic and biologics cannot be readily substituted, it is uncertain what impact the loss of patent protection would have on the sales of HUMIRA.
AbbVie's major products could lose patent protection earlier than expected, which could adversely affect AbbVie's future revenues and operating earnings.
Third parties or government authorities may challenge or seek to invalidate or circumvent AbbVie's patents and patent applications. For example, manufacturers of generic pharmaceutical products file, and may continue to file, Abbreviated New Drug Applications with the FDA seeking to market generic forms of AbbVie's products prior to the expiration of relevant patents owned or licensed by AbbVie by asserting that the patents are invalid, unenforceable and/or not infringed. In addition, petitioners have filed, and may continue to file, challenges to the validity of AbbVie patents under the 2011 Leahy-Smith America Invents Act, which created
inter partes
review and post grant review procedures for challenging patent validity in administrative proceedings at the United States Patent and Trademark Office.
Although most of the challenges to AbbVie's intellectual property have come from other businesses, governments may also challenge intellectual property rights. For example, court decisions and potential legislation relating to patents, such as legislation regarding biosimilars, and other regulatory initiatives may result in further erosion of intellectual property protection. In addition, certain governments outside the United States have indicated that compulsory licenses to patents may be sought to further their domestic policies or on the basis of national emergencies, such as HIV/AIDS. If triggered, compulsory licenses could diminish or eliminate sales and profits from those jurisdictions and negatively affect AbbVie's results of operations.
AbbVie normally responds to challenges by vigorously defending its patents, including by filing patent infringement lawsuits. Patent litigation, administrative proceedings and other challenges to AbbVie's patents are costly and unpredictable and may deprive AbbVie of market exclusivity for a patented product. To the extent AbbVie's intellectual property is successfully challenged or circumvented or to the extent such intellectual property does not allow AbbVie to compete effectively, AbbVie's business will suffer. To the extent that countries do not enforce AbbVie's intellectual property rights or require compulsory licensing of AbbVie's intellectual property, AbbVie's future revenues and operating earnings will be reduced.
A third party's intellectual property may prevent AbbVie from selling its products or have a material adverse effect on AbbVie's future profitability and financial condition.
Third parties may claim that an AbbVie product infringes upon their intellectual property. Resolving an intellectual property infringement claim can be costly and time consuming and may require AbbVie to enter into license agreements. AbbVie cannot guarantee that it would be able to obtain license agreements on commercially reasonable terms. A successful claim of patent or other intellectual property infringement could subject AbbVie to significant damages or an injunction
|
2017 Form 10-K
|
11
|
||
preventing the manufacture, sale, or use of the affected AbbVie product or products. Any of these events could have a material adverse effect on AbbVie's profitability and financial condition.
Any significant event that adversely affects HUMIRA revenues could have a material and negative impact on AbbVie's results of operations and cash flows.
HUMIRA accounted for approximately
65%
of AbbVie's total net revenues in
2017
. Any significant event that adversely affects HUMIRA's revenues could have a material adverse impact on AbbVie's results of operations and cash flows. These events could include loss of patent protection for HUMIRA, the commercialization of biosimilars of HUMIRA, the discovery of previously unknown side effects or impaired efficacy, increased competition from the introduction of new, more effective or less expensive treatments and discontinuation or removal from the market of HUMIRA for any reason.
AbbVie's research and development efforts may not succeed in developing and marketing commercially successful products and technologies, which may cause its revenues and profitability to decline.
To remain competitive, AbbVie must continue to launch new products and new indications and/or brand extensions for existing products, and such launches must generate revenue sufficient both to cover its substantial research and development costs and to replace revenues of profitable products that are lost to or displaced by competing products or therapies. Failure to do so would have a material adverse effect on AbbVie's revenue and profitability. Accordingly, AbbVie commits substantial effort, funds, and other resources to research and development and must make ongoing substantial expenditures without any assurance that its efforts will be commercially successful. A high rate of failure in the biopharmaceutical industry is inherent in the research and development of new products, and failure can occur at any point in the research and development process, including after significant funds have been invested. Products that appear promising in development may fail to reach the market for numerous reasons, including failure to demonstrate effectiveness, safety concerns, superior safety or efficacy of competing therapies, failure to achieve positive clinical or pre-clinical outcomes beyond the current standards of care, inability to obtain necessary regulatory approvals or delays in the approval of new products and new indications, limited scope of approved uses, excessive costs to manufacture, the failure to obtain or maintain intellectual property rights, or infringement of the intellectual property rights of others.
Decisions about research studies made early in the development process of a pharmaceutical product candidate can affect the marketing strategy once such candidate receives approval. More detailed studies may demonstrate additional benefits that can help in the marketing, but they also consume time and resources and may delay submitting the pharmaceutical product candidate for approval. AbbVie cannot guarantee that a proper balance of speed and testing will be made with respect to each pharmaceutical product candidate or that decisions in this area would not adversely affect AbbVie's future results of operations.
Even if AbbVie successfully develops and markets new products or enhancements to its existing products, they may be quickly rendered obsolete by changing clinical preferences, changing industry standards, or competitors' innovations. AbbVie's innovations may not be accepted quickly in the marketplace because of existing clinical practices or uncertainty over third-party reimbursement. AbbVie cannot state with certainty when or whether any of its products under development will be launched, whether it will be able to develop, license, or otherwise acquire compounds or products, or whether any products will be commercially successful. Failure to launch successful new products or new indications for existing products may cause AbbVie's products to become obsolete, causing AbbVie's revenues and operating results to suffer.
A portion of AbbVie's near-term pharmaceutical pipeline relies on collaborations with third parties, which may adversely affect the development and sale of its products.
AbbVie depends on alliances with pharmaceutical and biotechnology companies for a portion of the products in its near-term pharmaceutical pipeline. For example, AbbVie is collaborating with Roche Holding AG to develop and commercialize a next-generation Bcl-2 inhibitor, Venclexta (venetoclax), for patients with relapsed/refractory chronic lymphocytic leukemia and AbbVie is investigating its efficacy for additional indications.
Failures by these parties to meet their contractual, regulatory, or other obligations to AbbVie, or any disruption in the relationships between AbbVie and these third parties, could have an adverse effect on AbbVie's pharmaceutical pipeline and business. In addition, AbbVie's collaborative relationships for research and development extend for many years and may give rise to disputes regarding the relative rights, obligations and revenues of AbbVie and its collaboration partners, including the ownership of intellectual property and associated rights and obligations. This could result in the loss of intellectual property rights or protection, delay the development and sale of potential pharmaceutical products and lead to lengthy and expensive litigation, administrative proceedings or arbitration.
|
12
|
2017 Form 10-K
|
||
Biologics carry unique risks and uncertainties, which could have a negative impact on future results of operations.
The successful discovery, development, manufacturing and sale of biologics is a long, expensive and uncertain process. There are unique risks and uncertainties with biologics. For example, access to and supply of necessary biological materials, such as cell lines, may be limited and governmental regulations restrict access to and regulate the transport and use of such materials. In addition, the development, manufacturing and sale of biologics is subject to regulations that are often more complex and extensive than the regulations applicable to other pharmaceutical products. Manufacturing biologics, especially in large quantities, is often complex and may require the use of innovative technologies. Such manufacturing also requires facilities specifically designed and validated for this purpose and sophisticated quality assurance and quality control procedures. Biologics are also frequently costly to manufacture because production inputs are derived from living animal or plant material, and some biologics cannot be made synthetically. Failure to successfully discover, develop, manufacture and sell biologics—including HUMIRA—could adversely impact AbbVie's business and results of operations.
AbbVie's biologic products are subject to competition from biosimilars.
The Biologics Price Competition and Innovation Act creates a framework for the approval of biosimilars in the United States and could allow competitors to reference data from biologic products already approved. In Europe, the European Commission has granted marketing authorizations for several biosimilars pursuant to a set of general and product class-specific guidelines for biosimilar approvals issued over the past few years. In addition, companies are developing biosimilars in other countries that could compete with AbbVie’s biologic products. As competitors are able to obtain marketing approval for biosimilars referencing AbbVie’s biologic products, AbbVie’s products may become subject to competition from such biosimilars, with the attendant competitive pressure and consequences. Expiration or successful challenge of AbbVie’s applicable patent rights could also trigger competition from other products, assuming any relevant exclusivity period has expired. As a result, AbbVie could face more litigation and administrative proceedings with respect to the validity and/or scope of patents relating to its biologic products.
New products and technological advances by AbbVie's competitors may negatively affect AbbVie's results of operations.
AbbVie competes with other research-based pharmaceutical and biotechnology companies that discover, manufacture, market, and sell proprietary pharmaceutical products and biologics. For example, HUMIRA competes with anti-TNF products and other competitive products intended to treat a number of disease states and AbbVie’s virology products compete with other available hepatitis C treatment options. These competitors may introduce new products or develop technological advances that compete with AbbVie’s products in therapeutic areas such as immunology, virology/liver disease, oncology and neuroscience. AbbVie cannot predict with certainty the timing or impact of the introduction by competitors of new products or technological advances. Such competing products may be safer, more effective, more effectively marketed or sold, or have lower prices or superior performance features than AbbVie’s products, and this could negatively impact AbbVie’s business and results of operations.
The manufacture of many of AbbVie's products is a highly exacting and complex process, and if AbbVie or one of its suppliers encounters problems manufacturing AbbVie's products, AbbVie's business could suffer.
The manufacture of many of AbbVie's products is a highly exacting and complex process, due in part to strict regulatory requirements. Problems may arise during manufacturing for a variety of reasons, including equipment malfunction, failure to follow specific protocols and procedures, problems with raw materials, delays related to the construction of new facilities or the expansion of existing facilities, including those intended to support future demand for AbbVie's products, changes in manufacturing production sites and limits to manufacturing capacity due to regulatory requirements, changes in the types of products produced, physical limitations that could inhibit continuous supply, man-made or natural disasters and environmental factors. If problems arise during the production of a batch of product, that batch of product may have to be discarded and AbbVie may experience product shortages or incur added expenses. This could, among other things, lead to increased costs, lost revenue, damage to customer relations, time and expense spent investigating the cause and, depending on the cause, similar losses with respect to other batches or products. If problems are not discovered before the product is released to the market, recall and product liability costs may also be incurred.
|
2017 Form 10-K
|
13
|
||
AbbVie uses a number of products in its pharmaceutical and biologic manufacturing processes that are sourced from single suppliers, and an interruption in the supply of those products could adversely affect AbbVie's business and results of operations.
AbbVie uses a number of products in its pharmaceutical and biologic manufacturing processes that are sourced from single suppliers. The failure of these single-source suppliers to fulfill their contractual obligations in a timely manner or as a result of regulatory noncompliance or physical disruption at a manufacturing site may impair AbbVie's ability to deliver its products to customers on a timely and competitive basis, which could adversely affect AbbVie's business and results of operations. Finding an alternative supplier could take a significant amount of time and involve significant expense due to the nature of the products and the need to obtain regulatory approvals. AbbVie cannot guarantee that it will be able to reach agreement with alternative providers or that regulatory authorities would approve AbbVie's use of such alternatives. AbbVie does, however, carry business interruption insurance, which provides a degree of protection in the case of a failure by a single-source supplier.
Significant safety or efficacy issues could arise for AbbVie's products, which could have a material adverse effect on AbbVie's revenues and financial condition.
Pharmaceutical products receive regulatory approval based on data obtained in controlled clinical trials of limited duration. Following regulatory approval, these products will be used over longer periods of time in many patients. Investigators may also conduct additional, and perhaps more extensive, studies. If new safety or efficacy issues are reported or if new scientific information becomes available (including results of post-marketing Phase 4 trials), or if governments change standards regarding safety, efficacy or labeling, AbbVie may be required to amend the conditions of use for a product. For example, AbbVie may voluntarily provide or be required to provide updated information on a product's label or narrow its approved indication, either of which could reduce the product's market acceptance. If safety or efficacy issues with an AbbVie product arise, sales of the product could be halted by AbbVie or by regulatory authorities. Safety or efficacy issues affecting suppliers' or competitors' products also may reduce the market acceptance of AbbVie's products.
New data about AbbVie's products, or products similar to its products, could negatively impact demand for AbbVie's products due to real or perceived safety issues or uncertainty regarding efficacy and, in some cases, could result in product withdrawal. Furthermore, new data and information, including information about product misuse, may lead government agencies, professional societies, practice management groups or organizations involved with various diseases to publish guidelines or recommendations related to the use of AbbVie's products or the use of related therapies or place restrictions on sales. Such guidelines or recommendations may lead to lower sales of AbbVie's products.
AbbVie is subject to product liability claims and lawsuits that may adversely affect its business and results of operations.
In the ordinary course of business, AbbVie is the subject of product liability claims and lawsuits alleging that AbbVie's products or the products of other companies that it promotes have resulted or could result in an unsafe condition for or injury to patients. Product liability claims and lawsuits and safety alerts or product recalls, regardless of their ultimate outcome, may have a material adverse effect on AbbVie's business, results of operations and reputation and on its ability to attract and retain customers. Consequences may also include additional costs, a decrease in market share for the product in question, lower income and exposure to other claims. Product liability losses are self-insured.
AbbVie is subject to cost-containment efforts and pricing pressures that could cause a reduction in future revenues and operating earnings, and changes in the terms of rebate and chargeback programs, which are common in the pharmaceuticals industry, could have a material adverse effect on AbbVie's operations.
Cost-containment efforts by governments and private organizations are described in greater detail in Item 1, "Business—Regulation—Commercialization, Distribution and Manufacturing." To the extent these cost containment efforts are not offset by greater demand, increased patient access to health care, or other factors, AbbVie's future revenues and operating earnings will be reduced. In the United States, the European Union and other countries, AbbVie's business has experienced downward pressure on product pricing, and this pressure could increase in the future.
AbbVie is subject to increasing public and legislative pressure with respect to pharmaceutical pricing. In the United States, practices of managed care groups, and institutional and governmental purchasers, and United States federal laws and regulations related to Medicare and Medicaid, including the Medicare Prescription Drug Improvement and Modernization Act of 2003 and the Patient Protection and Affordable Care Act, contribute to pricing pressures. The potential for continuing
|
14
|
2017 Form 10-K
|
||
changes to the health care system in the United States and the increased purchasing power of entities that negotiate on behalf of Medicare, Medicaid and private sector beneficiaries could result in additional pricing pressures.
In numerous major markets worldwide, the government plays a significant role in funding health care services and determining the pricing and reimbursement of pharmaceutical products. Consequently, in those markets, AbbVie is subject to government decision-making and budgetary actions with respect to its products. In particular, many European countries have ongoing government-mandated price reductions for many pharmaceutical products, and AbbVie anticipates continuing pricing pressures in Europe. Differences between countries in pricing regulations could lead to third-party cross-border trading in AbbVie's products that results in a reduction in future revenues and operating earnings.
Rebates related to government programs, such as fee-for-service Medicaid or Medicaid managed care programs, arise from laws and regulations. AbbVie cannot predict if additional government initiatives to contain health care costs or other factors could lead to new or modified regulatory requirements that include higher or incremental rebates or discounts. Other rebate and discount programs arise from contractual agreements with private payers. Various factors, including market factors and the ability of private payers to control patient access to products, may provide payers the leverage to negotiate higher or additional rebates or discounts that could have a material adverse effect on AbbVie's operations.
AbbVie is subject to numerous governmental regulations, and it can be costly to comply with these regulations and to develop compliant products and processes.
AbbVie's products are subject to rigorous regulation by numerous international, supranational, federal and state authorities, as described in
Item 1
, "
Business
—Regulation—Discovery and Clinical Development." The process of obtaining regulatory approvals to market a pharmaceutical product can be costly and time consuming, and approvals might not be granted for future products, or additional indications or uses of existing products, on a timely basis, if at all. Delays in the receipt of, or failure to obtain approvals for, future products, or new indications and uses, could result in delayed realization of product revenues, reduction in revenues and substantial additional costs.
In addition, AbbVie cannot guarantee that it will remain compliant with applicable regulatory requirements once approval has been obtained for a product. These requirements include, among other things, regulations regarding manufacturing practices, product labeling and advertising and post-marketing reporting, including adverse event reports and field alerts due to manufacturing quality concerns. AbbVie must incur expense and spend time and effort to ensure compliance with these complex regulations.
Possible regulatory actions could result in substantial modifications to AbbVie's business practices and operations; refunds, recalls, or seizures of AbbVie's products; a total or partial shutdown of production in one or more of AbbVie's or its suppliers' facilities while AbbVie or its supplier remedies the alleged violation; the inability to obtain future approvals; and withdrawals or suspensions of current products from the market. Any of these events could disrupt AbbVie's business and have a material adverse effect on its business and results of operations.
Laws and regulations affecting government benefit programs could impose new obligations on AbbVie, require it to change its business practices, and restrict its operations in the future.
The health care industry is subject to various federal, state and international laws and regulations pertaining to government benefit programs reimbursement, rebates, price reporting and regulation and health care fraud and abuse. In the United States, these laws include anti-kickback and false claims laws, the Medicaid Rebate Statute, the Veterans Health Care Act and individual state laws relating to pricing and sales and marketing practices. Violations of these laws may be punishable by criminal and/or civil sanctions, including, in some instances, substantial fines, imprisonment and exclusion from participation in federal and state health care programs, including Medicare, Medicaid and Veterans Administration health programs. These laws and regulations are broad in scope and they are subject to change and evolving interpretations, which could require AbbVie to incur substantial costs associated with compliance or to alter one or more of its sales or marketing practices. In addition, violations of these laws, or allegations of such violations, could disrupt AbbVie's business and result in a material adverse effect on its business and results of operations.
AbbVie could be subject to increased monetary penalties and/or other sanctions, including exclusion from federal health care programs, if it fails to comply with the terms of the May 7, 2012 resolution of the Department of Justice's investigation into sales and marketing activities for Depakote.
On May 7, 2012, Abbott settled United States federal and 49 state investigations into its sales and marketing activities for Depakote by pleading guilty to a misdemeanor violation of the Food, Drug and Cosmetic Act, agreeing to pay
|
2017 Form 10-K
|
15
|
||
approximately $700 million in criminal fines and forfeitures and approximately $900 million to resolve civil claims, and submitting to a term of probation. The term of probation ended January 1, 2016 upon AbbVie satisfying all of the probation conditions. However, if AbbVie violates any remaining terms of the plea agreement, it may face additional monetary sanctions and other such remedies as the court deems appropriate.
In addition, Abbott entered into a five-year CIA with the Office of Inspector General for the United States Department of Health and Human Services (OIG). The effective date of the CIA is October 11, 2012. The obligations of the CIA have transferred to and become fully binding on AbbVie. The CIA requires enhancements to AbbVie's compliance program, fulfillment of reporting and monitoring obligations, management certifications and resolutions from AbbVie's board of directors, among other requirements. Compliance with the requirements of the settlement will impose additional costs and burdens on AbbVie, including in the form of employee training, third party reviews, compliance monitoring, reporting obligations and management attention. If AbbVie fails to comply with the CIA, the OIG may impose monetary penalties or exclude AbbVie from federal health care programs, including Medicare and Medicaid. AbbVie and Abbott may be subject to third party claims and shareholder lawsuits in connection with the settlement, and AbbVie may be required to indemnify all or a portion of Abbott's costs.
The international nature of AbbVie's business subjects it to additional business risks that may cause its revenue and profitability to decline.
AbbVie's business is subject to risks associated with doing business internationally, including in emerging markets. Net revenues outside of the United States make up approximately
35%
of AbbVie's total net revenues in
2017
. The risks associated with AbbVie's operations outside the United States include:
|
•
|
fluctuations in currency exchange rates;
|
|
•
|
changes in medical reimbursement policies and programs;
|
|
•
|
multiple legal and regulatory requirements that are subject to change and that could restrict AbbVie's ability to manufacture, market and sell its products;
|
|
•
|
differing local product preferences and product requirements;
|
|
•
|
trade protection measures and import or export licensing requirements;
|
|
•
|
difficulty in establishing, staffing and managing operations;
|
|
•
|
differing labor regulations;
|
|
•
|
potentially negative consequences from changes in or interpretations of tax laws;
|
|
•
|
political and economic instability, including sovereign debt issues;
|
|
•
|
price and currency exchange controls, limitations on participation in local enterprises, expropriation, nationalization and other governmental action;
|
|
•
|
inflation, recession and fluctuations in interest rates;
|
|
•
|
potential deterioration in the economic position and credit quality of certain non-U.S. countries, including in Europe and Latin America; and
|
|
•
|
potential penalties or other adverse consequences for violations of anti-corruption, anti-bribery and other similar laws and regulations, including the United States Foreign Corrupt Practices Act and the United Kingdom Bribery Act.
|
Events contemplated by these risks may, individually or in the aggregate, have a material adverse effect on AbbVie's revenues and profitability.
If AbbVie does not effectively and profitably commercialize IMBRUVICA, AbbVie's revenues and financial condition could be adversely affected.
AbbVie must effectively and profitably commercialize IMBRUVICA by creating and meeting continued market demand; achieving market acceptance and generating product sales; ensuring that the active pharmaceutical ingredient for IMBRUVICA and the finished product are manufactured in sufficient quantities and in compliance with requirements of the FDA and similar foreign regulatory agencies and with acceptable quality and pricing to meet commercial demand; and ensuring that the entire supply chain efficiently and consistently delivers IMBRUVICA to AbbVie's customers. The commercialization of
|
16
|
2017 Form 10-K
|
||
IMBRUVICA may not be successful due to, among other things, unexpected challenges from competitors, new safety issues or concerns being reported that may impact or narrow the approved indications, the relative price of IMBRUVICA as compared to alternative treatment options and changes to the label for IMBRUVICA that further restrict its marketing. If the commercialization of IMBRUVICA is unsuccessful, AbbVie's ability to generate revenue from product sales and realize the anticipated benefits of the merger with Pharmacyclics will be adversely affected.
AbbVie may acquire other businesses, license rights to technologies or products, form alliances, or dispose of assets, which could cause it to incur significant expenses and could negatively affect profitability.
AbbVie may pursue acquisitions, technology licensing arrangements, and strategic alliances, or dispose of some of its assets, as part of its business strategy. AbbVie may not complete these transactions in a timely manner, on a cost-effective basis, or at all, and may not realize the expected benefits. If AbbVie is successful in making an acquisition, the products and technologies that are acquired may not be successful or may require significantly greater resources and investments than originally anticipated. AbbVie may not be able to integrate acquisitions successfully into its existing business and could incur or assume significant debt and unknown or contingent liabilities. AbbVie could also experience negative effects on its reported results of operations from acquisition or disposition-related charges, amortization of expenses related to intangibles and charges for impairment of long-term assets. These effects could cause a deterioration of AbbVie's credit rating and result in increased borrowing costs and interest expense.
Additionally, changes in AbbVie's structure, operations, revenues, costs, or efficiency resulting from major transactions such as acquisitions, divestitures, mergers, alliances, restructurings or other strategic initiatives, may result in greater than expected costs, may take longer than expected to complete or encounter other difficulties, including the need for regulatory approval where appropriate.
AbbVie is dependent on wholesale distributors for distribution of its products in the United States and, accordingly, its results of operations could be adversely affected if they encounter financial difficulties.
In
2017
,
three wholesale distributors (McKesson Corporation, Cardinal Health, Inc. and AmerisourceBergen Corporation) accounted for substantially all of AbbVie's sales in the United States
. If one of its significant wholesale distributors encounters financial or other difficulties, such distributor may decrease the amount of business that it does with AbbVie, and AbbVie may be unable to collect all the amounts that the distributor owes it on a timely basis or at all, which could negatively impact AbbVie's business and results of operations.
AbbVie has debt obligations that could adversely affect its business and its ability to meet its obligations.
The amount of debt that AbbVie has incurred and intends to incur could have important consequences to AbbVie and its investors. These consequences include, among other things, requiring a portion of AbbVie's cash flow from operations to make interest payments on this debt and reducing the cash flow available to fund capital expenditures and other corporate purposes and to grow AbbVie's business. To the extent AbbVie incurs additional indebtedness, these risks could increase. In addition, AbbVie's cash flow from operations may not be sufficient to repay all of the outstanding debt as it becomes due, and AbbVie may not be able to borrow money, sell assets, or otherwise raise funds on acceptable terms, or at all, to refinance its debt.
AbbVie may need additional financing in the future to meet its capital needs or to make opportunistic acquisitions, and such financing may not be available on favorable terms, if at all.
AbbVie may need to seek additional financing for its general corporate purposes. For example, it may need to increase its investment in research and development activities or need funds to make acquisitions. AbbVie may be unable to obtain any desired additional financing on terms favorable to it, if at all. If AbbVie loses its investment grade credit rating or adequate funds are not available on acceptable terms, AbbVie may be unable to fund its expansion, successfully develop or enhance products, or respond to competitive pressures, any of which could negatively affect AbbVie's business. If AbbVie raises additional funds by issuing debt or entering into credit facilities, it may be subject to limitations on its operations due to restrictive covenants. Failure to comply with these covenants could adversely affect AbbVie's business.
|
2017 Form 10-K
|
17
|
||
AbbVie depends on information technology and a failure of those systems could adversely affect AbbVie's business.
AbbVie relies on sophisticated information technology systems to operate its business. These systems are potentially vulnerable to malicious intrusion, random attack, loss of data privacy, or breakdown. Data privacy or security breaches by employees or others may cause sensitive data, including intellectual property, trade secrets or personal information belonging to AbbVie, its patients, customers or business partners, to be exposed to unauthorized persons or to the public. Although AbbVie has invested in the protection of its data and information technology and also monitors its systems on an ongoing basis, there can be no assurance that these efforts will prevent breakdowns or breaches in AbbVie's information technology systems that could adversely affect AbbVie's business.
Other factors can have a material adverse effect on AbbVie's profitability and financial condition.
Many other factors can affect AbbVie's results of operations, cash flows and financial condition, including:
|
•
|
changes in or interpretations of laws and regulations, including changes in accounting standards, taxation requirements, product marketing application standards and environmental laws;
|
|
•
|
differences between the fair value measurement of assets and liabilities and their actual value, particularly for pension and post-employment benefits, stock-based compensation, intangibles and goodwill; and for contingent liabilities such as litigation and contingent consideration, the absence of a recorded amount, or an amount recorded at the minimum, compared to the actual amount;
|
|
•
|
changes in the rate of inflation (including the cost of raw materials, commodities and supplies), interest rates, market value of AbbVie's equity investments and the performance of investments held by it or its employee benefit trusts;
|
|
•
|
changes in the creditworthiness of counterparties that transact business with or provide services to AbbVie or its employee benefit trusts;
|
|
•
|
changes in the ability of third parties that provide information technology, accounting, human resources, payroll and other outsourced services to AbbVie to meet their contractual obligations to AbbVie; and
|
|
•
|
changes in business, economic and political conditions, including: war, political instability, terrorist attacks, the threat of future terrorist activity and related military action; natural disasters; the cost and availability of insurance due to any of the foregoing events; labor disputes, strikes, slow-downs, or other forms of labor or union activity; and pressure from third-party interest groups.
|
Risks Related to AbbVie's Common Stock
AbbVie cannot guarantee the timing, amount, or payment of dividends on its common stock.
Although AbbVie expects to pay regular cash dividends, the timing, declaration, amount and payment of future dividends to stockholders will fall within the discretion of AbbVie's board of directors. The board's decisions regarding the payment of dividends will depend on many factors, such as AbbVie's financial condition, earnings, capital requirements, debt service obligations, industry practice, legal requirements, regulatory constraints and other factors that the board deems relevant. For more information, see
Item 5
, "
Market for Registrant's Common Equity, Related Stockholder Matters and Issuer Purchases of Equity Securities
." AbbVie's ability to pay dividends will depend on its ongoing ability to generate cash from operations and access capital markets. AbbVie cannot guarantee that it will continue to pay a dividend in the future.
An AbbVie stockholder's percentage of ownership in AbbVie may be diluted in the future.
In the future, a stockholder's percentage ownership in AbbVie may be diluted because of equity issuances for capital market transactions, equity awards that AbbVie will be granting to AbbVie's directors, officers and employees, acquisitions, or other purposes. AbbVie's employees have options to purchase shares of its common stock as a result of conversion of their Abbott stock options (in whole or in part) to AbbVie stock options. AbbVie anticipates its compensation committee will grant additional stock options or other stock-based awards to its employees. Such awards will have a dilutive effect on AbbVie's earnings per share, which could adversely affect the market price of AbbVie's common stock. From time to time, AbbVie will issue additional options or other stock-based awards to its employees under AbbVie's employee benefits plans.
|
18
|
2017 Form 10-K
|
||
In addition, AbbVie's amended and restated certificate of incorporation authorizes AbbVie to issue, without the approval of AbbVie's stockholders, one or more classes or series of preferred stock having such designation, powers, preferences and relative, participating, optional and other special rights, including preferences over AbbVie's common stock respecting dividends and distributions, as AbbVie's board of directors generally may determine. The terms of one or more classes or series of preferred stock could dilute the voting power or reduce the value of AbbVie's common stock. For example, AbbVie could grant the holders of preferred stock the right to elect some number of AbbVie's directors in all events or on the happening of specified events or the right to veto specified transactions. Similarly, the repurchase or redemption rights or liquidation preferences AbbVie could assign to holders of preferred stock could affect the residual value of the common stock.
Certain provisions in AbbVie's amended and restated certificate of incorporation and amended and restated by-laws, and of Delaware law, may prevent or delay an acquisition of AbbVie, which could decrease the trading price of AbbVie's common stock.
AbbVie's amended and restated certificate of incorporation and amended and restated by-laws contain, and Delaware law contains, provisions that are intended to deter coercive takeover practices and inadequate takeover bids by making such practices or bids unacceptably expensive to the bidder and to encourage prospective acquirors to negotiate with AbbVie's board of directors rather than to attempt a hostile takeover. These provisions include, among others:
|
•
|
the inability of AbbVie's stockholders to call a special meeting;
|
|
•
|
the division of AbbVie's board of directors into three classes of directors, with each class serving a staggered three-year term;
|
|
•
|
a provision that stockholders may only remove directors for cause;
|
|
•
|
the ability of AbbVie's directors, and not stockholders, to fill vacancies on AbbVie's board of directors; and
|
|
•
|
the requirement that the affirmative vote of stockholders holding at least 80% of AbbVie's voting stock is required to amend certain provisions in AbbVie's amended and restated certificate of incorporation and AbbVie's amended and restated by-laws relating to the number, term and election of AbbVie's directors, the filling of board vacancies, the calling of special meetings of stockholders and director and officer indemnification provisions.
|
In addition, Section 203 of the Delaware General Corporation Law provides that, subject to limited exceptions, persons that acquire, or are affiliated with a person that acquires, more than 15% of the outstanding voting stock of a Delaware corporation shall not engage in any business combination with that corporation, including by merger, consolidation or acquisitions of additional shares, for a three-year period following the date on which that person or its affiliates becomes the holder of more than 15% of the corporation's outstanding voting stock.
AbbVie believes these provisions protect its stockholders from coercive or otherwise unfair takeover tactics by requiring potential acquirors to negotiate with AbbVie's board of directors and by providing AbbVie's board of directors with more time to assess any acquisition proposal. These provisions are not intended to make the company immune from takeovers. However, these provisions apply even if the offer may be considered beneficial by some stockholders and could delay or prevent an acquisition that AbbVie's board of directors determines is not in the best interests of AbbVie and AbbVie's stockholders. These provisions may also prevent or discourage attempts to remove and replace incumbent directors.
|
2017 Form 10-K
|
19
|
||
CAUTIONARY STATEMENT REGARDING FORWARD-LOOKING STATEMENTS
This Annual Report on Form 10-K contains certain forward looking statements regarding business strategies, market potential, future financial performance and other matters. The words "believe," "expect," "anticipate," "project" and similar expressions, among others, generally identify "forward looking statements," which speak only as of the date the statements were made. The matters discussed in these forward looking statements are subject to risks, uncertainties and other factors that could cause actual results to differ materially from those projected, anticipated or implied in the forward looking statements. In particular, information included under
Item 1
, "
Business
,"
Item 1A
, "
Risk Factors
," and
Item 7
, "
Management's Discussion and Analysis of Financial Condition and Results of Operations
" contain forward looking statements. Where, in any forward looking statement, an expectation or belief as to future results or events is expressed, such expectation or belief is based on the current plans and expectations of AbbVie management and expressed in good faith and believed to have a reasonable basis, but there can be no assurance that the expectation or belief will result or be achieved or accomplished. Factors that could cause actual results or events to differ materially from those anticipated include the matters described under
Item 1A
, "
Risk Factors
" and
Item 7
, "
Management's Discussion and Analysis of Financial Condition and Results of Operations
." AbbVie does not undertake any obligation to update the forward-looking statements included in this Annual Report on Form 10-K to reflect events or circumstances after the date hereof, unless AbbVie is required by applicable securities law to do so.
None.
AbbVie's corporate offices are located at 1 North Waukegan Road, North Chicago, Illinois 60064-6400. AbbVie's manufacturing facilities are in the following locations:
|
United States
|
|
Outside the United States
|
|
Abbott Park, Illinois*
|
|
Campoverde di Aprilia, Italy
|
|
Barceloneta, Puerto Rico
|
|
Cork, Ireland
|
|
Jayuya, Puerto Rico
|
|
Ludwigshafen, Germany
|
|
North Chicago, Illinois
|
|
Singapore*
|
|
Worcester, Massachusetts*
|
|
Sligo, Ireland
|
|
Wyandotte, Michigan*
|
||
_______________________________________________________________________________
|
*
|
Leased property.
|
In addition to the above, AbbVie has other manufacturing facilities worldwide. AbbVie believes its facilities are suitable and provide adequate production capacity. There are no material encumbrances on AbbVie's owned properties.
In the United States, including Puerto Rico, AbbVie has one distribution center. AbbVie also has research and development facilities in the United States located at: Abbott Park, Illinois; North Chicago, Illinois; Redwood City, California; South San Francisco, California; Sunnyvale, California; Cambridge, Massachusetts; and Worcester, Massachusetts. Outside the United States, AbbVie's principal research and development facilities are located in Ludwigshafen, Germany.
|
20
|
2017 Form 10-K
|
||
Information pertaining to legal proceedings is provided in
Note 14
, "
Legal Proceedings and Contingencies
" to the Consolidated Financial Statements included under
Item 8
, "
Financial Statements and Supplementary Data
," and is incorporated by reference herein.
Not applicable.
|
2017 Form 10-K
|
21
|
||
EXECUTIVE OFFICERS OF THE REGISTRANT
The following table lists AbbVie's executive officers, each of whom was first appointed as an AbbVie corporate officer in December 2012, except as otherwise indicated:
|
Name
|
|
Age
|
|
Position
|
|
Richard A. Gonzalez
|
|
64
|
|
Chairman of the Board and Chief Executive Officer
|
|
Carlos Alban
|
|
55
|
|
Executive Vice President, Commercial Operations
|
|
William J. Chase
|
|
50
|
|
Executive Vice President, Chief Financial Officer
|
|
Henry O. Gosebruch*
|
|
45
|
|
Executive Vice President and Chief Strategy Officer
|
|
Laura J. Schumacher
|
|
54
|
|
Executive Vice President, External Affairs, General Counsel and Corporate Secretary
|
|
Michael E. Severino, M.D.*
|
|
52
|
|
Executive Vice President, Research and Development and Chief Scientific Officer
|
|
Timothy J. Richmond
|
|
51
|
|
Senior Vice President, Human Resources
|
|
Azita Saleki-Gerhardt, Ph.D.
|
|
54
|
|
Senior Vice President, Operations
|
|
Robert A. Michael*
|
|
47
|
|
Vice President, Controller
|
_______________________________________________________________________________
|
*
|
Mr. Gosebruch was first appointed as a corporate officer in December 2015; Dr. Severino was first appointed as a corporate officer in June 2014; and Mr. Michael was first appointed as a corporate officer in December 2015.
|
Mr. Gonzalez is the Chairman and Chief Executive Officer of AbbVie. He served as Abbott’s Executive Vice President of the Pharmaceutical Products Group from July 2010 to December 2012, and was responsible for Abbott’s worldwide pharmaceutical business, including commercial operations, research and development, and manufacturing. He also served as President, Abbott Ventures Inc., Abbott’s medical technology investment arm, from 2009 to 2011. Mr. Gonzalez joined Abbott in 1977 and held various management positions before briefly retiring in 2007, including: Abbott’s President and Chief Operating Officer; President, Chief Operating Officer of Abbott’s Medical Products Group; Senior Vice President and President of Abbott’s former Hospital Products Division; Vice President and President of Abbott’s Health Systems Division; and Divisional Vice President and General Manager for Abbott’s Diagnostics Operations in the United States and Canada.
Mr. Alban is AbbVie's Executive Vice President, Commercial Operations. He served as Abbott's Senior Vice President, Proprietary Pharmaceutical Products, Global Commercial Operations from 2011 to 2012, as Senior Vice President, International Pharmaceuticals from 2009 to 2011, as Vice President, Western Europe and Canada from 2007 to 2009, and as Vice President, European Operations from 2006 to 2007. Mr. Alban joined Abbott in 1986.
Mr. Chase is AbbVie's Executive Vice President, Chief Financial Officer. He served as Abbott's Vice President, Licensing and Acquisitions from 2010 to 2012, as Vice President, Treasurer from 2007 to 2010, and as Divisional Vice President, Controller of Abbott International from 2004 to 2007. Mr. Chase joined Abbott in 1989.
Mr. Gosebruch is AbbVie's Executive Vice President and Chief Strategy Officer. He worked for more than 20 years in the Mergers & Acquisitions Group at J.P. Morgan Securities LLC, serving as Managing Director since 2007 and as Co-Head of M&A North America during 2015. Mr. Gosebruch joined AbbVie in 2015.
Ms. Schumacher is AbbVie's Executive Vice President, External Affairs, General Counsel and Corporate Secretary, responsible for AbbVie's externally-facing functions of Health Economics Outcomes Research, Government Affairs, Corporate Responsibility, Brand and Communications. She also leads AbbVie's legal functions. Prior to AbbVie's separation from Abbott, Ms. Schumacher served as Executive Vice President, General Counsel and Corporate Secretary from 2007 to 2012, and as Senior Vice President, Corporate Secretary and General Counsel from 2005 to 2007. Both at Abbott and AbbVie, Ms. Schumacher also led Licensing and Acquisition and Ventures and Early Stage Collaborations. At Abbott, Ms. Schumacher was also responsible for its Office of Ethics and Compliance. Ms. Schumacher joined Abbott in 1990. She serves on the board of General Dynamics Corporation.
Dr. Severino is AbbVie's Executive Vice President, Research and Development and Chief Scientific Officer. Dr. Severino served at Amgen Inc. as Senior Vice President, Global Development and Corporate Chief Medical Officer from 2012 to 2014, as Vice President, Global Development from 2010 to 2012 and as Vice President, Therapeutic Area Head, General Medicine and Inflammation Global Clinical Development from 2007 to 2012. He joined AbbVie in 2014.
|
22
|
2017 Form 10-K
|
||
Mr. Richmond is AbbVie's Senior Vice President, Human Resources. He served as Abbott's Divisional Vice President of Compensation & Benefits from 2008 to 2012, as Group Vice President of Talent and Rewards from 2007 to 2008, and as Divisional Vice President of Talent Acquisition from 2006 to 2007. Mr. Richmond joined Abbott in 2006.
Dr. Saleki-Gerhardt is AbbVie's Senior Vice President, Operations. She served as Abbott's Vice President, Pharmaceuticals Manufacturing and Supply from 2011 to 2012, and as Divisional Vice President, Quality Assurance, Global Pharmaceutical Operations from 2008 to 2011. Dr. Saleki-Gerhardt joined Abbott in 1993.
Mr. Michael has been Vice President, Controller, since March 1, 2017. He became an AbbVie officer in 2015 and served as AbbVie’s Vice President, Treasurer from 2015 to 2016, as Vice President, Controller, Commercial Operations from 2013 to 2015 and Vice President, Financial Planning and Analysis from 2012 to 2013. At Abbott, Mr. Michael served as Division Controller, Nutrition Supply Chain from 2010 to 2012. Mr. Michael joined Abbott in 1993.
The executive officers of AbbVie are elected annually by the board of directors. All other officers are elected by the board or appointed by the Chairman of the Board. All officers are either elected at the first meeting of the board of directors held after the annual stockholder meeting or appointed by the Chairman of the Board after that board meeting. Each officer holds office until a successor has been duly elected or appointed and qualified or until the officer's death, resignation, or removal. There are no family relationships between any of the executive officers listed above.
|
2017 Form 10-K
|
23
|
||
Principal Market
The principal market for AbbVie's common stock is the New York Stock Exchange (NYSE). AbbVie's common stock is also listed on the Chicago Stock Exchange and traded on various regional and electronic exchanges.
|
Market Price Per Share
|
|||||
|
2017
|
2016
|
||||
|
High
|
Low
|
High
|
Low
|
||
|
First Quarter
|
$66.79
|
$59.27
|
$59.81
|
$50.71
|
|
|
Second Quarter
|
$73.67
|
$63.12
|
$65.37
|
$56.36
|
|
|
Third Quarter
|
$90.95
|
$69.38
|
$68.12
|
$61.77
|
|
|
Fourth Quarter
|
$99.10
|
$85.24
|
$65.05
|
$55.06
|
|
Stockholders
There were
50,095
stockholders of record of AbbVie common stock as of January 31,
2018
.
Dividends
The following table summarizes quarterly cash dividends declared for the years ended December 31,
2017
and
2016
:
|
2017
|
2016
|
|||||||||
|
Date Declared
|
|
Payment Date
|
|
Dividend Per Share
|
Date Declared
|
Payment Date
|
Dividend Per Share
|
|||
|
10/27/17
|
02/15/18
|
$0.71
|
10/28/16
|
02/15/17
|
$0.64
|
|||||
|
09/08/17
|
11/15/17
|
$0.64
|
09/09/16
|
11/15/16
|
$0.57
|
|||||
|
06/22/17
|
08/15/17
|
$0.64
|
06/16/16
|
08/15/16
|
$0.57
|
|||||
|
02/16/17
|
05/15/17
|
$0.64
|
02/18/16
|
05/16/16
|
$0.57
|
|||||
On
October 27, 2017
, AbbVie's board of directors declared an increase in the quarterly cash dividend from
$0.64
per share to
$0.71
per share, payable on
February 15, 2018
to stockholders of record as of
January 12, 2018
.
The timing, declaration, amount of and payment of any dividends by AbbVie in the future is within the discretion of its board of directors and will depend upon many factors, including AbbVie's financial condition, earnings, capital requirements of its operating subsidiaries, covenants associated with certain of AbbVie's debt service obligations, legal requirements, regulatory constraints, industry practice, ability to access capital markets and other factors deemed relevant by its board of directors.
Moreover, if AbbVie determines to pay any dividend in the future, there can be no assurance that it will continue to pay such dividends or the amount of such dividends.
Performance Graph
The following graph compares the cumulative total returns of AbbVie, the S&P 500 Index and the NYSE Arca Pharmaceuticals Index. This graph covers the period from January 2, 2013 (the first day AbbVie's common stock began "regular-way" trading on the NYSE) through
December 31, 2017
. This graph assumes $100 was invested in AbbVie common stock and each index on January 2, 2013 and also assumes the reinvestment of dividends. The stock price performance on the following graph is not necessarily indicative of future stock price performance.
|
24
|
2017 Form 10-K
|
||
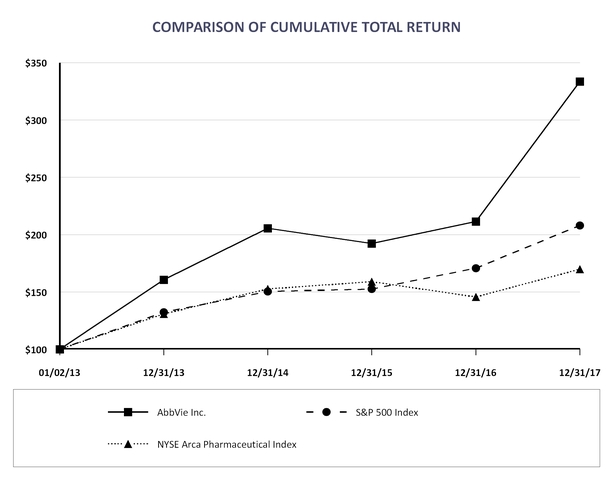
This performance graph is furnished and shall not be deemed "filed" with the SEC or subject to Section 18 of the Securities Exchange Act of 1934, nor shall it be deemed incorporated by reference in any of AbbVie's filings under the Securities Act of 1933, as amended.
Issuer Purchases of Equity Securities
|
Period
|
(a) Total
Number
of Shares
(or Units)
Purchased
|
(b) Average
Price
Paid per Share
(or Unit)
|
(c) Total
Number of
Shares (or Units)
Purchased as Part
of Publicly
Announced
Plans or
Programs
|
(d) Maximum Number (or
Approximate Dollar Value) of
Shares (or Units) that May
Yet Be Purchased Under the
Plans or Programs
|
|||||||||
|
October 1, 2017 - October 31, 2017
|
8,469
|
|
(1)
|
$
|
94.35
|
|
—
|
|
$
|
4,536,288,945
|
|
||
|
November 1, 2017 - November 30, 2017
|
5,279,237
|
|
(1)
|
$
|
94.76
|
|
5,276,274
|
|
$
|
4,036,289,077
|
|
||
|
December 1, 2017 - December 31, 2017
|
20,588
|
|
(1)
|
$
|
97.85
|
|
—
|
|
$
|
4,036,289,077
|
|
||
|
Total
|
5,308,294
|
|
(1)
|
94.77
|
|
5,276,274
|
|
$
|
4,036,289,077
|
|
|||
|
1.
|
In addition to AbbVie shares repurchased on the open market under a publicly announced program, if any, these shares included the shares deemed surrendered to AbbVie to pay the exercise price in connection with the exercise of employee stock options –
4,552
in October;
1,855
in November; and
5,368
in December, with average exercise prices of
$95.96
in October;
$93.36
in November; and
$97.33
in December.
|
These shares also included the shares purchased on the open market for the benefit of participants in the AbbVie Employee Stock Purchase Plan –
3,917
in October;
1,108
in November; and
15,220
in December.
|
2017 Form 10-K
|
25
|
||
These shares do not include the shares surrendered to AbbVie to satisfy minimum tax withholding obligations in connection with the vesting or exercise of stock-based awards.
On February 15, 2018, AbbVie's board of directors authorized a new
$10.0 billion
stock repurchase program, which superseded AbbVie's previous stock repurchase program.
The new stock repurchase program permits purchases of AbbVie shares from time to time in open-market or private transactions, including accelerated share repurchases, at management’s discretion. The program has no time limit and can be discontinued at any time.
|
26
|
2017 Form 10-K
|
||
The selected financial information should be read in conjunction with the financial statements and accompanying notes included under
Item 8
, "
Financial Statements and Supplementary Data
" and
Item 7
, "
Management's Discussion and Analysis of Financial Condition and Results of Operations
."
|
as of and for the years ended December 31 (in millions, except per share data)
|
2017
|
2016
|
2015
|
2014
|
2013
|
|||||||||||||||
|
Statement of earnings data
|
||||||||||||||||||||
|
Net revenues
|
$
|
28,216
|
|
$
|
25,638
|
|
$
|
22,859
|
|
$
|
19,960
|
|
$
|
18,790
|
|
|||||
|
Net earnings
|
5,309
|
|
5,953
|
|
5,144
|
|
1,774
|
|
4,128
|
|
||||||||||
|
Basic earnings per share
|
$
|
3.31
|
|
$
|
3.65
|
|
$
|
3.15
|
|
$
|
1.11
|
|
$
|
2.58
|
|
|||||
|
Diluted earnings per share
|
$
|
3.30
|
|
$
|
3.63
|
|
$
|
3.13
|
|
$
|
1.10
|
|
$
|
2.56
|
|
|||||
|
Cash dividends declared per common share
|
$
|
2.63
|
|
$
|
2.35
|
|
$
|
2.10
|
|
$
|
1.75
|
|
$
|
2.00
|
|
(a)
|
||||
|
Weighted-average basic shares outstanding
|
1,596
|
|
1,622
|
|
1,625
|
|
1,595
|
|
1,589
|
|
||||||||||
|
Weighted-average diluted shares outstanding
|
1,603
|
|
1,631
|
|
1,637
|
|
1,610
|
|
1,604
|
|
||||||||||
|
Balance sheet data
|
||||||||||||||||||||
|
Total assets
(b)(c)
|
$
|
70,786
|
|
$
|
66,099
|
|
$
|
53,050
|
|
$
|
27,513
|
|
$
|
29,241
|
|
|||||
|
Long-term debt and lease obligations
(b)(c)(d)
|
36,968
|
|
36,465
|
|
31,265
|
|
14,552
|
|
14,353
|
|
||||||||||
|
(a)
|
AbbVie declared regular quarterly cash dividends in 2013 aggregating $1.60 per share of common stock. In addition, a cash dividend of $0.40 per share of common stock was declared from pre-separation earnings on January 4, 2013 and was recorded as a reduction of additional paid-in capital.
|
|
(b)
|
In May 2015, AbbVie acquired Pharmacyclics for approximately
$20.8 billion
, including cash consideration of
$12.4 billion
and equity consideration of approximately
128 million
shares of AbbVie common stock valued at
$8.4 billion
. In connection with the acquisition, AbbVie issued
$16.7 billion
aggregate principal amount of unsecured senior notes, of which approximately
$11.5 billion
was used to finance the acquisition and approximately
$5.0 billion
was used to finance an accelerated share repurchase (ASR) program. See
Note 5
to the
Consolidated Financial Statements
for information regarding the acquisition of Pharmacyclics,
Note 9
for information on the senior notes and
Note 12
for information on the ASR.
|
|
(c)
|
In June 2016, AbbVie acquired Stemcentrx for approximately
$6.4 billion
, including cash consideration of
$1.9 billion
, equity consideration of approximately
62.4 million
shares of AbbVie common stock valued at
$3.9 billion
and contingent consideration of approximately
$620 million
. In connection with the acquisition, AbbVie issued
$7.8 billion
aggregate principal amount of unsecured senior notes. Of the
$7.7 billion
net proceeds, approximately
$1.9 billion
was used to finance the acquisition, approximately
$3.8 billion
was used to finance an ASR and approximately
$2.0 billion
was used to repay the company's outstanding term loan that was due to mature in November 2016. See
Note 5
to the
Consolidated Financial Statements
for information regarding the acquisition of Stemcentrx,
Note 9
for information on the senior notes and
Note 12
for information on the ASR.
|
|
(d)
|
Includes current portion of both long-term debt and lease obligations.
|
|
2017 Form 10-K
|
27
|
||
The following is a discussion and analysis of the financial condition of AbbVie Inc. (AbbVie or the company) as of December 31,
2017
and
2016
and results of operations for each of the three years in the period ended December 31,
2017
. This commentary should be read in conjunction with the consolidated financial statements and accompanying notes appearing in
Item 8
, "
Financial Statements and Supplementary Data
."
EXECUTIVE OVERVIEW
Company Overview
AbbVie is a global, research-based biopharmaceutical company formed in 2013 following separation from Abbott Laboratories (Abbott). AbbVie's mission is to use its expertise, dedicated people and unique approach to innovation to develop and market advanced therapies that address some of the world's most complex and serious diseases. AbbVie's products are focused on treating conditions such as chronic autoimmune diseases in rheumatology, gastroenterology and dermatology; oncology, including blood cancers; virology, including hepatitis C (HCV) and human immunodeficiency virus (HIV); neurological disorders, such as Parkinson's disease and multiple sclerosis; metabolic diseases, including thyroid disease and complications associated with cystic fibrosis; as well as other serious health conditions. AbbVie also has a pipeline of promising new medicines across such important medical specialties as immunology, oncology and neurology, with additional targeted investment in cystic fibrosis and women's health.
AbbVie's products are generally sold worldwide directly to wholesalers, distributors, government agencies, health care facilities, specialty pharmacies and independent retailers from AbbVie-owned distribution centers and public warehouses. In the United States, AbbVie distributes pharmaceutical products principally through independent wholesale distributors, with some sales directly to pharmacies and patients. Outside the United States, sales are made either directly to customers or through distributors, depending on the market served. Certain products are co-marketed or co-promoted with other companies. AbbVie has approximately
29,000
employees. AbbVie operates in one business segment—pharmaceutical products.
2017
Financial Results
AbbVie's strategy has focused on delivering strong financial results, advancing and investing in its pipeline and returning value to shareholders while ensuring a strong, sustainable growth business over the long term. The company's financial performance in
2017
included delivering worldwide net revenues of
$28.2 billion
, operating earnings of
$9.6 billion
and diluted earnings per share of
$3.30
. Worldwide net revenues grew by
10%
on a constant currency basis, driven primarily by the continued strength of HUMIRA, revenue growth related to IMBRUVICA and other key products including Creon and Duodopa and the launch of HCV product MAVYRET. These increases were partially offset by a decline in net revenues of HCV product VIEKIRA.
Diluted earnings per share in
2017
was
$3.30
and included
net charges related to the December 2017 enactment of the Tax Cuts and Jobs Act
. The net charges included
$4.5 billion
for the
one-time mandatory repatriation of previously untaxed earnings of foreign subsidiaries
, partially offset by after-tax benefits of
$3.3 billion
due to the
remeasurement of net deferred tax liabilities and other related impacts
.
Additional after-tax costs that impacted
2017
diluted earnings per share included the following: (i)
$809 million
related to the amortization of intangible assets; (ii)
$625 million
for the change in fair value of contingent consideration liabilities; (iii)
$327 million
for acquired in-process research and development (IPR&D); (iv) litigation reserve charges of
$286 million
; (v) an intangible asset impairment charge of
$244 million
; (vi) milestone payments of
$143 million
; and (vii) acquisition related costs of
$49 million
. These costs were partially offset by an after-tax benefit of
$91 million
due to a tax audit settlement.
2017
financial results also reflected continued added funding to support AbbVie’s emerging mid- and late-stage pipeline assets and continued investment in AbbVie’s growth brands.
In
2017
, the company generated cash flows from operations of
$10.0 billion
, which AbbVie utilized to continue to enhance its pipeline through licensing and collaboration activities, pay cash dividends to stockholders of
$4.1 billion
and repurchase approximately
13 million
shares for
$1.0 billion
in the open market. In
October 2017
, AbbVie's board of directors declared a quarterly cash dividend of
$0.71
per share of common stock payable in
February 2018
. This reflected an increase of approximately
11%
over the previous quarterly dividend of
$0.64
per share of common stock.
|
28
|
2017 Form 10-K
|
||
2018
Strategic Objectives
AbbVie's mission is to be an innovation-driven, patient-focused specialty biopharmaceutical company capable of achieving top-tier financial performance through outstanding execution and a consistent stream of innovative new medicines. AbbVie intends to continue to advance its mission in a number of ways, including: (i) growing revenues by diversifying revenue streams, driving late-stage pipeline assets to the market and ensuring strong commercial execution of new product launches; (ii) continued investment and expansion in its pipeline in support of opportunities in immunology, oncology and neurology as well as continued investment in key on-market products; (iii) expanding operating margins; and (iv) returning cash to shareholders via dividends and share repurchases. In addition, AbbVie anticipates several regulatory submissions and key data readouts from key clinical trials in the next twelve months.
AbbVie expects to achieve its strategic objectives through:
|
•
|
HUMIRA sales growth by driving biologic penetration across disease categories, maintaining market leadership and effectively managing biosimilar erosion.
|
|
•
|
IMBRUVICA revenue growth driven by increasing market share with its eight currently approved indications in six different disease areas.
|
|
•
|
The strong execution of new product launches, including MAVYRET.
|
|
•
|
The favorable impact of pipeline products approved in 2017 or currently under regulatory review where approval is expected in 2018. These products are described in greater detail in the section labeled "Research and Development" included as part of this
Item 7
.
|
AbbVie remains committed to driving continued expansion of operating margins and expects to achieve this objective through continued leverage from revenue growth, the reduction of HUMIRA royalty expense, productivity initiatives in supply chain and ongoing efficiency programs to optimize manufacturing, commercial infrastructure, administrative costs and general corporate expenses.
Research and Development
Research and innovation are the cornerstones of AbbVie's business as a global biopharmaceutical company. AbbVie's long-term success depends to a great extent on its ability to continue to discover and develop innovative pharmaceutical products and acquire or collaborate on compounds currently in development by other biotechnology or pharmaceutical companies.
AbbVie's pipeline currently includes more than
60
compounds or indications in clinical development individually or under collaboration or license agreements and is focused on such important medical specialties as immunology, oncology and neurology along with targeted investments in cystic fibrosis and women's health. Of these programs, more than
30
are in mid- and late-stage development.
The following sections summarize transitions of significant programs from Phase 2 development to Phase 3 development as well as developments in significant Phase 3 and registration programs. AbbVie expects multiple Phase 2 programs to transition into Phase 3 programs in the next twelve months.
Significant Programs and Developments
Immunology
Upadacitinib
|
•
|
In June 2017, AbbVie announced that top-line results from the Phase 3 SELECT-NEXT clinical trial evaluating upadacitinib (ABT-494), the company’s selective JAK1 inhibitor currently in late-stage development for rheumatoid arthritis (RA), met all primary and ranked secondary endpoints in patients with moderate to severe RA who did not adequately respond to treatment with conventional synthetic disease modifying anti-rheumatic drugs (DMARDs). The safety profile of upadacitinib was consistent with previously reported Phase 2 trials and no new safety signals were detected.
|
|
•
|
In September 2017, AbbVie announced that top-line results from the Phase 3 SELECT-BEYOND clinical trial evaluating upadacitinib met all primary and ranked secondary endpoints in patients with moderate to severe RA who did not adequately respond or were intolerant to treatment with biologic DMARDs. The safety profile of upadacitinib was consistent with previously reported Phase 2 trials and the Phase 3 SELECT-NEXT clinical trial, with no new safety signals detected.
|
|
2017 Form 10-K
|
29
|
||
|
•
|
In December 2017, AbbVie announced that top-line results from the Phase 3 SELECT-MONOTHERAPY clinical trial evaluating upadacitinib met all primary and key secondary endpoints in patients with moderate to severe RA who did not adequately respond to treatment with methotrexate. The safety profile of upadacitinib was consistent with previously reported Phase 3 SELECT clinical trials and Phase 2 trials, with no new safety signals detected.
|
|
•
|
In 2017, AbbVie initiated Phase 3 clinical trials to evaluate the safety and efficacy of upadacitinib in subjects with moderately to severely active Crohn’s disease and in subjects with moderately to severely active psoriatic arthritis.
|
|
•
|
In January 2018, the U.S. Food and Drug Administration (FDA) granted breakthrough therapy designation for upadacitinib in adult patients with moderate to severe atopic dermatitis who are candidates for systemic therapy.
|
Risankizumab
|
•
|
In October 2017, AbbVie announced that top-line results from three Phase 3 clinical trials evaluating risankizumab, an investigational interleukin-23 (IL-23) inhibitor, with 12-week dosing compared to ustekinumab and adalimumab met all co-primary and ranked secondary endpoints for the treatment of patients with moderate to severe chronic plaque psoriasis. The safety profile was consistent with all previously reported studies, and there were no new safety signals detected across the three studies.
|
|
•
|
In December 2017, AbbVie announced that top-line results from the Phase 3 IMMhance clinical trial evaluating risankizumab at 16 weeks and 52 weeks of treatment compared to placebo met all primary and ranked secondary endpoints for the treatment of patients with moderate to severe plaque psoriasis. The safety profile was consistent with all previously reported Phase 3 studies, and there were no new safety signals detected across the Phase 3 program.
|
|
•
|
In December 2017, AbbVie initiated a Phase 3 clinical trial to evaluate the safety and efficacy of risankizumab in subjects with moderately to severely active Crohn’s disease.
|
Oncology
IMBRUVICA
|
•
|
In January 2017, the FDA approved IMBRUVICA for the treatment of patients with relapsed/refractory marginal zone lymphoma (MZL) who require systemic therapy and have received at least one prior anti-CD20-based therapy. This indication is approved under accelerated approval based on overall response rate (ORR) and continued approval may be contingent upon verification and description of clinical benefit in a confirmatory trial. MZL is a slow-growing form of non-Hodgkin's lymphoma.
|
|
•
|
In August 2017, the FDA approved IMBRUVICA for the treatment of adult patients with chronic graft-versus-host-disease (cGVHD) after failure of one or more lines of systemic therapy. IMBRUVICA is the first therapy specifically approved for adults with cGVHD, a severe and potentially life-threatening consequence of stem cell or bone marrow transplant. This marked the sixth U.S. disease indication for IMBRUVICA since the medication's initial approval in 2013 and the first approved indication outside of cancer.
|
|
•
|
In December 2017, AbbVie announced that the Phase 3 iNNOVATE clinical trial evaluating IMBRUVICA in combination with rituximab in patients with untreated (treatment-naïve) and previously-treated Waldenström’s macroglobulinemia (WM) met its primary endpoint. This is the first and only treatment approved for newly or previously-treated patients with WM.
|
VENCLEXTA
|
•
|
In February 2017, AbbVie initiated a Phase 3 clinical trial to study the safety and efficacy of venetoclax in combination with azacitidine in treatment-naïve elderly subjects with acute myeloid leukemia (AML) who are ineligible for standard induction therapy (high-dose chemotherapy).
|
|
30
|
2017 Form 10-K
|
||
|
•
|
In May 2017, AbbVie initiated a Phase 3 clinical trial to evaluate if venetoclax when co-administered with low dose cytarabine (LDAC) improves overall survival (OS) versus LDAC and placebo, in treatment naïve subjects with AML.
|
|
•
|
In September 2017, AbbVie announced that top-line results from the Phase 3 MURANO clinical trial evaluating venetoclax tablets in combination with Rituxan (rituximab) met the primary endpoint of prolonged progression-free survival compared with bendamustine in combination with Rituxan in patients with relapsed/refractory chronic lymphocytic leukemia (CLL).
|
|
•
|
In December 2017, AbbVie submitted a supplemental New Drug Application (sNDA) to the FDA for VENCLEXTA (venetoclax) in combination with Rituxan in patients with relapsed or refractory CLL and in January 2018, AbbVie submitted an sNDA for VENCLEXTA monotherapy in patients with CLL who have relapsed or are refractory to B-cell receptor inhibitors.
|
Rova-T
|
•
|
In February 2017, AbbVie initiated a Phase 3 clinical trial to evaluate the efficacy of rovalpituzumab tesirine (Rova-T) as maintenance therapy following first-line platinum based chemotherapy in participants with extensive stage small cell lung cancer (SCLC).
|
|
•
|
In April 2017, AbbVie initiated a Phase 3 clinical trial to evaluate Rova-T compared with topotecan for subjects with advanced or metastatic SCLC with high levels of delta-like protein 3 who have first disease progression during or following front-line platinum-based chemotherapy.
|
ABT-414
|
•
|
In November 2017, AbbVie presented results from the INTELLANCE-2 trial, a potential registration-enabling Phase 2 study evaluating depatuxizumab mafodotin (ABT-414), an investigational, antibody drug conjugate (ADC) targeting epidermal growth factor receptor (EGFR) alone or in combination with temozolomide (TMZ) in subjects with recurrent glioblastoma multiforme (GBM). Results from the INTELLANCE-2 study failed to meet the primary endpoint of overall survival and AbbVie will not be submitting regulatory applications for ABT-414 in recurrent GBM. In INTELLANCE-2, the combination of ABT-414 and TMZ performed numerically better than lomustine or TMZ and a positive trend in overall survival was observed. While AbbVie will not file in recurrent GBM based on these data, the Phase 2/3 INTELLANCE-1 trial evaluating the safety and efficacy of ABT-414 in combination with TMZ in subjects with newly diagnosed GBM with EGFR amplification is ongoing.
|
Veliparib
|
•
|
In April 2017, AbbVie announced that two Phase 3 studies evaluating veliparib, an investigational, oral poly (adenosine diphosphate-ribose) polymerase (PARP) inhibitor in combination with chemotherapy did not meet their primary endpoints. The studies evaluated veliparib in combination with carboplatin and paclitaxel in patients with squamous non-small cell lung cancer (NSCLC) and triple negative breast cancer (TNBC). Ongoing Phase 3 studies include non-squamous non-small cell lung cancer, BRCA1/2 breast cancer and ovarian cancer.
|
Virology/Liver Disease
|
•
|
In February 2017, the European Committee for Medicinal Products for Human Use (CHMP) granted a positive opinion for a shorter, eight-week treatment of VIEKIRAX (ombitasvir/paritaprevir/ritonavir tablets) + EXVIERA (dasabuvir tablets) as an option for previously untreated adult patients with genotype 1b chronic HCV and minimal to moderate fibrosis.
|
|
•
|
In July 2017, the European Commission granted marketing authorization for MAVIRET (glecaprevir/pibrentasvir), a once-daily, ribavirin-free treatment for adults with HCV infection across all major genotypes (GT1-6). MAVIRET is also indicated for patients with specific treatment challenges, including those with compensated cirrhosis across all major genotypes, and those who previously had limited treatment options, such as patients with severe chronic kidney disease (CKD) or those with genotype 3 chronic HCV infection.
|
|
•
|
In August 2017, the FDA approved MAVYRET (glecaprevir/pibrentasvir) for the treatment of patients with chronic HCV genotype 1-6 infection without cirrhosis and with compensated cirrhosis (Child-Pugh A). MAVYRET is also
|
|
2017 Form 10-K
|
31
|
||
indicated for the treatment of adult patients with HCV genotype 1 infection, who previously have been treated with a regimen containing an HCV NS5A inhibitor or an NS3/4A protease inhibitor, but not both. MAVYRET/MAVIRET is an 8-week, pan-genotypic treatment for patients without cirrhosis and who are new to treatment.
Other
|
•
|
In September 2017, AbbVie submitted a New Drug Application to the FDA for elagolix, an investigational, orally administered gonadotropin-releasing hormone (GnRH) antagonist, being evaluated for the management of endometriosis with associated pain. In October, AbbVie was granted priority review for elagolix by the FDA for the management of endometriosis with associated pain. In November, AbbVie announced detailed results from two replicate Phase 3 extension studies evaluating the long-term efficacy and safety of elagolix, being evaluated for the management of endometriosis with associated pain.
|
|
•
|
In December 2017, AbbVie announced the strategic decision to close the SONAR study, a Phase 3 clinical trial evaluating the effects of the investigational compound atrasentan on progression of kidney disease in patients with stage 2 to 4 chronic kidney disease and type 2 diabetes when added to standard of care. The ongoing monitoring of renal events observed in the study revealed considerably fewer endpoints than expected at the time of analysis, which will likely affect the ability to test the SONAR study hypothesis. Therefore, AbbVie determined that it cannot justify continuing the participation of patients in the study. The decision to close the SONAR study early was not related to any safety concerns.
|
RESULTS OF OPERATIONS
Net Revenues
The comparisons presented at constant currency rates reflect comparative local currency net revenues at the prior year's foreign exchange rates. This measure provides information on the change in net revenues assuming that foreign currency exchange rates had not changed between the prior and the current periods. AbbVie believes that the non-GAAP measure of change in net revenues at constant currency rates, when used in conjunction with the GAAP measure of change in net revenues at actual currency rates, may provide a more complete understanding of the company's operations and can facilitate analysis of the company's results of operations, particularly in evaluating performance from one period to another.
|
Percent change
|
|||||||||||||||||||||||
|
At actual currency rates
|
At constant currency rates
|
||||||||||||||||||||||
|
for the years ended (dollars in millions)
|
2017
|
2016
|
2015
|
2017
|
2016
|
2017
|
2016
|
||||||||||||||||
|
United States
|
$
|
18,251
|
|
$
|
15,947
|
|
$
|
13,561
|
|
14.4
|
%
|
17.6
|
%
|
14.4
|
%
|
17.6
|
%
|
||||||
|
International
|
9,965
|
|
9,691
|
|
9,298
|
|
2.8
|
%
|
4.2
|
%
|
2.1
|
%
|
7.3
|
%
|
|||||||||
|
Net revenues
|
$
|
28,216
|
|
$
|
25,638
|
|
$
|
22,859
|
|
10.1
|
%
|
12.2
|
%
|
9.8
|
%
|
13.5
|
%
|
||||||
|
32
|
2017 Form 10-K
|
||
The following table details AbbVie's worldwide net revenues:
|
Percent change
|
|||||||||||||||||||||||
|
At actual currency rates
|
At constant currency rates
|
||||||||||||||||||||||
|
Years ended December 31
(dollars in millions)
|
2017
|
2016
|
2015
|
2017
|
2016
|
2017
|
2016
|
||||||||||||||||
|
HUMIRA
|
|||||||||||||||||||||||
|
United States
|
$
|
12,361
|
|
$
|
10,432
|
|
$
|
8,405
|
|
18.5
|
%
|
24.1
|
%
|
18.5
|
%
|
24.1
|
%
|
||||||
|
International
|
6,066
|
|
5,646
|
|
5,607
|
|
7.4
|
%
|
0.7
|
%
|
6.7
|
%
|
4.3
|
%
|
|||||||||
|
Total
|
$
|
18,427
|
|
$
|
16,078
|
|
$
|
14,012
|
|
14.6
|
%
|
14.7
|
%
|
14.4
|
%
|
16.1
|
%
|
||||||
|
IMBRUVICA
|
|||||||||||||||||||||||
|
United States
|
$
|
2,144
|
|
$
|
1,580
|
|
$
|
659
|
|
35.8
|
%
|
>100.0
|
%
|
35.8
|
%
|
>100.0
|
%
|
||||||
|
Collaboration revenues
|
429
|
|
252
|
|
95
|
|
70.0
|
%
|
>100.0
|
%
|
70.0
|
%
|
>100.0
|
%
|
|||||||||
|
Total
|
$
|
2,573
|
|
$
|
1,832
|
|
$
|
754
|
|
40.5
|
%
|
>100.0
|
%
|
40.5
|
%
|
>100.0
|
%
|
||||||
|
HCV
|
|||||||||||||||||||||||
|
United States
|
$
|
338
|
|
$
|
342
|
|
$
|
804
|
|
(1.4
|
)%
|
(57.4
|
)%
|
(1.4
|
)%
|
(57.4
|
)%
|
||||||
|
International
|
936
|
|
1,180
|
|
835
|
|
(20.6
|
)%
|
41.3
|
%
|
(20.5
|
)%
|
42.7
|
%
|
|||||||||
|
Total
|
$
|
1,274
|
|
$
|
1,522
|
|
$
|
1,639
|
|
(16.3
|
)%
|
(7.1
|
)%
|
(16.2
|
)%
|
(6.4
|
)%
|
||||||
|
Lupron
|
|||||||||||||||||||||||
|
United States
|
$
|
669
|
|
$
|
663
|
|
$
|
653
|
|
0.8
|
%
|
1.5
|
%
|
0.8
|
%
|
1.5
|
%
|
||||||
|
International
|
160
|
|
158
|
|
173
|
|
1.4
|
%
|
(8.5
|
)%
|
0.5
|
%
|
(5.2
|
)%
|
|||||||||
|
Total
|
$
|
829
|
|
$
|
821
|
|
$
|
826
|
|
0.9
|
%
|
(0.6
|
)%
|
0.7
|
%
|
0.1
|
%
|
||||||
|
Creon
|
|||||||||||||||||||||||
|
United States
|
$
|
831
|
|
$
|
730
|
|
$
|
632
|
|
13.9
|
%
|
15.5
|
%
|
13.9
|
%
|
15.5
|
%
|
||||||
|
Synagis
|
|||||||||||||||||||||||
|
International
|
$
|
738
|
|
$
|
730
|
|
$
|
740
|
|
1.2
|
%
|
(1.5
|
)%
|
0.6
|
%
|
(0.4
|
)%
|
||||||
|
Synthroid
|
|||||||||||||||||||||||
|
United States
|
$
|
781
|
|
$
|
763
|
|
$
|
755
|
|
2.3
|
%
|
1.1
|
%
|
2.3
|
%
|
1.1
|
%
|
||||||
|
AndroGel
|
|||||||||||||||||||||||
|
United States
|
$
|
577
|
|
$
|
675
|
|
$
|
694
|
|
(14.5
|
)%
|
(2.8
|
)%
|
(14.5
|
)%
|
(2.8
|
)%
|
||||||
|
Kaletra
|
|||||||||||||||||||||||
|
United States
|
$
|
71
|
|
$
|
116
|
|
$
|
163
|
|
(38.6
|
)%
|
(28.8
|
)%
|
(38.6
|
)%
|
(28.8
|
)%
|
||||||
|
International
|
352
|
|
433
|
|
537
|
|
(18.8
|
)%
|
(19.3
|
)%
|
(21.1
|
)%
|
(13.3
|
)%
|
|||||||||
|
Total
|
$
|
423
|
|
$
|
549
|
|
$
|
700
|
|
(22.9
|
)%
|
(21.5
|
)%
|
(24.7
|
)%
|
(16.9
|
)%
|
||||||
|
Sevoflurane
|
|||||||||||||||||||||||
|
United States
|
$
|
78
|
|
$
|
80
|
|
$
|
81
|
|
(2.1
|
)%
|
(1.0
|
)%
|
(2.1
|
)%
|
(1.0
|
)%
|
||||||
|
International
|
332
|
|
348
|
|
393
|
|
(4.6
|
)%
|
(11.4
|
)%
|
(3.7
|
)%
|
(6.9
|
)%
|
|||||||||
|
Total
|
$
|
410
|
|
$
|
428
|
|
$
|
474
|
|
(4.1
|
)%
|
(9.7
|
)%
|
(3.4
|
)%
|
(6.0
|
)%
|
||||||
|
Duodopa
|
|||||||||||||||||||||||
|
United States
|
$
|
61
|
|
$
|
37
|
|
$
|
12
|
|
66.1
|
%
|
>100.0
|
%
|
66.1
|
%
|
>100.0
|
%
|
||||||
|
International
|
294
|
|
256
|
|
219
|
|
14.6
|
%
|
16.9
|
%
|
13.1
|
%
|
18.1
|
%
|
|||||||||
|
Total
|
$
|
355
|
|
$
|
293
|
|
$
|
231
|
|
21.1
|
%
|
26.9
|
%
|
19.8
|
%
|
28.1
|
%
|
||||||
|
All other
|
$
|
998
|
|
$
|
1,217
|
|
$
|
1,402
|
|
(18.0
|
)%
|
(13.2
|
)%
|
(18.2
|
)%
|
(12.3
|
)%
|
||||||
|
Total net revenues
|
$
|
28,216
|
|
$
|
25,638
|
|
$
|
22,859
|
|
10.1
|
%
|
12.2
|
%
|
9.8
|
%
|
13.5
|
%
|
||||||
|
2017 Form 10-K
|
33
|
||
The following discussion and analysis of AbbVie's net revenues by product is presented on a constant currency basis.
Global HUMIRA sales increased
14%
in
2017
and
16%
in
2016
. The sales increases in
2017
and
2016
were driven by market growth across therapeutic categories and geographies as well as favorable pricing in certain geographies. The sales increase in
2016
was also driven by the approval of new indications. In the United States, HUMIRA sales increased
18%
in
2017
and
24%
in
2016
. The sales increase in
2017
was driven by market growth across all indications and favorable pricing. The sales increase in
2016
was driven by market growth across all indications, higher market share and favorable pricing. Internationally, HUMIRA revenues increased
7%
in
2017
and
4%
in
2016
, driven primarily by market growth across indications. AbbVie continues to pursue strategies intended to further differentiate HUMIRA from competing products and add to the sustainability and future growth of HUMIRA.
Net revenues for IMBRUVICA represent product revenues in the United States and collaboration revenues outside of the United States related to AbbVie's 50% share of IMBRUVICA profit. Net revenues for IMBRUVICA commenced following the completion of the Pharmacyclics acquisition on May 26, 2015. Global IMBRUVICA sales increased
40%
in
2017
as a result of continued penetration of IMBRUVICA as a first-line treatment for patients with CLL as well as favorable pricing. The sales increase in
2016
was driven by market share gains following the FDA and EMA approval of IMBRUVICA as a first-line treatment for patients with CLL as well as having a full year of sales in 2016.
Global HCV sales decreased
16%
in
2017
and
6%
in
2016
. The sales decrease in 2017 and 2016 was a result of market contraction, lower market share and price erosion of VIEKIRA. These factors were partially offset for 2017 by the launch of MAVYRET in certain geographies during the second half of 2017.
Net revenues for Creon increased
14%
in
2017
and
15%
in
2016
, driven primarily by continued market growth and higher market share. Creon maintains market leadership in the pancreatic enzyme market.
Global Kaletra net revenues decreased
25%
in
2017
and
17%
in
2016
, primarily due to lower market share resulting from the impact of increasing competition in the HIV marketplace. AbbVie expects net revenues for Kaletra to continue to decline in
2018
.
Net revenues for Duodopa increased
20%
in
2017
and
28%
in
2016
, primarily as a result of market penetration and geographic expansion.
Gross Margin
|
Percent change
|
|||||||||||||||||
|
years ended December 31 (dollars in millions)
|
2017
|
|
2016
|
|
2015
|
|
2017
|
|
2016
|
||||||||
|
Gross margin
|
$
|
21,176
|
|
$
|
19,805
|
|
$
|
18,359
|
|
7
|
%
|
8
|
%
|
||||
|
as a percent of net revenues
|
75
|
%
|
77
|
%
|
80
|
%
|
|||||||||||
Gross margin as a percentage of net revenues in
2017
decreased from
2016
primarily due to an intangible asset impairment charge of
$354 million
in 2017, as well as the unfavorable impacts of higher intangible asset amortization and the IMBRUVICA profit sharing arrangement. These drivers were partially offset by lower amortization of the fair market value step-up of acquisition-date inventory of Pharmacyclics as well as favorable changes in product mix and operational efficiencies.
Gross margin as a percentage of net revenues in
2016
decreased from
2015
primarily due to unfavorable foreign exchange rates as well as unfavorable impacts of higher intangible asset amortization, the IMBRUVICA profit sharing arrangement and higher amortization of the fair market value step-up of acquisition-date inventory of Pharmacyclics. Additionally, 2016 gross margin included an intangible asset impairment charge of
$39 million
and 2015 gross margin included milestone revenue of $40 million from an oncology collaboration partner. These drivers were partially offset by favorable changes in product mix and operational efficiencies.
|
34
|
2017 Form 10-K
|
||
Selling, General and Administrative
|
Percent change
|
|||||||||||||||||
|
years ended December 31 (dollars in millions)
|
2017
|
|
2016
|
|
2015
|
|
2017
|
|
2016
|
||||||||
|
Selling, general and administrative
|
$
|
6,275
|
|
$
|
5,855
|
|
$
|
6,387
|
|
7
|
%
|
(8
|
)%
|
||||
|
as a percent of net revenues
|
22
|
%
|
23
|
%
|
28
|
%
|
|||||||||||
SG&A expenses as a percentage of net revenues in
2017
decreased from
2016
due to continued leverage from revenue growth partially offset by litigation reserve charges of
$370 million
in
2017
and new product launch expenses.
SG&A expenses as a percentage of net revenues in
2016
decreased from
2015
due to continued leverage from revenue growth and lower costs in
2016
. SG&A expenses in 2015 included costs associated with the separation from Abbott of
$265 million
, Pharmacyclics acquisition and integration costs of
$294 million
and litigation reserve charges of
$165 million
. Additionally, SG&A expense in 2015 reflected marketing support for the global launch of VIEKIRA.
Research and Development and Acquired In-Process Research and Development
|
Percent change
|
|||||||||||||||||
|
years ended December 31 (dollars in millions)
|
2017
|
2016
|
2015
|
2017
|
2016
|
||||||||||||
|
Research and development
|
$
|
4,982
|
|
$
|
4,366
|
|
$
|
4,285
|
|
14
|
%
|
2
|
%
|
||||
|
as a percent of net revenues
|
18
|
%
|
17
|
%
|
19
|
%
|
|||||||||||
|
Acquired in-process research and development
|
$
|
327
|
|
$
|
200
|
|
$
|
150
|
|
64
|
%
|
33
|
%
|
||||
Research and Development
(R&D) expenses in
2017
increased from
2016
principally due to increased funding to support the company’s emerging mid- and late-stage pipeline assets, the impact of the post-acquisition R&D expenses of Stemcentrx and Boehringer Ingelheim (BI) compounds and an increase in development milestones of
$63 million
. These factors were partially offset by a decrease in acquisition related costs of
$135 million
.
R&D expenses in
2016
increased from
2015
due primarily to increased funding to support the company’s emerging mid- and late-stage pipeline assets. This increase was partially offset by the following factors: (i) 2015 R&D expenses included a $350 million charge related to the purchase of a priority review voucher from a third party; (ii) development milestones decreased by $53 million; and (iii) 2015 results included restructuring charges of $32 million.
Acquired in-process research and development (IPR&D) expenses reflect upfront payments related to various collaborations. Acquired IPR&D expense in 2017 included a charge of
$205 million
as a result of entering into a global strategic collaboration with Alector, Inc. (Alector) to develop and commercialize medicines to treat Alzheimer’s disease and other neurodegenerative disorders. There were no individually significant transactions or cash flows during
2016
. Acquired IPR&D expense in 2015 included a charge of
$100 million
as a result of entering into an exclusive worldwide license agreement with C
2
N Diagnostics (C
2
N) to develop and commercialize anti-tau antibodies for the treatment of Alzheimer's disease and other neurological disorders. See
Note 5
to the
Consolidated Financial Statements
for additional information regarding the Alector and C
2
N agreements.
Other Non-Operating Expenses
|
years ended December 31 (in millions)
|
2017
|
2016
|
2015
|
|||||||||
|
Interest expense
|
$
|
1,150
|
|
$
|
1,047
|
|
$
|
719
|
|
|||
|
Interest income
|
(146
|
)
|
(82
|
)
|
(33
|
)
|
||||||
|
Interest expense, net
|
$
|
1,004
|
|
$
|
965
|
|
|
$
|
686
|
|
||
|
Net foreign exchange loss
|
$
|
348
|
|
$
|
303
|
|
$
|
193
|
|
|||
|
Other expense, net
|
513
|
|
232
|
|
13
|
|
||||||
Interest expense in 2017 increased compared to 2016 due to a full year of expense associated with the May 2016 issuance of
$7.8 billion
aggregate principal amount of senior notes which were issued primarily to finance the acquisition of Stemcentrx and to repay an outstanding term loan.
|
2017 Form 10-K
|
35
|
||
Interest expense in 2016 increased compared to 2015 due to a full year of expense associated with the May 2015 issuance of
$16.7 billion
aggregate principal amount of senior notes which were issued primarily to finance the acquisition of Pharmacyclics in addition to the incremental expense associated with the May 2016 senior notes issuance discussed above. Interest expense in 2016 also included a debt extinguishment charge of
$39 million
related to the redemption of the 1.75% senior notes that were due to mature in November 2017. These increases were partially offset by the absence of bridge financing-related costs of
$86 million
in 2015 incurred in connection with the acquisition of Pharmacyclics. Interest income continued to increase in both 2017 and 2016 due to growth in the company’s investment securities.
Net foreign exchange loss in 2017 included
$316 million
of historical currency translation losses that were reclassified from accumulated other comprehensive income (AOCI) related to the liquidation of certain foreign entities following the enactment of U.S. tax reform. Net foreign exchange loss in 2016 included losses totaling $298 million related to the devaluation of AbbVie’s net monetary assets denominated in the Venezuelan bolivar. See
Note 10
to the
Consolidated Financial Statements
for additional information regarding the Venezuelan devaluation. Net foreign exchange loss in 2015 included losses of $170 million to complete the liquidation of the company’s remaining foreign currency positions related to the terminated proposed combination with Shire.
Other expense, net included charges related to the change in fair value of the BI and Stemcentrx contingent consideration liabilities of
$626 million
in
2017
and
$228 million
in 2016. The fair value of contingent consideration liabilities is impacted by the passage of time and multiple other inputs, including the probability of success of achieving regulatory/commercial milestones, discount rates, the estimated amount of future sales of the acquired products still in development and other market-based factors. In 2017, the change in fair value represented mainly higher probabilities of success, the passage of time and declining interest rates. In 2016, the change in fair value represented mainly the passage of time, as increases to the BI contingent consideration liability due to higher probabilities of success were fully offset by the effects of rising interest rates and changes in other market-based assumptions. See
Note 5
to the
Consolidated Financial Statements
for additional information regarding the acquisitions of Stemcentrx and BI compounds. Other expense, net for 2017 also included realized gains on available-for-sale investment securities of
$90 million
. Other expense, net for 2015 included impairment charges totaling
$36 million
related to certain of the company's equity investment securities.
Income Tax Expense
The effective income tax rate was
31%
in
2017
,
24%
in
2016
and
23%
in
2015
. The effective tax rate in each period differed from the statutory tax rate principally due to the benefit from foreign operations which reflects the impact of lower income tax rates in locations outside the United States, tax incentives in Puerto Rico and other foreign tax jurisdictions and business development activities. The increase in the effective tax rate for
2017
over the prior year was principally due to the estimated tax effects of the enactment of the Tax Cuts and Jobs Act (the “Act”) in 2017. The effective tax rate in 2017 included tax expense of $4.5 billion on the one-time mandatory repatriation of previously untaxed earnings of foreign subsidiaries, partially offset by a $3.6 billion net tax benefit for the remeasurement of deferred taxes related to the Act and foreign tax law changes.
The Act significantly changed the U.S. corporate tax system. The Act reduces the U.S. federal corporate tax rate from 35% to 21% and creates a territorial tax system that includes new taxes on certain foreign sourced earnings. As a result, the effective income tax rate may change significantly in future periods. See
Note 13
to the
Consolidated Financial Statements
for additional information regarding the Act.
The effective tax rate in 2016 included additional expense of $187 million related to the recognition of the tax effect of regulations issued by the Internal Revenue Service on December 7, 2016 that changed the determination of the U.S. taxability of foreign currency gains and losses related to certain foreign operations. The effective income tax rate in 2015 included a tax benefit of $103 million from a reduction of state valuation allowances.
FINANCIAL POSITION, LIQUIDITY AND CAPITAL RESOURCES
|
years ended December 31 (in millions)
|
2017
|
2016
|
2015
|
||||||||
|
Cash flows from:
|
|||||||||||
|
Operating activities
|
$
|
9,960
|
|
$
|
7,041
|
|
$
|
7,535
|
|
||
|
Investing activities
|
(274
|
)
|
(6,074
|
)
|
(12,936
|
)
|
|||||
|
Financing activities
|
(5,512
|
)
|
(3,928
|
)
|
5,752
|
|
|||||
Operating cash flows in
2017
increased from
2016
primarily due to improved results of operations resulting from revenue growth, an improvement in operating earnings and a decrease in income tax payments. Operating cash flows in
2016
|
36
|
2017 Form 10-K
|
||
decreased from
2015
primarily due to improved results of operations resulting from revenue growth and an improvement in operating margin, offset by income tax payments. Realized excess tax benefits associated with stock-based compensation totaled
$71 million
in
2017
and were presented within operating cash flows as a result of the adoption of a new accounting pronouncement. Prior to the adoption of the new accounting pronouncement, realized excess benefits of
$55 million
in
2016
and
$61 million
in
2015
were presented within cash flows from financing activities. See Note 2 to the
Consolidated Financial Statements
for additional information regarding the adoption of this new accounting pronouncement. Operating cash flows also reflected AbbVie's voluntary contributions, primarily to its principal domestic defined benefit plan of
$150 million
in 2017,
2016
and
2015
. In 2018, AbbVie plans to make voluntary contributions to its various defined benefit plans in excess of
$750 million
.
Investing cash flows in 2017 included capital expenditures of
$529 million
and payments made for other acquisitions and investments of
$308 million
, partially offset by net sales and maturities of investment securities totaling
$563 million
. Investing cash flows in 2016 primarily included
$1.9 billion
of cash consideration paid to acquire Stemcentrx in June 2016, a
$595 million
upfront payment to acquire certain rights from BI in April 2016, net purchases of investment securities totaling $3.0 billion and capital expenditures of
$479 million
. Investing activities in 2015 primarily included $11.5 billion of cash consideration paid to acquire Pharmacyclics in May 2015 (net of cash acquired of
$877 million
). Investing activities in 2015 also included cash outflows related to other acquisitions and investments of $964 million, including a
$500 million
payment to Calico,
$100 million
related to an exclusive worldwide license agreement with C
2
N to develop and commercialize anti-tau antibodies for the treatment of Alzheimer's disease and other neurological disorders and
$130 million
paid to Infinity due to the achievement of a development milestone under the collaboration agreement. Cash flows from investing activities in
2015
also included capital expenditures of
$532 million
.
In
2017
,
2016
and
2015
, the company issued and redeemed commercial paper. The balance of commercial paper outstanding was
$400 million
as of December 31,
2017
and
$377 million
as of December 31,
2016
. AbbVie may issue additional commercial paper or retire commercial paper to meet liquidity requirements as needed.
In November 2016, the company issued
€3.6 billion
aggregate principal amount of unsecured senior Euro notes. The company used the proceeds to redeem
$4.0 billion
aggregate principal amount of
1.75%
senior notes that were due to mature in November 2017. In connection with the offering, AbbVie incurred
$17 million
of issuance costs. In May 2016, the company issued
$7.8 billion
aggregate principal amount of senior notes. Approximately
$2.0 billion
of the net proceeds were used to repay an outstanding term loan that was due to mature in November 2016, approximately
$1.9 billion
of the net proceeds were used to finance the acquisition of Stemcentrx and approximately
$3.8 billion
of the net proceeds were used to finance an ASR. See
Note 12
to the
Consolidated Financial Statements
for additional information on the ASR transactions. In connection with the May 2016 issuance of senior notes, AbbVie incurred
$52 million
of issuance costs.
In May 2015, the company issued
$16.7 billion
aggregate principal amount of unsecured senior notes. Approximately
$11.5 billion
of the net proceeds were used to finance the acquisition of Pharmacyclics and
$5.0 billion
of the net proceeds were used to finance an ASR. In 2015, the company paid
$86 million
of costs relating to an
$18.0 billion
, 364-Day Bridge Term Loan Credit Agreement (the bridge loan) as well as
$93 million
of costs relating to the May 2015 issuance of senior notes. No amounts were drawn under the bridge loan, which was terminated as a result of the issuance of the senior notes. In September 2015, AbbVie entered into a three-year
$2.0 billion
term loan credit facility and a 364-day
$2.0 billion
term loan credit facility. In November 2015, AbbVie drew on these term facilities and used the proceeds to refinance its
$4.0 billion
of senior notes that matured in 2015.
Cash dividend payments totaled
$4.1 billion
in
2017
,
$3.7 billion
in
2016
and
$3.3 billion
in
2015
. The increase in cash dividend payments was primarily due to an increase in the dividend rate. On
October 27, 2017
, AbbVie announced that its board of directors declared an increase in the company's quarterly cash dividend from
$0.64
per share to
$0.71
per share beginning with the dividend payable on
February 15, 2018
to stockholders of record as of
January 12, 2018
. This reflects an increase of approximately
11%
over the previous quarterly rate. On February 15, 2018, AbbVie announced that its board of directors declared an increase in the company's quarterly cash dividend from
$0.71
per share to
$0.96
per share beginning with the dividend payable on May 15, 2018 to stockholders of record as of April 13, 2018.
The timing, declaration, amount of and payment of any dividends by AbbVie in the future is within the discretion of its board of directors and will depend upon many factors, including AbbVie's financial condition, earnings, capital requirements of its operating subsidiaries, covenants associated with certain of AbbVie's debt service obligations, legal requirements, regulatory constraints, industry practice, ability to access capital markets and other factors deemed relevant by its board of directors.
In addition to the ASRs, under AbbVie's existing stock repurchase program, the company repurchased approximately
13 million
shares for
$1.0 billion
in
2017
, approximately
34 million
shares for
$2.1 billion
in
2016
and approximately
46 million
shares for
$2.8 billion
in
2015
. AbbVie cash-settled
$285 million
of its December 2016 open market purchases in January 2017 and cash-settled
$300 million
of its December 2015 open market purchases in January 2016. The stock repurchase authorization permits purchases of AbbVie shares from time to time in open-market or private transactions at management's
|
2017 Form 10-K
|
37
|
||
discretion. The program has no time limit and can be discontinued at any time. AbbVie's remaining stock repurchase authorization was
$4.0 billion
as of December 31,
2017
. On February 15, 2018, AbbVie's board of directors authorized a new
$10.0 billion
stock repurchase program, which superseded AbbVie's previous stock repurchase program.
The new stock repurchase program permits purchases of AbbVie shares from time to time in open-market or private transactions, including accelerated share repurchases, at management’s discretion. The program has no time limit and can be discontinued at any time.
In 2017, AbbVie paid
$305 million
of contingent consideration to BI related to a Phase 3 enrollment milestone.
$268 million
of this milestone was included in financing cash flows and
$37 million
was included in operating cash flows.
Cash and equivalents were impacted by net favorable exchange rate changes totaling
$29 million
in
2017
, net unfavorable exchange rate changes totaling
$338 million
in
2016
and
$300 million
in
2015
. The favorable exchange rate changes in 2017 were primarily due to the strengthening of the Euro and other foreign currencies on the translation of the company's Euro-denominated assets and cash denominated in foreign currencies. The unfavorable exchange rate changes in 2016 were primarily due to the devaluation of AbbVie's net monetary assets denominated in the Venezuelan bolivar. The unfavorable exchange rate changes in 2015 were principally due to the weakening of the Euro and other foreign currencies on the translation of the company's Euro-denominated assets and cash denominated in foreign currencies.
Prior to the enactment of the Tax Cuts and Jobs Act in December 2017, a significant portion of cash and equivalents were considered reinvested indefinitely in foreign subsidiaries. The enactment of U.S. tax reform significantly changed the U.S. corporate tax system, including imposing a mandatory one-time transition tax on previously untaxed earnings of foreign subsidiaries and the creation of a territorial tax system that generally allows the repatriation of future foreign sourced earnings without incurring additional U.S. taxes. The company has not fully completed its analysis and calculation of foreign earnings subject to the transition tax. The provisional estimate of the one-time transition tax was $4.5 billion and is generally payable in eight annual installments. AbbVie does not expect the transition tax liability to materially affect its liquidity and capital resources.
Credit Risk
AbbVie monitors economic conditions, the creditworthiness of customers and government regulations and funding, both domestically and abroad. AbbVie regularly communicates with its customers regarding the status of receivable balances, including their payment plans and obtains positive confirmation of the validity of the receivables. AbbVie establishes an allowance against accounts receivable when it is probable they will not be collected. AbbVie may also utilize factoring arrangements to mitigate credit risk, although the receivables included in such arrangements have historically not been a significant amount of total outstanding receivables.
AbbVie continues to do business with foreign governments in certain countries, including Greece, Portugal, Italy and Spain, which have historically experienced challenges in credit and economic conditions. Substantially all of AbbVie's trade receivables in Greece, Portugal, Italy and Spain are with government health systems. Outstanding governmental receivables in these countries, net of allowances for doubtful accounts, totaled
$255 million
as of December 31,
2017
and
$244 million
at December 31,
2016
. The company also continues to do business with foreign governments in certain oil-exporting countries that have experienced a deterioration in economic conditions, including Saudi Arabia and Russia, which may result in delays in the collection of receivables. Outstanding governmental receivables related to Saudi Arabia, net of allowances for doubtful accounts, were
$149 million
as of December 31,
2017
and
$122 million
as of December 31,
2016
. Outstanding governmental receivables related to Russia, net of allowances for doubtful accounts, were
$152 million
as of December 31,
2017
and $110 million as of December 31,
2016
. Global economic conditions and customer-specific factors may require the company to periodically re-evaluate the collectability of its receivables and the company could potentially incur credit losses.
Currently, AbbVie does not believe the economic conditions in oil-exporting countries will have a significant impact on the company's liquidity, cash flow or financial flexibility. However, if government funding were to become unavailable in these countries or if significant adverse changes in their reimbursement practices were to occur, AbbVie may not be able to collect the entire balance outstanding as of December 31,
2017
.
Credit Facility, Access to Capital and Credit Ratings
Credit Facility
AbbVie currently has a
$3.0 billion
five
-year revolving credit facility which matures in October 2019. The revolving credit facility enables the company to borrow funds on an unsecured basis at variable interest rates and contains various covenants. At December 31,
2017
, the company was in compliance with all its credit facility covenants. Commitment fees under the credit facility were insignificant. There were no amounts outstanding under the credit facility as of December 31,
2017
and
2016
.
|
38
|
2017 Form 10-K
|
||
Access to Capital
The company intends to fund short-term and long-term financial obligations as they mature through cash on hand, future cash flows from operations, or by issuing additional debt. The company's ability to generate cash flows from operations, issue debt or enter into financing arrangements on acceptable terms could be adversely affected if there is a material decline in the demand for the company's products or in the solvency of its customers or suppliers, deterioration in the company's key financial ratios or credit ratings, or other material unfavorable changes in business conditions. At the current time, the company believes it has sufficient financial flexibility to issue debt, enter into other financing arrangements and attract long-term capital on acceptable terms to support the company's growth objectives.
Credit Ratings
There were no changes in the company’s credit ratings in 2017. Unfavorable changes to the ratings may have an adverse impact on future financing arrangements; however, they would not affect the company's ability to draw on its credit facility and would not result in an acceleration of scheduled maturities of any of the company's outstanding debt.
|
2017 Form 10-K
|
39
|
||
Contractual Obligations
The following table summarizes AbbVie's estimated contractual obligations as of December 31,
2017
:
|
(in millions)
|
Total
|
Less than
one year
|
One to
three years
|
Three to
five years
|
More than
five years
|
||||||||||||||
|
Short-term borrowings
|
$
|
400
|
|
$
|
400
|
|
$
|
—
|
|
$
|
—
|
|
$
|
—
|
|
||||
|
Long-term debt and capital lease obligations, including current portion
|
37,612
|
|
6,026
|
|
5,469
|
|
5,938
|
|
20,179
|
|
|||||||||
|
Interest on long-term debt
(a)
|
15,617
|
|
1,154
|
|
2,250
|
|
2,080
|
|
10,133
|
|
|||||||||
|
Future minimum non-cancelable operating lease commitments
|
957
|
|
143
|
|
235
|
|
151
|
|
428
|
|
|||||||||
|
Purchase obligations and other
(b)
|
1,135
|
|
972
|
|
115
|
|
46
|
|
2
|
|
|||||||||
|
Other long-term liabilities
(c) (d) (e) (f)
|
10,605
|
|
1,135
|
|
1,610
|
|
1,331
|
|
6,529
|
|
|||||||||
|
Total
|
$
|
66,326
|
|
$
|
9,830
|
|
$
|
9,679
|
|
$
|
9,546
|
|
$
|
37,271
|
|
||||
|
(a)
|
Includes estimated future interest payments on long-term debt and capital lease obligations. Interest payments on debt are calculated for future periods using forecasted interest rates in effect at the end of
2017
. Projected interest payments include the related effects of interest rate swap agreements. Certain of these projected interest payments may differ in the future based on changes in floating interest rates or other factors or events. The projected interest payments only pertain to obligations and agreements outstanding at
December 31, 2017
. See
Note 9
to the
Consolidated Financial Statements
for additional information regarding the company's debt instruments and
Note 10
for additional information on the interest rate swap agreements outstanding at
December 31, 2017
.
|
|
(b)
|
Includes the company's significant unconditional purchase obligations. These commitments do not exceed the company's projected requirements and are made in the normal course of business.
|
|
(c)
|
Amounts less than one year includes voluntary contributions in excess of
$750 million
that AbbVie plans to make to its various defined benefit plans subsequent to December 31,
2017
. Amounts otherwise exclude pension and other post-employment benefits and related deferred compensation cash outflows. Timing of funding is uncertain and dependent on future movements in interest rates and investment returns, changes in laws and regulations and other variables. Also included in this amount are components of other long-term liabilities including restructuring. See
Note 8
to the
Consolidated Financial Statements
for additional information on restructuring and
Note 11
for additional information on the pension and other post-employment benefit plans.
|
|
(d)
|
Excludes liabilities associated with the company's unrecognized tax benefits as it is not possible to reliably estimate the timing of the future cash outflows related to these liabilities. See
Note 13
to the
Consolidated Financial Statements
for additional information on these unrecognized tax benefits.
|
|
(e)
|
Includes
$4.5 billion
of contingent consideration liabilities related to the acquisitions of Stemcentrx and BI compounds which are recorded at fair value on the consolidated balance sheet. Potential contingent consideration payments that exceed the fair value recorded on the consolidated balance sheet are not included in the table of contractual obligations. See Notes
5
and
10
to the
Consolidated Financial Statements
for additional information regarding these liabilities.
|
|
(f)
|
Includes a one-time transition tax liability on a mandatory deemed repatriation of previously untaxed earnings of foreign subsidiaries resulting from U.S. tax reform, enacted in 2017. The one-time transition tax is generally payable in eight annual installments. See Note 13 to the
Consolidated Financial Statements
for additional information regarding the provisional estimates of these tax liabilities.
|
AbbVie enters into R&D collaboration arrangements with third parties that may require future milestone payments to third parties contingent upon the achievement of certain development, regulatory, or commercial milestones. Individually, these arrangements are insignificant in any one annual reporting period. However, if milestones for multiple products covered by these arrangements would happen to be reached in the same reporting period, the aggregate charge to expense could be material to the results of operations in that period. From a business perspective, the payments are viewed as positive because they signify that the product is successfully moving through development and is now generating or is more likely to generate future cash flows from product sales. It is not possible to predict with reasonable certainty whether these milestones will be achieved or the timing for achievement. As a result, these potential payments are not included in the table of contractual obligations. See
Note 5
to the
Consolidated Financial Statements
for additional information on these collaboration arrangements.
|
40
|
2017 Form 10-K
|
||
CRITICAL ACCOUNTING POLICIES AND ESTIMATES
The preparation of financial statements in accordance with generally accepted accounting principles in the United States requires the use of estimates and assumptions that affect the reported amounts of assets and liabilities and the reported amounts of revenue and expenses. A summary of the company's significant accounting policies is included in
Note 2
to the
Consolidated Financial Statements
. Certain of these policies are considered critical as these most significantly impact the company's financial condition and results of operations and require the most difficult, subjective, or complex judgments, often as a result of the need to make estimates about the effect of matters that are inherently uncertain. Actual results may vary from these estimates.
Revenue Recognition
AbbVie recognizes revenue when persuasive evidence of an arrangement exists, delivery has occurred, the sales price is fixed or determinable and collectability of the sales price is reasonably assured. Revenue from product sales is recognized when title and risk of loss have passed to the customer.
Rebates
AbbVie provides rebates to pharmacy benefit managers, state government Medicaid programs, insurance companies that administer Medicare drug plans, wholesalers, group purchasing organizations and other government agencies and private entities.
Rebate and chargeback accruals are recorded as a reduction to revenue in the period the related product is sold. Rebates and chargebacks totaled
$12.9 billion
in
2017
,
$10.8 billion
in
2016
and
$8.6 billion
in
2015
. Rebate amounts are typically based upon the volume of purchases using contractual or statutory prices, which may vary by product and by payer. For each type of rebate, the factors used in the calculations of the accrual for that rebate include the identification of the products subject to the rebate, the applicable price terms and the estimated lag time between sale and payment of the rebate, which can be significant.
In order to establish its rebate and chargeback accruals, the company uses both internal and external data to estimate the level of inventory in the distribution channel and the rebate claims processing lag time for each type of rebate. To estimate the rebate percentage or net price, the company tracks sales by product and by customer or payer. The company evaluates inventory data reported by wholesalers, available prescription volume information, product pricing, historical experience and other factors in order to determine the adequacy of its reserves. AbbVie regularly monitors its reserves and records adjustments when rebate trends, rebate programs and contract terms, legislative changes, or other significant events indicate that a change in the reserve is appropriate. Historically, adjustments to rebate accruals have not been material to net earnings.
The following table is an analysis of the three largest rebate accruals and chargeback allowances, which comprise approximately
92%
of the total consolidated rebate and chargebacks recorded as reductions to revenues in
2017
. Remaining rebate provisions charged against gross revenues are not significant in the determination of operating earnings.
|
(in millions)
|
Medicaid
and
Medicare
Rebates
|
Managed
Care
Rebates
|
Wholesaler
Chargebacks
|
||||||||
|
Balance at December 31, 2014
|
$
|
712
|
|
$
|
476
|
|
$
|
253
|
|
||
|
Provisions
|
1,716
|
|
2,215
|
|
3,866
|
|
|||||
|
Payments
|
(1,396
|
)
|
(1,771
|
)
|
(3,756
|
)
|
|||||
|
Balance at December 31, 2015
|
1,032
|
|
920
|
|
363
|
|
|||||
|
Provisions
|
2,606
|
|
3,146
|
|
3,987
|
|
|||||
|
Payments
|
(2,471
|
)
|
(2,899
|
)
|
(3,967
|
)
|
|||||
|
Balance at December 31, 2016
|
1,167
|
|
1,167
|
|
383
|
|
|||||
|
Provisions
|
2,909
|
|
3,990
|
|
5,026
|
|
|||||
|
Payments
|
(2,736
|
)
|
(3,962
|
)
|
(4,887
|
)
|
|||||
|
Balance at December 31, 2017
|
$
|
1,340
|
|
$
|
1,195
|
|
$
|
522
|
|
||
|
2017 Form 10-K
|
41
|
||
Cash Discounts and Product Returns
Cash discounts and product returns, which totaled
$1.3 billion
in
2017
,
$964 million
in
2016
and
$898 million
in
2015
, are recorded as a reduction to revenue in the same period the related product is sold. The reserve for cash discounts is readily determinable because the company's experience of payment history is fairly consistent. Product returns can be reliably estimated based on the company's historical return experience.
Pension and Other Post-Employment Benefits
AbbVie engages outside actuaries to assist in the determination of the obligations and costs under the pension and other post-employment benefit plans that are direct obligations of AbbVie. The valuation of the funded status and the net periodic benefit cost for these plans are calculated using actuarial assumptions. The significant assumptions, which are reviewed annually, include the discount rate, the expected long-term rate of return on plan assets and the health care cost trend rates. The significant assumptions used in determining these calculations are disclosed in
Note 11
to the
Consolidated Financial Statements
.
The discount rate is selected based on current market rates on high-quality, fixed-income investments at December 31 each year. AbbVie employs a yield-curve approach for countries where a robust bond market exists. The yield curve is developed using high-quality bonds. The yield curve approach reflects the plans' specific cash flows (i.e. duration) in calculating the benefit obligations by applying the corresponding individual spot rates along the yield curve. Beginning in 2016, AbbVie also reflected the plans' specific cash flows and applied them to the corresponding individual spot rates along the yield curve in calculating the service cost and interest cost portions of expense. For other countries, AbbVie reviews various indices such as corporate bond and government bond benchmarks to estimate the discount rate. AbbVie's assumed discount rates have a significant effect on the amounts reported for defined benefit pension and other post-employment plans as of December 31,
2017
. A 50 basis point change in the assumed discount rate would have had the following effects on AbbVie's calculation of net periodic benefit costs in
2018
and projected benefit obligations as of December 31,
2017
:
|
50 basis point
|
|||||||
|
(in millions) (brackets denote a reduction)
|
Increase
|
Decrease
|
|||||
|
Defined benefit plans
|
|||||||
|
Service and interest cost
|
$
|
(64
|
)
|
$
|
72
|
|
|
|
Projected benefit obligation
|
(572
|
)
|
652
|
|
|||
|
Other post-employment plans
|
|||||||
|
Service and interest cost
|
$
|
(9
|
)
|
$
|
11
|
|
|
|
Projected benefit obligation
|
(77
|
)
|
89
|
|
|||
Effective December 31, 2015, AbbVie elected to change the method it uses to estimate the service and interest cost components of net periodic benefit costs. Historically, AbbVie estimated these service and interest cost components of this expense utilizing a single weighted-average discount rate derived from the yield curve used to measure the benefit obligation at the beginning of the period. In late 2015, AbbVie elected to utilize a full yield curve approach in the estimation of these components by applying the specific spot rates along the yield curve used in the determination of the benefit obligation to the relevant projected cash flows. AbbVie elected to make this change to provide a more precise measurement of service and interest costs by improving the correlation between projected benefit cash flows to the corresponding spot yield curve rates. AbbVie accounted for this change prospectively as a change in accounting estimate that is inseparable from a change in accounting principle. This change reduced AbbVie’s net periodic benefit cost by approximately
$41 million
in
2016
. This change had
no
effect on the 2015 expense and did not affect the measurement of AbbVie’s total benefit obligations.
The expected long-term rate of return is based on the asset allocation, historical performance and the current view of expected future returns. AbbVie considers these inputs with a long-term focus to avoid short-term market influences. The current long-term rate of return on plan assets for each plan is supported by the historical performance of the trust's actual and target asset allocation. AbbVie's assumed expected long-term rate of return has a significant effect on the amounts reported for defined benefit pension plans as of December 31,
2017
and will be used in the calculation of net periodic benefit cost in
2018
. A one percentage point change in assumed expected long-term rate of return on plan assets would increase or decrease the net period benefit cost of these plans in
2018
by
$54 million
.
The health care cost trend rate is selected by reviewing historical trends and current views on projected future health care cost increases. The current health care cost trend rate is supported by the historical trend experience of each plan. Assumed health care cost trend rates have a significant effect on the amounts reported for health care plans as of
|
42
|
2017 Form 10-K
|
||
December 31,
2017
and will be used in the calculation of net periodic benefit cost in
2018
. A one percentage point change in assumed health care cost trend rates would have the following effects on AbbVie's calculation of net periodic benefit costs in
2018
and the projected benefit obligation as of December 31,
2017
:
|
One percentage point
|
|||||||
|
(in millions) (brackets denote a reduction)
|
Increase
|
Decrease
|
|||||
|
Service and interest cost
|
$
|
31
|
|
$
|
(24
|
)
|
|
|
Projected benefit obligation
|
183
|
|
(140
|
)
|
|||
Income Taxes
AbbVie accounts for income taxes under the asset and liability method. Provisions for federal, state and foreign income taxes are calculated on reported pretax earnings based on current tax laws. Deferred taxes are provided using enacted tax rates on the future tax consequences of temporary differences, which are the differences between the financial statement carrying amount of assets and liabilities and their respective tax bases and the tax benefits of carryforwards. A valuation allowance is established or maintained when, based on currently available information, it is more likely than not that all or a portion of a deferred tax asset will not be realized.
Litigation
The company is subject to contingencies, such as various claims, legal proceedings and investigations regarding product liability, intellectual property, commercial, securities and other matters that arise in the normal course of business. See
Note 14
to the
Consolidated Financial Statements
for additional information. Loss contingency provisions are recorded for probable losses at management's best estimate of a loss, or when a best estimate cannot be made, a minimum loss contingency amount within a probable range is recorded. Accordingly, AbbVie is often initially unable to develop a best estimate of loss and therefore, the minimum amount, which could be zero, is recorded. As information becomes known, either the minimum loss amount is increased, resulting in additional loss provisions, or a best estimate can be made, also resulting in additional loss provisions. Occasionally, a best estimate amount is changed to a lower amount when events result in an expectation of a more favorable outcome than previously expected.
Valuation of Goodwill and Intangible Assets
AbbVie has acquired and may continue to acquire significant intangible assets in connection with business combinations that AbbVie records at fair value. Transactions involving the purchase or sale of intangible assets occur with some frequency between companies in the pharmaceuticals industry and valuations are usually based on a discounted cash flow analysis incorporating the stage of completion. The discounted cash flow model requires assumptions about the timing and amount of future net cash flows, risk, cost of capital, terminal values and market participants. Each of these factors can significantly affect the value of the intangible asset. IPR&D acquired in a business combination is capitalized as an indefinite-lived intangible asset until regulatory approval is obtained, at which time it is accounted for as a definite-lived asset and amortized over its estimated useful life, or discontinuation, at which point the intangible asset will be written off. IPR&D acquired in transactions that are not business combinations is expensed immediately, unless deemed to have an alternative future use. Payments made to third parties subsequent to regulatory approval are capitalized and amortized over the remaining useful life.
AbbVie reviews the recoverability of definite-lived intangible assets whenever events or changes in circumstances indicate the carrying value of an asset may not be recoverable. Goodwill and indefinite-lived intangible assets are reviewed for impairment annually or when an event occurs that could result in an impairment. See
Note 2
to the
Consolidated Financial Statements
for further information.
Annually, the company tests its goodwill for impairment by first assessing qualitative factors to determine whether it is more likely than not that the fair value is less than its carrying amount. Some of the factors considered in the assessment include general macro-economic conditions, conditions specific to the industry and market, cost factors, which could have a significant effect on earnings or cash flows, the overall financial performance and whether there have been sustained declines in the company's share price. If the company concludes it is more likely than not that the fair value of the reporting unit is less than its carrying amount, a quantitative impairment test is performed. AbbVie tests indefinite-lived intangible assets using a quantitative impairment test.
For its quantitative impairment tests, the company uses an estimated future cash flow approach that requires significant judgment with respect to future volume, revenue and expense growth rates, changes in working capital use, foreign currency exchange rates, the selection of an appropriate discount rate, asset groupings and other assumptions and estimates. The
|
2017 Form 10-K
|
43
|
||
estimates and assumptions used are consistent with the company's business plans and a market participant's views of a company and similar companies. The use of alternative estimates and assumptions could increase or decrease the estimated fair value of the assets and potentially result in different impacts to the company's results of operations. Actual results may differ from the company's estimates.
Contingent
Consideration
The fair value measurements of contingent consideration liabilities are determined as of the acquisition date based on significant unobservable inputs, including the discount rate, estimated probabilities and timing of achieving specified development, regulatory and commercial milestones and the estimated amount of future sales of the acquired products still in development. Contingent consideration liabilities are revalued to fair value at each subsequent reporting date until the related contingency is resolved. Changes to the fair value of the contingent consideration liabilities can result from changes to one or a number of inputs, including discount rates, the probabilities of achieving the milestones, the time required to achieve the milestones and estimated future sales. Significant judgment is employed in determining the appropriateness of these inputs. Changes to the inputs described above could have a material impact on the company's financial position and results of operations in any given period. At December 31,
2017
, a
50 basis point
increase/decrease in the assumed discount rate would have decreased/increased the value of the contingent consideration liabilities by approximately
$170 million
. Additionally, at December 31,
2017
, a five percentage point increase/decrease in the assumed probability of success across all potential indications would have increased/decreased the value of the contingent consideration liabilities by approximately
$390 million
.
Recent Accounting Pronouncements
See
Note 2
to the
Consolidated Financial Statements
for additional information on recent accounting pronouncements.
|
44
|
2017 Form 10-K
|
||
The company is exposed to risk that its earnings, cash flows and equity could be adversely impacted by changes in foreign exchange rates and interest rates. Certain derivative instruments are used when available on a cost-effective basis to hedge the company's underlying economic exposures. See
Note 10
to the
Consolidated Financial Statements
for additional information regarding the company's financial instruments and hedging strategies.
Foreign Currency Risk
AbbVie's primary net foreign currency exposures are the Euro, Japanese yen and British pound. The following table reflects the total foreign currency forward exchange contracts outstanding at December 31,
2017
and
2016
:
|
2017
|
2016
|
||||||||||||||||||||
|
(in millions)
|
Contract
amount
|
Weighted
average
exchange
rate
|
Fair and
carrying
value
receivable/(payable)
|
Contract
amount
|
Weighted
average
exchange
rate
|
Fair and
carrying
value
receivable
|
|||||||||||||||
|
Receive primarily U.S. dollars in exchange for the following currencies:
|
|||||||||||||||||||||
|
Euro
|
$
|
6,366
|
|
1.175
|
|
$
|
(88
|
)
|
$
|
5,544
|
|
1.078
|
|
$
|
102
|
|
|||||
|
Japanese yen
|
940
|
|
112.4
|
|
2
|
|
935
|
|
111.6
|
|
39
|
|
|||||||||
|
British pound
|
760
|
|
1.310
|
|
(22
|
)
|
611
|
|
1.303
|
|
35
|
|
|||||||||
|
All other currencies
|
1,877
|
|
n/a
|
|
(18
|
)
|
1,693
|
|
n/a
|
|
11
|
|
|||||||||
|
Total
|
$
|
9,943
|
|
$
|
(126
|
)
|
$
|
8,783
|
|
$
|
187
|
|
|||||||||
The company estimates that a 10% appreciation in the underlying currencies being hedged from their levels against the U.S. dollar, with all other variables held constant, would decrease the fair value of foreign exchange forward contracts by
$1.0 billion
at December 31,
2017
. If realized, this appreciation would negatively affect earnings over the remaining life of the contracts. However, gains and losses on the hedging instruments offset losses and gains on the hedged transactions and reduce the earnings and stockholders' equity volatility relating to foreign exchange. A 10% appreciation is believed to be a reasonably possible near-term change in foreign currencies.
In November 2016, the company issued
€3.6 billion
aggregate principal amount of unsecured senior Euro notes, which are exposed to foreign currency risk. The company has designated these foreign currency denominated notes as hedges of its net investments in certain foreign subsidiaries and affiliates. As a result, any foreign currency translation gains or losses related to the Euro notes will be included in accumulated other comprehensive income. See
Note 9
to the
Consolidated Financial Statements
for additional information related to the senior Euro note issuance and
Note 10
to the
Consolidated Financial Statements
for additional information related to the net investment hedging program.
The functional currency of the company’s Venezuela operations is the U.S. dollar due to the hyperinflationary status of the Venezuelan economy. During the first quarter of 2016, in consideration of declining economic conditions in Venezuela and a decline in transactions settled at the official rate, AbbVie determined that its net monetary assets denominated in the Venezuelan bolivar (VEF) were no longer expected to be settled at the official rate of 10 VEF per U.S. dollar, but rather at the Divisa Complementaria (DICOM) rate. Therefore, during the first quarter of 2016, AbbVie recorded a charge of $298 million to net foreign exchange loss to revalue its bolivar-denominated net monetary assets using the DICOM rate then in effect of approximately 270 VEF per U.S. dollar. As of December 31,
2017
, AbbVie’s net monetary assets in Venezuela were insignificant.
Interest Rate Risk
The company estimates that an increase in interest rates of 100 basis points would adversely impact the fair value of AbbVie's interest rate swap contracts by approximately
$509 million
at December 31,
2017
. If realized, the fair value reduction would affect earnings over the remaining life of the contracts. The company estimates that an increase of 100 basis points in long-term interest rates would decrease the fair value of long-term debt by
$2.2 billion
at December 31,
2017
. A 100 basis point change is believed to be a reasonably possible near-term change in interest rates.
|
2017 Form 10-K
|
45
|
||
Market Price Risk
AbbVie’s debt securities investment portfolio (the portfolio) is its main exposure to market price risk. The portfolio is subject to changes in fair value as a result of interest rate fluctuations and other market factors. It is AbbVie’s policy to mitigate market price risk by maintaining a diversified portfolio that limits the amount of exposure to a particular issuer and security type while placing limits on the amount of time to maturity. AbbVie’s investment policy limits investments to investment grade credit ratings. The company estimates that an increase in interest rates of 100 basis points would decrease the fair value of the portfolio by approximately
$34 million
as of December 31,
2017
. If the portfolio were to be liquidated, the fair value reduction would affect the income statement in the period sold.
Non-Publicly Traded Equity Securities
AbbVie holds equity securities in other pharmaceutical and biotechnology companies that are not traded on public stock exchanges. The carrying value of these investments was
$48 million
as of December 31,
2017
and
$42 million
as of December 31,
2016
. AbbVie monitors these investments for other than temporary declines in market value and charges impairment losses to net earnings when an other than temporary decline in estimated value occurs. In
2017
and
2016
, impairment charges recorded were insignificant. In 2015, AbbVie recorded impairment charges totaling
$36 million
related to certain of the company's investments in non-publicly traded equity securities.
|
46
|
2017 Form 10-K
|
||
|
|
Page
|
|
Consolidated Financial Statements
|
|
|
2017 Form 10-K
|
47
|
||
AbbVie Inc. and Subsidiaries
|
years ended December 31 (in millions, except per share data)
|
2017
|
2016
|
2015
|
||||||||
|
Net revenues
|
$
|
28,216
|
|
$
|
25,638
|
|
$
|
22,859
|
|
||
|
Cost of products sold
|
7,040
|
|
5,833
|
|
4,500
|
|
|||||
|
Selling, general and administrative
|
6,275
|
|
5,855
|
|
6,387
|
|
|||||
|
Research and development
|
4,982
|
|
4,366
|
|
4,285
|
|
|||||
|
Acquired in-process research and development
|
327
|
|
200
|
|
150
|
|
|||||
|
Total operating costs and expenses
|
18,624
|
|
16,254
|
|
15,322
|
|
|||||
|
Operating earnings
|
9,592
|
|
9,384
|
|
7,537
|
|
|||||
|
Interest expense, net
|
1,004
|
|
965
|
|
686
|
|
|||||
|
Net foreign exchange loss
|
348
|
|
303
|
|
193
|
|
|||||
|
Other expense, net
|
513
|
|
232
|
|
13
|
|
|||||
|
Earnings before income tax expense
|
7,727
|
|
7,884
|
|
6,645
|
|
|||||
|
Income tax expense
|
2,418
|
|
1,931
|
|
1,501
|
|
|||||
|
Net earnings
|
$
|
5,309
|
|
$
|
5,953
|
|
$
|
5,144
|
|
||
|
Per share data
|
|||||||||||
|
Basic earnings per share
|
$
|
3.31
|
|
$
|
3.65
|
|
$
|
3.15
|
|
||
|
Diluted earnings per share
|
$
|
3.30
|
|
$
|
3.63
|
|
$
|
3.13
|
|
||
|
Cash dividends declared per common share
|
$
|
2.63
|
|
$
|
2.35
|
|
$
|
2.10
|
|
||
|
Weighted-average basic shares outstanding
|
1,596
|
|
1,622
|
|
1,625
|
|
|||||
|
Weighted-average diluted shares outstanding
|
1,603
|
|
1,631
|
|
1,637
|
|
|||||
The accompanying notes are an integral part of these consolidated financial statements.
|
48
|
2017 Form 10-K
|
||
AbbVie Inc. and Subsidiaries
Consolidated Statements of Comprehensive Income
|
years ended December 31 (in millions)
|
2017
|
2016
|
2015
|
||||||||
|
Net earnings
|
$
|
5,309
|
|
$
|
5,953
|
|
$
|
5,144
|
|
||
|
Foreign currency translation adjustments, net of tax expense (benefit) of $34 in 2017, $(31) in 2016 and $(139) in 2015
|
996
|
|
(165
|
)
|
(667
|
)
|
|||||
|
Net investment hedging activities, net of tax expense (benefit) of $(194) in 2017, $79 in 2016 and $— in 2015
|
(343
|
)
|
140
|
|
—
|
|
|||||
|
Pension and post-employment benefits, net of tax expense (benefit) of $(94) in 2017, $(75) in 2016 and $96 in 2015
|
(406
|
)
|
(135
|
)
|
230
|
|
|||||
|
Marketable security activities, net of tax expense (benefit) of $(8) in 2017, $(11) in 2016 and $22 in 2015
|
(46
|
)
|
(1
|
)
|
44
|
|
|||||
|
Cash flow hedging activities, net of tax expense (benefit) of $(26) in 2017, $18 in 2016 and $(6) in 2015
|
(342
|
)
|
136
|
|
(137
|
)
|
|||||
|
Other comprehensive loss
|
(141
|
)
|
(25
|
)
|
(530
|
)
|
|||||
|
Comprehensive income
|
$
|
5,168
|
|
$
|
5,928
|
|
$
|
4,614
|
|
||
The accompanying notes are an integral part of these consolidated financial statements.
|
2017 Form 10-K
|
49
|
||
AbbVie Inc. and Subsidiaries
|
as of December 31 (in millions, except share data)
|
2017
|
2016
|
|||||
|
Assets
|
|||||||
|
Current assets
|
|||||||
|
Cash and equivalents
|
$
|
9,303
|
|
$
|
5,100
|
|
|
|
Short-term investments
|
486
|
|
1,323
|
|
|||
|
Accounts receivable, net
|
5,088
|
|
4,758
|
|
|||
|
Inventories
|
1,605
|
|
1,444
|
|
|||
|
Prepaid expenses and other
|
4,741
|
|
3,562
|
|
|||
|
Total current assets
|
21,223
|
|
16,187
|
|
|||
|
Investments
|
2,090
|
|
1,783
|
|
|||
|
Property and equipment, net
|
2,803
|
|
2,604
|
|
|||
|
Intangible assets, net
|
27,559
|
|
28,897
|
|
|||
|
Goodwill
|
15,785
|
|
15,416
|
|
|||
|
Other assets
|
1,326
|
|
1,212
|
|
|||
|
Total assets
|
$
|
70,786
|
|
$
|
66,099
|
|
|
|
Liabilities and Equity
|
|||||||
|
Current liabilities
|
|||||||
|
Short-term borrowings
|
$
|
400
|
|
$
|
377
|
|
|
|
Current portion of long-term debt and lease obligations
|
6,015
|
|
25
|
|
|||
|
Accounts payable and accrued liabilities
|
10,226
|
|
9,379
|
|
|||
|
Total current liabilities
|
16,641
|
|
9,781
|
|
|||
|
Long-term debt and lease obligations
|
30,953
|
|
36,440
|
|
|||
|
Deferred income taxes
|
2,490
|
|
6,890
|
|
|||
|
Other long-term liabilities
|
15,605
|
|
8,352
|
|
|||
|
Commitments and contingencies
|
|
|
|
|
|||
|
Stockholders’ equity
|
|||||||
|
Common stock, $0.01 par value, 4,000,000,000 shares authorized, 1,768,738,550 shares issued as of December 31, 2017 and 1,754,900,486 as of December 31, 2016
|
18
|
|
18
|
|
|||
|
Common stock held in treasury, at cost, 176,607,525 shares as of December 31, 2017 and 162,387,762 as of December 31, 2016
|
(11,923
|
)
|
(10,852
|
)
|
|||
|
Additional paid-in-capital
|
14,270
|
|
13,678
|
|
|||
|
Retained earnings
|
5,459
|
|
4,378
|
|
|||
|
Accumulated other comprehensive loss
|
(2,727
|
)
|
(2,586
|
)
|
|||
|
Total stockholders’ equity
|
5,097
|
|
4,636
|
|
|||
|
Total liabilities and equity
|
$
|
70,786
|
|
$
|
66,099
|
|
|
The accompanying notes are an integral part of these consolidated financial statements.
|
50
|
2017 Form 10-K
|
||
AbbVie Inc. and Subsidiaries
Consolidated Statements of Equity
|
years ended December 31 (in millions)
|
Common
shares
outstanding
|
Common
stock
|
Treasury
stock
|
Additional
paid-in
capital
|
Retained
earnings
|
Accumulated
other
comprehensive
loss
|
Total
|
|||||||||||||||||||
|
Balance at December 31, 2014
|
1,591
|
|
$
|
16
|
|
$
|
(972
|
)
|
$
|
4,194
|
|
$
|
535
|
|
$
|
(2,031
|
)
|
$
|
1,742
|
|
||||||
|
Net earnings
|
—
|
|
—
|
|
—
|
|
—
|
|
5,144
|
|
—
|
|
5,144
|
|
||||||||||||
|
Other comprehensive loss, net of tax
|
—
|
|
—
|
|
—
|
|
—
|
|
—
|
|
(530
|
)
|
(530
|
)
|
||||||||||||
|
Dividends declared
|
—
|
|
—
|
|
—
|
|
—
|
|
(3,431
|
)
|
—
|
|
(3,431
|
)
|
||||||||||||
|
Common shares issued to Pharmacyclics stockholders
|
128
|
|
1
|
|
—
|
|
8,404
|
|
—
|
|
—
|
|
8,405
|
|
||||||||||||
|
Purchases of treasury stock
|
(119
|
)
|
—
|
|
(7,886
|
)
|
—
|
|
—
|
|
—
|
|
(7,886
|
)
|
||||||||||||
|
Stock-based compensation plans and other
|
10
|
|
—
|
|
19
|
|
482
|
|
—
|
|
—
|
|
501
|
|
||||||||||||
|
Balance at December 31, 2015
|
1,610
|
|
17
|
|
(8,839
|
)
|
13,080
|
|
2,248
|
|
(2,561
|
)
|
3,945
|
|
||||||||||||
|
Net earnings
|
—
|
|
—
|
|
—
|
|
—
|
|
5,953
|
|
—
|
|
5,953
|
|
||||||||||||
|
Other comprehensive loss, net of tax
|
—
|
|
—
|
|
—
|
|
—
|
|
—
|
|
(25
|
)
|
(25
|
)
|
||||||||||||
|
Dividends declared
|
—
|
|
—
|
|
—
|
|
—
|
|
(3,823
|
)
|
—
|
|
(3,823
|
)
|
||||||||||||
|
Common shares issued to Stemcentrx stockholders
|
63
|
|
—
|
|
3,958
|
|
(35
|
)
|
—
|
|
—
|
|
3,923
|
|
||||||||||||
|
Purchases of treasury stock
|
(94
|
)
|
—
|
|
(6,018
|
)
|
—
|
|
—
|
|
—
|
|
(6,018
|
)
|
||||||||||||
|
Stock-based compensation plans and other
|
14
|
|
1
|
|
47
|
|
633
|
|
—
|
|
—
|
|
681
|
|
||||||||||||
|
Balance at December 31, 2016
|
1,593
|
|
18
|
|
(10,852
|
)
|
13,678
|
|
4,378
|
|
(2,586
|
)
|
4,636
|
|
||||||||||||
|
Net earnings
|
—
|
|
—
|
|
—
|
|
—
|
|
5,309
|
|
—
|
|
5,309
|
|
||||||||||||
|
Other comprehensive loss, net of tax
|
—
|
|
—
|
|
—
|
|
—
|
|
—
|
|
(141
|
)
|
(141
|
)
|
||||||||||||
|
Dividends declared
|
—
|
|
—
|
|
—
|
|
—
|
|
(4,221
|
)
|
—
|
|
(4,221
|
)
|
||||||||||||
|
Purchases of treasury stock
|
(15
|
)
|
—
|
|
(1,125
|
)
|
—
|
|
—
|
|
—
|
|
(1,125
|
)
|
||||||||||||
|
Stock-based compensation plans and other
|
14
|
|
—
|
|
54
|
|
592
|
|
(7
|
)
|
—
|
|
639
|
|
||||||||||||
|
Balance at December 31, 2017
|
1,592
|
|
$
|
18
|
|
$
|
(11,923
|
)
|
$
|
14,270
|
|
$
|
5,459
|
|
$
|
(2,727
|
)
|
$
|
5,097
|
|
||||||
The accompanying notes are an integral part of these consolidated financial statements.
|
2017 Form 10-K
|
51
|
||
AbbVie Inc. and Subsidiaries
|
years ended December 31 (in millions) (brackets denote cash outflows)
|
2017
|
2016
|
2015
|
||||||||
|
Cash flows from operating activities
|
|||||||||||
|
Net earnings
|
$
|
5,309
|
|
$
|
5,953
|
|
$
|
5,144
|
|
||
|
Adjustments to reconcile net earnings to net cash from operating activities:
|
|||||||||||
|
Depreciation
|
425
|
|
425
|
|
417
|
|
|||||
|
Amortization of intangible assets
|
1,076
|
|
764
|
|
419
|
|
|||||
|
Change in fair value of contingent consideration liabilities
|
626
|
|
228
|
|
—
|
|
|||||
|
Stock-based compensation
|
365
|
|
353
|
|
282
|
|
|||||
|
Upfront costs and milestones related to collaborations
|
470
|
|
280
|
|
280
|
|
|||||
|
Devaluation loss related to Venezuela
|
—
|
|
298
|
|
—
|
|
|||||
|
Intangible asset impairment
|
354
|
|
39
|
|
—
|
|
|||||
|
Impacts related to U.S. tax reform
|
1,242
|
|
—
|
|
—
|
|
|||||
|
Other, net
|
84
|
|
390
|
|
489
|
|
|||||
|
Changes in operating assets and liabilities, net of acquisitions:
|
|||||||||||
|
Accounts receivable
|
(391
|
)
|
(71
|
)
|
(1,076
|
)
|
|||||
|
Inventories
|
93
|
|
(38
|
)
|
(434
|
)
|
|||||
|
Prepaid expenses and other assets
|
(118
|
)
|
(393
|
)
|
511
|
|
|||||
|
Accounts payable and other liabilities
|
425
|
|
(1,187
|
)
|
1,503
|
|
|||||
|
Cash flows from operating activities
|
9,960
|
|
7,041
|
|
7,535
|
|
|||||
|
Cash flows from investing activities
|
|||||||||||
|
Acquisition of businesses, net of cash acquired
|
—
|
|
(2,495
|
)
|
(11,488
|
)
|
|||||
|
Other acquisitions and investments
|
(308
|
)
|
(262
|
)
|
(964
|
)
|
|||||
|
Acquisitions of property and equipment
|
(529
|
)
|
(479
|
)
|
(532
|
)
|
|||||
|
Purchases of investment securities
|
(2,230
|
)
|
(5,315
|
)
|
(851
|
)
|
|||||
|
Sales and maturities of investment securities
|
2,793
|
|
2,359
|
|
899
|
|
|||||
|
Other
|
—
|
|
118
|
|
—
|
|
|||||
|
Cash flows from investing activities
|
(274
|
)
|
(6,074
|
)
|
(12,936
|
)
|
|||||
|
Cash flows from financing activities
|
|||||||||||
|
Net change in short-term borrowings
|
22
|
|
(29
|
)
|
(19
|
)
|
|||||
|
Proceeds from issuance of long-term debt
|
—
|
|
11,627
|
|
20,660
|
|
|||||
|
Repayments of long-term debt and lease obligations
|
(25
|
)
|
(6,010
|
)
|
(4,018
|
)
|
|||||
|
Debt issuance costs
|
—
|
|
(69
|
)
|
(182
|
)
|
|||||
|
Dividends paid
|
(4,107
|
)
|
(3,717
|
)
|
(3,294
|
)
|
|||||
|
Purchases of treasury stock
|
(1,410
|
)
|
(6,033
|
)
|
(7,586
|
)
|
|||||
|
Proceeds from the exercise of stock options
|
254
|
|
268
|
|
155
|
|
|||||
|
Payments of contingent consideration liabilities
|
(268
|
)
|
—
|
|
—
|
|
|||||
|
Other, net
|
22
|
|
35
|
|
36
|
|
|||||
|
Cash flows from financing activities
|
(5,512
|
)
|
(3,928
|
)
|
5,752
|
|
|||||
|
Effect of exchange rate changes on cash and equivalents
|
29
|
|
(338
|
)
|
(300
|
)
|
|||||
|
Net change in cash and equivalents
|
4,203
|
|
(3,299
|
)
|
51
|
|
|||||
|
Cash and equivalents, beginning of year
|
5,100
|
|
8,399
|
|
8,348
|
|
|||||
|
Cash and equivalents, end of year
|
$
|
9,303
|
|
$
|
5,100
|
|
$
|
8,399
|
|
||
|
Other supplemental information
|
|||||||||||
|
Interest paid, net of portion capitalized
|
$
|
1,099
|
|
$
|
986
|
|
$
|
536
|
|
||
|
Income taxes paid
|
1,696
|
|
3,563
|
|
1,108
|
|
|||||
|
Supplemental schedule of non-cash investing and financing activities
|
|||||||||||
|
Issuance of common shares associated with acquisitions of businesses
|
—
|
|
3,923
|
|
8,405
|
|
|||||
The accompanying notes are an integral part of these consolidated financial statements.
|
52
|
2017 Form 10-K
|
||
AbbVie Inc. and Subsidiaries
Notes to Consolidated Financial Statements
Background
The principal business of AbbVie Inc. (AbbVie or the company) is the discovery, development, manufacture and sale of a broad line of pharmaceutical products. AbbVie's products are generally sold worldwide directly to wholesalers, distributors, government agencies, health care facilities, specialty pharmacies and independent retailers from AbbVie-owned distribution centers and public warehouses. Substantially all of AbbVie's net revenues in the United States are to
three
wholesalers. Outside the United States, products are sold primarily to customers or through distributors, depending on the market served.
AbbVie was incorporated in Delaware on April 10, 2012. On January 1, 2013, AbbVie became an independent, publicly-traded company as a result of the distribution by Abbott Laboratories (Abbott) of
100%
of the outstanding common stock of AbbVie to Abbott's shareholders. AbbVie incurred separation-related expenses of
$270 million
in 2015, which were principally classified in selling, general and administrative expenses (SG&A) in the consolidated statements of earnings.
Basis of Historical Presentation
For a certain portion of AbbVie’s operations, the legal transfer of AbbVie’s assets (net of liabilities) did not occur with the separation of AbbVie on January 1, 2013 due to the time required to transfer marketing authorizations and satisfy other regulatory requirements in certain countries. Under the terms of the separation agreement with Abbott, AbbVie was responsible for the business activities conducted by Abbott on its behalf and was subject to the risks and entitled to the benefits generated by these operations and assets. As a result, the related assets and liabilities and results of operations were reported in AbbVie’s consolidated financial statements. All of these operations were transferred to AbbVie as of December 31, 2016. Net revenues related to these operations were insignificant in
2016
and were
$213 million
in
2015
.
Use of Estimates
The consolidated financial statements have been prepared in accordance with U.S. generally accepted accounting principles (GAAP) and necessarily include amounts based on estimates and assumptions by management. Actual results could differ from those amounts. Significant estimates include amounts for rebates, pension and other post-employment benefits, income taxes, litigation, valuation of goodwill and intangible assets, contingent consideration liabilities, financial instruments and inventory and accounts receivable exposures.
Basis of Consolidation
The consolidated financial statements include the accounts of AbbVie and all of its subsidiaries in which a controlling interest is maintained. Controlling interest is determined by majority ownership interest and the absence of substantive third-party participating rights or, in the case of variable interest entities, where AbbVie is determined to be the primary beneficiary. Investments in companies over which AbbVie has a significant influence but not a controlling interest are accounted for using the equity method with AbbVie's share of earnings or losses reported in other expense, net in the consolidated statements of earnings. All other investments are generally accounted for using the cost method. Intercompany balances and transactions are eliminated.
Certain reclassifications have been made to conform the prior period consolidated financial statements to the current period presentation.
Revenue Recognition
AbbVie recognizes revenue when persuasive evidence of an arrangement exists, delivery has occurred, the sales price is fixed or determinable and collectability of the sales price is reasonably assured. Revenue from product sales is recognized when title and risk of loss have passed to the customer. Provisions for discounts, rebates, sales incentives to customers, returns and other adjustments are provided for in the period the related revenues are recorded. Rebate amounts are typically based upon the volume of purchases using contractual or statutory prices, which may vary by product and by payer. For each type of rebate, the factors used in the calculations of the accrual include the identification of the products subject to the
|
2017 Form 10-K
|
53
|
||
rebate, the applicable price terms and the estimated lag time between sale and payment of the rebate, which can be significant. Sales incentives to customers are insignificant. Historical data is readily available and reliable and is used for estimating the amount of the reduction in gross revenues. Revenue from the launch of a new product, from an improved version of an existing product, or for shipments in excess of a customer's normal requirements are recorded when the conditions noted above are met. In those situations, management records a returns reserve for such revenue, if necessary. Sales of product rights for marketable products are recorded as revenue upon disposition of the rights.
Research and Development Expenses
Internal research and development (R&D) costs are expensed as incurred. Clinical trial costs incurred by third parties are expensed as the contracted work is performed. Where contingent milestone payments are due to third parties under research and development collaborations for pre-commercialization milestones, the milestone payment obligations are expensed when the milestone results are achieved. Payments made to third parties subsequent to regulatory approval are capitalized as intangible assets and amortized to cost of products sold over the remaining useful life of the related product.
Collaborations and Other Arrangements
The company enters into collaborative agreements with third parties to develop and commercialize drug candidates. Collaborative activities may include joint research and development and commercialization of new products. AbbVie generally receives certain licensing rights under these arrangements. These collaborations often require upfront payments and may include additional milestone, research and development cost sharing, royalty or profit share payments, contingent upon the occurrence of certain future events linked to the success of the asset in development and commercialization. Upfront payments associated with collaborative arrangements during the development stage are expensed to acquired in-process research and development (IPR&D) expenses in the consolidated statements of earnings. Subsequent payments made to the partner for the achievement of milestones during the development stage are expensed to R&D expense in the consolidated statements of earnings when the milestone is achieved. Milestone payments made to the partner subsequent to regulatory approval are capitalized as intangible assets and amortized to cost of products sold over the estimated useful life of the related asset. Royalties are expensed to cost of products sold in the consolidated statements of earnings when incurred.
Advertising
Costs associated with advertising are expensed as incurred and are included in SG&A in the consolidated statements of earnings. Advertising expenses were
$846 million
in
2017
,
$764 million
in
2016
and
$704 million
in
2015
.
Pension and Other Post-Employment Benefits
AbbVie records annual expenses relating to its defined benefit pension and other post-employment benefit plans based on calculations which utilize various actuarial assumptions, including discount rates, rates of return on assets, compensation increases, turnover rates and health care cost trend rates. AbbVie reviews its actuarial assumptions on an annual basis and makes modifications to the assumptions based on current rates and trends. Actuarial gains and losses are deferred in accumulated other comprehensive loss (AOCI), net of tax and are amortized over the remaining service attribution periods of the employees under the corridor method. Differences between the expected long-term return on plan assets and the actual annual return are amortized to net periodic benefit cost over a
five
-year period.
Income Taxes
Income taxes are accounted for under the asset and liability method. Provisions for federal, state and foreign income taxes are calculated on reported pretax earnings based on current tax laws. Deferred taxes are provided using enacted tax rates on the future tax consequences of temporary differences, which are the differences between the financial statement carrying amounts of assets and liabilities and their respective tax bases and the tax benefits of carryforwards. A valuation allowance is established or maintained when, based on currently available information, it is more likely than not that all or a portion of a deferred tax asset will not be realized.
Cash and Equivalents
Cash and equivalents include money market funds and time deposits with original maturities of three months or less.
Investments
Investments consist primarily of time deposits, marketable debt securities, held-to-maturity debt securities and equity securities. Investments in marketable securities are classified as available-for-sale and are recorded at fair value with any unrealized holding gains or losses, net of tax, included in AOCI on the consolidated balance sheets. Investments in equity securities that are not traded on public stock exchanges and held-to-maturity debt securities are recorded at cost.
|
54
|
2017 Form 10-K
|
||
AbbVie periodically assesses its investment securities for other-than-temporary impairment losses. This evaluation is based on a number of factors, including the length of time and the extent to which the fair value has been below the cost basis and adverse conditions related specifically to the security, including any changes to the credit rating of the security, intent to sell, or whether AbbVie will more likely than not be required to sell the security before recovery of its amortized cost basis. AbbVie also considers industry factors and general market trends. When AbbVie determines that an other than temporary decline has occurred, a cost basis investment is written down with a charge to other expense (income), net in the consolidated statements of earnings and an available-for-sale investment's unrealized loss is reclassified from AOCI to other expense (income), net in the consolidated statements of earnings. Realized gains and losses on sales of investments are computed using the first-in, first-out method adjusted for any other-than-temporary declines in fair value that were recorded in net earnings.
Accounts Receivable
Accounts receivable are stated at their net realizable value. The allowance for doubtful accounts reflects the best estimate of probable losses inherent in the receivables portfolio determined on the basis of historical experience, specific allowances for known troubled accounts and other currently available information. Accounts receivable are written off after all reasonable means to collect the full amount (including litigation, where appropriate) have been exhausted. The allowance for doubtful accounts was
$58 million
at December 31,
2017
and
$72 million
at December 31,
2016
.
Inventories
Inventories are valued at the lower of cost (first-in, first-out basis) or market. Cost includes material and conversion costs. Inventories consisted of the following:
|
as of December 31 (in millions)
|
2017
|
2016
|
|||||
|
Finished goods
|
$
|
610
|
|
$
|
223
|
|
|
|
Work-in-process
|
822
|
|
1,080
|
|
|||
|
Raw materials
|
173
|
|
141
|
|
|||
|
Inventories
|
$
|
1,605
|
|
$
|
1,444
|
|
|
Property and Equipment
|
as of December 31 (in millions)
|
2017
|
2016
|
|||||
|
Land
|
$
|
48
|
|
$
|
46
|
|
|
|
Buildings
|
1,428
|
|
1,344
|
|
|||
|
Equipment
|
5,991
|
|
5,726
|
|
|||
|
Construction in progress
|
604
|
|
410
|
|
|||
|
Property and equipment, gross
|
8,071
|
|
7,526
|
|
|||
|
Less accumulated depreciation
|
(5,268
|
)
|
(4,922
|
)
|
|||
|
Property and equipment, net
|
$
|
2,803
|
|
$
|
2,604
|
|
|
Depreciation for property and equipment is recorded on a straight-line basis over the estimated useful lives of the assets. The estimated useful life for buildings ranges from
10
to
50
years. Buildings include leasehold improvements which are amortized over the life of the related facility lease (including any renewal periods, if appropriate) or the asset, whichever is shorter. The estimated useful life for equipment ranges from
2
to
25
years. Equipment includes certain computer software and software development costs incurred in connection with developing or obtaining software for internal use and is amortized over
3
to
10
years. Depreciation expense was
$425 million
in
2017
,
$425 million
in
2016
and
$417 million
in
2015
. Assets related to capital leases were insignificant at December 31,
2017
and
2016
.
Litigation and Contingencies
Loss contingency provisions are recorded when it is probable that a liability has been incurred and the amount of the liability can be reasonably estimated based on existing information. When a best estimate cannot be made, the minimum loss contingency amount in a probable range is recorded. Legal fees are expensed as incurred. AbbVie accrues for product liability claims on an undiscounted basis. The liabilities are evaluated quarterly and adjusted if necessary as additional information becomes available. Receivables for insurance recoveries for product liability claims, if any, are recorded as assets on an undiscounted basis when it is probable that a recovery will be realized.
|
2017 Form 10-K
|
55
|
||
Business Combinations
AbbVie utilizes the acquisition method of accounting for business combinations. This method requires, among other things, that r
esults of operations of acquired companies are included in AbbVie's results of operations beginning on the respective acquisition dates and
that assets acquired and liabilities assumed are recognized at fair value as of the acquisition date.
Any excess of the fair value of consideration transferred over the fair values of the net assets acquired is recognized as goodwill. Contingent consideration liabilities are recognized at the estimated fair value on the acquisition date. Subsequent changes to the fair value of contingent consideration liabilities are recognized in other expense (income), net in the consolidated statements of earnings. The fair value of assets acquired and liabilities assumed in certain cases may be subject to revision based on the final determination of fair value during a period of time generally not to exceed twelve months from the acquisition date. Legal costs, due diligence costs, business valuation costs and all other business acquisition costs are expensed when incurred.
Goodwill and Intangible Assets
Intangible assets acquired in a business combination are recorded at fair value using a discounted cash flow model. The discounted cash flow model requires assumptions about the timing and amount of future net cash flows, risk, the cost of capital and terminal values of market participants. Definite-lived intangibles are amortized over their estimated useful lives using the estimated pattern of economic benefit. AbbVie reviews the recoverability of definite-lived intangible assets whenever events or changes in circumstances indicate the carrying value of an asset may not be recoverable. AbbVie first compares the projected undiscounted cash flows to be generated by the asset to its carrying value. If the undiscounted cash flows of an intangible asset are less than the carrying value, the intangible asset is written down to its fair value. Where cash flows cannot be identified for an individual asset, the review is applied at the lowest level for which cash flows are largely independent of the cash flows of other assets and liabilities.
Goodwill and indefinite-lived assets are not amortized, but are subject to an impairment review annually and more frequently when indicators of impairment exist. An impairment of goodwill could occur if the carrying amount of a reporting unit exceeded the fair value of that reporting unit. An impairment of indefinite-lived intangible assets would occur if the fair value of the intangible asset is less than the carrying value.
The company tests its goodwill for impairment by first assessing qualitative factors to determine whether it is more likely than not that the fair value is less than its carrying amount. If the company concludes it is more likely than not that the fair value of the reporting unit is less than its carrying amount, a quantitative impairment test is performed. AbbVie tests indefinite-lived intangible assets using a quantitative impairment test. For its quantitative impairment tests, the company uses an estimated future cash flow approach that requires significant judgment with respect to future volume, revenue and expense growth rates, changes in working capital use, future foreign currency exchange rates, the selection of an appropriate discount rate, asset groupings and other assumptions and estimates. The estimates and assumptions used are consistent with the company's business plans and a market participant's views of a company and similar companies. The use of alternative estimates and assumptions could increase or decrease the estimated fair value of the assets and potentially result in different impacts to the company's results of operations. Actual results may differ from the company's estimates.
Acquired In-Process Research and Development
In an asset acquisition, the initial costs of rights to IPR&D projects acquired are expensed as IPR&D in the consolidated statements of earnings unless the project has an alternative future use. These costs include initial payments incurred prior to regulatory approval in connection with research and development collaboration agreements that provide rights to develop, manufacture, market and/or sell pharmaceutical products. In a business combination, the fair value of IPR&D projects acquired are capitalized and accounted for as indefinite-lived intangible assets until the underlying project receives regulatory approval, at which point the intangible asset will be accounted for as a definite-lived intangible asset, or discontinuation, at which point the intangible asset will be written off. R&D costs incurred after the acquisition are expensed as incurred.
Foreign Currency Translation
Foreign subsidiary earnings are translated into U.S. dollars using average exchange rates. The net assets of foreign subsidiaries are translated into U.S. dollars using period-end exchange rates. The U.S. dollar effects that arise from translating the net assets of these subsidiaries at changing rates are recognized in other comprehensive (loss) income (OCI) in the consolidated statements of comprehensive income. The net assets of subsidiaries in highly inflationary economies are remeasured as if the functional currency were the reporting currency. The remeasurement is recognized in net foreign exchange loss in the consolidated statements of earnings.
|
56
|
2017 Form 10-K
|
||
Derivatives
All derivative instruments are recognized as either assets or liabilities at fair value on the consolidated balance sheets and are classified as current or long-term based on the scheduled maturity of the instrument.
For derivatives formally designated as hedges, the company assesses at inception and quarterly thereafter, whether the hedging derivatives are highly effective in offsetting changes in the fair value or cash flows of the hedged item. The changes in fair value of a derivative designated as a fair value hedge and of the hedged item attributable to the hedged risk are recognized in earnings immediately. The effective portions of changes in the fair value of a derivative designated as a cash flow hedge are reported in AOCI and are subsequently recognized in earnings consistent with the underlying hedged item. If it is determined that a derivative is no longer highly effective as a hedge, the company discontinues hedge accounting prospectively. If a hedged forecasted transaction becomes probable of not occurring, any gains or losses are reclassified from AOCI to earnings. Derivatives that are not designated as hedges are adjusted to fair value through current earnings.
The company also uses derivative instruments or foreign currency denominated debt to hedge its net investments in certain foreign subsidiaries and affiliates. Realized and unrealized gains and losses from these hedges are included in AOCI.
Derivative cash flows, with the exception of net investment hedges, are principally classified in the operating section of the consolidated statements of cash flows, consistent with the underlying hedged item. Cash flows related to net investment hedges are classified in the investing section of the consolidated statements of cash flows.
Recent Accounting Pronouncements
Recently Adopted Accounting Pronouncements
In January 2017, the Financial Accounting Standards Board (FASB) issued Accounting Standards Update (ASU) No. 2017-01,
Business Combinations (Topic 805): Clarifying the Definition of a Business
. The standard provides clarifying guidance to assist in the evaluation of whether transactions are treated as business combinations or asset acquisitions. AbbVie elected to early adopt the changes prospectively in the first quarter of 2017.
In March 2016, the FASB issued ASU No. 2016-09,
Compensation-Stock Compensation (Topic 718): Improvements to Employee Share-Based Payment Accounting
. AbbVie adopted the standard in the first quarter of 2017. As a result, all excess tax benefits associated with stock-based awards are recognized in the statement of earnings when the awards vest or settle, rather than in stockholders' equity. In addition, excess tax benefits in the statement of cash flows are now classified as an operating activity rather than as a financing activity. AbbVie adopted these changes prospectively. Accordingly, the company recognized excess tax benefits in income tax expense of
$71 million
in 2017 and classified them within cash flows from operating activities.
Recent Accounting Pronouncements Not Yet Adopted
In May 2014, the FASB issued ASU No. 2014-09,
Summary and Amendments That Create Revenue from Contracts with Customers (Topic 606) and Other Assets and Deferred Costs-Contracts with Customers (Subtopic 340-40)
. The amendments in this standard supersede most current revenue recognition requirements. The core principle of the new guidance is that an entity should recognize revenue to depict the transfer of promised goods or services to customers in an amount that reflects the consideration to which the entity expects to be entitled in exchange for those goods or services. AbbVie can apply the amendments using one of the following two methods: (i) retrospectively to each prior reporting period presented, or (ii) modified retrospectively with the cumulative effect of initially applying the amendments recognized at the date of initial application. AbbVie will adopt the standard effective the first quarter of 2018 and apply the amendments using the modified retrospective method. The company has completed its assessment of the new standard as of December 31, 2017. AbbVie does not expect significant changes to the amounts or timing of revenue recognition for product sales, which is its primary revenue stream. However, the adoption of the new standard will require a cumulative-effect adjustment to retained earnings on January 1, 2018 of approximately
$120 million
, net of tax, primarily related to certain deferred license revenues that were originally expected to be recognized through early 2020.
In January 2016, the FASB issued ASU No. 2016-01,
Financial Instruments-Overall (Subtopic 825-10): Recognition and Measurement of Financial Assets and Financial Liabilities
. The standard requires several targeted changes including that equity investments (except those accounted for under the equity method of accounting, or those that result in consolidation of the investee) be measured at fair value with changes in fair value recognized in net earnings. These provisions will not impact the accounting for AbbVie's investments in debt securities. The new guidance also changes certain disclosure requirements and other aspects of current U.S. GAAP. Amendments are to be applied as a cumulative-effect adjustment to the balance sheet as of the beginning of the fiscal year of adoption. This standard will be effective for AbbVie starting with the
|
2017 Form 10-K
|
57
|
||
first quarter of 2018. Based on historical trends, AbbVie does not believe the adoption will have a material impact on its consolidated financial statements.
In February 2016, the FASB issued ASU No. 2016-02,
Leases (Topic 842)
. The standard outlines a comprehensive lease accounting model that supersedes the current lease guidance and requires lessees to recognize lease liabilities and corresponding right-of-use assets for all leases with lease terms greater than 12 months. The guidance also changes the definition of a lease and expands the disclosure requirements of lease arrangements. The new standard must be adopted using the modified retrospective approach and will be effective for AbbVie starting with the first quarter of 2019, with early adoption permitted. AbbVie will adopt the standard effective in the first quarter of 2019 and is currently assessing the impact of adopting this guidance on its consolidated financial statements.
In June 2016, the FASB issued ASU No. 2016-13,
Financial Instruments - Credit Losses (Topic 326)
. The standard changes how credit losses are measured for most financial assets and certain other instruments. For trade and other receivables, held-to-maturity debt securities, loans and other financial instruments, the standard requires the use of a new forward-looking "expected credit loss" model that generally will result in the earlier recognition of allowances for losses. For available-for-sale debt securities with unrealized losses, the standard now requires allowances to be recorded instead of reducing the amortized cost of the investment. Additionally, the standard requires new disclosures and will be effective for AbbVie starting with the first quarter of 2020. Early adoption beginning in the first quarter of 2019 is permitted. With certain exceptions, adjustments are to be applied using a modified-retrospective approach by reflecting adjustments through a cumulative-effect impact to retained earnings as of the beginning of the fiscal year of adoption. AbbVie is currently assessing the impact and timing of adopting this guidance on its consolidated financial statements.
In October 2016, the FASB issued ASU No. 2016-16,
Income Taxes (Topic 740)
. The new standard requires entities to recognize the income tax consequences of an intercompany transfer of an asset other than inventory when the transfer occurs. Under current U.S. GAAP, the income tax consequences of these intercompany asset transfers are deferred until the asset is sold to a third party or otherwise recovered through use. The standard will be effective for AbbVie starting with the first quarter of 2018. Adjustments for this update are to be applied on a modified retrospective basis through a cumulative-effect adjustment directly to retained earnings with any adjustments reflected as of the beginning of the fiscal year of adoption. The company has completed its assessment of the new standard as of
December 31, 2017
. The adoption will require a cumulative-effect adjustment to retained earnings on January 1, 2018 of approximately
$1.8 billion
related to prepaid income tax assets that will be affected by this standard, of which
$1.4 billion
was included in prepaid expenses and other on the consolidated balance sheet as of
December 31, 2017
.
In March 2017, the FASB issued ASU No. 2017-07,
Compensation - Retirement Benefits (Topic 715): Improving the Presentation of Net Periodic Pension Cost and Net Periodic Postretirement Benefit Cost
. The standard requires that an employer continue to report the service cost component of net periodic benefit cost in the same income statement line item or items as other employee compensation costs arising from services rendered during the period. The other components of net periodic benefit cost are required to be presented separately outside of income from operations and are not eligible for capitalization. The standard will be effective for AbbVie starting with the first quarter of 2018. Upon adoption, the company will apply the income statement classification provisions of this standard retrospectively and will reclassify income of
$47 million
from operating earnings to non-operating income for the year ended December 31, 2017. Additionally, the company preliminarily expects to record approximately
$20 million
of non-operating income in 2018 which would have been recorded in operating earnings under the previous guidance.
In August 2017, the FASB issued ASU No. 2017-12,
Derivatives and Hedging (Topic 815): Targeted Improvements to Accounting for Hedging Activities
. The standard simplifies the application of hedge accounting and more closely aligns the accounting with an entity’s risk management activities. AbbVie will early adopt the standard effective in the first quarter of 2018 and does not believe the adoption will have a material impact on its consolidated financial statements.
|
58
|
2017 Form 10-K
|
||
Interest Expense, Net
|
years ended December 31 (in millions)
|
2017
|
2016
|
2015
|
||||||||
|
Interest expense
|
$
|
1,150
|
|
$
|
1,047
|
|
$
|
719
|
|
||
|
Interest income
|
(146
|
)
|
(82
|
)
|
(33
|
)
|
|||||
|
Interest expense, net
|
$
|
1,004
|
|
$
|
965
|
|
$
|
686
|
|
||
Accounts Payable and Accrued Liabilities
|
as of December 31 (in millions)
|
2017
|
2016
|
|||||
|
Sales rebates
|
$
|
3,069
|
|
$
|
2,887
|
|
|
|
Accounts payable
|
1,474
|
|
1,407
|
|
|||
|
Dividends payable
|
1,143
|
|
1,028
|
|
|||
|
Salaries, wages and commissions
|
763
|
|
644
|
|
|||
|
Royalty and license arrangements
|
514
|
|
434
|
|
|||
|
Other
|
3,263
|
|
2,979
|
|
|||
|
Accounts payable and accrued liabilities
|
$
|
10,226
|
|
$
|
9,379
|
|
|
Other Long-Term Liabilities
|
as of December 31 (in millions)
|
2017
|
2016
|
|||||
|
Contingent consideration liabilities
|
$
|
4,266
|
|
$
|
3,941
|
|
|
|
Pension and other post-employment benefits
|
2,740
|
|
2,085
|
|
|||
|
Liabilities for unrecognized tax benefits
|
2,683
|
|
1,166
|
|
|||
|
Income taxes payable
|
4,675
|
|
—
|
|
|||
|
Other
|
1,241
|
|
1,160
|
|
|||
|
Other long-term liabilities
|
$
|
15,605
|
|
$
|
8,352
|
|
|
AbbVie grants certain restricted stock awards (RSAs) and restricted stock units (RSUs) that are considered to be participating securities. Due to the presence of participating securities, AbbVie calculates earnings per share (EPS) using the more dilutive of the treasury stock or the two-class method. For all periods presented, the two-class method was more dilutive.
|
2017 Form 10-K
|
59
|
||
The following table summarizes the impact of the two-class method:
|
Years ended December 31,
|
|||||||||||
|
(in millions, except per share information)
|
2017
|
2016
|
2015
|
||||||||
|
Basic EPS
|
|||||||||||
|
Net earnings
|
$
|
5,309
|
|
$
|
5,953
|
|
$
|
5,144
|
|
||
|
Earnings allocated to participating securities
|
26
|
|
30
|
|
26
|
|
|||||
|
Earnings available to common shareholders
|
$
|
5,283
|
|
|
$
|
5,923
|
|
|
$
|
5,118
|
|
|
Weighted-average basic shares outstanding
|
1,596
|
|
1,622
|
|
1,625
|
|
|||||
|
Basic earnings per share
|
$
|
3.31
|
|
$
|
3.65
|
|
$
|
3.15
|
|
||
|
Diluted EPS
|
|||||||||||
|
Net earnings
|
$
|
5,309
|
|
$
|
5,953
|
|
$
|
5,144
|
|
||
|
Earnings allocated to participating securities
|
26
|
|
30
|
|
26
|
|
|||||
|
Earnings available to common shareholders
|
$
|
5,283
|
|
$
|
5,923
|
|
$
|
5,118
|
|
||
|
Weighted-average shares of common stock outstanding
|
1,596
|
|
1,622
|
|
1,625
|
|
|||||
|
Effect of dilutive securities
|
7
|
|
9
|
|
12
|
|
|||||
|
Weighted-average diluted shares outstanding
|
1,603
|
|
1,631
|
|
1,637
|
|
|||||
|
Diluted earnings per share
|
$
|
3.30
|
|
$
|
3.63
|
|
$
|
3.13
|
|
||
As further described in
Note 12
, AbbVie entered into and executed an accelerated share repurchase agreement (ASR) with third party financial institutions in 2016 and 2015. For purposes of calculating EPS, AbbVie reflected the ASR as a repurchase of AbbVie common stock in the relevant periods.
Certain shares issuable under stock-based compensation plans were excluded from the computation of EPS because the effect would have been antidilutive. The number of common shares excluded was insignificant for all periods presented.
Acquisition of Stemcentrx
On June 1, 2016, AbbVie acquired all of the outstanding equity interests in Stemcentrx, a privately-held biotechnology company. The transaction expanded AbbVie’s oncology pipeline by adding the late-stage asset rovalpituzumab tesirine (Rova-T),
four
additional early-stage clinical compounds in solid tumor indications and a significant portfolio of pre-clinical assets. Rova-T is currently in registrational trials for small cell lung cancer.
The acquisition of Stemcentrx was accounted for as a business combination using the acquisition method of accounting.
The aggregate upfront consideration for the acquisition of Stemcentrx consisted of approximately
62.4 million
shares of AbbVie common stock, issued from common stock held in treasury, and cash. AbbVie may make certain contingent payments upon the achievement of defined development and regulatory milestones. As of the acquisition date, the maximum aggregate amount payable for development and regulatory milestones was
$4.0 billion
. The acquisition-date fair value of these milestones was
$620 million
and was estimated using a combination of probability-weighted discounted cash flow models and Monte Carlo simulation models. The estimate was determined based on significant inputs that are not observable in the market, referred to as Level 3 inputs, as described in more detail in
Note 10
.
The following table summarizes total consideration:
|
(in millions)
|
|||
|
Cash
|
$
|
1,883
|
|
|
Fair value of AbbVie common stock
|
3,923
|
|
|
|
Contingent consideration
|
620
|
|
|
|
Total consideration
|
$
|
6,426
|
|
|
60
|
2017 Form 10-K
|
||
The following table summarizes fair values of assets acquired and liabilities assumed as of the June 1, 2016 acquisition date:
|
(in millions)
|
|||
|
Assets acquired and liabilities assumed
|
|||
|
Accounts receivable
|
$
|
1
|
|
|
Prepaid expenses and other
|
7
|
|
|
|
Property and equipment
|
17
|
|
|
|
Intangible assets - Indefinite-lived research and development
|
6,100
|
|
|
|
Accounts payable and accrued liabilities
|
(31
|
)
|
|
|
Deferred income taxes
|
(1,933
|
)
|
|
|
Other long-term liabilities
|
(7
|
)
|
|
|
Total identifiable net assets
|
4,154
|
|
|
|
Goodwill
|
2,272
|
|
|
|
Total assets acquired and liabilities assumed
|
$
|
6,426
|
|
Intangible assets were related to IPR&D for Rova-T,
four
additional early-stage clinical compounds in solid tumor indications and several additional pre-clinical compounds. The estimated fair value of the acquired IPR&D was determined using the multi-period excess earnings model of the “income approach,” which is a valuation technique that provides an estimate of the fair value of an asset based on market participant expectations of the cash flows an asset would generate over its remaining useful life. Some of the more significant assumptions inherent in the development of those asset valuations include the estimated annual cash flows for each asset or product (including net revenues, cost of sales, R&D costs, selling and marketing costs and working capital/contributory asset charges), the appropriate discount rate to select in order to measure the risk inherent in each future cash flow stream, the assessment of each asset’s life cycle, the regulatory approval probabilities, commercial success risks, competitive landscape as well as other factors.
The goodwill recognized represents expected synergies, including the ability to: (i) leverage the respective strengths of each business; (ii) expand the combined company’s product portfolio; (iii) accelerate AbbVie's clinical and commercial presence in oncology; and (iv) establish a strong leadership position in oncology. Goodwill was also impacted by the establishment of a deferred tax liability for the acquired identifiable intangible assets which have no tax basis. The goodwill is not deductible for tax purposes.
Following the acquisition date, the operating results of Stemcentrx have been included in the company's financial statements. AbbVie’s consolidated statement of earnings for the year ended December 31, 2016 included
no
net revenues and an operating loss of
$165 million
associated with Stemcentrx's operations. This operating loss included
$43 million
of post-acquisition stock-based compensation expense for Stemcentrx options and excluded interest expense and certain acquisition costs.
Pro Forma Financial Information
The following table presents the unaudited pro forma combined results of operations of AbbVie and Stemcentrx for the years ended December 31, 2016 and 2015 as if the acquisition of Stemcentrx had occurred on January 1, 2015:
|
Years ended December 31,
|
|||||||
|
(in millions, except per share information)
|
2016
|
2015
|
|||||
|
Net revenues
|
$
|
25,641
|
|
$
|
22,869
|
|
|
|
Net earnings
|
5,907
|
|
4,894
|
|
|||
|
Basic earnings per share
|
$
|
3.58
|
|
$
|
2.90
|
|
|
|
Diluted earnings per share
|
$
|
3.56
|
|
$
|
2.88
|
|
|
The unaudited pro forma financial information was prepared using the acquisition method of accounting and was based on the historical financial information of AbbVie and Stemcentrx. In order to reflect the occurrence of the acquisition on January 1, 2015 as required, the unaudited pro forma financial information includes adjustments to reflect the additional interest expense associated with the issuance of debt to finance the acquisition and the reclassification of acquisition,
|
2017 Form 10-K
|
61
|
||
integration and financing-related costs incurred during the year ended December 31, 2016 to the year ended December 31, 2015. The unaudited pro forma financial information is not necessarily indicative of what the consolidated results of operations would have been had the acquisition been completed on January 1, 2015. In addition, the unaudited pro forma financial information is not a projection of the future results of operations of the combined company nor does it reflect the expected realization of any cost savings or synergies associated with the acquisition.
Acquisition of BI 655066 and BI 655064 from Boehringer Ingelheim
On April 1, 2016, AbbVie acquired all rights to risankizumab (BI 655066), an anti-IL-23 monoclonal biologic antibody in Phase 3 development for psoriasis, from Boehringer Ingelheim (BI) pursuant to a global collaboration agreement. AbbVie is also evaluating the potential of this biologic therapy in other indications, including Crohn’s disease, psoriatic arthritis and asthma. In addition to risankizumab, AbbVie also gained rights to an anti-CD40 antibody, BI 655064, currently in Phase 1 development. BI will retain responsibility for further development of BI 655064, and AbbVie may elect to advance the program after completion of certain clinical achievements. The acquired assets include all patents, data, know-how, third-party agreements, regulatory filings and manufacturing technology related to BI 655066 and BI 655064.
The company concluded that the acquired assets met the definition of a business and accounted for the transaction as a business combination using the acquisition method of accounting. Under the terms of the agreement, AbbVie made an upfront payment of
$595 million
. Additionally,
$18 million
of payments to BI, pursuant to a contractual obligation to reimburse BI for certain development costs it incurred prior to the acquisition date, were initially deferred. AbbVie may make certain contingent payments upon the achievement of defined development, regulatory and commercial milestones, as well as royalty payments based on net revenues of licensed products. As of the acquisition date, the maximum aggregate amount payable for development and regulatory milestones was approximately
$1.6 billion
. The acquisition-date fair value of these milestones was
$606 million
. The acquisition-date fair value of contingent royalty payments was
$2.8 billion
. The potential contingent consideration payments were estimated by applying a probability-weighted expected payment model for contingent milestone payments and a Monte Carlo simulation model for contingent royalty payments, which were then discounted to present value. The fair value measurements were based on Level 3 inputs.
The following table summarizes total consideration:
|
(in millions)
|
|||
|
Cash
|
$
|
595
|
|
|
Deferred consideration payable
|
18
|
|
|
|
Contingent consideration
|
3,365
|
|
|
|
Total consideration
|
$
|
3,978
|
|
The following table summarizes fair values of assets acquired as of the April 1, 2016 acquisition date:
|
(in millions)
|
|||
|
Assets acquired
|
|||
|
Identifiable intangible assets - Indefinite-lived research and development
|
$
|
3,890
|
|
|
Goodwill
|
88
|
|
|
|
Total assets acquired
|
$
|
3,978
|
|
The estimated fair value of the acquired IPR&D was determined using the multi-period excess earnings model of the “income approach.” The goodwill recognized represents expected synergies, including an expansion of the company’s immunology product portfolio.
Pro forma results of operations for this acquisition have not been presented because this acquisition is insignificant to AbbVie’s consolidated results of operations.
Acquisition of Pharmacyclics
On May 26, 2015, AbbVie acquired Pharmacyclics, a biopharmaceutical company that develops and commercializes novel therapies for people impacted by cancer. Pharmacyclics markets IMBRUVICA (ibrutinib), a Bruton's tyrosine kinase (BTK) inhibitor, targeting B-cell malignancies.
|
62
|
2017 Form 10-K
|
||
The acquisition of Pharmacyclics was accounted for as a business combination using the acquisition method of accounting. The total consideration for the acquisition of Pharmacyclics consisted of cash and approximately
128 million
shares of AbbVie common stock and is summarized as follows:
|
(in millions)
|
|
||
|
Cash
|
$
|
12,365
|
|
|
Fair value of AbbVie common stock
|
8,405
|
|
|
|
Total consideration
|
$
|
20,770
|
|
The following table summarizes the fair values of assets acquired and liabilities assumed as of the May 26, 2015 acquisition date:
|
(in millions)
|
|
||
|
Assets acquired and liabilities assumed
|
|
|
|
|
Cash and equivalents
|
$
|
877
|
|
|
Short-term investments
|
11
|
|
|
|
Accounts receivable
|
106
|
|
|
|
Inventories
|
492
|
|
|
|
Other assets
|
212
|
|
|
|
Intangible assets
|
|
|
|
|
Definite-lived developed product rights
|
4,590
|
|
|
|
Definite-lived license agreements
|
6,780
|
|
|
|
Indefinite-lived research and development
|
7,180
|
|
|
|
Accounts payable and accrued liabilities
|
(381
|
)
|
|
|
Deferred income taxes
|
(6,453
|
)
|
|
|
Other long-term liabilities
|
(254
|
)
|
|
|
Total identifiable net assets
|
13,160
|
|
|
|
Goodwill
|
7,610
|
|
|
|
Total assets acquired and liabilities assumed
|
$
|
20,770
|
|
The amortization of the fair market value step-up fo
r acquired inventory was included in cost of products sold and R&D in the consolidated statements of earnings. The related amortization was
$58 million
in
2017
,
$274 million
in
2016
and
$113 million
in 2015.
Intangible assets were related to the IMBRUVICA developed product rights, IPR&D in the United States for additional IMBRUVICA indications and the contractual rights to IMBRUVICA profits and losses outside the United States as a result of the collaboration agreement with Janssen Biotech, Inc. and its affiliates (Janssen), one of the Janssen Pharmaceutical companies of Johnson & Johnson. See
Note 6
for additional information regarding the collaboration with Janssen. The acquired definite-lived intangible assets are being amortized over a weighted-average estimated useful life of
12
years using the estimated pattern of economic benefit. The estimated fair value of the IPR&D and identifiable intangible assets was determined using the "income approach."
The goodwill recognized from the acquisition of Pharmacyclics includes expected synergies, including the ability to leverage the respective strengths of each business, expanding the combined company's product portfolio, acceleration of clinical and commercial presence in oncology and establishment of a strong leadership position in hematological oncology. The goodwill is not deductible for tax purposes.
From the acquisition date through December 31, 2015, AbbVie's 2015 consolidated statement of earnings included net revenues of
$774 million
and an operating loss of
$519 million
associated with Pharmacyclics' operations. The operating loss included
$346 million
of acquisition-related compensation expense,
$261 million
of inventory step-up and intangible asset amortization and
$100 million
of transaction and integration costs. Of these costs,
$294 million
was recorded within SG&A expenses,
$152 million
within R&D expense and
$261 million
within cost of products sold in the 2015 consolidated statement of earnings.
|
2017 Form 10-K
|
63
|
||
Pro Forma Financial Information
The following table presents the unaudited pro forma combined results of operations of AbbVie and Pharmacyclics for 2015 as if the acquisition of Pharmacyclics had occurred on January 1, 2014:
|
year ended December 31 (in millions, except per share information)
|
2015
|
||
|
Net revenues
|
$
|
23,215
|
|
|
Net earnings
|
5,345
|
|
|
|
Basic earnings per share
|
$
|
3.18
|
|
|
Diluted earnings per share
|
$
|
3.16
|
|
The unaudited pro forma financial information was prepared using the acquisition method of accounting and was based on the historical financial information of AbbVie and Pharmacyclics. In order to reflect the occurrence of the acquisition on January 1, 2014 as required, the unaudited pro forma financial information includes adjustments to reflect the incremental amortization expense to be incurred based on the fair values of the identifiable intangible assets acquired; the incremental cost of products sold related to the fair value adjustments associated with the acquisition-date inventory; the additional interest expense associated with the issuance of debt to finance the acquisition; and the reclassification of acquisition, integration and financing-related costs incurred during the year ended December 31, 2015 to the year ended December 31, 2014. The unaudited pro forma financial information is not necessarily indicative of what the consolidated results of operations would have been had the acquisition been completed on January 1, 2014. In addition, the unaudited pro forma financial information is not a projection of the future results of operations of the combined company nor does it reflect the expected realization of any cost savings or synergies associated with the acquisition.
Other Licensing & Acquisitions Activity
Excluding the acquisitions above, cash outflows related to other acquisitions and investments totaled
$308 million
in
2017
,
$262 million
in
2016
and
$964 million
in
2015
. AbbVie recorded IPR&D charges of
$327 million
in
2017
,
$200 million
in
2016
and
$150 million
in
2015
. Significant arrangements impacting
2017
,
2016
and
2015
, some of which require contingent milestone payments, are summarized below.
Alector, Inc.
In October 2017, AbbVie entered into a global strategic collaboration with Alector, Inc. (Alector) to develop and commercialize medicines to treat Alzheimer’s disease and other neurodegenerative disorders. AbbVie and Alector have agreed to research a portfolio of antibody targets and AbbVie has an option to global development and commercial rights to two targets. The terms of the arrangement included an initial upfront payment of
$205 million
, which was expensed to IPR&D in the fourth quarter of 2017. Alector will conduct exploratory research, drug discovery and development for lead programs up to the conclusion of the proof of concept studies. If the option is exercised, AbbVie will lead development and commercialization activities and could make additional payments to Alector of up to
$986 million
upon achievement of certain development and regulatory milestones. Alector and AbbVie will co-fund development and commercialization and will share global profits equally.
C
2
N Diagnostics
In March 2015, AbbVie entered into an exclusive worldwide license agreement with C
2
N Diagnostics (C
2
N) to develop and commercialize anti-tau antibodies for the treatment of Alzheimer's disease and other neurological disorders. As part of the agreement, AbbVie made an initial upfront payment of
$100 million
, which was expensed to IPR&D in 2015. AbbVie made additional payments of
$35 million
in both 2016 and 2017, which were recorded in R&D expense, due to the achievement of development milestones under the license agreement. Upon the achievement of certain development, regulatory and commercial milestones, AbbVie could make additional payments of up to
$615 million
, as well as royalties on net revenues.
Other Arrangements
In addition to the significant arrangements described above, AbbVie entered into several other arrangements resulting in charges to IPR&D of
$122 million
in
2017
,
$200 million
in
2016
and
$50 million
in
2015
. In connection with the other individually insignificant early stage arrangements entered into in
2017
, AbbVie could make additional payments of up to
$2.4 billion
upon the achievement of certain development, regulatory and commercial milestones.
|
64
|
2017 Form 10-K
|
||
Other Activity
Priority Review Voucher (PRV)
In August 2015, AbbVie entered into an agreement to purchase a rare pediatric disease PRV from a third party. The PRV entitles AbbVie to receive an FDA priority review of a single New Drug Application or Biologics License Application, which reduces the target review time and could lead to an expedited approval. In exchange for the PRV, AbbVie made a payment of
$350 million
, which was recorded in R&D expense in the consolidated statement of earnings and as an operating cash outflow in the consolidated statement of cash flows for 2015. AbbVie intends to use the PRV for an existing R&D project.
In December 2011, Pharmacyclics entered into a worldwide collaboration and license agreement with Janssen for the joint development and commercialization of IMBRUVICA, a novel, orally active, selective covalent inhibitor of BTK and certain compounds structurally related to IMBRUVICA, for oncology and other indications, excluding all immune and inflammatory mediated diseases or conditions and all psychiatric or psychological diseases or conditions, in the United States and outside the United States.
The collaboration provides Janssen with an exclusive license to commercialize IMBRUVICA outside of the United States and co-exclusively with AbbVie in the United States. Both parties are responsible for the development, manufacturing and marketing of any products generated as a result of the collaboration. The collaboration has no set duration or specific expiration date and provides for potential future development, regulatory and approval milestone payments of up to
$200 million
to AbbVie. The collaboration also includes a cost sharing arrangement for associated collaboration activities. Except in certain cases, Janssen is responsible for approximately
60%
of collaboration development costs and AbbVie is responsible for the remaining
40%
of collaboration development costs.
In the United States, both parties have co-exclusive rights to commercialize the products; however, AbbVie is the principal in the end customer product sales. AbbVie and Janssen share pre-tax profits and losses equally from the commercialization of products. Sales of IMBRUVICA are included in AbbVie's net revenues. Janssen's share of profits is included in AbbVie's cost of products sold. Other costs incurred under the collaboration are reported in their respective expense line items, net of Janssen's share.
Outside the United States, Janssen is responsible for and has exclusive rights to commercialize IMBRUVICA. AbbVie and Janssen share pre-tax profits and losses equally from the commercialization of products. AbbVie's share of profits is included in AbbVie's net revenues. Other costs incurred under the collaboration are reported in their respective expense line items, net of Janssen's share.
The following table shows the profit and cost sharing relationship between Janssen and AbbVie:
|
years ended December 31 (in millions)
|
2017
|
2016
|
2015
|
|||||||||
|
United States - Janssen's share of profits (included in cost of products sold)
|
$
|
1,001
|
|
$
|
735
|
|
$
|
306
|
|
|||
|
International - AbbVie's share of profits (included in net revenues)
|
429
|
|
252
|
|
95
|
|
||||||
|
Global - AbbVie's share of other costs (included in respective line items)
|
288
|
|
262
|
|
159
|
|
||||||
|
2017 Form 10-K
|
65
|
||
Goodwill
The following table summarizes the changes in the carrying amount of goodwill:
|
(in millions)
|
|
||
|
Balance as of December 31, 2015
|
$
|
13,168
|
|
|
Additions (see Note 5)
|
2,360
|
|
|
|
Foreign currency translation
|
(112
|
)
|
|
|
Balance as of December 31, 2016
|
15,416
|
|
|
|
Foreign currency translation
|
369
|
|
|
|
Balance as of December 31, 2017
|
$
|
15,785
|
|
The latest impairment assessment of goodwill was completed in the third quarter of
2017
. As of December 31,
2017
, there were
no
accumulated goodwill impairment losses. Future impairment tests for goodwill will be performed annually in the third quarter, or earlier if impairment indicators exist.
Intangible Assets, Net
The following table summarizes intangible assets:
|
2017
|
2016
|
||||||||||||||||||||||
|
as of December 31 (in millions)
|
Gross
carrying
amount
|
Accumulated
amortization
|
Net
carrying
amount
|
Gross
carrying
amount
|
Accumulated
amortization
|
Net
carrying
amount
|
|||||||||||||||||
|
Definite-lived intangible assets
|
|||||||||||||||||||||||
|
Developed product rights
|
$
|
16,138
|
|
$
|
(4,982
|
)
|
$
|
11,156
|
|
$
|
16,464
|
|
$
|
(4,256
|
)
|
$
|
12,208
|
|
|||||
|
License agreements
|
7,822
|
|
(1,409
|
)
|
6,413
|
|
7,809
|
|
(1,110
|
)
|
6,699
|
|
|||||||||||
|
Total definite-lived intangible assets
|
23,960
|
|
(6,391
|
)
|
17,569
|
|
24,273
|
|
(5,366
|
)
|
18,907
|
|
|||||||||||
|
Indefinite-lived research and development
|
9,990
|
|
—
|
|
9,990
|
|
9,990
|
|
—
|
|
9,990
|
|
|||||||||||
|
Total intangible assets, net
|
$
|
33,950
|
|
$
|
(6,391
|
)
|
$
|
27,559
|
|
$
|
34,263
|
|
$
|
(5,366
|
)
|
$
|
28,897
|
|
|||||
Definite-lived intangible assets are amortized over their estimated useful lives, which range between
2
to
16
years with an average of
12
years for developed product rights and
11
years for license agreements. Amortization expense was
$1.1 billion
in
2017
,
$764 million
in
2016
and
$419 million
in
2015
and was included in cost of products sold in the consolidated statements of earnings. The anticipated annual amortization expense for definite-lived intangible assets recorded as of December 31,
2017
is as follows:
|
(in billions)
|
2018
|
2019
|
2020
|
2021
|
2022
|
||||||||||||||
|
Anticipated annual amortization expense
|
$
|
1.3
|
|
$
|
1.5
|
|
$
|
1.7
|
|
$
|
1.9
|
|
$
|
2.1
|
|
||||
In 2017, an impairment charge of
$354 million
was recorded related to ZINBRYTA that reduced both the gross carrying amount and net carrying amount of the underlying intangible assets due to lower expected future cash flows for the product. In 2016, an impairment charge of
$39 million
was recorded related to certain developed product rights in the United States due to a decline in the market for the product. In 2015,
no
intangible asset impairment charges were recorded. The 2017 and 2016 impairment charges were based on discounted cash flow analyses and were included in cost of products sold in the consolidated statements of earnings.
Indefinite-lived intangible assets represent acquired IPR&D associated with products that have not yet received regulatory approval. Indefinite-lived intangible assets as of
December 31, 2017
and
2016
related to the acquisitions of Stemcentrx and BI compounds. See
Note 5
for additional information. The latest impairment assessment of indefinite-lived intangible assets was completed in the third quarter of
2017
.
No
impairment charges were recorded in
2017
,
2016
and
2015
. Future impairment tests for indefinite-lived intangible assets will be performed annually in the third quarter, or earlier if impairment indicators exist.
|
66
|
2017 Form 10-K
|
||
AbbVie continuously evaluates its operations to identify opportunities to optimize its manufacturing and R&D operations, commercial infrastructure and administrative costs and to respond to changes in its business environment, for example, in conjunction with the loss and expected loss of exclusivity of certain products. As a result, AbbVie management periodically approves individual restructuring plans to achieve these objectives. In
2017
,
2016
and
2015
, no such plans were individually significant. Restructuring charges recorded were
$86 million
in
2017
,
$52 million
in
2016
and
$138 million
in
2015
and were primarily related to employee severance and contractual obligations. These charges were recorded in cost of products sold, R&D expense and SG&A expenses in the consolidated statements of earnings based on classification of the affected employees or operations.
The following summarizes the cash activity in the restructuring reserve for
2017
,
2016
and
2015
:
|
(in millions)
|
|||
|
Accrued balance at December 31, 2014
|
$
|
122
|
|
|
2015 restructuring charges
|
126
|
|
|
|
Payments and other adjustments
|
(100
|
)
|
|
|
Accrued balance at December 31, 2015
|
148
|
|
|
|
2016 restructuring charges
|
52
|
|
|
|
Payments and other adjustments
|
(113
|
)
|
|
|
Accrued balance at December 31, 2016
|
87
|
|
|
|
2017 restructuring charges
|
86
|
|
|
|
Payments and other adjustments
|
(87
|
)
|
|
|
Accrued balance at December 31, 2017
|
$
|
86
|
|
|
2017 Form 10-K
|
67
|
||
The following table summarizes long-term debt:
|
as of December 31 (dollars in millions)
|
Effective
interest rate
in 2017
(a)
|
2017
|
Effective
interest rate
in 2016
(a)
|
2016
|
|||||||||
|
Senior notes issued in 2012
|
|||||||||||||
|
2.00% notes due 2018
|
2.15
|
%
|
1,000
|
|
2.15
|
%
|
1,000
|
|
|||||
|
2.90% notes due 2022
|
2.97
|
%
|
3,100
|
|
2.97
|
%
|
3,100
|
|
|||||
|
4.40% notes due 2042
|
4.46
|
%
|
2,600
|
|
4.46
|
%
|
2,600
|
|
|||||
|
Senior notes issued in 2015
|
|||||||||||||
|
1.80% notes due 2018
|
1.92
|
%
|
3,000
|
|
1.92
|
%
|
3,000
|
|
|||||
|
2.50% notes due 2020
|
2.65
|
%
|
3,750
|
|
2.65
|
%
|
3,750
|
|
|||||
|
3.20% notes due 2022
|
3.28
|
%
|
1,000
|
|
3.28
|
%
|
1,000
|
|
|||||
|
3.60% notes due 2025
|
3.66
|
%
|
3,750
|
|
3.66
|
%
|
3,750
|
|
|||||
|
4.50% notes due 2035
|
4.58
|
%
|
2,500
|
|
4.58
|
%
|
2,500
|
|
|||||
|
4.70% notes due 2045
|
4.73
|
%
|
2,700
|
|
4.73
|
%
|
2,700
|
|
|||||
|
Senior notes issued in 2016
|
|||||||||||||
|
2.30% notes due 2021
|
2.40
|
%
|
1,800
|
|
2.40
|
%
|
1,800
|
|
|||||
|
2.85% notes due 2023
|
2.91
|
%
|
1,000
|
|
2.91
|
%
|
1,000
|
|
|||||
|
3.20% notes due 2026
|
3.28
|
%
|
2,000
|
|
3.28
|
%
|
2,000
|
|
|||||
|
4.30% notes due 2036
|
4.37
|
%
|
1,000
|
|
4.37
|
%
|
1,000
|
|
|||||
|
4.45% notes due 2046
|
4.50
|
%
|
2,000
|
|
4.50
|
%
|
2,000
|
|
|||||
|
Senior Euro notes issued in 2016
|
|||||||||||||
|
0.38% notes due 2019 (€1,400 principal)
|
0.55
|
%
|
1,673
|
|
0.55
|
%
|
1,464
|
|
|||||
|
1.38% notes due 2024 (€1,450 principal)
|
1.46
|
%
|
1,733
|
|
1.46
|
%
|
1,516
|
|
|||||
|
2.13% notes due 2028 (€750 principal)
|
2.18
|
%
|
896
|
|
2.18
|
%
|
784
|
|
|||||
|
Term loan facilities
|
|||||||||||||
|
Floating rate notes due 2018
|
2.26
|
%
|
2,000
|
|
1.64
|
%
|
2,000
|
|
|||||
|
Other
|
|
|
110
|
|
|
|
113
|
|
|||||
|
Fair value hedges
|
(401
|
)
|
(338
|
)
|
|||||||||
|
Unamortized bond discounts
|
(97
|
)
|
(110
|
)
|
|||||||||
|
Unamortized deferred financing costs
|
(146
|
)
|
(164
|
)
|
|||||||||
|
Total long-term debt and lease obligations
|
36,968
|
|
36,465
|
|
|||||||||
|
Current portion
|
6,015
|
|
25
|
|
|||||||||
|
Noncurrent portion
|
$
|
30,953
|
|
$
|
36,440
|
|
|||||||
|
(a)
|
Excludes the effect of any related interest rate swaps.
|
In November 2016, the company issued
€3.6 billion
aggregate principal amount of unsecured senior Euro notes. These senior notes rank equally with all other unsecured and unsubordinated indebtedness of the company. AbbVie may redeem the senior notes prior to maturity at a redemption price equal to the principal amount of the senior notes redeemed plus a make-whole premium. AbbVie may redeem the senior notes at par between
one
and
three
months prior to maturity. In connection with the offering, debt issuance costs totaled
$17 million
and debt discounts incurred totaled
$9 million
and are being amortized over the respective terms of the senior notes to interest expense, net in the consolidated statements of earnings. The company used the proceeds to redeem
$4.0 billion
aggregate principal amount of
1.75%
senior notes that were due to mature in November 2017. As a result of this redemption, the company incurred a charge of
$39 million
(
$25 million
after tax) related to the make-whole premium, write-off of unamortized debt issuance costs and other expenses. The charge was recorded in interest expense, net in the consolidated statement of earnings.
|
68
|
2017 Form 10-K
|
||
In May 2016, the company issued
$7.8 billion
aggregate principal amount of unsecured senior notes. These senior notes rank equally with all other unsecured and unsubordinated indebtedness of the company. AbbVie may redeem the senior notes prior to maturity at a redemption price equal to the principal amount of the senior notes redeemed plus a make-whole premium. AbbVie may redeem the senior notes at par between
one
and
six
months prior to maturity. In connection with the offering, debt issuance costs totaled
$52 million
and debt discounts incurred totaled
$29 million
and are being amortized over the respective terms of the senior notes to interest expense, net in the consolidated statements of earnings. Of the
$7.7 billion
net proceeds,
$2.0 billion
was used to repay the company’s outstanding term loan that was due to mature in November 2016, approximately
$1.9 billion
was used to finance the acquisition of Stemcentrx and approximately
$3.8 billion
was used to finance an ASR with a third party financial institution. See
Note 5
for additional information related to the acquisition of Stemcentrx and
Note 12
for additional information related to the ASR.
In September 2015, AbbVie entered into a
$2.0 billion
three
-year term loan credit agreement and a
$2.0 billion
364
-day term loan credit agreement (collectively, the term loan facilities). In November 2015, AbbVie drew on these term loan facilities and used the proceeds to refinance its
$4.0 billion
of senior notes that matured in November 2015. In connection with the May 2016 unsecured senior notes issuance, AbbVie repaid the
364
-day term loan credit agreement. The borrowings under the term loan facilities bear interest at variable rates which are adjusted based on AbbVie's public debt ratings.
In May 2015, the company issued
$16.7 billion
aggregate principal amount of unsecured senior notes. The senior notes rank equally with all other unsecured and unsubordinated indebtedness of the company. AbbVie may redeem the senior notes prior to maturity at a redemption price equal to the principal amount of the senior notes redeemed plus a make-whole premium and, except for the
1.80%
notes due 2018, AbbVie may redeem the senior notes at par between
one
and
six
months prior to maturity. Debt issuance costs incurred in connection with the offering totaled
$93 million
and are being amortized over the respective terms of the senior notes to interest expense, net in the consolidated statements of earnings. Approximately
$11.5 billion
of the net proceeds were used to finance the acquisition of Pharmacyclics and approximately
$5.0 billion
of the net proceeds were used to finance an ASR with a third party financial institution. See
Note 5
for additional information related to the acquisition of Pharmacyclics and
Note 12
for additional information related to the ASR.
In March 2015, AbbVie entered into an
$18.0 billion
bridge loan in support of the then planned acquisition of Pharmacyclics.
No
amounts were drawn under the bridge loan, which was terminated as a result of the company's May 2015 senior notes issuance. Interest expense, net in 2015 included
$86 million
of costs related to the bridge loan.
AbbVie has outstanding
$6.7 billion
aggregate principal amount of unsecured senior notes which were issued in 2012. AbbVie may redeem all of the senior notes of each series, at any time, or some of the senior notes of each series, from time to time, at a redemption price equal to the principal amount of the senior notes redeemed plus a make-whole premium.
At December 31,
2017
, the company was in compliance with its senior note covenants and term loan covenants.
Short-Term Borrowings
Short-term borrowings included commercial paper borrowings of
$400 million
at December 31,
2017
and
$377 million
at December 31,
2016
. The weighted-average interest rate on commercial paper borrowings was
1.3%
in
2017
,
0.6%
in
2016
and
0.3%
in
2015
.
In October 2014, AbbVie entered into a
$3.0 billion
five
-year revolving credit facility, which matures in October 2019. The revolving credit facility enables the company to borrow funds on an unsecured basis at variable interest rates and contains various covenants. At December 31,
2017
, the company was in compliance with all its credit facility covenants. Commitment fees under AbbVie's revolving credit facilities were insignificant in
2017
,
2016
and
2015
.
No
amounts were outstanding under the credit facility as of
December 31, 2017
and
December 31, 2016
.
|
2017 Form 10-K
|
69
|
||
Maturities of Long-Term Debt and Capital Lease Obligations
The following table summarizes AbbVie's future minimum lease payments under non-cancelable operating leases, debt maturities and future minimum lease payments for capital lease obligations as of December 31,
2017
:
|
as of and for the years ending December 31 (in millions)
|
Operating
leases
|
Debt maturities
and capital leases
|
|||||
|
2018
|
$
|
143
|
|
$
|
6,026
|
|
|
|
2019
|
126
|
|
1,698
|
|
|||
|
2020
|
109
|
|
3,771
|
|
|||
|
2021
|
85
|
|
1,836
|
|
|||
|
2022
|
66
|
|
4,102
|
|
|||
|
Thereafter
|
428
|
|
20,179
|
|
|||
|
Total obligations and commitments
|
957
|
|
37,612
|
|
|||
|
Fair value hedges, unamortized bond discounts and deferred financing costs
|
|
|
(644
|
)
|
|||
|
Total long-term debt and lease obligations
|
$
|
957
|
|
$
|
36,968
|
|
|
Lease expense was
$169 million
in
2017
,
$159 million
in
2016
and
$146 million
in
2015
. AbbVie's operating leases generally include renewal options and provide for the company to pay taxes, maintenance, insurance and other operating costs of the leased property. As of December 31,
2017
, annual future minimum lease payments for capital lease obligations were insignificant.
Contingencies and Guarantees
In connection with the separation, AbbVie has indemnified Abbott for all liabilities resulting from the operation of AbbVie's business other than income tax liabilities with respect to periods prior to the distribution date and other liabilities as agreed to by AbbVie and Abbott. AbbVie has no material exposures to off-balance sheet arrangements and no special-purpose entities. In the ordinary course of business, AbbVie has periodically entered into third-party agreements, such as the assignment of product rights, which have resulted in AbbVie becoming secondarily liable for obligations for which AbbVie had previously been primarily liable. Based upon past experience, the likelihood of payments under these agreements is remote.
Risk Management Policy
The company is exposed to foreign currency exchange rate and interest rate risks related to its business operations. AbbVie's hedging policy attempts to manage these risks to an acceptable level based on the company's judgment of the appropriate trade-off between risk, opportunity and costs. The company uses derivative and nonderivative instruments to reduce its exposure to foreign currency exchange rates. AbbVie also periodically enters into interest rate swaps, in which the company agrees to exchange, at specified intervals, the difference between fixed and floating interest amounts calculated by reference to an agreed-upon notional amount. Derivative instruments are not used for trading purposes or to manage exposure to changes in interest rates for investment securities, and
none
of the company's outstanding derivative instruments contain credit risk related contingent features; collateral is generally not required.
Financial Instruments
Various AbbVie foreign subsidiaries enter into foreign currency forward exchange contracts to manage exposures to changes in foreign exchange rates for anticipated intercompany transactions denominated in a currency other than the functional currency of the local entity. These contracts, with notional amounts totaling
$2.2 billion
at December 31,
2017
and
$2.2 billion
at December 31,
2016
, are designated as cash flow hedges and are recorded at fair value. The durations of these forward exchange contracts were generally less than
eighteen
months. Accumulated gains and losses as of December 31,
2017
will be reclassified from AOCI and included in cost of products sold at the time the products are sold, generally not exceeding
six months
from the date of settlement.
The company also enters into foreign currency forward exchange contracts to manage its exposure to foreign currency denominated trade payables and receivables and intercompany loans. These contracts are not designated as hedges and are recorded at fair value. Resulting gains or losses are reflected in net foreign exchange loss in the consolidated statements of
|
70
|
2017 Form 10-K
|
||
earnings and are generally offset by losses or gains on the foreign currency exposure being managed. These contracts had notional amounts totaling
$7.7 billion
at December 31,
2017
and
$6.6 billion
at December 31,
2016
.
The company also uses foreign currency forward exchange contracts or foreign currency denominated debt to hedge its net investments in certain foreign subsidiaries and affiliates. In the fourth quarter of 2016, the company issued
€3.6 billion
aggregate principal amount of senior Euro notes and designated the principal amounts of this foreign denominated debt as net investment hedges. Concurrently, the company settled foreign currency forward exchange contracts with aggregate notional amounts of
€3.5 billion
that were designated as net investment hedges.
AbbVie is a party to interest rate hedge contracts designated as fair value hedges with notional amounts totaling
$11.8 billion
at December 31,
2017
and
$11.8 billion
at December 31,
2016
. The effect of the hedge contracts is to change a fixed-rate interest obligation to a floating rate for that portion of the debt. AbbVie records the contracts at fair value and adjusts the carrying amount of the fixed-rate debt by an offsetting amount.
The following table summarizes the amounts and location of AbbVie's derivative instruments on the consolidated balance sheets:
|
Fair value -
Derivatives in asset position
|
Fair value -
Derivatives in liability position
|
||||||||||||||
|
as of December 31 (in millions)
|
Balance sheet caption
|
2017
|
2016
|
Balance sheet caption
|
2017
|
2016
|
|||||||||
|
Foreign currency forward exchange contracts
|
|||||||||||||||
|
Designated as cash flow hedges
|
Prepaid expenses and other
|
$
|
1
|
|
$
|
170
|
|
Accounts payable and accrued liabilities
|
$
|
120
|
|
$
|
5
|
|
|
|
Not designated as hedges
|
Prepaid expenses and other
|
22
|
|
55
|
|
Accounts payable and accrued liabilities
|
29
|
|
33
|
|
|||||
|
Interest rate swaps designated as fair value hedges
|
Prepaid expenses and other
|
—
|
|
—
|
|
Accounts payable and accrued liabilities
|
8
|
|
—
|
|
|||||
|
Interest rate swaps designated as fair value hedges
|
Other assets
|
—
|
|
—
|
|
Other long-term liabilities
|
393
|
|
338
|
|
|||||
|
Total derivatives
|
$
|
23
|
|
$
|
225
|
|
|
$
|
550
|
|
$
|
376
|
|
||
While certain derivatives are subject to netting arrangements with the company's counterparties, the company does not offset derivative assets and liabilities within the consolidated balance sheets.
The following table presents the pre-tax amounts of gains (losses) from derivative instruments recognized in other comprehensive loss:
|
2017
|
2016
|
2015
|
||||||||||||||||||||||||||||
|
years ended December 31 (in millions)
|
Cash Flow
Hedges
|
Net Investment Hedges
|
Total
|
Cash Flow
Hedges
|
Net Investment Hedges
|
Total
|
Cash Flow
Hedges |
Net Investment Hedges
|
Total
|
|||||||||||||||||||||
|
Foreign currency forward exchange contracts
|
$
|
(250
|
)
|
$
|
—
|
|
$
|
(250
|
)
|
$
|
174
|
|
$
|
118
|
|
$
|
292
|
|
$
|
122
|
|
$
|
—
|
|
$
|
122
|
|
|||
The amount of hedge ineffectiveness was insignificant for all periods presented. Assuming market rates remain constant through contract maturities, the company expects to transfer pre-tax unrealized losses of
$174 million
into cost of products sold for foreign currency cash flow hedges during the next 12 months.
The company recognized, in other comprehensive loss, pre-tax losses of
$537 million
in
2017
and pre-tax gains of
$101 million
in
2016
related to non-derivative, foreign currency denominated debt designated as net investment hedges.
|
2017 Form 10-K
|
71
|
||
The following table summarizes the pre-tax amounts and location of derivative instrument net gains (losses) recognized in the consolidated statements of earnings, including the effective portions of the net gains (losses) reclassified out of AOCI into net earnings. See
Note 12
for the amount of net gains (losses) reclassified out of AOCI.
|
years ended December 31 (in millions)
|
Statement of earnings caption
|
2017
|
2016
|
2015
|
||||||||
|
Foreign currency forward exchange contracts
|
||||||||||||
|
Designated as cash flow hedges
|
Cost of products sold
|
$
|
118
|
|
$
|
20
|
|
$
|
265
|
|
||
|
Not designated as hedges
|
Net foreign exchange loss
|
(96
|
)
|
6
|
|
(155
|
)
|
|||||
|
Non-designated treasury rate lock agreements
|
Other expense, net
|
—
|
|
(12
|
)
|
—
|
|
|||||
|
Interest rate swaps designated as fair value hedges
|
Interest expense, net
|
(63
|
)
|
(266
|
)
|
108
|
|
|||||
|
Total
|
$
|
(41
|
)
|
$
|
(252
|
)
|
$
|
218
|
|
|||
The gain (loss) related to outstanding interest rate swaps designated as fair value hedges is recognized in interest expense, net and directly offsets the (loss) gain on the underlying hedged item, the fixed-rate debt, resulting in no net impact to interest expense, net for all periods presented.
Fair Value Measures
The fair value hierarchy consists of the following three levels:
|
•
|
Level 1—Valuations based on unadjusted quoted prices in active markets for identical assets that the company has the ability to access;
|
|
•
|
Level 2—Valuations based on quoted prices for similar instruments in active markets, quoted prices for identical or similar instruments in markets that are not active and model-based valuations in which all significant inputs are observable in the market; and
|
|
•
|
Level 3—Valuations using significant inputs that are unobservable in the market and include the use of judgment by the company's management about the assumptions market participants would use in pricing the asset or liability.
|
The following table summarizes the bases used to measure certain assets and liabilities that were carried at fair value on a recurring basis on the consolidated balance sheet as of December 31,
2017
:
|
Basis of fair value measurement
|
|||||||||||||||
|
(in millions)
|
Total
|
Quoted prices in active markets for
identical assets
(Level 1)
|
Significant other
observable
inputs
(Level 2)
|
Significant
unobservable
Inputs
(Level 3)
|
|||||||||||
|
Assets
|
|||||||||||||||
|
Cash and equivalents
|
$
|
9,303
|
|
$
|
849
|
|
$
|
8,454
|
|
$
|
—
|
|
|||
|
Debt securities
|
2,524
|
|
—
|
|
2,524
|
|
—
|
|
|||||||
|
Equity securities
|
4
|
|
4
|
|
—
|
|
—
|
|
|||||||
|
Foreign currency contracts
|
23
|
|
—
|
|
23
|
|
—
|
|
|||||||
|
Total assets
|
$
|
11,854
|
|
$
|
853
|
|
$
|
11,001
|
|
$
|
—
|
|
|||
|
Liabilities
|
|||||||||||||||
|
Interest rate hedges
|
$
|
401
|
|
$
|
—
|
|
$
|
401
|
|
$
|
—
|
|
|||
|
Foreign currency contracts
|
149
|
|
—
|
|
149
|
|
—
|
|
|||||||
|
Contingent consideration
|
4,534
|
|
—
|
|
—
|
|
4,534
|
|
|||||||
|
Total liabilities
|
$
|
5,084
|
|
$
|
—
|
|
$
|
550
|
|
$
|
4,534
|
|
|||
|
72
|
2017 Form 10-K
|
||
The following table summarizes the bases used to measure certain assets and liabilities that were carried at fair value on a recurring basis on the consolidated balance sheet as of December 31,
2016
:
|
Basis of fair value measurement
|
|||||||||||||||
|
(in millions)
|
Total
|
Quoted prices in active markets for
identical assets
(Level 1)
|
Significant other
observable
inputs
(Level 2)
|
Significant
unobservable
Inputs
(Level 3)
|
|||||||||||
|
Assets
|
|||||||||||||||
|
Cash and equivalents
|
$
|
5,100
|
|
$
|
1,191
|
|
$
|
3,909
|
|
$
|
—
|
|
|||
|
Time deposits
|
1,014
|
|
—
|
|
1,014
|
|
—
|
|
|||||||
|
Debt securities
|
1,974
|
|
—
|
|
1,974
|
|
—
|
|
|||||||
|
Equity securities
|
76
|
|
76
|
|
—
|
|
—
|
|
|||||||
|
Foreign currency contracts
|
225
|
|
—
|
|
225
|
|
—
|
|
|||||||
|
Total assets
|
$
|
8,389
|
|
$
|
1,267
|
|
$
|
7,122
|
|
$
|
—
|
|
|||
|
Liabilities
|
|||||||||||||||
|
Interest rate hedges
|
$
|
338
|
|
$
|
—
|
|
$
|
338
|
|
$
|
—
|
|
|||
|
Foreign currency contracts
|
38
|
|
—
|
|
38
|
|
—
|
|
|||||||
|
Contingent consideration
|
4,213
|
|
—
|
|
—
|
|
4,213
|
|
|||||||
|
Total liabilities
|
$
|
4,589
|
|
$
|
—
|
|
$
|
376
|
|
$
|
4,213
|
|
|||
The fair values of time deposits approximate their amortized cost due to the short maturities of these instruments. The fair values of available-for-sale debt securities were determined based on prices obtained from commercial pricing services. Available-for-sale equity securities consists of investments for which the fair values were determined by using the published market price per unit multiplied by the number of units held, without consideration of transaction costs. The derivatives entered into by the company were valued using publicized spot curves for interest rate hedges and publicized forward curves for foreign currency contracts. The fair value measurements of the contingent consideration liabilities were determined based on significant unobservable inputs, including the discount rate, estimated probabilities and timing of achieving specified development, regulatory and commercial milestones and the estimated amount of future sales of the acquired products still in development. Changes to the fair value of the contingent consideration liabilities can result from changes to one or a number of inputs, including discount rates, the probabilities of achieving the milestones, the time required to achieve the milestones and estimated future sales. Significant judgment is employed in determining the appropriateness of these inputs. Changes to the inputs described above could have a material impact on the company's financial position and results of operations in any given period. At December 31,
2017
, a
50 basis point
increase/decrease in the assumed discount rate would have decreased/increased the value of the contingent consideration liabilities by approximately
$170 million
. Additionally, at December 31,
2017
, a
five
percentage point increase/decrease in the assumed probability of success across all potential indications would have increased/decreased the value of the contingent consideration liabilities by approximately
$390 million
.
There have been no transfers of assets or liabilities between the fair value measurement levels. The following table presents the changes in fair value of contingent consideration liabilities which are measured using Level 3 inputs:
|
years ended December 31 (in millions)
|
2017
|
2016
|
||||||
|
Beginning balance
|
$
|
4,213
|
|
$
|
—
|
|
||
|
Additions (See Note 5)
|
—
|
|
3,985
|
|
||||
|
Change in fair value recognized in net earnings
|
626
|
|
228
|
|
||||
|
Milestone payments
|
(305
|
)
|
—
|
|
||||
|
Ending balance
|
$
|
4,534
|
|
$
|
4,213
|
|
||
The change in fair value recognized in net earnings was recorded in other expense, net in the consolidated statements of earnings in
2017
and
2016
.
|
2017 Form 10-K
|
73
|
||
In addition to the financial instruments that the company carries at fair value on the consolidated balance sheets, certain financial instruments are carried at historical cost or some basis other than fair value. The book values, approximate fair values and bases used to measure the approximate fair values of certain financial instruments as of December 31,
2017
are shown in the table below:
|
Basis of fair value measurement
|
||||||||||||||||||
|
(in millions)
|
Book Value
|
Approximate
fair values
|
Quoted prices in active markets for
identical assets
(Level 1)
|
Significant other
observable
inputs
(Level 2)
|
Significant
unobservable
Inputs
(Level 3)
|
|||||||||||||
|
Assets
|
||||||||||||||||||
|
Investments
|
$
|
48
|
|
$
|
48
|
|
$
|
—
|
|
$
|
—
|
|
$
|
48
|
|
|||
|
Total assets
|
$
|
48
|
|
$
|
48
|
|
$
|
—
|
|
$
|
—
|
|
$
|
48
|
|
|||
|
Liabilities
|
||||||||||||||||||
|
Short-term borrowings
|
$
|
400
|
|
$
|
400
|
|
$
|
—
|
|
$
|
400
|
|
$
|
—
|
|
|||
|
Current portion of long-term debt and lease obligations, excluding fair value hedges
|
6,023
|
|
6,034
|
|
4,004
|
|
2,030
|
|
—
|
|
||||||||
|
Long-term debt and lease obligations, excluding fair value hedges
|
31,346
|
|
32,846
|
|
32,763
|
|
83
|
|
—
|
|
||||||||
|
Total liabilities
|
$
|
37,769
|
|
$
|
39,280
|
|
$
|
36,767
|
|
$
|
2,513
|
|
$
|
—
|
|
|||
The book values, approximate fair values and bases used to measure the approximate fair values of certain financial instruments as of December 31,
2016
are shown in the table below:
|
Basis of fair value measurement
|
||||||||||||||||||
|
(in millions)
|
Book Value
|
Approximate
fair values
|
Quoted prices in active markets for
identical assets
(Level 1)
|
Significant other
observable
inputs
(Level 2)
|
Significant
unobservable
Inputs
(Level 3)
|
|||||||||||||
|
Assets
|
||||||||||||||||||
|
Investments
|
$
|
42
|
|
$
|
42
|
|
$
|
—
|
|
$
|
5
|
|
$
|
37
|
|
|||
|
Total assets
|
$
|
42
|
|
$
|
42
|
|
$
|
—
|
|
$
|
5
|
|
$
|
37
|
|
|||
|
Liabilities
|
||||||||||||||||||
|
Short-term borrowings
|
$
|
377
|
|
$
|
377
|
|
$
|
—
|
|
$
|
377
|
|
$
|
—
|
|
|||
|
Current portion of long-term debt and lease obligations, excluding fair value hedges
|
25
|
|
25
|
|
—
|
|
25
|
|
—
|
|
||||||||
|
Long-term debt and lease obligations, excluding fair value hedges
|
36,778
|
|
36,664
|
|
34,589
|
|
2,075
|
|
—
|
|
||||||||
|
Total liabilities
|
$
|
37,180
|
|
$
|
37,066
|
|
$
|
34,589
|
|
$
|
2,477
|
|
$
|
—
|
|
|||
Investments primarily consist of cost method investments, for which the company takes into consideration recent transactions and financial information of the investee, which represents a Level 3 basis of fair value measurement. The fair values of short-term borrowings approximate the carrying values due to the short maturities of these instruments.
The fair values of long-term debt, excluding fair value hedges and the term loans, were determined by using the published market price for the debt instruments, without consideration of transaction costs, which represents a Level 1 basis of fair value measurement. The fair values of the term loans were determined based on a discounted cash flow analysis using quoted market rates, which represents a Level 2 basis of fair value measurement. The counterparties to financial instruments consist of select major international financial institutions.
|
74
|
2017 Form 10-K
|
||
Available-for-sale Securities
Substantially all of the company’s investments in debt and equity securities were classified as available-for-sale. Debt securities classified as short-term were
$482 million
as of
December 31, 2017
and
$309 million
as of
December 31, 2016
. Long-term debt securities mature primarily within
five years
. Estimated fair values of available-for-sale securities were based on prices obtained from commercial pricing services.
The following table summarizes available-for-sale securities by type as of December 31,
2017
:
|
Amortized Cost
|
Gross unrealized
|
Fair Value
|
|||||||||||||
|
(in millions)
|
Gains
|
Losses
|
|||||||||||||
|
Asset backed securities
|
$
|
930
|
|
$
|
1
|
|
$
|
(3
|
)
|
$
|
928
|
|
|||
|
Corporate debt securities
|
1,451
|
|
4
|
|
(2
|
)
|
1,453
|
|
|||||||
|
Other debt securities
|
144
|
|
—
|
|
(1
|
)
|
143
|
|
|||||||
|
Equity securities
|
4
|
|
2
|
|
(2
|
)
|
4
|
|
|||||||
|
Total
|
$
|
2,529
|
|
$
|
7
|
|
$
|
(8
|
)
|
$
|
2,528
|
|
|||
The following table summarizes available-for-sale securities by type as of December 31,
2016
:
|
Amortized Cost
|
Gross unrealized
|
Fair Value
|
|||||||||||||
|
(in millions)
|
Gains
|
Losses
|
|||||||||||||
|
Asset backed securities
|
$
|
891
|
|
$
|
1
|
|
$
|
(4
|
)
|
$
|
888
|
|
|||
|
Corporate debt securities
|
961
|
|
1
|
|
(2
|
)
|
960
|
|
|||||||
|
Other debt securities
|
127
|
|
—
|
|
(1
|
)
|
126
|
|
|||||||
|
Equity securities
|
18
|
|
60
|
|
(2
|
)
|
76
|
|
|||||||
|
Total
|
$
|
1,997
|
|
$
|
62
|
|
$
|
(9
|
)
|
$
|
2,050
|
|
|||
AbbVie had
no
other-than-temporary impairments as of December 31,
2017
. Net realized gains were
$90 million
in
2017
. Net realized gains in
2016
and
2015
were insignificant.
Concentrations of Risk
The company invests excess cash in time deposits, money market funds and debt securities to diversify the concentration of cash among different financial institutions. The company has established credit exposure limits and monitors concentrations of credit risk associated with financial institution deposits.
The functional currency of the company's Venezuela operations is the U.S. dollar due to the hyperinflationary status of the Venezuelan economy. During the first quarter of 2016, in consideration of declining economic conditions in Venezuela and a decline in transactions settled at the official rate, AbbVie determined that its net monetary assets denominated in the Venezuelan bolivar (VEF) were no longer expected to be settled at the official rate of
10
VEF per U.S. dollar, but rather at the Divisa Complementaria (DICOM) rate. Therefore, during the first quarter of 2016, AbbVie recorded a charge of
$298 million
to net foreign exchange loss to revalue its bolivar-denominated net monetary assets using the DICOM rate then in effect of approximately
270
VEF per U.S. dollar. As of December 31,
2017
and
2016
, AbbVie’s net monetary assets in Venezuela were insignificant.
AbbVie continues to do business with foreign governments in certain countries, including Greece, Portugal, Italy and Spain, which have historically experienced challenges in credit and economic conditions. Substantially all of AbbVie’s trade receivables in Greece, Portugal, Italy and Spain are with government health systems. Outstanding governmental receivables in these countries, net of allowances for doubtful accounts, totaled
$255 million
as of December 31,
2017
and
$244 million
as of December 31,
2016
. The company also continues to do business with foreign governments in certain oil-exporting countries that have experienced a deterioration in economic conditions, including Saudi Arabia and Russia, which may result in delays in the collection of receivables. Outstanding governmental receivables related to Saudi Arabia, net of allowances for doubtful accounts, were
$149 million
as of December 31,
2017
and
$122 million
at December 31,
2016
. Outstanding governmental receivables related to Russia, net of allowances for doubtful accounts, were
$152 million
as of December 31,
2017
and
$110 million
as of December 31,
2016
. Global economic conditions and customer-specific factors may require the company to periodically re-evaluate the collectability of its receivables and the company could potentially incur credit losses.
|
2017 Form 10-K
|
75
|
||
Of total net accounts receivable,
three
U.S. wholesalers accounted for
56%
as of December 31,
2017
and
51%
as of December 31,
2016
, and substantially all of AbbVie's net revenues in the United States were to these
three
wholesalers.
HUMIRA (adalimumab) is AbbVie's single largest product and accounted for approximately
65%
of AbbVie's total net revenues in
2017
,
63%
in
2016
and
61%
in
2015
.
AbbVie sponsors various pension and other post-employment benefit plans, including defined benefit, defined contribution and termination indemnity plans, which cover most employees worldwide. In addition, AbbVie provides medical benefits, primarily to eligible retirees in the United States and Puerto Rico, through other post-retirement benefit plans. Net obligations for these plans have been reflected on the consolidated balance sheets as of December 31,
2017
and
2016
.
AbbVie's principal domestic defined benefit plan is the AbbVie Pension Plan. AbbVie made voluntary contributions of
$150 million
in
2017
,
2016
and
2015
to this plan. In 2018, AbbVie plans to make voluntary contributions to its various defined benefit plans in excess of
$750 million
.
The following table summarizes benefit plan information for the global AbbVie-sponsored defined benefit and other post-employment plans:
|
Defined
benefit plans
|
Other
post-employment
plans
|
||||||||||||||
|
as of and for the years ended December 31 (in millions)
|
2017
|
2016
|
2017
|
2016
|
|||||||||||
|
Projected benefit obligations
|
|||||||||||||||
|
Beginning of period
|
$
|
5,829
|
|
$
|
5,387
|
|
$
|
627
|
|
$
|
557
|
|
|||
|
Service cost
|
236
|
|
210
|
|
26
|
|
25
|
|
|||||||
|
Interest cost
|
204
|
|
201
|
|
24
|
|
24
|
|
|||||||
|
Employee contributions
|
2
|
|
1
|
|
—
|
|
—
|
|
|||||||
|
Actuarial loss
|
714
|
|
313
|
|
149
|
|
33
|
|
|||||||
|
Benefits paid
|
(173
|
)
|
(163
|
)
|
(15
|
)
|
(12
|
)
|
|||||||
|
Other, primarily foreign currency translation adjustments
|
173
|
|
(120
|
)
|
2
|
|
—
|
|
|||||||
|
End of period
|
6,985
|
|
5,829
|
|
813
|
|
627
|
|
|||||||
|
Fair value of plan assets
|
|||||||||||||||
|
Beginning of period
|
4,572
|
|
4,174
|
|
—
|
|
—
|
|
|||||||
|
Actual return on plan assets
|
684
|
|
383
|
|
—
|
|
—
|
|
|||||||
|
Company contributions
|
246
|
|
273
|
|
15
|
|
12
|
|
|||||||
|
Employee contributions
|
2
|
|
1
|
|
—
|
|
—
|
|
|||||||
|
Benefits paid
|
(173
|
)
|
(163
|
)
|
(15
|
)
|
(12
|
)
|
|||||||
|
Other, primarily foreign currency translation adjustments
|
68
|
|
(96
|
)
|
—
|
|
—
|
|
|||||||
|
End of period
|
5,399
|
|
4,572
|
|
—
|
|
—
|
|
|||||||
|
Funded status, end of period
|
$
|
(1,586
|
)
|
$
|
(1,257
|
)
|
$
|
(813
|
)
|
$
|
(627
|
)
|
|||
|
Amounts recognized on the consolidated balance sheets
|
|||||||||||||||
|
Other assets
|
$
|
388
|
|
$
|
240
|
|
$
|
—
|
|
$
|
—
|
|
|||
|
Accounts payable and accrued liabilities
|
(32
|
)
|
(25
|
)
|
(15
|
)
|
(14
|
)
|
|||||||
|
Other long-term liabilities
|
(1,942
|
)
|
(1,472
|
)
|
(798
|
)
|
(613
|
)
|
|||||||
|
Net obligation
|
$
|
(1,586
|
)
|
$
|
(1,257
|
)
|
$
|
(813
|
)
|
$
|
(627
|
)
|
|||
|
Actuarial loss, net
|
$
|
2,471
|
|
$
|
2,118
|
|
$
|
320
|
|
$
|
179
|
|
|||
|
Prior service cost (credit)
|
12
|
|
14
|
|
(29
|
)
|
(37
|
)
|
|||||||
|
Accumulated other comprehensive loss
|
$
|
2,483
|
|
$
|
2,132
|
|
$
|
291
|
|
$
|
142
|
|
|||
|
76
|
2017 Form 10-K
|
||
The projected benefit obligations (PBO) in the table above included
$2.0 billion
at December 31,
2017
and
$1.7 billion
at December 31,
2016
, related to international defined benefit plans.
For plans reflected in the table above, the accumulated benefit obligations (ABO) were
$6.3 billion
at December 31,
2017
and
$5.3 billion
at December 31,
2016
. For those plans reflected in the table above in which the ABO exceeded plan assets at December 31,
2017
, the ABO was
$3.8 billion
, the PBO was
$4.4 billion
and aggregate plan assets were
$2.5 billion
.
Amounts Recognized in Other Comprehensive Loss
The following table summarizes the pre-tax gains and losses included in other comprehensive loss:
|
years ended December 31 (in millions)
|
2017
|
2016
|
2015
|
||||||||
|
Defined benefit plans
|
|||||||||||
|
Actuarial loss (gain)
|
$
|
412
|
|
$
|
284
|
|
$
|
(117
|
)
|
||
|
Amortization of actuarial loss and prior service cost
|
(107
|
)
|
(85
|
)
|
(127
|
)
|
|||||
|
Foreign exchange gain (loss)
|
46
|
|
(22
|
)
|
(37
|
)
|
|||||
|
Total pre-tax loss (gain) recognized in other comprehensive loss
|
$
|
351
|
|
$
|
177
|
|
$
|
(281
|
)
|
||
|
Other post-employment plans
|
|||||||||||
|
Actuarial loss (gain)
|
$
|
149
|
|
$
|
33
|
|
$
|
(17
|
)
|
||
|
Amortization of actuarial loss and prior service cost (credit)
|
—
|
|
—
|
|
(2
|
)
|
|||||
|
Total pre-tax loss (gain) recognized in other comprehensive loss
|
$
|
149
|
|
$
|
33
|
|
$
|
(19
|
)
|
||
The pre-tax amount of actuarial loss and prior service cost included in AOCI at December 31,
2017
that is expected to be recognized in net periodic benefit cost in
2018
is
$149 million
for defined benefit plans and
$14 million
for other post-employment plans.
Net Periodic Benefit Cost
|
years ended December 31 (in millions)
|
2017
|
2016
|
2015
|
||||||||
|
Defined benefit plans
|
|||||||||||
|
Service cost
|
$
|
236
|
|
$
|
210
|
|
$
|
227
|
|
||
|
Interest cost
|
204
|
|
201
|
|
219
|
|
|||||
|
Expected return on plan assets
|
(382
|
)
|
(354
|
)
|
(325
|
)
|
|||||
|
Amortization of actuarial loss and prior service cost
|
107
|
|
85
|
|
127
|
|
|||||
|
Net periodic benefit cost
|
$
|
165
|
|
$
|
142
|
|
$
|
248
|
|
||
|
Other post-employment plans
|
|||||||||||
|
Service cost
|
$
|
26
|
|
$
|
25
|
|
$
|
25
|
|
||
|
Interest cost
|
24
|
|
24
|
|
23
|
|
|||||
|
Amortization of actuarial loss and prior service cost
|
—
|
|
—
|
|
2
|
|
|||||
|
Net periodic benefit cost
|
$
|
50
|
|
$
|
49
|
|
$
|
50
|
|
||
Weighted-Average Assumptions Used in Determining Benefit Obligations at the Measurement Date
|
as of December 31
|
2017
|
2016
|
|||
|
Defined benefit plans
|
|||||
|
Discount rate
|
3.4
|
%
|
3.9
|
%
|
|
|
Rate of compensation increases
|
4.5
|
%
|
4.4
|
%
|
|
|
Other post-employment plans
|
|||||
|
Discount rate
|
3.9
|
%
|
4.7
|
%
|
|
|
2017 Form 10-K
|
77
|
||
The assumptions used in calculating the December 31,
2017
measurement date benefit obligations will be used in the calculation of net periodic benefit cost in
2018
.
Weighted-Average Assumptions Used in Determining Net Periodic Benefit Cost
|
years ended December 31
|
2017
|
2016
|
2015
|
|||||
|
Defined benefit plans
|
||||||||
|
Discount rate for determining service cost
|
3.9
|
%
|
4.4
|
%
|
3.9
|
%
|
||
|
Discount rate for determining interest cost
|
3.7
|
%
|
4.0
|
%
|
3.9
|
%
|
||
|
Expected long-term rate of return on plan assets
|
7.8
|
%
|
7.9
|
%
|
7.8
|
%
|
||
|
Expected rate of change in compensation
|
4.4
|
%
|
4.4
|
%
|
4.4
|
%
|
||
|
Other post-employment plans
|
||||||||
|
Discount rate for determining service cost
|
4.9
|
%
|
5.1
|
%
|
4.5
|
%
|
||
|
Discount rate for determining interest cost
|
4.1
|
%
|
4.3
|
%
|
4.5
|
%
|
||
Effective December 31, 2015, AbbVie elected to change the method it uses to estimate the service and interest cost components of net periodic benefit costs. Historically, AbbVie estimated these service and interest cost components of this expense utilizing a single weighted-average discount rate derived from the yield curve used to measure the benefit obligation at the beginning of the period. In late 2015, AbbVie elected to utilize a full yield curve approach in the estimation of these components by applying the specific spot rates along the yield curve used in the determination of the benefit obligation to the relevant projected cash flows. AbbVie elected to make this change to provide a more precise measurement of service and interest costs by improving the correlation between projected benefit cash flows to the corresponding spot yield curve rates. AbbVie accounted for this change prospectively as a change in accounting estimate that is inseparable from a change in accounting principle. This change reduced AbbVie's net periodic benefit cost by approximately
$41 million
in
2016
. This change had
no
effect on the
2015
expense and did not affect the measurement of AbbVie's total benefit obligations.
For the December 31,
2017
post-retirement health care obligations remeasurement, the company assumed a
7.7%
pre-65 (
9.5%
post-65) annual rate of increase in the per capita cost of covered health care benefits. The rate was assumed to decrease gradually to
4.5%
in 2050 and remain at that level thereafter. For purposes of measuring the
2017
post-retirement health care costs, the company assumed a
6.8%
pre-65 (
7.8%
post-65) annual rate of increase in the per capita cost of covered health care benefits. The rate was assumed to decrease gradually to
4.5%
for 2064 and remain at that level thereafter.
Assumed health care cost trend rates have a significant effect on the amounts reported for health care plans. As of December 31,
2017
, a one percentage point change in assumed health care cost trend rates would have the following effects:
|
One percentage point
|
|||||||
|
year ended December 31, 2017 (in millions) (brackets denote a reduction)
|
Increase
|
Decrease
|
|||||
|
Service cost and interest cost
|
$
|
11
|
|
$
|
(9
|
)
|
|
|
Projected benefit obligation
|
183
|
|
(140
|
)
|
|||
|
78
|
2017 Form 10-K
|
||
Defined Benefit Pension Plan Assets
|
Basis of fair value measurement
|
|||||||||||||||
|
as of December 31 (in millions)
|
2017
|
Quoted prices in
active markets for
identical assets
(Level 1)
|
Significant other
observable
inputs
(Level 2)
|
Significant
unobservable
inputs
(Level 3)
|
|||||||||||
|
Equities
|
|||||||||||||||
|
U.S. large cap
(a)
|
$
|
597
|
|
$
|
597
|
|
$
|
—
|
|
$
|
—
|
|
|||
|
U.S. mid cap
(b)
|
74
|
|
74
|
|
—
|
|
—
|
|
|||||||
|
International
(c)
|
63
|
|
63
|
|
—
|
|
—
|
|
|||||||
|
Fixed income securities
|
|||||||||||||||
|
U.S. government securities
(d)
|
110
|
|
6
|
|
104
|
|
—
|
|
|||||||
|
Corporate debt instruments
(d)
|
238
|
|
132
|
|
106
|
|
—
|
|
|||||||
|
Non-U.S. government securities
(d)
|
59
|
|
25
|
|
34
|
|
—
|
|
|||||||
|
Other
(d)
|
265
|
|
260
|
|
5
|
|
—
|
|
|||||||
|
Absolute return funds
(e)
|
262
|
|
4
|
|
258
|
|
—
|
|
|||||||
|
Real assets
|
7
|
|
7
|
|
—
|
|
—
|
|
|||||||
|
Other
(f)
|
40
|
|
40
|
|
—
|
|
—
|
|
|||||||
|
Total
|
$
|
1,715
|
|
$
|
1,208
|
|
$
|
507
|
|
$
|
—
|
|
|||
|
Total assets measured at NAV
|
3,684
|
|
|||||||||||||
|
Fair value of plan assets
|
$
|
5,399
|
|
|
|
|
|
|
|
||||||
|
Basis of fair value measurement
|
|||||||||||||||
|
as of December 31 (in millions)
|
2016
|
Quoted prices in
active markets for
identical assets
(Level 1)
|
Significant other
observable
inputs
(Level 2)
|
Significant
unobservable
inputs
(Level 3)
|
|||||||||||
|
Equities
|
|||||||||||||||
|
U.S. large cap
(a)
|
$
|
519
|
|
$
|
519
|
|
$
|
—
|
|
$
|
—
|
|
|||
|
U.S. mid cap
(b)
|
63
|
|
63
|
|
—
|
|
—
|
|
|||||||
|
International
(c)
|
97
|
|
97
|
|
—
|
|
—
|
|
|||||||
|
Fixed income securities
|
|||||||||||||||
|
U.S. government securities
(d)
|
94
|
|
—
|
|
94
|
|
—
|
|
|||||||
|
Corporate debt instruments
(d)
|
243
|
|
162
|
|
81
|
|
—
|
|
|||||||
|
Non-U.S. government securities
(d)
|
32
|
|
30
|
|
2
|
|
|
|
|||||||
|
Other
(d)
|
184
|
|
179
|
|
5
|
|
—
|
|
|||||||
|
Absolute return funds
(e)
|
228
|
|
3
|
|
225
|
|
—
|
|
|||||||
|
Real assets
|
31
|
|
31
|
|
—
|
|
—
|
|
|||||||
|
Other
(f)
|
61
|
|
61
|
|
—
|
|
—
|
|
|||||||
|
Total
|
$
|
1,552
|
|
$
|
1,145
|
|
$
|
407
|
|
$
|
—
|
|
|||
|
Total assets measured at NAV
|
3,020
|
|
|||||||||||||
|
Fair value of plan assets
|
$
|
4,572
|
|
|
|
|
|
|
|
||||||
|
(a)
|
A mix of index funds and actively managed equity accounts that are benchmarked to various large cap indices.
|
|
(b)
|
A mix of index funds and actively managed equity accounts that are benchmarked to various mid cap indices.
|
|
2017 Form 10-K
|
79
|
||
|
(c)
|
A mix of index funds and actively managed equity accounts that are benchmarked to various non-U.S. equity indices in both developed and emerging markets.
|
|
(d)
|
Securities held by actively managed accounts, index funds and mutual funds.
|
|
(e)
|
Primarily funds having global mandates with the flexibility to allocate capital broadly across a wide range of asset classes and strategies, including but not limited to equities, fixed income, commodities, financial futures, currencies and other securities, with objectives to outperform agreed upon benchmarks of specific return and volatility targets.
|
|
(f)
|
Investments in cash and cash equivalents.
|
Equities and registered investment companies having quoted prices are valued at the published market prices. Fixed income securities that are valued using significant other observable inputs are quoted at prices obtained from independent financial service industry-recognized vendors. Investments held in pooled investment funds, common collective trusts or limited partnerships are valued at the net asset value (NAV) practical expedient to estimate fair value. The NAV is provided by the fund administrator and is based on the value of the underlying assets owned by the fund minus its liabilities.
The investment mix of equity securities, fixed income and other asset allocation strategies is based upon achieving a desired return, balancing higher return, more volatile equity securities and lower return, less volatile fixed income securities. Investment allocations are established for each plan and are generally made across a range of markets, industry sectors, capitalization sizes and in the case of fixed income securities, maturities and credit quality. The target investment allocations for the AbbVie Pension Plan is
35%
in equity securities,
20%
in fixed income securities and
45%
in asset allocation strategies and other holdings. There are no known significant concentrations of risk in the plan assets of the AbbVie Pension Plan or of any other plans.
The expected return on plan assets assumption for each plan is based on management's expectations of long-term average rates of return to be achieved by the underlying investment portfolio. In establishing this assumption, management considers historical and expected returns for the asset classes in which the plans are invested, as well as current economic and capital market conditions.
Expected Benefit Payments
The following table summarizes total benefit payments expected to be paid to plan participants including payments funded from both plan and company assets:
|
years ending December 31 (in millions)
|
Defined
benefit plans
|
Other
post-employment
plans
|
|||||
|
2018
|
$
|
192
|
|
$
|
16
|
|
|
|
2019
|
206
|
|
19
|
|
|||
|
2020
|
218
|
|
20
|
|
|||
|
2021
|
232
|
|
22
|
|
|||
|
2022
|
246
|
|
24
|
|
|||
|
2023 to 2027
|
1,474
|
|
153
|
|
|||
Defined Contribution Plan
AbbVie's principal defined contribution plan is the AbbVie Savings Plan. AbbVie recorded expense of
$82 million
in
2017
,
$75 million
in
2016
and
$73 million
in
2015
related to this plan. AbbVie provides certain other post-employment benefits, primarily salary continuation arrangements, to qualifying employees and accrues for the related cost over the service lives of the employees.
|
80
|
2017 Form 10-K
|
||
Stock-Based Compensation
AbbVie grants stock-based awards to eligible employees pursuant to the AbbVie 2013 Incentive Stock Program (2013 ISP), which provides for several different forms of benefits, including nonqualified stock options, RSAs, RSUs and various performance-based awards. Under the 2013 ISP,
100 million
shares of AbbVie common stock were reserved for issuance as awards to AbbVie employees. The 2013 ISP also facilitated the assumption of certain awards granted under Abbott’s incentive stock program, which were adjusted and converted into Abbott and AbbVie stock-based awards as a result of AbbVie's separation from Abbott.
AbbVie measures compensation expense for stock-based awards based on the grant date fair value of the awards and the estimated number of awards that are expected to vest. Forfeitures are estimated based on historical experience at the time of grant and are revised in subsequent periods if actual forfeitures differ from those estimates. Compensation cost for stock-based awards is amortized over the service period, which could be shorter than the vesting period if an employee is retirement eligible. Retirement eligible employees generally are those who are age
55
or older and have at least
ten years
of service.
Stock-based compensation expense is principally related to awards issued pursuant to the 2013 ISP and is summarized as follows:
|
Years ended December 31,
|
|||||||||||
|
(in millions)
|
2017
|
2016
|
2015
|
||||||||
|
Cost of products sold
|
$
|
23
|
|
$
|
22
|
|
$
|
21
|
|
||
|
Research and development
|
159
|
|
193
|
|
111
|
|
|||||
|
Selling, general and administrative
|
183
|
|
181
|
|
150
|
|
|||||
|
Pre-tax compensation expense
|
365
|
|
396
|
|
282
|
|
|||||
|
Tax benefit
|
73
|
|
104
|
|
89
|
|
|||||
|
After-tax compensation expense
|
$
|
292
|
|
$
|
292
|
|
$
|
193
|
|
||
Stock-based compensation expense for the year ended December 31, 2016 also included the post-combination impact related to Stemcentrx options. See
Note 5
for additional information related to the Stemcentrx acquisition.
The realized excess tax benefits associated with stock-based compensation totaled
$71 million
in
2017
,
$55 million
in
2016
and
$61 million
in
2015
. Beginning in 2017, all excess tax benefits associated with stock-based awards are recognized in the statement of earnings when the awards vest or settle, rather than in stockholders' equity as a result of the adoption of a new accounting pronouncement. See Note 2 for additional information regarding the adoption of this new accounting pronouncement.
Stock Options
Stock options awarded pursuant to the 2013 ISP typically have a contractual term of
10
years and generally vest in one-third increments over a
three
-year period. The exercise price is equal to at least
100%
of the market value on the date of grant. The fair value is determined using the Black-Scholes model. The weighted-average grant-date fair values of stock options granted were
$9.80
in
2017
,
$9.29
in
2016
and
$9.96
in
2015
.
|
2017 Form 10-K
|
81
|
||
The following table summarizes AbbVie stock option activity in
2017
:
|
(options in thousands, aggregate intrinsic value in millions)
|
Options
|
Weighted-
average
exercise price
|
Weighted-
average
remaining
life (in years)
|
Aggregate
intrinsic value
|
||||||||
|
Outstanding at December 31, 2016
|
15,962
|
|
$
|
33.63
|
|
3.7
|
$
|
463
|
|
|||
|
Granted
|
1,241
|
|
61.36
|
|
||||||||
|
Exercised
|
(8,836
|
)
|
30.06
|
|
||||||||
|
Lapsed
|
(51
|
)
|
32.58
|
|
||||||||
|
Outstanding at December 31, 2017
|
8,316
|
|
$
|
41.69
|
|
5.1
|
$
|
458
|
|
|||
|
Exercisable at December 31, 2017
|
5,661
|
|
$
|
35.51
|
|
3.6
|
$
|
346
|
|
|||
The total intrinsic value of options exercised was
$371 million
in
2017
,
$325 million
in
2016
and
$216 million
in
2015
. The total fair value of options vested during
2017
was
$32 million
. On June 1, 2016, AbbVie issued stock options for
1.1 million
AbbVie shares to holders of unvested Stemcentrx options as a result of the conversion of such options in connection with the Stemcentrx acquisition. These options were fair-valued using a lattice valuation model. See
Note 5
for additional information related to the Stemcentrx acquisition.
As of December 31,
2017
,
$14 million
of unrecognized compensation cost related to stock options is expected to be recognized as expense over approximately the next
two years
.
RSAs, RSUs and Performance Shares
RSUs awarded to employees other than senior executives and other key employees pursuant to the 2013 ISP generally vest in one-third increments over a
three
year period. Recipients of these RSUs are entitled to receive dividend equivalents as dividends are declared and paid during the RSU vesting period.
The majority of the equity awards AbbVie grants to its senior executives and other key employees under the 2013 ISP are performance-based. Such awards granted before 2016 consisted of RSAs (or RSUs to the extent necessary for global employees) that generally vest in one-third increments over a
three
-to-
five
year period, with vesting contingent upon AbbVie achieving a minimum annual return on equity (ROE). Recipients are entitled to receive dividends (or dividend equivalents for RSUs) as dividends are declared and paid during the award vesting period.
In 2016, AbbVie redesigned certain aspects of its long-term incentive program. As a result, equity awards granted in 2016 and
2017
to senior executives and other key employees consisted of a combination of performance-vested RSUs and performance shares. The performance-vested RSUs have the potential to vest in one-third increments during a
three
-year performance period based on AbbVie’s ROE relative to a defined peer group of pharmaceutical, biotech and life sciences companies. The recipient may receive
one
share of AbbVie common stock for each vested award. The performance shares have the potential to vest over a
three
-year performance period and may be earned based on AbbVie’s EPS achievement and AbbVie’s total stockholder return (TSR) (a market condition) relative to a defined peer group of pharmaceutical, biotech and life sciences companies. Dividend equivalents on performance-vested RSUs and performance shares accrue during the performance period and are payable at vesting only to the extent that shares are earned.
The weighted-average grant-date fair value of RSAs, RSUs and performance shares generally is determined based on the number of shares/units granted and the quoted price of AbbVie’s common stock on the date of grant. The weighted-average grant-date fair values of performance shares with a TSR market condition are determined using the Monte Carlo simulation model.
|
82
|
2017 Form 10-K
|
||
The following table summarizes AbbVie RSA, RSU and performance share activity for
2017
:
|
(share units in thousands)
|
Share units
|
Weighted-average
grant date fair value
|
||||
|
Outstanding at December 31, 2016
|
10,715
|
|
$
|
56.47
|
|
|
|
Granted
|
6,109
|
|
61.89
|
|
||
|
Vested
|
(5,532
|
)
|
56.34
|
|
||
|
Forfeited
|
(610
|
)
|
59.50
|
|
||
|
Outstanding at December 31, 2017
|
10,682
|
|
$
|
59.47
|
|
|
The fair market value of RSAs, RSUs and performance shares (as applicable) vested was
$348 million
in
2017
,
$362 million
in
2016
and
$335 million
in
2015
.
As of December 31,
2017
,
$250 million
of unrecognized compensation cost related to RSAs, RSUs and performance shares is expected to be recognized as expense over approximately the next
two
years.
Cash Dividends
The following table summarizes quarterly cash dividends declared for the years ended December 31,
2017
and
2016
:
|
2017
|
2016
|
|||||||||
|
Date Declared
|
Payment Date
|
Dividend Per Share
|
Date Declared
|
Payment Date
|
Dividend Per Share
|
|||||
|
10/27/17
|
02/15/18
|
$0.71
|
10/28/16
|
02/15/17
|
$0.64
|
|||||
|
09/08/17
|
11/15/17
|
$0.64
|
09/09/16
|
11/15/16
|
$0.57
|
|||||
|
06/22/17
|
08/15/17
|
$0.64
|
06/16/16
|
08/15/16
|
$0.57
|
|||||
|
02/16/17
|
05/15/17
|
$0.64
|
02/18/16
|
05/16/16
|
$0.57
|
|||||
On February 15, 2018, AbbVie announced that its board of directors declared an increase in the company's quarterly cash dividend from
$0.71
per share to
$0.96
per share beginning with the dividend payable on May 15, 2018 to stockholders of record as of April 13, 2018.
Stock Repurchase Program
The company's stock repurchase authorization permits purchases of AbbVie shares from time to time in open-market or private transactions at management’s discretion. The program has no time limit and can be discontinued at any time. Shares repurchased under these programs are recorded at acquisition cost, including related expenses and are available for general corporate purposes. AbbVie's board of directors authorized increases to its existing stock repurchase program of
$4.0 billion
in April 2016 in anticipation of executing an ASR in connection with the Stemcentrx acquisition and of
$5.0 billion
in March 2015 in anticipation of executing an ASR in connection with the Pharmacyclics acquisition. The following table shows details about AbbVie’s ASR transactions:
|
(shares in millions, repurchase amounts in billions)
|
||||||
|
Execution date
|
Purchase amount
|
Initial delivery of shares
|
Final delivery of shares
|
Related acquisition
|
||
|
05/26/15
|
$5.0
|
68.1
|
5.0
|
Pharmacyclics
|
||
|
06/01/16
|
3.8
|
54.4
|
5.4
|
Stemcentrx
|
||
On February 16, 2017, AbbVie's board of directors authorized a
$5.0 billion
increase to AbbVie's existing stock repurchase program. AbbVie's remaining share repurchase authorization was
$4.0 billion
as of December 31,
2017
.
On February 15, 2018, AbbVie's board of directors authorized a new
$10.0 billion
stock repurchase program, which superseded AbbVie's previous stock repurchase program.
The new stock repurchase program permits purchases of AbbVie shares from time to time in open-market or private transactions, including accelerated share repurchases, at management’s discretion. The program has no time limit and can be discontinued at any time.
|
2017 Form 10-K
|
83
|
||
In addition to the ASRs, AbbVie repurchased on the open market approximately
13 million
shares for
$1.0 billion
in
2017
,
34 million
shares for
$2.1 billion
in
2016
and
46 million
shares for
$2.8 billion
in
2015
.
Accumulated Other Comprehensive Loss
The following table summarizes the changes in each component of AOCI, net of tax, for
2017
,
2016
and
2015
:
|
(in millions) (brackets denote losses)
|
Foreign
currency
translation
adjustments
|
Net investment hedging
activities
|
Pension
and post-
employment
benefits
|
Marketable security activities
|
Cash flow hedging
activities
|
Total
|
|||||||||||||||||
|
Balance as of December 31, 2014
|
$
|
(603
|
)
|
$
|
—
|
|
$
|
(1,608
|
)
|
$
|
3
|
|
$
|
177
|
|
$
|
(2,031
|
)
|
|||||
|
Other comprehensive income (loss) before
reclassifications
|
(667
|
)
|
—
|
|
147
|
|
48
|
|
122
|
|
(350
|
)
|
|||||||||||
|
Net losses (gains) reclassified from accumulated other comprehensive loss
|
—
|
|
—
|
|
83
|
|
(4
|
)
|
(259
|
)
|
(180
|
)
|
|||||||||||
|
Net current-period other comprehensive
income (loss)
|
(667
|
)
|
—
|
|
230
|
|
44
|
|
(137
|
)
|
(530
|
)
|
|||||||||||
|
Balance as of December 31, 2015
|
(1,270
|
)
|
—
|
|
(1,378
|
)
|
47
|
|
40
|
|
(2,561
|
)
|
|||||||||||
|
Other comprehensive income (loss) before
reclassifications
|
(165
|
)
|
140
|
|
(194
|
)
|
7
|
|
160
|
|
(52
|
)
|
|||||||||||
|
Net losses (gains) reclassified from accumulated other comprehensive loss
|
—
|
|
—
|
|
59
|
|
(8
|
)
|
(24
|
)
|
27
|
|
|||||||||||
|
Net current-period other comprehensive
income (loss)
|
(165
|
)
|
140
|
|
(135
|
)
|
(1
|
)
|
136
|
|
(25
|
)
|
|||||||||||
|
Balance as of December 31, 2016
|
(1,435
|
)
|
140
|
|
(1,513
|
)
|
46
|
|
176
|
|
(2,586
|
)
|
|||||||||||
|
Other comprehensive income (loss) before
reclassifications
|
680
|
|
(343
|
)
|
(480
|
)
|
29
|
|
(230
|
)
|
(344
|
)
|
|||||||||||
|
Net losses (gains) reclassified from
accumulated other comprehensive loss
|
316
|
|
—
|
|
74
|
|
(75
|
)
|
(112
|
)
|
203
|
|
|||||||||||
|
Net current-period other comprehensive
income (loss)
|
996
|
|
(343
|
)
|
(406
|
)
|
(46
|
)
|
(342
|
)
|
(141
|
)
|
|||||||||||
|
Balance as of December 31, 2017
|
$
|
(439
|
)
|
$
|
(203
|
)
|
$
|
(1,919
|
)
|
$
|
—
|
|
$
|
(166
|
)
|
$
|
(2,727
|
)
|
|||||
In 2017, AbbVie reclassified
$316 million
of historical currency translation losses from AOCI related to the liquidation of certain foreign entities following the enactment of U.S. tax reform. These losses were included in net foreign exchange loss in the consolidated statement of earnings and had
no
related income tax impacts. Other comprehensive loss in 2017 also included foreign currency translation adjustments totaling a gain of
$680 million
, which was principally due to the impact of the strengthening of the Euro on the translation of the company’s Euro-denominated assets. Other comprehensive loss in 2016 included foreign currency translation adjustments totaling a loss of
$165 million
, which was principally due to the impact of the weakening of the Euro on the translation of the company’s Euro-denominated assets. Other comprehensive loss in 2015 included foreign currency translation adjustments totaling a loss of
$667 million
, which was principally driven by the impact of the weakening of the Euro on the translation of the company's Euro-denominated assets.
|
84
|
2017 Form 10-K
|
||
The table below presents the impact on AbbVie's consolidated statements of earnings for significant amounts reclassified out of each component of accumulated other comprehensive loss:
|
years ended December 31 (in millions) (brackets denote gains)
|
2017
|
2016
|
2015
|
||||||||
|
Pension and post-employment benefits
|
|||||||||||
|
Amortization of actuarial losses and other
(a)
|
$
|
107
|
|
$
|
85
|
|
$
|
129
|
|
||
|
Tax benefit
|
(33
|
)
|
(26
|
)
|
(46
|
)
|
|||||
|
Total reclassifications, net of tax
|
$
|
74
|
|
$
|
59
|
|
$
|
83
|
|
||
|
Cash flow hedging activities
|
|||||||||||
|
Losses (gains) on designated cash flow hedges
(b)
|
$
|
(118
|
)
|
$
|
(20
|
)
|
$
|
(265
|
)
|
||
|
Tax expense (benefit)
|
6
|
|
(4
|
)
|
6
|
|
|||||
|
Total reclassifications, net of tax
|
$
|
(112
|
)
|
$
|
(24
|
)
|
$
|
(259
|
)
|
||
|
(a)
|
Amounts are included in the computation of net periodic benefit cost (see
Note 11
).
|
|
(b)
|
Amounts are included in cost of products sold (see
Note 10
).
|
Other
In addition to common stock, AbbVie's authorized capital includes
200 million
shares of preferred stock, par value
$0.01
. As of December 31,
2017
,
no
shares of preferred stock were issued or outstanding.
Earnings Before Income Tax Expense
|
years ended December 31 (in millions)
|
2017
|
|
2016
|
|
2015
|
||||||
|
Domestic
|
$
|
(2,678
|
)
|
$
|
(1,651
|
)
|
$
|
(1,038
|
)
|
||
|
Foreign
|
10,405
|
|
9,535
|
|
7,683
|
|
|||||
|
Total earnings before income tax expense
|
$
|
7,727
|
|
$
|
7,884
|
|
$
|
6,645
|
|
||
Income Tax Expense
|
years ended December 31 (in millions)
|
2017
|
2016
|
2015
|
||||||||
|
Current
|
|||||||||||
|
Domestic
|
$
|
6,204
|
|
$
|
2,229
|
|
$
|
1,036
|
|
||
|
Foreign
|
376
|
|
498
|
|
313
|
|
|||||
|
Total current taxes
|
$
|
6,580
|
|
$
|
2,727
|
|
$
|
1,349
|
|
||
|
Deferred
|
|||||||||||
|
Domestic
|
$
|
(4,898
|
)
|
$
|
(792
|
)
|
$
|
141
|
|
||
|
Foreign
|
736
|
|
(4
|
)
|
11
|
|
|||||
|
Total deferred taxes
|
$
|
(4,162
|
)
|
$
|
(796
|
)
|
$
|
152
|
|
||
|
Total income tax expense
|
$
|
2,418
|
|
$
|
1,931
|
|
$
|
1,501
|
|
||
Impacts Related to U.S. Tax Reform
The Tax Cuts and Jobs Act (the “Act”) was signed into law in December 2017, resulting in significant changes to the U.S. corporate tax system. The Act reduces the U.S. federal corporate tax rate from
35%
to
21%
, requires companies to pay a one-time transition tax on a mandatory deemed repatriation of earnings of certain foreign subsidiaries that were previously untaxed and creates new taxes on certain foreign sourced earnings. These changes are effective beginning in 2018.
|
2017 Form 10-K
|
85
|
||
Prior to the enactment of the Act, the company did not provide deferred income taxes on undistributed earnings of foreign subsidiaries that were indefinitely reinvested for continued use in foreign operations. Due to the provision of the Act that requires a one-time deemed repatriation of earnings of foreign subsidiaries, the company no longer considers those earnings to be indefinitely reinvested. The transition tax expense on the one-time mandatory repatriation of previously untaxed earnings of foreign subsidiaries was
$4.5 billion
, generally payable in eight annual installments.
Additionally, the company remeasured certain deferred tax assets and liabilities based on tax rates at which they are expected to reverse in the future. The net tax benefit of U.S. tax reform from the remeasurement of deferred taxes related to the Act and foreign tax law changes was
$3.6 billion
.
Given the complexity of the Act and anticipated guidance from the U.S. Treasury about implementing the Act, the company’s analysis and accounting for the tax effects of the Act is preliminary. As a direct result of the Act, the company recorded
$4.5 billion
of transition tax expense, as well as
$4.1 billion
of net tax benefit for deferred tax remeasurement. Both of these amounts are provisional estimates, as the company has not fully completed its analysis and calculation of foreign earnings subject to the transition tax or its analysis of certain other aspects of the Act that could result in adjustments to the remeasurement of deferred tax balances. Upon completion of the analysis in 2018, these estimates may be adjusted through income tax expense in the consolidated statement of earnings.
Effective Tax Rate Reconciliation
|
years ended December 31
|
2017
|
|
2016
|
|
2015
|
|||
|
Statutory tax rate
|
35.0
|
%
|
35.0
|
%
|
35.0
|
%
|
||
|
Effect of foreign operations
|
(12.2
|
)
|
(10.3
|
)
|
(9.4
|
)
|
||
|
U.S. tax credits
|
(4.0
|
)
|
(4.4
|
)
|
(4.5
|
)
|
||
|
Impacts related to U.S. tax reform
|
12.0
|
|
—
|
|
—
|
|
||
|
Tax law change related to foreign currency
|
—
|
|
2.4
|
|
—
|
|
||
|
All other, net
|
0.5
|
|
1.8
|
|
1.5
|
|
||
|
Effective tax rate
|
31.3
|
%
|
24.5
|
%
|
22.6
|
%
|
||
The effective income tax rate fluctuates year to year due to the allocation of the company's taxable earnings among jurisdictions, as well as certain discrete factors and events in each year, including changes in tax law, acquisitions and collaborations. The effective income tax rates in
2017
,
2016
and
2015
differed from the statutory tax rate principally due to changes in enacted tax rates and laws, the benefit from foreign operations which reflects the impact of lower income tax rates in locations outside the United States, tax incentives in Puerto Rico and other foreign tax jurisdictions, business development activities and the cost of repatriation decisions. The effective tax rates for these periods also reflected the benefit from U.S. tax credits principally related to research and development credits, the orphan drug tax credit and Puerto Rico excise tax credits. The Puerto Rico excise tax credits relate to legislation enacted by Puerto Rico that assesses an excise tax on certain products manufactured in Puerto Rico. The tax is levied on gross inventory purchases from entities in Puerto Rico and is included in cost of products sold in the consolidated statements of earnings. The majority of the tax is creditable for U.S. income tax purposes.
The effective income tax rate in 2017 included impacts related to U.S. tax reform. In addition, in 2017, the company recognized a net tax benefit of
$91 million
related to the resolution of various tax positions pertaining to prior years.
The effective income tax rate in 2016 included additional expense of
$187 million
related to the recognition of the tax effect of regulations issued by the Internal Revenue Service on December 7, 2016 that changed the determination of the U.S. taxability of foreign currency gains and losses related to certain foreign operations.
The effective income tax rate in 2015 included a tax benefit of
$103 million
from a reduction of state valuation allowances.
|
86
|
2017 Form 10-K
|
||
Deferred Tax Assets and Liabilities
|
as of December 31 (in millions)
|
2017
|
2016
|
|||||
|
Deferred tax assets
|
|||||||
|
Compensation and employee benefits
|
$
|
556
|
|
$
|
718
|
|
|
|
Accruals and reserves
|
315
|
|
425
|
|
|||
|
Chargebacks and rebates
|
305
|
|
473
|
|
|||
|
Deferred revenue
|
219
|
|
391
|
|
|||
|
Net operating losses and other credit carryforwards
|
208
|
|
151
|
|
|||
|
Other
|
429
|
|
289
|
|
|||
|
Total deferred tax assets
|
2,032
|
|
2,447
|
|
|||
|
Valuation allowances
|
(108
|
)
|
(76
|
)
|
|||
|
Total net deferred tax assets
|
1,924
|
|
2,371
|
|
|||
|
Deferred tax liabilities
|
|||||||
|
Excess of book basis over tax basis of intangible assets
|
(3,762
|
)
|
(5,487
|
)
|
|||
|
Excess of book basis over tax basis in investments
|
(181
|
)
|
(3,367
|
)
|
|||
|
Other
|
(203
|
)
|
(182
|
)
|
|||
|
Total deferred tax liabilities
|
(4,146
|
)
|
(9,036
|
)
|
|||
|
Net deferred tax liabilities
|
$
|
(2,222
|
)
|
$
|
(6,665
|
)
|
|
The decreases in deferred tax assets and liabilities were primarily due to the enactment of the U.S. tax reform that reduced the U.S. federal corporate tax rate from
35%
to
21%
and created a territorial tax system, which will generally allow repatriation of future foreign sourced earnings without incurring additional U.S. taxes. The Act also created a minimum tax on certain foreign sourced earnings. The taxability of the foreign sourced earnings and the applicable tax rates are dependent on future events. While the company is still evaluating its accounting policy for the minimum tax on foreign sourced earnings, the provisional estimates of the tax effects of the Act were reported on the basis that the minimum tax will be recognized in tax expense in the year it is incurred as a period expense.
As of December 31,
2017
, gross state net operating losses were
$1.2 billion
and tax credit carryforwards were
$228 million
. The state tax carryforwards expire between 2018 and 2038. As of
December 31, 2017
, foreign net operating loss carryforwards were
$209 million
. Foreign net operating loss carryforwards of
$155 million
expire between 2018 and 2027 and the remaining do not have an expiration period.
The company had valuation allowances of
$108 million
as of December 31,
2017
and
$76 million
as of December 31,
2016
. These were principally related to state net operating losses and credit carryforwards that are not expected to be realized.
Current income taxes receivable were
$2.1 billion
as of December 31,
2017
and
$347 million
as of December 31,
2016
and were included in prepaid expenses and other on the consolidated balance sheets.
Unrecognized Tax Benefits
|
years ended December 31 (in millions)
|
2017
|
2016
|
2015
|
||||||||
|
Beginning balance
|
$
|
1,168
|
|
$
|
954
|
|
$
|
421
|
|
||
|
Increase due to current year tax positions
|
1,768
|
|
118
|
|
187
|
|
|||||
|
Increase due to prior year tax positions
|
16
|
|
111
|
|
369
|
|
|||||
|
Decrease due to prior year tax positions
|
(2
|
)
|
(7
|
)
|
(15
|
)
|
|||||
|
Settlements
|
(233
|
)
|
—
|
|
—
|
|
|||||
|
Lapse of statutes of limitations
|
(16
|
)
|
(8
|
)
|
(8
|
)
|
|||||
|
Ending balance
|
$
|
2,701
|
|
$
|
1,168
|
|
$
|
954
|
|
||
|
2017 Form 10-K
|
87
|
||
AbbVie and Abbott entered into a tax sharing agreement, effective on the date of separation, which provides that Abbott is liable for and has indemnified AbbVie against all income tax liabilities for periods prior to the separation. AbbVie will be responsible for unrecognized tax benefits and related interest and penalties for periods after separation or in instances where an existing entity was transferred to AbbVie upon separation.
If recognized, the net amount of potential tax benefits that would impact the company's effective tax rate is
$2.6 billion
in
2017
and
$1.1 billion
in
2016
. Of the unrecognized tax benefits recorded in the table above as of December 31,
2017
, AbbVie would be indemnified for approximately
$85 million
. The “Increases due to current year tax positions” in the table above includes amounts related to federal, state and international tax items, including a provisional estimate of the remeasurement of unrecognized tax benefits related to earnings of foreign subsidiaries following the enactment of U.S. tax reform in 2017. The "Increase due to prior year tax positions" in the table above includes amounts relating to federal, state and international items as well as prior positions acquired through business development activities during the year. Uncertain tax positions are generally included as a long-term liability on the consolidated balance sheets.
AbbVie recognizes interest and penalties related to income tax matters in income tax expense in the consolidated statements of earnings. AbbVie recognized gross income tax expense of
$24 million
in
2017
,
$35 million
in
2016
and
$13 million
in
2015
, for interest and penalties related to income tax matters. AbbVie had an accrual for the payment of gross interest and penalties of
$120 million
at December 31,
2017
,
$112 million
at December 31,
2016
and
$83 million
at December 31,
2015
.
The company is routinely audited by the tax authorities in significant jurisdictions and a number of audits are currently underway. It is reasonably possible during the next twelve months that uncertain tax positions may be settled, which could result in a decrease in the gross amount of unrecognized tax benefits. Due to the potential for resolution of federal, state and foreign examinations and the expiration of various statutes of limitation, the company's gross unrecognized tax benefits balance may change within the next twelve months up to
$31 million
. All significant federal, state, local and international matters have been concluded for years through 2008. The company believes adequate provision has been made for all income tax uncertainties.
AbbVie is subject to contingencies, such as various claims, legal proceedings and investigations regarding product liability, intellectual property, commercial, securities and other matters that arise in the normal course of business. Loss contingency provisions are recorded for probable losses at management’s best estimate of a loss, or when a best estimate cannot be made, a minimum loss contingency amount within a probable range is recorded. The recorded accrual balance for litigation was approximately
$445 million
as of December 31,
2017
and approximately
$225 million
at December 31,
2016
. Initiation of new legal proceedings or a change in the status of existing proceedings may result in a change in the estimated loss accrued by AbbVie. While it is not feasible to predict the outcome of all proceedings and exposures with certainty, management believes that their ultimate disposition should not have a material adverse effect on AbbVie’s consolidated financial position, results of operations or cash flows.
Subject to certain exceptions specified in the separation agreement by and between Abbott and AbbVie, AbbVie assumed the liability for, and control of, all pending and threatened legal matters related to its business, including liabilities for any claims or legal proceedings related to products that had been part of its business, but were discontinued prior to the distribution, as well as assumed or retained liabilities, and will indemnify Abbott for any liability arising out of or resulting from such assumed legal matters.
Several pending lawsuits filed against Unimed Pharmaceuticals, Inc., Solvay Pharmaceuticals, Inc. (a company Abbott acquired in February 2010 and now known as AbbVie Products LLC) and others are consolidated for pre-trial purposes in the United States District Court for the Northern District of Georgia under the Multi-District Litigation (MDL) Rules as In re: AndroGel Antitrust Litigation, MDL No. 2084. These cases, brought by private plaintiffs and the Federal Trade Commission (FTC), generally allege Solvay's patent litigation involving AndroGel was sham litigation and the 2006 patent litigation settlement agreements and related agreements with
three
generic companies violate federal antitrust laws. Plaintiffs generally seek monetary damages and/or injunctive relief and attorneys' fees. These cases include: (a)
four
individual plaintiff lawsuits; (b)
three
purported class actions; and (c) Federal Trade Commission v. Actavis, Inc. et al. Following the district court's dismissal of all plaintiffs' claims, appellate proceedings led to the reinstatement of the claims regarding the patent litigation settlements, which are proceeding in the district court.
|
88
|
2017 Form 10-K
|
||
Lawsuits are pending against AbbVie and others generally alleging that the 2005 patent litigation settlement involving Niaspan entered into between Kos Pharmaceuticals, Inc. (a company acquired by Abbott in 2006 and presently a subsidiary of AbbVie) and a generic company violates federal and state antitrust laws and state unfair and deceptive trade practices and unjust enrichment laws. Plaintiffs generally seek monetary damages and/or injunctive relief and attorneys' fees. The lawsuits consist of
four
individual plaintiff lawsuits and
two
consolidated purported class actions: one brought by
three
named direct purchasers of Niaspan and the other brought by
ten
named end-payer purchasers of Niaspan. The cases are consolidated for pre-trial proceedings in the United States District Court for the Eastern District of Pennsylvania under the MDL Rules as In re: Niaspan Antitrust Litigation, MDL No. 2460. In October 2016, the State of California filed a lawsuit regarding the Niaspan patent litigation settlement in Orange County Superior Court, asserting a claim under the unfair competition provision of the California Business and Professions Code seeking injunctive relief, restitution, civil penalties and attorneys’ fees.
In September 2014, the FTC filed suit in the United States District Court for the Eastern District of Pennsylvania against AbbVie and others, alleging that the 2011 patent litigation with
two
generic companies regarding AndroGel was sham litigation and the patent litigation settlement with one of those generic companies violates federal antitrust laws. The FTC's complaint seeks monetary damages and injunctive relief. In May 2015, the court dismissed the FTC's claim regarding the patent litigation settlement.
In March 2015, the State of Louisiana filed a lawsuit, State of Louisiana v. Fournier Industrie et Sante, et al., against AbbVie, Abbott and affiliated Abbott entities in Louisiana state court. Plaintiff alleges that patent applications and patent litigation filed and other alleged conduct from the early 2000's and before related to the drug TriCor violated Louisiana State antitrust and unfair trade practices laws. The lawsuit seeks monetary damages and attorneys' fees.
In November 2014, a putative class action lawsuit, Medical Mutual of Ohio v. AbbVie Inc., et al., was filed against several manufacturers of testosterone replacement therapies (TRTs), including AbbVie, in the United States District Court for the Northern District of Illinois on behalf of all insurance companies, health benefit providers, and other third party payers who paid for TRTs, including AndroGel. The claims asserted include violations of the federal RICO Act and state consumer fraud and deceptive trade practices laws. The complaint seeks monetary damages and injunctive relief.
Product liability cases are pending in which plaintiffs generally allege that AbbVie and other manufacturers of TRTs did not adequately warn about risks of certain injuries, primarily heart attacks, strokes and blood clots. Approximately
4,300
claims are consolidated for pre-trial purposes in the United States District Court for the Northern District of Illinois under the MDL Rules as In re: Testosterone Replacement Therapy Products Liability Litigation, MDL No. 2545. Approximately
210
claims are pending in various state courts. Plaintiffs generally seek compensatory and punitive damages. In July 2017, a jury in the United States District Court for the Northern District of Illinois reached a verdict in the first case to be tried. The jury found for AbbVie on the plaintiff's strict liability and negligence claims and for the plaintiff on the plaintiff's fraud claim. The jury awarded no compensatory damages, but did award plaintiffs
$150 million
in punitive damages. In December 2017, the court vacated the jury’s verdict and punitive damage award on the fraud claim and ordered a new trial on that claim. In a second case, a jury in the United States District Court for the Northern District of Illinois reached a verdict for AbbVie in August 2017 on all claims, which is the subject of post-trial proceedings. In another case, a jury in the United States District Court for the Northern District of Illinois reached a verdict for AbbVie in October 2017 on strict liability but for the plaintiff on remaining claims and awarded
$140,000
in compensatory damages and
$140 million
in punitive damages, which is the subject of post-trial proceedings. In a separate case, a jury in the United States District Court for the Northern District of Illinois reached a verdict for AbbVie in January 2018 on all claims.
Product liability cases are pending in which plaintiffs generally allege that AbbVie did not adequately warn about risk of certain injuries, primarily various birth defects, arising from use of Depakote. Over
ninety percent
of the approximately
635
claims are pending in the United States District Court for the Southern District of Illinois, and the rest are pending in various other federal and state courts. Plaintiffs generally seek compensatory and punitive damages.
In November 2014,
five
individuals filed a putative class action lawsuit, Rubinstein, et al. v Gonzalez, et al., on behalf of purchasers and sellers of certain Shire plc (Shire) securities between June 20 and October 14, 2014, against AbbVie and its chief executive officer in the United States District Court for the Northern District of Illinois alleging that the defendants made and/or are responsible for material misstatements in violation of federal securities laws in connection with AbbVie's proposed transaction with Shire.
In June 2016, a lawsuit, Elliott Associates, L.P., et al. v. AbbVie Inc., was filed by
five
investment funds against AbbVie in the Cook County, Illinois Circuit Court alleging that AbbVie made misrepresentations and omissions in connection with its proposed transaction with Shire. Similar lawsuits were filed between July and September 2017 against AbbVie and in some
|
2017 Form 10-K
|
89
|
||
instances its chief executive officer in the same court by twelve additional investment funds. Plaintiffs seek compensatory and punitive damages.
In May 2017, a shareholder derivative lawsuit, Ellis v. Gonzalez, et al., was filed in Delaware Chancery Court, alleging that AbbVie's directors breached their fiduciary duties in connection with statements made regarding the Shire transaction. The lawsuit seeks unspecified compensatory damages for AbbVie, among other relief.
Beginning in May 2016, the Patent Trial & Appeal Board of the U.S. Patent & Trademark Office (PTO) instituted
five
inter partes review proceedings brought by Coherus Biosciences and Boehringer Ingelheim related to
three
AbbVie patents covering methods of treatment of rheumatoid arthritis using adalimumab. In these proceedings, the PTO reviewed the validity of the patents and issued decisions of invalidity in May, June and July of 2017. AbbVie’s appeal of the decisions is pending in the Court of Appeals for the Federal Circuit.
In March 2017, AbbVie filed a lawsuit, AbbVie Inc. v. Novartis Vaccines and Diagnostics, Inc. and Grifols Worldwide Operations Ltd., in the United States District Court for the Northern District of California against Novartis Vaccines and Grifols Worldwide seeking a declaratory judgment that eleven HCV-related patents licensed to AbbVie in 2002 are invalid.
AbbVie is seeking to enforce certain patent rights related to adalimumab (a drug AbbVie sells under the trademark HUMIRA®). In a case filed in United States District Court for the District of Delaware in August 2017, AbbVie alleges that Boehringer Ingelheim International GmbH’s, Boehringer Ingelheim Pharmaceutical, Inc.’s, and Boehringer Ingelheim Fremont, Inc.’s proposed biosimilar adalimumab product infringes certain AbbVie patents. AbbVie seeks declaratory and injunctive relief.
Pharmacyclics LLC, a wholly owned subsidiary of AbbVie, is seeking to enforce its patent rights relating to ibrutinib capsules (a drug Pharmacyclics sells under the trademark IMBRUVICA®). In a case filed in the United States District Court for the District of Delaware on February 1, 2018, Pharmacyclics alleges that Fresenius Kabi USA, LLC, Fresenius Kabi USA, Inc., and Fresenius Kabi Oncology Limited’s proposed generic ibrutinib product infringes Pharmacyclics’ patents and Pharmacyclics seeks declaratory and injunctive relief. Janssen Biotech, Inc. which is in a global collaboration with Pharmacyclics concerning the development and marketing of IMBRUVICA, is the co-plaintiff in this suit.
AbbVie operates in
one
business segment—pharmaceutical products. Substantially all of AbbVie's net revenues in the United States are to
three
wholesalers. Outside the United States, products are sold primarily to health care providers or through distributors, depending on the market served. The following tables detail AbbVie's worldwide net revenues:
|
years ended December 31 (in millions)
|
2017
|
2016
|
2015
|
||||||||
|
HUMIRA
|
$
|
18,427
|
|
$
|
16,078
|
|
$
|
14,012
|
|
||
|
IMBRUVICA
|
2,573
|
|
1,832
|
|
754
|
|
|||||
|
HCV
|
1,274
|
|
1,522
|
|
1,639
|
|
|||||
|
Lupron
|
829
|
|
821
|
|
826
|
|
|||||
|
Creon
|
831
|
|
730
|
|
632
|
|
|||||
|
Synagis
|
738
|
|
730
|
|
740
|
|
|||||
|
Synthroid
|
781
|
|
763
|
|
755
|
|
|||||
|
AndroGel
|
577
|
|
675
|
|
694
|
|
|||||
|
Kaletra
|
423
|
|
549
|
|
700
|
|
|||||
|
Sevoflurane
|
410
|
|
428
|
|
474
|
|
|||||
|
Duodopa
|
355
|
|
293
|
|
231
|
|
|||||
|
All other
|
998
|
|
1,217
|
|
1,402
|
|
|||||
|
Total net revenues
|
$
|
28,216
|
|
$
|
25,638
|
|
$
|
22,859
|
|
||
|
90
|
2017 Form 10-K
|
||
Net revenues to external customers by geographic area, based on product shipment destination, were as follows:
|
years ended December 31 (in millions)
|
2017
|
2016
|
2015
|
||||||||
|
United States
|
$
|
18,251
|
|
$
|
15,947
|
|
$
|
13,561
|
|
||
|
Germany
|
1,157
|
|
1,104
|
|
1,082
|
|
|||||
|
United Kingdom
|
807
|
|
776
|
|
688
|
|
|||||
|
Japan
|
764
|
|
770
|
|
599
|
|
|||||
|
France
|
730
|
|
713
|
|
597
|
|
|||||
|
Canada
|
659
|
|
624
|
|
551
|
|
|||||
|
Spain
|
521
|
|
589
|
|
618
|
|
|||||
|
Italy
|
475
|
|
523
|
|
452
|
|
|||||
|
Brazil
|
410
|
|
355
|
|
376
|
|
|||||
|
The Netherlands
|
362
|
|
352
|
|
334
|
|
|||||
|
All other countries
|
4,080
|
|
3,885
|
|
4,001
|
|
|||||
|
Total net revenues
|
$
|
28,216
|
|
$
|
25,638
|
|
$
|
22,859
|
|
||
Long-lived assets, primarily net property and equipment, by geographic area were as follows:
|
as of December 31 (in millions)
|
2017
|
2016
|
|||||
|
United States and Puerto Rico
|
$
|
1,862
|
|
$
|
1,822
|
|
|
|
Europe
|
621
|
|
504
|
|
|||
|
All other
|
320
|
|
|
278
|
|
||
|
Total long-lived assets
|
$
|
2,803
|
|
$
|
2,604
|
|
|
|
2017 Form 10-K
|
91
|
||
|
(in millions except per share data)
|
2017
|
2016
|
||||||
|
First Quarter
|
||||||||
|
Net revenues
|
$
|
6,538
|
|
$
|
5,958
|
|
||
|
Gross margin
|
4,922
|
|
4,589
|
|
||||
|
Net earnings
(a)
|
1,711
|
|
1,354
|
|
||||
|
Basic earnings per share
|
$
|
1.07
|
|
$
|
0.83
|
|
||
|
Diluted earnings per share
|
$
|
1.06
|
|
$
|
0.83
|
|
||
|
Cash dividends declared per common share
|
$
|
0.64
|
|
$
|
0.57
|
|
||
|
Second Quarter
|
||||||||
|
Net revenues
|
$
|
6,944
|
|
$
|
6,452
|
|
||
|
Gross margin
|
5,416
|
|
5,047
|
|
||||
|
Net earnings
(b)
|
1,915
|
|
1,610
|
|
||||
|
Basic earnings per share
|
$
|
1.20
|
|
$
|
0.99
|
|
||
|
Diluted earnings per share
|
$
|
1.19
|
|
$
|
0.98
|
|
||
|
Cash dividends declared per common share
|
$
|
0.64
|
|
$
|
0.57
|
|
||
|
Third Quarter
|
||||||||
|
Net revenues
|
$
|
6,995
|
|
$
|
6,432
|
|
||
|
Gross margin
|
5,379
|
|
4,928
|
|
||||
|
Net earnings
(c)
|
1,631
|
|
1,598
|
|
||||
|
Basic earnings per share
|
$
|
1.02
|
|
$
|
0.97
|
|
||
|
Diluted earnings per share
|
$
|
1.01
|
|
$
|
0.97
|
|
||
|
Cash dividends declared per common share
|
$
|
0.64
|
|
$
|
0.57
|
|
||
|
Fourth Quarter
|
||||||||
|
Net revenues
|
$
|
7,739
|
|
$
|
6,796
|
|
||
|
Gross margin
|
5,459
|
|
5,241
|
|
||||
|
Net earnings
(d)
|
52
|
|
1,391
|
|
||||
|
Basic earnings per share
|
$
|
0.03
|
|
$
|
0.86
|
|
||
|
Diluted earnings per share
|
$
|
0.03
|
|
$
|
0.85
|
|
||
|
Cash dividends declared per common share
|
$
|
0.71
|
|
$
|
0.64
|
|
||
|
(a)
|
First quarter results in 2017 included after-tax costs of
$84 million
related to the change in fair value of contingent consideration liabilities. First quarter results in 2016 included a net foreign exchange loss of
$298 million
related to the devaluation of AbbVie’s net monetary assets denominated in the Venezuelan bolivar.
|
|
(b)
|
Second quarter results in 2017 included an after-tax charge of
$62 million
to increase litigation reserves and after-tax costs of
$61 million
related to the change in fair value of contingent consideration liabilities. Second quarter results in 2016 included after-tax costs totaling
$122 million
related to the acquisition of Stemcentrx and BI compounds as well as the amortization of the acquisition date fair value step-up for inventory related to the acquisition of Pharmacyclics.
|
|
(c)
|
Third quarter results in 2017 included after-tax costs of
$401 million
related to the change in fair value of contingent consideration liabilities. Third quarter results in 2016 included after-tax costs of
$104 million
related to the change in fair value of contingent consideration liabilities.
|
|
(d)
|
Fourth quarter results in 2017 were impacted by
net charges related to the December 2017 enactment of the Tax Cuts and Jobs Act
, including an after-tax charge of
$4.5 billion
related to the
one-time mandatory repatriation of previously untaxed earnings of foreign subsidiaries
, partially offset by after-tax benefits of
$3.3 billion
due to
|
|
92
|
2017 Form 10-K
|
||
remeasurement of net deferred tax liabilities and other related impacts
. Additional after-tax costs that impacted fourth quarter results in 2017 included
$244 million
for an intangible asset impairment charge,
$221 million
for a charge to increase litigation reserves,
$205 million
as a result of entering into a global strategic collaboration with Alector, Inc. and
$79 million
related to the change in fair value of contingent consideration liabilities. These costs were partially offset by an after-tax benefit of
$91 million
due to a tax audit settlement. Fourth quarter results in 2016 included after-tax costs totaling
$187 million
associated with a tax law change for regulations issued in the fourth quarter of 2016 that revised the treatment of foreign currency translation gains and losses for certain operations as well as after-tax costs totaling
$85 million
related to the change in fair value of contingent consideration liabilities.
|
2017 Form 10-K
|
93
|
||
Report Of Independent Registered Public Accounting Firm
To the Stockholders and the Board of Directors of AbbVie Inc.
Opinion on the Financial Statements
We have audited the accompanying consolidated balance sheets of AbbVie Inc. and subsidiaries (the Company) as of December 31,
2017
and
2016
, and the related consolidated statements of earnings, comprehensive income, equity and cash flows for each of the three years in the period ended December 31,
2017
, and the related notes (collectively referred to as the “financial statements”). In our opinion, the financial statements present fairly, in all material respects, the consolidated financial position of the Company at December 31,
2017
and
2016
, and the consolidated results of its operations and its cash flows for each of the three years in the period ended December 31,
2017
, in conformity with U.S. generally accepted accounting principles.
We also have audited, in accordance with the standards of the Public Company Accounting Oversight Board (United States) (PCAOB), the Company's internal control over financial reporting as of December 31,
2017
, based on criteria established in Internal Control-Integrated Framework issued by the Committee of Sponsoring Organizations of the Treadway Commission (2013 framework) and our report dated
February 16, 2018
expressed an unqualified opinion thereon.
Basis for Opinion
These financial statements are the responsibility of the Company's management. Our responsibility is to express an opinion on the Company's financial statements based on our audits. We are a public accounting firm registered with the PCAOB and are required to be independent with respect to the Company in accordance with the U.S. federal securities laws and the applicable rules and regulations of the Securities and Exchange Commission and the PCAOB.
We conducted our audits in accordance with the standards of the PCAOB. Those standards require that we plan and perform the audit to obtain reasonable assurance about whether the financial statements are free of material misstatement, whether due to error or fraud. Our audits included performing procedures to assess the risks of material misstatement of the financial statements, whether due to error or fraud, and performing procedures to respond to those risks. Such procedures included examining, on a test basis, evidence regarding the amounts and disclosures in the financial statements. Our audits also included evaluating the accounting principles used and significant estimates made by management, as well as evaluating the overall presentation of the financial statements. We believe that our audits provide a reasonable basis for our opinion.
/s/ Ernst & Young LLP
We have served as the Company’s auditor since 2013.
Chicago, Illinois
February 16, 2018
|
94
|
2017 Form 10-K
|
||
None.
Disclosure Controls and Procedures; Internal Control Over Financial Reporting
Evaluation of disclosure controls and procedures.
The Chief Executive Officer, Richard A. Gonzalez, and the Chief Financial Officer, William J. Chase, evaluated the effectiveness of AbbVie's disclosure controls and procedures as of the end of the period covered by this report, and concluded that AbbVie's disclosure controls and procedures were effective to ensure that information AbbVie is required to disclose in the reports that it files or submits with the Securities and Exchange Commission under the Securities Exchange Act of 1934 is recorded, processed, summarized and reported, within the time periods specified in the Commission's rules and forms, and to ensure that information required to be disclosed by AbbVie in the reports that it files or submits under the Securities Exchange Act of 1934 is accumulated and communicated to AbbVie's management, including its principal executive officer and principal financial officer, as appropriate to allow timely decisions regarding required disclosure.
Changes in internal control over financial reporting.
There were no changes in AbbVie's internal control over financial reporting (as defined in Rule 13a-15(f) under the Securities Exchange Act of 1934) that have materially affected, or are reasonably likely to materially affect, AbbVie's internal control over financial reporting during the quarter ended December 31,
2017
.
Inherent limitations on effectiveness of controls.
AbbVie's management, including its Chief Executive Officer and its Chief Financial Officer, do not expect that AbbVie's disclosure controls or internal control over financial reporting will prevent or detect all errors and all fraud. A control system, no matter how well designed and operated, can provide only reasonable, not absolute, assurance that the control system's objectives will be met. The design of a control system must reflect the fact that there are resource constraints, and the benefits of controls must be considered relative to their costs. Further, because of the inherent limitations in all control systems, no evaluation of controls can provide absolute assurance that misstatements due to error or fraud will not occur or that all control issues and instances of fraud, if any, have been detected. These inherent limitations include the realities that judgments in decision-making can be faulty and that breakdowns can occur because of simple error or mistake. Controls can also be circumvented by the individual acts of some persons, by collusion of two or more people, or by management override of the controls.
The design of any system of controls is based in part on certain assumptions about the likelihood of future events, and there can be no assurance that any design will succeed in achieving its stated goals under all potential future conditions. Projections of any evaluation of controls effectiveness to future periods are subject to risks. Over time, controls may become inadequate because of changes in conditions or deterioration in the degree of compliance with policies or procedures.
Management's annual report on internal control over financial reporting.
Management of AbbVie is responsible for establishing and maintaining adequate internal control over financial reporting, as such term is defined in Rule 13a-15(f) under the Securities Exchange Act of 1934. AbbVie's internal control over financial reporting is designed to provide reasonable assurance regarding the reliability of financial reporting and the preparation of financial statements for external purposes in accordance with generally accepted accounting principles in the United States. However, all internal control systems, no matter how well designed, have inherent limitations. Therefore, even those systems determined to be effective can provide only reasonable assurance with respect to financial statement preparation and reporting.
Management assessed the effectiveness of AbbVie's internal control over financial reporting as of
December 31, 2017
. In making this assessment, management used the criteria set forth by the Committee of Sponsoring Organizations of the Treadway Commission (COSO) in
Internal Control-Integrated Framework
(2013 framework). Based on that assessment, management concluded that AbbVie maintained effective internal control over financial reporting as of December 31,
2017
, based on the COSO criteria.
The effectiveness of AbbVie's internal control over financial reporting as of
December 31, 2017
has been audited by Ernst & Young LLP, an independent registered public accounting firm, as stated in their attestation report below, which expresses an unqualified opinion on the effectiveness of AbbVie's internal control over financial reporting as of
December 31, 2017
.
|
2017 Form 10-K
|
95
|
||
Report of independent registered public accounting firm.
The report of AbbVie's independent registered public accounting firm related to its assessment of the effectiveness of internal control over financial reporting is included below.
|
96
|
2017 Form 10-K
|
||
Report Of Independent Registered Public Accounting Firm
To the Stockholders and the Board of Directors of AbbVie Inc.
Opinion on Internal Control over Financial Reporting
We have audited AbbVie Inc. and subsidiaries' internal control over financial reporting as of December 31,
2017
, based on criteria established in Internal Control—Integrated Framework issued by the Committee of Sponsoring Organizations of the Treadway Commission (2013 framework) (the COSO criteria). In our opinion, AbbVie Inc. and subsidiaries (the Company) maintained, in all material respects, effective internal control over financial reporting as of December 31,
2017
, based on the COSO criteria.
We also have audited, in accordance with the standards of the Public Company Accounting Oversight Board (United States) (PCAOB), the consolidated balance sheets of AbbVie Inc. and subsidiaries as of December 31,
2017
and
2016
, and the related consolidated statements of earnings, comprehensive income, equity and cash flows for each of the three years in the period ended December 31,
2017
, and the related notes of the Company and our report dated
February 16, 2018
expressed an unqualified opinion thereon.
Basis of Opinion
The Company's management is responsible for maintaining effective internal control over financial reporting and for its assessment of the effectiveness of internal control over financial reporting included in the accompanying Management's Annual Report on Internal Control over Financial Reporting. Our responsibility is to express an opinion on the Company's internal control over financial reporting based on our audit. We are a public accounting firm registered with the PCAOB and are required to be independent with respect to the Company in accordance with the U.S. federal securities laws and the applicable rules and regulations of the Securities and Exchange Commission and the PCAOB.
We conducted our audit in accordance with the standards of the PCAOB. Those standards require that we plan and perform the audit to obtain reasonable assurance about whether effective internal control over financial reporting was maintained in all material respects.
Our audit included obtaining an understanding of internal control over financial reporting, assessing the risk that a material weakness exists, testing and evaluating the design and operating effectiveness of internal control based on the assessed risk, and performing such other procedures as we considered necessary in the circumstances. We believe that our audit provides a reasonable basis for our opinion.
Definition and Limitations on Internal Control Over Financial Reporting
A company's internal control over financial reporting is a process designed to provide reasonable assurance regarding the reliability of financial reporting and the preparation of financial statements for external purposes in accordance with generally accepted accounting principles. A company's internal control over financial reporting includes those policies and procedures that (1) pertain to the maintenance of records that, in reasonable detail, accurately and fairly reflect the transactions and dispositions of the assets of the company; (2) provide reasonable assurance that transactions are recorded as necessary to permit preparation of financial statements in accordance with generally accepted accounting principles, and that receipts and expenditures of the company are being made only in accordance with authorizations of management and directors of the company; and (3) provide reasonable assurance regarding prevention or timely detection of unauthorized acquisition, use, or disposition of the company's assets that could have a material effect on the financial statements.
Because of its inherent limitations, internal control over financial reporting may not prevent or detect misstatements. Also, projections of any evaluation of effectiveness to future periods are subject to the risk that controls may become inadequate because of changes in conditions, or that the degree of compliance with the policies or procedures may deteriorate.
/s/ Ernst & Young LLP
Chicago, Illinois
February 16, 2018
|
2017 Form 10-K
|
97
|
||
None.
|
98
|
2017 Form 10-K
|
||
Incorporated herein by reference are "Information Concerning Director Nominees," "The Board of Directors and its Committees—Committees of the Board of Directors," "Section 16(a) Beneficial Ownership Reporting Compliance," and "Procedure for Recommendation and Nomination of Directors and Transaction of Business at Annual Meeting" to be included in the
2018
AbbVie Inc. Proxy Statement. The
2018
Definitive Proxy Statement will be filed on or about
March 19, 2018
. Also incorporated herein by reference is the text found in this Form 10-K under the caption, "Executive Officers of the Registrant."
AbbVie's code of business conduct requires all its business activities to be conducted in compliance with all applicable laws, regulations and ethical principles and values. All directors, officers and employees of AbbVie are required to read, understand and abide by the requirements of the code of business conduct applicable to them. AbbVie's code of business conduct is available in the corporate governance section of AbbVie's investor relations website at www.abbvieinvestor.com.
Any waiver of the code of business conduct for directors or executive officers may be made only by AbbVie's audit committee. AbbVie will disclose any amendment to, or waiver from, a provision of the code of conduct for the principal executive officer, principal financial officer, principal accounting officer or controller, or persons performing similar functions, on its website within four business days following the date of the amendment or waiver. In addition, AbbVie will disclose any waiver from the code of business conduct for the other executive officers and for directors on the website.
AbbVie has a chief ethics and compliance officer who reports to the chief executive officer and to the public policy committee. The chief ethics and compliance officer is responsible for overseeing, administering and monitoring AbbVie's compliance program.
The material to be included in the
2018
AbbVie Inc. Proxy Statement under the headings "Director Compensation," "Executive Compensation," and "Compensation Committee Report" is incorporated herein by reference. The
2018
Definitive Proxy Statement will be filed on or about
March 19, 2018
.
|
2017 Form 10-K
|
99
|
||
(a)
Equity Compensation Plan Information.
The following table presents information as of
December 31, 2017
about AbbVie's equity compensation plans under which AbbVie common stock has been authorized for issuance:
|
Plan Category
|
(a)
Number of
securities to be
issued upon
exercise of
outstanding
options,
warrants and
rights (1)
|
(b)
Weighted-
average exercise
price of
outstanding
options,
warrants and
rights (2)
|
(c)
Number of
securities
remaining
available for
future issuance
under equity
compensation
plans (excluding
securities
reflected in
column (a)) (3)
|
||||||
|
Equity compensation plans approved by security holders
|
18,770,467
|
|
$
|
41.69
|
|
73,405,945
|
|
||
|
Equity compensation plans not approved by security holders
|
—
|
|
—
|
|
—
|
|
|||
|
Total
|
18,770,467
|
|
$
|
41.69
|
|
73,405,945
|
|
||
|
(1)
|
Includes 3,350,775 shares issuable under AbbVie's Incentive Stock Program pursuant to awards granted by Abbott and adjusted into AbbVie awards in connection with AbbVie's separation from Abbott.
|
|
(2)
|
The weighted-average exercise price does not include outstanding restricted stock units, restricted stock awards and performance shares that have no exercise price.
|
|
(3)
|
Excludes shares issuable upon the exercise of stock options and pursuant to other rights granted under the Stemcentrx 2011 Equity Incentive Plan, which was assumed by AbbVie upon the consummation of its acquisition of Stemcentrx, Inc. As of December 31, 2017, 562,497 options remained outstanding under this plan. The options have a weighted-average exercise price of $13.62. No further awards will be granted under this plan.
|
|
(b)
|
Information Concerning Security Ownership.
Incorporated herein by reference is the material under the heading "Securities Ownership—Securities Ownership of Executive Officers and Directors" in the
2018
AbbVie Inc. Proxy Statement. The
2018
Definitive Proxy Statement will be filed on or about
March 19, 2018
.
|
The material to be included in the
2018
AbbVie Inc. Proxy Statement under the headings "The Board of Directors and its Committees," "Corporate Governance Materials," and "Procedures for Approval of Related Person Transactions" is incorporated herein by reference. The
2018
Definitive Proxy Statement will be filed on or about
March 19, 2018
.
The material to be included in the
2018
AbbVie Inc. Proxy Statement under the headings "Audit Fees and Non-Audit Fees" and "Policy on Audit Committee Pre-Approval of Audit and Permissible Non-Audit Services of the Independent Registered Public Accounting Firm" is incorporated herein by reference. The
2018
Definitive Proxy Statement will be filed on or about
March 19, 2018
.
|
100
|
2017 Form 10-K
|
||
|
(a)
|
Documents filed as part of this Form 10-K.
|
|
(1)
|
Financial Statements:
See Item 8, "Financial Statements and Supplementary Data," on page 47 hereof, for a list of financial statements.
|
|
(2)
|
Financial Statement Schedules:
All schedules omitted are inapplicable or the information required is shown in the consolidated financial statements or notes thereto.
|
|
(3)
|
Exhibits Required by Item 601 of Regulation S-K:
The information called for by this paragraph is set forth in Item 15(b) below.
|
|
(b)
|
Exhibits:
|
|
Exhibit
Number
|
Exhibit Description
|
||
|
|
|||
|
|
|||
|
|
|||
|
|
|||
|
|
|||
|
|
|||
|
|
|||
|
|
|||
|
|
|||
|
|
|||
|
|
|||
|
|
|||
|
2017 Form 10-K
|
101
|
||
|
Exhibit
Number
|
Exhibit Description
|
||
|
|
|||
|
|
|||
|
|
|||
|
|
|||
|
|
|||
|
|
|||
|
|
|||
|
|
|||
|
|
|||
|
|
|||
|
|
|||
|
|
|||
|
|
|||
|
|
|||
|
|
|||
|
|
|||
|
|
|||
|
|
|||
|
|
|||
|
|
|||
|
|
|||
|
|
|||
|
102
|
2017 Form 10-K
|
||
|
Exhibit
Number
|
Exhibit Description
|
||
|
|
|||
|
|
|||
|
|
|||
|
|
|||
|
|
|||
|
|
|||
|
|
|||
|
|
|||
|
|
|||
|
|
|||
|
|
|||
|
|
|||
|
|
|||
|
|
|||
|
|
|||
|
|
|||
|
|
|||
|
|
|||
|
|
|||
|
|
|||
|
|
|||
|
101
|
|
The following financial statements and notes from the AbbVie Inc. Annual Report on Form 10-K for the year ended December 31, 2017 filed on February 16, 2018, formatted in XBRL: (i) Consolidated Statements of Earnings; (ii) Consolidated Statements of Comprehensive Income; (iii) Consolidated Balance Sheets; (iv) Consolidated Statements of Equity; (v) Consolidated Statements of Cash Flows; and (vi) the Notes to Consolidated Financial Statements.
|
|
|
|
|
The AbbVie Inc. 2018 Definitive Proxy Statement will be filed with the Securities and Exchange Commission under separate cover on or about March 19, 2018.
|
|
_______________________________________________________________________________
|
2017 Form 10-K
|
103
|
||
|
*
|
Incorporated herein by reference. Commission file number 001-35565.
|
|
**
|
Denotes management contract or compensatory plan or arrangement required to be filed as an exhibit hereto.
|
Exhibits 32.1 and 32.2, above, are furnished herewith and should not be deemed to be "filed" under the Securities Exchange Act of 1934. AbbVie will furnish copies of any of the above exhibits to a stockholder upon written request to the Secretary, AbbVie Inc., 1 North Waukegan Road, North Chicago, Illinois 60064.
|
104
|
2017 Form 10-K
|
||
None.
|
2017 Form 10-K
|
105
|
||
SIGNATURES
Pursuant to the requirements of Section 13 or 15(d) of the Securities Exchange Act of 1934, AbbVie Inc. has duly caused this report to be signed on its behalf by the undersigned, thereunto duly authorized.
|
AbbVie Inc.
|
||||
|
By:
|
|
/s/ RICHARD A. GONZALEZ
|
||
|
|
|
Name:
|
|
Richard A. Gonzalez
|
|
|
|
Title:
|
|
Chairman of the Board and
Chief Executive Officer
|
|
Date:
|
February 16, 2018
|
|||
Pursuant to the requirements of the Securities Exchange Act of 1934, this report has been signed below by the following persons on behalf of AbbVie Inc. on
February 16, 2018
in the capacities indicated below.
|
/s/ RICHARD A. GONZALEZ
|
/s/ WILLIAM J. CHASE
|
|
|
Richard A. Gonzalez
Chairman of the Board and
Chief Executive Officer
(Principal Executive Officer)
|
|
William J. Chase
Executive Vice President,
Chief Financial Officer
(Principal Financial Officer)
|
|
/s/ ROBERT A. MICHAEL
|
||
|
Robert A. Michael
Vice President, Controller
(Principal Accounting Officer)
|
|
|
|
/s/ ROBERT J. ALPERN, M.D.
|
/s/ ROXANNE S. AUSTIN
|
|
|
Robert J. Alpern, M.D.
Director of AbbVie Inc.
|
|
Roxanne S. Austin
Director of AbbVie Inc.
|
|
/s/ WILLIAM H.L. BURNSIDE
|
/s/ BRETT J. HART
|
|
|
William H.L. Burnside
Director of AbbVie Inc.
|
|
Brett J. Hart
Director of AbbVie Inc.
|
|
/s/ EDWARD M. LIDDY
|
/s/ MELODY B. MEYER
|
|
|
Edward M. Liddy
Director of AbbVie Inc.
|
|
Melody B. Meyer
Director of AbbVie Inc.
|
|
/s/ EDWARD J. RAPP
|
/s/ GLENN F. TILTON
|
|
|
Edward J. Rapp
Director of AbbVie Inc.
|
|
Glenn F. Tilton
Director of AbbVie Inc.
|
|
/s/ FREDERICK H. WADDELL
|
||
|
Frederick H. Waddell
Director of AbbVie Inc.
|
||
|
106
|
2017 Form 10-K
|
||
TABLE OF CONTENTS
Part IItem 1. BusinessItem 1A. Risk FactorsItem 1B. Unresolved Staff CommentsItem 2. PropertiesItem 3. Legal ProceedingsItem 4. Mine Safety DisclosuresPart IIItem 5. Market For Registrant's Common Equity, Related Stockholder Matters and Issuer Purchases Of Equity SecuritiesItem 6. Selected Financial DataItem 7. Management's Discussion and Analysis Of Financial Condition and Results Of OperationsItem 7A. Quantitative and Qualitative Disclosures About Market RiskItem 8. Financial Statements and Supplementary DataNote 1 Background and Basis Of PresentationNote 2 Summary Of Significant Accounting PoliciesNote 3 Supplemental Financial InformationNote 4 Earnings Per ShareNote 5 Licensing, Acquisitions and Other ArrangementsNote 6 Collaboration with Janssen Biotech, IncNote 7 Goodwill and Intangible AssetsNote 8 Restructuring PlansNote 9 Debt, Credit Facilities and Commitments and ContingenciesNote 10 Financial Instruments and Fair Value MeasuresNote 11 Post-employment BenefitsNote 12 EquityNote 13 Income TaxesNote 14 Legal Proceedings and ContingenciesNote 15 Segment and Geographic Area InformationNote 16 Quarterly Financial Data (unaudited)Item 9. Changes in and Disagreements with Accountants on Accounting and Financial DisclosureItem 9A. Controls and ProceduresItem 9B. Other InformationPart IIIItem 10. Directors, Executive Officers and Corporate GovernanceItem 11. Executive CompensationItem 12. Security Ownership Of Certain Beneficial Owners and Management and Related Stockholder MattersItem 13. Certain Relationships and Related Transactions, and Director IndependenceItem 14. Principal Accounting Fees and ServicesPart IVItem 15. Exhibits, Financial Statement SchedulesItem 16. Form 10-k Summary