ASBURY AUTOMOTIVE GROUP INC
10-Ks and 10-Qs
|
|
|
|
|
|
|
|
|
|
|
|
|
|
|
|
|
|
|
|
|
|
|
|
|
|
|
|
|
|
|
|
|
|
|
|
|
|
|
|
|
|
|
|
|
|
|
|
|
|
|
|
|
|
|
|
UNITED STATES
SECURITIES AND EXCHANGE COMMISSION
Washington, D.C. 20549
FORM 10-K
(Mark One)
|
x
|
ANNUAL REPORT PURSUANT TO SECTION 13 OR 15(d) OF THE SECURITIES EXCHANGE ACT OF 1934
|
For the fiscal year ended December 31, 2010
or
|
o
|
TRANSITION REPORT PURSUANT TO SECTION 13 OR 15(d) OF THE SECURITIES EXCHANGE ACT OF 1934
|
For the transition period from to
Commission file number: 001-31262
(Exact name of Registrant as specified in its charter)
|
Delaware
|
|
01-0609375
|
|
(State or other jurisdiction of
incorporation or organization)
|
|
(I.R.S. Employer
Identification No.)
|
|
2905 Premiere Parkway, NW, Suite 300
Duluth, Georgia
|
|
30097
|
|
(Current address of principal executive offices)
|
|
(Zip Code)
|
(770) 418-8200
(Registrant’s telephone number, including area code)
|
Title of each class
|
|
Name of each exchange on which registered
|
|
Common Stock, par value $.01 per share
|
|
New York Stock Exchange
|
None.
a
Indicate by check mark if the registrant is a well-known seasoned issuer, as defined in Rule 405 of the Securities Act. Yes
o
No
x
Indicate by check mark if the registrant is not required to file reports pursuant to Section 13 or Section 15(d) of the Act. Yes
o
No
x
Indicate by check mark whether the registrant (1) has filed all reports required to be filed by Section 13 or 15(d) of the Securities Exchange Act of 1934 during the preceding 12 months (or for such shorter period that the registrant was required to file such reports), and (2) has been subject to such filing requirements for the past 90 days. Yes
x
No
o
Indicate by checkmark whether the registrant has submitted electronically and posted on its Web site, if any, every Interactive Data File required to be submitted and posted pursuant to Rule 405 of Regulation S-T (§ 232.405 of this chapter) during the preceding 12 months (or for such shorter period that the registrant was required to submit and post such files). Yes
o
No
o
Indicate by check mark if disclosure of delinquent filers pursuant to Item 405 of Regulation S-K is not contained herein, and will not be contained, to the best of registrant’s knowledge, in definitive proxy or information statements incorporated by reference in Part III of this Form 10-K or any amendment to this Form 10-K.
o
Indicate by check mark whether the registrant is a large accelerated filer, an accelerated filer, a non-accelerated filer or a smaller reporting company (as defined in Rule 12b-2 of the Act).
|
Large Accelerated Filer
|
|
o
|
|
Accelerated filer
|
|
x
|
|
Non-Accelerated Filer
|
|
o
|
|
Smaller reporting company
|
|
o
|
Indicate by check mark whether registrant is a shell company (as defined in Rule 12b-2 of the Exchange Act). Yes
o
No
x
Based on the closing price of the registrant’s common stock as of June 30, 2010, the aggregate market value of the common stock held by non-affiliates of the registrant was $333,917,940 (based upon the assumption, solely for purposes of this computation, that all of the officers and directors of the registrant were affiliates of the registrant).
Indicate the number of shares outstanding of each of the registrant’s classes of common stock, as of the latest practicable date: The number of shares of common stock outstanding as of February 24, 2011 was 32,817,175 (net of 4,846,226 treasury shares).
DOCUMENTS INCORPORATED BY REFERENCE
List hereunder the following documents if incorporated by reference and the Part of the Form 10-K into which the document is incorporated:
Portions of the registrant’s definitive Proxy Statement for the 2011 Annual Meeting of Stockholders, to be filed within 120 days after the end of the registrant’s fiscal year, are incorporated by reference into Part III, Items 10 through 14 of this Annual Report on Form 10-K.
ASBURY AUTOMOTIVE GROUP, INC.
ANNUAL REPORT ON FORM 10-K
FOR THE YEAR ENDED
DECEMBER 31, 2010
|
|
|
Page
|
|
PART I
|
||
|
PART II
|
||
|
PART III
|
||
|
PART IV
|
||
Forward-Looking Information
Certain of the discussions and information included in this report may constitute “forward-looking statements” within the meaning of the federal securities laws. Forward-looking statements are statements that are not historical in nature and may include statements relating to our goals, plans and projections regarding industry and general economic trends, our expected financial position, results of operations or market position and our business strategy. Such statements can generally be identified by words such as “may,” “target,” “could,” “would,” “will,” “should,” “believe,” “expect,” “anticipate,” “plan,” “intend,” “foresee” and other similar words or phrases. Forward-looking statements may also relate to our expectations and assumptions with respect to, among other things:
|
•
|
our ability to execute our business strategy;
|
|
•
|
our ability to improve our operating cash flows, and the availability of capital and liquidity;
|
|
•
|
our estimated future capital expenditures;
|
|
•
|
the duration of the economic recovery process and its impact on our revenues and expenses;
|
|
•
|
our parts and service revenue due to, among other things, improvements in manufacturing quality, manufacturer recalls, the lower than recently historical U.S. SAAR and any changes in business strategy and government regulations;
|
|
•
|
the variable nature of significant components of our cost structure;
|
|
•
|
our ability to decrease our exposure to regional economic downturns due to our geographic diversity and brand mix;
|
|
•
|
manufacturers’ willingness to continue to use incentive programs in the near future to drive demand for their product offerings;
|
|
•
|
our ability to implement our dealer management system in a cost-efficient manner;
|
|
•
|
our acquisition and divestiture strategies;
|
|
•
|
the continued availability of financing, including floor plan financing for inventory;
|
|
•
|
the ability of consumers to secure vehicle financing;
|
|
•
|
the growth of mid-line import and luxury brands over the long-term;
|
|
•
|
our ability to mitigate any future negative trends in new vehicle sales; and
|
|
•
|
our ability to increase our net income as a result of the foregoing and other factors.
|
Forward-looking statements involve known and unknown risks, uncertainties and other factors that may cause our actual future results, performance or achievements to be materially different from any future results, performance or achievements expressed or implied by the forward-looking statements. Such factors include, but are not limited to:
|
•
|
our ability to execute our balanced automotive retailing and service business strategy;
|
|
•
|
changes in the mix, and total number of vehicles, we are able to sell;
|
|
•
|
changes in general economic and business conditions, including changes in consumer confidence levels, interest rates, consumer credit availability, and employment levels;
|
|
•
|
changes in laws and regulations governing the operation of automobile franchises, including trade restrictions, consumer protections, accounting standards, taxation requirements, and environmental laws;
|
|
•
|
changes in the price of oil and gasoline;
|
|
•
|
our ability to generate sufficient cash flows, maintain our liquidity and obtain additional funds for working capital, capital expenditures, acquisitions, debt maturities and other corporate purposes, if necessary;
|
|
•
|
our ability to refinance any of our indebtedness on terms, and in amounts, that are favorable to us;
|
|
•
|
our continued ability to comply with any covenants in various of our financing and lease agreements, or to obtain waivers of these covenants as necessary;
|
1
|
•
|
our relationships with, and the reputation and financial health and viability of vehicle manufacturers whose brands we sell, and their ability to design, manufacture, deliver and market their vehicles successfully;
|
|
•
|
our relationship with, and the financial stability of, our lenders and lessors;
|
|
•
|
our ability to execute our initiatives and other strategies;
|
|
•
|
high levels of competition in our industry, which may create pricing and margin pressures on our products and services;
|
|
•
|
our ability to renew, and enter into new, framework and dealer agreements with manufacturers whose brands we sell, on terms acceptable to us;
|
|
•
|
our ability to attract and to retain key personnel;
|
|
•
|
our ability to leverage gains from our dealership portfolio; and
|
|
•
|
significant disruptions in the financial markets, which may impact our ability to access capital.
|
Many of these factors are beyond our control or difficult to predict, and their ultimate impact could be material. Moreover, the factors set forth under “Item 1A. Risk Factors” and “Item 7. Management’s Discussion and Analysis of Financial Condition and Results of Operations” below and other cautionary statements made in this report should be read and considered as forward-looking statements subject to such uncertainties. We urge you to carefully consider those factors.
Forward-looking statements speak only as of the date of this report. We expressly disclaim any obligation to update any forward-looking statement contained herein.
Additional Information
Our annual reports on Form 10-K, quarterly reports on Form 10-Q, current reports on Form 8-K, and any amendments to such reports filed pursuant to Section 13(a) or 15(d) of the Securities Exchange Act of 1934, are made available free of charge on our web site at
http://www.asburyauto.com
as soon as practical after such reports are filed with the Securities and Exchange Commission (the “Commission”). In addition, the proxy statement that will be delivered to our stockholders in connection with our 2011 Annual Meeting of Stockholders, when filed, will also be available on our web site, and at the URL stated in such proxy statement. We also make available on our web site copies of our charter, bylaws and other materials that outline our corporate governance policies and practices, including:
|
•
|
the respective charters of our audit committee, governance and nominating committee, compensation and human resources committee and risk management committee;
|
|
•
|
our criteria for independence of the members of our board of directors, audit committee, and compensation committee;
|
|
•
|
our Corporate Governance Guidelines; and
|
|
•
|
our Code of Business Conduct and Ethics for Directors, Officers and Employees.
|
We intend to provide any information required by Item 5.05 of Form 8-K (relating to amendments or waivers of our Code of Business Conduct and Ethics for Directors, Officers and Employees) by disclosure on our web site.
You may also obtain a printed copy of the foregoing materials by sending a written request to: Investor Relations Department, Asbury Automotive Group, Inc., 2905 Premiere Parkway, NW, Suite 300, Duluth, Georgia 30097. In addition, the Commission makes available on its web site, free of charge, reports, proxy and information statements and other information regarding issuers, such as us, that file electronically with the Commission. The Commission’s web site is
http://www.sec.gov
. Unless otherwise specified, information contained on our web site, available by hyperlink from our web site or on the Commission’s web site, is not incorporated into this report or other documents we file with, or furnish to, the Commission.
Except as the context otherwise requires, “we,” “our,” “us,” “Asbury” and “the Company” refer to Asbury Automotive Group, Inc. and its subsidiaries.
We are one of the largest automotive retailers in the United States, operating 110 franchises (84 dealership locations) as of
December 31, 2010
, including 10 franchises (three dealership locations) associated with our heavy truck business in Atlanta, Georgia which were pending disposition as of
December 31, 2010
. We offer an extensive range of automotive products and services, including:
|
•
|
new and used vehicles;
|
2
|
•
|
vehicle maintenance;
|
|
•
|
replacement parts and collision repair services;
|
|
•
|
new and used vehicle financing; and
|
|
•
|
aftermarket products such as insurance, warranty and service contracts.
|
Asbury Automotive Group, Inc. was incorporated in the State of Delaware on February 15, 2002, and our stock is listed on the New York Stock Exchange under the ticker symbol “ABG.”
General Description of Our Operations
As of
December 31, 2010
, we operated dealerships in 20 metropolitan markets throughout the United States. We have developed our dealership portfolio through the acquisition of large, locally-branded dealership groups operating throughout the United States. We have complemented these large dealership group acquisitions with the purchase of numerous single point dealerships and smaller dealership groups in our then-existing market areas. Our retail network consists of eight locally-branded dealership groups. The following chart gives a detailed breakdown of our markets, brand names and franchises as of
December 31, 2010
:
|
Brand Names by Region
|
|
Date of Initial
Acquisition
|
|
Markets
|
|
Franchises
|
|
Nalley Automotive Group
|
|
September 1996
|
|
Atlanta, GA
|
|
Acura, Audi, BMW, Hino(a)(b), Honda, IC Bus(a)(b), Infiniti(a), International(a)(b), Isuzu Truck(b), Jaguar, Lexus(a), Nissan, Peterbilt(b), Toyota, UD Truck(b), Volvo, Workhorse(b)
|
|
Courtesy Autogroup
|
|
September 1998
|
|
Tampa, FL
|
|
Chrysler, Dodge, Honda, Hyundai, Infiniti, Jeep, Kia, Mercedes-Benz, Nissan, Toyota, smart, Sprinter
|
|
Coggin Automotive Group
|
|
October 1998
|
|
Jacksonville, FL
|
|
Honda(a), Nissan(a), Toyota, Chevrolet, Buick, GMC
|
|
|
|
Orlando, FL
|
|
Ford, Honda(a), Lincoln
|
||
|
|
|
Fort Pierce, FL
|
|
Acura, BMW, Honda, Mercedes-Benz
|
||
|
Crown Automotive Company
|
|
December 1998
|
|
Princeton, NJ
|
|
BMW, MINI
|
|
|
|
Greensboro, NC
|
|
Acura, BMW, Chrysler, Dodge, Honda, Jeep, Nissan, Volvo
|
||
|
|
|
Durham, NC
|
|
Honda
|
||
|
|
|
Fayetteville, NC
|
|
Dodge, Ford
|
||
|
|
|
Charlotte, NC
|
|
Honda
|
||
|
|
|
Richmond, VA
|
|
Acura, BMW(a), MINI
|
||
|
|
|
Charlottesville, VA
|
|
BMW
|
||
|
|
|
Greenville, SC
|
|
Jaguar, Lexus, Nissan, Porsche, Toyota, Volvo
|
||
|
David McDavid Auto Group
|
|
April 1998
|
|
Dallas/Fort Worth, TX
|
|
Acura, Honda(a), Lincoln(b)
|
|
|
|
Houston, TX
|
|
Honda, Nissan
|
||
|
|
|
Austin, TX
|
|
Acura
|
||
|
North Point Auto Group
|
|
February 1999
|
|
Little Rock, AR
|
|
BMW, Ford, Lincoln, Mazda, Nissan(a), Toyota, Volkswagen, Volvo
|
|
Gray-Daniels Auto Family
|
|
April 2000
|
|
Jackson, MS
|
|
Chevrolet, Ford, Lincoln, Nissan(a), Toyota
|
|
Plaza Motor Company
|
|
December 1997
|
|
St. Louis, MO
|
|
Audi, BMW, Cadillac, Infiniti, Land Rover, Lexus, Mercedes-Benz(a), Porsche, smart, Sprinter(a)
|
|
(a)
|
This market has two of these franchises.
|
|
(b)
|
Represents pending divestitures as of
December 31, 2010
.
|
3
In addition to the dealership groups listed above, we also operate one luxury brand dealership in California.
Our operations provide a diverse revenue base that we believe mitigates the impact of fluctuating new car sales volumes. While new car sales generate the majority of our revenue, used vehicle retail sales, parts and service and finance and insurance provide significantly higher profit margins, and therefore account for the majority of our profitability and have been historically more stable throughout economic cycles.
New Vehicle Sales
As of
December 31, 2010
, we owned a diverse portfolio of 36 American, European and Asian brands. Our new vehicle unit sales consist of the sale of new vehicles to individual retail customers (“new vehicle retail”) and the sale of new vehicles to commercial customers (“fleet”) (the terms "new vehicle retail" and "fleet" being together referred to as "new"). New vehicle revenue and new vehicle gross profit include revenue and gross profit from new vehicle retail and fleet sales. In 2010, we sold 69,683 new vehicles through our dealerships. New vehicle sales were 55% of our total revenues and 22% of our total gross profit for the year ended
December 31, 2010
. We evaluate the results of our new vehicle sales based on unit volumes and gross profit per vehicle sold.
Our new vehicle revenues include new vehicle sale and lease transactions arranged by our dealerships with third parties. We believe leases provide a number of benefits. As a result of fixed-period lease terms, customers who lease new vehicles have historically returned to our dealerships more frequently than customers who purchase new vehicles. In addition, because third-party lessors frequently give the leasing dealerships the first option to purchase vehicles returned by their customers at lease-end, leases typically provide us with an additional source of late-model vehicles for our used vehicle inventory. Generally, leased vehicles remain under manufacturer warranty for the term of the lease, which results in additional parts and services revenue, as dealerships are typically relied upon to provide warranty repair service to the lessee throughout the lease term.
Used Vehicle Sales
We sell used vehicles at all of our dealership locations. Used vehicle sales include the sale of used vehicles to individual retail customers (“used retail”) and the sale of used vehicles to other dealers at auction (“wholesale”) (the terms “used retail” and “wholesale” being together referred to as “used”). In
2010
, we sold 46,473 used retail vehicles through our dealerships. We evaluate the results of our used vehicle sales based on unit volumes and gross profit per vehicle sold. Sales of used retail vehicles, which generally have higher gross margins than sales of new vehicles, accounted for approximately 22% of our total revenues and 14% of our total gross profit for the year ended
December 31, 2010
. Wholesale sales represented 5% of our total revenues, but did not have a material impact on our total gross profit for the year ended
December 31, 2010
.
Gross profit from the sale of used vehicles depends primarily on the ability of our dealerships to obtain a high quality supply of used vehicles and the use of advanced technology to manage our inventory. Our new vehicle operations typically provide our used vehicle operations with a large supply of high quality trade-ins and off-lease vehicles, which we believe are good sources of attractive used vehicle inventory. We also purchase a significant portion of our used vehicle inventory at auctions restricted to new vehicle dealers (offering off-lease, rental and fleet vehicles) and “open” auctions that offer vehicles sold by other dealers and repossessed vehicles. Our used vehicle inventory is typically sold as wholesale if a vehicle is not sold at retail within 60 days, except for used vehicles that do not fit within our inventory mix, which are typically sold as wholesale almost immediately. The reconditioning of used vehicles also generates revenue for our parts and service departments.
Parts and Service
We sell replacement parts and provide vehicle maintenance and collision repair service at all of our franchised dealerships, primarily for the vehicle brands sold at those dealerships. In addition, as of
December 31, 2010
, we maintained 26 free-standing collision repair centers (one of which is pending disposition) either on the premises of, or in close proximity to, our dealerships. Parts and service revenues accounted for approximately 14% of our total revenues and 46% of our total gross profit for the year ended
December 31, 2010
. Historically, parts and service revenues have been more stable than those from vehicle sales. Industry-wide, parts and service revenues have consistently increased over time primarily due to the increased cost of maintaining vehicles, the added technical complexity of vehicles and the increasing number of vehicles on the road.
The automotive parts and service industry tends to be highly fragmented, with franchised dealerships and independent repair shops competing for this business. We believe, however, that the increased use of advanced technology in vehicles has made it difficult for independent repair shops to compete effectively for our parts and service business. These independent repair shops may not be able to invest in the equipment and training necessary to perform major or technical repairs, especially as such repairs relate to luxury and mid-line imports which comprise a significant majority of our new vehicle retail sales. We believe our parts and service business is also positioned to benefit from the service work potentially generated through the sale
4
of extended service contracts to customers who purchase new and used vehicles from us, as historically these customers have tended to have their vehicles serviced at the location where they purchase extended service contracts. Additionally, vehicle manufacturers generally require manufacturer warranty work to be performed only at franchised dealerships. As a result, unlike independent service stations or independent and superstore used car dealerships with service operations, our franchised dealerships are authorized to perform work covered by manufacturer warranties on increasingly technologically complex vehicles.
Finance and Insurance
We refer to the finance and insurance portion of our business as F&I. Through our F&I business, we arrange, and receive commissions for, third-party financing of the sale or lease of new and used vehicles to customers, as well as offer a number of aftermarket products such as extended service contracts, guaranteed asset protection (“GAP”) debt cancellation, prepaid maintenance, credit life and disability insurance, and similar products. We also generate F&I revenues from the receipt of certain marketing fees paid to us under agreements with preferred lenders. Our F&I business generated approximately 3% of our total revenues and 18% of our total gross profit for the year ended
December 31, 2010
. The following is a brief description of our significant F&I product offerings:
|
•
|
Extended service contracts – covers certain repair work after the expiration of the manufacturer warranty;
|
|
•
|
GAP debt cancellation – covers the customer after a total loss for the difference between the value of the vehicle and the outstanding loan or lease obligation after insurance proceeds;
|
|
•
|
Prepaid maintenance – covers certain routine maintenance work, such as (i) oil changes, (ii) cleaning and adjusting of brakes, (iii) multi-point vehicle inspections and (iv) tire rotations; and
|
|
•
|
Credit life and disability – covers the remaining amounts due on an auto loan or a lease in the event of death or disability.
|
We earn sales-based commissions from third-party lenders, including manufacturer captive finance subsidiaries, on substantially all of the financing that we arrange on behalf of our customers. We may be charged back (“chargebacks”) for these commissions in the event a finance contract is canceled or repaid, typically within the first 90 days of such contract. We arranged customer financing on approximately 70% of the vehicles we sold during the year ended
December 31, 2010
. We do not retain any material liability for the credit risk associated with these purchase and lease transactions after the completion of the transactions.
Similarly, we may be required to refund a portion of our profit relating to the sale of service contracts, maintenance and insurance and other products in the event of early cancellation. We do not, however, bear any risk related to insurance payments, which are borne by third parties. We receive discounted pricing compared to smaller competitors in our local markets on many of the service contracts, maintenance and insurance products that we provide as a result of our size and sales volume. Historically, chargebacks on finance and service contracts, maintenance and insurance products have totaled between 10% and 14% of total F&I revenue.
We are party to a number of “preferred lender agreements.” Under the terms of these preferred lender agreements, each lender has agreed to provide a marketing fee to us above the standard commission rate for each loan that our dealerships place with that lender. Furthermore, many of the service contracts and insurance products we sell result in underwriting profits and investment income for us based on portfolio performance. The underwriting profits and investment income, if any, represent the amount of funds available to pay future claims in excess of what is actually used to pay claims on the related policies. These payments are determined by the lenders based upon an agreed-upon earnings schedule.
Recent Developments
In January 2011, we purchased certain previously leased real estate from a member of our board of directors for $16.8 million.
In February 2011, we announced a management succession plan in connection with the anticipated retirement of our former President and Chief Executive Officer, Charles R. Oglesby, on July 31, 2011. As part of that plan, on February 9, 2011, Mr. Oglesby was elected as the Executive Chairman of our Board of Directors until he retires in July 2011, and Craig T. Monaghan, our former Senior Vice President and Chief Financial Offier, was elected President and Chief Executive Officer. We expect to incur approximately $4.7 million of compensation expense in 2011 related to our former Chief Executive Officer.
In February 2011, our Board of Directors authorized us to use up to $30.0 million of cash to repurchase certain of our outstanding debt securities. This authorization expires February 28, 2012.
5
Business Strategy
Focus on Premier Brand Mix, Strategic Markets and Diversification
We classify our new vehicle retail sales into the following categories: luxury, mid-line import, and mid-line domestic. Luxury and mid-line imports together accounted for approximately 86% of our new vehicle sales for the year ended December 31, 2010. We continue to believe that, over the long-term, luxury and mid-line import manufacturers are well positioned to continue the market share gains they have achieved in the United States over the past few decades based on the expectation of continued broadening of their product offerings and the delivery of high quality products and services to their customers.
Our physical locations encompassed 20 different metropolitan markets at 84 locations in the following 11 states as of
December 31, 2010
: Arkansas, California, Florida, Georgia, Mississippi, Missouri, New Jersey, North Carolina, South Carolina, Texas and Virginia. We believe that our broad geographic coverage, as well as diversification among manufacturers, decreases our exposure to regional economic downturns and manufacturer-specific risks such as warranty issues or production disruption.
The following table reflects (i) the number of franchises and (ii) the percent of new vehicle revenues represented by each class of franchise as of
December 31, 2010
:
6
|
Class/Franchise
|
Number of
Franchises as of
December 31, 2010
|
% of New
Vehicle Revenues for the
Year Ended
December 31, 2010
|
|||
|
Light Vehicles
|
|||||
|
Luxury
|
|||||
|
BMW
|
9
|
|
9
|
%
|
|
|
Acura
|
6
|
|
5
|
|
|
|
Mercedes-Benz
|
5
|
|
8
|
|
|
|
Infiniti
|
4
|
|
5
|
|
|
|
Lincoln(a)
|
4
|
|
1
|
|
|
|
Lexus
|
4
|
|
6
|
|
|
|
Volvo
|
4
|
|
1
|
|
|
|
Audi
|
2
|
|
1
|
|
|
|
Jaguar
|
2
|
|
*
|
|
|
|
Porsche
|
2
|
|
*
|
|
|
|
Cadillac
|
1
|
|
*
|
|
|
|
Land Rover
|
1
|
|
1
|
|
|
|
Total Luxury
|
44
|
|
37
|
%
|
|
|
Mid-Line Import
|
|||||
|
Honda
|
13
|
|
23
|
%
|
|
|
Nissan
|
11
|
|
13
|
|
|
|
Toyota
|
6
|
|
10
|
|
|
|
Sprinter
|
3
|
|
*
|
|
|
|
MINI
|
2
|
|
1
|
|
|
|
smart
|
2
|
|
*
|
|
|
|
Mazda
|
1
|
|
*
|
|
|
|
Volkswagen
|
1
|
|
*
|
|
|
|
Hyundai
|
1
|
|
1
|
|
|
|
Kia
|
1
|
|
1
|
|
|
|
Total Mid-Line Import
|
41
|
|
49
|
%
|
|
|
Mid-Line Domestic
|
|||||
|
Ford
|
4
|
|
8
|
%
|
|
|
Dodge
|
3
|
|
2
|
|
|
|
Chevrolet
|
2
|
|
2
|
|
|
|
Chrysler
|
2
|
|
*
|
|
|
|
Jeep
|
2
|
|
1
|
|
|
|
Buick
|
1
|
|
*
|
|
|
|
GMC
|
1
|
|
1
|
|
|
|
Total Mid-Line Domestic
|
15
|
|
14
|
%
|
|
|
Total Light Vehicles
|
100
|
|
100
|
%
|
|
7
|
Class/Franchise
|
Number of
Franchises as of
December 31, 2010
|
|
|
Heavy Trucks(b)
|
||
|
Hino(b)
|
2
|
|
|
Isuzu Truck(b)
|
2
|
|
|
UD Truck(b)
|
2
|
|
|
International(b)
|
1
|
|
|
IC Bus(b)
|
1
|
|
|
Peterbilt(b)
|
1
|
|
|
Workhorse(b)
|
1
|
|
|
Total Heavy Trucks
|
10
|
|
|
TOTAL
|
110
|
|
_______________________________
* Franchise accounted for less than 1% of new vehicle retail revenue for the year ended
December 31, 2010
.
|
(a)
|
Includes one pending divestiture as of
December 31, 2010
.
|
(b) As of December 31, 2010, we had executed a contract to sell our heavy truck business and, as a result, our 10 heavy truck franchises were pending divestiture as of December 31, 2010.
Maintain Disciplined Cost Structure and Emphasize Expense Control
We continually focus on expense control at our dealerships. We are constantly evaluating our cost structure, and believe we are well positioned to manage our costs in the future by:
|
•
|
centralizing our financial and information processing systems;
|
|
•
|
deploying information technology and best practices across our dealership network;
|
|
•
|
capitalizing on our scale through negotiating contracts with certain of our vendors on a national basis; and
|
|
•
|
maintaining a performance-based compensation structure.
|
For example, in order to reduce our expenses, in 2009 we completed a corporate and regional restructuring, which included the relocation of our corporate offices and the reorganization of our retail network, and also included the elimination of our regional management structure. These restructuring and reorganization activities allowed us to continue realizing cost savings into 2010.
In order to mitigate the impact of significant fluctuations in vehicle sales, we tie management and employee compensation at various operational levels to performance through incentive-based pay systems based on appropriate metrics. For example, a portion of management's stock-based compensation is based on overall performance criteria relative to our peer group, including, profitability growth, productivity improvement and return on invested capital measures. We also compensate our general managers, department managers and sales and other dealership personnel with incentive pay, based on metrics such as dealership profitability, departmental profitability and individual performance, as appropriate.
Flexible and Prudent Capital Allocation
Our capital allocation decisions are primarily based on our desire to maintain sufficient liquidity and a prudent capital structure. We continuously evaluate our liquidity and capital resources based upon (i) our cash and cash equivalents on hand, (ii) the funds that we expect to generate through future operations, (iii) current and expected borrowing availability under our revolving credit facilities, floor plan facilities and mortgage financing, (iv) amounts in our new vehicle floor plan notes payable offset accounts and (v) the potential impact of any contemplated or pending future transactions, including, but not limited to, financings, acquisitions, dispositions or other capital expenditures. As part of our balanced approach, we continuously evaluate capital deployment opportunities that we believe will maximize the value of our Company, including:
|
•
|
investing in our business and technology;
|
|
•
|
acquiring dealerships that meet our internal return threshold;
|
8
|
•
|
repurchase shares of our common stock in the open market; and
|
|
•
|
reducing our leverage through debt repurchases and purchasing properties currently under lease.
|
We may at some time in the future return some portion of capital to our shareholders through the payment of dividends.
Focus on Higher Margin Products and Services
While new vehicle sales are critical to drawing customers to our dealerships, parts and service, used vehicle retail sales, and F&I generally provide significantly higher profit margins and account for the majority of our profitability. In order to maximize the growth of these higher margin businesses, we have discipline-specific executives at both the corporate and dealership levels who focus on increasing the penetration of current services and expanding the breadth of our offerings to customers.
Local Management of Dealership Operations
We believe that local management of dealership operations enables our retail network to provide market-specific responses to sales, customer service and inventory requirements. The general managers of our dealerships are responsible for the operations, personnel and financial performance of their dealerships as well as other day-to-day operations. We believe our general managers’ familiarity with their markets enables them to effectively run day-to-day operations, market to customers and recruit new employees. The general manager of each dealership is supported, in most cases, by a new vehicle sales manager, a used vehicle sales manager, an F&I manager, and a parts and service manager. Our dealership management teams typically have many years of experience in the automotive retail industry. This management structure is complemented by support from the corporate office through centralized technology and financial oversight.
Commitment to Customer Service
We are focused on providing a high level of customer service and have designed our dealerships' services to meet the needs of an increasingly sophisticated and demanding automotive consumer. We endeavor to establish relationships that we believe will result in both repeat business and additional business through customer referrals. Furthermore, we provide our dealership managers with appropriate incentives to employ more efficient selling approaches, engage in extensive follow-up to develop long-term relationships with customers and extensively train our sales staff to meet customer needs.
We continually evaluate opportunities, and implement appropriate new technologies, to improve the buying experience for our customers, and believe that our ability to share best practices across our multi-jurisdictional platform gives us an advantage over independent dealerships. For example, we recently implemented a common customer relations management tool in all of our dealerships to facilitate communications with our customers before, during and after the sale. We continue to invest in technologies designed to improve our sales process and employee productivity, all with the goal of improving the customer experience.
In addition, our higher margin parts and service operations are an integral part of our overall approach to customer service, providing an opportunity to foster ongoing relationships and improve customer loyalty. We continue to train our technicians and service advisors to ensure that our customers continue to receive excellent service.
Centralized Administrative and Strategic Functions
Our corporate management is responsible for our capital structure and operating strategy while the implementation of our operating strategy rests with each dealership management team based on the policies and procedures established by corporate management. Corporate management continuously evaluates the financial and operating results of our dealerships, as well as each dealership's geographical location, and from time to time, makes decisions to acquire or dispose of dealerships to refine our dealership portfolio.
As part of our investment in our IT systems, in June 2010, we undertook the deployment of a common dealer management system (DMS) with the Dealer Services Group of Automatic Data Processing, Inc. as our provider. We expect the implementation of this system to be substantially complete by the end of the summer of 2011. We believe a single DMS will provide the foundation for future efficiencies and create a more efficient retail operation that will result in a better experience for our customers.
We consolidate financial, accounting and operational data received from our dealerships through customized financial products. Our IT approach enables us to integrate and aggregate information from our dealerships. Through the combination of
9
a common dealer management system and our corporate financial products, management can now view the financial, accounting and operational data at various levels of the organization. In addition, we have centralized our information technology, payroll and benefits administration from which we expect continued cost synergies.
Marketing
Consistent with our local management strategy, our advertising and marketing efforts are generally focused at the local market level, with the aim of building our business with a broad base of repeat, referral and new customers. Traditionally, we have spent the majority of our advertising dollars on television advertising. However, we are experiencing a continued shift toward Internet-based advertising, including lead generation. Recognizing the fact that customers are increasing their use of interactive tools to make buying decisions, we continue to invest in the development of our e-commerce strategy by:
|
•
|
focusing on the development of our brands online;
|
|
•
|
performing research to better understand the online consumer and their decision to visit one site versus another; and
|
|
•
|
increasing marketing spend on online marketing.
|
In addition, radio, print, direct mail and the yellow pages make up a significant portion of our remaining advertising spend. In addition, we also use electronic mail and social media channels to assist our marketing efforts and to stay in contact with our customers.
We have chosen to create common marketing materials for our brand names using professional advertising agencies. Our total company advertising expense from continuing operations was $26.4 million for the year ended
December 31, 2010
, which equals an average of $227 per retail vehicle sold. In addition, manufacturers’ direct advertising spending in support of their brands has historically been a significant component of the total amount spent on new car advertising in the United States.
Competition
For new vehicle sales, our dealerships compete with other franchised dealerships, primarily in their regions. We do not have any cost advantage in purchasing new vehicles from manufacturers. Instead, we rely on our advertising and merchandising, sales expertise, service reputation, strong local brand names and location of our dealerships to assist in the sale of new vehicles. Our used vehicle operations compete with other franchised dealers, large used car retail consolidators, regional and national vehicle rental companies, independent used car dealers, Internet-based vehicle brokers and private parties for supply and resale of used vehicles.
We compete with other franchised dealers to perform warranty repairs and with other automobile dealers and franchised and independent service centers for non-warranty repair and routine maintenance business. We compete with other automobile dealers, service stores and auto parts retailers in our parts operations. We believe that the principal competitive factors in parts and service sales are our ability to use factory-approved replacement parts, our competitive prices, our familiarity with a manufacturer’s brands and models, and the quality of our customer service.
In arranging financing for our customers’ vehicle purchases, we compete with a broad range of financial institutions. In addition, many financial institutions are now offering F&I products through the Internet, which may increase competition and reduce our profits on certain of these items. We believe that the principal competitive factors in providing financing are convenience, interest rates and flexibility in contract length.
In addition, given our desire to hire experienced, talented and successful individuals, the market for qualified employees in the industry and in the regions in which we operate, particularly for general managers and sales and service personnel, is highly competitive. As a result, we also compete with franchised dealers and other large automotive retailers for talented personnel.
Dealer and Framework Agreements
Each of our dealerships operates pursuant to a dealer agreement between the dealership and the manufacturer (or in some cases the distributor) of each brand of new vehicles sold and/or serviced at the dealership. A typical dealer agreement specifies the locations at which the dealer has the right and obligation to sell the manufacturer’s vehicles and related parts and products and/or to perform certain approved services. Each dealer agreement also governs the use of the manufacturer’s trademarks and service marks.
The allocation of new vehicles among dealerships is subject to the discretion of the manufacturer, and generally does not guarantee the dealership exclusivity within a given territory or otherwise. Most dealer agreements impose requirements on substantially all aspects of the dealer’s operations. For example, most of our dealer agreements contain provisions and standards related to, among other things, the following:
10
|
•
|
inventories of new vehicles and manufacturer replacement parts;
|
|
•
|
maintenance of minimum net working capital requirements, and in some cases, minimum net worth requirements;
|
|
•
|
achievement of certain sales and customer satisfaction targets;
|
|
•
|
advertising and marketing practices;
|
|
•
|
facilities and signs;
|
|
•
|
products offered to customers;
|
|
•
|
dealership management;
|
|
•
|
personnel training;
|
|
•
|
information systems;
|
|
•
|
geographic market; and
|
|
•
|
dealership monthly and annual financial reporting.
|
In addition to requirements under dealer agreements, we are subject to additional provisions contained in supplemental agreements, framework agreements, dealer addenda and manufacturers’ policies, collectively referred to as “framework agreements.” Framework agreements impose requirements on us in addition to those described above. Such agreements also define other standards and limitations, including:
|
•
|
company-wide performance criteria;
|
|
•
|
capitalization requirements;
|
|
•
|
limitations on changes in our ownership or management;
|
|
•
|
limitations on the number of a particular manufacturer’s franchises owned by us;
|
|
•
|
restrictions or prohibitions on our ability to pledge the stock of certain of our subsidiaries; and
|
|
•
|
conditions for consent to proposed acquisitions, including sales and customer satisfaction criteria, as well as limitations on the total local, regional and national market share percentage that would be represented by a particular manufacturer’s franchises owned by us after giving effect to a proposed acquisition.
|
Some dealer agreements and framework agreements grant the manufacturer the right to purchase its dealerships from us under certain circumstances, including upon the occurrence of an extraordinary corporate transaction without the manufacturer’s prior consent or a material breach of the framework agreement. Some of our dealer agreements and framework agreements also give the manufacturer a right of first refusal if we propose to sell any dealership representing the manufacturer’s brands to a third party. These agreements may also attempt to limit the protections available under applicable state laws and require us to resolve disputes through binding arbitration.
Certain of our dealer agreements expire after a specified period of time, ranging from one year to eight years, while other of our agreements have a perpetual term. We expect that we will be able to renew expiring agreements in the ordinary course of business. However, typical dealer agreements give the manufacturer the right to terminate or the option of non-renewal of the dealer agreements under certain circumstances, including:
|
•
|
insolvency or bankruptcy of the dealership;
|
|
•
|
failure to adequately operate the dealership or to maintain required capitalization levels;
|
|
•
|
impairment of the reputation or financial condition of the dealership;
|
|
•
|
change of control of the dealership without manufacturer approval;
|
|
•
|
failure to complete facility upgrades required by the manufacturer or agreed to by the dealer; or
|
|
•
|
material breach of other provisions of a dealer agreement.
|
While our dealer agreements may be terminated or not renewed for any of the reasons listed above, it may be possible to negotiate a waiver of termination or non-renewal with the manufacturer. Notwithstanding that, however, no assurances can be provided that upon the termination or attempted termination, or nonrenewal of any agreement, that we will be able to enter into new agreements, or waivers to any agreement, on acceptable terms, in a timely manner, or at all.
In certain instances, we may be entitled to benefit from the protection of applicable state laws which limit a manufacturer’s
11
ability to terminate or refuse to renew a franchise agreement, provide dealers with certain rights with respect to the addition of dealerships within proscribed geographic areas, and protect dealers against manufacturers unreasonably withholding consent to proposed changes in ownership of dealerships. However, our protection may be limited in some cases under our existing framework agreements with manufacturers, and the laws with respect to these activities may be changed at any time in the future.
Regulations
We operate in a highly regulated industry. Under various state laws each of our dealerships must obtain one or more licenses in order to establish, operate or relocate a dealership or operate an automotive repair service in such state. In addition, we are subject to numerous complex federal, state and local laws regulating the conduct of our business, including with respect to:
|
•
|
advertising;
|
|
•
|
motor vehicle and retail installment sales practices;
|
|
•
|
leasing;
|
|
•
|
sales of finance, insurance and vehicle protection products;
|
|
•
|
consumer credit;
|
|
•
|
unfair and deceptive trade practices;
|
|
•
|
consumer protection;
|
|
•
|
consumer privacy;
|
|
•
|
money laundering;
|
|
•
|
environmental matters;
|
|
•
|
land use and zoning;
|
|
•
|
health and safety; and
|
|
•
|
employment practices.
|
We actively make efforts to assure we are in compliance with the laws and related regulations that affect our business.
Environmental Matters
We are subject to a wide range of environmental laws and regulations, including those governing discharges into the air and water, the storage of petroleum substances and chemicals, the handling and disposal of wastes and the remediation of contamination. As with automobile dealerships generally, and service and parts and collision repair center operations in particular, our business involves the generation, use, handling and disposal of hazardous or toxic substances and wastes. Operations involving the management of wastes are subject to requirements of the Federal Resource Conservation and Recovery Act and comparable state statutes. Pursuant to these laws, federal and state environmental agencies have established approved methods for handling, storing, treating, transporting and disposing of regulated substances and wastes with which we must comply.
Our business also involves the use of above ground and underground storage tanks. Under applicable laws and regulations, we are responsible for the proper use, maintenance and abandonment of our regulated storage tanks and for remediation of subsurface soils and groundwater impacted by releases from existing or abandoned storage tanks. In addition to these regulated tanks, we own, operate, or have otherwise closed in place other underground and above ground devices or containers (such as automotive lifts and service pits) that may not be classified as regulated tanks, but which could or may have released stored materials into the environment, thereby potentially obligating us to clean up any soils or groundwater resulting from such releases.
We are also subject to laws and regulations governing remediation of contamination at or from our facilities or at facilities where we send hazardous or toxic substances or wastes for treatment, recycling or disposal. The Comprehensive Environmental Response, Compensation and Liability Act, or CERCLA, also known as the “Superfund” law, and similar state statutes, impose liability for the entire cost of a cleanup, without regard to fault or the legality of the original conduct, on those that are considered to have contributed to the release of a “hazardous substance.” Responsible parties include the owner or operator of
12
the site or sites where the release occurred and companies that disposed or arranged for the disposal of the hazardous substances released at such sites. These responsible parties also may be liable for damages to natural resources. It is not uncommon for neighboring landowners and other third parties to file claims for personal injury and property damage allegedly caused by the release of hazardous substances. Currently, we are not aware of any material “Superfund” or other remedial liabilities to which we are subject.
Further, the Federal Clean Water Act and comparable state statutes prohibit discharges of pollutants into regulated waters without the necessary permits, require containment of potential discharges of oil or hazardous substances and require preparation of spill contingency plans. We are not aware of any non-compliance with the wastewater discharge requirements, requirements for the containment of potential discharges and spill contingency planning or other environmental laws applicable to our operations.
Environmental laws and regulations are very complex and it has become difficult for businesses that routinely handle hazardous and non-hazardous wastes to achieve and maintain full compliance with all applicable environmental laws. From time to time we may experience incidents and encounter conditions that are not in compliance with environmental laws and regulations. However, none of our dealerships has been subject to any material environmental liabilities in the past, nor do we know of any fact or condition that would result in any material environmental liabilities being incurred in the future. Nevertheless, environmental laws and regulations and their interpretation and enforcement change frequently and we believe that the trend of more expansive and stricter environmental legislation and regulations is likely to continue. As a result, there can be no assurance that compliance with environmental laws or regulations or the future discovery of unknown environmental conditions will not require additional expenditures by us, or that such expenditures would not be material. Our operations are subject to substantial changes in laws and regulations and related claims and proceedings, any of which could adversely affect our business, financial condition and results of operations.
Employees
As of
December 31, 2010
, we employed approximately 7,100 people. We believe our relationship with our employees is favorable. We do not have employees that are represented by a labor union; however, certain of our facilities are located in areas of high union concentration, and such facilities are susceptible to union-organizing activity. Although we have not experience any strikes or walkouts at our operations, because of our dependence on vehicle manufacturers, we may be affected adversely by labor strikes, work slowdowns and walkouts at vehicle manufacturers’ production facilities and transportation modes that are outside of our control.
Insurance
Because of the vehicle inventory and the nature of the automotive retail business, automobile retail dealerships generally require significant levels of insurance covering a broad variety of risks. Our insurance program includes multiple umbrella policies with a total per occurrence and aggregate limit of $100.0 million. We are self insured for certain employee medical claims and maintain stop loss insurance for individual claims. We have large deductible insurance programs in place for workers compensation, property and general liability claims.
In addition to the other information in this report, you should consider carefully the following risk factors when evaluating our business. Any of these risks, or the occurrence of any of the events described in these risk factors, could cause our actual future results, performance or achievements to be materially different from or could materially adversely affect our business, financial condition or results of operations. In addition, other risks or uncertainties not presently known to us or that we currently do not deem material could arise, any of which could also materially adversely affect us.
If the automotive retail environment continues to be challenging and our dealerships are unable to generate sufficient cash, our liquidity position may be materially adversely affected.
For the last three years, the automotive retail industry has experienced an unprecedented challenging environment. The seasonally adjusted annual rate (“SAAR”) of new vehicle sales in the U.S., which was over 16.0 million from 1999 to 2007, decreased to approximately 13.2 million in 2008 and 10.4 million in 2009. While the automotive retail industry experienced a modest recovery in 2010 with a 11.6 million SAAR, we believe improvement in the industry will continue to be slow, with SAAR expected to reach only 12.5 million to 13.0 million in 2011. Our operations have been and could continue to be adversely affected by the continuance of uncertain economic conditions. We also expect continued difficulty for consumers in securing vehicle financing as unemployment remains higher than recent historical averages. If consumers are unable to secure financing to purchase vehicles, SAAR could be further negatively impacted, which in turn could adversely impact our cash flows.
13
If we are unable to generate sufficient operating cash flow, we may need to enter into certain extraordinary transactions in order to generate sufficient cash to sustain our operations, which may include, but not be limited to selling certain of our dealerships or other assets and borrowing under our existing credit facilities. There can be no assurance that, if necessary, we will be able to enter into any such transactions in a timely manner or on reasonable terms, if at all. Furthermore, in the event we are required to sell dealership assets to enhance our liquidity, the sale of any material portion of such assets could have an adverse effect on our revenue stream, the size of our operations and certain corporate efficiencies. If we are unable to generate sufficient operating cash flow or enter into any such transactions in a timely manner, our liquidity may be materially adversely affected.
Our dealerships’ profitability depends in large part upon customer demand for the particular vehicle lines they carry.
The profitability of our dealerships depends in large part on the overall success of the vehicle lines they carry. Historically, we have generated most of our revenue through new vehicle sales. New vehicle sales also tend to lead to sales of higher-margin products and services such as finance and insurance products and parts and services. Although we have sought to limit our dependence on any one vehicle brand, we have focused our new vehicle sales operations on mid-line import and luxury brands. Our current brand mix is weighted 86% towards luxury and mid-line import brands, with the remaining 14% consisting of domestic brands. For the year ended
December 31, 2010
, brands representing 5% or more of our revenues from new vehicle sales were as follows:
|
Brand
|
% of Total
New Vehicle
Revenues
|
|
|
Honda
|
23
|
%
|
|
Nissan
|
13
|
%
|
|
Toyota
|
10
|
%
|
|
BMW
|
9
|
%
|
|
Mercedes-Benz
|
8
|
%
|
|
Ford
|
8
|
%
|
|
Lexus
|
6
|
%
|
|
Acura
|
5
|
%
|
|
Infiniti
|
5
|
%
|
If a manufacturer fails to produce desirable vehicles or develops a reputation for producing undesirable vehicles, and we own dealerships that sell that manufacturer’s vehicles, our revenues at those dealerships could be adversely affected as consumers shift their vehicle purchases toward more desirable brands, makes and models. If the profitability at certain of our dealerships is adversely affected, there could be an significant reduction of our cash flows, which in turn could result in impairments of such dealership's properties and/or intangible assets.
We depend on our ability to obtain a desirable mix of popular new vehicles from manufacturers. Typically, popular vehicles produce the highest profit margins but are the most difficult to obtain from manufacturers. Manufacturers generally allocate their vehicles among their franchised dealerships based on the sales history of each dealership, and in some instances on the level of capital expenditures associated with such dealerships. If our dealerships experience prolonged periods of sales declines, those manufacturers may cut back their allotments of popular vehicles to our dealerships and, as a result, our new vehicle sales and profits may decline.
Changes or declines in consumer demand, due to general economic conditions, changes in preferences, or otherwise, could adversely affect us.
Our business is heavily dependent on consumer demand and preferences. Further, retail vehicle sales are cyclical and historically have experienced periodic downturns characterized by oversupply and weak demand. These cycles are often dependent on general economic conditions and consumer confidence, as well as levels of discretionary personal income, credit availability and interest rates. The current uncertain economic climate in the U.S. continues to have a significant impact on our retail business, particularly sales of new and used automobiles, especially as unemployment rates remain high and housing prices remain unstable. In addition, fuel prices have been unstable and have reached historically high levels in the recent past. Significant increases in gasoline prices could cause a reduction in automobile purchases and a further shift in buying patterns from luxury or SUV models (which typically provide higher profit margins to retailers like us) to smaller, more economical vehicles (which typically have lower profit margins). A continued shift in preferences by consumers for smaller, more economic vehicles may have an adverse effect on our revenues and results of operations.
14
While a decline in demand for new vehicles in some instances creates additional demand for parts and services due to the aging of and increased wear and tear on existing vehicles, in difficult economic conditions, people often delay nonessential service and repairs on their vehicles. Continued delays on the service and repairs of vehicles due to general economic conditions or otherwise could have a further adverse effect on our parts and service business, which has traditionally produced higher profit margins for our business, and thus could also have a material adverse effect on our revenues and results of operations. Conversely, in the recent past, we have seen the prices of used vehicles generally increase, which increase has created a demand for new vehicles. A continual increase in the number of new vehicle sales over the number of used vehicle sales could have an adverse effect on our revenues and results of operations as used vehicle sales have traditionally produced higher profit margins for our business. Furthermore, the general increase in the cost of vehicles to us, coupled with lower manufacturer incentives and customers who seek to pay the lowest price possible for vehicles, has resulted in continued pressure on our profit margins. A continued decrease in our profit margins could have a material adverse effect on our cash flows, our results of operations and our business.
We have significant debt, and the ability to incur additional debt may limit our flexibility to manage our business. Furthermore, if we are unable to generate sufficient cash, our ability to service our debt may be materially adversely affected.
We have substantial debt service obligations. As of
December 31, 2010
, we had total debt of $550.7 million, including $5.2 million classified as Liabilities Associated with Assets Held for Sale, but excluding floor plan notes payable and the $1.7 million unamortized discount on our 3% Convertible Notes due 2012 (the "3% Convertible Notes") on our Consolidated Balance Sheet. In addition, we and our subsidiaries have the ability to obtain additional debt from time to time to finance acquisitions, real property purchases, capital expenditures or for other purposes, subject to the restrictions contained in our BofA Revolving Credit Facility, our JPMorgan Used Vehicle Floor Plan Facility and the indentures governing our 8.375% Senior Subordinated Notes due 2020 (the "8.375% Notes") and our 7.625% Senior Subordinated Notes due 2017 (the “7.625% Notes”), as well as certain other agreements. We will continue to have substantial debt service obligations, consisting of required cash payments of principal and interest, for the foreseeable future.
Our significant indebtedness could have important consequences to us, including the following:
|
•
|
our ability to obtain additional financing for acquisitions, capital expenditures, working capital or other general corporate purposes may be impaired;
|
|
•
|
a substantial portion of our current cash flow from operating activities must be dedicated to the payment of principal and interest on our debt, thereby reducing the funds available to us for our operations and other corporate purposes;
|
|
•
|
some of our borrowings are and will continue to be at variable rates of interest, which exposes us to certain risks of interest rate increases; and
|
|
•
|
we may be substantially more leveraged than some of our competitors, which may place us at a relative competitive disadvantage and make us more vulnerable to changes in market conditions and governmental regulations.
|
As a result of the foregoing and other potential limitations, our indebtedness obligations may limit our ability to take strategic actions that would otherwise enable us to manage our business, in a manner in which we otherwise would, absent such limitations, which could materially adversely affect our business, financial condition and results of operations.
Under various agreements to which we are a party, we are required to maintain compliance with certain financial and other covenants. Our failure to comply with certain covenants in our debt, mortgage, lease and framework agreements could adversely affect our ability to access our revolving credit facilities and adversely affect our ability to conduct our business.
There are operating and financial restrictions and covenants in certain of our leases and in our debt instruments, including our revolving credit facilities with Bank of America, N.A. and JPMorgan Chase Bank, N.A., the indentures governing our 8.375% Notes and our 7.625% Notes and the mortgage agreements or guarantees for mortgages held by Wells Fargo Bank, N.A., successor to Wachovia Bank, National Association, and Wachovia Financial Services, Inc., and certain of our other mortgage obligations. These limit, among other things, our ability to incur certain additional debt, to create certain liens or other encumbrances, and to make certain payments (including dividends and repurchases of our shares and investments). Our revolving credit facilities, mortgages and/or guarantees related to such mortgages, and certain of our lease and framework agreements, require us to maintain compliance with certain financial ratios.
If we are unable to comply with any applicable financial or other covenants, we may be required to seek waivers of or modifications to our covenants from our lenders, or we may need to undertake a transaction designed to generate proceeds sufficient to repay such debt. Obtaining such waivers or modifications often requires the payment to the bank lenders of significant fees and requires significant time and attention of management. In light of continued uncertain conditions in the
15
automotive industry and the conditions in the credit markets generally, we cannot give any assurance that we would be able to successfully take any necessary actions at times, or on terms acceptable to us.
We are currently in compliance with all applicable financial and other covenants. However, our failure to satisfy any of these covenants in the future would constitute a default under the relevant debt agreement, which would (i) entitle the lenders under such agreement to terminate our ability to borrow under the relevant agreement and accelerate our obligations to repay outstanding borrowings; (ii) require us to apply our available cash to repay these borrowings and/or (iii) prevent us from making debt service payments on our 8.375% Notes, our 7.625% Notes, and our 3% Convertible Notes. In many cases, a default under one of our debt agreements could trigger cross default provisions in one or more of our other debt and lease agreements.
In addition to the financial and other covenants contained in our various financing agreements, a number of our dealerships are located on properties that we lease. Certain of the leases governing such properties have certain covenants with which we must comply. If we fail to comply with the covenants under our leases, the respective landlords could, among other remedies, terminate the leases and seek damages which could equal the amount to which the accelerated rents under the applicable lease for the remainder of the lease term exceeds the fair market rent over the same period, or evict us from the property.
Similarly, our failure to comply with financial and other covenants in our framework agreements would give the relevant manufacturer certain rights, including the right to reject proposed acquisitions, and may give them the right to repurchase their franchises from us. Events that give rise to such rights, and our inability to acquire additional dealerships or the requirement that we sell one or more of our dealerships at any time, could inhibit the growth of our business, and could have a material adverse effect on our business, financial condition and results of operations.
A general disruption in the credit markets could negatively impact our business, results of operations, financial condition or liquidity.
In the recent past, global financial markets and economic conditions have been disruptive and volatile, and continue to be uncertain. These issues, along with significant write-offs in the financial services sector, the re-pricing of certain credit risks and continued weak economic conditions in certain industries and sectors have made it difficult to obtain funding.
We currently maintain revolving credit facilities with Bank of America, N.A., JPMorgan Chase Bank, N.A., and a syndicate of other banks under those credit facilities, and we have hedge transactions in place with Wells Fargo Bank, N.A., Wachovia Financial Services, Inc., Goldman Sachs & Co. and Deutsche Bank AG, London Branch. If any of these financial institutions that have extended credit commitments to us or have entered into hedge or similar transactions with us are further adversely affected by the current uncertain conditions in the U.S. and international capital markets, they may become unable or unwilling to fund borrowings under their credit commitments to us or otherwise fulfill their obligations under the relevant agreements, which could have a material adverse effect on our liquidity and ability to conduct our operations.
Furthermore, the cost of obtaining money from the credit markets generally has increased in connection with the uncertain financial markets, as many lenders and institutional investors have increased interest rates, enacted more stringent lending standards, refused to refinance existing debt and reduced and, in some cases, ceased to provide funding to borrowers. Our inability to access necessary or desirable funding, or to enter into certain related transactions, when and at costs deemed appropriate by us could have a negative impact on our business, financial condition and liquidity.
Our capital costs and our results of operations may be materially and adversely affected by changes in interest rates.
We generally finance our purchases of new vehicle inventory and have the ability to finance the purchase of used vehicle inventory using floor plan credit facilities under which we are charged interest at variable rates. In addition, we have the ability to borrow funds under our various credit facilities at variable interest rates. Therefore, our interest expense from variable rate debt will rise with increases in interest rates. In addition, a significant rise in interest rates may also have the effect of depressing demand in the interest rate sensitive aspects of our business, particularly new and used vehicle sales, because most of our customers finance their vehicle purchases. As a result, rising interest rates may have the effect of simultaneously increasing our costs and reducing our revenues. Given our debt composition as of
December 31, 2010
, each one percent increase in market interest rates would increase our total annual interest expense, including floor plan interest, by as much as$4.8 million. When considered in connection with reduced expected sales as and if interest rates increase, any such increase could materially adversely affect our business, financial condition and results of operations.
Adverse conditions affecting the manufacturers of the vehicles that we sell may negatively impact our revenues and profitability.
16
Our ability to successfully market vehicles to the public depends to a great extent on aspects of our manufacturers’ operations. Vehicle manufacturers have been, and continue to be, adversely affected by the recent U.S. and global recession. There has been a significant decline in vehicle sales, and other factors, such as rising interest rates and the tightening of the credit markets, have contributed to a difficult retail environment. In addition, conditions which further negatively affect vehicle manufacturers in any of the following areas could have an adverse effect on their respective revenues and profitability:
|
•
|
financial condition;
|
|
•
|
marketing efforts;
|
|
•
|
reputation for quality;
|
|
•
|
manufacturer and other product defects, including recalls;
|
|
•
|
management;
|
|
•
|
disruption in manufacturing, importation and distribution; and
|
|
•
|
labor relations.
|
Adverse conditions that materially affect a vehicle manufacturer and impact its ability to profitably design, market, produce or distribute new vehicles could in turn materially adversely affect our ability to (i) sell vehicles produced by that manufacturer, obtain or finance our desired new vehicle inventories, (ii) access or benefit from manufacturer financial assistance programs, (iii) collect in full or on a timely basis any amounts due therefrom, and/or (iv) to obtain other goods and services provided by the impacted manufacturer. Our business, results of operations, financial condition, cash flows, and prospects could be materially adversely affected as a result of any event that has an adverse effect on any vehicle manufacturers or distributors.
In addition, if a vehicle manufacturer seeks protection from creditors in bankruptcy, among other things, (i) the manufacturer could seek to terminate or reject all or certain of our franchises, (ii) if the manufacturer is successful in terminating all or certain of our franchises, we may not receive adequate compensation for those franchises, (iii) our cost to obtain financing for our new vehicle inventory may increase or no longer be available from such manufacturer’s captive finance subsidiary, (iv) consumer demand for such manufacturer’s products could be materially adversely affected, especially if costs related to improving such manufacturer’s poor financial condition are imputed to the price of its products, (v) there may be a significant disruption in the availability of consumer credit to purchase or lease vehicles or negative changes in the terms of such financing, which may negatively impact our sales, or (vi) there may be a reduction in the value of receivables and inventory associated with that manufacturer. The occurrence of any one or more of the above-mentioned events could have a material adverse effect on our business and results of operations.
If vehicle manufacturers reduce or discontinue sales incentive, warranties or other promotional programs, our results of operations, cash flows and financial condition may be adversely affected.
Our dealerships benefit from certain sales incentives, warranties and other promotional programs of vehicle manufacturers that are intended to promote and support their respective new vehicle sales. Some key incentive programs include:
|
•
|
customer rebates on new vehicles;
|
|
•
|
dealer incentives on new vehicles;
|
|
•
|
special financing or leasing terms;
|
|
•
|
warranties on new and used vehicles; and
|
|
•
|
sponsorship of used vehicle sales by authorized new vehicle dealers.
|
Manufacturers often make many changes to their incentive programs during each year. Any reduction or discontinuation of key manufacturers’ incentive programs may reduce our sales volume which, in turn, could have a material adverse effect on our results of operations, cash flows and financial condition.
Our sales of vehicles, our results of operations and financial condition have been and may continue to be adversely affected by depressed levels of available consumer financing.
The majority of vehicle purchase transactions are financed, particularly used vehicle transactions. During the recent global recession, consumers experienced a decline in the availability of credit due to a number of factors, including an overall tightening of the lending markets. In addition, manufacturers decreased the availability of leases or terminated leasing programs altogether. The reduced availability of credit and the increase in the cost to consumers for such credit has contributed to the decline in our vehicle sales. A continued reduction in credit availability, or continued high costs thereof, could result in a
17
decline in our vehicle sales that could have a material adverse effect on our business, financial condition and results of operations.
Sub-prime lenders have historically provided financing to those buyers who, for a number of reasons, do not have access to traditional financing, including those buyers who have a poor credit history or lack the down payment necessary to purchase a vehicle. Sub-prime lenders have recently become more stringent with their credit standards, which has made it more difficult for consumers needing sub-prime financing to obtain credit. Furthermore, the sub-prime lenders may continue to apply higher credit requirements in the future. If the current levels of availability of credit in the sub-prime lending market continue, the ability of these consumers to purchase vehicles could remain limited, resulting in a decline in our used vehicle sales. Retail sales of used vehicles generally have higher gross margins than new vehicles. A decline in our used vehicle sales could have a material adverse effect on our revenues and an adverse effect on our profitability.
Our business may be adversely affected by unfavorable conditions in one or more of our local markets, even if those conditions are not prominent nationally.
Our overall corporate results are also subject to local economic, competitive and other conditions prevailing in the various geographic markets in which we operate. Our dealerships currently are located in the Atlanta, Austin, Charlotte, Charlottesville, Dallas-Fort Worth, Durham, Fayetteville, Fort Pierce, Fresno, Greensboro, Greenville, Houston, Jackson, Jacksonville, Little Rock, Orlando, Princeton, Richmond, St. Louis and Tampa markets. If economic conditions remain uncertain, consumer spending remains low or competition for services offered by automotive retailers remains significant in any of these markets, or any of these factors becomes exacerbated, our results of operations, revenues and profitability could be adversely affected.
If we fail to obtain renewals of one or more of our dealer agreements on acceptable terms, if certain of our franchises are terminated, or if certain manufacturers’ rights under their agreements with us are triggered, our business, financial condition and results of operations may be adversely affected.
Each of our dealerships operates under the terms of a dealer agreement with the manufacturer (or manufacturer-authorized distributor) of each new vehicle brand it carries and/or is authorized to service, and we operate under additional framework agreements for some vehicle manufacturers, which contain additional requirements that govern the particular vehicle manufacturer’s franchises. Our dealerships may obtain new vehicles from manufacturers, service vehicles, sell new vehicles and display vehicle manufacturers’ trademarks only to the extent permitted under these agreements. As a result of the terms of our dealer, framework and related agreements and our dependence on the rights, granted by the manufacturers, the manufacturers have the right to exercise a great deal of control over our day-to-day operations, and the terms of these agreements govern key aspects of our operations, acquisition strategy and capital spending.
Our dealer agreements may be terminated or not renewed by manufacturers for a number of reasons, and many of the manufacturers have the right to direct us to divest our dealerships if there is a default under the franchise agreement, an unapproved change of control, or certain other unapproved events. Our dealer agreements are scheduled to expire at various times. Although we expect that these agreements will be renewed, there can be no assurances that we will be able to renew these agreements on a timely basis or that we will be able to obtain renewals on acceptable terms. Most of our dealer agreements also provide the manufacturer with a right of first refusal to purchase any of the manufacturer’s franchises we seek to sell. Our results of operations may be materially and adversely affected to the extent that our rights become compromised or our operations are restricted due to the terms of our dealer agreements or if we lose franchises representing a significant percentage of our revenues.
Our failure to meet consumer satisfaction, financial or sales performance requirements specified by manufacturers may adversely affect our ability to acquire new dealerships and our profitability.
Many manufacturers attempt to measure customers’ satisfaction with their experience in our sales and service departments through rating systems that are generally known in the automotive retailing industry as consumer satisfaction indices (“CSI”). The use of CSI ratings by manufacturers is in addition to their right to monitor the financial and sales performance of our dealerships. At the time we acquire a dealership or enter into a new dealer or framework agreement, manufacturers will often establish sales or performance criteria for that dealership. In accordance with the terms of these agreements, these criteria have been modified by various manufacturers from time to time in the past, and we cannot assure you that they will not be further modified or replaced by different criteria in the future. Some of our dealerships have had difficulty from time to time meeting these criteria in the past. We cannot assure you that any of our dealerships will be able to comply with these criteria in the future.
In accordance with the terms of an applicable framework agreement, a manufacturer may use these criteria as factors in evaluating any application we may make for acquisitions of additional dealerships. A manufacturer may refuse to consent to our acquisition of one of its franchises if it determines our dealerships do not comply with its performance criteria. This would
18
impede our ability to execute acquisitions and limit our ability to grow. In addition, we receive payments and incentives from certain manufacturers based, in part, on our CSI ratings, and future payments may be materially reduced or eliminated if our CSI ratings do not meet stated criteria.
Manufacturers’ actions in connection with any proposed acquisitions or divestitures may limit our future growth and impact our business, financial condition or results of operations.
We are generally required to obtain manufacturer consent before we can acquire any additional dealerships selling such manufacturer’s automobiles. In addition, many of our dealer and framework agreements require that we meet certain CSI rating and sales performance criteria as a condition to additional dealership acquisitions. We cannot assure you that we will be able to meet these performance criteria at any applicable time or that manufacturers will consent to future acquisitions, which may prevent us from being able to take advantage of market opportunities, and may limit our ability to expand our business. The process of applying for and obtaining manufacturer consents can take a significant amount of time, generally between 60 and 90 days or more. Delays in consummating acquisitions caused by this process may negatively affect our ability to acquire dealerships that we believe will produce acquisition synergies and integrate well into our overall strategy. In addition, manufacturers typically establish minimum capital requirements for each of their dealerships on a case-by-case basis. As a condition to granting consent to a proposed acquisition, a manufacturer may require us to remodel and upgrade our facilities and capitalize the subject dealership at levels we would not otherwise choose to fund, causing us to divert our financial resources away from uses that management believes may be of higher long-term value to us. Furthermore, the exercise by manufacturers of their right of first refusal to acquire a dealership may prevent us from acquiring dealerships that we otherwise would acquire which could have an adverse effect on our ability to grow through acquisitions.
Likewise, from time to time, we may determine that it is in our best interest to sell one or more of our dealerships. Parties that are interested in acquiring any dealership may also be required to obtain the consent of the manufacturer. The refusal by the manufacturer to approve a potential buyer may delay the sale of that dealership, and would require us to find another potential buyer or wait until the buyer is able to meet the requirements of the manufacturer. A delay in the sale of a dealership could have a negative impact on our profitability and an adverse effect on our business, financial condition or results of operations.
Additionally, many vehicle manufacturers place limits on the total number of franchises that any group of affiliated dealerships may own. Certain manufacturers place limits on the number of franchises or share of total brand vehicle sales that may be maintained by an affiliated dealership group on a national, regional or local basis, as well as limits on store ownership in contiguous markets. If we reach any of these limits, we may be prevented from making further acquisitions, which could negatively affect our future growth.
If state laws that protect automotive retailers are repealed, weakened or superseded by our framework agreements with manufacturers, our dealerships will be more susceptible to termination, non-renewal or renegotiation of their dealer agreements.
Applicable state laws generally provide that an automobile manufacturer may not terminate or refuse to renew a dealer agreement unless it has first provided the dealer with written notice setting forth “good cause” and stating the grounds for termination or non-renewal. Some state laws allow dealers to file protests or petitions or allow them to attempt to comply with the manufacturer’s criteria within a notice period to avoid the termination or non-renewal. Though unsuccessful to date, manufacturers’ lobbying efforts may lead to the repeal or revision of applicable state laws. Our framework agreements with certain manufacturers contain provisions that, among other things, attempt to limit the protections available to dealers under applicable state laws. If these laws are repealed in the states in which we operate, manufacturers may be able to terminate our franchises without providing advance notice, an opportunity to cure or a showing of good cause. Without the protection of these state laws, it may also be more difficult for us to renew our dealer agreements upon expiration. Changes in laws that provide manufacturers the ability to terminate our dealer agreements could materially adversely affect our business, financial condition and results of operations. Furthermore, if a manufacturer seeks protection from creditors in bankruptcy, courts have held that the federal bankruptcy laws may supersede the state laws that protect automotive retailers resulting in either the termination, non-renewal or rejection of franchises by such manufacturers.
Manufacturers’ restrictions regarding a change in our stock ownership may result in the termination or forced sale of our franchises, which may have a number of impacts on us, including adversely impacting our business, financial condition and results of operations, or even deterring an acquisition of us.
Some of our dealer agreements and framework agreements with manufacturers prohibit transfers of any ownership interests of a dealership or, in some cases, its parent, without the applicable manufacturer’s consent. Our agreements with some manufacturers provide that, under certain circumstances, the manufacturer would have the right to terminate our agreement or force a sale of our franchise if a person or entity acquires an ownership interest in us above a specified level or if a person or entity acquires the right to vote a specified percentage of our common stock without the approval of the applicable
19
manufacturer. Triggers of these clauses are often based upon actions by our stockholders and are generally outside of our control, and may result in the termination or non-renewal of our dealer and framework agreements or forced sale of one or more franchises, which may have a material adverse effect on us. These restrictions may also prevent or deter prospective acquirers from acquiring control of us and, therefore, may adversely impact the value of our common stock.
Our business is seasonal, and events occurring during seasons that revenues are typically higher may disproportionately affect our results of operations and financial condition.
The automobile industry is subject to seasonal variations in revenues. Demand for vehicles is generally lower during the first and fourth quarters of each year. Accordingly, we expect our revenues and operating results generally to be lower in the first and fourth quarters than in the second and third quarters of any year. If conditions occur during the second or third quarters that weaken automotive sales, such as severe weather in the geographic areas in which our dealerships operate, war, high fuel costs, depressed economic conditions or similar adverse conditions, our revenues for the year may be disproportionately adversely affected.
Our business may be adversely affected by import product restrictions, foreign trade risks and currency valuations that may impair our ability to sell foreign vehicles or parts profitably.
A portion of our new vehicle business involves the sale of vehicles, parts or vehicles composed of parts that are manufactured outside the U.S. As a result, our operations are subject to customary risks of importing merchandise, including import duties, exchange rates, trade restrictions, work stoppages and general political and socio-economic conditions in other countries. The U.S. or the countries from which our products are imported may, from time to time, impose new quotas, duties, tariffs or other restrictions, or adjust presently prevailing quotas, duties or tariffs, which may affect our operations and our ability to purchase imported vehicles and/or parts at reasonable prices. Relative weakness of the U.S. dollar against foreign currencies in the future may result in an increase in costs to us and in the retail price of such vehicles or parts, which could discourage consumers from purchasing such vehicles and adversely impact our profitability.
If we are unable to acquire and successfully integrate additional dealerships, we may be unable to realize desired results and be required to divert resources from comparatively more profitable operations.
We believe that the automobile retailing industry is a mature industry whose sales are significantly impacted by the prevailing economic climate, both nationally and in local markets. Accordingly, we believe that our future growth depends in part on our ability to manage expansion, control costs in our operations and acquire and effectively and efficiently integrate acquired dealerships into our organization. When seeking to acquire and acquiring other dealerships, we face risks commonly encountered with growth through acquisitions. These risks include, but are not limited to:
|
•
|
failing to obtain manufacturers’ consents to acquisitions of additional franchises;
|
|
•
|
incurring significant transaction related costs for both completed and failed acquisitions;
|
|
•
|
incurring significantly higher capital expenditures and operating expenses;
|
|
•
|
failing to integrate the operations and personnel of the acquired dealerships and impairing relationships with employees;
|
|
•
|
incurring undisclosed liabilities at acquired dealerships;
|
|
•
|
disrupting our ongoing business and diverting our management resources to newly acquired dealerships; and
|
|
•
|
impairing relationships with manufacturers and customers as a result of changes in management.
|
We may not adequately anticipate all the demands that our growth will impose on our personnel, procedures and structures, including our financial and reporting control systems, data processing systems and management structure. Moreover, our failure to retain qualified management personnel at any acquired dealership may increase the risks associated with integrating the acquired dealership. If we cannot adequately anticipate and respond to these demands, we may fail to realize acquisition synergies and our resources will be focused on incorporating new operations into our structure rather than on areas that may be more profitable.
There is competition to acquire automotive dealerships, and we may not be able to grow our business through acquisitions if attractive targets are not available or if market values result in prices at levels that we do not believe offer an acceptable rate of return.
We believe that the U.S. automotive retailing market is fragmented and offers many potential acquisition candidates. However, we often compete with several other national, regional and local dealer groups, and other strategic and financial
20
buyers, some of which may have greater financial resources, in evaluating potential acquisition candidates. Competition for attractive acquisition targets may result in fewer acquisition opportunities for us, and increased acquisition costs. We may have to forego acquisition opportunities to the extent that we cannot negotiate such acquisitions on acceptable terms.
Substantial competition in automobile sales and services may adversely affect our profitability.
The automotive retail and service industry is highly competitive with respect to price, service, location and selection. Our competition includes:
|
•
|
franchised automobile dealerships in our markets that sell the same or similar new and used vehicles;
|
|
•
|
privately negotiated sales of used vehicles;
|
|
•
|
other used vehicle retailers, including regional and national vehicle rental companies;
|
|
•
|
Internet-based used vehicle brokers that sell used vehicles to consumers;
|
|
•
|
service center chain stores; and
|
|
•
|
independent service and repair shops.
|
We do not have any cost advantage in purchasing new vehicles from manufacturers. We typically rely on our advertising, merchandising, sales expertise, service reputation and dealership location to sell new and used vehicles. Further, our dealer agreements do not grant us the exclusive right to sell a manufacturer’s product within a given geographic area. Our revenues and profitability may be materially and adversely affected if competing dealerships expand their market share or additional franchises are awarded in our markets.
Property loss or other uninsured liabilities at some of our dealerships could impact our financial condition and results of operations.
The automotive retail business is subject to substantial risk of property loss due to the significant concentration of property at dealership locations, including vehicles and parts. We have historically experienced business interruptions from time to time at several of our dealerships due to adverse weather conditions or other extraordinary events, such as hurricanes in Florida and tornadoes and hail storms in Texas and Mississippi. Other potential liabilities arising out of our operations may involve claims by employees, customers or third parties for personal injury or property damage and potential fines and penalties in connection with alleged violations of regulatory requirements. To the extent we experience future events such as these, or others, our results of operations, financial condition or cash flows may be materially adversely impacted.
While we maintain insurance to protect against a number of losses, this insurance coverage often contains significant deductibles which we must pay prior to obtaining insurance coverage. In addition, we choose to “self-insure” for a portion of our potential liabilities, meaning we do not carry insurance from a third party for such liabilities, and are wholly responsible for any related losses. Furthermore, the laws of some states prohibit insurance against certain types of liabilities, and so we self-insure for those liabilities.
In certain instances, our insurance may not fully cover a loss depending on the applicable deductible or the magnitude and nature of the claim. Additionally, changes in the cost or availability of insurance in the future could substantially increase our costs to maintain our current level of coverage or could cause us to reduce our insurance coverage and increase our self-insured risks. To the extent we incur significant additional costs for insurance, suffer losses that are not covered by in-force insurance or suffer losses for which we are self-insured, our financial condition and results of operations could be materially adversely impacted.
Business interruptions at any of our dealerships due to a failure of any of our management information systems, including our inability to successfully convert our dealerships to a common dealer management system, could have a material adverse effect on our business, results of operations, financial condition and cash flow.
We rely on management information systems at our dealerships which are licensed from third parties and are used in all aspects of our sales and service efforts, as well as in the preparation of our consolidated financial and operating data. In 2010, we began the conversion of our dealer management systems to a common dealer management system (“DMS”) provided by ADP. Currently, approximately 30% of our dealerships have been successfully converted to the ADP DMS, and we expect to substantially complete the remaining conversions of our dealerships by the end of the summer of 2011. Our business could be significantly disrupted if (i) we are unable to successfully convert the remaining dealerships to the ADP DMS, (ii) the ADP DMS fails to integrate with other third party management information systems, customer relations management tools or other software, or to the extent any of these systems become unavailable to us for any reason, or (iii) if our relationship deteriorates with ADP or any of our other third-party providers. Any such disruption in our business could materially adversely affect our
21
results of operations, financial condition and cash flow.
Government regulations and environmental regulation compliance costs may adversely affect our profitability.
We are, and expect to continue to be, subject to a wide range of federal, state and local laws and regulations, including local licensing requirements. These laws regulate the conduct of our business, including:
|
•
|
motor vehicle and retail installment sales practices;
|
|
•
|
leasing;
|
|
•
|
sales of finance, insurance and vehicle protection products;
|
|
•
|
consumer credit;
|
|
•
|
deceptive trade practices;
|
|
•
|
consumer protection;
|
|
•
|
consumer privacy;
|
|
•
|
money laundering;
|
|
•
|
advertising;
|
|
•
|
land use and zoning; and
|
|
•
|
health and safety; and
|
|
•
|
employment practices.
|
Environmental laws and regulations govern, among other things, discharges into the air and water, storage of petroleum substances and chemicals, the handling and disposal of wastes and remediation of contamination arising from spills and releases. In addition, we may also have liability in connection with materials that were sent to third-party recycling, treatment and/or disposal facilities under federal and state statutes. These federal and state statutes impose liability for investigation and remediation of contamination without regard to fault or the legality of the conduct that contributed to the contamination. Similar to many of our competitors, we have incurred and expect to continue to incur capital and operating expenditures and other costs in complying with such federal and state statutes. In addition, we may be subject to broad liabilities arising out of contamination at our currently and formerly owned or operated facilities, at locations to which hazardous substances were transported from such facilities, and at such locations related to entities formerly affiliated with us. Although for some such potential liabilities we believe we are entitled to indemnification from other entities, we cannot assure you that such entities will view their obligations as we do or will be able or willing to satisfy them. Failure to comply with applicable laws and regulations, or significant additional expenditures required to maintain compliance therewith, may have a material adverse effect on our business, results of operations, financial condition, cash flows, and prospects.
If we or our employees at the individual dealerships violate or are alleged to violate laws and regulations applicable to them or protecting consumers generally, we could be subject to individual claims or consumer class actions, administrative, civil or criminal actions investigations or actions and adverse publicity. Such actions could expose us to substantial monetary damages and legal defense costs, injunctive relief and criminal and civil fines and penalties, including suspension or revocation of our licenses and franchises to conduct dealership operations. Some jurisdictions regulate finance fees and administrative or document fees that may be charged in connection with vehicle sales, which could restrict our ability to generate revenue from these activities.
Furthermore, the enactment of new laws and regulations that materially impair or restrict our sales, finance and insurance, or other operations could have a material adverse effect on our business, results of operations, financial condition, cash flows, and prospects. For example, in recent years, private plaintiffs and state attorneys general in the U.S. have increased their scrutiny of advertising, sales, and finance and insurance activities in the sale and leasing of motor vehicles. These activities have led many lenders to limit the amounts that may be charged to customers as fee income for these activities. If these or similar activities were to significantly restrict our ability to generate revenue from arranging financing for our customers, we could be adversely affected. In addition, the Dodd-Frank Wall Street Reform and Consumer Protection Act, which was signed into law on July 21, 2010, establishes a new consumer financial protection agency with broad regulatory powers. Although automotive dealers are generally excluded from coverage within this agency, the Dodd-Frank Act could lead to additional, indirect regulation of automotive dealers through its regulation of automotive finance companies and other financial institutions.
Likewise, employees and former employees are protected by a variety of employment laws and regulations. Allegations of a
22
violation could subject us to individual claims or consumer class actions, administrative investigations or adverse publicity. Such actions could expose us to substantial monetary damages and legal defense costs, injunctive relief and civil fines and penalties.
We are involved in various legal proceedings in the ordinary course of our business, including litigation with employees and with customers regarding our products and services, and expect to continue to be subject to claims related to our existing business and any new business. A significant judgment against us, the loss of a significant license or permit or the imposition of a significant fine could have a material adverse effect on our business, financial condition and future prospects. We further expect that, from time to time, new laws and regulations, particularly in the labor, employment, environmental and consumer protection areas will be enacted, and compliance with such laws, or penalties for failure to comply, could significantly increase our costs.
Healthcare reform legislation could adversely affect our future profitability and financial condition.
Rising healthcare costs and interest in universal healthcare coverage in the U.S. have resulted in government and private sector initiatives proposing healthcare reforms. The Patient Protection and Affordable Care Act, which was signed into law on March 23, 2010, is expected to increase our annual employee health care costs , with the most significant increases commencing in 2014. We cannot predict the extent of the effect of this Act, or any future state or federal healthcare legislation or regulation, will have on us. However, an expansion in government’s role in the U.S. healthcare industry could result in significant long-term costs to us, which could in turn adversely affect our future profitability and financial condition.
Governmental regulation pertaining to fuel economy (CAFE) standards may affect a manufacturer’s ability to produce cost effective vehicles, which would impact our sales.
The Energy Policy Conservation Act, enacted into law by Congress in 1975, added Title V, “Improving Automotive Efficiency,” to the Motor Vehicle Information and Cost Savings Act and established Corporate Average Fuel Economy (“CAFE”) standards for passenger cars and light trucks. CAFE is the sales weighted average fuel economy, expressed in miles per gallon (mpg) of a manufacturer’s fleet of passenger cars or light trucks with a gross vehicle weight rating of 8,500 pounds or less, manufactured for sale in the U.S., for any given model year.
The primary goal of CAFE was to substantially increase passenger car fuel efficiency. Congress has continuously increased the standards since 1974 and, since mid-year 1990, the passenger car standard was increased to 27.5 miles per gallon, a level at which it has remained through 2009. Passenger car fuel economy is now required to rise to an industry average of 39 miles per gallon by 2016. Likewise, significant changes to light truck CAFE standards have been established over the years. The standard is expected to be increased to about 30 miles per gallon by 2016.
The penalty for a manufacturer’s failure to meet the CAFE standards is currently $5.50 per tenth of a mile per gallon for each tenth under the target volume times the total volume of those vehicles manufactured for a given model year.
Failure of a manufacturer to develop passenger vehicles and light trucks that meet CAFE standards could subject the manufacturer to substantial penalties, increase the cost of vehicles sold to us, and adversely affect our ability to market and sell vehicles to meet consumer needs and desires. Furthermore, Congress may continue to increase CAFE standards in the future and such additional legislation may have a further adverse impact on the manufacturers and our business operations.
Climate change legislation or regulations restricting emission of “greenhouse gases” could result in increased operating costs and reduced demand for the vehicles we sell.
On December 15, 2009, the U.S. Environmental Protection Agency (“EPA”) published its findings that emissions of carbon dioxide, methane and other “greenhouse gases” present an endangerment to public health and the environment because emissions of such gases are, according to the EPA, contributing to warming of the earth’s atmosphere and other climatic changes. These findings allow the EPA to adopt and implement regulations that would restrict emissions of greenhouse gases under existing provisions of the federal Clean Air Act. Accordingly, the EPA has proposed regulations that would require a reduction in emissions of greenhouse gases from motor vehicles and could trigger permit review for greenhouse gas emissions from certain stationary sources. In addition, on October 30, 2009, the EPA published a final rule requiring the reporting of greenhouse gas emissions from specified large greenhouse gas emission sources in the United States, including facilities that emit more than 25,000 tons of greenhouse gases on an annual basis, beginning in 2011 for emissions occurring in 2010. At the state level, more than one−third of the states, either individually or through multi−state regional initiatives, already have begun implementing legal measures to reduce emissions of greenhouse gases. The adoption and implementation of any regulations imposing reporting obligations on, or limiting emissions of greenhouse gases from, our facilities, equipment and operations or from the vehicles that we sell require us to incur costs to reduce emissions of greenhouse gases associated with our operations and also could adversely affect demand for certain vehicles.
23
Future changes in financial accounting standards or practices or existing taxation rules or practices may affect our reported results of operations.
A change in accounting standards or practices or a change in existing taxation rules or practices can have a significant effect on our reported results and may affect our reporting of transactions completed before the change is effective. New accounting pronouncements and taxation rules and varying interpretations of accounting pronouncements and taxation practices have occurred and may occur in the future. Changes to existing rules or the questioning of current practices may adversely affect our reported financial results or the way we conduct our business.
The loss of key personnel may adversely affect our business.
Our success depends, to a significant degree, upon the continued contributions of our management team. Manufacturer dealer or framework agreements may require the prior approval of the applicable manufacturer before any change is made in dealership general managers or other management positions. The loss of the services of one or more of these key employees may materially impair the profitability of our operations, or may result in a violation of an applicable dealer or framework agreement.
In addition, we may need to hire additional managers or other key personnel from time to time. In some instances, potential acquisitions are more viable to us if we are able to retain experienced managers or obtain replacement managers should the owner or manager of an acquired dealership not continue to manage the business. The market for qualified employees in the industry and in the regions in which we operate, particularly for general managers and sales and service personnel, is highly competitive and may subject us to increased labor costs during periods of low unemployment. The loss of the services of key employees or the inability to attract additional qualified managers may adversely affect the ability of our dealerships to conduct their operations in accordance with the standards set by us or the manufacturers.
We depend on our executive officers as well as other key personnel. Although our CEO and COO entered into employment agreements with us, most of our key personnel are not bound by employment agreements, and those with employment agreements are bound only for a limited period of time. Further, we do not maintain “key man” life insurance policies on any of our executive officers or key personnel. If we are unable to retain our key personnel, we may be unable to successfully develop and implement our business plans, which may have an adverse effect on our busines
24
None.
We lease our corporate headquarters, which are located at 2905 Premiere Parkway, NW, Suite 300, Duluth, Georgia. In addition, as of
December 31, 2010
, our operations encompassed 84 dealership locations throughout 11 states. As of
December 31, 2010
, we leased 45 of these locations and owned the remaining locations. We have one location in Mississippi and one location in Missouri where we lease the underlying land but own the building facilities on that land. These locations are included in the leased column of the table below. In addition, we operate 26 collision repair centers. We lease 13 of these collision repair centers and own the remaining repair center locations.
As of December 31, 2010, we had 10 heavy truck franchises operating in three dealership locations, and one collision repair center, pending disposition. These locations and the collision center are included as part of the Nalley Automotive Group data in the table below.
|
Dealership Group or Location
|
Dealerships
|
|
Collision Repair Centers
|
|||||||||
|
|
Owned
|
Leased
|
|
Owned
|
Leased
|
|||||||
|
Coggin Automotive Group
|
11
|
|
4
|
|
(a)
|
5
|
|
2
|
|
|||
|
Courtesy Autogroup
|
—
|
|
9
|
|
|
—
|
|
2
|
|
|||
|
Crown Automotive Company
|
11
|
|
8
|
|
|
2
|
|
1
|
|
|||
|
David McDavid Auto Group
|
5
|
|
2
|
|
(b)
|
2
|
|
3
|
|
|||
|
Gray-Daniels Auto Family
|
1
|
|
5
|
|
|
—
|
|
1
|
|
|||
|
Nalley Automotive Group
|
5
|
|
10
|
|
|
3
|
|
2
|
|
|||
|
California Dealership
|
—
|
|
1
|
|
—
|
|
—
|
|
||||
|
Northpoint Auto Group
|
2
|
|
4
|
|
|
1
|
|
1
|
|
|||
|
Plaza Motor Company
|
4
|
|
2
|
|
|
—
|
|
1
|
|
|||
|
Total
|
39
|
|
45
|
|
|
13
|
|
13
|
|
|||
________________________________________
|
(a)
|
Includes one dealership that leases a new vehicle facility and operates a separate used vehicle facility that is owned.
|
|
(b)
|
Includes one pending divestiture as of
December 31, 2010
.
|
From time to time, we and our dealerships may become involved in various claims relating to, and arising out of our business and our operations. These claims may involve, but are not limited to, financial and other audits by vehicle manufacturers, lenders and certain federal, state and local government authorities, which relate primarily to (a) incentive and warranty payments received from vehicle manufacturers, (b) compliance with lender rules and covenants and (c) payments made to government authorities relating to federal, state and local taxes, as well as compliance with other government regulations. Claims may also arise through litigation, government proceedings and other dispute resolution processes. Such claims, including class actions, can relate to, but are not limited to, the practice of charging administrative fees, employment-related matters, truth-in-lending practices, contractual disputes, actions brought by governmental authorities and other matters. We evaluate pending and threatened claims and establish loss contingency reserves based upon outcomes we currently believe to be probable and reasonably estimable.
We currently do not anticipate that any known claim will materially adversely affect our financial condition, liquidity, results of operations or financial statement disclosures. However, the outcome of any known matter cannot be predicted with certainty, and an unfavorable resolution of one or more matters presently known or arising in the future could have a material adverse effect on our financial condition, liquidity, results of operations or financial statement disclosures.
25
Our common stock is traded on the New York Stock Exchange (the “NYSE”) under the symbol “ABG”. Quarterly information concerning our high and low closing sales price per share of our common stock as reported by the NYSE is as follows:
|
|
High
|
Low
|
|||||||
|
|
|
|
|||||||
|
Fiscal Year Ended December 31, 2009
|
|||||||||
|
First Quarter
|
$
|
5.23
|
|
$
|
2.01
|
|
|||
|
Second Quarter
|
11.94
|
|
4.74
|
|
|||||
|
Third Quarter
|
14.86
|
|
8.99
|
|
|||||
|
Fourth Quarter
|
14.58
|
|
9.63
|
|
|||||
|
Fiscal Year Ended December 31, 2010
|
|||||||||
|
First Quarter
|
$
|
14.24
|
|
$
|
10.91
|
|
|||
|
Second Quarter
|
16.79
|
|
10.54
|
|
|||||
|
Third Quarter
|
14.42
|
|
9.82
|
|
|||||
|
Fourth Quarter
|
18.80
|
|
13.73
|
|
|||||
We did not pay any dividends during any of these periods. On February 24, 2011, the last reported sale price of our common stock on the NYSE was $18.16 per share, and there were approximately 61 record holders of our common stock. In December 2010, our board of directors authorized the repurchase of up to $25.0 million of our common stock. In December 2010, we repurchased 8,700 shares of our common stock for $0.1 million.
Pursuant to the indentures governing our 8.375% Notes and our 7.625% Notes, and the agreements governing our BofA Revolving Credit Facility and our JPMorgan Used Vehicle Floor Plan Facility, our ability to repurchase shares of our common stock and pay cash dividends is limited. In accordance with such calculations, our ability to repurchase common stock or pay dividends was limited to $56.5 million under these agreements as of
December 31, 2010
.
|
Period
|
Total Number of Shares Purchased
|
Average Price Paid per Share
|
Total Number of Shares Purchased as Part of Publicly Announced Plans or Programs
|
Approximate Dollar Value of Shares that May Yet be Purchased Under the Plans or Program (3)
|
||||||||||
|
02/01/2010 - 02/28/2010 (1)
|
6,706
|
|
$
|
11.61
|
|
—
|
|
$
|
—
|
|
||||
|
05/01/2010 - 05/31/2010 (1)
|
13,558
|
|
$
|
15.28
|
|
—
|
|
$
|
—
|
|
||||
|
12/01/2010 - 12/31/2010 (2)
|
8,700
|
|
$
|
17.26
|
|
8,700
|
|
$
|
24.9
|
|
||||
_________________
|
(1)
|
Represents shares repurchased to pay the withholding taxes on shares of restricted stock granted to employees that vested during this time period.
|
|
(2)
|
Represents shares of our common stock repurchased pursuant to a 10b5-1 trading plan, which expired on February 23, 2011.
|
|
(3)
|
In December 2010, our board of directors
authorized the repurchase of up to $25.0 million of our common stock, which program expires on December 31, 2011.
|
PERFORMANCE GRAPH
The following graph furnished by the Company shows the value as of
December 31, 2010
, of a $100 investment in the Company’s common stock made on December 31, 2005 (with dividends reinvested), as compared with similar investments based on (i) the value of the S & P 500 Index (with dividends reinvested) and (ii) the value of a market-weighted Peer Group Index composed of the common stock of AutoNation, Inc., Sonic Automotive, Inc., Group 1 Automotive, Inc., Penske Automotive Group, Inc. and Lithia Motors, Inc., in each case on a “total return” basis assuming reinvestment of dividends. The market-weighted Peer Group Index values were calculated from the beginning of the performance period. The historical stock performance shown below is not necessarily indicative of future expected performance.
26
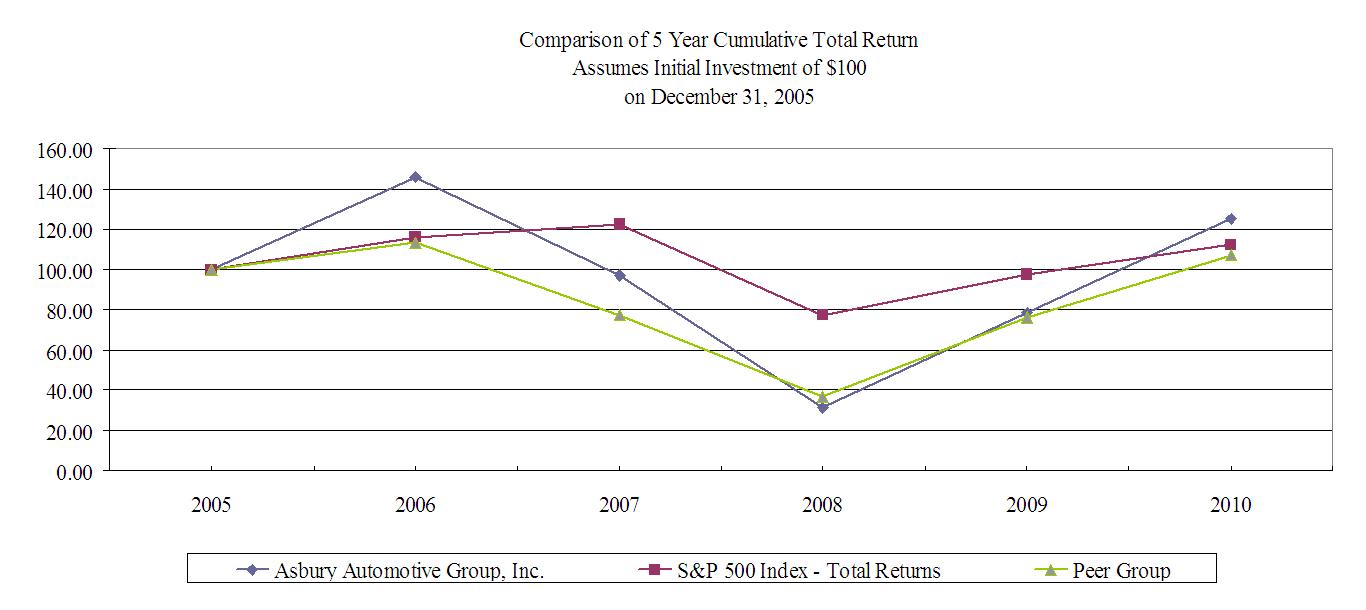
The forgoing graph is not, and shall not be deemed to be, filed as part of the Company's annual report on Form 10-K. Such graph is not, and will not be deemed, filed or incorporated by reference into any filing of the Company under the Securities Act of 1933 or the Securities Exchange Act of 1934, except to the extent specifically incorporated by reference therein by the Company.
The following table sets forth selected consolidated financial data for the five years ended December 31, 2010. The accompanying income (loss) statement data for the years ended
December 31, 2009
,
2008
,
2007
, and
2006
have been reclassified to reflect the status of our discontinued operations as of
December 31, 2010
. The following information should be read in conjunction with “Management’s Discussion and Analysis of Financial Condition and Results of Operations” and the Company’s consolidated financial statements and the notes thereto, included elsewhere in this annual report on Form 10-K.
27
|
|
For the Years Ended December 31,
|
||||||||||||||||||
|
|
2010
|
2009
|
2008
|
2007
|
2006
|
||||||||||||||
|
|
(in millions, except per share data)
|
||||||||||||||||||
|
Revenues:
|
|||||||||||||||||||
|
New vehicle
|
$
|
2,179.6
|
|
$
|
1,859.6
|
|
$
|
2,371.8
|
|
$
|
2,841.3
|
|
$
|
2,756.0
|
|
||||
|
Used vehicle
|
1,084.6
|
|
902.4
|
|
1,012.3
|
|
1,265.9
|
|
1,233.9
|
|
|||||||||
|
Parts and service
|
555.4
|
|
553.2
|
|
581.8
|
|
549.7
|
|
519.9
|
|
|||||||||
|
Finance and insurance, net
|
116.4
|
|
90.9
|
|
127.5
|
|
141.0
|
|
134.1
|
|
|||||||||
|
Total revenues
|
3,936.0
|
|
3,406.1
|
|
4,093.4
|
|
4,797.9
|
|
4,643.9
|
|
|||||||||
|
Cost of sales
|
3,287.3
|
|
2,823.5
|
|
3,416.1
|
|
4,048.0
|
|
3,918.0
|
|
|||||||||
|
Gross profit
|
648.7
|
|
582.6
|
|
677.3
|
|
749.9
|
|
725.9
|
|
|||||||||
|
Selling, general and administrative expenses
|
499.5
|
|
465.5
|
|
547.8
|
|
576.6
|
|
555.4
|
|
|||||||||
|
Depreciation and amortization
|
21.1
|
|
22.2
|
|
21.1
|
|
18.4
|
|
17.2
|
|
|||||||||
|
Impairment expenses
|
—
|
|
—
|
|
528.7
|
|
—
|
|
—
|
|
|||||||||
|
Other operating expense (income), net
|
1.4
|
|
(0.8
|
)
|
1.3
|
|
1.0
|
|
(1.4
|
)
|
|||||||||
|
Income (loss) from operations
|
126.7
|
|
95.7
|
|
(421.6
|
)
|
153.9
|
|
154.7
|
|
|||||||||
|
Other income (expense):
|
|||||||||||||||||||
|
Floor plan interest expense
|
(9.4
|
)
|
(10.9
|
)
|
(22.2
|
)
|
(31.3
|
)
|
(29.9
|
)
|
|||||||||
|
Other interest expense, net
|
(36.2
|
)
|
(36.2
|
)
|
(37.1
|
)
|
(33.7
|
)
|
(38.3
|
)
|
|||||||||
|
Swap interest expense
|
(6.6
|
)
|
(6.6
|
)
|
(5.5
|
)
|
(1.7
|
)
|
(1.3
|
)
|
|||||||||
|
Convertible debt discount amortization
|
(1.4
|
)
|
(1.8
|
)
|
(3.0
|
)
|
(2.4
|
)
|
—
|
|
|||||||||
|
(Loss) gain on extinguishment of long-term debt, net
|
(12.6
|
)
|
0.1
|
|
26.2
|
|
(18.5
|
)
|
(1.1
|
)
|
|||||||||
|
Total other expense, net
|
(66.2
|
)
|
(55.4
|
)
|
(41.6
|
)
|
(87.6
|
)
|
(70.6
|
)
|
|||||||||
|
Income (loss) before income taxes
|
60.5
|
|
40.3
|
|
(463.2
|
)
|
66.3
|
|
84.1
|
|
|||||||||
|
Income tax expense (benefit)
|
23.2
|
|
15.1
|
|
(136.2
|
)
|
23.6
|
|
31.7
|
|
|||||||||
|
Income (loss) from continuing operations
|
37.3
|
|
25.2
|
|
(327.0
|
)
|
42.7
|
|
52.4
|
|
|||||||||
|
Discontinued operations, net of tax
|
0.8
|
|
(11.8
|
)
|
(16.7
|
)
|
6.8
|
|
8.3
|
|
|||||||||
|
Net income (loss)
|
$
|
38.1
|
|
$
|
13.4
|
|
$
|
(343.7
|
)
|
$
|
49.5
|
|
$
|
60.7
|
|
||||
|
Income (loss) from continuing operations per common share:
|
|||||||||||||||||||
|
Basic
|
$
|
1.16
|
|
$
|
0.79
|
|
$
|
(10.32
|
)
|
$
|
1.41
|
|
$
|
1.86
|
|
||||
|
Diluted
|
$
|
1.12
|
|
$
|
0.77
|
|
$
|
(10.32
|
)
|
$
|
1.38
|
|
$
|
1.81
|
|
||||
|
Cash dividends declared per common share
|
$
|
—
|
|
$
|
—
|
|
$
|
0.68
|
|
$
|
0.85
|
|
$
|
0.40
|
|
||||
|
|
As of December 31,
|
||||||||||||||||||
|
|
2010
|
2009
|
2008
|
2007
|
2006
|
||||||||||||||
|
|
(in millions)
|
||||||||||||||||||
|
Working capital
|
$
|
241.5
|
|
$
|
213.4
|
|
$
|
161.5
|
|
$
|
320.7
|
|
$
|
412.0
|
|
||||
|
Inventories(a)
|
578.7
|
|
506.7
|
|
689.5
|
|
782.8
|
|
780.1
|
|
|||||||||
|
Total assets
|
1,486.3
|
|
1,400.9
|
|
1,650.8
|
|
2,009.1
|
|
2,030.8
|
|
|||||||||
|
Floor plan notes payable(b)
|
456.8
|
|
441.6
|
|
633.4
|
|
683.8
|
|
704.7
|
|
|||||||||
|
Total debt(b)
|
549.0
|
|
537.8
|
|
610.7
|
|
458.6
|
|
455.9
|
|
|||||||||
|
Total shareholders’ equity
|
287.1
|
|
243.6
|
|
226.6
|
|
593.9
|
|
611.8
|
|
|||||||||
______________________________
|
(a)
|
Includes amounts classified as assets held for sale on our consolidated balance sheets.
|
|
(b)
|
Includes amounts classified as liabilities associated with assets held for sale on our consolidated balance sheets.
|
28
OVERVIEW
We are one of the largest automotive retailers in the United States, operating 110 franchises (84 dealership locations) in 20 metropolitan markets within 11 states as of
December 31, 2010
. We offer an extensive range of automotive products and services, including new and used vehicles; vehicle maintenance, replacement parts and collision repair services; and financing, insurance and service contracts. As of
December 31, 2010
, we offered 36 domestic and foreign brands of new vehicles. Our current brand mix is weighted 86% towards luxury and mid-line import brands, with the remaining 14% consisting of domestic brands. We also operate 26 collision repair centers that serve customers in our local markets.
The franchises, locations, brands and collision repair centers described above include those associated with our heavy truck business in Atlanta, Georgia and the acquisition of nine franchises (four dealership locations) in the fourth quarter of 2010. As of December 31, 2010, we had executed a contract to sell our heavy truck business and, as a result, the results of operations of the business were classified as Discontinued Operations, net on our Consolidated Statements of Income (Loss). As of December 31, 2010, our heavy truck business included ten franchises (three locations) offering seven brands of heavy trucks, as well as one collision repair center.
Our retail network is made up of dealerships operating primarily under the following locally-branded dealership groups:
|
•
|
Coggin dealerships, operating primarily in the Florida markets of Jacksonville, Fort Pierce and Orlando;
|
|
•
|
Courtesy dealerships operating in Tampa, Florida;
|
|
•
|
Crown dealerships operating in New Jersey, North Carolina, South Carolina and Virginia;
|
|
•
|
Nalley dealerships operating in Atlanta, Georgia;
|
|
•
|
McDavid dealerships operating in Texas;
|
|
•
|
North Point dealerships operating in Little Rock, Arkansas;
|
|
•
|
Plaza dealerships operating in St. Louis, Missouri; and
|
|
•
|
Gray-Daniels dealerships operating in Jackson, Mississippi.
|
In addition to the dealership groups listed above, we also operated one luxury brand dealership in California as of
December 31, 2010
.
Our revenues are derived primarily from: (i) the sale of new vehicles to individual retail customers (“new vehicle retail”) and commercial customers (“fleet”) (the terms “new vehicle retail,” and “fleet” being collectively referred to as “new”); (ii) the sale of used vehicles to individual retail customers (“used retail”) and to other dealers at auction (“wholesale”) (the terms “used retail” and “wholesale” being collectively referred to as “used”); (iii) maintenance and collision repair services and the sale of automotive parts (together referred to as “parts and service”); and (iv) the arrangement of vehicle financing and the sale of a number of aftermarket products, such as insurance and service contracts (collectively referred to as “F&I”). We evaluate the results of our new and used vehicle sales based on unit volumes and gross profit per vehicle sold, our parts and service operations based on aggregate gross profit, and F&I based on dealership generated F&I gross profit per vehicle sold. We assess the organic growth of our revenue and gross profit by comparing the year-to-year results of stores that we have operated for at least twelve full months (“same store”).
Our organic growth is dependent upon the execution of our balanced automotive retailing and service business strategy, the continued strength of our brand mix and the production of desirable vehicles by automotive manufacturers whose brands
we sell. Our vehicle sales have historically fluctuated with product availability as well as local and national economic
conditions, including consumer confidence, availability of consumer credit, fuel prices and employment levels. We believe that the impact on our business of any future negative trends in new vehicle sales would be partially mitigated by (i) the expected
relative stability of our parts and service operations over the long-term, (ii) the variable nature of significant components of our
cost structure and (iii) our brand mix. Historically, our brand mix has been less affected by market volatility than the U.S.
automobile industry as a whole.
Our operating results are generally subject to changes in the economic environment as well as seasonal variations. We
tend to generate more revenue and operating income in the second and third quarters than in the first and fourth quarters of the
calendar year. Generally, the seasonal variations in our operations are caused by factors related to weather conditions, changes
in manufacturer incentive programs, model changeovers and consumer buying patterns, among other things.
Our gross profit margin varies with our revenue mix. The sale of new vehicles generally results in lower gross profit margin
29
than used vehicle sales and sales of parts and service. As a result, when used vehicle and parts and service revenue increases as a percentage of total revenue, we expect our overall gross profit margin to increase.
Selling, general and administrative (“SG&A”) expenses consist primarily of fixed and incentive-based compensation, advertising, rent, insurance, utilities and other customary operating expenses. A significant portion of our cost structure is variable (such as sales commissions), or controllable (such as advertising), generally allowing us to adapt to changes in the retail environment over the long-term. We evaluate commissions paid to salespeople as a percentage of retail vehicle gross profit and all other SG&A expenses in the aggregate as a percentage of total gross profit, with the exception of advertising expense, which we evaluate on a per vehicle retailed ("PVR") basis.
In 2008 and 2009, the automotive retail market was impacted by weak economic conditions in the United States and globally, including turmoil in the credit markets, broad declines in the equity markets, reduced consumer confidence, rising
unemployment and continued weakness in the housing market. The seasonally adjusted annual rate (“SAAR”) of new vehicle
sales in the United States, which was over 16.0 million from 1999 to 2007, decreased to approximately 13.2 million for 2008 and 10.4 million for 2009. However, new vehicle sales in the U.S. showed signs of improvement in 2010, as the new vehicle SAAR improved to 11.6 million for 2010.
The weak economic conditions in 2009 were partially offset in the third quarter of 2009 by the federal government’s Car
Allowance Rebate System program, otherwise known as “Cash for Clunkers.” This program provided consumers a
rebate of between $3,500 and $4,500 if they traded in an eligible vehicle in connection with the purchase of a more fuel
efficient new vehicle. The U.S. Department of Transportation estimates that this program led to the sale of nearly
700,000 new vehicles during July and August of 2009. We sold approximately 3,300 new vehicles under the Cash for Clunkers program, and we believe the attention that this program created increased traffic at our stores and led to additional new and used vehicle sales that were not part of the Cash for Clunkers program.
We expect that U.S. new vehicle sales will continue to improve in 2011, with a SAAR for the full year between 12.5 million and 13.0 million. We believe that the majority of automotive manufacturers will continue to use a combination of attractive vehicle pricing, financing incentive and leasing programs to increase demand in the near term, although no assurance can be provided in this regard. Additionally, we believe that our new vehicle revenue brand mix, which included approximately 49% revenue from mid-line import brands and 37% revenue from luxury brands in 2010, is well positioned for growth over the long term.
We had total available liquidity of $255.9 million as of
December 31, 2010
, which includes cash and cash equivalents of $21.3 million, borrowing availability of $175.1 million under our various credit facilities and $59.5 million of availability under new vehicle floor plan offset accounts with certain of our floor plan lenders. For further discussion of our floor plan offset accounts, please refer to “Liquidity and Capital Resources” below. In addition, we have no material long-term debt maturities until September 2012, at which time our 3% Senior Subordinated Convertible Notes due 2012 (the "3% Convertible Notes") will mature. As of
December 31, 2010
, we had $29.5 million in aggregate principal amount of our 3% Convertible Notes outstanding.
RESULTS OF OPERATIONS
Year Ended
December 31, 2010
Compared to the Year Ended
December 31, 2009
30
|
|
For the Years Ended December 31,
|
|||||||||||||
|
|
2010
|
2009
|
Increase
(Decrease)
|
%
Change
|
||||||||||
|
|
(Dollars in millions, except per share data)
|
|||||||||||||
|
REVENUES:
|
||||||||||||||
|
New vehicle
|
$
|
2,179.6
|
|
$
|
1,859.6
|
|
$
|
320.0
|
|
17
|
%
|
|||
|
Used vehicle
|
1,084.6
|
|
902.4
|
|
182.2
|
|
20
|
%
|
||||||
|
Parts and service
|
555.4
|
|
553.2
|
|
2.2
|
|
—
|
%
|
||||||
|
Finance and insurance, net
|
116.4
|
|
90.9
|
|
25.5
|
|
28
|
%
|
||||||
|
Total revenues
|
3,936.0
|
|
3,406.1
|
|
529.9
|
|
16
|
%
|
||||||
|
GROSS PROFIT:
|
||||||||||||||
|
New vehicle
|
143.7
|
|
131.3
|
|
12.4
|
|
9
|
%
|
||||||
|
Used vehicle
|
91.5
|
|
79.4
|
|
12.1
|
|
15
|
%
|
||||||
|
Parts and service
|
297.1
|
|
281.0
|
|
16.1
|
|
6
|
%
|
||||||
|
Finance and insurance, net
|
116.4
|
|
90.9
|
|
25.5
|
|
28
|
%
|
||||||
|
Total gross profit
|
648.7
|
|
582.6
|
|
66.1
|
|
11
|
%
|
||||||
|
OPERATING EXPENSES:
|
||||||||||||||
|
Selling, general and administrative
|
499.5
|
|
465.5
|
|
34.0
|
|
7
|
%
|
||||||
|
Depreciation and amortization
|
21.1
|
|
22.2
|
|
(1.1
|
)
|
(5
|
)%
|
||||||
|
Other operating expense (income), net
|
1.4
|
|
(0.8
|
)
|
2.2
|
|
(275
|
)%
|
||||||
|
Income from operations
|
126.7
|
|
95.7
|
|
31.0
|
|
32
|
%
|
||||||
|
OTHER INCOME (EXPENSE):
|
||||||||||||||
|
Floor plan interest expense
|
(9.4
|
)
|
(10.9
|
)
|
(1.5
|
)
|
(14
|
)%
|
||||||
|
Other interest expense, net
|
(36.2
|
)
|
(36.2
|
)
|
—
|
|
—
|
%
|
||||||
|
Swap interest expense
|
(6.6
|
)
|
(6.6
|
)
|
—
|
|
—
|
%
|
||||||
|
Convertible debt discount amortization
|
(1.4
|
)
|
(1.8
|
)
|
(0.4
|
)
|
(22
|
)%
|
||||||
|
(Loss) gain on extinguishment of long-term debt
|
(12.6
|
)
|
0.1
|
|
12.7
|
|
NM
|
|
||||||
|
Total other expense, net
|
(66.2
|
)
|
(55.4
|
)
|
10.8
|
|
19
|
%
|
||||||
|
Income before income taxes
|
60.5
|
|
40.3
|
|
20.2
|
|
50
|
%
|
||||||
|
INCOME TAX EXPENSE
|
23.2
|
|
15.1
|
|
8.1
|
|
54
|
%
|
||||||
|
INCOME FROM CONTINUING OPERATIONS
|
37.3
|
|
25.2
|
|
12.1
|
|
48
|
%
|
||||||
|
DISCONTINUED OPERATIONS, net of tax
|
0.8
|
|
(11.8
|
)
|
12.6
|
|
107
|
%
|
||||||
|
NET INCOME
|
$
|
38.1
|
|
$
|
13.4
|
|
$
|
24.7
|
|
184
|
%
|
|||
|
Income from continuing operations per common share—Diluted
|
$
|
1.12
|
|
$
|
0.77
|
|
$
|
0.35
|
|
45
|
%
|
|||
|
Net income per common share—Diluted
|
$
|
1.14
|
|
$
|
0.41
|
|
$
|
0.73
|
|
178
|
%
|
|||
31
|
|
For the Years Ended
December 31,
|
||||
|
|
2010
|
2009
|
|||
|
REVENUE MIX PERCENTAGES:
|
|||||
|
New vehicles
|
55.4
|
%
|
54.6
|
%
|
|
|
Used retail vehicles
|
22.3
|
%
|
21.1
|
%
|
|
|
Used vehicle wholesale
|
5.2
|
%
|
5.4
|
%
|
|
|
Parts and service
|
14.1
|
%
|
16.2
|
%
|
|
|
Finance and insurance, net
|
3.0
|
%
|
2.7
|
%
|
|
|
Total revenue
|
100.0
|
%
|
100.0
|
%
|
|
|
GROSS PROFIT MIX PERCENTAGES:
|
|||||
|
New vehicles
|
22.2
|
%
|
22.5
|
%
|
|
|
Used retail vehicles
|
14.3
|
%
|
13.8
|
%
|
|
|
Used vehicle wholesale
|
(0.2
|
)%
|
(0.1
|
)%
|
|
|
Parts and service
|
45.8
|
%
|
48.2
|
%
|
|
|
Finance and insurance, net
|
17.9
|
%
|
15.6
|
%
|
|
|
Total gross profit
|
100.0
|
%
|
100.0
|
%
|
|
|
SG&A EXPENSES AS A PERCENTAGE OF GROSS PROFIT
|
77.0
|
%
|
79.9
|
%
|
|
Net income and income from continuing operations increased by
$24.7 million
and
$12.1 million
, respectively, during
2010
as compared to
2009
, primarily as a result of (i) a $
66.1 million
(
11%
) increase in gross profit and (ii) a 290 basis point decrease in SG&A expenses as a percentage of gross profit. Net income and income from continuing operations for
2010
were reduced by $8.3 million, net of tax, from losses on the extinguishment of long-term debt.
The
$12.1 million
increase in income from continuing operations was primarily a result of a $
66.1 million
(
11%
) increase in total gross profit. Gross profit increased across all four of our business lines and was driven by a $
25.5 million
(
28%
) increase in F&I gross profit and a $
16.1 million
(
6%
) increase in parts and service gross profit. These increases in gross profit were partially offset by (i) a $34.0 million (7%) increase in SG&A expenses and (ii) $12.6 million in losses from the extinguishment of long-term debt during 2010. Our total gross profit margin decreased 60 basis points to 16.5%, principally as a result of a mix shift to our lower margin new vehicle and used vehicle businesses.
The
$529.9 million
(
16%
) increase in total revenue was primarily a result of a
$320.0 million
(
17%
) increase in new vehicle revenue and a
$182.2 million
(
20%
) increase in used vehicle revenue. The increase in new vehicle revenue includes a $312.0 million (17%) increase in same store new vehicle revenue and $8.0 million in new vehicle revenue from acquired dealerships. The increase in used vehicle revenue includes (i) a $158.4 million (22%) increase in same store used vehicle retail revenue, (ii) a $20.5 million (11%) increase in same store used vehicle wholesale revenue and (iii) $3.3 million of used vehicle revenue derived from acquired dealerships.
32
New Vehicle—
|
|
For the Years Ended
December 31,
|
Increase
(Decrease)
|
%
Change
|
|||||||||||
|
|
2010
|
2009
|
||||||||||||
|
|
(Dollars in millions, except for per vehicle data)
|
|||||||||||||
|
Revenue:
|
||||||||||||||
|
New vehicle revenue—same store(1)
|
||||||||||||||
|
Luxury
|
$
|
796.7
|
|
$
|
665.7
|
|
$
|
131.0
|
|
20
|
%
|
|||
|
Mid-line import
|
1,066.7
|
|
946.2
|
|
120.5
|
|
13
|
%
|
||||||
|
Mid-line domestic
|
308.2
|
|
247.7
|
|
60.5
|
|
24
|
%
|
||||||
|
Total new vehicle revenue—same store(1)
|
2,171.6
|
|
1,859.6
|
|
312.0
|
|
17
|
%
|
||||||
|
New vehicle revenue—acquisitions
|
8.0
|
|
—
|
|
||||||||||
|
New vehicle revenue, as reported
|
$
|
2,179.6
|
|
$
|
1,859.6
|
|
$
|
320.0
|
|
17
|
%
|
|||
|
Gross profit:
|
||||||||||||||
|
New vehicle gross profit—same store(1)
|
||||||||||||||
|
Luxury
|
$
|
61.6
|
|
$
|
50.3
|
|
$
|
11.3
|
|
22
|
%
|
|||
|
Mid-line import
|
59.5
|
|
64.2
|
|
(4.7
|
)
|
(7
|
)%
|
||||||
|
Mid-line domestic
|
22.3
|
|
16.8
|
|
5.5
|
|
33
|
%
|
||||||
|
Total new vehicle gross profit—same store(1)
|
143.4
|
|
131.3
|
|
12.1
|
|
9
|
%
|
||||||
|
New vehicle gross profit—acquisitions
|
0.3
|
|
—
|
|
||||||||||
|
New vehicle gross profit, as reported
|
$
|
143.7
|
|
$
|
131.3
|
|
$
|
12.4
|
|
9
|
%
|
|||
|
|
For the Years Ended
December 31,
|
Increase
(Decrease)
|
%
Change
|
|||||||||||
|
|
2010
|
2009
|
||||||||||||
|
New vehicle units:
|
||||||||||||||
|
New vehicle retail units—same store(1)
|
||||||||||||||
|
Luxury
|
16,371
|
|
14,248
|
|
2,123
|
|
15
|
%
|
||||||
|
Mid-line import
|
42,431
|
|
38,766
|
|
3,665
|
|
9
|
%
|
||||||
|
Mid-line domestic
|
8,181
|
|
7,234
|
|
947
|
|
13
|
%
|
||||||
|
Total new vehicle retail units—same store(1)
|
66,983
|
|
60,248
|
|
6,735
|
|
11
|
%
|
||||||
|
Fleet vehicles
|
2,451
|
|
1,785
|
|
666
|
|
37
|
%
|
||||||
|
Total new vehicle units—same store(1)
|
69,434
|
|
62,033
|
|
7,401
|
|
12
|
%
|
||||||
|
New vehicle units—acquisitions
|
249
|
|
—
|
|
||||||||||
|
New vehicle units—actual
|
69,683
|
|
62,033
|
|
7,650
|
|
12
|
%
|
||||||
33
New Vehicle Metrics—
|
|
For the Years Ended December 31,
|
Increase
(Decrease)
|
%
Change
|
|||||||||||
|
|
2010
|
2009
|
||||||||||||
|
Revenue per new vehicle sold—same store(1)
|
$
|
31,276
|
|
$
|
29,978
|
|
$
|
1,298
|
|
4
|
%
|
|||
|
Gross profit per new vehicle sold—same store(1)
|
$
|
2,065
|
|
$
|
2,117
|
|
$
|
(52
|
)
|
(2
|
)%
|
|||
|
New vehicle gross margin—same store(1)
|
6.6
|
%
|
7.1
|
%
|
(0.5
|
)%
|
(7
|
)%
|
||||||
______________________________
|
(1)
|
Same store amounts consist of information from dealerships for the identical months of each period presented in the comparison, commencing with the first full month in which the dealership was owned by us.
|
The
$320.0 million
(
17%
) increase in new vehicle revenue was primarily a result of a
$312.0 million
(
17%
) increase in same store new vehicle revenue due to an 11% increase in same store new vehicle retail unit sales and a 37% increase in same store fleet unit sales. Our total new vehicle revenues also benefited from
$8.0 million
of revenue derived from acquisitions. We believe that the increase in new vehicle retail unit sales was primarily driven by a favorable comparison with an overall weak economic environment during 2009, as well as increased consumer confidence and less stringent consumer lending standards. Unit volumes increased across each of our brand segments, consistent with overall U.S. vehicle sales. New vehicle SAAR increased to 11.6 million for 2010 as compared to 10.4 million for 2009.
Total new vehicle gross profit increased by $
12.4
million (
9%
), which included $0.3 million of gross profit derived from acquisitions. Gross profit from our luxury and mid-line domestic brands increased $
11.3
million (
22%
) and $
5.5
million (
33%
), respectively, but was offset by a $
4.7
million (
7%
) decrease in gross profit from our mid-line import brands. Our gross profit per new vehicle sold decreased $52, driven primarily by the decrease in mid-line import gross profit, due to higher incentives in the 2009 period, including manufacturer incentives and the impact of the Cash for Clunkers program; however, this decrease was more than offset by a $107 increase in F&I per vehicle sold, reflecting an improvement in total gross profit per vehicle sold during 2010.
From time to time we participate in certain manufacturer incentive programs that include performance criteria. In the fourth quarter of 2010, we recognized approximately $2.5 million of manufacturer incentives ($2.1 million of which related to the period of January 2008 through September 2010) related to (i) the purchase and sale of vehicles during the period from January 2008 through December 2010 and (ii) our satisfaction of certain manufacturer facility image standards in the fourth quarter of 2010. The $2.5 million of manufacturer incentives is included as a reduction of new vehicle cost of sales and, as as a result, increased our luxury new vehicle gross profit for 2010. We do not expect this level of manufacturer incentives in the future.
34
Used Vehicle—
|
|
For the Years Ended December 31,
|
Increase
(Decrease)
|
%
Change
|
|||||||||||
|
|
2010
|
2009
|
||||||||||||
|
|
(Dollars in millions, except for per vehicle data)
|
|||||||||||||
|
Revenue:
|
||||||||||||||
|
Used vehicle retail revenues—same store(1)
|
$
|
877.0
|
|
$
|
718.6
|
|
$
|
158.4
|
|
22
|
%
|
|||
|
Used vehicle retail revenues—acquisitions
|
3.0
|
|
—
|
|
||||||||||
|
Total used vehicle retail revenues
|
880.0
|
|
718.6
|
|
161.4
|
|
22
|
%
|
||||||
|
Used vehicle wholesale revenues—same store(1)
|
204.3
|
|
183.8
|
|
20.5
|
|
11
|
%
|
||||||
|
Used vehicle wholesale revenues—acquisitions
|
0.3
|
|
—
|
|
||||||||||
|
Total used vehicle wholesale revenues
|
204.6
|
|
183.8
|
|
20.8
|
|
11
|
%
|
||||||
|
Used vehicle revenue, as reported
|
$
|
1,084.6
|
|
$
|
902.4
|
|
$
|
182.2
|
|
20
|
%
|
|||
|
Gross profit:
|
||||||||||||||
|
Used vehicle retail gross profit—same store(1)
|
$
|
92.7
|
|
$
|
79.9
|
|
$
|
12.8
|
|
16
|
%
|
|||
|
Used vehicle retail gross profit—acquisitions
|
0.4
|
|
—
|
|
||||||||||
|
Total used vehicle retail gross profit
|
93.1
|
|
79.9
|
|
13.2
|
|
17
|
%
|
||||||
|
Used vehicle wholesale gross profit—same store(1)
|
(1.6
|
)
|
(0.5
|
)
|
(1.1
|
)
|
NM
|
|
||||||
|
Used vehicle wholesale gross profit—acquisitions
|
—
|
|
—
|
|
||||||||||
|
Total used vehicle wholesale gross profit
|
(1.6
|
)
|
(0.5
|
)
|
(1.1
|
)
|
NM
|
|
||||||
|
Used vehicle gross profit, as reported
|
$
|
91.5
|
|
$
|
79.4
|
|
$
|
12.1
|
|
15
|
%
|
|||
|
Used vehicle retail units:
|
||||||||||||||
|
Used vehicle retail units—same store(1)
|
46,329
|
|
39,373
|
|
6,956
|
|
18
|
%
|
||||||
|
Used vehicle retail units—acquisitions
|
144
|
|
—
|
|
||||||||||
|
Used vehicle retail units—actual
|
46,473
|
|
39,373
|
|
7,100
|
|
18
|
%
|
||||||
Used Vehicle Metrics—
|
|
For the Years Ended December 31,
|
Increase
(Decrease)
|
%
Change
|
|||||||||||
|
|
2010
|
2009
|
||||||||||||
|
Revenue per used vehicle retailed—same store(1)
|
$
|
18,930
|
|
$
|
18,251
|
|
$
|
679
|
|
4
|
%
|
|||
|
Gross profit per used vehicle retailed—same store(1)
|
$
|
2,001
|
|
$
|
2,029
|
|
$
|
(28
|
)
|
(1
|
)%
|
|||
|
Used vehicle retail gross margin—same store(1)
|
10.6
|
%
|
11.1
|
%
|
(0.5
|
)%
|
(5
|
)%
|
||||||
_________________________
|
(1)
|
Same store amounts consist of information from dealerships for the identical months of each period presented in the comparison, commencing with the first full month in which the dealership was owned by us.
|
The
$182.2 million
(
20%
) increase in used vehicle revenue includes (i) a
$158.4 million
(
22%
) increase in same store used vehicle retail revenue, (ii) a
$20.5 million
(
11%
) increase in same store wholesale revenue and (iii)
$3.3 million
of used vehicle revenues derived from dealership acquisitions. The
$12.1 million
(
15%
) increase in used vehicle gross profit was primarily a result of a
$12.8 million
(
16%
) increase in same store used vehicle retail gross profit, partially offset by a
$1.1 million
increase in same store used vehicle wholesale losses. The increase in used vehicle retail revenue and gross profit was driven primarily by increased unit volume sales, partially offset by a lower gross profit margin of 10.6%, down 50 basis points from the prior year. These results reflect a favorable comparison to an overall weak economic environment in 2009, as well as the benefits of several store-level programs initiated in 2009, including volume-driven initiatives such as our "1:2:1" program, a goal of retailing one used vehicle for every new vehicle retailed. This initiative is designed to drive not only used retail volume, but to increase revenues from associated parts and service reconditioning and F&I as well. The
4%
increase in revenue per used vehicle retailed from 2009 to 2010 was primarily driven by (i) a mix shift towards our higher-priced used vehicles, including Certified Pre-Owned, or "CPO" vehicles, as well as our full-size used trucks and SUVs and (ii) an increase in associated parts
35
and service reconditioning, as reconditioning work generally increases the price of the related used vehicles. We believe this was reflective of an overall trend in 2010, with many customers preferring to purchase a higher-priced used vehicle rather than a comparably priced new vehicle.
We believe our used vehicle inventory is well-aligned with consumer demand, with approximately 35 days of supply in our inventory as of
December 31, 2010
, as compared to approximately 36 days sales in our inventory as of
December 31, 2009
. We expect to continue to reduce the level of used vehicle inventory, based on days supply, with a target of 30 days of supply, which we believe will position us well to improve our used vehicle profitability.
Parts and Service—
|
|
For the Years Ended December 31,
|
Increase
(Decrease)
|
%
Change
|
|||||||||||
|
|
2010
|
2009
|
||||||||||||
|
|
(Dollars in millions)
|
|||||||||||||
|
Revenue:
|
||||||||||||||
|
Parts and service revenue—same store(1)
|
$
|
553.5
|
|
$
|
553.2
|
|
$
|
0.3
|
|
—
|
%
|
|||
|
Parts and service revenues—acquisitions
|
1.9
|
|
—
|
|
||||||||||
|
Parts and service revenue, as reported
|
$
|
555.4
|
|
$
|
553.2
|
|
$
|
2.2
|
|
—
|
%
|
|||
|
Gross profit:
|
||||||||||||||
|
Parts and service gross profit—same store(1):
|
||||||||||||||
|
Customer pay
|
$
|
181.6
|
|
$
|
175.9
|
|
$
|
5.7
|
|
3
|
%
|
|||
|
Warranty
|
48.4
|
|
46.7
|
|
1.7
|
|
4
|
%
|
||||||
|
Reconditioning and preparation
|
45.0
|
|
36.1
|
|
8.9
|
|
25
|
%
|
||||||
|
Wholesale parts
|
21.0
|
|
22.3
|
|
(1.3
|
)
|
(6
|
)%
|
||||||
|
Total parts and service gross profit—same store(1)
|
296.0
|
|
281.0
|
|
15.0
|
|
5
|
%
|
||||||
|
Parts and service gross profit—acquisitions
|
1.1
|
|
—
|
|
||||||||||
|
Parts and service gross profit, as reported
|
$
|
297.1
|
|
$
|
281.0
|
|
$
|
16.1
|
|
6
|
%
|
|||
|
Parts and service gross margin—same store(1)
|
53.5
|
%
|
50.8
|
%
|
2.7
|
%
|
5
|
%
|
||||||
____________________________
|
(1)
|
Same store amounts consist of information from dealerships for the identical months of each period presented in the comparison, commencing with the first full month in which the dealership was owned by us.
|
The
$2.2 million
increase in parts and service revenue was primarily due to $1.9 million of parts and service revenue derived from acquired dealerships. The
$16.1 million
(
6%
) increase in parts and service gross profit was primarily due to a 270 basis point increase in our same store parts and service gross margin primarily as a result of increased gross profit from
reconditioning and preparation of used vehicles. The $8.9 million increase in reconditioning gross profit is a result of the increase in our new and used vehicle unit sales, which provided more reconditioning and preparation work.
We continue to focus on improving our parts and service revenue, and specifically our customer pay business, over the long-term by (i) continuing to invest in additional service capacity, where appropriate, (ii) upgrading equipment, (iii) focusing on improving customer retention and customer satisfaction and (iv) capitalizing on our dealer training programs.
36
Finance and Insurance, net—
|
|
For the Years Ended December 31,
|
Increase
(Decrease)
|
%
Change
|
|||||||||||
|
|
2010
|
2009
|
||||||||||||
|
|
(Dollar in millions, except for per vehicle data)
|
|||||||||||||
|
Finance and insurance, net—same store(1)
|
$
|
116.1
|
|
$
|
90.9
|
|
$
|
25.2
|
|
28
|
%
|
|||
|
Finance and insurance, net—acquisitions
|
0.3
|
|
—
|
|
||||||||||
|
Finance and insurance, net as reported
|
$
|
116.4
|
|
$
|
90.9
|
|
$
|
25.5
|
|
28
|
%
|
|||
|
F&I per vehicle sold—same store(1)
|
$
|
1,003
|
|
$
|
896
|
|
$
|
107
|
|
12
|
%
|
|||
_____________________
|
(1)
|
Same store amounts consist of information from dealerships for the identical months of each period presented in the comparison, commencing with the first full month in which the dealership was owned by us.
|
F&I increased
$25.5 million
(
28%
) during
2010
as compared to
2009
, due to (i) a 14% increase in same store retail unit sales and (ii) a
12%
increase in same store F&I per vehicle sold. The increase in F&I per vehicle sold was primarily attributable to (a) more favorable lending standards and other market factors in 2010, which allowed more of our customers to take advantage of a broader array of F&I products and (b) our continued focus on improving the F&I results at our lower-performing stores by increasing the training of our F&I personnel and implementing certain best practices initiatives, including a certification process for our F&I personnel.
37
Selling, General and Administrative—
|
|
For the Years Ended December 31,
|
Increase
(Decrease)
|
% of Gross
Profit Increase (Decrease)
|
|||||||||||||||||
|
|
2010
|
% of Gross
Profit
|
2009
|
% of Gross
Profit
|
||||||||||||||||
|
|
(Dollars in millions)
|
|||||||||||||||||||
|
Personnel costs
|
$
|
235.6
|
|
36.4
|
%
|
$
|
219.7
|
|
37.7
|
%
|
$
|
15.9
|
|
(1.3
|
)%
|
|||||
|
Sales compensation
|
64.9
|
|
10.0
|
%
|
55.0
|
|
9.4
|
%
|
9.9
|
|
0.6
|
%
|
||||||||
|
Share-based compensation
|
5.1
|
|
0.8
|
%
|
2.8
|
|
0.5
|
%
|
2.3
|
|
0.3
|
%
|
||||||||
|
Outside services
|
47.9
|
|
7.4
|
%
|
47.3
|
|
8.1
|
%
|
0.6
|
|
(0.7
|
)%
|
||||||||
|
Advertising
|
26.2
|
|
4.1
|
%
|
26.8
|
|
4.6
|
%
|
(0.6
|
)
|
(0.5
|
)%
|
||||||||
|
Rent
|
42.2
|
|
6.5
|
%
|
39.3
|
|
6.7
|
%
|
2.9
|
|
(0.2
|
)%
|
||||||||
|
Utilities
|
15.4
|
|
2.4
|
%
|
15.1
|
|
2.6
|
%
|
0.3
|
|
(0.2
|
)%
|
||||||||
|
Insurance
|
10.7
|
|
1.7
|
%
|
13.2
|
|
2.3
|
%
|
(2.5
|
)
|
(0.6
|
)%
|
||||||||
|
Other
|
50.1
|
|
7.7
|
%
|
46.3
|
|
8.0
|
%
|
3.8
|
|
(0.3
|
)%
|
||||||||
|
Selling, general and administrative—same store(1)
|
498.1
|
|
77.0
|
%
|
465.5
|
|
79.9
|
%
|
32.6
|
|
(2.9
|
)%
|
||||||||
|
Acquisitions
|
1.4
|
|
—
|
|
||||||||||||||||
|
Selling, general and administrative—actual
|
$
|
499.5
|
|
77.0
|
%
|
$
|
465.5
|
|
79.9
|
%
|
$
|
34.0
|
|
(2.9
|
)%
|
|||||
|
Gross profit—same store(1)
|
$
|
646.6
|
|
$
|
582.6
|
|
||||||||||||||
|
Gross profit—actual
|
$
|
648.7
|
|
$
|
582.6
|
|
||||||||||||||
________________________
|
(1)
|
Same store amounts consist of information from dealerships for the identical months of each period presented in the comparison, commencing with the first full month in which the dealership was owned by us.
|
Same store SG&A expense as a percentage of gross profit was
77.0%
for
2010
as compared to
79.9%
for
2009
. The 290 basis point decrease was primarily a result of (i) a 130 basis point decrease in personnel costs as a result of leveraging our fixed expenses, and lower fixed compensation expense resulting from the elimination of our regional management structure and staffing reductions and (ii) a 60 basis point decrease in insurance costs associated with our large deductible insurance programs for workers compensation, property and general liability claims. We are also currently engaged in numerous store-level productivity initiatives to improve our profitability, including the transition to a common dealership management system and the consolidation of certain dealership accounting functions.
During 2010, we recognized $0.9 million of incremental rent expense as a result of reaching an agreement with the lessor of our former New York headquarters office space for a cash settlement in exchange for a termination of our remaining lease obligation, which totaled approximately $5.9 million prior to termination. As a result of this agreement, we expect our annual rent expense will be reduced by approximately $0.9 million.
Depreciation and Amortization—
The
$1.1 million
(5%) decrease in depreciation and amortization expense was primarily the result of a significant reduction in capital expenditures in 2010 and 2009 as compared to our historical levels.
Other Operating Expense (Income)—
Other operating expense (income) includes gains and losses from the sale of property and equipment, income derived from lease arrangements and other non-core operating items. The $1.4 million expense in 2010 is related to third party costs associated with our debt refinancing, real estate related losses and revisions to loss estimates associated with legal matters, partially offset by the termination of a lease agreement that resulted in $1.7 million of income.
During 2010 and 2009, we compared the carrying value of certain assets to estimates of fair value determined with the assistance of third-party desktop appraisals and real estate brokers and, as a result, recorded non-cash impairments of certain property and equipment totaling $3.0 million and $0.7 million, which were included in Other Operating Expense (Income) for 2010 and 2009, respectively.
38
Floor Plan Interest Expense—
The
$1.5 million
(14%) decrease in floor plan interest expense was attributable to the lower short-term interest rate environment. Additionally, during 2010, we used excess cash to reduce floor plan notes payable using floor plan offset accounts with certain of our floor plan lenders, effectively lowering our average floor plan notes payable balance during 2010 when compared to the prior year period. We had approximately $48.7 million in these floor plan offset accounts, on a daily weighted average basis, during 2010. We did not have any amounts in floor plan offset accounts during 2009.
Swap Interest Expense —
We have entered into various derivative financial instruments, including fair value and cash flow interest rate swaps, which have been primarily designed to provide hedges against changes in fair value of certain debt obligations and variable rate cash flows. Our earnings have been impacted by these interest rate swaps in the form of (i) amounts reclassified from Accumulated Other Comprehensive Income ("AOCI") to earnings for active swaps, (ii) amortization of amounts reclassified from AOCI to earnings for terminated cash flow swaps and (iii) amortization of terminated fair value swaps. The net impact on earnings related to our various derivative financial instruments for
2010
and
2009
was $6.6 million.
Convertible Debt Discount Amortization —
During
2010
and
2009
, we recognized
$1.4 million
and
$1.8 million
of convertible debt amortization associated with our 3% Convertible Notes. Since a portion of our 3% Convertible Notes will be settled in cash upon conversion, we separately account for the liability and equity components in a manner that reflects our nonconvertible debt borrowing rate when interest cost is recognized in subsequent periods. The excess of the principal amount of the liability component over its initial fair value is amortized to interest cost using the effective interest method. We expect that convertible debt amortization will total approximately $1.0 million in
2011
, based on the $29.5 million aggregate principal amount of 3% Convertible Notes outstanding as of
December 31, 2010
.
(Loss) Gain on Extinguishment of Long-Term Debt—
During
2010
, we recognized a
$12.6 million
net loss on the extinguishment of long-term debt, consisting of (i) an $11.3 million loss on the extinguishment of our remaining outstanding $179.4 million of 8% Senior Subordinated Notes due 2014 (the "8% Notes") and (ii) a $1.3 million net loss on the repurchase of $25.2 million of our 3% Convertible Notes for $24.4 million. Included in the $11.3 million loss on the extinguishment of our remaining 8% Notes was (i) $5.2 million of premiums paid in connection with the repurchase of the 8% Notes pursuant to a tender offer, (ii) a $3.6 million write-off of unamortized hedging activity associated with a terminated fair value swap and (iii) a $2.5 million write-off of the remaining unamortized debt issuance costs associated with the 8% Notes. Included in the $1.3 million net loss on the repurchase of our 3% Convertible Notes was (a) a $1.8 million pro-rata write-off of the unamortized discount associated with the repurchased 3% Convertible Notes and (b) a $0.3 million pro-rata write-off of unamortized debt issuance costs, partially offset by a $0.8 million gain on the repurchase of the 3% Convertible Notes.
Income Tax Expense—
The
$8.1 million
(
54%
) increase in income tax expense was primarily a result of the
$20.2 million
(
50%
) increase in income before income taxes in 2010 as compared to 2009. Our effective tax rate increased from 37.5% for the
2009
period to 38.3% for the
2010
period. The 80 basis point increase is primarily a result of the reversal of certain tax reserves in 2009, partially offset by 2010 tax exempt income and 2009 tax exempt losses from corporate owned life insurance policies. Our effective tax rate is highly dependent on our level of income before income taxes and permanent differences between book and tax income. As a result, it is difficult to project our overall effective tax rate for any given period. Based upon our current expectation of
2011
income before income taxes, we expect our effective income tax rate will be between 38% and 40% in
2011
.
Discontinued Operations—
During
2010
, we sold one franchise (one dealership location). The
$0.8 million
, net of tax, net income from discontinued operations during
2010
consists of $2.5 million, net of tax, of income from insurance proceeds related to tornado damage to vacant real estate of one of our former dealership locations in Yazoo City, Mississippi, partially offset by (i) $1.3 million, net of tax, of impairment expenses related to certain property not currently used in our operations, (ii) $0.2 million, net of tax, of rent acceleration on certain real estate not currently used in our operations, (iii) $0.1 million, net of tax, of net operating losses of franchises sold prior to or pending disposition as of
December 31, 2010
, including primarily rent and other expenses of idle facilities and (iv) a $0.1 million, net of tax, loss on the sale of one franchise (one dealership location).
During 2009, we sold four franchises (three dealership locations) and closed six franchises (three dealership locations) and,
39
as of December 31, 2009, there was one franchise (one dealership location) pending disposition. The $11.8 million, net of tax, net loss from discontinued operations for 2009 is a result of (i) $8.7 million, net of tax, of net operating losses of franchises sold prior to or pending disposition as of
December 31, 2010
, including rent expense of idle facilities and legal expenses for franchises sold prior to
December 31, 2010
, (ii) $3.0 million, net of tax, of impairment expenses related to abandoned real estate from discontinued operations and (iii) $2.5 million, net of tax, of rent accelerations on abandoned properties, partially offset by a $2.4 million, net of tax, net gain on the sale of dealerships.
We continuously evaluate the financial and operating results of our dealerships, as well as each dealership’s geographical location, and may continue to refine our dealership portfolio through strategic acquisitions or divestitures from time to time.
RESULTS OF OPERATIONS
Year Ended
December 31, 2009
Compared to Year Ended
December 31, 2008
|
|
For the Years Ended December 31,
|
|||||||||||||
|
|
2009
|
2008
|
Increase
(Decrease)
|
%
Change
|
||||||||||
|
|
(Dollars In millions, except per share data)
|
|||||||||||||
|
REVENUES:
|
||||||||||||||
|
New vehicle
|
$
|
1,859.6
|
|
$
|
2,371.8
|
|
$
|
(512.2
|
)
|
(22
|
)%
|
|||
|
Used vehicle
|
902.4
|
|
1,012.3
|
|
(109.9
|
)
|
(11
|
)%
|
||||||
|
Parts and service
|
553.2
|
|
581.8
|
|
(28.6
|
)
|
(5
|
)%
|
||||||
|
Finance and insurance, net
|
90.9
|
|
127.5
|
|
(36.6
|
)
|
(29
|
)%
|
||||||
|
Total revenues
|
3,406.1
|
|
4,093.4
|
|
(687.3
|
)
|
(17
|
)%
|
||||||
|
GROSS PROFIT:
|
||||||||||||||
|
New vehicle
|
131.3
|
|
164.7
|
|
(33.4
|
)
|
(20
|
)%
|
||||||
|
Used vehicle
|
79.4
|
|
86.7
|
|
(7.3
|
)
|
(8
|
)%
|
||||||
|
Parts and service
|
281.0
|
|
298.4
|
|
(17.4
|
)
|
(6
|
)%
|
||||||
|
Finance and insurance, net
|
90.9
|
|
127.5
|
|
(36.6
|
)
|
(29
|
)%
|
||||||
|
Total gross profit
|
582.6
|
|
677.3
|
|
(94.7
|
)
|
(14
|
)%
|
||||||
|
OPERATING EXPENSES:
|
||||||||||||||
|
Selling, general and administrative
|
465.5
|
|
547.8
|
|
(82.3
|
)
|
(15
|
)%
|
||||||
|
Depreciation and amortization
|
22.2
|
|
21.1
|
|
1.1
|
|
5
|
%
|
||||||
|
Impairment expenses
|
—
|
|
528.7
|
|
(528.7
|
)
|
NM
|
|
||||||
|
Other operating (income) expense, net
|
(0.8
|
)
|
1.3
|
|
(2.1
|
)
|
(162
|
)%
|
||||||
|
Income (loss) from operations
|
95.7
|
|
(421.6
|
)
|
517.3
|
|
(123
|
)%
|
||||||
|
OTHER INCOME (EXPENSE):
|
||||||||||||||
|
Floor plan interest expense
|
(10.9
|
)
|
(22.2
|
)
|
(11.3
|
)
|
(51
|
)%
|
||||||
|
Other interest expense, net
|
(36.2
|
)
|
(37.1
|
)
|
(0.9
|
)
|
(2
|
)%
|
||||||
|
Swap interest expense
|
(6.6
|
)
|
(5.5
|
)
|
1.1
|
|
20
|
%
|
||||||
|
Convertible debt discount amortization
|
(1.8
|
)
|
(3.0
|
)
|
(1.2
|
)
|
(40
|
)%
|
||||||
|
Gain on extinguishment of long-term debt
|
0.1
|
|
26.2
|
|
(26.1
|
)
|
NM
|
|
||||||
|
Total other expense, net
|
(55.4
|
)
|
(41.6
|
)
|
13.8
|
|
33
|
%
|
||||||
|
Income (loss) before income taxes
|
40.3
|
|
(463.2
|
)
|
503.5
|
|
109
|
%
|
||||||
|
INCOME TAX EXPENSE (BENEFIT)
|
15.1
|
|
(136.2
|
)
|
151.3
|
|
111
|
%
|
||||||
|
INCOME (LOSS) FROM CONTINUING OPERATIONS
|
25.2
|
|
(327.0
|
)
|
352.2
|
|
108
|
%
|
||||||
|
DISCONTINUED OPERATIONS, net of tax
|
(11.8
|
)
|
(16.7
|
)
|
4.9
|
|
29
|
%
|
||||||
|
NET INCOME (LOSS)
|
$
|
13.4
|
|
$
|
(343.7
|
)
|
$
|
357.1
|
|
104
|
%
|
|||
|
Income (loss) from continuing operations per common share—Diluted
|
$
|
0.77
|
|
$
|
(10.32
|
)
|
$
|
11.09
|
|
107
|
%
|
|||
|
Net income (loss) per common share—Diluted
|
$
|
0.41
|
|
$
|
(10.84
|
)
|
$
|
11.25
|
|
104
|
%
|
|||
40
|
|
For the Years Ended
December 31,
|
||||
|
|
2009
|
2008
|
|||
|
REVENUE MIX PERCENTAGES:
|
|||||
|
New vehicles
|
54.6
|
%
|
57.9
|
%
|
|
|
Used retail vehicles
|
21.1
|
%
|
19.4
|
%
|
|
|
Used vehicle wholesale
|
5.4
|
%
|
5.4
|
%
|
|
|
Parts and service
|
16.2
|
%
|
14.2
|
%
|
|
|
Finance and insurance, net
|
2.7
|
%
|
3.1
|
%
|
|
|
Total revenue
|
100.0
|
%
|
100.0
|
%
|
|
|
GROSS PROFIT MIX PERCENTAGES:
|
|||||
|
New vehicles
|
22.5
|
%
|
24.3
|
%
|
|
|
Used retail vehicles
|
13.8
|
%
|
13.2
|
%
|
|
|
Used vehicle wholesale
|
(0.1
|
)%
|
(0.4
|
)%
|
|
|
Parts and service
|
48.2
|
%
|
44.1
|
%
|
|
|
Finance and insurance, net
|
15.6
|
%
|
18.8
|
%
|
|
|
Total gross profit
|
100.0
|
%
|
100.0
|
%
|
|
|
SG&A EXPENSES AS A PERCENTAGE OF GROSS PROFIT
|
79.9
|
%
|
80.9
|
%
|
|
Net income (loss) and income (loss) from continuing operations increased
$357.1 million
and
$352.2 million
, respectively, during
2009
, as compared to
2008
, primarily as a result of impairment expenses during
2008
totaling $383.0 million, net of tax. Our loss from discontinued operations decreased
$4.9 million
, net of tax, during
2009
as compared to
2008
, primarily related to lower impairment expenses in
2009
as compared to
2008
.
The
$352.2 million
increase in income (loss) from continuing operations was primarily a result of impairment expenses in
2008
totaling $368.6 million, net of tax. We experienced declines in gross profit across all four of our business lines in 2009, and $26.1 million of lower gains from the repurchases of a portion of our senior subordinated notes. These decreases in income (loss) from continuing operations were partially offset by (i) an
$82.3 million
(
15%
) decrease in SG&A expense and (ii) an
$11.3 million
(
51%
) decrease in floor plan interest expense, as a result of lower inventory and lower short-term interest rates.
The
$687.3 million
(
17%
) decrease in total revenue was primarily a result of a
$512.2 million
(22)%
decrease in new vehicle revenue and a
$109.9 million
(11)%
decrease in used vehicle revenue. The decrease in new vehicle revenue includes a $518.2 million (22%) decrease in same store new vehicle revenue, partially offset by $6.0 million derived from dealership acquisitions. The decrease in used vehicle revenue includes a $72.8 million (9%) decrease in same store retail revenue and a$39.8 million (18%) decrease in same store wholesale revenue, partially offset by $2.7 million in used vehicle revenue derived from dealership acquisitions.
The
$94.7 million
(
14%
) decrease in total gross profit was primarily a result of a $36.6 million (29%) decrease in F&I gross profit, a $33.4 million (20%) decrease in new vehicle gross profit and a $17.4 million (6%) decrease in parts and service gross profit . Our total gross profit margin increased 60 basis points to 17.1%, principally as a result of a mix shift to our higher margin parts and service business.
41
New Vehicle—
|
|
For the Years Ended December 31,
|
Increase
(Decrease)
|
%
Change
|
|||||||||||
|
|
2009
|
2008
|
||||||||||||
|
|
(Dollars in millions, except for per vehicle data)
|
|||||||||||||
|
Revenue:
|
||||||||||||||
|
New vehicle revenue—same store(1)
|
||||||||||||||
|
Luxury
|
$
|
665.7
|
|
$
|
876.0
|
|
$
|
(210.3
|
)
|
(24
|
)%
|
|||
|
Mid-line import
|
940.2
|
|
1,198.6
|
|
(258.4
|
)
|
(22
|
)%
|
||||||
|
Mid-line domestic
|
247.7
|
|
297.2
|
|
(49.5
|
)
|
(17
|
)%
|
||||||
|
Total new vehicle revenue—same store(1)
|
1,853.6
|
|
2,371.8
|
|
(518.2
|
)
|
(22
|
)%
|
||||||
|
New vehicle revenue—acquisitions
|
6.0
|
|
—
|
|
||||||||||
|
New vehicle revenue, as reported
|
$
|
1,859.6
|
|
$
|
2,371.8
|
|
$
|
(512.2
|
)
|
(22
|
)%
|
|||
|
Gross profit:
|
||||||||||||||
|
New vehicle gross profit—same store(1)
|
||||||||||||||
|
Luxury
|
$
|
50.3
|
|
$
|
64.6
|
|
$
|
(14.3
|
)
|
(22
|
)%
|
|||
|
Mid-line import
|
63.9
|
|
80.0
|
|
(16.1
|
)
|
(20
|
)%
|
||||||
|
Mid-line domestic
|
16.8
|
|
20.1
|
|
(3.3
|
)
|
(16
|
)%
|
||||||
|
Total new vehicle gross profit—same store(1)
|
131.0
|
|
164.7
|
|
(33.7
|
)
|
(20
|
)%
|
||||||
|
New vehicle gross profit—acquisitions
|
0.3
|
|
—
|
|
||||||||||
|
New vehicle gross profit, as reported
|
$
|
131.3
|
|
$
|
164.7
|
|
$
|
(33.4
|
)
|
(20
|
)%
|
|||
|
|
For the Years Ended December 31,
|
Increase
(Decrease)
|
%
Change
|
||||||||
|
|
2009
|
2008
|
|||||||||
|
New vehile units:
|
|||||||||||
|
New vehicle retail units—same store(1)
|
|||||||||||
|
Luxury
|
14,248
|
|
18,663
|
|
(4,415
|
)
|
(24
|
)%
|
|||
|
Mid-line import
|
38,515
|
|
48,435
|
|
(9,920
|
)
|
(20
|
)%
|
|||
|
Mid-line domestic
|
7,234
|
|
9,277
|
|
(2,043
|
)
|
(22
|
)%
|
|||
|
Total new vehicle retail units—same store(1)
|
59,997
|
|
76,375
|
|
(16,378
|
)
|
(21
|
)%
|
|||
|
Fleet vehicles
|
1,785
|
|
3,086
|
|
(1,301
|
)
|
(42
|
)%
|
|||
|
New vehicle units—same store(1)
|
61,782
|
|
79,461
|
|
(17,679
|
)
|
(22
|
)%
|
|||
|
Total new vehicle units—acquisitions
|
251
|
|
—
|
|
|||||||
|
New vehicle units—actual
|
62,033
|
|
79,461
|
|
(17,428
|
)
|
(22
|
)%
|
|||
42
New Vehicle Metrics—
|
|
For the Years Ended December 31,
|
Increase
(Decrease)
|
%
Change
|
|||||||||||
|
|
2009
|
2008
|
||||||||||||
|
Revenue per new vehicle sold—same store(1)
|
$
|
30,002
|
|
$
|
29,849
|
|
$
|
153
|
|
1
|
%
|
|||
|
Gross profit per new vehicle sold—same store(1)
|
$
|
2,120
|
|
$
|
2,073
|
|
$
|
47
|
|
2
|
%
|
|||
|
New vehicle gross margin—same store(1)
|
7.1
|
%
|
6.9
|
%
|
0.2
|
%
|
3
|
%
|
||||||
_______________________
|
(1)
|
Same store amounts consist of information from dealerships for the identical months of each period presented in the comparison, commencing with the first full month in which the dealership was owned by us.
|
The
$512.2 million
(
22%
) decrease in new vehicle revenue was primarily a result of a
$518.2 million
(
22%
) decrease in same store new vehicle revenue due to a 21% decrease in same store new vehicle retail unit sales and a 42% decrease in same store fleet unit sales. These decreases were partially offset by $6.0 million of revenue derived from acquisitions. The decrease in new vehicle revenue was driven by low consumer confidence, the overall economic environment and the turmoil in the financial markets, which led to more stringent lending standards for manufacturer captive and bank financing, including decreasing loan-to-value ratios and increasing credit score requirements for consumers. Unit volumes declined across each of our brand segments, consistent with overall U.S. vehicle sales. This was partially offset by the sale of approximately 3,300 new vehicles in connection with the Cash for Clunkers program. We believe the attention that this program created increased traffic at our stores and led to additional new and used vehicle sales that were not part of the Cash for Clunkers program.
The
$33.4 million
(
20%
) decrease in new vehicle gross profit was due to a
$33.7 million
(
20%
) decrease in same store new vehicle gross profit, resulting from a 21% decrease in same store new vehicle retail unit sales. These decreases were partially offset by $0.3 million of gross profit derived from acquisitions. The unit sales and margin declines reflect a competitive marketplace with less business available due to the overall weak economic environment and more stringent lending standards.
43
Used Vehicle—
|
|
For the Years Ended
December 31,
|
Increase
(Decrease)
|
%
Change
|
|||||||||||
|
|
2009
|
2008
|
||||||||||||
|
|
(Dollars in millions, except for per vehicle data)
|
|||||||||||||
|
Revenue:
|
||||||||||||||
|
Used vehicle retail revenues—same store(1)
|
$
|
716.6
|
|
$
|
789.4
|
|
$
|
(72.8
|
)
|
(9
|
)%
|
|||
|
Used vehicle retail revenues—acquisitions
|
2.0
|
|
—
|
|
||||||||||
|
Total used vehicle retail revenues
|
718.6
|
|
789.4
|
|
(70.8
|
)
|
(9
|
)%
|
||||||
|
Used vehicle wholesale revenues—same store(1)
|
183.1
|
|
222.9
|
|
(39.8
|
)
|
(18
|
)%
|
||||||
|
Used vehicle wholesale revenues—acquisitions
|
0.7
|
|
—
|
|
||||||||||
|
Total used vehicle wholesale revenues
|
183.8
|
|
222.9
|
|
(39.1
|
)
|
(18
|
)%
|
||||||
|
Used vehicle revenue, as reported
|
$
|
902.4
|
|
$
|
1,012.3
|
|
$
|
(109.9
|
)
|
(11
|
)%
|
|||
|
Gross profit:
|
||||||||||||||
|
Used vehicle retail gross profit—same store(1)
|
$
|
79.6
|
|
$
|
89.7
|
|
$
|
(10.1
|
)
|
(11
|
)%
|
|||
|
Used vehicle retail gross profit—acquisitions
|
0.3
|
|
—
|
|
||||||||||
|
Total used vehicle retail gross profit
|
79.9
|
|
89.7
|
|
(9.8
|
)
|
(11
|
)%
|
||||||
|
Used vehicle wholesale gross profit—same store(1)
|
(0.5
|
)
|
(3.0
|
)
|
2.5
|
|
(83
|
)%
|
||||||
|
Used vehicle wholesale gross profit—acquisitions
|
—
|
|
—
|
|
||||||||||
|
Total used vehicle wholesale gross profit
|
(0.5
|
)
|
(3.0
|
)
|
2.5
|
|
(83
|
)%
|
||||||
|
Used vehicle gross profit, as reported
|
$
|
79.4
|
|
$
|
86.7
|
|
$
|
(7.3
|
)
|
(8
|
)%
|
|||
|
Used vehicle retail units:
|
||||||||||||||
|
Used vehicle retail units—same store(1)
|
39,240
|
|
44,241
|
|
(5,001
|
)
|
(11
|
)%
|
||||||
|
Used vehicle retail units—acquisitions
|
133
|
|
—
|
|
||||||||||
|
Used vehicle retail units—actual
|
39,373
|
|
44,241
|
|
(4,868
|
)
|
(11
|
)%
|
||||||
Used Vehicle Metrics—
|
|
For the Years Ended
December 31,
|
Increase
(Decrease)
|
%
Change
|
|||||||||||
|
|
2009
|
2008
|
||||||||||||
|
Revenue per used vehicle retailed—same store(1)
|
$
|
18,262
|
|
$
|
17,843
|
|
$
|
419
|
|
2
|
%
|
|||
|
Gross profit per used vehicle retailed—same store(1)
|
$
|
2,029
|
|
$
|
2,028
|
|
$
|
1
|
|
—
|
%
|
|||
|
Used vehicle retail gross margin—same store(1)
|
11.1
|
%
|
11.4
|
%
|
(0.3
|
)%
|
(3
|
)%
|
||||||
_______________________
|
(1)
|
Same store amounts consist of information from dealerships for the identical months of each period presented in the comparison, commencing with the first full month in which the dealership was owned by us.
|
The
$109.9 million
(
11%
) decrease in used vehicle revenue includes a $72.8 million (9%) decrease in same store retail revenue and a $39.8 million (18%) decrease in same store wholesale revenue, partially offset by $2.7 million in revenue derived from dealership acquisitions. The
$7.3 million
(
8%
) decrease in used vehicle gross profit was primarily a result of a $10.1 million (11%) decrease in same store retail gross profit, partially offset by a $2.5 million reduction in wholesale losses. The decrease in used vehicle retail revenue and gross profit was driven by unit volume declines that reflected (i) a weak retail environment and (ii) a tighter lending environment, which in turn resulted in lower sales to sub-prime customers. The decrease in used vehicle wholesale revenue was a result of lower new retail and used retail unit sales, which resulted in fewer vehicles from trade-ins available to sell at auction.
44
Parts and Service—
|
|
For the Years Ended
December 31,
|
Increase
(Decrease)
|
%
Change
|
|||||||||||
|
|
2009
|
2008
|
||||||||||||
|
|
(Dollars in millions)
|
|||||||||||||
|
Revenue:
|
||||||||||||||
|
Parts and service revenue—same store(1)
|
$
|
550.9
|
|
$
|
581.8
|
|
$
|
(30.9
|
)
|
(5
|
)%
|
|||
|
Parts and service revenues—acquisitions
|
2.3
|
|
—
|
|
||||||||||
|
Parts and service revenue, as reported
|
$
|
553.2
|
|
$
|
581.8
|
|
$
|
(28.6
|
)
|
(5
|
)%
|
|||
|
Gross profit:
|
||||||||||||||
|
Parts and service gross profit—same store(1):
|
||||||||||||||
|
Customer pay
|
$
|
175.3
|
|
$
|
182.9
|
|
$
|
(7.6
|
)
|
(4
|
)%
|
|||
|
Warranty
|
46.5
|
|
48.8
|
|
(2.3
|
)
|
(5
|
)%
|
||||||
|
Reconditioning and preparation
|
36.0
|
|
43.0
|
|
(7.0
|
)
|
(16
|
)%
|
||||||
|
Wholesale parts
|
22.2
|
|
23.7
|
|
(1.5
|
)
|
(6
|
)%
|
||||||
|
Total parts and service gross profit—same store(1)
|
280.0
|
|
298.4
|
|
(18.4
|
)
|
(6
|
)%
|
||||||
|
Parts and service gross profit—acquisitions
|
1.0
|
|
—
|
|
|
|
||||||||
|
Parts and service gross profit, as reported
|
$
|
281.0
|
|
$
|
298.4
|
|
$
|
(17.4
|
)
|
(6
|
)%
|
|||
|
Parts and service gross margin—same store(1)
|
50.8
|
%
|
51.3
|
%
|
(0.5
|
)%
|
(1
|
)%
|
||||||
_______________________
|
(1)
|
Same store amounts consist of information from dealerships for the identical months of each period presented in the comparison, commencing with the first full month in which the dealership was owned by us.
|
The
$28.6 million
(
5%
) decrease in parts and service revenues and
$17.4 million
(
6%
) decrease in parts and service gross profit were due to a decrease in our customer pay business as well as a decrease in gross profit from reconditioning and preparation of used vehicles. Same store customer pay parts and service revenue and gross profit decreased $19.3 million (5%) and $7.6 million (4%), respectively. We believe customers were delaying maintenance visits and larger repair work as they reduced non-essential spending during the challenging economic environment.
Finance and Insurance, net—
|
|
For the Years
Ended December 31,
|
Increase
(Decrease)
|
%
Change
|
|||||||||||
|
|
2009
|
2008
|
||||||||||||
|
|
(Dollars in millions, except for per vehicle data)
|
|||||||||||||
|
Dealership generated F&I—same store(1)
|
$
|
90.6
|
|
$
|
122.8
|
|
$
|
(32.2
|
)
|
(26
|
)%
|
|||
|
Dealership generated F&I—acquisitions
|
0.3
|
|
—
|
|
||||||||||
|
Dealership generated F&I, net
|
90.9
|
|
122.8
|
|
(31.9
|
)
|
(26
|
)%
|
||||||
|
Corporate generated F&I
|
—
|
|
4.7
|
|
(4.7
|
)
|
NM
|
|
||||||
|
Finance and insurance, net as reported
|
$
|
90.9
|
|
$
|
127.5
|
|
$
|
(36.6
|
)
|
(29
|
)%
|
|||
|
Dealership generated F&I per vehicle sold—same store(1) (2)
|
$
|
897
|
|
$
|
993
|
|
$
|
(96
|
)
|
(10
|
)%
|
|||
|
F&I per vehicle sold—same store(1)
|
$
|
897
|
|
$
|
1,031
|
|
$
|
(134
|
)
|
(13
|
)%
|
|||
____________________
|
(1)
|
Same store amounts consist of information from dealerships for the identical months of each period presented in the comparison, commencing with the first full month in which the dealership was owned by us.
|
|
(2)
|
Dealership generated F&I per vehicle sold excludes corporate generated F&I.
|
We evaluate our dealership generated F&I performance on a per vehicle sold basis by dividing dealership generated F&I gross profit by the number of vehicles sold during the period. We also evaluate F&I gross profit from any gains related to the
45
sale of our remaining interest in certain contracts (“Corporate generated F&I”).
F&I decreased
$36.6 million
(
29%
) during
2009
as compared to
2008
, due to (i) an 18% decrease in same store unit sales, (ii) a 10% decrease in same store dealership generated F&I per vehicle sold and (iii) a decrease of $4.7 million resulting from a corporate generated F&I gain related to the sale of our remaining interest in a pool of maintenance contracts in 2008. These decreases in F&I were partially offset by $0.3 million derived from dealership acquisitions.
The decrease in dealership generated F&I per vehicle sold was primarily attributable to lower financing commissions due to more stringent lending standards, which included lower loan to value ratios, which limit our opportunity to offer customers our full array of finance and insurance products. In addition, we believe that customers were very concerned about their monthly payment amount in light of the difficult economic environment.
Selling, General and Administrative—
|
|
For the Years Ended December 31,
|
Increase
(Decrease)
|
% of Gross
Profit Increase (Decrease)
|
|||||||||||||||||
|
|
2009
|
% of Gross
Profit
|
2008
|
% of Gross
Profit
|
||||||||||||||||
|
|
(Dollars in millions)
|
|||||||||||||||||||
|
Personnel costs
|
$
|
219.1
|
|
37.7
|
%
|
$
|
252.4
|
|
37.3
|
%
|
$
|
(33.3
|
)
|
0.4
|
%
|
|||||
|
Sales compensation
|
54.8
|
|
9.4
|
%
|
70.7
|
|
10.4
|
%
|
(15.9
|
)
|
(1.0
|
)%
|
||||||||
|
Share-based compensation
|
2.8
|
|
0.5
|
%
|
1.9
|
|
0.3
|
%
|
0.9
|
|
0.2
|
%
|
||||||||
|
Outside services
|
47.2
|
|
8.1
|
%
|
53.7
|
|
7.9
|
%
|
(6.5
|
)
|
0.2
|
%
|
||||||||
|
Advertising
|
26.7
|
|
4.6
|
%
|
39.5
|
|
5.8
|
%
|
(12.8
|
)
|
(1.2
|
)%
|
||||||||
|
Rent
|
39.3
|
|
6.8
|
%
|
44.2
|
|
6.5
|
%
|
(4.9
|
)
|
0.3
|
%
|
||||||||
|
Utilities
|
15.0
|
|
2.6
|
%
|
15.9
|
|
2.3
|
%
|
(0.9
|
)
|
0.3
|
%
|
||||||||
|
Insurance
|
13.2
|
|
2.3
|
%
|
11.9
|
|
1.8
|
%
|
1.3
|
|
0.5
|
%
|
||||||||
|
Other
|
46.2
|
|
8.0
|
%
|
57.6
|
|
8.6
|
%
|
(11.4
|
)
|
(0.6
|
)%
|
||||||||
|
Selling, general and administrative—same store(1)
|
464.3
|
|
80.0
|
%
|
547.8
|
|
80.9
|
%
|
(83.5
|
)
|
(0.9
|
)%
|
||||||||
|
Acquisitions
|
1.2
|
|
—
|
|
||||||||||||||||
|
Selling, general and administrative—actual
|
$
|
465.5
|
|
79.9
|
%
|
$
|
547.8
|
|
80.9
|
%
|
$
|
(82.3
|
)
|
(1.0
|
)%
|
|||||
|
Gross Profit—same store
|
$
|
580.7
|
|
$
|
677.3
|
|
||||||||||||||
|
Gross Profit—actual
|
$
|
582.6
|
|
$
|
677.3
|
|
||||||||||||||
_______________________
|
(1)
|
Same store amounts consist of information from dealerships for the identical months of each period presented in the comparison, commencing with the first full month in which the dealership was owned by us.
|
Same store SG&A expense as a percentage of gross profit was
80.0%
for
2009
, as compared to
80.9%
for
2008
. The 90 basis point decrease was primarily a result of (i) a 120 basis point reduction in advertising expense due to our focus on managing advertising spend in the depressed retail environment during 2009 and (ii) a 100 basis point decrease in sales compensation expense due to our restructuring of variable compensation plans. These items were partially offset by the de-leveraging impact on our cost structure from the decline in vehicle sales volumes, including a 50 basis point increase in personnel costs and a 50 basis point increase in insurance costs associated with our large deductible insurance programs for workers compensation, property and general liability claims.
Depreciation and Amortization—
The $1.1 million (5%) increase in depreciation and amortization expense was a result of property and equipment acquired during
2009
and
2008
, including the purchase of $207.9 million of previously leased property in the second quarter of
2008
.
46
Impairment Expenses—
During the fourth quarter of
2009
, we compared the carrying value of our assets held for sale to estimates of fair values determined with the assistance of third-party desktop appraisals and real estate brokers and, as a result, recorded $5.5 million in non-cash impairments of certain property and equipment, $4.8 million of which is included in Discontinued Operations for
2009
(see “Discontinued Operations” below). The remaining $0.7 million non-cash impairment charge was included in Other Operating (Income) Expense in 2009 (for further discussion of our asset impairment expenses, please refer to Note 10 of our consolidated financial statements).
During the fourth quarter of
2008
, we experienced a sustained decline in our market capitalization and a significant decline in total revenue due to overall retail industry conditions driven by declining consumer confidence, more stringent lending standards, rising gas prices, changes in consumer demand and falling home prices. Our stock price decreased 60% from $11.52 per share as of September 30, 2008, to $4.57 per share as of
December 31, 2008
, which significantly reduced our total market capitalization. In addition, our total revenues decreased approximately 30% during the fourth quarter of
2008
as compared to the fourth quarter of 2007. During
2008
, we recognized impairment expenses from continuing operations totaling $528.7 million, which includes (i) a $491.7 million impairment of all of our goodwill, (ii) a $30.9 million impairment of franchise rights and other intangible assets and (iii) a $6.1 million impairment of certain property and equipment.
Other Operating (Income) Expense—
Other operating (income) expense includes gains and losses from the sale of property and equipment, income derived from sub-lease arrangements and other non-core operating items. Other non-core operating items during 2008 include executive separation benefits expense of $1.7 million related to the separation from the Company of our former chief financial officer.
Floor Plan Interest Expense—
The
$11.3 million
(51%) decrease in floor plan interest expense was attributable to a lower average balance of new vehicle inventory and the lower short-term interest rate environment.
Other Interest Expense—
The $2.2 million (6%) decrease in other interest expense was primarily attributable to lower average indebtedness outstanding as a result of the repurchase of $59.8 million of senior subordinated notes in the fourth quarter of
2008
and the repayment of $8.0 million of mortgage notes payable in the third quarter of
2009
.
Swap Interest Expense —
We have entered into various derivative financial instruments, including fair value and cash flow interest rate swaps, which have been primarily designed to provide hedges against changes in fair value of certain debt obligations and variable rate cash flows. Our earnings have been impacted by these interest rate swaps in the form of (i) amounts reclassified from AOCI to earnings for active swaps, (ii) amortization of amounts reclassified from AOCI to earnings for terminated cash flow swaps and (iii) amortization of terminated fair value swaps. The net impact on earnings related to our various derivative financial instruments for
2009
and
2008
was $6.6 million and $5.5 million, respectively.
Convertible Debt Discount Amortization —
During
2009
, and
2008
, we recognized
$1.8 million
and
$3.0 million
of convertible debt amortization associated with our 3% Convertible Notes. Since a portion of our 3% Convertible Notes will be settled in cash upon conversion, we separately account for the liability and equity components in a manner that reflects our nonconvertible debt borrowing rate when interest cost is recognized in subsequent periods. The excess of the principal amount of the liability component over its initial fair value is amortized to interest cost using the effective interest method.
Gain (Loss) on Extinguishment of Long-Term Debt—
During 2008, we recognized a $26.2 million net gain on the extinguishment of long-term debt. Included in the $26.2 million net gain was a $35.8 million gain on the repurchase of $59.8 million of our senior subordinated notes for $24.0 million, partially offset by (i) a $6.5 million pro-rata write-off of the unamortized discount associated with the repurchased 3% Convertible Notes and (ii) a $1.4 million pro-rata write-off of debt issuance costs. In addition, we recognized a $1.7 million loss as a result of our decision to terminate our credit facility with JPMorgan Chase Bank N.A. in September 2008, which represents the unamortized debt issuance costs associated with such facility.
47
Income Tax (Benefit) Expense—
The $151.3 million increase in income tax expense was primarily a result of the recognition of $528.7 million of impairment expenses from continuing operations in 2008. Our effective tax rate increased from 29.4% for the 2008 period to 37.5% for the 2009 period. The 810 basis point increase is primarily a result of excess book goodwill over tax goodwill for which we will not receive a tax benefit, the impact of losses on our corporate owned life insurance policies for which we will not received a tax benefit, partially offset by the reversal of deferred tax asset valuation allowances that we now expect to realize.
Discontinued Operations—
During 2009, we sold four franchises (three dealership locations) and closed six franchises (three dealership locations), and as of December 31, 2009, there was one franchise (one dealership location) pending disposition. The $11.8 million, net of tax, net loss from discontinued operations for 2009 is a result of (i) $8.7 million, net of tax, of net operating losses of franchises sold or pending disposition as of
December 31, 2010
, including rent expense of idle facilities and legal expenses of franchises sold prior to
December 31, 2010
, (ii) $3.0 million, net of tax, of impairment expenses related to abandoned real estate from discontinued operations and (iii) $2.5 million, net of tax, of rent accelerations on abandoned properties, partially offset by a $2.4 million, net of tax, net gain on the sale of dealerships.
The
$16.7 million
, net of tax, net loss from discontinued operations during 2008 includes (i) $14.4 million, net of tax, of impairment expenses related to discontinued operations, (ii) $2.0 million of net operating losses of franchises sold or pending disposition as of
December 31, 2010
, including rent expense of idle facilities and miscellaneous legal expenses of franchises sold prior to
December 31, 2010
and (iii) a $0.3 million, net of tax, loss on the sale of five franchises (four dealership locations).
LIQUIDITY AND CAPITAL RESOURCES
As of
December 31, 2010
, we had total available liquidity of $255.9 million, which includes cash and cash equivalents of
$21.3 million
, borrowing availability of $175.1 million under our various credit facilities and $59.5 million of availability under new vehicle floor plan offset accounts with certain of our floor plan lenders, which are generally accessible within one to two days. The total borrowing capacity under our credit facilities of $200.0 million is limited by a borrowing base calculation and, from time to time, may be further limited by our required compliance with certain financial covenants. These financial covenants currently do not further limit our availability under our credit facilities. For a detailed discussion of our financial covenants, see “Covenants” below.
We continuously evaluate our liquidity and capital resources based upon (i) our cash and cash equivalents on hand, (ii) the funds that we expect to generate through future operations, (iii) current and expected borrowing availability under our revolving credit facilities, floor plan facilities and mortgage financing, (iv) amounts in our new vehicle floor plan notes payable offset accounts and (v) the potential impact of any contemplated or pending future transactions, including, but not limited to, financings, acquisitions, dispositions or other capital expenditures. We believe we will have sufficient liquidity to meet our debt service and working capital requirements; commitments and contingencies; debt repayment, maturity and repurchase obligations; acquisitions; capital expenditures; and any operating requirements for at least the next twelve months.
We have the following material credit facilities, mortgage notes, senior subordinated notes and inventory financing facilities as of
December 31, 2010
. For a more detailed description of the material terms of our various debt agreements, refer to the “Floor Plan Notes Payable” and “Long-Term Debt” footnotes in the accompanying consolidated financial statements.
|
•
|
Revolving credit facility
- $150.0 million revolving credit facility with Bank of America, N.A. as administrative agent, and a syndicate of commercial banks and commercial financing entities (the “BofA Revolving Credit Facility”) for working capital, general corporate purposes and acquisitions that is currently set to expire in August 2012.
|
|
•
|
Used vehicle facility
- $50.0 million used vehicle floor plan facility with JPMorgan Chase Bank, N.A. and Bank of America (the “JPMorgan Used Vehicle Floor Plan Facility”) for working capital, capital expenditures and general corporate purposes that is currently set to expire in August 2012.
|
|
•
|
Mortgage notes
- $
172.8
of mortgage note obligations primarily payable to Wells Fargo Bank, National Association, successor by merger to Wachovia Bank, National Association, and Wachovia Financial Services, Inc., a North Carolina corporation (together referred to as “Wachovia”). These mortgage notes payable are secured by the related underlying property.
|
|
•
|
3% Senior Subordinated Convertible Notes due 2012 (“3% Convertible Notes”)
- $29.5 million in aggregate principal amount of our 3% Convertible Notes outstanding, offset by $1.7 million of an unamortized discount. We are required to pay interest on the 3% Convertible Notes on March 15 and September 15 of each year until their maturity
|
48
on September 15, 2012.
|
•
|
7.625% Senior Subordinated Notes due 2017 (“7.625% Notes”)
- $
143.2
million in aggregate principal amount of our 7.625% Notes outstanding. We are required to pay interest on the 7.625% Notes on March 15 and September 15 of each year until their maturity on March 15, 2017.
|
|
•
|
8.375% Senior Subordinated Notes due 2020 (“8.375% Notes”)
- $
200.0
million in aggregate principal amount of our 8.375% Notes outstanding. We are required to pay interest on the 8.375% Notes on May 15 and November 15 of each year until their maturity on November 15, 2020.
|
|
•
|
Inventory financing (“Floor plan”) facilities
- $359.7 million outstanding with lenders affiliated with the manufacturers from which we purchase new vehicles and $91.9 million outstanding with lenders not affiliated with any such manufacturers, including amounts classified as Liabilities Associated with Assets Held for Sale. The availability under our floor plan facilities is not limited, with the exception of an $18.0 million limitation in aggregate borrowings for the purchase of Chrysler, Dodge and Jeep new vehicle inventory and a $30.0 million limitation in aggregate borrowings for the purchase of Hyundai, Kia, Audi, Porsche, Volkswagen, Land Rover and Jaguar new vehicle inventory. In addition to the facilities described above, we have established accounts with certain manufacturers that allow us to transfer cash to an account as an offset to floor plan notes payable (“floor plan offset accounts”) that reduces our outstanding new vehicle floor plan notes payable while retaining the ability to transfer amounts from the offset accounts into our operating cash accounts within one to two days. As of
December 31, 2010
, we had $59.5 million in these floor plan offset accounts.
|
Under the terms of our credit facilities and certain mortgage notes payable, our ability to incur new indebtedness is currently limited to (i) permitted floorplan indebtedness, (ii) real estate loans in an aggregate amount not to exceed $30.0 million, (iii) certain refinancings, refunds, renewals or extensions of existing indebtedness and (iv) other customary permitted indebtedness.
Long-Term Debt Refinancing and Amendments
In November 2010, we completed a refinancing of the long-term debt, which included the issuance of $200.0 million of our 8.375% Notes, the proceeds of which were primarily used to repurchase all of our outstanding $179.4 million aggregate principal amount 8% Senior Subordinated Notes due 2014 (the "8% Notes").
We recognized an $11.3 million loss in connection with this long-term debt refinancing, which is included in (Loss) Gain on Extinguishment of Long-Term Debt, net on the accompanying Consolidated Statements of Income (Loss), consisting of (i) $5.2 million of premiums paid in conjunction with the early retirement of the 8% Notes, (ii) a $3.6 million write-off of hedging activity associated with the 8% Notes and (iii) a $2.5 million write-off of the remaining unamortized debt issuance costs associated with the 8% Notes. We also incurred approximately $1.0 million of third-party expenses in connection with this long-term debt refinancing, which are included in Other Operating Expense (Income), net on the accompanying Consolidated Statements of Income (Loss).
In addition, we obtained the consent of holders of our 7.625% Senior Subordinated Notes due 2017 (the "7.625% Notes"), to amendments to the indenture governing the 7.625% Notes, primarily to increase our ability to make restricted payments, including the payment of dividends and repurchases of our common stock. In addition, we entered into amendments to our mortgage loan facility, revolving credit facility and our used vehicle facility that were similar to the amendments of our 7.625% Notes ("Loan Amendments"). In addition, the Loan Amendments included modifications to the Permitted Real Estate Debt (as defined in each of those credit facilities) allowance during the Modified Covenant Period (as defined in each of those credit facilities) to increase the limit from $12.0 million to $30.0 million.
49
3% Senior Subordinated Convertible Note Repurchases
During the third quarter of 2010, we paid $24.4 million to repurchase $25.2 million of our 3% Convertible Notes.
Pursuant to one or more authorizations from our board of directors, we may from time to time repurchase various of our subordinated notes in open market purchases or privately negotiated transactions. The decision to repurchase subordinated notes will be dependent upon prevailing market conditions, our liquidity position, and other factors. Currently, our BofA Revolving Credit Facility and our JPMorgan Used Vehicle Floor Plan Facility limit our ability to purchase our debt securities to $30.0 million per calendar year, plus 50% of the net proceeds from any asset sales during any given calendar year. In February 2011, our Board of Directors authorized us to use up to $30.0 million of cash to repurchase 3% Convertible Notes, 7.625% Notes or 8.375% Notes, which authorization expires February 28, 2012. This authority supersedes and replaces our previous authority under which we had repurchased $25.2 million of 3% Convertible Notes.
Covenants
We are subject to a number of covenants in our various debt and lease agreements, including those described below. We were in compliance with all of our covenants throughout
2010
. Failure to comply with any of our debt covenants would constitute a default under the relevant debt agreements, which would entitle the lenders under such agreements to terminate our ability to borrow under the relevant agreements and accelerate our obligations to repay outstanding borrowings, if any, unless compliance with the covenants is waived. In many cases, defaults under one of our agreements could trigger cross default provisions in our other agreements. If we are unable to remain in compliance with our financial or other covenants, we would be required to seek waivers or modifications of our covenants from our lenders, or we would need to raise debt and/or equity financing or sell assets to generate proceeds sufficient to repay such debt. We cannot give any assurance that we would be able to successfully take any of these actions on terms, or at times, that may be necessary or desirable.
Our BofA Revolving Credit Facility, JPMorgan Used Vehicle Floor Plan Facility and certain of our mortgages and/or guarantees related to such mortgages require compliance with certain financial covenants. In July 2009, we amended the BofA Revolving Credit Facility to, among other things, eliminate the total leverage ratio requirement and reduce the required fixed charge coverage ratio from 1.20 to 1.00 to 1.10 to 1.00 for each four fiscal quarter period ending on or before September 30, 2010. Beginning with the four fiscal quarter period ended
December 31, 2010
, our fixed charge coverage ratio requirement returned to 1.20 to 1.00 per the terms of the above-mentioned amendment. At our option and with 30 days' written notice, the $30.0 million indebtedness limitation, as described above, may be removed in conjunction with the reinstatement of the total leverage ratio to the terms as set forth in the BofA Revolving Credit Facility prior to the July 2009 amendment.
Our guarantees under our master loan agreement with Wachovia (the "Wachovia Master Loan Agreement") also require compliance with certain financial covenants. In May 2009, we amended the Wachovia Master Loan Agreement, which among other things, eliminated the requirement that we comply with a total leverage ratio, but imposed significant additional limitations on our ability to incur new indebtedness, primarily due to a limit on new real estate loans in an aggregate amount not to exceed $12.0 million. In November 2010, we amended the Wachovia Master Loan Agreement, which among other things, increased the limit on new real estate loans from $12.0 million to $30.0 million. At our option and with 30 days' written notice, the indebtedness limitation may be removed in conjunction with the reinstatement of the total leverage ratio to the terms as set forth in the Wachovia Master Loan Agreement prior to the May 2009 amendment.
Certain of our lease agreements also require compliance with various financial covenants and incorporate by reference the financial covenants set forth in the BofA Revolving Credit Facility. A breach of any of these covenants could immediately give rise to certain landlord remedies under our various lease agreements, the most severe of which include the following: (a) termination of the applicable lease and/or other leases with the same or an affiliated landlord under a cross-default provision, (b) eviction from the premises; and (c) the landlord would have a claim for any or all of the following: (i) damages suffered by landlord by reason of the default, equal to rent and other amounts payable by tenant under the lease prior to the default plus other fees and costs incurred by landlord; and (ii) additional damages, either payable monthly in an amount equal to the rent due under the lease less the amount of rent, if any, received by the landlord from a substitute tenant, or payable in a lump sum equal to the present value of the sum of the amount by which all remaining sums due under the lease exceeds the fair market rental value of the premises for the same period, plus landlord’s expense and value of all vacancy periods projected by landlord to be incurred in connection with reletting the premises.
50
Acquisitions
During the twelve months ended
December 31, 2010
, we acquired nine franchises (four dealership locations) for an aggregate purchase price of $77.5 million. We financed these acquisitions with (i) $46.6 million of cash, (ii) $13.9 million of floor plan borrowings for the purchase of related new vehicle inventory and (iii) $17.0 million of a seller financed mortgage note payable for the purchase of land and building associated with five of these franchises (three dealership locations).
Share Repurchase
In December 2010, our board of directors authorized the repurchase of up to $25.0 million of our common stock. In December 2010 we repurchased 8,700 shares for a total of $0.1 million.
We repurchased 20,264 shares of our common stock for $0.3 million from employees in connection with a net share settlement feature of employee share-based awards during
2010
.
Contractual Obligations
As of
December 31, 2010
, we had the following contractual obligations (in millions):
|
|
Payments due by period
|
||||||||||||||||||||||||||
|
|
2011
|
2012
|
2013
|
2014
|
2015
|
Thereafter
|
Total
|
||||||||||||||||||||
|
Floor plan notes payable(a)
|
$
|
451.6
|
|
$
|
—
|
|
$
|
—
|
|
$
|
—
|
|
$
|
—
|
|
$
|
—
|
|
$
|
451.6
|
|
||||||
|
Operating leases
|
44.6
|
|
42.3
|
|
39.0
|
|
32.9
|
|
30.4
|
|
140.8
|
|
330.0
|
|
|||||||||||||
|
Long-term debt (b)(c)
|
9.2
|
|
38.4
|
|
110.1
|
|
1.9
|
|
17.9
|
|
373.2
|
|
550.7
|
|
|||||||||||||
|
Interest on long-term debt (d)
|
35.5
|
|
34.9
|
|
32.3
|
|
30.5
|
|
29.8
|
|
103.6
|
|
266.6
|
|
|||||||||||||
|
Deferred compensation obligations
|
—
|
|
—
|
|
—
|
|
—
|
|
—
|
|
8.2
|
|
8.2
|
|
|||||||||||||
|
Employee compensation obligations
|
2.3
|
|
3.7
|
|
1.7
|
|
—
|
|
—
|
|
—
|
|
7.7
|
|
|||||||||||||
|
Total
|
$
|
543.2
|
|
$
|
119.3
|
|
$
|
183.1
|
|
$
|
65.3
|
|
$
|
78.1
|
|
$
|
625.8
|
|
$
|
1,614.8
|
|
||||||
|
(a)
|
Includes $32.5 million classified as liabilities associated with assets held for sale.
|
|
(b)
|
Does not include $1.7 million unamortized discount that reduces the book value of our 3% Convertible Notes.
|
|
(c)
|
Includes maturities of $5.2 million classified as liabilities associated with assets held for sale.
|
|
(d)
|
Includes variable interest calculated using an estimated LIBOR rate of 0.26%.
|
Cash Flows
Classification of Cash Flows Associated with Floor Plan Notes Payable
Borrowings and repayments of floor plan notes payable to a lender unaffiliated with the manufacturer from which we
purchase a particular new vehicle ("Non-Trade"), and all floor plan notes payable relating to pre-owned vehicles (together
referred to as “Floor Plan Notes Payable - Non-Trade”), are classified as financing activities on the accompanying Consolidated Statements of Cash Flows, with borrowings reflected separately from repayments. The net change in floor plan notes payable to a lender affiliated with the manufacturer from which we purchase a particular new vehicle (collectively referred to as “Floor Plan Notes Payable - Trade”) is classified as an operating activity on the accompanying Consolidated Statements of Cash Flows. Borrowings of floor plan notes payable associated with inventory acquired in connection with all acquisitions are classified as a financing activity. Cash flows related to floor plan notes payable included in operating activities differ from cash flows related to floor plan notes payable included in financing activities only to the extent that the former are payable to a lender affiliated with the manufacturer from which we purchased the related inventory, while the latter are payable to a lender not affiliated with the manufacturer from which we purchased the related inventory.
Floor plan borrowings are required by all vehicle manufacturers for the purchase of new vehicles, and all floor plan
lenders require amounts borrowed for the purchase of a vehicle to be repaid within a short time period after the related
vehicle is sold. As a result, we believe that it is important to understand the relationship between the cash flows of all of our
floor plan notes payable and new vehicle inventory in order to understand our working capital and operating cash flow and to
be able to compare our operating cash flow to that of our competitors (i.e., if our competitors have a different mix of trade and
non-trade floor plan financing as compared to us). In addition, we include all floor plan borrowings and repayments in our
internal operating cash flow forecasts. As a result, we use the non-GAAP measure (defined below) “cash provided by operating
activities, as adjusted” to compare our results to forecasts. We believe that splitting the cash flows of floor plan notes payable
51
between operating activities and financing activities, while all new vehicle inventory activity is included in operating activities,
results in significantly different operating cash flow than if all the cash flows of floor plan notes payable were classified
together in operating activities.
Cash provided by operating activities, as adjusted, includes borrowings and repayments of floor plan notes payable to
lenders not affiliated with the manufacturer from which we purchase the related vehicle. Cash provided by operating activities,
as adjusted, has material limitations. Cash provided by operating activities, as adjusted, may not be comparable to similarly
titled measures of other companies and should not be considered in isolation, or as a substitute for analysis of our operating
results in accordance with GAAP. In order to compensate for these potential limitations we also review the related GAAP
measures.
We have provided below a reconciliation of cash flow from operating activities, as if all changes in floor plan notes
payable, except for (i) borrowings associated with acquisitions and repayments associated with divestitures and (ii) borrowings
and repayments associated with the purchase of used vehicle inventory, were classified as an operating activity.
|
|
For the Year Ended
December 31,
|
||||||||||
|
|
2010
|
2009
|
2008
|
||||||||
|
|
(In millions)
|
||||||||||
|
Reconciliation of Cash provided by Operating Activities to Cash provided by Operating Activities, as adjusted
|
|||||||||||
|
Cash provided by operating activities, as reported
|
$
|
9.9
|
|
$
|
110.9
|
|
$
|
529.2
|
|
||
|
New vehicle floor plan borrowings (repayments)—non-trade, net
|
7.3
|
|
(55.8
|
)
|
(354.7
|
)
|
|||||
|
Floor plan notes payable—trade divestitures
|
5.9
|
|
10.2
|
|
5.9
|
|
|||||
|
Cash provided by operating activities, as adjusted
|
$
|
23.1
|
|
$
|
65.3
|
|
$
|
180.4
|
|
||
Operating Activities—
Net cash provided by operating activities totaled
$9.9 million
,
$110.9 million
and
$529.2 million
for the years ended
December 31, 2010
,
2009
and
2008
, respectively. Net cash provided by operating activities, as adjusted, totaled
$23.1 million
,
$65.3 million
and
$180.4 million
for the years ended
December 31, 2010
,
2009
and
2008
, respectively. Cash provided by operating activities, as adjusted, includes net (loss) income, adjustments to reconcile net (loss) income to net cash provided by operating activities and changes in working capital, including changes in floor plan notes payable and inventory.
The
$42.2 million
decrease in our cash provided by operating activities, as adjusted, for the year ended
December 31, 2010
, compared to the year ended
December 31, 2009
, was primarily the result of the following:
|
•
|
$48.6 million related to a net increase in inventory, net of floor plan notes payable as a result of (i) the use of available cash to reduce our floor plan notes payable prior to the sale of the related vehicle through the use of floor plan offset accounts and (ii) an increase in our used inventory in 2010 to meet consumer demand; and
|
|
•
|
$47.6 million related to a net increase in accounts receivable and contracts-in-transit during 2010 as compared to 2009. The increase during 2010 reflected a significant improvement in revenue from all four business lines, particularly in the fourth quarter, due to a favorable comparison with a weaker economic environment in 2009.
|
The decrease in our cash provided by operating activities, as adjusted, was partially offset by the following:
|
•
|
$38.2 million increase in net income adjusted for non-cash items; and
|
|
•
|
a $21.4 million related to the increase in accounts payable and accrued expenses as a result of increased business activities during 2010 as compared to 2009.
|
Investing Activities—
Net cash used in investing activities totaled
$68.9 million
and
$292.4 million
for the years ended
December 31, 2010
and
2008
, respectively. Net cash provided by investing activities totaled
$16.1 million
for the year ended
December 31, 2009
. Cash flows from investing activities relate primarily to capital expenditures, acquisition and divestiture activity and sales of property and equipment.
Capital expenditures were
$30.1 million
,
$8.3 million
and
$69.3 million
for the years ended
December 31, 2010
,
2009
and
2008
, respectively. Our capital investments currently consist primarily of real estate purchases, upgrades to our existing
52
facilities and equipment purchases. We expect that capital expenditures during 2011 will total approximately $35.0 million, excluding the purchase of real estate. As part of our balanced capital allocation strategy, we continuously evaluate opportunities to purchase properties currently under lease. No assurances can be provided that we will have or be able to access capital at times or on terms in amounts deemed necessary to execute this strategy.
Cash paid in connection with dealership acquisitions totaled $60.5 million for nine franchises and
$41.9 million
for one franchise during the years ended December 31, 2010 and
2008
, respectively. We did not complete any acquisitions during 2009. We financed the 2010 acquisitions with (i) $46.6 million of available cash, with the remaining purchase price financed through floor plan borrowings. As part of our growth strategy, we continuously evaluate opportunities for strategic acquisitions that we believe would meet our internal rate of return criteria.
During 2008, we invested $207.9 million for the purchase of previously leased real estate.
Proceeds from the sale of assets totaled
$17.7 million
,
$25.1 million
and
$25.4 million
for the years ended
December 31, 2010
,
2009
and
2008
, respectively. Included in the proceeds from the sale of assets for the years ended
December 31, 2010
,
2009
and
2008
, were $7.0 million, $14.9 million and $10.4 million, respectively, associated with the sale of inventory in connection with the sale of one franchise (one dealership location), four franchises (three dealership locations), and thirteen franchises (seven dealership locations), respectively. We continuously monitor the profitability and market value of our dealerships and, under certain conditions, may strategically divest certain dealerships.
Financing Activities—
Net cash used in financing activities totaled
$4.4 million
, $133.9 million and $198.6 million for the years ended December 31, 2010, 2009 and 2008, respectively.
Proceeds from borrowings totaled
$222.5 million
,
$0.9 million
and
$302.8 million
, for the years ended
December 31, 2010
,
2009
and
2008
, respectively. The proceeds from borrowings during
2010
were primarily the result of the issuance of $200.0 million of the 8.375% Notes. Proceeds from borrowings in 2008 were primarily related to mortgage financings to fund the construction of a dealership facility and the purchases of previously leased real estate.
Repayments of borrowings totaled
$240.1 million
,
$76.3 million
and
$126.1 million
, respectively. The repayments during
2010
were primarily related to the repurchase of $179.4 million of our 8% Notes and $25.2 million of our 3% Convertible Notes. Repayments of borrowings in
2009
and 2008 related to (i) credit facility repayments, (ii) repurchases of a portion of our 3% Convertible Notes and (iii) principal amortization of mortgage notes payable.
During
2010
we paid
$7.6 million
for debt issuance costs associated with the issuance of our 8.375% Notes and certain amendments to our credit facilities and mortgage notes payable.
We borrowed $13.9 million and
$7.6 million
from our Floor Plan Facilities for the purchase of inventory in connection with the acquisition of nine and one franchises during 2010 and
2008
, respectively. We repaid
$2.9 million
and
$2.8 million
of non-trade floor plan notes payable associated with sale of three and six dealerships during
2009
and
2008
, respectively.
During
2010
and 2009, we paid no dividends. During
2008
we paid
$21.5 million
of dividends.
Pending Divestitures
In December 2010, we executed agreements to sell (i) our heavy truck business in Atlanta, Georgia, (ii) one luxury franchise and (iii) our remaining consumer loan portfolio. We expect to close on these divestitures in the first quarter of 2011. As of
December 31, 2010
, a total of eleven franchises (four dealership locations) were pending disposition, including ten franchises (three dealership locations) associated with our heavy truck business. Assets associated with pending dispositions totaled $53.0 million as of
December 31, 2010
. Liabilities associated with pending dispositions totaled $37.7 million as of
December 31, 2010
.
Assets held for sale also includes real estate not currently used in our operations that we currently intend to sell totaling $12.7 million as of
December 31, 2010
.
53
Stock Repurchase and Dividend Restrictions
Pursuant to the indentures governing our 8.375% Notes and our 7.625% Notes, and the agreements governing our BofA Revolving Credit Facility and our JPMorgan Used Vehicle Floor Plan Facility, our ability to repurchase shares of our common stock and pay cash dividends is limited. In accordance with such calculations, our ability to repurchase common stock or pay dividends was limited to $56.5 million under these agreements as of
December 31, 2010
.
Off Balance Sheet Arrangements
We had no off balance sheet arrangements during the years presented other than those disclosed in Notes 21 and 22 of our accompanying consolidated financial statements.
APPLICATION OF CRITICAL ACCOUNTING ESTIMATES
Preparation of financial statements in conformity with accounting principles generally accepted in the United States of America requires management to make estimates and assumptions that affect amounts of assets and liabilities and disclosures of contingent assets and liabilities as of the date of the financial statements and reported amounts of revenues and expenses during the periods presented. Actual amounts could differ from those estimates. On an ongoing basis, management evaluates its estimates and assumptions and the effects of any such revisions are reflected in the financial statements in the period in which they are determined to be necessary. The accounting estimates described below are those that require management judgments, and therefore are critical to understanding our results of operations. Senior management has discussed the development and selection of these accounting estimates and the related disclosures with the audit committee of our board of directors.
Deferred Income Taxes—
Estimates and judgments are used in the calculation of certain tax liabilities and in the determination of the recoverability of certain deferred tax assets. In assessing the realizability of deferred tax assets, we consider whether it is more likely than not that some portion or all of the deferred tax assets will not be realized. We regularly evaluate the recoverability of our deferred tax assets and,
if necessary, provide valuation allowances to offset portions of deferred tax assets due to uncertainty surrounding the future realization of such deferred tax assets. Valuation allowances are based on historical taxable income, projected future taxable income, the expected timing of the reversals of existing temporary differences, and the implementation of tax-planning strategies. We would establish a valuation allowance in the period we determine it is more likely than not that deferred tax assets will or will not be realized. If a change in circumstances results in a change in our ability to realize our deferred tax assets, our tax provision would be adjusted in the period when the change in circumstances occurs.
F&I Chargeback Reserve—
We receive commissions from the sale of vehicle service contracts, credit life insurance and disability insurance to customers. In addition, we receive commissions from financing institutions for arranging customer financing. We may be charged back (“chargebacks”) for finance, insurance or vehicle service contract commissions in the event a customer prepays or defaults on a retail sales contract or cancels an insurance or warranty contract. The revenues from financing fees and commissions are recorded at the time the vehicles are sold and a reserve for future chargebacks is established based on historical operating results and the termination provisions of the applicable contracts. This data is evaluated on a product-by-product basis. Our loss histories vary depending on the product but generally total between 10% and 14% of F&I revenues. Our F&I chargebacks from continuing operations for the twelve months ended
December 31, 2010
,
2009
and
2008
were $14.0 million, $12.2 million, and $17.5 million, respectively. Our chargeback reserves were $12.5 million and $13.2 million as of
December 31, 2010
and
December 31, 2009
, respectively. Total chargebacks as a percentage of F&I revenue for the twelve months ended
December 31, 2010
and
2009
, were 12% and 14% respectively. A 1% change in our estimate for all our products would have changed our finance and insurance, net by approximately $1.3 million.
Used Vehicle Inventory Lower of Cost or Market Reserves—
Our used vehicle inventory is stated at the lower of cost or market. We use the specific identification method to value our vehicle inventories. We maintain a reserve for specific inventory units where cost basis exceeds fair value. In assessing lower of cost or market for used vehicles, we consider (i) the aging of used vehicles, (ii) loss histories of used vehicles and (iii) current market conditions.
Our used vehicle loss histories have indicated that our losses range between 3% and 6% of our used vehicle inventory. Our used vehicle losses for the twelve months ended
December 31, 2010
,
2009
and
2008
were $10.4 million, $9.7 million and
54
$16.0 million, respectively. As of
December 31, 2010
, our used vehicle loss reserve was $2.9 million, or 3.7% of used vehicle inventory. As of
December 31, 2009
, our used vehicle loss reserve was $2.3 million, or 3.6% of used vehicle inventory. As of
December 31, 2010
, each 1% change in our estimate would change our used vehicle reserve approximately $0.8 million.
Insurance Reserves—
We are self insured for certain employee medical claims and maintain stop loss insurance for individual claims. We have large deductible insurance programs in place for workers compensation, property and general liability claims. We maintain and review at least monthly our claim and loss history to assist in assessing our future liability for these claims. We also use professional service providers, such as account administrators and actuaries, to help us accumulate and assess this information. As of
December 31, 2010
and
December 31, 2009
, we had $14.0 million and $12.7 million, respectively, of insurance reserves for both known and unknown employee medical, workers compensation, property and general liability claims. Expenses associated with employee medical, workers compensation, property and general liability claims from continuing operations, including premiums for insurance coverage, for the twelve months ended
December 31, 2010
,
2009
and
2008
, totaled $21.2 million, $23.9 million and $22.6 million, respectively.
55
Interest Rate Risk
We are exposed to market risk from changes in interest rates on a significant portion of our outstanding indebtedness. Based on $477.0 million of total variable rate debt (including floor plan notes payable) outstanding as of
December 31, 2010
, a 1% change in interest rates would result in a change of as much as $4.8 million to our annual other interest expense.
We received $18.7 million of interest credit assistance from certain automobile manufacturers during the year ended
December 31, 2010
. Interest credit assistance reduced cost of sales (including amounts classified as discontinued operations) for the year ended
December 31, 2010
by $18.3 million and reduced new vehicle inventory by $4.1 million and $3.7 million as of
December 31, 2010
and
December 31, 2009
, respectively. Although we can provide no assurance as to the amount of future floor plan interest credit assistance, it is our expectation, based on historical data that an increase in prevailing interest rates would result in increased interest credit assistance from certain automobile manufacturers.
Hedging Risk—
In December 2010, we entered into an interest rate swap agreement with a notional principal amount of $
10.8
million. This swap was designed to provide a hedge against changes in variable rate cash flows through maturity in June 2011. The notional value of this swap is reduced over its term until July 2011 when the notional principal amount increases to $21.5 million and then begins to reduce over the remaining term to $16.1 million at maturity. This interest rate swap qualifies for cash flow hedge accounting treatment and will not contain any ineffectiveness.
We also have an interest rate swap with a current notional principal amount of
$125.0 million
. The swap was designed to provide a hedge against changes in variable rate cash flows through maturity in June 2013. This swap is collateralized by Company assets upon which we have not otherwise granted a first priority lien. This interest rate swap qualifies for cash flow hedge accounting treatment and will contain minor ineffectiveness.
We have a separate interest rate swap with a current notional principal amount of
$11.6
million. The swap was designed to provide a hedge against changes in variable rate cash flows through maturity in June 2011. The notional value of this swap is reduced over its term to $11.3 million at maturity. This interest rate swap qualifies for cash flow hedge accounting treatment and will contain minor ineffectiveness.
For additional information about the effect of our derivative instruments on the accompanying consolidated financial statements, see Note 16 “Financial Instruments” of the notes thereto.
In connection with the sale of our 3% Convertible Notes, we entered into convertible note hedge transactions with respect to our common stock with Goldman, Sachs & Co. and Deutsche Bank AG, London Branch (collectively, the “Counterparties”). The convertible note hedge transactions require the Counterparties to deliver to us, subject to customary anti-dilution adjustments, all shares issuable upon conversion of the 3% Convertible Notes. The effect of the convertible note hedge transactions is to unwind the conversion feature of the 3% Convertible Notes. Under the terms of the convertible note hedge transactions we will receive shares from the Counterparties in the event of a conversion of our 3% Convertible Notes. In connection with the repurchase of 3% Convertible Notes, a portion of the convertible note hedges was terminated.
We also entered into separate warrant transactions whereby we sold to the Counterparties warrants to acquire, subject to customary anti-dilution adjustments, shares of our common stock at an initial strike price of $45.09 per share, which was a 62.50% premium over the market price of our common stock at the time of pricing. As of
December 31, 2010
, the strike price was $44.74 as a result of certain dividend payments. Under the terms of the warrant transactions we are required to issue shares of our common stock to the Counterparties in the event of a conversion of our 3% Convertible Notes at a strike price above $33.73.
56
INDEX TO CONSOLIDATED FINANCIAL STATEMENTS
|
|
Page
|
57
REPORT OF INDEPENDENT REGISTERED PUBLIC ACCOUNTING FIRM
ON THE CONSOLIDATED FINANCIAL STATEMENTS
The Board of Directors and Shareholders of
Asbury Automotive Group, Inc.
We have audited the accompanying consolidated balance sheets of Asbury Automotive Group, Inc. as of December 31, 2010 and 2009, and the related consolidated statements of income (loss), shareholders' equity, and cash flows for the years then ended. These financial statements are the responsibility of the Company's management. Our responsibility is to express an opinion on these financial statements based on our audit.
We conducted our audits in accordance with the standards of the Public Company Accounting Oversight Board (United States). Those standards require that we plan and perform the audit to obtain reasonable assurance about whether the financial statements are free of material misstatement. An audit includes examining, on a test basis, evidence supporting the amounts and disclosures in the financial statements. An audit also includes assessing the accounting principles used and significant estimates made by management, as well as evaluating the overall financial statement presentation. We believe that our audits provide a reasonable basis for our opinion.
In our opinion, the financial statements referred to above present fairly, in all material respects, the consolidated financial position of Asbury Automotive Group, Inc. at December 31, 2010 and 2009, and the consolidated results of its operations and its cash flows for the years then ended in conformity with U.S. generally accepted accounting principles.
We also have audited, in accordance with the standards of the Public Company Accounting Oversight Board (United States), Asbury Automotive Group, Inc.'s internal control over financial reporting as of December 31, 2010, based on criteria established in Internal Control-Integrated Framework issued by the Committee of Sponsoring Organizations of the Treadway Commission and our report dated February 25, 2011 expressed an unqualified opinion thereon.
/s/ Ernst &Young LLP
Atlanta, Georgia
February 25, 2011
58
REPORT OF INDEPENDENT REGISTERED PUBLIC ACCOUNTING FIRM
ON INTERNAL CONTROL OVER FINANCIAL REPORTING
The Board of Directors and Shareholders of
Asbury Automotive Group, Inc.
We have audited Asbury Automotive Group, Inc.'s internal control over financial reporting as of December 31, 2010, based on criteria established in Internal Control-Integrated Framework issued by the Committee of Sponsoring Organizations of the Treadway Commission (the COSO criteria). Asbury Automotive Group, Inc.'s management is responsible for maintaining effective internal control over financial reporting, and for its assessment of the effectiveness of internal control over financial reporting included in the accompanying Management's Report on Internal Control Over Financial Reporting. Our responsibility is to express an opinion on the company's internal control over financial reporting based on our audit.
We conducted our audit in accordance with the standards of the Public Company Accounting Oversight Board (United States). Those standards require that we plan and perform the audit to obtain reasonable assurance about whether effective internal control over financial reporting was maintained in all material respects. Our audit included obtaining an understanding of internal control over financial reporting, assessing the risk that a material weakness exists, testing and evaluating the design and operating effectiveness of internal control based on the assessed risk, and performing such other procedures as we considered necessary in the circumstances. We believe that our audit provides a reasonable basis for our opinion.
A company's internal control over financial reporting is a process designed to provide reasonable assurance regarding the reliability of financial reporting and the preparation of financial statements for external purposes in accordance with generally accepted accounting principles. A company's internal control over financial reporting includes those policies and procedures that (1) pertain to the maintenance of records that, in reasonable detail, accurately and fairly reflect the transactions and dispositions of the assets of the company; (2) provide reasonable assurance that transactions are recorded as necessary to permit preparation of financial statements in accordance with generally accepted accounting principles, and that receipts and expenditures of the company are being made only in accordance with authorizations of management and directors of the company; and (3) provide reasonable assurance regarding prevention or timely detection of unauthorized acquisition, use, or disposition of the company's assets that could have a material effect on the financial statements.
As indicated in the accompanying Management's Report on Internal Control over Financial Reporting, management's assessment of and conclusion on the effectiveness of internal control over financial reporting did not include the internal controls of nine franchises acquired during December 2010, which are included in the 2010 consolidated financial statements of Asbury Automotive Group, Inc. and constituted approximately $79.8 million of total assets as of December 31, 2010 and approximately $13.5 million of revenues for the year then ended. Our audit of internal control over financial reporting of Asbury Automotive Group, Inc. also did not include an evaluation of the internal control over financial reporting of the nine franchises.
Because of its inherent limitations, internal control over financial reporting may not prevent or detect misstatements. Also, projections of any evaluation of effectiveness to future periods are subject to the risk that controls may become inadequate because of changes in conditions, or that the degree of compliance with the policies or procedures may deteriorate.
In our opinion, Asbury Automotive Group, Inc. maintained, in all material respects, effective internal control over financial reporting as of December 31, 2010, based on the COSO criteria
.
We also have audited, in accordance with the standards of the Public Company Accounting Oversight Board (United States), the consolidated balance sheets of Asbury Automotive Group, Inc. as of December 31, 2010 and 2009, and the related consolidated statements of income (loss), shareholders' equity, and cash flows for the years then ended, and our report dated February 25, 2011 expressed an unqualified opinion thereon.
/s/ Ernst &Young LLP
Atlanta, Georgia
February 25, 2011
59
REPORT OF INDEPENDENT REGISTERED PUBLIC ACCOUNTING FIRM
To the Board of Directors and Shareholders of
Asbury Automotive Group, Inc.
Duluth, GA
We have audited the accompanying consolidated statements of income (loss), shareholders' equity, and cash flows of Asbury Automotive Group, Inc. and subsidiaries for the year ended December 31, 2008. These financial statements are the responsibility of the Company's management. Our responsibility is to express an opinion on these financial statements based on our audit.
We conducted our audit in accordance with the standards of the Public Company Accounting Oversight Board (United States). Those standards require that we plan and perform the audit to obtain reasonable assurance about whether the financial statements are free of material misstatement. An audit includes examining, on a test basis, evidence supporting the amounts and disclosures in the financial statements. An audit also includes assessing the accounting principles used and significant estimates made by management, as well as evaluating the overall financial statement presentation. We believe that our audit provides a reasonable basis for our opinion.
In our opinion, the consolidated financial statements referred to above present fairly, in all material respects, the results of operations and cash flows of Asbury Automotive Group, Inc and subsidiaries for the year ended December 31, 2008, in conformity with accounting principles generally accepted in the United States of America.
The accompanying consolidated 2008 financial statements have been prepared assuming that the Company will continue as a going concern. As discussed in Note 1 to the consolidated financial statements, there is uncertainty that the Company will remain in compliance with certain debt covenants throughout 2009. This condition raises substantial doubt about its ability to continue as a going concern. Management's plans concerning these matters are also discussed in Note 1 to the consolidated financial statements. The consolidated financial statements do not include any adjustments that might result from the outcome of this uncertainty.
As discussed in Note 17 to the consolidated financial statements, effective January 1, 2007, the Company adopted accounting principles relating to the accounting for uncertainty in income taxes.
As discussed in Note 2 to the consolidated financial statements, the accompanying 2008 financial statements have been retrospectively adjusted for the change in method of accounting for debt with conversion and other options. Also, as discussed in Note 2 to the consolidated financial statements, the accompanying 2008 financial statements have been retrospectively adjusted for discontinued operations.
/s/ DELOITTE & TOUCHE LLP
New York, New York
March 16, 2009
(March 1, 2010 as to the 2008 retrospective adjustments relating to the accounting for debt with conversion and other options and February 25, 2011 as to the 2008 retrospective adjustments relating to discontinued operations discussed in Note 2)
60
ASBURY AUTOMOTIVE GROUP, INC.
CONSOLIDATED BALANCE SHEETS
(In millions, except par value and share data)
|
|
December 31,
|
||||||
|
|
2010
|
2009
|
|||||
|
ASSETS
|
|||||||
|
CURRENT ASSETS:
|
|||||||
|
Cash and cash equivalents
|
$
|
21.3
|
|
$
|
84.7
|
|
|
|
Contracts-in-transit
|
80.6
|
|
61.8
|
|
|||
|
Accounts receivable (net of allowance of $0.7 and $0.8, respectively)
|
102.6
|
|
79.0
|
|
|||
|
Inventories
|
542.9
|
|
501.1
|
|
|||
|
Deferred income taxes
|
7.6
|
|
8.6
|
|
|||
|
Assets held for sale
|
65.7
|
|
25.5
|
|
|||
|
Other current assets
|
56.6
|
|
51.5
|
|
|||
|
Total current assets
|
877.3
|
|
812.2
|
|
|||
|
PROPERTY AND EQUIPMENT, net
|
458.4
|
|
452.5
|
|
|||
|
GOODWILL
|
18.9
|
|
—
|
|
|||
|
DEFERRED INCOME TAXES, net of current portion
|
61.5
|
|
84.4
|
|
|||
|
OTHER LONG-TERM ASSETS
|
70.2
|
|
51.8
|
|
|||
|
Total assets
|
$
|
1,486.3
|
|
$
|
1,400.9
|
|
|
|
LIABILITIES AND SHAREHOLDERS’ EQUITY
|
|||||||
|
CURRENT LIABILITIES:
|
|||||||
|
Floor plan notes payable—trade
|
$
|
339.1
|
|
$
|
359.1
|
|
|
|
Floor plan notes payable—non-trade
|
80.0
|
|
77.0
|
|
|||
|
Current maturities of long-term debt
|
8.9
|
|
9.0
|
|
|||
|
Accounts payable and accrued liabilities
|
170.1
|
|
148.2
|
|
|||
|
Liabilities associated with assets held for sale
|
37.7
|
|
5.5
|
|
|||
|
Total current liabilities
|
635.8
|
|
598.8
|
|
|||
|
LONG-TERM DEBT
|
534.9
|
|
528.8
|
|
|||
|
OTHER LONG-TERM LIABILITIES
|
28.5
|
|
29.7
|
|
|||
|
COMMITMENTS AND CONTINGENCIES (Notes 21 and 22)
|
|||||||
|
SHAREHOLDERS’ EQUITY:
|
|||||||
|
Preferred stock, $.01 par value, 10,000,000 shares authorized; none issued or outstanding
|
—
|
|
—
|
|
|||
|
Common stock, $.01 par value, 90,000,000 shares authorized; 37,597,481 and 37,200,557 shares issued, including shares held in treasury, respectively
|
0.4
|
|
0.4
|
|
|||
|
Additional paid-in capital
|
463.4
|
|
457.3
|
|
|||
|
Accumulated deficit
|
(95.7
|
)
|
(133.8
|
)
|
|||
|
Treasury stock, at cost; 4,799,188 and 4,770,224 shares respectively
|
(75.0
|
)
|
(74.6
|
)
|
|||
|
Accumulated other comprehensive loss
|
(6.0
|
)
|
(5.7
|
)
|
|||
|
Total shareholders’ equity
|
287.1
|
|
243.6
|
|
|||
|
Total liabilities and shareholders’ equity
|
$
|
1,486.3
|
|
$
|
1,400.9
|
|
|
See accompanying Notes to Consolidated Financial Statements
61
ASBURY AUTOMOTIVE GROUP, INC.
CONSOLIDATED STATEMENTS OF INCOME (LOSS)
(In millions, except per share data)
|
|
For the Years Ended December 31,
|
||||||||||
|
|
2010
|
2009
|
2008
|
||||||||
|
REVENUES:
|
|||||||||||
|
New vehicle
|
$
|
2,179.6
|
|
$
|
1,859.6
|
|
$
|
2,371.8
|
|
||
|
Used vehicle
|
1,084.6
|
|
902.4
|
|
1,012.3
|
|
|||||
|
Parts and service
|
555.4
|
|
553.2
|
|
581.8
|
|
|||||
|
Finance and insurance, net
|
116.4
|
|
90.9
|
|
127.5
|
|
|||||
|
Total revenues
|
3,936.0
|
|
3,406.1
|
|
4,093.4
|
|
|||||
|
COST OF SALES:
|
|||||||||||
|
New vehicle
|
2,035.9
|
|
1,728.3
|
|
2,207.1
|
|
|||||
|
Used vehicle
|
993.1
|
|
823.0
|
|
925.6
|
|
|||||
|
Parts and service
|
258.3
|
|
272.2
|
|
283.4
|
|
|||||
|
Total cost of sales
|
3,287.3
|
|
2,823.5
|
|
3,416.1
|
|
|||||
|
GROSS PROFIT
|
648.7
|
|
582.6
|
|
677.3
|
|
|||||
|
OPERATING EXPENSES:
|
|||||||||||
|
Selling, general and administrative
|
499.5
|
|
465.5
|
|
547.8
|
|
|||||
|
Depreciation and amortization
|
21.1
|
|
22.2
|
|
21.1
|
|
|||||
|
Impairment expenses
|
—
|
|
—
|
|
528.7
|
|
|||||
|
Other operating expense (income), net
|
1.4
|
|
(0.8
|
)
|
1.3
|
|
|||||
|
Income (loss) from operations
|
126.7
|
|
95.7
|
|
(421.6
|
)
|
|||||
|
OTHER (EXPENSE) INCOME:
|
|||||||||||
|
Floor plan interest expense
|
(9.4
|
)
|
(10.9
|
)
|
(22.2
|
)
|
|||||
|
Other interest expense, net
|
(36.2
|
)
|
(36.2
|
)
|
(37.1
|
)
|
|||||
|
Swap interest expense
|
(6.6
|
)
|
(6.6
|
)
|
(5.5
|
)
|
|||||
|
Convertible debt discount amortization
|
(1.4
|
)
|
(1.8
|
)
|
(3.0
|
)
|
|||||
|
(Loss) gain on extinguishment of long-term debt, net
|
(12.6
|
)
|
0.1
|
|
26.2
|
|
|||||
|
Total other expense, net
|
(66.2
|
)
|
(55.4
|
)
|
(41.6
|
)
|
|||||
|
Income (loss) before income taxes
|
60.5
|
|
40.3
|
|
(463.2
|
)
|
|||||
|
INCOME TAX EXPENSE (BENEFIT)
|
23.2
|
|
15.1
|
|
(136.2
|
)
|
|||||
|
INCOME (LOSS) FROM CONTINUING OPERATIONS
|
37.3
|
|
25.2
|
|
(327.0
|
)
|
|||||
|
DISCONTINUED OPERATIONS, net of tax
|
0.8
|
|
(11.8
|
)
|
(16.7
|
)
|
|||||
|
NET INCOME (LOSS)
|
$
|
38.1
|
|
$
|
13.4
|
|
$
|
(343.7
|
)
|
||
|
EARNINGS (LOSS) PER COMMON SHARE:
|
|||||||||||
|
Basic—
|
|||||||||||
|
Continuing operations
|
$
|
1.16
|
|
$
|
0.79
|
|
$
|
(10.32
|
)
|
||
|
Discontinued operations
|
0.02
|
|
(0.37
|
)
|
(0.52
|
)
|
|||||
|
Net income (loss)
|
$
|
1.18
|
|
$
|
0.42
|
|
$
|
(10.84
|
)
|
||
|
Diluted—
|
|||||||||||
|
Continuing operations
|
$
|
1.12
|
|
$
|
0.77
|
|
$
|
(10.32
|
)
|
||
|
Discontinued operations
|
0.02
|
|
(0.36
|
)
|
(0.52
|
)
|
|||||
|
Net income (loss)
|
$
|
1.14
|
|
$
|
0.41
|
|
$
|
(10.84
|
)
|
||
|
WEIGHTED AVERAGE COMMON SHARES OUTSTANDING:
|
|||||||||||
|
Basic
|
32.2
|
|
32.0
|
|
31.7
|
|
|||||
|
Stock options
|
0.5
|
|
0.5
|
|
*
|
|
|||||
|
Restricted stock
|
0.3
|
|
0.3
|
|
*
|
|
|||||
|
Performance share units
|
0.2
|
|
0.1
|
|
*
|
|
|||||
|
Restricted share units
|
0.1
|
|
—
|
|
*
|
|
|||||
|
Diluted
|
33.3
|
|
32.9
|
|
31.7
|
|
|||||
_______________
* Common stock equivalents were not included in the calculation of diluted net loss per common share as the effect would have been anti-dilutive.
See accompanying Notes to Consolidated Financial Statements
62
ASBURY AUTOMOTIVE GROUP, INC.
CONSOLIDATED STATEMENTS OF SHAREHOLDERS’ EQUITY
(Dollars in millions)
See accompanying Notes to Consolidated Financial Statements
|
|
Common Stock
|
Additional
Paid-in
Capital
|
(Accumulated
Deficit)
Retained
Earnings
|
Treasury Stock
|
Accumulated
Other
Comprehensive
Loss
|
Total
|
|||||||||||||||||||||||
|
|
Shares
|
Amount
|
|
|
Shares
|
Amount
|
|
|
|||||||||||||||||||||
|
Balances, December 31, 2007
|
36,258,961
|
|
$
|
0.3
|
|
$
|
451.5
|
|
$
|
217.9
|
|
4,677,261
|
|
$
|
(73.3
|
)
|
$
|
(2.6
|
)
|
$
|
593.8
|
|
|||||||
|
Comprehensive Income (Loss):
|
|||||||||||||||||||||||||||||
|
Net loss
|
—
|
|
—
|
|
—
|
|
(343.7
|
)
|
—
|
|
—
|
|
—
|
|
(343.7
|
)
|
|||||||||||||
|
Change in fair value of cash flow swaps, net of reclassification adjustment and $2.3 million tax benefit
|
—
|
|
—
|
|
—
|
|
—
|
|
—
|
|
—
|
|
(3.4
|
)
|
(3.4
|
)
|
|||||||||||||
|
Amortization of terminated cash flow swaps, net of $(0.3) million tax expense
|
—
|
|
—
|
|
—
|
|
—
|
|
—
|
|
—
|
|
0.4
|
|
0.4
|
|
|||||||||||||
|
Comprehensive loss
|
—
|
|
—
|
|
—
|
|
(343.7
|
)
|
—
|
|
—
|
|
(3.0
|
)
|
(346.7
|
)
|
|||||||||||||
|
Dividends
|
—
|
|
—
|
|
—
|
|
(21.4
|
)
|
—
|
|
—
|
|
—
|
|
(21.4
|
)
|
|||||||||||||
|
Share-based compensation
|
—
|
|
—
|
|
1.9
|
|
—
|
|
—
|
|
—
|
|
—
|
|
1.9
|
|
|||||||||||||
|
Issuance of common stock in connection with share-based payment arrangements, including $(0.1) million tax deficit
|
452,924
|
|
0.1
|
|
0.1
|
|
—
|
|
—
|
|
—
|
|
—
|
|
0.2
|
|
|||||||||||||
|
Repurchases of common stock associated with net share settlement of employee share-based awards
|
—
|
|
—
|
|
—
|
|
—
|
|
82,957
|
|
(1.2
|
)
|
—
|
|
(1.2
|
)
|
|||||||||||||
|
Balances, December 31, 2008
|
36,711,885
|
|
$
|
0.4
|
|
$
|
453.5
|
|
$
|
(147.2
|
)
|
4,760,218
|
|
$
|
(74.5
|
)
|
$
|
(5.6
|
)
|
$
|
226.6
|
|
|||||||
|
Comprehensive Income (Loss):
|
|||||||||||||||||||||||||||||
|
Net loss
|
—
|
|
—
|
|
—
|
|
13.4
|
|
—
|
|
—
|
|
—
|
|
13.4
|
|
|||||||||||||
|
Change in fair value of cash flow swaps, net of reclassification adjustment and $0.3 million tax benefit
|
—
|
|
—
|
|
—
|
|
—
|
|
—
|
|
—
|
|
(0.5
|
)
|
(0.5
|
)
|
|||||||||||||
|
Amortization of terminated cash flow swaps, net of $(0.2) million tax expense
|
—
|
|
—
|
|
—
|
|
—
|
|
—
|
|
—
|
|
0.4
|
|
0.4
|
|
|||||||||||||
|
Comprehensive income
|
—
|
|
—
|
|
—
|
|
13.4
|
|
—
|
|
—
|
|
(0.1
|
)
|
13.3
|
|
|||||||||||||
|
Share-based compensation
|
—
|
|
—
|
|
2.8
|
|
—
|
|
—
|
|
—
|
|
—
|
|
2.8
|
|
|||||||||||||
|
Issuance of common stock in connection with share-based payment arrangements, including $(0.4) million tax deficit
|
488,672
|
|
—
|
|
1.0
|
|
—
|
|
10,006
|
|
(0.1
|
)
|
—
|
|
0.9
|
|
|||||||||||||
|
Balances, December 31, 2009
|
37,200,557
|
|
$
|
0.4
|
|
$
|
457.3
|
|
$
|
(133.8
|
)
|
4,770,224
|
|
$
|
(74.6
|
)
|
$
|
(5.7
|
)
|
$
|
243.6
|
|
|||||||
|
Comprehensive Income (Loss):
|
|||||||||||||||||||||||||||||
|
Net income
|
—
|
|
—
|
|
—
|
|
38.1
|
|
—
|
|
—
|
|
—
|
|
38.1
|
|
|||||||||||||
|
Change in fair value of cash flow swaps, net of reclassification adjustment and $0.4 million tax benefit
|
—
|
|
—
|
|
—
|
|
—
|
|
—
|
|
—
|
|
(0.6
|
)
|
(0.6
|
)
|
|||||||||||||
|
Amortization of terminated cash flow swaps, net of $(0.2) million tax expense
|
—
|
|
—
|
|
—
|
|
—
|
|
—
|
|
—
|
|
0.3
|
|
0.3
|
|
|||||||||||||
|
Comprehensive income
|
—
|
|
—
|
|
—
|
|
38.1
|
|
—
|
|
—
|
|
(0.3
|
)
|
37.8
|
|
|||||||||||||
|
Share-based compensation
|
—
|
|
—
|
|
5.1
|
|
—
|
|
—
|
|
—
|
|
—
|
|
5.1
|
|
|||||||||||||
|
Issuance of common stock in connection with share-based payment arrangements, including $0.4 million excess tax benefit
|
396,924
|
|
—
|
|
1.0
|
|
—
|
|
—
|
|
—
|
|
—
|
|
1.0
|
|
|||||||||||||
|
Repurchase of common stock associated with net shares settlement of employee share-based awards
|
—
|
|
—
|
|
—
|
|
—
|
|
20,264
|
|
(0.3
|
)
|
—
|
|
(0.3
|
)
|
|||||||||||||
|
Purchase of treasury shares
|
—
|
|
—
|
|
—
|
|
—
|
|
8,700
|
|
(0.1
|
)
|
—
|
|
(0.1
|
)
|
|||||||||||||
|
Balances, December 31, 2010
|
37,597,481
|
|
$
|
0.4
|
|
$
|
463.4
|
|
$
|
(95.7
|
)
|
4,799,188
|
|
$
|
(75.0
|
)
|
$
|
(6.0
|
)
|
$
|
287.1
|
|
|||||||
63
ASBURY AUTOMOTIVE GROUP, INC.
(In millions
)
|
|
For the Years Ended December 31,
|
||||||||||
|
|
2010
|
2009
|
2008
|
||||||||
|
CASH FLOW FROM OPERATING ACTIVITIES:
|
|||||||||||
|
Net income (loss)
|
$
|
38.1
|
|
$
|
13.4
|
|
$
|
(343.7
|
)
|
||
|
Adjustments to reconcile net income (loss) to net cash provided by operating activities—
|
|||||||||||
|
Depreciation and amortization
|
21.1
|
|
22.2
|
|
21.1
|
|
|||||
|
Stock-based compensation
|
5.1
|
|
2.8
|
|
1.9
|
|
|||||
|
Deferred income taxes
|
24.5
|
|
18.2
|
|
(159.4
|
)
|
|||||
|
Loss (gain) on extinguishment of long-term debt
|
12.6
|
|
(0.1
|
)
|
(26.2
|
)
|
|||||
|
Loaner vehicle amortization
|
8.1
|
|
7.4
|
|
8.5
|
|
|||||
|
Excess tax benefit on share-based arrangements
|
(0.4
|
)
|
—
|
|
—
|
|
|||||
|
Impairment expenses
|
5.1
|
|
5.5
|
|
550.9
|
|
|||||
|
Other adjustments, net
|
3.8
|
|
10.4
|
|
13.4
|
|
|||||
|
Changes in operating assets and liabilities, net of acquisitions and divestitures—
|
|
|
|
||||||||
|
Contracts-in-transit
|
(18.8
|
)
|
2.0
|
|
52.3
|
|
|||||
|
Accounts receivable
|
(46.3
|
)
|
(18.6
|
)
|
30.7
|
|
|||||
|
Proceeds from the sale of accounts receivable
|
22.8
|
|
21.9
|
|
20.5
|
|
|||||
|
Inventories
|
(24.7
|
)
|
206.8
|
|
137.4
|
|
|||||
|
Other current assets
|
(50.1
|
)
|
(44.3
|
)
|
(43.6
|
)
|
|||||
|
Floor plan notes payable—trade
|
(4.2
|
)
|
(124.0
|
)
|
305.3
|
|
|||||
|
Floor plan notes payable—trade divestitures
|
(5.9
|
)
|
(10.2
|
)
|
(5.9
|
)
|
|||||
|
Accounts payable and accrued liabilities
|
16.8
|
|
(4.6
|
)
|
(35.2
|
)
|
|||||
|
Other long-term assets and liabilities, net
|
2.3
|
|
2.1
|
|
1.2
|
|
|||||
|
Net cash provided by operating activities
|
9.9
|
|
110.9
|
|
529.2
|
|
|||||
|
CASH FLOW FROM INVESTING ACTIVITIES:
|
|||||||||||
|
Capital expenditures
|
(30.1
|
)
|
(8.3
|
)
|
(69.3
|
)
|
|||||
|
Acquisitions
|
(60.5
|
)
|
—
|
|
(41.9
|
)
|
|||||
|
Purchase of previously leased real estate
|
—
|
|
—
|
|
(207.9
|
)
|
|||||
|
Proceeds from the sale of assets
|
17.7
|
|
25.1
|
|
25.4
|
|
|||||
|
Other investing activities
|
4.0
|
|
(0.7
|
)
|
1.3
|
|
|||||
|
Net cash (used in) provided by investing activities
|
(68.9
|
)
|
16.1
|
|
(292.4
|
)
|
|||||
|
CASH FLOW FROM FINANCING ACTIVITIES:
|
|||||||||||
|
Floor plan borrowings—non-trade
|
410.7
|
|
329.6
|
|
2,028.8
|
|
|||||
|
Floor plan borrowings—acquisitions
|
13.9
|
|
—
|
|
7.6
|
|
|||||
|
Floor plan repayments—non-trade
|
(404.4
|
)
|
(384.3
|
)
|
(2,383.5
|
)
|
|||||
|
Floor plan repayments—non-trade divestitures
|
—
|
|
(2.9
|
)
|
(2.8
|
)
|
|||||
|
Payments of dividends
|
—
|
|
—
|
|
(21.5
|
)
|
|||||
|
Proceeds from borrowings
|
222.5
|
|
0.9
|
|
302.8
|
|
|||||
|
Repayments of borrowings
|
(240.1
|
)
|
(76.3
|
)
|
(126.1
|
)
|
|||||
|
Payments of debt issuance costs
|
(7.6
|
)
|
(2.2
|
)
|
(2.9
|
)
|
|||||
|
Purchases of treasury stock, including those associated with net share settlement of employee share-based awards
|
(0.4
|
)
|
(0.1
|
)
|
(1.2
|
)
|
|||||
|
Excess tax benefit on share-based arrangements
|
0.4
|
|
—
|
|
—
|
|
|||||
|
Proceeds from the exercise of stock options
|
0.6
|
|
1.4
|
|
0.2
|
|
|||||
|
Net cash provided by (used in) financing activities
|
(4.4
|
)
|
(133.9
|
)
|
(198.6
|
)
|
|||||
|
Net (decrease) increase in cash and cash equivalents
|
(63.4
|
)
|
(6.9
|
)
|
38.2
|
|
|||||
|
CASH AND CASH EQUIVALENTS, beginning of year
|
84.7
|
|
91.6
|
|
53.4
|
|
|||||
|
CASH AND CASH EQUIVALENTS, end of year
|
$
|
21.3
|
|
$
|
84.7
|
|
$
|
91.6
|
|
||
See Note 20 for supplemental cash flow information
See accompanying Notes to Consolidated Financial Statements
64
ASBURY AUTOMOTIVE GROUP, INC.
NOTES TO CONSOLIDATED FINANCIAL STATEMENTS
(
December 31, 2010
,
2009
and
2008
)
1. DESCRIPTION OF BUSINESS
We are one of the largest automotive retailers in the United States, operating 110 franchises (84 dealership locations) in 20 metropolitan markets within 11 states as of
December 31, 2010
. We offer an extensive range of automotive products and services, including new and used vehicles; vehicle maintenance, replacement parts and collision repair services; and financing, insurance and service contracts. As of
December 31, 2010
, we offered 36 domestic and foreign brands of new vehicles. Our current brand mix is weighted 86% towards luxury and mid-line import brands, with the remaining 14% consisting of domestic brands. We also operate 26 collision repair centers that serve customers in our local markets.
The franchises, locations, brands and collision repair centers described above include those associated with our heavy truck business in Atlanta, Georgia and the acquisition of nine franchises (four dealership locations) in the fourth quarter of 2010. In December 2010, we entered into a contract to sell our heavy truck business and, as a result, the results of operations of this business were classified as Discontinued Operations, net on the accompanying Consolidated Statements of Income (Loss). As of December 31, 2010, our heavy truck business included ten franchise (three locations) offering seven brands of heavy trucks, as well as one collision repair center.
Our retail network is made up of dealerships operating primarily under the following locally-branded dealership groups:
|
•
|
Coggin dealerships, operating primarily in the Florida markets of Jacksonville, Fort Pierce and Orlando;
|
|
•
|
Courtesy dealerships operating in Tampa, Florida;
|
|
•
|
Crown dealerships operating in New Jersey, North Carolina, South Carolina and Virginia;
|
|
•
|
Nalley dealerships operating in Atlanta, Georgia;
|
|
•
|
McDavid dealerships operating in Texas;
|
|
•
|
North Point dealerships operating in Little Rock, Arkansas;
|
|
•
|
Plaza dealerships operating in St. Louis, Missouri; and
|
|
•
|
Gray-Daniels dealerships operating in Jackson, Mississippi.
|
In addition to the dealership groups listed above, we also operated one luxury brand dealership in California as of
December 31, 2010
.
We are subject to a number of financial covenants in our various debt and lease agreements. As of December 31, 2008, there was uncertainty as to whether we would be able to remain in compliance with such covenants. Our previous independent registered public accounting firm included an explanatory paragraph in its audit report for our 2008 consolidated financial statements that indicated there was uncertainty that we would remain in compliance with certain covenants in our debt agreements, and that this uncertainty raised substantial doubt about our ability to continue as a going concern. The inclusion of this explanatory paragraph in the 2008 audit report constituted a default under our revolving credit facility with Bank of America, N.A. (“Bank of America”), as administrative agent, and a syndicate of commercial banks and commercial financing entities (the “BofA Revolving Credit Facility”), our revolving credit facility with JPMorgan Chase Bank, N.A. (“JPMorgan Chase”), as administrative agent, and Bank of America (the “JPMorgan Used Vehicle Floor Plan Facility”) and our new vehicle floor plan facility with General Motors Acceptance Corporation. On March 12, 2009, we received waivers from all of our associated lending partners with respect to these defaults and, as a result, we were in compliance with the covenants contained in these borrowing facilities.
2. SUMMARY OF SIGNIFICANT ACCOUNTING POLICIES
Basis of Presentation
The accompanying consolidated financial statements have been prepared in accordance with accounting principles generally accepted in the United States of America (“GAAP”), and reflect the consolidated accounts of Asbury Automotive Group, Inc. and our wholly owned subsidiaries. All intercompany transactions have been eliminated in consolidation.
The preparation of financial statements in conformity with GAAP requires management to make estimates and assumptions that affect the amounts of assets and liabilities and disclosures of contingent assets and liabilities as of the date of the financial statements and the reported amounts of revenues and expenses during the periods presented. Actual results could differ
65
materially from these estimates. Estimates and assumptions are reviewed quarterly and the effects of revisions are reflected in the consolidated financial statements in the period they are determined to be necessary. Significant estimates made in the accompanying consolidated financial statements include, but are not limited to, inventory valuation reserves, reserves for chargebacks against revenue recognized from the sale of finance and insurance ("F&I") products, certain assumptions related to intangible and long-lived assets, reserves for insurance programs, reserves for certain legal proceedings, realization of deferred tax assets and reserves for estimated tax liabilities.
Cash and Cash Equivalents
Cash and cash equivalents include investments in money market accounts and short-term certificates of deposit which have maturity dates of less than 90 days when purchased.
Contracts-In-Transit
Contracts-in-transit represent receivables from third-party finance companies for the portion of new and used vehicle purchase price financed by customers through sources arranged by us. Amounts due from contracts-in-transit are generally collected within two weeks following the date of sale of the related vehicle.
Inventories
Inventories are stated at the lower of cost or market. We use the specific identification method to value vehicle inventories and the “first-in, first-out” method (“FIFO”) to account for our parts inventories. We maintain a reserve for specific vehicles where cost basis exceeds market value. In assessing the lower of cost or market for new and used vehicles, we consider (i) the aging of new and used vehicles, (ii) loss histories of new and used vehicles, (iii) the timing of annual and model changeovers of new vehicles and (iv) then-current market conditions. Our new vehicle loss histories have indicated that our losses range between 1% and 3% of our new vehicle inventory greater than 300 days old. Our used vehicle loss histories have indicated that our losses range between 3% and 6% of our total used vehicle inventory.
We receive assistance from certain automobile manufacturers in the form of advertising and interest credits. Manufacturer advertising credits that are reimbursements of costs associated with specific advertising programs are recognized as a reduction of advertising expense in the period they are earned. All other manufacturer advertising and interest credits are accounted for as purchase discounts and are recorded as a reduction of inventory and recognized as a reduction to New Vehicle Cost of Sales in the accompanying Consolidated Statements of Income (Loss) in the period the related vehicle is sold.
Property and Equipment
Property and equipment are recorded at cost and depreciated using the straight-line method over their estimated useful lives. Depreciation is included in Depreciation and Amortization and Discontinued Operations, net of tax, on the accompanying Consolidated Statements of Income (Loss). Leasehold improvements are capitalized and amortized over the lesser of the life of the lease or the useful life of the related asset. The ranges of estimated useful lives are as follows (in years):
|
Buildings and improvements
|
10-40
|
|
Machinery and equipment
|
5-10
|
|
Furniture and fixtures
|
3-10
|
|
Company vehicles
|
3-5
|
Expenditures for major additions or improvements, which extend the useful lives of assets, are capitalized. Minor replacements, maintenance and repairs, which do not improve or extend the lives of such assets, are expensed as incurred.
We review property and equipment for impairment whenever events or changes in circumstances indicate the carrying value may not be recoverable. When we test our long-lived assets for impairment, we first compare the carrying amount of the underlying assets to their net recoverable value by reviewing the undiscounted cash flows expected to result from the use and eventual disposition of the underlying assets. If the carrying amount of the underlying assets is less than their net recoverable value, then we calculate an impairment equal to the excess of the carrying amount over the fair market value, and the impairment loss would be charged to operations in the period identified. As a result of impairment tests conducted in
2010
,
2009
and
2008
, we recorded impairments of certain of our property and equipment in those periods (see Note 10).
We capitalize interest on borrowings during the active construction period of capital projects. Capitalized interest is added to the cost of the assets and is depreciated over the estimated useful lives of the assets.
Acquisitions
66
Acquisitions are accounted for under the purchase method of accounting and the assets acquired and liabilities assumed are recorded at their fair value as of the acquisition dates. The operations of the acquired dealerships are included in the accompanying Consolidated Statements of Income (Loss) commencing on the date of acquisition.
Goodwill and Other Intangible Assets
Goodwill represents the excess cost of the businesses acquired over the fair market value of the identifiable net assets. We have determined that, based on how we integrate acquisitions into our business, how the components of our business share resources and interact with one another, and the fact that all components are economically similar, we qualify as a single reporting unit for purposes of testing goodwill for impairment. Our dealership general managers are responsible for customer-facing activities, including inventory management, advertising and personnel decisions, and have the flexibility to respond to local market conditions. The corporate management team is generally responsible for infrastructure and strategy decisions.
The fair market value of our manufacturer franchise rights, which are included in Other Long Term Assets on the accompanying Consolidated Balance Sheets, is determined at the acquisition date through discounting the projected cash flows specific to each franchise. We have determined that manufacturer franchise rights have an indefinite life as there are no economic or other factors that limit their useful lives and they are expected to generate cash flows indefinitely due to the historically long lives of the manufacturers’ brand names. Furthermore, to the extent that any agreements evidencing our manufacturer franchise rights would expire, we expect that we would be able to renew those agreements in the ordinary course of business. Due to the fact that manufacturer franchise rights are specific to each dealership, we have determined that the dealership is the reporting unit for purposes of testing franchise rights for impairment.
We do not amortize goodwill and other intangible assets that are deemed to have indefinite lives. We review goodwill and manufacturer franchise rights for impairment annually as of October 1
st
of each year, or more often if events or circumstances indicate that impairment may have occurred. We are subject to financial statement risk to the extent that manufacturer franchise rights become impaired due to decreases in fair market value of our individual franchises or to the extent that goodwill becomes impaired due to decreases in the fair market value of our automotive retail business.
We completed our annual intangible impairment tests as of October 1, 2010, and no impairment of goodwill or other intangible assets was recognized as a result of such tests.
Debt Issuance Costs
Debt issuance costs are capitalized and included in Other Long-Term Assets in the accompanying Consolidated Balance Sheets. Debt issuance costs are amortized to Other Interest Expense and Floor Plan Interest Expense in the accompanying Consolidated Statements of Income (Loss) through maturity using either the effective interest method or straight line method.
Derivative Instruments and Hedging Activities
We utilize derivative financial instruments to manage our capital structure and interest rate risk. The types of risks hedged are those relating to the variability of cash flows and changes in the fair value of our financial instruments caused by movements in interest rates. We document our risk management strategy and assess hedge effectiveness at the inception and during the term of each hedge. Derivatives are reported at fair value on the accompanying Consolidated Balance Sheets.
The effective portion of the gain or loss on our cash flow hedges is reported as a component of accumulated other comprehensive loss and reclassified to interest expense in the accompanying Consolidated Statements of Income (Loss) in the same period during which the hedged transaction affects earnings.
Measurements of hedge effectiveness are based on comparisons between the gains or losses of the actual interest rate swaps and the gains or losses of hypothetical interest rate swaps, which have the exact same critical terms of the defined hedged items. Ineffective portions of these interest rate swaps are reported as a component of interest expense in the accompanying Consolidated Statements of Income (Loss).
Insurance
We are self insured for employee medical claims and maintain stop loss insurance for individual claims. We have large deductible insurance programs for workers compensation, property and general liability claims. We maintain and review our claim and loss history to assist in assessing our expected future liability for these claims. We also use professional service providers, such as account administrators and actuaries, to help us accumulate and assess this information.
Revenue Recognition
67
Revenue from the sale of new and used vehicles (which excludes sales tax) is recognized upon the latest of delivery, passage of title, signing of the sales contract or approval of financing. Revenue from the sale of parts, service and collision repair work (which excludes sales tax) is recognized upon delivery of parts to the customer or at the time vehicle service or repair work is completed, as applicable. Manufacturer incentives and rebates, including manufacturer holdbacks, floor plan interest assistance and certain advertising assistance, are recognized as a reduction of new vehicle cost of sales at the time the related vehicles are sold.
We receive commissions from third-party lending and insurance institutions for arranging customer financing and from the sale of vehicle service contracts, credit life insurance and disability insurance to customers, and other insurance offerings (collectively “F&I”). We may be charged back (“chargebacks”) for F&I commissions in the event a contract is prepaid, in default or terminated. F&I commissions are recorded at the time a vehicle is sold and a reserve for future chargebacks is established based on historical chargeback experience and the termination provisions of the applicable contracts. F&I commissions, net of estimated chargebacks, are included in Finance and Insurance, net in the accompanying Consolidated Statements of Income (Loss).
Internal Profit
Revenues and expenses associated with the internal work performed by our parts and service departments on new and used vehicle inventory are eliminated in consolidation. The gross profit earned by our parts and service departments for internal work performed is included as a reduction of Parts and Service Cost of Sales on the accompanying Consolidated Statements of Income (Loss). The costs incurred by our new and used departments for work performed by our parts and service departments is included in either New Vehicle Cost of Sales or Used Vehicle Cost of Sales on the accompanying Consolidated Statements of Income (Loss), depending on the classification of the vehicle serviced. We maintain an internal profit reserve for internal profit on vehicles that have not been sold.
Share-Based Compensation
We record share-based compensation expense under the fair value method on a straight-line basis over the vesting period.
Earnings (Loss) per Common Share
Basic earnings per share is computed for all periods presented by dividing net income by the weighted-average common shares outstanding during the period. Diluted earnings per share is computed by dividing net income by the weighted-average common shares and common share equivalents outstanding during the period. For all periods presented, there were no adjustments to the numerator necessary to compute diluted earnings per share. We have issued warrants that, upon exercise, may result in the issuance of between 2.4 million and 4.9 million shares of our common stock at an exercise price of $44.74 per share. Since the warrants are required to be settled in shares of common stock, the premium received for selling the warrants was recorded as an increase to additional paid in capital, together with any cash received upon exercise. In addition, our 3% Senior Subordinated Convertible Notes due 2012 (the “3% Convertible Notes”) are convertible into shares of our common stock at a current conversion rate of $33.73 per share. The shares issuable upon exercise of these warrants and conversion of our 3% Convertible Notes could potentially dilute basic earnings per share in the future; however, these shares were not included in the computation of diluted earnings per share because their inclusion would be anti-dilutive. The maximum number of shares of common stock issuable upon conversion of our 3% Convertible Notes as of
December 31, 2010
was 2.2 million shares.
Advertising
We expense costs of advertising as incurred and production costs when the advertising initially takes place, net of certain advertising credits and other discounts. Advertising expense from continuing operations totaled $26.4 million, $26.8 million and $39.5 million for the years ended
December 31, 2010
,
2009
and
2008
, net of earned advertising credits and volume discounts of $10.4 million, $3.3 million and $4.6 million, respectively, and is included in Selling, General and Administrative expense in the accompanying Consolidated Statements of Income (Loss).
Income Taxes
We use the liability method to account for income taxes. Under this method, deferred tax assets and liabilities are recognized for the expected future tax consequences of differences between the carrying amounts of assets and liabilities and their respective tax basis using currently enacted tax rates. The effect on deferred assets and liabilities of a change in tax rates is recognized in income in the period when the change is enacted. Deferred tax assets are reduced by a valuation allowance when it is more likely than not that some portion or all the deferred tax assets will not be realized.
Discontinued Operations
68
Certain amounts reflected in the accompanying Consolidated Balance Sheets as of
December 31, 2010
and
2009
, have been classified as Assets Held for Sale or Liabilities Associated with Assets Held for Sale, to the extent that they were held for sale, or associated with assets held for sale, at each balance sheet date. Amounts in the accompanying Consolidated Statements of Income (Loss) for the years ended
December 31, 2009
and
2008
, have been reclassified to reflect the results of franchises sold during
2010
or held for sale as of
December 31, 2010
, as if we had classified those franchises as discontinued operations for all years presented. The assets and liabilities classified as held for sale are reclassified to the appropriate balance sheet categories for all periods presented in the period that it is determined that the related franchise will no longer be actively marketed for sale.
We report franchises and ancillary businesses as discontinued operations when it is evident that the operations and cash flows of a franchise or ancillary business being actively marketed for sale will be eliminated from our on-going operations and that we will not have any significant continuing involvement in its operations. We do not classify franchises as discontinued operations if we believe that the cash flows generated by the franchise will be replaced by expanded operations of our remaining franchises within the respective local market area.
Statements of Cash Flows
Borrowings and repayments of floor plan notes payable to a lender unaffiliated with the manufacturer from which we
purchase a particular new vehicle (“Non-Trade”), and all floor plan notes payable relating to pre-owned vehicles (collectively
referred to as "Floor Plan Notes Payable - Non-Trade"), are classified as financing activities on the accompanying Consolidated Statements of Cash Flows, with borrowings reflected separately from repayments. The net change in floor plan notes payable to a lender affiliated with the manufacturer from which we purchase a particular new vehicle (collectively referred to as “Floor Plan Notes Payable - Trade”) is classified as an operating activity on the accompanying Consolidated Statements of Cash Flows.
Loaner vehicles account for a significant portion of Other Current Assets on the accompanying Consolidated Statements of Cash Flows. We acquire loaner vehicles either with available cash or through borrowings from manufacturer affiliated lenders. While loaner vehicles are initially used by our service department for use in our business, these vehicles are used in such capacity for a short period of time (typically six to twelve months) before we sell them. Therefore we classify the acquisition of loaner vehicles and the related borrowings and repayments as operating activities in the accompanying Consolidated Statements of Cash Flows. The cash outflow to acquire loaner vehicles is presented in Other Current Assets in the accompanying Consolidated Statements of Cash Flows. Borrowings and repayments of loaner vehicle notes payable are presented in Accounts Payable and Accrued Liabilities in the accompanying Consolidated Statements of Cash Flows. When loaner vehicles are taken out of loaner status they are transferred to used vehicle inventory, which is reflected as a non-cash transfer in the accompanying Consolidated Statements of Cash Flows. The cash inflow from the sale of loaner vehicles is reflected in Inventories on the accompanying Consolidated Statements of Cash Flows.
Business and Credit Concentration Risk
Financial instruments, which potentially subject us to concentration of credit risk, consist principally of cash deposits. We maintain cash balances at financial institutions with strong credit ratings. Generally, amounts invested with financial institutions are in excess of FDIC insurance limits.
We have substantial debt service obligations. As of
December 31, 2010
, we had total debt of $550.7 million, including amounts classified as Liabilities Associated with Assets Held for Sale, excluding floor plan notes payable and the unamortized discount on our 3% Convertible Notes on our accompanying Consolidated Balance Sheet. In addition, we and our subsidiaries have the ability to obtain additional debt from time to time to finance acquisitions, real property purchases, capital expenditures or for other purposes, which borrowings are subject to the restrictions contained in our revolving credit facilities and the indentures governing our 8.375% Senior Subordinated Notes due 2020 (the "8.375% Notes") and our 7.625% Senior Subordinated Notes due 2017 (the "7.625% Notes"). We will have substantial debt service obligations, consisting of required cash payments of principal and interest, for the foreseeable future.
In addition, we are subject to operating and financial restrictions and covenants in certain of our leases and in our debt instruments, including our revolving credit facilities with Bank of America, N.A. and JPMorgan Chase, the indentures under our 8.375% Notes and our 7.625% Notes and the mortgage agreements or guarantees for mortgages held with Wachovia Bank, National Association, Wachovia Financial Services, Inc. and certain of our other mortgage obligations. These agreements contain restrictions on, among other things, our ability to incur additional indebtedness, to create liens or other encumbrances, and to make certain payments (including dividends and repurchases of our shares and investments). These agreements may also require us to maintain compliance with certain financial and other ratios. Our ability to comply with these ratios may be affected by events beyond our control. A breach of any of the covenants in our debt instruments or certain leases, or our
69
inability to comply with any required ratios could result in an event of default, which, if not cured or waived, could result in cross defaults which would have a material adverse effect on us. In the event of any default under these agreements governing our indebtedness or our mortgages and/or guarantees related to such mortgages, the payment of all outstanding borrowings could be accelerated, together with accrued and unpaid interest and other fees, and we would be required to apply our available cash to repay these borrowings or could be prevented from making debt service payments on our 8.375% Notes, our 7.625% Notes, and our 3% Convertible Notes, any of which would be an event of default under the respective indentures for such Notes. Furthermore, failing to comply with any of these covenants or meet the required financial ratios could prevent us from being able to access our credit lines under these credit facilities or limit the size or pricing, or result in other less favorable terms, or combination thereof, under such credit facilities.
A number of our dealerships are located on properties that we lease. Each of the leases governing such properties has certain covenants with which we must comply. If we fail to comply with the covenants under our leases, the respective landlords could terminate the leases and seek damages from us.
Concentrations of credit risk with respect to contracts-in-transit and accounts receivable are limited primarily to automotive manufacturers and financial institutions. Credit risk arising from receivables from commercial customers is minimal due to the large number of customers comprising our customer base.
A significant portion of our new vehicle sales are derived from a limited number of automotive manufacturers. For the year ended
December 31, 2010
, brands representing 5% or more of our revenues from new vehicle sales were as follows:
|
Brand
|
% of Total
New
Vehicle Revenues
|
|
|
Honda
|
23
|
%
|
|
Nissan
|
13
|
%
|
|
Toyota
|
10
|
%
|
|
BMW
|
9
|
%
|
|
Mercedes-Benz
|
8
|
%
|
|
Ford
|
8
|
%
|
|
Lexus
|
6
|
%
|
No other brand accounted for more than 5% of our total new vehicle revenue for the year ended
December 31, 2010
.
Segment Reporting
We have determined that as a result of how we internally view our business, regularly review our financial data and operating metrics and allocate resources that we operate in one segment, automotive retail. Our Chief Operating Decision Maker is our Chief Executive Officer who manages the business, regularly reviews financial information and allocates resources on a consolidated basis. Our dealerships are components of our automotive retail segment and, therefore, are not segments themselves.
Nonfinancial Assets and Liabilities
We began accounting for the methods of fair value for nonfinancial assets and liabilities based on a new definition of fair value on January 1, 2009. The adoption of the new accounting requirements for nonfinancial assets and liabilities did not have a material impact on our consolidated financial statements.
3. RECLASSIFICATION OF PRIOR YEAR FINANCIAL STATEMENTS
We have previously presented the earnings impact associated with our various derivative financial instruments as components of Floor Plan Interest Expense and Other Interest Expense on our Consolidated Statements of Income (Loss). Our various derivative financial instruments, which include fair value and cash flow interest rate swaps, have been primarily designed to provide hedges against changes in fair value of certain debt obligations and variable rate cash flows. Our earnings have been impacted by these interest rate swaps in the form of (i) amounts reclassified from Accumulated Other Comprehensive Income ("AOCI") to earnings for active swaps, (ii) amortization of amounts reclassified from AOCI to earnings for terminated cash flow swaps and (iii) amortization of terminated fair value swaps. In order to more clearly show the earnings impact associated with our various derivative financial instruments, we have separately disclosed "Swap Interest Expense" on our Consolidated Statements of Income (Loss) and reclassified the appropriate amounts from Floor Plan Interest Expense and
70
Other Interest Expense to Swap Interest Expense. These reclassifications did not have any impact on income (loss) from continuing operations, earnings (loss) per share or retained earnings.
|
|
For the Year Ended December 31,
|
||||||
|
|
2009
|
2008
|
|||||
|
|
(In millions)
|
||||||
|
Floor plan interest expense, previously reported
|
$
|
(18.0
|
)
|
$
|
(28.9
|
)
|
|
|
Swap interest expense previously included in floor plan interest expense
|
5.0
|
|
4.3
|
|
|||
|
Floor plan interest expense of franchises placed into discontinued operations in 2010
|
2.1
|
|
2.4
|
|
|||
|
Floor plan interest expense
|
$
|
(10.9
|
)
|
$
|
(22.2
|
)
|
|
|
|
For the Year Ended December 31,
|
||||||
|
|
2009
|
2008
|
|||||
|
|
(In millions)
|
||||||
|
Other interest expense, previously reported
|
$
|
(38.2
|
)
|
$
|
(40.0
|
)
|
|
|
Swap interest expense previously included in other interest expense
|
1.6
|
|
1.2
|
|
|||
|
Other interest expense of franchises placed into discontinued operations in 2010
|
0.2
|
|
0.2
|
|
|||
|
Interest income
|
0.2
|
|
1.5
|
|
|||
|
Other interest expense, net
|
$
|
(36.2
|
)
|
$
|
(37.1
|
)
|
|
|
|
For the Year Ended December 31,
|
||||||
|
|
2009
|
2008
|
|||||
|
|
(In millions)
|
||||||
|
Swap interest expense, previously reported
|
$
|
—
|
|
$
|
—
|
|
|
|
Swap interest expense previously included in floor plan interest expense
|
(5.0
|
)
|
(4.3
|
)
|
|||
|
Swap interest expense previously included in other interest expense
|
(1.6
|
)
|
(1.2
|
)
|
|||
|
Swap interest expense
|
$
|
(6.6
|
)
|
$
|
(5.5
|
)
|
|
In addition, we have reclassified our Consolidated Statements of Income (Loss) for 2009 and 2008 to reflect the current status of our discontinued operations and we have made certain other immaterial reclassifications of prior year amounts to be consistent with current period presentation.
4. ACQUISITIONS
Results of acquired dealerships are included in our accompanying Consolidated Statements of Income (Loss) commencing on the date of acquisition.
In the fourth quarter of 2010, we acquired nine franchises (four dealership locations) for an aggregate purchase price of $77.5 million. We financed these acquisitions with (i) $46.6 million of cash, (ii) $13.9 million of floor plan borrowings for the purchase of the related new vehicle inventory and (iii) $17.0 million of a seller financed mortgage note payable for the purchase of land and buildings associated with five of those franchises (three dealership locations). During the twelve months ended
December 31, 2009
, we did not acquire any dealerships.
Two of the franchises acquired thereafter became part of our heavy truck business. In December 2010, we entered into a contract to sell our heavy truck business. As a result the assets and liabilities associated with these franchises were classified as Assets Held for Sale and Liabilities Associated with Assets Held for Sale as of December 31, 2010.
Below is the preliminary allocation of purchase price for acquisitions completed during 2010 and 2009. The $39.0 million of goodwill and manufacturer franchise rights will be deductible for federal and state income taxes ratably over a fifteen year period.
71
|
|
For the Years Ended December 31,
|
||||||
|
|
2010
|
2009
|
|||||
|
|
(In millions)
|
||||||
|
Inventory
|
$
|
17.4
|
|
$
|
—
|
|
|
|
Property and equipment
|
21.1
|
|
—
|
|
|||
|
Goodwill
|
20.5
|
|
—
|
|
|||
|
Manuacturer franchise rights
|
18.5
|
|
—
|
|
|||
|
Total purchase price
|
$
|
77.5
|
|
$
|
—
|
|
|
During the twelve months ended
December 31, 2010
, we were awarded two Sprinter franchises, which were added to our Mercedes-Benz locations in St. Louis, Missouri and Tampa, Florida. During the twelve months ended
December 31, 2009
, we were awarded one Jeep franchise, which was added to our Chrysler/Dodge location in Greensboro, North Carolina. We did not pay any amount in connection with being awarded any of these three franchises.
The pro forma consolidated statements of operations as if the results of these acquisitions had been included in our consolidated results for the entire year ended December 31, 2010 would not have been materially different from our reported consolidated statements of operations for these periods.
5. ACCOUNTS RECEIVABLE
We have agreements to sell certain of our trade receivables, without recourse as to credit risk, in an amount not to exceed $25.0 million annually. The receivables are sold at a discount, which is included in Selling, General and Administrative expense in the accompanying Consolidated Statements of Income (Loss). The discounts totaled $0.6 million, $0.6 million and $0.5 million for the years ended
December 31, 2010
,
2009
and
2008
, respectively. During the years ended
December 31, 2010
,
2009
and
2008
, $23.4 million, $22.5 million and $21.0 million of receivables, respectively, were sold under these agreements and were reflected as reductions of trade accounts receivable.
6. INVENTORIES
Inventories consist of the following:
|
|
As of December 31,
|
||||||
|
|
2010
|
2009
|
|||||
|
|
(In millions)
|
||||||
|
New vehicles
|
$
|
431.9
|
|
$
|
395.5
|
|
|
|
Used vehicles
|
74.8
|
|
64.1
|
|
|||
|
Parts and accessories
|
36.2
|
|
41.5
|
|
|||
|
Total inventories
|
$
|
542.9
|
|
$
|
501.1
|
|
|
The lower of cost or market reserves reduced total inventory cost by $4.6 million and $7.4 million as of
December 31, 2010
and
2009
, respectively. In addition to the inventories shown above, we have $35.8 million and $5.6 million of inventory as of
December 31, 2010
and
2009
, respectively, classified as Assets Held for Sale on the accompanying Consolidated Balance Sheets as they are associated with franchises held for sale. As of
December 31, 2010
and
2009
, certain automobile manufacturer incentives reduced new vehicle inventory cost by $5.1 million and $5.2 million, respectively, and reduced new vehicle cost of sales from continuing operations for the years ended
December 31, 2010
,
2009
and
2008
, by $19.2 million, $20.1 million and $26.5 million, respectively.
7. ASSETS AND LIABILITIES HELD FOR SALE
Assets and liabilities classified as held for sale include (i) assets and liabilities associated with discontinued operations held for sale at each balance sheet date and (ii) real estate not currently used in our operations that we intend to sell and the related mortgage notes payable, if applicable.
Assets associated with pending dispositions as of
December 31, 2010
totaled $53.0 million, which includes $10.6 million of land and building assets. Liabilities associated with pending dispositions totaled $37.7 million as of
December 31, 2010
.
72
Assets associated with pending dispositions totaled $8.0 million as of
December 31, 2009
. Liabilities associated with pending dispositions totaled $5.5 million as of
December 31, 2009
.
Real estate not currently used in our operations that we are actively marketing to sell totaled $12.7 million and $17.5 million as of
December 31, 2010
and
2009
, respectively. There were no liabilities associated with our real estate assets held for sale as of
December 31, 2010
and 2009, respectively.
During the twelve months ended
December 31, 2010
, we sold one franchise (one dealership location). In addition, during the twelve months ended December 31, 2010 we removed $4.8 million and $1.4 million of assets held for sale and liabilities associated with assets held for sale related to one franchise (one dealership location) as a result of our decision to operate this store instead of market it for sale. As a result, we reclassified the assets and liabilities associated with this franchise from Assets Held for Sale and Liabilities Associated with Assets Held for Sale on the Consolidated Balance Sheet as of December 31, 2009.
A summary of assets held for sale and liabilities associated with assets held for sale is as follows:
|
|
As of December 31,
|
||||||
|
|
2010
|
2009
|
|||||
|
|
(In millions)
|
||||||
|
Assets:
|
|||||||
|
Inventories
|
$
|
35.8
|
|
$
|
5.6
|
|
|
|
Property and equipment, net
|
26.1
|
|
19.9
|
|
|||
|
Goodwill
|
1.6
|
|
—
|
|
|||
|
Other
|
2.2
|
|
—
|
|
|||
|
Total assets
|
65.7
|
|
25.5
|
|
|||
|
Liabilities:
|
|||||||
|
Floor plan notes payable
|
32.5
|
|
5.5
|
|
|||
|
Mortgage notes payable
|
5.2
|
|
—
|
|
|||
|
Total liabilities
|
37.7
|
|
5.5
|
|
|||
|
Net assets held for sale
|
$
|
28.0
|
|
$
|
20.0
|
|
|
8. OTHER CURRENT ASSETS
Other current assets consist of the following:
|
|
As of December 31,
|
||||||
|
|
2010
|
2009
|
|||||
|
|
(In millions)
|
||||||
|
Service loaner vehicles
|
$
|
41.2
|
|
$
|
31.9
|
|
|
|
Prepaid taxes
|
9.4
|
|
10.3
|
|
|||
|
Prepaid rent
|
0.7
|
|
3.8
|
|
|||
|
Other
|
5.3
|
|
5.5
|
|
|||
|
Other current assets
|
$
|
56.6
|
|
$
|
51.5
|
|
|
9. PROPERTY AND EQUIPMENT, NET
Property and equipment, net consist of the following:
73
|
|
As of December 31,
|
||||||
|
|
2010
|
2009
|
|||||
|
|
(In millions)
|
||||||
|
Land
|
$
|
171.9
|
|
$
|
167.3
|
|
|
|
Buildings and leasehold improvements
|
316.3
|
|
300.3
|
|
|||
|
Machinery and equipment
|
65.6
|
|
71.6
|
|
|||
|
Furniture and fixtures
|
28.9
|
|
30.4
|
|
|||
|
Company vehicles
|
7.0
|
|
9.7
|
|
|||
|
Total
|
589.7
|
|
579.3
|
|
|||
|
Less—Accumulated depreciation
|
(131.3
|
)
|
(126.8
|
)
|
|||
|
Property and equipment, net
|
$
|
458.4
|
|
$
|
452.5
|
|
|
During the years ended
December 31, 2010
,
2009
and
2008
, we capitalized $0.5 million, $0.4 million and $1.1 million, respectively, of interest in connection with various capital projects to upgrade or remodel our facilities. Depreciation and amortization expense from continuing operations was
$21.1 million
,
$22.2 million
and
$21.1 million
for the years ended
December 31, 2010
,
2009
and
2008
, respectively.
We have multiple mortgage agreements with various lenders. For a detailed description of our mortgage agreements, refer to our “Long-Term Debt” footnote below. As of
December 31, 2010
and
2009
, we had total mortgage notes payable outstanding of $178.0 million and $169.9 million, respectively, of which $5.2 million was classified as Liabilities Held for Sale on the accompanying Consolidated Balance Sheet as of
December 31, 2010
. These obligations were collateralized by the related real estate with a carrying value of
$276.4
million and
$246.7
million as of
December 31, 2010
and
2009
, respectively, of which $7.8 million was classified as Assets Held for Sale on the accompanying Consolidated Balance Sheet as of
December 31, 2010
.
10. ASSET IMPAIRMENT EXPENSES
Due to events and circumstances specific to each reporting period, we performed certain interim period impairment tests during
2010
,
2009
and
2008
. We compared the carrying value of our assets held for sale to estimates of fair values determined with the assistance of third-party desktop appraisals and real estate brokers.
The impairment tests indicated an impairment of our intangible assets and certain of our property and equipment. As a result, we recognized the following impairment expenses in
2010
,
2009
and
2008
:
|
|
As of December 31,
|
||||||||||
|
|
2010
|
2009
|
2008
|
||||||||
|
|
(In millions)
|
||||||||||
|
Goodwill
|
$
|
—
|
|
$
|
—
|
|
$
|
499.8
|
|
||
|
Manufacturer franchise rights
|
—
|
|
—
|
|
37.1
|
|
|||||
|
Property and equipment
|
5.1
|
|
5.5
|
|
11.4
|
|
|||||
|
Other intangible assets
|
—
|
|
—
|
|
2.6
|
|
|||||
|
Total impairment expense
|
5.1
|
|
5.5
|
|
550.9
|
|
|||||
|
Less— impairment expenses included in discontinued operations
|
|||||||||||
|
Goodwill
|
—
|
|
—
|
|
(8.1
|
)
|
|||||
|
Manufacturer franchise rights
|
—
|
|
—
|
|
(8.7
|
)
|
|||||
|
Property and equipment
|
(2.1
|
)
|
(4.8
|
)
|
(5.3
|
)
|
|||||
|
Other intangible assets
|
—
|
|
—
|
|
(0.1
|
)
|
|||||
|
Total impairment expenses included in discontinued operations
|
(2.1
|
)
|
(4.8
|
)
|
(22.2
|
)
|
|||||
|
Total impairment expenses included in continuing operations
|
$
|
3.0
|
|
$
|
0.7
|
|
$
|
528.7
|
|
||
During the fourth quarter of
2008
, we experienced a sustained decline in our market capitalization and a significant decline in total revenue due to overall retail industry conditions driven by declining consumer confidence, more stringent lending standards, rising gas prices, changes in consumer demand and falling home prices. Our stock price decreased 60% from $11.52 per share as of September 30, 2008 to $4.57 per share as of December 31, 2008. In addition, our total revenues decreased approximately 30% during the fourth quarter of
2008
as compared to the fourth quarter of 2007.
74
The test for goodwill impairment, as defined by SFAS No. 142, is a two-step approach (a) determining fair value of our single reporting unit and (b) allocating the fair value (as if it were the purchase price in a business combination). We determined fair value using two valuation methods (1) quoted market price of our outstanding common shares plus a control premium and (2) a discounted cash flow analysis using forward-looking projections of our estimated future operating results. As a result, during 2008, we recognized impairment expenses totaling $550.9 million, which includes (i) a $499.8 million impairment of all of our goodwill, (ii) a $39.7 million impairment of franchise rights and other intangible assets and (iii) an $11.4 million impairment of certain property and equipment.
11. GOODWILL
Our acquisitions have resulted in the recording of goodwill, which is an asset representing operational synergies and future economic benefits arising from other assets acquired in a business combination that are not individually identified and separately recognized. The changes in the carrying amount of goodwill for the years ended
December 31, 2010
and
2009
are as follows:
|
|
Gross
Carrying
Amount
|
Less:
Accumulated
Impairment
|
Net
|
||||||||
|
|
(In millions)
|
||||||||||
|
Balance as of December 31, 2008 and 2009
|
$
|
537.7
|
|
$
|
(537.7
|
)
|
$
|
—
|
|
||
|
Acquisitions
|
20.5
|
|
—
|
|
20.5
|
|
|||||
|
Reclassified to assets held for sale
|
(1.6
|
)
|
—
|
|
(1.6
|
)
|
|||||
|
Balance as of December 31, 2010
|
$
|
556.6
|
|
$
|
(537.7
|
)
|
$
|
18.9
|
|
||
12. OTHER LONG-TERM ASSETS
Other Long-Term Assets consist of the following:
|
|
As of December 31,
|
||||||
|
|
2010
|
2009
|
|||||
|
|
(In millions)
|
||||||
|
Manufacturer franchise rights
|
$
|
36.3
|
|
$
|
18.5
|
|
|
|
Deferred financing costs
|
12.9
|
|
10.5
|
|
|||
|
Cash surrender value of corporate-owned life insurance policies
|
13.6
|
|
12.1
|
|
|||
|
Construction period rent
|
3.4
|
|
4.0
|
|
|||
|
Other
|
4.0
|
|
6.7
|
|
|||
|
Total other long-term assets
|
$
|
70.2
|
|
$
|
51.8
|
|
|
13. FLOOR PLAN NOTES PAYABLE
We have floor plan facilities with predominantly our brands’ captive finance companies for the purchase of new and used inventory at all of our dealerships, except at our Chrysler, Dodge and Jeep dealerships (“Chrysler Dealerships”). In October 2008, we secured a $29.0 million new vehicle floor plan facility with Bank of America for the financing of new vehicle inventory at our Chrysler Dealerships.
As of
December 31, 2010
, our new vehicle inventory purchases are financed by the following floor plan providers:
|
•
|
American Honda Finance—Honda and Acura new vehicle inventory;
|
|
•
|
Bank of America—Chrysler, Dodge and Jeep new vehicle inventory—limited to $18.0 million of borrowing availability;
|
|
•
|
BMW Financial Services—BMW and MINI new vehicle inventory;
|
|
•
|
Comerica Bank—Hino and Isuzu Truck new heavy truck inventory;
|
|
•
|
Navistar Financial—International Truck, IC Bus, Workhorse and UD new heavy truck inventory;
|
|
•
|
DCFS USA LLC—Mercedes-Benz and smart new vehicle inventory;
|
75
|
•
|
Ford Motor Credit Corporation—Ford, Lincoln, Volvo and Mazda new vehicle inventory;
|
|
•
|
General Motors Acceptance Corporation—Chevrolet, Pontiac, Buick, GMC and Cadillac new vehicle inventory;
|
|
•
|
JPMorgan Chase Bank, N.A.—Audi, Hyundai, Kia, Land Rover, Jaguar, Porsche, and Volkswagen new vehicle inventory—limited to $30.0 million of borrowing capacity;
|
|
•
|
Nissan Motor Acceptance Corporation—Nissan and Infiniti new vehicle inventory;
|
|
•
|
PACCAR Financial Services Corporation—Peterbilt new heavy truck inventory;
|
|
•
|
Toyota Financial Services—Toyota new vehicle inventory purchased from Gulf States Toyota and Lexus new vehicle inventory; and
|
|
•
|
World Omni Financial Corporation—Toyota new vehicle inventory purchased from Southeast Toyota.
|
Borrowings on all our new vehicle floor plan financing facilities above generally accrue interest at rates ranging from approximately 1.50% to 3.00% above the London Interbank Offered Rate (“LIBOR”) or 0.50% below to 1.50% above the Prime Rate, with some floor plan financing facilities establishing specific prime rate or LIBOR minimums. Other than the limitations under our new vehicle floor plan facilities with Bank of America and JPMorgan Chase, as described above, all of our other new vehicle floor plan facilities do not have stated borrowing limitations. Our floor plan facility with JPMorgan Chase matures in August 2012, and the floor plan facilities with all other lenders have no stated termination date.
Under the terms of the collateral documents entered into with the lenders under our new vehicle floor plan facilities, we and all of our dealership subsidiaries, granted security interests in all of the new vehicle inventory financed under the respective floor plan facilities, as well as the proceeds from the sale of such vehicles, and certain other collateral.
We consider floor plan notes payable to a party that is affiliated with the entity from which we purchase our new vehicle inventory “Floor plan notes payable—trade” and all other floor plan notes payable “Floor plan notes payable—non-trade.” As of
December 31, 2010
, we had $359.7 million of floor plan notes payable—trade and $91.9 million of floor plan notes payable—non-trade outstanding, including amounts classified as Liabilities Associated with Assets Held for Sale.
As of
December 31, 2010
and
2009
, we had a total of $451.6 million and $441.6 million of floor plan notes payable outstanding, respectively, including $32.5 million and $5.5 million classified as Liabilities Associated with Assets Held for Sale.
In addition to the facilities described above, we have established accounts with certain manufacturers that allow us to transfer cash to an account as an offset to floor plan notes payable (“floor plan offset accounts”) that reduces our outstanding new vehicle floor plan notes payable while retaining the ability to transfer amounts from the floor plan offset accounts into our operating cash accounts within one to two days. As of
December 31, 2010
, we had $59.5 million in these floor plan offset accounts.
JPMorgan Used Vehicle Floor Plan Facility
We have a used vehicle floor plan facility with JPMorgan Chase ("JPMorgan Used Vehicle Floor Plan Facility"), against which we use certain of our used motor vehicle inventory as collateral. Total credit availability under our JPMorgan Used Vehicle Floor Plan Facility is $50.0 million. The JPMorgan Used Vehicle Floor Plan Facility matures on August 15, 2012. Under the JPMorgan Used Vehicle Floor Plan Facility, subject to a borrowing base, we may borrow up to $50.0 million, which amount may be expanded up to $75.0 million in total credit availability upon satisfaction of certain conditions. The amount available for borrowing under the JPMorgan Used Vehicle Floor Plan Facility is limited by the lesser of (i) $50.0 million or (ii) 65% of the net book value of our used vehicle inventory (excluding heavy trucks and our Ford, Lincoln and Mercury inventory) eligible to be used in the borrowing base calculation, less unpaid liens. As of
December 31, 2010
, we did not have any amounts outstanding and our available borrowings under the JPMorgan Used Vehicle Floor Plan Facility were limited to $37.1 million.
Any loan under the JPMorgan Used Vehicle Floor Plan Facility will bear interest at LIBOR, as adjusted for statutory reserve requirements for Eurocurrency liabilities, plus 2%. If there is a change in the law making it unlawful to make or maintain any loan under the JPMorgan Used Vehicle Floor Plan Facility, then any outstanding loan may be converted to a loan bearing interest at the Prime Rate in effect, plus 2%. Upon an event of default under the JPMorgan Used Vehicle Floor Plan Facility and in addition to exercising the remedies set out below, the lenders may request that we pay interest on the principal outstanding amount of all outstanding loans at the interest rate otherwise applicable to such loan, plus 2% per annum.
Under the terms of the JPMorgan Used Vehicle Floor Plan Facility, we have agreed not to encumber assets, subject to
76
certain exceptions (such as the security interest in new vehicle inventory financed using floor plan arrangements). In addition, the JPMorgan Used Vehicle Floor Plan Facility contains certain negative covenants, including covenants which could prohibit or restrict the payment of dividends, capital expenditures and the dispositions of assets, as well as other customary covenants and default provisions. We are also subject to financial covenants under the terms of the JPMorgan Used Vehicle Floor Plan Facility (refer to further discussion in Note 15 below under “Covenants”).
Under the terms of the JPMorgan Used Vehicle Floor Plan Facility, our ability to incur new indebtedness is currently limited to (i) permitted floorplan indebtedness, (ii) real estate loans in an aggregate amount not to exceed $30.0 million, (iii) certain refinancings, refunds, renewals or extensions of existing indebtedness and (iv) other customary permitted indebtedness. At our option and with 30 days’ written notice, the indebtedness limitation and total leverage ratio, as described below, may be reinstated to the original terms as set forth in the JPMorgan Used Vehicle Floor Plan Facility prior to the July 2009 amendment. We are also subject to financial covenants under the terms of the JPMorgan Used Vehicle Floor Plan Facility (refer to further discussion in Note 15 below under “Covenants”).
The JPMorgan Used Vehicle Floor Plan Facility contains events of default, including cross-defaults to other material indebtedness, change of control events and events of default customary for syndicated commercial credit facilities. Upon the occurrence of an event of default, JPMorgan, as the administrative agent, may (i) require us to immediately repay all outstanding amounts under the JPMorgan Used Vehicle Floor Plan Facility; (ii) terminate the commitment of each lender to make loans; and (iii) exercise on behalf of itself and the other lenders all rights and remedies available to it and the other lenders under the credit agreement.
14. ACCOUNTS PAYABLE AND ACCRUED LIABILITIES
Accounts payable and accrued liabilities consist of the following:
|
|
As of December 31,
|
||||||
|
|
2010
|
2009
|
|||||
|
|
(In millions)
|
||||||
|
Accounts payable
|
$
|
43.9
|
|
$
|
43.0
|
|
|
|
Loaner vehicle notes payable
|
37.6
|
|
28.0
|
|
|||
|
Accrued compensation
|
20.8
|
|
18.5
|
|
|||
|
Accrued insurance
|
14.0
|
|
12.7
|
|
|||
|
Taxes payable (non-income tax)
|
13.8
|
|
11.7
|
|
|||
|
Accrued finance and insurance chargebacks
|
7.6
|
|
8.1
|
|
|||
|
Accrued interest
|
7.4
|
|
9.5
|
|
|||
|
Other
|
25.0
|
|
16.7
|
|
|||
|
Accounts payable and accrued liabilities
|
$
|
170.1
|
|
$
|
148.2
|
|
|
Long-term debt consists of the following:
|
|
As of December 31,
|
||||||
|
2010
|
2009
|
||||||
|
(In millions)
|
|||||||
|
8.375% Senior Subordinated Notes due 2020
|
$
|
200.0
|
|
$
|
—
|
|
|
|
7.625% Senior Subordinated Notes due 2017
|
143.2
|
|
143.2
|
|
|||
|
8% Senior Subordinated Notes due 2014 ($179.4 million face value, net of hedging activity of $4.5 million
|
—
|
|
174.9
|
|
|||
|
3% Senior Subordinated Convertible Notes due 2012 ($29.5 million and $54.7 million face value, respectively, net of discounts of $1.7 million and $4.9 million, respectively)
|
27.8
|
|
49.8
|
|
|||
|
Mortgage notes payable bearing interest at fixed and variable rates (the weighted average interest rates were 3.6% and 3.7% for the years ended December 31, 2010 and 2009, respectively)
|
172.8
|
|
169.9
|
|
|||
|
543.8
|
|
537.8
|
|
||||
|
Less: current portion
|
(8.9
|
)
|
(9.0
|
)
|
|||
|
Long-term debt
|
$
|
534.9
|
|
$
|
528.8
|
|
|
77
The aggregate maturities of long-term debt as of
December 31, 2010
, are as follows (in millions) (a):
|
2011
|
$
|
8.9
|
|
|
2012
|
38.1
|
|
|
|
2013
|
105.5
|
|
|
|
2014
|
1.9
|
|
|
|
2015
|
17.9
|
|
|
|
Thereafter
|
373.2
|
|
|
|
$
|
545.5
|
|
|
_______________________________________
|
(a)
|
Maturities do not include the $1.7 million discount which reduces the book value of our 3% Convertible Notes. In addition, maturities do not include $5.2 million of mortgage notes payable classified as Liabilities Associated with Assets Held for Sale as of December 31, 2010 with principal payments due of $0.3 million, $0.3 million and $4.6 million in 2011, 2012 and 2013, respectively.
|
Our previous independent registered public accounting firm included an explanatory paragraph in its audit report for our 2008 financial statements that indicated there was uncertainty that we would remain in compliance with certain covenants in our debt agreements, and that this uncertainty raised substantial doubt about our ability to continue as a going concern. The inclusion of this explanatory paragraph in the 2008 audit report constituted a default under our BofA Revolving Credit Facility, our JPMorgan Used Vehicle Floor Plan Facility and our new vehicle floor plan facility with General Motors Acceptance Corporation. On March 12, 2009, we received waivers from all of our associated lending partners with respect to these defaults and, as a result, we were in compliance with the covenants contained in these borrowing facilities.
Long-Term Debt Refinancing and Amendments
In November 2010, we completed a refinancing of our long-term debt, which included the issuance of $200.0 million of 8.375% Notes, the proceeds of which were used to repurchase all of our outstanding $179.4 million aggregate principal amount 8% Senior Subordinated Notes due 2014 (the "8% Notes").
We recognized an $11.3 million loss in connection with our long-term debt refinancing, which is included in (Loss) Gain on Extinguishment of Long-Term Debt, net on the accompanying Consolidated Statements of Income (Loss) and consisted of (i) $5.2 million of premiums paid in conjunction with the repurchase and redemption of the 8% Notes, (ii) a $3.6 million write-off of hedging activity associated with the 8% Notes and (iii) a $2.5 million write-off of remaining unamortized debt issuance costs associated with the 8% Notes. We also incurred approximately $1.0 million of third-party expenses in connection with our long-term debt refinancing, which are included in Other Operating Expense (Income), net on the accompanying Consolidated Statements of Income (Loss).
In addition, we obtained the consent of holders of our 7.625% Notes, to amendments to the indenture governing the 7.625% Notes, primarily to increase our ability to make restricted payments, including the payment of dividends and repurchases of our common stock. In addition, we entered into amendments to our mortgage loan facility, revolving credit facility and our used vehicle facility that were similar to the amendments of our 7.625% Notes (the "Loan Amendments"). In addition, the Loan Amendments included modifications to the Permitted Real Estate Debt (as defined in each of these credit facilities) allowance during the Modified Covenant Period (as defined in each of these credit facilities) to increase the limit from $12.0 million to $30.0 million.
We received net proceeds of $196.0 million from the issuance of the 8.375% Notes. The costs related to the issuance of the 8.375% Notes were capitalized and are being amortized to other interest expense over the term of the 8.375% Notes.
Our 8.375% Notes are fully and unconditionally guaranteed, on a joint-and-several basis, by all of our current wholly-owned subsidiaries and will be so guaranteed by all of our future domestic subsidiaries that have outstanding, incur or guarantee any other indebtedness. Any subsidiary of the Company other than the subsidiary guarantors are immaterial. The terms of our 8.375% Notes, in certain circumstances, restrict our ability to, among other things, incur additional indebtedness, pay dividends, repurchase our common stock or merge or sell all or substantially all our assets.
Revolving Credit Facility
We have a revolving credit facility with Bank of America, N.A. ("Bank of America"), as administrative agent, and a
78
syndicate of commercial banks and commercial financing entities (the “BofA Revolving Credit Facility”). The BofA Revolving Credit Facility matures on August 15, 2012. Under the BofA Revolving Credit Facility, subject to a borrowing base, we may (i) borrow up to $150.0 million, which amount may be expanded to up to $200.0 million in total credit availability upon satisfaction of certain conditions; (ii) borrow up to $20.0 million from Bank of America under a swing line of credit; and (iii) request Bank of America to issue letters of credit on our behalf. Availability under the BofA Revolving Credit Facility is, in part, a function of our borrowing base. Availability is reduced on a dollar-for-dollar basis by the aggregate face amount of any outstanding letters of credit and swing line loans issued by Bank of America. Based on the borrowing base calculation and the $12.0 million of outstanding letters of credit as of
December 31, 2010
, our available borrowings were limited to $138.0 million as of December 31, 2010. As of
December 31, 2010
, we did not have any borrowings outstanding under the BofA Revolving Credit Facility.
Loans (including any swing line loans) under the BofA Revolving Credit Facility bear interest at a specified percentage above the LIBOR or Base Rate (as defined therein), at our option, according to a utilization rate-based pricing grid
The BofA Revolving Credit Facility contains certain negative covenants, including covenants which could prohibit or restrict the payment of dividends, equity and debt repurchases, capital expenditures and material dispositions of assets, as well as other customary covenants and default provisions. Under the terms of the BofA Revolving Credit Facility, our ability to incur new indebtedness is currently limited to (i) permitted floorplan indebtedness, (ii) real estate loans in an aggregate amount not to exceed $30.0 million, (iii) certain existing indebtedness, and certain refinancings, refunds, renewals or extensions of existing indebtedness and (iv) other customary permitted indebtedness. The BofA Revolving Credit Facility contains a fixed charge coverage ratio covenant of 1.20 to 1.00. At our option and with 30 days’ written notice, the indebtedness limitation, as described above, may be removed in conjunction with the reinstatement of a total leverage ratio. We were in compliance with all covenants as of December 31, 2010.
Under the terms of collateral documents entered into with the lenders under the BofA Revolving Credit Facility, the lenders have a security interest in certain of our personal property other than fixtures and certain other excluded property. Our subsidiaries also guarantee our obligations under the BofA Revolving Credit Facility.
Mortgage Notes Payable
We have a master loan agreement with Wells Fargo Bank, National Association, successor by merger to Wachovia Bank, National Association, a national banking association, and Wachovia Financial Services, Inc., a North Carolina corporation (together referred to as “Wachovia”, and the master loan agreement being referred to as the “Wachovia Master Loan Agreement”). Pursuant to the terms of the Wachovia Master Loan Agreement, Wachovia has extended credit to certain of our subsidiaries guaranteed by us through a series of related but separate loans (collectively, the “Wachovia Mortgages”) for certain properties located in Florida, North Carolina, Virginia, Georgia, Arkansas and Texas. Each of the Wachovia Mortgages is secured by the related underlying property and bears interest at 1-month LIBOR plus 2.95%. We are required to make monthly principal payments based on a straight-line twenty year amortization schedule, with balloon repayment of all outstanding principal amounts due in June 2013.
The Wachovia Master Loan Agreement also contains customary representations and warranties and the guarantees under such agreements contain negative covenants, including, among other things, covenants not to, with permitted exceptions, (i) incur any additional debt; (ii) create any additional liens on the Property (as defined in the Wachovia Master Loan Agreement); and (iii) enter into any sale-leaseback transactions in connection with the underlying properties. In November 2010, we amended the Wachovia Master Loan Agreement, modifying our then-existing permitted additional debt allowance to include (i) a mortgage associated with an acquisition that closed in December 2010 totaling $17.0 million and (ii) a one-time real estate loan in an amount not to exceed $30.0 million.
In October 2010 we refinanced two variable rate mortgage notes payable to Wells Fargo Bank, National Association, a national banking association ("Wells Fargo"). These two mortgage notes payable were combined into one mortgage note payable bearing interest at 1-month LIBOR plus 3.6% and the maturity was extended to October 2015.
In December 2010, in connection with the acquisition of five franchises (three dealership locations), we entered into a fixed rate mortgage note payable with a principal amount of $17.0 million. This is an interest only mortgage note payable bearing interest at 8.5%, with the full principal due upon maturity in December 2020.
Below is a summary of our outstanding mortgage notes payable, the carrying values of the related collateralized real estate, and years of maturity as of
December 31, 2010
and
2009
:
79
|
As of December 31, 2010
|
As of December 31, 2009
|
|||||||||||||||||||
|
Mortgage Agreement
|
Aggregate Principal Outstanding
|
Carrying Value of Collateralized Related Real Estate
|
Maturity Dates
|
Aggregate Principal Outstanding
|
Carrying Value of Collateralized Related Real Estate
|
Maturity Dates
|
||||||||||||||
|
Wachovia Master Loan Agreement (a)
|
$
|
122.2
|
|
$
|
197.5
|
|
2013
|
$
|
129.2
|
|
$
|
183.3
|
|
2013
|
||||||
|
Wells Fargo Mortgage(s)
|
22.3
|
|
34.9
|
|
2015
|
23.7
|
|
38.7
|
|
2011
|
||||||||||
|
Other mortgage debt
|
33.5
|
|
44.0
|
|
2018-2020
|
17.0
|
|
24.7
|
|
2018
|
||||||||||
|
Total
|
$
|
178.0
|
|
$
|
276.4
|
|
$
|
169.9
|
|
$
|
246.7
|
|
||||||||
_______________________________________
|
(a)
|
Aggregate principal outstanding and carrying value of real estate includes $5.2 million and $7.8 million, respectively, classified as Liabilities Associated with Assets Held for Sale and Assets Held for Sale, respectively, as of December 31, 2010.
|
Subordinated Note Repurchases
As of
December 31, 2010
, we had $372.7 million in aggregate principal amount of various series of our subordinated notes outstanding, including $200.0 million of 8.375% Notes,
$143.2 million
of 7.625% Notes and $29.5 million of 3% Convertible Notes. During the third quarter of 2010, we paid $24.4 million to repurchase $25.2 million of our 3% Convertible Notes.
We may from time to time repurchase various series of our subordinated notes in open market purchases or privately negotiated transactions. The decision to repurchase subordinated notes will be dependent upon prevailing market conditions, our liquidity position, and other factors. Currently, our BofA Revolving Credit Facility and our JPMorgan Used Vehicle Floor Plan Facility limit our ability to purchase our debt securities to $30.0 million per calendar year, plus 50% of the net proceeds from any asset sales during any given calendar year.
3% Senior Subordinated Convertible Notes due 2012
We had $29.5 million in aggregate principal amount of our 3% Convertible Notes outstanding as of
December 31, 2010
. If the 3% Convertible Notes are converted, we will pay cash for the principal amount of each Note and, if applicable, shares of our common stock. As of
December 31, 2010
, the conversion rate of our 3% Convertible Notes was equivalent to a per share stock price of $33.73. The conversion rate is subject to adjustment in some events, but is not adjusted for accrued interest.
Our 3% Convertible Notes are fully and unconditionally guaranteed, on a joint-and-several basis, by all of our current wholly-owned subsidiaries. We are a holding company that has no material independent assets or operations. Any subsidiary other than the subsidiary guarantors are immaterial.
In connection with the sale of our 3% Convertible Notes in March 2007, we entered into convertible note hedge and warrant transactions. The convertible note hedge and warrant transactions are separate contracts and are not part of the terms of the 3% Convertible Notes and, as such, they do not affect the holders’ rights under the 3% Convertible Notes. The convertible hedge and warrant transactions have the effect of increasing the conversion price of the 3% Convertible Notes to $44.74 per share. The convertible note hedge and warrant transactions are expected to offset the potential dilution upon conversion of the 3% Convertible Notes in the event that the market value per share of our common stock at the time of conversion is between $33.73 and $44.74.
7.625% Senior Subordinated Notes due 2017
We had
$143.2 million
in aggregate principal amount of our 7.625% Notes outstanding as of
December 31, 2010
. Our 7.625% Notes are fully and unconditionally guaranteed, on a joint-and-several basis, by all of our current wholly-owned subsidiaries and will be so guaranteed by all of our future domestic subsidiaries that have outstanding, incur or guarantee any other indebtedness. The terms of our 7.625% Notes, in certain circumstances, restrict our ability to, among other things, incur additional indebtedness, pay dividends, repurchase our common stock and merge or sell all or substantially all our assets.
Covenants
We are subject to a number of covenants in our various debt and lease agreements, including those described below. We
80
were in compliance with all of our covenants throughout
2010
. Failure to comply with any of our debt covenants would constitute a default under the relevant debt agreements, which would entitle the lenders under such agreements to terminate our ability to borrow under the relevant agreements and accelerate our obligations to repay outstanding borrowings, if any, unless compliance with the covenants is waived. In many cases, defaults under one of our agreements could trigger cross default provisions in our other agreements. If we are unable to remain in compliance with our financial or other covenants, we would be required to seek waivers or modifications of our covenants from our lenders, or we would need to raise debt and/or equity financing or sell assets to generate proceeds sufficient to repay such debt. We cannot give any assurance that we would be able to successfully take any of these actions on terms, or at times, that may be necessary or desirable.
Our BofA Revolving Credit Facility, JPMorgan Used Vehicle Floor Plan Facility and certain of our mortgages and/or guarantees related to such mortgages require compliance with certain financial covenants. In July 2009, we amended the BofA Revolving Credit Facility to, among other things, eliminate the total leverage ratio requirement and reduce the required fixed charge coverage ratio from 1.20 to 1.00 to 1.10 to 1.00 for each four fiscal quarter period ending on or before September 30, 2010. Beginning with the four fiscal quarter period ended
December 31, 2010
, our fixed charge coverage ratio requirement returned to 1.20 to 1.00 per the terms of the above-mentioned amendment. At our option and with 30 days' written notice, the $30.0 million indebtedness limitation, as described above, may be removed in conjunction with the reinstatement of the total leverage ratio to the terms as set forth in the BofA Revolving Credit Facility prior to the July 2009 amendment.
Our guarantees under the Wachovia Master Loan Agreement also require compliance with certain financial covenants. In May 2009, we amended the Wachovia Master Loan Agreement, which among other things, eliminated the requirement that we comply with a total leverage ratio, but imposed significant additional limitations on our ability to incur new indebtedness, primarily due to a limit on new real estate loans in an aggregate amount not to exceed $12.0 million. In November 2010, we amended the Wachovia Master Loan Agreement, which among other things, increased the limit on new real estate loans from $12.0 million to $30.0 million. At our option and with 30 days' written notice, the indebtedness limitation may be removed in conjunction with the reinstatement of the total leverage ratio to the terms as set forth in the Wachovia Master Loan Agreement prior to the May 2009 amendment.
Certain of our lease agreements also require compliance with various financial covenants and incorporate by reference the financial covenants set forth in the BofA Revolving Credit Facility. A breach of any of these covenants could immediately give rise to certain landlord remedies under our various lease agreements, the most severe of which include the following: (a) termination of the applicable lease and/or other leases with the same or an affiliated landlord under a cross-default provision, (b) eviction from the premises; and (c) the landlord would have a claim for any or all of the following: (i) damages suffered by landlord by reason of the default, equal to rent and other amounts payable by tenant under the lease prior to the default plus other fees and costs incurred by landlord; and (ii) additional damages, either payable monthly in an amount equal to the rent due under the lease less the amount of rent, if any, received by the landlord from a substitute tenant, or payable in a lump sum equal to the present value of the sum of the amount by which all remaining sums due under the lease exceeds the fair market rental value of the premises for the same period, plus landlord’s expense and value of all vacancy periods projected by landlord to be incurred in connection with reletting the premises.
16. FINANCIAL INSTRUMENTS AND FAIR VALUE
Financial instruments consist primarily of cash, contracts-in-transit, accounts receivable, notes receivable, cash surrender value of corporate-owned life insurance policies, accounts payable, floor plan notes payable, long-term debt and interest rate swap agreements. The carrying amounts of our financial instruments, with the exception of long-term debt, approximate fair value due either to their short-term nature or existence of variable interest rates, which approximate market rates. The fair market value of our long-term debt is based on reported market prices. A summary of the carrying values and fair values of our 8.375% Notes, 8% Notes, 7.625% Notes and our 3% Convertible Notes are as follows:
81
|
|
As of
|
||||||
|
|
December 31, 2010
|
December 31, 2009
|
|||||
|
|
(In millions)
|
||||||
|
Carrying Value:
|
|||||||
|
8.375% Senior Subordinated Notes due 2020
|
$
|
200.0
|
|
$
|
—
|
|
|
|
8% Senior Subordinated Notes due 2014 ($179.4 million face value, net of hedging activity of $4.5 million)
|
—
|
|
174.9
|
|
|||
|
7.625% Senior Subordinated Notes due 2017
|
143.2
|
|
143.2
|
|
|||
|
3% Senior Subordinated Convertible Notes Due 2012 ($29.5 million and $54.7 million face value, respectively, net of discounts of $1.7 million and $4.9 million, respectively)
|
27.8
|
|
49.8
|
|
|||
|
Total carrying value
|
$
|
371.0
|
|
$
|
367.9
|
|
|
|
Fair Value:
|
|||||||
|
8.375% Senior Subordinated Notes due 2020
|
$
|
205.8
|
|
$
|
—
|
|
|
|
8% Senior Subordinated Notes due 2014
|
—
|
|
178.7
|
|
|||
|
7.625% Senior Subordinated Notes due 2017
|
144.1
|
|
135.0
|
|
|||
|
3% Senior Subordinated Convertible Notes due 2012
|
29.0
|
|
48.0
|
|
|||
|
Total fair value
|
$
|
378.9
|
|
$
|
361.7
|
|
|
In December 2010, we entered into an interest rate swap agreement with a notional principal amount of $
10.8
million. This swap was designed to provide a hedge against changes in variable rate cash flows through maturity in June 2011. The notional value of this swap is reduced over its term until July 2011 when the notional principal amount increases to $21.5 million and then begins to reduce over the remaining term to $16.1 million at maturity. This interest rate swap qualifies for cash flow hedge accounting treatment and will not contain any ineffectiveness.
We have an interest rate swap with a current notional principal amount of
$125.0 million
. The swap was designed to provide a hedge against changes in variable rate cash flows through maturity in June 2013. This swap is collateralized by Company assets upon which we have not otherwise granted a first priority lien. This interest rate swap qualifies for cash flow hedge accounting treatment and will contain minor ineffectiveness.
We have a separate interest rate swap with a current notional principal amount of
$11.6
million. The swap was designed to provide a hedge against changes in variable rate cash flows through maturity in June 2011. The notional value of this swap is reduced over its term to $11.3 million at maturity. This interest rate swap qualifies for cash flow hedge accounting treatment and will contain minor ineffectiveness.
|
For the Year Ended December 31,
|
Derivative in Cash Flow Hedging relationships
|
Effective Results
Recognized
in AOCI
(Effective
Portion)
|
Location of Results
Reclassified from
AOCI to Earnings
|
Amount Reclassified from AOCI to Earnings–Active Swaps
|
Amount Reclassified from AOCI to Earnings–Terminated Swaps
|
Ineffective Results Recognized in Earnings
|
Location of
Ineffective Results
|
|||||||||||||||
|
2010
|
Interest rate swaps
|
$
|
(5.9
|
)
|
Swap interest expense
|
$
|
(5.3
|
)
|
$
|
(0.3
|
)
|
$
|
—
|
|
N/A
|
|||||||
|
2009
|
Interest rate swaps
|
$
|
(5.6
|
)
|
Swap interest expense
|
$
|
(5.1
|
)
|
$
|
(0.4
|
)
|
$
|
—
|
|
N/A
|
|||||||
|
2008
|
Interest rate swaps
|
$
|
(5.7
|
)
|
Swap interest expense
|
$
|
(2.3
|
)
|
$
|
(0.4
|
)
|
$
|
—
|
|
N/A
|
|||||||
On the basis of yield curve conditions as of December 31, 2010, we anticipate that the amount expected to be reclassified out
82
of Accumulated Other Comprehensive Income (“AOCI”) into earnings in the next 12 calendar months will be a loss of $5.0 million. However, this anticipated $5.0 million loss relates to hedging activity that fixes the interest rates on only 24% of our variable rate debt, including floor plan notes payable and, therefore, if the current low interest rate environment continues, we believe we would experience a benefit from such interest rates on 76% of our variable rate debt.
Fair value estimates reflect making a credit adjustment to the discount rate applied to all expected cash flows under the swap. Other than that assumption, all other inputs reflect level 2 inputs.
Market Risk Disclosures as of
December 31, 2010
:
Instruments entered into for trading purposes—None
Instruments entered into for hedging purposes (in millions)—
|
Type of Derivative
|
Notional Size
|
Underlying Rate
|
Expiration
|
Fair Value
|
||||||||
|
Interest Rate Swap*
|
$
|
147.3
|
|
1 month LIBOR
|
2011 - 2013
|
$
|
(9.2
|
)
|
||||
____________________________
* The total fair value of our swaps is $9.2 million of which $5.0 million is included in Accounts Payable and Accrued Liabilities, $4.7 million is included in Other Long-Term Liabilities and $0.5 million is included in Other Long-Term Assets on the accompanying Consolidated Balance Sheet, respectively.
Market Risk Disclosures as of
December 31, 2009
:
Instruments entered into for trading purposes—None
Instruments entered into for hedging purposes (in millions)—
|
Type of Derivative
|
Notional Size
|
Expiration
|
Fair Value
|
|||||||
|
Interest Rate Swap*
|
$
|
137.2
|
|
2011 - 2013
|
$
|
(8.4
|
)
|
|||
____________________________
* The total fair value of our swaps is $8.4 million of which $0.3 million is included in Accounts Payable and Accrued Liabilities and $8.1 million is included in Other Long-Term Liabilities on the accompanying Consolidated Balance Sheet, respectively.
In determining fair value, we use various valuation approaches, including market, income and/or cost approaches. Accounting standards establish a hierarchy for inputs used in measuring fair value that maximizes the use of observable inputs and minimizes the use of unobservable inputs by requiring that the most observable inputs be used when available. Observable inputs are inputs that market participants would use in pricing the asset or liability developed based on market data obtained from independent sources. Unobservable inputs are inputs that reflect our assumptions about the assumptions market participants would use in pricing the asset or liability developed based on the best information available in the circumstances. The hierarchy is broken down into three levels based on the reliability of inputs as follows:
Level 1—Valuations based on quoted prices in active markets for identical assets or liabilities that we have the ability to access. Assets utilizing Level 1 inputs include exchange-traded equity securities that are actively traded.
Level 2—Valuations based on quoted prices in markets that are not active or for which all significant inputs are observable, either directly or indirectly. Assets and liabilities utilizing Level 2 inputs include fair value and cash flow swap instruments.
Level 3—Valuations based on inputs that are unobservable and significant to the overall fair value measurement. Asset and liability measurements utilizing Level 3 inputs include those used in estimating fair value of non-financial assets and non-financial liabilities in purchase acquisitions, those used in assessing impairment and those used in the reporting unit valuation in the first step of the annual goodwill impairment evaluation.
The availability of observable inputs can vary and is affected by a wide variety of factors. To the extent that valuation is based on models or inputs that are less observable or unobservable in the market, the determination of fair value requires more judgment. Accordingly, the degree of judgment required to determine fair value is greatest for instruments categorized in Level 3. In certain cases, the inputs used to measure fair value may fall into different levels of the fair value hierarchy. In such cases, for disclosure purposes, the level in the fair value hierarchy within which the fair value measurement is disclosed is determined
83
based on the lowest level input that is significant to the fair value measurement.
Fair value is a market-based measure considered from the perspective of a market participant who holds the asset or owes the liability rather than an entity-specific measure. Therefore, even when market assumptions are not readily available, our assumptions are set to reflect those that market participants would use in pricing the asset or liability at the measurement date. We use inputs that are current as of the measurement date, including during periods when the market may be abnormally high or abnormally low.
Valuation Techniques
The fair value of cash flow swaps is calculated as the present value of expected future cash flows, determined on the basis of forward interest rates and present value factors. As such, the carrying amounts for these swaps are designated to be level 2 fair values and totaled $9.5 million and $8.4 million as of
December 31, 2010
and
2009
, respectively. The carrying value of these swaps is included in Other Long-Term Assets, Other Long-Term Liabilities and Other Current Liabilities on the accompanying Consolidated Balance Sheet as of
December 31, 2010
.
The fair value of assets held for sale used to determine the impairment expense we incurred in the fourth quarters of
2010
and 2009 were determined with the assistance of third-party desktop appraisals and real estate brokers and are designated to be level 3 fair values.
Other Financial Instruments
In connection with the sale of our 3% Convertible Notes in March 2007, we entered into convertible note hedge and warrant transactions. The convertible note hedge and warrant transactions are separate contracts and are not part of the terms of the 3% Convertible Notes and, as such, they do not affect the holders’ rights under the 3% Convertible Notes. The convertible hedge and warrant transactions have the effect of increasing the conversion price of the 3% Convertible Notes to $44.74 per share. The convertible note hedge and warrant transactions are expected to offset the potential dilution upon conversion of the 3% Convertible Notes in the event that the market value per share of our common stock at the time of conversion is between $33.73 and $44.74.
The convertible note hedge transactions represent purchase options of our common stock. At the issuance, there were 3.4 million shares of our common stock underlying the convertible note hedge transactions, with 4.1 million shares representing the maximum number of shares that we could receive thereunder. The initial exercise price of the convertible note hedge contracts was $33.99. The exercise price is subject to certain adjustments which mirror the adjustments to the conversion price of the 3% Notes (including for subsequent changes in our dividend). A portion of the options will be exercised upon the conversion of our 3% Notes and each such exercise will be settled in shares of our common stock. The convertible note hedge transactions will expire on the earlier of (i) the last day on which any convertible notes remain outstanding and (ii) the third scheduled trading day immediately preceding September 15, 2012. In connection with the repurchase of 3% Notes a portion of the convertible note hedges was terminated. As of December 31, 2010, there were 2.2 million shares representing the maximum number of shares that we could receive under the convertible note hedge transactions.
The warrant transactions represent net call options. On exercise of the warrants, we are obligated to deliver a number of shares of our common stock in an amount based on the excess of the market value per share of our common stock over the strike price of the warrants. At issuance, there were 3.4 million shares of our common stock underlying the warrant transactions, with 6.8 million shares representing the maximum number of shares of our common stock required to be issued. The warrant transactions expire at various dates from December 14, 2012 through April 11, 2013. As of December 31, 2010, there were 4.9 million shares representing the maximum number of shares that we could receive under the warrant transactions.
17. INCOME TAXES
The components of income tax expense (benefit) from continuing operations are as follows:
84
|
|
For the Years Ended December 31,
|
||||||||||
|
|
2010
|
2009
|
2008
|
||||||||
|
|
(In millions)
|
||||||||||
|
Current:
|
|||||||||||
|
Federal
|
$
|
6.0
|
|
$
|
1.4
|
|
$
|
18.1
|
|
||
|
State
|
1.9
|
|
(1.2
|
)
|
0.6
|
|
|||||
|
Subtotal
|
7.9
|
|
0.2
|
|
18.7
|
|
|||||
|
Deferred:
|
|||||||||||
|
Federal
|
14.1
|
|
12.2
|
|
(128.7
|
)
|
|||||
|
State
|
1.2
|
|
2.7
|
|
(26.2
|
)
|
|||||
|
Subtotal
|
15.3
|
|
14.9
|
|
(154.9
|
)
|
|||||
|
Total
|
$
|
23.2
|
|
$
|
15.1
|
|
$
|
(136.2
|
)
|
||
A reconciliation of the statutory federal rate to the effective tax rate from continuing operations is as follows:
|
|
For the Years Ended December 31,
|
||||||||||
|
|
2010
|
2009
|
2008
|
||||||||
|
|
(In millions)
|
||||||||||
|
Provision at the statutory rate
|
$
|
21.2
|
|
$
|
14.1
|
|
$
|
(162.1
|
)
|
||
|
Increase (decrease) resulting from:
|
|||||||||||
|
State income tax expense (benefit) , net
|
2.0
|
|
1.3
|
|
(14.5
|
)
|
|||||
|
Book goodwill in excess of tax goodwill associated with impairment expense and divestitures
|
—
|
|
—
|
|
41.1
|
|
|||||
|
(Gain) loss on corporate owned life insurance policies
|
(0.2
|
)
|
(0.4
|
)
|
1.1
|
|
|||||
|
Tax credits received
|
(0.1
|
)
|
(0.1
|
)
|
(0.2
|
)
|
|||||
|
Release of valuation allowance
|
—
|
|
—
|
|
(1.1
|
)
|
|||||
|
Other
|
0.3
|
|
0.2
|
|
(0.5
|
)
|
|||||
|
Provision for income taxes
|
$
|
23.2
|
|
$
|
15.1
|
|
$
|
(136.2
|
)
|
||
The tax effects of temporary differences representing deferred tax assets (liabilities) result principally from the following:
85
|
|
December 31,
|
||||||
|
|
2010
|
2009
|
|||||
|
|
(In millions)
|
||||||
|
Reserves and accruals
|
$
|
20.5
|
|
$
|
18.9
|
|
|
|
Net operating loss (“NOL”) carryforwards
|
4.5
|
|
3.6
|
|
|||
|
Goodwill amortization
|
51.4
|
|
67.9
|
|
|||
|
Depreciation
|
(12.1
|
)
|
(2.1
|
)
|
|||
|
Interest Rate Swaps
|
3.8
|
|
3.6
|
|
|||
|
Other
|
1.0
|
|
1.1
|
|
|||
|
Net deferred tax asset
|
$
|
69.1
|
|
$
|
93.0
|
|
|
|
|
December 31,
|
||||||
|
|
2010
|
2009
|
|||||
|
|
(In millions)
|
||||||
|
Balance sheet classification:
|
|||||||
|
Deferred tax assets:
|
|||||||
|
Current
|
$
|
8.6
|
|
$
|
9.8
|
|
|
|
Long-term
|
87.7
|
|
98.6
|
|
|||
|
Deferred tax liabilities:
|
|||||||
|
Current
|
(1.0
|
)
|
(1.2
|
)
|
|||
|
Long-term
|
(26.2
|
)
|
(14.2
|
)
|
|||
|
Net deferred tax asset
|
$
|
69.1
|
|
$
|
93.0
|
|
|
As of
December 31, 2010
, our net operating losses were set to expire between 2011 and 2030.
As of
December 31, 2010
, the net amount of our unrecognized tax benefits was $1.0 million, all of which, if recognized, would affect our effective tax rate. A reconciliation of the beginning and ending amount of gross unrecognized tax benefits is as follows:
|
Gross Liability for
Unrecognized Tax
Benefits
|
|||
|
In Millions
|
|||
|
Balance at January 1, 2008
|
4.8
|
|
|
|
Additions for Tax Positions of Current Year
|
0.1
|
|
|
|
Additions for Tax Positions of Prior Year
|
1.6
|
|
|
|
Reduction for Tax Positions of Prior Years
|
(0.7
|
)
|
|
|
Reduction for Lapse of Statute of Limitations
|
(1.2
|
)
|
|
|
Balance at Decemeber 31, 2008
|
$
|
4.6
|
|
|
Additions for Tax Positions of Current Year
|
0.3
|
|
|
|
Additions for Tax Positions of Prior Year
|
0.1
|
|
|
|
Reduction for Tax Positions of Prior Years
|
(0.4
|
)
|
|
|
Reduction for Lapse of Statute of Limitations
|
(1.2
|
)
|
|
|
Effective Settlements
|
(1.9
|
)
|
|
|
Balance at December 31, 2009
|
1.5
|
|
|
|
Reduction for Lapse of Statute of Limitations
|
(0.3
|
)
|
|
|
Balance at December 31, 2010
|
$
|
1.2
|
|
We recognize interest and penalties related to unrecognized tax benefits in income tax expense. Included in the liability for unrecognized tax benefits was accrued interest of $0.2 million and no amount for penalties, as of
December 31, 2010
.
The statute of limitations related to the consolidated Federal income tax return is closed for all tax years up to and including
86
2005. In addition, the IRS has conducted and closed a Joint Committee Audit for the consolidated Federal consolidated tax returns for the 2004 and 2005 tax years.
The expiration of the statute of limitations related to the various state income tax returns that we and our subsidiaries file varies by state. The 2007 through 2009 tax years generally remain subject to examination by most state tax authorities. We do not anticipate any material changes related to unrecognized tax benefits, individually or in the aggregate, to occur within the next twelve months.
18. OTHER LONG-TERM LIABILITIES
Other long-term liabilities consist of the following:
|
|
As of December 31,
|
||||||
|
|
2010
|
2009
|
|||||
|
|
(In millions)
|
||||||
|
Deferred compensation liability
|
$
|
8.2
|
|
$
|
7.6
|
|
|
|
Deferred rent
|
7.7
|
|
6.3
|
|
|||
|
Interest rate swap liabilities
|
4.7
|
|
8.1
|
|
|||
|
Accrued finance and insurance chargebacks
|
4.9
|
|
5.2
|
|
|||
|
Other
|
3.0
|
|
2.5
|
|
|||
|
Other long-term liabilities
|
$
|
28.5
|
|
$
|
29.7
|
|
|
19. DISCONTINUED OPERATIONS AND DIVESTITURES
During the year ended
December 31, 2010
, we sold one franchise (one dealership location). As of
December 31, 2010
, there were eleven franchises (four dealership locations) pending disposition, of which ten franchises (three dealership locations) were associated with our heavy truck business. The accompanying Consolidated Statements of Income (Loss) for the years ended
December 31, 2009
and
2008
, have been reclassified to reflect the status of our discontinued operations as of
December 31, 2010
.
The following table provides further information regarding our discontinued operations as of
December 31, 2010
, and includes the results of businesses sold prior to
December 31, 2010
:
87
|
For the Year Ended
|
For the Year Ended
|
For the Year Ended
|
|||||||||||||||||||||||||||||||||
|
|
December 31, 2010
|
December 31, 2009
|
December 31, 2008
|
||||||||||||||||||||||||||||||||
|
|
Sold/
Closed
|
Pending
Disposition
|
Total
|
Sold/
Closed(a)
|
Pending
Disposition(b)
|
Total
|
Sold/
Closed(c)
|
Pending
Disposition(b)
|
Total
|
||||||||||||||||||||||||||
|
|
(Dollars in millions)
|
||||||||||||||||||||||||||||||||||
|
Franchises:
|
|||||||||||||||||||||||||||||||||||
|
Mid-line domestic
|
—
|
|
—
|
|
—
|
|
7
|
|
—
|
|
7
|
|
15
|
|
—
|
|
15
|
|
|||||||||||||||||
|
Mid-line import
|
1
|
|
—
|
|
1
|
|
2
|
|
—
|
|
2
|
|
4
|
|
—
|
|
4
|
|
|||||||||||||||||
|
Heavy Trucks
|
—
|
|
10
|
|
10
|
|
—
|
|
10
|
|
10
|
|
—
|
|
10
|
|
10
|
|
|||||||||||||||||
|
Luxury
|
—
|
|
1
|
|
1
|
|
2
|
|
1
|
|
3
|
|
4
|
|
1
|
|
5
|
|
|||||||||||||||||
|
Total
|
1
|
|
11
|
|
12
|
|
11
|
|
11
|
|
22
|
|
23
|
|
11
|
|
34
|
|
|||||||||||||||||
|
Revenues
|
$
|
8.8
|
|
$
|
277.3
|
|
$
|
286.1
|
|
$
|
133.0
|
|
$
|
258.4
|
|
$
|
391.4
|
|
$
|
364.0
|
|
$
|
324.8
|
|
$
|
688.8
|
|
||||||||
|
Cost of sales
|
7.4
|
|
241.1
|
|
248.5
|
|
110.9
|
|
231.1
|
|
342.0
|
|
304.4
|
|
285.2
|
|
589.6
|
|
|||||||||||||||||
|
Gross profit
|
1.4
|
|
36.2
|
|
37.6
|
|
22.1
|
|
27.3
|
|
49.4
|
|
59.6
|
|
39.6
|
|
99.2
|
|
|||||||||||||||||
|
Operating expenses
|
3.7
|
|
28.8
|
|
32.5
|
|
36.9
|
|
27.3
|
|
64.2
|
|
64.2
|
|
31.4
|
|
95.6
|
|
|||||||||||||||||
|
Impairment expenses
|
2.1
|
|
—
|
|
2.1
|
|
4.8
|
|
—
|
|
4.8
|
|
22.2
|
|
—
|
|
22.2
|
|
|||||||||||||||||
|
Income (loss) from operations
|
(4.4
|
)
|
7.4
|
|
3.0
|
|
(19.6
|
)
|
—
|
|
(19.6
|
)
|
(26.8
|
)
|
8.2
|
|
(18.6
|
)
|
|||||||||||||||||
|
Other income (expense), net
|
0.1
|
|
(1.5
|
)
|
(1.4
|
)
|
(0.8
|
)
|
(2.3
|
)
|
(3.1
|
)
|
(3.5
|
)
|
(2.8
|
)
|
(6.3
|
)
|
|||||||||||||||||
|
Gain/(loss) on disposition
|
(0.2
|
)
|
—
|
|
(0.2
|
)
|
3.8
|
|
—
|
|
3.8
|
|
(0.5
|
)
|
—
|
|
(0.5
|
)
|
|||||||||||||||||
|
Income (loss) before income taxes
|
(4.5
|
)
|
5.9
|
|
1.4
|
|
(16.6
|
)
|
(2.3
|
)
|
(18.9
|
)
|
(30.8
|
)
|
5.4
|
|
(25.4
|
)
|
|||||||||||||||||
|
Income tax benefit (expense)
|
1.8
|
|
(2.4
|
)
|
(0.6
|
)
|
6.3
|
|
0.8
|
|
7.1
|
|
10.5
|
|
(1.8
|
)
|
8.7
|
|
|||||||||||||||||
|
Discontinued operations, net of tax
|
$
|
(2.7
|
)
|
$
|
3.5
|
|
$
|
0.8
|
|
$
|
(10.3
|
)
|
$
|
(1.5
|
)
|
$
|
(11.8
|
)
|
$
|
(20.3
|
)
|
$
|
3.6
|
|
$
|
(16.7
|
)
|
||||||||
____________________________
|
(a)
|
Franchises were sold between January 1, 2009 and
December 31, 2010
|
|
(b)
|
Franchises placed into discontinued operations in
2010
and pending dispositions as of
December 31, 2010
|
|
(c)
|
Franchises were sold between January 1, 2008 and
December 31, 2010
|
In April 2010, a tornado severely damaged one of our former dealership buildings in Yazoo City, Mississippi with a book
value of $1.5 million. We estimated that the tornado caused approximately $0.8 million of damage. The building was insured
for replacement cost as part of our property insurance policy and, as a result, we received insurance proceeds totaling $4.9
million, which is included in Other Investing Activities in the accompanying Consolidated Statement of Cash Flows for the year ended December 31, 2010. Since the dealership was not being used in our operations, we do not plan to replace the building. Therefore, we recorded the $4.9 million of proceeds, net of the $0.8 million cost of the building damage, as a gain in Discontinued Operations, net in the third quarter of 2010.
20. SUPPLEMENTAL CASH FLOW INFORMATION
During the years ended
December 31, 2010
,
2009
and
2008
, we made interest payments, including amounts capitalized, totaling $52.1 million, $55.2 million and $71.2 million, respectively. Included in these interest payments are $10.9 million, $11.7 million and $12.5 million of floor plan interest payments for the years ended December 31, 2010, 2009 and 2008, respectively.
During the years ended
December 31, 2010
and
2009
, we received income tax refunds, net of payments made, of $1.7 million and $3.9 million, respectively. During the year ended
December 31, 2008
, we made income tax payments, net of refunds received, totaling $8.8 million.
88
In the fourth quarter of 2010, we acquired nine franchises (four dealership locations) for an aggregate purchase price of $77.5 million, which was financed with (i) $46.6 million of cash, (ii) $13.9 million of floor plan borrowings for the purchase of the related new vehicle inventory and (iii) $17.0 million of a seller financed mortgage note payable for the purchase of land and buildings associated with five of those franchises (three dealership locations). The $17.0 million of seller financed mortgage note payable is a non-cash transaction and therefore is not included in the accompanying Consolidated Statement of Cash Flows for the year ended December 31, 2010.
The following items are included in Other Adjustments to reconcile net income (loss) to cash flow from operating activities:
|
|
For the Years Ended December 31,
|
||||||||||
|
|
2010
|
2009
|
2008
|
||||||||
|
Accelerated rent expense associated with abandoned rental properties
|
$
|
0.4
|
|
$
|
4.0
|
|
$
|
—
|
|
||
|
Amortization of deferred financing fees
|
2.5
|
|
2.8
|
|
2.4
|
|
|||||
|
Convertible debt discount amortization
|
1.4
|
|
1.8
|
|
3.0
|
|
|||||
|
Depreciation and amortization from discontinued operations
|
1.2
|
|
2.5
|
|
3.2
|
|
|||||
|
Deferred compensation expense (income)
|
0.9
|
|
1.4
|
|
(2.9
|
)
|
|||||
|
(Gain) loss on sale of assets
|
(0.3
|
)
|
(2.9
|
)
|
1.2
|
|
|||||
|
Gain on insurance proceeds
|
(4.3
|
)
|
—
|
|
—
|
|
|||||
|
Unrealized (gain) loss on deferred compensation investments
|
(0.5
|
)
|
(1.1
|
)
|
3.2
|
|
|||||
|
Other individually immaterial items
|
2.5
|
|
1.9
|
|
3.3
|
|
|||||
|
Other adjustments, net
|
$
|
3.8
|
|
$
|
10.4
|
|
$
|
13.4
|
|
||
21. LEASE OBLIGATIONS
We lease various facilities, real estate and equipment primarily under operating lease agreements, most of which have remaining terms from one to twenty years. Certain of our leases contain renewal options and rent escalation clauses. We record rent expense on a straight-line basis over the life of the lease for lease agreements where the rent escalates at fixed rates over time. Rent expense from continuing operations totaled $42.2 million, $39.3 million and $44.2 million for the years ended
December 31, 2010
,
2009
and
2008
, respectively. As of
December 31, 2010
, we had no material capital lease obligations.
Future minimum payments under long-term, non-cancelable operating leases as of
December 31, 2010
, are as follows:
|
|
Total
|
||
|
|
(In millions)
|
||
|
2011
|
$
|
44.6
|
|
|
2012
|
42.3
|
|
|
|
2013
|
39.0
|
|
|
|
2014
|
32.9
|
|
|
|
2015
|
30.4
|
|
|
|
Thereafter
|
140.8
|
|
|
|
Total minimum lease payments
|
$
|
330.0
|
|
Certain of our lease agreements include financial covenants and incorporate by reference the financial covenants set forth in the BofA Revolving Credit Facility. A breach of any of these covenants could immediately give rise to certain landlord remedies under our various lease agreements, the most severe of which include the following: (a) termination of the applicable lease and/or other leases with the same or an affiliated landlord under a cross-default provision, (b) eviction from the premises; and (c) the landlord would have a claim for any or all of the following: (i) damages suffered by landlord by reason of the default, equal to rent and other amounts payable by tenant under the lease prior to the default plus other fees and costs incurred by landlord; and (ii) additional damages, either payable monthly in an amount equal to the rent due under the lease less the amount of rent, if any, received by landlord from a substitute tenant, or payable in a lump sum equal to the present value of the sum of the amount by which all remaining sums due under the lease exceeds the fair market rental value of the premises for the same period, plus landlord’s expense and value of all vacancy periods projected by landlord to be incurred in connection with reletting the premises.
89
22. COMMITMENTS AND CONTINGENCIES
A significant portion of our business involves the sale of vehicles, parts or vehicles composed of parts that are manufactured outside the United States of America. As a result, our operations are subject to customary risks of importing merchandise, including fluctuations in the relative values of currencies, import duties, exchange controls, trade restrictions, work stoppages and general political and socio-economic conditions in foreign countries. The United States of America or the countries from which our products are imported may, from time to time, impose new quotas, duties, tariffs or other restrictions, or adjust presently prevailing quotas, duties or tariffs, which may affect our operations and our ability to purchase imported vehicles and/or parts at reasonable prices.
In some instances, manufacturers may have the right, and may direct us to implement costly capital improvements to dealerships as a condition upon entering into franchise agreements with them. Manufacturers also typically require that their franchises meet specific standards of appearance. These factors, either alone or in combination, could cause us to use our financial resources on capital projects that we might not have planned for or otherwise determined to undertake.
Our dealerships are party to dealer and framework agreements with the applicable vehicle manufacturer. In accordance with these agreements, each dealership is subject to certain rights and restrictions typical of the industry. The ability of the manufacturers to influence the operations of the dealerships or the loss of any of these agreements could have a negative impact on our operating results.
Substantially all of our facilities are subject to federal, state and local provisions regarding the discharge of materials into the environment. Compliance with these provisions has not had, nor do we expect such compliance to have, any material effect upon our capital expenditures, net earnings, financial condition, liquidity or competitive position. We believe that our current practices and procedures for the control and disposition of such materials comply with applicable federal, state and local requirements. No assurances can be provided, however, that future laws or regulations, or changes in existing laws or regulations, would not require us to expend significant resources in order to comply therewith.
From time to time, we and our dealerships may become involved in various claims relating to, and arising out of our business and our operations. These claims may involve, but are not limited to, financial and other audits by vehicle manufacturers, lenders and certain federal, state and local government authorities, which relate primarily to (a) incentive and warranty payments received from vehicle manufacturers, (b) compliance with lender rules and covenants and (c) payments made to government authorities relating to federal, state and local taxes, as well as compliance with other government regulations. Claims may also arise through litigation, government proceedings and other dispute resolution processes. Such claims, including class actions, can relate to, but are not limited to, the practice of charging administrative fees, employment-related matters, truth-in-lending practices, contractual disputes, actions brought by governmental authorities and other matters. We evaluate pending and threatened claims and establish loss contingency reserves based upon outcomes we currently believe to be probable and reasonably estimable.
We currently do not anticipate that any known claim will materially adversely affect our financial condition, liquidity, results of operations or financial statement disclosures. However, the outcome of any known matter cannot be predicted with certainty, and an unfavorable resolution of one or more matters presently known or arising in the future could have a material adverse effect on our financial condition, liquidity, results of operations or financial statement disclosures.
We have $12.0 million of letters of credit outstanding as of
December 31, 2010
, which are required by certain of our insurance providers. In addition, as of
December 31, 2010
, we maintain a $5.0 million surety bond line which we use in our ordinary course of business.
Other material commitments include (i) floor plan notes payable, (ii) operating leases, (iii) long-term debt and (iv) interest on long-term debt, as described elsewhere herein.
23. RELATED PARTY TRANSACTIONS
During the years ended December 31, 2010, 2009 and 2008, we were party to certain agreements with a member of our board of directors, who was a former member of management. These transactions primarily involved long-term operating leases of dealership facilities. We believe that these transactions were on terms comparable to those that could be obtained from unaffiliated third parties. For the years ended
December 31, 2010
,
2009
and
2008
, we made rental payments totaling $3.7 million, $3.3 million and $3.5 million, respectively, to this director or entities controlled by this director.
24. SHARE-BASED COMPENSATION AND EMPLOYEE BENEFIT PLANS
We have established two share-based compensation plans (the “Plans”) under which we have granted non-qualified stock
90
options, performance share units, restricted share units and shares of restricted stock to our directors, officers and employees at fair market value on the date of the grant. Stock options generally vest ratably over three years from the date of grant and expire ten years from the date of grant. Performance share units vest after three years or ratably over three years from the date of grant. The actual number of shares earned by a holder of performance share units may range from 0% to 180% of the target number of shares to be granted to the holder, depending on the achievement of certain performance criteria over a defined period of time. Restricted share units vest ratably over a three year period from the date of grant. Restricted stock vests either ratably over three years or after three years from the date of grant and provides the holder voting and dividend rights prior to vesting. We have granted a total of 5.8 million non-qualified stock options, 1.1 million performance share units, 0.7 million shares of restricted stock and $0.1 million of restricted share units. In addition, there were approximately 2.7 million share-based awards available for grant under our share-based compensation plans as of
December 31, 2010
.
We issue new shares of our common stock upon the exercise of stock options or vesting of performance share units, restricted stock or restricted share units. In addition, in connection with the vesting of performance share units, restricted stock or restricted share units, we expect to repurchase a portion of the shares issued equal to the amount of employee income tax withholding.
The fair value of each option award was estimated on the date of grant using the Black Scholes option valuation model. The fair value of each performance share unit and restricted stock was calculated using the closing market price of our common stock on the date of grant. Expected volatilities are based on the historical volatility of our common stock. We use historical data to estimate the rate of option exercises and employee turnover within the valuation model. The expected term of options granted represents the period of time that the related options are expected to be outstanding. The risk-free rate for periods within the contractual life of the option is based on the U.S. Treasury yield curve in effect at the time of grant.
The table below summarizes the assumptions used relating to the valuation of our stock options during
2009
and
2008
. We did not grant any stock options during 2010.
|
|
2009
|
2008
|
|||
|
Risk-free interest rate
|
1.61%-2.35%
|
2
|
%
|
||
|
Expected term
|
4-6 years
|
4 years
|
|||
|
Expected volatility
|
64% - 75%
|
64
|
%
|
||
|
Expected dividends
|
-
|
-
|
|||
We have recognized $5.1 million ($2.0 million tax benefit), $2.8 million ($1.1 million tax benefit) and $1.9 million ($0.7 million tax benefit) in stock-based compensation expense for the years ended
December 31, 2010
,
2009
and
2008
, respectively. As of
December 31, 2010
, there was $6.4 million of total unrecognized share-based compensation expense related to non-vested share-based awards granted under the Plans. We expect to recognize $3.6 million of stock-based compensation expense in 2011, $2.1 million in 2012 and a total of $0.7 million in 2013 and 2014.
A summary of options outstanding and exercisable under the Plans as of
December 31, 2010
, changes during the year then ended and changes during the years ended December 31,
2009
and
2008
is presented below:
91
|
|
Stock
Options
|
Weighted Average
Exercise Price
|
Weighted
Average
Remaining
Contractual
Term
|
Aggregate Intrinsic
Value* (in millions)
|
|||||||||
|
Options outstanding—December 31, 2007
|
1,100,804
|
|
$
|
14.37
|
|
||||||||
|
Granted
|
420,000
|
|
3.69
|
|
|||||||||
|
Exercised
|
(17,335
|
)
|
12.42
|
|
|||||||||
|
Expired / Forfeited
|
(9,169
|
)
|
14.61
|
|
|||||||||
|
Options outstanding—December 31, 2008
|
1,494,300
|
|
$
|
11.39
|
|
||||||||
|
Granted
|
1,100,000
|
|
4.21
|
|
|||||||||
|
Exercised
|
(188,874
|
)
|
7.76
|
|
|||||||||
|
Expired / Forfeited
|
(550,314
|
)
|
10.24
|
|
|||||||||
|
Options outstanding—December 31, 2009
|
1,855,112
|
|
$
|
7.84
|
|
||||||||
|
Granted
|
—
|
|
—
|
|
|||||||||
|
Exercised
|
(106,367
|
)
|
5.28
|
|
|||||||||
|
Expired / Forfeited / Cancelled
|
(209,767
|
)
|
12.60
|
|
|||||||||
|
Options outstanding—December 31, 2010
|
1,538,978
|
|
$
|
7.37
|
|
6.4
|
|
$
|
6.8
|
|
|||
|
Options exercisable—December 31, 2010
|
818,978
|
|
$
|
10.13
|
|
5.0
|
|
$
|
17.1
|
|
|||
____________________________
* Based on the closing price of our common stock on
December 31, 2010
, which was $18.48 per share.
Net cash received from option exercises for the year ended
December 31, 2010
was $0.6 million. The actual intrinsic value of options exercised during the years ended
December 31, 2010
and
2009
was $1.2 million and $0.9 million, respectively. The actual tax benefit realized for the tax deductions from option exercises during the years ended
December 31, 2010
and
2009
was $0.1 million and $0.3 million, respectively. There was no material actual intrinsic value for options exercised or actual tax benefit realized for the tax deductions from option exercises during the year ended December 31, 2008.
A summary of performance share units, restricted share units and restricted stock as of
December 31, 2010
, changes during the year then ended and changes during the years ended December 31,
2009
and 2008 is presented below:
|
|
Shares
|
Weighted Average Grant Date
Fair Value
|
||||
|
Performance Share Units—December 31, 2007
|
575,768
|
|
$
|
21.92
|
|
|
|
Granted
|
169,251
|
|
14.29
|
|
||
|
Performance estimate
|
(228,120
|
)
|
21.94
|
|
||
|
Vested
|
(211,094
|
)
|
16.86
|
|
||
|
Forfeited
|
(102,500
|
)
|
21.63
|
|
||
|
Performance Share Units—December 31, 2008
|
203,305
|
|
$
|
21.06
|
|
|
|
Granted
|
—
|
|
—
|
|
||
|
Performance estimate
|
(10,318
|
)
|
24.47
|
|
||
|
Vested
|
(63,950
|
)
|
22.98
|
|
||
|
Forfeited
|
(74,175
|
)
|
22.23
|
|
||
|
Performance Share Units—December 31, 2009
|
54,862
|
|
$
|
14.36
|
|
|
|
Granted
|
309,517
|
|
11.69
|
|
||
|
Performance estimate
|
83,747
|
|
11.64
|
|
||
|
Vested
|
—
|
|
—
|
|
||
|
Forfeited
|
(14,000
|
)
|
11.88
|
|
||
|
Performance Share Units—December 31, 2010*
|
434,126
|
|
$
|
12.40
|
|
|
___________________________
* Maximum of 606,609 issuable upon attaining certain performance metrics.
Each performance share unit provides an opportunity for the employee to receive a number of shares of our common stock
92
based on our performance during a three year period as measured against objective performance goals as determined by the compensation committee of our board of directors. The actual number of shares earned may range from 0% to 180% of the target number of shares depending upon achievement of the performance goals.
|
|
Shares
|
Weighted Average Grant
Date Fair Value
|
||||
|
Restricted Stock—December 31, 2007
|
72,525
|
|
$
|
26.83
|
|
|
|
Granted
|
224,491
|
|
14.39
|
|
||
|
Vested
|
(58,483
|
)
|
22.15
|
|
||
|
Forfeited
|
(17,451
|
)
|
13.85
|
|
||
|
Restricted Stock—December 31, 2008
|
221,082
|
|
$
|
16.40
|
|
|
|
Granted
|
82,000
|
|
9.09
|
|
||
|
Vested
|
(31,379
|
)
|
21.20
|
|
||
|
Forfeited
|
(28,492
|
)
|
14.68
|
|
||
|
Restricted Stock—December 31, 2009
|
243,211
|
|
$
|
13.57
|
|
|
|
Granted
|
307,038
|
|
11.67
|
|
||
|
Vested
|
(52,047
|
)
|
15.71
|
|
||
|
Forfeited
|
(22,756
|
)
|
11.70
|
|
||
|
Restricted Stock—December 31, 2010
|
475,446
|
|
$
|
12.40
|
|
|
|
|
Shares
|
Weighted Average Grant
Date Fair Value
|
||||
|
Restricted Share Units—December 31, 2009
|
—
|
|
$
|
—
|
|
|
|
Granted
|
100,767
|
|
11.58
|
|
||
|
Vested
|
—
|
|
—
|
|
||
|
Forfeited
|
—
|
|
—
|
|
||
|
Restricted Share Units—December 31, 2010
|
100,767
|
|
$
|
11.58
|
|
|
Employee Retirement Plan
We sponsor the Asbury Automotive Retirement Savings Plan (the “Plan”), a 401(k) plan, for eligible employees except for the employees of one of our dealership groups, which maintains a separate retirement plan. Employees are eligible to participate in the Plan on or after ninety days of service to the Company. Employees electing to participate in the Plan may contribute up to 75% of their annual eligible compensation. IRS rules limited total participant contributions during
2010
to $16,500 or $22,000 if age 50 or more; however, we limit participant contributions for employees with an annual salary of greater than $110,000 to $10,000 per year or $15,500 if age 50 or more. After one year of employment, we match 25% of employees’ contributions up to 4% of their eligible compensation, with a maximum match of $2,450 per participant. Beginning on January 1, 2009, we suspended our matching contributions for employees with an annual salary of greater than $110,000. Employer contributions vest by graded schedule over four years after the date of hire. Expenses from continuing operations related to employer matching contributions totaled $0.9 million, $1.0 million and $3.1 million for the years ended
December 31, 2010
,
2009
and
2008
, respectively.
Deferred Compensation Plan
We sponsor the Asbury Automotive Wealth Accumulation Plan (the “Deferred Compensation Plan”) wherein eligible employees, generally those at senior levels, may elect to defer a portion of their annual compensation. We have established a rabbi trust to finance obligations under the Deferred Compensation Plan with corporate-owned variable life insurance contracts. Participants are 100% vested in their respective deferrals and the earnings thereon. Historically, we elected to match a portion of certain eligible employee’s contributions. Beginning January 1, 2009, we suspended our matching contributions for all
93
employees in our deferred compensation plan. The employee deferral match expense totaled $0.2 million for the year ended
December 31, 2008
. Each annual employer match vests in full three years from the date the employee deferral match is funded. The total deferred compensation liability was $8.2 million and $7.6 million as of
December 31, 2010
and
2009
, respectively. The related cash surrender value and face value on such contracts totaled $11.5 million and $66.8 million as of
December 31, 2010
, respectively.
25. CONDENSED QUARTERLY REVENUES AND EARNINGS (UNAUDITED):
|
|
For the Three Months Ended
|
|||||||||||||||
|
|
March 31,
|
June 30,
|
September 30,
|
December 31,
|
||||||||||||
|
|
(In millions, except per share data)
|
|||||||||||||||
|
2009
|
||||||||||||||||
|
Revenues (1)
|
$
|
760.3
|
|
$
|
871.4
|
|
$
|
938.3
|
|
$
|
836.1
|
|
||||
|
Gross profit (1)
|
$
|
136.4
|
|
$
|
147.2
|
|
$
|
156.6
|
|
$
|
142.4
|
|
||||
|
Net income (1)
|
$
|
0.3
|
|
$
|
5.5
|
|
$
|
7.4
|
|
$
|
0.2
|
|
||||
|
Net income per common share:
|
||||||||||||||||
|
Basic (2)
|
$
|
0.01
|
|
$
|
0.17
|
|
$
|
0.23
|
|
$
|
0.01
|
|
||||
|
Diluted (2)
|
$
|
0.01
|
|
$
|
0.17
|
|
$
|
0.22
|
|
$
|
0.01
|
|
||||
|
2010
|
||||||||||||||||
|
Revenues (1)
|
$
|
886.5
|
|
$
|
998.8
|
|
$
|
1,029.3
|
|
$
|
1,021.4
|
|
||||
|
Gross profit (1)
|
$
|
152.3
|
|
$
|
164.2
|
|
$
|
166.3
|
|
$
|
165.9
|
|
||||
|
Net income (1) (3)
|
$
|
7.4
|
|
$
|
12.8
|
|
$
|
12.5
|
|
$
|
5.4
|
|
||||
|
Net income per common share:
|
||||||||||||||||
|
Basic (2) (3)
|
$
|
0.23
|
|
$
|
0.40
|
|
$
|
0.39
|
|
$
|
0.17
|
|
||||
|
Diluted (2) (3)
|
$
|
0.22
|
|
$
|
0.39
|
|
$
|
0.38
|
|
$
|
0.16
|
|
||||
____________________________
|
(1)
|
Quarterly revenues, gross profit and net income (loss) do not agree to previously reported amounts on Form 10-Q as a result of subsequent discontinued operations.
|
|
(2)
|
The sum of income (loss) per common share for the four quarters does not equal total income (loss) per common share due to changes in the average number of shares outstanding during the respective periods.
|
|
(3)
|
Results for the three months ended December 31, 2010 were reduced by $7.6 million, net of tax, or $0.23 per common share, as a result of expenses associated with the repurchase of our 8% Notes and amendments to our 7.625% Notes and credit facilities and mortgage notes payable.
|
26. SUBSEQUENT EVENTS
In January 2011, we purchased certain previously leased real estate from a member of our board of directors for $16.8 million.
In February 2011, we announced a management succession plan in connection with the anticipated retirement of our former President and Chief Executive Officer, Charles R. Oglesby, on July 31, 2011. As part of that plan, on February 9, 2011, Mr. Oglesby was elected as the Executive Chairman of our Board of Directors until he retires in July 2011, and Craig T. Monaghan, our former Senior Vice President and Chief Financial Offier, was elected President and Chief Executive Officer. We expect to incur approximately $4.7 million of compensation expense in 2011 related to our former Chief Executive Officer.
In February 2011, our Board of Directors authorized us to use up to $30.0 million of cash to repurchase 3% Convertible Notes, 7.625% Notes or 8.375% Notes, which authorization expires February 28, 2012. This authority supercedes and replaces the existing authority under which we repurchased $25.2 million of 3% Convertible Notes.
None.
Disclosure Controls and Procedures
As of the end of the period covered by this report, the Company conducted an evaluation, under the supervision and with
94
the participation of the Company’s principal executive officer and principal financial officer, of the effectiveness of the design and operation of the Company’s disclosure controls and procedures as defined in Rule 13a-15(e) and 15d-15(e) under the Securities Exchange Act of 1934, as amended (the “Exchange Act”). Based on this evaluation, the Company’s principal executive officer and principal financial officer concluded that as of the end of such period such disclosure controls and procedures were effective to ensure that information required to be disclosed by the Company in reports it files or submits under the Exchange Act is (i) recorded, processed, summarized and reported within the time period specified in the rules and forms of the U.S. Securities and Exchange Commission and (ii) accumulated and communicated to our management, including our principal executive officer and principal financial officer, as appropriate, to allow timely decisions regarding disclosure. Management necessarily applies its judgment in assessing the costs and benefits of such controls and procedures, which, by their nature, can provide only reasonable assurance regarding management’s control objectives. The Company’s management, including the principal executive officer and the principal financial officer, does not expect that our disclosure controls and procedures can prevent all possible errors or fraud. A control system, no matter how well conceived and operated, can provide only reasonable, not absolute, assurance that objectives of the control system are met. There are inherent limitations in all control systems, including the realities that judgments in decision-making can be faulty, and that breakdowns can occur because of simple errors or mistakes. Additionally, controls can be circumvented by the individual acts of one or more persons. The design of any system of controls is based in part upon certain assumptions about the likelihood of future events, and while our disclosure controls and procedures are designed to be effective under circumstances where they should reasonably be expected to operate effectively, there can be no assurance that any design will succeed in achieving its stated goals under all potential future conditions. Because of the inherent limitations in any control system, misstatements due to possible errors or fraud may occur and not be detected.
Management’s Report on Internal Control Over Financial Reporting
Our management is responsible for establishing and maintaining adequate internal control over our company’s financial reporting, as such term is defined in Exchange Act Rule 13a-15(f). Our internal control system was designed to provide reasonable assurance to our management and our board of directors regarding the preparation and fair presentation of published financial statements. Our internal control over financial reporting also includes those policies and procedures that:
|
•
|
Pertain to the maintenance of records that, in reasonable detail, accurately and fairly reflect the transactions and dispositions of our assets;
|
|
•
|
Provide reasonable assurance that transactions are recorded as necessary to permit preparation of financial statements in accordance with generally accepted accounting principles, and that our receipts and expenditures are being made only in accordance with authorizations of our management and directors; and
|
|
•
|
Provide reasonable assurance regarding prevention or timely detection of unauthorized acquisitions, use or disposition of our assets that could have a material effect on the financial statements.
|
Because of its inherent limitations, internal control over financial reporting may not prevent or detect misstatements. Also, projections of any evaluation of effectiveness to future periods are subject to the risk that controls may become inadequate because of changes in conditions, or that the degree or compliance with the policies or procedures may deteriorate.
Our management assessed the effectiveness of our internal control over financial reporting as of
December 31, 2010
. In making this assessment, we used the criteria set forth by the Committee of Sponsoring Organizations of the Treadway Commission (COSO) in Internal Control—Integrated Framework. Our assessment included a review of the documentation of controls, evaluation of the design effectiveness of controls and testing of the effectiveness of controls. Based on our assessment under the framework in Internal Control—Integrated Framework issued by COSO, our management concluded that our internal control over financial reporting was effective as of
December 31, 2010
. Our auditors, Ernst & Young LLP, an independent registered public accounting firm, has audited and reported on our consolidated financial statements and on the effectiveness of our internal controls over financial reporting. Their report is contained herein.
During December 2010, we acquired substantially all of the assets, including certain real estate, of nine franchises (four dealership locations). As permitted by Securities and Exchange Commission guidance, the scope of our Section 404 evaluation for the fiscal year ended December 31, 2010 does not include the internal controls over financial reporting of the acquired operations. These acquisitions are included in our consolidated financial statements from the date of acquisition. The nine franchises represented approximately $64.5 million of our $1.5 billion consolidated assets as of December 31, 2010 and approximately $13.6 million of our $3.9 billion consolidated revenues for the year then ended.
From the acquisition date to December 31, 2010, the processes and systems of the acquired operations were discrete and did not significantly impact internal control over financial reporting for our other consolidated subsidiaries.
Changes in Internal Control Over Financial Reporting
95
During the quarter ended December 31,
2010
, the Company continued its implementation of the ADP Dealer Management System, which has been implemented at approximately 30% of our dealerships. As appropriate, the Company is modifying the documentation of its internal control processes and procedures relating to this change in dealer management systems to supplement and complement existing internal controls over financial reporting. Other than the above, there was no change in the Company’s internal control over financial reporting during the fourth quarter of the fiscal year ended
December 31, 2010
that has materially affected, or is reasonably likely to materially affect, the Company’s internal control over financial reporting.
None.
96
Reference is made to the information to be set forth in the "Proposal No. 1 Election of Directors," "Governance of the Company," "Director Compensation Table" and "Corporate Officers" sections of our Proxy Statement to be filed within 120 days after the end of our fiscal year, which information is incorporated herein by reference.
Reference is made to the information to be set forth in the "Executive Compensation" section of our Proxy Statement to be filed within 120 days after the end of our fiscal year, which information is incorporated herein by reference.
Reference is made to the information to be set forth in the "Securities Owned by Management and Certain Beneficial Owners" section of our Proxy Statement to be filed within 120 days after the end of our fiscal year, which information is incorporated herein by reference.
Reference is made to the information to be set forth in the "Related Persons Transaction" section of our Proxy Statement to be filed within 120 days after the end of our fiscal year, which information is incorporated herein by reference.
Reference is made to the information to be set forth in the "Independent Auditors' Fees" section of our Proxy Statement to be filed within 120 days after the end of our fiscal year, which information is incorporated herein by reference.
|
(a)
|
The following documents are filed as a part of this report on Form 10-K:
|
|
(1)
|
Financial Statements: See index to Consolidated Financial Statements.
|
|
(2)
|
Financial Statement Schedules: Not applicable.
|
|
(3)
|
Exhibits required to be filed by Item 601 of Regulation S-K:
|
The Exhibits listed below are identified by numbers corresponding to the Exhibit Table of Item 601 of Regulation S-K.
|
Exhibit
Number
|
|
Description of Documents
|
|
3.1
|
|
Restated Certificate of Incorporation of Asbury Automotive Group, Inc. (filed as Exhibit 4.1 to the Company’s Registration Statement on Form S-8 filed with the SEC on March 20, 2002)*
|
|
3.2
|
|
Bylaws of Asbury Automotive Group, Inc. (filed as Exhibit 3.1 to the Company’s Current Report on Form 8-K filed with the SEC on October 26, 2009)*
|
|
4.1
|
|
Indenture, dated as of March 16, 2007, by and among Asbury Automotive Group, Inc., the Subsidiary Guarantors listed on Schedule I thereto, and the Bank of New York Mellon, as Trustee, related to the 3.00% Senior Subordinated Convertible Notes due 2012 (filed as Exhibit 4.1 to the Company’s Quarterly Report on Form 10-Q for the quarter ended March 31, 2007)*
|
|
4.2
|
|
Form of 3.00% Senior Subordinated Convertible Notes due 2012 (filed with Exhibit 4.2 to the Company’s Quarterly Report on Form 10-Q for the quarter ended March 31, 2007)*
|
|
4.3
|
|
First Supplemental Indenture, dated as of June 29, 2007, by and among Asbury Automotive Group, Inc., the Subsidiaries of Asbury Automotive Group, Inc. listed on Schedule II thereto, the other Guarantors listed on Schedule I thereto and The Bank of New York, as Trustee, related to the 3.00% Senior Subordinated Convertible Notes due 2012 (filed as Exhibit 4.10 to the Company’s Registration Statement on Form S-4 filed with the SEC on July 5, 2007)*
|
97
|
Exhibit
Number
|
|
Description of Documents
|
|
4.4
|
|
Second Supplemental Indenture, dated as of August 17, 2010, by and among Asbury Automotive Group, Inc., the Subsidiaries of Asbury Automotive Group, Inc. listed on Schedule II thereto, the other Guarantors listed on Schedule I thereto and The Bank of New York Mellon, as Trustee, related to the 3.00% Senior Subordinated Convertible Notes due 2012 (filed as Exhibit 4.10 to the Company’s Quarterly Report on Form 10-Q for the quarter ended September 30, 2010)*
|
|
4.5
|
|
Indenture, dated as of March 26, 2007, by and among Asbury Automotive Group, Inc., the Subsidiary Guarantors listed on Schedule I thereto and The Bank of New York, as Trustee, relating to the 7.625% Senior Subordinated Notes due 2017 (filed as Exhibit 4.3 to the Company’s Quarterly Report on Form 10-Q for the quarter ended March 31, 2007)*
|
|
4.6
|
|
Form of 7.625% Senior Subordinated Notes due 2017 (filed as Exhibit 4.4 to the Company’s Quarterly Report on Form 10-Q for the quarter ended March 31, 2007)*
|
|
4.7
|
|
First Supplemental Indenture, dated as of June 29, 2007, by and among Asbury Automotive Group, Inc., the Subsidiaries of Asbury Automotive Group, Inc. listed on Schedule II thereto, the other Guarantors listed on Schedule I thereto and The Bank of New York, as Trustee, related to the 7.625% Senior Subordinated Notes due 2017 (filed as Exhibit 4.3 to the Company’s Registration Statement on Form S-4 filed with the SEC on July 5, 2007)*
|
|
4.8
|
Second Supplemental Indenture, dated as of June 30, 2010, by and among Asbury Automotive Group, Inc., the Subsidiaries of Asbury Automotive Group, Inc. listed on Schedule II thereto, the other Guarantors listed on Schedule I thereto and The Bank of New York Mellon, as Trustee, related to the 7.625% Senior Subordinated Notes due 2017 (filed as Exhibit 4.2 to the Company’s Quarterly Report on Form 10-Q for the quarter ended June 30, 2010)*
|
|
|
4.9
|
Third Supplemental Indenture, dated as of November 10, 2010, by and among Asbury Automotive Group, Inc., the Subsidiaries of Asbury Automotive Group, Inc. listed on Schedule II thereto, the other Guarantors listed on Schedule I thereto and The Bank of New York Mellon, as Trustee, related to the 7.625% Senior Subordinated Notes due 2017 (filed as Exhibit 4.6 to the Company’s Current Report on Form 8-K filed with the SEC on November 18, 2010)*
|
|
|
4.10
|
Fourth Supplemental Indenture, dated as of November 16, 2010, by and among Asbury Automotive Group, Inc., the Subsidiaries of Asbury Automotive Group, Inc. listed on Schedule II thereto, the other Guarantors listed on Schedule I thereto and The Bank of New York Mellon, as Trustee, related to the 7.625% Senior Subordinated Notes due 2017 (filed as Exhibit 4.4 to the Company’s Current Report on Form 8-K filed with the SEC on November 18, 2010)*
|
|
|
4.11
|
|
Fifth Supplemental Indenture, dated as of December 30, 2010, by and among Asbury Automotive Group, Inc., the Subsidiaries of Asbury Automotive Group, Inc. listed on Schedule II thereto, the other Guarantors listed on Schedule I thereto and The Bank of New York Mellon, as Trustee, related to the 7.625% Senior Subordinated Notes due 2017
|
|
4.12
|
Indenture, dated as of November 16, 2010, by and among Asbury Automotive Group, Inc., the Subsidiary Guarantors listed on Schedule I thereto and The Bank of New York Mellon, as Trustee, relating to the 8.375% Senior Subordinated Notes due 2020 (filed as Exhibit 4.1 to the Company’s Current Report on Form 8-K filed with the SEC on November 18, 2010)*
|
|
|
4.13
|
Form of 8.375% Senior Subordinated Notes due 2020 (included as Exhibit A in Exhibit 4.1 and filed as Exhibit 4.2 to the Company’s Current Report on Form 8-K filed with the SEC on November 18, 2010)*
|
|
|
4.14
|
First Supplemental Indenture, dated as of December 30, 2010, by and among Asbury Automotive Group, Inc., the Subsidiaries of Asbury Automotive Group, Inc. listed on Schedule II thereto, the other Guarantors listed on Schedule I thereto and The Bank of New York Mellon, as Trustee, related to the 8.375% Senior Subordinated Notes due 2020
|
|
|
4.15
|
|
Confirmation of Issuer Warrant by and between Asbury Automotive Group, Inc. and Goldman, Sachs & Co., dated March 12, 2007 (filed as Exhibit 10.4 to the Company’s Quarterly Report on Form 10-Q for the quarter ended March 31, 2007)*
|
|
4.16
|
|
Confirmation of Issuer Warrant dated March 12, 2007 by and between Asbury Automotive Group, Inc. and Deutsche Bank AG, London Branch (filed as Exhibit 10.5 to the Company’s Quarterly Report on Form 10-Q for the quarter ended March 31, 2007)*
|
|
4.17
|
|
Amendment to Confirmation dated March 13, 2007, by and between Goldman, Sachs & Co. and Asbury Automotive Group, Inc. relating to the Issuer Warrant (filed as Exhibit 10.6 to the Company’s Quarterly Report on Form 10-Q for the quarter ended March 31, 2007)*
|
98
|
Exhibit
Number
|
|
Description of Documents
|
|
4.18
|
|
Amendment to Confirmation dated March 13, 2007, by and between Deutsche Bank AG, London Branch and Asbury Automotive Group, Inc. relating to the Issuer Warrant (filed as Exhibit 10.7 to the Company’s Quarterly Report on Form 10-Q for the quarter ended March 31, 2007)*
|
|
4.19
|
Registration Rights Agreement dated November 16, 2010, by and among Asbury Automotive Group, Inc. and Merrill Lynch Fenner & Smith Incorporated, J.P. Morgan Securities LLC and Wells Fargo Securities, LLC (filed as Exhibit 4.3 to the Company's Current Report on Form 8-K filed with the SEC on November 18, 2010)*
|
|
|
10.1**
|
|
Amended and Restated Wealth Accumulation Plan (filed as Exhibit 4.19 to the Company’s Annual Report on Form 10-K for the year ended December 31, 2007)*
|
|
10.2**
|
|
Amended and Restated 1999 Stock Option Plan (filed as Exhibit 10.1 to the Company’s Annual Report on Form 10-K for the year ended December 31, 2007) *
|
|
10.3**
|
|
Amended and Restated 2002 Equity Incentive Plan (filed as Exhibit 10.3 to the Company’s Quarterly Report on Form 10-Q for the quarter ended March 31, 2010) *
|
|
10.4**
|
First Amendment to the Amended and Restated 2002 Equity Incentive Plan (filed as Exhibit 10.2 to the Company's Quarterly Report on Form 10-Q for the quarter ended March 31, 2010)*
|
|
|
10.5**
|
|
Amended and Restated Key Executive Incentive Compensation Plan (filed as Exhibit 10.2 to the Company’s Current Report on Form 8-K filed with the SEC on May 4, 2009) *
|
|
10.6**
|
|
Form of Officer/Director Indemnification Agreement (filed as Exhibit 10.7 to the Company’s Quarterly Report on Form 10-Q for the quarter ended March 31, 2010)*
|
|
10.7**
|
|
Severance Agreement by and between Asbury Automotive Group, Inc. and Philip R. Johnson, dated April 29, 2009 (filed as Exhibit 10.6 to the Company’s Current Report on Form 8-K filed with the SEC on May 4, 2009)*
|
|
10.8**
|
|
Employment Agreement by and between Asbury Automotive Group, Inc. and Elizabeth B. Chandler, dated April 27, 2009 (filed as Exhibit 10.10 to the Company's Annual Report on Form 10-K for the year ended December 31, 2009)*
|
|
10.9**
|
Severance Agreement by and between Asbury Automotive Group, Inc. and Elizabeth B. Chandler, dated June 26, 2009 (filed as Exhibit 10.11 to the Company's Annual Report on Form 10-K for the year ended December 31, 2009)*
|
|
|
10.10**
|
|
Severance Agreement by and between Asbury Automotive Group, Inc. and Keith R. Style, dated February 28, 2008 (filed as Exhibit 10.12 to the Company’s Annual Report on Form 10-K for the year ended December 31, 2008)*
|
|
10.11**
|
|
Letter Agreement by and between Asbury Automotive Group, Inc. and Joseph G. Parham, Jr., dated April 22, 2010
|
|
10.12**
|
|
Severance Agreement by and between Asbury Automotive Group, Inc. and Joseph G. Parham, Jr., dated May 3, 2010
|
|
10.13
|
|
First Amended and Restated Lease Agreement by and between Jeffrey I. Wooley and Asbury Automotive Tampa, L.P., effective September 17, 1998 (for premises located on Hillsborough Avenue, Tampa, Florida) (filed as Exhibit 10.20 to the Company’s Annual Report on Form 10-K for the year ended December 31, 2007)*
|
|
10.14
|
|
Lease Agreement by and between Jeffrey I. Wooley and Asbury Automotive Tampa, L.P., effective January 5, 2011 (for premises located on Adamo Drive, Brandon, Florida)
|
|
10.15
|
Agreement of Purchase and Sale between Asbury Automotive Tampa L.P. and Jeffrey I. Wooley, dated as of December 17, 2010 (filed as Exhibit 10.1 to the Company's Form 8-K filed with the SEC on December 20, 2010)*
|
|
|
10.16**
|
|
Amended and Restated Employment Agreement by and between Asbury Automotive Group, Inc. and Charles Oglesby, dated March 22, 2010 (filed as Exhibit 10.1 to the Company’s Current Report on Form 8-K filed with the SEC on March 25, 2010) *
|
|
10.17**
|
Employment Agreement between Asbury Automotive Group, Inc. and Philip R. Johnson, dated June 30, 2010 (filed as Exhibit 10.1 to the Company's Current Report on Form 8-K filed with the SEC on June 30, 2010)*
|
|
99
|
Exhibit
Number
|
|
Description of Documents
|
|
10.18**
|
|
Letter Agreement by and between Asbury Automotive Group, Inc. and Craig T. Monaghan, executed on April 30, 2008 (filed as Exhibit 10.1 to the Company’s Current Report on Form 8-K filed with the SEC on May 1, 2008)*
|
|
10.19**
|
|
Severance Agreement by and between Asbury Automotive Group, Inc. and Craig T. Monaghan, dated April 29, 2009 (filed as Exhibit 10.5 to the Company’s Current Report on Form 8-K filed with the SEC on May 4, 2009)*
|
|
10.20**
|
|
Letter Agreement by and between Asbury Automotive Group, Inc. and Michael S. Kearney, dated April 29, 2009 (filed as Exhibit 10.3 to the Company’s Current Report on Form 8-K filed with the SEC on May 4, 2009) *
|
|
10.21**
|
|
Severance Agreement by and between Asbury Automotive Group, Inc. and Michael S. Kearney, dated April 29, 2009 (filed as Exhibit 10.4 to the Company’s Current Report on Form 8-K filed with the SEC on May 4, 2009) *
|
|
10.22**
|
|
Form of Nonqualified Stock Option Grant Agreement (filed as Exhibit 10.24 to the Company’s Annual Report on Form 10-K for the year ended December 31, 2007)*
|
|
10.23**
|
|
Form of Performance Share Unit Award Agreement (filed as Exhibit 10.4 to the Company’s Quarterly Report on Form 10-Q for the quarter ended March 31, 2010)*
|
|
10.24**
|
|
Form of Restricted Share Award Agreement for Non-Employee Directors (filed as Exhibit 10.26 to the Company’s Annual Report on Form 10-K for the year ended December 31, 2007)*
|
|
10.25**
|
|
Form of Restricted Share Award Agreement (filed as Exhibit 10.5 to the Company’s Quarterly Report on Form 10-Q for the quarter ended March 31, 2010)*
|
|
10.26**
|
|
Restricted Share Award Agreement for Non-Employee Directors by and between Asbury Automotive Group, Inc. and Michael J. Durham, dated October 23, 2006 (filed as Exhibit 10.3 to the Company’s Quarterly Report on Form 10-Q for the quarter ended September 30, 2006)*
|
|
10.27
|
|
Ford Sales and Service Agreement (filed as Exhibit 10.13 to Amendment No. 2 to the Company’s Registration Statement on Form S-1 filed with the SEC on October 12, 2001)*
|
|
10.28
|
|
General Motors Dealer Sales and Service Agreement (filed as Exhibit 10.14 to Amendment No. 2 to the Company’s Registration Statement on Form S-1 filed with the SEC on October 12, 2001)*
|
|
10.29
|
|
Honda Automobile Dealer Sales and Service Agreement (filed as Exhibit 10.15 to Amendment No. 2 to the Company’s Registration Statement on Form S-1 filed with the SEC on October 12, 2001.)*
|
|
10.30
|
|
Mercedes-Benz Passenger Car Dealer Agreement (filed as Exhibit 10.16 to Amendment No. 2 to the Company’s Registration Statement on Form S-1 filed with the SEC on October 12, 2001)*
|
|
10.31
|
|
Nissan Dealer Sales and Service Agreement (filed as Exhibit 10.17 to Amendment No. 2 to the Company’s Registration Statement on Form S-1 filed with the SEC on October 12, 2001)*
|
|
10.32
|
|
Toyota Dealer Agreement (filed as Exhibit 10.18 to Amendment No. 2 to the Company’s Registration Statement on Form S-1filed with the SEC on October 12, 2001)*
|
|
10.33
|
|
Credit Agreement dated as of September 26, 2008, by and among Asbury Automotive Group, Inc., Bank of America, N.A., as administrative agent, swing line lender and L/C Issuer and the other Lenders party thereto listed on the signature pages thereto (filed as Exhibit 10.1 to the Company’s Current Report on Form 8-K with the SEC on October 2, 2008)*
|
|
10.34
|
|
Revolving Credit Agreement dated as of October 29, 2008, by and among Asbury Automotive Group, Inc., the Lenders listed therein and JPMorgan Chase Bank, N.A., as administrative agent (filed as Exhibit 10.1 to the Company’s Current Report on Form 8-K filed with the SEC on November 4, 2008)*
|
|
10.35
|
Amendment No. 1 to Credit Agreement by and between Asbury Automotive Group, Inc. and Bank of America, N. A., as administrative agent, swing line lender and L/C Issuer and the other Lenders party thereto listed on the signature pages thereto, and Subsidiary Guarantors listed on the signature pages thereto, dated July 22, 2009 (filed as Exhibit 10.2 to the Company’s Current Report on Form 8-K filed with the SEC on July 24, 2009)*
|
|
|
10.36
|
Amendment No. 2 to Credit Agreement by and between Asbury Automotive Group, Inc. and Bank of America, N. A., as administrative agent, swing line lender and L/C Issuer and the other Lenders party thereto listed on the signature pages thereto, and Subsidiary Guarantors listed on the signature pages thereto, dated November 16, 2010
|
|
100
|
Exhibit
Number
|
|
Description of Documents
|
|
10.37
|
|
Amendment No. 1 to Credit Agreement by and between Asbury Automotive Group, Inc. and JPMorgan Chase Bank, N. A., as administrative agent, and the other Lenders party thereto listed on the signature pages thereto, and Guarantors listed on the signature pages thereto, dated July 21, 2009 (filed as Exhibit 10.1 to the Company’s Current Report on Form 8-K filed with the SEC on July 24, 2009)*
|
|
10.38
|
Amendment No. 2 to Credit Agreement by and between Asbury Automotive Group, Inc. and JPMorgan Chase Bank, N. A., as administrative agent, and the other Lenders party thereto listed on the signature pages thereto, and Guarantors listed on the signature pages thereto, dated November 16, 2010
|
|
|
10.39
|
|
Confirmation of Convertible Bond Hedge Transaction dated March 12, 2007, by and between Asbury Automotive Group, Inc. and Goldman, Sachs & Co. (filed as Exhibit 10.2 to the Company’s Quarterly Report on Form 10-Q for the quarter ended March 31, 2007)*
|
|
10.40
|
|
Confirmation of Convertible Bond Hedge Transaction dated March 12, 2007, by and between Asbury Automotive Group, Inc. and Deutsche Bank AG, London Branch (filed as Exhibit 10.3 to the Company’s Quarterly Report on Form 10-Q for the quarter ended March 31, 2007)*
|
|
10.41
|
|
Master Loan Agreement by and among certain subsidiaries of Asbury Automotive Group, Inc. and Wachovia Bank, National Association and Wachovia Financial Services, Inc., dated as of June 4, 2008 (filed as Exhibit 10.1 to the Company’s Current Report on Form 8-K filed with the SEC on June 10, 2008)*
|
|
10.42
|
|
Unconditional Guaranty dated as of June 4, 2008, by and between Asbury Automotive Group, Inc. and Wachovia Bank, National Association (filed as Exhibit 10.2 to the Company’s Current Report on Form 8-K filed with the SEC on June 10, 2008)*
|
|
10.43
|
|
Unconditional Guaranty dated as of June 4, 2008, by and between Asbury Automotive Group, Inc. and Wachovia Financial Services, Inc. (filed as Exhibit 10.3 to the Company’s Current Report on Form 8-K filed with the SEC on June 10, 2008)*
|
|
10.44
|
|
Purchase and Sale Agreement by and between the affiliates of AutoStar Realty Operating Partnership listed on Schedule 1.1.1 thereto, and Asbury Automotive Group, Inc. dated May 8, 2008 (filed as Exhibit 10.4 to the Company’s Current Report on Form 8-K filed with the SEC on June 10, 2008)*
|
|
10.45
|
|
Modification Number One to Master Loan Agreement by and among certain subsidiaries of Asbury Automotive Group, Inc. and Wachovia Bank, National Association and Wachovia Financial Services, Inc., dated as of December 1, 2008 (filed as Exhibit 10.48 to the Company’s Annual Report on Form 10-K for the year ended December 31, 2008)*
|
|
10.46
|
|
Modification Number Two to Master Loan Agreement, dated as of May 7, 2009, by and among certain subsidiaries of Asbury Automotive Group, Inc., and Wachovia Bank, National Association and Wachovia Financial Services, Inc. (filed as Exhibit 10.1 to the Company’s Current Report on Form 8-K filed with the SEC on May 12, 2009)*
|
|
10.47
|
|
Modification Number Three to Master Loan Agreement, dated July 2, 2009, by and among certain subsidiaries of Asbury Automotive Group, Inc., and Wachovia Bank, National Association and Wachovia Financial Services, Inc.
|
|
10.48
|
Modification Number Four to Master Loan Agreement, dated as of October 21, 2010, by and among certain subsidiaries of Asbury Automotive Group, Inc., and Wachovia Bank, National Association and Wachovia Financial Services, Inc.
|
|
|
10.49
|
Modification Number Five to Master Loan Agreement, dated as of November 29, 2010, by and among certain subsidiaries of Asbury Automotive Group, Inc., and Wells Fargo Bank, N.A., as successor to Wachovia Bank, National Association and Wachovia Financial Services, Inc.
|
|
|
10.50
|
Modification Number One to Unconditional Guaranty and Reaffirmation of Unconditional Guaranty, dated as of May 7, 2009, by and between Asbury Automotive Group, Inc., and Wachovia Bank, National Association (filed as Exhibit 10.2 to the Company’s Current Report on Form 8-K filed with the SEC on May 12, 2009)*
|
|
|
10.51
|
|
Modification Number One to Unconditional Guaranty and Reaffirmation of Unconditional Guaranty, dated as of May 7, 2009, by and between Asbury Automotive Group, Inc., and Wachovia Bank Financial Services, Inc. (filed as Exhibit 10.3 to the Company’s Current Report on Form 8-K filed with the SEC on May 12, 2009)*
|
|
10.52
|
Modification Number One to Amended and Restated Unconditional Guaranty and Reaffirmation of Amended and Restated Unconditional Guaranty dated as of November 29, 2010, by and between Asbury Automotive Group, Inc. and Wells Fargo Bank, N.A., as successor to Wachovia Bank, National Association
|
101
|
Exhibit
Number
|
|
Description of Documents
|
|
10.53
|
Modification Number One to Amended and Restated Unconditional Guaranty and Reaffirmation of Amended and Restated Unconditional Guaranty dated as of November 29, 2010, by and between Asbury Automotive Group, Inc. and Wachovia Financial Services, Inc.
|
|
|
10.54
|
|
Limited Waiver by and among Asbury Automotive Group, Inc., each of the Subsidiaries of Asbury Automotive Group, Inc. listed on the signature pages thereto, each of the Lenders listed on the signature pages thereto, and JPMorgan Chase Bank, N.A., as Administrative Agent for the Lenders, dated as of March 12, 2009 (filed as Exhibit 10.49 to the Company’s Annual Report on Form 10-K for the year ended December 31, 2008)*
|
|
10.55
|
|
Limited Waiver by and among Asbury Automotive Group, Inc., Bank of America, N.A., as Administrative Agent for the Lenders and as Swing Line Lender and L/C Issuer, each of the Lenders listed on the signature pages thereto, and each of the Subsidiaries of Asbury Automotive Group, Inc. listed on the signature pages thereto, dated as of March 12, 2009 (filed as Exhibit 10.50 to the Company’s Annual Report on Form 10-K for the year ended December 31, 2008)*
|
|
10.56**
|
Form of Restricted Stock Unit Award Agreement (filed as Exhibit 10.6 to the Company's Quarterly Report on Form 10-Q for the quarter ended March 31, 2010)*
|
|
|
12.1
|
Statement Regarding Computation of Ratio of Earnings to Fixed Charges
|
|
|
21
|
|
Subsidiaries of the Company
|
|
23.1
|
|
Consent of Ernst & Young LLP
|
|
23.2
|
|
Consent of Deloitte & Touche LLP
|
|
24
|
|
Powers of Attorney (included on signature page hereto)
|
|
31.1
|
|
Certificate of Chief Executive Officer pursuant to Rule 13a-14(a)/15d-14(a)of the Securities Exchange Act of 1934, as adopted pursuant to Section 302 of the Sarbanes-Oxley Act of 2002
|
|
31.2
|
|
Certificate of Chief Financial Officer pursuant to Rule 13a-14(a)/15d-14(a)of the Securities Exchange Act of 1934, as adopted pursuant to Section 302 of the Sarbanes-Oxley Act of 2002
|
|
32.1
|
|
Certificate of Chief Executive Officer pursuant to 18 U.S.C. Section 1350, as adopted pursuant to Section 906 of the Sarbanes-Oxley Act of 2002
|
|
32.2
|
|
Certificate of Chief Financial Officer pursuant to 18 U.S.C. Section 1350, as adopted pursuant to Section 906 of the Sarbanes-Oxley Act of 2002
|
|
*
|
|
Incorporated by reference.
|
|
**
|
|
Management contract or compensatory plan or arrangement.
|
102
SIGNATURES
Pursuant to the requirements of Section 13 or 15(d) of the Securities Exchange Act of 1934, the registrant has duly caused this report to be signed on its behalf by the undersigned, thereunto duly authorized.
|
Asbury Automotive Group, Inc.
|
|||
|
Date: February 25, 2011
|
By:
|
|
/s/ Craig T. Monaghan
|
|
Name:
|
|
Craig T. Monaghan
|
|
|
Title:
|
|
Chief Executive Officer and President
|
|
POWER OF ATTORNEY
KNOW ALL PERSONS BY THESE PRESENTS, that each person whose signature appears below constitutes and appoints Craig T Monaghan and Keith R. Style, and each of them, acting individually, as his or her true and lawful attorney-in-fact, each with full power of substitution and resubstitution, for him or her and in his or her name, place and stead, in any and all capacities, to sign any and all amendments to this Annual Report on Form 10-K for the year ended
December 31, 2010
, and other documents in connection herewith and therewith, and to file the same, with all exhibits thereto, with the Securities and Exchange Commission, granting unto said attorneys-in-fact and agents, and each of them, full power and authority to do and perform each and every act and thing requisite and necessary to be done in connection herewith and therewith and about the premises, as fully to all intents and purposes as he or she might or could do in person, hereby ratifying and confirming all that said attorneys-in-fact and agents, or any of them, or their or his substitute or substitutes, may lawfully do or cause to be done by virtue hereof.
Pursuant to the requirements of Section 13 or 15(d) of the Securities Exchange Act of 1934, the registrant has duly caused this report to be signed on its behalf by the undersigned, thereunto duly authorized.
|
Signature
|
|
Title
|
|
Date
|
|
/s/ Craig T. Monaghan
|
|
Chief Executive Officer and President
|
|
February 25, 2011
|
|
(Craig T. Monaghan)
|
|
Principal Financial Officer
|
|
|
|
/s/ Keith R. Style
|
|
Vice President, Operations, Formerly Vice President, Finance
|
|
February 25, 2011
|
|
(Keith R. Style)
|
|
|
||
|
/s/ Bryan C. Hanlon
|
|
Controller and
|
|
February 25, 2011
|
|
(Bryan C. Hanlon)
|
|
Chief Accounting Officer
|
|
|
|
/s/ Charles R. Oglesby
|
|
Director
|
|
February 25, 2011
|
|
(Charles R. Oglesby)
|
|
Executive Chairman of the Board
|
|
|
|
/s/ Michael J. Durham
|
|
Director
|
|
February 25, 2011
|
|
(Michael J. Durham)
|
|
|
||
|
/s/ Janet M. Clarke
|
|
Director
|
|
February 25, 2011
|
|
(Janet M. Clarke)
|
|
|
||
|
/s/ Dennis E. Clements
|
|
Director
|
|
February 25, 2011
|
|
(Dennis E. Clements)
|
|
|
103
|
Signature
|
|
Title
|
|
Date
|
|
/s/ Thomas C. DeLoach, Jr.
|
|
Director
|
|
February 25, 2011
|
|
(Thomas C. DeLoach, Jr.)
|
|
|
||
|
/s/ Juanita T. James
|
|
Director
|
|
February 25, 2011
|
|
(Juanita T. James)
|
|
|
||
|
/s/ Vernon E. Jordan, Jr.
|
|
Director
|
|
February 25, 2011
|
|
(Vernon E. Jordan, Jr.)
|
|
|
||
|
/s/ Eugene S. Katz
|
|
Director
|
|
February 25, 2011
|
|
(Eugene S. Katz)
|
|
|
||
|
/s/ Philip F. Maritz
|
|
Director
|
|
February 25, 2011
|
|
(Philip F. Maritz)
|
|
|
||
|
/s/ Jeffrey I. Wooley
|
|
Director
|
|
February 25, 2011
|
|
(Jeffrey I. Wooley)
|
|
|
104
|
Exhibit
Number
|
|
Description of Documents
|
|
3.1
|
|
Restated Certificate of Incorporation of Asbury Automotive Group, Inc. (filed as Exhibit 4.1 to the Company’s Registration Statement on Form S-8 filed with the SEC on March 20, 2002)*
|
|
3.2
|
|
Bylaws of Asbury Automotive Group, Inc. (filed as Exhibit 3.1 to the Company’s Current Report on Form 8-K filed with the SEC on October 26, 2009)*
|
|
4.1
|
|
Indenture, dated as of March 16, 2007, by and among Asbury Automotive Group, Inc., the Subsidiary Guarantors listed on Schedule I thereto, and the Bank of New York Mellon, as Trustee, related to the 3.00% Senior Subordinated Convertible Notes due 2012 (filed as Exhibit 4.1 to the Company’s Quarterly Report on Form 10-Q for the quarter ended March 31, 2007)*
|
|
4.2
|
|
Form of 3.00% Senior Subordinated Convertible Notes due 2012 (filed with Exhibit 4.2 to the Company’s Quarterly Report on Form 10-Q for the quarter ended March 31, 2007)*
|
|
4.3
|
|
First Supplemental Indenture, dated as of June 29, 2007, by and among Asbury Automotive Group, Inc., the Subsidiaries of Asbury Automotive Group, Inc. listed on Schedule II thereto, the other Guarantors listed on Schedule I thereto and The Bank of New York, as Trustee, related to the 3.00% Senior Subordinated Convertible Notes due 2012 (filed as Exhibit 4.10 to the Company’s Registration Statement on Form S-4 filed with the SEC on July 5, 2007)*
|
|
4.4
|
|
Second Supplemental Indenture, dated as of August 17, 2010, by and among Asbury Automotive Group, Inc., the Subsidiaries of Asbury Automotive Group, Inc. listed on Schedule II thereto, the other Guarantors listed on Schedule I thereto and The Bank of New York Mellon, as Trustee, related to the 3.00% Senior Subordinated Convertible Notes due 2012 (filed as Exhibit 4.10 to the Company’s Quarterly Report on Form 10-Q for the quarter ended September 30, 2010)*
|
|
4.5
|
|
Indenture, dated as of March 26, 2007, by and among Asbury Automotive Group, Inc., the Subsidiary Guarantors listed on Schedule I thereto and The Bank of New York, as Trustee, relating to the 7.625% Senior Subordinated Notes due 2017 (filed as Exhibit 4.3 to the Company’s Quarterly Report on Form 10-Q for the quarter ended March 31, 2007)*
|
|
4.6
|
|
Form of 7.625% Senior Subordinated Notes due 2017 (filed as Exhibit 4.4 to the Company’s Quarterly Report on Form 10-Q for the quarter ended March 31, 2007)*
|
|
4.7
|
|
First Supplemental Indenture, dated as of June 29, 2007, by and among Asbury Automotive Group, Inc., the Subsidiaries of Asbury Automotive Group, Inc. listed on Schedule II thereto, the other Guarantors listed on Schedule I thereto and The Bank of New York, as Trustee, related to the 7.625% Senior Subordinated Notes due 2017 (filed as Exhibit 4.3 to the Company’s Registration Statement on Form S-4 filed with the SEC on July 5, 2007)*
|
|
4.8
|
Second Supplemental Indenture, dated as of June 30, 2010, by and among Asbury Automotive Group, Inc., the Subsidiaries of Asbury Automotive Group, Inc. listed on Schedule II thereto, the other Guarantors listed on Schedule I thereto and The Bank of New York Mellon, as Trustee, related to the 7.625% Senior Subordinated Notes due 2017 (filed as Exhibit 4.2 to the Company’s Quarterly Report on Form 10-Q for the quarter ended June 30, 2010)*
|
|
|
4.9
|
Third Supplemental Indenture, dated as of November 10, 2010, by and among Asbury Automotive Group, Inc., the Subsidiaries of Asbury Automotive Group, Inc. listed on Schedule II thereto, the other Guarantors listed on Schedule I thereto and The Bank of New York Mellon, as Trustee, related to the 7.625% Senior Subordinated Notes due 2017 (filed as Exhibit 4.6 to the Company’s Current Report on Form 8-K filed with the SEC on November 18, 2010)*
|
|
|
4.10
|
Fourth Supplemental Indenture, dated as of November 16, 2010, by and among Asbury Automotive Group, Inc., the Subsidiaries of Asbury Automotive Group, Inc. listed on Schedule II thereto, the other Guarantors listed on Schedule I thereto and The Bank of New York Mellon, as Trustee, related to the 7.625% Senior Subordinated Notes due 2017 (filed as Exhibit 4.4 to the Company’s Current Report on Form 8-K filed with the SEC on November 18, 2010)*
|
|
|
4.11
|
|
Fifth Supplemental Indenture, dated as of December 30, 2010, by and among Asbury Automotive Group, Inc., the Subsidiaries of Asbury Automotive Group, Inc. listed on Schedule II thereto, the other Guarantors listed on Schedule I thereto and The Bank of New York Mellon, as Trustee, related to the 7.625% Senior Subordinated Notes due 2017
|
|
4.12
|
Indenture, dated as of November 16, 2010, by and among Asbury Automotive Group, Inc., the Subsidiary Guarantors listed on Schedule I thereto and The Bank of New York Mellon, as Trustee, relating to the 8.375% Senior Subordinated Notes due 2020 (filed as Exhibit 4.1 to the Company’s Current Report on Form 8-K filed with the SEC on November 18, 2010)*
|
|
105
|
Exhibit
Number
|
|
Description of Documents
|
|
4.13
|
Form of 8.375% Senior Subordinated Notes due 2020 (included as Exhibit A in Exhibit 4.1 and filed as Exhibit 4.2 to the Company’s Current Report on Form 8-K filed with the SEC on November 18, 2010)*
|
|
|
4.14
|
First Supplemental Indenture, dated as of December 30, 2010, by and among Asbury Automotive Group, Inc., the Subsidiaries of Asbury Automotive Group, Inc. listed on Schedule II thereto, the other Guarantors listed on Schedule I thereto and The Bank of New York Mellon, as Trustee, related to the 8.375% Senior Subordinated Notes due 2020
|
|
|
4.15
|
|
Confirmation of Issuer Warrant by and between Asbury Automotive Group, Inc. and Goldman, Sachs & Co., dated March 12, 2007 (filed as Exhibit 10.4 to the Company’s Quarterly Report on Form 10-Q for the quarter ended March 31, 2007)*
|
|
4.16
|
|
Confirmation of Issuer Warrant dated March 12, 2007 by and between Asbury Automotive Group, Inc. and Deutsche Bank AG, London Branch (filed as Exhibit 10.5 to the Company’s Quarterly Report on Form 10-Q for the quarter ended March 31, 2007)*
|
|
4.17
|
|
Amendment to Confirmation dated March 13, 2007, by and between Goldman, Sachs & Co. and Asbury Automotive Group, Inc. relating to the Issuer Warrant (filed as Exhibit 10.6 to the Company’s Quarterly Report on Form 10-Q for the quarter ended March 31, 2007)*
|
|
4.18
|
|
Amendment to Confirmation dated March 13, 2007, by and between Deutsche Bank AG, London Branch and Asbury Automotive Group, Inc. relating to the Issuer Warrant (filed as Exhibit 10.7 to the Company’s Quarterly Report on Form 10-Q for the quarter ended March 31, 2007)*
|
|
4.19
|
Registration Rights Agreement dated November 16, 2010, by and among Asbury Automotive Group, Inc. and Merrill Lynch Fenner & Smith Incorporated, J.P. Morgan Securities LLC and Wells Fargo Securities, LLC (filed as Exhibit 4.3 to the Company's Current Report on Form 8-K filed with the SEC on November 18, 2010)*
|
|
|
10.1**
|
|
Amended and Restated Wealth Accumulation Plan (filed as Exhibit 4.19 to the Company’s Annual Report on Form 10-K for the year ended December 31, 2007)*
|
|
10.2**
|
|
Amended and Restated 1999 Stock Option Plan (filed as Exhibit 10.1 to the Company’s Annual Report on Form 10-K for the year ended December 31, 2007) *
|
|
10.3**
|
|
Amended and Restated 2002 Equity Incentive Plan (filed as Exhibit 10.3 to the Company’s Quarterly Report on Form 10-Q for the quarter ended March 31, 2010) *
|
|
10.4**
|
First Amendment to the Amended and Restated 2002 Equity Incentive Plan (filed as Exhibit 10.2 to the Company's Quarterly Report on Form 10-Q for the quarter ended March 31, 2010)*
|
|
|
10.5**
|
|
Amended and Restated Key Executive Incentive Compensation Plan (filed as Exhibit 10.2 to the Company’s Current Report on Form 8-K filed with the SEC on May 4, 2009) *
|
|
10.6**
|
|
Form of Officer/Director Indemnification Agreement (filed as Exhibit 10.7 to the Company’s Quarterly Report on Form 10-Q for the quarter ended March 31, 2010)*
|
|
10.7**
|
|
Severance Agreement by and between Asbury Automotive Group, Inc. and Philip R. Johnson, dated April 29, 2009 (filed as Exhibit 10.6 to the Company’s Current Report on Form 8-K filed with the SEC on May 4, 2009)*
|
|
10.8**
|
|
Employment Agreement by and between Asbury Automotive Group, Inc. and Elizabeth B. Chandler, dated April 27, 2009 (filed as Exhibit 10.10 to the Company's Annual Report on Form 10-K for the year ended December 31, 2009)*
|
|
10.9**
|
Severance Agreement by and between Asbury Automotive Group, Inc. and Elizabeth B. Chandler, dated June 26, 2009 (filed as Exhibit 10.11 to the Company's Annual Report on Form 10-K for the year ended December 31, 2009)*
|
|
|
10.10**
|
|
Severance Agreement by and between Asbury Automotive Group, Inc. and Keith R. Style, dated February 28, 2008 (filed as Exhibit 10.12 to the Company’s Annual Report on Form 10-K for the year ended December 31, 2008)*
|
|
10.11**
|
|
Letter Agreement by and between Asbury Automotive Group, Inc. and Joseph G. Parham, Jr., dated April 22, 2010
|
|
10.12**
|
|
Severance Agreement by and between Asbury Automotive Group, Inc. and Joseph G. Parham, Jr., dated May 3, 2010
|
106
|
Exhibit
Number
|
|
Description of Documents
|
|
10.13
|
|
First Amended and Restated Lease Agreement by and between Jeffrey I. Wooley and Asbury Automotive Tampa, L.P., effective September 17, 1998 (for premises located on Hillsborough Avenue, Tampa, Florida) (filed as Exhibit 10.20 to the Company’s Annual Report on Form 10-K for the year ended December 31, 2007)*
|
|
10.14
|
|
Lease Agreement by and between Jeffrey I. Wooley and Asbury Automotive Tampa, L.P., effective January 5, 2011 (for premises located on Adamo Drive, Brandon, Florida)
|
|
10.15
|
Agreement of Purchase and Sale between Asbury Automotive Tampa L.P. and Jeffrey I. Wooley, dated as of December 17, 2010 (filed as Exhibit 10.1 to the Company's Form 8-K filed with the SEC on December 20, 2010)*
|
|
|
10.16**
|
|
Amended and Restated Employment Agreement by and between Asbury Automotive Group, Inc. and Charles Oglesby, dated March 22, 2010 (filed as Exhibit 10.1 to the Company’s Current Report on Form 8-K filed with the SEC on March 25, 2010) *
|
|
10.17**
|
Employment Agreement between Asbury Automotive Group, Inc. and Philip R. Johnson, dated June 30, 2010 (filed as Exhibit 10.1 to the Company's Current Report on Form 8-K filed with the SEC on June 30, 2010)*
|
|
|
10.18**
|
|
Letter Agreement by and between Asbury Automotive Group, Inc. and Craig T. Monaghan, executed on April 30, 2008 (filed as Exhibit 10.1 to the Company’s Current Report on Form 8-K filed with the SEC on May 1, 2008)*
|
|
10.19**
|
|
Severance Agreement by and between Asbury Automotive Group, Inc. and Craig T. Monaghan, dated April 29, 2009 (filed as Exhibit 10.5 to the Company’s Current Report on Form 8-K filed with the SEC on May 4, 2009)*
|
|
10.20**
|
|
Letter Agreement by and between Asbury Automotive Group, Inc. and Michael S. Kearney, dated April 29, 2009 (filed as Exhibit 10.3 to the Company’s Current Report on Form 8-K filed with the SEC on May 4, 2009) *
|
|
10.21**
|
|
Severance Agreement by and between Asbury Automotive Group, Inc. and Michael S. Kearney, dated April 29, 2009 (filed as Exhibit 10.4 to the Company’s Current Report on Form 8-K filed with the SEC on May 4, 2009) *
|
|
10.22**
|
|
Form of Nonqualified Stock Option Grant Agreement (filed as Exhibit 10.24 to the Company’s Annual Report on Form 10-K for the year ended December 31, 2007)*
|
|
10.23**
|
|
Form of Performance Share Unit Award Agreement (filed as Exhibit 10.4 to the Company’s Quarterly Report on Form 10-Q for the quarter ended March 31, 2010)*
|
|
10.24**
|
|
Form of Restricted Share Award Agreement for Non-Employee Directors (filed as Exhibit 10.26 to the Company’s Annual Report on Form 10-K for the year ended December 31, 2007)*
|
|
10.25**
|
|
Form of Restricted Share Award Agreement (filed as Exhibit 10.5 to the Company’s Quarterly Report on Form 10-Q for the quarter ended March 31, 2010)*
|
|
10.26**
|
|
Restricted Share Award Agreement for Non-Employee Directors by and between Asbury Automotive Group, Inc. and Michael J. Durham, dated October 23, 2006 (filed as Exhibit 10.3 to the Company’s Quarterly Report on Form 10-Q for the quarter ended September 30, 2006)*
|
|
10.27
|
|
Ford Sales and Service Agreement (filed as Exhibit 10.13 to Amendment No. 2 to the Company’s Registration Statement on Form S-1 filed with the SEC on October 12, 2001)*
|
|
10.28
|
|
General Motors Dealer Sales and Service Agreement (filed as Exhibit 10.14 to Amendment No. 2 to the Company’s Registration Statement on Form S-1 filed with the SEC on October 12, 2001)*
|
|
10.29
|
|
Honda Automobile Dealer Sales and Service Agreement (filed as Exhibit 10.15 to Amendment No. 2 to the Company’s Registration Statement on Form S-1 filed with the SEC on October 12, 2001.)*
|
|
10.30
|
|
Mercedes-Benz Passenger Car Dealer Agreement (filed as Exhibit 10.16 to Amendment No. 2 to the Company’s Registration Statement on Form S-1 filed with the SEC on October 12, 2001)*
|
|
10.31
|
|
Nissan Dealer Sales and Service Agreement (filed as Exhibit 10.17 to Amendment No. 2 to the Company’s Registration Statement on Form S-1 filed with the SEC on October 12, 2001)*
|
|
10.32
|
|
Toyota Dealer Agreement (filed as Exhibit 10.18 to Amendment No. 2 to the Company’s Registration Statement on Form S-1filed with the SEC on October 12, 2001)*
|
107
|
Exhibit
Number
|
|
Description of Documents
|
|
10.33
|
|
Credit Agreement dated as of September 26, 2008, by and among Asbury Automotive Group, Inc., Bank of America, N.A., as administrative agent, swing line lender and L/C Issuer and the other Lenders party thereto listed on the signature pages thereto (filed as Exhibit 10.1 to the Company’s Current Report on Form 8-K with the SEC on October 2, 2008)*
|
|
10.34
|
|
Revolving Credit Agreement dated as of October 29, 2008, by and among Asbury Automotive Group, Inc., the Lenders listed therein and JPMorgan Chase Bank, N.A., as administrative agent (filed as Exhibit 10.1 to the Company’s Current Report on Form 8-K filed with the SEC on November 4, 2008)*
|
|
10.35
|
Amendment No. 1 to Credit Agreement by and between Asbury Automotive Group, Inc. and Bank of America, N. A., as administrative agent, swing line lender and L/C Issuer and the other Lenders party thereto listed on the signature pages thereto, and Subsidiary Guarantors listed on the signature pages thereto, dated July 22, 2009 (filed as Exhibit 10.2 to the Company’s Current Report on Form 8-K filed with the SEC on July 24, 2009)*
|
|
|
10.36
|
Amendment No. 2 to Credit Agreement by and between Asbury Automotive Group, Inc. and Bank of America, N. A., as administrative agent, swing line lender and L/C Issuer and the other Lenders party thereto listed on the signature pages thereto, and Subsidiary Guarantors listed on the signature pages thereto, dated November 16, 2010
|
|
|
10.37
|
|
Amendment No. 1 to Credit Agreement by and between Asbury Automotive Group, Inc. and JP Morgan Chase Bank, N. A., as administrative agent, and the other Lenders party thereto listed on the signature pages thereto, and Guarantors listed on the signature pages thereto, dated July 21, 2009 (filed as Exhibit 10.1 to the Company’s Current Report on Form 8-K filed with the SEC on July 24, 2009)*
|
|
10.38
|
Amendment No. 2 to Credit Agreement by and between Asbury Automotive Group, Inc. and JP Morgan Chase Bank, N. A., as administrative agent, and the other Lenders party thereto listed on the signature pages thereto, and Guarantors listed on the signature pages thereto, dated November 16, 2010
|
|
|
10.39
|
|
Confirmation of Convertible Bond Hedge Transaction dated March 12, 2007, by and between Asbury Automotive Group, Inc. and Goldman, Sachs & Co. (filed as Exhibit 10.2 to the Company’s Quarterly Report on Form 10-Q for the quarter ended March 31, 2007)*
|
|
10.40
|
|
Confirmation of Convertible Bond Hedge Transaction dated March 12, 2007, by and between Asbury Automotive Group, Inc. and Deutsche Bank AG, London Branch (filed as Exhibit 10.3 to the Company’s Quarterly Report on Form 10-Q for the quarter ended March 31, 2007)*
|
|
10.41
|
|
Master Loan Agreement by and among certain subsidiaries of Asbury Automotive Group, Inc. and Wachovia Bank, National Association and Wachovia Financial Services, Inc., dated as of June 4, 2008 (filed as Exhibit 10.1 to the Company’s Current Report on Form 8-K filed with the SEC on June 10, 2008)*
|
|
10.42
|
|
Unconditional Guaranty dated as of June 4, 2008, by and between Asbury Automotive Group, Inc. and Wachovia Bank, National Association (filed as Exhibit 10.2 to the Company’s Current Report on Form 8-K filed with the SEC on June 10, 2008)*
|
|
10.43
|
|
Unconditional Guaranty dated as of June 4, 2008, by and between Asbury Automotive Group, Inc. and Wachovia Financial Services, Inc. (filed as Exhibit 10.3 to the Company’s Current Report on Form 8-K filed with the SEC on June 10, 2008)*
|
|
10.44
|
|
Purchase and Sale Agreement by and between the affiliates of AutoStar Realty Operating Partnership listed on Schedule 1.1.1 thereto, and Asbury Automotive Group, Inc. dated May 8, 2008 (filed as Exhibit 10.4 to the Company’s Current Report on Form 8-K filed with the SEC on June 10, 2008)*
|
|
10.45
|
|
Modification Number One to Master Loan Agreement by and among certain subsidiaries of Asbury Automotive Group, Inc. and Wachovia Bank, National Association and Wachovia Financial Services, Inc., dated as of December 1, 2008 (filed as Exhibit 10.48 to the Company’s Annual Report on Form 10-K for the year ended December 31, 2008)*
|
|
10.46
|
|
Modification Number Two to Master Loan Agreement, dated as of May 7, 2009, by and among certain subsidiaries of Asbury Automotive Group, Inc., and Wachovia Bank, National Association and Wachovia Financial Services, Inc. (filed as Exhibit 10.1 to the Company’s Current Report on Form 8-K filed with the SEC on May 12, 2009)*
|
|
10.47
|
|
Modification Number Three to Master Loan Agreement, dated July 2, 2009, by and among certain subsidiaries of Asbury Automotive Group, Inc., and Wachovia Bank, National Association and Wachovia Financial Services, Inc.
|
108
|
Exhibit
Number
|
|
Description of Documents
|
|
10.48
|
Modification Number Four to Master Loan Agreement, dated as of October 21, 2010, by and among certain subsidiaries of Asbury Automotive Group, Inc., and Wachovia Bank, National Association and Wachovia Financial Services, Inc.
|
|
|
10.49
|
Modification Number Five to Master Loan Agreement, dated as of November 29, 2010, by and among certain subsidiaries of Asbury Automotive Group, Inc., and Wells Fargo Bank, N.A., as successor to Wachovia Bank, National Association and Wachovia Financial Services, Inc.
|
|
|
10.50
|
Modification Number One to Unconditional Guaranty and Reaffirmation of Unconditional Guaranty, dated as of May 7, 2009, by and between Asbury Automotive Group, Inc., and Wachovia Bank, National Association (filed as Exhibit 10.2 to the Company’s Current Report on Form 8-K filed with the SEC on May 12, 2009)*
|
|
|
10.51
|
|
Modification Number One to Unconditional Guaranty and Reaffirmation of Unconditional Guaranty, dated as of May 7, 2009, by and between Asbury Automotive Group, Inc., and Wachovia Bank Financial Services, Inc. (filed as Exhibit 10.3 to the Company’s Current Report on Form 8-K filed with the SEC on May 12, 2009)*
|
|
10.52
|
Modification Number One to Amended and Restated Unconditional Guaranty and Reaffirmation of Amended and Restated Unconditional Guaranty dated as of November 29, 2010, by and between Asbury Automotive Group, Inc. and Wells Fargo Bank, N.A., as successor to Wachovia Bank, National Association
|
|
|
10.53
|
Modification Number One to Amended and Restated Unconditional Guaranty and Reaffirmation of Amended and Restated Unconditional Guaranty dated as of November 29, 2010, by and between Asbury Automotive Group, Inc. and Wachovia Financial Services, Inc.
|
|
|
10.54
|
|
Limited Waiver by and among Asbury Automotive Group, Inc., each of the Subsidiaries of Asbury Automotive Group, Inc. listed on the signature pages thereto, each of the Lenders listed on the signature pages thereto, and JPMorgan Chase Bank, N.A., as Administrative Agent for the Lenders, dated as of March 12, 2009 (filed as Exhibit 10.49 to the Company’s Annual Report on Form 10-K for the year ended December 31, 2008)*
|
|
10.55
|
|
Limited Waiver by and among Asbury Automotive Group, Inc., Bank of America, N.A., as Administrative Agent for the Lenders and as Swing Line Lender and L/C Issuer, each of the Lenders listed on the signature pages thereto, and each of the Subsidiaries of Asbury Automotive Group, Inc. listed on the signature pages thereto, dated as of March 12, 2009 (filed as Exhibit 10.50 to the Company’s Annual Report on Form 10-K for the year ended December 31, 2008)*
|
|
12.1
|
Statement Regarding Computation of Ratio of Earnings to Fixed Charges
|
|
|
10.56**
|
Form of Restricted Stock Unit Award Agreement (filed as Exhibit 10.6 to the Company's Quarterly Report on Form 10-Q for the quarter ended March 31, 2010)*
|
|
|
21
|
|
Subsidiaries of the Company
|
|
23.1
|
|
Consent of Ernst & Young LLP
|
|
23.2
|
|
Consent of Deloitte & Touche LLP
|
|
24
|
|
Powers of Attorney (included on signature page hereto)
|
|
31.1
|
|
Certificate of Chief Executive Officer pursuant to Rule 13a-14(a)/15d-14(a)of the Securities Exchange Act of 1934, as adopted pursuant to Section 302 of the Sarbanes-Oxley Act of 2002
|
|
31.2
|
|
Certificate of Chief Financial Officer pursuant to Rule 13a-14(a)/15d-14(a)of the Securities Exchange Act of 1934, as adopted pursuant to Section 302 of the Sarbanes-Oxley Act of 2002
|
|
32.1
|
|
Certificate of Chief Executive Officer pursuant to 18 U.S.C. Section 1350, as adopted pursuant to Section 906 of the Sarbanes-Oxley Act of 2002
|
|
32.2
|
|
Certificate of Chief Financial Officer pursuant to 18 U.S.C. Section 1350, as adopted pursuant to Section 906 of the Sarbanes-Oxley Act of 2002
|
|
*
|
|
Incorporated by reference.
|
|
**
|
|
Management contract or compensatory plan or arrangement.
|
109
TABLE OF CONTENTS
Part IItem 1. BusinessItem 1A. Risk FactorsItem 1B. Unresolved Staff CommentsItem 2. PropertiesItem 3. Legal ProceedingsItem 4. [removed and Reserved]Part IIItem 5. Market For Registrant S Common Equity, Related Stockholder Matters and Issuer Purchases Of Equity SecuritiesItem 6. Selected Financial DataItem 7. Management S Discussion and Analysis Of Financial Condition and Results Of OperationItem 7A. Quantitative and Qualitative Disclosures About Market RiskItem 8. Financial Statements and Supplementary DataItem 9. Changes in and Disagreements with Accountants on Accounting and Financial DisclosureItem 9A. Controls and ProceduresItem 9B. Other InformationPart IIIItem 10. Directors, Executive Officers and Corporate GovernanceItem 11. Executive CompensationItem 12. Security Ownership Of Certain Beneficial Owners and Management and Related Stockholder MattersItem 13. Certain Relationships and Related Transactions, and Director IndependenceItem 14. Principal Accountant Fees and ServicesPart IVItem 15. Exhibits and Financial Statement Schedules