ARBUTUS BIOPHARMA CORP
10-Ks,20-Fs and 10-Qs
|
|
|
|
|
|
|
|
|
|
|
|
|
|
|
|
|
|
|
|
|
|
|
|
|
|
|
|
|
|
|
|
|
|
|
|
|
|
|
|
|
|
|
|
|
|
|
UNITED STATES
SECURITIES AND EXCHANGE COMMISSION
Washington, D.C. 20549
Form 10-K
ý
ANNUAL REPORT PURSUANT TO SECTION 13 OR 15(d) OF THE SECURITIES EXCHANGE ACT OF 1934
For the Fiscal Year Ended December 31, 2013
OR
o
TRANSITION REPORT PURSUANT TO SECTION 13 OR 15(d) OF THE SECURITIES EXCHANGE ACT OF 1934
For the Transition Period from to
Commission File Number: [001-34949]
Tekmira Pharmaceuticals Corporation
(Exact Name of Registrant as Specified in Its Charter)
|
British Columbia, Canada
|
980597776
|
|
|
(State or Other Jurisdiction of
Incorporation or Organization)
|
(I.R.S. Employer
Identification No.)
|
|
|
100-8900 Glenlyon Parkway, Burnaby, BC V5J 5J8
(Address of Principal Executive Offices)
|
||
|
604-419-3200
(Registrant’s Telephone Number, Including Area Code):
|
||
|
Securities registered pursuant to Section 12(b) of the Act:
|
||
|
Title of Each Class
|
Name of Each Exchange on Which Registered
|
|
|
Common shares, without par value
|
The NASDAQ Stock Market LLC and The Toronto Stock
Exchange
|
|
|
Securities registered pursuant to Section 12(g) of the Act:
|
||
Indicate by check mark if the registrant is a well-known seasoned issuer, as defined in Rule 405 of the Securities Act. Yes
o
No
ý
Indicate by check mark if the registrant is not required to file reports pursuant to Section 13 or Section 15(d) of the Act. Yes
o
No
ý
Indicate by check mark whether the registrant (1) has filed all reports required to be filed by Section 13 or 15(d) of the Securities Exchange Act of 1934 during the preceding 12 months (or for such shorter period that the registrant was required to file such reports), and (2) has been subject to such filing requirements for the past 90 days. Yes
ý
No
o
Indicate by check mark whether the registrant has submitted electronically and posted on its corporate Web site, if any, every Interactive Data File required to be submitted and posted pursuant to Rule 405 of Regulation S-T during the preceding 12 months (or for such shorter period that the registrant was required to submit and post such files). Yes
ý
No
o
Indicate by check mark if disclosure of delinquent filers pursuant to Item 405 of Regulation S-K is not contained herein, and will not be contained, to the best of registrant’s knowledge, in definitive proxy or information statements incorporated by reference in Part III of this Form 10-K or any amendment to this Form 10-K.
o
Indicate by check mark whether the registrant is a large accelerated filer, an accelerated filer, a non-accelerated filer, or a smaller reporting company. See the definitions of “large accelerated filer,” “accelerated filer” and “smaller reporting company” in Rule 12b-2 of the Exchange Act. (Check one):
|
Large accelerated filer
o
|
Accelerated filer
o
|
Non-accelerated filer
ý
(Do not check if a smaller reporting company)
|
Smaller reporting company
o
|
Indicate by check mark whether the registrant is a shell company (as defined in Rule 12b-2 of the Exchange Act). Yes
o
No
ý
The registrant is a non-accelerated filer as the aggregate market capitalization of voting and non-voting equity held by non-affiliates as at June 30, 2013 was $67,789,985
As of March 21, 2014, the registrant had 21,945,838 Common Shares, no par value, outstanding.
2
TEKMIRA PHARMACEUTICALS CORPORATION
TABLE OF CONTENTS
|
Page
|
||
3
This annual report on Form 10-K contains forward-looking information and forward-looking statements(collectively, forward-looking statements) within the meaning of applicable securities laws. All statements other than statements relating to historical matters should be considered forward-looking statements. When used in this report, the words “believe,” “expect,” “plan,” “anticipate,” “estimate,” “predict,” “may,” “could,” “should,” “intend,” “will,” “target,” “goal” and similar expressions are intended to identify forward-looking statements, although not all forward-looking statements contain these words.
Forward-looking statements in this annual report include statements about Tekmira’s strategy, future operations, clinical trials, prospects and the plans of management; RNAi (ribonucleic acid interference) product development programs; the effects of Tekmira’s products on the treatment of cancer, chronic Hepatitis B infection, infectious disease, alcohol use disorder, and other diseases; Gastrointestinal Neuroendocrine Tumors (GI-NET) or Adrenocortical Carcinoma (ACC) enrollment in a Phase I/II clinical trial with TKM-PLK1, and expected interim data from this trial in the second half of 2014; completion of the necessary preclinical work to be in a position to file an Investigational New Drug (IND) application in the second half of 2014 in order to advance TKM-HBV into a Phase I clinical trial, with data available in 2015; the development of TKM-Ebola under the “Animal Rule”; additional funding opportunities for TKM-Marburg; completion of necessary preclinical work to be in a position to file an IND in the second half of 2014 in order to advance TKM-ALDH2 into a Phase I clinical trial; potential government funding sources for new therapeutic strategies for alcohol use disorder and Tekmira’s exploration and leveraging of these partnership opportunities; the generation of data and the expectation of identifying another development candidate in 2014; the potential quantum of value of the transactions contemplated in the Monsanto option agreement; arbitration proceedings with Alnylam Pharmaceuticals, Inc. (Alnylam) in connection with ALN-VSP; ongoing advances in next-generation LNP technologies; anticipated royalty receipts based on sales of Marqibo; statements with respect to revenue and expense fluctuation and guidance; the quantum and timing of potential funding.
With respect to the forward-looking statements contained in this annual report, Tekmira has made numerous assumptions. While Tekmira considers these assumptions to be reasonable, these assumptions are inherently subject to significant business, economic, competitive, market and social uncertainties and contingencies.
Our actual results could differ materially from those discussed in the forward-looking statements as a result of a number of important factors, including the factors discussed in this annual report on Form 10-K, including those discussed in Item 1A of this report under the heading “Risk Factors,” and the risks discussed in our other filings with the Securities and Exchange Commission and Canadian Securities Regulators. Readers are cautioned not to place undue reliance on these forward-looking statements, which reflect management’s analysis, judgment, belief or expectation only as of the date hereof. We explicitly disclaim any obligation to update these forward-looking statements to reflect events or circumstances that arise after the date hereof, except as required by law.
4
|
Business
|
Overview
Tekmira is a biopharmaceutical company focused on developing RNA interference (RNAi) therapeutics. We are leveraging our extensive drug development and delivery expertise by advancing novel drugs based on our leading lipid nanoparticle (LNP) delivery technology.
RNAi has the potential to generate a broad new class of therapeutics that take advantage of the body’s own natural processes to silence genes—or more specifically to eliminate specific gene-products, from the cell. With this ability to eliminate disease causing proteins from cells, RNAi products represent opportunities for therapeutic intervention that have not been achievable with conventional drugs. Delivery technology is crucial in order to protect RNAi drugs in the blood stream following administration, allow efficient delivery to the target cells, and facilitate cellular uptake and release into the cytoplasm of the cell. Tekmira’s proprietary LNP delivery platform represents the most widely adopted delivery technology in RNAi, enabling eight clinical trials and administered to well over 200 patients to date.
With both oncology and anti-viral product platforms, augmented by additional metabolic development programs, our RNAi product pipeline is focused on areas where there is a significant unmet medical need and commercial opportunity. Tekmira’s clinical development programs include RNAi therapeutics addressing chronic hepatitis B virus infection and unmet cancer indications such as gastrointestinal neuroendocrine tumors and adrenocortical carcinoma. Tekmira’s LNP technology also enables our partners’ development programs and pipelines, providing us with non-dilutive funding to support our own therapeutic development programs. Because LNP can enable a wide variety of nucleic acid payloads, including messenger RNA, we continue to see new product development and partnering opportunities based on our industry-leading delivery expertise.
Corporate History
Tekmira was incorporated pursuant to the British Columbia Business Corporations Act (BCBCA), on October 6, 2005 and commenced active business on April 30, 2007 when Tekmira and its parent company, Inex Pharmaceuticals Corporation (Inex) were reorganized under a statutory plan of arrangement (the Reorganization) completed under the provisions of the BCBCA. The Reorganization saw Inex’s entire business transferred to and continued by Tekmira. In this discussion of corporate history the terms “we”, “us” and “our” refer to the business of Inex for the time prior to the Reorganization and the business of Tekmira for the time after the Reorganization.
Since 1992, we have focused on developing lipid delivery technologies for different classes of therapeutic agents, including chemotherapy drugs and nucleic acid drugs. Our technology was applied to the development of Marqibo, a liposomal formulation of the chemotherapy drug vincristine, which was subsequently licensed to Hana Biosciences in 2006. Under this legacy agreement, our current licensee, Spectrum Pharmaceuticals, Inc., has a license to develop Marqibo, along with two other liposomal chemotherapy products.
Since 2005, we began focusing on developing lipid nanoparticle delivery technology for a class of nucleic acid drugs called RNAi trigger molecules that mediate RNA interference, or RNAi. In 2006, we initiated a research collaboration with Alnylam Pharmaceuticals, Inc. to combine their expertise in RNAi payload or “trigger” technologies with our knowledge of RNAi delivery technology. In January 2007, we entered into a License and Collaboration Agreement with Alnylam where we obtained, among other things, a worldwide license to certain Alnylam intellectual property for the research, development, manufacturing and commercialization of RNAi products for the treatment of human diseases, and Alnylam obtained exclusive access to Tekmira’s delivery technology for siRNA and microRNA.
In 2008, we combined our business with that of Protiva Biotherapeutics, Inc. (Protiva). At the time of acquisition, Protiva was a private, venture-backed company incorporated under the laws of Canada and since 2003 had focused its business on developing lipid nanoparticle, or LNP, delivery technology for RNAi , a business similar to ours. Since commencing work on the delivery of RNAi triggers, Protiva has filed several patent applications covering different LNP formulations, manufacturing processes, and RNAi trigger design to remove any immune stimulatory properties. At the time of acquisition, Protiva had licensed its LNP technology on a non-exclusive basis to Alnylam and Merck and had access to Alnylam’s intellectual property for the research, development and commercialization of RNAi products.
The business combination was completed through our acquisition, under a share purchase agreement, of all the then outstanding shares of Protiva in consideration for common shares of Tekmira. Protiva is now our wholly-owned subsidiary. Concurrent with the completion of the business combination with Protiva, we entered into initial research agreements with F. Hoffman-La Roche Ltd and Hoffman La-Roche Inc., which we refer to together as Roche, and completed private placement investments of $5.0 million with Alnylam and $5.0 million (CDN$5.0 million) with an affiliate of Roche.
5
Since the completion of the business combination, we have focused on advancing our own collective RNAi therapeutic products and providing our lipid nanoparticle delivery technology to pharmaceutical partners and collaborators.
Recent Development
Completion of Underwritten Public Offering of Common Stock
In March 2014, we completed an underwritten public offering of 2,125,000 shares of our common stock at a price of $28.50 per share for aggregate gross proceeds of $60,562,500, before deducting underwriting discounts and commissions and other estimated offering expenses. Leerink Partners LLC acted as the sole manager for the offering. The underwriter has also been granted a 30-day option to purchase up to an additional 318,750 shares to cover over-allotments, if any, which would result in additional gross proceeds. We anticipate using the net proceeds from this offering to develop and advance product candidates through clinical trials, as well as for working capital and general corporate purposes.
RNA Interference
RNA interference (RNAi) is considered to be one of the most important discoveries in the field of biology in the last decade. The scientists who discovered the mechanism were awarded the 2006 Nobel Prize in Medicine. Intense research activity has subsequently uncovered the complex molecular mechanisms responsible for RNAi that are transforming the way that drug targets are discovered and validated. RNAi is a naturally occurring process that takes place inside cells, and includes processes whereby RNAi profoundly suppress the production of specific proteins. Synthetic RNAi trigger molecules are being developed as drugs that specifically suppress the production of disease-associated proteins through RNAi.
Using the gene sequence coding for the target protein, effective RNAi trigger molecules can be designed.. RNAi -based drugs are typically small synthetic nuclei acid molecules. When RNAi triggers are introduced into the cell they are incorporated into an RNA-induced silencing complex (RISC), which interacts specifically with mRNA coding for the target protein. mRNA are cleaved in a sequence specific manner and then destroyed, preventing production of the target protein. Importantly, this process is catalytic and RISC associated RNAi triggers can remain stable inside the cell for weeks, destroying many more copies of the target mRNA and maintaining target protein suppression for long periods of time.
Potential of RNAi Therapeutics
RNAi has the potential to generate a broad new class of therapeutics that take advantage of the body’s own natural processes to silence genes—or more specifically to eliminate specific gene-products, from the cell. While there are no RNAi therapeutics currently approved for commercial use, there are a number of RNAi products currently in human clinical trials. RNAi products are broadly applicable as they can silence, or eliminate the production of disease causing proteins from cells, thus creating opportunities for therapeutic intervention that have not been achievable with conventional drugs. Development of RNAi therapeutic products is currently limited by the instability of the RNAi trigger molecules in the bloodstream and the inability of these molecules to access target cells or tissues following intravenous, or systemic, administration, and their inability to gain entry to the inside of target cells, where they carry out their action. Delivery technology is necessary to protect these drugs in the blood stream following administration, allow efficient delivery to the target cells and facilitate cellular uptake and release into the cytoplasm of the cell.
Tekmira’s Lipid Nanoparticle (LNP) Delivery Technology
Tekmira’s LNP technology has been shown in pre-clinical studies to enable RNAi therapeutic products by overcoming the limitations of RNAi drug delivery, allowing efficient and selective ‘silencing’ or reduction of certain target proteins. We believe that Tekmira is strongly positioned to take advantage of the need for delivery technology that can efficiently encapsulate RNAi triggers, and other types of molecules, delivering them to sites of disease. We, along with our partners, are advancing RNAi therapeutic product candidates using our LNP technology as the delivery vehicle to access target tissues and cells.
Our proprietary LNP delivery technology allows RNAi triggers to be encapsulated in a particle made of lipids (fats or oils) that can be administered intravenously and travel through the blood stream to target tissues or sites of disease. The nanoparticles are designed to stay in the circulation for periods of time that allow the particle to efficiently accumulate at sites of disease such as the liver or cancerous tumors. Once the nanoparticles have accumulated at the target site, the cells take up the particle by a process called endocytosis in which the cell’s membrane surrounds the particle. This envelope or endosome pinches off from the cell’s membrane and migrates to the inside of the cell. The lipid nanoparticles undergo an interaction with the endosomal membrane and in the process the RNAi triggers are released inside the cell. The released RNAi trigger molecules engage the RISC complex, mediating RNAi.
6
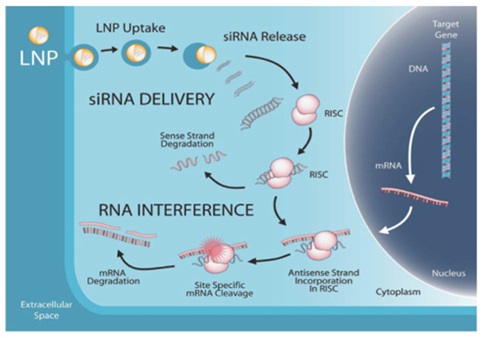
Lipid Nanoparticle (LNP)-Enabled Delivery and Mechanism of RNA Interference in Cells
Today, our LNP technology represents the most widely adopted delivery technology in RNAi, enabling eight clinical trials and administered to over 200 human subjects. Because LNP can enable a wide variety of nucleic acid payloads, including messenger RNA, we continue to see new product development and partnering opportunities based on our industry-leading delivery expertise. In October 2013, we presented new preclinical data at a scientific symposium demonstrating that mRNA when encapsulated and delivered using Tekmira’s LNP technology can be effectively delivered and expressed in liver, tumors and other specific tissues of therapeutic interest.
Our Product Pipeline
With both oncology and anti-viral product platforms, and additional metabolic research and development programs, we are advancing our RNAi product pipeline with a focus on areas where there is a significant unmet medical need and commercial opportunity.

7
Tekmira’s Product Pipeline of LNP-Enabled Therapeutics
TKM-PLK1
Our oncology product platform, TKM-PLK1, targets polo-like kinase 1 (PLK1), a protein involved in cell proliferation and a validated oncology target. Inhibition of PLK1 expression prevents the tumor cell from completing cell division, resulting in cell cycle arrest and death of the cancer cell. Evidence that patients with elevated levels of PLK1 in their tumors exhibit poorer prognosis and survival rates has been documented in the medical literature.
We presented updated Phase I TKM-PLK1 data at the 6th Annual NET Conference hosted by the North American Neuroendocrine Tumor Society (NA-NETS) held in Charleston, South Carolina on October 4, 2013. This data set included a total of 36 patients in a population of advanced cancer patients with solid tumors. Doses ranged from 0.15 mg/kg to 0.90 mg/kg during the dose escalation portion of the trial, with the maximum tolerated dose (MTD) of 0.75 mg/kg. Serious adverse events (SAEs) were experienced by four subjects in this heavily pre-treated, advanced cancer patient population, with three of these four subjects continuing on study. Forty percent (6 out of 15) of patients evaluable for response, treated at a dose equal to or greater than 0.6 mg/kg, showed clinical benefit. Three out of the four Adrenocortical Carcinoma (ACC) patients (75%) treated with TKM-PLK1 achieved stable disease, including one patient who saw a 19.3% reduction in target tumor size after two cycles of treatment and is still on study receiving TKM-PLK1. Of the two Gastrointestinal Neuroendocrine Tumors (GI-NET) patients enrolled, both experienced clinical benefit: one patient had a partial response based on RECIST response criteria, and the other GI-NET patient achieved stable disease and showed a greater than 50% reduction in Chromogranin-A (CgA) levels, a key biomarker used to predict clinical outcome and tumor response.
Based on these encouraging results from our Phase I TKM-PLK1 clinical trial, we have expanded into a Phase I/II clinical trial with TKM-PLK1, which is specifically enrolling patients within two therapeutic indications: advanced GI-NET or ACC. This multi-center, single arm, open label study is designed to measure efficacy using RECIST criteria and tumor biomarkers for GI-NET patients, as well as to continue to further evaluate the safety, tolerability and pharmacokinetics of TKM-PLK1. TKM-PLK1 will be administered weekly with each four-week cycle consisting of three once-weekly doses followed by a rest week. Enrollment is currently underway, and it t is expected that approximately 20 patients with advanced GI-NET or ACC tumors will be enrolled in this trial, with a minimum of 10 GI-NET patients to be enrolled. We expect to report interim data from this trial in the second half of 2014.
In the first half of 2014, we also expect to initiate another Phase I/II clinical trial with TKM-PLK1, enrolling patients with Hepatocellular Carcinoma (HCC). This clinical trial will be a multi-center, single arm, open label dose escalation study designed to evaluate the safety, tolerability and pharmacokinetics of TKM-PLK1 as well as determine the maximum tolerated dose in HCC patients and measure the anti-tumor activity of TKM-PLK1 in HCC patients.
TKM-HBV
Our extensive experience in the anti-viral RNAi therapeutics arena has been applied to the development of TKM-HBV, an RNAi therapeutic for the treatment of chronic Hepatitis B infection. There are over 350 million people infected globally with Hepatitis B virus (HBV). In the United States there are approximately 1.4 million HBV chronically infected individuals (Source of statistics: CDC – U.S. Centers for Disease Control and Prevention). We are focused on addressing the unmet need of eliminating HBV surface antigen expression in chronically infected patients. Small molecule nucleotide therapy is rapidly becoming the standard of care for chronically HBV infected patients. However, many of these patients continue to express a viral protein called Hepatits B surface antigen. This protein causes inflammation in the liver leading to cirrhosis and in some cases to hepatocellular cancer and death.
TKM-HBV is designed to eliminate surface antigen expression in these chronically infected patients. The rationale is that by blocking surface antigen – and reducing much of the pathology associated with surface antigen expression – this therapy will also allow these patients to undergo ‘seroconversion’, or raise an immune response, including antibodies against the virus, and effect a functional cure of the infection.
TKM-HBV is being developed as a multi-component RNAi therapeutic cocktail that targets multiple sites on the HBV genome. TKM-HBV therapeutic will employ third generation-LNP that is more potent and has a broader therapeutic index than previous generations of LNP. We anticipate presenting preclinical data in the second half of 2014 in support of filing an Investigational New Drug (IND) or equivalent application by the end of the year. Our goal is to advance TKM-HBV into a Phase I clinical trial in chronically infected HBV patients, with initial data available in 2015.
TKM-Ebola and TKM-Marburg
TKM-Ebola, an anti-Ebola viral therapeutic, is being developed under a contract with the U.S. Department of Defense’s (DoD) Joint Project Manager Medical Countermeasure Systems (JPM-MCS). In 2010, our preclinical studies were published in the medical journal
The Lancet
demonstrating that when RNAi triggers targeting the Ebola virus and delivered by Tekmira’s LNP technology were used to treat previously infected non-human primates, the result was 100 percent protection from an otherwise lethal dose of Zaire Ebola virus (Geisbert et al., The Lancet, Vol 375, May 29, 2010).
8
TKM-Ebola is being developed under an FDA regulatory construct referred to as the “Animal Rule.” The Animal Rule provides that under certain circumstances, where it is unethical or not feasible to conduct human efficacy studies, the FDA may grant marketing approval based on adequate and well-controlled animal studies when the results of those studies establish that the drug is reasonably likely to produce clinical benefit in humans. Demonstration of the product’s safety in humans is still required.
In July 2010, we signed a contract with the DoD under their JPM-MCS program, to advance the TKM-Ebola program. Based on the budget for the extended contract, this would provide us with a total of approximately $140.0 million in funding for the entire program. In May 2013, we announced that our collaboration with the JPM-MCS was modified and expanded to include advances in LNP formulation technology since the initiation of the program in 2010. These contract modifications increased the stage one targeted funding from $34.7 million to $41.7 million. We expect to release data from the single ascending dose portion of this Phase I clinical trial in the second half of 2014.
In January 2014, we commenced a Phase I clinical trial with TKM-Ebola. The trial is a randomized, single-blind, placebo-controlled study involving single ascending doses and multiple ascending doses of TKM-Ebola. The study will assess the safety, tolerability and pharmacokinetics of administering TKM-Ebola to healthy adult subjects. Four subjects will be enrolled per cohort. There are four planned cohorts for a total of 16 subjects in the single dose arm, and three planned cohorts for a total of 12 subjects in the multiple dose arm of the trial. Each cohort will enroll three subjects who receive TKM-Ebola, and one who will receive placebo.
In March 2014, we were granted a Fast Track designation from the U.S. Food and Drug Administration (FDA) for the development of TKM-Ebola. The FDA’s Fast Track is a process designed to facilitate the development and expedite the review of drugs in order to get important new therapies to the patient earlier.
Like Ebola, Marburg is a member of the filovirus family of hemorrhagic fever viruses, and there are currently no approved therapeutics available for the treatment of Marburg infection. In 2010, Tekmira and University of Texas Medical Branch (UTMB) were awarded a National Institutes of Health (NIH) grant to support research to develop RNAi therapeutics to treat Ebola and Marburg hemorrhagic fever viral infections. In February 2014, UTMB and Tekmira, along with other collaborators, were awarded additional funding from the NIH in support of this research.
In November 2013, we disclosed data from the collaboration between Tekmira and the UTMB that showed 100% survival in non-human primates infected with the Angola strain of the Marburg virus in two separate studies. In the first study, 100% survival was achieved when dosing at 0.5 mg/kg TKM-Marburg began one hour after infection with otherwise lethal quantities of the virus. Dosing then continued once daily for seven days. In the second study, 100% survival was achieved even though treatment did not begin until 24 hours after infection. These results build upon a study published earlier in the Journal of Infectious Disease showing 100% protection in guinea pig models of infection with Angola, Ci67 and Ravn strains of the Marburg virus using a broad spectrum RNAi therapeutic enabled by Tekmira’s LNP. Tekmira expects to continue to build on these data and pursue additional funding opportunities or development partnerships for TKM-Marburg.
TKM-ALDH2
In the United States, two million people seek treatment each year for alcohol use disorder, and approximately 350,000 of these patients receive pharmacotherapy for alcohol use disorder (Source of statistics: Defined Health
,
2013). TKM-ALDH2 will be developed for a clearly defined high value segment of the alcohol use disorder market, with a target patient population who have moderate to severe alcohol use disorder, such as educated professionals who have social support and are motivated to seek treatment.
TKM-ALDH2 has been designed to knock down or silence the ALDH2 enzyme to induce long term acute sensitivity to ethanol. Aldehyde dehydrogenase 2 (ALDH2) is a key enzyme in ethanol metabolism. Inhibition of aldehyde dehydrogenase 2 activity, through the silencing of ALDH2, results in the build-up of acetaldehyde. Elevated levels of acetaldehyde are responsible for the adverse physiological effects that cause individuals to avoid alcohol consumption. We have developed an extremely potent RNAi trigger and combined it with a third generation LNP. Human proof of concept for ALDH2 inhibition already exists in the form of the approved drug disulfiram. However, disulfiram’s efficacy suffers from poor compliance because it has to be taken daily. We believe that a once-monthly dose of TKM-ALDH2 could induce prolonged ethanol sensitivity, thus overcoming the patient compliance issues associated with the daily dosing of other treatments.
We anticipate completing the necessary preclinical work to be in a position to file an IND in the second half of 2014 in order to advance TKM-ALDH2 into a Phase I clinical trial in healthy volunteers. It is expected that proof-of-concept with alcohol challenge including ALDH2 knockdown, acetaldehyde build up and ethanol toxicity can be obtained in the Phase I clinical trial with data available in 2015. Because alcohol use disorder represents a significant public health problem, we believe there are government funding sources seeking to support new therapeutic strategies, and Tekmira will be exploring and leveraging these partnering opportunities.
9
Additional Discovery Programs
We are currently evaluating several additional preclinical candidates with potential in diverse therapeutic areas using key criteria to prioritize efforts. Given the extremely high efficiency of delivery for third generation liver-centric LNP formulations, we are focused on rare diseases where the molecular target is found in the liver, where early clinical proof-of-concept can be achieved and where there may be accelerated development opportunities. Two areas of interest are glycogen storage diseases and rare forms of hypertriglyceridemia. Our research team intends to continue to generate preclinical data to support the advancement of the most promising of these targets, and we expect to be in a position to identify another development candidate in 2014.
Other Partner-Based Programs
Patisiran, or ALN-TTR02, which is being developed by Alnylam, represents the most clinically advanced application of our proprietary LNP delivery technology. In November 2013, Alnylam presented positive results from its Phase II clinical trial with patisiran (ALN-TTR02), an RNAi therapeutic targeting transthyretin (TTR) for the treatment of TTR-mediated amyloidosis (ATTR), which is enabled by our LNP technology. In December 2013, Alnylam announced the initiation of the APOLLO Phase III trial of patisiran, with the study now open for enrollment, to evaluate efficacy and safety of patisiran in ATTR patients with Familial Amyloidotic Polyneuropathy (FAP). Alnylam also has two other LNP-based products in clinical development: ALN-VSP (liver cancer), and ALN-PCS02 (hypercholesterolemia). Alnylam will pay us low single digit royalties based on commercial sales of Alnylam’s LNP-enabled products. More information about our licensing agreement with Alnylam can be found under the “Strategic Alliances, Licensing Agreements, and Research Collaborations” section of this report.
Marqibo®, originally developed by Tekmira, is a novel, sphingomyelin/cholesterol liposome-encapsulated formulation of the FDA-approved anticancer drug vincristine. Marqibo’s approved indication is for the treatment of adult patients with Philadelphia chromosome-negative acute lymphoblastic leukemia (Ph- ALL) in second or greater relapse or whose disease has progressed following two or more lines of anti-leukemia therapy. Our licensee, Spectrum Pharmaceuticals, Inc. has two ongoing Phase III trials evaluating Marqibo in additional indications. In September 2013, Spectrum launched Marqibo through its existing hematology sales force in the United States and shipped the first commercial orders. We are entitled to mid-single digit royalty payments based on Marqibo’s commercial sales. More information about our licensing agreement with Spectrum can be found under the “Strategic Alliances, Licensing Agreements, and Research Collaborations” section of this report.
Ongoing Advancements in LNP Technology
We continue to develop our proprietary “gold standard” LNP delivery technology and receive clinical validation from LNP-based products currently in clinical trials. The most advanced LNP-enabled therapeutic, which is being developed by Alnylam Pharmaceuticals, Inc., has entered a Phase III clinical trial. Our LNP technology remains an important cornerstone of our business development activities moving forward. Because LNP can enable a wide variety of nucleic acid payloads, including messenger RNA, we continue to see new product development and partnering opportunities based on our industry-leading delivery expertise. In February 2014, we presented new preclinical data at a the AsiaTIDES scientific symposium in Tokyo, Japan demonstrating that messenger RNA (mRNA) can be effectively delivered and expressed in liver, tumors when encapsulated and delivered using Tekmira's LNP technology.
Strategic Alliances, Licensing Agreements, and Research Collaborations
Since inception, Tekmira has fostered collaborations and technology licensing relationships with leading companies in the RNAi field, including Alnylam Pharmaceuticals, Inc., Bristol-Myers Squibb Company, Merck & Co. Inc., , the U.S. Department of Defense’s JPM-MCS Office, Monsanto, and other undisclosed pharmaceutical and biotechnology companies.
We have certain rights under the RNAi intellectual property of Alnylam Pharmaceuticals, Inc. to develop thirteen RNAi therapeutic products. In addition, we have a broad non-exclusive license to use Unlocked Nucleobase Analogs (UNAs) from Arcturus Therapeutics, Inc. for the development of RNAi therapeutic products directed to any target in any therapeutic indication.
Alnylam Pharmaceuticals, Inc. and Acuitas Therapeutics Inc.
In November 2012, we, Alnylam, and and AlCana Technologies, Inc. (now Acuitas Therapeutics Inc.) entered into an agreement to settle all litigation and restructure the existing contractual relationship, replacing all earlier licensing, cross-licensing, collaboration, and manufacturing agreements. Consistent with the terms outlined in the 2012 settlement agreement, in December 2013, we finalized and entered a cross-license agreement with Acuitas. The terms provide Acuitas with access to certain of Tekmira’s earlier IP generated prior to April 2010 and provide us with certain access to Acuitas’ technology and licenses in the RNAi field, along with a percentage of each milestone and royalty payment with respect to certain products, and Acuitas has agreed that it will not compete in the RNAi field for a period of 5 years.
10
As a result of settlement and 2012 cross-license agreement, Tekmira received a total of $65 million in cash payments from Alnylam in November 2012. This included $30 million associated with the termination of the manufacturing agreement and $35 million associated with the termination of the previous license agreements, as well as a reduction of the milestone and royalty schedules associated with Alnylam’s ALN-VSP, ALN-PCS, and ALN-TTR programs. Of the $65 million received from Alnylam, $18.7 million was subsequently paid by us to our lead legal counsel, in satisfaction of the contingent obligation owed to that counsel. In addition, Alnylam transferred all agreed upon patents and patent applications related to LNP technology for the systemic delivery of RNAi therapeutic products, including the MC3 lipid family, to Tekmira. As a result, we own and control prosecution of this intellectual property portfolio. Tekmira is the only company able to sublicense LNP intellectual property in future platform-type relationships. Alnylam has a license to use our intellectual property to develop and commercialize products and may only grant access to our LNP technology to its partners if it is part of a product sublicense. Alnylam’s license rights are limited to patents that we filed, or that claim priority to a patent that was filed, before April 15, 2010. Alnylam does not have rights to our patents filed after April 15, 2010 unless they claim priority to a patent filed before that date. Alnylam will pay us low single digit royalties based on commercial sales of Alnylam’s LNP-enabled products. Alnylam currently has three LNP-based products in clinical development: ALN-TTR02 (patisiran), ALN-VSP, and ALN-PCS02.
The 2012 cross-license agreement with Alnylam also grants us intellectual property rights to develop our own proprietary RNAi therapeutics. Alnylam has granted us a worldwide license for the discovery, development and commercialization of RNAi products directed to thirteen gene targets – three exclusive and ten non-exclusive licenses – provided that they have not been committed by Alnylam to a third party or are not otherwise unavailable as a result of the exercise of a right of first refusal held by a third party or are part of an ongoing or planned development program of Alnylam. Licenses for five of the ten non-exclusive targets – ApoB, PLK1, Ebola, WEE1, and CSN5 – have already been granted, along with an additional license for ALDH2, which has been granted on an exclusive basis. In consideration for this license, we have agreed to pay single-digit royalties to Alnylam on product sales and have milestone obligations of up to $8.5 million on the non-exclusive licenses (with the exception of TKM-Ebola, which has no milestone obligations). Alnylam no longer has “opt-in” rights to Tekmira’s lead oncology product, TKM-PLK1, so we now hold all development and commercialization rights related TKM-PLK1. We will have no milestone obligations on the three exclusive licenses.
In December 2013, we received a $5 million milestone from Alnylam, triggered by the initiation of the APOLLO Phase III trial of patisiran. We have entered an arbitration proceeding with Alnylam, as provided for under our licensing agreement, to resolve a matter related to a disputed $5 million milestone payment to Tekmira from Alnylam related to its ALN-VSP product. We have not recorded any revenue in respect of this milestone.
Spectrum Pharmaceuticals, Inc.
In July 2013, Talon Therapeutics Inc. (formerly Hana Biosciences, Inc.) was acquired by Spectrum Pharmaceuticals, Inc. Under a legacy license agreement, Spectrum has an exclusive license to three targeted chemotherapy products originally developed by Tekmira. Marqibo (Optisomal Vincristine), Alocrest (Optisomal Vinorelbine) and Brakiva (Optisomal Topotecan). Spectrum will pay us milestones and single-digit royalties and is responsible for all future development and future expenses.
We are eligible to receive milestone payments from Spectrum of up to $18.0 million upon achievement of further development and regulatory milestones and, we will also receive single-digit royalties based on product sales. If Spectrum sublicenses any of the product candidates, Tekmira is eligible to receive a percentage of any upfront fees or milestone payments received by Spectrum. Depending on the royalty rates Spectrum receives from its sublicensees, our royalty rate may be lower on product sales by the sublicensees. The royalty rate will be reduced to low single digits if there is generic competition.
Marqibo is a novel, sphingomyelin/cholesterol liposome-encapsulated formulation of the FDA-approved anticancer drug vincristine originally developed by Tekmira. In September 2013, our licensee, Spectrum Pharmaceuticals, Inc. launched Marqibo® through its existing hematology sales force in the United States and has shipped the first commercial orders. We are entitled to mid-single digit royalty payments based on Marqibo’s commercial sales.
Monsanto Company
In January 2014, we signed an Option Agreement and a Service Agreement with Monsanto, pursuant to which Monsanto may obtain a license to use our proprietary delivery technology. The transaction supports the application of our proprietary delivery technology and related IP for use in agriculture. The potential value of the transaction could reach up to $86.2 million following the successful completion of milestones. In January 2014, we received $14.5 million of the net $16.5 million in anticipated near term payments.
Marina Biotech, Inc./Arcturus Therapeutics, Inc.
On November 29, 2012, we disclosed that we had obtained a worldwide, non-exclusive license to a novel RNAi trigger technology called Unlocked Nucleobase Analog (UNA) from Marina for the development of RNAi therapeutics. UNAs can be incorporated into RNAi drugs and have the potential to improve them by increasing their stability and reducing off-target effects. In August 2013, Marina assigned its UNA technology to Arcturus Therapeutics, Inc., and the UNA license agreement between Tekmira and Marina was assigned to Arcturus. The terms of the license are otherwise unchanged.
11
To date we have paid Marina $0.5 million in license fees and there are milestones of up to $3.2 million plus royalties for each product that we develop using UNA technology licensed from Marina.
Merck & Co., Inc. (Merck) and Alnylam license agreement
As a result of the business combination with Protiva in 2008, we acquired a non-exclusive royalty-bearing world-wide license agreement with Merck. Under the license, Merck will pay up to $17.0 million in milestones for each product they develop covered by Protiva’s intellectual property, except for the first product for which Merck will pay up to $15.0 million in milestones, and will pay royalties on product sales. Merck’s license rights are limited to patents that we filed, or that claim priority to a patent that was filed, before October 9, 2008. Merck does not have rights to our patents filed after October 9, 2008 unless they claim priority to a patent filed before that date. Merck has also granted a license to the Company to certain of its patents. On January 12, 2014, Alnylam announced that they will be acquiring certain assets license from Merck which may include the license agreement, in which case, it will transfer to Alnylam.
Bristol-Myers Squibb Company (BMS)
In May 2010 we announced the expansion of our ongoing research collaboration with BMS. Under the new agreement, BMS will use RNAi trigger molecules formulated by us in LNPs to silence target genes of interest. BMS will conduct the preclinical work to validate the function of certain genes and share the data with us. We can use the preclinical data to develop RNAi therapeutic drugs against the therapeutic targets of interest. BMS paid us $3.0 million concurrent with the signing of the agreement. We are required to provide a predetermined number of LNP batches over the four-year agreement. BMS will have a first right to negotiate a licensing agreement on certain RNAi products developed by us that evolve from BMS validated gene targets. In May 2011, we announced a further expansion of the collaboration to include broader applications of our LNP technology and additional target validation work. Recognition of revenue from agreements with BMS is covered in the Revenue section of this MD&A.
U.S. National Institutes of Health (NIH)
On October 13, 2010 we announced that together with collaborators at The University of Texas Medical Branch (UTMB), we were awarded a new NIH grant to support research to develop RNAi therapeutics to treat Ebola and Marburg hemorrhagic fever viral infections using our LNP delivery technology. The grant, worth $2.4 million, is supporting work at Tekmira and at UTMB. At December 31, 2013 the remaining balance of Tekmira’s portion of the grant was $0.04 million. In February 2014, UTMB and Tekmira, along with other collaborators, were awarded additional funding from the NIH in support of this research.
Halo-Bio RNAi Therapeutics, Inc.
On August 24, 2011, we entered into a license and collaboration agreement with Halo-Bio. Under the agreement, Halo-Bio granted to us an exclusive license to its multivalent ribonucleic acid MV-RNA technology. The agreement was amended on August 8, 2012 to adjust the future license fees and other contingent payments. To date we have recorded $0.5 million in fees under our license from Halo-Bio. We terminated the agreement with Halo-Bio on July 31, 2013. There are no further payments due or contingently payable to Halo-Bio.
Aradigm Corporation
In December 2004, we entered into a licensing agreement with Aradigm under which Aradigm exclusively licensed certain of our liposomal intellectual property for the pulmonary delivery of Ciprofloxacin. As amended, this agreement calls for milestone payments totalling $4.5 and $4.75 million, respectively, for the first two disease indications pursued by Aradigm using our technology, and for low- to mid-single-digit royalties on sales revenue from products using our technology. Aradigm has asserted that it is not using our technology in its current products, and we have now terminated the Aradigm license agreement.
University of British Columbia
Certain early work on lipid nanoparticle delivery systems and related inventions was undertaken at the University of British Columbia (UBC). These inventions are licensed to us by UBC under a license agreement, initially entered in 1998 as amended in 2006 and 2007. We have granted sublicenses under the UBC license to Alnylam as well as to Talon. Alnylam has in turn sublicensed us under the licensed UBC patents for discovery, development and commercialization of RNAi products. In mid-2009, we and our subsidiary Protiva entered into a supplemental agreement with UBC, Alnylam and AlCana Technologies, Inc., in relation to a separate research collaboration to be conducted among UBC, Alnylam and AlCana to which we have license rights. The settlement agreement signed in late 2012 to resolve the litigation among Alnylam, AlCana, Tekmira and Protiva provided for the effective termination of all obligations under such supplemental agreement as between and among all litigants.
12
Patents and Proprietary Rights
In addition to the expertise we have developed and maintain in confidence, we own a portfolio of patents and patent applications directed to LNP inventions, the formulation and manufacture of LNP-based pharmaceuticals, chemical modification of RNAi molecules, and RNAi drugs and processes directed at particular disease indications.
We have filed many patent applications with the European Patent Office that have been granted. In Europe, upon grant, a period of nine months is allowed for notification of opposition to such granted patents. If our patents are subjected to interference or opposition proceedings, we would incur significant costs to defend them. Further, our failure to prevail in any such proceedings could limit the patent protection available to our RNAi platform, including our product candidates.
Tekmira has a portfolio of approximately 95 patent families, in the U.S. and abroad, that are directed to various aspects of LNPs and LNP formulations. The portfolio includes approximately 72 issued U.S. patents, approximately 71 issued non-U.S. patents, and approximately 229 pending patent applications, including the following patents and applications in the United States and Europe
(1)
:
|
Invention
Category
|
Title
|
Priority
Filing
Date*
|
Status**
|
Expiration
Date***
|
|
LNP
|
Lipid Encapsulated Interfering RNA
|
07/16/2003
|
U.S. Pat. No.7,982,027; applications pending in the U.S. and Europe
|
07/16/2024
|
|
LNP
|
Lipid Encapsulated Interfering RNA
|
06/07/2004
|
U.S. Pat. No. 7,799,565; European Pat. No.1766035; application pending in the U.S.
|
06/07/2025
|
|
LNP
|
Novel Lipid Formulations for Nucleic Acid Delivery
|
04/15/2008
|
U.S. Pat. Nos. 8,058,069 and 8,492,359; applications pending in U.S. and Europe
|
04/15/2029
|
|
LNP
|
Novel Lipid Formulations for
Delivery of Therapeutic
Agents to Solid Tumors
|
07/01/2009
|
U.S. Pat. No.8,283,333
Applications pending in the U.S. and Europe
|
06/30/2030
|
|
LNP
Manufacturing
|
Liposomal Apparatus and Manufacturing Methods
|
06/28/2002
|
U.S. Pat. Nos. 7,901,708 and 8,329,070; European Pat. No. 1519714; application pending in the U.S.; application allowed in Europe
|
06/30/2023
|
|
LNP
Manufacturing
|
Systems and Methods for Manufacturing Liposomes
|
07/27/2005
|
Application pending in the U.S. and Europe
|
07/27/2026
|
|
Novel Lipids
|
Cationic Lipids and Methods of Use
|
06/07/2004
|
U.S. Pat. No. 7,745,651; European Pat. No. 1781593; application pending in the U.S.
|
06/07/2025
|
|
Novel Lipids
|
Polyethyleneglycol-Modified Lipid Compounds and Uses Thereof
|
09/15/2003
|
U.S. Pat. No. 7,803,397; European Pat. No. 1664316; application pending in the U.S.
|
09/15/2024
|
|
Chemical
Modifications
|
Modified siRNA Molecules and Uses Thereof
|
11/02/2005
|
U.S. Pat. Nos. 8,101,741,8,188,263 and 8,513,403; applications pending in Europe and the U.S.
|
11/02/2026
|
|
Chemical
Modifications
|
Modified siRNA Molecules and Uses Thereof
|
06/09/2006
|
U.S. Pat. No. 7,915,399
|
06/08/2027
|
|
Therapeutic
Target
|
siRNA Silencing of Apolipoprotein B
|
11/17/2004
|
Application pending in Europe
|
11/17/2025
|
|
Therapeutic
Target
|
Compositions and Methods
for Silencing Apolipoprotein
B
|
07/01/2009
|
U.S. Pat. No. 8,236,943
application pending in Europe
|
06/30/2030
|
|
Therapeutic
Target
|
siRNA Silencing of Filovirus Gene Expression
|
10/20/2005
|
U.S. Pat. No. 7,838,658
|
10/20/2026
|
|
Therapeutic
Target
|
Compositions and Methods
for Silencing Ebola Virus
Gene Expression
|
07/20/2009
|
Application allowed in the U.S.
|
07/20/2030
|
|
Therapeutic
Target
|
Silencing of Polo-Like Kinase Expression using Interfering RNA
|
12/27/2007
|
Applications pending in the U.S. and Europe
|
12/23/2028
|
|
(1)
|
Patent information current as of March 24, 2014.
|
|
*
|
Priority filing dates are based on the filing dates of provisional patent applications. Provisional applications expire unless they are converted to non-provisional applications within one year.
|
|
**
|
An “allowed” patent application is an active case that has been found by the patent office to contain patentable subject matter, subject to the payment of issue/grant fees by the applicant.
|
13
|
***
|
Once issued, the term of a US patent first filed after mid-1995 generally extends until the 20th anniversary of the filing date of the first non-provisional application to which such patent claims priority. It is important to note, however, that the United States Patent & Trademark Office, or USPTO, sometimes requires the filing of a Terminal Disclaimer during prosecution, which may shorten the term of the patent. On the other hand, certain patent term adjustments may be available based on USPTO delays during prosecution. Similarly, in the pharmaceutical area, certain patent term extensions may be available based on the history of the drug in clinical trials. We cannot predict whether or not any such adjustments or extensions will be available or the length of any such adjustments or extensions.
|
Employees
At March 21, 2014, we had 92 employees, 74 of whom were engaged in research and development. None of our employees are represented by a labor union or covered by a collective bargaining agreement, nor have we experienced work stoppages. We believe that relations with our employees are good.
Corporate information
The company is comprised of four entities, Tekmira Pharmaceuticals Corporation (“Tekmira” or “we” or “us”) and three wholly owned subsidiaries (Protiva Biotherapeutics Inc., Protiva Agricultural Development Company Inc. and Protiva Biotherapeutics U.S.A. Inc.). Tekmira was incorporated pursuant to the British Columbia Business Corporations Act, or BCBCA, on October 6, 2005 and commenced active business on April 30, 2007 when Tekmira and its parent company, Inex Pharmaceuticals Corporation, or Inex, were reorganized under a statutory plan of arrangement (the Reorganization) completed under the provisions of the BCBCA. The Reorganization saw Inex’s entire business transferred to and continued by Tekmira. Protiva Biotherapeutics Inc. is incorporated under the BCBCA and was acquired by Tekmira Pharmaceuticals Corporation on May 30, 2008. Protiva Biotherapeutics U.S.A. Inc. is incorporated in the State of Delaware and was acquired by Tekmira Pharmaceuticals Corporation on May 30, 2008. Protiva Agricultural Development Company Inc. is incorporated under the BCBCA and was formed on January 9, 2014.
Our head office and principal place of business is located at 100—8900 Glenlyon Parkway, Burnaby, British Columbia, Canada, V5J 5J8 (telephone: (604) 419-3200). Our registered and records office is located at 700 West Georgia St, 25th Floor, Vancouver, British Columbia, Canada, V7Y 1B3.
Investor information
We are a reporting issuer in Canada under the securities laws of each of the Provinces of Canada. Our common shares trade on Toronto Stock Exchange under the symbol “TKM” and, since November 15, 2010, on the NASDAQ Global Market under the symbol “TKMR.” We are currently a foreign reporting issuer for SEC reporting purposes. However, in order to be more easily compared to our principal competitors, commencing with this Form 10-K filing, we will be filing annual reports on Form 10-K, quarterly reports on Form 10-Q and current reports on Form 8-K, with the SEC, as if we were a U.S. domestic issuer.
We maintain an internet website at
http://www.tekmira.com
.
The information on our website is not incorporated by reference into this annual report on Form 10-K and should not be considered to be a part of this annual report on Form 10-K. Our website address is included in this annual report on Form 10-K as an inactive technical reference only. Our reports filed or furnished pursuant to Section 13(a) or 15(d) of the Securities Exchange Act of 1934, as amended, including our annual reports on Form 10-K (annual reports on Form 20-F up to year-ended December 31, 2012), our quarterly reports on Form 10-Q (quarterly reports on Form 6-K up to quarter-ended September 30, 2013) and our current reports on Form 8-K, and amendments to those reports, are accessible through our website, free of charge, as soon as reasonably practicable after these reports are filed electronically with, or otherwise furnished to, the SEC. We also make available on our website the charters of our audit committee, executive compensation and human resources committee and corporate governance and nominating committee, whistleblower policy, insider trading policy, and majority voting policy, as well as our code of business conduct and ethics. In addition, we intend to disclose on our web site any amendments to, or waivers from, our code of business conduct and ethics that are required to be disclosed pursuant to the SEC rules.
You may read and copy any materials we file with the SEC at the SEC’s Public Reference Room at 100 F Street, NE, Washington, DC 20549. You may obtain information on the operation of the Public Reference Room by calling the SEC at 1-800-SEC-0330. The SEC also maintains an Internet website that contains reports, proxy and information statements, and other information regarding Tekmira and other issuers that file electronically with the SEC. The SEC’s Internet website address is
http://www.sec.gov.
|
Risk Factors
|
Our business is subject to numerous risks. We caution you that the following important factors, among others, could cause our actual results to differ materially from those expressed in forward-looking statements made by us or on our behalf in filings with the SEC, press releases, communications with investors and oral statements. All statements other than statements relating to historical matters should be considered forward-looking statements. When used in this report, the words “believe,” “expect,” “plan,” “anticipate,” “estimate,” “predict,” “may” “could” “should,” “intend,” “will,” “target,” “goal” and similar expressions are intended to identify forward-looking statements, although not all forward-looking statements contain these words. Any or all of our forward-looking statements in this annual report on Form 10-K and in any other public statements we make may turn out to be wrong. They can be affected by inaccurate assumptions we might make or by known or unknown risks and uncertainties. Many factors mentioned in the discussion below will be important in determining future results. Consequently, no forward-looking statement can be guaranteed. Actual future results may vary materially from those anticipated in forward-looking statements. We explicitly disclaim any obligation to update any forward-looking statements to reflect events or circumstances that arise after the date hereof. You are advised, however, to consult any further disclosure we make in our reports filed with the SEC.
14
Risks Related to Our Business
We are in the early stages of our development and because we have a short development history with ribonucleic acid interference (RNAi), there is a limited amount of information about us upon which you can evaluate our RNAi business and prospects.
We have not begun to market or generate revenues from the commercialization of any RNAi products. We have only a limited history upon which one can evaluate our RNAi business and prospects as our RNAi therapeutic products are still at an early stage of development and thus we have limited experience and have not yet demonstrated an ability to successfully overcome many of the risks and uncertainties frequently encountered by companies in new and rapidly evolving fields, particularly in the biopharmaceutical area. For example, to execute our business plan, we will need to successfully:
|
|
·
|
execute product development activities using an unproven technology;
|
|
|
·
|
build, maintain and protect a strong intellectual property portfolio;
|
|
|
·
|
gain acceptance for the development and commercialization of any product we develop;
|
|
|
·
|
develop and maintain successful strategic relationships; and
|
|
|
·
|
manage our spending and cash requirements as our expenses are expected to increase due to research and preclinical work, clinical trials, regulatory approvals, and commercialization and maintaining our intellectual property portfolio
|
If we are unsuccessful in accomplishing these objectives, we may not be able to develop products, raise capital, expand our business or continue our operations.
The approach we are taking to discover and develop novel drug products is unproven and may never lead to marketable drug products.
We intend to concentrate our internal research and development efforts in the future on RNAi technology, and our future success depends in part on the successful development of RNAi technology and products based on RNAi technology. While RNAi technology is based on a naturally occurring process that takes place inside cells, which can suppress the production of specific proteins, and has the potential to generate therapeutic drugs that take advantage of that process, neither we nor any other company has received regulatory approval to market a therapeutic product based on RNAi technology. The scientific discoveries that form the basis for our efforts to discover and develop new products are relatively new. While there are a number of RNAi therapeutics in development, very few product candidates based on these discoveries have ever been tested in humans and there can be no assurance that any RNAi therapeutic product will be approved for commercial use.
Further, our focus solely on RNAi technology for developing products, as opposed to multiple, more proven technologies for product development, increases our risks. If we are not successful in developing a product candidate using RNAi technology, we may be required to change the scope and direction of our product development activities. In that case, we may not be able to identify and implement successfully an alternative product development strategy.
We expect to depend on our existing and new collaborators for a significant portion of our revenues and to develop, conduct clinical trials with, obtain regulatory approvals for, and manufacture, market and sell some of our product candidates. If these collaborations are unsuccessful, or anticipated milestone payments are not received, our business could be adversely affected.
We expect that we will depend in part on Alnylam, Spectrum, the DoD, and Monsanto to provide revenue to fund our operations, especially in the near term. The DoD represented 63% of our operating revenue for the year ended December 31, 2013. Furthermore, our strategy is to enter into various additional arrangements with corporate and academic collaborators, licensors, licensees and others for the research, development, clinical testing, manufacturing, marketing and commercialization of our products. We may be unable to continue to establish such collaborations, and any collaborative arrangements we do establish may be unsuccessful, or we may not receive milestone payments as anticipated.
Should any collaborative partner fail to develop or ultimately successfully commercialize any of the products to which it has obtained rights, our business may be adversely affected. In addition, once initiated, there can be no assurance that any of these collaborations will be continued or result in successfully commercialized products. Failure of a collaborative partner to continue funding any particular program could delay or halt the development or commercialization of any products arising out of such program. In addition, there can be no assurance that the collaborative partners will not pursue alternative technologies or develop alternative products either on their own or in collaboration with others, including our competitors, as a means for developing treatments for the diseases targeted by our programs.
15
We expect the DoD to fund our TKM-Ebola program through to completion of a Phase 1 human safety clinical trial and possibly beyond that to FDA drug approval. The quantum and timing of funding may not be what we have projected and the DoD could cancel this funding at any time.
We have a contract with the DoD for $41.7 million for our TKM-Ebola program through to the completion of a Phase 1 human safety clinical trial and certain manufacturing objectives. The DoD may later extend the contract to cover the entire TKM-Ebola program through to FDA drug approval.
This is our first DoD contract of any notable size. Our lack of experience in dealing with the DoD brings uncertainty into our cash flow projections and uncertainty into our ability to execute the contract within DoD requirements. Furthermore, there is inherent risk in projecting cash flows years ahead for such a complex program. The quantum and timing of funding for the TKM-Ebola program may not be what we have projected and under the terms of the contract or the proposed modification to the contract and the DoD could cancel or suspend this funding, which is paid through monthly reimbursements, at any time.
We rely on third parties to conduct our clinical trials, and if they fail to fulfill their obligations, our development plans may be adversely affected.
We rely on independent clinical investigators, contract research organizations and other third-party service providers to assist us in managing, monitoring and otherwise carrying out our clinical trials. We have contracted with, and we plan to continue to contract with, certain third parties to provide certain services, including site selection, enrolment, monitoring and data management services. Although we depend heavily on these parties, we do not control them and therefore, we cannot be assured that these third parties will adequately perform all of their contractual obligations to us. If our third-party service providers cannot adequately fulfill their obligations to us on a timely and satisfactory basis or if the quality or accuracy of our clinical trial data is compromised due to failure to adhere to our protocols or regulatory requirements, or if such third parties otherwise fail to meet deadlines, our development plans may be delayed or terminated.
We have no sales, marketing or distribution experience and would have to invest significant financial and management resources to establish these capabilities.
We have no sales, marketing or distribution experience. We currently expect to rely heavily on third parties to launch and market certain of our products, if approved. However, if we elect to develop internal sales, distribution and marketing capabilities, we will need to invest significant financial and management resources. For products where we decide to perform sales, marketing and distribution functions ourselves, we could face a number of additional risks, including:
|
|
·
|
we may not be able to attract and build a significant marketing or sales force;
|
|
|
·
|
the cost of establishing a marketing or sales force may not be justifiable in light of the revenues generated by any particular product; and
|
|
|
·
|
our direct sales and marketing efforts may not be successful.
|
If we are unable to develop our own sales, marketing and distribution capabilities, we will not be able to successfully commercialize our products, if approved, without reliance on third partie
s.
We will rely on third-party manufacturers to manufacture our products (if approved) in commercial quantities, which could delay, prevent or increase the costs associated with the future commercialization of our products.
Our product candidates have not yet been manufactured for commercial use. If any of our product candidates become approved for commercial sale, in order to supply our or our collaborators’ commercial requirements for such an approved product, we will need to establish third-party manufacturing capacity. Any third-party manufacturing partner may be required to fund capital improvements to support the scale-up of manufacturing and related activities. The third-party manufacturer may not be able to establish scaled manufacturing capacity for an approved product in a timely or economic manner, if at all. If a manufacturer is unable to provide commercial quantities of such an approved product, we will have to successfully transfer manufacturing technology to a new manufacturer. Engaging a new manufacturer for such an approved product could require us to conduct comparative studies or utilize other means to determine bioequivalence of the new and prior manufacturers’ products, which could delay or prevent our ability to commercialize such an approved product. If any of these manufacturers is unable or unwilling to increase its manufacturing capacity or if we are unable to establish alternative arrangements on a timely basis or on acceptable terms, the development and commercialization of such an approved product may be delayed or there may be a shortage in supply. Any inability to manufacture our products in sufficient quantities when needed would seriously harm our business.
Manufacturers of our approved products, if any, must comply with current good manufacturing practices (cGMP) requirements enforced by the FDA and Health Canada through facilities inspection programs. These requirements include quality control, quality assurance, and the maintenance of records and documentation. Manufacturers of our approved products, if any, may be unable to comply with these cGMP requirements and with other FDA, Health Canada, state, and foreign regulatory requirements. We have little control over our manufacturers’ compliance with these regulations and standards. A failure to comply with these requirements may result in fines and civil penalties, suspension of production, suspension or delay in product approval, product seizure or recall, or withdrawal of product approval. If the safety of any quantities supplied is compromised due to our manufacturer’s failure to adhere to applicable laws or for other reasons, we may not be able to obtain regulatory approval for or successfully commercialize our products, which would seriously harm our business.
16
Risks Related to Our Financial Results and Need for Financing
We will require substantial additional capital to fund our operations. If additional capital is not available, we may need to delay, limit or eliminate our research, development and commercialization processes and may need to undertake a restructuring.
Within the next several years, substantial additional funds will be required to continue with the active development of our pipeline products and technologies. In particular, our funding needs may vary depending on a number of factors including:
|
|
·
|
revenues earned from our partners, including Alnylam, Spectrum, and Monsanto;
|
|
|
·
|
revenues earned from our DoD contract to develop TKM-Ebola;
|
|
|
·
|
the extent to which we continue the development of our product candidates or form collaborative relationships to advance our products;
|
|
|
·
|
our decisions to in-license or acquire additional products or technology for development, in particular for our RNAi therapeutics programs;
|
|
|
·
|
our ability to attract and retain corporate partners, and their effectiveness in carrying out the development and ultimate commercialization of our product candidates;
|
|
|
·
|
whether batches of drugs that we manufacture fail to meet specifications resulting in delays and investigational and remanufacturing costs;
|
|
|
·
|
the decisions, and the timing of decisions, made by health regulatory agencies regarding our technology and products;
|
|
|
·
|
competing technological and market developments; and
|
|
|
·
|
prosecuting and enforcing our patent claims and other intellectual property rights.
|
We will seek to obtain funding to maintain and advance our business from a variety of sources including public or private equity or debt financing, collaborative arrangements with pharmaceutical and biotechnology companies and government grants and contracts. There can be no assurance that funding will be available at all or on acceptable terms to permit further development of our products especially in light of the current difficult climate for investment in early stage biotechnology companies.
If adequate funding is not available, we may be required to delay, reduce or eliminate one or more of our research or development programs or reduce expenses associated with non-core activities. We may need to obtain funds through arrangements with collaborators or others that may require us to relinquish most or all of our rights to product candidates at an earlier stage of development or on less favorable terms than we would otherwise seek if we were better funded. Insufficient financing may also mean failing to prosecute our patents or relinquishing rights to some of our technologies that we would otherwise develop or commercialize.
We have incurred losses in nearly every year since our inception and we anticipate that we will not achieve sustained profits for the foreseeable future. To date, we have had no product revenues.
With the exception of the year ended December 31, 2006 and December 31, 2012, we have incurred losses each fiscal year since inception until December 31, 2012 and have not received any revenues other than from research and development collaborations, license fees and milestone payments. From inception to December 31, 2013, we have an accumulated net deficit of $167.0 (C$243.4) million. As we continue our research and development and clinical trials and seek regulatory approval for the sale of our product candidates, we do not expect to attain sustained profitability for the foreseeable future. We do not expect to achieve sustained profits until such time as strategic alliance payments, product sales and royalty payments, if any, generate sufficient revenues to fund our continuing operations. We cannot predict if we will ever achieve profitability and, if we do, we may not be able to remain consistently profitable or increase our profitability.
Risks Related to Managing Our Operations
If we are unable to attract and retain qualified key management, scientific staff, consultants and advisors, our ability to implement our business plan may be adversely affected.
We depend upon our senior executive officers as well as key scientific, management and other personnel. The competition for qualified personnel in the biotechnology field is intense. We rely heavily on our ability to attract and retain qualified managerial, scientific and technical staff. The loss of the service of any of the members of our senior management, including Dr. Mark Murray, our Chief Executive Officer, may adversely affect our ability to develop our technology, add to our pipeline, advance our product candidates and manage our operations.
17
We may have difficulty managing our growth and expanding our operations successfully as we seek to evolve from a company primarily involved in discovery and preclinical testing into one that develops products through clinical development and commercialization.
As product candidates we develop enter and advance through clinical trials, we will need to expand our development, regulatory, manufacturing, clinical and medical capabilities or contract with other organizations to provide these capabilities for us. As our operations expand, we expect that we will need to manage additional relationships with various collaborators, suppliers and other organizations. Our ability to manage our operations and growth will require us to continue to improve our operational, financial and management controls, reporting systems and procedures. We may not be able to implement improvements to our management information and control systems in an efficient or timely manner and may discover deficiencies in existing systems or controls.
We could face liability from our controlled use of hazardous and radioactive materials in our research and development processes.
We use certain radioactive materials, biological materials and chemicals, including organic solvents, acids and gases stored under pressure, in our research and development activities. Our use of radioactive materials is regulated by the Canadian Nuclear Safety Commission for the possession, transfer, import, export, use, storage, handling and disposal of radioactive materials. Our use of biological materials and chemicals, including the use, manufacture, storage, handling and disposal of such materials and certain waste products is regulated by a number of federal, provincial and local laws and regulations. Although we believe that our safety procedures for handling such materials comply with the standards prescribed by such laws and regulations, the risk of accidental contamination or injury from these materials cannot be completely eliminated. In the event of such an accident, we could be held liable for any damages that result and any such liability could exceed our resources. We are not specifically insured with respect to this liability.
Our business and operations could suffer in the event of information technology system failures.
Despite the implementation of security measures, our internal computer systems and those of our contractors and consultants are vulnerable to damage from computer viruses, unauthorized access, natural disasters, terrorism, war, and telecommunication and electrical failures. Such events could cause interruption of our operations. For example, the loss of pre-clinical trial data or data from completed or ongoing clinical trials for our product candidates could result in delays in our regulatory filings and development efforts and significantly increase our costs. To the extent that any disruption or security breach were to result in a loss of or damage to our data, or inappropriate disclosure of confidential or proprietary information, we could incur liability and the development of our product candidates could be delayed.
Our independent auditors have not assessed our internal control over financial reporting. If our internal control over financial reporting is not effective, it could have a material adverse effect on our stock price and our ability to raise capital.
As disclosed in Item 7 of our annual report on Form 10-K for the fiscal year ended December 31, 2013, our management has evaluated, and provided a report with respect to, the effectiveness of our internal control over financial reporting as of December 31, 2013. However, because we are a “non-accelerated filer” within the meaning of Rule 12b-2 under the Exchange Act, our independent auditors are not required to assess our internal control over financial reporting or to provide a report thereon. Although our management has determined that our internal control over financial reporting was effective as of the evaluation date, there can be no assurance that our independent auditors would agree with our management’s conclusion. Furthermore, if our market capitalization, excluding affiliated stockholders, at June 30 of any fiscal year is greater than $75 million, then we will be required to obtain independent auditor certification on the adequacy of our internal control over financial reporting for that fiscal year. Given our current market capitalization, we are preparing for an independent audit of our internal control over financial reporting for our fiscal year ending December 31, 2014. If our internal control over financial reporting is determined in the future to not be effective, whether by our management or by our independent auditors, there could be an adverse reaction in the financial markets due to a loss of confidence in the reliability of our financial statements, which could materially adversely affect our stock price and our ability to raise capital necessary to operate our business. In addition, we may be required to incur costs in improving our internal control system and hiring additional personnel.
Risks Related to Development, Clinical Testing and Regulatory Approval of Our Product Candidates
The manufacture and sale of human therapeutic products are governed by a variety of statutes and regulations. There can be no assurance that our product candidates will obtain regulatory approval.
To obtain marketing approval, U.S. and Canadian laws require:
|
|
·
|
controlled research and human clinical testing;
|
|
|
·
|
establishment of the safety and efficacy of the product for each use sought;
|
|
|
·
|
government review and approval of a submission containing manufacturing, pre-clinical and clinical data;
|
|
|
·
|
adherence to Good Manufacturing Practice Regulations during production and storage; and
|
18
|
|
·
|
control of marketing activities, including advertising and labelling.
|
The product candidates we currently have under development will require significant development, pre-clinical trial and clinical testing and investment of significant funds before their commercialization. Some of our product candidates, if approved, will require the completion of post-market studies. There can be no assurance that such products will be developed. The process of completing clinical testing and obtaining required approvals is likely to take a number of years and require the use of substantial resources. If we fail to obtain regulatory approvals, our operations will be adversely affected. Further, there can be no assurance that product candidates employing a new technology will be shown to be safe and effective in clinical trials or receive applicable regulatory approvals.
Other markets have regulations and restrictions similar to those in the U.S. and Canada. Investors should be aware of the risks, problems, delays, expenses and difficulties which we may encounter in view of the extensive regulatory environment which affects our business in any jurisdiction where we develop product candidates.
If testing of a particular product candidate does not yield successful results, then we will be unable to commercialize that product candidate.
We must demonstrate our product candidates’ safety and efficacy in humans through extensive clinical testing. Our research and development programs are at an early stage of development. We may experience numerous unforeseen events during, or as a result of, the testing process that could delay or prevent commercialization of any products, including the following:
|
|
·
|
decreased demand for our product candidates;
|
|
|
·
|
impairment of our business reputation;
|
|
|
·
|
withdrawal of clinical trial participants;
|
|
|
·
|
costs of related litigation;
|
|
|
·
|
substantial monetary awards to patients or other claimants;
|
|
|
·
|
loss of revenues; and
|
|
|
·
|
the inability to commercialize our product candidates.
|
Although we currently have product liability insurance coverage for our clinical trials for expenses or losses, our insurance coverage is limited to $10 million per occurrence, and $10 million in the aggregate, and may not reimburse us or may not be sufficient to reimburse us for any or all expenses or losses we may suffer. Moreover, insurance coverage is becoming increasingly expensive and, in the future, we may not be able to maintain insurance coverage at a reasonable cost or in sufficient amounts to protect us against losses due to liability. We intend to expand our insurance coverage to include the sale of commercial products if we obtain marketing approval for our product candidates in development, but we may be unable to obtain commercially reasonable product liability insurance for any products approved for marketing. On occasion, large judgments have been awarded in class action lawsuits based on products that had unanticipated side effects. A successful product liability claim or series of claims brought against us could cause our stock price to fall and, if judgments exceed our insurance coverage, could decrease our cash and adversely affect our business.
The Animal Rule is a new and seldom-used approach to seeking approval of a new drug, and our TKM-Ebola program may not meet the requirements for this path to regulatory approval.
We plan to develop the TKM-Ebola therapeutic product candidate to treat Ebola virus using the “Animal Rule” regulatory mechanism. Pursuant to the Animal Rule, we must demonstrate efficacy in animal models and safety in humans. There is no guarantee that the FDA will agree to this approach for the development of TKM-Ebola, considering that no validated animal model has been established as predicting human outcomes in the prevention or treatment of the Ebola virus. The FDA may decide that our data are insufficient for approval and require additional pre-clinical, clinical, or other studies, or refuse to approve our products, or place restrictions on our ability to commercialize those products. Animal models represent, at best, a rough approximation of efficacy in humans, and, as such, countermeasures developed using animal models will be untested until their use in humans during an emergency.
Risks Related to Patents, Licenses and Trade Secrets
Other companies or organizations may assert patent rights that prevent us from developing or commercializing our products.
RNA interference is a relatively new scientific field that has generated many different patent applications from organizations and individuals seeking to obtain patents in the field. These applications claim many different methods, compositions and processes relating to the discovery, development and commercialization of RNAi therapeutic products. Because the field is so new, very few of these patent applications have been fully processed by government patent offices around the world, and there is a great deal of uncertainty about which patents will be issued, when, to whom, and with what claims. It is likely that there could be litigation and other proceedings, such as interference and opposition proceedings in various patent offices, relating to patent rights in the RNAi field.
19
In addition, there are many issued and pending patents that claim aspects of RNAi trigger chemistry technology that we may need to apply to our product candidates. There are also many issued patents that claim genes or portions of genes that may be relevant for RNAi trigger drug products we wish to develop. Thus, it is possible that one or more organizations will hold patent rights to which we will need a license. If those organizations refuse to grant us a license to such patent rights on reasonable terms, we will not be able to market products or perform research and development or other activities covered by these patents.
Our patents and patent applications may be challenged and may be found to be invalid, which could adversely affect our business.
Certain Canadian, U.S. and international patents and patent applications we own involve complex legal and factual questions for which important legal principles are largely unresolved. For example, no consistent policy has emerged for the breadth of biotechnology patent claims that are granted by the U.S. Patent and Trademark Office or enforced by the U.S. federal courts. In addition, the coverage claimed in a patent application can be significantly reduced before a patent is issued. Also, we face the following intellectual property risks:
|
|
·
|
some or all patent applications may not result in the issuance of a patent;
|
|
|
·
|
patents issued may not provide the holder with any competitive advantages;
|
|
|
·
|
patents could be challenged by third parties;
|
|
|
·
|
the patents of others, including Alnylam, could impede our ability to do business;
|
|
|
·
|
competitors may find ways to design around our patents; and
|
|
|
·
|
competitors could independently develop products which duplicate our products.
|
A number of industry competitors and institutions have developed technologies, filed patent applications or received patents on various technologies that may be related to or affect our business. Some of these technologies, applications or patents may conflict with our technologies or patent applications. Such conflict could limit the scope of the patents, if any, that we may be able to obtain or result in the denial of our patent applications. In addition, if patents that cover our activities are issued to other companies, there can be no assurance that we would be able to obtain licenses to these patents at a reasonable cost or be able to develop or obtain alternative technology. If we do not obtain such licenses, we could encounter delays in the introduction of products, or could find that the development, manufacture or sale of products requiring such licenses is prohibited. In addition, we could incur substantial costs in defending patent infringement suits brought against us or in filing suits against others to have such patents declared invalid. As publication of discoveries in the scientific or patent literature often lags behind actual discoveries, we cannot be certain we or any licensor was the first creator of inventions covered by pending patent applications or that we or such licensor was the first to file patent applications for such inventions. Any future proceedings could result in substantial costs, even if the eventual outcomes are favorable. There can be no assurance that our patents, if issued, will be held valid or enforceable by a court or that a competitor’s technology or product would be found to infringe such patents.
Our business depends on our ability to use RNAi technology that we have licensed or will in the future license from third parties, including Alnylam, and, if these licenses were terminated or if we were unable to license additional technology we may need in the future, our business will be adversely affected.
We currently hold licenses for certain technologies that are or may be applicable to our current and subsequent product candidates. These include a license to patents held or applied for by Alnylam and a license to UNA technology from Arcturus Therapeutics. The licenses are subject to termination in the event of a breach by us of the license, if we fail to cure the breach following notice and the passage of a cure period. The UBC license, which is sublicensed to Alnylam, is subject to termination with respect to one or more particular patents if we and Alnylam were to cease patent prosecution or maintenance activities with respect to such patent(s), or in the event of a breach by us of the license, if we fail to cure the breach following notice and the passage of a cure period. There can be no assurance that these licenses will not be terminated. We may need to acquire additional licenses in the future to technologies developed by others, including Alnylam. For example, Alnylam has granted us a worldwide license for the discovery, development and commercialization of RNAi products directed to thirteen gene targets (three exclusive and ten non-exclusive licenses). Licenses for the five non-exclusive targets and one exclusive target have already been granted. We have rights to select the gene targets for up to two more exclusive licenses and five more nonexclusive licenses from Alnylam, which would be made available to us only if they have not been previously selected by Alnylam or one of its other partners. This will limit the targets available for selection by us, and we may never be able to select gene targets or may be required to make our selection from gene targets that have minimal commercial potential. Furthermore, future license agreements may require us to make substantial milestone payments. We will also be obligated to make royalty payments on the sales, if any, of products resulting from licensed RNAi technology. For some of our licensed RNAi technology, we are responsible for the costs of filing and prosecuting patent applications. The termination of a license or the inability to license future technologies on acceptable terms may adversely affect our ability to develop or sell our products.
We may incur substantial costs as a result of litigation or other proceedings relating to patent and other intellectual property rights which could have a material adverse effect on our business, financial condition and results of operations and could cause the market value of our Common Shares to decline.
20
There has been significant litigation in the biotechnology industry over contractual obligations, patents and other proprietary rights, and we may become involved in various types of litigation that arise from time to time. Involvement in litigation could consume a substantial portion of our resources, regardless of the outcome of the litigation. Counterparties in litigation may be better able to sustain the costs of litigation because they have substantially greater resources. If claims against us are successful, in addition to any potential liability for damages, we could be required to obtain a license, grant cross-licenses, and pay substantial milestones or royalties in order to continue to develop, manufacture or market the affected products. Involvement and continuation of involvement in litigation may result in significant and unsustainable expense, and divert management’s attention from ongoing business concerns and interfere with our normal operations. Litigation is also inherently uncertain with respect to the time and expenses associated therewith, and involves risks and uncertainties in the litigation process itself, such as discovery of new evidence or acceptance of unanticipated or novel legal theories, changes in interpretation of the law due to decisions in other cases, the inherent difficulty in predicting the decisions of judges and juries and the possibility of appeals. Ultimately we could be prevented from commercializing a product or be forced to cease some aspect of our business operations as a result of claims of patent infringement or violation of other intellectual property rights and the costs associated with litigation, which could have a material adverse effect on our business, financial condition, and operating results and could cause the market value of our Common Shares to decline.
Confidentiality agreements with employees and others, including collaborators, may not adequately prevent disclosure of trade secrets and other proprietary information.
Much of our know-how and RNAi technology may constitute trade secrets. There can be no assurance, however, that we will be able to meaningfully protect our trade secrets. In order to protect our proprietary RNAi technology and processes, we rely in part on confidentiality agreements with our collaborators, employees, vendors, consultants, outside scientific collaborators and sponsored researchers, and other advisors. These agreements may not effectively prevent disclosure of confidential information and may not provide an adequate remedy in the event of unauthorized disclosure of confidential information. In addition, others may independently discover trade secrets and proprietary information, and in such cases we could not assert any trade secret rights against such party. Costly and time consuming litigation could continue to be necessary to enforce and determine the scope of our proprietary rights, and failure to obtain or maintain trade secret protection could adversely affect our competitive business position.
Risks Related to Competition
The pharmaceutical market is intensely competitive. If we are unable to compete effectively with existing drugs, new treatment methods and new technologies, we may be unable to successfully commercialize any product candidates that we develop.
The pharmaceutical market is intensely competitive and rapidly changing. Many large pharmaceutical and biotechnology companies, academic institutions, governmental agencies and other public and private research organizations are pursuing the development of novel drugs for the same diseases that we are targeting or expect to target. Many of our competitors have:
|
|
·
|
much greater financial, technical and human resources than we have at every stage of the discovery, development, manufacture and commercialization process;
|
|
|
·
|
more extensive experience in pre-clinical testing, conducting clinical trials, obtaining regulatory approvals, and in manufacturing, marketing and selling pharmaceutical products;
|
|
|
·
|
product candidates that are based on previously tested or accepted technologies;
|
|
|
·
|
products that have been approved or are in late stages of development; and
|
|
|
·
|
collaborative arrangements in our target markets with leading companies and research institutions.
|
We will face intense competition from products that have already been approved and accepted by the medical community for the treatment of the conditions for which we are currently developing products. We also expect to face competition from new products that enter the market. We believe a significant number of products are currently under development, and may become commercially available in the future, for the treatment of conditions for which we may try to develop products. These products, or other of our competitors’ products, may be more effective, safer, less expensive or marketed and sold more effectively, than any products we develop.
There are a large number of companies that are developing new agents for use in cancer therapy including RNAi therapeutics, and there are other companies developing small molecule drugs designed to inhibit the PLK1 target, including Boehringer Ingelheim, Onconova Therapeutics and Millennium/Takeda. These agents may be competitive with our product candidate TKM-PLK1. We anticipate significant competition in the HBV market with several early phase product candidates announced. In addition, there are organizations working on treatments for hemorrhagic fever viruses, such as Sarepta Therapeutics, Inc. We will also face competition for other product candidates that we expect to develop in the future.
If we successfully develop product candidates, and obtain approval for them, we will face competition based on many different factors, including:
|
|
·
|
the safety and effectiveness of our products;
|
21
|
|
·
|
the ease with which our products can be administered and the extent to which patients and physicians accept new routes of administration;
|
|
|
·
|
the timing and scope of regulatory approvals for these products;
|
|
|
·
|
the availability and cost of manufacturing, marketing and sales capabilities;
|
|
|
·
|
price;
|
|
|
·
|
reimbursement coverage; and
|
|
|
·
|
patent position.
|
Our competitors may develop or commercialize products with significant advantages over any products we develop based on any of the factors listed above or on other factors. Our competitors may therefore be more successful in commercializing their products than we are, which could adversely affect our competitive position and business. Competitive products may make any products we develop obsolete or uncompetitive before we can recover the expenses of developing and commercializing our product candidates. Such competitors could also recruit our employees, which could negatively impact our level of expertise and the ability to execute on our business plan. Furthermore, we also face competition from existing and new treatment methods that reduce or eliminate the need for drugs, such as the use of advanced medical devices. The development of new medical devices or other treatment methods for the diseases we are targeting and may target could make our product candidates noncompetitive, obsolete or uneconomical.
We face competition from other companies that are working to develop novel products using technology similar to ours. If these companies develop products more rapidly than we do or their technologies, including delivery technologies, are more effective than ours, then our ability to successfully commercialize products will be adversely affected.
In addition to the competition we face from competing products in general, we also face competition from other companies working to develop novel products using technology that competes more directly with our own. There are multiple companies working in the field of RNAi, including major pharmaceutical companies such as Novartis International AG, Takeda Pharmaceutical Company Limited, and Merck, and biotechnology companies such as Alnylam, Quark Pharmaceuticals, Inc., Silence Therapeutics plc, Arrowhead Research Corporation and its subsidiary, Calando Pharmaceuticals, Inc., Marina, RXi Pharmaceuticals Corporation, Dicerna Pharmaceuticals, Inc., Sylentis S.A., Santaris Pharma A/S, and Benitec Ltd., among others. Any of these companies may develop its RNAi technology more rapidly and more effectively than we do or may develop products against the same target or disease indication that we are pursuing.
We also compete with companies working to develop antisense-based drugs, such as Isis Pharmaceuticals, Inc. and Sarepta. Like RNAi therapeutic products, antisense drugs target messenger RNAs, or mRNAs, in order to suppress the activity of specific genes. Isis is the developer of a currently approved antisense drug and has several antisense product candidates in clinical trials. Isis has also licensed its antisense technology to a number of other companies that are developing antisense-based drugs. The development of antisense drugs is more advanced than that of RNAi therapeutic products, and antisense technology may become the preferred technology for products that target mRNAs to silence specific genes.
In addition to competition with respect to RNAi and with respect to specific products, we face substantial competition to discover and develop safe and effective means to deliver RNAi triggerss to the relevant cell and tissue types. Our competitors may develop safer and more effective means to deliver RNAi triggerss to the relevant cell and tissue types than our existing lipid nanoparticle delivery technology, and our ability to successfully commercialize our products would be adversely affected. In addition, substantial resources are being expended by third parties in the effort to discover and develop alternative means of delivering RNAi triggerss into the relevant cell and tissue types, both in academic laboratories and in the corporate sector. Some of our competitors have substantially greater resources than we do, and if our competitors are able to negotiate exclusive access to those delivery solutions developed by third parties, we may be unable to successfully commercialize our product candidates.
Risks Related to the Ownership of our Common Shares
If our stock price fluctuates, our investors could incur substantial losses.
The market price of our Common Shares may fluctuate significantly in response to factors that are beyond our control. The stock market in general has recently experienced extreme price and volume fluctuations. The market prices of securities of pharmaceutical and biotechnology companies have been extremely volatile, and have experienced fluctuations that often have been unrelated or disproportionate to the operating performance of these companies. These broad market fluctuations could result in extreme fluctuations in the price of our Common Shares, which could cause our investors to incur substantial losses.
There is no assurance that an active trading market in our Common Shares will be sustained.
Our Common Shares are listed for trading on the NASDAQ and the TSX exchanges. However, there can be no assurances that an active trading market in our Common Shares on these stock exchanges will be sustained.
22
We are incorporated in Canada and all of our assets, the majority of our officers and a significant number of our directors reside outside the United States, with the result that it may be difficult for investors to enforce any judgments obtained against us or some of our directors or officers.
We and our wholly-owned subsidiary, Protiva, are each incorporated under the laws of the Province of British Columbia and all of our assets are located outside the United States. In addition, the majority of our officers and a significant number of our directors are nationals or residents of countries other than the United States, and all or a substantial portion of such persons’ assets are located outside the United States. While we have appointed National Registered Agents, Inc. as our agent for service of process to effect service of process within the United States upon us, it may not be possible for you to enforce against us or those persons in the United States, judgments obtained in U.S. courts based upon the civil liability provisions of the U.S. federal securities laws or other laws of the United States. In addition, there is doubt as to whether original action could be brought in Canada against us or our directors or officers based solely upon U.S. federal or state securities laws and as to the enforceability in Canadian courts of judgments of U.S. courts obtained in actions based upon the civil liability provisions of U.S. federal or state securities laws.
As a foreign private issuer, we are subject to different United States securities laws and rules than a domestic United States issuer, which may limit the information publicly available to our shareholders.
We are currently a “foreign private issuer” as defined under U.S. securities laws. As a result, even though we are subject to the informational requirements of the Exchange Act, as a foreign private issuer, we are currently exempt from certain informational requirements of the Exchange Act to which domestic U.S. issuers are subject, such as the proxy solicitation rules under Section 14 of the Exchange Act. In order to be more easily compared to our principal competitors, commencing with this Form 10-K filing, we will be filing annual reports on Form 10-K, quarterly reports on Form 10-Q and current reports on Form 8-K, with the SEC, as if we were a U.S. domestic issuer. The insider reporting and short-profit provisions under Section 16 of the Exchange Act are not applicable to us, so our shareholders may not know on as timely a basis when our officers, directors and principal shareholders purchase or sell our Common Shares, as the reporting periods under the corresponding Canadian insider reporting requirements are longer.
We may lose our foreign private issuer status in the future, which could result in significant additional costs and expenses to us.
In order to maintain our current status as a foreign private issuer, a majority of our Common Shares must be either directly or indirectly owned by non-residents of the United States, unless we satisfy all of the additional requirements necessary to preserve this status. We expect that in the future we might lose our foreign private issuer status. If we are not a foreign private issuer, we would not be eligible to use certain foreign issuer forms and would be required to file periodic and current reports and registration statements on United States domestic issuer forms with the SEC. In addition, we may lose the ability to rely upon exemptions from NASDAQ corporate governance requirements that are available to foreign private issuers. Further, if we engage in capital raising activities after losing our foreign private issuer status, there is a higher likelihood that investors may require us to file resale registration statements with the SEC as a condition to any such financing.
If we are deemed to be a “passive foreign investment company” for the current or any future taxable year, investors who are subject to United States federal taxation would likely suffer materially adverse U.S. federal income tax consequences.
We generally will be a “passive foreign investment company” under the meaning of Section 1297 of the U.S. Internal Revenue Code of 1986, as amended (the “Code”), (a “PFIC”) if (a) 75% or more of our gross income is “passive income” (generally, dividends, interest, rents, royalties, and gains from the disposition of assets producing passive income) in any taxable year, or (b) if at least 50% or more of the quarterly average value of our assets produce, or are held for the production of, passive income in any taxable year. A shareholder who is a U.S. person (as such term is defined under applicable U.S. legislation) should be aware that we believe that we were a PFIC during one or more prior taxable years. We have not yet made a determination as to whether we were a PFIC in respect of our taxable year ended December 31, 2013. If we are a PFIC for any taxable year during which a U.S. person holds our Common Shares, it would likely result in materially adverse U.S. federal income tax consequences for such U.S. person, including, but not limited to, any gain from the sale of our Common Shares would be taxed as ordinary income, as opposed to capital gain, and such gain and certain distributions on our Common Shares would be subject to an interest charge, except in certain circumstances. It may be possible for U.S. persons to fully or partially mitigate such tax consequences by making a “qualifying electing fund election,” as defined in the Code (a “QEF Election”), but there is no assurance that we will provide such persons with the information that we are required to provide to them in order to assist them in making a QEF Election. In addition, U.S. persons that hold Common Shares issuable upon exercise of warrants are generally not eligible to make certain elections available under the Code that are intended to mitigate the adverse tax consequences of PFIC rules with respect to such warrant shares unless such holders also elect to make a deemed taxable sale of their warrant shares. The PFIC rules are extremely complex.
Our articles and certain Canadian laws could delay or deter a change of control.
Our preferred shares are available for issuance from time to time at the discretion of our board of directors, without shareholder approval. Our articles allow our board, without shareholder approval, to determine the special rights to be attached to our preferred shares, and such rights may be superior to those of our Common Shares.
23
In addition, limitations on the ability to acquire and hold our Common Shares may be imposed by the Competition Act in Canada. This legislation permits the Commissioner of Competition of Canada to review any acquisition of a significant interest in us. This legislation grants the Commissioner jurisdiction to challenge such an acquisition before the Canadian Competition Tribunal if the Commissioner believes that it would, or would be likely to, result in a substantial lessening or prevention of competition in any market in Canada. The Investment Canada Act subjects an acquisition of control of a company by a non-Canadian to government review if the value of our assets, as calculated pursuant to the legislation, exceeds a threshold amount. A reviewable acquisition may not proceed unless the relevant minister is satisfied that the investment is likely to result in a net benefit to Canada. Any of the foregoing could prevent or delay a change of control and may deprive or limit strategic opportunities for our shareholders to sell their shares.
The exercise of all or any number of outstanding stock options, the award of any additional options, bonus shares or other stock-based awards or any issuance of shares to raise funds or acquire a business may dilute your Common Shares.
We have in the past and may in the future grant to some or all of our directors, officers and employees options to purchase our Common Shares and other stock-based awards as non-cash incentives to those persons. The issuance of any equity securities could, and the issuance of any additional shares will, cause our existing shareholders to experience dilution of their ownership interests.
Any additional issuance of shares or a decision to acquire other businesses through the sale of equity securities, may dilute our investors’ interests, and investors may suffer dilution in their net book value per share depending on the price at which such securities are sold. Such issuance may cause a reduction in the proportionate ownership and voting power of all other shareholders. The dilution may result in a decline in the price of our Common Shares or a change in control.
We do not expect to pay dividends for the foreseeable future.
We have not paid any cash dividends to date and we do not intend to declare dividends for the foreseeable future, as we anticipate that we will reinvest future earnings, if any, in the development and growth of our business. Therefore, investors will not receive any funds unless they sell their Common Shares, and shareholders may be unable to sell their shares on favorable terms or at all. We cannot assure you of a positive return on investment or that you will not lose the entire amount of your investment in our Common Shares. Prospective investors seeking or needing dividend income or liquidity should not purchase our Common Shares.
The value of our securities, including our Common Shares, might be affected by matters not related to our operating performance and could subject us to securities litigation.
The value of our Common Shares may be reduced for a number of reasons, many of which are outside our control, including:
|
|
·
|
general economic and political conditions in Canada, the United States and globally;
|
|
|
·
|
governmental regulation of the health care and pharmaceutical industries;
|
|
|
·
|
failure to achieve desired drug discovery outcomes by us or our collaborators;
|
|
|
·
|
failure to obtain industry partner and other third party consents and approvals, when required;
|
|
|
·
|
stock market volatility and market valuations;
|
|
|
·
|
competition for, among other things, capital, drug targets and skilled personnel;
|
|
|
·
|
the need to obtain required approvals from regulatory authorities;
|
|
|
·
|
revenue and operating results failing to meet expectations in any particular period;
|
|
|
·
|
investor perception of the health care and pharmaceutical industries;
|
|
|
·
|
limited trading volume of our Common Shares;
|
|
|
·
|
announcements relating to our business or the businesses of our competitors; and
|
|
|
·
|
our ability or inability to raise additional funds.
|
|
Unresolved Staff Comments
|
Not Applicable.
|
Properties
|
Our head office and principal place of business is located at 100-8900 Glenlyon Parkway, Burnaby, British Columbia, Canada, V5J 5J8. The Company leases a 51,000 square foot facility. The lease expires in July 2014 but the Company has the option to extend the lease to 2017 and then to 2022 and then to 2027.
We believe that the total space available to us under our current lease will meet our needs for the foreseeable future and that additional space would be available to us on commercially reasonable terms if required.
24
|
Legal Proceedings
|
We are involved with various legal matters arising in the ordinary course of business. We make provisions for liabilities when it is both probable that a liability has been incurred and the amount of the loss can be reasonably estimated. Such provisions are reviewed at least quarterly and adjusted to reflect the impact of any settlement negotiations, judicial and administrative rulings, advice of legal counsel, and other information and events pertaining to a particular case. Litigation is inherently unpredictable. Although the ultimate resolution of these various matters cannot be determined at this time, we do not believe that such matters, individually or in the aggregate, will have a material adverse effect on our consolidated results of operations, cash flows, or financial condition.
Alnylam Pharmaceuticals Inc. (“Alnylam”)
On June 21, 2013, we transferred manufacturing process technology to Ascletis Pharmaceuticals (Hangzhou) Co., Ltd. (“Ascletis”) to enable them to produce ALN-VSP, a product candidate licensed to them by Alnylam. We believe that under a licensing agreement with Alnylam, the technology transfer to Ascletis triggers a $5,000,000 milestone obligation from Alnylam to the Company. However, Alnylam has demanded a declaration that we have not yet met our milestone obligations. We dispute Alnylam’s position. To remedy this dispute, we have commenced arbitration proceedings with Alnylam, as provided for under the agreement.
|
Mine Safety Disclosures
|
Not applicable.
25
|
Market for Registrant’s Common Equity, Related Stockholder Matters and Issuer Purchases of Equity Securities
|
On November 15, 2010, our common shares began to trade on the NASDAQ Global Market under the symbol “TKMR”. Our common shares are also traded on the Toronto Stock Exchange in Canada under the symbol “TKM”. As at March 21, 2014, there were 137 registered holders of common shares and 21,945,838 common shares issued and outstanding. The following table shows the progression in the high and low trading prices of our common shares on the NASDAQ Global Market and the Toronto Stock Exchange for the periods listed:
|
|
NASDAQ
High
(US$)
|
|
NASDAQ
Low
(US$)
|
|
TSX
High
(C$)
|
|
TSX
Low
(C$)
|
|||||||||
|
Year Ended:
|
|
|
|
|
||||||||||||
|
December 31, 2013
|
|
$
|
11.42
|
|
|
$
|
4.18
|
|
|
$
|
11.62
|
|
|
$
|
4.31
|
|
|
December 31, 2012
|
|
$
|
6.78
|
|
|
$
|
1.52
|
|
|
$
|
6.49
|
|
|
$
|
1.41
|
|
|
Quarter Ended:
|
|
|
|
|
||||||||||||
|
December 31, 2013
|
|
$
|
11.42
|
|
|
$
|
6.93
|
|
|
$
|
11.62
|
|
|
$
|
7.16
|
|
|
September 30, 2013
|
|
$
|
7.72
|
|
|
$
|
4.70
|
|
|
$
|
7.90
|
|
|
$
|
4.96
|
|
|
June 30, 2013
|
|
$
|
5.25
|
|
|
$
|
4.25
|
|
|
$
|
5.34
|
|
|
$
|
4.35
|
|
|
March 31, 2013
|
|
$
|
5.53
|
|
|
$
|
4.18
|
|
|
$
|
5.45
|
|
|
$
|
4.31
|
|
|
December 31, 2012
|
|
$
|
6.78
|
|
|
$
|
3.22
|
|
|
$
|
6.49
|
|
|
$
|
3.21
|
|
|
September 30, 2012
|
|
$
|
4.22
|
|
|
$
|
2.04
|
|
|
$
|
4.09
|
|
|
$
|
1.98
|
|
|
June 30, 2012
|
|
$
|
2.80
|
|
|
$
|
1.77
|
|
|
$
|
2.64
|
|
|
$
|
1.91
|
|
|
March 31, 2012
|
|
$
|
2.91
|
|
|
$
|
1.52
|
|
|
$
|
2.85
|
|
|
$
|
1.41
|
|
|
Month Ended:
|
|
|
|
|
||||||||||||
|
February 28, 2014
|
|
$
|
24.88
|
|
|
$
|
13.66
|
|
|
$
|
27.50
|
|
|
$
|
15.06
|
|
|
January 31, 2014
|
|
$
|
14.85
|
|
|
$
|
7.65
|
|
|
$
|
16.50
|
|
|
$
|
8.14
|
|
Material Modifications to the Rights of Security Holders/Use of Proceeds
Not applicable.
Purchase of Equity Securities by the Issuer and Affiliated Purchasers
Not applicable.
Recent Sales of Unregistered Securities
None.
Stock Performance Graph
The following performance graph and related information shall not be deemed “soliciting material” or to be “filed” with the SEC, nor shall such information be incorporated by reference into any future filing under the Securities Act of 1933 or Securities Exchange Act of 1934, each as amended, except to the extent that we specifically incorporate it by reference into such filing
.
The following graph compares the cumulative shareholder return on an investment of C$100 in the Common Shares of the Company on the TSX from December 31, 2008, with a cumulative total shareholder return on the S&P/TSX Composite Total Return Index.
26
Geographic Breakdown of Shareholders
As of March 18, 2014, our shareholder register indicates that our common shares are held as follows:
|
Location
|
|
Number of Shares
|
|
Percentage of
Total Shares
|
Number of Registered
Shareholders of
Record
|
|||||||
|
Canada
|
|
15,218,380
|
|
|
69.35
|
%
|
119
|
|
||||
|
United States
|
|
6,726,657
|
|
|
30.65
|
%
|
14
|
|
||||
|
Other
|
|
801
|
|
|
0.00
|
%
|
4
|
|
||||
|
|
|
|||||||||||
|
Total
|
|
21,945,838
|
|
|
100
|
%
|
137
|
|
||||
Our securities are recorded in registered form on the books of our transfer agent, CST Trust Company, located at 1600-1066 West Hastings Street, Vancouver, BC V6E 3X1. However, the majority of such shares are registered in the name of intermediaries such as brokerage houses and clearing houses (on behalf of their respective brokerage clients). We are permitted, upon request to our transfer agent, to obtain a list of our beneficial shareholders who do not object to their identities being disclosed to us. We are not permitted to obtain from our transfer agent a list of our shareholders who have objected to their identities being disclosed to us.
Shares registered in intermediaries were assumed to be held by residents of the same country in which the clearing house was located.
Dividends
We have not declared or paid any dividends on our common shares since the date of our incorporation. We intend to retain our earnings, if any, to finance the growth and development of our business and do not expect to pay dividends or to make any other distributions in the near future. Our board of directors will review this policy from time to time having regard to our financing requirements, financial condition and other factors considered to be relevant.
|
Selected Consolidated Financial Data
|
The following table presents selected financial data derived from Tekmira’s audited consolidated financial statements for each of the five years for the period ending December 31, 2013. You should read this information in conjunction with our financial statements for the periods presented, as well as Item 1 “
Business
” and Item 7 “
Management’s Discussion and Analysis of Financial Condition and Results of Operations
” included elsewhere in this Annual Report.
Historical results are not necessarily indicative of future results.
27
Summary Financial Information
Under U.S. GAAP (in thousands of US dollars, except per share amounts)
|
Year Ended December 31,
|
||||||||||||||||||||
|
2013
|
2012
|
2011
|
2010
|
2009
|
||||||||||||||||
| $ | $ | $ | $ | $ | ||||||||||||||||
|
Operating Data
|
||||||||||||||||||||
|
Revenue
|
15,464 | 14,105 | 16,812 | 20,745 | 12,693 | |||||||||||||||
|
Expenses
|
27,617 | 27,050 | 27,505 | 32,900 | 20,151 | |||||||||||||||
|
Loss from operations
|
(12,153 | ) | (12,945 | ) | (10,694 | ) | (12,155 | ) | (7,458 | ) | ||||||||||
|
Net income (loss)
|
(14,064 | ) | 29,612 | (10,083 | ) | (12,058 | ) | (7,697 | ) | |||||||||||
|
Weighted average number of common shares—basic
(1)
|
15,303 | 13,728 | 11,319 | 10,333 | 10,325 | |||||||||||||||
|
Weighted average number of common shares—diluted
(1)
|
15,303 | 14,321 | 11,319 | 10,333 | 10,325 | |||||||||||||||
|
Income (loss) per common share—basic
|
(0.92 | ) | 2.16 | (0.89 | ) | (1.17 | ) | (0.75 | ) | |||||||||||
|
Income (loss) per common share—diluted
|
(0.92 | ) | 2.07 | (0.89 | ) | (1.17 | ) | (0.75 | ) | |||||||||||
|
Balance Sheet Data
|
||||||||||||||||||||
|
Total current assets
|
70,343 | 51,243 | 11,594 | 18,006 | 24,803 | |||||||||||||||
|
Total assets
|
71,716 | 52,595 | 13,758 | 21,136 | 27,956 | |||||||||||||||
|
Total liabilities
|
12,522 | 11,676 | 8,531 | 10,345 | 6,513 | |||||||||||||||
|
Share capital
|
242,045 | 206,572 | 200,965 | 196,393 | 195,727 | |||||||||||||||
|
Total stockholders’ equity
|
59,193 | 40,919 | 5,227 | 10,791 | 21,463 | |||||||||||||||
|
Number of shares outstanding
(1)
|
19,049 | 14,305 | 12,149 | 10,339 | 10,329 | |||||||||||||||
Notes:
|
(1)
|
On November 4, 2010, Tekmira completed a consolidation of its common shares whereby five old common shares of Tekmira were exchanged for one new common share of Tekmira. Except as otherwise indicated, all references to common shares, common shares outstanding, average number of common shares outstanding, per share amounts and options in this document have been restated to reflect the common shares consolidation on a retroactive basis.
|
|
Management’s Discussion and Analysis of Financial Condition and Results of Operations
|
Change in reporting currency
Our functional currency is the Canadian dollar. However, most of our competitors, and a large proportion of our investors, are based in the United States. To achieve greater comparability with our competitors’ financial information and improve the understandability of our financial information for our U.S. investors, effective October 1, 2013, we are using United States dollars as our reporting currency. All assets and liabilities are translated using the exchange rate at the balance sheet date. Revenues, expenses and other income (losses) are translated using the average rate for the period, except for large transactions, which are translated at the exchange rate on the date of the transaction. As a result of the change in reporting currency, we are reporting an accumulated other comprehensive loss of $15.8 million as at December 31, 2013 (2012 - $12.7 million; 2011 – $13.1 million) in our consolidated balance sheets. As the translation differences from our functional currency of Canadian dollars to our reporting currency of U.S. dollars are unrealized gains and losses, the differences are recorded in other comprehensive income, and do not impact the calculation of income or loss per share. All dollar amounts in this MD&A are U.S. dollars unless otherwise stated.
OVERVIEW
Tekmira is a biopharmaceutical company focused on developing and advancing novel RNA interference therapeutics, as well as pursuing partnering opportunities for its leading lipid nanoparticle (LNP) delivery technology. RNAi has the potential to generate a broad new class of therapeutics that take advantage of the body’s own natural processes to silence genes—or more specifically to eliminate specific gene-products, from the cell. With this ability to eliminate disease causing proteins from cells, RNAi products represent opportunities for therapeutic intervention that have not been achievable with conventional drugs. Delivery technology is crucial in order to protect RNAi drugs in the blood stream following administration, allow efficient delivery to the target cells, and facilitate cellular uptake and release into the cytoplasm of the cell. Tekmira’s LNP technology represents the most widely adopted delivery technology in RNAi, enabling eight clinical trials and administered to well over 200 patients to date. Because LNP can enable a wide variety of nucleic acid payloads, including messenger RNA, we continue to see new product development and partnering opportunities based on our industry-leading delivery expertise.
28
Our Product Candidates
With both oncology and anti-viral product platforms, we are advancing our RNAi product pipeline with a focus on areas where there is a significant unmet medical need and commercial opportunity.
TKM-PLK1
Our oncology product platform, TKM-PLK1, targets polo-like kinase 1 (PLK1), a protein involved in tumor cell proliferation and a validated oncology target. Inhibition of PLK1 expression prevents the tumor cell from completing cell division, resulting in cell cycle arrest and death of the cancer cell. Evidence that patients with elevated levels of PLK1 in their tumors exhibit poorer prognosis and survival rates has been documented in the medical literature.
We presented updated Phase I TKM-PLK1 data at the 6th Annual NET Conference hosted by the North American Neuroendocrine Tumor Society (NA-NETS) held in Charleston, South Carolina on October 4, 2013. This data set included a total of 36 patients in a population of advanced cancer patients with solid tumors. Doses ranged from 0.15 mg/kg to 0.90 mg/kg during the dose escalation portion of the trial, with the maximum tolerated dose (MTD) of 0.75 mg/kg. Serious adverse events (SAEs) were experienced by four subjects in this heavily pre-treated, advanced cancer patient population, with three of these four subjects continuing on study. Forty percent (6 out of 15) of patients evaluable for response, treated at a dose equal to or greater than 0.6 mg/kg, showed clinical benefit. Three out of the four Adrenocortical Carcinoma (ACC) patients (75%) treated with TKM-PLK1 achieved stable disease, including one patient who saw a 19.3% reduction in target tumor size after two cycles of treatment and is still on study receiving TKM-PLK1. Of the two Gastrointestinal Neuroendocrine Tumors (GI-NET) patients enrolled, both experienced clinical benefit: one patient had a partial response based on RECIST response criteria, and the other GI-NET patient achieved stable disease and showed a greater than 50% reduction in Chromogranin-A (CgA) levels, a key biomarker used to predict clinical outcome and tumor response.
Based on the encouraging results from the dose escalation portion and expansion cohort from our Phase I TKM-PLK1 clinical trial, we have expanded into a Phase I/II clinical trial with TKM-PLK1, which is specifically enrolling patients within two therapeutic indications: advanced GI-NET or ACC. This multi-center, single arm, open label study is designed to measure efficacy using RECIST criteria and tumor biomarkers for GI-NET patients, as well as to evaluate the safety, tolerability and pharmacokinetics of TKM-PLK1. TKM-PLK1 will be administered weekly with each four-week cycle consisting of three once-weekly doses followed by a rest week. It is expected that approximately 20 patients with advanced GI-NET or ACC tumors will be enrolled in this trial, with a minimum of 10 GI-NET patients to be enrolled. We expect to report interim data from this trial in the second half of 2014.
In the first half of 2014, we also expect to initiate another Phase I/II clinical trial with TKM-PLK1, enrolling patients with Hepatocellular Carcinoma (HCC). This clinical trial will be a multi-center, single arm, open label dose escalation study designed to evaluate the safety, tolerability and pharmacokinetics of TKM-PLK1 as well as determine the maximum tolerated dose in HCC patients and measure the anti-tumor activity of TKM-PLK1 in HCC patients.
TKM-HBV
Our extensive experience in the anti-viral arena has been applied to our TKM-HBV program, and the development of an RNAi therapeutic for the treatment of chronic Hepatitis B infection. There are over 350 million people infected globally with Hepatitis B virus (HBV). In the United States there are approximately 1.4 million HBV chronically infected individuals. We are focused on addressing the unmet need of eliminating HBV surface antigen expression in chronically infected patients. Small molecule nucleotide therapy is rapidly becoming the standard of care for chronically HBV infected patients. However, many of these patients continue to express a viral protein called surface antigen. This protein causes inflammation in the liver leading to cirrhosis and in some cases to hepatocellular cancer and death.
TKM-HBV is designed to eliminate surface antigen expression in these chronically infected patients. The rationale is that by blocking surface antigen – and reducing much of the pathology associated with surface antigen expression – this therapy will also allow these patients a potential to ‘sero-convert’, or raise their own antibodies against the virus, and effect a functional cure of the infection.
TKM-HBV is being developed as a multi-component RNAi therapeutic that targets multiple sites on the HBV genome. Because HBV is a viral infection of the liver, the TKM-HBV therapeutic will employ a liver-centric, third generation-LNP formulation that is more potent and has a broader therapeutic index than any LNP currently in clinical development. We expect to present preclinical data in the second half of 2014. We anticipate completing the necessary preclinical work to be in a position to file an Investigational New Drug (IND) application in the second half of 2014 in order to advance TKM-HBV into a Phase I clinical trial in chronically infected HBV patients, with data available in 2015.
TKM-Ebola and TKM-Marburg
TKM-Ebola, an anti-Ebola viral therapeutic, is being developed under a contract with the U.S. Department of Defense’s (DoD) Joint Project Manager Medical Countermeasure Systems (JPM-MCS). In 2010, preclinical studies were published in the medical journal
The Lancet
demonstrating that when RNAi triggers targeting the Ebola virus and delivered by Tekmira’s LNP technology were used to treat previously infected non-human primates, the result was 100 percent protection from an otherwise lethal dose of Zaire Ebola virus (Geisbert et al., The Lancet, Vol 375, May 29, 2010).
29
In July 2010, we signed a contract with the DoD under their JPM-MCS program to advance TKM-Ebola, providing us with approximately $140.0 million in funding for the entire program. In May 2013 we announced that our collaboration with the JPM-MCS was modified and expanded to include advances in LNP formulation technology since the initiation of the program in 2010. The recent contract modification increases the stage one targeted funding from $34.7 million to $41.7 million.
In January 2014, we commenced a Phase I clinical trial with TKM-Ebola. The trial is a randomized, single-blind, placebo-controlled study involving single ascending doses and multiple ascending doses of TKM-Ebola. The study will assess the safety, tolerability and pharmacokinetics of administering TKM-Ebola to healthy adult subjects. Four subjects will be enrolled per cohort. There are four planned cohorts for a total of 16 subjects in the single dose arm, and three planned cohorts for a total of 12 subjects in the multiple dose arm of the trial. Each cohort will enroll three subjects who receive TKM-Ebola, and one who will receive placebo.
In March 2014, we were granted a Fast Track designation from the U.S. Food and Drug Administration (FDA) for the development of TKM-Ebola. The FDA’s Fast Track is a process designed to facilitate the development and expedite the review of drugs in order to get important new therapies to the patient earlier.
TKM-Ebola is being developed under specific FDA regulatory guidelines called the “Animal Rule.” The Animal Rule provides that under certain circumstances, where it is unethical or not feasible to conduct human efficacy studies, the FDA may grant marketing approval based on adequate and well-controlled animal studies when the results of those studies establish that the drug is reasonably likely to produce clinical benefit in humans. Demonstration of the product’s safety in humans is still required.
Like Ebola, Marburg is a member of the filovirus family of hemorrhagic fever viruses. Regularly occurring natural outbreaks with the Marburg Angola strain have resulted in mortality in approximately 90% of infected individuals, matching that of the most lethal Ebola strains, while in laboratory settings experimental infection with either virus is uniformly lethal (Source of statistics: WHO, World Health Organization). There are currently no approved therapeutics available for the treatment of Marburg infection. In 2010, Tekmira and the University of Texas Medical Branch (UTMB) were awarded a National Institutes of Health (NIH) grant to support research to develop RNAi therapeutics to treat Ebola and Marburg hemorrhagic fever viral infections. In February 2014, UTMB and Tekmira, along with other collaborators, were awarded additional funding from the NIH in support of this research.
In November 2013, we announced data from a collaboration between Tekmira and the UTMB that showed 100% survival in non-human primates infected with the Angola strain of the Marburg virus in two separate studies. In the first study, 100% survival was achieved when dosing at 0.5 mg/kg TKM-Marburg began one hour after infection with otherwise lethal quantities of the virus. Dosing then continued once daily for seven days. In the second study, 100% survival was achieved even though treatment did not begin until 24 hours after infection. Tekmira expects to continue to build on these data and pursue additional funding opportunities or development partnerships for TKM-Marburg.
TKM-ALDH2
TKM-ALDH2 is a unique application of RNAi. In the United States, approximately 18 million people have an alcohol use disorder. Two million of these seek treatment each year, and approximately 350,000 of these patients receive pharmacotherapy for alcohol use disorder. TKM-ALDH2 will be developed for a high value segment of the alcohol use disorder market, with a target patient population who have moderate to severe alcohol use disorder, such as educated professionals who have support and are motivated to seek treatment.
TKM-ALDH2 has been designed to knock down or silence the ALDH2 enzyme to induce long term acute sensitivity to ethanol. Aldehyde dehydrogenase 2 (ALDH2) is a key enzyme in ethanol metabolism. Inhibition of aldehyde dehydrogenase 2 activity, through the silencing of ALDH2, results in the build-up of acetaldehyde. Elevated levels of acetaldehyde are responsible for adverse physiological effects that cause individuals to avoid alcohol consumption. We have developed an extremely potent RNAi trigger and combined it with a third generation LNP. Human proof of concept for ALDH2 inhibition already exists in the form of the approved drug disulfiram. However, disulfiram’s efficacy suffers from poor compliance because it has to be taken daily. We believe TKM-ALDH2 will induce prolonged ethanol sensitivity that will enable it to overcome the compliance limitations associated with daily dosing.
We anticipate completing the necessary preclinical work to be in a position to file an IND in the second half of 2014 in order to advance TKM-ALDH2 into a Phase I clinical trial in healthy volunteers. It is expected that proof-of-concept with alcohol challenge including ALDH2 knockdown, acetaldehyde build up and ethanol toxicity can be obtained in the Phase I clinical trial with data available in 2015. Because alcohol use disorder represents a significant public health problem, there are a variety of government funding sources seeking to support new therapeutic strategies, and Tekmira will be exploring and leveraging these partnering opportunities.
Other Preclinical Candidates
We are currently evaluating several additional preclinical candidates with potential in diverse therapeutic areas using key criteria to prioritize efforts. Given the extremely high efficiency of delivery for third generation liver-centric LNP formulations, we are focused on rare diseases where the molecular target is found in the liver, where early clinical proof-of-concept can be achieved and where there may be accelerated development opportunities. Two areas of interest are glycogen storage diseases and rare forms of hypertriglyceridemia. Our research team intends to continue to generate preclinical data to support the advancement of the most promising of these targets, and we expect to be in a position to identify another development candidate in 2014.
30
Advancements in LNP Technology
We continue to develop our proprietary “gold standard” LNP delivery technology and receive clinical validation from LNP-based products currently in clinical trials. The most advanced LNP-enabled therapeutic, which is being developed by Alnylam Pharmaceuticals, Inc., has now entered Phase III clinical development. Ongoing advances in next-generation LNP technologies include increasing potency as well as expanding the therapeutic index. Our LNP technology remains an important cornerstone of our business development activities moving forward.
Because LNP can enable a wide variety of nucleic acid payloads, including messenger RNA, we continue to see new product development and partnering opportunities based on our industry-leading delivery expertise. Most recently, in February 2014, we presented new preclinical data at the AsiaTIDES scientific symposium demonstrating that mRNA when encapsulated and delivered using Tekmira's LNP technology can be effectively delivered and expressed in liver, tumors and other specific tissues of therapeutic interest.
Technology, product development and licensing agreements
In the field of RNAi therapeutics, we have licensed our LNP delivery technology to Alnylam and Merck & Co., Inc., and Alnylam has provided royalty bearing access to our LNP delivery technology to some of its partners. In addition, we have ongoing research relationships with Bristol-Myers Squibb Company, the United States National Cancer Institute, the DoD’s JPM-MCS program, and other undisclosed pharmaceutical and biotechnology companies. Outside the field of RNAi, we have a legacy licensing agreement with Spectrum Pharmaceuticals Inc.
We have rights under the RNAi intellectual property of Alnylam to develop thirteen RNAi therapeutic products. In addition, we have a broad non-exclusive license to use Unlocked Nucleobase Analogs (UNAs) from Arcturus Therapeutics, Inc. for the development of RNAi therapeutic products directed to any target in any therapeutic indication.
Strategic Alliances
Alnylam Pharmaceuticals, Inc. and Acuitas Therapeutics Inc.
Alnylam has a license to use our intellectual property to develop and commercialize products and may only grant access to our LNP technology to its partners if it is part of a product sublicense. Alnylam’s license rights are limited to patents that we filed, or that claim priority to a patent that was filed, before April 15, 2010. Alnylam does not have rights to our patents filed after April 15, 2010 unless they claim priority to a patent filed before that date. Alnylam will pay us low single digit royalties as Alnylam’s LNP-enabled products are commercialized. Alnylam currently has three LNP-based products in clinical development: ALN-TTR02 (patisiran), ALN-VSP, and ALN-PCS02.
In November 2013, Alnylam presented positive results from its Phase II clinical trial with patisiran (ALN-TTR02), an RNAi therapeutic targeting transthyretin (TTR) for the treatment of TTR-mediated amyloidosis (ATTR), which is enabled by our LNP technology. The program represents the most clinically advanced application of our proprietary LNP delivery technology. Alnylam also announced the initiation of the APOLLO Phase III trial of patisiran, with the study now open for enrollment, to evaluate efficacy and safety of patisiran in ATTR patients with Familial Amyloidotic Polyneuropathy (FAP).
In December 2013, we received a $5 million milestone from Alnylam, triggered by the initiation of the APOLLO Phase III trial of patisiran. We have entered an arbitration proceeding with Alnylam, as provided for under our licensing agreement, to resolve a matter related to a disputed $5 million milestone payment to Tekmira from Alnylam related to its ALN-VSP product. We have not recorded any revenue in respect of this milestone.
Our licensing agreement with Alnylam grants us intellectual property rights for the development and commercialization of RNAi therapeutics for specified targets. In consideration for these three exclusive and ten non-exclusive licenses, we have agreed to pay single-digit royalties to Alnylam on product sales, with milestone obligations of up to $8.5 million on the non-exclusive licenses and no milestone obligations on the three exclusive licenses.
Consistent with the terms of the settlement agreement signed in November 2012, in December 2013, we finalized and entered a cross-license agreement with Acuitas Therapeutics Inc. (formerly AlCana Technologies, Inc.). The terms of the cross-license agreement provide Acuitas with access to certain of Tekmira’s earlier IP generated prior to April 2010 and provide us with certain access to Acuitas’ technology and licenses in the RNAi field, along with a percentage of each milestone and royalty payment with respect to certain products, and Acuitas has agreed that it will not compete in the RNAi field for a period of 5 years.
Spectrum Pharmaceuticals, Inc.
In September 2013, we announced that our licensee, Spectrum Pharmaceuticals, Inc. had launched Marqibo® through its existing hematology sales force in the United States and has shipped the first commercial orders. We are entitled to mid-single digit royalty payments based on Marqibo’s commercial sales. Marqibo, which is a novel, sphingomyelin/cholesterol liposome-encapsulated formulation of the FDA-approved anticancer drug vincristine originally developed by Tekmira, was licensed from Tekmira to Talon Therapeutics in 2006. In July 2013, Talon was acquired by Spectrum Pharmaceuticals, Inc. Marqibo’s approved indication is for the treatment of adult patients with Philadelphia chromosome-negative acute lymphoblastic leukemia (Ph- ALL) in second or greater relapse or whose disease has progressed following two or more lines of anti-leukemia therapy. Spectrum has two ongoing Phase III trials evaluating Marqibo in additional indications.
31
Monsanto Company
In January 2014, we signed an Option Agreement and a Service Agreement with Monsanto, pursuant to which Monsanto may obtain a license to use our proprietary delivery technology. The transaction supports the application of our proprietary delivery technology and related IP for use in agriculture. The potential value of the transaction could reach up to $86.2 million following the successful completion of milestones. In January 2014, we received $14.5 million of the net $16.5 million in anticipated near term payments.
Marina Biotech, Inc. / Arcturus Therapeutics, Inc.
On November 29, 2012, we disclosed that we had obtained a worldwide, non-exclusive license to a novel RNAi trigger technology called Unlocked Nucleobase Analog (UNA) from Marina for the development of RNAi therapeutics. UNAs can be incorporated into RNAi drugs and have the potential to improve them by increasing their stability and reducing off-target effects. In August 2013, Marina assigned its UNA technology to Arcturus Therapeutics, Inc., and the UNA license agreement between Tekmira and Marina was assigned to Arcturus. The terms of the license are otherwise unchanged.
To date we have paid Marina $0.5 million in license fees and there are milestones of up to $3.2 million plus royalties for each product that we develop using UNA technology licensed from Marina.
Merck & Co., Inc. (Merck) and Alnylam license agreement
As a result of the business combination with Protiva in 2008, we acquired a non-exclusive royalty-bearing world-wide license agreement with Merck. Under the license, Merck will pay up to $17.0 million in milestones for each product they develop covered by Protiva’s intellectual property, except for the first product for which Merck will pay up to $15.0 million in milestones, and will pay royalties on product sales. Merck’s license rights are limited to patents that we filed, or that claim priority to a patent that was filed, before October 9, 2008. Merck does not have rights to our patents filed after October 9, 2008 unless they claim priority to a patent filed before that date. Merck has also granted a license to the Company to certain of its patents. On January 12, 2014, Alnylam announced that they will be acquiring certain assets from Merck which may include the license agreement in which case it will transfer to Alnylam.
Bristol-Myers Squibb Company (BMS)
In May 2010 we announced the expansion of our ongoing research collaboration with BMS. Under the new agreement, BMS will use RNAi triggers molecules formulated by us in LNPs to silence target genes of interest. BMS will conduct the preclinical work to validate the function of certain genes and share the data with us. We can use the preclinical data to develop RNAi therapeutic drugs against the therapeutic targets of interest. BMS paid us $3.0 million concurrent with the signing of the agreement. We are required to provide a predetermined number of LNP batches over the four-year agreement. BMS will have a first right to negotiate a licensing agreement on certain RNAi products developed by us that evolve from BMS validated gene targets. In May 2011, we announced a further expansion of the collaboration to include broader applications of our LNP technology and additional target validation work. Recognition of revenue from agreements with BMS is covered in the Revenue section of this MD&A.
U.S. National Institutes of Health (NIH)
On October 13, 2010 we announced that together with collaborators at The University of Texas Medical Branch (UTMB), we were awarded a new NIH grant to support research to develop RNAi therapeutics to treat Ebola and Marburg hemorrhagic fever viral infections using our LNP delivery technology. The grant, worth $2.4 million, is supporting work at Tekmira and at UTMB. At December 31, 2013 the remaining balance of Tekmira’s portion of the grant was $0.04 million. In February 2014, UTMB and Tekmira, along with other collaborators, were awarded additional funding from the NIH in support of this research.
Halo-Bio RNAi Therapeutics, Inc.
On August 24, 2011, we entered into a license and collaboration agreement with Halo-Bio. Under the agreement, Halo-Bio granted to us an exclusive license to its multivalent ribonucleic acid MV-RNA technology. The agreement was amended on August 8, 2012 to adjust the future license fees and other contingent payments. To date we have recorded $0.5 million in fees under our license from Halo-Bio. We terminated the agreement with Halo-Bio on July 31, 2013. There are no further payments due or contingently payable to Halo-Bio.
32
CRITICAL ACCOUNTING POLICIES AND ESTIMATES
The significant accounting policies that we believe to be most critical in fully understanding and evaluating our financial results are revenue recognition, stock-based compensation and share purchase warrant valuation. These accounting policies require us to make certain estimates and assumptions. We believe that the estimates and assumptions upon which we rely are reasonable, based upon information available to us at the time that these estimates and assumptions are made. Actual results may differ from our estimates. Our critical accounting estimates affect our net income or loss calculation.
Revenue Recognition /
Our primary sources of revenue have been derived from research and development collaborations and contracts, and licensing fees comprised of initial fees and milestone payments. Payments received under research and development agreements and contracts, which are non-refundable, are recorded as revenue as services are performed and as the related expenditures are incurred pursuant to the agreement, provided collectability is reasonably assured. Revenue earned under research and development manufacturing collaborations where we bear some or all of the risk of a product manufacture failure is recognized when the purchaser accepts the product and there are no remaining rights of return. Revenue earned under research and development collaborations and contracts where we do not bear any risk of product manufacture failure is recognized in the period the work is performed. For contracts where the manufacturing amount is specified, revenue is recognized as product is manufactured in proportion to the total amount specified under the contract. Initial fees and milestone payments which require our ongoing involvement are deferred and amortized into income over the estimated period of our involvement as we fulfill our obligations under our agreements. Revenue earned under contractual arrangements upon the occurrence of specified milestones is recognized as the milestones are achieved and collection is reasonably assured.
The revenue that we recognize is a critical accounting estimate because of the volume and nature of the revenues we receive. Some of the research, development and licensing agreements that we have entered into contain multiple revenue elements that are to be recognized for accounting in accordance with our revenue recognition policy. We need to make estimates as to what period the services will be delivered with respect to up-front licensing fees and milestone payments received because these payments are deferred and amortized into income over the estimated period of our ongoing involvement. The actual period of our ongoing involvement may differ from the estimated period determined at the time the payment is initially received and recorded as deferred revenue. This may result in a different amount of revenue that should have been recorded in the period and a longer or shorter period of revenue amortization. When an estimated period changes we amortize the remaining deferred revenue over the estimated remaining time to completion. The rate at which we recognize revenue from payments received for services to be provided under research and development agreements depends on our estimate of work completed to date and total work to be provided. The actual total services provided to earn such payments may differ from our estimates.
Our DoD contract for TKM-Ebola is based on cost reimbursement plus an incentive fee. At the beginning of our fiscal year we estimate our labor and overhead rates for the year ahead. During the year, we re-estimate our labor and overhead rates and adjust our revenue accordingly. Our actual labor and overhead rates will differ from our estimate based on actual costs incurred and the proportion of our efforts on contracts and internal products versus indirect activities. Within minimum and maximum collars, the amount of incentive fee we can earn under the DoD contract varies based on our costs incurred versus budgeted costs. We need to make an estimate of our final contract costs in order to calculate the final incentive fee we will receive. Until we are able to make a reliable estimate of the final contract costs, we recognize only the minimum incentive fee achievable and earned. Once we are able to reliably estimate the final contract costs, we recognize the portion of the estimated incentive fee earned to date.
Our revenue for 2013 was $15.5 million (2012 - $14.1 million) and deferred revenue at December 31, 2013 was $3.5 million (December 31, 2012 - $3.9 million).
Stock-based compensation
/ The stock-based compensation that we record is a critical accounting estimate due to the value of compensation recorded, the volume of our stock option activity, and the many assumptions that are required to be made to calculate the compensation expense.
Compensation expense is recorded for stock options issued to employees and directors using the fair value method. We must calculate the fair value of stock options issued and amortize the fair value to stock compensation expense over the vesting period, and adjust the expense for stock option forfeitures and cancellations. We use the Black-Scholes model to calculate the fair value of stock options issued which requires that certain assumptions, including the expected life of the option and expected volatility of the stock, be estimated at the time that the options are issued. This accounting estimate is reasonably likely to change from period to period as further stock options are issued and adjustments are made for stock option forfeitures and cancellations. We make an estimate for stock option forfeitures at the time of grant and revise this estimate in subsequent periods if actual forfeitures differ. The term "forfeitures" is distinct from "cancellations" or "expirations" and represents only the unvested portion of the surrendered stock option. We amortize the fair value of stock options using the straight-line method over the vesting period of the options, generally a period of three years for employees and immediate vesting for directors.
We recorded stock-based compensation expense in 2013 of $0.9 million (2012 - $1.0 million).
Share purchase warrant valuation
/ The valuation of share purchase warrants is a critical accounting estimate due to the value of liabilities recorded and the many assumptions that are required to be made to calculate the liability, resulting in the classification of our warranty liability as a level 3 financial instrument, which represents 43% of our total liabilities measured at fair value.
33
We classify warrants in our consolidated balance sheet as liabilities and revalue them at each balance sheet date. Any change in valuation is recorded in our statement of operations. We use the Black-Scholes pricing model to value the warrants. Determining the appropriate fair-value model and calculating the fair value of registered warrants requires considerable judgment. A small change in the estimates used may cause a relatively large change in the estimated valuation. Prior to Q3 2013, for the purpose of valuing warrants, the estimated volatility of our common stock at the date of issuance, and at each subsequent reporting period, is based upon observations of warrants in the market with similar characteristics and expected remaining lives. The risk-free interest rate is based on the zero-coupon rate for bonds with a maturity similar to the expected remaining life of the warrants at the valuation date. The expected life of the warrants is assumed to be equivalent to their remaining contractual term.
Based on changes in our business and general stock market conditions since our warrants were issued in 2011 and 2012, in Q3 2013, we undertook a review of our warrant fair value assumptions. Our previous assumption for warrant expected life was the warrant’s remaining contractual term. Based on the pattern of exercises of our warrants we have reduced the expected life to a weighted average of 1.6 years. Our previous assumption for expected volatility in respect of our warrants was 40%. We are now calculating volatility based on our historic share price fluctuations, which, at December 31, 2013, gave a weighted average expected volatility of 47.03%. The reduction in expected life has the effect of reducing the fair value of our warrants, whereas, the increase in our expectations for volatility increases the fair value of our warrants. These two warrant-pricing assumptions, however, had relatively little impact on the change in the fair value of our warrants in 2013 as compared to the impact of the change in our stock price, as quoted on the Toronto Stock Exchange, from $5.01 (C$4.98) in at December 31, 2012 to $7.94(C$8.45) at December 31, 2013.
We recorded a loss for the change in fair value of warrant liability in 2013 of $3.5 million (2012 – loss of $3.8 million).
SUMMARY OF QUARTERLY RESULTS
The following table presents our unaudited quarterly results of operations for each of our last eight quarters. These data have been derived from our unaudited condensed consolidated financial statements, which were prepared on the same basis as our annual audited financial statements and, in our opinion, include all adjustments necessary, consisting solely of normal recurring adjustments, for the fair presentation of such information.
(in millions $ except per share data) – unaudited
|
Q4
|
Q3
|
Q2
|
Q1
|
Q4
|
Q3
|
Q2
|
Q1
|
|||||||||||||||||||||||||
|
2013
|
2013
|
2013
|
2013
|
2012
|
2012
|
2012
|
2012
|
|||||||||||||||||||||||||
|
Revenue
|
||||||||||||||||||||||||||||||||
|
Collaborations and contracts:
|
||||||||||||||||||||||||||||||||
|
DoD
|
$
|
2.6
|
$
|
2.8
|
$
|
2.4
|
$
|
1.9
|
$
|
3.6
|
$
|
1.9
|
$
|
2.5
|
$
|
3.5
|
||||||||||||||||
|
Other
|
(0.1)
|
0.1
|
0.4
|
0.2
|
0.3
|
0.1
|
0.1
|
0.1
|
||||||||||||||||||||||||
|
2.6
|
2.9
|
2.8
|
2.1
|
3.9
|
2.0
|
2.6
|
3.6
|
|||||||||||||||||||||||||
|
Alnylam milestone payments
|
5.0
|
—
|
—
|
—
|
—
|
—
|
1.0
|
—
|
||||||||||||||||||||||||
|
Spectrum milestone and royalty payments
|
—
|
—
|
—
|
—
|
—
|
1.0
|
—
|
—
|
||||||||||||||||||||||||
|
Total revenue
|
7.6
|
2.9
|
2.8
|
2.1
|
3.9
|
3.0
|
3.6
|
3.6
|
||||||||||||||||||||||||
|
Expenses
|
(9.9)
|
(6.6)
|
(5.9)
|
(5.1)
|
(9.8)
|
(4.8)
|
(6.2)
|
(6.2)
|
||||||||||||||||||||||||
|
Other income (losses)
|
(0.2)
|
(2.2)
|
0.1
|
0.5
|
44.2
|
(1.6)
|
0.7
|
(0.5)
|
||||||||||||||||||||||||
|
Net (loss) income
|
(2.6)
|
(5.9)
|
(3.0)
|
(2.5)
|
38.0
|
(3.4)
|
(1.9)
|
(3.1)
|
||||||||||||||||||||||||
|
Basic net (loss) income per share
|
$
|
(0.15)
|
$
|
(0.41)
|
$
|
(0.21)
|
$
|
(0.17)
|
$
|
2.72
|
$
|
(0.25)
|
$
|
(0.14)
|
$
|
(0.25)
|
||||||||||||||||
|
Diluted net (loss) income per share
|
$
|
(0.15)
|
$
|
(0.41)
|
$
|
(0.21)
|
$
|
(0.17)
|
$
|
2.51
|
$
|
(0.25)
|
$
|
(0.14)
|
$
|
(0.25)
|
||||||||||||||||
Quarterly Trends
Revenue
/ Our revenue is derived from research and development collaborations and contracts, licensing fees, milestone and royalty payments. Over the past two years, our principal source of ongoing revenue has been our contract with the DoD to advance TKM-Ebola which began in July 2010. We expect revenue to continue to fluctuate particularly due to the development stage of the TKM-Ebola contract and the irregular nature of licensing payments and milestone receipts.
34
In Q3 2010 we signed a contract with the DoD to develop TKM-Ebola and have since incurred significant program costs related to equipment, materials and preclinical and clinical studies. These costs are included in our research, development, collaborations and contracts expenses. These costs are fully reimbursed by the DoD, and this reimbursement amount is recorded as revenue. DoD revenue from the TKM-Ebola program also compensates us for labor and overheads and provides an incentive fee. In Q3 2012, the DoD issued a temporary stop-work order, which was subsequently lifted in Q4 2012 and the contract resumed. Revenue in Q4 2012 was unusually high due to an increase in our overhead rates. As described in our critical accounting policies, we estimate the labor and overhead rates to be charged under our TKM-Ebola contract and update these rate estimates throughout the year. In Q4 2012, we incurred unforecasted expenses which led to an increase in our TKM-Ebola contract overhead rates and, therefore, an increase in our revenue under the contract. Q1 2013 DoD revenue was lower as certain activities were still building momentum following the stop-work order. TKM-Ebola contract revenue increased in Q2, Q3 and Q4 2013 as technology transfer, manufacturing and non-clinical studies were all ongoing. On May 8, 2013 we announced the signing of a modification to the TKM-Ebola contract - see the “Results of Operations” section of this discussion.
In Q2 2012 we earned a $1.0 million milestone from Alnylam following their initiation of a Phase II human clinical trial enabled by our LNP delivery technology. In Q4 2013 we earned a $5.0 million milestone from Alnylam following their initiation of a Phase III trial enabled by our LNP technology.
In Q3 2012 we earned a $1.0 million milestone from Spectrum when they received accelerated approval for Marqibo from the U.S. Food and Drug Administration (FDA). In Q4 2013, we earned our first meaningful royalty payment from Spectrum, $0.04 million, as they shipped commercial orders of Marqibo.
In Q4 2013 we decided with BMS to extend the batch formulation agreement end date from May 2014 to December 2014. Extending the agreement will give BMS more time to order LNP batches. There will not be any monetary consideration for extending the agreement. Revenue recognized in 2013 has been reduced and the balance of deferred revenue as at December 31, 2013 has been increased to account for BMS, potentially, ordering more batches under the agreement. This adjustment is reflected in the $0.1 million of negative “other revenue” in Q4 2013 when the decision was made to extend the agreement and a cumulative revenue adjustment was recorded.
Expenses /
Expenses consist primarily of clinical and pre-clinical trial expenses, personnel expenses, consulting and third party expenses, reimbursable collaboration expenses, consumables and materials, patent filing expenses, facilities, stock-based compensation and general corporate costs.
Q3 2012 expenses were unusually low due in part to the TKM-Ebola contract stop-work order as discussed above. Our Q4 2012 expenses were unusually high as we paid staff bonuses and recorded $2.5 million in license fee charges related to Acuitas, Marina and Halo-Bio - see the Overview section of this discussion.
In Q4 2013, our expenses increased due to an increase in our research and development activities.
Other income (losses) /
Other income in Q4 2012 consists primarily of $65.0 million received under the new Alnylam license agreement net of related contingent legal fees of $18.7 million paid to our lead litigation counsel. Q3 2013 includes a loss for the $2.5 million increase in the fair value of our warrant liability. This is largely attributable to the increase in our share price as compared to when the warrants were last valued at the end of Q2 2013.
Other losses in Q4 2013 consist primarily of a $1.4 million increase in the fair value of warrant liability due to the significant increase in our share price. We also recorded a foreign exchange gain of $1.1 million on the U.S. dollar funds that we received from financing activities.
Net (loss) income /
The loss in Q1 2012 is largely due to the reduction in Alnylam revenue in Q1 2012 and an increase in the fair value of our outstanding warrants in Q1 2012 as a result of our increasing share price. The increase in loss in both Q3 2012 and Q3 2013 is largely due to increases in the fair value of our warrant liability which is caused by increases in our share price over the previous quarter ends. The net income in Q4 2012 is largely due to the litigation settlement payments received from Alnylam, and the decrease in loss in Q4 2013 is largely due to the milestone payment we received from Alnylam.
Fourth quarter of 2013 /
Our Q4 2013 net loss was $2.6 million ($0.15 basic and diluted loss per common share) as compared to a net income of $38.0 million ($2.72 basic income per common share, $2.51 diluted income per common share) for Q4 2012.
Revenue increased to $7.6 million in Q4 2013 as compared to $3.9 million in Q4 2012 largely as a result of the $5.0 million milestone payment from Alnylam.
Research, development, collaborations and contracts expenses remained relatively stable at $7.0 million in Q4 2013 and $7.2 million in Q4 2012. In Q4 2012 we recorded $2.5 million in license fee charges related to Acuitas, Marina and Halo-Bio - see the Overview section of this discussion. In Q4 2013, we increased DoD research and development activities as compared to Q4 2012 when work was ramping up again after the stop-work period.
35
Other income in Q4 2012 is primarily $65.0 million received under the new Alnylam license agreement net of related contingent legal fees of $18.7 million paid to our lead litigation counsel. Other losses in Q4 2013 primarily consists of $1.4 million increase in warrant liability due to the increase in our share price, and a foreign exchange gain of $1.1 million on the U.S. dollar funds that we received from financing activities.
RESULTS OF OPERATIONS
The following summarizes the results of our operations for the 2013, 2012 and 2011 fiscal years, in millions of dollars:
|
2013
|
2012
|
2011
|
||||||||||
|
Total revenue
|
15.5 | 14.1 | 16.8 | |||||||||
|
Operating expenses
|
27.6 | 27.0 | 27.5 | |||||||||
|
Loss from operations
|
(12.2 | ) | (12.9 | ) | (10.7 | ) | ||||||
|
Net income (loss)
|
(14.1 | ) | 29.6 | (10.1 | ) | |||||||
|
Basic income (loss) per share
|
(0.92 | ) | 2.16 | (0.89 | ) | |||||||
|
Diluted income (loss) per share
|
(0.92 | ) | 2.07 | (0.89 | ) | |||||||
|
Total assets
|
71.7 | 52.6 | 13.8 | |||||||||
|
Total liabilities
|
12.5 | 11.7 | 8.5 | |||||||||
|
Total non-current liabilities
|
0.0 | 0.7 | 1.7 | |||||||||
|
Deficit
|
(167.0 | ) | (153.0 | ) | (182.6 | ) | ||||||
|
Accumulated other comprehensive loss
|
(15.8 | ) | (12.7 | ) | (13.2 | ) | ||||||
|
Total stockholders’ equity
|
59.2 | 40.9 | 5.2 | |||||||||
Year ended December 31, 2013 compared to the year ended December 31, 2012
For the fiscal year ended December 31, 2013, our net loss was $14.1 million ($0.92 basic and diluted loss per common share) as compared to a net income of $29.6 million ($2.16 basic income per common share, $2.07 diluted income per common share) for 2012.
Revenue
/ Revenue is summarized in the following table, in millions:
|
2013
|
% of Total
|
2012
|
% of Total
|
|||||||||||||
|
Collaborations and contracts
|
||||||||||||||||
|
DoD
|
9.8 | 63 | % | 11.5 | 82 | % | ||||||||||
|
Alnylam
|
- | - | - | - | ||||||||||||
|
BMS
|
0.5 | 3 | % | 0.4 | 3 | % | ||||||||||
|
Other RNAi collaborators
|
0.1 | 1 | % | 0.1 | 1 | % | ||||||||||
|
Total collaborations and contracts
|
10.4 | 68 | % | 12.1 | 86 | % | ||||||||||
|
Alnylam milestone payments
|
5.0 | 32 | % | 1.0 | 7 | % | ||||||||||
|
Spectrum milestone and royalty payments
|
0.0 | 0 | % | 1.0 | 7 | % | ||||||||||
|
Total revenue
|
15.5 | 14.1 | ||||||||||||||
DoD revenue
On July 14, 2010, we signed a contract with the United States Government Department of Defense (“DoD”) to advance an RNAi therapeutic utilizing our LNP technology to treat Ebola virus infection (see Overview for further discussion). The initial phase of the contract, which is funded under a Transformational Medical Technologies program, was budgeted at $34.7 million. This stage one funding is for the development of TKM-Ebola including completion of preclinical development, filing an IND application with the FDA and completing a Phase I human safety clinical trial.
On August 6, 2012, we announced that we had received a temporary stop-work order from the DoD in respect of our TKM-Ebola contract. On October 2, 2012, we announced that the stop-work order had been lifted and we resumed work.
In November 2012, we submitted a modification request to the existing contract to the DoD in order to integrate recent advancements in LNP formulation and manufacturing technology in the TKM-Ebola development program. The modification was approved and increased the stage one targeted funding from $34.7 million to $41.7 million.
Under the contract, we are being reimbursed for costs incurred, including an allocation of overheads, and we are being paid an incentive fee.
36
Alnylam revenue
In June 2012 we earned a $1.0 million milestone from Alnylam following their initiation of a Phase II human clinical trial for their product candidate ALN-TTR02. ALN-TTR02 utilizes our LNP technology.
In November 2013, Alnylam initiated a Phase III trial with ALN-TTR02, also known as patisiran, and the associated $5.0 million development milestone was paid to us in December 2013. On June 21, 2013, we transferred manufacturing process technology to Ascletis to enable them to produce ALN-VSP, a product candidate licensed to them by Alnylam. We believe that under our licensing agreement with Alnylam, the technology transfer to Ascletis triggers a $5.0 million milestone obligation from Alnylam to us. However, Alnylam has demanded a declaration that we have not yet met its milestone obligations. We dispute Alnylam’s position. To remedy this dispute, we have commenced arbitration proceedings with Alnylam, as provided for under the agreement. We have not recorded any revenue in respect of this milestone.
BMS revenue
In May 2010 we signed a formulation agreement with BMS under which BMS paid us $3.0 million to make a certain number of LNP formulations over the following four year period. Revenue recognized in 2012 and 2013 relate to LNP batches the company produced in proportion to the maximum LNP formulations that may be required under the contract. As at December 31, 2013, we intend to offer BMS an extension to the agreement’s end date from May 10, 2014 to December 31, 2014. Extending the agreement will give BMS more time to order LNP batches. There will not be any monetary consideration for extending the agreement. Revenue recognized in 2013 has been reduced and the balance of deferred revenue as at December 31, 2013 has been increased to account for BMS, potentially, ordering more batches under the agreement.
Other RNAi collaborators revenue
We have active research agreements with a number of other RNAi collaborators.
Spectrum revenue
In August 2012, we earned a $1.0 million milestone payment from Talon based on the FDA approval of Marqibo. Talon was acquired by Spectrum in July 2013. The acquisition does not affect the terms of our license with Talon. In September 2013, Spectrum announced that they had shipped the first commercial orders of Marqibo. In 2013, we recorded $0.04 million in Marqibo royalty revenue.
Expenses
/ Expenses are summarized in the following table, in millions:
|
2013
|
% of Total
|
2012
|
% of Total
|
|||||||||||||
|
Research, development, collaborations and contracts
|
$ | 21.5 | 78 | % | $ | 18.0 | 67 | % | ||||||||
|
General and administrative
|
5.5 | 20 | % | 8.1 | 30 | % | ||||||||||
|
Depreciation
|
0.6 | 2 | % | 0.9 | 3 | % | ||||||||||
|
Total operating expenses
|
$ | 27.6 | $ | 27.0 | ||||||||||||
Research, development, collaborations and contracts
Research, development, collaborations and contracts expenses consist primarily of clinical and pre-clinical trial expenses, personnel expenses, consulting and third party expenses, consumables and materials, as well as a portion of stock-based compensation and general corporate costs.
In 2012, spending on our internal earlier-stage research programs was reduced as we focused on TKM-Ebola, TKM-PLK1 and the litigation against Alnylam and Acuitas. In 2013, we resumed research activities and spending on earlier-stage research programs and new target identification, including new 2013 programs TKM-HBV and TKM-ALDH2 – see Overview. In 2013, there was additional spending on the TKM-PLK1 program as we moved into Phase I/II and initiated more clinical trial sites. In addition, we incurred incremental costs for TKM-Ebola program in 2013, as compared to 2012, as we conducted a number of pre-clinical studies with our new formulation.
Compensation expenses are at a similar level in 2013 as compared to 2012. There was an increase in workforce of 19 employees in 2013, but there was a higher bonus payout in 2012 following settlement with Alnylam and Acuitas.
A significant portion of our research, development, collaborations and contracts expenses are not tracked by project as they benefit multiple projects or our technology platform and because our most-advanced programs are not yet in late-stage clinical development. However, our collaboration agreements contain cost-sharing arrangements pursuant to which certain costs incurred under the project are reimbursed. Costs reimbursed under collaborations typically include certain direct external costs and hourly or full-time equivalent labor rates for the actual time worked on the project. In addition, we have been reimbursed under government contracts for certain allowable costs including direct internal and external costs. As a result, although a significant portion of our research, development, collaborations and contracts expenses are not tracked on a project-by-project basis, we do, however, track direct external costs attributable to, and the actual time our employees worked on, our collaborations and government contracts.
37
General and administrative
General and administrative expenses were higher in 2012 due to legal fees incurred in respect of our lawsuit with Alnylam and Acuitas.
Depreciation of property and equipment
Most of our recent property and equipment additions were related to our TKM-Ebola program and are not recorded as Company assets. As such, a large portion of our property and equipment is reaching full amortization. In 2013, however, we did spend $0.7 million on property and equipment mostly related to information technology improvements.
Other income (losses) /
Other income (losses) are summarized in the following table, in millions:
|
2013
|
2012
|
|||||||
|
Interest income
|
$ | 0.5 | $ | 0.1 | ||||
|
Licensing settlement payment
|
- | 65.0 | ||||||
|
Licensing settlement legal fees
|
- | (18.7 | ) | |||||
|
Foreign exchange gains
|
1.1 | - | ||||||
|
Increase in fair value of warrant liability
|
(3.5 | ) | (3.8 | ) | ||||
|
Total other income (losses)
|
$ | (1.9 | ) | $ | 42.6 | |||
Licensing settlement payment and legal fees
In November 2012 we received $65.0 million in cash from Alnylam as a result of signing a new license agreement. In connection with the licensing settlement payment of $65.0 million, in December 2012, we paid our lead legal counsel $18.7 million in contingent legal fees.
No revenues or expenses were recorded in 2013 related to the Alnylam settlement as the litigation was settled in 2012.
Increase in fair value of warrant liability
In conjunction with equity and debt financing transactions in 2011 and an equity private placement that closed on February 29, 2012, we have issued warrants to purchase our common share. We are accounting for the warrants under the authoritative guidance on accounting for derivative financial instruments indexed to, and potentially settled in, a company’s own stock, on the understanding that in compliance with applicable securities laws, the registered warrants require the issuance of registered securities upon exercise and do not sufficiently preclude an implied right to net cash settlement. At each balance sheet date the warrants are revalued using the Black-Scholes model and the change in value is recorded in the consolidated statement of operations and comprehensive income (loss).
The aggregate increase in value of our common share purchase warrants outstanding at December 31, 2013 was $3.5 million as compared to an increase in the value of common share purchase warrants outstanding at the end of 2012 of $3.8 million. The increases are a result of increases in the Company’s share price from the previous reporting dates.
We expect to see future changes in the fair value of our warrant liability and these changes will largely depend on the change in the Company’s share price, any change in our assumed rate of share price volatility, our assumptions for the expected lives of the warrants and warrant issuances or exercises.
Year ended December 31, 2012 compared to the year ended December 31, 2011
For the fiscal year ended December 31, 2012, our net income was $29.6 million ($2.16 basic income per common share, $2.07 diluted income per common share) as compared to a net loss of $10.1 million ($0.89 basic and diluted loss per common) for 2011.
38
Revenue
/ Revenue is summarized in the following table, in millions:
|
2012
|
% of Total
|
2011
|
% of Total
|
|||||||||||||
|
Collaborations and contracts
|
||||||||||||||||
|
DoD
|
$ | 11.5 | 82 | % | $ | 11.5 | 69 | % | ||||||||
|
Alnylam
|
- | - | 4.2 | 25 | % | |||||||||||
|
BMS
|
0.4 | 3 | % | 0.4 | 3 | % | ||||||||||
|
Other RNAi collaborators
|
0.1 | 1 | % | 0.1 | 1 | % | ||||||||||
|
Total collaborations and contracts
|
12.1 | 86 | % | 16.3 | 97 | % | ||||||||||
|
Alnylam milestone payments
|
1.0 | 7 | % | 0.5 | 3 | % | ||||||||||
|
Spectrum milestone and royalty payments
|
1.0 | 7 | % | - | 0 | % | ||||||||||
|
Total revenue
|
$ | 14.1 | $ | 16.8 | ||||||||||||
DoD revenue
On July 14, 2010, we signed a contract with the DoD to advance an RNAi therapeutic utilizing our LNP technology to treat Ebola virus infection (see Overview for further discussion). Under the contract, we are being reimbursed for costs incurred, including an allocation of overheads, and we are being paid an incentive fee.
Alnylam revenue
Under the previous Alnylam Manufacturing Agreement, we were the exclusive manufacturer of any products required by Alnylam that utilize our technology through to the end of Phase II clinical trials. Under the Agreement there was a contractual minimum payment for the provision of staff in each of the three years from 2009 to 2011 and Alnylam was reimbursing us for any external costs incurred. As discussed earlier, the Alnylam Manufacturing Agreement was replaced by a new licensing agreement as part of the settlement of the litigation between Tekmira, Alnylam and Acuitas, and we are no longer manufacturing for Alnylam.
In Q2 2012 we earned a $1.0 million milestone from Alnylam following their initiation of a Phase II human clinical trial for their product candidate ALN-TTR02. ALN-TTR02 utilizes our LNP technology. In Q3 2011 we recorded a $0.5 million milestone payment from Alnylam following their initiation of a Phase I human clinical trial for a product enabled by our LNP delivery technology.
BMS revenue
In May 2010 we signed a formulation agreement with BMS under which BMS paid us $3.0 million to make a certain number of LNP formulations over the following four year period.
Other RNAi collaborators revenue
We have active research agreements with a number of other RNAi collaborators.
Spectrum revenue
In Q3 2012, we earned a $1.0 million milestone payment from Talon based on the FDA approval of Marqibo. Talon was acquired by Spectrum in July 2013.
Expenses /
Expenses are summarized in the following table, in millions:
|
2012
|
% of Total
|
2011
|
% of Total
|
|||||||||||||
|
Research, development, collaborations and contracts
|
$ | 18.0 | 67 | % | $ | 20.1 | 73 | % | ||||||||
|
General and administrative
|
8.1 | 30 | % | 6.4 | 23 | % | ||||||||||
|
Depreciation
|
0.9 | 3 | % | 1.0 | 4 | % | ||||||||||
|
Total operating expenses
|
27.0 | 27.5 | ||||||||||||||
Research, development, collaborations and contracts
For reasons discussed in the revenue section above, third-party expenses on our Alnylam collaboration were lower in 2012 as compared to 2011.
Spending on our internal earlier-stage research programs was reduced as we focused on TKM-Ebola, TKM-PLK1 and the litigation against Alnylam and Acuitas.
Compensation expenses were at a similar level in 2012 as compared to 2011. There was a reduction in workforce of 15 employees in June 2011 and a further reduction in workforce in January 2012 of 16 employees. However, the reduced number of employees was offset by bonus payouts in Q4 2012; there were no bonuses paid in 2011.
39
General and administrative
The increase in 2012 general and administrative expenses relates to legal fees incurred in respect of our lawsuit with Alnylam and Acuitas (excluding licensing settlement legal fees that have been recorded as other losses) and bonus payouts in Q4 2012; there were no bonuses paid in 2011.
Other income (losses) /
Other income (losses) are summarized in the following table, in millions:
|
2012
|
2011
|
|||||||
|
Interest income
|
$ | 0.1 | $ | 0.1 | ||||
|
Licensing settlement payment
|
65.0 | - | ||||||
|
Licensing settlement legal fees
|
(18.7 | ) | - | |||||
|
(Increase) decrease in fair value of warrant liability
|
(3.8 | ) | 0.6 | |||||
|
Total other income (losses)
|
$ | 42.6 | $ | 0.6 | ||||
Licensing settlement payment and legal fees
In November 2012 we received $65.0 million in cash from Alnylam as a result of signing a new license agreement.
In connection with the licensing settlement payment of $65.0 million, in December 2012, we paid our lead legal counsel $18.7 million in contingent legal fees.
Change in fair value of warrant liability
In conjunction with equity and debt financing transactions in 2011 and an equity private placement that closed on February 29, 2012, we have issued warrants to purchase our common share. We are accounting for the warrants under the authoritative guidance on accounting for derivative financial instruments indexed to, and potentially settled in, a company’s own stock, on the understanding that in compliance with applicable securities laws, the registered warrants require the issuance of registered securities upon exercise and do not sufficiently preclude an implied right to net cash settlement. At each balance sheet date the warrants are revalued using the Black-Scholes model and the change in value is recorded in the consolidated statement of operations and comprehensive income (loss).
The aggregate increase in value of our common share purchase warrants outstanding at December 31, 2012 was $3.8 million as compared to a decrease in the value of common share purchase warrants outstanding at the end of 2011 of $0.6 million. The increase in value in 2012 is a result of additional warrants issued from the 2012 financing, as well as an increase in the Company’s share price from the previous balance sheet date of December 31, 2011.
LIQUIDITY AND CAPITAL RESOURCES
The following table summarizes our cash flow activities for the periods indicated, in millions:
|
Year ended December 31
|
||||||||||||
|
2013
|
2012
|
2011
|
||||||||||
|
Net income (loss) for the year
|
(14.1 | ) | 29.6 | (10.1 | ) | |||||||
|
Adjustments to reconcile net loss to net cash (used in) provided by operating activities
|
5.0 | 5.7 | 1.1 | |||||||||
|
Changes in operating assets and liabilities
|
2.3 | (2.4 | ) | 1.1 | ||||||||
|
Net cash (used in) operating activities
|
(6.7 | ) | 32.9 | (7.8 | ) | |||||||
|
Net cash used in investing activities
|
(0.7 | ) | (0.0 | ) | (0.1 | ) | ||||||
|
Net cash provided by financing activities
|
32.7 | 4.5 | 4.6 | |||||||||
|
Effect of foreign exchange rate changes on cash & cash equivalents
|
(3.6 | ) | 0.5 | (0.1 | ) | |||||||
|
Net increase (decrease) in cash and cash equivalents
|
21.7 | 38.0 | (3.4 | ) | ||||||||
|
Cash and cash equivalents, beginning of year
|
47.0 | 9.0 | 12.4 | |||||||||
|
Cash and cash equivalents, end of year
|
68.7 | 47.0 | 9.0 | |||||||||
Since our incorporation, we have financed our operations through the sales of shares, units, debt, revenues from research and development collaborations and licenses with corporate partners, interest income on funds available for investment, and government contracts, grants and tax credits.
At December 31, 2013, we had cash and cash equivalents of approximately $68.7 million as compared to $47.0 million at December 31, 2012.
Operating activities used $6.7 million in cash in 2013 as compared to $32.9 million of cash provided in 2012 and $7.8 million used in 2011. The positive operating cash flow in 2012 was largely the result of the $65.0 million settlement reached with Alnylam which was recorded as “other income”.
40
Investing activities used $0.73 million in 2013 as compared to $0.01 million in 2012 and $0.06 million in 2011. Equipment we acquire under our TKM-Ebola contract is owned by the DoD and is not recorded as a Company investment.
On June 16, 2011, we completed a public offering of 1,789,900 units for gross proceeds of $5.2 million. Each unit, priced at C$2.85, consists of one common share and one half of one common share purchase warrant. Each whole warrant entitles the holder to acquire one common share at a price of C$3.35. The warrants expire on June 15, 2016.
On February 29, 2012, we completed a private placement of 1,848,601 units for gross proceeds of $4.1 million. Each unit, priced at C$2.20, consists of one common share and one half of one common share purchase warrant. Each whole warrant entitles the holder to acquire one common share at a price of C$2.60 for a period of five years from closing.
On October 22, 2013, we completed an underwritten public offering of 3,750,000 common shares, at a price of $8.00 per share, representing gross proceeds of $30.0 million. On November 1, 2013, the offering’s underwriter completed the exercise of its over-allotment option to purchase a further 562,500 shares at $8.00 bringing the aggregate financing gross proceeds to $34.5 million. The cost of the financing, including commissions and professional fees, was $2.5 million, resulting in net proceeds of $32.0 million.
On March 18, 2014, we completed an underwritten public offering of 2,125,000 common shares, at a price of $28.50 per share, representing gross proceeds of $60.5 million. The cost of financing, including commissions and professional fees, is estimated at $3.9 million, which will give us net proceeds of $56.6 million. The offering’s underwriter has a 30 day option to purchase an additional 318,750 common shares at $28.50, which would bring the net proceeds to $65.2 million if exercised in full. We plan to use these proceeds to develop and advance product candidates through clinical trials, as well as for working capital and general corporate purposes.
Cash requirements /
At December 31, 2013 we held $68.7 million in cash and cash equivalents. On March 18, 2014, we raised net proceeds of $56.6 million from a public offering. We believe we have sufficient cash resources for at least the next 12 months. In the future, substantial additional funds will be required to continue with the active development of our pipeline products and technologies. In particular, our funding needs may vary depending on a number of factors including:
|
|
·
|
revenues earned from our DoD contract to develop TKM-Ebola;
|
|
|
·
|
revenues earned from our collaborative partnerships and licensing agreements, including milestone payments from Alnylam and royalties from sales of Marqibo from Spectrum;
|
|
|
·
|
the extent to which we continue the development of our product candidates, add new product candidates to our pipeline, or form collaborative relationships to advance our products;
|
|
|
·
|
our decisions to in-license or acquire additional products or technology for development, in particular for our RNAi therapeutics programs;
|
|
|
·
|
our ability to attract and retain corporate partners, and their effectiveness in carrying out the development and ultimate commercialization of our product candidates;
|
|
|
·
|
whether batches of drugs that we manufacture fail to meet specifications resulting in delays and investigational and remanufacturing costs;
|
|
|
·
|
the decisions, and the timing of decisions, made by health regulatory agencies regarding our technology and products;
|
|
|
·
|
competing technological and market developments; and
|
|
|
·
|
prosecuting and enforcing our patent claims and other intellectual property rights.
|
We will seek to obtain funding to maintain and advance our business from a variety of sources including public or private equity or debt financing, collaborative arrangements with pharmaceutical companies and government grants and contracts. There can be no assurance that funding will be available at all or on acceptable terms to permit further development of our products especially in light of the current difficult climate for investment in early stage biotechnology companies.
If adequate funding is not available, we may be required to delay, reduce or eliminate one or more of our research or development programs or reduce expenses associated with non-core activities. We may need to obtain funds through arrangements with collaborators or others that may require us to relinquish most or all of our rights to product candidates at an earlier stage of development or on less favorable terms than we would otherwise seek if we were better funded. Insufficient financing may also mean failing to prosecute our patents or relinquishing rights to some of our technologies that we would otherwise develop or commercialize.
Material commitments for capital expenditures
/ As at the date of this discussion we do not have any material commitments for capital expenditure.
41
OFF-BALANCE SHEET ARRANGEMENTS
Protiva promissory notes
/ On March 25, 2008, our subsidiary, Protiva, declared a dividend totaling $12.0 million. The dividend was paid by issuing promissory notes on May 23, 2008. Recourse for payment of the promissory notes will be limited to our receipt, if any, of up to $12.0 million in payments from a third party. We will pay these funds, if and when we receive them, to the former Protiva shareholders in satisfaction of the promissory notes. As contingent obligations that would not need to be funded by the Company, the $12.0 million receivable and the related promissory notes payable are not included in our consolidated balance sheet.
CONTRACTUAL OBLIGATIONS
Facility lease
/ Effective July 29, 2009, we signed an amendment to the operating lease for its laboratory and office premises. The amended lease expires in July 2014 but we have the option to extend the lease to 2017 and then to 2022 and then to 2027. The amended lease included a signing incentive payment. In accordance with our accounting policy the signing incentive payment is being amortized on a straight-line basis over the term of the amended lease.
Product development partnership with the Canadian Government /
We entered into a Technology Partnerships Canada ("TPC") agreement with the Canadian Federal Government on November 12, 1999. Under this agreement, TPC agreed to fund 27% of our costs incurred prior to March 31, 2004, in the development of certain oligonucleotide product candidates up to a maximum contribution from TPC of $7.2 million (C$9.3 million). As at December 31, 2013, a cumulative contribution of $3.5 million (C$3.7 million) had been received and we do not expect any further funding under this agreement. In return for the funding provided by TPC, we agreed to pay royalties on the share of future licensing and product revenue, if any, that is received by us on certain non-siRNA oligonucleotide product candidates covered by the funding under the agreement. These royalties are payable until a certain cumulative payment amount is achieved or until a pre-specified date. In addition, until a cumulative amount equal to the funding actually received under the agreement has been paid to TPC, we agreed to pay a 2.5% royalty on any royalties we receive for Marqibo.
In September 2013, we began to earn royalties on Marqibo and have accrued $0.001 million in royalties payable to TPC as at December 31, 2013. The remaining contingently payable balance with TPC as of December 31, 2013 was $3.5 million (C$3.7 million).
License agreement with Marina Biotech, Inc. (“Marina”) /
On November 29, 2012, we announced a worldwide, non-exclusive license to a novel RNAi payload technology called Unlocked Nucleobase Analog (“UNA”) from Marina for the development of RNAi therapeutics.
UNA technology can be used in the development of RNAi therapeutics, which treat disease by silencing specific disease causing genes. UNAs can be incorporated into RNAi drugs and have the potential to improve them by increasing their stability and reducing off-target effects.
Under the license agreement, in the year ended December 31, 2012, we paid Marina an upfront fee of $0.3 million. A further license payment of $0.2 million was expensed in March 2013 and we will make milestone payments of up to $3.3 million, plus royalties on each product that we develop that uses Marina’s UNA technology. The upfront fee and license payment were expensed to research, development, collaborations and contracts expense.
Effective August 9, 2013, Marina’s UNA technology was acquired by Arcturus Therapeutics, Inc. (“Arcturus”) and the UNA license agreement between us and Marina was assigned to Arcturus. The terms of the license are otherwise unchanged.
Tabular Disclosure of Contractual Obligations
The following table summarizes our contractual obligations as at December 31, 2013:
|
(in millions $)
|
Payments Due by Period
|
|||||||||||||||||||
|
Total
|
Less
than 1 year
|
1 – 3
years
|
4 – 5
years
|
After 5
years
|
||||||||||||||||
|
Contractual Obligations
|
||||||||||||||||||||
|
Facility lease
|
0.7 | 0.7 | — | — | — | |||||||||||||||
|
Technology license obligations
(1)
|
1.3 | 1.3 | — | — | — | |||||||||||||||
|
Total contractual obligations
|
2.0 | 2.0 | — | — | — | |||||||||||||||
1
Relates to our expected fixed payment obligations under in-license agreements.
We in-license technology from a number of sources. Pursuant to these in-license agreements, we will be required to make additional payments if and when we achieve specified development, regulatory, financial and commercialization milestones. To the extent we are unable to reasonably predict the likelihood, timing or amount of such payments, we have excluded them from the table above. Our technology in-licenses are further described in the Overview section of this discussion.
We also have contracts and collaborative arrangements that require us to undertake certain research and development work as further explained elsewhere in this discussion. It is not practicable to estimate the amount of these obligations.
42
IMPACT OF INFLATION
Inflation has not had a material impact on our operations.
RELATED PARTY TRANSACTIONS
We have not entered into any related party transactions in the periods covered by this discussion.
OUTSTANDING SHARE DATA
At March 21, 2014, we had 21,945,838 common shares issued and outstanding, outstanding options to purchase an additional 1,893,954 common shares and outstanding warrants to purchase an additional 718,000 common shares.
RECENT ACCOUNTING PRONOUNCEMENTS
From time to time, new accounting pronouncements are issued by the Financial Accounting Standards Board (FASB) or other standard setting bodies that we adopt as of the specified effective date. Unless otherwise discussed, we believe that the impact of recently issued standards that are not yet effective will not have a material impact on our financial position or results of operations upon adoption.
In December 2011, the FASB issued ASU 2011-11,
Balance Sheet (Topic 210): Disclosures about Offsetting Assets and Liabilities
. In January 2013, the FASB issued ASU 2013-01,
Balance Sheet: Clarifying the Scope of Disclosures about Offsetting Assets and Liabilities
,
and is intended to narrow the scope of ASU 2011-11.These newly issued accounting standards requires an entity to disclose both gross and net information about instruments and transactions eligible for offset in the statement of financial position as well as instruments and transactions executed under a master netting or similar arrangement and was issued to enable users of financial statements to understand the effects or potential effects of those arrangements on its financial position. This ASU is required to be applied retrospectively and is effective for fiscal years, and interim periods within those years, beginning on or after January 1, 2013. As this accounting standard only requires enhanced disclosure, the adoption of this standard did not have an impact on our financial position or results of operations.
In February 2013, the FASB issued amendments to the accounting guidance for presentation of comprehensive income to improve the reporting of reclassifications out of accumulated other comprehensive income. The amendments do not change the current requirements for reporting net income or other comprehensive income, but do require an entity to provide information about the amounts reclassified out of accumulated other comprehensive income by component. In addition, an entity is required to present, either on the face of the statement where the net income is presented or in the notes, significant amounts reclassified out of accumulated other comprehensive income by the respective line items of net income but only if the amount reclassified is required under GAAP to be reclassified to net income in its entirety in the same reporting period. For other amounts that are not required under GAAP to be reclassified in their entirety to net income, an entity is required to cross-reference to other disclosures required under GAAP that provide additional detail about these amounts. For public companies, these amendments are effective prospectively for reporting periods beginning after December 15, 2012. The adoption of this guidance did not have a material impact on our consolidated financial statements.
In July 2013, the FASB issued ASU 2013-11, Income Taxes (ASC 740)
Presentation of an Unrecognized Tax Benefit When a Net Operating Loss Carry forward, a Similar Tax Loss, or a Tax Credit Carry forward Exists
(Update). The update is intended to eliminate the diversity in practice of the presentation of an unrecognized tax benefit when a net operating loss carryforward, a similar tax loss, or a tax credit carryforward exists. The update is effective for annual and interim financial statements for fiscal years beginning after December 15, 2013. The amendments should be applied prospectively to all unrecognized tax benefits that exist at the effective date. Retrospective application is permitted. We do not expect that the adoption of this guidance will have a material impact on our consolidated financial statements.
|
Quantitative and Qualitative Disclosures about Market Risk
|
We are exposed to market risk related to changes in interest rates, which could adversely affect the value of our interest rate sensitive assets and liabilities. We do not hold any instruments for trading purposes and investment decisions are governed by a Board approved Investment Policy. As at December 31, 2013 and 2012, we had cash and cash equivalents of $68.7 million and $47.0 million respectively. We invest our cash reserves in high interest saving accounts and guaranteed investment certificates with varying terms to maturity (not exceeding two years) issued by major Canadian banks, selected with regard to the expected timing of expenditures for continuing operations and prevailing interest rates. The fair value of our cash investments as at December 31, 2013 is at least equal to the face value of those investments and the value reported in our Balance Sheet. Due to the relatively short-term nature of the investments that we hold, we do not believe that the results of operations or cash flows would be affected to any significant degree by a sudden change in market interest rates relative to our investment portfolio. Our debt instrument sensitive to changes in interest rate is our warrant liability with its fair value determined using the Black-Scholes model, which uses interest rate as an input. We have estimated the effects on our warrant liability based on a one percentage point hypothetical adverse change in interest rates as of December 31, 2013 and 2012. We determined the hypothetical fair value using the same Black-Scholes model, and determined that an increase in the interest rates of one percentage point would have had an adverse change to our warrant liability of $0.04 million and $0.10 million as of December 31, 2013 and 2012, respectively.
43
In addition, we are exposed to market risk related to changes in foreign currency exchange rates. We used a forward exchange contract to convert $45.0 million into Canadian dollars in November 2012. We have not entered into any other agreements or purchased any instruments to hedge possible currency risks at this time. Prior to the financing in October 2013, which was denominated in U.S. dollars, we managed our U.S. dollar currency risk by using cash received from U.S. dollar revenues to pay U.S. dollar expense and by limited holdings of U.S. dollar cash and cash equivalent balances to working capital levels. Given our increasing level of U.S. dollar expenses, we maintained the funds raised in October 2013 in U.S. dollars in order to achieve a natural foreign exchange hedge. As of December 31, 2013 and 2012, an adverse change of one percentage point in the foreign currency exchange rates would have resulted in an incremental loss of $0.4 million and $0.01 million, respectively. We recorded foreign exchange gains of $1.1 million and $0.02 million for the fiscal years ended December 31, 2013 and 2012, respectively.
|
Financial Statements and Supplementary Data
|
INDEX TO CONSOLIDATED FINANCIAL STATEMENTS
|
Page
|
||
|
|
||
|
|
||
|
|
||
|
|
||
|
|
||
|
|
||
To the Shareholders and Board of Directors of Tekmira Pharmaceuticals Corporation
We have audited the accompanying consolidated financial statements of Tekmira Pharmaceuticals Corporation, which comprise the consolidated balance sheets as at December 31, 2013 and December 31, 2012, the consolidated statements of operations and comprehensive income (loss), stockholders’ equity and cash flows for each of the years in the three-year period ended December 31, 2013, and notes, comprising a summary of significant accounting policies and other explanatory information.
Management's Responsibility for the Consolidated Financial Statements
Management is responsible for the preparation and fair presentation of these consolidated financial statements in accordance with US generally accepted accounting principles, and for such internal control as management determines is necessary to enable the preparation of consolidated financial statements that are free from material misstatement, whether due to fraud or error.
Auditors’ Responsibility
Our responsibility is to express an opinion on these consolidated financial statements based on our audits. We conducted our audits in accordance with Canadian generally accepted auditing standards and the standards of the Public Company Accounting Oversight Board (United States). Those standards require that we comply with ethical requirements and plan and perform the audit to obtain reasonable assurance about whether the consolidated financial statements are free from material misstatement.
An audit involves performing procedures to obtain audit evidence about the amounts and disclosures in the consolidated financial statements. The procedures selected depend on our judgment, including the assessment of the risks of material misstatement of the consolidated financial statements, whether due to fraud or error. In making those risk assessments, we consider internal control relevant to the entity's preparation and fair presentation of the consolidated financial statements in order to design audit procedures that are appropriate in the circumstances but not for the purpose of expressing an opinion on the effectiveness of the entity’s internal control. An audit also includes evaluating the appropriateness of accounting policies used and the reasonableness of accounting estimates made by management, as well as evaluating the overall presentation of the consolidated financial statements.
We believe that the audit evidence we have obtained in our audits is sufficient and appropriate to provide a basis for our audit opinion.
44
Opinion
In our opinion, the consolidated financial statements present fairly, in all material respects, the consolidated financial position of Tekmira Pharmaceuticals Corporation as at December 31, 2013 and December 31, 2012 and its consolidated results of operations and its consolidated cash flows for each of the years in the three-year period ended December 31, 2013 in accordance with US generally accepted accounting principles.
KPMG LLP
Chartered Accountants
March 5, 2014
Vancouver, Canada
45
TEKMIRA PHARMACEUTICALS CORPORATION
(Expressed in US Dollars)
(Prepared in accordance with US GAAP)
|
December 31
2013
|
December 31
2012
|
|||||||
|
Assets
|
||||||||
|
Current assets:
|
||||||||
|
Cash and cash equivalents
|
$ | 68,716,531 | 47,024,124 | |||||
|
Accounts receivable
|
116,556 | 1,074,891 | ||||||
|
Accrued revenue
|
212,384 | 2,373,881 | ||||||
|
Deferred expenses
|
172,952 | 431,410 | ||||||
|
Investment tax credits receivable
|
40,200 | 9,875 | ||||||
|
Prepaid expenses and other assets
|
1,084,030 | 329,280 | ||||||
|
Total current assets
|
70,342,653 | 51,243,461 | ||||||
|
Property and equipment (note 4)
|
13,038,751 | 13,188,186 | ||||||
|
Less accumulated depreciation (note 4)
|
(11,665,594 | ) | (11,836,456 | ) | ||||
|
Property and equipment, net of accumulated
depreciation (note 4)
|
1,373,157 | 1,351,730 | ||||||
|
Total assets
|
$ | 71,715,810 | $ | 52,595,191 | ||||
|
Liabilities and stockholders' equity
|
||||||||
|
Current liabilities:
|
||||||||
|
Accounts payable and accrued liabilities (note 10)
|
$ | 3,680,462 | 3,795,546 | |||||
|
Deferred revenue (note 3)
|
3,463,255 | 3,143,580 | ||||||
|
Warrants (note 2 and 5)
|
5,378,772 | 4,014,821 | ||||||
|
Total current liabilities
|
12,522,489 | 10,953,947 | ||||||
|
Deferred revenue, net of current portion (note 3)
|
- | 722,445 | ||||||
|
Total liabilities
|
12,522,489 | 11,676,392 | ||||||
|
Stockholders’ equity:
|
||||||||
|
Common shares (note 5)
|
||||||||
|
Authorized - unlimited number with no par value
|
||||||||
|
Issued and outstanding:
19,048,900 (December 31, 2012 - 14,305,356)
|
216,701,859 | 181,785,818 | ||||||
|
Additional paid-in capital
|
25,343,481 | 24,786,028 | ||||||
|
Deficit
|
(167,026,633 | ) | (152,962,407 | ) | ||||
|
Accumulated other comprehensive income (loss)
|
(15,825,386 | ) | (12,690,640 | ) | ||||
|
Total stockholders' equity
|
59,193,321 | 40,918,799 | ||||||
|
Total liabilities and stockholders' equity
|
$ | 71,715,810 | $ | 52,595,191 | ||||
Nature of business and future operations (note 1)
Contingencies and commitments (note 8)
Subsequent events (note 11)
See accompanying notes to the consolidated financial statements.
46
TEKMIRA PHARMACEUTICALS CORPORATION
(Expressed in US Dollars)
(Prepared in accordance with US GAAP)
|
Year ended December 31
|
||||||||||||
|
2013
|
2012
|
2011
|
||||||||||
|
Revenue (note 3)
|
||||||||||||
|
Collaborations and contracts
|
$ | 10,424,569 | $ | 12,105,186 | $ | 16,311,590 | ||||||
|
Licensing fees, milestone and
royalty payments
|
5,039,581 | 2,000,000 | 500,000 | |||||||||
|
Total revenue
|
15,464,150 | 14,105,186 | 16,811,590 | |||||||||
|
Expenses
|
||||||||||||
|
Research, development, collaborations
and contracts
|
21,458,258 | 18,043,356 | 20,131,922 | |||||||||
|
General and administrative
|
5,546,273 | 8,140,779 | 6,386,386 | |||||||||
|
Depreciation of property and equipment
|
612,837 | 865,599 | 986,932 | |||||||||
|
Total expenses
|
27,617,368 | 27,049,734 | 27,505,240 | |||||||||
|
Loss from operations
|
(12,153,218 | ) | (12,944,548 | ) | (10,693,650 | ) | ||||||
|
Other income (losses)
|
||||||||||||
|
Interest income
|
539,996 | 138,320 | 126,314 | |||||||||
|
Licensing settlement payment (note 3(b))
|
- | 65,000,000 | - | |||||||||
|
Licensing settlement legal fees (note 3(b))
|
- | (18,737,966 | ) | - | ||||||||
|
Foreign exchange gains (losses)
|
1,079,310 | 24,855 | (14,692 | ) | ||||||||
|
Warrant issuance costs (note 5)
|
- | (47,030 | ) | (80,937 | ) | |||||||
|
(Increase) decrease in fair value of warrant liability (note 2)
|
(3,530,314 | ) | (3,821,635 | ) | 579,474 | |||||||
|
Net income (loss)
|
$ | (14,064,226 | ) | $ | 29,611,996 | $ | (10,083,491 | ) | ||||
|
Income (loss) per common share (note 2)
|
||||||||||||
|
Basic
|
$ | (0.92 | ) | $ | 2.16 | $ | (0.89 | ) | ||||
|
Diluted
|
$ | (0.92 | ) | $ | 2.07 | $ | (0.89 | ) | ||||
|
Weighted average number of common shares
|
||||||||||||
|
Basic
|
15,302,680 | 13,727,925 | 11,318,766 | |||||||||
|
Diluted
|
15,302,680 | 14,320,814 | 11,318,766 | |||||||||
|
Comprehensive income (loss)
|
||||||||||||
|
Cumulative translation adjustment
|
(3,134,746 | ) | 473,825 | (53,066 | ) | |||||||
|
Comprehensive income (loss)
|
$ | (17,198,972 | ) | $ | 30,085,821 | $ | (10,136,557 | ) | ||||
See accompanying notes to the consolidated financial statements.
47
TEKMIRA PHARMACEUTICALS CORPORATION
(Expressed in US Dollars)
(Prepared in accordance with US GAAP)
| Additional |
Accumulated
|
Total
|
||||||||||||||||||||||
|
Number
|
Share
|
paid-in
|
|
other comprehensive
|
stockholders'
|
|||||||||||||||||||
|
of shares
|
capital
|
capital
|
Deficit
|
income (loss)
|
equity
|
|||||||||||||||||||
|
Balance, December 31, 2010
|
10,338,702 | $ | 172,982,011 | $ | 23,410,834 | $ | (172,490,912 | ) | $ | (13,111,399 | ) | $ | 10,790,534 | |||||||||||
|
Stock-based compensation
|
- | - | 633,449 | - | - | 633,449 | ||||||||||||||||||
|
Issuance of common shares
pursuant to exercise of options
|
20,033 | 128,371 | (117,586 | ) | - | - | 10,785 | |||||||||||||||||
|
Issuance of common shares in conjunction with the
public offering, net of issuance costs of $481,135 and net of initial fair value of warrants of $751,505
|
1,789,900 | 3,928,294 | - | - | - | 3,928,294 | ||||||||||||||||||
|
Currency translation adjustment
|
- | - | - | - | (53,066 | ) | (53,066 | ) | ||||||||||||||||
|
Net loss
|
- | - | - | (10,083,491 | ) | - | (10,083,491 | ) | ||||||||||||||||
|
Balance, December 31, 2011
|
12,148,635 | $ | 177,038,676 | $ | 23,926,697 | $ | (182,574,403 | ) | $ | (13,164,465 | ) | $ | 5,226,505 | |||||||||||
|
Stock-based compensation
|
- | - | 982,290 | - | - | 982,290 | ||||||||||||||||||
|
Issuance of common shares
pursuant to exercise of options
|
38,635 | 194,050 | (122,959 | ) | - | - | 71,091 | |||||||||||||||||
|
Issuance of common shares
pursuant to exercise of warrants
|
269,485 | 1,512,973 | - | - | - | 1,512,973 | ||||||||||||||||||
|
Issuance of common shares in conjunction with the
private offering, net of issuance costs of $178,521 and net of initial fair value of warrants of $850,907
|
1,848,601 | 3,040,119 | - | - | - | 3,040,119 | ||||||||||||||||||
|
Currency translation adjustment
|
- | - | - | - | 473,825 | 473,825 | ||||||||||||||||||
|
Net income
|
- | - | - | 29,611,996 | - | 29,611,996 | ||||||||||||||||||
|
Balance, December 31, 2012
|
14,305,356 | $ | 181,785,818 | $ | 24,786,028 | $ | (152,962,407 | ) | $ | (12,690,640 | ) | $ | 40,918,799 | |||||||||||
|
Stock-based compensation
|
- | - | 903,005 | - | - | 903,005 | ||||||||||||||||||
|
Issuance of common shares
pursuant to exercise of options
|
125,596 | 734,872 | (345,552 | ) | - | - | 389,320 | |||||||||||||||||
|
|
||||||||||||||||||||||||
|
Issuance of common shares
pursuant to exercise of warrants
|
305,448 | 2,142,852 | - | - | - | 2,142,852 | ||||||||||||||||||
|
Issuance of common shares in conjunction with the
private offering, net of issuance costs of $2,461,683
|
4,312,500 | 32,038,317 | - | - | - | 32,038,317 | ||||||||||||||||||
|
Currency translation adjustment
|
- | - | - | - | (3,134,746 | ) | (3,134,746 | ) | ||||||||||||||||
|
Net loss
|
- | - | - | (14,064,226 | ) | - | (14,064,226 | ) | ||||||||||||||||
|
Balance, December 31, 2013
|
19,048,900 | $ | 216,701,859 | $ | 25,343,481 | $ | (167,026,633 | ) | $ | (15,825,386 | ) | $ | 59,193,321 | |||||||||||
48
TEKMIRA PHARMACEUTICALS CORPORATION
(Expressed in US Dollars)
(Prepared in accordance with US GAAP)
|
Year ended December 31
|
||||||||||||
|
2013
|
2012
|
2011
|
||||||||||
|
OPERATING ACTIVITIES
|
||||||||||||
|
Income (loss) for the year
|
$ | (14,064,226 | ) | $ | 29,611,996 | $ | (10,083,491 | ) | ||||
|
Items not involving cash:
|
||||||||||||
|
Depreciation of property and equipment
|
612,837 | 865,599 | 986,932 | |||||||||
|
Stock-based compensation expense
|
903,005 | 982,290 | 633,449 | |||||||||
|
Unrealized foreign exchange (gains) losses
|
(18,119 | ) | 29,292 | (20,331 | ) | |||||||
|
Warrant issuance costs
|
- | 47,030 | 80,937 | |||||||||
|
Change in fair value of warrant liability
|
3,530,314 | 3,821,635 | (579,474 | ) | ||||||||
|
Fair value of warrants issued in conjunction with debt facility
|
- | - | 35,414 | |||||||||
|
Net change in non-cash operating items:
|
||||||||||||
|
Accounts receivable
|
888,929 | (189,707 | ) | 2,397,321 | ||||||||
|
Accrued revenue
|
2,008,215 | (2,187,580 | ) | 621,552 | ||||||||
|
Deferred expenses
|
230,602 | 360,720 | (226,999 | ) | ||||||||
|
Investment tax credits receivable
|
(30,963 | ) | 322,845 | 71,336 | ||||||||
|
Inventory
|
- | - | 148,214 | |||||||||
|
Prepaid expenses and other assets
|
(776,012 | ) | 97,272 | (107,504 | ) | |||||||
|
Accounts payable and accrued liabilities
|
129,997 | (197,265 | ) | (2,142,976 | ) | |||||||
|
Deferred revenue
|
(153,138 | ) | (655,344 | ) | 354,662 | |||||||
|
Net cash (used in) operating activities
|
(6,738,559 | ) | 32,908,783 | (7,830,958 | ) | |||||||
|
INVESTING ACTIVITIES
|
||||||||||||
|
Proceeds from sale of property and equipment
|
- | 2,503 | - | |||||||||
|
Acquisition of property and equipment
|
(725,100 | ) | (14,900 | ) | (60,378 | ) | ||||||
|
Net cash used in investing activities
|
(725,100 | ) | (12,397 | ) | (60,378 | ) | ||||||
|
FINANCING ACTIVITIES
|
||||||||||||
|
Proceeds from issuance of common shares and warrants, net of issuance costs
|
32,038,317 | 3,843,996 | 4,598,862 | |||||||||
|
Issuance of common shares pursuant to exercise of options
|
389,320 | 71,091 | 10,786 | |||||||||
|
Issuance of common shares pursuant to exercise of warrants
|
288,824 | 632,282 | - | |||||||||
|
Net cash provided by financing activities
|
32,716,461 | 4,547,369 | 4,609,648 | |||||||||
|
Effect of foreign exchange rate changes on cash & cash equivalents
|
(3,560,395 | ) | 549,610 | (100,232 | ) | |||||||
|
Increase (decrease) in cash and cash equivalents
|
21,692,407 | 37,993,365 | (3,381,920 | ) | ||||||||
|
Cash and cash equivalents, beginning of year
|
47,024,124 | 9,030,759 | 12,412,678 | |||||||||
|
Cash and cash equivalents, end of year
|
$ | 68,716,531 | $ | 47,024,124 | $ | 9,030,759 | ||||||
|
Supplemental cash flow information
|
||||||||||||
|
Fair value of warrants exercised on a cashless basis
|
$ | 1,404,349 | $ | 210,680 | $ | - | ||||||
|
Investment tax credits received
|
$ | 9,875 | $ | 322,720 | $ | 103,664 | ||||||
|
Fair value of warrants issued in conjunction with public offering
|
$ | - | $ | 850,907 | $ | 751,505 | ||||||
|
Fair value of warrants issued in conjunction with debt facility
|
$ | - | $ | - | $ | 35,414 | ||||||
See accompanying notes to the consolidated financial statements.
49
Tekmira Pharmaceuticals Corporation (the “Company”) is a Canadian biopharmaceutical business focused on advancing novel RNA interference therapeutics.
The success of the Company is dependent on obtaining the necessary regulatory approvals to bring its products to market and achieve profitable operations. The continuation of the research and development activities and the commercialization of its products are dependent on the Company’s ability to successfully complete these activities and to obtain adequate financing through a combination of financing activities and operations. It is not possible to predict either the outcome of future research and development programs or the Company’s ability to fund these programs in the future.
|
2.
|
Significant accounting policies
|
Basis of presentation
Tekmira Pharmaceuticals Corporation was incorporated on October 6, 2005 as an inactive wholly owned subsidiary of Inex Pharmaceuticals Corporation (“Inex”). Pursuant to a “Plan of Arrangement” effective April 30, 2007 the business and substantially all of the assets and liabilities of Inex were transferred to the Company. The consolidated financial statements for all periods presented herein include the consolidated operations of Inex until April 30, 2007 and the operations of the Company thereafter.
These consolidated financial statements include the accounts of the Company and its two wholly-owned subsidiaries, Protiva Biotherapeutics Inc. and Protiva Biotherapeutics (USA), Inc., which were acquired on May 30, 2008. All intercompany transactions and balances have been eliminated on consolidation.
Comparative Information
Certain information has been reclassified to conform with the financial statement presentation adopted for the current year.
Use of estimates
The preparation of the consolidated financial statements in conformity with generally accepted accounting principles requires management to make estimates and assumptions about future events that affect the reported amounts of assets, liabilities, revenue, expenses, contingent assets and contingent liabilities as at the end or during the reporting period. Actual results could significantly differ from those estimates. Significant areas requiring the use of management estimates relate to recognition of revenue, stock-based compensation, share purchase warrant valuation and the amounts recorded as accrued liabilities.
Cash and cash equivalents
Cash and cash equivalents are all highly liquid instruments with an original maturity of three months or less when purchased. Cash equivalents are recorded at cost plus accrued interest. The carrying value of these cash equivalents approximates their fair value.
Fair value of financial instruments
We measure certain financial instruments and other items at fair value.
To determine the fair value, we use the fair value hierarchy for inputs used in measuring fair value that maximizes the use of observable inputs and minimizes the use of unobservable inputs by requiring that the most observable inputs be used when available. Observable inputs are inputs market participants would use to value an asset or liability and are developed based on market data obtained from independent sources. Unobservable inputs are inputs based on assumptions about the factors market participants would use to value an asset or liability. The three levels of inputs that may be used to measure fair value are as follows:
|
•
|
Level 1 inputs are quoted market prices for identical instruments available in active markets.
|
|
•
|
Level 2 inputs are inputs other than quoted prices included within Level 1 that are observable for the asset or liability either directly or indirectly. If the asset or liability has a contractual term, the input must be observable for substantially the full term. An example includes quoted market prices for similar assets or liabilities in active markets.
|
|
•
|
Level 3 inputs are unobservable inputs for the asset or liability and will reflect management’s assumptions about market assumptions that would be used to price the asset or liability.
|
Assets and liabilities are classified based on the lowest level of input that is significant to the fair value measurements. Changes in the observability of valuation inputs may result in a reclassification of levels for certain securities within the fair value hierarchy.
The Company’s financial instruments consist of cash and cash equivalents, accounts receivable, investment tax credits receivable, accounts payable and accrued liabilities, and warrants and promissory notes.
50
The carrying values of cash and cash equivalents are recorded at fair value based on quoted prices in active markets. The carrying values of accounts receivable, investment tax credits receivable and accounts payable and accrued liabilities approximate their fair values due to the immediate or short-term maturity of these financial instruments.
As quoted prices for the warrants are not readily available, the Company has used a Black-Scholes pricing model, as described in Note 5, to estimate fair value. These are level 3 inputs as defined above.
The following tables present information about the Company’s assets and liabilities that are measured at fair value on a recurring basis, and indicates the fair value hierarchy of the valuation techniques used to determine such fair value:
|
Level 1
|
Level 2
|
Level 3
|
December 31, 2013
|
|||||||||||||
|
Assets
|
||||||||||||||||
|
Cash
|
$ | 68,716,531 | - | - | $ | 68,716,531 | ||||||||||
|
Guaranteed Investment Certificates
|
- | - | - | - | ||||||||||||
|
Total
|
$ | 68,716,531 | - | - | $ | 68,716,531 | ||||||||||
|
Liabilities
|
||||||||||||||||
|
Warrants
|
$ | - | - | $ | 5,378,772 | $ | 5,378,772 | |||||||||
|
Level 1
|
Level 2
|
Level 3
|
December 31, 2012
|
|||||||||||||
|
Assets
|
||||||||||||||||
|
Cash
|
$ | 44,373,720 | - | - | $ | 44,373,720 | ||||||||||
|
Guaranteed Investment Certificates
|
2,650,404 | - | - | 2,650,404 | ||||||||||||
|
Total
|
$ | 47,024,124 | - | - | $ | 47,024,124 | ||||||||||
|
Liabilities
|
||||||||||||||||
|
Warrants
|
$ | - | - | $ | 4,014,821 | $ | 4,014,821 | |||||||||
The following table presents the changes in fair value of the Company’s warrants:
|
Liability at
beginning
of the year
|
Opening
liability of
warrants issued in
the year
|
Fair value of
warrants
exercised
in the
year
|
Increase
(decrease) in
value of
warrants
|
Foreign
exchange
(gain) loss
|
Liability
at end
of the year
|
|||||||||||||||||||
|
Year ended December 31, 2011
|
$ | - | $ | 786,919 | $ | - | $ | (579,474 | ) | $ | (5,825 | ) | $ | 201,620 | ||||||||||
|
Year ended December 31, 2012
|
$ | 201,620 | $ | 850,907 | $ | (880,691 | ) | $ | 3,821,635 | $ | 21,350 | $ | 4,014,821 | |||||||||||
|
Year ended December 31, 2013
|
$ | 4,014,821 | $ | - | $ | (1,854,028 | ) | $ | 3,530,314 | $ | (312,335 | ) | $ | 5,378,772 | ||||||||||
Inventory
Inventory includes materials assigned for the manufacture of products for collaborative partners and manufacturing costs for products awaiting acceptance by collaborative partners. Inventory is carried at the lower of cost and net realizable value. The cost of inventories includes all costs of purchase, costs of manufacturing and other costs incurred in bringing the inventories to their present location and condition.
Materials purchased for the Company’s own research and development products, or, for collaborative partners where an acceptance criteria does not apply, are not recorded as inventory but are expensed at the time of receipt.
Property and equipment
Property and equipment is recorded at cost less impairment losses, accumulated depreciation, related government grants and investment tax credits. The Company records depreciation using the straight-line method over the estimated useful lives of the capital assets as follows:
51
|
Rate
|
||||
|
Laboratory equipment (years)
|
5 | |||
|
Computer and office equipment (years)
|
2 | - | 5 | |
|
Furniture and fixtures (years)
|
5 | |||
Leasehold improvements are depreciated over their estimated useful lives but in no case longer than the lease term, except where lease renewal is reasonably assured. Assets held under capital leases that do not allow for ownership to pass to the Company are depreciated using the straight-line method over their useful life, not exceeding the lease term. Assets under construction are not depreciated until usage has begun.
Intangible assets
The costs incurred in establishing and maintaining patents for intellectual property developed internally are expensed in the period incurred.
Impairment of long-lived assets
If there is a major event indicating that the carrying value of property and equipment may be impaired then management will perform an impairment test and if the recoverable value, based on undiscounted future cash flows, exceeds carrying value then such assets are written down to their fair values.
Revenue recognition
The Company earns revenue from research and development collaboration and contract services, licensing fees and milestone payments. Revenues associated with multiple element arrangements are attributed to the various elements based on their relative fair values or are recognized as a single unit of accounting when relative fair values are not determinable. Non-refundable payments received under collaborative research and development agreements are recorded as revenue as services are performed and related expenditures are incurred. Non-refundable upfront license fees from collaborative licensing and development arrangements are recognized as the Company fulfills its obligations related to the various elements within the agreements, in accordance with the contractual arrangements with third parties and the term over which the underlying benefit is being conferred. Revenue earned under contractual arrangements upon the occurrence of specified milestones is recognized as the milestones are achieved and collection is reasonably assured.
Revenue earned under research and development manufacturing collaborations where the Company bears some or all of the risk of a product manufacturing failure is recognized when the purchaser accepts the product and there are no remaining rights of return.
Revenue earned under research and development collaborations where the Company does not bear any risk of product manufacturing failure is recognized in the period the work is performed. For contracts where the manufacturing amount is specified, revenue is recognized as product is manufactured in proportion to the total amount specified under the contract.
Revenue and expenses under the contract with the United States Government Department of Defense (“DoD”) are being recorded using the percentage-of-completion method. Contract progress is based on costs incurred to date. Expenses under the contract are recorded in the Company’s consolidated statement of operations and comprehensive income (loss) as they are incurred. Government contract revenues related to expenses incurred under the contract are recorded in the same period as those expenses. Expenses accrued under the contract but not yet invoiced are recorded in the Company’s balance sheet as accrued liabilities and accrued revenues. Equipment purchased under the contract is recorded on the Company’s balance sheet as deferred expense and deferred revenue and amortized, on a straight-line basis, over the life of the contract.
Cash or other compensation received in advance of meeting the revenue recognition criteria is recorded on the balance sheet as deferred revenue. Revenue meeting recognition criteria but not yet received or receivable is recorded on the balance sheet as accrued revenue.
Leases and lease inducements
Leases entered into are classified as either capital or operating leases. Leases which substantially transfer all benefits and risks of ownership of property to the Company are accounted for as capital leases. At the time a capital lease is entered into, an asset is recorded together with its related long-term obligation to reflect the purchase and financing.
All other leases are accounted for as operating leases wherein rental payments are expensed as incurred.
Lease inducements represent leasehold improvement allowances and reduced or free rent periods and are amortized on a straight-line basis over the term of the lease and are recorded as a reduction of rent expense.
52
Research and development costs
Research and development costs, including acquired in-process research and development expenses for which there is no alternative future use, are charged as an expense in the period in which they are incurred.
Income or loss per share
Income or loss per share is calculated based on the weighted average number of common shares outstanding. Diluted loss per share does not differ from basic loss per share since the effect of the Company’s stock options and warrants is anti-dilutive. Diluted income per share is calculated using the treasury stock method which uses the weighted average number of common shares outstanding during the period and also includes the dilutive effect of potentially issuable common shares from outstanding, in-the-money stock options and warrants.
The following table sets out the computation of basic and diluted net income (loss) per common share:
| Year ended December 31 | ||||||||||||
|
2013
|
2012
|
2011
|
||||||||||
|
Numerator:
|
||||||||||||
|
Net income (loss)
|
$ | (14,064,226 | ) | $ | 29,611,996 | $ | (10,083,491 | ) | ||||
|
Denominator:
|
||||||||||||
|
Weighted average number of common shares
|
15,302,680 | 13,727,925 | 11,318,766 | |||||||||
|
Effect of dilutive securities:
|
||||||||||||
|
Warrants
|
- | 177,374 | - | |||||||||
|
Options
|
- | 415,515 | - | |||||||||
|
Diluted weighted average number of common shares
|
15,302,680 | 14,320,814 | 11,318,766 | |||||||||
|
Basic income (loss) per common share
|
$ | (0.92 | ) | $ | 2.16 | $ | (0.89 | ) | ||||
|
Diluted income (loss) per common share
|
$ | (0.92 | ) | $ | 2.07 | $ | (0.89 | ) | ||||
For the year ended December 31, 2013, potential common shares of 3,064,767 were excluded from the calculation of income per common share because their inclusion would be anti-dilutive (December 31, 2012 –1,085,503; December 31, 2011 – 2,694,330).
Government grants and refundable investment tax credits
Government grants and tax credits provided for current expenses is included in the determination of income or loss for the year, as a reduction of the expenses to which it relates. Government grants and tax credits towards the acquisition of property and equipment is deducted from the cost of the related property and equipment.
Foreign currency translation and change in reporting currency
The functional currency of the Company is the Canadian dollar. For the Company and its integrated subsidiaries (Protiva Biotherapeutics Inc. and Protiva Biotherapeutics (USA), Inc.), foreign currency monetary assets and liabilities are translated into Canadian dollars at the rate of exchange prevailing at the balance sheet date. Non-monetary assets and liabilities are translated at historical exchange rates. The previous month’s closing rate of exchange is used to translate revenue and expense transactions. Exchange gains and losses are included in income or loss for the period.
Effective October 1, 2013, the Company is using United States dollars as its reporting currency. All assets and liabilities are translated using the exchange rate at the balance sheet date (2013 – 0.9402; 2012 – 1.0051; 2011 – 0.9833). Revenues, expenses and other income (losses) are translated using the average rate for the period (2013 – 0.971; 2012 – 1.001; 2011 – 1.012), except for large transactions, for which the exchange rate on the date of the transaction is used. Equity accounts are translated using the historical rate. As a result of the change in reporting currency, the Company is reporting an accumulated other comprehensive loss of $15,825,386 as at December 31, 2013 (2012 - $12,690,640; 2011 – $13,164,466) in its consolidated balance sheets. As the translation differences from the Company’s functional currency of Canadian dollars to the Company’s reporting currency of U.S. dollars are unrealized gains and losses, the differences are recorded in other comprehensive income (loss), and do not impact the calculation of Earnings per Share.
53
Deferred income taxes
Income taxes are accounted for using the asset and liability method of accounting. Deferred income taxes are recognized for the future income tax consequences attributable to differences between the carrying values of assets and liabilities and their respective income tax bases and for loss carry-forwards. Deferred income tax assets and liabilities are measured using enacted income tax rates expected to apply to taxable income in the periods in which temporary differences are expected to be recovered or settled. The effect on deferred income tax assets and liabilities of a change in tax laws or rates is included in earnings in the period that includes the enactment date. When realization of deferred income tax assets does not meet the more-likely-than-not criterion for recognition, a valuation allowance is provided.
Stock-based compensation
The Company grants stock options to employees and directors pursuant to a share incentive plan described in note 5. Compensation expense is recorded for issued stock options using the fair value method with a corresponding increase in additional paid-in capital. Any consideration received on the exercise of stock options is credited to share capital.
The fair value of stock options is measured at the grant date and amortized on a straight-line basis over the vesting period.
Warrants
The Company accounts for the warrants under the authoritative guidance on accounting for derivative financial instruments indexed to, and potentially settled in, a company’s own stock, on the understanding that in compliance with applicable securities laws, the registered warrants require the issuance of registered securities upon exercise and do not sufficiently preclude an implied right to net cash settlement. The Company classifies warrants in its consolidated balance sheet as a liability which is revalued at each balance sheet date subsequent to the initial issuance. The Company uses the Black-Scholes pricing model to value the warrants. Determining the appropriate fair-value model and calculating the fair value of registered warrants requires considerable judgment. A small change in the estimates used may cause a relatively large change in the estimated valuation. The estimated volatility of the Company’s common stock at the date of issuance, and at each subsequent reporting period, is based on historic fluctuations in the Company’s stock price. The risk-free interest rate is based on the zero-coupon rate for bonds with a maturity similar to the expected remaining life of the warrants at the valuation date. The expected life of the warrants is based on the historical pattern of exercises of warrants.
Segment information
The Company operates in a single reporting segment, the research and development of RNA interference therapeutics. Substantially all of the Company’s revenues to date were earned from customers or collaborators based in the United States. Substantially all of the Company’s premises, property and equipment is located in Canada.
Recent accounting pronouncements
From time to time, new accounting pronouncements are issued by the Financial Accounting Standards Board (FASB) or other standard setting bodies that are adopted by the Company as of the specified effective date. Unless otherwise discussed, we believe that the impact of recently issued standards that are not yet effective will not have a material impact on our financial position or results of operations upon adoption.
In December 2011, the FASB issued ASU 2011-11,
Balance Sheet (Topic 210): Disclosures about Offsetting Assets and Liabilities
. In January 2013, the FASB issued ASU-2013-01,
Balance Sheet: Clarifying the Scope and Disclosures about Offsetting Assets and Liabilities
, which narrows the scope of ASU 2011-011. These newly issued accounting standards requires an entity to disclose both gross and net information about instruments and transactions eligible for offset in the balance sheet as well as instruments and transactions executed under a master netting or similar arrangement and was issued to enable users of financial statements to understand the effects or potential effects of those arrangements on its balance sheet. This ASU is required to be applied retrospectively and is effective for fiscal years, and interim periods within those years, beginning on or after January 1, 2013. As this accounting standard only requires enhanced disclosure, the adoption of this standard did not have an impact on the Company’s financial position or statement of operations.
In February 2013, the FASB issued amendments to the accounting guidance for presentation of comprehensive income to improve the reporting of reclassifications out of accumulated other comprehensive income. The amendments do not change the current requirements for reporting net income or other comprehensive income, but do require an entity to provide information about the amounts reclassified out of accumulated other comprehensive income by component. In addition, an entity is required to present, either on the face of the statement where the net income is presented or in the notes, significant amounts reclassified out of accumulated other comprehensive income by the respective line items of net income but only if the amount reclassified is required under GAAP to be reclassified to net income in its entirety in the same reporting period. For other amounts that are not required under GAAP to be reclassified in their entirety to net income, an entity is required to cross-reference to other disclosures required under GAAP that provide additional detail about these amounts. For public companies, these amendments are effective prospectively for reporting periods beginning after December 15, 2012. The adoption of this guidance did not impact our consolidated financial statements.
54
In July 2013, the FASB issued ASU 2013-11, Income Taxes (ASC 740)
Presentation of an Unrecognized Tax Benefit When a Net Operating Loss Carry forward, a Similar Tax Loss, or a Tax Credit Carry forward Exists
(Update). The update is intended to eliminate the diversity in practice of the presentation of an unrecognized tax benefit when a net operating loss carryforward, a similar tax loss, or a tax credit carryforward exists. The update is effective for annual and interim financial statements for fiscal years beginning after December 15, 2013. The amendments should be applied prospectively to all unrecognized tax benefits that exist at the effective date. Retrospective application is permitted.
|
3.
|
Collaborations, contracts and licensing agreements
|
The following tables set forth revenue recognized under collaborations, contracts and licensing agreements:
Revenue
| Year ended December 31 | ||||||||||||
|
2013
|
2012
|
2011
|
||||||||||
|
Collaborations and contracts
|
||||||||||||
|
DoD (a)
|
$ | 9,805,556 | $ | 11,536,101 | $ | 11,565,997 | ||||||
|
Alnylam (b)
|
- | 9,719 | 4,191,295 | |||||||||
|
BMS (c)
|
525,527 | 440,279 | 437,165 | |||||||||
|
Other RNAi collaborators (d)
|
93,486 | 119,087 | 117,133 | |||||||||
|
Total research and development collaborations and contracts
|
10,424,569 | 12,105,186 | 16,311,590 | |||||||||
|
Licensing fees and milestone payments
|
||||||||||||
|
Alnylam milestone payments (b)
|
5,000,000 | 1,000,000 | 500,000 | |||||||||
|
Spectrum payments (e)
|
39,581 | 1,000,000 | - | |||||||||
|
Total licensing fees and milestone payments
|
5,039,581 | 2,000,000 | 500,000 | |||||||||
|
Total revenue
|
$ | 15,464,150 | $ | 14,105,186 | $ | 16,811,590 | ||||||
The following table sets forth deferred collaborations and contracts revenue:
|
December 31, 2013
|
December 31, 2012
|
|||||||
|
DoD (a)
|
$ | 1,655,028 | $ | 1,388,970 | ||||
|
BMS current portion (c)
|
1,808,227 | 1,754,610 | ||||||
|
Deferred revenue, current portion
|
3,463,255 | 3,143,580 | ||||||
|
BMS long-term portion (c)
|
- | 722,445 | ||||||
|
Total deferred revenue
|
$ | 3,463,255 | $ | 3,866,025 | ||||
(a) Contract with United States Government’s Department of Defense (“DoD”) to develop TKM-Ebola
On July 14, 2010, the Company signed a contract with the DoD to advance TKM-Ebola, an RNAi therapeutic utilizing the Company’s lipid nanoparticle technology to treat Ebola virus infection.
In the initial phase of the contract, funded as part of the Transformational Medical Technologies program, the Company is eligible to receive up to $34.7 million. This initial funding is for the development of TKM-Ebola including completion of preclinical development, filing an Investigational New Drug application with the United States Food and Drug Administration (“FDA”) and completing a Phase 1 human safety clinical trial. On May 8, 2013, the Company announced that the contract had been modified to support development plans that integrate recent advancements in lipid nanoparticle (“LNP”) formulation and manufacturing technologies. The contract modification increased the stage one targeted funding to $41.7 million.
The DoD has the option of extending the contract beyond the initial funding period to support the advancement of TKM-Ebola through to the completion of clinical development and FDA approval. Based on the contract’s budget this would provide the Company with up to $140.0 million in funding for the entire program.
Under the contract, the Company is reimbursed for costs incurred, including an allocation of overhead costs, and is paid an incentive fee. At the beginning of the fiscal year the Company estimates its labour and overhead rates for the year ahead. At the end of the year the actual labour and overhead rates are calculated and revenue is adjusted accordingly. The Company’s actual labour and overhead rates will differ from its estimated rates based on actual costs incurred and the proportion of the Company’s efforts on contracts and internal products versus indirect activities. Within minimum and maximum collars, the amount of incentive fee the Company can earn under the contract varies based on costs incurred versus budgeted costs. During the contractual period, incentive fee revenue and total costs are impacted by management’s estimate and judgments which are continuously reviewed and adjusted as necessary using the cumulative catch-up method. At December 31, 2012, the Company was not able to make a reliable estimate of the final contract costs, and only the minimum incentive fee achievable and earned was recognized. At December 31, 2013, the Company believes it can reliably estimate the final contract costs so has recognized the portion of expected incentive fee which has been earned to date.
55
On August 6, 2012, the Company announced that it had received a temporary stop-work order from the DoD in respect of this contract. On October 2, 2012, the Company announced that the stop-work order had been lifted and work on the contract resumed. On November 1, 2012, the Company submitted a contract modification request to the DoD in order to integrate recent advancements in the Company’s formulation technology. The modification request is currently being negotiated while work is continuing on the contract.
(b)
License and collaboration with Alnylam Pharmaceuticals, Inc. (“Alnylam”)
License and Collaboration Agreement with Alnylam through Tekmira
On January 8, 2007, the Company entered into a licensing and collaboration agreement with Alnylam (“Alnylam License and Collaboration”), which was amended and restated in May 2008, giving them an exclusive license to certain of the Company’s historical lipid nanoparticle intellectual property for the discovery, development, and commercialization of ribonucleic acid interference (“RNAi”) therapeutics.
The Alnylam License and Collaboration was replaced by a new license agreement as part of the settlement, which is discussed below.
Cross-License with Alnylam acquired through Protiva
As a result of the acquisition of Protiva on May 30, 2008, the Company acquired a Cross-License Agreement between Protiva and Alnylam (the “Alnylam Cross-License”). Alnylam was granted a non-exclusive license to the Protiva intellectual property.
The Alnylam Cross-License was replaced by a new license agreement as part of the settlement, which is discussed below.
Manufacturing agreement with Alnylam
Under a manufacturing agreement with Alnylam (the “Alnylam Manufacturing Agreement”) effective January 1, 2009, the Company was the exclusive manufacturer of any products required by Alnylam through to the end of Phase 2 clinical trials that utilize the Company’s technology. Alnylam was paying the Company for the provision of staff and for external costs incurred. Time charged to Alnylam was at a fixed rate and under the Alnylam Manufacturing Agreement there was a contractual minimum for the provision of staff of $11,200,000 over the three year period ending December 31, 2011.
The Alnylam Manufacturing Agreement was terminated as part of the settlement which is discussed below.
Settlement of litigation with Alnylam and Acuitas Therapeutics Inc. (“Acuitas”, formerly AlCana Technologies Inc.)
On March 16, 2011 the Company filed a complaint against Alnylam. On November 12, 2012, the Company entered into an agreement to settle all litigation between the Company and Alnylam and Acuitas (the “Settlement”) and also entered into a new licensing agreement with Alnylam that replaces all earlier licensing, cross-licensing, collaboration, and manufacturing agreements. The Company entered into a separate cross license agreement with Acuitas which includes milestone and royalty payments and Acuitas has agreed not to compete in the RNAi field for five years. In conjunction with the Settlement, the Company paid Acuitas $300,000. The Company paid a further $1,500,000 upon the execution of the cross license agreement with Acuitas, in the year ended December 31, 2013.
As a result of the new Alnylam license agreement, on November 26, 2012, the Company received $65,000,000 in cash from Alnylam. This includes $30,000,000 associated with the termination of the manufacturing agreement and $35,000,000 associated with the termination of the previous license agreements, as well as a modification of the milestone and royalty schedules associated with Alnylam's ALN-VSP, ALN-PCS, and ALN-TTR programs. Under the settlement, Alnylam received license rights to the Company’s patents that were filed, or that claim priority to a patent that was filed, before April 15, 2010. Alnylam does not have rights to the Company’s patents filed after April 15, 2010 unless they claim priority to a patent filed before that date. In addition, Alnylam has transferred all agreed upon patents and patent applications related to lipid nanoparticle (“LNP”) technology for the systemic delivery of RNAi therapeutic products, including the MC3 lipid family, to the Company, who will own and control prosecution of this intellectual property portfolio. The Company is the only entity able to sublicense its LNP intellectual property in future platform-type relationships. Alnylam has a license to use the Company’s intellectual property to develop and commercialize products and may only grant access to the Company’s LNP technology to its partners if it is part of a product sublicense. Alnylam will pay the Company milestones and royalties as Alnylam’s LNP-enabled products are developed and commercialized.
56
The new licensing agreement with Alnylam also grants the Company intellectual property rights to develop its own proprietary RNAi therapeutics. Alnylam has granted the Company a worldwide license for the discovery, development and commercialization of RNAi products directed to thirteen gene targets – three exclusive and ten non-exclusive licenses – provided that they have not been committed by Alnylam to a third party or are not otherwise unavailable as a result of the exercise of a right of first refusal held by a third party or are part of an ongoing or planned development program of Alnylam. Licenses for five of the ten non-exclusive targets – ApoB, PLK1, Ebola, WEE1, and CSN5 – have already been granted, along with an additional license for ALDH2, which has been granted on an exclusive basis. In consideration for this license, the Company has agreed to pay single-digit royalties to Alnylam on product sales and have milestone obligations of up to $8,500,000 on the non-exclusive licenses (with the exception of TKM-Ebola, which has no milestone obligations). Alnylam no longer has “opt-in” rights to the Company’s lead oncology product, TKM-PLK1, so the Company now holds all development and commercialization rights related TKM-PLK1. The Company will have no milestone obligations on the three exclusive licenses. As a result of the settlement of the litigation between the Company and Alnylam, $18,737,966 in a contingent obligation payment to Orrick, Herrington and Sutcliffe LLP (“Orrick”), lead legal counsel for the lawsuit against Alnylam and Acuitas, was paid out on December 10, 2012.
Milestone receipts and payments
In June 2012 the Company earned a $1,000,000 milestone from Alnylam in respect of the initiation of Alnylam’s ALN-TTR02 Phase 2 human clinical trial.
In November 2013, Alnylam initiated a Phase III trial with ALN-TTR02, also known as patisiran, and the associated $5,000,000 development milestone was paid to the Company in December 2013.
In November 2013, the Company initiated Phase I/II clinical trial for TKM-PLK1, resulting in a milestone payment of $375,000 to Alnylam.
Arbitration with Alnylam and Ascletis Pharmaceuticals (Hangzhou) Co. Ltd. (“Ascletis”)
On June 21, 2013, the Company transferred manufacturing process technology to Ascletis to enable them to produce ALN-VSP, a product candidate licensed to them by Alnylam. The Company believes that under the new licensing agreement with Alnylam, the technology transfer to Ascletis triggers a $5,000,000 milestone obligation from Alnylam to the Company. However, Alnylam has demanded a declaration that the Company has not yet met its milestone obligations. The Company disputes Alnylam’s position. To remedy this dispute, the Company and Alnylam have commenced arbitration proceedings as provided for under the agreement. The Company has not recorded any revenue in respect of this milestone.
(c) Bristol-Myers Squibb (“BMS”) collaboration
On May 10, 2010 the Company announced the expansion of its research collaboration with BMS. Under the new agreement, BMS uses small interfering RNA (“siRNA”) molecules formulated by the Company in LNP technology to silence target genes of interest. BMS is conducting the preclinical work to validate the function of certain genes and share the data with the Company. The Company can use the preclinical data to develop RNAi therapeutic drugs against the therapeutic targets of interest. The Company received $3,000,000 from BMS concurrent with the signing of the agreement and recorded the amount as deferred revenue. The Company is required to provide a pre-determined number of LNP batches over the four-year agreement. BMS has a first right to negotiate a licensing agreement on certain RNAi products developed by the Company that evolve from BMS validated gene targets.
Revenue from the May 10, 2010 agreement with BMS is being recognized as the Company produces the related LNP batches.
As at December 31, 2013, the Company and BMS intend to extend the agreement’s end date from May 10, 2014 to December 31, 2014. Extending the agreement will give BMS more time to order LNP batches. There will not be any monetary consideration for extending the agreement. Revenue recognized in 2013 has been reduced and the balance of deferred revenue as at December 31, 2013 has been increased to account for BMS, potentially, ordering more batches under the agreement.
(d) Other RNAi collaborators
The Company has active research agreements with a number of other RNAi collaborators.
(e) Agreements with Spectrum Pharmaceuticals, Inc. (“Spectrum”)
On May 6, 2006, the Company signed a number of agreements with Talon Therapeutics, Inc. (“Talon”, formerly Hana Biosciences, Inc.) including the grant of worldwide licenses (the “Talon License Agreement”) for three of the Company’s chemotherapy products, Marqibo®, Alocrest
TM
(Optisomal Vinorelbine) and Brakiva
TM
(Optisomal Topotecan).
On August 9, 2012, the Company announced that Talon had received accelerated approval for Marqibo from the FDA for the treatment of adult patients with Philadelphia chromosome negative acute lymphoblastic leukemia in second or greater relapse or whose disease has progressed following two or more anti-leukemia therapies. Marqibo is a liposomal formulation of the chemotherapy drug vincristine. In the year ended December 31, 2012, the Company received a milestone of $1,000,000 based on the FDA’s approval of Marqibo and will receive royalty payments based on Marqibo’s commercial sales. There are no further milestones related to Marqibo but the Company is eligible to receive total milestone payments of up to $18,000,000 on Alocrest and Brakiva.
57
Talon was acquired by Spectrum in July 2013. The acquisition does not affect the terms of the license between Talon and the Company.
On September 3, 2013, Spectrum announced that they had shipped the first commercial orders of Marqibo. In the year ended December 31, 2013, the Company recorded $39,581 in Marqibo royalty revenue (2012 - $nil, 2011 - $nil). In the year ended December 31, 2013, the Company accrued $990 in royalties due to TPC in respect of the Marqibo royalty earned by the Company (see note 8).
(f) License agreement with Merck & Co., Inc. (“Merck”)
As a result of the acquisition of Protiva in 2008, the Company received a non-exclusive royalty-bearing world-wide license, of certain intellectual property acquired by Merck. Under the license, Merck will pay up to $17,000,000 in milestones for each product it develops using the acquired intellectual property, except for the first product for which Merck will pay up to $15,000,000 in milestones. Merck will also pay royalties on product sales. Merck’s license rights are limited to patents that the Company filed, or that claim priority to a patent that was filed, before October 9, 2008. Merck does not have rights to patents filed by the Company after October 9, 2008 unless they claim priority to a patent filed before that date.
The license agreement with Merck was entered into as part of a settlement of litigation between Protiva and a Merck subsidiary. No payments have been made under this license to date.
Merck has granted a license to the Company to certain of its intellectual property.
On January 12, 2014, Alnylam announced that they will be acquiring this license from Merck in which case this license agreement will transfer to Alnylam.
|
4.
|
Property and equipment
|
|
December 31, 2013
|
Cost
|
Accumulated
depreciation
|
Net
book value
|
|||||||||
|
Lab equipment
|
$ | 4,885,963 | $ | (4,678,976 | ) | $ | 206,987 | |||||
|
Leashold improvements
|
5,592,312 | (5,001,683 | ) | $ | 590,629 | |||||||
|
Computer hardware and software
|
1,991,927 | (1,589,519 | ) | $ | 402,408 | |||||||
|
Furniture and fixtures
|
395,948 | (395,416 | ) | $ | 532 | |||||||
|
Assets under construction
|
172,601 | - | $ | 172,601 | ||||||||
| $ | 13,038,751 | $ | (11,665,594 | ) | $ | 1,373,157 | ||||||
|
December 31, 2012
|
Cost
|
Accumulated
depreciation
|
Net
book value
|
|||||||||
|
Lab equipment
|
$ | 5,136,975 | $ | (4,787,905 | ) | $ | 349,070 | |||||
|
Leasehold improvements
|
5,978,338 | (5,041,900 | ) | 936,438 | ||||||||
|
Computer hardware and software
|
1,649,593 | (1,585,288 | ) | 64,305 | ||||||||
|
Furniture and fixtures
|
423,281 | (421,363 | ) | 1,918 | ||||||||
| $ | 13,188,187 | $ | (11,836,456 | ) | $ | 1,351,731 | ||||||
As at December 31, 2013, all of the Company’s property and equipment are currently in use and no impairment has been recorded.
|
5.
|
Share capital
|
(a) Financing
On June 16, 2011, the Company completed a public offering of 1,789,900 units at a price of $2.88 (C$2.85) each for total gross proceeds, before expenses, of $5,160,934. Each unit consists of one common share and one half of one common share purchase warrant. Each whole warrant entitles the holder to acquire one common share at a price of C$3.35. The warrants expire on June 15, 2016. After paying underwriter’s commission and other unit issue costs, the offering generated net cash of $4,598,862. The total unit issuance cost of $562,072 has been allocated, on a pro-rata basis, as $481,135 to the shares and $80,937to the warrants and recorded, respectively, to share capital and warrant issuance costs in the consolidated statement of operations and comprehensive income (loss).
58
On the date of issuance, the Black-Scholes aggregate value of the 894,950 warrants was $751,505 based on an assumed risk-free interest rate of 2.19%, volatility of 40%, a zero dividend yield and an expected life of 5 years. The fair value of the warrants at issuance was initially recorded as a liability with the residual amount of proceeds allocated to share capital.
On February 29, 2012, the Company completed a private placement offering of 1,848,601 units at a price of $2.20 (C$2.20) each for total gross proceeds, before expenses, of $4,069,547. Each unit consists of one common share and one half of one common share purchase warrant. Each whole warrant entitles the holder to acquire one common share at a price of C$2.60. The warrants expire on February 28, 2017. After paying brokerage fees and other unit issue costs, the offering generated net cash of $3,843,995. The total unit issuance cost of $225,551 has been allocated, on a pro-rata basis, as $178,521 to the shares and $47,030 to the warrants and recorded, respectively, to share capital and warrant issuance costs in the consolidated statement of operations and comprehensive income (loss).
On the date of issuance, the Black-Scholes aggregate value of the 924,302 warrants was $850,907 based on an assumed risk-free interest rate of 1.44%, volatility of 40%, a zero dividend yield and an expected life of 5 years. The fair value of the warrants at issuance was initially recorded as a liability with the residual amount of proceeds from the private placement being allocated to share capital.
On October 22, 2013, the Company announced that it had completed an underwritten public offering of 3,750,000 common shares, at a price of $8.00 per share, representing gross proceeds of $30,000,000. On November 1, 2013, the offering’s underwriter completed the exercise of its over-allotment option to purchase a further 562,500 shares at $8.00 bringing the aggregate financing gross proceeds to $34,500,000. The cost of the financing, including commissions and professional fees, was $2,461,683, resulting in net proceeds of $32,038,317.
(b) Authorized share capital
The Company’s authorized share capital consists of an unlimited number of common and preferred shares without par value.
(c) Warrants to purchase common shares
During the year ended December 31, 2013, there were 105,683 warrants exercised for $288,823 in cash (December 31, 2012 – 230,841 warrants for $632,282) and 468,000 warrants exercised using the cashless exercise provision in return for 199,765 common shares (December 31, 2012 – 54,545 warrants for 38,644 common shares).
A following table summarizes the Company’s warrant activity for the years ended December 31, 2012 and 2013:
|
Common shares
purchasable upon
exercise of
warrants
|
Weighted average
exercise price (C$)
|
Weighted
average exercise
price (US$)
|
Range of
exercise prices
(C$)
|
Range of
exercise prices
(US$)
|
Weighted
average
remaining
contractual life
(years)
|
Aggregate
intrinsic value
(C$)
|
Aggregate
intrinsic value
(US$)
|
|||||||||||||||||||||||||||
|
Balance, December 31, 2011
|
949,495 | $ | 3.25 | $ | 3.20 | $1.65 | - | $3.35 | $1.62 | - | $3.29 | 4.6 | $ | - | $ | - | ||||||||||||||||||
|
Issued
|
924,302 | $ | 2.60 | $ | 2.61 | $2.60 | $2.61 | |||||||||||||||||||||||||||
|
Exercised
|
(285,386 | ) | $ | 2.53 | $ | 2.54 | $1.65 | - | $3.35 | $1.66 | - | $3.37 | ||||||||||||||||||||||
|
Balance, December 31, 2012
|
1,588,411 | $ | 3.00 | $ | 3.02 | $2.50 | - | $3.35 | $2.51 | - | $3.37 | 3.8 | 3,140,893 | 3,156,912 | ||||||||||||||||||||
|
Issued
|
- | - | - | - | - | |||||||||||||||||||||||||||||
|
Exercised
|
(573,683 | ) | $ | 3.19 | $ | 3.00 | $2.60 | - | $3.35 | $2.44 | - | $3.15 | - | |||||||||||||||||||||
|
Balance, December 31, 2013
|
1,014,728 | $ | 2.90 | $ | 2.72 | $2.60 | - | $3.35 | $2.44 | - | $3.15 | 2.7 | $ | 5,635,446 | $ | 5,298,447 | ||||||||||||||||||
The aggregate intrinsic value in the table above is calculated based on the difference between the exercise price of the warrants and the quoted price of the Company’s common stock as of the reporting date.
All of the Company’s warrants were exercisable as of December 31, 2013.
The weighted average Black-Scholes option-pricing assumptions and the resultant fair values are as follows for warrants outstanding at December 31, 2013 and 2012 are as follows:
59
|
Year ended December 31
|
||||||||
|
2013
|
2012
|
|||||||
|
Dividend yield
|
0.00 | % | 0.00 | % | ||||
|
Expected volatility
|
47.03 | % | 40.00 | % | ||||
|
Risk-free interest rate
|
1.13 | % | 1.28 | % | ||||
|
Expected average term (years)
|
1.6
|
3.8
|
||||||
|
Fair value of warrants outstanding
|
$ | 5.30 | $ | 2.51 | ||||
|
Aggregate fair value of warrants outstanding
|
$ | 5,378,722 | $ | 4,014,821 | ||||
The value of the Company’s warrants is particularly sensitive to changes in the Company’s share price and the estimated rate of share price volatility. Based on changes in the Company’s business and general stock market conditions since the warrants were issued in 2011 and 2012, in 2013, the Company undertook a review of its warrant fair value assumptions. The previous assumption for warrant expected life was the warrant’s remaining contractual term. Based on the pattern of exercises of the warrants the Company has now reduced the expected life to a weighted average of 1.6 years as of December 31, 2013. The previous assumption for expected volatility in respect of the warrants was 40%. The Company is now calculating volatility based on historic share price fluctuations, which, at December 31, 2013, gave a weighted average expected volatility of 47.03%. The reduction in expected life has the effect of reducing the fair value of the warrants, whereas, the increase in expected volatility increases the fair value of the warrants.
(e) Stock-based compensation
The Company has three share-based compensation plans; the “2007 Plan”, the “2011 Plan” and the “Protiva Option Plan”.
On June 22, 2011, the shareholders of the Company approved an omnibus stock-based compensation plan (the “2011 Plan”) and a 273,889 increase in the number of stock-based compensation awards that the Company is permitted to issue. The Company’s pre-existing 2007 Plan was limited to the granting of stock options as equity incentive awards whereas the 2011 Plan also allows for the issuance of tandem stock appreciation rights, restricted stock units and deferred stock units (collectively, and including options, referred to as “Awards”). The 2011 Plan replaces the 2007 Plan. The 2007 Plan will continue to govern the options granted thereunder. No further options will be granted under the Company’s 2007 Plan.
Under the Company’s 2007 Plan the Board of Directors granted options to employees, directors and consultants of the Company. The exercise price of the options was determined by the Company’s Board of Directors but was always at least equal to the closing market price of the common shares on the day preceding the date of grant and the term of options granted did not exceed 10 years. The options granted generally vested over three years for employees and immediately for directors.
Under the Company’s 2011 Plan the Board of Directors may grant options, and other types of Awards, to employees, directors and consultants of the Company. The exercise price of the options is determined by the Company’s Board of Directors but will be at least equal to the closing market price of the common shares on the day preceding the date of grant and the term may not exceed 10 years. Options granted generally vest over three years for employees and immediately for directors.
Hereafter, information on options governed by the 2007 Plan and 2011 Plan is presented on a consolidated basis as the terms of the two plans are similar. Information on the Protiva Option Plan is presented separately.
On June 20, 2012, the shareholders of the Company approved a 550,726 increase in the number of stock-based compensation awards that the Company is permitted to issue.
60
Stock option activity for the Company’s 2007 Plan and 2011 Plan
|
Number of
optioned
common shares
|
Weighted
average exercise
price (C$)
|
Weighted
average exercise
price (US$)
|
Aggregate
intrinsic
value (C$)
|
Aggregate
intrinsic
value (US$)
|
||||||||||||||||
|
Balance, December 31, 2010
|
1,083,432 | $ | 7.95 | $ | 7.72 | $ | 756,628 | $ | 734,881 | |||||||||||
|
Options granted
|
403,100 | $ | 2.14 | $ | 2.17 | |||||||||||||||
|
Options exercised
|
(1,667 | ) | $ | 1.50 | $ | 1.52 | $ | 1,330 | $ | 1,346 | ||||||||||
|
Options forfeited, cancelled or expired
|
(71,547 | ) | $ | 27.42 | $ | 27.74 | ||||||||||||||
|
Balance, December 31, 2011
|
1,413,318 | $ | 5.32 | $ | 5.38 | $ | 1,800 | $ | 1,821 | |||||||||||
|
Options granted
|
326,300 | $ | 4.16 | $ | 4.16 | |||||||||||||||
|
Options exercised
|
(28,417 | ) | $ | 2.34 | $ | 2.34 | $ | 81,545 | $ | 81,598 | ||||||||||
|
Options forfeited, cancelled or expired
|
(62,355 | ) | $ | 21.27 | $ | 21.29 | ||||||||||||||
|
Balance, December 31, 2012
|
1,648,846 | $ | 4.54 | $ | 4.54 | $ | 2,299,512 | $ | 2,300,996 | |||||||||||
|
Options granted
|
270,250 | $ | 7.52 | $ | 7.30 | |||||||||||||||
|
Options exercised
|
(124,246 | ) | $ | 3.22 | $ | 3.13 | $ | 551,385 | $ | 535,369 | ||||||||||
|
Options forfeited, cancelled or expired
|
(64,085 | ) | $ | 21.87 | $ | 21.23 | ||||||||||||||
|
Balance, December 31, 2013
|
1,730,765 | $ | 4.45 | $ | 4.32 | $ | 7,029,795 | $ | 6,825,608 | |||||||||||
Options under the 2007 Plan and 2011 Plan expire at various dates from December 14, 2014 to December 5, 2023.
The following table summarizes information pertaining to stock options outstanding at December 31, 2013 under the Company’s 2007 Plan and 2011 Plan:
|
Options outstanding December 31, 2013
|
Options exercisable December 31, 2013
|
||||||||||||||||||||||||||||||
|
Range of
Exercise prices
|
Number
of options
outstanding
|
Weighted
average
remaining
contractual
life (years)
|
Weighted
average
exercise
price (C$)
|
Weighted
average
exercise
price (US$)
|
Number
of options
exercisable
|
Weighted
average
exercise
price (C$)
|
Weighted
average
exercise
price (US$)
|
||||||||||||||||||||||||
| $1.50 | to | $1.90 | 261,475 | 6.7 | $ | 1.71 | $ | 1.66 | 236,475 | $ | 1.71 | $ | 1.66 | ||||||||||||||||||
| $2.10 | to | $2.60 | 279,000 | 7.7 | $ | 2.32 | $ | 2.25 | 236,175 | $ | 2.35 | $ | 2.28 | ||||||||||||||||||
| $3.00 | to | $3.10 | 108,979 | 2.2 | $ | 3.04 | $ | 2.95 | 108,979 | $ | 3.04 | $ | 2.95 | ||||||||||||||||||
| $3.73 | to | $3.85 | 153,250 | 6.1 | $ | 3.84 | $ | 3.73 | 150,650 | $ | 3.85 | $ | 3.74 | ||||||||||||||||||
| $4.38 | to | $4.54 | 21,250 | 9.2 | $ | 4.53 | $ | 4.40 | 5,313 | $ | 4.53 | $ | 4.40 | ||||||||||||||||||
| $4.65 | to | $5.60 | 576,846 | 6.2 | $ | 5.25 | $ | 5.10 | 474,909 | $ | 5.27 | $ | 5.12 | ||||||||||||||||||
| $5.69 | to | $11.60 | 329,965 | 7.6 | $ | 7.79 | $ | 7.56 | 164,590 | $ | 7.45 | $ | 7.23 | ||||||||||||||||||
| $1.50 | to | $11.60 | 1,730,765 | 6.6 | $ | 4.45 | $ | 4.32 | 1,377,091 | $ | 4.08 | $ | 3.96 | ||||||||||||||||||
At December 31, 2013, there were 1,377,091 options exercisable (December 31, 2012 – 1,315,155; December 31, 2011 - 1,015,224) with a weighted average exercise price of $3.96 (C$4.08). The weighted average remaining contractual life of exercisable options as at December 31, 2013 was 5.9 years. The aggregate intrinsic value of options exercisable at December 31, 2013 was $5,869,668.
61
A summary of the Company’s non-vested stock option activity and related information for the year ended December 31, 2013 is as follows:
|
Number of
optioned
common shares
|
Weighted
average
fair value (C$)
|
Weighted
average
fair value (US$)
|
||||||||||
|
Non-vested at December 31, 2012
|
333,691 | $ | 3.38 | $ | 3.38 | |||||||
|
Options granted
|
270,250 | $ | 7.52 | 7.30 | ||||||||
|
Options vested
|
(219,966 | ) | $ | 4.47 | 4.34 | |||||||
|
Non-vested options forfeited
|
(30,300 | ) | $ | 3.74 | 3.63 | |||||||
|
Non-vested at December 31, 2013
|
353,675 | $ | 5.44 | $ | 5.28 | |||||||
The weighted average remaining contractual life for options expected to vest at December 31, 2013 was 9.2 years and the weighted average exercise price for these options was $5.73 (C$5.90) per share.
The aggregate intrinsic value of options expected to vest as at December 31, 2013 was $942,918 (December 31, 2012 - $450,620; December 31, 2011 - $nil).
The total fair value of options that vested during the year ended December 31, 2013 was $954,534 (2012 - $1,071,240; 2011 - $355,657).
Valuation assumptions for the Company’s 2007 Plan and 2011 Plan
The fair value of stock options at date of grant, based on the following assumptions, was estimated using the Black-Scholes option-pricing model. Assumptions on the dividend yield are based on the fact that the Company has never paid cash dividends and has no present intention to pay cash dividends. Assumptions about the Company’s expected stock-price volatility are based on the historical volatility of the Company’s publicly traded stock. The risk-free interest rate used for each grant is equal to the zero coupon rate for instruments with a similar expected life. Expected life assumptions are based on the Company’s historical data. The Company currently expects, based on an analysis of its historical forfeitures, that approximately 98% of its options issued will ultimately vest, and has applied a forfeiture rate of 2.0% to all unvested options held as of December 31, 2013. The Company will record additional expense if the actual forfeitures are lower than estimated and will record a recovery of prior expense if the actual forfeitures are higher than estimated. The weighted average option pricing assumptions and the resultant fair values are as follows:
|
Year ended December 31
|
||||||||||||
|
2013
|
2012
|
2011
|
||||||||||
|
Dividend yield
|
0.00 | % | 0.00 | % | 0.00 | % | ||||||
|
Expected volatility
|
111.61 | % | 120.40 | % | 116.26 | % | ||||||
|
Risk-free interest rate
|
2.39 | % | 1.56 | % | 2.51 | % | ||||||
|
Expected average option term (years)
|
9.6 | 8.2 | 9.6 | |||||||||
|
Fair value of options granted (C$)
|
$ | 6.96 | $ | 3.83 | $ | 2.00 | ||||||
Stock-based compensation expense for the Company’s 2007 Plan and 2011 Plan
An expense for stock-based compensation for options awarded to employees and calculated in accordance with the fair value method has been recorded in the consolidated statement of operations and comprehensive income (loss) as follows:
|
Year ended December 31
|
||||||||||||
|
2013
|
2012
|
2011
|
||||||||||
|
Research, development, collaborations
and contracts expenses
|
$ | 621,807 | $ | 772,367 | $ | 500,425 | ||||||
|
General and administrative expenses
|
281,198 | 209,923 | 133,024 | |||||||||
|
Total
|
$ | 903,005 | $ | 982,290 | $ | 633,449 | ||||||
At December 31, 2013, there remains $1,619,451 of unearned compensation expense related to unvested employee stock options to be recognized as expense over a weighted-average period of approximately 15 months.
62
Protiva Option Plan
On May 30, 2008, as a condition of the acquisition of Protiva Biotherapeutics Inc., a total of 350,457 common shares of the Company were reserved for the exercise of 519,073 Protiva share options (“Protiva Options”). The Protiva Options have an exercise price of C$0.30, were fully vested and exercisable as of May 30, 2008, expire at various dates from February 4, 2014 to March 1, 2018 and upon exercise each option will be converted into approximately 0.6752 shares of the Company (the same ratio at which Protiva common shares were exchanged for Company common shares at completion of the acquisition of Protiva). The Protiva Options are not part of the Company’s 2007 Plan or 2011 Plan and the Company is not permitted to grant any further Protiva Options.
The following table sets forth outstanding options under the Protiva Option Plan:
|
Number of Protiva
Options
|
Equivalent number
of Company
common shares
|
Weighted
average exercise
price (C$)
|
Weighted
average
exercise price
(US$)
|
|||||||||||||
|
Balance, December 31, 2010
|
518,223 | 349,883 | 0.30 | 0.30 | ||||||||||||
|
Options exercised
|
(27,202 | ) | (18,366 | ) | 0.30 | 0.30 | ||||||||||
|
Options forfeited, cancelled or expired
|
- | - | - | - | ||||||||||||
|
Balance, December 31, 2011
|
491,020 | 331,517 | 0.30 | 0.30 | ||||||||||||
|
Options exercised
|
(15,135 | ) | (10,218 | ) | 0.30 | 0.30 | ||||||||||
|
Options forfeited, cancelled or expired
|
- | - | - | - | ||||||||||||
|
Balance, December 31, 2012
|
475,885 | 321,299 | $ | 0.30 | $ | 0.30 | ||||||||||
|
Options exercised
|
(2,000 | ) | (1,350 | ) | 0.30 | 0.29 | ||||||||||
|
Options forfeited, cancelled or expired
|
(1,000 | ) | (675 | ) | 0.30 | 0.29 | ||||||||||
|
Balance, December 31, 2013
|
472,885 | 319,274 | 0.30 | 0.29 | ||||||||||||
The weighted average remaining contractual life of exercisable Protiva Options as at December 31, 2013 was 2.1 years.
The aggregate intrinsic value of Protiva Options outstanding at December 31, 2013 was $3,866,368. The intrinsic value of Protiva Options exercised in the year ended December 31, 2013 was $8,265 (2012 - $18,941; 2011 - $43,114).
Awards outstanding and available for issuance
Combining all of the Company’s share-based compensation plans, at December 31, 2013, the Company has 2,050,039 options outstanding and a further 216,523 Awards available for issuance.
|
6.
|
Government grants and refundable investment tax credits
|
Government grants and refundable investment tax credits have been recorded as a reduction in research and development expenses.
Government grants for the year ended December 31, 2013 include $68,633 in funding from the U.S. National Institutes of Health (2012 - $274,254; 2011 - $344,744).
The Company’s estimated claim for refundable Scientific Research and Experimental Development investment tax credits for the year ended December 31, 2013 is $42,804 (2012 - $nil; 2011 - $21,150).
|
7.
|
Income taxes
|
Income tax (recovery) expense varies from the amounts that would be computed by applying the combined Canadian federal and provincial income tax rate of 17.7% (year ended December 31, 2012 – 17.5%; December 31, 2011 – 26.5%) to the loss before income taxes as shown in the following tables:
63
|
Year ended December 31
|
||||||||||||
|
2013
|
2012
|
2011
|
||||||||||
|
Computed taxes (recoveries) at Canadian
federal and provincial tax rates
|
$ | (2,380,267 | ) | $ | 7,486,268 | $ | (2,589,310 | ) | ||||
|
Differences due to change in enacted tax rates
|
(5,723 | ) | 780,963 | 700,342 | ||||||||
|
Difference due to change in tax rate on opening deferred taxes
|
- | 2,636,377 | 3,369,825 | |||||||||
|
Permanent and other differences
|
1,820,842 | 2,202,291 | 141,587 | |||||||||
|
Change in valuation allowance
|
565,147 | (2,515,765 | ) | (1,622,445 | ) | |||||||
|
Utilization of investment tax credits
|
- | (10,590,133 | ) | - | ||||||||
|
Income tax (recovery) expense
|
$ | - | $ | - | $ | - | ||||||
As at December 31, 2013, the Company has investment tax credits available to reduce Canadian federal income taxes of $6,859,352 (December 31, 2012 - $5,891,094) and provincial income taxes of $2,431,691 (December 31, 2012 - $1,914,623) and expiring between 2014 and 2033.
At December 31, 2013, the Company has scientific research and experimental development expenditures of $49,906,852 (December 31, 2012 - $48,357,146) available for indefinite carry-forward and $24,526,593 (December 31, 2012 - $21,457,451) of net operating losses due to expire between 2028 and 2033 and which can be used to offset future taxable income in Canada.
On November 23, 2011, the Company was registered as a corporation under the Business Activity Act in the province of British Columbia. Under this program, provincial corporation tax charged on foreign income earned from the Company’s patents will be eligible for a 75% tax refund up to a maximum of C$8,000,000. Significant components of the Company’s deferred tax assets are shown below:
|
Year ended December 31
|
||||||||
|
2013
|
2012
|
|||||||
|
Deferred tax assets:
|
||||||||
|
Non-capital loss carryforwards
|
$ | 4,354,066 | $ | 4,561,144 | ||||
|
Research and development deductions
|
8,858,564 | 8,583,554 | ||||||
|
Book amortization in excess of tax
|
2,170,922 | 1,934,818 | ||||||
|
Share issue costs
|
(136,329 | ) | (26,133 | ) | ||||
|
Revenue recognized for tax purposes in excess of
revenue recognized for accounting purposes
|
667,542 | - | ||||||
|
Tax value in excess of accounting value in lease inducements
|
(2,821 | ) | 8,041 | |||||
|
Accounting value in excess of tax value in intangible assets
|
- | 372,892 | ||||||
|
Provincial investment tax credits
|
392,063 | 304,545 | ||||||
|
Total deferred tax assets
|
16,304,008 | 15,738,861 | ||||||
|
Valuation allowance
|
(16,304,008 | ) | (15,738,861 | ) | ||||
|
Net deferred tax assets
|
$ | - | $ | - | ||||
|
8.
|
Contingencies and commitments
|
Property lease
Effective July 29, 2009 the Company signed an amendment to the operating lease for its laboratory and office premises. The amended lease expires in July 2014 but the Company has the option to extend the lease to 2017 and then to 2022 and then to 2027. The amended lease included a signing incentive payment. In accordance with the Company’s accounting policy the signing incentive payment is being amortized on a straight-line basis over the term of the amended lease.
The minimum commitment for rent and estimated operating costs for the year ended December 31, 2014 is $705,150.
The Company’s lease expense, for the year ended December 31, 2013 of $1,224,794 has been recorded in the consolidated statements of operations and comprehensive income (loss) (2012 - $937,365; 2011 - $944,457).
The Company has netted $nil of sub-lease income against lease expense in the year ended December 31, 2013 (2012 - $172,034; 2011 - $196,555).
64
Product development partnership with the Canadian Government
The Company entered into a Technology Partnerships Canada ("TPC") agreement with the Canadian Federal Government on November 12, 1999. Under this agreement, TPC agreed to fund 27% of the costs incurred by the Company, prior to March 31, 2004, in the development of certain oligonucleotide product candidates up to a maximum contribution from TPC of $7,179,170 (C$9,329,912). As at December 31, 2013, a cumulative contribution of $3,480,217 (C$3,701,571) has been received and the Company does not expect any further funding under this agreement. In return for the funding provided by TPC, the Company agreed to pay royalties on the share of future licensing and product revenue, if any, that is received by the Company on certain non-siRNA oligonucleotide product candidates covered by the funding under the agreement. These royalties are payable until a certain cumulative payment amount is achieved or until a pre-specified date. In addition, until a cumulative amount equal to the funding actually received under the agreement has been paid to TPC, the Company agreed to pay 2.5% royalties on any royalties the Company receives for Marqibo. For the year-ended December 31, 2013, the Company earned royalties on Marqibo sales in the amount of $39,581
(see note 3(e)), resulting in $990 recorded by the Company as royalty payable to TPC.
Contingently payable promissory notes
On March 25, 2008, Protiva declared dividends totaling $12,000,000. The dividends were paid by Protiva issuing promissory notes on May 23, 2008. Recourse against Protiva for payment of the promissory notes will be limited to Protiva’s receipt, if any, of up to $12,000,000 in license payments from Merck (see note 3(f)). Protiva will pay these funds if and when it receives them, to the former Protiva shareholders in satisfaction of the promissory notes. As contingent items the $12,000,000 receivable and the related promissory notes payable are not recorded in the Company’s consolidated balance sheet.
License and collaboration agreement with Halo-Bio RNAi Therapeutics, Inc. (“Halo-Bio”)
On August 24, 2011, the Company entered into a license and collaboration agreement with Halo-Bio. Under the agreement, Halo-Bio granted the Company an exclusive license to its multivalent ribonucleic acid (“MV-RNA”) technology. The agreement provides for the companies to work together to design and develop MV-RNA molecules to gene targets of interest to the Company and to combine MV-RNA molecules with the Company’s LNP technology to develop therapeutic products.
The Company paid Halo-Bio an initial license fee of $100,000 and recorded this amount as a research, development, collaborations and contracts expense in the year ended December 31, 2011.
The agreement was amended on August 8, 2012 to adjust the future license fees and other contingent payments. The Company recorded a further $450,000 in license fees to research, development, collaborations and contracts expense in the year ended December 31, 2012, in respect of the agreement.
The Company terminated the agreement with Halo-Bio on July 31, 2013. There are no further payments due or contingently payable to Halo-Bio.
License agreement with Marina Biotech, Inc. (“Marina”)
On November 29, 2012 the Company announced a worldwide, non-exclusive license to a novel RNAi payload technology called Unlocked Nucleobase Analog (“UNA”) from Marina for the development of RNAi therapeutics.
UNA technology can be used in the development of RNAi therapeutics, which treat disease by silencing specific disease causing genes. UNAs can be incorporated into RNAi drugs and have the potential to improve them by increasing their stability and reducing off-target effects.
Under the license agreement the Company paid Marina an upfront fee of $300,000. A further license payment of $200,000 was paid in 2013 and the Company will make milestone payments of up to $3,250,000 and royalties on each product developed by the Company that uses Marina’s UNA technology. The payments to Marina are expensed to research, development, collaborations and contracts expense.
Effective August 9, 2013, Marina’s UNA technology was acquired by Arcturus Therapeutics, Inc. (“Arcturus”) and the UNA license agreement between the Company and Marina was assigned to Arcturus. The terms of the license are otherwise unchanged.
The Company believes that it is probable they will use Arcturus’s UNA technology for one of its product candidates in the foreseeable future.
|
9.
|
Concentrations of business risk
|
Credit risk
Credit risk is defined by the Company as an unexpected loss in cash and earnings if a collaborative partner is unable to pay its obligations in due time. The Company’s main source of credit risk is related to its accounts receivable balance which principally represents temporary financing provided to collaborative partners in the normal course of operations.
The Company does not currently maintain a provision for bad debts as the majority of accounts receivable are from collaborative partners or government agencies and are considered low risk.
The carrying amount of financial assets represents the maximum credit exposure. The maximum exposure to credit risk at December 31, 2013 was the accounts receivable balance of $116,556 (December 31, 2012 - $1,074,891).
65
All accounts receivable balances were current as at December 31, 2013 and December 31, 2012.
Significant collaborators and customers risk
We depend on a small number of collaborators and customers for a significant portion of our revenues (see note 3).
Liquidity Risk
Liquidity risk results from the Company’s potential inability to meet its financial liabilities, for example payments to suppliers. The Company ensures sufficient liquidity through the management of net working capital and cash balances.
The Company’s liquidity risk is primarily attributable to its cash and cash equivalents. The Company limits exposure to liquidity risk on its liquid assets through maintaining its cash and cash equivalent deposits with high-credit quality financial institutions. Due to the nature of these investments, the funds are available on demand to provide optimal financial flexibility.
The Company believes that its current sources of liquidity are sufficient to cover its likely applicable short term cash obligations. The Company’s financial obligations include accounts payable and accrued liabilities which generally fall due within 45 days.
The net liquidity of the Company is considered to be the cash and cash equivalents less accounts payable and accrued liabilities
|
December 31, 2013
|
December 31, 2012
|
|||||||
|
Cash, cash equivalents and short term investments
|
$ | 68,716,531 | $ | 47,024,124 | ||||
|
Less: Accounts payable and accrued liabilities
|
(3,680,462 | ) | (3,795,546 | ) | ||||
| $ | 65,036,069 | $ | 43,228,578 | |||||
Foreign currency risk
For the year-ended December 31, 2013, the Company has converted its reporting currency to the US dollar, and the Company’s functional currency remains as the Canadian dollar (note 2). The results of the Company’s operations are subject to currency transaction and translation risk as the Company’s revenues and expenses are denominated in both Canadian and US dollars. The fluctuation of the US dollar in relation to the Canadian dollar will consequently have an impact upon the Company’s income or loss and may also affect the value of the Company’s assets, liabilities, and the amount of shareholders’ equity both as recorded in the Company’s financial statements, in the Canadian functional currency, and as reported, for presentation purposes, in the US dollar.
The Company manages its US dollar exchange rate risk by, whenever possible, using cash received from US dollar revenues and financing to pay US dollar expenses. Prior to the financing in October 2013 (note 5(a)), which was denominated in US dollars, the Company’s policy was to convert all but a working capital level of US dollars into Canadian dollars. Given the Company’s increasing level of US dollar expenses, the Company maintained the funds raised in October 2013 in US dollars in order to achieve a natural foreign exchange hedge.
In November 2012, the Company used a forward exchange contract to convert US$45,000,000 into Canadian dollars. The Company has not entered into any other agreements or purchased any instruments to hedge possible currency risks. The Company’s exposure to US dollar currency expressed in Canadian dollars was as follows:
|
(in C$)
|
December 31, 2013
|
December 31, 2012
|
||||||
|
Cash and cash equivalents
|
$ | 38,900,944 | $ | 149,058 | ||||
|
Accounts receivable
|
10,840 | 1,025,306 | ||||||
|
Accrued revenue
|
225,892 | 2,361,836 | ||||||
|
Accounts payable and accrued liabilities
|
(1,889,480 | ) | (2,969,454 | ) | ||||
| $ | 37,248,196 | $ | 566,746 | |||||
An analysis of the Company’s sensitivity to foreign currency exchange rate movements is not provided in these financial statements as the Company’s US dollar cash holdings and expected US dollar revenues are sufficient to cover US dollar expenses for the foreseeable future.
66
|
10.
|
Supplementary information
|
Accounts payable and accrued liabilities is comprised of the following:
|
December 31, 2013
|
December 31, 2012
|
|||||||
|
Trade accounts payable
|
$ | 1,217,242 | $ | 805,790 | ||||
|
Research and development accruals
|
1,404,905 | 310,492 | ||||||
|
License fee accruals
|
- | 1,649,957 | ||||||
|
Professional fee accruals
|
247,148 | 602,113 | ||||||
|
Deferred lease inducements
|
16,454 | 48,078 | ||||||
|
Other accrued liabilities
|
794,713 | 379,116 | ||||||
| $ | 3,680,462 | $ | 3,795,546 | |||||
|
11.
|
Subsequent events
|
Option and Services Agreements with Monsanto Company (“Monsanto”)
On January 13, 2014, the Company and Monsanto signed an Option Agreement and a Services Agreement (together, the “Agreements”). Under the Agreements, Monsanto may obtain a license to use the Company’s proprietary delivery technology and related intellectual property for use in agriculture. Over the option period, which is expected to be approximately four years, the Company will provide lipid formulations for Monsanto’s research and development activities, and Monsanto will make certain payments to the Company to maintain its option rights. The maximum potential value of the transaction is $86,200,000 following the successful completion of milestones. In January 2014, the Company received $14,500,000 of the $16,500,000 near term payments as outlined in the terms of the Agreements.
At any time during the option period, Monsanto may choose to exercise its option, in which case Monsanto would pay the Company an option exercise fee and would receive a worldwide, exclusive right to use the Company’s proprietary delivery technology in the field of agriculture. Monsanto may elect to terminate this option at their discretion. The Company retains all rights to therapeutics uses of all current intellectual property and intellectual property developed under the Agreements.
Base shelf prospectus
On February 28, 2014, the Company filed a short form base shelf prospectus with securities regulatory authorities in Canada, other than Quebec, and a corresponding shelf registration statement with the United States Securities and Exchange Commission on Form F-10.
The base shelf registration statement provides for the potential of offering, in Canada and the United States, up to $150,000,000 of Tekmira’s common shares, warrants to purchase common shares and/or units comprising any combination of the foregoing from time to time over the next 25 months.
67
|
12.
|
Interim financial data (unaudited)
|
|
2013
|
||||||||||||||||||||
| Q1 | Q2 | Q3 | Q4 |
Total
|
||||||||||||||||
|
Revenue
|
2,131,519 | 2,843,806 | 2,962,809 | 7,526,016 | 15,464,150 | |||||||||||||||
|
Loss from operations
|
(2,993,811 | ) | (3,070,968 | ) | (3,652,191 | ) | (2,436,248 | ) | (12,153,218 | ) | ||||||||||
|
Net loss
|
(2,546,244 | ) | (3,014,928 | ) | (5,905,923 | ) | (2,597,131 | ) | (14,064,226 | ) | ||||||||||
|
Basic and diluted net loss per share
|
$ | (0.18 | ) | $ | (0.21 | ) | $ | (0.41 | ) | $ | (0.15 | ) | $ | (0.92 | ) | |||||
|
2012
|
||||||||||||||||||||
| Q1 | Q2 | Q3 | Q4 |
Total
|
||||||||||||||||
|
Revenue
|
3,586,970 | 3,643,296 | 3,067,593 | 3,807,327 | 14,105,186 | |||||||||||||||
|
Loss from operations
|
(2,651,931 | ) | (2,599,027 | ) | (1,784,666 | ) | (5,908,924 | ) | (12,944,548 | ) | ||||||||||
|
Net (loss) income
|
(3,180,259 | ) | (1,935,761 | ) | (3,457,600 | ) | 38,185,616 | 29,611,996 | ||||||||||||
|
Basic net (loss) income per share
|
$ | (0.25 | ) | $ | (0.14 | ) | $ | (0.25 | ) | $ | 2.72 | $ | 2.16 | |||||||
|
Diluted net (loss) income per share
|
$ | (0.25 | ) | $ | (0.14 | ) | $ | (0.25 | ) | $ | 2.51 | $ | 2.07 | |||||||
68
|
Changes in and Disagreements with Accountants on Accounting and Financial Disclosure
|
None.
|
Controls and Procedures
|
Disclosure Controls and Procedures
As of the end of our fiscal year ended December 31, 2013, an evaluation of the effectiveness of our “disclosure controls and procedures” (as such term is defined in Rules 13a-15(e) and 15d-15(e) under the Securities Exchange Act of 1934) was carried out by our management, with the participation of our Chief Executive Officer (CEO) and Chief Financial Officer (CFO). Based upon that evaluation, the CEO and CFO have concluded that as of the end of that fiscal year, our disclosure controls and procedures are effective to ensure that information required to be disclosed by us in reports that we file or submit under the Exchange Act is (i) recorded, processed, summarized and reported within the time periods specified in Securities and Exchange Commission (the “Commission”) rules and forms and (ii) accumulated and communicated to the management of the registrant, including the CEO and CFO, to allow timely decisions regarding required disclosure.
It should be noted that while the CEO and CFO believe that our disclosure controls and procedures provide a reasonable level of assurance that they are effective, they do not expect that our disclosure controls and procedures or internal control over financial reporting will prevent all errors and fraud. A control system, no matter how well conceived or operated, can provide only reasonable, not absolute, assurance that the objectives of the control system are met.
Management’s Annual Report on internal control over financial reporting
Management is responsible for establishing and maintaining adequate internal control over our financial reporting, as such term is defined in Rule 13a-15(f) of the Securities Exchange Act of 1934. Our internal control system was designed to provide reasonable assurance that all transactions are accurately recorded, that transactions are recorded as necessary to permit preparation of financial statements in accordance with generally accepted accounting principles, and that our assets are safeguarded.
Management has assessed the effectiveness of our internal control over financial reporting as at December 31, 2013. In making its assessment, management used the Committee of Sponsoring Organizations of the Treadway Commission (COSO) framework in Internal Control – Integrated Framework (1992) to evaluate the effectiveness of our internal control over financial reporting. Based on this assessment, management has concluded that our internal control over financial reporting was effective as of December 31, 2013.
Attestation report of the registered public accounting firm
The Company is a “non-accelerated filer” within the meaning of Rule 12b-2 under the Exchange Act. Therefore, this annual report is not required to include an attestation report of our registered public accounting firm regarding our internal control over financial reporting.
Changes in internal control over financial reporting
There have been no changes in our internal control over financial reporting during the period covered by the annual report, being the fiscal year ended December 31, 2013, that materially affected, or are reasonably likely to materially affect, our internal control over financial reporting and disclosure controls and procedures.
|
Other Information
|
None.
69
|
Directors, Executive Officers and Corporate Governance
|
Directors and Management
The following table sets forth information relating to our directors and executive officers as at the date of this Annual Report:
|
Name
|
|
Age
|
Residence
|
|
Position
|
|
Michael Abrams
(1)
|
|
57
|
Custer, Washington, U.S.A.
|
|
Executive Vice President, Chief Discovery Officer
|
|
Bruce Cousins
(5)
|
53
|
Victoria, British Columbia, Canada
|
Executive Vice President, Chief Financial Officer
|
||
|
Kenneth Galbraith
(2)(4)
|
|
51
|
Surrey, British Columbia, Canada
|
|
Director
|
|
Donald Jewell
(2) (3)
|
|
60
|
West Vancouver, British Columbia, Canada
|
|
Director
|
|
Frank Karbe
(2)
|
|
45
|
Mill Valley, California, U.S.A.
|
|
Director
|
|
Daniel Kisner
(3)(4)
|
|
67
|
Rancho Santa Fe, California, U.S.A.
|
|
Director (Chairman)
|
|
Mark Kowalski
(6)
|
59
|
Boston, Massachusetts, U.S.A.
|
Senior Vice President, Chief Medical Officer
|
||
|
Ian MacLachlan
|
|
50
|
Mission, British Columbia, Canada
|
|
Executive Vice President and Chief Technical Officer
|
|
Mark Murray
|
|
65
|
Seattle, Washington, U.S.A.
|
|
President, Chief Executive Officer and Director
|
|
Peggy Phillips
(1)(3)
|
|
60
|
Seattle, Washington, U.S.A.
|
|
Director
|
Notes:
|
(1)
|
Ms. Phillips was appointed as a Director on February 12, 2014 to replace Dr. Abrams, who joined the Company as Chief Discovery Officer in January 2014.
|
|
(2)
|
Member of Audit Committee.
|
|
(3)
|
Member of Executive Compensation and Human Resources Committee.
|
|
(4)
|
Member of Corporate Governance and Nominating Committee.
|
|
(5)
|
Mr. Cousins was appointed Executive Vice President and Chief Financial Officer, effective October 7, 2013.
|
|
(6)
|
Mr. Kowalski was appointed Senior Vice President and Chief Medical Officer, effective August 12, 2013.
|
Mark Murray, Ph.D., President, Chief Executive Officer and Director.
Dr. Murray has served as our President, Chief Executive Officer and Director since May 2008 when Tekmira and Protiva merged. Previously, he was the President and CEO and founder of Protiva since its inception in 2000. Dr. Murray has over 20 years of experience in both the R&D and business development and management facets of the biotechnology industry. Dr. Murray has held senior management positions at ZymoGenetics and Xcyte Therapies. Since entering the biotechnology industry Dr. Murray has successfully completed numerous and varied partnering deals, directed successful product development programs, been responsible for strategic planning programs, raised venture capital, and executed extensive business development initiatives in the U.S., Europe and Asia. Dr. Murray obtained his Ph.D. in Biochemistry from the University of Oregon Health Sciences University and was a Damon Runyon-Walter Winchell post-doctoral research fellow for three years at the Massachusetts Institute of Technology.
Daniel Kisner, M.D., Chairman.
Dr. Kisner has served as the Chairman of our Board since January 2010. Dr. Kisner is currently an independent consultant. From 2003 until December 2010, Dr. Kisner was a Partner at Aberdare Ventures. Prior to Aberdare, Dr. Kisner served as President and CEO of Caliper Technologies, a leader in microfluidic lab-on-a-chip technology. He led Caliper from a technology-focused start up to a publicly traded, commercially oriented organization. Prior to Caliper, he was President and COO of Isis Pharmaceuticals, Inc. Previously, Dr. Kisner was Division VP of Pharmaceutical Development for Abbott Laboratories and VP of Clinical Research and Development at SmithKline Beckman Pharmaceuticals. In addition, he held a tenured position in the Division of Oncology at the University of Texas, San Antonio School of Medicine and is certified by the American Board of Internal Medicine in Internal Medicine and Medical Oncology. Dr. Kisner holds a B.A. from Rutgers University and an M.D. from Georgetown University.
70
Michael Abrams, Ph.D., Executive Vice President, Chief Discovery Officer.
Dr. Michael Abrams has served as our Executive Vice President and Chief Discovery Officer since January 2014. Prior to joining Tekmira, Dr. Abrams was Chief Innovation Officer and Vice President, Research and Development at CDRD Ventures Inc. Previously, Dr. Abrams was President and Chief Executive Officer (CEO) of Inimex. He was the founding CEO of AnorMED, Inc., the company that discovered and developed Mozobil, a drug for improving stem cell mobilization for patients undergoing stem cell transplantation. Mozobil was approved by the FDA in 2008 and AnorMED was acquired by Genzyme Corporation in 2006 for $580 million. Previously, Dr. Abrams was a Biomedical Research Manager for Johnson Matthey, plc., where he led the spin-off of the biomedical research group to form AnorMED. From 2009 to 2013, Dr. Abrams served as Board Chairman of Indel Therapeutics. Dr. Abrams has a Ph.D. in Chemistry from the Massachusetts Institute of Technology and a B.A. in Chemistry from Bowdoin College. In 2009 he was a co-recipient of the Georg Charles de Hevesy Nuclear Pioneer Award from the Society of Nuclear Medicine for his work in the invention of the radiopharmaceutical, Cardiolite.
Kenneth Galbraith, F.C.A., Director.
Mr. Galbraith has served as our Director since January 2010. Since September 2013, Mr. Galbraith has held the position of Managing Director at Five Corners Capital. He previously was a General Partner at Ventures West, leading the firm’s biotechnology practice from 2007 to 2013. Prior to joining Ventures West, Mr. Galbraith was Chairman and Interim CEO of AnorMED, a biopharmaceutical company focused on new therapeutic products in hematology, HIV and oncology, until its sale to Genzyme Corp. in a cash transaction worth almost $600 million. Previously, Mr. Galbraith spent 13 years in senior management with QLT Inc., a global biopharmaceutical company specializing in developing treatments for eye diseases, retiring in 2000 from his position as Executive VP and CFO. He currently serves on the Board of Directors of a number of private biotechnology companies as well as a NASDAQ-listed biotechnology company, MacroGenics, Inc. (“MGNX”). Mr. Galbraith earned a Bachelor of Commerce (Honours) degree from the University of British Columbia and is a Fellow of the Chartered Accountants of BC.
Donald Jewell, C.A., Director.
Mr. Jewell has served as our Director since May 2008. Mr. Jewell is a Chartered Accountant with over 35 years of business experience. Mr. Jewell spent 20 years with KPMG and at the time of his departure, he was the managing partner in charge of KPMG’s management consulting practice in British Columbia. Until March 2010, Mr. Jewell was Chairman of Cal Investments Limited, a London based hedge fund. Mr. Jewell is currently the managing director of a private Canadian holding company; a private equity investor and on the Board of three investee businesses; Trustee of a two substantial Canadian private trusts; and on the Board of the trusts’ major operating companies. He is also on the Board of Directors of Lantic Inc.
Frank Karbe, Director.
Mr. Karbe has served as our Director since January 2010. Mr. Karbe is currently the Executive Vice President and Chief Financial Officer of Exelixis, Inc., a NASDAQ-listed biotechnology company. Prior to joining Exelixis in 2004, Mr. Karbe worked as an investment banker for Goldman Sachs & Co., where he served most recently as Vice President in the healthcare group focusing on corporate finance and mergers and acquisitions in the biotechnology industry. Prior to joining Goldman Sachs in 1997, Mr. Karbe held various positions in the finance department of The Royal Dutch/Shell Group in Europe. Mr. Karbe holds a Diplom-Kaufmann from the WHU—Otto Beisheim Graduate School of Management, Koblenz, Germany (equivalent to a U.S. Masters of Business Administration).
Peggy Phillips, Director.
Ms. Phillips has served as our Director since February 2014. Previously, Ms. Phillips was on the Board of Immunex and served as the Chief Operating Officer from 1999 until the company was acquired by Amgen in 2002. During her sixteen year career at Immunex, she held positions of increasing responsibility in research, development, manufacturing, sales, and marketing. As General Manager for Enbrel, she was responsible for clinical development, process development and regulatory affairs as well as the launch, sales and marketing of the product. Prior to joining Immunex, Ms. Phillips worked at Miles Laboratories for ten years. Ms. Phillips currently sits on the Board of Directors of Dynavax Technologies Corporation (NASDAQ: DVAX), a clinical stage biopharmaceutical company. Previously, Ms. Phillips served on the board of directors of Portola Pharmaceuticals, a biopharmaceutical company and on the board of Western Wireless, a cellular network operator, from 2004 until the acquisition of the company by Alltel in mid-2005. From 2003 until 2011, Ms. Phillips served on the Board of the Naval Academy Foundation. Ms. Phillips holds a B.S. and a M.S. in microbiology from the University of Idaho.
Bruce Cousins, Executive Vice President, Chief Financial Officer.
Mr. Bruce Cousins has served as our Executive Vice President and Chief Financial Officer since October 2013. Mr. Cousins has over 22 years’ experience both working for multi-million dollar companies and leading start-ups through to successful completion of their strategic growth plans. In 2004, Mr. Cousins joined Aspreva Pharmaceuticals and led its highly successful IPO. In 2008, he played a key leadership role in the eventual sale of Aspreva in a $915 million all-cash transaction. Prior to joining Aspreva, Mr. Cousins spent 14 years with Johnson & Johnson (J&J) working in operations and finance, both domestically and internationally. Prior to the pharmaceutical industry, Mr. Cousins was a chartered accountant with Deloitte & Touche. More recently, Mr. Cousins has held senior roles in the renewable energy sector, and from 2011 to 2013 he was Chief Executive Officer of Carmanah Technologies Corporation, a TSX-listed company. Mr. Cousins completed a Bachelor of Commerce degree from McMaster University in 1987 and received a Chartered Accountant designation in 1989.
71
Mark Kowalski, M.D., Ph.D., Senior Vice President, Chief Medical Officer.
Dr. Mark Kowalski has served as our Chief Medical Officer (CMO) and Senior Vice President since August 2013. Dr. Kowalski has extensive experience in Phase I through Phase IV drug development and clinical trials in a wide variety of therapeutic areas including oncology, urology, infectious diseases, analgesia, allergy, rheumatology and cardiovascular diseases. His experience also includes basic scientific research on the molecular biology of HIV as well as clinical practice in internal medicine. Prior to joining Tekmira, Dr. Kowalski worked in the oncology and inflammation therapeutic area at Gilead Sciences, Inc. following Gilead’s $510-million acquisition of YM BioSciences Inc. Previously, Dr. Kowalski had been CMO and Vice President of Regulatory Affairs at YM BioSciences Inc. Dr. Kowalski’s experience also encompasses being the CMO and Vice President of Medical/Regulatory Affairs at Viventia Biotechnologies Inc. Prior to Viventia, he was the Senior Director of Medical Affairs at AAIPharma Inc. Dr. Kowalski holds a B.A. from Rutgers University and an M.D. and Ph.D. from the University of Kansas School of Medicine. He completed his postgraduate training in internal medicine and infectious diseases at Duke University and Harvard Medical School.
Ian MacLachlan, Ph.D., Executive Vice President, Chief Technical Officer.
Dr. MacLachlan served as our Executive Vice President and Chief Scientific Officer from May 2008 to January 2014, at which time he became head of a newly formed group focused on medical countermeasures as Executive Vice President and Chief Technical Officer. Dr. MacLachlan was a co-founder of Protiva in 2000 and led Protiva’s R&D program since the company’s inception. A graduate of the University of Alberta, where he received both his B.Sc. and Ph.D. in Biochemistry, Dr. MacLachlan spent two years at the Vienna Bio-Center where some of the first experiments in systemic gene delivery were performed. Following this, Dr. MacLachlan conducted postdoctoral research at the Howard Hughes Medical Institute at the University of Michigan in the laboratory of Dr. Gary Nabel, a pioneer in the development of DNA-based therapeutics. Active in molecular therapeutics for more than a decade, he co-founded Protiva after five years leading the development of the gene transfer technology at Inex Pharmaceuticals. Dr. MacLachlan has been an invited speaker on nucleic acid delivery at the National Institutes of Health, the National Cancer Institute, numerous academic institutions and most major scientific meetings dealing with molecular therapy. He is a member of the New York Academy of Sciences, the Oligonucleotide Therapeutics Society and the American Society of Gene and Cell Therapy and serves on the Editorial Board of the journals Molecular Therapy, Molecular Therapy – Nucleic Acids and Nucleic Acid Therapeutics.
Board Practices
Our Directors have served in their respective capacities since their election or appointment and will serve until our next annual general meeting or until a successor is duly elected and qualified, unless their office is earlier vacated in accordance with the Law of Canada and our articles of incorporation. Our executives serve at the discretion of the board. The following table sets information on length of service of our current directors:
|
Director Name,
Position with
the Company, and
Residency
|
Period as a
Director of the
Company
|
Principal Occupation
for the Past Five Years
|
Other Public Company
Directorships Currently
Held or Held during the
Past Five Years
|
|
Kenneth Galbraith
Director
British Columbia, Canada
|
Since Jan. 28, 2010
|
Five Corners Capital (Sept. 2013 – present)
General Partner at Ventures West (Feb. 2007 – Sept. 2013
|
MacroGenics Inc.
(Oct. 2013- present)
|
|
Donald Jewell
(1)
Director
British Columbia
,
Canada
|
Since May 30, 2008
|
Managing Partner, RIO Industrial (financial management services) (Aug. 1995-present)
|
Rogers Sugar/Lantic
(Sept. 2003 – Jan. 2013)
|
|
Frank Karbe
Director
California, U.S.A.
|
Since Jan. 28, 2010
|
Chief Financial Officer of Exelixis, Inc. (Jan. 2004-present)
|
n/a
|
72
|
Director Name,
Position with
the Company, and
Residency
|
Period as a
Director of the
Company
|
Principal Occupation
for the Past Five Years
|
Other Public Company
Directorships Currently
Held or Held during the
Past Five Years
|
|
Daniel Kisner
Director and Board Chair
California, U.S.A.
|
Since Jan. 28, 2010
|
Independent Consultant
(Sept. 2010 to present)
Partner at Aberdare Ventures (2003-September 2010)
|
Dynavax Technologies Corporation
(Jul. 2010 – present)
Lpath Incorporated
(Jun. 2012 - present)
Conatus Pharmaceuticals
(Feb. 2014 - present)
|
|
Mark Murray
(1)
Director, President and CEO
Washington, U.S.A.
|
Since May 30, 2008
|
President, Chief Executive Officer and Director of Tekmira (May 2008 – present);
President and Chief Executive Officer of Protiva Biotherapeutics Inc. (2000-present)
|
n/a
|
|
Peggy Phillips
Director
Washington, U.S.A.
|
Since Feb. 12, 2014
|
Independent Consultant
(Previously Chief Operating Officer of Immunex Corporation)
|
Dynavax Technologies Corporation
(Aug. 2006 - present)
|
Notes:
|
(1)
|
Dr. Murray and Mr. Jewell were directors of Protiva before it was acquired by Tekmira on May 30, 2008.
|
Corporate Governance
Tekmira believes in building a strong governance foundation. We are subject to many provisions of the Sarbanes-Oxley Act of 2002 and related rules of the SEC, the governance standards of the NASDAQ and TSX and the rules and policies of the Canadian provincial securities regulators regarding audit committees, corporate governance and the certification of certain annual and interim filings. The Board of Directors continues to further its commitment to corporate governance by ensuring that all corporate governance documents are current, including the following documents:
|
•
|
Audit Committee Charter;
|
|
|
•
|
Corporate Governance and Nominating Committee Charter;
|
|
|
•
|
Executive Compensation and Human Resource Committee Charter;
|
|
|
•
•
•
•
|
Code of Conduct for Directors, Officers and Employees;
Whistleblower Policy;
Insider Trading Policy; and
Majority Voting Policy.
|
Employees are periodically re-trained on the Code of Conduct.
The Board of Directors approved all current Committee Charters and Guidelines on August 20, 2013. All of the above listed documents are publicly available on the Tekmira website at www.tekmira.com.
NASDAQ Corporate Governance Exemptions
As a Canadian corporation listed on the NASDAQ Global Market, we are not required to comply with most of the NASDAQ corporate governance requirements, so long as we comply with Canadian corporate governance practices. In order to claim such an exemption, we must disclose the significant differences between our corporate governance practices and those required to be followed by U.S. domestic issuers under NASDAQ’s corporate governance requirements. We are in compliance with the NASDAQ corporate governance requirements except as described below:
73
(1) Quorum Requirements
Rule 5620(c) of the NASDAQ Marketplace Rules requires that the minimum quorum requirement for a meeting of shareholders is 33.33% of the outstanding common shares. In addition, Rule 5620(c) requires that an issuer listed on NASDAQ state its quorum requirement in its bylaws. Our articles provide that a quorum for purposes of any meeting of shareholders of the Company consists of at least two persons who are, or who represent by proxy, one or more shareholders who, in the aggregate, hold at least 5% of the issues shares entitled to be voted at a meeting of shareholders. Our common shares are also listed on the Toronto Stock Exchange, the primary stock exchange in Canada, which does not prescribe a minimum quorum requirement. We follow applicable Canadian laws with respect to quorum requirements.
(2) Shareholder Approval
Rule 5635 of the NASDAQ Marketplace Rules requires shareholder approval to be obtained prior to the issuance of securities in connection with the undertaking of certain corporate actions. The circumstances under which shareholder approval is required under the NASDAQ Marketplace Rules are not identical to the circumstances under which shareholder approval is required under Canadian law and the requirements of the Toronto Stock Exchange. For example, but without limitation, Rule 5635 requires shareholder approval of most equity compensation plans and material revisions to such plans. This requirement covers plans that provide for the delivery of both newly issued and treasury securities. We follow the Toronto Stock Exchange rules with respect to the requirements for shareholder approval of potential transactions, including, without limitation, shareholder approval of equity compensation plans and material revisions to such plans.
Benefits on Termination of Directors
We do not have any contractual obligations arising if we terminate a director. However, historical practice has been to waive our stock options plan’s post termination 30 day cancellation and extend stock options through to their original expiration date.
Committees of our Board of Directors
To assist in the discharge of its responsibilities, our Board of Directors currently has three committees: the Audit Committee, the Executive Compensation and Human Resources Committee, and the Corporate Governance and Nominating Committee.
Audit Committee
The members of our Audit Committee are Mr. Karbe, Mr. Jewell and Mr. Galbraith, each of whom is a non-employee member of our Board of Directors. Mr. Karbe chairs the Audit Committee. Our Board of Directors has determined that each of the members of the Audit Committee is financially literate and are each an “audit committee financial expert” (as is currently defined under Item 407(d)(5) of Regulation S-K promulgated under applicable SEC rules. Our Board of Directors has determined that each member of our Audit Committee is an independent member of our Board of Directors under the current requirements of the NASDAQ and the rules and regulations of the SEC and Canadian provincial securities regulatory authorities.
Our Audit Committee is responsible for overseeing our financial reporting processes on behalf of our Board of Directors. Our auditor and independent registered public accounting firm reports directly to our Audit Committee. Specific responsibilities of our Audit Committee include:
|
•
|
overseeing the work of the auditors engaged for the purpose of preparing or issuing an auditor’s report or performing other audit, review or attest services for the Company;
|
|
•
|
evaluating the performance, and assessing the qualifications, of our auditor and recommending to our Board of Directors the appointment of, and compensation for, our auditor for the purpose of preparing or issuing an auditor report or performing other audit, review or attest services;
|
|
•
|
subject to the appointment of our auditor in accordance with applicable corporate formalities, determining and approving the engagement of, and compensation to be paid to, our auditor;
|
|
•
|
determining and approving the engagement, prior to the commencement of such engagement, of, and compensation for, our auditor and to perform any proposed permissible non-audit services;
|
|
•
|
reviewing our financial statements and management’s discussion and analysis of financial condition and results of operations and recommending to our Board of Directors whether or not such financial statements and management’s discussion and analysis of financial condition and results of operations should be approved by our Board of Directors;
|
|
•
|
conferring with our auditor and with our management regarding the scope, adequacy and effectiveness of internal financial reporting controls in effect;
|
74
|
•
|
establishing procedures for the receipt, retention and treatment of complaints received by us regarding accounting, internal accounting controls or auditing matters and the confidential and anonymous submission by our employees of concerns regarding questionable accounting or auditing matters; and
|
|
|
•
|
reviewing and discussing with our management and auditor, as appropriate, our guidelines and policies with respect to risk assessment and risk management, including our major financial risk exposures and investment and hedging policies and the steps taken by our management to monitor and control these exposures.
|
A copy of our Audit Committee’s charter is available on our website at www.tekmira.com.
Executive Compensation and Human Resources Committee
The members of our Executive Compensation and Human Resources Committee (the “Compensation Committee”) are Ms. Phillips, Mr. Jewell, and Dr. Kisner. Ms. Phillips currently chairs the Compensation Committee. Our Board of Directors has determined that each of the members of the Compensation Committee has the appropriate experience for their Committee responsibilities based on their past or current senior roles in our industry. Our Board of Directors has determined that each member of our Compensation Committee is an independent member of our Board of Directors under the current requirements of the NASDAQ and as defined in the rules and regulations of the Canadian provincial securities regulatory authorities.
Specific responsibilities of our Compensation Committee include:
|
•
|
reviewing and making recommendations to our Board of Directors for our chief executive officer and other executive officers: annual base salary; annual incentive bonus, including the specific goals and amount; equity compensation; employment agreements, severance arrangements and change in control agreements/provisions; and any other benefits, compensations, compensation policies or arrangements;
|
|
•
|
reviewing and making recommendations to our Board of Directors regarding our overall compensation plans and structure, including incentive compensation and equity based plans;
|
|
•
|
reviewing and making recommendations to our Board of Directors regarding the compensation to be paid to our non-employee directors, including any retainer, committee and committee chair fees and/or equity compensation;
|
|
•
|
reviewing any report to be included in our periodic filings or proxy statement; and
|
|
•
|
acting as administrator of our equity compensation plans.
|
A copy of our Compensation Committee’s charter is available on our website at www.tekmira.com.
Corporate Governance and Nominating Committee
The members of our Corporate Governance and Nominating Committee are Mr. Galbraith and Dr. Kisner. Mr. Galbraith currently chairs the committee. Our Board of Directors has determined that each member of our Corporate Governance and Nominating Committee is an independent member of our Board of Directors under the current requirements of the NASDAQ and as defined in the rules and regulations of the Canadian provincial securities regulatory authorities.
Specific responsibilities of our Corporate Governance and Nominating Committee include:
|
•
|
establishing criteria for Board membership and identifying, evaluating, reviewing and recommending qualified candidates to serve on the Board;
|
|
•
|
evaluating, reviewing and considering the recommendation for nomination of incumbent directors for re-election to the Board;
|
|
•
|
periodically reviewing and assessing the performance of our Board, including Board committees;
|
|
•
|
developing and reviewing a set of corporate governance principles for Tekmira.
|
A copy of our Corporate Governance and Nominating Committee’s charter is available on our website at www.tekmira.com.
Our Board of Directors is responsible for approving nominees for election as directors. However, as is described above, our Corporate Governance and Nominating Committee is responsible for reviewing, soliciting and recommending nominees to our Board of Directors.
75
In evaluating prospective nominees, our Corporate Governance and Nominating Committee looks for the following minimum qualifications: strong business acumen, previous experience as an executive or director with successful companies, standards of integrity and ethics, and a willingness and ability to make the necessary time commitment to diligently perform the duties of a director. Nominees are selected with a view to our best interests as a whole, rather than as representative of any particular stakeholder or category of stakeholders. Our Corporate Governance and Nominating Committee will also consider the skill sets of the incumbent directors when recruiting replacements to fill vacancies in our Board of Directors. Our Board of Directors prefers a mix of experience among its members to maintain a diversity of viewpoints and ensure that our Board of Directors can achieve its objectives. When a vacancy on our Board of Directors occurs, in searching for a new director, the Corporate Governance and Nominating Committee will identify particular areas of specialization which it considers beneficial, in addition to the general qualifications, having regard to the skill sets of the other members of our Board of Directors. Potential nominees and their respective references are interviewed extensively in person by the Corporate Governance and Nominating Committee before any nomination is endorsed by that committee. All nominations proposed by the Corporate Governance and Nominating Committee must receive the approval of our Board of Directors.
Code of Ethics
The Board of Directors of Tekmira Pharmaceuticals Corporation has adopted a Code of Business Conduct (Code) for all directors, officers and employees of the Company.
The purpose of this Code is to promote:
|
•
|
Honest and ethical conduct, including ethical handling of actual or apparent conflicts of interest between personal and professional relationships;
|
|
•
|
Full, fair, accurate, timely, and understandable disclosure in the reports that Tekmira is required to file with such securities exchange or quotation system or regulatory agency as may from time to time apply to Tekmira and in other public communications made by Tekmira;
|
|
•
|
Compliance with all applicable laws, rules and regulations.
|
The Company’s Code of Business Conduct and related documents have been posted on Tekmira’s website at
www.tekmira.com
. In addition, any substantive amendments we make to our Code, and any material waivers we grant to our principal executive officer, principal financial officer, principal accounting officer or controller, or persons performing similar functions will be disclosed on our website.
|
Executive Compensation
|
Named Executive Officers
For the purposes herein, our Named Executive Officers include our Chief Executive Officer, Mark Murray, Chief Financial Officer, Bruce Cousins (from October 2013, Ian Mortimer until October 2013), Chief Technical Officer, Ian MacLachlan, Chief Medical Officer, Mark Kowalski, and Senior Vice President of Pharmaceutical Development, Peter Lutwyche.
Compensation Discussion and Analysis
Compensation Principles, Components and Policies
The Executive Compensation and Human Resources Committee, or the Compensation Committee, is responsible for recommending the compensation of our executive officers to the Board of Directors. In establishing compensation levels for executive officers, the Compensation Committee seeks to accomplish the following goals:
|
•
|
to recruit and subsequently retain highly qualified executive officers by offering overall compensation which is competitive with that offered for comparable positions in other biotechnology companies;
|
|
•
|
to motivate executives to achieve important corporate performance objectives and reward them when such objectives are met; and
|
|
•
|
to align the interests of executive officers with the long-term interests of shareholders through participation in our stock-based compensation plan (the “2011 Plan”).
|
Benchmarking of Executive Compensation
In the fourth quarter of 2010, Lane Caputo Compensation Inc. was paid $30,000 to review Executive and Director Compensation and to benchmark against companies in the biotechnology industry. Lane Caputo benchmarked compensation against a group of relevant peer companies. The 16 companies selected in Tekmira’s peer group were:
| Aeterna Zentaris Inc. | Neuralstem Inc | |
| AVI Biopharma Inc. | NovaBay Pharmaceuticals Inc | |
| Celldex Therapeutics Inc. | OncoGeneX Pharmaceuticals Inc. |
76
| Cleveland Biolabs Inc. | Peregrine Pharmaceuticals Inc | |
| Curis Inc. | Rexahn Pharmaceuticals Inc | |
| Idera Pharmaceuticals Inc | Sangamo BioSciences Inc | |
| Inhibitex Inc | Transition Therapeutics Inc | |
| Inovio Pharmaceuticals Inc | YM BioSciences Inc. |
Based on the review of the Lane Caputo report, no changes were made to the base salaries of the Named Executive Officers except for Dr. Murray whose salary was increased from $338,100 (his salary was then denominated in Canadian dollars and was C$345,000) to $350,000 effective January 1, 2011.
During 2011 and 2012, given business conditions, no increases to executive compensation were considered.
During 2013, we participated in and purchased the Radford Global US Life Sciences Survey (US Edition). This survey is generally aimed at non-executive level staff. Tekmira considered 50
th
percentile data from the survey for companies with 50 to 149 employees in determining salaries for Dr. Kowalski and Mr. Cousins who were hired during 2013. 50
th
percentile market data was presented to the Compensation Committee by the CEO at the end of 2013 and was considered in the determination of executive salaries for 2014.
We intend to conduct a director and officer compensation benchmarking exercise in 2014.
Performance Graph
The performance of our share price is one of the factors the Compensation Committee takes into account when considering executive compensation. The following graph compares the cumulative shareholder return on an investment of C$100 in the Common Shares of the Company on the TSX from December 31, 2008, with a cumulative total shareholder return on the S&P/TSX Composite Total Return and S&P/TSX Capped Health Care Indices.
Elements of Executive Compensation
Currently, our executive compensation package consists of the following components: base salary, discretionary annual incentive cash bonus, long-term incentives in the form of share options and health and retirement benefits generally available to all of our employees. We have not granted any share appreciation rights to our directors and officers. We have established the above components for our executive compensation package because we believe a competitive base salary and opportunity for annual cash bonuses are required to recruit and retain key executives. Our 2011 Plan enables our executive officers to participate in our long term success and aligns their interests with those of the shareholders. Additional details on the compensation package for Named Executive Officers are described in the following sections.
Base Salary
The Named Executive Officers are paid a base salary as an immediate means of rewarding the Named Executive Officer for efforts expended on our behalf. Base salaries for Named Executive Officers are evaluated against the responsibilities inherent in the position held, the individual’s experience and past performance and industry benchmarks.
77
Annual Incentive Cash Bonuses
Our policy is to pay bonuses at the end of our fiscal year, assuming that we have sufficient financial stability, based upon our level of achievement of major corporate objectives as determined by the Compensation Committee and the Board of Directors.
Long-Term Incentives—Share Options
Share options are granted to reward individuals for current performance, expected future performance and to align the long term interest of Named Executive Officers with shareholders. Share option grants are not based on pre-determined performance goals, either personal or corporate. Awards reflect the qualitative judgment of the Board of Directors as to whether a grant should be awarded for retention or incentive purposes and if so what the size and timing of such awards should be as well as taking into consideration the third party compensation survey completed for us in the third quarter of 2010.
Share options are generally awarded to executive officers at commencement of employment and periodically thereafter after taking into consideration the recommendations of the Lane Caputo compensation report completed in Q4 2010. Any special compensation other than cash bonuses is typically granted in the form of options. The exercise price for the options is the closing price of the Common Shares on the last trading day before the grant of the option. See subsection
“Equity Compensation Plans”
for a description of the terms of the Company’s current omnibus share compensation plan.
Pension Plans or Similar Benefits for Named Executive Officers
We do not have any pension or deferred compensation plans for our Named Executive Officers. We do, however, have a Registered Retirement Savings Plan (“RRSP”) Matching Plan whereby the Company matches employee contributions to their RRSPs up to a certain percentage of each employee’s salary. The RRSP matching plan is available to all full-time employees of Tekmira. Each year the Compensation Committee will approve a matching percentage of up to 5% of the employee salaries. The matching percentage is the same for all employees and is not based on performance.
Health care plans
All Tekmira employees receive health care coverage as a benefit. In addition, Drs. Murray and MacLachlan are entitled to reimbursement of any health expenses incurred, including their families’ health expenses, that are not covered by our insurance, as part of their employment contracts.
Other compensation
As part of his employment contract, Dr. Murray’s compensation also includes reimbursement of personal tax filing service fees up to a maximum of $10,000 per year.
Named Executive Officer compensation for 2011, 2012 and 2013
Base salary
There were no changes to Named Executive Officer salaries from 2011 to 2012.
The salaries of Drs. Murray and Kowalski are denominated in US dollars. The salaries of the other Named Executive Officers are denominated in Canadian dollars.
Effective January 1, 2013, the base salary of Dr. Murray was increased by 8% to $377,500, the base salary of Dr. MacLachlan was increased by 7% to $305,851 (C$315,000), the base salary of Mr. Mortimer was increased by 7% to $296,141 (C$305,000) and the base salary of Dr. Lutwyche was increased by 7% to $233,029 (C$240,000) (Canadian dollar denominated salaries have been converted to US dollars at the 2013 average exchange rate of 0.9710). These increases reflect cost of living increases, performance and retention measures and take into consideration the lack of increases in 2012.
Effective January 1, 2014, the base salary of Dr. Murray was increased by 6% to $400,000, the base salary of Dr. MacLachlan was increased by 2.5% to $303,568 (C$322,875), the base salary of Mr. Cousins remained at $286,762 (C$305,000), the base salary of Dr. Lutwyche was increased by 3% to $232,418 (C$247,200), and the base salary of Dr. Kowalski was increased by 2.5% to $333,125 (Canadian dollar denominated salaries have been converted to US dollars at the December 31, 2013 exchange rate of 0.9402).
Annual Incentive Cash Bonuses
For 2011, Dr. Murray, Mr. Mortimer and Dr. MacLachlan were eligible to earn cash bonuses of up to a maximum of 50% and Dr. Lutwyche up to a maximum of 35% of their respective base salaries based on the Board of Directors determination of achievement of corporate goals. Our objectives for 2011, as established by the Board of Directors included: continued enrollment of patients in the Phase 1 clinical trial for TKM-PLK1; completion of pre-clinical toxicology studies for TKM-Ebola and filing of a TKM-Ebola Investigational New Drug application; continued execution of the TKM-Ebola contract including manufacturing scale-up and lyophilization of LNP technology; generate pre-clinical proof of concept for our next product candidate; and, maintain a strong cash position. Although good progress was made on the achievement of the 2011 objectives, given business conditions, no cash bonuses were paid.
78
For 2012, maximum percentage bonus potential for Drs. Murray, MacLachlan and Lutwyche was the same as for 2011. Our objectives for 2012, as established by the Board of Directors included: completing enrollment of patients in the Phase 1 clinical trial for TKM-PLK1; completion of a Phase 1 clinical trial for TKM-Ebola; continued execution of TKM-Ebola contract including manufacturing scale-up and lyophilization of LNP technology; and, complete an equity offering and maintain a strong cash position. At the end of 2012, the Compensation Committee recommended, and the Board of Directors approved, the payment of 200% of the maximum cash bonus for 2012 for Drs. Murray, MacLachlan, and Lutwyche. The bonus payments at the end of 2012 included the amounts the Named Executives had forgone in the 2011 and achievement against corporate objectives. The bonus was not based on any quantitative weighting of individual corporate performance goals or other formulaic process.
Maximum percentage bonus potential for Drs. Murray, MacLachlan and Lutwyche for 2013 was the same as for 2012. The maximum percentage bonus potential for Mr. Mortimer was 50%, for Mr. Cousins it was 40%, and for Dr. Kowalski it was 35%. Our objectives for 2013 were assigned quantitative weighting, and were established by the Board of Directors which included: initiating a TKM-PLK1 Phase 2 efficacy clinical trial (30%); file a TKM-ALDH2 IND (10%); treat first subject with new formulations of TKM-Ebola (10%); nominate a new product development candidate (20%); maintain cash runway into 2015 (10%); generate business development revenue (15%); and other organizational objectives (5%). At the end of 2013, the Compensation Committee recommended, and the Board of Directors approved, the payment of executive bonuses of up to 87.5% of the maximum. The maximum bonus level was based on the progress and achievement of the listed corporate objectives based on the indicated quantitative weighting.
The President and Chief Executive Officer reviewed the performance of Drs. MacLachlan, Lutwyche and Kowalski in light of their goals and achievements for 2013. Mr. Mortimer did not receive a performance bonus as he resigned from the Company. Dr. Murray’s bonus payout was based solely on the achievement of 2013 Corporate Goals. Mr. Cousin’s bonus was also based solely on achievement of corporate goals. The individual goals for Drs. MacLachlan, Lutwyche and Kowalski also contributed to determination of their bonus percentages.
The bonus percentages, as a percentage of annual salary, earned by the Named Executive Officers for 2013 were therefore:
Dr. Mark Murray 43.8%
Mr. Bruce Cousins 35.0%
Dr. Ian MacLachlan 37.2%
Dr. Mark Kowalski 30.6%
Dr. Peter Lutwyche 30.6%
Long-Term Incentives—Share Options
Share options are typically granted to employees, including executives, at the end of the year. At the end of 2010 there wasn’t enough room in our option pool to grant executive options. At our June 2011 Annual General Meeting our shareholders approved an increase to our available share option pool of 273,889. In August 2011 we granted 35,000 options to Dr. Murray, 25,000 options to Dr. MacLachlan, 25,000 options to Mr. Mortimer and 20,000 options to Dr. Lutwyche. These share option grants were recommended by the Compensation Committee and approved by independent Directors based on corporate and individual performance and vested upon the final resolution of the litigation. See Item 1. “
Business
” for details of the litigation.
In December 2011, as part of our annual compensation review, we granted 35,000 options to Dr. Murray, 25,000 options to Dr. MacLachlan, 25,000 options to Mr. Mortimer and 20,000 options to Dr. Lutwyche. These share option grants were recommended by the Compensation Committee and approved by independent Directors based on corporate and individual performance and our needs for fiscal 2012. These options vest one quarter immediately and one quarter on the next three anniversaries of their grant date.
In December 2012, as part of our annual compensation review, we granted 35,000 options to Dr. Murray, 25,000 options to Dr. MacLachlan, 25,000 options to Mr. Mortimer and 20,000 options to Dr. Lutwyche. These share option grants were recommended by the Compensation Committee and approved by independent Directors based on corporate and individual performance and our needs for fiscal 2013. These options vest one quarter immediately and one quarter on the next three anniversaries of their grant date.
79
In 2013, we granted 150,000 options to Mr. Cousins and 50,000 options to Dr. Kowalski in conjunction with their appointments as executive officers of Tekmira. These options vest one quarter immediately and one quarter on the next three anniversaries of their grant date.
In February 2014, as part of our annual compensation review, we granted 35,000 options to Dr. Murray, 25,000 options to each of Dr. MacLachlan and Dr. Kowalski, and 20,000 options to Dr. Lutwyche. These share option grants were recommended by the Compensation Committee and approved by independent Directors based on corporate and individual performance and our needs for fiscal 2014. Mr. Cousins did not receive any performance options in February 2014 as he was appointed in October 2013. These options vest one quarter immediately and one quarter on the next three anniversaries of their grant.
Compensation Committee Interlocks and Insider Participation
No member of the Compensation Committee during fiscal year 2013 served as one of our officers, former officers or employees nor received directly or indirectly compensation from the Company, other than in the capacity as a member of our Board and Compensation Committee. There was no direct or indirect control by the members of the Compensation Committee of the Company. No member of the Compensation Committee, directly or indirectly, is the beneficial owner of more than 10% of the Company’s equity, nor are they an executive officer, employee, director, general partner or a managing member of one or more entities that are together the beneficial owners of more than 10% of the Company’s equity. The Compensation Committee members are not aware of any business or personal relationship between (i) a member of the Compensation Committee and any person who has provided or is providing advice to the Compensation Committee; and (ii) an executive officer of the company and any firm or other person who is employed or is employing such person to provide advice to the Compensation Committee. During fiscal year 2013, none of our executive officers served as a director or member of the compensation committee of any other entity, one of whose executive officers served as a member of our Board of Directors or Compensation Committee, and none of our executive officers served as a member of the board of directors of any other entity, one of whose executive officers served as a member of our Compensation Committee.
Compensation Report from the Board of Directors
The Board of Directors has reviewed and discussed “Compensation Discussion and Analysis” required by Item 402(b) of Regulation S-K with management and, based on such review and discussions, has recommended that the “Compensation Discussion and Analysis” be included in this Annual Report on Form 10-K.
BOARD OF DIRECTORS
Daniel Kisner, Board Chair
Franke Karbe
Kenneth Galbraith
Mark Murray
Peggy Phillips
Donald Jewell
Executive Compensation details
The following disclosure sets out the compensation for our Named Executive Officers and our directors for the financial year ended December 31, 2013.
Summary Compensation Table
The following table sets out the compensation paid, payable or otherwise provided to our Named Executive Officers during the our three most recently completed financial years ending on December 31. All amounts are expressed in US dollars unless otherwise noted. Amounts paid or denominated in Canadian dollars are converted to US dollars for presentation purposes at the average exchange rate for the year.
80
|
Name and principal position
|
Year
|
Salary
(US$)
|
Salary
(C$)
|
Options
(US$)
(1)
|
Annual
incentive
cash
bonus
(US$)
|
All other
compensation
(US$)
(2)
|
Total
compensation
(US$)
|
|||||||||||||||||
|
Dr. Mark Murray
|
2013
|
377,500 |
NA
|
- | 160,359 | 43,792 | 581,651 | |||||||||||||||||
|
President and
|
2012
|
350,000 |
NA
|
165,768 | 347,984 | 62,040 | 925,792 | |||||||||||||||||
|
Chief Executive Officer
|
2011
|
350,000 |
NA
|
136,533 | - | 42,358 | 528,891 | |||||||||||||||||
|
Mr. Bruce Cousins
(3)
|
2013
|
69,480 | 71,558 | 1,247,159 | 24,318 | 2,085 | 1,343,040 | |||||||||||||||||
|
Executive Vice President, Finance
|
2012
|
- | - | - | - | - | - | |||||||||||||||||
|
and Chief Financial Officer
|
2011
|
- | - | - | - | - | - | |||||||||||||||||
|
Mr. Ian Mortimer
(4)
|
2013
|
262,351 | 270,199 | - | - | - | 262,351 | |||||||||||||||||
|
Executive Vice President, Finance
|
2012
|
285,184 | 285,000 | 118,405 | 285,184 | 8,556 | 697,329 | |||||||||||||||||
|
and Chief Financial Officer
|
2011
|
288,336 | 285,000 | 97,523 | - | - | 385,860 | |||||||||||||||||
|
Dr. Ian MacLachlan
|
2013
|
305,851 | 315,000 | - | 113,739 | 9,422 | 429,011 | |||||||||||||||||
|
Executive Vice President
|
2012
|
295,190 | 295,000 | 118,405 | 295,190 | 8,856 | 717,642 | |||||||||||||||||
|
and Chief Technical Officer
|
2011
|
298,454 | 295,000 | 97,523 | - | 1,456 | 397,433 | |||||||||||||||||
|
Dr. Mark Kowalski
(5)
|
2013
|
128,623 |
NA
|
261,819 | 36,240 | 3,859 | 430,541 | |||||||||||||||||
|
Senior Vice President
|
2012
|
- |
NA
|
- | - | - | - | |||||||||||||||||
|
and Chief Medical Officer
|
2011
|
- |
NA
|
- | - | - | - | |||||||||||||||||
|
Dr. Peter Lutwyche
|
2013
|
233,029 | 240,000 | - | 71,365 | 6,991 | 311,385 | |||||||||||||||||
|
Senior Vice President, Pharmaceutical
|
2012
|
225,145 | 225,000 | 94,724 | 157,602 | 6,754 | 484,225 | |||||||||||||||||
|
Development
|
2011
|
227,634 | 225,000 | 78,019 | - | - | 305,653 | |||||||||||||||||
Notes:
|
1.
|
The fair value of each option is estimated as at the date of grant using the most widely accepted option pricing model, Black-Scholes. The fair value of options computed on the grant date is in accordance with FASB ASC Topic 718. The weighted average option pricing assumptions and the resultant fair values for options awarded to Named Executive Officers in 2011 are as follows: expected average option term of ten years; a zero dividend yield; a weighted average expected volatility of 115.5%; and, a weighted average risk-free interest rate of 2.51%. The weighted average option pricing assumptions and the resultant fair values for options awarded to Named Executive Officers in 2012 are as follows: expected average option term of ten years; a zero dividend yield; a weighted average expected volatility of 121.5%; and, a weighted average risk-free interest rate of 1.46%. The weighted average option pricing assumptions and the resultant fair values for options awarded to Named Executive Officers for fiscal 2013 are as follows: expected average option term of ten years; a zero dividend yield; a weighted average expected volatility of 114.7%; and, a weighted average risk-free interest rate of 2.49%. Options awarded to the Named Executive Officers in February 2014 are not included in the above table.
|
|
2.
|
All other compensation in 2012 and 2013 includes Registered Retirement Savings Plan, or RRSP, or equivalent matching payments of 3% of salary. In 2012 and 2013 all of our full-time employees and executives were eligible for RRSP or equivalent matching payments. In 2011 RRSP match payments had been suspended to conserve cash. Dr. Murray’s other compensation also includes reimbursement of personal tax filing service fees up to a maximum of $10,000 per year. Dr. Murray’s and Dr. MacLachlan’s other compensation also includes amounts claimed under their contractual entitlement to reimbursement of any health expenses incurred, including their families’ health expenses, that are not covered by insurance.
|
|
3.
|
Mr. Cousins commenced employment with Tekmira in October 2013 with an annual salary of $286,762 (C$305,000) and was granted 150,000 new hire stock options at that time.
|
|
4.
|
Mr. Mortimer resigned from Tekmira in October 2013.
|
|
5.
|
Dr. Kowalski commenced employment in August 2013 with an annual salary of $325,000 and was granted 50,000 new hire stock options at that time.
|
81
Grants of Plan-Based Awards Table
|
Estimated Possible Payouts Under Non-
Equity Incentive Plan Awards(2)
|
Stock
Awards:
|
Option
Awards:
Number of
|
Exercise or
|
Grant Date
Fair Value of
|
|||||||||||||||||||||||||||
|
Name
|
Date of
Grant (1)
|
Threshold
($)
|
Target
($)
|
Maximum
($)
|
Number of
Shares of
Stock(3)
|
Securities
Underlying
Options
|
Base Price of
Option
Awards ($)
|
Stock and
Option
Awards ($)(4)
|
|||||||||||||||||||||||
|
Bruce Cousins
|
10/7/13
|
$ | - | $ | - | $ | - | - | 150,000 | $ | 8.86 | $ | 1,247,159 | ||||||||||||||||||
|
Executive Vice President and Chief Financial Officer
|
|||||||||||||||||||||||||||||||
|
(from October 2013)
|
|||||||||||||||||||||||||||||||
|
Mark Kowalski, M.D., Ph.D.
|
8/12/13
|
$ | - | $ | - | $ | - | - | 50,000 | $ | 5.58 | $ | 261,819 | ||||||||||||||||||
|
Senior Vice President and Chief Medical Officer
|
|||||||||||||||||||||||||||||||
|
Mark Murray, Ph.D.
|
N/A | $ | - | $ | - | $ | - | - | - | $ | - | $ | - | ||||||||||||||||||
|
President and Chief Executive Officer
|
|||||||||||||||||||||||||||||||
|
Ian Mortimer
|
N/A | $ | - | $ | - | $ | - | - | - | $ | - | $ | - | ||||||||||||||||||
|
Executive Vice President and Chief Financial Officer
|
|||||||||||||||||||||||||||||||
|
(until October 2013)
|
|||||||||||||||||||||||||||||||
|
Ian MacLachlan, Ph.D.
|
N/A | $ | - | $ | - | $ | - | - | - | $ | - | $ | - | ||||||||||||||||||
|
Executive Vice President and Chief Medical Officer
|
|||||||||||||||||||||||||||||||
|
Peter Lutwyche, Ph.D.
|
N/A | $ | - | $ | - | $ | - | - | - | $ | - | $ | - | ||||||||||||||||||
|
Senior Vice President, Pharmaceutical Development
|
|||||||||||||||||||||||||||||||
Notes:
|
1.
|
The stock option awards reported in the 2013 Grants of Plan-Based Awards Table were granted pursuant to our Designated Plans.
|
|
2.
|
We do not have any non-equity incentive plans. A discretionary annual incentive cash bonus may be included as a component of our executive compensation package – see Item 11 subsection “
Elements of Executive Compensation
”.
|
|
3.
|
Our 2011 Plan allows for the issuance of tandem stock appreciation rights, restricted stock units and deferred stock units, but we have not granted any stock awards to date.
|
|
4.
|
The Grant Date Fair Value, computed in accordance with FASB ASC Topic 718, represents the value of stock options granted during the year. The amounts reported in the Grants of Plan-Based Awards Table reflect our accounting expense and may not represent the amounts our named executive officers will actually realize from the awards. Whether, and to what extent, a named executive officer realizes value will depend on our actual operating performance, stock price fluctuations and that named executive officer’s continued employment. Our Designated Plans, governed substantially under the same terms as our 2011 Plan, provide that the option exercise price is always at least equal to the closing market price of the common shares on the day preceding the date of grant and the term may not exceed 10 years. These stock options vest one quarter immediately, and one quarter on the next three anniversaries of their grant date. As the closing market price of the common shares is denominated in Canadian dollars, the Exercise Price and the Grant Date Fair Value shown in the table have been translated to US dollars using the average exchange rate for the year.
|
Outstanding Option-Based Awards at December 31, 2013
There were no outstanding stock awards for any Named Executive Officer as at December 31, 2013. The following tables set out all option awards, outstanding as at December 31, 2013, for each Named Executive Officer:
82
|
Option-based awards - total outstanding options
(1)
|
||||||
|
Name
|
Number of securities
underlying unexercised
|
Option
exercise price
|
Option
exercise price
|
Option grant date
(2)
|
Value of
unexercised
|
Value of
unexercised
|
|
Dr. Mark Murray
(5)
|
219,428
|
0.44
|
0.44
|
September 13, 2005
|
1,757,618
|
1,646,739
|
|
27,007
|
0.44
|
0.44
|
March 2, 2008
|
216,326
|
202,679
|
|
|
30,000
|
4.65
|
4.37
|
August 31, 2008
|
114,000
|
107,183
|
|
|
25,000
|
1.80
|
1.69
|
December 9, 2008
|
166,250
|
156,308
|
|
|
25,000
|
3.85
|
3.62
|
January 28, 2010
|
115,000
|
108,123
|
|
|
35,000
|
2.40
|
2.26
|
August 10, 2011
|
211,750
|
199,087
|
|
|
35,000
|
1.70
|
1.60
|
December 23, 2011
|
236,250
|
222,122
|
|
|
35,000
|
5.15
|
4.84
|
December 10, 2012
|
115,500
|
108,593
|
|
|
Mr. Ian Mortimer
|
3,000
|
7.00
|
6.58
|
December 15, 2004
|
4,350
|
4,090
|
|
15,000
|
3.10
|
2.91
|
July 26, 2005
|
80,250
|
75,451
|
|
|
2,500
|
5.40
|
5.08
|
March 29, 2006
|
7,625
|
7,169
|
|
|
7,500
|
5.40
|
5.08
|
March 29, 2006
|
22,875
|
21,507
|
|
|
3,750
|
3.00
|
2.82
|
August 3, 2006
|
20,438
|
19,215
|
|
|
3,750
|
3.00
|
2.82
|
August 3, 2006
|
20,438
|
19,215
|
|
|
3,750
|
3.00
|
2.82
|
August 3, 2006
|
20,438
|
19,215
|
|
|
3,750
|
3.00
|
2.82
|
August 3, 2006
|
20,438
|
19,215
|
|
|
10,000
|
6.50
|
6.11
|
August 7, 2007
|
19,500
|
18,334
|
|
|
6,000
|
5.60
|
5.27
|
April 1, 2008
|
17,100
|
16,077
|
|
|
8,000
|
5.60
|
5.27
|
April 1, 2008
|
22,800
|
21,437
|
|
|
70,000
|
5.60
|
5.27
|
April 1, 2008
|
199,500
|
187,570
|
|
|
11,000
|
1.80
|
1.69
|
December 9, 2008
|
73,150
|
68,776
|
|
|
16,000
|
3.85
|
3.62
|
January 28, 2010
|
73,600
|
69,199
|
|
|
25,000
|
2.40
|
2.26
|
August 10, 2011
|
151,250
|
142,205
|
|
|
25,000
|
1.70
|
1.60
|
December 23, 2011
|
168,750
|
158,659
|
|
|
25,000
|
5.15
|
4.84
|
December 10, 2012
|
82,500
|
77,567
|
|
|
Mr. Bruce Cousins
|
150,000
|
9.12
|
8.57
|
October 7, 2013
|
-
|
-
|
|
Dr. Ian MacLachlan
|
30,000
|
4.65
|
4.37
|
August 31, 2008
|
114,000
|
107,183
|
|
16,000
|
1.80
|
1.69
|
December 9, 2008
|
106,400
|
100,037
|
|
|
16,000
|
3.85
|
3.62
|
January 28, 2010
|
73,600
|
69,199
|
|
|
25,000
|
2.40
|
2.26
|
August 10, 2011
|
151,250
|
142,205
|
|
|
25,000
|
1.70
|
1.60
|
December 23, 2011
|
168,750
|
158,659
|
|
|
25,000
|
5.15
|
4.84
|
December 10, 2012
|
82,500
|
77,567
|
|
|
Dr. Mark Kowalski
|
50,000
|
5.75
|
5.41
|
August 12, 2013
|
135,000
|
126,927
|
|
Dr. Peter Lutwyche
|
18,000
|
1.80
|
1.69
|
December 9, 2008
|
119,700
|
112,542
|
|
16,000
|
3.85
|
3.62
|
January 28, 2010
|
73,600
|
69,199
|
|
|
20,000
|
2.40
|
2.26
|
August 10, 2011
|
121,000
|
113,764
|
|
|
20,000
|
1.70
|
1.60
|
December 23, 2011
|
135,000
|
126,927
|
|
|
20,000
|
5.15
|
4.84
|
December 10, 2012
|
66,000
|
62,053
|
|
83
|
Option-based awards - outstanding vested options
(1)
|
||||||
|
Name
|
Number of securities
underlying unexercised
|
Option
exercise price
|
Option
exercise price
|
Option grant date
(2)
|
Value of
unexercised
|
Value of
unexercised
|
|
Dr. Mark Murray
(5)
|
219,428
|
0.44
|
0.44
|
September 13, 2005
|
1,757,618
|
1,646,739
|
|
27,007
|
0.44
|
0.44
|
March 2, 2008
|
216,326
|
202,679
|
|
|
30,000
|
4.65
|
4.37
|
August 31, 2008
|
114,000
|
107,183
|
|
|
25,000
|
1.80
|
1.69
|
December 9, 2008
|
166,250
|
156,308
|
|
|
18,750
|
3.85
|
3.62
|
January 28, 2010
|
86,250
|
81,092
|
|
|
35,000
|
2.40
|
2.26
|
August 10, 2011
|
211,750
|
199,087
|
|
|
26,250
|
1.70
|
1.60
|
December 23, 2011
|
177,188
|
166,592
|
|
|
17,500
|
5.15
|
4.84
|
December 10, 2012
|
57,750
|
54,297
|
|
|
Mr. Ian Mortimer
(4)
|
3,000
|
7.00
|
6.58
|
December 15, 2004
|
4,350
|
4,090
|
|
15,000
|
3.10
|
2.91
|
July 26, 2005
|
80,250
|
75,451
|
|
|
2,500
|
5.40
|
5.08
|
March 29, 2006
|
7,625
|
7,169
|
|
|
7,500
|
5.40
|
5.08
|
March 29, 2006
|
22,875
|
21,507
|
|
|
3,750
|
3.00
|
2.82
|
August 3, 2006
|
20,438
|
19,215
|
|
|
3,750
|
3.00
|
2.82
|
August 3, 2006
|
20,438
|
19,215
|
|
|
3,750
|
3.00
|
2.82
|
August 3, 2006
|
20,438
|
19,215
|
|
|
3,750
|
3.00
|
2.82
|
August 3, 2006
|
20,438
|
19,215
|
|
|
10,000
|
6.50
|
6.11
|
August 7, 2007
|
19,500
|
18,334
|
|
|
6,000
|
5.60
|
5.27
|
April 1, 2008
|
17,100
|
16,077
|
|
|
8,000
|
5.60
|
5.27
|
April 1, 2008
|
22,800
|
21,437
|
|
|
70,000
|
5.60
|
5.27
|
April 1, 2008
|
199,500
|
187,570
|
|
|
11,000
|
1.80
|
1.69
|
December 9, 2008
|
73,150
|
68,776
|
|
|
16,000
|
3.85
|
3.62
|
January 28, 2010
|
73,600
|
69,199
|
|
|
25,000
|
2.40
|
2.26
|
August 10, 2011
|
151,250
|
142,205
|
|
|
18,750
|
1.70
|
1.60
|
December 23, 2011
|
126,563
|
118,994
|
|
|
12,500
|
5.15
|
4.84
|
December 10, 2012
|
41,250
|
38,783
|
|
|
Mr. Bruce Cousins
|
37,500
|
9.12
|
8.57
|
October 7, 2013
|
-
|
-
|
|
Dr. Ian MacLachlan
|
30,000
|
4.65
|
4.37
|
August 31, 2008
|
114,000
|
107,183
|
|
16,000
|
1.80
|
1.69
|
December 9, 2008
|
106,400
|
100,037
|
|
|
16,000
|
3.85
|
3.62
|
January 28, 2010
|
73,600
|
69,199
|
|
|
25,000
|
2.40
|
2.26
|
August 10, 2011
|
151,250
|
142,205
|
|
|
18,750
|
1.70
|
1.60
|
December 23, 2011
|
126,563
|
118,994
|
|
|
12,500
|
5.15
|
4.84
|
December 10, 2012
|
41,250
|
38,783
|
|
|
Dr. Mark Kowalski
|
12,500
|
5.75
|
5.41
|
August 12, 2013
|
33,750
|
31,732
|
|
Dr. Peter Lutwyche
|
18,000
|
1.80
|
1.69
|
December 9, 2008
|
119,700
|
112,542
|
|
16,000
|
3.85
|
3.62
|
January 28, 2010
|
73,600
|
69,199
|
|
|
20,000
|
2.40
|
2.26
|
August 10, 2011
|
121,000
|
113,764
|
|
|
15,000
|
1.70
|
1.60
|
December 23, 2011
|
101,250
|
95,195
|
|
|
10,000
|
5.15
|
4.84
|
December 10, 2012
|
33,000
|
31,027
|
|
84
|
Option-based awards - outstanding unvested options
(1)
|
||||||
|
Name
|
Number of securities
underlying unexercised
|
Option
exercise price
|
Option
exercise price
|
Option grant date
(2)
|
Value of
unexercised
|
Value of
unexercised
|
|
Dr. Mark Murray
(5)
|
6,250
|
3.85
|
3.62
|
January 28, 2010
|
28,750
|
27,031
|
|
8,750
|
1.70
|
1.60
|
December 23, 2011
|
59,063
|
55,531
|
|
|
17,500
|
5.15
|
4.84
|
December 10, 2012
|
57,750
|
54,297
|
|
|
Mr. Ian Mortimer
|
6,250
|
1.70
|
1.60
|
December 23, 2011
|
42,188
|
39,665
|
|
12,500
|
5.15
|
4.84
|
December 10, 2012
|
41,250
|
38,783
|
|
|
Mr. Bruce Cousins
|
112,500
|
9.12
|
8.57
|
October 7, 2013
|
-
|
-
|
|
Dr. Ian MacLachlan
|
6,250
|
1.70
|
1.60
|
December 23, 2011
|
42,188
|
39,665
|
|
12,500
|
5.15
|
4.84
|
December 10, 2012
|
41,250
|
38,783
|
|
|
Dr. Mark Kowalski
|
37,500
|
5.75
|
5.41
|
August 12, 2013
|
101,250
|
95,195
|
|
Dr. Peter Lutwyche
|
5,000
|
1.70
|
1.60
|
December 23, 2011
|
33,750
|
31,732
|
|
10,000
|
5.15
|
4.84
|
December 10, 2012
|
33,000
|
31,027
|
|
Notes to tables:
(1) Options vest 25% immediately, and 25% at each of the 1
st
, 2
nd
, and 3
rd
anniversaries of the grant date except for options granted on March 29, 2006 that vested immediately, options granted on July 26, 2005, August 3, 2006 and August 10, 2011 that vested based on the completion of certain performance criteria and options granted on April 1, 2008 that vested on May 31, 2009.
(2) Options expire 10 years after the grant date.
(3) This amount is the difference between Tekmira’s December 31, 2013 closing TSX share price of C$8.45 and the exercise price of the option (denominated in Canadian dollars).
(4) This amount is the difference between Tekmira’s December 31, 2013 closing TSX share price of C$8.45 and the exercise price of the option converted to US dollars at the December 31, 2013 exchange rate of 1.0636.
(5) Dr. Murray holds options to purchase 365,000 common shares of Protiva, a wholly-owned subsidiary of Tekmira, with an exercise price of C$0.30. As part of the business combination between Tekmira and Protiva, Tekmira agreed to issue 246,435 common shares of Tekmira on the exercise of these stock options giving an effective cost per Tekmira stock option of C$0.44. The shares reserved for issue on the exercise of the Protiva options are equal to the number of Tekmira common shares that would have been issued if the options had been exercised before the completion of the business combination and the shares issued on exercise of the options had then been exchanged for Tekmira common shares. See subsection
“Share ownership – Additional Shares Subject to Issue”.
Named Executive Officer Incentive Plan Awards – Options Exercised During the Year
No options were exercised by any of the Named Executive Officers during the year ended December 31, 2013.
Named Executive Officer Incentive Plan Awards – Value Vested During the Year
The aggregate value of executive options vesting during the year ended December 31, 2013 measured at their date of vesting by comparing option exercise price to closing market price on that day was:
|
Name
|
Option-based
awards value
|
Option-based
awards value
|
|
Dr. Mark Murray
|
234,900
|
226,442
|
|
Mr. Bruce Cousins
|
-
|
-
|
|
Mr. Ian Mortimer
|
167,405
|
161,274
|
|
Dr. Ian MacLachlan
|
167,405
|
161,274
|
|
Dr. Mark Kowalski
|
-
|
-
|
|
Dr. Peter Lutwyche
|
134,580
|
129,830
|
85
Termination and Change of Control Benefits
The following table provides information concerning the value of payments and benefits following the termination of employment of the Named Executive Officers under various circumstances. Payments vary based on the reason for termination and the timing of a departure. The below amounts are calculated as if the Named Executive Officer’s employment had been terminated on December 31, 2013. Receipt of payments on termination is contingent on the Named Executive Officer delivering a release to Tekmira.
|
Payment Type
|
Dr. Mark
Murray
|
Mr. Bruce
Cousins
|
Dr. Ian
MacLachlan
|
Dr. Mark
Kowalski
|
Dr. Peter
Lutwyche
|
|||||||||||||||
|
Involuntary termination by Tekmira for cause
|
||||||||||||||||||||
|
Cash payment
|
$ | - | $ | - | $ | - | $ | - | $ | - | ||||||||||
|
Option values
(1)
|
$ | 2,620,461 | $ | - | $ | 576,401 | $ | 31,732 | $ | 421,727 | ||||||||||
|
Benefits
(2)
|
$ | - | $ | - | $ | - | $ | - | $ | - | ||||||||||
|
Involuntary termination by Tekmira upon death
|
||||||||||||||||||||
|
Cash payment
|
$ | - | $ | - | $ | - | $ | - | $ | - | ||||||||||
|
Option values
(1)
|
$ | 2,620,461 | $ | - | $ | 576,401 | $ | 31,732 | $ | 421,727 | ||||||||||
|
Benefits
(2)
|
$ | - | $ | - | $ | - | $ | - | $ | - | ||||||||||
|
Involuntary termination by Tekmira without cause
|
||||||||||||||||||||
|
Cash payment
|
$ | 1,116,771 | $ | 310,308 | $ | 863,192 | $ | 360,092 | $ | 276,223 | ||||||||||
|
Option values
(1)(3)
|
$ | 2,859,266 | $ | - | $ | 654,849 | $ | 63,464 | $ | 421,727 | ||||||||||
|
Benefits
(2)
|
$ | 157,747 | $ | 10,716 | $ | 22,577 | $ | 91,154 | $ | 8,053 | ||||||||||
|
Involuntary termination by Tekmira without cause or
|
||||||||||||||||||||
|
by Executive with good reason after a change in control of the Company
|
||||||||||||||||||||
|
Cash payment
|
$ | 1,116,771 | $ | 310,308 | $ | 863,192 | $ | 360,092 | $ | 304,625 | ||||||||||
|
Option values
(1)(3)
|
$ | 2,859,266 | $ | - | $ | 654,849 | $ | 63,464 | $ | 468,972 | ||||||||||
|
Benefits
(2)
|
$ | 157,747 | $ | 10,716 | $ | 22,577 | $ | 91,154 | $ | 9,344 | ||||||||||
Notes:
|
(1)
|
This amount is based on the difference between Tekmira’s December 31, 2013 TSX closing share price of C$8.45 and the exercise price of the options that were vested as at December 31, 2013 converted into US at 0.9402.
|
|
(2)
|
Ongoing benefit coverage has been estimated assuming that benefits will be payable for the full length of the severance period which would be the case if new employment was not taken up during the severance period. Benefits include extended health and dental coverage that is afforded to all of the Company’s full time employees. Dr. Murray’s benefits also include a $2,000,000 life insurance policy, the reimbursement of up to $10,000 per annum in professional fees related to the filing of his tax returns. Dr. Murray and Dr. MacLachlan’s benefits also include an estimate of the costs of reimbursement of health expenses incurred, including their families’ health expenses, that are not covered by insurance.
|
|
(3)
|
This amount is based on the difference between Tekmira’s December 31, 2013 TSX closing share price of C$8.45 and the exercise price of the options that were vested as at December 31, 2013 and options that would vest during the severance period.
|
Director Compensation
The Board of Directors has adopted formal policies for compensation of non-executive directors. In order to align the interests of directors with the long-term interests of shareholders, the directors have determined that the most appropriate form of payment for their services as directors is through participation in the Tekmira’s equity compensation plans, as well as an annual cash retainer and fees for meeting attendance. Directors who also serve as a member of our management team receive no additional consideration for acting as a director.
The Board has adopted a policy that non-executive directors are granted options upon appointment as a director and are eligible for annual grants thereafter. Our Board fees are denominated in U.S. dollars. The Board fee schedule for 2011 was as follows: an annual cash retainer of $18,000 per annum ($25,500 for the Chairman of the Board; an additional $5,000 for the Chairman of the Audit Committee; an additional $2,500 for members of the Audit Committee; and an additional $2,500 for the Chairman of any other Board constituted committees) and meeting fees of $500 to $1,750. In the fourth quarter of 2010, Lane Caputo conducted a review of Executive and Director Compensation. Lane Caputo’s report recommended the following Board fee schedule: an annual cash retainer of $25,000 per annum ($50,000 for the Chairman of the Board; an additional $10,000 for the Chairman of the Audit Committee; an additional $6,000 for members of the Audit Committee; an additional $7,500 for the Chairman of the Compensation and Governance Committees; and, an additional $5,000 for members of the Compensation and Governance Committees) and Board meeting fees of $1,750 and no fees for Board committee meetings. The Board approved this new fee schedule effective January 1, 2011 but resolved to defer any payments in excess of the prior fee schedule until such time as the Company was more financially stable. Following the settlement of the litigation with Alnylam and AlCana in November 2012, the Board resolved to release the excess fees and continue with the Lane Caputo recommended Board fee schedule on an ongoing basis.
86
Non-executive directors earned cash compensation of $245,750 in 2013 as annual retainer and meeting attendance fees. We also reimburse directors for travel expenses they incur on behalf of the Company, including the cost of attending meetings of the Board.
The compensation provided to the directors, excluding Dr. Murray who is included in the Named Executive Officer disclosure above, for our most recently completed financial year of December 31, 2013 is:
|
Name
|
Fees earned
($)
|
Option-based
awards
(1)
($)
|
Total
($)
|
|||||||||
|
Daniel Kisner (Board Chair)
|
68,750 | 68,750 | ||||||||||
|
Donald Jewell
|
44,750 | 44,750 | ||||||||||
|
Frank Karbe (Audit Committee Chair)
|
43,750 | 43,750 | ||||||||||
|
Kenneth Galbraith (Corporate Governance and Nominating Committee Chair)
|
47,250 | 47,250 | ||||||||||
|
Michael Abrams
(2)
|
41,250 | 41,250 | ||||||||||
Notes:
|
(1)
|
No option-based awards were granted to the directors in 2013. We expect to grant 7,500 options to each of the directors if an increase in our option pool is approved at our next Annual General Meeting.
|
|
(2)
|
Dr. Abrams resigned from the Board on December 31, 2013 and joined the Company as Executive Vice President and Chief Discovery Officer on January 1, 2014.
|
Director options are priced at the closing market price of the previous trading day and vest immediately upon granting. We typically grants options to directors at the time of their first appointment to the Board and then on an annual basis at the end of the fiscal year. At our June 2011 Annual General Meeting our shareholders approved an increase to our available share option pool of 273,889. In August 2011 we granted 5,000 options to each of our non-executive Board members. In December 2011 we granted 5,000 options to each of our non-executive Board members. At our June 2012 Annual General and Special Meeting our shareholders approved an increase to our available share option pool of 550,726. In December 2012 we granted 5,000 options to each of our non-executive Board members.
We recently reset our new Board member option grant level from 10,000 to 15,000 and our ongoing Board member annual grant level from 5,000 to 7,500. Annual grants will continue to vest immediately but instead of vesting immediately, new Board member grants now vest 25% immediately, and 25% at each of the 1st, 2nd, and 3rd anniversaries of the grant date. For the 2013 year, we expect to issue an annual grant of options to each of our non-executive Board members following our 2014 Annual General Meeting.
|
Security Ownership of Certain Beneficial Owners and Management and Related Stockholder Matters
|
Equity Compensation Plans
Tekmira has five share-based compensation plans; the “2007 Plan”, the “2011 Plan”, (together, the “Tekmira Plans”) two “Designated Plans” and the “Protiva Option Plan”.
At Tekmira’s annual general and special meeting of shareholders on June 22, 2011, shareholders approved the 2011 Plan and a 273,889 increase in the number common shares in respect of which Awards may be granted under the 2011 Plan. Tekmira’s pre-existing 2007 Plan was limited to the granting of stock options as equity incentive awards whereas the 2011 Plan also allows for the issuance of tandem stock appreciation rights, restricted stock units and deferred stock units. The 2011 Plan replaces the 2007 Plan. The 2007 Plan will continue to govern the options granted there under. No further options will be granted under Tekmira’s 2007 Plan. At Tekmira’s annual general and special meeting of shareholders on June 20, 2012, shareholders approved a 550,726 increase in the number common shares in respect of which Awards may be granted under the 2011 Plan.
87
There is an aggregate of 1,893,954 common share options currently issued and outstanding and available for future issuance as common shares under the Tekmira Plans, the Designated Plans and the Protiva Option Plan which represents approximately 8.6% of the Company’s issued and outstanding common shares at March 21, 2014.
Since January 1996, the equivalent of 721,792 common shares of Tekmira have been issued pursuant to the exercise of options granted under the Tekmira Plans (which represents approximately 3.3% of the Company’s issued and outstanding common shares), and as of March 21, 2014, there were 1,472,078 common shares of Tekmira subject to options outstanding under Tekmira’s Plans (which represents approximately 6.7% of the Company’s current issued and outstanding common shares). The number of common shares of Tekmira remaining available for future grants of options as at March 21, 2014 was 97,398 (which represents approximately 0.4% of the Company’s current issued and outstanding common shares).
On May 30, 2008, as a condition of the acquisition of Protiva, the Company reserved 350,457 common shares for the exercise of up to 519,073 Protiva share options (“Protiva Options”). These shares are reserved for the issue to those shareholders who did not exercise their Protiva share options and exchange the shares of Protiva issuable on exercise for common shares of Tekmira on the closing of the business combination with Protiva. The shares reserved for them are equal to the same number of Tekmira common shares they would have received if they had exercised their options and transferred the shares to Tekmira. The Protiva Options are not part of Tekmira’s 2011 Plan or 2007 Plan and the Company is not permitted to grant any further Protiva stock options. The Protiva Options all have an exercise price $0.27 (C$0.30) ($0.39 (C$0.44) after applying the rate at which they will be converted into Tekmira shares) and expire on dates ranging from January 21, 2015 to March 1, 2018. As at March 21, 2014, Protiva options equating to 31,183 common shares had been exercised and Protiva options equating to 319,274 common shares remained outstanding.
Additionally, Tekmira granted a total of 200,000 options in 2013 to two executive officers of Tekmira in conjunction with their new appointments as executive officers. These options were granted in accordance with the policies of the Toronto Stock Exchange and pursuant to newly designated share compensation plans (the “Designated Plans”). The Designated Plans are governed by substantially the same terms as the 2011 Plan. See Item 11
“Executive Compensation
”, subsection “
Named Executive Officer compensation for 2011, 2012 and 2013
” for details.
Securities authorized for issuance under equity compensation plans
The following table sets out information for the five stock-based compensation plans as at March 21, 2014:
|
Plan Category
|
|
Number of securities
to be
issued upon
exercise of
outstanding options,
warrants, and rights
(a)
|
|
Weighted-average
exercise price
(US$) of
outstanding options,
warrants, and
rights
(b)
|
|
Number of securities
remaining available
for future issuance
under equity
compensation plans
(excluding securities
reflected in column (a))
(c)
|
||||||
|
Equity compensation plans approved by security holders
|
||||||||||||
|
2007 and 2011 Plan
|
1,374,680
|
$ |
5.64
|
97,398
|
||||||||
|
Protiva Option Plan
|
319,274
|
0.39
|
- | |||||||||
|
Equity compensation plans not approved by security holders
|
||||||||||||
|
Designated Plans
|
200,000 |
6.94
|
-
|
|||||||||
|
Total
|
1,893,954
|
$ |
4.89
|
97,398
|
||||||||
Security ownership of certain beneficial owners and management
The following table sets forth certain information regarding the beneficial ownership of our Common Stock as of March 21, 2014, by (i) each person (or group of affiliated persons) who is known by us to own beneficially more than 5% of the outstanding shares of the Common Stock, (ii) each of our directors, (iii) each of our executive officers whose name appears in the summary compensation table under the caption "Executive Compensation," and (iv) all of our executive officers and directors as a group. Unless otherwise indicated in the footnotes to the table, the business address of the 5% stockholders is 100-8900 Glenlyon Parkway, Burnaby BC V5J 5J8, and the stockholders listed have direct beneficial ownership and sole voting and investment power with respect to the shares beneficially owned. For each individual and group included in the table below, percentage ownership is calculated by dividing the number of shares beneficially owned by such person or group by the sum of the 21,945,838 shares of Common Stock outstanding on March 21, 2014, plus the number of shares of Common Stock that such person or group had the right to acquire within 60 days after March 21, 2014.
88
|
Name and address of Beneficial Owner
(1)
|
Number of
Common
Shares
|
+
|
Number of
Warrants
(2)
|
+
|
Number of
Shares Acquirable within 60 days
(3)
|
=
|
Total Beneficial Ownership
|
Percentage of Common Stock Ownership Beneficially Owned
(4)
|
||||
|
Holders of more than 5% of our common stock
|
||||||||||||
|
Franklin Resources Inc.
(5)
|
2,022,400
|
—
|
—
|
2,022,400
|
9.22
|
%
|
||||||
|
Steven T. Newby
(6)
|
1,206,000
|
—
|
—
|
1,206,000
|
5.50
|
% | ||||||
|
Directors and Named Officers
|
||||||||||||
|
Daniel Kisner
|
12,500
|
6,250
|
25,000
|
43,750
|
*
|
|||||||
|
Michael Abrams
(7)
|
10,200
|
2,500
|
81,092
|
93,792
|
*
|
|||||||
|
Kenneth Galbraith
|
15,240
|
—
|
20,000
|
35,240
|
*
|
|||||||
|
Donald Jewell
|
479,755
|
90,000
|
25,000
|
594,755
|
2.70
|
%
|
||||||
|
Frank Karbe
|
5,000
|
2,500
|
20,000
|
27,500
|
*
|
|||||||
|
Peggy Phillips
|
—
|
—
|
3,750
|
3,750
|
*
|
|||||||
|
Mark Murray
|
64,961
|
10,000
|
407,685
|
482,646
|
2.16
|
%
|
||||||
|
Ian MacLachlan
|
171,534
|
5,000
|
124,500
|
301,034
|
1.36
|
%
|
||||||
|
Bruce Cousins
|
—
|
—
|
37,500
|
37,500
|
*
|
|||||||
|
Mark Kowalski
|
—
|
—
|
18,750
|
18,750
|
*
|
|||||||
|
Peter Lutwyche
|
38,758
|
2,500
|
84,000
|
125,258
|
*
|
|||||||
|
All directors and current executive officers as a group (11 persons)
|
797,948
|
118,750
|
847,277
|
1,763,975
|
7.70
|
%
|
||||||
Notes:
| * | Less than 1% of our outstanding common stock. |
|
(1)
|
Unless otherwise indicated, the address of each stockholder is c/o Tekmira Pharmaceuticals Corp.; 100-8900 Glenlyon Parkway, Burnaby BC, V6J 5J8.
|
|
(2)
|
These warrants were acquired through participation in Tekmira’s June 2011 public share offering and/or Tekmira’s February 2012 private placement.
|
|
(3)
|
Reflects shares issuable upon the exercise of stock options that are exercisable or will become exercisable within 60 days after March 21, 2014.
|
| (4) |
Based on 21,945,838 common shares issued and outstanding, as of March 21, 2014. Shares of common stock subject to options currently exercisable, or exercisable within 60 days of March 21, 2014, are deemed outstanding for computing the percentage of the common stock beneficially owned by the person holding such options but are not deemed outstanding for computing the percentage of any other person.
|
| (5) |
According to Schedule 13G filed with the SEC on January 10, 2014 by Franklin Resources Inc., as of December 31, 2013,
Franklin Resources Inc. is the record and beneficial owner of 2,022,400 of our common stock. The address of Franklin
Resources Inc. is One Franklin Parkway, San Mateo, CA 94403-1906.
|
| (6) |
According to Schedule 13G/A filed with the SEC on February 18, 2014 by Steven T. Newby, as of December 31, 2013, Steven
T. Newby is the record and beneficial owner of 1,206,000 of our common stock. The address of Steven T. Newby is 12716
Split Creek Court, North Potomac, MD 20878
|
| (7) | Dr. Abrams was a Director until December 31, 2013. |
|
Certain Relationships and Related Transactions, and Director Independence
|
Related Party Transaction
The Audit Committee has been tasked with responsibility to review and approve related party transactions. The policy provides that management shall present related party transactions to the Audit Committee for approval.
We have not entered into any related party transactions that require disclosure in this Form 10-K.
89
Director Independence
The Board of Directors has determined that each of the current directors, listed below, is an "independent director" under the listing standards of the NASDAQ Global Market
Dr. Dan Kisner
Mr. Ken Galbraith
Mr. Donald Jewell
Mr. Frank Karbe
Ms. Peggy Phillips
In assessing the independence of the directors, the Board of Directors determines whether or not any director has a material relationship with us (either directly or as a partner, shareholder or officer of an organization that has a relationship with us). The Board of Directors considers all relevant facts and circumstances in making independence determinations, including the existence and scope of any commercial, industrial, banking, consulting, legal, accounting, charitable and familial relationships. Dr. Murray is not independent as he is Tekmira’s President and CEO.
Dr. Kisner was a Partner at Aberdare Ventures from 2003 until December 2010. Dr. Kisner is currently an independent consultant, and he does not solicit or provide consulting services to Tekmira. Dr. Kisner serves on the board of several other public biotechnology companies. He is independent under our categorical standards.
Mr. Galbraith was General Partner of Ventures West, prior to joining Five Corners Capital in 2013, where he is currently a General Partner. He currently serves on the Board of Directors of a number of private biotechnology companies. He is independent under our categorical standards.
Mr. Jewell spent 20 years with KPMG and was Managing Partner of the firm’s management consulting practice at the time of his departure. He is currently the managing director of a private Canadian holding company, Trustee of two Canadian private trusts, and on the Board of the trusts’ major operating companies. He is also on the Board of Directors of Lantic Inc. He is independent under our categorical standards.
Mr. Karbe was an investment banker for Goldman Sachs & Co., where he served most recently was Vice President in the healthcare group. He is currently the Executive Vice President and Chief Financial Officer of Exelixis Inc., a NASDAQ-listed biotechnology company. He is independent under our categorical standards.
Ms. Phillips was on the Board of Immunex and served as the Chief Operating Officer from 1999 until the company was acquired by Amgen in 2002. From 2003 until 2011, Ms. Phillips served on the Board of the Naval Academy Foundation. She is independent under our categorical standards.
|
Principal Accountant Fees and Services
|
Fees billed by external auditors
See Item 10. “
Directors, Executive Officers and Corporate Governance”
, subsection “Committees of our Board of Directors” for discussion on audit committee responsibilities.
The aggregate fees billed for professional services rendered by KPMG for the years ended December 31, 2013 and December 31, 2012 are as follows:
|
|
December 31,
2013
|
|
December 31,
2012
|
|||||
|
Audit fees
(1)
|
|
$
|
234,146
|
|
|
$
|
187,120
|
|
|
Audit-related fees
(2)
|
|
8,253
|
|
|
0
|
|
||
|
Tax fees
(3)
|
|
85,189
|
|
|
33,570
|
|
||
|
Other fees
|
|
0
|
|
|
0
|
|
||
|
Total fees
|
|
$
|
327,588
|
|
|
$
|
220,690
|
|
|
(1)
|
Quarterly reviews, review of SEC listing documents and review of prospectus.
|
|
(2)
|
Preliminary review of Sarbanes-Oxley internal controls
|
|
(3)
|
Tax compliance and tax planning.
|
90
Audit Committee Pre-Approval Policies and Procedures
The Company has complied with the Institute of Chartered Accountants of British Columbia (ICABC) Rules of Professional Conduct on auditor independence and Public Company Accounting Oversight Board (PCAOB) independence standards (the Rules) by adopting pre-approval policies and procedures for non-audit services to be provided by the Company’s auditors, KPMG LLP (KPMG). As they relate to public companies these Rules are very similar to the revised independence rules of the Securities and Exchange Commission (SEC) that became effective on May 6, 2003. They include prohibitions or restrictions on services that may be provided to audit clients and require that all services provided to a listed entity audit client, including its subsidiaries, be pre-approved by the client’s audit committee.
The Rules identify the following ten types of non-audit services that are deemed inconsistent with an auditors’ independence (“Prohibited Services”): bookkeeping or other services related to the audit client’s accounting records or financial statements; financial information systems design and implementation; appraisal or valuation services for financial reporting purposes; actuarial services for items recorded in the financial statements; internal audit outsourcing services; management functions; human resources; certain corporate finance and other services; legal services; certain expert services unrelated to the audit.
The Rules provide further details as to the specific nature of services within these categories that are prohibited. The Company and its subsidiaries will not engage KPMG to carry out any Prohibited Service. For services that are not prohibited the following pre-approval policies will apply:
|
•
|
The Audit Committee will pre-approve all audit services provided by KPMG through their recommendation of KPMG as shareholders’ auditors at the Company’s annual meeting and through the Audit Committee’s review of KPMG’s annual audit plan.
|
|
•
|
Annually, the Audit Committee will review a list of audit, audit-related, tax and other non-audit services and recommend pre-approval of these services for the upcoming year. Any additional requests will be addressed on a case-by-case specific engagement basis as described below. The Audit Committee will be informed quarterly of the services on the pre-approved list for which the auditor has been engaged.
|
|
•
|
All requests to engage KPMG for other services will be addressed on a case-by-case specific engagement basis. The Company employee making the request is to submit the request for service to the Company’s Executive Vice President, Finance. The request for service should include a description of the service, the estimated fee, a statement that the service is not a Prohibited Service and the reason KPMG is being engaged.
|
For additional requests for services where the aggregate fees are estimated to be less than or equal to $20,000, recommendations, in respect of each engagement, will be submitted by Executive Vice President, Finance, the official responsible for coordinating services with KPMG to the chairman of the Audit Committee for consideration and approval. The full Audit Committee will subsequently be informed of the service, at its next meeting. The engagement may commence upon approval of the chairman of the Audit Committee. For services where the aggregate fees are estimated to be greater than $20,000, recommendations, in respect of each engagement, will be submitted by the Company’s Executive Vice President, Finance to the full Audit Committee for consideration and approval, generally at its next meeting. The engagement may commence upon approval of the Committee.
Of the fees reported in the table above under the heading “Principal Accountant Fees and Services – Fees Billed by External Auditor”, none of the fees billed by KPMG LLP were approved by the Company’s audit committee pursuant to the de minimus exception provided by Section (c)(7)(i)(C) of Rule 2-01 of Regulation S-X.
91
|
Exhibits and Financial Statement Schedules
|
Financial Statements
See Index to Consolidated Financial Statements under Item 8 of Part II.
Financial Statement Schedules
None
SIGNATURES
Pursuant to the requirements of Section 13 or 15(d) of the Securities Exchange Act of 1934, the Registrant has duly caused this report to be signed on its behalf by the undersigned, thereunto duly authorized on March 27, 2014.
|
TEKMIRA PHARMACEUTICALS CORPORATION
|
||
|
By:
|
/s/ Mark Murray
|
|
|
Mark Murray
|
||
|
President and Chief Executive Officer
|
||
Pursuant to the requirements of the Securities Exchange Act of 1934, this report has been signed below by the following persons on behalf of the Registrant and in the capacities indicated on March 27, 2014.
|
Signatures
|
Capacity in Which Signed
|
|
|
/s/ Daniel Kisner
|
Director (Chairman)
|
|
|
Daniel Kisner
|
||
|
/s/ Mark Murray
|
President and Chief Executive Officer and Director
|
|
|
Mark Murray
|
(Principal Executive Officer)
|
|
|
/s/ Bruce Cousins
|
Executive Vice President, Finance and Chief Financial Officer
|
|
|
Bruce Cousins
|
(Principal Financial Officer and Accounting Officer)
|
|
|
/s/ Kenneth Galbraith
|
Director
|
|
|
Kenneth Galbraith
|
||
|
/s/ Donald Jewell
|
Director
|
|
|
Donald Jewell
|
||
|
/s/ Frank Karbe
|
Director
|
|
|
Frank Karbe
|
||
|
/s/ Peggy Phillips
|
Director
|
|
|
Peggy Phillips
|
92
INDEX TO THE EXHIBITS
|
Exhibit
Number
|
Description
|
||
|
2.1*
|
Subscription Agreement, between the Company and Alnylam Pharmaceuticals, Inc., dated March 28, 2008 (incorporated herein by reference to Exhibit 2.1 to the Registrant’s Annual Report on Form 20-F for the year ended December 31, 2010 filed with the SEC on June 3, 2011).
|
||
|
2.2*
|
Subscription Agreement, between the Company and Roche Finance Ltd., dated March 31, 2008 (incorporated herein by reference to Exhibit 2.2 to the Registrant’s Annual Report on Form 20-F for the year ended December 31, 2010 filed with the SEC on June 3, 2011).
|
||
|
3.1*
|
Notice of Articles and Articles of the Company (incorporated herein by reference to Exhibit 1.1 to the Registrant’s
Annual Report on Form 20-F for the year ended December 31, 2010 filed with the SEC on June 3, 2011).
|
||
|
3.2**
|
Amendment to the Articles and Articles of the Company dated May 14, 2013.
|
||
|
10.1†*
|
Amendment No. 1 to the Amended and Restated Agreement, between the Company (formerly Inex Pharmaceuticals Corporation) and Hana Biosciences, Inc., effective as of May 27, 2009 (incorporated herein by reference to Exhibit 4.1 to the Registrant’s Annual Report on Form 20-F for the year ended December 31, 2010 filed with the SEC on June 3, 2011).
|
||
|
10.2†*
|
Amended and Restated License Agreement, between Inex Pharmaceuticals Corporation and Hana Biosciences, Inc, dated April 30, 2007 (incorporated herein by reference to Exhibit 4.2 to the Registrant’s Amendment No. 1 to Form 20-F for the year ended December 31, 2010 filed with the SEC on January 31, 2012).
|
||
|
10.3†*
|
Sublicense Agreement, between Inex Pharmaceuticals Corporation and Alnylam Pharmaceuticals, Inc., dated January 8, 2007 (incorporated herein by reference to Exhibit 4.3 to the Registrant’s Amendment No. 1 to Form 20-F for the year ended December 31, 2010 filed with the SEC on January 31, 2012).
|
||
|
10.4†*
|
Amended and Restated License and Collaboration Agreement, between the Company and Alnylam Pharmaceuticals, Inc., effective as of May 30, 2008 (incorporated herein by reference to Exhibit 4.4 to the Registrant’s Amendment No. 1 to Form 20-F for the year ended December 31, 2010 filed with the SEC on January 31, 2012).
|
||
|
10.5†*
|
Amended and Restated Cross-License Agreement, between Alnylam Pharmaceuticals, Inc. and Protiva Biotherapeutics Inc., dated May 30, 2008 (incorporated herein by reference to Exhibit 4.5 to the Registrant’s Amendment No. 1 to Form 20-F for the year ended December 31, 2010 filed with the SEC on January 31, 2012).
|
||
|
10.6†*
|
License Agreement, between Inex Pharmaceuticals and Aradigm Corporation, dated December 8, 2004 (incorporated herein by reference to Exhibit 4.6 to the Registrant’s Amendment No. 1 to Form 20-F for the year ended December 31, 2010 filed with the SEC on January 31, 2012).
|
||
|
10.7†*
|
Settlement Agreement, between Sirna Therapeutics, Inc. and Merck & Co., Inc. and Protiva Biotherapeutics Inc. and Protiva Biotherapeutics (USA), Inc., effective as of October 9, 2007 (incorporated herein by reference to Exhibit 4.7 to the Registrant’s Amendment No. 1 to Form 20-F for the year ended December 31, 2010 filed with the SEC on January 31, 2012).
|
||
|
10.8†*
|
Development, Manufacturing and Supply Agreement, between the Company and Alnylam Pharmaceuticals, Inc., dated January 2, 2009 (incorporated herein by reference to Exhibit 4.8 to the Registrant’s Amendment No. 1 to Form 20-F for the year ended December 31, 2010 filed with the SEC on January 31, 2012).
|
||
|
10.9†*#
|
Executive Employment Agreement with Ian Mortimer, dated March 26, 2008 (incorporated herein by reference to Exhibit 4.9 to the Registrant’s Annual Report on Form 20-F for the year ended December 31, 2010 filed with the SEC on June 3, 2011).
|
||
|
10.10*#
|
Executive Employment Agreement with Ian MacLachlan, dated May 30, 2008 (incorporated herein by reference to Exhibit 4.10 to the Registrant’s Annual Report on Form 20-F for the year ended December 31, 2010 filed with the SEC on June 3, 2011).
|
||
93
|
Exhibit
Number
|
Description
|
||
|
10.11*#
|
Executive Employment Agreement with Mark Murray, dated May 30, 2008 (incorporated herein by reference to Exhibit 4.11 to the Registrant’s Annual Report on Form 20-F for the year ended December 31, 2010 filed with the SEC on June 3, 2011).
|
||
|
10.12*#
|
Executive Employment Agreement with Peter Lutwyche, dated January 1, 2009 (incorporated herein by reference to Exhibit 4.12 to the Registrant’s Annual Report on Form 20-F for the year ended December 31, 2010 filed with the SEC on June 3, 2011).
|
||
|
10.13*#
|
Share Option Plan amended through May 12, 2009 (including form stock option agreements) (incorporated herein by reference to Exhibit 4.13 to the Registrant’s Annual Report on Form 20-F for the year ended December 31, 2010 filed with the SEC on June 3, 2011).
|
||
|
10.14*
|
Lease Agreement with Canada Lands Company CLC Limited dated December 15, 1997, as amended (incorporated herein by reference to Exhibit 4.14 to the Registrant’s Annual Report on Form 20-F for the year ended December 31, 2010 filed with the SEC on June 3, 2011).
|
||
|
10.15*#
|
Form of Indemnity Agreement (incorporated herein by reference to Exhibit 4.15 to the Registrant’s Annual Report on Form 20-F for the year ended December 31, 2010 filed with the SEC on June 3, 2011).
|
||
|
10.16*
|
Award Contract with USASMDC/ARSTRAT effective date July 14, 2010 (incorporated herein by reference to Exhibit 4.16 to the Registrant’s Annual Report on Form 20-F for the year ended December 31, 2010 filed with the SEC on June 3, 2011).
|
||
|
10.17†*
|
License Agreement between the University of British Columbia and Inex Pharmaceuticals Corporation executed on July 30, 2001 (incorporated herein by reference to Exhibit 4.17 to the Registrant’s Annual Report on Form 20-F for the year ended December 31, 2010 filed with the SEC on June 3, 2011).
|
||
|
10.18†*
|
Amendment Agreement between the University of British Columbia and Inex Pharmaceuticals Corporation dated July 11, 2006 (incorporated herein by reference to Exhibit 4.18 to the Registrant’s Annual Report on Form 20-F for the year ended December 31, 2010 filed with the SEC on June 3, 2011).
|
||
|
10.19†*
|
Second Amendment Agreement between the University of British Columbia and Inex Pharmaceuticals Corporation dated January 8, 2007 (incorporated herein by reference to Exhibit 4.19 to the Registrant’s Annual Report on Form 20-F for the year ended December 31, 2010 filed with the SEC on June 3, 2011).
|
||
|
10.20†*
|
Consent Agreement of the University of British Columbia to Inex/Alnylam Sublicense Agreement dated January 8, 2007 (incorporated herein by reference to Exhibit 4.20 to the Registrant’s Annual Report on Form 20-F for the year ended December 31, 2010 filed with the SEC on June 3, 2011).
|
||
|
10.21†*
|
Amendment No. 2 to the Amended and Restated Agreement, between the Company (formerly Inex Pharmaceuticals Corporation) and Hana Biosciences, Inc., effective as of September 20, 2010 (incorporated herein by reference to Exhibit 4.21 to the Registrant’s Annual Report on Form 20-F for the year ended December 31, 2010 filed with the SEC on June 3, 2011).
|
||
|
10.22†*
|
License and Collaboration Agreement between the Company and Halo-Bio RNAi Therapeutics, Inc. as of August 24, 2011 (incorporated herein by reference to Exhibit 4.22 to the Registrant’s Annual Report on Form 20-F for the year ended December 31, 2011 filed with the SEC on March 27, 2012).
|
||
|
10.23*
|
Loan Agreement with Silicon Valley Bank dated as of December 21, 2011 (incorporated herein by reference to Exhibit 4.23 to the Registrant’s Annual Report on Form 20-F for the year ended December 31, 2011 filed with the SEC on March 27, 2012).
|
||
|
10.24*#
|
Employment Agreement with Paul Brennan dated August 24, 2010 (incorporated herein by reference to Exhibit 4.24 to the Registrant’s Annual Report on Form 20-F for the year ended December 31, 2011 filed with the SEC on March 27, 2012).
|
||
|
10.25*#
|
Tekmira 2011 Omnibus Share Compensation Plan approved by shareholders on June 22, 2011 (incorporated herein by reference to Exhibit 4.25 to the Registrant’s Annual Report on Form 20-F for the year ended December 31, 2011 filed with the SEC on March 27, 2012).
|
||
|
10.26†*
|
Settlement Agreement and General Release, by and among Tekmira Pharmaceuticals Corporation, Protiva Biotherapeutics Inc., Alnylam Pharmaceuticals, Inc., and AlCana Technologies, Inc., dated November 12, 2012 (incorporated herein by reference to Exhibit 4.26 to the Registrant’s Annual Report on Form 20-F for the year ended December 31, 2012 filed with the SEC on March 27, 2013).
|
||
94
|
Exhibit
Number
|
Description
|
||
|
10.27†*
|
Cross-License Agreement by and among Alnylam Pharmaceuticals, Inc., Tekmira Pharmaceuticals Corporation and Protiva Biotherapeutics Inc., dated November 12, 2012(incorporated herein by reference to Exhibit 4.27 to the Registrant’s Annual Report on Form 20-F for the year ended December 31, 2012 filed with the SEC on March 27, 2013).
|
||
|
10.28†*
|
License Agreement by and among Protiva Biotherapeutics Inc. and Marina Biotech, Inc. dated November 28, 2012 (incorporated herein by reference to Exhibit 4.28 to the Registrant’s Annual Report on Form 20-F for the year ended December 31, 2012 filed with the SEC on March 27, 2013).
|
||
|
10.29*#
|
Employment Agreement with Diane Gardiner dated March 1, 2013 (incorporated herein by reference to Exhibit 4.29 to the Registrant’s Annual Report on Form 20-F for the year ended December 31, 2012 filed with the SEC on March 27, 2013).
|
||
|
10.30**#
|
Employment Agreement with Mark Kowalski dated August 12, 2013
|
||
|
10.31**#
|
Employment Agreement with Bruce Cousins dated October 7, 2013
|
||
|
10.32††**
|
Services Agreement by and among Protiva Biotherapeutics Inc., Protiva Agricultural Development Company Inc. and Monsanto Company dated January 12, 2014
|
||
|
10.33††**
|
Option Agreement by and among Tekmira Pharmaceuticals Corporation, Protiva Biotherapeutics Inc., Protiva Agricultural Development Company Inc. and Monsanto Canada Inc. dated January 12, 2014
|
||
|
10.34††**
|
License and Services Agreement by and among Protiva Biotherapeutics Inc., Protiva Agricultural Development Company Inc. and Tekmira Pharmaceuticals Corporation dated January 12, 2014
|
||
|
21.1**
|
List of Subsidiaries (incorporated herein by reference to Exhibit 8.1 to the Registrant’s Annual Report on Form 20-F for the year ended December 31, 2010 filed with the SEC on June 3, 2011).
|
||
|
23.1**
|
Consent of KPMG LLP, an Independent Registered Public Accounting Firm | ||
| 31.1** |
Certification of Chief Executive Officer pursuant to Rule 13a-14 or 15d-14 of the Securities Exchange Act of 1934, as adopted pursuant to Section 302 of the Sarbanes-Oxley Act of 2002
|
||
| 31.2** |
Certification of Chief Financial Officer pursuant to Rule 13a-14 or 15d-14 of the Securities Exchange Act of 1934, as adopted pursuant to Section 302 of the Sarbanes-Oxley Act of 2002
|
||
| 32.1** |
Certification of Chief Executive Officer pursuant to 18 U.S.C. Section 1350, as adopted pursuant to Section 906 of the Sarbanes-Oxley Act of 2002.
|
||
| 32.2** |
Certification of Chief Financial Officer pursuant to 18 U.S.C. Section 1350, as adopted pursuant to Section 906 of the Sarbanes-Oxley Act of 2002.
|
||
|
101.INS**
|
XBRL Instance Document
|
||
| 101.SCH** |
XBRL Taxonomy Extension Schema Document
|
||
| 101.CAL** |
XBRL Taxonomy Extension Calculation Linkbase Document
|
||
| 101.DEF** |
XBRL Taxonomy Extension Definition Linkbase Document
|
||
| 101.LAB** |
XBRL Taxonomy Extension Label Linkbase Document
|
||
| 101.PRE** |
XBRL Taxonomy Extension Presentation Linkbase Document
|
||
________________
|
*
|
Previously filed.
|
|
**
|
Filed herewith.
|
|
†
|
Confidential treatment granted as to portions of this exhibit.
|
|
††
|
Confidential treatment has been requested as to portions of this exhibit.
|
|
#
|
Management contract or compensatory plan or arrangement.
|
95
TABLE OF CONTENTS
Part IItem 1. BusinessItem 1A. Risk FactorsItem 1B. Unresolved Staff CommentsItem 2. PropertiesItem 3. Legal ProceedingsItem 4. Mine Safety DisclosuresPart IIItem 5. Market For Registrant S Common Equity, Related Stockholder Matters and Issuer Purchases Of Equity SecuritiesItem 6. Selected Consolidated Financial DataItem 7. Management S Discussion and Analysis Of Financial Condition and Results Of OperationsItem 7A. Quantitative and Qualitative Disclosures About Market RiskItem 8. Financial Statements and Supplementary DataItem 9. Changes in and Disagreements with Accountants on Accounting and Financial DisclosureItem 9A. Controls and ProceduresItem 9B. Other InformationPart IIIItem 10. Directors, Executive Officers and Corporate GovernanceItem 11. Executive CompensationItem 12. Security Ownership Of Certain Beneficial Owners and Management and Related Stockholder MattersItem 13. Certain Relationships and Related Transactions, and Director IndependenceItem 14. Principal Accountant Fees and ServicesPart IVItem 15. Exhibits and Financial Statement Schedules