ARBUTUS BIOPHARMA CORP
10-Ks,20-Fs and 10-Qs
|
|
|
|
|
|
|
|
|
|
|
|
|
|
|
|
|
|
|
|
|
|
|
|
|
|
|
|
|
|
|
|
|
|
|
|
|
|
|
|
|
|
|
|
|
|
|
SECURITIES AND EXCHANGE COMMISSION
Washington, D.C. 20549
Form 10-K
ý
ANNUAL REPORT PURSUANT TO SECTION 13 OR 15(d) OF THE SECURITIES EXCHANGE ACT OF 1934
For the Fiscal Year Ended December 31, 2014
OR
o
TRANSITION REPORT PURSUANT TO SECTION 13 OR 15(d) OF THE SECURITIES EXCHANGE ACT OF 1934
For the Transition Period from to
Commission File Number: [001-34949]
Tekmira Pharmaceuticals Corporation
(Exact Name of Registrant as Specified in Its Charter)
|
British Columbia, Canada
|
980597776
|
|
|
(State or Other Jurisdiction of
Incorporation or Organization)
|
(I.R.S. Employer
Identification No.)
|
|
|
100-8900 Glenlyon Parkway, Burnaby, BC V5J 5J8
(Address of Principal Executive Offices)
|
||
|
604-419-3200
(Registrant’s Telephone Number, Including Area Code):
|
||
|
Securities registered pursuant to Section 12(b) of the Act:
|
||
|
Title of Each Class
|
Name of Each Exchange on Which Registered
|
|
|
Common shares, without par value
|
The NASDAQ Stock Market LLC
|
|
|
Securities registered pursuant to Section 12(g) of the Act:
|
||
Indicate by check mark if the registrant is a well-known seasoned issuer, as defined in Rule 405 of the Securities Act. Yes
o
No
ý
Indicate by check mark if the registrant is not required to file reports pursuant to Section 13 or Section 15(d) of the Act. Yes
o
No
ý
Indicate by check mark whether the registrant (1) has filed all reports required to be filed by Section 13 or 15(d) of the Securities Exchange Act of 1934 during the preceding 12 months (or for such shorter period that the registrant was required to file such reports), and (2) has been subject to such filing requirements for the past 90 days. Yes
ý
No
o
Indicate by check mark whether the registrant has submitted electronically and posted on its corporate Web site, if any, every Interactive Data File required to be submitted and posted pursuant to Rule 405 of Regulation S-T during the preceding 12 months (or for such shorter period that the registrant was required to submit and post such files). Yes
ý
No
o
Indicate by check mark if disclosure of delinquent filers pursuant to Item 405 of Regulation S-K is not contained herein, and will not be contained, to the best of registrant’s knowledge, in definitive proxy or information statements incorporated by reference in Part III of this Form 10-K or any amendment to this Form 10-K.
o
Indicate by check mark whether the registrant is a large accelerated filer, an accelerated filer, a non-accelerated filer, or a smaller reporting company. See the definitions of “large accelerated filer,” “accelerated filer” and “smaller reporting company” in Rule 12b-2 of the Exchange Act. (Check one):
|
Large accelerated filer
o
|
Accelerated filer
ý
|
Non-accelerated filer
o
|
Smaller reporting company
o
|
|
(Do not check if a smaller reporting company)
|
|||
Indicate by check mark whether the registrant is a shell company (as defined in Rule 12b-2 of the Exchange Act). Yes
o
No
ý
DOCUMENTS INCORPORATED BY REFERENCE
Portions of the registrant’s definitive proxy statement for its 2015 annual meeting of stockholders, which the registrant intends to file pursuant to Regulation 14A with the Securities and Exchange Commission not later than 120 days after the registrant’s fiscal year end of December 31, 2014, are incorporated by reference into Part III of this Form 10-K.
2
TEKMIRA PHARMACEUTICALS CORPORATION
TABLE OF CONTENTS
|
Page
|
||
3
This annual report on Form 10-K contains forward-looking information and forward-looking statements (collectively, forward-looking statements) within the meaning of applicable securities laws. All statements other than statements relating to historical matters should be considered forward-looking statements. When used in this report, the words “believe,” “expect,” “plan,” “anticipate,” “estimate,” “predict,” “may,” “could,” “should,” “intend,” “will,” “target,” “goal” and similar expressions are intended to identify forward-looking statements, although not all forward-looking statements contain these words.
Forward-looking statements in this annual report include statements about Tekmira’s strategy, future operations, clinical trials, prospects and the plans of management; RNAi (ribonucleic acid interference) and Hepatitis B virus product development programs; the effects of Tekmira’s products on the treatment of cancer, chronic Hepatitis B infection, infectious disease, alcohol use disorder, and other diseases; the potential of RNAi to generate a new class of therapies; Tekmira’s strategic focus on, and phased clinical plan of combination therapies for, curing HBV; the composition and roles of the management team; Tekmira’s continued listing on NASDAQ; the research benefits of the collaborating with The Baruch S. Blumberg Institute; clinical trial goals and milestones in product pipelines expected to be reached in the second half of 2015 and beyond, including the results of a TKM-HBV Phase I clinical trial, a multi-dosing TKM-HBV trial in the second half of 2015, filing an IND or equivalent for OCB-030 and initiating a study by year end 2015, the initiation of CYT-003 preclinical studies in 2015, filing an IND with the FDA or an equivalent filing with foreign regulatory authorities and initiating Phase 1 studies with one of the capsid assembly inhibitors in 2016, results from surface antigen secretion inhibitors and filing an IND or its equivalent in another territory for a lead compound in 2016, identifying orally active small molecule human STING agonists that possess the desired characteristics to progress into human clinical studies, filing an IND with the FDA or its equivalent in another territory for cccDNA formation inhibitors in 2017, and inhibiting the formation of new virus and subviral particles from cccDNA by controlling cccDNA transcription; the expected efficacy of Tekmira’s various HBV therapies; Tekmira’s continued commitment to its non-HBV assets, both clinical and preclinical, and timing of expected results; non-HBV clinical trial milestones, including final data from GI-NET and ACC studies in the second half of 2015, an HCC Phase I/II clinical trial, and results from a TKM-Ebola-Guinea study in the second half of 2015; non-HBV preclinical trial milestones, including filing an investigational new drug application for TKM-HTG in the second half of 2015, partnering or external funding for TKM-ALDH, and filing an investigational new drug application for TKM-HTG in the second half of 2015; the expected efficacy of Tekmira’s various non-HBV products; the continuation of LNP technology as an important cornerstone of Tekmira’s business development activities, and the expected yield from the latest generation of the platform; the expected return from strategic alliances, licensing agreements, and research collaborations, such as the potential value of a transaction with Monsanto Company, a grant from the U.S. National Institutes of Health, and transactions with Enantigen Therapeutics, Inc.; the potential quantum of value of the transactions contemplated in the Monsanto option agreement; funding and licensing of Blumberg’s HBV research; the sufficiency of space under Tekmira’s head office lease; Tekmira’s intent to retain earnings, if any, to finance the growth and development of their business and not to pay dividends or to make any other distributions in the near future; a rolling Phase II clinical program for HBV, using an iterative process of combination drug candidates, leading into Phase III clinical trials; the expansion of the HBV pipeline through internal development, acquisitions and in-licenses; the advancement of the RNAi product pipeline either internally or with partners, with a focus on realizing the long term value of these assets; arbitration proceedings with Alnylam Pharmaceuticals, Inc. in connection with ALN-VSP; arbitration proceedings with the University of British Columbia in connection with alleged unpaid royalties; anticipated royalty receipts; statements with respect to revenue and expense fluctuation and guidance; and the quantum and timing of potential funding.
With respect to the forward-looking statements contained in this annual report, Tekmira has made numerous assumptions. While Tekmira considers these assumptions to be reasonable, these assumptions are inherently subject to significant business, economic, competitive, market and social uncertainties and contingencies.
Our actual results could differ materially from those discussed in the forward-looking statements as a result of a number of important factors, including the factors discussed in this annual report on Form 10-K, including those discussed in Item 1A of this report under the heading “Risk Factors,” and the risks discussed in our other filings with the Securities and Exchange Commission and Canadian Securities Regulators. Readers are cautioned not to place undue reliance on these forward-looking statements, which reflect management’s analysis, judgment, belief or expectation only as of the date hereof. We explicitly disclaim any obligation to update these forward-looking statements to reflect events or circumstances that arise after the date hereof, except as required by law.
4
|
Item
1.
|
Business
|
Overview
Following our recent business combination with OnCore Biopharma, Inc., (“OnCore”) we intend to focus our efforts on discovering, developing and commercializing a cure for patients suffering from chronic HBV infection, a disease of the liver caused by the hepatitis B virus. Our strategy incorporates our heritage and expertise in RNAi combined with the newly acquired assets and expertise through the OnCore merger.
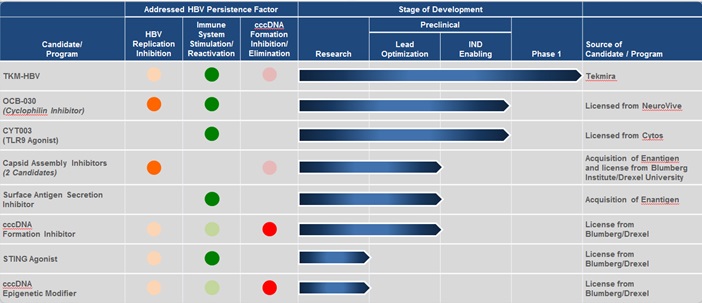
We believe that, as a result of the merger, Tekmira will be well positioned to capitalize on the HBV global market opportunity. Our current HBV pipeline consists of 9 drugs and drug candidates, with eight unique mechanisms of action. Our unique strategy is to target the three pillars we believe are necessary to deliver an HBV cure, including: (i) suppressing HBV viral replication, (ii) restoring host response by suppressing HBsAg or activating/stimulating the host immune system directed at HBV and (iii) eliminating covalently closed circular DNA (cccDNA),
the reservoir of viral genomic material
. We believe that our chances for success in HBV are increased, and risk is mitigated, by having a portfolio of assets targeting these three strategies. Most importantly, we believe combination therapies are the key to HBV treatment and a potential cure. We believe that clinical development can be accelerated when multiple components of a combination therapy regimen are controlled by the same company and therefore we have retained exclusive worldwide development and commercialization rights to all of our drug candidates and programs in HBV.
Recognized as a world leader in RNA interference (RNAi) delivery technology, Tekmira is a biopharmaceutical company that since inception has focused on advancing novel RNAi-based therapeutics. RNA interference is considered one of the most important discoveries in the field of biomedical science in the last decade. RNAi has the potential to generate a new class of therapies that take advantage of the body’s own natural processes to silence genes and, by extension, treat serious human diseases that often rely on the production of certain proteins at the genetic level. With this ability to eliminate disease-causing proteins from cells, RNAi therapies represent opportunities for therapeutic intervention that have not been achievable with conventional therapeutics.
Tekmira’s proprietary LNP Delivery Platform allows for the successful delivery and enablement of RNAi drugs. By encapsulating the RNAi trigger molecules in lipid nanoparticles (LNP); our LNP technology enables efficient delivery and uptake into target cells. Our LNP technology represents the most widely adopted delivery method in RNAi. To date, it has enabled eight clinical trials and has been administered to more than 250 patients. Recent results demonstrate that multi-dosing with LNP technology has been well-tolerated with treatments out to one year.
With anti-viral, oncology, and metabolic product platforms, our RNAi product pipeline is focused on areas where there is a significant medical need and commercial opportunity. Tekmira’s clinical and preclinical programs include RNAi therapeutics addressing chronic hepatitis B virus (HBV) infection, cancer indications such as gastrointestinal neuroendocrine tumors and adrenocortical carcinoma, and metabolic disorders such as hypertriglyceridemia.
Tekmira’s LNP technology also enables our partners’ development programs and pipelines, providing us with non-dilutive funding to support its internal therapeutic development programs. Because LNP can enable a wide variety of nucleic acid triggers, including messenger RNA (mRNA), we continue to seek new product development and partnering opportunities based on our industry-leading delivery expertise.
Corporate History
Tekmira was incorporated pursuant to the British Columbia Business Corporations Act (BCBCA), on October 6, 2005, and commenced active business on April 30, 2007, when Tekmira and its parent company, Inex Pharmaceuticals Corporation (“Inex”) were reorganized under a statutory plan of arrangement (the “Reorganization”) completed under the provisions of the BCBCA. The Reorganization saw Inex’s entire business transferred to and continued by Tekmira. In this discussion of corporate history the terms “we”, “us” and “our” refer to the business of Inex for the time prior to the Reorganization and the business of Tekmira for the time after the Reorganization.
Since 1992, we have focused on developing lipid delivery technologies for different classes of therapeutic agents, including chemotherapy drugs and nucleic acid drugs. Our technology was applied to the development of Marqibo®, a liposomal formulation of the chemotherapy drug vincristine, which was subsequently licensed to Hana Biosciences in 2006. Under this legacy agreement, our current licensee, Spectrum Pharmaceuticals, Inc., has a license to develop Marqibo, along with two other liposomal chemotherapy products.
Since 2005, Protiva Biotherapeutics, Inc. (“Protiva”) and Inex began separately developing lipid nanoparticle delivery technology for a class of nucleic acid drugs called RNAi trigger molecules that mediate RNA interference, or RNAi, and both Protiva and Inex initiated separate research collaborations with Alnylam Pharmaceuticals, Inc. (“Alnylam”) to combine Alnylam’s expertise in RNAi trigger molecules or “trigger” technologies with each of Protiva’s and Inex’s separate proprietary knowledge of RNAi delivery technology. In January 2007, Inex entered into a License and Collaboration Agreement with Alnylam where Inex obtained, among other things, a worldwide license to certain Alnylam intellectual property for the research, development, manufacturing and commercialization of RNAi products for the treatment of human diseases, and Alnylam obtained exclusive access to Inex’s delivery technology for siRNA and microRNA. In August 2007, Protiva entered into a Cross License Agreement with Alnylam where Protiva obtained, among other things, a worldwide license to certain Alnylam intellectual property for the research, development, manufacturing and commercialization of RNAi products for the treatment of human diseases and Alnylam obtained non-exclusive access to Protiva’s delivery technology for siRNA and microRNA.
In 2008, Inex and Protiva entered into a business combination. At the time of its acquisition, Protiva was a private, venture-backed company incorporated under the laws of Canada and since 2003 had focused its business on developing lipid nanoparticle (LNP) delivery technology for RNAi, a business similar to Inex’s. Since commencing work on the delivery of RNAi triggers, Protiva has filed several patent applications covering different LNP formulations, manufacturing processes, and RNAi trigger design to remove any immune stimulatory properties. At the time of its acquisition, Protiva had licensed its LNP technology on a non-exclusive basis to Alnylam and (“Merck”) and had access to Alnylam’s intellectual property for the research, development and commercialization of RNAi products.
5
The business combination with Protiva was completed through an acquisition, under a share purchase agreement, of all the then outstanding shares of Protiva in consideration for common shares of Tekmira. Protiva is now Tekmira’s wholly-owned subsidiary. Concurrent with the completion of the business combination with Protiva, we entered into initial research agreements with F. Hoffman-La Roche Ltd and Hoffman La-Roche Inc., which we refer to together as (“Roche”), and completed private placement investments of $5.0 million with Alnylam and $5.0 million with an affiliate of Roche. Since the completion of the business combination with Protiva, Tekmira has focused on advancing RNAi therapeutic products and providing LNP delivery technology to pharmaceutical partners and collaborators using Protiva’s lipid technology.
In March of 2015, Tekmira completed a merger whereby OnCore Biopharma, Inc. (“OnCore”) became a wholly owned subsidiary of Tekmira. As described in further detail below, Tekmira’s business strategy going forward intends to focus on discovering, developing and commercializing therapeutics targeting chronic hepatitis B infection, as well as continuing to advance our non-HBV programs as well.
Tekmira is headquartered in Vancouver, Canada, and it opened an office in Seattle, USA in May 2014. As a result of the merger with OnCore, we also have offices in Doylestown, Pennsylvania, USA.
Business Combination between Tekmira and OnCore
On March 4, 2015, Tekmira completed a business combination pursuant to which OnCore became a wholly-owned subsidiary of Tekmira. This combined company intends to focus on developing a curative regimen for hepatitis B virus (HBV) patients by combining multiple therapeutic approaches. The transaction was approved by 99.5% of votes cast by Tekmira shareholders voting at a Special Meeting held on Tuesday, March 3, 2015, and representing 51.2% of Tekmira’s common shareholders. In connection with the transaction, Tekmira issued 23,973,315 common shares to the shareholders of OnCore in exchange for their OnCore securities, and OnCore became a wholly-owned subsidiary of Tekmira.
The new company's management team includes Mark J. Murray, PhD, President and Chief Executive Officer; Patrick T. Higgins, Chief Operating Officer; Bruce Cousins, Chief Financial Officer; Michael J. Sofia, PhD, Chief Scientific Officer; and Michael J. Abrams, PhD, Chief Discovery Officer. William T. Symonds, PharmD, is the Chief Development Officer and will lead the clinical development of the portfolio.
Vivek Ramaswamy is the Chairman of the Board for Tekmira. The remaining Board members are Dr. Mark J. Murray, Mr. Herbert Conrad, Mr. Richard Henriques, Dr. Keith Manchester, Mr. Frank Karbe, and Dr. William Symonds.
The business combination involving Tekmira and OnCore brings together each of Tekmira’s and OnCore’s broad expertise in antiviral drug development, Tekmira’s clinic-ready HBV RNAi therapeutic and OnCore’s existing HBV programs to build a portfolio of compounds with a long term goal of eradicating HBV. We believe that, as a result of the merger, Tekmira will have a comprehensive HBV pipeline of drugs, and drug candidates, and be positioned to capitalise on the HBV global market opportunity. With eight unique mechanisms in development, our pipeline targets the three pillars we believe are necessary to deliver an HBV cure, including: (i) suppressing HBV viral replication, (ii) restoring host response by suppressing Hepatitis B surface antigen (HBsAg) or activating/stimulating the host immune system directed at HBV and (iii) eliminating covalently closed circular DNA (cccDNA). We believe that our chances for success in HBV are increased, and risk is mitigated, by having a portfolio of assets targeting these three strategies. Most importantly, we believe combination therapies are the key to HBV treatment and a potential cure. We believe that clinical development can be accelerated when multiple components of a combination therapy regimen are controlled by the same company, and therefore we have retained exclusive worldwide development and commercialization rights to all of our drug candidates and programs in HBV.
While we intend to focus our business strategy on HBV, we also believe that value resides in our other non-HBV programs and with our Lipid Nanoparticle (LNP) technology. We plan to determine what we believe are the best strategies for optimizing the value of the remaining assets. We also see significant value in the collaborations Tekmira has established to date, and plan to continue to work closely with and support our partners using Tekmira’s RNAi technology.
Voluntary Delisting from the Toronto Stock Exchange (TSX)
Our common shares were voluntarily delisted from the Toronto Stock Exchange ("TSX") as of Tuesday, March 3, 2015.
6
RNA Interference
In the last decade, RNAi has become one of the most important innovations in the field of drug discovery and development. In 2006 the scientists who discovered the mechanisms for RNAi were awarded the Nobel Prize in Physiology or Medicine.
We believe that RNAi has the potential to generate a new class of safer therapeutics. RNAi therapeutics take advantage of the body’s own natural processes to eliminate specific gene-products or proteins in the cell. Synthetic RNAi trigger molecules are developed as drugs that specifically suppress the production of disease-associated proteins through the RNAi mechanism. RNAi trigger molecules are designed using the gene sequence coding for the target protein. RNAi -based drugs are typically small synthetic nucleic acid molecules. When RNAi triggers are introduced into the cell they are incorporated into an RNA-induced silencing complex (RISC), which interacts specifically with messenger RNA (mRNA) coding for the target protein. mRNA are cleaved in a sequence specific manner and then destroyed, preventing production of the target protein. Importantly, this process is catalytic and RISC associated RNAi triggers can remain stable inside the cell for weeks, destroying many more copies of the target mRNA and maintaining target protein suppression for extended periods of time.
Potential of RNAi Therapeutics
The development of RNAi drugs allows for a completely novel approach to treating disease, which is why RNAi is considered one of the most promising and rapidly advancing frontiers in drug discovery. While there are no RNAi therapeutics approved for commercial use, there are a number of RNAi products currently in human clinical trials. RNAi products are broadly applicable as they can eliminate the production of disease-causing proteins from cells, creating opportunities for therapeutic intervention that have not been achievable with conventional drugs. Development of RNAi therapeutic products is currently limited by the instability of the RNAi trigger molecules in the bloodstream and the inability of these molecules to access target cells or tissues following administration. Delivery technology is necessary to protect these drugs in the bloodstream to allow efficient delivery and cellular uptake by the target cells.
Tekmira’s Lipid Nanoparticle (LNP) Delivery Technology
Tekmira has developed a proprietary delivery platform called Lipid Nanoparticle or LNP. This platform has become the gold-standard in RNAi development, establishing Tekmira as a leader in this new area of innovative medicine.
Our proprietary LNP delivery technology allows for the successful encapsulation of RNAi trigger molecules in lipid nanoparticles (LNP) administered intravenously, which travel through the bloodstream to target tissues or disease sites. LNPs are designed to protect the triggers, and stay in the circulation long enough to accumulate at disease sites, such as the liver or cancerous tumors. LNPs are then taken up into the target cells by a process called endocytosis. Subsequent activation by the changing environment inside the cell causes the LNP to release the trigger molecules, which can then successfully mediate RNAi.
In preclinical studies, Tekmira’s LNP technology has demonstrated how it can overcome the limitations of RNAi drug delivery, enabling efficient and selective “gene silencing” or reduction of certain target proteins. We believe that Tekmira is well positioned to benefit from the need for effective delivery technology for RNAi therapeutics to reach specific disease sites. Using our LNP technology we, along with our partners, are advancing several RNAi therapeutics across a range of indications for serious conditions with limited treatment options.
7
Lipid Nanoparticle (LNP)-Enabled Delivery and Mechanism of RNA Interference

* RISC is an RNA-induced silencing complex that incorporates one strand of siRNA or microRNA
Today, our LNP technology represents the most widely adopted delivery technology in RNAi, which has enabled eight clinical trials and has been administered to more than 250 human subjects. Because LNP can enable a wide variety of nucleic acid triggers, including mRNA, we continue to see new product development and partnering opportunities based on our industry-leading delivery expertise.
In October 2013, we presented new preclinical data at the International mRNA Health Conference in Tubingen, Germany, demonstrating that mRNA when encapsulated and delivered using Tekmira’s LNP technology can be effectively delivered and expressed in the liver in tumors and other specific tissues of therapeutic interest.
Our Product Pipeline
HBV-Focused Pipeline
Hepatitis B virus (HBV) causes the most common serious liver infection in the world. The World Health Organization (WHO) estimates that 350 million people worldwide are chronically infected, and other estimates suggest this could include up to 1.4 million people in the United States. Individuals chronically infected with HBV are at an increased risk of developing significant liver disease, including cirrhosis, or permanent scarring of the liver, as well as liver failure and hepatocellular carcinoma (HCC) or liver cancer. According to the Hepatitis B Foundation, HBV is the cause of up to 80% of liver cancers. Individuals with liver cancer typically have a five-year survival rate of only 15%. The WHO estimates that more than 780,000 people die every year due to the consequences of hepatitis B virus disease.
Our extensive experience in antiviral drug development has been applied to our TKM-HBV program to develop an RNAi therapeutic for chronic hepatitis B infection. Small molecule nucleotide therapy has been the standard of care for chronic HBV infected patients. However, many of these patients continue to express a viral protein called HBV surface antigen (HBsAg). This protein causes inflammation in the liver leading to cirrhosis and, in some cases, HCC and death.
As a result of our merger whereby OnCore became a wholly owned subsidiary of Tekmira, our pipeline of assets has expanded beyond therapeutics being developed with RNAi technology, particularly with respect to HBV. In HBV, we now have what we believe is an industry-leading pipeline focused on finding a cure for chronic HBV infection. Our belief is that to achieve an HBV cure, a combination of products that affect the three main drivers of HBV persistence need to be utilized. Specifically, this means that to be successful, we believe we need to have products that address antiviral replication, immune reactivation and reduce the pool of cccDNA.
Once multiple compounds within the portfolio with sufficient anti-HBV activity have been identified, we intend, subject to discussions with regulatory authorities, to conduct a rolling Phase II clinical program. These studies will likely evaluate combinations of two or more drug candidates in small cohorts of patients with chronic HBV infection to identify active combinations and those that do not have sufficient antiviral activity. We expect to use these results to adaptively design additional treatment regimens for the next cohorts. We also plan to evaluate different treatment durations to determine the optimal duration for a finite duration therapy. We plan to continue this iterative process until we select combination therapy regimens and treatment durations to conduct Phase III clinical trials intended to ultimately support regulatory filings for marketing approval. A graphic summary of our HBV products is set forth below.
8
Note:
The solid circles represent the mechanism that "directly" impacts the given persistence factor. The shaded circle shows "indirect" effects of a given mechanism
.
We intend to continue to expand our HBV pipeline through internal development, acquisitions and in-licenses. We believe that a major engine for internal innovation is the collaboration entered into by OnCore, which is now a wholly owned subsidiary on Tekmira, with The Baruch S. Blumberg Institute, (“Blumberg”) one of the leading non-profit research institutes in the world focused on HBV. We believe that this collaboration will provide us with access to cutting-edge research in new target identification, assay development, mechanism of action studies and lead-finding efforts focused on hepatitis B virus. This relationship also provides us with access to research that we believe is equal to, or surpasses that of other biotechnology or pharmaceutical companies, and can add value to our current and future research and development efforts in HBV.
TKM-HBV is designed to address an unmet medical need and eliminate HBsAg expression in patients chronically infected with HBV. Reducing HBsAg is thought to be a key prerequisite to enable a patient’s immune system to raise an adequate antibody response against the virus. The ability of TKM-HBV to inhibit numerous viral elements in addition to HBsAg increases the likelihood of successfully controlling the viral infection.
TKM-HBV is being developed as a multi-component RNAi therapeutic that simultaneously targets three sites on the HBV genome. Targeting three distinct and highly conserved sites on the HBV genome is intended to facilitate potent knockdown of all viral mRNA transcripts and viral antigens across a broad range of HBV genotypes and reduce the risk of developing antiviral resistance. The goal is for TKM-HBV to be administered without prophylactic steroid treatment.
We presented results from our preclinical studies at the 10th Annual Meeting of the Oligonucleotide Therapeutics Society Meeting held in San Diego, California, on October 15, 2014. Among the results reported is the potent and rapid reduction in HBsAg demonstrated by TKM-HBV in several well-validated models. In these models, TKM-HBV treatment resulted in reductions in both intrahepatic and serum HBsAg, as well as reductions in HBV DNA, covalently closed circular DNA (cccDNA), Hepatitis B e antigen and Hepatitis B c antigen. A rapid 1 log reduction in serum HBsAg was achieved with a single 1 mg/kg dose of TKM-HBV in the humanized mouse model, which closely mimics chronic human hepatitis B infection. 1-2 log viral reductions from similar single-dose LNP treatments in two other true-infection animal models were also demonstrated.
Preclinical studies conducted on infected primary human hepatocytes showed that TKM-HBV had robust and consistent activity against different viral strains representing the major clinical genotypes A, B, C and D.
Our
data shows that inclusion of three RNAi triggers results in a more broadly effective knockdown of hepatitis B viral elements than a single trigger alone. The mode of action of TKM-HBV complements standard of care nucleoside/nucleotide (NUC) therapy, and lack of drug antagonism has been demonstrated with entecavir, lamivudine and tenofovir on infected primary human hepatocytes, making combination therapy a viable option
.
Our data supports the utility of TKM-HBV as a potential new therapeutic option for treating patients with chronic HBV infection. In early 2015, we advanced two TKM-HBV product candidates into a Phase I trial. Both product candidates employ the same unique combination of three RNAi trigger molecules. However, they differ in their LNP composition. One formulation employs a third generation LNP, and the other employs a new, fourth generation LNP, which incorporates novel lipid chemistry and demonstrates improved potency. The multi-component RNAi therapeutic is expected to result in broad and effective inhibition of HBV.
9
The TKM-HBV Phase I clinical trial is a randomized, single-blind, placebo-controlled study, involving single ascending doses of TKM-HBV. The study will assess the safety, tolerability and pharmacokinetics of intravenous administration of two formulations of TKM-HBV in healthy adult subjects. For each formulation, there are five planned cohorts for a total of 20 subjects (40 in total for both formulations). Four subjects will be enrolled per cohort with three subjects receiving TKM-HBV, and one receiving placebo. We expect the results from the Phase I clinical trial in healthy human volunteers to determine which product formulation we will advance into chronically infected patients in a multi-dosing trial in the second half of 2015.
Following our recent merger with OnCore, our product development pipeline will now focus on discovery, acquisition or in-licensing and developing drug candidates that attack multiple targets of the HBV lifecycle, including the aggressive suppression of HBV replication, restoration of an adequate immune response and reducing the pool of cccDNA. Although the ultimate curative regimens for HBV are currently unknown, we have assembled a robust portfolio of drug development programs targeting multiple targets within the HBV life cycle, which we plan to evaluate to determine the best potential combination approaches for patients. These assets include the following:
Cyclophilin Inhibitor — OCB-030
Cyclophilins are proteins that have been shown to play a role in several biological processes, including viral infection. By inhibiting cyclophilin, we believe the ability of HBV to replicate can be impaired and the host immune response toward HBV may be enhanced. Through our OnCore subsidiary, we have licensed from NeuroVive Pharmaceutical AB, or “NeuroVive”, the exclusive rights to develop and commercialize cyclophilin inhibitor drug candidates, including OCB-030, for the treatment of hepatitis B. We are engaged in studies which we expect to be completed in order to file an IND, or equivalent, and initiate a study by year end 2015.
TLR9 Agonist (CYT-003)
Pharmaceutical activation of toll-like receptors (TLRs) is a novel and attractive approach for the treatment of chronic HBV because agonism of these receptors triggers innate immune responses and also stimulates adaptive immunity. It is hoped that immune stimulation by TLR agonists can overcome the multiple immunologic blocks that allows chronic HBV infection, including direct activation of the host’s innate antiviral response, hence overcoming the functional weakness in HBV-specific immune cell responses.
Licensed from Cytos Bioetchnology Ltd. (“Cytos”), CYT-003 is a biological carrier which is filled with the immunostimulatory oligonucleotide called G10. G10 is a toll-like receptor-9 (TLR-9) agonist. CYT-003 has been shown to directly activate B cells and stimulates human pDC to secrete Interferon alpha. CYT-003 also activates other antigen presenting cells indirectly and promotes the development of TH1 type cytokine response. This is thought to be potentially beneficial in promoting anti-HBV T cell immunity. CYT-003 has previously been utilised in human trials in other indications and therefore could move quickly into the clinic in HBV infected patients. Preclinical studies to demonstrate proof of concept are anticipated to be initiated in 2015.
Capsid Assembly Inhibitors
We are developing two capsid assembly inhibitors as oral therapeutics for the treatment of chronic HBV infection. By inhibiting assembly of the viral capsid, the ability of hepatitis B virus to replicate is impaired, which subsequently reduces the amount of new virus produced, and may have an effect on cccDNA. Through our OnCore subsidiary, we have acquired exclusive, worldwide rights to these drug candidates through an in-license from Blumberg and Drexel University, or (“Drexel”), and through OnCore’s recent acquisition of Enantigen Therapeutics, Inc., or Enantigen.
Surface Antigen Secretion Inhibitors
We are developing multiple small molecule orally bioavailable HBV surface antigen secretion inhibitors. By inhibiting the secretion of HBV surface antigen from infected cells, we expect that the immune response of patients treated with this therapy can reengage and thereby mount a more credible response to a hepatitis B virus infection. We acquired these drug candidates through OnCore’s recent acquisition of Enantigen.
STING Agonists
We are developing STING (stimulator of interferon genes) agonists. By activating interferon genes, we anticipate that the body can produce additional interferon alpha and beta, which have antiviral properties. Our development program, which is currently in the discovery research stage, is based on proof of concept data in mice generated by Blumberg which showed that STING agonists can elicit an antiviral response and inhibit HBV replication in mouse liver cells. In collaboration with Blumberg, our plan is to identify potent, orally active small molecule human STING agonists that possess the desired characteristics to progress into human clinical studies.
10
cccDNA Formation Inhibitors
We are developing multiple series of cccDNA formation inhibitors. The inhibition of cccDNA formation would reduce the amount of cccDNA in the infected liver cell and could ultimately eliminate the reservoir of HBV genomic material required for continued viral replication. Through our OnCore subsidiary, we acquired the exclusive, worldwide rights to this program through an in-license from Blumberg. This program is currently in lead optimization.
cccDNA Epigenetic Modifiers
In addition to cccDNA formation inhibitors, we are developing cccDNA epigenetic modifiers. By controlling cccDNA transcription, we anticipate that we may be able to inhibit the formation of new virus and subviral particles from cccDNA. This development program, which is currently in the discovery research stage, is based on proof of concept data generated by Blumberg using known inhibitors of enzymes involved in DNA information processing.
Non-HBV Assets – Clinical Programs and Pre-Clinical Programs (LNP enabled)
We believe there is significant value in our non-HBV assets and remain committed to maximizing this value. We intend to continue our clinical programs to the appropriate point in support of this objective. We also remain interested in advancing our ongoing metabolic and rare disease preclinical programs in an appropriate way toward this value maximization objective and in continuing to leverage our knowledge and expertise in LNP technology. A graphic summary of our non-HBV products is set forth below.
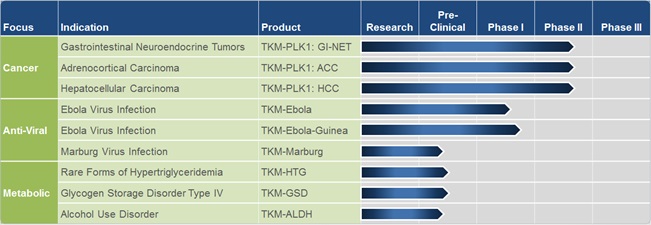
Our RNAi product pipeline is focused on anti-virals, oncology and metabolic product platforms, where there is a significant medical need and commercial opportunity. Our intention is to advance our RNAi product pipeline either ourselves or with partners, with a focus on realizing the value of these assets.
We believe that our LNP technology is a leading technology for formulating novel RNAi and mRNA products. The use of the technology in these fields has the potential to enable a broad new class of therapeutics. Our LNP technology currently represents the most widely adopted and advanced delivery technology in RNAi, having enabled eight clinical trials and with administration to over 250 patients to date. LNP and RNAi technology has the potential to generate a broad new class of therapeutics that take advantage of the body’s own natural processes to silence genes — or more specifically to eliminate specific gene-products, from the cell.
We are also committed to continuing to support the work of our product development partners and intellectual property licensees with the goal of realizing the short-term and long term financial potential of these partnerships.
Clinical Programs (LNP enabled)
TKM-PLK1
Our oncology product platform, TKM-PLK1, targets polo-like kinase 1 (PLK1), a protein involved in tumor cell proliferation and a validated oncology target. Inhibition of PLK1 expression prevents the tumor cell from completing cell division, resulting in cell cycle arrest and death of the cancer cell. Evidence that patients with elevated levels of PLK1 in their tumors exhibit poorer prognosis and survival rates has been documented in the medical literature. TKM-PLK1 is being evaluated in oncology indications in which there are limited or ineffective therapies available: Gastrointestinal Neuroendocrine Tumors (GI-NET), Adrenocortical Carcinoma (ACC) and Hepatocellular Carcinoma (HCC).
11
GI-NET and ACC
GI-NET is the gastrointestinal subset of neuroendocrine tumors. According to a paper by Yao et al. (2008), a historical analysis of the US SEER database reveals the incidence of neuroendocrine tumors has increased faster in the last few decades than any other neoplasm, with a growth rate of greater than 3% expected to continue in the near term. The prevalence of GI-NET in the US is estimated to be approximately 55,000 individuals. Prognosis for advanced or metastatic GI-NET, the target population for TKM-PLK1, is poor with 25-54% of patients surviving less than one year.
ACC is an ultra-rare form of cancer that develops in the adrenal gland, with data from the US National Cancer Institute estimating 500 patients in the US. Survival prognosis for these patients is poor. A large percentage of patients are not good surgical candidates and there is a lack of effective systemic therapies.
We presented updated Phase I TKM-PLK1 data at the 6th Annual NET Conference hosted by the North American Neuroendocrine Tumor Society (NA-NETS) in Charleston, South Carolina on October 4, 2013. This data set included a total of 36 patients in a population of advanced cancer patients with solid tumors. Doses ranged from 0.15 mg/kg to 0.90 mg/kg during the dose escalation portion of the trial, with the maximum tolerated dose (MTD) of 0.75 mg/kg. Serious adverse events (SAEs) were experienced by four subjects in this heavily pre-treated, advanced cancer patient population, with three of four subjects continuing on study. Forty percent (6 out of 15) of patients evaluable for response, treated at a dose equal to or greater than 0.6 mg/kg, showed clinical benefit. Three out of the four ACC patients (75%) treated with TKM-PLK1 achieved stable disease, including one patient who saw a 19.3% reduction in target tumor size after two cycles of treatment and is still on study receiving TKM-PLK1. Of the two GI-NET patients enrolled, both experienced clinical benefit: one patient had a partial response based on Response Evaluation Criteria in Solid Tumors
(
RECIST
)
criteria, and the other GI-NET patient achieved stable disease and showed a greater than 50% reduction in Chromogranin-A (CgA) levels, a key biomarker used to predict clinical outcome and tumor response.
Based on encouraging results from the dose escalation portion and expansion cohort from our Phase I TKM-PLK1 clinical trial, we expanded into a Phase I/II clinical trial with TKM-PLK1, which is specifically enrolling patients within two therapeutic indications: advanced GI-NET or ACC. This multi-center, single arm, open label study is designed to measure efficacy using RECIST criteria
for GI-NET patients and ACC patients as well as evaluate the safety, tolerability and pharmacokinetics of TKM-PLK1. TKM-PLK1 is administered weekly with each four-week cycle consisting of three once-weekly doses followed by a rest week. In the Fall of 2014, we achieved our enrolment target of patients with advanced GI-NET or ACC tumors. These patients will continue treatment and be followed to determine if TKM-PLK1 produces a meaningful clinical benefit.
We provided an update on this Phase I/II clinical study in December 2014. To date, 55 patients, in both the Phase I and Phase I/II studies have been treated at doses of ≥ 0.6 mg/kg, which is considered to be in the efficacious dose range based on preclinical studies. Of these, 31 patients comprise the target population of GI-NET or ACC patients. Currently, nine patients (GI-NET and ACC) remain actively on treatment and data collection is ongoing.
While we are still awaiting maturation of data, we continue to see evidence of anti-tumor activity in some treated subjects, including one ACC patient with an almost complete resolution of their disease. We expect to report final data from these studies in the second half of 2015.
HCC
HCC is one of the most common cancers and one of the most deadly, with over 650,000 deaths each year worldwide according to the Globocan 2012 database. US incidence is estimated at 27,000 individuals with annual growth rates greater than 2%. HCC is an aggressive, hard-to-treat disease with one-year survival rates of less than 50% and five-year rates as low as 4% (National Cancer Institute). To date, Nexavar
®
(sorafenib) is the only agent approved to treat HCC with an improvement in overall survival of just two to three months.
In May 2014, we initiated another Phase I/II clinical trial with TKM-PLK1, enrolling patients with advanced HCC. Patient dosing has commenced and we have completed the first treatment in all of our subjects for the first HCC cohort. This Phase I/II clinical trial is a multi-center, single arm, open label dose escalation study designed to evaluate the safety, tolerability and pharmacokinetics of TKM-PLK1 as well as determine the maximum tolerated dose in patients with advanced HCC. It will also include a preliminary assessment of the anti-tumor activity of TKM-PLK1 in this patient population. It is expected that approximately 38 patients with advanced HCC tumors will be enrolled in this Phase I/II clinical trial.
TKM-Ebola
TKM-Ebola, an anti-Ebola RNAi therapeutic, is being developed under a $140 million contract, signed in July 2010, with the U.S. Department of Defense (DoD) Joint Project Manager Medical Countermeasure Systems BioDefense Therapeutics (JPM-MCS-BDTX). Preclinical studies published in the medical journal
The Lancet
in 2010 demonstrated that when RNAi triggers targeting the Ebola virus and delivered by our LNP technology were used to treat previously infected non-human primates, the result was 100 percent protection from an otherwise lethal dose of Zaire Ebola virus (Geisbert et al.,
The Lancet,
Vol. 375, May 29, 2010).
12
In May 2013, our collaboration with the JPM-MCS-BDTX was modified and expanded to include advances in LNP formulation technology. The contract modification increased the first stage of funding from $34.7 million to $41.7 million. In April 2014, we signed a second contract modification to increase this funding by $2.1 million to a total of $43.8 million to compensate Tekmira for unrecovered costs that occurred in 2012 and to provide additional funding should it be required.
TKM-Ebola is being developed under specific U.S. Food and Drug Administration (FDA) regulatory guidelines called the “Animal Rule”. This allows, in circumstances where it is unethical or not feasible to conduct human efficacy studies, marketing approval to be granted based on adequate and well-controlled animal studies when the results of those studies establish that the drug is reasonably likely to produce clinical benefit in humans. Demonstration of the product’s safety in humans is still required.
We were granted Fast Track designation from the FDA for the development of TKM-Ebola in March 2014. The FDA’s Fast Track is a process designed to facilitate the development and expedite the review of drugs in order to get important new therapies to the patient earlier.
In May 2014, we successfully completed the single ascending dose portion of the TKM-Ebola Phase I clinical trial in healthy human volunteers. Results demonstrated that administration of the TKM-Ebola therapeutic, in the absence of any steroid containing pre-medication, was well-tolerated at a dose level of 0.3 mg/kg, determined to be the maximum tolerated dose.
In July 2014, we received notice from the FDA placing the TKM-Ebola Investigational New Drug application (IND) on clinical hold until additional information is supplied, and the multiple ascending dose portion of the trial protocol is modified to ensure the safety of healthy volunteers. The clinical hold was subsequently modified to a partial clinical hold to permit the administration of TKM-Ebola to patients with a suspected or confirmed Ebola virus infection. Under the FDA’s expanded access program, several patients with a confirmed or suspected Ebola virus infection were treated with TKM-Ebola. Data is being collected and will be provided to the FDA under our IND. Health Canada also established a similar framework for the potential use of TKM-Ebola in the same group of patients.
With the emergency use of our TKM-Ebola product under expanded access protocols and recent developments, such as the production of a new product candidate for clinical trials in West Africa, the clinical development pathways for our Ebola products are evolving. We may not be able to resolve the partial clinical hold of the healthy volunteer, multiple ascending dose portion of our Phase 1 trial of TKM-Ebola.
In December 2014, the US Congress amended the Rare and Tropical Disease list to include Ebola as a candidate for a potential Accelerated Review Voucher.
TKM-Ebola-Guinea, an Anti-Ebola RNAi Therapeutic Targeting Ebola-Guinea Strain of Ebola Virus
In September 2014, we joined an international consortium led by the International Severe Acute Respiratory and Emerging Infection Consortium (ISARIC) at the University of Oxford, UK, to potentially provide an RNAi based investigational therapeutic for expedited clinical studies in West Africa.
In October 2014, the genomic sequence of the Ebola-Guinea strain, which is the virus responsible for the recent outbreak in West Africa, was determined from several viral isolates and published in the New England Journal of Medicine (Baize S., et al. Emergence of Zaire Ebola Virus Disease in Guinea;
New England Journal of Medicine
, October 9, 2014 Vol. 371 No. 15). We rapidly developed a modified RNAi therapeutic to specifically target Ebola-Guinea. The new product, TKM-Ebola-Guinea, is designed to match the genomic sequence exactly, with two RNAi molecule triggers. Results of preclinical studies with TKM-Ebola-Guinea demonstrated efficacy comparable to those obtained with TKM-Ebola, which demonstrated up to 100% protection from an otherwise lethal dose of the virus.
In December 2014, we entered into a Manufacturing and Clinical Trial Agreement with the University of Oxford to provide the new TKM-Ebola-Guinea therapeutic product for clinical studies in West Africa. ISARIC can conduct clinical studies of TKM-Ebola-Guinea in Ebola virus infected patients, with funding provided by the Wellcome Trust. GMP manufacture of TKM-Ebola-Guinea is now complete and 100 treatment courses are available for the study. A Phase II single arm trial called RAPIDE (Rapid Assessment of Potential Interventions & Drugs for Ebola), was initiated in March 2015 in Sierra Leone. The study is open-label
with a concurrent observational study in Ebola virus disease
, and results are expected in the second half of 2015.
The U.S. Department of Defense JPM-MCS-BDTX has also exercised an option, valued at $7.0 million, in our current contract to manufacture TKM-Ebola-Guinea. We have been awarded the option for scale-up and GMP manufacture of the product for approximately 500 treatment courses.
Non-HBV Preclinical Programs (LNP enabled)
We are currently evaluating several additional preclinical candidates with potential in diverse therapeutic areas. Given the extremely high efficiency of delivery for third and fourth generation liver-centric LNP formulations, we are focused on rare diseases where the molecular target is found in the liver, early clinical proof-of-concept can be achieved and development opportunities may be accelerated. Our research team intends to continue to generate preclinical data to support the advancement of the most promising of these targets.
13
TKM-Marburg
Like Ebola, Marburg is a member of the filovirus family of hemorrhagic fever viruses. Natural outbreaks with the Marburg-Angola strain have resulted in mortality in approximately 90% of infected individuals. There are currently no approved therapeutics available for the treatment of Marburg infection.
In 2010, along with the University of Texas Medical Branch (UTMB), we were awarded a National Institutes of Health (NIH) grant to support research to develop RNAi therapeutics to treat Ebola and Marburg hemorrhagic fever viral infections. In November 2013, we announced data showing 100% survival in non-human primates infected with the Angola strain of the Marburg virus in two separate studies. These results build upon a study published earlier in the Journal of Infectious Disease showing 100% protection in guinea pig models of infection with Angola, Ci67 and Ravn strains of the Marburg virus using a broad spectrum RNAi therapeutic enabled by Tekmira’s LNP.
In February 2014, along with UTMB, and other collaborators, we were awarded additional funding from the NIH in support of this research. Data was published demonstrating complete protection of non-human primates against lethal Marburg-Angola strain, (
Science Translational Medicine
. Thi EP., et al. Marburg virus infection in nonhuman primates: Therapeutic treatment by lipid-encapsulated siRNA. 2014 Aug 20;6 (250))
Non-HBV Preclinical Programs (LNP enabled)
We are currently evaluating several additional preclinical candidates with potential in diverse therapeutic areas. Given the extremely high efficiency of delivery for third and fourth generation liver-centric LNP formulations, we are focused on rare diseases where the molecular target is found in the liver, early clinical proof-of-concept can be achieved and development opportunities may be accelerated. Our research team intends to continue to generate preclinical data to support the advancement of the most promising of these targets.
TKM-HTG
Our metabolic product platform, TKM-HTG, aims to achieve rapid and sustained reductions of triglycerides to address the limitations of existing Hypertriglyceridemia (HTG) treatments. Hypertriglyceridemia is a type of dyslipidemia where there are high blood levels of triglycerides. Patients with severe HTG, (classified as triglyceride levels greater than 1000 mg/dL) are at risk of acute pancreatitis as well as the risk of cardiovascular disease. Approximately one million adults in the US and 18 million worldwide suffer from severe HTG. (NHANES 2003-2004 data).
Another patient group affected by HTG are those with Familial Chylomicronemia Syndrome (FCS), which is a very rare hereditary condition affecting an estimated 1:1,000,000 people (www.fcs.raredr.com). Additionally, 35% of patients with Type 2 Diabetes (T2D) suffer from mixed hyperlipidemia which is a combination of elevated cholesterol and high triglycerides. With underlying T2D, these patients are at considerable risk from cardiovascular disease.
TKM-HTG is being developed as a multi-component RNAi therapeutic that simultaneously targets a combination of genes expressed in the liver, which are known to play a significant role in triglyceride metabolism. High triglyceride levels are medically linked to increased risk of cardiovascular disease, fatty liver disease, insulin resistance and pancreatitis.
We anticipate filing an investigational new drug application, or equivalent document, in the second half of 2015.
TKM-ALDH
TKM-ALDH is designed to knockdown or silence aldehyde dehydrogenase (ALDH) to induce long term acute sensitivity to ethanol, for use in severe alcohol use disorder. Aldehyde dehydrogenase is a key enzyme in ethanol metabolism. Inhibition of ALDH activity, through the silencing of ALDH, results in the build-up of acetaldehyde leading to adverse physiological effects. Human proof of concept for ALDH inhibition already exists in the form of the approved drug disulfiram. However, disulfiram’s efficacy is compromised by poor compliance because it has to be taken daily. We believe TKM-ALDH will induce prolonged ethanol sensitivity that will enable it to overcome the compliance limitations associated with daily dosing. We are exploring partnering or external funding opportunities to maximize the value of this asset.
Ongoing Advancements in LNP Technology
We plan to continue to develop our proprietary LNP delivery technology and receive clinical validation from LNP-based products currently in clinical trials. The most advanced LNP-enabled therapeutic, which is being developed by Alnylam, has entered a Phase III clinical trial. We believe our LNP technology can remain an important cornerstone of our business development activities moving forward. We recently announced the latest (fourth) generation of the platform which comprises a rational re-design of the lipid architecture, as well as formulation and process advances. These attributes can be utilized in programs entering the clinic in 2015 and are expected to yield significant increases in potency and therapeutic index.
14
Because LNP can enable a wide variety of nucleic acid triggers, including mRNA, we continue to see new product development and partnering opportunities based on what we believe is our industry-leading delivery expertise. In February 2014, we presented new preclinical data at the AsiaTIDES scientific symposium in Tokyo, Japan demonstrating that mRNA can be effectively delivered to target proteins expressed.
Partner-Based Programs
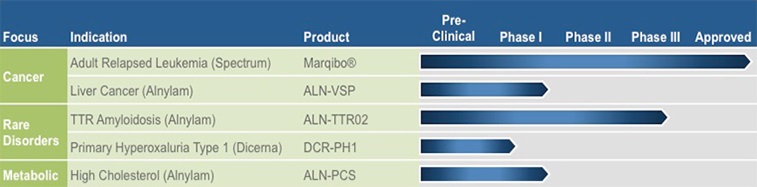
Patisiran (ALN-TTR02)
Patisiran, or ALN-TTR02, which is being developed by Alnylam, represents the most clinically advanced application of our proprietary LNP delivery technology. In November 2013, Alnylam presented positive results from its Phase II clinical trial with patisiran (ALN-TTR02), an RNAi therapeutic targeting transthyretin (TTR) for the treatment of TTR-mediated amyloidosis (ATTR). In December 2013, Alnylam announced the initiation of the APOLLO Phase III trial of patisiran to evaluate efficacy and safety of patisiran in ATTR patients with Familial Amyloidotic Polyneuropathy (FAP). In April 2014, Alnylam presented positive new data from its Phase II clinical trial with patisiran. These results provide additional support for Alnylam's Phase III APOLLO trial. In October 2014, Alnylam reported positive clinical data for the ongoing patisiran Phase II Open Label Extension (OLE) study in patients with FAP. The results demonstrated sustained knockdown of serum TTR of up to 90% and a favorable tolerability profile out to one year of treatment.
Alnylam has also pursued two other LNP-based products through clinical development: ALN-VSP (liver cancer), and ALN-PCS02 (hypercholesterolemia). Alnylam will pay Tekmira low single digit royalties based on commercial sales of Alnylam’s LNP-enabled products. More information about our licensing agreement with Alnylam can be found under the “Strategic Alliances, Licensing Agreements, and Research Collaborations” section of this report.
Marqibo®
Marqibo®, originally developed by Tekmira, is a novel, sphingomyelin/cholesterol liposome-encapsulated formulation of the FDA-approved anticancer drug vincristine. Marqibo’s approved indication is for the treatment of adult patients with Philadelphia chromosome-negative acute lymphoblastic leukemia (Ph-ALL) in second or greater relapse or whose disease has progressed following two or more lines of anti-leukemia therapy. Our licensee, Spectrum Pharmaceuticals, Inc. (“Spectrum”), launched Marqibo through its existing hematology sales force in the United States. We are entitled to mid-single digit royalty payments based on Marqibo’s commercial sales. Spectrum has ongoing trials evaluating Marqibo in three additional indications, which are: first line use in patients with Philadelphia Negative Acute Lymphoblastic Leukemia (Ph-ALL), Pediatric ALL and Non-Hodgkin’s lymphoma. More information about our licensing agreement with Spectrum can be found under the “Strategic Alliances, Licensing Agreements, and Research Collaborations” section of this report.
DCR-PH1
In November 2014, we signed a licensing and collaboration agreement with Dicerna Pharmaceuticals, Inc. to utilize our LNP delivery technology exclusively in Dicerna's primary hyperoxaluria type 1 (PH1) development program. Dicerna will use our third generation LNP technology for delivery of DCR-PH1, Dicerna's product incorporating its Dicer substrate RNA (DsiRNA) molecule, for the treatment of PH1, a rare, inherited liver disorder that often results in kidney failure and for which there are no approved therapies. More information about our licensing agreement with Dicerna can be found under the “Strategic Alliances, Licensing Agreements, and Research Collaborations” section of this report.
Strategic Alliances, Licensing Agreements, and Research Collaborations
Since inception, we have fostered collaborations and technology licensing relationships with leading companies in the RNAi field, including Alnylam Pharmaceuticals, Inc., Bristol-Myers Squibb Company, Merck & Co. Inc., the U.S. Department of Defense’s BioDefense Therapeutics’ Office, Monsanto, Dicerna Pharmaceuticals Inc., and other undisclosed pharmaceutical and biotechnology companies.
15
We have certain rights under the RNAi intellectual property of Alnylam Pharmaceuticals, Inc. to develop 13 RNAi therapeutic products. In addition, we have a broad non-exclusive license to use Unlocked Nucleobase Analogs (UNAs) from Arcturus Therapeutics, Inc. (
“Arcturus
”)
for the development of RNAi therapeutic products directed to any target in any therapeutic indication.
Alnylam Pharmaceuticals, Inc. (“Alnylam”) and Acuitas Therapeutics Inc. (“Acuitas”)
In November 2012, we, Alnylam, and AlCana Technologies, Inc. (now Acuitas Therapeutics Inc.) entered into an agreement to settle all litigation and to restructure the existing contractual relationship, replacing all earlier licensing, cross-licensing, collaboration, and manufacturing agreements. Consistent with the terms outlined in the 2012 settlement agreement, in December 2013, we finalized and entered a cross-license agreement with Acuitas. The terms provide Acuitas with access to certain of our earlier Intellectual Property (IP) generated prior to April 2010, and provide us with certain access to their technology and licenses in the RNAi field, along with a percentage of each milestone, and royalty payment with respect to certain products. In addition, Acuitas has agreed that it will not compete in the RNAi field for a period of five years.
As a result of the settlement and 2012 cross-license agreement, we received a total of $65 million in cash payments from Alnylam in November 2012. This included $30 million associated with the termination of the manufacturing agreement and $35 million associated with the termination of the previous Alnylam-Inex and Alnylam-Protiva license agreements, as well as a reduction of the milestone and royalty schedules associated with Alnylam’s ALN-VSP, ALN-PCS, and ALN-TTR programs. Of the $65 million received from Alnylam, $18.7 million was subsequently paid by us to our lead legal counsel, in satisfaction of the contingent obligation owed to that counsel. In addition, Alnylam transferred all agreed upon patents and patent applications related to LNP technology for the systemic delivery of RNAi therapeutic products, including the MC3 lipid family, which is used in Alnylam’s TTR-mediated amyloidosis treatment ALN-TTR02, to Tekmira. As a result, we own and control prosecution of this IP portfolio. We are the only company able to sublicense LNP intellectual property in future platform-type relationships. Alnylam has a license to use our IP to develop and commercialize products and may only grant access to our LNP technology to its partners if the partner is part of a product sublicense. Alnylam’s license rights are limited to patents that we filed, or that claim priority to a patent that was filed, before April 15, 2010. Alnylam does not have rights to our patents filed on or after April 15, 2010 unless they claim priority to a patent filed before that date. Alnylam will pay us low single digit royalties based on commercial sales of Alnylam’s LNP-enabled products using our technology, including ALN-TTR02 (patisiran), ALN-VSP, and ALN-PCS02.
The 2012 cross-license agreement with Alnylam also grants us IP rights to develop our own proprietary RNAi therapeutics. Alnylam has granted us a worldwide license for the discovery, development and commercialization of RNAi products directed to 13 gene targets – three exclusive and ten non-exclusive licenses – provided that they have not been committed by Alnylam to a third party, or are otherwise unavailable as a result of the exercise of a right of first refusal held by a third party, or are part of an ongoing or planned development program of Alnylam. Licenses for five of the 10 non-exclusive targets – ApoB, PLK1, Ebola, WEE1, and CSN5 – have already been granted, along with an additional license for ALDH2, which has been granted on an exclusive basis. In consideration for this license, we have agreed to pay single-digit royalties to Alnylam on product sales and have milestone obligations of up to $8.5 million on the non-exclusive licenses (with the exception of TKM-Ebola, which has no milestone obligations). Alnylam no longer has “opt-in” rights to our lead oncology product, TKM-PLK1, so we now hold all development and commercialization rights related TKM-PLK1. We will have no milestone obligations on the three exclusive licenses.
In December 2013, we received a $5.0 million milestone from Alnylam, triggered by the initiation of the APOLLO Phase III trial of patisiran. We have entered an arbitration proceeding with Alnylam, as provided for under our licensing agreement, to resolve a matter related to a disputed $5.0 million milestone payment payable to us by Alnylam for its ALN-VSP product. We have not recorded any revenue in respect of this milestone.
Merck & Co., Inc. ("Merck") and Alnylam license agreement
As a result of the business collaboration with Protiva in 2008, we acquired a non-exclusive royalty-bearing worldwide license agreement with Merck. Under the license, Merck will pay up to $17.0 million in milestones for each product they develop covered by Protiva’s IP, except for the first product for which Merck will pay up to $15.0 million in milestones, and will pay royalties on product sales. Merck’s license rights are limited to patents that we filed, or that claim priority to a patent that was filed, before October 9, 2008. Merck does not have rights to our patents filed after October 9, 2008 unless they claim priority to a patent filed before that date. Merck has also granted a license to us to certain of its patents. On March 6, 2014, Alnylam announced that they acquired all assets and licenses from Merck, which included our license agreement.
Dicerna Pharmaceuticals, Inc. (“Dicerna”)
In November 2014, Tekmira signed a licensing agreement and a development and supply agreement with Dicerna to license Tekmira's LNP delivery technology for exclusive use in Dicerna's primary hyperoxaluria type 1 (PH1) development program. Dicerna will use Tekmira's third generation LNP technology for delivery of DCR-PH1, Dicerna's product incorporating its Dicer substrate RNA (DsiRNA) molecule, for the treatment of PH1, a rare, inherited liver disorder that often results in kidney failure and for which there are no approved therapies. Under the agreements, Dicerna paid Tekmira $2.5 million upfront and will potentially make payments of $22 million in aggregate development milestones, plus a mid-single-digit royalty on future PH1 sales. This partnership also includes a supply agreement under which we will provide clinical drug supply and regulatory support for the rapid advancement of this product candidate.
16
Monsanto Company (“Monsanto”)
In January 2014, we signed an Option Agreement and a Service Agreement with Monsanto, pursuant to which Monsanto may obtain a license to use our proprietary delivery technology. The transaction supports the application of our proprietary delivery technology and related IP for use in agriculture. The potential value of the transaction could reach $86.2 million following the successful completion of milestones. In January 2014, we received $14.5 million of the $17.5 million in anticipated near term payments. We received additional payments of $1.5 M each in June 2014 and October 2014 following achievement of specific program objectives.
Spectrum Pharmaceuticals, Inc.
(“Spectrum”)
In July 2013, Talon Therapeutics Inc. (formerly Hana Biosciences, Inc.) was acquired by Spectrum. Under a legacy license agreement, Spectrum has an exclusive license to three targeted chemotherapy products originally developed by us. Marqibo® (optisomal vincristine), Alocrest
®
(optisomal vinorelbine) and Brakiva
®
(optisomal topotecan). Spectrum will pay us milestones and single-digit royalties and is responsible for all future development and expenses.
We are eligible to receive milestone payments from Spectrum up to $18.0 million upon achievement of further development and regulatory milestones, as well as single-digit royalties based on product sales. If Spectrum sublicenses any of the product candidates, we are eligible to receive a percentage of any upfront fees or milestone payments received by Spectrum. On September 18, 2014, Spectrum announced that they have sublicensed rights to sell Marqibo in the Greater China region to CASI Pharmaceuticals, Inc. (“CASI”). CASI issued a promissory note for $1.5 million as up-front consideration for the sublicense. The promissory note is payable on March 17, 2016 at which time Spectrum will pay a portion to us. Depending on the royalty rates Spectrum receives from its sub-licensees, our royalty rate may be lower on product sales by the sub-licensees. The royalty rate will be reduced to low single digits if there is generic competition.
Marqibo is a novel, sphingomyelin/cholesterol liposome-encapsulated formulation of the FDA-approved anticancer drug vincristine originally developed by Tekmira. In September 2013, we announced that our licensee, Spectrum had launched Marqibo through its existing hematology sales force in the United States. Since then commercial sales have occurred. We are entitled to mid-single digit royalty payments based on Marqibo’s commercial sales.
Marina Biotech, Inc. (“Marina”) /Arcturus Therapeutics, Inc. (“Arcturus”)
In November 2012, we disclosed that we had obtained a worldwide, non-exclusive license to a novel RNAi trigger technology called Unlocked Nucleobase Analog (UNA) from Marina for the development of RNAi therapeutics. UNAs can be incorporated into RNAi drugs and have the potential to improve them by increasing their stability and reducing off-target effects. In August 2013, Marina assigned its UNA technology to Arcturus and the UNA license agreement between Tekmira and Marina was assigned to Arcturus. The terms of the license are otherwise unchanged.
To date, we have paid Marina $0.5 million in license fees and there are milestones of up to $3.2 million plus royalties for each product that we develop using UNA technology licensed from Marina. We announced on January 21, 2015, that we had initiated a Phase I clinical trial with TKM-HBV. As TKM-HBV utilizes UNA technology in-licensed from Arcturus, the initiation of the trial triggered a single milestone payment of $250,000 payable by us to Arcturus.
U.S. National Institutes of Health (“NIH”)
In October 2010, we announced that together with collaborators at The University of Texas Medical Branch (UTMB), we were awarded a new NIH grant to support research to develop RNAi therapeutics to treat Ebola and Marburg hemorrhagic fever viral infections using our LNP delivery technology. The grant, worth $2.4 million, is supporting work at Tekmira and at UTMB. In February 2014, we along with UTMB, and other collaborators, were awarded additional funding from the NIH in support of this research. Under this grant, we will receive
$3.4 million over a period of five years.
Bristol-Myers Squibb Company (“BMS”)
In May 2010, we announced a research collaboration with BMS. Under this agreement, BMS conducted preclinical work to validate the function of certain genes and shared the data with us to potentially develop RNAi therapeutic drugs against therapeutic targets of interest. We formulated the required RNAi trigger molecules enabled by our LNP technology to silence target genes of interest. BMS paid us $3.0 million concurrent with the signing of the agreement. We provided a predetermined number of LNP batches over the four-year agreement. In May 2011, we announced a further expansion of the collaboration to include broader applications of our LNP technology and additional target validation work. In May 2014, the collaboration expired and both parties’ obligations ended. Recognition of revenue from agreements with BMS is covered in the Revenue section of this MD&A.
17
Halo-Bio RNAi Therapeutics, Inc. (“Halo-Bio”)
In August 2011, we entered into a license and collaboration agreement with Halo-Bio. Under the agreement, Halo-Bio granted to us an exclusive license to its multivalent ribonucleic acid MV-RNA technology. The agreement was amended on August 8, 2012, to adjust future license fees and other contingent payments. To date, we have recorded $0.5 million in fees under our license from Halo-Bio. We terminated the agreement with Halo-Bio on July 31, 2013. There are no further payments due or contingently payable to Halo-Bio.
Aradigm Corporation (“Aradigm”)
In December 2004, we entered into a licensing agreement with Aradigm under which Aradigm exclusively licensed certain of our liposomal intellectual property for the pulmonary delivery of Ciprofloxacin. As amended, this agreement calls for milestone payments totalling $4.5 and $4.75 million, respectively, for the first two disease indications pursued by Aradigm using our technology, and for low- to mid-single-digit royalties on sales revenue from products using our technology. We terminated the Aradigm license agreement in May 2013.
University of British Columbia (“UBC”)
Certain early work on lipid nanoparticle delivery systems and related inventions was undertaken at the University of British Columbia (UBC). These inventions are licensed to us by UBC under a license agreement, initially entered in 1998 and as amended in 2001, 2006 and 2007. We have granted sublicenses under the UBC license to Alnylam as well as to Talon. Alnylam has in turn sublicensed back to us under the licensed UBC patents for discovery, development and commercialization of RNAi products. In mid-2009, we and our subsidiary Protiva entered into a supplemental agreement with UBC, Alnylam and Acuitas, in relation to a separate research collaboration to be conducted among UBC, Alnylam and Acuitas to which we have license rights. The settlement agreement signed in late 2012 to resolve the litigation among Alnylam, Acuitas, Tekmira and Protiva provided for the effective termination of all obligations under such supplemental agreement as between and among all litigants.
On November 10, 2014, the University of British Columbia filed a demand for arbitration against Tekmira Pharmaceuticals Corp., BCICAC File No.: DCA-1623. We received UBC’s Statement of Claims on January 16, 2015. In its Statement of Claims, UBC alleges that it is entitled to $3.5 million in allegedly unpaid royalties based on publicly available information, and an unspecified amount based on non-public information. UBC also seeks interest and costs, including legal fees. Tekmira disputes UBC’s allegation. No dates have been scheduled for this arbitration.
Newly acquired assets as a result of our merger with OnCore
In addition to the newly acquired product candidates discussed above, our merger with OnCore resulted in the acquisition of the following:
Cytos Biotechnology Ltd (“Cytos”)
On December 30, 2014, OnCore entered into an exclusive, worldwide, sub-licensable (subject to certain restrictions with respect to licensed viral infections other than hepatitis) license to six different series of compounds. The licensed compounds are Qbeta-derived virus-like particles that encapsulate TLR9, TLR7 or RIG-I agonists and may or may not be conjugated with antigens from hepatitis virus or other licensed viruses. We have an option to expand this license to include additional viral infections other than influenza and Cytos will retain all rights for influenza, all non-viral infections, and all viral infections (other than hepatitis) for which we have not exercised an option.
In partial consideration for this license, upon closing of the Cytos Agreement we will be obligated to pay Cytos up to a total of $67 million for each of the six licensed compound series upon the achievement of specified development and regulatory milestones for hepatitis; and each additional licensed viral infection, up to a total of $110 million upon the achievement of specified sales performance milestones; and tiered royalty payments in the high-single to low-double digits, based upon the proportionate net sales of licensed products in any commercialized combination.
The Baruch S. Blumberg Institute (“Blumberg”) and Drexel University (“Drexel”)
In February 2014, OnCore entered into a license agreement with Blumberg and Drexel that granted us an exclusive (except as to certain know-how and subject to retained non-commercial research rights), worldwide, sub-licensable license to three different compound series: cccDNA inhibitors, capsid assembly inhibitors and HCC inhibitors.
In partial consideration for this license, OnCore paid a license initiation fee of $150,000 and issued warrants to Blumberg and Drexel. Under this license agreement, OnCore also agreed to pay up to $3.5 million in development and regulatory milestones per licensed compound series, up to $92.5 million in sales performance milestones per licensed product, and royalties in the mid-single digits based upon the proportionate net sales of licensed products in any commercialized combination. We are obligated to pay Blumberg and Drexel a double digit percentage of all amounts received from the sub-licensees, subject to customary exclusions.
18
In November 2014, OnCore entered into an additional license agreement with Blumberg and Drexel pursuant to which OnCore received an exclusive (subject to retained non-commercial research rights), worldwide, sub-licensable license under specified patents and know-how controlled by Blumberg and Drexel covering epigenetic modifiers of cccDNA and STING agonists. In consideration for these exclusive licenses, OnCore made an upfront payment of $50,000. Under this agreement, we will be required to pay up to $1.0 million for each licensed product upon the achievement of a specified regulatory milestone and a low single digit royalty, based upon the proportionate net sales of compounds covered by this intellectual property in any commercialized combination. We are also obligated to pay Blumberg and Drexel a double digit percentage of all amounts received from its sub-licensees, subject to exclusions.
Acquisition of Enantigen Therapeutics, Inc. (“Enantigen”)
In October 2014, OnCore acquired all of the outstanding shares of Enantigen pursuant to a stock purchase agreement. Through this transaction, OnCore acquired a HBV surface antigen secretion inhibitor program and a capsid assembly inhibitor program, each of which are now assets of Tekmira, following the merger with OnCore.
Under the stock purchase agreement, we agreed to pay to Enantigen’s selling stockholders up to a total of $21.0 million upon the achievement of specified development and regulatory milestones for the first two products that contain either a capsid compound, or a HBV surface antigen compound that is covered by a patent that acquired under this agreement, or a capsid compound from an agreed upon list of compounds, up to a total of $101.5 million in sales performance milestones in connection with the sale of the first commercialized product of Tekmira for the treatment of HBV, regardless of whether such product is based upon assets acquired under this agreement; and low single digit royalty on net sales of such first commercialized HBV product, up to a maximum royalty payment of $1.0 million that, if paid, would be offset against our milestone payment obligations.
License Agreements between Enantigen and Blumberg and Drexel
Under the stock purchase agreement, we also agreed to that Enantigen would fulfill its obligations under Enantigen’s three patent license agreements with Blumberg and Drexel. Pursuant to each patent license agreement, Enantigen is obligated to pay Blumberg and Drexel up to approximately $500,000 in development and regulatory milestones per licensed product, royalties in the low single digits, and a percentage of revenue it receives from its sub-licensees.
Research Collaboration and Funding Agreement with Blumberg
In October 2014, OnCore entered into a research collaboration and funding agreement with Blumberg under which we will provide $1.0 million per year of research funding for three years, renewable at our option for an additional three years, for Blumberg to conduct research projects in HBV and liver cancer pursuant to a research plan to be agreed upon by the parties. Blumberg has exclusivity obligations to Tekmira with respect to HBV research funded under the agreement. In addition, we have the right to match any third party offer to fund HBV research that falls outside the scope of the research being funded under the agreement. Blumberg has granted us the right to obtain an exclusive, royalty bearing, worldwide license to any intellectual property generated by any funded research project. If we elect to exercise our right to obtain such a license, we will have a specified period of time to negotiate and enter into a mutually agreeable license agreement with Blumberg. This license agreement will include the following pre negotiated upfront, milestone and royalty payments: an upfront payment in the amount of $100,000; up to $8.1 million upon the achievement of specified development and regulatory milestones; up to $92.5 million upon the achievement of specified commercialization milestones; and royalties at a low single to mid-single digit rates based upon the proportionate net sales of licensed products from any commercialized combination.
NeuroVive Pharmaceutical AB (“NeuroVive”)
In September 2014, OnCore entered into a license agreement with NeuroVive that granted us an exclusive, worldwide, sub-licensable license to develop, manufacture and commercialize, for the treatment of HBV, oral dosage form sanglifehrin based cyclophilin inhibitors (including OCB-030). Under this license agreement we have been granted a non-exclusive, royalty free right and license and right of reference to NeuroVive’s relevant regulatory approvals and filings for the sole purpose of developing, manufacturing and commercializing licensed products for the treatment of HBV. Under this license agreement, we have (1) an option to expand our exclusive license to include treatment of viral diseases other than HBV and (2) an option, exercisable upon specified conditions, to expand our exclusive license to include development, manufacture and commercialization of non-oral variations of licensed products for treatment of viral diseases other than HBV. NeuroVive retains all rights with respect to development, manufacture and commercialization of licensed products and non-oral variations of licensed products for all indications (other than HBV) for which we have not exercised our option.
In partial consideration for this license, OnCore paid NeuroVive a license fee of $1 million. We are also obligated to pay up to $47.0 million in clinical development and regulatory milestones per indication and up to $102.5 million in sales performance milestones per licensed product and indication. If we are acquired by a third party in a transaction that meets certain criteria, then we or our acquiror will be obligated to pay all remaining development, regulatory and sales milestone payments, regardless of whether the applicable milestone events have been achieved, for each licensed product that entered clinical development before such acquisition. We agreed to pay NeuroVive tiered royalties in the mid-single to low-double digit range based upon the proportionate gross sales of patented licensed products from any commercialized combination. If we terminate this license agreement in its entirety for convenience prior to the first commercial sale of any licensed product, we will be obligated to pay NeuroVive $2 million.
19
Patents and Proprietary Rights
Our commercial success depends in part on our ability to obtain and maintain proprietary protection for our drug candidates, novel discoveries, product development technologies and other know-how, to operate without infringing on the proprietary rights of others and to prevent others from infringing our proprietary rights. Our policy is to seek to protect our proprietary position by, among other methods, filing or in licensing U.S. and foreign patents and patent applications related to our proprietary technology, inventions and improvements that are important to the development and implementation of our business. We also rely on trademarks, trade secrets, know how, continuing technological innovation and potential in licensing opportunities to develop and maintain our proprietary position.
In addition to our proprietary expertise, we own a portfolio of patents and patent applications directed to LNP inventions, the formulation and manufacture of LNP-based pharmaceuticals, chemical modification of RNAi molecules, and RNAi drugs and processes directed at particular disease indications. We have filed many patent applications with the US and European Patent Offices that have been granted. In the US our patents might be challenged by interference or opposition proceedings.
In Europe, upon grant, a period of nine months is allowed for notification of opposition to such granted patents. If our patents are subjected to interference or opposition proceedings, we would incur significant costs to defend them. Further, our failure to prevail in any such proceedings could limit the patent protection available to our RNAi platform, including our product candidates.
We have a portfolio of approximately 95 patent families, in the U.S. and abroad, that are directed to various aspects of LNPs and LNP formulations. The portfolio includes approximately 72 issued U.S. patents, approximately 71 issued non-U.S. patents, and approximately 229 pending patent applications, including the following patents and applications in the United States and Europe (1) :
|
Invention
Category
|
Title
|
Priority
Filing
Date*
|
Status**
|
Expiration
Date***
|
|
LNP
|
Lipid Encapsulated Interfering RNA
|
07/16/2003
|
U.S. Pat. No.7,982,027; applications pending in the U.S. and Europe
|
07/16/2024
|
|
LNP
|
Lipid Encapsulated Interfering RNA
|
06/07/2004
|
U.S. Pat. No. 7,799,565; European Pat. No.1766035; application pending in the U.S.
|
06/07/2025
|
|
LNP
|
Novel Lipid Formulations for Nucleic Acid Delivery
|
04/15/2008
|
U.S. Pat. Nos. 8,058,069; 8,492,359 and 8,822,668; applications pending in U.S. and Europe.
|
04/15/2029
|
|
LNP
|
Novel Lipid Formulations for Delivery of Therapeutic Agents to Solid Tumors
|
07/01/2009
|
U.S. Pat. No.8,283,333 Applications pending in the U.S. and Europe
|
06/30/2030
|
|
LNP
Manufacturing
|
Liposomal Apparatus and Manufacturing Methods
|
06/28/2002
|
U.S. Pat. Nos. 7,901,708 and 8,329,070; European Pat. No. 1519714; application pending in the U.S.; application allowed in Europe
|
06/30/2023
|
|
LNP
Manufacturing
|
Systems and Methods for Manufacturing Liposomes
|
07/27/2005
|
Application pending in the U.S. and Europe
|
07/27/2026
|
|
Novel Lipids
|
Cationic Lipids and Methods of Use
|
06/07/2004
|
U.S. Pat. No. 7,745,651; European Pat. No. 1781593; application pending in the U.S.
|
06/07/2025
|
|
Novel Lipids
|
Polyethyleneglycol-Modified Lipid Compounds and Uses Thereof
|
09/15/2003
|
U.S. Pat. No. 7,803,397; European Pat. No. 1664316; application pending in the U.S.
|
09/15/2024
|
|
Chemical
Modifications
|
Modified siRNA Molecules and Uses Thereof
|
11/02/2005
|
U.S. Pat. Nos. 8,101,741,8,188,263 and 8,513,403; applications pending in Europe and the U.S.
|
11/02/2026
|
|
Chemical
Modifications
|
Modified siRNA Molecules and Uses Thereof
|
06/09/2006
|
U.S. Pat. No. 7,915,399
|
06/08/2027
|
|
Therapeutic
Target
|
siRNA Silencing of Apolipoprotein B
|
11/17/2004
|
Application pending in Europe
|
11/17/2025
|
|
Therapeutic
Target
|
Compositions and Methods for Silencing Apolipoprotein B
|
07/01/2009
|
U.S. Pat. No. 8,236,943 application pending in Europe
|
06/30/2030
|
|
Therapeutic
Target
|
siRNA Silencing of Filovirus Gene Expression
|
10/20/2005
|
U.S. Pat. No. 7,838,658
|
10/20/2026
|
|
Therapeutic
Target
|
Compositions and Methods for Silencing Ebola Virus Gene Expression
|
07/20/2009
|
Application allowed in the U.S.
|
07/20/2030
|
|
Therapeutic
Target
|
Silencing of Polo-Like Kinase Expression using Interfering RNA
|
12/27/2007
|
Applications pending in the U.S. and Europe
|
12/23/2028
|
20
|
(1)
|
Patent information current as of January 8, 2015.
|
|
*
|
Priority filing dates are based on the filing dates of provisional patent applications. Provisional applications expire unless they are converted to non-provisional applications within one year.
|
|
**
|
An “allowed” patent application is an active case that has been found by the patent office to contain patentable subject matter, subject to the payment of issue/grant fees by the applicant.
|
| *** | Once issued, the term of a US patent first filed after mid-1995 generally extends until the 20th anniversary of the filing date of the first non-provisional application to which such patent claims priority. It is important to note, however, that the United States Patent & Trademark Office, or USPTO, sometimes requires the filing of a Terminal Disclaimer during prosecution, which may shorten the term of the patent. On the other hand, certain patent term adjustments may be available based on USPTO delays during prosecution. Similarly, in the pharmaceutical area, certain patent term extensions may be available based on the history of the drug in clinical trials. We cannot predict whether or not any such adjustments or extensions will be available or the length of any such adjustments or extensions. |
Through our wholly-owned subsidiary, OnCore, we also have licenses to numerous patents and patent applications relating to HBV drug candidates, methods of manufacturing and development, diagnosis, treatment or prevention of hepatitis viruses in humans, among others.
Employees
At December 31, 2014, Tekmira had 103 employees, 75 of whom were engaged in research and development. As a result of our recent merger with OnCore, we are adding 11 additional employees. None of our employees are represented by a labor union or covered by a collective bargaining agreement, nor have we experienced any work stoppages. We believe that relations with our employees are good.
Corporate information
The company is comprised of six entities, Tekmira Pharmaceuticals Corporation (“Tekmira” or “we” or “us”) and five wholly owned subsidiaries (Protiva Biotherapeutics Inc., Protiva Agricultural Development Company Inc., Protiva Biotherapeutics (USA) Inc., OnCore Biopharma, Inc and Enantigen Therapeutics, Inc). Tekmira was incorporated pursuant to the British Columbia Business Corporations Act, or BCBCA, on October 6, 2005 and commenced active business on April 30, 2007 when Tekmira and its parent company, Inex Pharmaceuticals Corporation, or Inex, were reorganized under a statutory plan of arrangement (the Reorganization) completed under the provisions of the BCBCA. The Reorganization saw Inex’s entire business transferred to and continued by Tekmira. Protiva Biotherapeutics Inc., is incorporated under the BCBCA and was acquired by Tekmira Pharmaceuticals Corporation on May 30, 2008. Protiva Biotherapeutics (USA) Inc., is incorporated in the State of Delaware and was acquired by Tekmira Pharmaceuticals Corporation on May 30, 2008. Protiva Agricultural Development Company Inc., is incorporated under the BCBCA and was formed on January 9, 2014. On March 4, 2015, we completed a business combination with OnCore Biopharma, Inc., that is intended to create a leading global hepatitis B virus (HBV) company focused on developing a curative regimen for HBV patients by combining multiple therapeutic approaches. OnCore has one subsidiary, Enantigen Therapeutics, Inc.
Tekmira’s head office and principal place of business is located at 100—8900 Glenlyon Parkway, Burnaby, British Columbia, Canada, V5J 5J8 (telephone: (604) 419-3200). The Company’s registered and records office is located at 700 West Georgia St, 25th Floor, Vancouver, British Columbia, Canada, V7Y 1B3. The address of the Seattle office is 1100 Dexter Ave N. Suite 100, Seattle, WA 98109. OnCore’s offices are located at 3805 Old Easton Road, Doylestown, PA 18902.
Investor information
We are a reporting issuer in Canada under the securities laws of each of the Provinces of Canada. On March 3, 2015, Tekmira’s common shares were voluntarily delisted from the Toronto Stock Exchange. Since November 15, 2010, Tekmira’s common shares have been trading on the NASDAQ Global Market under the symbol “TKMR.” Tekmira's common shares will continue to be listed and trade on the NASDAQ under the ticker symbol of "TKMR" and its Canadian shareholders will be able to continue to trade through their brokers on that exchange.
We maintain an internet website at http://www.tekmira.com
.
The information on our website is not incorporated by reference into this annual report on Form 10-K and should not be considered to be a part of this annual report on Form 10-K. Our website address is included in this annual report on Form 10-K as an inactive technical reference only. Our reports filed or furnished pursuant to Section 13(a) or 15(d) of the Securities Exchange Act of 1934, as amended, including our annual reports on Form 10-K (annual reports on Form 20-F up to year-ended December 31, 2012), our quarterly reports on Form 10-Q (quarterly reports on Form 6-K up to quarter-ended September 30, 2013) and our current reports on Form 8-K, and amendments to those reports, are accessible through our website, free of charge, as soon as reasonably practicable after these reports are filed electronically with, or otherwise furnished to, the SEC. We also make available on our website the charters of our audit committee, executive compensation and human resources committee and corporate governance and nominating committee, whistleblower policy, insider trading policy, and majority voting policy, as well as our code of business conduct and ethics for directors, officers and employees. In addition, we intend to disclose on our web site any amendments to, or waivers from, our code of business conduct and ethics that are required to be disclosed pursuant to the SEC rules.
21
You may read and copy any materials we file with the SEC at the SEC’s Public Reference Room at 100 F Street, NE, Washington, DC 20549. You may obtain information on the operation of the Public Reference Room by calling the SEC at 1-800-SEC-0330. The SEC also maintains an Internet website that contains reports, proxy and information statements, and other information regarding Tekmira and other issuers that file electronically with the SEC. The SEC’s Internet website address is http://www.sec.gov.
|
Item 1A.
|
Risk Factors
|
Our business is subject to numerous risks. We caution you that the following important factors, among others, could cause our actual results to differ materially from those expressed in forward-looking statements made by us or on our behalf in filings with the SEC, press releases, communications with investors and oral statements. All statements other than statements relating to historical matters should be considered forward-looking statements. When used in this report, the words “believe,” “expect,” “plan,” “anticipate,” “estimate,” “predict,” “may” “could” “should,” “intend,” “will,” “target,” “goal” and similar expressions are intended to identify forward-looking statements, although not all forward-looking statements contain these words. Any or all of our forward-looking statements in this annual report on Form 10-K and in any other public statements we make may turn out to be wrong. They can be affected by inaccurate assumptions we might make or by known or unknown risks and uncertainties. Many factors mentioned in the discussion below will be important in determining future results. Consequently, no forward-looking statement can be guaranteed. Actual future results may vary materially from those anticipated in forward-looking statements. We explicitly disclaim any obligation to update any forward-looking statements to reflect events or circumstances that arise after the date hereof. You are advised, however, to consult any further disclosure we make in our reports filed with the SEC.
Risks Related to Our Business
We are in the early stages of our development and because we have a short development history with ribonucleic acid interference (RNAi) and assets relating to HBV, there is a limited amount of information about us upon which you can evaluate our RNAi business and prospects, and our HBV business and prospects.
We have not begun to market or generate revenues from the commercialization of any RNAi products or our HBV products. We have only a limited history upon which one can evaluate our business and prospects as our therapeutic products are still at an early stage of development and thus we have limited experience and have not yet demonstrated an ability to successfully overcome many of the risks and uncertainties frequently encountered by companies in new and rapidly evolving fields, particularly in the biopharmaceutical area. For example, to execute our business plan, we will need to successfully:
|
·
|
execute research and development activities using RNAi technology; and technologies involved in the development of HBV therapeutics;
|
|
|
·
|
build, maintain and protect a strong intellectual property portfolio;
|
|
|
·
|
gain acceptance for the development and commercialization of any product we develop;
|
|
|
·
|
develop and maintain successful strategic relationships; and
|
|
|
·
|
manage our spending and cash requirements as our expenses are expected to increase due to research and preclinical work, clinical trials, regulatory approvals, and commercialization and maintaining our intellectual property portfolio
|
If we are unsuccessful in accomplishing these objectives, we may not be able to develop products, raise capital, expand our business or continue our operations.
The approach we are taking to discover and develop novel drug products is unproven and may never lead to marketable drug products.
We intend to concentrate our internal research and development efforts in the future primarily on the discovery and development of therapeutics targeting chronic hepatitis B to be able to ultimately develop a cure for the disease. Our future success depends in part on the successful development of these therapeutics.
Our approach to the treatment of HBV is unproven, and we do not know whether we will be able to develop any drugs of commercial value.
There is no known cure for HBV. Any compounds that we develop may not effectively address the three key factors driving HBV persistence that we believe should be targeted in order to cure HBV. Even if we are able to develop compounds that address one or more of these key factors, targeting these key factors has not been proven to cure HBV. Further, our focus on the elimination of cccDNA as the critical component of developing a cure for HBV may be misplaced in the event that the elimination of cccDNA does not prove to contribute to a cure for HBV. In addition, we may be unable to develop a drug that successfully eliminates cccDNA. We may be unable to acquire additional drug candidates on terms acceptable to us, or at all. Even if we are able to acquire or develop drug candidates that address one of these mechanisms of action in preclinical studies, we may not succeed in demonstrating safety and efficacy of the drug candidate in human clinical trials. If we are unable to identify suitable compounds for preclinical and clinical development, we will not succeed in realizing our goal of a cure for HBV.
22
We also intend to continue research and development efforts on RNAi technology and products based on RNAi technology. While RNAi technology is based on a naturally occurring process that takes place inside cells, which can suppress the production of specific proteins, and has the potential to generate therapeutic drugs that take advantage of that process, neither we nor any other company has received regulatory approval to market a therapeutic product based on RNAi technology. The scientific discoveries that form the basis for our efforts to discover and develop new products are relatively new. While there are a number of RNAi therapeutics in development, very few product candidates based on these discoveries have ever been tested in humans and there can be no assurance that any RNAi therapeutic product will be approved for commercial use.
If we are not successful in developing a product with our research and development efforts, we may be required to change the scope and direction of our product development activities. In that case, we may not be able to identify and implement successfully an alternative product development strategy.
We expect to depend in part on our existing collaborators for a significant portion of our revenues and to develop, conduct clinical trials with, obtain regulatory approvals for, and manufacture, market and sell some of our product candidates. If these collaborations are unsuccessful, or anticipated milestone payments are not received, our business could be adversely affected.
We expect that we will depend in part on Alnylam, Spectrum, the DoD, and Monsanto to provide revenue to fund our operations, especially in the near term. The DoD represented 63% of our operating revenue for the year ended December 31, 2014. Furthermore, our strategy is to enter into various additional arrangements with corporate and academic collaborators, licensors, licensees and others for the research, development, clinical testing, manufacturing, marketing and commercialization of our products. We may be unable to continue to establish such collaborations, and any collaborative arrangements we do establish may be unsuccessful, or we may not receive milestone payments as anticipated.
Should any collaborative partner fail to develop or ultimately successfully commercialize any of the products to which it has obtained rights, our business may be adversely affected. In addition, once initiated, there can be no assurance that any of these collaborations will be continued or result in successfully commercialized products. Failure of a collaborative partner to continue funding any particular program could delay or halt the development or commercialization of any products arising out of such program. In addition, there can be no assurance that the collaborative partners will not pursue alternative technologies or develop alternative products either on their own or in collaboration with others, including our competitors, as a means for developing treatments for the diseases targeted by our programs.
We expect to spend substantial amounts to acquire additional drug candidates, to conduct further research and development and preclinical testing and clinical trials of our drug candidates, to seek regulatory approvals for our drug candidates and to launch and commercialize any drug candidates for which we receive regulatory approval. These expenditures will include costs associated with our and our subsidiary’s licensing agreements with Blumberg, or Drexel, and NeuroVive and Cytos. Under the terms of these agreements, we are obligated to make significant cash payments upon the achievement of specified development, regulatory and sales performance milestones, as well as royalty payments in connection with the sale of licensed products, to our licensors.
We have a contract with the DoD for $43.8 million for our TKM-Ebola program through to the completion of a Phase 1 human safety clinical trial and certain manufacturing objectives. The DoD may later extend the contract to cover the entire TKM-Ebola program through to FDA drug approval.
This is our first DoD contract of any notable size. Our lack of experience in dealing with the DoD brings uncertainty into our cash flow projections and uncertainty into our ability to execute the contract within DoD requirements. Furthermore, there is inherent risk in projecting cash flows years ahead for such a complex program. The quantum and timing of funding for the TKM-Ebola program may not be what we have projected and under the terms of the contract or the proposed modification to the contract and the DoD could cancel or suspend this funding, which is paid through monthly reimbursements, at any time.
We rely on third parties to conduct our clinical trials, and if they fail to fulfill their obligations, our development plans may be adversely affected.
We rely on independent clinical investigators, contract research organizations and other third-party service providers to assist us in managing, monitoring and otherwise carrying out our clinical trials. We have contracted with, and we plan to continue to contract with, certain third parties to provide certain services, including site selection, enrolment, monitoring and data management services. Although we depend heavily on these parties, we do not control them and therefore, we cannot be assured that these third parties will adequately perform all of their contractual obligations to us. If our third-party service providers cannot adequately fulfill their obligations to us on a timely and satisfactory basis or if the quality or accuracy of our clinical trial data is compromised due to failure to adhere to our protocols or regulatory requirements, or if such third parties otherwise fail to meet deadlines, our development plans may be delayed or terminated.
23
We have no sales, marketing or distribution experience and would have to invest significant financial and management resources to establish these capabilities.
We have no sales, marketing or distribution experience. We currently expect to rely heavily on third parties to launch and market certain of our products, if approved. However, if we elect to develop internal sales, distribution and marketing capabilities, we will need to invest significant financial and management resources. For products where we decide to perform sales, marketing and distribution functions ourselves, we could face a number of additional risks, including:
|
·
|
we may not be able to attract and build a significant marketing or sales force;
|
|
|
·
|
the cost of establishing a marketing or sales force may not be justifiable in light of the revenues generated by any particular product; and
|
|
|
·
|
our direct sales and marketing efforts may not be successful.
|
If we are unable to develop our own sales, marketing and distribution capabilities, we will not be able to successfully commercialize our products, if approved, without reliance on third parties.
We will rely on third-party manufacturers to manufacture our products (if approved) in commercial quantities, which could delay, prevent or increase the costs associated with the future commercialization of our products.
Our product candidates have not yet been manufactured for commercial use. If any of our product candidates become approved for commercial sale, in order to supply our or our collaborators’ commercial requirements for such an approved product, we will need to establish third-party manufacturing capacity. Any third-party manufacturing partner may be required to fund capital improvements to support the scale-up of manufacturing and related activities. The third-party manufacturer may not be able to establish scaled manufacturing capacity for an approved product in a timely or economic manner, if at all. If a manufacturer is unable to provide commercial quantities of such an approved product, we will have to successfully transfer manufacturing technology to a new manufacturer. Engaging a new manufacturer for such an approved product could require us to conduct comparative studies or utilize other means to determine bioequivalence of the new and prior manufacturers’ products, which could delay or prevent our ability to commercialize such an approved product. If any of these manufacturers is unable or unwilling to increase its manufacturing capacity or if we are unable to establish alternative arrangements on a timely basis or on acceptable terms, the development and commercialization of such an approved product may be delayed or there may be a shortage in supply. Any inability to manufacture our products in sufficient quantities when needed would seriously harm our business.
Manufacturers of our approved products, if any, must comply with current good manufacturing practices (cGMP) requirements enforced by the FDA and Health Canada through facilities inspection programs. These requirements include quality control, quality assurance, and the maintenance of records and documentation. Manufacturers of our approved products, if any, may be unable to comply with these cGMP requirements and with other FDA, Health Canada, state, and foreign regulatory requirements. We have little control over our manufacturers’ compliance with these regulations and standards. A failure to comply with these requirements may result in fines and civil penalties, suspension of production, suspension or delay in product approval, product seizure or recall, or withdrawal of product approval. If the safety of any quantities supplied is compromised due to our manufacturer’s failure to adhere to applicable laws or for other reasons, we may not be able to obtain regulatory approval for or successfully commercialize our products, which would seriously harm our business.
Risks Related to Our Financial Results and Need for Financing
We will require substantial additional capital to fund our operations. If additional capital is not available, we may need to delay, limit or eliminate our research, development and commercialization processes and may need to undertake a restructuring.
Within the next several years, substantial additional funds will be required to continue with the active development of our pipeline products and technologies. In particular, our funding needs may vary depending on a number of factors including:
|
·
|
revenues earned from our partners, including Alnylam, Spectrum, Monsanto, and Dicerna;
|
|
|
·
|
revenues earned from our DoD contract to develop TKM-Ebola;
|
|
|
·
|
the extent to which we continue the development of our product candidates or form collaborative relationships to advance our products;
|
|
|
·
|
our decisions to in-license or acquire additional products or technology for development,
|
|
|
·
|
our ability to attract and retain corporate partners, and their effectiveness in carrying out the development and ultimate commercialization of our product candidates;
|
|
|
·
|
whether batches of drugs that we manufacture fail to meet specifications resulting in delays and investigational and remanufacturing costs;
|
|
|
·
|
the decisions, and the timing of decisions, made by health regulatory agencies regarding our technology and products;
|
|
|
·
|
competing technological and market developments; and
|
|
|
·
|
prosecuting and enforcing our patent claims and other intellectual property rights.
|
24
We will seek to obtain funding to maintain and advance our business from a variety of sources including public or private equity or debt financing, collaborative arrangements with pharmaceutical and biotechnology companies and government grants and contracts. There can be no assurance that funding will be available at all or on acceptable terms to permit further development of our products especially in light of the current difficult climate for investment in early stage biotechnology companies.
If adequate funding is not available, we may be required to delay, reduce or eliminate one or more of our research or development programs or reduce expenses associated with non-core activities. We may need to obtain funds through arrangements with collaborators or others that may require us to relinquish most or all of our rights to product candidates at an earlier stage of development or on less favorable terms than we would otherwise seek if we were better funded. Insufficient financing may also mean failing to prosecute our patents or relinquishing rights to some of our technologies that we would otherwise develop or commercialize.
We have incurred losses in nearly every year since our inception and we anticipate that we will not achieve sustained profits for the foreseeable future. To date, we have had no product revenues.
With the exception of the year ended December 31, 2006 and December 31, 2012, we have incurred losses each fiscal year since inception until December 31, 2014 and have not received any revenues other than from research and development collaborations, license fees and milestone payments. From inception to December 31, 2014, we have an accumulated net deficit of $ 206 million. As we continue our research and development and clinical trials and seek regulatory approval for the sale of our product candidates, we do not expect to attain sustained profitability for the foreseeable future. We do not expect to achieve sustained profits until such time as strategic alliance payments, product sales and royalty payments, if any, generate sufficient revenues to fund our continuing operations. We cannot predict if we will ever achieve profitability and, if we do, we may not be able to remain consistently profitable or increase our profitability.
Risks Related to Managing Our Operations
If we are unable to attract and retain qualified key management, scientific staff, consultants and advisors, our ability to implement our business plan may be adversely affected.
We depend upon our senior executive officers as well as key scientific, management and other personnel. The competition for qualified personnel in the biotechnology field is intense. We rely heavily on our ability to attract and retain qualified managerial, scientific and technical staff. The loss of the service of any of the members of our senior management, including Dr. Mark Murray, our Chief Executive Officer, may adversely affect our ability to develop our technology, add to our pipeline, advance our product candidates and manage our operations.
We may have difficulty managing our growth and expanding our operations successfully as we seek to evolve from a company primarily involved in discovery and preclinical testing into one that develops products through clinical development and commercialization.
As product candidates we develop enter and advance through clinical trials, we will need to expand our development, regulatory, manufacturing, clinical and medical capabilities or contract with other organizations to provide these capabilities for us. As our operations expand, we expect that we will need to manage additional relationships with various collaborators, suppliers and other organizations. Our ability to manage our operations and growth will require us to continue to improve our operational, financial and management controls, reporting systems and procedures. We may not be able to implement improvements to our management information and control systems in an efficient or timely manner and may discover deficiencies in existing systems or controls.
We could face liability from our controlled use of hazardous and radioactive materials in our research and development processes.
We use certain radioactive materials, biological materials and chemicals, including organic solvents, acids and gases stored under pressure, in our research and development activities. Our use of radioactive materials is regulated by the Canadian Nuclear Safety Commission for the possession, transfer, import, export, use, storage, handling and disposal of radioactive materials. Our use of biological materials and chemicals, including the use, manufacture, storage, handling and disposal of such materials and certain waste products is regulated by a number of federal, provincial and local laws and regulations. Although we believe that our safety procedures for handling such materials comply with the standards prescribed by such laws and regulations, the risk of accidental contamination or injury from these materials cannot be completely eliminated. In the event of such an accident, we could be held liable for any damages that result and any such liability could exceed our resources. We are not specifically insured with respect to this liability.
Our business and operations could suffer in the event of information technology system failures.
Despite the implementation of security measures, our internal computer systems and those of our contractors and consultants are vulnerable to damage from computer viruses, unauthorized access, natural disasters, terrorism, war, and telecommunication and electrical failures. Such events could cause interruption of our operations. For example, the loss of pre-clinical trial data or data from completed or ongoing clinical trials for our product candidates could result in delays in our regulatory filings and development efforts and significantly increase our costs. To the extent that any disruption or security breach will result in a loss of or damage to our data, or inappropriate disclosure of confidential or proprietary information, we could incur liability and the development of our product candidates could be delayed.
25
If, in the future, our internal control over financial reporting is not effective, it could have a material adverse effect on our stock price and our ability to raise capital.
We have completed an independent audit of our internal control over financial reporting for our fiscal year ending December 31, 2014 and no material weaknesses have been identified. If our internal control over financial reporting is determined in the future to not be effective, whether by our management or by our independent auditors, there could be an adverse reaction in the financial markets due to a loss of confidence in the reliability of our financial statements, which could materially adversely affect our stock price and our ability to raise capital necessary to operate our business. In addition, we may be required to incur costs in improving our internal control system and hiring additional personnel.
The failure to integrate successfully the businesses of Tekmira and OnCore in the expected timeframe would adversely affect Tekmira’s future results following the completion of the merger.
Tekmira recently closed a merger transaction whereby OnCore became its wholly owned subsidiary. The success of Tekmira will depend, in large part, on the ability of Tekmira to realize the anticipated benefits from this merger, including operating synergies, from combining the businesses of Tekmira and OnCore. To realize these anticipated benefits, Tekmira must successfully integrate the businesses of Tekmira and OnCore. This integration will be complex and time-consuming.
Tekmira can offer no assurance that it realize the benefits anticipated to result from the merger.
Potential difficulties that may be encountered in the integration process include the following:
• complexities associated with managing the larger, combined business;
• integrating personnel from the two companies;
• potential unknown liabilities and unforeseen expenses, delays or regulatory conditions associated with the merger;
• performance shortfalls at one or both of the companies as a result of the diversion of management’s attention caused by completing the merger and integrating the companies’ operations and
• challenges related to the management and monitoring of new operations and associated increased costs and complexity.
Tekmira’s success will be dependent on its ability to maintain and renew relationships with pre-existing third party relationships. There can be no assurance that the business of Tekmira will be able to maintain pre-existing business relationships, or enter into or maintain new business relationships, on acceptable terms, if at all. The failure to maintain important pre-existing third party relationships could have a material adverse effect on the business, financial condition or results of operations of Tekmira.
Risks Related to Development, Clinical Testing and Regulatory Approval of Our Product Candidates
The manufacture and sale of human therapeutic products are governed by a variety of statutes and regulations. There can be no assurance that our product candidates will obtain regulatory approval.
To obtain marketing approval, U.S. and Canadian laws require:
|
·
|
controlled research and human clinical testing;
|
|
|
·
|
establishment of the safety and efficacy of the product for each use sought;
|
|
|
·
|
government review and approval of a submission containing manufacturing, pre-clinical and clinical data;
|
|
|
·
|
adherence to Good Manufacturing Practice Regulations during production and storage; and
|
|
|
·
|
control of marketing activities, including advertising and labelling
|
The product candidates we currently have under development will require significant development, pre-clinical trial and clinical testing and investment of significant funds before their commercialization. Some of our product candidates, if approved, will require the completion of post-market studies. There can be no assurance that such products will be developed. The process of completing clinical testing and obtaining required approvals is likely to take a number of years and require the use of substantial resources. If we fail to obtain regulatory approvals, our operations will be adversely affected. Further, there can be no assurance that product candidates employing a new technology will be shown to be safe and effective in clinical trials or receive applicable regulatory approvals.
26
Other markets have regulations and restrictions similar to those in the U.S. and Canada. Investors should be aware of the risks, problems, delays, expenses and difficulties which we may encounter in view of the extensive regulatory environment which affects our business in any jurisdiction where we develop product candidates.
If testing of a particular product candidate does not yield successful results, then we will be unable to commercialize that product candidate.
We must demonstrate our product candidates’ safety and efficacy in humans through extensive clinical testing. Our research and development programs are at an early stage of development. We may experience numerous unforeseen events during, or as a result of, the testing process that could delay or prevent commercialization of any products, including the following:
|
·
|
decreased demand for our product candidates;
|
|
|
·
|
impairment of our business reputation;
|
|
|
·
|
withdrawal of clinical trial participants;
|
|
|
·
|
costs of related litigation;
|
|
|
·
|
substantial monetary awards to patients or other claimants;
|
|
|
·
|
loss of revenues; and
|
|
|
·
|
inability to commercialize our product candidates.
|
Although we currently have product liability insurance coverage for our clinical trials for expenses or losses, our insurance coverage is limited to $10 million per occurrence, and $10 million in the aggregate, and may not reimburse us or may not be sufficient to reimburse us for any or all expenses or losses we may suffer. Moreover, insurance coverage is becoming increasingly expensive and, in the future, we may not be able to maintain insurance coverage at a reasonable cost or in sufficient amounts to protect us against losses due to liability. We intend to expand our insurance coverage to include the sale of commercial products if we obtain marketing approval for our product candidates in development, but we may be unable to obtain commercially reasonable product liability insurance for any products approved for marketing. On occasion, large judgments have been awarded in class action lawsuits based on products that had unanticipated side effects. A successful product liability claim or series of claims brought against us could cause our stock price to fall and, if judgments exceed our insurance coverage, could decrease our cash and adversely affect our business.
The Animal Rule is a new and seldom-used approach to seeking approval of a new drug, and our TKM-Ebola program may not meet the requirements for this path to regulatory approval.
We plan to develop the TKM-Ebola therapeutic product candidate to treat Ebola virus using the “Animal Rule” regulatory mechanism. Pursuant to the Animal Rule, we must demonstrate efficacy in animal models and safety in humans. There is no guarantee that the FDA will agree to this approach for the development of TKM-Ebola, considering that no validated animal model has been established as predicting human outcomes in the prevention or treatment of the Ebola virus. The FDA may decide that our data are insufficient for approval and require additional pre-clinical, clinical, or other studies, or refuse to approve our products, or place restrictions on our ability to commercialize those products. Animal models represent, at best, a rough approximation of efficacy in humans, and, as such, countermeasures developed using animal models will be untested until their use in humans during an emergency.
Recently enacted and future legislation may increase the difficulty and cost for us to obtain marketing approval of and commercialize our drug candidates and affect the prices we may obtain.
In the United States and some foreign jurisdictions, there have been a number of legislative and regulatory changes and proposed changes regarding the healthcare system that could, among other things, prevent or delay marketing approval of our drug candidates, restrict or regulate post approval activities and affect our ability to profitably sell any products for which we obtain marketing approval.
For example, in March 2010, the Patient Protection and Affordable Care Act, as amended by the Health Care Education Reconciliation Act, or collectively the Affordable Care Act, was enacted to broaden access to health insurance, reduce or constrain the growth of healthcare spending, enhance remedies against fraud and abuse, add new transparency requirements for health care and health insurance industries, impose new taxes and fees on the health industry and impose additional health policy reforms. Although it is too early to determine the effect of the Affordable Care Act, the new law appears likely to continue the downward pressure on pharmaceutical pricing, especially under the Medicare program, and may also increase our regulatory burdens and operating costs.
Moreover, the recently enacted Drug Supply Chain Security Act imposes new obligations on manufacturers of pharmaceutical products related to product and tracking and tracing. Legislative and regulatory proposals have been made to expand post approval requirements and restrict sales and promotional activities for pharmaceutical products. We are not sure whether additional legislative changes will be enacted, or whether the current regulations, guidance or interpretations will be changed, or what the impact of such changes on our business, if any, may be.
27
Coverage and adequate reimbursement may not be available for our drug candidates, which could make it difficult for us to sell our products profitably
.
Market acceptance and sales of any drug candidates that we develop, will depend in part on the extent to which reimbursement for these products and related treatments will be available from third party payors, including government health administration authorities and private health insurers. Third party payors decide which drugs they will pay for and establish reimbursement levels. Third party payors often rely upon Medicare coverage policy and payment limitations in setting their own reimbursement policies. However, decisions regarding the extent of coverage and amount of reimbursement to be provided for each of our drug candidates will be made on a plan by plan basis. One payors determination to provide coverage for a product does not assure that other payors will also provide coverage, and adequate reimbursement, for the product. Additionally, a third party payors decision to provide coverage for a drug does not imply that an adequate reimbursement rate will be approved. Each plan determines whether or not it will provide coverage for a drug, what amount it will pay the manufacturer for the drug, and on what tier of its formulary the drug will be placed. The position of a drug on a formulary generally determines the copayment that a patient will need to make to obtain the drug and can strongly influence the adoption of a drug by patients and physicians. Patients who are prescribed treatments for their conditions and providers performing the prescribed services generally rely on third party payors to reimburse all or part of the associated healthcare costs. Patients are unlikely to use our products unless coverage is provided and reimbursement is adequate to cover a significant portion of the cost of our products.
A primary trend in the U.S. healthcare industry and elsewhere is cost containment. Third party payors have attempted to control costs by limiting coverage and the amount of reimbursement for particular medications. We cannot be sure that coverage and reimbursement will be available for any product that we commercialize and, if reimbursement is available, what the level of reimbursement will be. Inadequate coverage and reimbursement may impact the demand for, or the price of, any product for which we obtain marketing approval. If coverage and adequate reimbursement is not available, or is available only to limited levels, we may not be able to successfully commercialize any drug candidates that we develop.
Additionally, there have been a number of legislative and regulatory proposals to change the healthcare system in the United States and in some foreign jurisdictions that could affect our ability to sell any future drugs profitably. These legislative and regulatory changes may negatively impact the reimbursement for any future drugs, following approval.
Risks Related to Patents, Licenses and Trade Secrets
Other companies or organizations may assert patent rights that prevent us from developing or commercializing our products.
RNA interference is a relatively new scientific field that has generated many different patent applications from organizations and individuals seeking to obtain patents in the field. These applications claim many different methods, compositions and processes relating to the discovery, development and commercialization of RNAi therapeutic products. Because the field is so new, very few of these patent applications have been fully processed by government patent offices around the world, and there is a great deal of uncertainty about which patents will be issued, when, to whom, and with what claims. It is likely that there could be litigation and other proceedings, such as interference and opposition proceedings in various patent offices, relating to patent rights in RNAi.
In addition, there are many issued and pending patents that claim aspects of RNAi trigger chemistry technology that we may need to apply to our product candidates. There are also many issued patents that claim genes or portions of genes that may be relevant for RNAi trigger drug products we wish to develop. Thus, it is possible that one or more organizations will hold patent rights to which we will need a license. If those organizations refuse to grant us a license to such patent rights on reasonable terms, we will not be able to market products or perform research and development or other activities covered by these patents.
Our patents and patent applications may be challenged and may be found to be invalid, which could adversely affect our business.
Certain Canadian, U.S. and international patents and patent applications we own involve complex legal and factual questions for which important legal principles are largely unresolved. For example, no consistent policy has emerged for the breadth of biotechnology patent claims that are granted by the U.S. Patent and Trademark Office or enforced by the U.S. federal courts. In addition, the coverage claimed in a patent application can be significantly reduced before a patent is issued. Also, we face the following intellectual property risks:
|
·
|
some or all patent applications may not result in the issuance of a patent;
|
|
|
·
|
patents issued may not provide the holder with any competitive advantages;
|
|
|
·
|
patents could be challenged by third parties;
|
|
|
·
|
the patents of others, including Alnylam, could impede our ability to do business;
|
|
|
·
|
competitors may find ways to design around our patents; and
|
|
|
·
|
competitors could independently develop products which duplicate our products.
|
A number of industry competitors and institutions have developed technologies, filed patent applications or received patents on various technologies that may be related to or affect our business. Some of these technologies, applications or patents may conflict with our technologies or patent applications. Such conflict could limit the scope of the patents, if any, that we may be able to obtain or result in the denial of our patent applications. In addition, if patents that cover our activities are issued to other companies, there can be no assurance that we would be able to obtain licenses to these patents at a reasonable cost or be able to develop or obtain alternative technology. If we do not obtain such licenses, we could encounter delays in the introduction of products, or could find that the development, manufacture or sale of products requiring such licenses is prohibited. In addition, we could incur substantial costs in defending patent infringement suits brought against us or in filing suits against others to have such patents declared invalid. As publication of discoveries in the scientific or patent literature often lags behind actual discoveries, we cannot be certain we or any licensor was the first creator of inventions covered by pending patent applications or that we or such licensor was the first to file patent applications for such inventions. Any future proceedings could result in substantial costs, even if the eventual outcomes are favorable. There can be no assurance that our patents, if issued, will be held valid or enforceable by a court or that a competitor’s technology or product would be found to infringe such patents.
28
Our business depends, in part, on our ability to use RNAi technology that we have licensed or will in the future license from third parties, including Alnylam, and, if these licenses were terminated or if we were unable to license additional technology we may need in the future, our business will be adversely affected.
We currently hold licenses for certain technologies that are or may be applicable to our current and subsequent product candidates. These include a license to patents held or applied for by Alnylam and a license to UNA technology from Arcturus Therapeutics. The licenses are subject to termination in the event of a breach by us of the license, if we fail to cure the breach following notice and the passage of a cure period. The UBC license, which is sublicensed to Alnylam, is subject to termination with respect to one or more particular patents if we and Alnylam were to cease patent prosecution or maintenance activities with respect to such patent(s), or in the event of a breach by us of the license, if we fail to cure the breach following notice and the passage of a cure period. There can be no assurance that these licenses will not be terminated. We may need to acquire additional licenses in the future to technologies developed by others, including Alnylam. For example, Alnylam has granted us a worldwide license for the discovery, development and commercialization of RNAi products directed to thirteen gene targets (three exclusive and ten non-exclusive licenses). Licenses for the five non-exclusive targets and one exclusive target have already been granted. We have rights to select the gene targets for up to two more exclusive licenses and five more nonexclusive licenses from Alnylam, which would be made available to us only if they have not been previously selected by Alnylam or one of its other partners. This will limit the targets available for selection by us, and we may never be able to select gene targets or may be required to make our selection from gene targets that have minimal commercial potential. Furthermore, future license agreements may require us to make substantial milestone payments. We will also be obligated to make royalty payments on the sales, if any, of products resulting from licensed RNAi technology. For some of our licensed RNAi technology, we are responsible for the costs of filing and prosecuting patent applications. The termination of a license or the inability to license future technologies on acceptable terms may adversely affect our ability to develop or sell our products.
Our business depends, in part, on our ability to use the technology that we have licensed or will in the future license from third parties, including Blumberg, NeuroVive and Cytos, and, if these licenses were terminated or if we were unable to license additional technology we may need in the future, our business will be adversely affected.
Through our wholly owned subsidiary, OnCore, we have licensed certain of our intellectual property from Blumberg and NeuroVive and Cytos. Our current technology licenses are critical to our business and we expect to enter into additional licenses in the future. If we fail to comply with our obligations under these agreements or any future license agreements, we are subject to a bankruptcy, or if we grant a sublicense in the future and our sublicense does not comply with our obligations under these agreements or becomes subject to a bankruptcy, the licensor may have the right to terminate the license, in which event we would not be able to develop or market products covered by the license or may face other penalties under the agreements, which would have a materially adverse effect on our business. In addition, applicable laws involving bankruptcy or similar proceeding by licensors in some jurisdictions outside the United States may provide the trustee or receiver in such proceeding with the right to set aside or otherwise terminate or seek to modify the license. Any termination of these agreements or reduction or elimination of our rights under these agreements may result in our having to negotiate new or amended agreements with less favorable terms, or cause us to lose our rights under these agreements, including our rights to important intellectual property and technologies that form the basis of our technology, which may then be in licensed by one or more of our competitors.
We may incur substantial costs as a result of litigation or other proceedings relating to patent and other intellectual property rights which could have a material adverse effect on our business, financial condition and results of operations and could cause the market value of our Common Shares to decline.
There has been significant litigation in the biotechnology industry over contractual obligations, patents and other proprietary rights, and we may become involved in various types of litigation that arise from time to time. Involvement in litigation could consume a substantial portion of our resources, regardless of the outcome of the litigation. Counterparties in litigation may be better able to sustain the costs of litigation because they have substantially greater resources. If claims against us are successful, in addition to any potential liability for damages, we could be required to obtain a license, grant cross-licenses, and pay substantial milestones or royalties in order to continue to develop, manufacture or market the affected products. Involvement and continuation of involvement in litigation may result in significant and unsustainable expense, and divert management’s attention from ongoing business concerns and interfere with our normal operations. Litigation is also inherently uncertain with respect to the time and expenses associated therewith, and involves risks and uncertainties in the litigation process itself, such as discovery of new evidence or acceptance of unanticipated or novel legal theories, changes in interpretation of the law due to decisions in other cases, the inherent difficulty in predicting the decisions of judges and juries and the possibility of appeals. Ultimately we could be prevented from commercializing a product or be forced to cease some aspect of our business operations as a result of claims of patent infringement or violation of other intellectual property rights and the costs associated with litigation, which could have a material adverse effect on our business, financial condition, and operating results and could cause the market value of our Common Shares to decline.
29
Confidentiality agreements with employees and others, including collaborators, may not adequately prevent disclosure of trade secrets and other proprietary information.
Much of our know-how and technology may constitute trade secrets. There can be no assurance, however, that we will be able to meaningfully protect our trade secrets. In order to protect our proprietary technology and processes, we rely in part on confidentiality agreements with our collaborators, employees, vendors, consultants, outside scientific collaborators and sponsored researchers, and other advisors. These agreements may not effectively prevent disclosure of confidential information and may not provide an adequate remedy in the event of unauthorized disclosure of confidential information. In addition, others may independently discover trade secrets and proprietary information, and in such cases we could not assert any trade secret rights against such party. Costly and time consuming litigation could continue to be necessary to enforce and determine the scope of our proprietary rights, and failure to obtain or maintain trade secret protection could adversely affect our competitive business position.
Risks Related to Competition
The pharmaceutical market is intensely competitive. If we are unable to compete effectively with existing drugs, new treatment methods and new technologies, we may be unable to successfully commercialize any product candidates that we develop.
The pharmaceutical market is intensely competitive and rapidly changing. Many large pharmaceutical and biotechnology companies, academic institutions, governmental agencies and other public and private research organizations are pursuing the development of novel drugs for the same diseases that we are targeting or expect to target. Many of our competitors have:
|
·
|
much greater financial, technical and human resources than we have at every stage of the discovery, development, manufacture and commercialization process;
|
|
|
·
|
more extensive experience in pre-clinical testing, conducting clinical trials, obtaining regulatory approvals, and in manufacturing, marketing and selling pharmaceutical products;
|
|
|
·
|
product candidates that are based on previously tested or accepted technologies;
|
|
|
·
|
products that have been approved or are in late stages of development; and
|
|
|
·
|
collaborative arrangements in our target markets with leading companies and research institutions.
|
We will face intense competition from products that have already been approved and accepted by the medical community for the treatment of the conditions for which we are currently developing products. We also expect to face competition from new products that enter the market. We believe a significant number of products are currently under development, and may become commercially available in the future, for the treatment of conditions for which we may try to develop products. These products, or other of our competitors’ products, may be more effective, safer, less expensive or marketed and sold more effectively, than any products we develop.
We are aware of several companies that are working to develop drugs that would compete against our drug candidates for HBV treatment. As a significant unmet medical need exists for HBV, there are several large and small pharmaceutical companies focused on delivering therapeutics for treatment of HBV. Further, it is likely that additional drugs will become available in the future for the treatment of HBV. We will face competition from other drugs currently approved or that will be approved in the future for the treatment of chronic hepatitis B.
There are a large number of companies that are developing new agents for use in cancer therapy including RNAi therapeutics, and there are other companies developing small molecule drugs designed to inhibit the PLK1 target, including Onconova Therapeutics and Millennium/Takeda. These agents may be competitive with our product candidate TKM-PLK1.
We anticipate significant competition in the HBV market with several early phase product candidates announced. In addition, there are organizations working on treatments for Ebola virus disease and other hemorrhagic fever viruses. We will also face competition for other product candidates that we expect to develop in the future.
If we successfully develop product candidates, and obtain approval for them, we will face competition based on many different factors, including the following:
|
·
|
safety and effectiveness of our products
|
|
|
·
|
ease with which our products can be administered and the extent to which patients and physicians accept new routes of administration;
|
|
|
·
|
timing and scope of regulatory approvals for these products;
|
|
|
·
|
availability and cost of manufacturing, marketing and sales capabilities;
|
|
|
·
|
price;
|
|
|
·
|
reimbursement coverage; and
|
|
|
·
|
patent position.
|
30
Our competitors may develop or commercialize products with significant advantages over any products we develop based on any of the factors listed above or on other factors. Our competitors may therefore be more successful in commercializing their products than we are which could adversely affect our competitive position and business. Competitive products may make any products we develop obsolete or uncompetitive before we can recover the expenses of developing and commercializing our product candidates. Such competitors could also recruit our employees, which could negatively impact our level of expertise and the ability to execute on our business plan. Furthermore, we also face competition from existing and new treatment methods that reduce or eliminate the need for drugs, such as the use of advanced medical devices. The development of new medical devices or other treatment methods for the diseases we are targeting and may target could make our product candidates non-competitive, obsolete or uneconomical.
We face competition from other companies that are working to develop novel products using technology similar to ours. If these companies develop products more rapidly than we do or their technologies, including delivery technologies, are more effective than ours, then our ability to successfully commercialize products will be adversely affected.
In addition to the competition we face from competing products in general, we also face competition from other companies working to develop novel products using technology that competes more directly with our own. There are multiple companies working in the field of RNAi, including major pharmaceutical companies such as Novartis International AG, Takeda Pharmaceutical Company Limited, and Merck, and biotechnology companies such as Alnylam, Quark Pharmaceuticals, Inc., Silence Therapeutics plc, Arrowhead Research Corporation and its subsidiary, Calando Pharmaceuticals, Inc., Marina, RXi Pharmaceuticals Corporation, Dicerna Pharmaceuticals, Inc., Sylentis S.A., Santaris Pharma A/S, and Benitec Ltd., among others. Any of these companies may develop its RNAi technology more rapidly and more effectively than we do or may develop products against the same target or disease indication that we are pursuing.
We also compete with companies working to develop antisense-based drugs, such as Isis Pharmaceuticals, Inc. and Sarepta. Like RNAi therapeutic products, antisense drugs target messenger RNAs, or mRNAs, in order to suppress the activity of specific genes. Isis is the developer of a currently approved antisense drug and has several antisense product candidates in clinical trials. Isis has also licensed its antisense technology to a number of other companies that are developing antisense-based drugs. The development of antisense drugs is more advanced than that of RNAi therapeutic products, and antisense technology may become the preferred technology for products that target mRNAs to silence specific genes.
In addition to competition with respect to RNAi and with respect to specific products, we face substantial competition to discover and develop safe and effective means to deliver RNAi triggers to the relevant cell and tissue types. Our competitors may develop safer and more effective means to deliver RNAi triggers to the relevant cell and tissue types than our existing lipid nanoparticle delivery technology, and our ability to successfully commercialize our products would be adversely affected. In addition, substantial resources are being expended by third parties in the effort to discover and develop alternative means of delivering RNAi triggers into the relevant cell and tissue types, both in academic laboratories and in the corporate sector. Some of our competitors have substantially greater resources than we do, and if our competitors are able to negotiate exclusive access to those delivery solutions developed by third parties, we may be unable to successfully commercialize our product candidates.
We face significant competition from other biotechnology and pharmaceutical companies targeting HBV.
As a significant unmet medical need exists for HBV, there are several large and small pharmaceutical companies focused on delivering therapeutics for treatment of HBV. Further, it is likely that additional drugs will become available in the future for the treatment of HBV.
We are aware of several companies that are working to develop drugs that would compete against our drug candidates for HBV treatment. Many of our existing or potential competitors have substantially greater financial, technical and human resources than we do and significantly greater experience in the discovery and development of drug candidates, as well as in obtaining regulatory approvals of those drug candidates in the United States and in foreign countries. Our current and potential future competitors also have significantly more experience commercializing drugs that have been approved for marketing. Mergers and acquisitions in the pharmaceutical and biotechnology industries could result in even more resources being concentrated among a small number of our competitors.
Competition may increase further as a result of advances in the commercial applicability of technologies and greater availability of capital for investment in these industries. Our competitors may succeed in developing, acquiring or licensing, on an exclusive basis, drug candidates that are more effective or less costly than any drug candidate that we may develop.
We will face competition from other drugs currently approved or that will be approved in the future for the treatment of HBV. Therefore, our ability to compete successfully will depend largely on our ability to:
|
•
|
discover, develop and commercialize drugs that are superior to other products in the market;
|
|
•
|
demonstrate through our clinical trials that our drug candidates are differentiated from existing and future therapies;
|
|
•
|
attract qualified scientific, product development and commercial personnel;
|
|
•
|
obtain patent or other proprietary protection for our drugs and technologies;
|
31
|
•
|
obtain required regulatory approvals;
|
|
•
|
successfully collaborate with pharmaceutical companies in the discovery, development and commercialization of new drugs; and
|
|
•
|
negotiate competitive pricing and reimbursement with third party payors.
|
The availability of our competitors’ products could limit the demand, and the price we are able to charge, for any drug candidate we develop. The inability to compete with existing or subsequently introduced drug candidates would have a material adverse impact on our business, financial condition and prospects.
Established pharmaceutical companies may invest heavily to accelerate discovery and development of novel compounds or to in license novel compounds that could make our drug candidates less competitive. In addition, any new product that competes with an approved product must demonstrate compelling advantages in efficacy, convenience, tolerability and safety in order to overcome price competition and to be commercially successful. Accordingly, our competitors may succeed in obtaining patent protection, discovering, developing or receiving FDA approval for or commercializing medicines before we do, which would have a material adverse impact on our business.
Risks Related to the Ownership of our Common Shares
If our stock price fluctuates, our investors could incur substantial losses.
The market price of our Common Shares may fluctuate significantly in response to factors that are beyond our control. The stock market in general has recently experienced extreme price and volume fluctuations. The market prices of securities of pharmaceutical and biotechnology companies have been extremely volatile, and have experienced fluctuations that often have been unrelated or disproportionate to the operating performance of these companies. These broad market fluctuations could result in extreme fluctuations in the price of our Common Shares, which could cause our investors to incur substantial losses.
There is no assurance that an active trading market in our Common Shares will be sustained.
Our Common Shares are listed for trading on the NASDAQ exchange. However, there can be no assurances that an active trading market in our Common Shares on these stock exchanges will be sustained.
We a
re incorporated in Canada and the majority of our assets, and some of our officers reside outside the United States, with the result that it may be difficult for investors to enforce any judgments obtained against us or some of our officers.
Tekmira, and some of its subsidiaries, are incorporated under the laws of the Province of British Columbia and the majority of Tekmira’s assets are located outside the United States. While we have appointed National Registered Agents, Inc. as our agent for service of process to effect service of process within the United States upon us, it may not be possible for you to enforce against us or those persons in the United States, judgments obtained in U.S. courts based upon the civil liability provisions of the U.S. federal securities laws or other laws of the United States. In addition, there is doubt as to whether original action could be brought in Canada against us or our directors or officers based solely upon U.S. federal or state securities laws and as to the enforceability in Canadian courts of judgments of U.S. courts obtained in actions based upon the civil liability provisions of U.S. federal or state securities laws.
If we are deemed to be a “passive foreign investment company” for the current or any future taxable year, investors who are subject to United States federal taxation would likely suffer materially adverse U.S. federal income tax consequences.
We generally will be a “passive foreign investment company” under the meaning of Section 1297 of the U.S. Internal Revenue Code of 1986, as amended (the “Code”), (a “PFIC”) if (a) 75% or more of our gross income is “passive income” (generally, dividends, interest, rents, royalties, and gains from the disposition of assets producing passive income) in any taxable year, or (b) if at least 50% or more of the quarterly average value of our assets produce, or are held for the production of, passive income in any taxable year. A shareholder who is a U.S. person (as such term is defined under applicable U.S. legislation) should be aware that we believe that we were a PFIC during one or more prior taxable years. We have not yet made a determination as to whether we were a PFIC in respect of our taxable year ended December 31, 2014. If we are a PFIC for any taxable year during which a U.S. person holds our Common Shares, it would likely result in materially adverse U.S. federal income tax consequences for such U.S. person, including, but not limited to, any gain from the sale of our Common Shares would be taxed as ordinary income, as opposed to capital gain, and such gain and certain distributions on our Common Shares would be subject to an interest charge, except in certain circumstances. It may be possible for U.S. persons to fully or partially mitigate such tax consequences by making a “qualifying electing fund election,” as defined in the Code (a “QEF Election”), but there is no assurance that we will provide such persons with the information that we are required to provide to them in order to assist them in making a QEF Election. In addition, U.S. persons that hold Common Shares issuable upon exercise of warrants are generally not eligible to make certain elections available under the Code that are intended to mitigate the adverse tax consequences of PFIC rules with respect to such warrant shares unless such holders also elect to make a deemed taxable sale of their warrant shares. The PFIC rules are extremely complex.
32
Our articles and certain Canadian laws could delay or deter a change of control.
Our preferred shares are available for issuance from time to time at the discretion of our board of directors, without shareholder approval. Our articles allow our board, without shareholder approval, to determine the special rights to be attached to our preferred shares, and such rights may be superior to those of our Common Shares.
In addition, limitations on the ability to acquire and hold our Common Shares may be imposed by the Competition Act in Canada. This legislation permits the Commissioner of Competition of Canada to review any acquisition of a significant interest in us. This legislation grants the Commissioner jurisdiction to challenge such an acquisition before the Canadian Competition Tribunal if the Commissioner believes that it would, or would be likely to, result in a substantial lessening or prevention of competition in any market in Canada. The Investment Canada Act subjects an acquisition of control of a company by a non-Canadian to government review if the value of our assets, as calculated pursuant to the legislation, exceeds a threshold amount. A reviewable acquisition may not proceed unless the relevant minister is satisfied that the investment is likely to result in a net benefit to Canada. Any of the foregoing could prevent or delay a change of control and may deprive or limit strategic opportunities for our shareholders to sell their shares.
The exercise of all or any number of outstanding stock options, the award of any additional options, bonus shares or other stock-based awards or any issuance of shares to raise funds or acquire a business may dilute your Common Shares.
We have in the past and may in the future grant to some or all of our directors, officers and employees options to purchase our Common Shares and other stock-based awards as non-cash incentives to those persons. The issuance of any equity securities could, and the issuance of any additional shares will, cause our existing shareholders to experience dilution of their ownership interests.
Any additional issuance of shares or a decision to acquire other businesses through the sale of equity securities may dilute our investors’ interests, and investors may suffer dilution in their net book value per share depending on the price at which such securities are sold. Such issuance may cause a reduction in the proportionate ownership and voting power of all other shareholders. The dilution may result in a decline in the price of our Common Shares or a change in control.
We do not expect to pay dividends for the foreseeable future.
We have not paid any cash dividends to date and we do not intend to declare dividends for the foreseeable future, as we anticipate that we will reinvest future earnings, if any, in the development and growth of our business. Therefore, investors will not receive any funds unless they sell their Common Shares, and shareholders may be unable to sell their shares on favorable terms or at all. We cannot assure you of a positive return on investment or that you will not lose the entire amount of your investment in our Common Shares. Prospective investors seeking or needing dividend income or liquidity should not purchase our Common Shares.
The value of our securities, including our Common Shares, might be affected by matters not related to our operating performance and could subject us to securities litigation.
The value of our Common Shares may be reduced for a number of reasons, many of which are outside our control, including:
|
·
|
general economic and political conditions in Canada, the United States and globally;
|
|
|
·
|
governmental regulation of the health care and pharmaceutical industries;
|
|
|
·
|
failure to achieve desired drug discovery outcomes by us or our collaborators;
|
|
|
·
|
failure to obtain industry partner and other third party consents and approvals, when required;
|
|
|
·
|
stock market volatility and market valuations;
|
|
|
·
|
competition for, among other things, capital, drug targets and skilled personnel;
|
|
|
·
|
the need to obtain required approvals from regulatory authorities;
|
|
|
·
|
revenue and operating results failing to meet expectations in any particular period;
|
|
|
·
|
investor perception of the health care and pharmaceutical industries;
|
|
|
·
|
limited trading volume of our Common Shares;
|
|
|
·
|
announcements relating to our business or the businesses of our competitors; and
|
|
|
·
|
our ability or inability to raise additional funds.
|
The concentration of the common shares ownership with insiders will likely limit the ability of the other shareholders to influence corporate matters.
As of March 9, 2015, executive officers, directors, five percent or greater shareholders, and their respective affiliated entities of the Tekmira beneficially own, in the aggregate, approximately 44% of Tekmira’s outstanding common shares. As a result, these shareholders, acting together, have significant influence over most matters that require approval by Tekmira’s shareholders, including the election of directors and approval of significant corporate transactions. Corporate actions might be taken even if other shareholders oppose them. This concentration of ownership might also have the effect of delaying or preventing a corporate transaction that other shareholders may view as beneficial.
33
If securities analysts do not publish research or reports about the business of Tekmira, or if they publish negative evaluations, the price of Tekmira’s Common Shares could decline.
The trading market for the Tekmira’s Common Shares may be impacted by the availability or lack of research and reports that third-party industry or financial analysts publish about Tekmira. There are many large, publicly traded companies active in the biopharmaceutical industry, which may mean it will be less likely that Tekmira receives widespread analyst coverage. Furthermore, if one or more of the analysts who do cover Tekmira downgrade its stock, its stock price would likely decline. If Tekmira does not receive adequate coverage by reputable analysts that have an understanding of Tekmira’s business and industry, it could fail to achieve visibility in the market, which in turn could cause its stock price to decline.
Risk Factors Relating to Assets Acquired as a result of the Merger with OnCore
We are required to make deferred payments in connection with OnCore’s prior acquisition of Enantigen, and its failure to make these payments may adversely affect Tekmira’s ability to progress certain of its drug development programs.
In connection with OnCore’s acquisition of Enantigen, OnCore paid $2.0 million in cash to Enantigen’s selling stockholders in October 2014 and an additional $1.0 million in cash in December 2014. We are obligated to pay an additional $2.0 million in cash by March 31, 2015. If we do not pay this amount as required, we would be required to return all shares of Enantigen to its former stockholders, which would mean that we would lose our rights to certain HBV surface antigen secretion inhibitor and capsid assembly inhibitor programs.
OnCore has licensed critical portions of its intellectual property from Blumberg, Drexel and NeuroVive, and is subject to significant obligations under those license agreements.
The rights OnCore holds under its license agreements with Blumberg, Drexel and NeuroVive are important to its business. The OnCore discovery and development platform is built, in part, around patents exclusively in licensed from these parties. For example, the elimination of cccDNA is the most critical element in our combination strategy to cure HBV, and the cccDNA formation inhibitor program is in licensed from Blumberg and Drexel.
OnCore has licenses with Blumberg and Drexel, both directly and through its acquisition of Enantigen, that grant it the exclusive (except in some cases as to know how that is not unique or specific to the licensed products or compound series, which are non-exclusive and subject to retained rights for non-commercial research use), worldwide license to make, have made, use, import, offer for sale and sell products incorporating one or more licensed compounds, which include cccDNA inhibitors, capsid assembly inhibitors, inhibitors of secretion of HBV antigens and hepatocellular carcinoma inhibitors, either for general use in humans or for use in the field of HBV research, diagnosis and treatment. OnCore’s license with NeuroVive grants OnCore the exclusive, worldwide license under patents and know how controlled by NeuroVive to develop, manufacture and commercialize for the treatment of HBV, oral dosage form products, or licensed products, that incorporate sanglifehrin based cyclophilin inhibitors, including OnCore’s drug candidate OCB-030. OnCore’s license with Cytos grants OnCore the exclusive, worldwide, sub licensable (subject to certain restrictions with respect to licensed viral infections other than hepatitis) license, under patents and know-how controlled by Cytos, to research, develop, manufacture and commercialize, for the diagnosis, treatment or prevention of hepatitis viruses in humans, licensed products that incorporate Q beta-derived virus-like particles that are filled with TLR9, TLR7 or RIG-I agonists.
Under OnCore’s agreements with Blumberg, Drexel, NeuroVive and Cytos, OnCore is subject to significant obligations, including diligence obligations with respect to development and commercialization activities, payment obligations upon achievement of certain milestones and royalties on product sales, as well as other material obligations. Under OnCore’s direct agreement with Blumberg and Drexel, OnCore agreed to pay up to $3.5 million in development and regulatory milestones per licensed compound series, up to $92.5 million in sales performance milestones per licensed product, and royalties in the mid-single digits in connection with the sale of licensed products. Under each of the three license agreements that OnCore’s subsidiary Enantigen has with Blumberg and Drexel, Enantigen is obligated to pay up to $500,000 in development and regulatory milestones per licensed product and royalties in the low single digits in connection with the sale of licensed products. Under OnCore’s agreement with NeuroVive, OnCore agreed to pay up to $47.0 million in clinical development and regulatory milestones per indication, up to $102.5 million in sales performance milestones per licensed product and indication, and tiered royalties in the mid-single to low double digits in connection with the sale of licensed products. Under OnCore’s agreement with Cytos, OnCore agreed to pay up to $67 million upon the achievement of specified development and regulatory milestones for hepatitis and each additional licensed viral infection, in each case for each of the six licensed compound series, up to $110 million upon the achievement of specified sales performance milestones, and tiered royalty payments at a royalty rate in the high-single to low double digits, based upon net sales of licensed products. If these payments become due under the terms of the agreements, OnCore may not have sufficient funds available to meet its obligations and we may be negatively affected.
34
If there is any conflict, dispute, disagreement or issue of non-performance between OnCore and Blumberg, Drexel, NeuroVive or Cytos regarding OnCore’s rights or obligations under these license agreements, including any conflict, dispute or disagreement arising from OnCore failure to satisfy diligence or payment obligations under such agreements, Blumberg and Drexel or NeuroVive or Cytos, as applicable, may have a right to terminate the license. The loss of any of these license agreements could materially and adversely affect OnCore’s ability to use intellectual property that is critical to our drug discovery and development efforts, as well as its ability to enter into future collaboration, licensing and/or marketing agreements for one or more affected drug candidates or development programs.
OnCore relies on and will incur additional expense in connection with its research collaboration with Blumberg.
In October 2014, OnCore entered into an agreement with Blumberg under which it will provide annual funding for a three year period in the amount of $1.0 million per year and which is renewable for an additional three year period at our option, for Blumberg to conduct research projects in HBV and liver cancer pursuant to a research plan to be agreed upon by the parties. In exchange, OnCore has the right to obtain an exclusive, royalty bearing, worldwide license to intellectual property generated by Blumberg in the course of the funded research and OnCore believes that Blumberg’s HBV research platform will continue to be a source of potentially novel hepatitis B targets, drug candidates, assays and other HBV specific technologies. As a result, OnCore is dependent, in part, upon the success of Blumberg in performing its responsibilities under this research collaboration. Blumberg may not cooperate with OnCore or perform its obligations under the agreement. OnCore cannot control the amount and timing of Blumberg’s resources that will be devoted to research and development activities related to our research collaboration. Further, development costs associated with OnCore’s research projects may be difficult to anticipate and exceed our expectations. If funding is unable to continue to financially support the collaboration, if OnCore does not obtain exclusive licenses from Blumberg to the resulting intellectual property, or if OnCore fails to comply with its obligations under those license agreements, its development efforts may be materially harmed.
Some of OnCore’s licensors have retained rights to develop and commercialize certain of its drug candidates to treat diseases other than HBV and, as a result, its development and commercialization efforts may be negatively affected.
OnCore’s license agreements provide OnCore with the rights to develop and commercialize our drug candidates for HBV; however, some of OnCore’s licensors have retained rights to develop and commercialize certain of its drug candidates to treat diseases other than HBV, and to license those rights to other third parties. For example, NeuroVive has retained rights to the development of sanglifehrin based cyclophilin inhibitors, including those having the same active ingredient as OCB-030, and Cytos has retained all rights with respect to development of the licensed products for influenza, all non-viral infections and certain viral infections other than hepatitis.
NeuroVive is currently performing preclinical studies on an intravenous formulation of one of these drug candidates with the intention of initiating clinical trials in cardiovascular disease and central nervous system conditions. Because NeuroVive’s drug candidate has the same active ingredient as OCB-030, OnCore’s ability to successfully develop and commercialize OCB-030 could be negatively affected by data, including any adverse events, arising from NeuroVive’s clinical trials. If OnCore obtains regulatory approval for OCB-030 or its TLR9 agonist for HBV and NeuroVive or Cytos, as the case may be, obtains regulatory approval for a drug candidate that has the same active ingredient as OCB-030 or our TLR9 agonist for another indication, and if each is available outside of a combination therapy, physicians may prescribe the NeuroVive or Cytos drug, instead of OnCore’s drug, to patients with HBV if, for example, the cost of the NeuroVive or Cytos drug is less than our drug. In this case, OnCore would not be receiving any payments on the account of such sales and our revenue would be adversely affected.
|
Item 1B.
|
Unresolved Staff Comments
|
There
are no unresolved staff comments at the moment.
|
Item 2.
|
Properties
|
Our head office and principal place of business is located at 100-8900 Glenlyon Parkway, Burnaby, British Columbia, Canada, V5J 5J8. The Company leases a 51,000 square foot facility. On June 23, 2014, we signed a renewal agreement to the operating lease for its laboratory and office premises. The renewal is effective August 1, 2014 and expires July 31, 2019, but we have the option to extend the lease to 2024, 2029, and 2034. We believe that the total space available to us under our current lease will meet our needs for the foreseeable future and that additional space would be available to us on commercially reasonable terms if required.
Through our wholly owned subsidiary, OnCore, we have approximately 2,600 square feet of leased office space at 3805 Old Easton Road, Doylestown, PA 18902.
|
Item 3.
|
Legal Proceedings
|
We
are involved with various legal matters arising in the ordinary course of business. We make provisions for liabilities when it is both probable that a liability has been incurred and the amount of the loss can be reasonably estimated. Such provisions are reviewed at least quarterly and adjusted to reflect the impact of any settlement negotiations, judicial and administrative rulings, advice of legal counsel, and other information and events pertaining to a particular case. Litigation is inherently unpredictable. Although the ultimate resolution of these various matters cannot be determined at this time, we do not believe that such matters, individually or in the aggregate, will have a material adverse effect on our consolidated results of operations, cash flows, or financial condition.
35
Alnylam Pharmaceuticals Inc. (“Alnylam”)
On June 21, 2013, we transferred manufacturing process technology to Ascletis Pharmaceuticals (Hangzhou) Co., Ltd. (“Ascletis”) to enable them to produce ALN-VSP, a product candidate licensed to them by Alnylam. We believe that under a licensing agreement with Alnylam, the technology transfer to Ascletis triggers a $5 million milestone obligation from Alnylam to Tekmira. However, Alnylam has demanded a declaration that we have not yet met our milestone obligations. We dispute Alnylam’s position. To remedy this dispute, the parties have commenced arbitration proceedings, as provided for under the agreement. In addition to seeking a declaration that we have met our obligations under the agreement, we have also stated a claim for breach of contract, breach of the implied covenant of good faith and fair dealing, and fraud. The hearing date for this arbitration is currently set for the second week in May, 2015.
University of British Columbia (“UBC”)
Certain early work on lipid nanoparticle delivery systems and related inventions was undertaken at the University of British Columbia (UBC). These inventions are licensed to us by UBC under a license agreement, initially entered in 1998 as amended in 2001, 2006 and 2007. We have granted sublicenses under the UBC license to Alnylam as well as to Talon. Alnylam has in turn sublicensed back to us under the licensed UBC patents for discovery, development and commercialization of RNAi products. In mid-2009, we and our subsidiary Protiva entered into a supplemental agreement with UBC, Alnylam and AlCana Technologies, Inc., in relation to a separate research collaboration to be conducted among UBC, Alnylam and AlCana to which we have license rights. The settlement agreement signed in late 2012 to resolve the litigation among Alnylam, AlCana, Tekmira and Protiva provided for the effective termination of all obligations under such supplemental agreement as between and among all litigants.
On November 10, 2014, the University of British Columbia filed a demand for arbitration against Tekmira Pharmaceuticals Corp., BCICAC File No.: DCA-1623. We received UBC’s Statement of Claims on January 16, 2015. In its Statement of Claims, UBC alleges that it is entitled to $3.5 million in allegedly unpaid royalties based on publicly available information, and an unspecified amount based on non-public information. UBC also seeks interest and costs, including legal fees. We dispute UBC’s allegation. No dates have been scheduled for this arbitration.
|
Item 4.
|
Mine Safety Disclosures
|
Not
applicable.
36
|
Item 5.
|
Market for Registrant’s Common Equity, Related Stockholder Matters and Issuer Purchases of Equity Securities
|
On November 15, 2010, our common shares began to trade on the NASDAQ Global Market under the symbol “TKMR”. Our common shares are also traded on the Toronto Stock Exchange in Canada under the symbol “TKM”. As at March 9, 2015, there were 126 registered holders of common shares and 46,567,496 common shares issued and outstanding. The following table shows the progression in the high and low trading prices of our common shares on the NASDAQ Global Market and the Toronto Stock Exchange for the periods listed:
|
|
NASDAQ
High
(US$)
|
|
NASDAQ
Low
(US$)
|
|
TSX
High
(C$)
|
|
TSX
Low
(C$)
|
|||||||||
|
Year Ended:
|
|
|
|
|
||||||||||||
|
December 31, 2014
|
|
$
|
31.48
|
|
|
$
|
7.65
|
|
|
$
|
34.66
|
|
|
$
|
8.14
|
|
|
December 31, 2013
|
|
$
|
11.42
|
|
|
$
|
4.18
|
|
|
$
|
11.62
|
|
|
$
|
4.31
|
|
|
Quarter Ended:
|
|
|
|
|
||||||||||||
|
December 31, 2014
|
|
$
|
29.93
|
|
|
$
|
12.54
|
|
|
$
|
33.69
|
|
|
$
|
14.37
|
|
|
September 30, 2014
|
|
$
|
26.05
|
|
|
$
|
8.86
|
|
|
$
|
28.56
|
|
|
$
|
9.55
|
|
|
June 30, 2014
|
|
$
|
24.47
|
|
|
$
|
10.20
|
|
|
$
|
26.99
|
|
|
$
|
11.08
|
|
|
March 31, 2014
|
|
$
|
31.48
|
|
|
$
|
7.65
|
|
|
$
|
34.66
|
|
|
$
|
8.14
|
|
|
December 31, 2013
|
|
$
|
11.42
|
|
|
$
|
6.93
|
|
|
$
|
11.62
|
|
|
$
|
7.16
|
|
|
September 30, 2013
|
|
$
|
7.72
|
|
|
$
|
4.70
|
|
|
$
|
7.90
|
|
|
$
|
4.96
|
|
|
June 30, 2013
|
|
$
|
5.25
|
|
|
$
|
4.25
|
|
|
$
|
5.34
|
|
|
$
|
4.35
|
|
|
March 31, 2013
|
|
$
|
5.53
|
|
|
$
|
4.18
|
|
|
$
|
5.45
|
|
|
$
|
4.31
|
|
|
Month Ended:
|
|
|
|
|
||||||||||||
|
February 28, 2015
|
|
$
|
25.49
|
|
|
$
|
17.50
|
|
|
$
|
33.76
|
|
|
$
|
17.05
|
|
|
January 31, 2015
|
|
$
|
26.73
|
|
|
$
|
14.50
|
|
|
$
|
32.19
|
|
|
$
|
21.90
|
|
Material Modifications to the Rights of Security Holders/Use of Proceeds
Not applicable.
Purchase of Equity Securities by the Issuer and Affiliated Purchasers
Not applicable.
Recent Sales of Unregistered Securities
None.
37
Stock Performance Graph
The following performance graph and related information shall not be deemed “soliciting material” or to be “filed” with the SEC, nor shall such information be incorporated by reference into any future filing under the Securities Act of 1933 or Securities Exchange Act of 1934, each as amended, except to the extent that we specifically incorporate it by reference into such filing
.
The following graph compares the cumulative shareholder return on an investment of C$100 in the Common Shares of the Company on the TSX from December 31, 2009, with a cumulative total shareholder return on the TSX Composite Total Return and TSX Capped Health Care Indices.
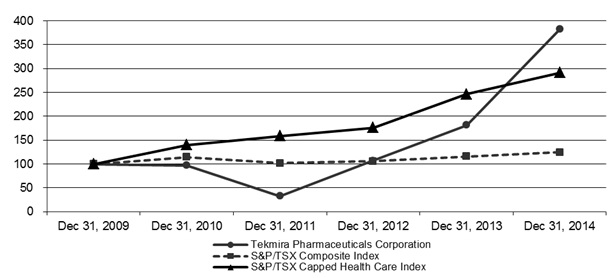
Geographic Breakdown of Shareholders
As of March 9, 2015, our shareholder register indicates that our common shares are held as follows:
|
Location
|
|
Number of Shares
|
|
Percentage of
Total Shares
|
Number of Registered
Shareholders of
Record
|
|||||||
|
Canada
|
|
15,776,736
|
|
|
33.9%
|
|
100
|
|
||||
|
United States
|
|
14,776,536
|
|
|
31.7%
|
22
|
|
|||||
|
Other
|
|
16,014,224
|
|
|
34.4%
|
4
|
|
|||||
|
|
|
|||||||||||
|
Total
|
|
46,567,496
|
|
|
100%
|
|
126
|
|
||||
Our securities are recorded in registered form on the books of our transfer agent, CST Trust Company, located at 1600-1066 West Hastings Street, Vancouver, BC V6E 3X1. However, the majority of such shares are registered in the name of intermediaries such as brokerage houses and clearing houses (on behalf of their respective brokerage clients). We are permitted, upon request to our transfer agent, to obtain a list of our beneficial shareholders who do not object to their identities being disclosed to us. We are not permitted to obtain from our transfer agent a list of our shareholders who have objected to their identities being disclosed to us.
Shares registered in intermediaries were assumed to be held by residents of the same country in which the clearing house was located.
Dividends
We have not declared or paid any dividends on our common shares since the date of our incorporation. We intend to retain our earnings, if any, to finance the growth and development of our business and do not expect to pay dividends or to make any other distributions in the near future. Our board of directors will review this policy from time to time having regard to our financing requirements, financial condition and other factors considered to be relevant.
|
Item 6.
|
Selected Consolidated Financial Data
|
The following table presents selected financial data derived from Tekmira’s audited consolidated financial statements for each of the five years for the period ending December 31, 2014. You should read this information in conjunction with our financial statements for the periods presented, as well as Item 1 “
Business
” and Item 7 “
Management’s Discussion and Analysis of Financial Condition and Results of Operations
” included elsewhere in this Annual Report. Historical results are not necessarily indicative of future results.
38
Summary Financial Information
Under U.S. GAAP (in thousands of US dollars, except per share amounts)
|
Year Ended December 31,
|
||||||||||||||||||||
|
2014
|
2013
|
2012
|
2011
|
2010
|
||||||||||||||||
|
$
|
$
|
$
|
$
|
$
|
||||||||||||||||
|
Operating Data
|
||||||||||||||||||||
|
Revenue
|
14,953
|
15,465
|
14,105
|
16,812
|
20,745
|
|||||||||||||||
|
Expenses
|
47,925
|
27,617
|
27,050
|
27,505
|
32,900
|
|||||||||||||||
|
Loss from operations
|
(32,972
|
)
|
(12,152
|
)
|
(12,945
|
)
|
(10,694
|
)
|
(12,155
|
)
|
||||||||||
|
Net income (loss)
|
(38,837
|
)
|
(14,063
|
)
|
29,611
|
(10,083
|
)
|
(12,058
|
)
|
|||||||||||
|
Weighted average number of common shares—basic
(1)
|
21,603
|
15,303
|
13,728
|
11,319
|
10,333
|
|||||||||||||||
|
Weighted average number of common shares—diluted
(1)
|
21,603
|
15,303
|
14,321
|
11,319
|
10,333
|
|||||||||||||||
|
Income (loss) per common share—basic
|
(1.80
|
)
|
(0.92
|
)
|
2.16
|
(0.89
|
)
|
(1.17
|
)
|
|||||||||||
|
Income (loss) per common share—diluted
|
(1.80
|
)
|
(0.92
|
)
|
2.07
|
(0.89
|
)
|
(1.17
|
)
|
|||||||||||
|
Balance Sheet Data
|
||||||||||||||||||||
|
Total current assets
|
116,418
|
70,343
|
51,243
|
11,594
|
18,006
|
|||||||||||||||
|
Total assets
|
118,178
|
71,716
|
52,595
|
13,758
|
21,136
|
|||||||||||||||
|
Total liabilities
|
30,143
|
12,522
|
11,676
|
8,531
|
10,345
|
|||||||||||||||
|
Share capital
|
316,212
|
242,045
|
206,572
|
200,965
|
196,393
|
|||||||||||||||
|
Total stockholders’ equity
|
88,035
|
59,194
|
40,919
|
5,227
|
10,791
|
|||||||||||||||
|
Number of shares outstanding
(1)
|
22,438
|
19,049
|
14,305
|
12,149
|
10,339
|
|||||||||||||||
Notes:
|
(1)
|
On November 4, 2010, Tekmira completed a consolidation of its common shares whereby five old common shares of Tekmira were exchanged for one new common share of Tekmira. Except as otherwise indicated, all references to common shares, common shares outstanding, average number of common shares outstanding, per share amounts and options in this document have been restated to reflect the common shares consolidation on a retroactive basis.
|
|
Item 7.
|
Management’s Discussion and Analysis of Financial Condition and Results of Operations
|
Following our recent business combination with OnCore Biopharma Inc. (“OnCore”) we intend to focus our efforts on discovering, developing and commercializing a cure for patients suffering from chronic HBV infection, a disease of the liver caused by hepatitis B. Our strategy incorporates our heritage and expertise in RNAi combined with the newly acquired assets and expertise through the OnCore merger.
We believe that, as a result of the merger, Tekmira will be well positioned to capitalize on the HBV global market opportunity. Our current HBV pipeline consists of 9 drugs and drug candidates, with eight unique mechanisms of action. Our unique strategy is to target the three pillars we believe are necessary to deliver an HBV cure, including: (i) suppressing HBV viral replication, (ii) restoring host response by suppressing HBsAg or activating/stimulating the host immune system directed at HBV and (iii) eliminating covalently closed circular DNA (cccDNA),
the reservoir of viral genomic material
. We believe that our chances for success in HBV are increased, and risk is mitigated, by having a portfolio of assets targeting these three strategies. Most importantly, we believe combination therapies are the key to HBV treatment and a potential cure. We believe that clinical development can be accelerated when multiple components of a combination therapy regimen are controlled by the same company and therefore we have retained exclusive worldwide development and commercialization rights to all of our drug candidates and programs in HBV.
Tekmira is a biopharmaceutical company that since inception has focused on developing and advancing novel RNA interference therapeutics, as well as pursuing partnering opportunities for its leading lipid nanoparticle (LNP) delivery technology. RNAi has the potential to generate a broad new class of therapeutics that take advantage of the body’s own natural processes to silence genes – or more specifically to eliminate specific gene-products from the cell. With this ability to eliminate disease-causing proteins from cells, RNAi products represent opportunities for therapeutic interventions that have not been achievable with conventional drugs.
Delivery technology is crucial in order to protect RNAi drugs in the bloodstream following administration, allow efficient delivery to the target cells, and facilitate cellular uptake and release into the cytoplasm of the cell. By encapsulating the RNAi trigger molecules in lipid particles, Tekmira’s propriety LNP technology enables efficient delivery and uptake into target cells. Tekmira’s LNP technology represents the most widely adopted delivery technology in RNAi. To date, it has enabled eight clinical trials and been administered to well over 250 patients. Furthermore, recent results demonstrate that multi-dosing with LNP has been well-tolerated with treatments out to one year.
LNP can also enable a wide variety of nucleic acid triggers, including messenger RNA. As such, we continue to seek new product development and partnering opportunities based on our industry-leading delivery expertise.
Our Product Candidates
As a result of our merger with OnCore our pipeline of assets has expanded beyond therapeutics being developed with RNAi technology. In HBV, we have what we believe is an industry-leading pipeline focused on curing HBV. Our belief is that to achieve an HBV cure, a combination of products that affect the main drivers of HBV need to be utilized. Specifically, this means that to be successful, we believe we need to have products that address HBV persistence — in antiviral replication, immune reactivation and the presence of cccDNA.
39
Once multiple compounds within the portfolio with sufficient anti HBV activity have been identified, we intend, subject to discussions with regulatory authorities, to conduct a rolling Phase II clinical program. These studies will likely evaluate combinations of two or more drug candidates in small cohorts of patients with chronic HBV infection to identify active combinations and those that do not have sufficient antiviral activity. We also plan to evaluate different treatment durations to determine the optimal duration for a finite duration therapy. We expect to use these results to adaptively design additional treatment regimens for the next cohorts. We plan to continue this iterative process until we select combination therapy regimens and treatment durations to conduct Phase III clinical trials intended to ultimately support regulatory filings for marketing approval.
We intend to continue to expand our HBV pipeline through internal development, acquisitions and in-licenses. We believe that a major engine for internal innovation is the collaboration entered into by OnCore, which is now a wholly owned subsidiary on Tekmira, with Blumberg, one of the leading non-profit research institutes in the world focused on HBV. We believe that this collaboration will provide us with access to cutting-edge research in new target identification, assay development, mechanism of action studies and lead-finding efforts focused on hepatitis B virus. This relationship also provides us with access to research that we believe is equal to, or surpasses that of other biotechnology or pharmaceutical companies, and can add value to our current and future R&D efforts in HBV.
Our RNAi product pipeline is focused on anti-virals, oncology and metabolic product platforms, where there is a significant medical need and commercial opportunity. Our intention is to advance our RNAi product pipeline either ourselves or with partners, with a focus on maximizing the value of these assets.
TKM-HBV
Hepatitis B virus (HBV) causes the most common serious liver infection in the world. The World Health Organization (WHO) estimates that 350 million people worldwide are chronically infected, and other estimates suggest this could include up to 1.4 million people in the United States. Individuals chronically infected with HBV are at an increased risk of developing significant liver disease, including cirrhosis, or permanent scarring of the liver, as well as liver failure and hepatocellular carcinoma (HCC) or liver cancer. According to the Hepatitis B Foundation, HBV is the cause of up to 80% of liver cancers. Individuals with liver cancer typically have a five-year survival rate of only 15%. The WHO estimates that more than 780,000 people die every year due to the consequences of hepatitis B.
Our extensive experience in antiviral drug development has been applied to our TKM-HBV program to develop an RNAi therapeutic for chronic hepatitis B infection. Small molecule nucleotide therapy has been the standard of care for chronic HBV infected patients. However, many of these patients continue to express a viral protein called HBV surface antigen (HBsAg). This protein causes inflammation in the liver leading to cirrhosis and, in some cases, HCC and death.
TKM-HBV is designed to address an unmet medical need and eliminate HBsAg expression in patients chronically infected with HBV. Reducing HBsAg is thought to be a key prerequisite to enable a patient’s immune system to raise an adequate antibody response against the virus. The ability of TKM-HBV to inhibit numerous viral elements in addition to HBsAg increases the likelihood of successfully controlling the viral infection.
TKM-HBV is being developed as a multi-component RNAi therapeutic that simultaneously targets three sites on the HBV genome. Targeting three distinct and highly conserved sites on the HBV genome is intended to facilitate potent knockdown of all viral mRNA transcripts and viral antigens across a broad range of HBV genotypes and reduce the risk of developing antiviral resistance. The goal is for TKM-HBV to be administered without prophylactic steroid treatment.
We presented results from our preclinical studies at the 10th Annual Meeting of the Oligonucleotide Therapeutics Society Meeting held in San Diego, California, on October 15, 2014. Among the results reported is the potent and rapid reduction in HBsAg demonstrated by TKM-HBV in several well-validated models. In these models, TKM-HBV treatment resulted in reductions in both intrahepatic and serum HBsAg, as well as reductions in HBV DNA, covalently closed circular DNA (cccDNA), HBeAg and HBcAg. A rapid 1 log reduction in serum HBsAg was achieved with a single 1 mg/kg dose of TKM-HBV in the humanized mouse model, which closely mimics chronic human hepatitis B infection. 1-2 log viral reductions from similar single-dose LNP treatments in two other true-infection animal models were also demonstrated.
Preclinical studies conducted on infected primary human hepatocytes showed that TKM-HBV had robust and consistent activity against different viral strains representing the major clinical genotypes A, B, C and D. Our data shows that inclusion of three RNAi triggers results in a more broadly effective knockdown of hepatitis B viral elements than a single trigger alone. The mode of action of TKM-HBV complements standard of care nucleoside/nucleotide (NUC) therapy, and lack of drug antagonism has been demonstrated with entecavir, lamivudine and tenofovir on infected primary human hepatocytes, making combination therapy a viable option
.
Our data supports the utility of TKM-HBV as a potential new therapeutic option for treating patients with chronic HBV infection. In early 2015, we advanced two TKM-HBV product candidates into a Phase I trial. Both product candidates employ the same unique combination of three RNAi trigger molecules. However, they differ in their LNP composition. One formulation employs a third generation LNP, and the other employs a new, fourth generation LNP, which incorporates novel lipid chemistry and demonstrates improved potency. The multi-component RNAi therapeutic is expected to result in broad and effective inhibition of HBV.
40
The TKM-HBV Phase I clinical trial is a randomized, single-blind, placebo-controlled study, involving single ascending doses of TKM-HBV. The study will assess the safety, tolerability and pharmacokinetics of intravenous administration of two formulations of TKM-HBV in healthy adult subjects. For each formulation, there are five planned cohorts for a total of 20 subjects (40 in total for both formulations). Four subjects will be enrolled per cohort with three subjects receiving TKM-HBV, and one receiving placebo. We expect the results from the Phase I clinical trial in healthy human volunteers to determine which product formulation will advance into chronically infected patients in a multi-dosing trial in the second half of 2015.
Newly Acquired HBV Candidates as a result of our merger with OnCore
Following Tekmira’s recent merger with OnCore our product development pipeline will now focus on discovery, acquisition or in-licensing and developing drug candidates that attack multiple targets of the HBV lifecycle, including the aggressive suppression of HBV replication and the formation inhibition and elimination of cccDNA. Although the ultimate curative regimens for HBV are currently unknown, we have assembled a robust portfolio of drug development programs targeting hepatitis B, which we plan to evaluate to determine the best potential combination approaches for patients. These assets include the following:
Cyclophilin Inhibitor — OCB-030
Cyclophilins are proteins that have been shown to play a role in several biological processes, including viral infection. By inhibiting cyclophilin, we believe the ability of HBV to replicate can be impaired and the host immune response toward HBV may be enhanced. We have licensed from NeuroVive Pharmaceutical AB, or NeuroVive, the exclusive rights to develop and commercialize cyclophilin inhibitor drug candidates, including OCB-030, for the treatment of hepatitis B. We are engaged in studies which we expect to be completed in order to file an IND, or equivalent, by year end 2015.
TLR9 Agonist (CYT-003)
Pharmaceutical activation of TLRs is a novel and attractive approach for the treatment of chronic HBV because agonism of these receptors triggers innate immune responses and also stimulates adaptive immunity. It is hoped that immune stimulation by TLR agonists can overcome the multiple immunologic blocks that allows chronic HBV infection, including direct activation of the host’s innate antiviral response, hence overcoming the functional weakness in HBV-specific immune cell responses.
Licensed from Cytos, CYT003 is a biological carrier which is filled G10 a toll-like receptor-9 (TLR-9) agonist. CYT-003 has been shown to directly activate B cells and stimulates human pDC to secrete Interferon alpha. CYT-003 also activates other antigen presenting cells indirectly and promotes the development of TH1 type cytokine response. This is thought to be potentially beneficial in promoting anti-HBV T cell immunity. CYT003 has previously been utilised in human trials in other indications and therefore could move quickly into the clinic in HBV infected patients. We anticipate initiating preclinical studies to demonstrate proof of concept 1H 2015. If the preclinical studies show utility in HBV, we could likely progress straight into patients given the existing safety database and the open INDs.
Capsid Assembly Inhibitors
We are developing two capsid assembly inhibitors as oral therapeutics for the treatment of chronic HBV infection. By inhibiting assembly of the viral capsid, the ability of hepatitis B virus to replicate is impaired, which subsequently reduces the amount of new virus produced, and may have an effect on cccDNA. We acquired exclusive, worldwide rights to these drug candidates through an in-license from Blumberg and Drexel University, or Drexel, and through OnCore’s recent acquisition of Enantigen Therapeutics, Inc., or Enantigen. We expect to file an IND with the FDA, or an equivalent filing with foreign regulatory authorities, and initiate Phase 1 studies with one of these compounds in 2016.
Surface Antigen Secretion Inhibitors
We are developing multiple small molecule orally bioavailable HBV surface antigen secretion inhibitors. By inhibiting the secretion of HBV surface antigen from infected cells, we expect that the immune response of patients treated with this therapy can reengage and thereby mount a more credible response to a hepatitis B virus infection. We acquired these drug candidates through OnCore’s recent acquisition of Enantigen. We expect to file an IND, or its equivalent in another territory, for a lead compound in 2016.
STING Agonists
We are developing STING (stimulator of interferon genes) agonists. By activating interferon genes, we anticipate that the body can produce additional interferon alpha and beta, which have antiviral properties. Our development program, which is currently in the discovery research stage, is based on proof of concept data in mice generated by Blumberg which showed that STING agonists can elicit an antiviral response and inhibit HBV replication in mouse liver cells. In collaboration with Blumberg, our plan is to identify potent, orally active small molecule human STING agonists that possess the desired characteristics to progress into human clinical studies.
41
cccDNA Formation Inhibitors
We are developing multiple series of cccDNA formation inhibitors. The inhibition of cccDNA formation would reduce the amount of cccDNA in the infected liver cell and could ultimately eliminate the reservoir of HBV genomic material required for continued viral replication. We acquired the exclusive, worldwide rights to this program through an in-license from Blumberg. This program is currently in early optimization and we anticipate filing an IND with the FDA or its equivalent in another territory in 2017.
cccDNA Epigenetic Modifiers
In addition to cccDNA formation inhibitors, we are developing cccDNA epigenetic modifiers. By controlling cccDNA transcription, we anticipate that we may be able to inhibit the formation of new virus and subviral particles from cccDNA. This development program, which is currently in the discovery research stage, is based on proof of concept data generated by Blumberg using known inhibitors of enzymes involved in DNA information processing.
Non-HBV Assets Clinical Programs TKM-PLK1, TKM-Ebola, TKM-Ebola-Guinea
(LNP Enabled)
We believe there is significant value in our non-HBV assets and remain committed to maximizing this value. We intend to continue our clinical programs to the appropriate point in support of this objective. We also remain interested in advancing our ongoing metabolic and rare disease preclinical programs in an appropriate way toward this value maximization objective and in continuing to leverage our knowledge and expertise in LNP technology.
TKM-PLK1
Our oncology product platform, TKM-PLK1, targets polo-like kinase 1 (PLK1), a protein involved in tumor cell proliferation and a validated oncology target. Inhibition of PLK1 expression prevents the tumor cell from completing cell division, resulting in cell cycle arrest and death of the cancer cell. Evidence that patients with elevated levels of PLK1 in their tumors exhibit poorer prognosis and survival rates has been documented in the medical literature. TKM-PLK1 is being evaluated in oncology indications in which there are limited or ineffective therapies available: Gastrointestinal Neuroendocrine Tumors (GI-NET), Adrenocortical Carcinoma (ACC) and Hepatocellular Carcinoma (HCC).
GI-NET and ACC
GI-NET is the gastrointestinal subset of neuroendocrine tumors. According to a paper by Yao et al. (2008), a historical analysis of the US SEER database reveals the incidence of neuroendocrine tumors has increased faster in the last few decades than any other neoplasm, with a growth rate of greater than 3% expected to continue in the near term. The prevalence of GI-NET in the US is estimated to be approximately 55,000 individuals. Prognosis for advanced or metastatic GI-NET, the target population for TKM-PLK1, is poor with 25-54% of patients surviving less than one year.
ACC is an ultra-rare form of cancer that develops in the adrenal gland, with data from the US National Cancer Institute estimating 500 patients in the US. Survival prognosis for these patients is poor. A large percentage of patients are not good surgical candidates and there is a lack of effective systemic therapies.
We presented updated Phase I TKM-PLK1 data at the 6th Annual NET Conference hosted by the North American Neuroendocrine Tumor Society (NA-NETS) in Charleston, South Carolina on October 4, 2013. This data set included a total of 36 patients in a population of advanced cancer patients with solid tumors. Doses ranged from 0.15 mg/kg to 0.90 mg/kg during the dose escalation portion of the trial, with the maximum tolerated dose (MTD) of 0.75 mg/kg. Serious adverse events (SAEs) were experienced by four subjects in this heavily pre-treated, advanced cancer patient population, with three of four subjects continuing on study. Forty percent (6 out of 15) of patients evaluable for response, treated at a dose equal to or greater than 0.6 mg/kg, showed clinical benefit. Three out of the four ACC patients (75%) treated with TKM-PLK1 achieved stable disease, including one patient who saw a 19.3% reduction in target tumor size after two cycles of treatment and is still on study receiving TKM-PLK1. Of the two GI-NET patients enrolled, both experienced clinical benefit: one patient had a partial response based on Response Evaluation Criteria in Solid Tumors
(
RECIST) criteria, and the other GI-NET patient achieved stable disease and showed a greater than 50% reduction in Chromogranin-A (CgA) levels, a key biomarker used to predict clinical outcome and tumor response.
Based on encouraging results from the dose escalation portion and expansion cohort from our Phase I TKM-PLK1 clinical trial, we expanded into a Phase I/II clinical trial with TKM-PLK1, which is specifically enrolling patients within two therapeutic indications: advanced GI-NET or ACC. This multi-center, single arm, open label study is designed to measure efficacy using RECIST criteria
for GI-NET patients and ACC patients as well as evaluate the safety, tolerability and pharmacokinetics of TKM-PLK1. TKM-PLK1 is administered weekly with each four-week cycle consisting of three once-weekly doses followed by a rest week. In the fall of 2014, we achieved our enrolment target of patients with advanced GI-NET or ACC tumors. These patients will continue treatment and be followed to determine if TKM-PLK1 produces a meaningful clinical benefit.
We provided an update on this Phase I/II clinical study in December 2014. To date, 55 patients, in both the Phase I and Phase I/II studies have been treated at doses of ≥ 0.6 mg/kg, which is considered to be in the efficacious dose range based on preclinical studies. Of these, 31 patients comprise the target population of GI-NET or ACC patients. Currently, nine patients (GI-NET and ACC) remain actively on treatment and data collection is ongoing.
42
While we are still awaiting maturation of data, we continue to see evidence of anti-tumor activity in some treated subjects, including one ACC patient with an almost complete resolution of their disease. We expect to report final data from these studies in the second half of 2015.
HCC
HCC is one of the most common cancers and one of the most deadly, with over 650,000 deaths each year worldwide according to the Globocan 2012 database. US incidence is estimated at 27,000 individuals with annual growth rates greater than 2%. HCC is an aggressive, hard-to-treat disease with one-year survival rates of less than 50% and five-year rates as low as 4% (National Cancer Institute). To date, Nexavar (sorafenib) is the only agent approved to treat HCC with an improvement in overall survival of just two to three months.
In May 2014, we initiated another Phase I/II clinical trial with TKM-PLK1, enrolling patients with advanced HCC. Patient dosing has commenced and we have completed the first treatment in all of our subjects for the first HCC cohort. This Phase I/II clinical trial is a multi-center, single arm, open label dose escalation study designed to evaluate the safety, tolerability and pharmacokinetics of TKM-PLK1 as well as determine the maximum tolerated dose in patients with advanced HCC. It will also include a preliminary assessment of the anti-tumor activity of TKM-PLK1 in this patient population. It is expected that approximately 38 patients with advanced HCC tumors will be enrolled in this Phase I/II clinical trial.
TKM-Ebola
TKM-Ebola, an anti-Ebola RNAi therapeutic, is being developed under a $140 million contract, signed in July 2010, with the U.S. Department of Defense (DoD) Joint Project Manager Medical Countermeasure Systems BioDefense Therapeutics (JPM-MCS-BDTX). Preclinical studies published in the medical journal
The Lancet
in 2010 demonstrated that when RNAi triggers targeting the Ebola virus and delivered by our LNP technology were used to treat previously infected non-human primates, the result was 100 percent protection from an otherwise lethal dose of Zaire Ebola virus (Geisbert et al.,
The Lancet,
Vol. 375, May 29, 2010).
In May 2013, our collaboration with the JPM-MCS-BDTX was modified and expanded to include advances in LNP formulation technology. The contract modification increased the first stage of funding from $34.7 million to $41.7 million. In April 2014, we signed a second contract modification to increase this funding by $2.1 million to a total of $43.8 million to compensate Tekmira for unrecovered costs that occurred in 2012 and to provide additional funding should it be required.
TKM-Ebola is being developed under specific U.S. Food and Drug Administration (FDA) regulatory guidelines called the “Animal Rule.” This allows, in circumstances where it is unethical or not feasible to conduct human efficacy studies, marketing approval to be granted based on adequate and well-controlled animal studies when the results of those studies establish that the drug is reasonably likely to produce clinical benefit in humans. Demonstration of the product’s safety in humans is still required.
We were granted Fast Track designation from the FDA for the development of TKM-Ebola in March 2014. The FDA’s Fast Track is a process designed to facilitate the development and expedite the review of drugs in order to get important new therapies to the patient earlier.
In May 2014, we successfully completed the single ascending dose portion of the TKM-Ebola Phase I clinical trial in healthy human volunteers. Results demonstrated that administration of the TKM-Ebola therapeutic, in the absence of any steroid containing pre-medication, was well-tolerated at a dose level of 0.3 mg/kg, determined to be the maximum tolerated dose.
In July 2014, we received notice from the FDA placing the TKM-Ebola Investigational New Drug application (IND) on clinical hold until additional information is supplied, and the multiple ascending dose portion of the trial protocol is modified to ensure the safety of healthy volunteers. The clinical hold was subsequently modified to a partial clinical hold to permit the administration of TKM-Ebola to patients with a suspected or confirmed Ebola virus infection. Under the FDA’s expanded access program, several patients with a confirmed or suspected Ebola virus infection were treated with TKM-Ebola. Data is being collected and will be provided to the FDA under our IND. Health Canada also established a similar framework for the potential use of TKM-Ebola in the same group of patients.
With the emergency use of our TKM-Ebola product under expanded access protocols and recent developments, such as the production of a new product candidate for clinical trials in West Africa, the clinical development pathways for our Ebola products are evolving. We may not be able to resolve the partial clinical hold of the healthy volunteer, multiple ascending dose portion of our Phase 1 trial of TKM-Ebola.
In December 2014, the US Congress amended the Rare and Tropical Disease list to include Ebola as a candidate for a potential Accelerated Review Voucher.
TKM-Ebola-Guinea, an Anti-Ebola RNAi Therapeutic Targeting Ebola-Guinea Strain of Ebola Virus
In September 2014, we joined an international consortium led by the International Severe Acute Respiratory and Emerging Infection Consortium (ISARIC) at the University of Oxford, UK, to potentially provide an RNAi based investigational therapeutic for expedited clinical studies in West Africa.
43
In October 2014, the genomic sequence of the Ebola-Guinea strain, which is the virus responsible for the recent outbreak in West Africa, was determined from several viral isolates and published in the New England Journal of Medicine (Baize S., et al. Emergence of Zaire Ebola Virus Disease in Guinea;
New England Journal of Medicine
, October 9, 2014 Vol. 371 No. 15). We rapidly developed a modified RNAi therapeutic to specifically target Ebola-Guinea. The new product, TKM-Ebola-Guinea, is designed to match the genomic sequence exactly, with two RNAi molecule triggers. Results of preclinical studies with TKM-Ebola-Guinea demonstrated efficacy comparable to those obtained with TKM-Ebola, which demonstrated up to 100% protection from an otherwise lethal dose of the virus.
In December 2014, we entered into a Manufacturing and Clinical Trial Agreement with the University of Oxford to provide the new TKM-Ebola-Guinea therapeutic product for clinical studies in West Africa. ISARIC can conduct clinical studies of TKM-Ebola-Guinea in Ebola virus infected patients, with funding provided by the Wellcome Trust. GMP manufacture of TKM-Ebola-Guinea is now complete and 100 treatment courses are available for the study. A Phase II single arm trial called RAPIDE (Rapid Assessment of Potential Interventions & Drugs for Ebola), was initiated in March 2015 in Sierra Leone. The study is open-label with a concurrent observational study in Ebola, and results are expected in the second half of 2015.
The U.S. Department of Defense JPM-MCS-BDTX has also exercised an option, valued at $7.0 million, in our current contract to manufacture TKM-Ebola-Guinea. We have been awarded the option for scale-up and GMP manufacture of the product for approximately 500 treatment courses.
Non-HBV Preclinical Candidates
(LNP enabled)
We are currently evaluating several additional preclinical candidates with potential in diverse therapeutic areas. Given the extremely high efficiency of delivery for third and fourth generation liver-centric LNP formulations, we are focused on rare diseases where the molecular target is found in the liver, early clinical proof-of-concept can be achieved and development opportunities may be accelerated. Our research team intends to continue to generate preclinical data to support the advancement of the most promising of these targets.
TKM-Marburg
Like Ebola, Marburg is a member of the filovirus family of hemorrhagic fever viruses. Natural outbreaks with the Marburg-Angola strain have resulted in mortality in approximately 90% of infected individuals. There are currently no approved therapeutics available for the treatment of Marburg infection.
In 2010, along with the University of Texas Medical Branch (UTMB), we were awarded a National Institutes of Health (NIH) grant to support research to develop RNAi therapeutics to treat Ebola and Marburg hemorrhagic fever viral infections. In November 2013, we announced data showing 100% survival in non-human primates infected with the Angola strain of the Marburg virus in two separate studies. These results build upon a study published earlier in the Journal of Infectious Disease showing 100% protection in guinea pig models of infection with Angola, Ci67 and Ravn strains of the Marburg virus using a broad spectrum RNAi therapeutic enabled by Tekmira’s LNP.
In February 2014, along with UTMB, and other collaborators, we were awarded additional funding from the NIH in support of this research. Data was published demonstrating complete protection of non-human primates against lethal Marburg-Angola strain, (
Science Translational Medicine
. Thi EP., et al. Marburg virus infection in nonhuman primates: Therapeutic treatment by lipid-encapsulated siRNA. 2014 Aug 20;6 (250))
TKM-HTG
Our metabolic product platform, TKM-HTG, aims to achieve rapid and sustained reductions of triglycerides to address the limitations of existing Hypertriglyceridemia (HTG) treatments. Hypertriglyceridemia is a type of dyslipidemia where there are high blood levels of triglycerides. Patients with severe HTG, (classified as triglyceride levels greater than 1000 mg/dL) are at risk of acute pancreatitis as well as the risk of cardiovascular disease. Approximately one million adults in the US and 18 million worldwide suffer from severe HTG. (NHANES 2003-2004 data).
Another patient group affected by HTG are those with Familial Chylomicronemia Syndrome (FCS), which is a very rare hereditary condition affecting an estimated 1:1,000,000 people (
www.fcs.raredr.com
). Additionally, 35% of patients with Type 2 Diabetes (T2D) suffer from mixed hyperlipidemia which is a combination of elevated cholesterol and high triglycerides. With underlying T2D, these patients are at considerable risk from cardiovascular disease.
TKM-HTG is being developed as a multi-component RNAi therapeutic that simultaneously targets a combination of genes expressed in the liver, which are known to play a significant role in triglyceride metabolism. High triglyceride levels are medically linked to increased risk of cardiovascular disease, fatty liver disease, insulin resistance and pancreatitis.
We anticipate filing an investigational new drug application, or equivalent document, in the second half of 2015.
44
TKM-ALDH
TKM-ALDH is designed to knockdown or silence aldehyde dehydrogenase (ALDH) to induce long term acute sensitivity to ethanol, for use in severe alcohol use disorder. Aldehyde dehydrogenase is a key enzyme in ethanol metabolism. Inhibition of ALDH activity, through the silencing of ALDH results in the build-up of acetaldehyde leading to adverse physiological effects. Human proof of concept for ALDH inhibition already exists in the form of the approved drug disulfiram. However, disulfiram’s efficacy is compromised by poor compliance because it has to be taken daily. We believe TKM-ALDH will induce prolonged ethanol sensitivity that will enable it to overcome the compliance limitations associated with daily dosing. We are exploring partnering or external funding opportunities to maximize the value of this asset.
Ongoing Advancements in LNP Technology
We plan to continue to develop our proprietary LNP delivery technology and receive clinical validation from LNP-based products currently in clinical trials. The most advanced LNP-enabled therapeutic, which is being developed by Alnylam Pharmaceuticals, Inc., has entered a Phase III clinical trial. We believe our LNP technology can remain an important cornerstone of our business development activities moving forward. We recently announced the latest (fourth) generation of the platform which comprises a rational re-design of the lipid architecture, as well as formulation and process advances. These attributes can be utilized in programs entering the clinic in 2015 and are expected to yield significant increases in potency and therapeutic index.
Because LNP can enable a wide variety of nucleic acid triggers, including messenger RNA (mRNA), we continue to see new product development and partnering opportunities based on what we believe is our industry-leading delivery expertise. In February 2014, we presented new preclinical data at the AsiaTIDES scientific symposium in Tokyo, Japan demonstrating that mRNA can be effectively delivered to target proteins expressed.
Technology, Product Development and Licensing Agreements
In the field of RNAi therapeutics, we have licensed our LNP delivery technology to Alnylam and Merck & Co., Inc. Alnylam has provided royalty bearing access of our LNP delivery technology to some of its partners. We also have a licensing and collaboration agreement with Dicerna Pharmaceuticals, Inc. In addition, we have ongoing research relationships with Monsanto, the United States National Cancer Institute, the US Department of Defense's BioDefense Therapeutics program and other undisclosed pharmaceutical and biotechnology companies. Outside the field of RNAi, we have a legacy licensing agreement with Spectrum Pharmaceuticals, Inc.
We have rights under the RNAi intellectual property of Alnylam to develop 13 RNAi therapeutic products. In addition, we have a broad non-exclusive license to use Unlocked Nucleobase Analogs (UNAs) from Arcturus Therapeutics, Inc. for the development of RNAi therapeutic products directed to any target in any therapeutic indication.
Strategic Alliances
Alnylam Pharmaceuticals, Inc. (“Alnylam”)
Alnylam has a license to use our Intellectual Property (IP) to develop and commercialize products and may only grant access to our LNP technology to its partners if it is part of a product sublicense. Alnylam’s license rights are limited to patents that we filed, or that claim priority to a patent that was filed, before April 15, 2010. Alnylam does not have rights to our patents filed after April 15, 2010 unless they claim priority to a patent filed before that date. Alnylam will pay us low single digit royalties as Alnylam’s LNP-enabled products are commercialized. Alnylam currently has three LNP-based products in clinical development: ALN-TTR02 (patisiran), ALN-VSP, and ALN-PCS02.
In November 2013, Alnylam presented positive results from its Phase II clinical trial with patisiran (ALN-TTR02), an RNAi therapeutic targeting transthyretin (TTR) for the treatment of TTR-mediated amyloidosis (ATTR), which is enabled by our LNP technology. Alnylam also announced the initiation of the APOLLO Phase III trial of patisiran, with the study now open for enrolment to evaluate efficacy and safety of patisiran in ATTR patients with Familial Amyloidotic Polyneuropathy (FAP).
In December 2013, we received a $5 million milestone from Alnylam, triggered by the initiation of the APOLLO Phase III trial of patisiran. We have entered an arbitration proceeding with Alnylam, as provided for under our licensing agreement, to resolve a matter related to a disputed $5 million milestone payment to Tekmira by Alnylam for its ALN-VSP product. We have not recorded any revenue in respect of this milestone.
In April 2014, Alnylam presented positive new data from its Phase II clinical trial with patisiran. These results provide support for Alnylam's Phase III APOLLO trial in which patisiran is being evaluated for its potential efficacy and safety in ATTR patients with FAP. Alnylam has disclosed that it continues to enrol patients in its APOLLO Phase III trial, with over 20 sites in nine countries, which are now open and active. The Phase III trial is intended to demonstrate the efficacy and safety of patisiran in support of marketing authorization in countries around the world.
45
In October 2014, Alnylam reported positive clinical data for the ongoing patisiran Phase II Open Label Extension (OLE) study in patients with FAP, which is also enabled by Tekmira’s LNP technology. The results demonstrated sustained knockdown of serum TTR of up to 90% and a favorable tolerability profile out to one year of treatment.
The patisiran program represents the most clinically advanced application of Tekmira’s proprietary LNP delivery technology. Furthermore, Alnylam’s results demonstrate that multi-dosing with Tekmira’s LNP has been well-tolerated with treatments out to one year.
Our licensing agreement with Alnylam grants us IP rights for the development and commercialization of RNAi therapeutics for specified targets. In consideration for these three exclusive and 10 non-exclusive licenses, we have agreed to pay single-digit royalties to Alnylam on product sales, with milestone obligations of up to $8.5 million on the non-exclusive licenses and no milestone obligations on the three exclusive licenses.
Acuitas Therapeutics Inc. (“Acuitas”)
Consistent with the terms of the settlement agreement signed in November 2012, we finalized and entered a cross-license agreement with Acuitas (formerly AlCana Technologies, Inc.) in December 2013. The terms of the cross-license agreement provide Acuitas with access to certain of Tekmira’s earlier IP generated prior to April 2010 and provide us with certain access to Acuitas’ technology and licenses in the RNAi field, along with a percentage of each milestone and royalty payment with respect to certain products. Acuitas has agreed that it will not compete in the RNAi field for a period of five years.
Spectrum Pharmaceuticals, Inc. (“Spectrum”)
In September 2013, we announced that our licensee, Spectrum, had launched Marqibo® through its existing hematology sales force in the United States. Since then commercial sales have occurred. We are entitled to mid-single digit royalty payments based on Marqibo®’s commercial sales. Marqibo, which is a novel sphingomyelin/cholesterol liposome-encapsulated formulation of the FDA-approved anticancer drug vincristine, was originally developed by Tekmira. We out-licensed the product to Talon Therapeutics in 2006 and in July 2013, Talon was acquired by Spectrum. Marqibo’s approved indication is for the treatment of adult patients with Philadelphia chromosome-negative acute lymphoblastic leukemia (Ph-ALL) in second or greater relapse or whose disease has progressed following two or more lines of anti-leukemia therapy. Spectrum has ongoing trials evaluating Marqibo in three additional indications, which are: first line use in patients with Ph-ALL, Pediatric ALL and Non-Hodgkin’s lymphoma.
Monsanto Company (“Monsanto”)
In January 2014, we signed an Option Agreement and a Service Agreement with Monsanto, pursuant to which Monsanto may obtain a license to use our proprietary delivery technology. The transaction supports the application of our proprietary delivery technology and related IP for use in agriculture. The potential value of the transaction could reach $86.2 million following the successful completion of milestones. In January 2014, we received $14.5 million of the $17.5 million in near term payments. We received additional payments of $1.5 M each in June 2014 and October 2014 following achievement of specific program objectives.
Marina Biotech, Inc. (“Marina”) / Arcturus Therapeutics, Inc. (“Arcturus”)
In November 2012, we disclosed that we had obtained a worldwide, non-exclusive license to a novel RNAi trigger technology called Unlocked Nucleobase Analog (UNA) from Marinaa for the development of RNAi therapeutics. UNAs can be incorporated into RNAi drugs and have the potential to improve them by increasing their stability and reducing off-target effects. In August 2013, Marina assigned its UNA technology to Arcturus and the UNA license agreement between Tekmira and Marina was assigned to Arcturus. The terms of the license are otherwise unchanged.
To date, we have paid Marina $0.5 million in license fees and there are milestones of up to $3.2 million plus royalties for each product that we develop using UNA technology licensed from Marina. We announced on January 21, 2015, that we had initiated a Phase I clinical trial with TKM-HBV. As TKM-HBV utilizes UNA technology in-licensed from Arcturus, the initiation of the trial triggered a single milestone payment of $250,000 payable by us to Arcturus.
Merck & Co., Inc. ("Merck") and Alnylam license agreement
As a result of the business collaboration with Protiva in 2008, we acquired a non-exclusive royalty-bearing world-wide license agreement with Merck. Under the license, Merck will pay up to $17 million in milestones for each product they develop covered by Protiva’s IP, except for the first product for which Merck will pay up to $15 million in milestones, and will pay royalties on product sales. Merck’s license rights are limited to patents that we filed, or that claim priority to a patent that was filed, before October 9, 2008. Merck does not have rights to our patents filed after October 9, 2008 unless they claim priority to a patent filed before that date. Merck has also granted a license to Tekmira to certain of its patents. On March 6, 2014, Alnylam announced that they acquired all assets and licenses from Merck, which included our license agreement.
Bristol-Myers Squibb Company (“BMS”)
In May 2010, we announced a research collaboration with BMS. Under this agreement, BMS conducted preclinical work to validate the function of certain genes and shared the data with us to potentially develop RNAi therapeutic drugs against therapeutic targets of interest. We formulated the required RNAi trigger molecules enabled by our LNP technology to silence target genes of interest. BMS paid us $3 million concurrent with the signing of the agreement. We provided a predetermined number of LNP batches over the four-year agreement. In May 2011, we announced a further expansion of the collaboration to include broader applications of our LNP technology and additional target validation work. In May 2014, the collaboration expired and both parties’ obligations ended.
46
U.S. National Institutes of Health (“NIH”)
On October 13, 2010 we announced that together with collaborators at The University of Texas Medical Branch (“UTMB”), we were awarded a new NIH grant, worth $2.4 million, to support research to develop RNAi therapeutics to treat Ebola and Marburg hemorrhagic fever viral infections using our LNP delivery technology. In February 2014, UTMB and Tekmira, along with other collaborators, were awarded additional funding of $3.4 million over five years from the NIH in support of this research.
Halo-Bio RNAi Therapeutics, Inc. ("Halo-Bio")
In August 2011, we entered into a license and collaboration agreement with Halo-Bio. Under the agreement, Halo-Bio granted to us an exclusive license to its multivalent ribonucleic acid MV-RNA technology. The agreement was amended on August 8, 2012 to adjust future license fees and other contingent payments. To date, we have recorded $0.5 million in fees under our license from Halo-Bio. We terminated the agreement with Halo-Bio in July 2013. There are no further payments due or contingently payable to Halo-Bio.
Dicerna Pharmaceuticals, Inc. (“Dicerna”)
In November 2014, Tekmira signed a licensing agreement and a development and supply agreement with Dicerna to license Tekmira's LNP delivery technology for exclusive use in Dicerna's primary hyperoxaluria type 1 (PH1) development program. Dicerna will use Tekmira's third generation LNP technology for delivery of DCR-PH1, Dicerna's product incorporating its Dicer substrate RNA (DsiRNA) molecule, for the treatment of PH1, a rare, inherited liver disorder that often results in kidney failure and for which there are no approved therapies. Under the agreements, Dicerna paid Tekmira $2.5 million upfront and will potentially make payments of $22 million in aggregate development milestones, plus a mid-single-digit royalty on future PH1 sales. This partnership also includes a supply agreement under which we will provide clinical drug supply and regulatory support for the rapid advancement of this product candidate.
Newly acquired assets as a result of our merger with OnCore
In addition to the newly acquired product candidates discussed above, our merger with OnCore resulted in the acquisition of the following:
Cytos Biotechnology Ltd (“Cytos”)
On December 30, 2014, OnCore entered into an exclusive, worldwide, sub-licensable (subject to certain restrictions with respect to licensed viral infections other than hepatitis) license to six different series of compounds. The licensed compounds are Qbeta-derived virus-like particles that encapsulate TLR9, TLR7 or RIG-I agonists and may or may not be conjugated with antigens from hepatitis virus or other licensed viruses. We have an option to expand this license to include additional viral infections other than influenza and Cytos will retain all rights for influenza, all non-viral infections, and all viral infections (other than hepatitis) for which we have not exercised an option.
In partial consideration for this license, upon closing of the Cytos Agreement we will be obligated to pay Cytos up to a total of $67 million for each of the six licensed compound series upon the achievement of specified development and regulatory milestones; for hepatitis and each additional licensed viral infection, up to a total of $110 million upon the achievement of specified sales performance milestones; and tiered royalty payments in the high-single to low-double digits, based upon the proportionate net sales of licensed products in any commercialized combination.
The Baruch S. Blumberg Institute (“Blumberg”) and Drexel University (“Drexel”)
In February 2014, OnCore entered into a license agreement with Blumberg and Drexel that granted us an exclusive (except as to certain know-how and subject to retained non-commercial research rights), worldwide, sub-licensable license to three different compound series: cccDNA inhibitors, capsid assembly inhibitors and HCC inhibitors.
In partial consideration for this license, OnCore paid a license initiation fee of $150,000 and issued warrants to Blumberg and Drexel. Under this license agreement, OnCore also agreed to pay up to $3.5 million in development and regulatory milestones per licensed compound series, up to $92.5 million in sales performance milestones per licensed product, and royalties in the mid-single digits based upon the proportionate net sales of licensed products in any commercialized combination. We are obligated to pay Blumberg and Drexel a double digit percentage of all amounts received from the sub-licensees, subject to customary exclusions.
In November 2014, OnCore entered into an additional license agreement with Blumberg and Drexel pursuant to which OnCore received an exclusive (subject to retained non-commercial research rights), worldwide, sub-licensable license under specified patents and know-how controlled by Blumberg and Drexel covering epigenetic modifiers of cccDNA and STING agonists. In consideration for these exclusive licenses, OnCore made an upfront payment of $50,000. Under this agreement, we will be required to pay up to $1.0 million for each licensed product upon the achievement of a specified regulatory milestone and a low single digit royalty, based upon the proportionate net sales of compounds covered by this intellectual property in any commercialized combination. We are also obligated to pay Blumberg and Drexel a double digit percentage of all amounts received from its sub-licensees, subject to exclusions.
License Agreements between Enantigen (“Enantigen”) and Blumberg and Drexel
In October 2014, OnCore acquired all of the outstanding shares of Enantigen pursuant to a stock purchase agreement. Through this transaction, OnCore acquired a HBV surface antigen secretion inhibitor program and a capsid assembly inhibitor program, each of which are now assets of Tekmira, following the merger with OnCore.
Under the stock purchase agreement, we agreed to pay up to a total of $21.0 million to Enantigen’s selling stockholders upon the achievement of specified development and regulatory milestones, for the first two products that contain either a capsid compound, or a HBV surface antigen compound that is covered by a patent that acquired under this agreement, or a capsid compound from an agreed upon list of compounds, up to a total of $101.5 million in sales performance milestones in connection with the sale of the first commercialized product of Tekmira for the treatment of HBV, regardless of whether such product is based upon assets acquired under this agreement, and low single digit royalty on net sales of such first commercialized HBV product, up to a maximum royalty payment of $1.0 million that, if paid, would be offset against our milestone payment obligations.
47
Under the stock purchase agreement, we also agreed that Enantigen would cause Enantigen to fulfill its obligations under Enantigen’s three patent license agreements with Blumberg and Drexel. Pursuant to each patent license agreement, Enantigen is obligated to pay Blumberg and Drexel up to approximately $500,000 in development and regulatory milestones per licensed product, royalties in the low single digits, and a percentage of revenue it receives from its sub-licensees.
Research Collaboration and Funding Agreement with Blumberg
In October 2014, OnCore entered into a research collaboration and funding agreement with Blumberg under which we will provide $1.0 million per year of research funding for three years, renewable at our option for an additional three years, for Blumberg to conduct research projects in HBV and liver cancer pursuant to a research plan to be agreed upon by the parties. Blumberg has exclusivity obligations to Tekmira with respect to HBV research funded under the agreement. In addition, we have the right to match any third party offer to fund HBV research that falls outside the scope of the research being funded under the agreement. Blumberg has granted us the right to obtain an exclusive, royalty bearing, worldwide license to any intellectual property generated by any funded research project. If we elect to exercise our right to obtain such a license, we will have a specified period of time to negotiate and enter into a mutually agreeable license agreement with Blumberg. This license agreement will include the following pre negotiated upfront, milestone and royalty payments: an upfront payment in the amount of $100,000; up to $8.1 million upon the achievement of specified development and regulatory milestones; up to $92.5 million upon the achievement of specified commercialization milestones; and royalties at a low single to mid-single digit rates based upon the proportionate net sales of licensed products from any commercialized combination.
NeuroVive Pharmaceutical AB (“NeuroVive”)
In September 2014, OnCore entered into a license agreement with NeuroVive that granted us an exclusive, worldwide, sub-licensable license to develop, manufacture and commercialize, for the treatment of HBV, oral dosage form sanglifehrin based cyclophilin inhibitors (including OCB-030). Under this license agreement we have been granted a non-exclusive, royalty free right and license and right of reference to NeuroVive’s relevant regulatory approvals and filings for the sole purpose of developing, manufacturing and commercializing licensed products for the treatment of HBV. Under this license agreement, we have (1) an option to expand our exclusive license to include treatment of viral diseases other than HBV and (2) an option, exercisable upon specified conditions, to expand our exclusive license to include development, manufacture and commercialization of non-oral variations of licensed products for treatment of viral diseases other than HBV. NeuroVive retains all rights with respect to development, manufacture and commercialization of licensed products and non-oral variations of licensed products for all indications (other than HBV) for which we have not exercised our option.
In partial consideration for this license, OnCore paid NeuroVive a license fee of $1 million. We are also obligated to pay up to $47.0 million in clinical development and regulatory milestones per indication and up to $102.5 million in sales performance milestones per licensed product and indication. If we are acquired by a third party in a transaction that meets certain criteria, then we or our acquiror will be obligated to pay all remaining development, regulatory and sales milestone payments, regardless of whether the applicable milestone events have been achieved, for each licensed product that entered clinical development before such acquisition. We agreed to pay NeuroVive tiered royalties in the mid-single to low-double digit range
based upon the proportionate
gross sales of patented licensed products
from any commercialized combination
. If we terminate this license agreement in its entirety for convenience prior to the first commercial sale of any licensed product, we will be obligated to pay NeuroVive $2 million.
CRITICAL ACCOUNTING POLICIES AND ESTIMATES
The significant accounting policies that we believe to be most critical in fully understanding and evaluating our financial results are revenue recognition, stock-based compensation, share purchase warrant valuation and financial instrument valuation. These accounting policies require us to make certain estimates and assumptions. We believe that the estimates and assumptions upon which we rely are reasonable, based upon information available to us at the time that these estimates and assumptions are made. Actual results may differ from our estimates. Our critical accounting estimates affect our net income or loss calculation.
Revenue Recognition /
Our primary sources of revenue have been derived from research and development collaborations and contracts, and licensing fees comprised of initial fees and milestone payments. Payments received under research and development agreements and contracts, which are non-refundable, are recorded as revenue as services are performed and as the related expenditures are incurred pursuant to the agreement, provided collectability is reasonably assured. Revenue earned under research and development manufacturing collaborations where we bear some or all of the risk of a product manufacture failure is recognized when the purchaser accepts the product and there are no remaining rights of return. Revenue earned under research and development collaborations and contracts where we do not bear any risk of product manufacture failure is recognized in the period the work is performed. Revenue earned under contractual arrangements upon the achievement of substantive milestones is recognized in its entirety in the period the payment has been received. We evaluate whether milestones under research and development arrangements are substantive by considering: whether substantive uncertainty exists upon the execution of the arrangement; the event can only be achieved based in whole or in part on our performance or occurrence of a specific outcome resulting from the our performance; any future performance required and payment is reasonable relative to all deliverables; and, payment terms in the arrangement. Initial fees and non-substantive milestone payments are deferred and amortized into income over the estimated period of our involvement as we fulfill our obligations under our agreements.
48
The revenue that we recognize is a critical accounting estimate because of the volume and nature of the revenues we receive. Some of the research, development and licensing agreements that we have entered into contain multiple revenue elements that are to be recognized for accounting in accordance with our revenue recognition policy. We need to make estimates as to what period the services will be delivered with respect to up-front licensing fees and milestone payments received because these payments are deferred and amortized into income over the estimated period of our ongoing involvement. The actual period of our ongoing involvement may differ from the estimated period determined at the time the payment is initially received and recorded as deferred revenue. This may result in a different amount of revenue that should have been recorded in the period and a longer or shorter period of revenue amortization. When an estimated period changes we amortize the remaining deferred revenue over the estimated remaining time to completion. The rate at which we recognize revenue from payments received for services to be provided under research and development agreements depends on our estimate of work completed to date and total work to be provided. The actual total services provided to earn such payments may differ from our estimates.
Our DoD contract for TKM-Ebola is based on cost reimbursement plus an incentive fee. At the beginning of our fiscal year we estimate our labor and overhead rates for the year ahead. During the year, we re-estimate our labor and overhead rates and adjust our revenue accordingly. Our actual labor and overhead rates will differ from our estimate based on actual costs incurred and the proportion of our efforts on contracts and internal products versus indirect activities. Within minimum and maximum collars, the amount of incentive fee we can earn under the DoD contract varies based on our costs incurred versus budgeted costs, with the exception of the Ebola-Guinea Amendment, which has a fixed incentive fee. During the contractual period, incentive fee revenue and total costs are impacted by management’s estimate and judgments which are continuously reviewed and adjusted, as necessary, using the cumulative catch-up method. At December 31, 2012, we were not able to make a reliable estimate of the final contract costs, and only the minimum incentive fee achievable and earned was recognized. For the years ended December 31, 2013 and 2014, we believe we were able to reliably estimate the final contract costs so have recognized the portion of expected incentive fee which has been earned to date.
Our revenue for 2014 was $15.0 million (2013 - $15.5 million, 2012 - $14.1 million) and deferred revenue at December 31, 2014 was $15.7 million (December 31, 2013 - $3.5 million).
Stock-based compensation
/ The stock-based compensation that we record is a critical accounting estimate due to the value of compensation recorded, the volume of our stock option activity, and the many assumptions that are required to be made to calculate the compensation expense.
Compensation expense is recorded for stock options issued to employees and directors using the fair value method. We must calculate the fair value of stock options issued and amortize the fair value to stock compensation expense over the vesting period, and adjust the expense for stock option forfeitures and cancellations. We use the Black-Scholes model to calculate the fair value of stock options issued which requires that certain assumptions, including the expected life of the option and expected volatility of the stock, be estimated at the time that the options are issued. This accounting estimate is reasonably likely to change from period to period as further stock options are issued and adjustments are made for stock option forfeitures and cancellations. We make an estimate for stock option forfeitures at the time of grant and revise this estimate in subsequent periods if actual forfeitures differ. The term "forfeitures" is distinct from "cancellations" or "expirations" and represents only the unvested portion of the surrendered stock option. Prior to Q2 2014, for the purpose of calculating the fair value, the expected life of stock options granted was eight years for employees, and ten years for directors and executives. Based on the pattern of increasing exercises of stock options, we have reduced the expected life to five years for employees and eight years for directors and executives for stock options granted after March 31, 2014. The expected life and fair values of stock-options granted prior to this date remain unchanged. The reduction in expected life has the effect of reducing the fair value of stock-options granted. We amortize the fair value of stock options using the straight-line method over the vesting period of the options, generally a period of three years for employees and immediate vesting for directors.
We recorded stock-based compensation expense in 2014 of $3.3 million (2013 - $0.9 million, 2012 - $1.0 million). The impact on the fair value of stock options due to the reduction in expected life is minor, as we would have recorded stock-based compensation expense of $3.4 million in 2014 using the previous expected life assumptions of eight and ten years for employees and directors and executives, respectively.
Share purchase warrant valuation
/ The valuation of share purchase warrants is a critical accounting estimate due to the value of liabilities recorded and the many assumptions that are required to calculate the liability, resulting in the classification of our warrant liability as a level 3 financial instrument.
We classify warrants in our consolidated balance sheet as liabilities and revalue them at each balance sheet date. Any change in valuation is recorded in our statement of operations. We use the Black-Scholes pricing model to value the warrants. Determining the appropriate fair-value model and calculating the fair value of registered warrants requires considerable judgment. A small change in the estimates used may cause a relatively large change in the estimated valuation. Due to ongoing changes in our business and general stock market conditions, we continuously assess our warrant fair value assumptions. We adjust the estimated expected life as appropriate, based on the pattern of exercises of our warrants. Our expected volatility is calculated based on our historic share price fluctuations over the same period as our estimated expected life of our outstanding warrants. The risk-free interest rate is based on the Government of Canada rate for bonds with a maturity similar to the expected remaining life of the warrants at the valuation date.
We recorded a loss for the change in fair value of warrant liability in 2014 of $10.4 million (2013 – loss of $3.5 million, 2012 – loss of $3.8 million).
Financial instrument valuation
/ The valuation of our financial instrument, which is Monsanto’s option to acquire either the shares or assets of Protiva Agricultural Development Company Inc., is a critical accounting estimate due to the potential value of the liability and the many assumptions we must make to calculate the fair value of the liability.
49
We classify the financial instrument in our consolidated balance sheet as a liability and revalue it at each balance sheet date. Any change in the valuation is recorded in our statement of operations. We used a discounted cash flow model to value the financial instrument. Determining the appropriate fair value model and calculating the fair value of the financial instrument requires considerable judgment, and changes in assumptions used may cause a relatively large change in the estimated valuation. The initial valuation of the financial instrument was determined to be nil. No change in the fair value of the financial instrument was recorded as at December 31, 2014.
SUMMARY OF QUARTERLY RESULTS
The following table presents our unaudited quarterly results of operations for each of our last eight quarters. These data have been derived from our unaudited condensed consolidated financial statements, which were prepared on the same basis as our annual audited financial statements and, in our opinion, include all adjustments necessary, consisting solely of normal recurring adjustments, for the fair presentation of such information.
(in millions $ except per share data) – unaudited
|
Q4
|
Q3
|
Q2
|
Q1
|
Q4
|
Q3
|
Q2
|
Q1
|
|||||||||||||||||||||||||
|
2014
|
2014
|
2014
|
2014
|
2013
|
2013
|
2013
|
2013
|
|||||||||||||||||||||||||
|
Revenue
|
||||||||||||||||||||||||||||||||
|
Collaborations and contracts:
|
||||||||||||||||||||||||||||||||
|
DoD
|
$
|
2.8
|
$
|
1.5
|
$
|
0.9
|
$
|
3.2
|
$
|
2.6
|
$
|
2.8
|
$
|
2.4
|
$
|
1.9
|
||||||||||||||||
|
Monsanto
|
0.3
|
0.3
|
0.2
|
0.3
|
—
|
—
|
—
|
—
|
||||||||||||||||||||||||
|
Dicerna
|
0.3
|
0.2
|
—
|
—
|
—
|
—
|
—
|
—
|
||||||||||||||||||||||||
|
Other
|
—
|
1.6
|
—
|
0.2
|
(0.1)
|
0.1
|
0.4
|
0.2
|
||||||||||||||||||||||||
|
3.4
|
3.6
|
1.1
|
3.7
|
2.6
|
2.9
|
2.8
|
2.1
|
|||||||||||||||||||||||||
|
Alnylam milestone payments
|
—
|
—
|
—
|
0.2
|
5.0
|
—
|
—
|
—
|
||||||||||||||||||||||||
|
Monsanto licensing fees and milestone payments
|
0.9
|
0.7
|
0.6
|
0.5
|
—
|
—
|
—
|
—
|
||||||||||||||||||||||||
|
Spectrum milestone and royalty payments
|
0.1
|
0.1
|
0.0
|
0.0
|
—
|
—
|
—
|
—
|
||||||||||||||||||||||||
|
Total revenue
|
4.4
|
4.4
|
1.8
|
4.4
|
7.6
|
2.9
|
2.8
|
2.1
|
||||||||||||||||||||||||
|
Expenses
|
(15.1)
|
(11.2)
|
(11.2)
|
(10.4)
|
(9.9)
|
(6.6)
|
(5.9)
|
(5.1)
|
||||||||||||||||||||||||
|
Other income (losses)
|
4.5
|
(1.8)
|
3.3
|
(12.0)
|
(0.2)
|
(2.2)
|
0.1
|
0.5
|
||||||||||||||||||||||||
|
Net loss
|
(6.2)
|
(8.6)
|
(6.1)
|
(18.0)
|
(2.6)
|
(5.9)
|
(3.0)
|
(2.5)
|
||||||||||||||||||||||||
|
Basic net loss per share
|
$
|
(0.27)
|
$
|
(0.39)
|
$
|
(0.28)
|
$
|
(0.91)
|
$
|
(0.15)
|
$
|
(0.41)
|
$
|
(0.21)
|
$
|
(0.17)
|
||||||||||||||||
|
Diluted net loss per share
|
$
|
(0.27)
|
$
|
(0.39)
|
$
|
(0.28)
|
$
|
(0.91)
|
$
|
(0.15)
|
$
|
(0.41)
|
$
|
(0.21)
|
$
|
(0.17)
|
||||||||||||||||
Quarterly Trends
Revenue
/
Our revenue is derived from research and development collaborations and contracts, licensing fees, milestone and royalty payments. Over the past two years, our principal source of ongoing revenue has been our contract with the DoD to advance TKM-Ebola which began in July 2010. We expect revenue to continue to fluctuate particularly due to the development stage of the TKM-Ebola contract and the irregular nature of licensing and milestone receipts.
In Q3 2010 we signed a contract with the DoD to develop TKM-Ebola and have since incurred significant program costs related to equipment, materials and preclinical and clinical studies. These costs are included in our research, development, collaborations and contracts expenses. These costs are fully reimbursed by the DoD, and this reimbursement amount is recorded as revenue. DoD revenue from the TKM-Ebola program also compensates us for labor and overheads and provides an incentive fee. As described in our critical accounting policies, we estimate the labor and overhead rates to be charged under our TKM-Ebola contract and update these rate estimates throughout the year. Q1 2013 DoD revenue was lower as certain activities were still building momentum following the stop-work order that occurred in Q3 2012. TKM-Ebola contract revenue increased in Q2, Q3 and Q4 2013 as technology transfer, manufacturing and non-clinical studies were all ongoing. In April 2014, we signed a contract modification to increase the stage one targeted funding by $2.1 million to $43.8 million. The additional funding is to compensate us for unrecovered costs related to the temporary stop-work period that occurred in 2012 and to provide additional overhead funding should it be required. In Q2 2014, we earned $3.2 million in DoD revenue, due partially to an increase in activity as we moved into a Phase I Clinical Trial. Also, as a result of the contract modification, we now expect to complete the initial stage of the contract close to budget, which increases our estimate of total incentive fee to be earned under the contract and the amount we have earned to date. In Q2 2014, we earned $0.9 million in DoD revenue due to lower contract activity as our clinical trial data was with the FDA for review. DoD revenue increased in Q3 2014 with an increase in activity as we prepared a response to the FDA’s partial clinical hold on our Phase I Clinical Trial. In October 2014, the DoD exercised a contract option adding $7.0 million to the contract for the scale-up and manufacture of TKM-Ebola-Guinea, our product targeting the Ebola-Guinea strain responsible for the current outbreak in West Africa. DoD revenue increased in Q4 2014 to $2.8 million as we purchased materials for the manufacture of TKM-Ebola-Guinea.
50
In January 2014, we signed an Option Agreement and a Services Agreement with Monsanto for the use of our proprietary delivery technology and related intellectual property in agriculture. Over the option period, which is expected to be approximately four years, Monsanto will make payments to us to maintain their option rights. In Q1 2014, we received $14.5 million of the $17.5 million near term payments, of which $4.5 million relates to research services and $10.0 million for the use of our technology. In June 2014 and October 2014, we received further payments of $1.5 million each, following the completion of specified program developments. The payments are being recognized as revenue on a straight-line basis over the option period.
In November 2014, we signed a License Agreement and a Development and Supply Agreement with Dicerna for the use of our proprietary delivery technology and related technology intended to develop, manufacture, and commercialize products related to treatment of PH1. In Q4 2014, we received an upfront payment of $2.5 million, which is being recognized over the period over which we provide services to Dicerna, estimated to complete in Q1 2017.
In Q4 2013 we earned a $5.0 million milestone from Alnylam following their initiation of a Phase III trial enabled by our LNP technology.
In Q4 2013, we began to earn royalties from Spectrum with respect to the commercial sales of Marqibo.
Included in “other collaborations and contract revenue” is revenue from a BMS batch formulation agreement. In Q4 2013, we offered to extend the BMS agreement end date from May 2014 to December 2014. Extending the agreement would have given BMS more time to order LNP batches. Revenue recognized in 2013 has been reduced and the balance of deferred revenue as at December 31, 2013 has been increased to account for BMS potentially ordering more batches under the agreement. This agreement is reflected in the $0.1 million of negative “other revenue” in Q4 2013 when the offer was made to extend the agreement and a cumulative revenue adjustment was recorded. In August 2014, we received notification from BMS that the extension would not occur. As such, the collaboration expired and both parties’ obligations under the agreement ended. Revenue recognized in Q3 2014 relates to the release of the deferred revenue balance of $1.6 million.
Expenses /
Expenses consist primarily of clinical and pre-clinical trial expenses, personnel expenses, consulting and third party expenses, reimbursable collaboration expenses, consumables and materials, patent filing expenses, facilities, stock-based compensation and general corporate costs.
Our expenses have increased in the past eight quarters due to an increase in our research and development activities as we seek to move more products into the clinic. In Q3 2013, we initiated a Phase I/II Clinical Trial for TKM-PLK1 in patients with GI-NET or ACC. In Q1 2014, we dosed the first subject in human clinical trials of TKM-Ebola. In Q2 2014, we initiated a Phase I/II Clinical Trial for TKM-PLK1 in patients with HCC. In Q4 2014, we filed a Canadian Clinical Trial Application (CTA) for TKM-HBV and received clearance to conduct a Phase I Clinical Trial, as well as initiated manufacturing of TKM-Ebola-Guinea for emergency use in West Africa – see overview. We also incurred research and development expenses related to identifying new targets.
Other income (losses) /
Other income (losses) consist primarily of changes in the fair value of our warrant liability and foreign exchange differences. Other losses increased in Q3 2013, Q1 2014, and Q3 2014 due primarily to the increase in fair value of our warrant liability. Increases in our share price from the previous reporting date result in an increase in the fair value of our warrant liability, and vice versa. We expect to see future changes in the fair value of our warrant liability and these changes will largely depend on the change in the Company’s share price, any change in our assumed rate of share price volatility, our assumptions for the expected lives of the warrants and warrant exercises.
Net loss /
Fluctuations in our net loss are explained by changes in revenue, expenses and other income (losses) as discussed above.
Fourth quarter of 2014 /
Our Q4 2014 net loss was $6.2 million ($0.27 basic and diluted loss per common share) as compared to a net loss of $2.6 million ($0.15 basic and diluted loss per common share) for Q4 2013.
Revenue was $4.6 million in Q4 2014 as compared to $7.6 million in Q4 2013. The decrease was largely due to the $5.0 million milestone payment from Alnylam received in Q4 2013.
Research, development, collaborations and contracts expenses increased to $11.9 million in Q4 2014 as compared to $7.0 million in Q4 2013. In Q4 2014, we increased research and development activities related to moving TKM-HBV into the clinic, including costs incurred in preparing a CTA, as well as costs incurred to support the ongoing HCC Phase I clinical trial for TKM-PLK1. Further, in Q4 2014, we purchased materials for the manufacture of TKM-Ebola-Guinea for use in West Africa – see overview.
51
Other losses in Q4 2013 primarily consists of $1.4 million increase in warrant liability due to the increase in our share price, and a foreign exchange gain of $1.1 million on our US dollar funds. Other gains in Q4 2014 primarily consist of a $2.6 million decrease in the fair value of our warrant liability, and a foreign exchange gain of $2.3 million on US dollar funds. We also incurred $0.5 million in acquisition costs related to the merger with OnCore in Q1 2015 – see overview.
RESULTS OF OPERATIONS
The following summarizes the results of our operations for the 2014, 2013, and 2012 fiscal years, in millions of dollars:
|
2014
|
2013
|
2012
|
||||||||||
|
Total revenue
|
15.0
|
15.5
|
14.1
|
|||||||||
|
Operating expenses
|
47.9
|
27.6
|
27.0
|
|||||||||
|
Loss from operations
|
(33.0
|
)
|
(12.2
|
)
|
(12.9
|
)
|
||||||
|
Net income (loss)
|
(38.8
|
)
|
(14.1
|
)
|
29.6
|
|||||||
|
Basic income (loss) per share
|
(1.80
|
)
|
(0.92
|
)
|
2.16
|
|||||||
|
Diluted income (loss) per share
|
(1.80
|
)
|
(0.92
|
)
|
2.07
|
|||||||
|
Total assets
|
118.2
|
71.7
|
52.6
|
|||||||||
|
Total liabilities
|
30.1
|
12.5
|
11.7
|
|||||||||
|
Total non-current liabilities
|
9.9
|
0.0
|
0.7
|
|||||||||
|
Deficit
|
(205.9
|
)
|
(167.0
|
)
|
(153.0
|
)
|
||||||
|
Accumulated other comprehensive loss
|
(22.3
|
)
|
(15.8
|
)
|
(12.7
|
)
|
||||||
|
Total stockholders’ equity
|
88.0
|
59.2
|
40.9
|
|||||||||
Year ended December 31, 2014 compared to the year ended December 31, 2013
For the fiscal year ended December 31, 2014, our net loss was $38.8 million ($1.80 basic and diluted loss per common share) as compared to a net loss of $14.1 million ($0.92 basic and diluted loss per common share) for 2013.
Revenue
/ Revenue is summarized in the following table, in millions:
|
2014
|
% of Total
|
2013
|
% of Total
|
|||||||||||||
|
Collaborations and contracts
|
||||||||||||||||
|
DoD
|
8.4
|
56
|
%
|
9.8
|
63
|
%
|
||||||||||
|
Monsanto
|
1.1
|
7
|
%
|
-
|
-
|
|||||||||||
|
BMS
|
1.7
|
12
|
%
|
0.5
|
3
|
%
|
||||||||||
|
Other RNAi collaborators
|
0.5
|
3
|
%
|
0.1
|
1
|
%
|
||||||||||
|
Total collaborations and contracts
|
11.7
|
78
|
%
|
10.4
|
68
|
%
|
||||||||||
|
Monsanto licensing fees and milestone payments
|
2.7
|
19
|
%
|
-
|
-
|
|||||||||||
|
Alnylam milestone payments
|
0.2
|
1
|
%
|
5.0
|
32
|
%
|
||||||||||
|
Dicerna licensing fee
|
0.2
|
1
|
%
|
-
|
-
|
|||||||||||
|
Spectrum milestone and royalty payments
|
0.2
|
1
|
%
|
0.0
|
0
|
%
|
||||||||||
|
Total revenue
|
15.0
|
15.5
|
||||||||||||||
DoD revenue
On July 14, 2010, we signed a contract with the United States Government Department of Defense (“DoD”) to advance an RNAi therapeutic utilizing our LNP technology to treat Ebola virus infection (see Overview for further discussion). The initial phase of the contract was budgeted at $34.7 million. This stage one funding is for the development of TKM-Ebola, including, completion of preclinical development, filing an IND application with the FDA and completing a Phase I human safety clinical trial. The DoD has the option of extending the contract beyond the initial funding period to support the advancement of TKM-Ebola through to the completion of clinical development and FDA approval. Based on the contract’s budget, this would provide the Company with up to $140 million in funding for the entire program.
In November 2012, we submitted a modification request to the existing contract to the DoD in order to integrate recent advancements in LNP formulation and manufacturing technology in the TKM-Ebola development program. The modification was approved and increased the stage one targeted funding from $34.7 million to $41.7 million. In April 2014, we signed a contract modification with the DoD to increase the stage one targeted funding by a further $2.1 million to $43.8 million. The additional funding is to compensate us for unrecovered costs incurred related to the temporary stop-work period that occurred in 2012 and to provide additional overhead funding should it be required. In October 2014, the DoD exercised an option valued at $7.0 million, awarded to us to manufacture TKM-Ebola-Guinea targeting the Ebola-Guinea strain responsible for the current outbreak in West Africa.
52
Under the contract, we are being reimbursed for costs incurred, including an allocation of overheads, and we are being paid an incentive fee.
DoD revenues and related contract expenses were lower in 2014 as compared to 2013 as we are nearing the end of stage one of the contract so most activities for this stage have already been completed. The reduction in stage one revenue in 2014 was offset by the addition of the $7.0 million award for the manufacture of TKM-Ebola-Guinea towards the end of 2014.
Monsanto revenue
On January 13, 2014, we signed an Option Agreement and a Services Agreement (together, the “Agreements”) with Monsanto. Under the Agreements, Monsanto has an option to acquire a license to use our proprietary delivery technology and related intellectual property for use in agriculture. Over the option period, which is expected to be approximately four years, we will provide lipid formulations for Monsanto’s research and development activities, and Monsanto will make certain payments to us to maintain their option rights (see Overview for further discussion).
In January 2014, we received $14.5 million, of which $4.5 million relates to research services and $10.0 million for the use of our technology, In June and September 2014, we received payments of $1.5 million each, following the completion of specified program developments. We are recognizing this revenue on a straight-line basis over the option period. For the year-ended December 31, 2014, we have recorded an aggregate of $3.8 million in revenue for the use of our technology and for research activities.
Alnylam and Acuitas revenue
On November 12, 2012, we entered into a new licensing agreement with Alnylam that replaces all earlier licensing, cross-licensing, collaboration, and manufacturing agreements. We also entered into a separate cross license agreement with Acuitas, which includes milestones and royalty payments, and Acuitas has agreed not to compete in the RNAi field for five years.
In November 2013, Alnylam initiated a Phase III trial with ALN-TTR02, also known as patisiran, and an associated $5.0 million development milestone was paid to us in December 2013. In March 2014, we earned a $0.15 milestone payment from Acuitas following their receipt of a milestone from Alnylam with the initiation of the ALN-TTR02 Phase III trial.
On June 21, 2013, we transferred manufacturing process technology to Ascletis to enable them to produce ALN-VSP, a product candidate licensed to them by Alnylam. We believe that under our licensing agreement with Alnylam, the technology transfer to Ascletis triggers a $5.0 million milestone obligation from Alnylam to us. However, Alnylam has demanded a declaration that we have not yet met its milestone obligations. We dispute Alnylam’s position. To remedy this dispute, we have commenced arbitration proceedings with Alnylam, as provided for under the agreement. The hearing date for this arbitration is currently set for the second week in May, 2015. We have not recorded any revenue in respect of this milestone.
BMS revenue
In May 2010 we signed a formulation agreement with BMS under which BMS paid us $3.0 million to make a certain number of LNP formulations over the following four year period. Revenue recognized in 2012 and 2013 relate to LNP batches the company produced in proportion to the maximum LNP formulations that may be required under the contract. As at December 31, 2013, we intended to offer BMS an extension to the agreement’s end date from May 10, 2014 to December 31, 2014. Extending the agreement would have given BMS more time to order LNP batches. The offer of extension resulted in a cumulative revenue adjustment recorded for the year-ended December 31, 2013. In August 2014, we received notification from BMS that the extension would not occur. Revenue recognized for the year-ended December 31, 2014 relates to the batches shipped to BMS during the period and the release of any remaining deferred revenue balance now that the agreement has expired and no further obligation with either party.
Dicerna revenue
In November 2014, we signed a License Agreement and a Development and Supply Agreement with Dicerna for the use of our proprietary delivery technology and related technology intended to develop, manufacture, and commercialize products related to treatment of PH1. Revenue recognized for the year-ended December 31, 2014 relates to the earned portion of the upfront payment of $2.5 million for the use our of technology, which is being recognized over the period over which we provide services to Dicerna, estimated to complete in March 2017.
Spectrum revenue
In September 2013, Spectrum announced that they had shipped the first commercial orders of Marqibo. For the year-ended December 31, 2014, we earned royalties of $0.2 million on the sales of Marqibo, which uses a license to our technology.
53
Expenses
/ Expenses are summarized in the following table, in millions:
|
2014
|
% of Total
|
2013
|
% of Total
|
|||||||||||||
|
Research, development, collaborations and contracts
|
$
|
38.7
|
81
|
%
|
$
|
21.5
|
78
|
%
|
||||||||
|
General and administrative
|
8.7
|
17
|
%
|
5.5
|
20
|
%
|
||||||||||
|
Depreciation
|
0.5
|
1
|
%
|
0.6
|
2
|
%
|
||||||||||
|
Total operating expenses
|
$
|
47.9
|
$
|
27.6
|
||||||||||||
Research, development, collaborations and contracts
Research, development, collaborations and contracts expenses consist primarily of clinical and pre-clinical trial expenses, personnel expenses, consulting and third party expenses, consumables and materials, as well as a portion of stock-based compensation and general corporate costs.
In 2013, research and development costs were primarily related to our internal earlier-stage research programs, moving TKM-PLK1 into Phase I/II clinical trial, and new targets identification: TKKM-HBV and TKM-ALDH2. In 2014, our research and development costs increased as we incurred incremental costs related to the progress of moving additional products into the clinic: the initiation of Phase I /II clinical trials in patients with HCC resulting in the expansion in the number of clinical trials sites and patients accrual for TKM-PLK1, significant research and preclinical spending on TKM-HBV to file a CTA to move into the clinic, as well as an increase in manufacturing activities under the DoD contract in response to the current Ebola outbreak in West Africa. In addition, we incurred incremental research and development spending for new partner collaborations we entered into in 2014, as well as spending on new targets identification – see Overview for further details.
Compensation expenses increased in 2014 as compared to 2013. There was an increase in workforce of 38 employees in 2014 to support our expanded portfolio of product candidates. In addition, R&D stock-based compensation expense increased significantly due, in part, to the increase in our share price.
A significant portion of our research, development, collaborations and contracts expenses are not tracked by project as they benefit multiple projects or our technology platform and because our most-advanced programs are not yet in late-stage clinical development. However, our collaboration agreements contain cost-sharing arrangements pursuant to which certain costs incurred under the project are reimbursed. Costs reimbursed under collaborations typically include certain direct external costs and hourly or full-time equivalent labor rates for the actual time worked on the project. In addition, we have been reimbursed under government contracts for certain allowable costs including direct internal and external costs. As a result, although a significant portion of our research, development, collaborations and contracts expenses are not tracked on a project-by-project basis, we do, however, track direct external costs attributable to, and the actual time our employees worked on, our collaborations and government contracts.
General and administrative
General and administrative expenses increased in 2014 due largely to an increase in compensation expenses. Our employee base grew in support of our expanding pipeline and we had a significant increase in stock-based compensation expense due, in part, to the increase in our share price. We incurred incremental spending on legal fees and consultants related to new compliance requirements linked to the growth of the Company.
Other income (losses) /
Other income (losses) are summarized in the following table, in millions:
|
2014
|
2013
|
|||||||
|
Interest income
|
$
|
0.9
|
$
|
0.5
|
||||
|
Foreign exchange gains
|
4.1
|
1.1
|
||||||
|
Increase in fair value of warrant liability
|
(10.4
|
)
|
(3.5
|
)
|
||||
|
Acquisition costs
|
(0.5
|
)
|
-
|
|||||
|
Total other income (losses)
|
$
|
(5.9
|
)
|
$
|
(1.9
|
)
|
||
Increase in fair value of warrant liability
In conjunction with equity and debt financing transactions in 2011 and 2012, we issued warrants to purchase our common share. We are accounting for the warrants under the authoritative guidance on accounting for derivative financial instruments indexed to, and potentially settled in, a company’s own stock, on the understanding that in compliance with applicable securities laws, the registered warrants require the issuance of registered securities upon exercise and do not sufficiently preclude an implied right to net cash settlement. At each balance sheet date the warrants are revalued using the Black-Scholes model and the change in value is recorded in the consolidated statement of operations and comprehensive income (loss).
54
The aggregate increase in value of our common share purchase warrants outstanding at December 31, 2014 was $10.4 million as compared to an increase in the value of common share purchase warrants outstanding at the end of 2013 of $3.5 million. The increases are a result of increases in the Company’s share price from the previous reporting dates.
We expect to see future changes in the fair value of our warrant liability and these changes will largely depend on the change in the Company’s share price, and, to a lesser extent, any change in our assumed rate of share price volatility, our assumptions for the expected lives of the warrants and warrant exercises.
Year ended December 31, 2013 compared to the year ended December 31, 2012
For the fiscal year ended December 31, 2013, our net loss was $14.1 million ($0.92 basic and diluted loss per common share) as compared to net income of $29.6 million ($2.16 basic income per common share, $2.07 diluted income per common share) for 2012.
Revenue
/ Revenue is summarized in the following table, in millions:
|
2013
|
% of Total
|
2012
|
% of Total
|
|||||||||||||
|
Collaborations and contracts
|
||||||||||||||||
|
DoD
|
$
|
9.8
|
63
|
%
|
$
|
11.5
|
82
|
%
|
||||||||
|
BMS
|
0.5
|
3
|
%
|
0.4
|
3
|
%
|
||||||||||
|
Other RNAi collaborators
|
0.1
|
1
|
%
|
0.1
|
1
|
%
|
||||||||||
|
Total collaborations and contracts
|
10.4
|
68
|
%
|
12.1
|
86
|
%
|
||||||||||
|
Alnylam milestone payments
|
5.0
|
32
|
%
|
1.0
|
7
|
%
|
||||||||||
|
Spectrum milestone and royalty payments
|
0.0
|
0
|
%
|
1.0
|
7
|
%
|
||||||||||
|
Total revenue
|
$
|
15.5
|
$
|
14.1
|
||||||||||||
DoD revenue
On July 14, 2010, we signed a contract with the DoD to advance an RNAi therapeutic utilizing our LNP technology to treat Ebola virus infection (see Overview for further discussion). Under the contract, we are being reimbursed for costs incurred, including an allocation of overheads, and we are being paid an incentive fee.
On August 6, 2012, we announced that we had received a temporary stop-work order from the DoD in respect of our TKM-Ebola contract. On October 2, 2012, we announced that the stop-work order had been lifted and we resumed work.
In November 2012, we submitted a modification request to the existing contract to the DoD in order to integrate recent advancements in LNP formulation and manufacturing technology in the TKM-Ebola development program. The modification was approved and increased the stage one targeted funding from $34.7 million to $41.7 million.
Alnylam revenue
In June 2012 we earned a $1.0 million milestone from Alnylam following their initiation of a Phase II human clinical trial for their product candidate ALN-TTR02. ALN-TTR02 utilizes our LNP technology.
In November 2013, Alnylam initiated a Phase III trial with ALN-TTR02, also known as patisiran, and an associated $5.0 million development milestone was paid to us in December 2013.
On June 21, 2013, we transferred manufacturing process technology to Ascletis to enable them to produce ALN-VSP, a product candidate licensed to them by Alnylam. We believe that under our licensing agreement with Alnylam, the technology transfer to Ascletis triggers a $5.0 million milestone obligation from Alnylam to us. However, Alnylam has demanded a declaration that we have not yet met its milestone obligations. We dispute Alnylam’s position. To remedy this dispute, we have commenced arbitration proceedings with Alnylam, as provided for under the agreement. In addition to seeking payment of the milestone, we have filed a claim against Alnylam for breach of contract, breach of the implied covenant of good faith and fair dealing, and fraud. The hearing date for this arbitration is currently set for the second week in May, 2015. We have not recorded any revenue in respect of this milestone.
BMS revenue
See discussion in “BMS revenue” section above.
55
Spectrum revenue
In August 2012, we earned a $1.0 million milestone payment from Talon based on the FDA approval of Marqibo. Talon was acquired by Spectrum in July 2013. The acquisition does not affect the terms of our license with Talon. In September 2013, Spectrum announced that they had shipped the first commercial orders of Marqibo.
Expenses /
Expenses are summarized in the following table, in millions:
|
2013
|
% of Total
|
2012
|
% of Total
|
|||||||||||||
|
Research, development, collaborations and contracts
|
$
|
21.5
|
78
|
%
|
$
|
18.0
|
67
|
%
|
||||||||
|
General and administrative
|
5.5
|
20
|
%
|
8.1
|
30
|
%
|
||||||||||
|
Depreciation
|
0.6
|
2
|
%
|
0.9
|
3
|
%
|
||||||||||
|
Total operating expenses
|
27.6
|
27.0
|
||||||||||||||
Research, development, collaborations and contracts
Research, development, collaborations and contracts expenses consist primarily of clinical and pre-clinical trial expenses, personnel expenses, consulting and third party expenses, consumables and materials, as well as a portion of stock-based compensation and general corporate costs.
In 2012, spending on our internal earlier-stage research programs was reduced as we focused on TKM-Ebola, TKM-PLK1 and the litigation against Alnylam and Acuitas. In 2013, we resumed research activities and spending on earlier-stage research programs and new target identification, including new 2013 programs TKM-HBV and TKM-ALDH2 – see Overview. In 2013, there was additional spending on the TKM-PLK1 program as we moved into Phase I/II and opened up more clinical trial sites. Compensation expenses are at a similar level in 2013 as compared to 2012. There was an increase in workforce of 19 employees in 2013, but there was a higher bonus payout in 2012 following settlement with Alnylam and Acuitas.
General and administrative
General and administrative expenses were higher in 2012 due to legal fees incurred in respect of our lawsuit with Alnylam and Acuitas.
Other income (losses) /
Other income (losses) are summarized in the following table, in millions:
|
2013
|
2012
|
|||||||
|
Interest income
|
$
|
0.5
|
$
|
0.1
|
||||
|
Licensing settlement payment
|
-
|
65.0
|
||||||
|
Licensing settlement legal fees
|
-
|
(18.7
|
)
|
|||||
|
Foreign exchange gains
|
1.1
|
-
|
||||||
|
Increase in fair value of warrant liability
|
(3.5
|
)
|
(3.8
|
)
|
||||
|
Total other income (losses)
|
$
|
(1.9
|
)
|
$
|
42.6
|
|||
Licensing settlement payment and legal fees
In November 2012 we received $65.0 million in cash from Alnylam as a result of signing a new license agreement. In connection with the licensing settlement payment of $65.0 million, in December 2012, we paid our lead legal counsel $18.7 million in contingent legal fees.
No payments were made or received in 2013 related to the Alnylam settlement as the litigation was settled in 2012.
Increase in fair value of warrant liability
In conjunction with equity and debt financing transactions in 2011 and an equity private placement that closed on February 29, 2012, we have issued warrants to purchase our common share. We are accounting for the warrants under the authoritative guidance on accounting for derivative financial instruments indexed to, and potentially settled in, a company’s own stock, on the understanding that in compliance with applicable securities laws, the registered warrants require the issuance of registered securities upon exercise and do not sufficiently preclude an implied right to net cash settlement. At each balance sheet date the warrants are revalued using the Black-Scholes model and the change in value is recorded in the consolidated statement of operations and comprehensive income (loss).
56
The aggregate increase in value of our common share purchase warrants outstanding at December 31, 2013 was $3.5 million as compared to an increase at the end of 2012 of $3.8 million. The increases are a result of increases in the Company’s share price from the previous reporting dates.
We expect to see future changes in the fair value of our warrant liability and these changes will largely depend on the change in the Company’s share price and, to a lesser extent, any change in our assumed rate of share price volatility, our assumptions for the expected lives of the warrants and warrant issuances or exercises.
LIQUIDITY AND CAPITAL RESOURCES
The following table summarizes our cash flow activities for the periods indicated, in millions:
|
Year ended December 31
|
||||||||||||
|
2014
|
2013
|
2012
|
||||||||||
|
Net (loss) income for the year
|
(38.8
|
)
|
(14.1
|
)
|
29.6
|
|||||||
|
Adjustments to reconcile net (loss) income to net cash (used in) provided by operating activities
|
9.9
|
5.0
|
5.7
|
|||||||||
|
Changes in operating assets and liabilities
|
16.6
|
2.3
|
(2.4
|
)
|
||||||||
|
Net cash (used in) provided by operating activities
|
(12.3
|
)
|
(6.7
|
)
|
32.9
|
|||||||
|
Net cash used in investing activities
|
(43.0
|
)
|
(0.7
|
)
|
(0.0
|
)
|
||||||
|
Net cash provided by financing activities
|
60.7
|
32.7
|
4.5
|
|||||||||
|
Effect of foreign exchange rate changes on cash & cash equivalents
|
(1.8
|
)
|
(3.6
|
)
|
0.5
|
|||||||
|
Net increase in cash and cash equivalents
|
3.5
|
21.7
|
38.0
|
|||||||||
|
Cash and cash equivalents, beginning of year
|
68.7
|
47.0
|
9.0
|
|||||||||
|
Cash and cash equivalents, end of year
|
72.2
|
68.7
|
47.0
|
|||||||||
Since our incorporation, we have financed our operations through the sales of shares, units, debt, revenues from research and development collaborations and licenses with corporate partners, interest income on funds available for investment, and government contracts, grants and tax credits.
At December 31, 2014, we had cash and cash equivalents of $72.2 million and short-term investments of $40.0 million, totalling $112.2 million as compared to cash and cash equivalents of $68.7 million at December 31, 2013.
Operating activities used $12.3 million in cash in 2014 as compared to $6.7 million used in 2013 and $32.9 million of cash provided in 2012. The positive operating cash flow in 2012 was largely the result of the $65.0 million settlement reached with Alnylam which was recorded as “other income”. Non-cash items to reconcile net loss used or provided by operating activities primarily consist of changes in fair value of warrant liability.
Investing activities used $43.0 million in 2014 as compared to $0.7 million in 2013 and $0.01 million in 2012. The increase in cash used in 2014 was primarily due to guaranteed investment certificates acquired in the year.
On February 29, 2012, we completed a private placement of 1,848,601 units for gross proceeds of $4.1 million. Each unit, priced at C$2.20, consists of one common share and one half of one common share purchase warrant. Each whole warrant entitles the holder to acquire one common share at a price of C$2.60 for a period of five years from closing.
On October 22, 2013, we completed an underwritten public offering of 3,750,000 common shares, at a price of $8.00 per share, representing gross proceeds of $30.0 million. On November 1, 2013, the offering’s underwriter completed the exercise of its over-allotment option to purchase a further 562,500 shares at $8.00 bringing the aggregate financing gross proceeds to $34.5 million. The cost of the financing, including commissions and professional fees, was $2.5 million, resulting in net proceeds of $32.0 million.
On March 18, 2014, we completed an underwritten public offering of 2,125,000 common shares, at a price of $28.50 per share, representing gross proceeds of $60.5 million. We are using these proceeds to develop and advance product candidates through clinical trials, as well as for working capital and general corporate purposes.
Cash requirements /
At December 31, 2014 we held $72.2 million in cash and cash equivalents and $40.0 million in short-term investments. On March 18, 2014, we raised gross proceeds of $60.5 million from a public offering. We believe we have sufficient cash resources for at least the next 12 months. In the future, substantial additional funds will be required to continue with the active development of our pipeline products and technologies. In particular, our funding needs may vary depending on a number of factors including:
|
|
·
|
the need for additional capital to fund future business development programs, including the merger with OnCore;
|
|
|
·
|
revenues earned form our current collaborative partnership and licensing agreements with Monsanto and Dicerna;
|
|
|
·
|
revenues earned from our DoD contract to develop TKM-Ebola and TKM-Ebola-Guinea;
|
57
|
|
·
|
revenues earned from our legacy collaborative partnerships and licensing agreements, including milestone payments from Alnylam and royalties from sales of Marqibo from Spectrum;
|
|
|
·
|
the extent to which we continue the development of our product candidates, add new product candidates to our pipeline, or form collaborative relationships to advance our products;
|
|
|
·
|
our decisions to in-license or acquire additional products or technology for development, in particular for our RNAi therapeutics programs;
|
|
|
·
|
our ability to attract and retain corporate partners, and their effectiveness in carrying out the development and ultimate commercialization of our product candidates;
|
|
|
·
|
whether batches of drugs that we manufacture fail to meet specifications resulting in delays and investigational and remanufacturing costs;
|
|
|
·
|
the decisions, and the timing of decisions, made by health regulatory agencies regarding our technology and products;
|
|
|
·
|
competing technological and market developments; and
|
|
|
·
|
costs associated with prosecuting and enforcing our patent claims and other intellectual property rights, including litigation and arbitration arising in the course of our business activities.
|
We will seek to obtain funding to maintain and advance our business from a variety of sources including public or private equity or debt financing, collaborative arrangements with pharmaceutical companies and government grants and contracts. There can be no assurance that funding will be available at all or on acceptable terms to permit further development of our products especially in light of the current difficult climate for investment in early stage biotechnology companies.
If adequate funding is not available, we may be required to delay, reduce or eliminate one or more of our research or development programs or reduce expenses associated with non-core activities. We may need to obtain funds through arrangements with collaborators or others that may require us to relinquish most or all of our rights to product candidates at an earlier stage of development or on less favorable terms than we would otherwise seek if we were better funded. Insufficient financing may also mean failing to prosecute our patents or relinquishing rights to some of our technologies that we would otherwise develop or commercialize.
Material commitments for capital expenditures
/ As at the date of this discussion we do not have any material commitments for capital expenditure.
OFF-BALANCE SHEET ARRANGEMENTS
We do not have any off-balance sheet arrangements that have or are reasonably likely to have a current or future effect on our financial condition, changes in financial condition, revenues or expenses, results of operations, liquidity, capital expenditures or capital resources that is material to investors.
CONTRACTUAL OBLIGATIONS
Facility lease
/ On June 23, 2014, we signed an agreement to renew the lease for our Burnaby office and lab facility. The lease term is for five years, commencing August 1, 2014 with three additional renewal terms of five years each.
Product development partnership with the Canadian Government /
We entered into a Technology Partnerships Canada ("TPC") agreement with the Canadian Federal Government on November 12, 1999. Under this agreement, TPC agreed to fund 27% of our costs incurred prior to March 31, 2004, in the development of certain oligonucleotide product candidates up to a maximum contribution from TPC of $7.2 million (C$9.3 million). As at December 31, 2014, a cumulative contribution of $3.5 million (C$3.7 million) had been received and we do not expect any further funding under this agreement. In return for the funding provided by TPC, we agreed to pay royalties on the share of future licensing and product revenue, if any that is received by us on certain non-siRNA oligonucleotide product candidates covered by the funding under the agreement. These royalties are payable until a certain cumulative payment amount is achieved or until a pre-specified date. In addition, until a cumulative amount equal to the funding actually received under the agreement has been paid to TPC, we agreed to pay a 2.5% royalty on any royalties we receive for Marqibo.
In September 2013, we began to earn royalties on Marqibo and have accrued $0.01 million in royalties payable to TPC as at December 31, 2014. The remaining contingently payable balance with TPC as of December 31, 2014 was $3.2 million (C$3.7 million).
License agreement with Marina Biotech, Inc. (“Marina”) /
On November 29, 2012, we announced a worldwide, non-exclusive license to a novel RNAi payload technology called Unlocked Nucleobase Analog (“UNA”) from Marina for the development of RNAi therapeutics.
UNA technology can be used in the development of RNAi therapeutics, which treat disease by silencing specific disease causing genes. UNAs can be incorporated into RNAi drugs and have the potential to improve them by increasing their stability and reducing off-target effects.
Under the license agreement we paid Marina an upfront fee of $0.3 million in 2012. A further license payment of $0.2 million was paid in 2013 and we will make milestone payments of up to $3.3 million, plus royalties, on each product that we develop that uses Marina’s UNA technology. The upfront fee and license payment were expensed to research, development, collaborations and contracts expense.
Effective August 9, 2013, Marina’s UNA technology was acquired by Arcturus Therapeutics, Inc. (“Arcturus”) and the UNA license agreement between us and Marina was assigned to Arcturus. The terms of the license are otherwise unchanged.
58
In December 2014, we received clearance from Health Canada to conduct a Phase I Clinical Study with TKM-HBV, which utilizes Arcturus’ UNA technology. This triggered the accrual of a $0.3 million payment to Arcturus as at December 31, 2014.
The following table summarizes our contractual obligations as at December 31, 2014, which does not include commitments acquired from OnCore in January 2015:
|
(in millions $)
|
Payments Due by Period
|
|||||||||||||||||||
|
Total
|
Less
than 1 year
|
1 – 3
years
|
3 – 5
years
|
More than
5 years
|
||||||||||||||||
|
Contractual Obligations
|
||||||||||||||||||||
|
Facility lease
|
5.1
|
1.1
|
2.2
|
1.8
|
—
|
|||||||||||||||
|
Technology license obligations
(1)
|
0.3
|
0.3
|
—
|
—
|
—
|
|||||||||||||||
|
Total contractual obligations
|
5.4
|
1.4
|
2.2
|
1.8
|
—
|
|||||||||||||||
1
Relates to our expected fixed payment obligations under in-license agreements.
We in-license technology from a number of sources. Pursuant to these in-license agreements, we will be required to make additional payments if and when we achieve specified development, regulatory, financial and commercialization milestones. To the extent we are unable to reasonably predict the likelihood, timing or amount of such payments; we have excluded them from the table above. Our technology in-licenses are further described in the Overview section of this discussion.
We also have contracts and collaborative arrangements that require us to undertake certain research and development work as further explained elsewhere in this discussion. It is not practicable to estimate the amount of these obligations.
IMPACT OF INFLATION
Inflation has not had a material impact on our operations.
RELATED PARTY TRANSACTIONS
We have not entered into any related party transactions in the periods covered by this discussion.
OUTSTANDING SHARE DATA
At March 9, 2015, we had 46,567,496 common shares issued and outstanding, outstanding options to purchase an additional 1,862,816 common shares and outstanding warrants to purchase an additional 386,750 common shares.
RECENT ACCOUNTING PRONOUNCEMENTS
From time to time, new accounting pronouncements are issued by the Financial Accounting Standards Board (FASB) or other standard setting bodies that we adopt as of the specified effective date. Unless otherwise discussed, we believe that the impact of recently issued standards that are not yet effective will not have a material impact on our financial position or results of operations upon adoption.
In May 2014, the FASB issued ASU 2014-09, Revenue from Contracts with Customers (ASC 606). The standard is intended to clarify the principles for recognizing revenue and to develop a common revenue standard for U.S. GAAP and IFRS by creating a new Topic 606, Revenue from Contracts with Customers. This guidance supersedes the revenue recognition requirements in ASC 605, Revenue Recognition, and supersedes some cost guidance included in Subtopic 605-35, Revenue Recognition – Construction-Type and Production-Type Contracts. The core principle of the accounting standard is that an entity recognizes revenue to depict the transfer of promised goods or services to customers in an amount that reflects the consideration to which the entity expects to be entitled in exchange for those good or services. The amendments should be applied by either (1) retrospectively to each prior reporting period presented; or (2) retrospectively with the cumulative effect of initially applying this Update recognized at the date of initial application. The update is effective for annual periods and interim periods within those annual periods, beginning after December 15, 2016, which, for us, means January 1, 2017. Early application is not permitted. The extent of the impact of adoption has not yet been determined.
In August 2014, the FASB issued ASU 2014-15, Presentation of Financial Statements – Going Concern (Subtopic 205-40): Disclosure of Uncertainties about an Entity’s Ability to Continue as a Going Concern. The update is intended to provide guidance in GAAP about management’s responsibility to evaluate whether there is substantial doubt about an entity’s ability to continue as a going concern and to provide related footnote disclosures. Under amendments to GAAP, the assessment period is within one year after the date that the financial statements are issued (or available to be issued). The amendments are effective for the annual period ending after December 15, 2016, which, for us, means January 1, 2017, and for annual periods and interim periods thereafter. Early application is permitted. We do not plan to early adopt this update. The extent of the impact of this adoption has not yet been determined.
59
|
Item 7A.
|
Quantitative and Qualitative Disclosures about Market Risk
|
We
are exposed to market risk related to changes in interest rates, which could adversely affect the value of our interest rate sensitive assets and liabilities. We do not hold any instruments for trading purposes and investment decisions are governed by a Board approved Investment Policy. As at December 31, 2014, we had cash and cash equivalents of $72.2 million and short-term investments of $40.0 million, as compared to $68.7 million cash and cash equivalents as at December 31, 2013. We invest our cash reserves in high interest saving accounts and guaranteed investment certificates with varying terms to maturity (not exceeding two years) issued by major Canadian banks, selected with regard to the expected timing of expenditures for continuing operations and prevailing interest rates. The fair value of our cash investments as at December 31, 2014 is at least equal to the face value of those investments and the value reported in our balance sheet. Due to the relatively short-term nature of the investments that we hold, we do not believe that the results of operations or cash flows would be affected to any significant degree by a sudden change in market interest rates relative to our investment portfolio. Our debt instrument sensitive to changes in interest rate is our warrant liability with its fair value determined using the Black-Scholes model, which uses interest rate as an input. We have estimated the effects on our warrant liability based on a one percentage point hypothetical adverse change in interest rates as of December 31, 2014 and 2013. We determined the hypothetical fair value using the same Black-Scholes model, and determined that an increase in the interest rates of one percentage point would have had an adverse change to our warrant liability of $0.01 million and $0.04 million as of December 31, 2014 and 2013, respectively.
In addition, we are exposed to market risk related to changes in foreign currency exchange rates. We have not entered into any agreements or purchased any instruments to hedge possible currency risks at this time. We manage our US dollar exchange rate risk by, whenever possible, using cash received from US dollar revenues and financing to pay US dollar expenses. Prior to our financing in October 2013, which was denominated in US dollars, our policy was to convert all but a working capital level of US dollars into Canadian dollars. Given our increasing level of US dollar expenses, our policy is now to maintain US and Canadian dollar cash and investment balances based on long term forecasts of currency needs thereby creating a natural currency hedge. As of December 31, 2014 and 2013, an adverse change of one percentage point in the foreign currency exchange rates of Canadian to US dollars would have resulted in an incremental loss of $0.7 million and $0.4 million, respectively. We recorded foreign exchange gains of $4.1 million and $1.1 million for the fiscal years ended December 31, 2014 and 2013, respectively.
|
Item 8.
|
Financial Statements and Supplementary Data
|
INDEX
TO CONSOLIDATED FINANCIAL STATEMENTS
|
Page
|
||
60
REPORT OF INDEPENDENT REGISTERED PUBLIC ACCOUNTING FIRM
To the Shareholders and Board of Directors of Tekmira Pharmaceuticals Corporation
We have audited the accompanying consolidated balance sheets of Tekmira Pharmaceuticals Corporation as of December 31, 2014 and December 31, 2013 and the related consolidated statements of operations and comprehensive income (loss), stockholders’ equity and cash flows each of the years in the three-year period ended December 31,
2014. These consolidated financial statements are the responsibility of Tekmira Pharmaceuticals Corporation’s management
. Our responsibility is to express an opinion on these consolidated financial statements based on our audits.
We conducted our audits in accordance with Canadian generally accepted auditing standards and the standards of the Public Company Accounting Oversight Board (United States). Those standards require that we plan and perform the audit to obtain reasonable assurance about whether the financial statements are free of material misstatement. An audit includes examining, on a test basis, evidence supporting the amounts and disclosures in the financial statements. An audit also includes assessing the accounting principles used and significant estimates made by management, as well as evaluating the overall financial statement presentation. We believe that our audits provide a reasonable basis for our opinion.
In our opinion, the consolidated financial statements referred to above present fairly, in all material respects, the consolidated financial position of Tekmira Pharmaceuticals Corporation as of December 31, 2014 and December 31, 2013, and its consolidated results of operations and its consolidated cash flows each of the years in the three-year period ended December 31, 2014 in conformity with US generally accepted accounting principles.
We also have audited, in accordance with the standards of the Public Company Accounting Oversight Board (United States), Tekmira Pharmaceuticals Corporation’s internal control over financial reporting as of December 31, 2014, based on the criteria established in Internal Control – Integrated Framework (2013) issued by the Committee of Sponsoring Organizations of the Treadway Commission (COSO), and our report dated March 12, 2015 expressed an unqualified opinion on the effectiveness of Tekmira Pharmaceuticals Corporation’s internal control over financial reporting.
/s/ KPMG LLP
Chartered Accountants
March 12, 2015
Vancouver, Canada
REPORT OF INDEPENDENT REGISTERED PUBLIC ACCOUNTING FIRM
To the Shareholders and Board of Directors of Tekmira Pharmaceuticals Corporation
We have audited Tekmira Pharmaceuticals Corporation’s internal control over financial reporting as of December 31, 2014, based on criteria established in
Internal Control – Integrated Framework (2013)
issued by the Committee of Sponsoring Organizations of the Treadway Commission (COSO). Tekmira Pharmaceuticals Corporation’s management is responsible for maintaining effective internal control over financial reporting and for its assessment of the effectiveness of internal control over financial reporting, included in the accompanying
Management’s Annual Report on Internal Control over Financial Reporting
. Our responsibility is to express an opinion on the Company’s internal control over financial reporting based on our audit.
We conducted our audit in accordance with the standards of the Public Company Accounting Oversight Board (United States). Those standards require that we plan and perform the audit to obtain reasonable assurance about whether effective internal control over financial reporting was maintained in all material respects. Our audit included obtaining an understanding of internal control over financial reporting, assessing the risk that a material weakness exists, and testing and evaluating the design and operating effectiveness of internal control based on the assessed risk. Our audit also included performing such other procedures as we considered necessary in the circumstances. We believe that our audit provides a reasonable basis for our opinion.
A company’s internal control over financial reporting is a process designed to provide reasonable assurance regarding the reliability of financial reporting and the preparation of financial statements for external purposes in accordance with generally accepted accounting principles. A company’s internal control over financial reporting includes those policies and procedures that (1) pertain to the maintenance of records that, in reasonable detail, accurately and fairly reflect the transactions and dispositions of the assets of the company; (2) provide reasonable assurance that transactions are recorded as necessary to permit preparation of financial statements in accordance with generally accepted accounting principles, and that receipts and expenditures of the company are being made only in accordance with authorizations of management and directors of the company; and (3) provide reasonable assurance regarding prevention or timely detection of unauthorized acquisition, use, or disposition of the company’s assets that could have a material effect on the financial statements.
Because of its inherent limitations, internal control over financial reporting may not prevent or detect misstatements. Also, projections of any evaluation of effectiveness to future periods are subject to the risk that controls may become inadequate because of changes in conditions, or that the degree of compliance with the policies or procedures may deteriorate.
In our opinion, Tekmira Pharmaceuticals Corporation maintained, in all material respects, effective internal control over financial reporting as of December 31, 2014, based on criteria established in
Internal Control – Integrated Framework (2013)
issued by the Committee of Sponsoring Organizations of the Treadway Commission (COSO)
.
We also have audited, in accordance with Canadian generally accepted auditing standards and the standards of the Public Company Accounting Oversight Board (United States), the consolidated balance sheets of Tekmira Pharmaceuticals Corporation as of December 31, 2014 and 2013, and the related consolidated statements of operations and comprehensive income (loss), stockholders’ equity and cash flows for each of the years in the three-year period ended December 31, 2014, and our report dated March 12, 2015 expressed an unqualified opinion on those consolidated financial statements.
/s/ KPMG LLP
Chartered Accountants
March 12, 2015
Vancouver, Canada
61
TEKMIRA PHARMACEUTICALS CORPORATION
(Expressed in thousands of US Dollars, except share and per share amounts)
(Prepared in accordance with US GAAP)
|
December 31
2014
|
December 31
2013
|
|||||||
|
Assets
|
||||||||
|
Current assets:
|
||||||||
|
Cash and cash equivalents
|
$ | 72,187 | $ | 68,717 | ||||
|
Short-term investments (note 2)
|
39,974 | - | ||||||
|
Accounts receivable
|
1,903 | 117 | ||||||
|
Accrued revenue
|
538 | 212 | ||||||
|
Deferred expenses
|
- | 173 | ||||||
|
Investment tax credits receivable
|
86 | 40 | ||||||
|
Prepaid expenses and other assets (note 6(a))
|
1,730 | 1,084 | ||||||
|
Total current assets
|
116,418 | 70,343 | ||||||
|
Property and equipment (note 4)
|
12,959 | 13,039 | ||||||
|
Less accumulated depreciation (note 4)
|
(11,199 | ) | (11,666 | ) | ||||
|
Property and equipment, net of accumulated
depreciation (note 4)
|
1,760 | 1,373 | ||||||
|
Total assets
|
$ | 118,178 | $ | 71,716 | ||||
|
Liabilities and stockholders' equity
|
||||||||
|
Current liabilities:
|
||||||||
|
Accounts payable and accrued liabilities (note 10)
|
$ | 9,328 | $ | 3,680 | ||||
|
Deferred revenue (note 3)
|
5,779 | 3,463 | ||||||
|
Warrants (note 2 and 5)
|
5,099 | 5,379 | ||||||
|
Total current liabilities
|
20,206 | 12,522 | ||||||
|
Deferred revenue, net of current portion (note 3)
|
9,937 | - | ||||||
|
Total liabilities
|
30,143 | 12,522 | ||||||
|
Stockholders’ equity:
|
||||||||
|
Common shares (note 5)
|
||||||||
|
Authorized - unlimited number with no par value
|
||||||||
|
Issued and outstanding:
22,438,169 (December 31, 2013 - 19,048,900)
|
290,004 | 216,702 | ||||||
|
Additional paid-in capital
|
26,208 | 25,343 | ||||||
|
Deficit
|
(205,864 | ) | (167,027 | ) | ||||
|
Accumulated other comprehensive loss
|
(22,313 | ) | (15,824 | ) | ||||
|
Total stockholders' equity
|
88,035 | 59,194 | ||||||
|
Total liabilities and stockholders' equity
|
$ | 118,178 | $ | 71,716 | ||||
Nature of business and future operations (note 1)
Contingencies and commitments (note 7)
Subsequent event (note 8)
See accompanying notes to the consolidated financial statements.
62
TEKMIRA PHARMACEUTICALS CORPORATION
(Expressed in thousands of US Dollars, except share and per share amounts)
(Prepared in accordance with US GAAP)
|
Year ended
December 31
|
||||||||||||
|
2014
|
2013
|
2012
|
||||||||||
|
Revenue (note 3)
|
||||||||||||
|
Collaborations and contracts
|
$ | 11,738 | $ | 10,425 | $ | 12,105 | ||||||
|
Licensing fees, milestone and
royalty payments
|
3,215 | 5,040 | 2,000 | |||||||||
|
Total revenue
|
14,953 | 15,465 | 14,105 | |||||||||
|
Expenses
|
||||||||||||
|
Research, development, collaborations
and contracts
|
38,713 | 21,458 | 18,043 | |||||||||
|
General and administrative
|
8,683 | 5,546 | 8,141 | |||||||||
|
Depreciation of property and equipment
|
529 | 613 | 866 | |||||||||
|
Total expenses
|
47,925 | 27,617 | 27,050 | |||||||||
|
Loss from operations
|
(32,972 | ) | (12,152 | ) | (12,945 | ) | ||||||
|
Other income (losses)
|
||||||||||||
|
Interest income
|
853 | 540 | 138 | |||||||||
|
Licensing settlement payment (note 3(c))
|
- | - | 65,000 | |||||||||
|
Licensing settlement legal fees (note 3(c))
|
- | - | (18,738 | ) | ||||||||
|
Foreign exchange gains
|
4,127 | 1,079 | 25 | |||||||||
|
Warrant issuance costs (note 5)
|
- | - | (47 | ) | ||||||||
|
Increase in fair value of warrant liability (note 2)
|
(10,383 | ) | (3,530 | ) | (3,822 | ) | ||||||
|
Acquisition costs
|
(462 | ) | - | - | ||||||||
|
Net income (loss)
|
$ | (38,837 | ) | $ | (14,063 | ) | $ | 29,611 | ||||
|
Income (loss) per common share
|
||||||||||||
|
Basic
|
$ | (1.80 | ) | $ | (0.92 | ) | $ | 2.16 | ||||
|
Diluted
|
$ | (1.80 | ) | $ | (0.92 | ) | $ | 2.07 | ||||
|
Weighted average number of common shares
|
||||||||||||
|
Basic
|
21,603,136 | 15,302,680 | 13,727,925 | |||||||||
|
Diluted
|
21,603,136 | 15,302,680 | 14,320,814 | |||||||||
|
Comprehensive income (loss)
|
||||||||||||
|
Cumulative translation adjustment
|
(6,489 | ) | (3,135 | ) | 474 | |||||||
|
Comprehensive loss
|
$ | (45,326 | ) | $ | (17,198 | ) | $ | 30,085 | ||||
See accompanying notes to the consolidated financial statements.
63
TEKMIRA PHARMACEUTICALS CORPORATION
Consolidated Statement of Stockholders’
Equity
(Expressed in thousands of US Dollars, except share and per share amounts)
(Prepared in accordance with US GAAP)
|
Number
of shares
|
Share
capital
|
Additional paid-in
capital
|
Deficit
|
Accumulated
other comprehensive
|
Total
stockholders'
|
|||||||||||||||||||
|
Balance, December 31, 2011
|
12,148,635 | $ | 177,039 | $ | 23,927 | $ | (182,575 | ) | $ | (13,163 | ) | $ | 5,228 | |||||||||||
|
Stock-based compensation
|
- | - | 982 | - | - | 982 | ||||||||||||||||||
|
Issuance of common shares
pursuant to exercise of options
|
38,635 | 194 | (123 | ) | - | - | 71 | |||||||||||||||||
|
Issuance of common shares
pursuant to exercise of warrants
|
269,485 | 1,513 | - | - | - | 1,513 | ||||||||||||||||||
|
Issuance of common shares in conjunction with the private offering, net of issuance costs of $179,000 and net of initial fair value of warrants of $851,000
|
1,848,601 | 3,040 | - | - | - | 3,040 | ||||||||||||||||||
|
Currency translation adjustment
|
- | - | - | - | 474 | 474 | ||||||||||||||||||
|
Net income
|
- | - | - | 29,611 | - | 29,611 | ||||||||||||||||||
|
Balance, December 31, 2012
|
14,305,356 | $ | 181,786 | $ | 24,786 | $ | (152,964 | ) | $ | (12,689 | ) | $ | 40,919 | |||||||||||
|
Stock-based compensation
|
- | - | 903 | - | - | 903 | ||||||||||||||||||
|
Issuance of common shares
pursuant to exercise of options
|
125,596 | 735 | (346 | ) | - | - | 389 | |||||||||||||||||
|
|
||||||||||||||||||||||||
|
Issuance of common shares
pursuant to exercise of warrants
|
305,448 | 2,143 | - | - | - | 2,143 | ||||||||||||||||||
|
Issuance of common shares in conjunction with the
private offering, net of issuance costs of $
2,462,000
|
4,312,500 | 32,038 | - | - | - | 32,038 | ||||||||||||||||||
|
Currency translation adjustment
|
- | - | - | - | (3,135 | ) | (3,135 | ) | ||||||||||||||||
|
Net loss
|
- | - | - | (14,063 | ) | - | (14,063 | ) | ||||||||||||||||
|
Balance, December 31, 2013
|
19,048,900 | $ | 216,702 | $ | 25,343 | $ | (167,027 | ) | $ | (15,824 | ) | $ | 59,194 | |||||||||||
|
Stock-based compensation
|
- | - | 3,283 | - | - | 3,283 | ||||||||||||||||||
|
Issuance of common shares
pursuant to exercise of options
|
648,506 | 5,034 | (2,418 | ) | - | - | 2,616 | |||||||||||||||||
|
|
||||||||||||||||||||||||
|
Issuance of common shares
pursuant to exercise of warrants
|
615,763 | 11,791 | - | - | - | 11,791 | ||||||||||||||||||
|
Issuance of common shares in conjunction with the
private offering, net of issuance costs of $4,085,000
|
2,125,000 | 56,477 | - | - | - | 56,477 | ||||||||||||||||||
|
Currency translation adjustment
|
- | - | - | - | (6,489 | ) | (6,489 | ) | ||||||||||||||||
|
Net loss
|
- | - | - | (38,837 | ) | - | (38,837 | ) | ||||||||||||||||
|
Balance, December 31, 2014
|
22,438,169 | $ | 290,004 | $ | 26,208 | $ | (205,864 | ) | $ | (22,313 | ) | $ | 88,035 | |||||||||||
See accompanying notes to the consolidated financial statements.
64
TEKMIRA PHARMACEUTICALS CORPORATION
(Expressed in thousands of US Dollars, except share and per share amounts)
(Prepared in accordance with US GAAP)
|
Year ended
December 31
|
||||||||||||
|
2014
|
2013
|
2012
|
||||||||||
|
OPERATING ACTIVITIES
|
||||||||||||
|
Net income (loss) for the period
|
$ | (38,837 | ) | $ | (14,063 | ) | $ | 29,611 | ||||
|
Items not involving cash:
|
||||||||||||
|
Depreciation of property and equipment
|
529 | 613 | 866 | |||||||||
|
Gain on sale of property and equipment
|
(80 | ) | - | - | ||||||||
|
Stock-based compensation - research, development, collaborations
and contract expenses
|
2,343 | 622 | 772 | |||||||||
|
Stock-based compensation - general and administrative expenses
|
940 | 281 | 210 | |||||||||
|
Unrealized foreign exchange (gains) losses
|
(4,218 | ) | (18 | ) | 29 | |||||||
|
Warrant issuance costs
|
- | 47 | ||||||||||
|
Change in fair value of warrant liability
|
10,383 | 3,530 | 3,822 | |||||||||
|
Net change in non-cash operating items:
|
||||||||||||
|
Accounts receivable
|
(1,887 | ) | 889 | (190 | ) | |||||||
|
Accrued revenue
|
(360 | ) | 2,008 | (2,188 | ) | |||||||
|
Deferred expenses
|
167 | 231 | 361 | |||||||||
|
Investment tax credits receivable
|
(52 | ) | (31 | ) | 323 | |||||||
|
Prepaid expenses and other assets
|
(773 | ) | (776 | ) | 97 | |||||||
|
Accounts payable and accrued liabilities
|
6,253 | 130 | (197 | ) | ||||||||
|
Deferred revenue
|
13,171 | (153 | ) | (655 | ) | |||||||
|
Net cash provided by (used in) operating activities
|
(12,421 | ) | (6,737 | ) | 32,908 | |||||||
|
INVESTING ACTIVITIES
|
||||||||||||
|
Acquisition of investments
|
(41,982 | ) | - | - | ||||||||
|
Proceeds from sale of property and equipment
|
80 | - | 3 | |||||||||
|
Acquisition of property and equipment
|
(1,056 | ) | (725 | ) | (15 | ) | ||||||
|
Net cash used in investing activities
|
(42,958 | ) | (725 | ) | (12 | ) | ||||||
|
FINANCING ACTIVITIES
|
||||||||||||
|
Proceeds from issuance of common shares, net of issuance costs
|
56,477 | 32,038 | 3,844 | |||||||||
|
Issuance of common shares pursuant to exercise of options
|
2,616 | 389 | 71 | |||||||||
|
Issuance of common shares pursuant to exercise of warrants
|
1,583 | 289 | 632 | |||||||||
|
Net cash provided by financing activities
|
60,676 | 32,716 | 4,547 | |||||||||
|
Effect of foreign exchange rate changes on cash and cash equivalents
|
(1,827 | ) | (3,561 | ) | 550 | |||||||
|
Increase (decrease) in cash and cash equivalents
|
3,470 | 21,693 | 37,993 | |||||||||
|
Cash and cash equivalents, beginning of period
|
68,717 | 47,024 | 9,031 | |||||||||
|
Cash and cash equivalents, end of period
|
$ | 72,187 | $ | 68,717 | $ | 47,024 | ||||||
|
Supplemental cash flow information
|
||||||||||||
|
Fair value of warrants exercised on a cashless basis
|
$ | 116 | $ | 1,404 | $ | 211 | ||||||
|
Investment tax credits received
|
$ | - | $ | 10 | $ | 323 | ||||||
|
Fair value of warrants issued in conjunction with public offering
|
$ | - | $ | - | $ | 851 | ||||||
See accompanying notes to the consolidated financial statements.
65
TEKMIRA PHARMACEUTICALS CORPORATION
Notes to Consolidated Financial Statements
(Tabular amounts in thousands of US Dollars, except share and per share amounts)
|
1.
|
Nature
of business and future operations
|
Tekmira Pharmaceuticals Corporation (the “Company”) is a Canadian biopharmaceutical business focused on advancing novel RNA interference therapeutics and discovering, developing and commercializing a cure for patients suffering from chronic hepatitis B infection, a disease of the liver caused by hepatitis B virus (“HBV”).
The success of the Company is dependent on obtaining the necessary regulatory approvals to bring its products to market and achieve profitable operations. The continuation of the research and development activities and the commercialization of its products are dependent on the Company’s ability to successfully complete these activities and to obtain adequate financing through a combination of financing activities and operations. It is not possible to predict either the outcome of future research and development programs or the Company’s ability to fund these programs in the future.
|
2.
|
Significant accounting policies
|
Basis of presentation
Tekmira Pharmaceuticals Corporation was incorporated on October 6, 2005 as an inactive wholly owned subsidiary of Inex Pharmaceuticals Corporation (“Inex”). Pursuant to a “Plan of Arrangement” effective April 30, 2007 the business and substantially all of the assets and liabilities of Inex were transferred to the Company. The consolidated financial statements for all periods presented herein include the consolidated operations of Inex until April 30, 2007 and the operations of the Company thereafter.
The Company has three wholly-owned subsidiaries: Protiva Biotherapeutics Inc. (“Protiva”), Protiva Biotherapeutics (USA) Inc. (“Protiva USA”), and Protiva Agricultural Development Company Inc. (“PADCo”). Protiva and Protiva USA were acquired on May 30, 2008. PADCo was incorporated on January 9, 2014.
These consolidated financial statements include the accounts of the Company and two of its wholly-owned subsidiaries, Protiva and Protiva USA. All intercompany transactions and balances have been eliminated on consolidation.
The Company records its investment in PADCo using the equity method. The Company has determined that PADCo is a variable interest entity (“VIE”) of which it is not the primary beneficiary. The Company is not the primary beneficiary as it does not have the power to make decisions that most significantly affect the economic performance of the VIE nor does the Company have the right to receive benefits or the obligation to absorb losses that in either case could potentially be significant to the VIE. PADCo is described further in note 3.
Comparative Information
Certain information has been reclassified to conform with the financial statement presentation adopted for the current year.
Use of estimates
The preparation of the consolidated financial statements in conformity with generally accepted accounting principles requires management to make estimates and assumptions about future events that affect the reported amounts of assets, liabilities, revenue, expenses, contingent assets and contingent liabilities as at the end or during the reporting period. Actual results could significantly differ from those estimates. Significant areas requiring the use of management estimates relate to recognition of revenue, stock-based compensation, valuation of warrant liability and financial instruments, and the amounts recorded as accrued liabilities.
Cash and cash equivalents
Cash and cash equivalents are all highly liquid instruments with an original maturity of three months or less when purchased. Cash equivalents are recorded at cost plus accrued interest. The carrying value of these cash equivalents approximates their fair value.
Short-term investments
The Company acquired guaranteed investment certificates during the year, which are classified as short-term investments on the balance sheet. Short-term investments have original maturities exceeding three months, and have remaining maturities within twelve months. Short-term investments accrue interest daily based on a fixed interest rate for the term. The carrying value of these cash equivalents are recorded at cost plus accrued interest, which approximates their fair value.
Fair value of financial instruments
We measure certain financial instruments and other items at fair value.
To determine the fair value, we use the fair value hierarchy for inputs used in measuring fair value that maximizes the use of observable inputs and minimizes the use of unobservable inputs by requiring that the most observable inputs be used when available. Observable inputs are inputs market participants would use to value an asset or liability and are developed based on market data obtained from independent sources. Unobservable inputs are inputs based on assumptions about the factors market participants would use to value an asset or liability. The three levels of inputs that may be used to measure fair value are as follows:
|
•
|
Level 1 inputs are quoted market prices for identical instruments available in active markets.
|
|
•
|
Level 2 inputs are inputs other than quoted prices included within Level 1 that are observable for the asset or liability either directly or indirectly. If the asset or liability has a contractual term, the input must be observable for substantially the full term. An example includes quoted market prices for similar assets or liabilities in active markets.
|
66
|
•
|
Level 3 inputs are unobservable inputs for the asset or liability and will reflect management’s assumptions about market assumptions that would be used to price the asset or liability.
|
Assets and liabilities are classified based on the lowest level of input that is significant to the fair value measurements. Changes in the observability of valuation inputs may result in a reclassification of levels for certain securities within the fair value hierarchy.
The Company’s financial instruments consist of cash and cash equivalents, short-term investments, accounts receivable, accounts payable and accrued liabilities, warrants and financial instruments
.
The carrying values of cash and cash equivalents, short-term investments, accounts receivable and accounts payable and accrued liabilities approximate their fair values due to the immediate or short-term maturity of these financial instruments.
As quoted prices for the warrants are not readily available, the Company has used a Black-Scholes pricing model, as described in note 5, to estimate fair value. These are level 3 inputs as defined above.
The Company used a discounted cash flow model to determine the fair value of the financial instrument related to Monsanto’s call option to acquire the equity or all of the assets of PADCo, as described in note 3. The fair value was determined at the date of recognition, and at each reporting date. The initial fair value of the financial instrument was nil, and there has been no change to its fair value as at December 31, 2014. These are level 3 inputs as defined above.
The following tables present information about the Company’s assets and liabilities that are measured at fair value on a recurring basis, and indicates the fair value hierarchy of the valuation techniques used to determine such fair value:
|
Level 1
|
Level 2
|
Level 3
|
December 31, 2014
|
|||||||||||||
|
Assets
|
||||||||||||||||
|
Cash and cash equivalents
|
$ | 72,187 | - | - | $ | 72,187 | ||||||||||
|
Guaranteed investment certificates
|
39,974 | - | - | 39,974 | ||||||||||||
|
Total
|
$ | 112,161 | - | - | $ | 112,161 | ||||||||||
|
Liabilities
|
||||||||||||||||
|
Warrants
|
- | - | $ | 5,099 | $ | 5,099 | ||||||||||
|
Financial instrument
|
- | - | - | - | ||||||||||||
|
Total
|
- | - | $ | 5,099 | $ | 5,099 | ||||||||||
|
Level 1
|
Level 2
|
Level 3
|
December 31, 2013
|
|||||||||||||
|
Assets
|
||||||||||||||||
|
Cash and cash equivalents
|
$ | 68,717 | - | - | $ | 68,717 | ||||||||||
|
Liabilities
|
||||||||||||||||
|
Warrants
|
- | - | $ | 5,379 | $ | 5,379 | ||||||||||
The following table presents the changes in fair value of the Company’s warrants:
|
Liability at beginning
of the period
|
Opening liability of
warrants issued in
the period
|
Fair value of
warrants exercised
in the period
|
Increase in fair
value of warrants
|
Foreign exchange
(gain) loss
|
Liability at end
of the period
|
|||||||||||||||||||
|
Year ended December 31, 2012
|
$ | 202 | $ | 851 | $ | (881 | ) | $ | 3,822 | $ | 21 | $ | 4,015 | |||||||||||
|
Year ended December 31, 2013
|
$ | 4,015 | - | $ | (1,854 | ) | $ | 3,530 | $ | (312 | ) | $ | 5,379 | |||||||||||
|
Year ended December 31, 2014
|
$ | 5,379 | - | $ | (10,208 | ) | $ | 10,383 | $ | (455 | ) | $ | 5,099 | |||||||||||
Inventory
Inventory includes materials assigned for the manufacture of products for collaborative partners and manufacturing costs for products awaiting acceptance by collaborative partners. Inventory is carried at the lower of cost and net realizable value and measured using first-in-first-out method. The cost of inventories includes all costs of purchase, costs of manufacturing and other costs incurred in bringing the inventories to their present location and condition.
67
Materials purchased for the Company’s own research and development products are not recorded as inventory but are expensed as incurred.
Property and equipment
Property and equipment is recorded at cost less impairment losses, accumulated depreciation, related government grants and investment tax credits. The Company records depreciation using the straight-line method over the estimated useful lives of the capital assets as follows:
|
Rate
|
|||
|
Laboratory equipment (years)
|
5
|
||
|
Computer and office equipment (years)
|
2
|
-
|
5
|
|
Furniture and fixtures (years)
|
5
|
||
Leasehold improvements are depreciated over their estimated useful lives but in no case longer than the lease term, except where lease renewal is reasonably assured. Assets held under capital leases that do not allow for ownership to pass to the Company are depreciated using the straight-line method over their useful life, not exceeding the lease term. Assets under construction are not depreciated until usage has begun.
Intangible assets
The costs incurred in establishing and maintaining patents for intellectual property developed internally are expensed in the period incurred.
Impairment of long-lived assets
If there is a major event indicating that the carrying value of property and equipment may be impaired then management will perform an impairment test and if the recoverable value, based on undiscounted future cash flows, exceeds carrying value then such assets are written down to their fair values.
Revenue recognition
The Company earns revenue from research and development collaboration and contract services, licensing fees, milestone and royalty payments. Revenues associated with multiple element arrangements are attributed to the various elements based on their relative fair values or are recognized as a single unit of accounting when relative fair values are not determinable. Non-refundable payments received under collaborative research and development agreements are recorded as revenue as services are performed and related expenditures are incurred. Non-refundable upfront license fees from collaborative licensing and development arrangements are recognized as the Company fulfills its obligations related to the various elements within the agreements, in accordance with the contractual arrangements with third parties and the term over which the underlying benefit is being conferred. The Company evaluates new arrangements for any substantive milestones by considering: whether substantive uncertainty exists upon execution of the arrangement; if the event can only be achieved based in whole or in part on the Company’s performance, or occurrence of a specific outcome resulting from the Company’s performance; any future performance required, and payment is reasonable relative to all deliverables; and, the payment terms in the arrangement. Payments received upon the achievement of substantive milestones are recognized as revenue in their entirety. Payments received upon the occurrence of milestones that are non-substantive are deferred and recognized as revenue over the estimated period of performance applicable to the associated collaborative agreement.
Revenue earned under research and development manufacturing collaborations where the Company bears some or all of the risk of a product manufacturing failure is recognized when the purchaser accepts the product and there are no remaining rights of return.
Revenue earned under research and development collaborations where the Company does not bear any risk of product manufacturing failure is recognized in the period the work is performed. For contracts where the manufacturing amount is specified, revenue is recognized as product is manufactured in proportion to the total amount specified under the contract.
Revenue and expenses under the contract with the United States Government Department of Defense (“DoD”) are being recorded using the percentage-of-completion method. Contract progress is based on costs incurred to date. Expenses under the contract are recorded in the Company’s consolidated statement of operations and comprehensive income (loss) as they are incurred. Government contract revenues related to expenses incurred under the contract are recorded in the same period as those expenses. Expenses accrued under the contract but not yet invoiced are recorded in the Company’s balance sheet as accrued liabilities and accrued revenues. Equipment purchased under the contract is recorded on the Company’s balance sheet as deferred expense and deferred revenue and amortized, on a straight-line basis, over the life of the contract.
Cash or other compensation received in advance of meeting the revenue recognition criteria is recorded on the balance sheet as deferred revenue. Revenue meeting recognition criteria but not yet received or receivable is recorded on the balance sheet as accrued revenue.
Leases and lease inducements
Leases entered into are classified as either capital or operating leases. Leases which substantially transfer all benefits and risks of ownership of property to the Company are accounted for as capital leases. At the time a capital lease is entered into, an asset is recorded together with its related long-term obligation to reflect the purchase and financing.
68
All other leases are accounted for as operating leases wherein rental payments are expensed as incurred.
Lease inducements represent leasehold improvement allowances and reduced or free rent periods and are amortized on a straight-line basis over the term of the lease and are recorded as a reduction of rent expense.
Research and development costs
Research and development costs, including acquired in-process research and development expenses for which there is no alternative future use, are charged as an expense in the period in which they are incurred.
Income or loss per share
Income or loss per share is calculated based on the weighted average number of common shares outstanding. Diluted loss per share does not differ from basic loss per share for the years ended December 31, 2014 and 2013, since the effect of the Company’s stock options and warrants is anti-dilutive. Diluted income per share is calculated using the treasury stock method which uses the weighted average number of common shares outstanding during the period and also includes the dilutive effect of potentially issuable common shares from outstanding, in-the-money stock options and warrants.
The following table sets out the computation of basic and diluted net income (loss) per common share:
|
For the year ended December 31
|
||||||||||||
|
2014
|
2013
|
2012
|
||||||||||
|
Numerator:
|
||||||||||||
|
Net income (loss)
|
$ | (38,837 | ) | $ | (14,063 | ) | $ | 29,611 | ||||
|
Denominator:
|
||||||||||||
|
Weighted average number of common shares
|
21,603,136 | 15,302,680 | 13,727,925 | |||||||||
|
Effect of dilutive securities:
|
||||||||||||
|
Warrants
|
- | - | 177,374 | |||||||||
|
Options
|
- | - | 415,515 | |||||||||
|
Diluted weighted average number of common shares
|
21,603,136 | 15,302,680 | 14,320,814 | |||||||||
|
Basic income (loss) per common share
|
$ | (1.80 | ) | $ | (0.92 | ) | $ | 2.16 | ||||
|
Diluted income (loss) per common share
|
$ | (1.80 | ) | $ | (0.92 | ) | $ | 2.07 | ||||
For the year ended December 31, 2014, potential common shares of 2,221,233 were excluded from the calculation of income per common share because their inclusion would be anti-dilutive (December 31, 2013 – 3,064,767; December 31, 2012 – 1,085,503).
Government grants and refundable investment tax credits
Government grants and tax credits provided for current expenses is included in the determination of income or loss for the year, as a reduction of the expenses to which it relates. Government grants and tax credits towards the acquisition of property and equipment is deducted from the cost of the related property and equipment.
Foreign currency translation and change in reporting currency
The functional currency of the Company is the Canadian dollar. For the Company and its integrated subsidiaries (Protiva and Protiva USA), foreign currency monetary assets and liabilities are translated into Canadian dollars at the rate of exchange prevailing at the balance sheet date. Non-monetary assets and liabilities are translated at historical exchange rates. The previous month’s closing rate of exchange is used to translate revenue and expense transactions. Exchange gains and losses are included in income or loss for the period.
The Company is using United States dollars as its reporting currency. All assets and liabilities are translated using the exchange rate at the balance sheet date. Revenues, expenses and other income (losses) are translated using the average rate for the period, except for large transactions, for which the exchange rate on the date of the transaction is used. Equity accounts are translated using the historical rate. As the translation differences from the Company’s functional currency of Canadian dollars to the Company’s reporting currency of US dollars are unrealized gains and losses, the differences are recorded in other comprehensive income (loss), and do not impact the calculation of Loss/Earnings per Share.
69
Deferred income taxes
Income taxes are accounted for using the asset and liability method of accounting. Deferred income taxes are recognized for the future income tax consequences attributable to differences between the carrying values of assets and liabilities and their respective income tax bases and for loss carry-forwards. Deferred income tax assets and liabilities are measured using enacted income tax rates expected to apply to taxable income in the periods in which temporary differences are expected to be recovered or settled. The effect on deferred income tax assets and liabilities of a change in tax laws or rates is included in earnings in the period that includes the enactment date. When realization of deferred income tax assets does not meet the more-likely-than-not criterion for recognition, a valuation allowance is provided.
Stock-based compensation
The Company grants stock options to employees and directors pursuant to a share incentive plan described in note 5. Compensation expense is recorded for issued stock options using the fair value method with a corresponding increase in additional paid-in capital. Any consideration received on the exercise of stock options is credited to share capital.
The fair value of stock options is measured at the grant date and amortized on a straight-line basis over the vesting period.
Warrants
The Company accounts for the warrants under the authoritative guidance on accounting for derivative financial instruments indexed to, and potentially settled in, a company’s own stock, on the understanding that in compliance with applicable securities laws, the registered warrants require the issuance of registered securities upon exercise and do not sufficiently preclude an implied right to net cash settlement. The Company classifies warrants in its consolidated balance sheet as a liability which is revalued at each balance sheet date subsequent to the initial issuance. The Company uses the Black-Scholes pricing model to value the warrants. Determining the appropriate fair-value model and calculating the fair value of registered warrants requires considerable judgment. A small change in the estimates used may cause a relatively large change in the estimated valuation. The estimated volatility of the Company’s common stock at the date of issuance, and at each subsequent reporting period, is based on historic fluctuations in the Company’s stock price. The risk-free interest rate is based on the Government of Canada rate for bonds with a maturity similar to the expected remaining life of the warrants at the valuation date. The expected life of the warrants is based on the historical pattern of exercises of warrants.
Segment information
The Company operates in a single reporting segment. Substantially all of the Company’s revenues to date were earned from customers or collaborators based in the United States. Substantially all of the Company’s premises, property and equipment are located in Canada.
Recent accounting pronouncements
From time to time, new accounting pronouncements are issued by the Financial Accounting Standards Board (FASB) or other standard setting bodies that are adopted by the Company as of the specified effective date. Unless otherwise discussed, we believe that the impact of recently issued standards that are not yet effective will not have a material impact on our financial position or results of operations upon adoption.
In May 2014, the FASB issued ASU 2014-09, Revenue from Contracts with Customers (ASC 606). The standard is intended to clarify the principles for recognizing revenue and to develop a common revenue standard for U.S. GAAP and IFRS by creating a new Topic 606, Revenue from Contracts with Customers. This guidance supersedes the revenue recognition requirements in ASC 605, Revenue Recognition, and supersedes some cost guidance included in Subtopic 605-35, Revenue Recognition – Construction-Type and Production-Type Contracts. The core principle of the accounting standard is that an entity recognizes revenue to depict the transfer of promised goods or services to customers in an amount that reflects the consideration to which the entity expects to be entitled in exchange for those good or services. The amendments should be applied by either (1) retrospectively to each prior reporting period presented; or (2) retrospectively with the cumulative effect of initially applying this ASU recognized at the date of initial application. The update is effective for annual periods and interim periods within those annual periods, beginning after December 15, 2016, which for the Company means January 1, 2017. Early application is not permitted. The extent of the impact of adoption has not yet been determined.
70
In August 2014, the FASB issued ASU 2014-15, Presentation of Financial Statements – Going Concern (Subtopic 205-40): Disclosure of Uncertainties about an Entity’s Ability to Continue as a Going Concern. The update is intended to provide guidance in GAAP about management’s responsibility to evaluate whether there is substantial doubt about an entity’s ability to continue as a going concern and to provide related footnote disclosures. Under amendments to GAAP, the assessment period is within one year after the date that the financial statements are issued (or available to be issued). The amendments are effective for the annual period ending after December 15, 2016, which for the Company means January 1, 2017, and for annual periods and interim periods thereafter. Early application is permitted. The Company does not plan to early adopt this update. The extent on the impact of this adoption has not yet been determined.
|
3.
|
Collaborations, contracts and licensing agreements
|
The following tables set forth revenue recognized under collaborations, contracts and licensing agreements:
|
Year ended December 31
|
||||||||||||
|
2014
|
2013
|
2012
|
||||||||||
|
Collaborations and contracts
|
||||||||||||
|
DoD (a)
|
$ | 8,407 | $ | 9,806 | $ | 11,536 | ||||||
|
Monsanto (b)
|
1,080 | - | - | |||||||||
|
Alnylam (c)
|
- | - | 10 | |||||||||
|
BMS (d)
|
1,741 | 526 | 440 | |||||||||
|
Dicerna (e)
|
510 | - | - | |||||||||
|
Other RNAi collaborators (g)
|
- | 93 | 119 | |||||||||
|
Total research and development collaborations and contracts
|
11,738 | 10,425 | 12,105 | |||||||||
|
Licensing fees, milestone and royalty payments
|
||||||||||||
|
Monsanto licensing fees and milestone payments (b)
|
2,744 | - | - | |||||||||
|
Alnylam milestone payments (c)
|
150 | 5,000 | 1,000 | |||||||||
|
Dicerna licensing fee (e )
|
131 | - | - | |||||||||
|
Spectrum royalty payments (f)
|
190 | 40 | 1,000 | |||||||||
|
Total licensing fees, milestone and royalty payments
|
3,215 | 5,040 | 2,000 | |||||||||
|
Total revenue
|
$ | 14,953 | $ | 15,465 | $ | 14,105 | ||||||
71
The following table sets forth deferred collaborations and contracts revenue:
|
December 31, 2014
|
December 31, 2013
|
|||||||
|
DoD (a)
|
$ | 313 | $ | 1,655 | ||||
|
Monsanto current portion (b)
|
4,245 | - | ||||||
|
BMS current portion (d)
|
- | 1,808 | ||||||
|
Dicerna current portion (e)
|
1,221 | |||||||
|
Deferred revenue, current portion
|
5,779 | 3,463 | ||||||
|
Monsanto long-term portion (b)
|
8,666 | - | ||||||
|
Dicerna long-term portion (e)
|
1,271 | - | ||||||
|
Total deferred revenue
|
$ | 15,716 | $ | 3,463 | ||||
(a) Contract with United States Government’s Department of Defense (“DoD”) to develop TKM-Ebola
On July 14, 2010, the Company signed a contract with the DoD to advance TKM-Ebola, an RNAi therapeutic utilizing the Company’s lipid nanoparticle technology to treat Ebola virus infection.
In the initial phase of the contract, funded as part of the Transformational Medical Technologies program, the Company was eligible to receive up to $34,700,000. This initial funding is for the development of TKM-Ebola including completion of preclinical development, filing an Investigational New Drug application with the United States Food and Drug Administration (“FDA”) and completing a Phase 1 human safety clinical trial. On May 8, 2013, the Company announced that the contract had been modified to support development plans that integrate recent advancements in lipid nanoparticle (“LNP”) formulation and manufacturing technologies. The contract modification increased the stage one targeted funding by an additional $6,970,000. On April 22, 2014, the Company and the DoD signed a contract modification to further increase the stage one targeted funding by $2,100,000 to $43,819,000. The additional funding is to compensate the Company for unrecovered overheads related to the temporary stop-work period that occurred in 2012 and to provide additional overhead funding should it be required.
The DoD has the option of extending the contract beyond the initial funding period to support the advancement of TKM-Ebola through to the completion of clinical development and FDA approval. Based on the contract’s budget this would provide the Company with up to $140,000,000 in funding for the entire program. In December 2014, the DoD exercised an option valued at $7,000,000 to manufacture TKM-Ebola-Guinea, developed by the Company targeting the Ebola-Guinea strain responsible for the current outbreak in West Africa.
Under the contract, the Company is reimbursed for costs incurred, including an allocation of overhead costs, and is paid an incentive fee. At the beginning of the fiscal year the Company estimates its labour and overhead rates for the year ahead. At the end of the year the actual labour and overhead rates are calculated and revenue is adjusted accordingly. The Company’s actual labour and overhead rates will differ from its estimated rates based on actual costs incurred and the proportion of the Company’s efforts on contracts and internal products versus indirect activities. Within minimum and maximum collars, the amount of incentive fee the Company can earn under the contract varies based on costs incurred versus budgeted costs. During the contractual period, incentive fee revenue and total costs are impacted by management’s estimate and judgments which are continuously reviewed and adjusted as necessary using the cumulative catch-up method. At December 31, 2012, the Company was not able to make a reliable estimate of the final contract costs, and only the minimum incentive fee achievable and earned was recognized. In August 2014, Public Works and Government Services Canada, on behalf of the DoD, completed the audit of the Company’s labour and overhead rates for 2011 and 2012, and no significant differences were adjusted from management’s estimate of the rates
. For the years ended December 31, 2013 and 2014, the Company believes it can reliably estimate the final contract costs so has recognized the portion of expected incentive fee which has been earned to date.
(b)
Option and Services Agreements with Monsanto Company (“Monsanto”)
On January 13, 2014, the Company and Monsanto signed an Option Agreement and a Services Agreement (together, the “Agreements”). Under the Agreements, Monsanto has an option to obtain a license to use the Company’s proprietary delivery technology and related intellectual property for use in agriculture. Over the option period, which is expected to be approximately four years, the Company will provide lipid formulations for Monsanto’s research and development activities, and Monsanto will make certain payments to the Company to maintain its option rights. The maximum potential value of the transaction is $86,200,000 following the successful completion of milestones. As at December 31, 2014, the Company had received $17,500,000 in near term payments as outlined in the terms of the Agreements. The amounts received relate to research services and use of the Company’s technology over the option period, and are recognized as revenue on a straight-line basis over the option period.
72
Under the Agreements, the Company has established a wholly-owned subsidiary, PADCo. The Company has determined that PADCo is a variable interest entity (“VIE”); however, Monsanto is the primary beneficiary of the arrangement. PADCo was established to perform research and development activities, which have been funded by Monsanto in return for a call option to acquire the equity or all of the assets of PADCo. At any time during the option period, Monsanto may choose to exercise its option, in which case Monsanto would pay the Company an option exercise fee and would receive a worldwide, exclusive right to use the Company’s proprietary delivery technology in the field of agriculture. Monsanto may elect to terminate this option at their discretion. The Company retains all rights to therapeutics uses of all current intellectual property and intellectual property developed under the Agreements. The Company’s initial investment is not significant, and the Company has no implied or unfunded commitments and the maximum exposure to loss is limited to the amount of investment in the entity. The Company has included its investment in PADCo in other assets. There were no significant assets or liabilities for PADCo as at December 31, 2014. There was no equity income or loss with respect to PADCo recorded for the period ended December 31, 2014.
(c)
License and collaboration with Alnylam Pharmaceuticals, Inc. (“Alnylam”)
License and Collaboration Agreement with Alnylam through Tekmira
On January 8, 2007, the Company entered into a licensing and collaboration agreement with Alnylam (“Alnylam License and Collaboration”), which was amended and restated in May 2008, giving them an exclusive license to certain of the Company’s historical lipid nanoparticle intellectual property for the discovery, development, and commercialization of ribonucleic acid interference (“RNAi”) therapeutics.
The Alnylam License and Collaboration was replaced by a new license agreement as part of the settlement, which is discussed below.
Cross-License with Alnylam acquired through Protiva
As a result of the acquisition of Protiva on May 30, 2008, the Company acquired a Cross-License Agreement between Protiva and Alnylam (the “Alnylam Cross-License”). Alnylam was granted a non-exclusive license to the Protiva intellectual property.
The Alnylam Cross-License was replaced by a new license agreement as part of the settlement, which is discussed below.
Manufacturing agreement with Alnylam
Under a manufacturing agreement with Alnylam (the “Alnylam Manufacturing Agreement”) effective January 1, 2009, the Company was the exclusive manufacturer of any products required by Alnylam through to the end of Phase 2 clinical trials that utilize the Company’s technology. Alnylam was paying the Company for the provision of staff and for external costs incurred. Time charged to Alnylam was at a fixed rate and under the Alnylam Manufacturing Agreement there was a contractual minimum for the provision of staff of $11,200,000 over the three year period ending December 31, 2011.
The Alnylam Manufacturing Agreement was terminated as part of the settlement which is discussed below.
Settlement of litigation with Alnylam and Acuitas Therapeutics Inc. (“Acuitas”, formerly AlCana Technologies Inc.)
On March 16, 2011 the Company filed a complaint against Alnylam. On November 12, 2012, the Company entered into an agreement to settle all litigation between the Company and Alnylam and Acuitas (the “Settlement”) and also entered into a new licensing agreement with Alnylam that replaces all earlier licensing, cross-licensing, collaboration, and manufacturing agreements. The Company entered into a separate cross license agreement with Acuitas which includes milestone and royalty payments and Acuitas has agreed not to compete in the RNAi field for five years. In conjunction with the Settlement, the Company paid Acuitas $300,000. The Company paid a further $1,500,000 upon the execution of the cross license agreement with Acuitas, in the year ended December 31, 2013.
As a result of the new Alnylam license agreement, on November 26, 2012, the Company received $65,000,000 in cash from Alnylam. This includes $30,000,000 associated with the termination of the manufacturing agreement and $35,000,000 associated with the termination of the previous license agreements, as well as a modification of the milestone and royalty schedules associated with Alnylam's ALN-VSP, ALN-PCS, and ALN-TTR programs. Under the settlement, Alnylam received license rights to the Company’s patents that were filed, or that claim priority to a patent that was filed, before April 15, 2010. Alnylam does not have rights to the Company’s patents filed after April 15, 2010 unless they claim priority to a patent filed before that date. In addition, Alnylam has transferred all agreed upon patents and patent applications related to lipid nanoparticle (“LNP”) technology for the systemic delivery of RNAi therapeutic products, including the MC3 lipid family, to the Company, who will own and control prosecution of this intellectual property portfolio. The Company is the only entity able to sublicense its LNP intellectual property in future platform-type relationships. Alnylam has a license to use the Company’s intellectual property to develop and commercialize products and may only grant access to the Company’s LNP technology to its partners if it is part of a product sublicense. Alnylam will pay the Company milestones and royalties as Alnylam’s LNP-enabled products are developed and commercialized.
The new licensing agreement with Alnylam also grants the Company intellectual property rights to develop its own proprietary RNAi therapeutics. Alnylam has granted the Company a worldwide license for the discovery, development and commercialization of RNAi products directed to thirteen gene targets – three exclusive and ten non-exclusive licenses – provided that they have not been committed by Alnylam to a third party or are not otherwise unavailable as a result of the exercise of a right of first refusal held by a third party or are part of an ongoing or planned development program of Alnylam. Licenses for five of the ten non-exclusive targets – ApoB, PLK1, Ebola, WEE1, and CSN5 – have already been granted, along with an additional license for ALDH2, which has been granted on an exclusive basis. In consideration for this license, the Company has agreed to pay single-digit royalties to Alnylam on product sales and have milestone obligations of up to $8,500,000 on the non-exclusive licenses (with the exception of TKM-Ebola, which has no milestone obligations). Alnylam no longer has “opt-in” rights to the Company’s lead oncology product, TKM-PLK1, so the Company now holds all development and commercialization rights related TKM-PLK1. The Company will have no milestone obligations on the three exclusive licenses. As a result of the settlement of the litigation between the Company and Alnylam, $18,737,966 in a contingent obligation payment to Orrick, Herrington and Sutcliffe LLP (“Orrick”), lead legal counsel for the lawsuit against Alnylam and Acuitas, was paid out on December 10, 2012.
73
Milestone receipts and payments
In June 2012 the Company earned a $1,000,000 milestone from Alnylam in respect of the initiation of Alnylam’s ALN-TTR02 Phase 2 human clinical trial.
In November 2013, Alnylam initiated a Phase III trial with ALN-TTR02, also known as patisiran, and the associated $5,000,000 development milestone was paid to the Company in December 2013.
In November 2013, the Company initiated Phase I/II clinical trial for TKM-PLK1, resulting in a milestone payment of $375,000 to Alnylam.
Arbitration with Alnylam and Ascletis Pharmaceuticals (Hangzhou) Co. Ltd. (“Ascletis”)
On June 21, 2013, the Company transferred manufacturing process technology to Ascletis to enable them to produce ALN-VSP, a product candidate licensed to them by Alnylam. The Company believes that under its licensing agreement with Alnylam, the technology transfer to Ascletis triggers a $5,000,000 milestone obligation from Alnylam to the Company. However, Alnylam has demanded a declaration that the Company has not yet met its milestone obligations. The Company disputes Alnylam’s position. To remedy this dispute, the Company and Alnylam have commenced arbitration proceedings as provided for under the agreement. The hearing date for this arbitration is currently set for the second week in May, 2015. The Company has not recorded any revenue in respect of this milestone.
(d) Bristol-Myers Squibb (“BMS”) collaboration
On May 10, 2010 the Company announced the expansion of its research collaboration with BMS. Under the new agreement, BMS uses small interfering RNA (“siRNA”) molecules formulated by the Company in LNP technology to silence target genes of interest. BMS is conducting the preclinical work to validate the function of certain genes and share the data with the Company. The Company can use the preclinical data to develop RNAi therapeutic drugs against the therapeutic targets of interest. The Company received $3,000,000 from BMS concurrent with the signing of the agreement and recorded the amount as deferred revenue. The Company is required to provide a pre-determined number of LNP batches over the four-year agreement. BMS has a first right to negotiate a licensing agreement on certain RNAi products developed by the Company that evolve from BMS validated gene targets.
Revenue from the May 10, 2010 agreement with BMS is being recognized as the Company produces the related LNP batches.
As at December 31, 2013, the Company and BMS intended to extend the agreement’s end date from May 10, 2014 to December 31, 2014. Extending the agreement would have given BMS more time to order LNP batches. The offer of an extension in December 2013 resulted in a cumulative revenue adjustment recorded for the year ended December 31, 2013. In August 2014, the Company received notification that the extension would not occur. As such, the agreement expired and both companies’ obligations under the agreement ended. Revenue earned for the year-ended December 31, 2014 relates to batches shipped to BMS during the period and the release of any remaining deferred revenue balance resulting from the expiration of the agreement.
(e) License and Development and Supply Agreement with Dicerna Pharmaceuticals, Inc. (“Dicerna”)
On November 16, 2014, the Company signed a License Agreement and a Development and Supply Agreement (together, the “Agreements”) with Dicerna to development, manufacture, and commercialization of products directed to treatment of Primary Hyperoxaluria 1 (“PH1”), In consideration for the rights granted under the Agreements, Dicerna paid the Company an upfront cash payment of $2,500,000. The Company is also entitled to receive payments from Dicerna on the manufacturing and services provided, as well as further payments with the achievement of development and regulatory milestones of $22,000,000 in aggregate, and potential commercial royalties. Further, under the Agreements, a joint development committee has been established to provide guidance and direction on the progression of the collaboration.
The Company determined the deliverables under the Agreements included the rights granted, participation in the joint development committee, materials manufactured and other services provided, as directed under the joint development committee. The Company has determined that manufacturing services and other services provided have standalone value, as a separate statement of work is executed and invoiced for each manufacturing or service work order. The relative fair values are determined as a batch price or fee is estimated upon the execution of each work order, with actual expenditures charged at comparable market rates with embedded margins on each work order. Manufacturing work orders are invoiced at the time of execution of the work order, at the initiation of manufacture, and at the release of materials. The Company has deferred the recognition of revenue on all cash payments received for manufacturing work orders. Revenue from service work orders is recognized as the services are performed. The license and participation in the joint development committee have been determined by the Company to not have standalone value due to the uniqueness of the subject matter under the Agreements. Therefore, these deliverables are treated as one unit of accounting and recognized as revenue over the performance period, which the Company has estimated to be approximately 28 months as at December 31, 2014.
74
The Company believes the development and regulatory milestones are substantive, due to the existence of substantive uncertainty upon the execution of the arrangement, and that the achievement of the development and regulatory events are based in part on the Company’s performance and the occurrence of a specific outcome resulting from performance. The Company has not received any milestone payments to date.
(f) Agreements with Spectrum Pharmaceuticals, Inc. (“Spectrum”)
On May 6, 2006, the Company signed a number of agreements with Talon Therapeutics, Inc. (“Talon”, formerly Hana Biosciences, Inc.) including the grant of worldwide licenses (the “Talon License Agreement”) for three of the Company’s chemotherapy products, Marqibo®, Alocrest
TM
(Optisomal Vinorelbine) and Brakiva
TM
(Optisomal Topotecan).
On August 9, 2012, the Company announced that Talon had received accelerated approval for Marqibo from the FDA for the treatment of adult patients with Philadelphia chromosome negative acute lymphoblastic leukemia in second or greater relapse or whose disease has progressed following two or more anti-leukemia therapies. Marqibo is a liposomal formulation of the chemotherapy drug vincristine. In the year ended December 31, 2012, the Company received a milestone of $1,000,000 based on the FDA’s approval of Marqibo and will receive royalty payments based on Marqibo’s commercial sales. There are no further milestones related to Marqibo but the Company is eligible to receive total milestone payments of up to $18,000,000 on Alocrest and Brakiva.
Talon was acquired by Spectrum in July 2013. The acquisition did not affect the terms of the license between Talon and the Company.
On September 3, 2013, Spectrum announced that they had shipped the first commercial orders of Marqibo. In the year ended December 31, 2014, the Company recorded $190,000 in Marqibo royalty revenue (2013 - $40,000, 2012 - $nil). In the year ended December 31, 2014, the Company accrued $5,000 in royalties due to TPC in respect of the Marqibo royalty earned by the Company (see note 8).
(g) Other RNAi collaborators
The Company had active research agreements with a number of other RNAi collaborators.
|
4.
|
Property and equipment
|
|
December 31, 2014
|
Cost
|
Accumulated
depreciation
|
Net
book value
|
|||||||||
|
Lab equipment
|
$ | 5,021 | (4,451 | ) | $ | 570 | ||||||
|
Leashold improvements
|
5,281 | (4,796 | ) | 485 | ||||||||
|
Computer hardware and software
|
2,293 | (1,588 | ) | 705 | ||||||||
|
Furniture and fixtures
|
364 | (364 | ) | - | ||||||||
| $ | 12,959 | (11,199 | ) | $ | 1,760 | |||||||
75
|
December 31, 2013
|
Cost
|
Accumulated
depreciation
|
Net
book value
|
|||||||||
|
Lab equipment
|
$ | 4,886 | (4,679 | ) | $ | 207 | ||||||
|
Leashold improvements
|
5,592 | (5,001 | ) | 591 | ||||||||
|
Computer hardware and software
|
1,992 | (1,590 | ) | 402 | ||||||||
|
Furniture and fixtures
|
396 | (396 | ) | - | ||||||||
|
Assets under construction
|
173 | - | 173 | |||||||||
| $ | 13,039 | (11,666 | ) | $ | 1,373 | |||||||
As at December 31, 2014, all of the Company’s property and equipment are currently in use and no impairment has been recorded.
|
5.
|
Share capital
|
(a) Financing
On February 29, 2012, the Company completed a private placement offering of 1,848,601 units at a price of $2.20 (C$2.20) each for total gross proceeds, before expenses, of $4,070,000. Each unit consists of one common share and one half of one common share purchase warrant. Each whole warrant entitles the holder to acquire one common share at a price of C$2.60. The warrants expire on February 28, 2017. After paying brokerage fees and other unit issue costs, the offering generated net cash of $3,844,000. The total unit issuance cost of $226,000 has been allocated, on a pro-rata basis, as $179,000 to the shares and $47,000 to the warrants and recorded, respectively, to share capital and warrant issuance costs in the consolidated statement of operations and comprehensive income (loss).
On the date of issuance, the Black-Scholes aggregate value of the 924,302 warrants was $851,000 based on an assumed risk-free interest rate of 1.44%, volatility of 40%, a zero dividend yield and an expected life of 5 years. The fair value of the warrants at issuance was initially recorded as a liability with the residual amount of proceeds from the private placement being allocated to share capital.
On October 22, 2013, the Company completed an underwritten public offering of 3,750,000 common shares, at a price of $8.00 per share, representing gross proceeds of $30,000,000. On November 1, 2013, the offering’s underwriter completed the exercise of its over-allotment option to purchase a further 562,500 shares at $8.00 bringing the aggregate financing gross proceeds to $34,500,000. The cost of the financing, including commissions and professional fees, was $2,462,000, resulting in net proceeds of $32,038,000.
On March 26, 2014, the Company completed an underwritten public offering of 2,125,000 common shares, at a price of $28.50 per share, representing gross proceeds of $60,562,000. The Company also granted the underwriters a 30-day option to purchase an additional 318,750 shares for an additional $9,084,000 to cover any over-allotments. The underwriters did not exercise the option. The cost of financing, including commissions and professional fees, was $4,085,000, resulting in net proceeds of $56,477,000.
(b) Authorized share capital
The Company’s authorized share capital consists of an unlimited number of common and preferred shares without par value.
(c) Warrants to purchase common shares
During the year ended December 31, 2014, there were 610,478 warrants exercised for $1,583,000 in cash (December 31, 2013 – 105,683 warrants for $289,000) and 6,000 warrants exercised using the cashless exercise provision in return for 5,285 common shares (December 31, 2013 – 468,000 warrants for 199,765 common shares).
76
The following table summarizes the Company’s warrant activity for the years ended December 31, 2014 and 2013:
|
Common shares
purchasable upon
exercise of
warrants
|
Weighted average
exercise price (C$)
|
Weighted
average exercise
price (US$)
|
Range of
exercise prices
(C$)
|
Range of
exercise prices
(US$)
|
Weighted average remaining contractual life (years)
|
Aggregate
intrinsic value
(C$)
|
Aggregate
intrinsic value
(US$)
|
|||||||||||||||||||||||||||
|
Balance, December 31, 2012
|
1,588,411 | $ | 3.00 | $ | 3.02 | $2.50 | - | $3.35 | $2.51 | - | $3.37 | 3.8 | $ | 3,141 | $ | 3,157 | ||||||||||||||||||
|
Exercised
|
(573,683 | ) | $ | 3.19 | $ | 3.00 | $2.60 | - | $3.35 | $2.44 | - | $3.15 | ||||||||||||||||||||||
|
Balance, December 31, 2013
|
1,014,728 | $ | 2.90 | $ | 2.72 | $2.60 | - | $3.35 | $2.44 | - | $3.15 | 2.7 | $ | 5,635 | $ | 5,298 | ||||||||||||||||||
|
Exercised
|
(616,478 | ) | $ | 3.09 | $ | 2.80 | $2.60 | - | $3.35 | $2.35 | - | $3.03 | ||||||||||||||||||||||
|
Balance, December 31, 2014
|
398,250 | $ | 2.95 | $ | 2.67 | $2.60 | - | $3.35 | $2.35 | - | $3.03 | 1.8 | $ | 5,902 | $ | 5,343 | ||||||||||||||||||
The aggregate intrinsic value in the table above is calculated based on the difference between the exercise price of the warrants and the quoted price of the Company’s common stock as of the reporting date.
All of the Company’s warrants were exercisable as of December 31, 2014.
The weighted average Black-Scholes option-pricing assumptions and the resultant fair values are as follows for warrants outstanding at December 31, 2014 and 2013 are as follows:
|
Year ended December 31
|
||||||||
|
2014
|
2013
|
|||||||
|
Dividend yield
|
0.00 | % | 0.00 | % | ||||
|
Expected volatility
|
85.22 | % | 47.03 | % | ||||
|
Risk-free interest rate
|
1.00 | % | 1.13 | % | ||||
|
Expected average term (years)
|
0.5
|
1.6
|
||||||
|
Fair value of warrants outstanding
|
$ | 12.80 | $ | 5.30 | ||||
|
Aggregate fair value of warrants outstanding
|
$ | 5,099 | $ | 5,379 | ||||
|
Number of warrants outstanding
|
398,250 | 1,014,728 | ||||||
The value of the Company’s warrants is particularly sensitive to changes in the Company’s share price and the estimated rate of share price volatility.
(e) Stock-based compensation
The Company has five share-based compensation plans; the “2007 Plan”, the “2011 Plan”, two “Designated Plans” (together, the “Tekmira Plans”), and the “Protiva Option Plan”.
On June 22, 2011, the shareholders of the Company approved an omnibus stock-based compensation plan (the “2011 Plan”) and a 273,889 increase in the number of stock-based compensation awards that the Company is permitted to issue. The Company’s pre-existing 2007 Plan was limited to the granting of stock options as equity incentive awards whereas the 2011 Plan also allows for the issuance of tandem stock appreciation rights, restricted stock units and deferred stock units (collectively, and including options, referred to as “Awards”). The 2011 Plan replaces the 2007 Plan. The 2007 Plan will continue to govern the options granted thereunder. No further options will be granted under the Company’s 2007 Plan.
Under the Company’s 2007 Plan the Board of Directors granted options to employees, directors and consultants of the Company. The exercise price of the options was determined by the Company’s Board of Directors but was always at least equal to the closing market price of the common shares on the day preceding the date of grant and the term of options granted did not exceed 10 years. The options granted generally vested over three years for employees and immediately for directors.
Under the Company’s 2011 Plan the Board of Directors may grant options, and other types of Awards, to employees, directors and consultants of the Company. The exercise price of the options is determined by the Company’s Board of Directors but will be at least equal to the closing market price of the common shares on the day preceding the date of grant and the term may not exceed 10 years. Options granted generally vest over three years for employees and immediately for directors.
77
Additionally, the Company granted a total of 200,000 options in 2013 to two executive officers in conjunction with their new appointments as executive officers. These options were granted in accordance with the policies of the Toronto Stock Exchange and pursuant to newly designated share compensation plans (the “Designated Plans”). The Designated Plans are governed by substantially the same terms as the 2011 Plan. Hereafter, information on options governed by the 2007 Plan, the 2011 Plan, and the Designated Plans is presented on a consolidated basis as the terms of the four plans are similar. Information on the Protiva Option Plan is presented separately.
At the Company’s annual general and special meeting of shareholders on June 20, 2012 and May 8, 2014, the shareholders of the Company approved respectively, a 550,726 and a 800,000 increase in the number of stock-based compensation awards that the Company is permitted to issue.
Stock option activity for the Tekmira Plans
|
Number of
optioned
|
Weighted
average exercise
|
Weighted
average exercise
|
Aggregate
intrinsic
|
Aggregate
intrinsic
|
||||||||||||||||
|
Balance, December 31, 2011
|
1,413,318 | $ | 5.32 | $ | 5.38 | $ | 2 | $ | 2 | |||||||||||
|
Options granted
|
326,300 | $ | 4.16 | $ | 4.16 | |||||||||||||||
|
Options exercised
|
(28,417 | ) | $ | 2.34 | $ | 2.34 | $ | 82 | $ | 82 | ||||||||||
|
Options forfeited, cancelled or expired
|
(62,355 | ) | $ | 21.27 | $ | 21.29 | ||||||||||||||
|
Balance, December 31, 2012
|
1,648,846 | $ | 4.54 | $ | 4.54 | $ | 2,300 | $ | 2,301 | |||||||||||
|
Options granted
|
270,250 | $ | 7.52 | $ | 7.30 | |||||||||||||||
|
Options exercised
|
(124,246 | ) | $ | 3.22 | $ | 3.13 | $ | 551 | $ | 535 | ||||||||||
|
Options forfeited, cancelled or expired
|
(64,085 | ) | $ | 21.87 | $ | 21.23 | ||||||||||||||
|
Balance, December 31, 2013
|
1,730,765 | $ | 4.45 | $ | 4.32 | $ | 7,030 | $ | 6,826 | |||||||||||
|
Options granted
|
431,125 | $ | 13.63 | $ | 12.34 | |||||||||||||||
|
Options exercised
|
(622,752 | ) | $ | 4.62 | $ | 4.18 | $ | 7,650 | $ | 6,926 | ||||||||||
|
Options forfeited, cancelled or expired
|
(9,000 | ) | $ | 8.20 | $ | 7.42 | ||||||||||||||
|
Balance, December 31, 2014
|
1,530,138 | $ | 6.95 | $ | 6.29 | $ | 16,573 | $ | 15,004 | |||||||||||
Options under the Tekmira Plans expire at various dates from July 25, 2015 to December 14, 2024.
The following table summarizes information pertaining to stock options outstanding at December 31, 2014 under the Tekmira Plans:
|
Options outstanding December 31, 2014
|
Options exercisable December 31, 2014
|
|||||||||||||||||||||||||||||
|
Range of
Exercise prices
|
Number
of options
|
Weighted
average
|
Weighted
average
|
Weighted
average
|
Number
of options
|
Weighted
average
|
Weighted
average
|
|||||||||||||||||||||||
| $1.50 | to | $1.90 | 184,325 | 5.9 | $ | 1.71 | $ | 1.55 | 184,325 | $ | 1.71 | $ | 1.55 | |||||||||||||||||
| $2.10 | to | $2.60 | 189,299 | 6.7 | $ | 2.32 | $ | 2.10 | 169,404 | $ | 2.35 | $ | 2.13 | |||||||||||||||||
| $3.00 | to | $3.85 | 160,650 | 3.8 | $ | 3.57 | $ | 3.23 | 160,450 | $ | 3.57 | $ | 3.23 | |||||||||||||||||
| $4.49 | to | $6.50 | 411,356 | 6.4 | $ | 5.21 | $ | 4.72 | 323,052 | $ | 5.20 | $ | 4.71 | |||||||||||||||||
| $7.05 | to | $10.40 | 252,923 | 8.6 | $ | 8.78 | $ | 7.95 | 117,548 | $ | 8.81 | $ | 7.98 | |||||||||||||||||
| $11.60 | to | $13.26 | 156,085 | 9.1 | $ | 12.89 | $ | 11.67 | 76,879 | $ | 12.68 | $ | 11.48 | |||||||||||||||||
| $14.80 | to | $18.54 | 175,500 | 9.2 | $ | 16.67 | $ | 15.09 | 57,250 | $ | 16.45 | $ | 14.89 | |||||||||||||||||
| $1.50 | to | $18.54 | 1,530,138 | 7.1 | $ | 6.95 | $ | 6.29 | 1,088,908 | $ | 5.43 | $ | 4.92 | |||||||||||||||||
At December 31, 2014, there were 1,088,908 options exercisable (December 31, 2013 – 1,377,091; December 31, 2012 - 1,315,155) with a weighted average exercise price of $4.92 (C$5.43). The weighted average remaining contractual life of exercisable options as at December 31, 2014 was 6.38 years. The aggregate intrinsic value of in-the-money options exercisable at December 31, 2014 was $11,578,000.
78
A summary of the Company’s non-vested stock option activity and related information for the year ended December 31, 2014 is as follows:
|
Number of
optioned
|
Weighted
average
|
Weighted
average
|
||||||||||
|
Non-vested at December 31, 2013
|
353,675 | $ | 5.44 | $ | 5.28 | |||||||
|
Options granted
|
431,125 | $ | 13.63 | 12.34 | ||||||||
|
Options vested
|
(334,994 | ) | $ | 8.35 | 7.56 | |||||||
|
Non-vested options forfeited
|
(8,576 | ) | $ | 6.89 | 6.24 | |||||||
|
Non-vested at December 31, 2014
|
441,230 | $ | 9.30 | $ | 8.42 | |||||||
The weighted average remaining contractual life for options expected to vest at December 31, 2014 was 8.8 years and the weighted average exercise price for these options was $9.67 (C$10.68) per share.
The aggregate intrinsic value of options expected to vest as at December 31, 2014 was $2,626,000 (December 31, 2013 - $943,000; December 31, 2012 - $451,000).
The total fair value of options that vested during the year ended December 31, 2014 was $2,505,000 (2013 - $955,000; 2012 - $1,071,000).
Valuation assumptions for the Tekmira Plans
The fair value of stock options at date of grant, based on the following assumptions, was estimated using the Black-Scholes option-pricing model. Assumptions on the dividend yield are based on the fact that the Company has never paid cash dividends and has no present intention to pay cash dividends. Assumptions about the Company’s expected stock-price volatility are based on the historical volatility of the Company’s publicly traded stock. The risk-free interest rate used for each grant is equal to the zero coupon rate for instruments with a similar expected life. Expected life assumptions are based on the Company’s historical data. The Company currently expects, based on an analysis of its historical forfeitures, approximately 97% of its options issued will ultimately vest, and has applied a forfeiture rate of 3% to all unvested options held as of December 31, 2014 (December 31, 2013 – 2%; December 31, 2012 – 2%). The Company will record additional expense if the actual forfeitures are lower than estimated and will record a recovery of prior expense if the actual forfeitures are higher than estimated. The weighted average option pricing assumptions and the resultant fair values are as follows:
|
Year ended December 31
|
||||||||||||
|
2014
|
2013
|
2012
|
||||||||||
|
Dividend yield
|
0.00 | % | 0.00 | % | 0.00 | % | ||||||
|
Expected volatility
|
101.08 | % | 111.61 | % | 120.40 | % | ||||||
|
Risk-free interest rate
|
2.25 | % | 2.39 | % | 1.56 | % | ||||||
|
Expected average option term (years)
|
8.8
|
9.6
|
8.2
|
|||||||||
|
Fair value of options granted (C$)
|
$ | 11.68 | $ | 6.96 | $ | 3.83 | ||||||
Stock-based compensation expense for the Tekmira Plans
An expense for stock-based compensation for options awarded to employees and calculated in accordance with the fair value method has been recorded in the consolidated statement of operations and comprehensive income (loss) as follows:
|
Year ended December 31
|
||||||||||||
|
2014
|
2013
|
2012
|
||||||||||
|
Research, development, collaborations
and contracts expenses
|
$ | 2,343 | $ | 622 | $ | 772 | ||||||
|
General and administrative expenses
|
940 | 281 | 210 | |||||||||
|
Total
|
$ | 3,283 | $ | 903 | $ | 982 | ||||||
At December 31, 2014, there remains $2,533,000 of unearned compensation expense related to unvested employee stock options to be recognized as expense over a weighted-average period of approximately 18 months.
79
Protiva Option Plan
On May 30, 2008, as a condition of the acquisition of Protiva Biotherapeutics Inc., a total of 350,457 common shares of the Company were reserved for the exercise of 519,073 Protiva share options (“Protiva Options”). The Protiva Options have an exercise price of C$0.30, were fully vested and exercisable as of May 30, 2008. As at December 31, 2014, the outstanding options expire at various dates from September 12, 2015 to March 1, 2018 and upon exercise each option will be converted into approximately 0.6752 shares of the Company (the same ratio at which Protiva common shares were exchanged for Company common shares at completion of the acquisition of Protiva). The Protiva Options are not part of the Tekmira Plans and the Company is not permitted to grant any further Protiva Options.
The following table sets forth outstanding options under the Protiva Option Plan:
|
Number of
Protiva
Options
|
Equivalent number
of Company
common shares
|
Weighted
average exercise
price (C$)
|
Weighted
average exercise
price (US$)
|
|||||||||||||
|
Balance, December 31, 2011
|
491,020 | 331,517 | $ | 0.30 | 0.30 | |||||||||||
|
Options exercised
|
(15,135 | ) | (10,218 | ) | 0.30 | 0.30 | ||||||||||
|
Options forfeited, cancelled or expired
|
- | - | - | - | ||||||||||||
|
Balance, December 31, 2012
|
475,885 | 321,299 | $ | 0.30 | $ | 0.30 | ||||||||||
|
Options exercised
|
(2,000 | ) | (1,350 | ) | 0.30 | 0.29 | ||||||||||
|
Options forfeited, cancelled or expired
|
(1,000 | ) | (675 | ) | 0.30 | $ | 0.29 | |||||||||
|
Balance, December 31, 2013
|
472,885 | 319,274 | $ | 0.30 | $ | 0.29 | ||||||||||
|
Options exercised
|
(38,145 | ) | (25,754 | ) | 0.30 | 0.27 | ||||||||||
|
Options forfeited, cancelled or expired
|
(1,000 | ) | (675 | ) | 0.30 | 0.27 | ||||||||||
|
Balance, December 31, 2014
|
433,740 | 292,845 | $ | 0.30 | 0.27 | |||||||||||
The weighted average remaining contractual life of exercisable Protiva Options as at December 31, 2014 was 1.0 years.
The aggregate intrinsic value of Protiva Options outstanding at December 31, 2014 was $4,374,000. The intrinsic value of Protiva Options exercised in the year ended December 31, 2014 was $378,000 (2013 - $8,000; 2012 - $19,000).
Awards outstanding and available for issuance
Combining all of the Company’s share-based compensation plans, at December 31, 2014, the Company has 1,822,983 options outstanding and a further 785,398 Awards available for issuance.
|
6.
|
Government grants and refundable investment tax credits
|
Government grants and refundable investment tax credits have been recorded as a reduction in research and development expenses. Materials manufactured but not yet accepted by the third party
(a) Government grants
On December 22, 2014, the Company entered into a Manufacturing and Clinical Trial Agreement with the University of Oxford to provide the new TKM-Ebola-Guinea therapeutic product for clinical studies in West Africa. The University of Oxford is the representative of the International Severe Acute Respiratory and Emerging Infection Consortium (ISARIC), who will be conducting clinical studies of TKM-Ebola-Guinea in Ebola virus infected patients, with funding provided by the Wellcome Trust. Manufacture of TKM-Ebola-Guinea has been completed and the manufacturing costs are included in other assets as at December 31, 2014. In January 2015, the Company received $1,098,000 from ISARIC, and is close to finalization of a suitable clinical protocol for the studies to commence.
Government grants for the year ended December 31, 2014 include $172,000 in funding from the U.S. National Institutes of Health (2013 - $69,000).
(b) Refundable investment tax credits
The Company’s estimated claim for refundable Scientific Research and Experimental Development investment tax credits for the year ended December 31, 2014 is $52,000 (2013 - $43,000).
|
7.
|
Income taxes
|
Income tax (recovery) expense varies from the amounts that would be computed by applying the combined Canadian federal and provincial income tax rate of 17.8% (year ended December 2013 – 17.8%; year ended December 31, 2012 – 17.5%) to the loss before income taxes as shown in the following tables:
80
|
Year ended December 31
|
||||||||||||
|
2014
|
2013
|
2012
|
||||||||||
|
Computed taxes (recoveries) at Canadian federal and provincial tax rates
|
$
|
(6,893
|
) |
$
|
(2,380
|
)
|
$
|
7,486
|
||||
|
Differences due to change in enacted tax rates
|
-
|
(6
|
)
|
781
|
||||||||
|
Difference due to change in tax rate on opening deferred taxes
|
-
|
-
|
2,720
|
|||||||||
|
Permanent and other differences
|
1,342
|
1,150
|
(1,195
|
) | ||||||||
|
Change in valuation allowance - other
|
5,551
|
1,236
|
798
|
|
||||||||
|
Change in valuation allowance - utilization of investment tax credits
|
- | - | (10,590 | ) | ||||||||
|
Income tax (recovery) expense
|
$
|
-
|
$
|
-
|
$
|
-
|
||||||
As at December 31, 2014, the Company has investment tax credits available to reduce Canadian federal income taxes of $7,866,000 (December 31, 2013 - $6,859,000) and provincial income taxes of $3,401,000 (December 31, 2013 - $2,432,000) and expiring between 2015 and 2034.
At December 31, 2014, the Company has scientific research and experimental development expenditures of $49,906,852 (December 31, 2013 - $49,907,000) available for indefinite carry-forward and $25,301,000 (December 31, 2013 - $24,527,000) of net operating losses due to expire between 2028 and 2033 and which can be used to offset future taxable income in Canada.
On November 23, 2011, the Company was registered as a corporation under the Business Activity Act in the province of British Columbia. Under this program, provincial corporation tax charged on foreign income earned from the Company’s patents will be eligible for a 75% tax refund up to a maximum of C$8,000,000. Significant components of the Company’s deferred tax assets are shown below:
|
Year ended December 31
|
||||||||
|
2014
|
2013
|
|||||||
|
Deferred tax assets:
|
||||||||
|
Non-capital loss carryforwards
|
$
|
4,491
|
$
|
4,354
|
||||
|
Research and development deductions
|
9,562
|
8,859
|
||||||
|
Book amortization in excess of tax
|
1,874
|
2,171
|
||||||
|
Share issue costs
|
815
|
(136
|
)
|
|||||
|
Revenue recognized for tax purposes in excess of revenue recognized for accounting purposes
|
2,790
|
668
|
||||||
|
Tax value in excess of accounting value in lease inducements
|
45
|
(3
|
)
|
|||||
|
Federal investment tax credits
|
6,470
|
5,539
|
||||||
|
Provincial investment tax credits
|
3,347
|
2,391
|
||||||
|
Total deferred tax assets
|
29,394
|
23,843
|
||||||
|
Valuation allowance
|
(29,394
|
)
|
(23,843
|
)
|
||||
|
Net deferred tax assets
|
$
|
-
|
$
|
-
|
||||
Certain comparative figures in the above deferred tax assets table have been recast to increase the Canadian federal investment tax credits by $5,539,000, the provincial investment tax credits by $1,999,000, and the valuation allowance by $7,538,000 as at December 31, 2013. The comparative figures in the income tax expense reconciliation table have also been recast to reflect these changes. These adjustments have no impact on the consolidated financial position, consolidated results of operations or the consolidated cash flows.
|
8.
|
Contingencies and commitments
|
Property lease
On June 23, 2014, the Company signed a renewal agreement to the operating lease for its laboratory and office premises. The renewal is effective August 1, 2014 and expires July 31, 2019, but the Company has the option to extend the lease to 2024, 2029, and 2034. The renewal agreement includes lease inducements, which are amortized on a straight-line basis over the term of the lease, in accordance with the Company’s accounting policy.
Following the lease renewal, the minimum rent and estimated operating cost commitment, net of lease inducements, is as follows:
|
Year ended December 31, 2015
|
$ | 1,119,000 | ||
|
Year ended December 31, 2016
|
1,119,000 | |||
|
Year ended December 31, 2017
|
1,119,000 | |||
|
Year ended December 31, 2018
|
1,119,000 | |||
|
Year ended December 31, 2019
|
653,000 | |||
| $ | 5,129,000 |
The Company’s lease expense, for the year ended December 31, 2014 of $1,133,000 has been recorded in the consolidated statements of operations and comprehensive income (loss) (2013 - $1,225,000; 2012 - $937,000).
81
Product development partnership with the Canadian Government
The Company entered into a Technology Partnerships Canada ("TPC") agreement with the Canadian Federal Government on November 12, 1999. Under this agreement, TPC agreed to fund 27% of the costs incurred by the Company, prior to March 31, 2004, in the development of certain oligonucleotide product candidates up to a maximum contribution from TPC of $7,179,000 (C$9,330,000). As at December 31, 2014, a cumulative contribution of $3,191,000 (C$3,702,000) had been received and the Company does not expect any further funding under this agreement. In return for the funding provided by TPC, the Company agreed to pay royalties on the share of future licensing and product revenue, if any, that is received by the Company on certain non-siRNA oligonucleotide product candidates covered by the funding under the agreement. These royalties are payable until a certain cumulative payment amount is achieved or until a pre-specified date. In addition, until a cumulative amount equal to the funding actually received under the agreement has been paid to TPC, the Company agreed to pay 2.5% royalties on any royalties the Company receives for Marqibo. For the year-ended December 31, 2014, the Company earned royalties on Marqibo sales in the amount of $190,000 (see note 3(f)), resulting in $5,000 recorded by the Company as royalty payable to TPC (2013 - $1,000, 2012 - $nil).
The cumulative amount paid or accrued up to December 31, 2014 was $6,000, resulting in the contingent amount due to TPC being $3,185,000 (C$3,695,000).
License agreement with Marina Biotech, Inc. (“Marina”)
On November 29, 2012 the Company announced a worldwide, non-exclusive license to a novel RNAi payload technology called Unlocked Nucleobase Analog (“UNA”) from Marina for the development of RNAi therapeutics.
UNA technology can be used in the development of RNAi therapeutics, which treat disease by silencing specific disease causing genes. UNAs can be incorporated into RNAi drugs and have the potential to improve them by increasing their stability and reducing off-target effects.
Under the license agreement the Company paid Marina an upfront fee of $300,000. A further license payment of $200,000 was paid in 2013 and the Company will make milestone payments of up to $3,250,000 and royalties on each product developed by the Company that uses Marina’s UNA technology. The payments to Marina are expensed to research, development, collaborations and contracts expense.
Effective August 9, 2013, Marina’s UNA technology was acquired by Arcturus Therapeutics, Inc. (“Arcturus”) and the UNA license agreement between the Company and Marina was assigned to Arcturus. The terms of the license are otherwise unchanged. On December 22, 2014, the Company received clearance from Health Canada to conduct a Phase I Clinical Study with TKM-HBV, which utilizes Arcturus’ UNA technology. This triggered the accrual of a $150,000 as at December 31, 2014 related to the milestone payment to Arcturus upon the dosing of first subject in a Phase I clinical trial of TKM-HBV, which occurred on January 21, 2015.
Arbitration with the University of British Columbia (“UBC”)
Certain early work on lipid nanoparticle delivery systems and related inventions was undertaken at UBC. These inventions are licensed to the Company by UBC under a license agreement, initially entered in 1998 as amended in 2001, 2006 and 2007. The Company has granted sublicenses under the UBC license to Alnylam as well as to Talon. Alnylam has in turn sublicensed back to the Company under the licensed UBC patents for discovery, development and commercialization of RNAi products. In 2009, the Company entered into a supplemental agreement with UBC, Alnylam and AlCana, in relation to a separate research collaboration to be conducted among UBC, Alnylam and AlCana to which the Company has license rights. The settlement agreement signed in late 2012 to resolve the litigation among the Company, Alnylam, and AlCana, provided for the effective termination of all obligations under such supplemental agreement as between and among all litigants (see note 3(c)).
On November 10, 2014, UBC filed a notice of arbitration against the Company and on January 16, 2015, filed a Statement of Claim, which alleges entitlement to $3,500,000 in allegedly unpaid royalties based on publicly available information, and an unspecified amount based on non-public information. UBC also seeks interest and costs, including legal fees. The Company is currently disputing UBC’s allegations, and no dates have been scheduled for this arbitration. However, the Company notes that arbitration is subject to inherent uncertainty and an arbitrator could rule against the Company. The Company has not recorded an estimate of the possible loss associated with this arbitration, due to the uncertainties related to both the likelihood and amount of any possible loss or range of loss. However, the defense of arbitration and related matters are costly and may divert the attention of the Company’s management and other resources that would otherwise be engaged in other activities. Costs related to the arbitration have been recorded by the Company as incurred.
|
9.
|
Concentrations of business risk
|
Credit risk
Credit risk is defined by the Company as an unexpected loss in cash and earnings if a collaborative partner is unable to pay its obligations in due time. The Company’s main source of credit risk is related to its accounts receivable balance which principally represents temporary financing provided to collaborative partners in the normal course of operations.
The Company does not currently maintain a provision for bad debts as the majority of accounts receivable is from collaborative partners or government agencies and are considered low risk.
The carrying amount of financial assets represents the maximum credit exposure. The maximum exposure to credit risk at December 31, 2014 was the accounts receivable balance of $1,903,000 (December 31, 2013 - $117,000).
All accounts receivable balances were current as at December 31, 2014 and December 31, 2013.
Significant collaborators and customers risk
We depend on a small number of collaborators and customers for a significant portion of our revenues (see note 3).
Liquidity Risk
Liquidity risk results from the Company’s potential inability to meet its financial liabilities, for example payments to suppliers. The Company ensures sufficient liquidity through the management of net working capital and cash balances.
The Company’s liquidity risk is primarily attributable to its cash and cash equivalents, and short-term investments. The Company limits exposure to liquidity risk on its liquid assets through maintaining its cash and cash equivalent, and short-term investments with high-credit quality financial institutions. Due to the nature of these investments, the funds are available on demand to provide optimal financial flexibility.
The Company believes that its current sources of liquidity are sufficient to cover its likely applicable short term cash obligations. The Company’s financial obligations include accounts payable and accrued liabilities which generally fall due within 45 days.
82
The net liquidity of the Company is considered to be the cash and cash equivalents and short-term investments less accounts payable and accrued liabilities.
|
December 31, 2014
|
December 31, 2013
|
|||||||
|
Cash, cash equivalents and short-term investments
|
$ | 112,161 | $ | 68,717 | ||||
|
Less: Accounts payable and accrued liabilties
|
(9,328 | ) | (3,680 | ) | ||||
| $ | 102,833 | $ | 65,037 | |||||
Foreign currency risk
The results of the Company’s operations are subject to currency transaction and translation risk as the Company’s revenues and expenses are denominated in both Canadian and US dollars. The fluctuation of the US dollar in relation to the Canadian dollar will consequently have an impact upon the Company’s reported income or loss and may also affect the value of the Company’s assets, liabilities, and the amount of shareholders’ equity both as recorded in the Company’s financial statements, in the Canadian functional currency, and as reported, for presentation purposes, in the US dollar.
The Company manages its US dollar exchange rate risk by, whenever possible, using cash received from US dollar revenues and financing to pay US dollar expenses. Prior to the financing in October 2013 (note 5(a)), which was denominated in US dollars, the Company’s policy was to convert all but a working capital level of US dollars into Canadian dollars. Given the Company’s increasing level of US dollar expenses, its policy is now to maintain US and Canadian dollar cash and investment and short-term investment balances based on long term forecasts of currency needs thereby creating a natural currency hedge.
The Company has not entered into any agreements or purchased any instruments to hedge possible currency risks. The Company’s exposure to US dollar currency expressed in Canadian dollars was as follows:
|
(in C$)
|
December 31, 2014
|
December 31, 2013
|
||||||
|
Cash and cash equivalents and short-term investments
|
$ | 75,224 | $ | 38,901 | ||||
|
Accounts receivable
|
1,942 | 11 | ||||||
|
Accrued revenue
|
624 | 226 | ||||||
|
Accounts payable and accrued liabilities
|
(4,494 | ) | (1,889 | ) | ||||
| $ | 73,296 | $ | 37,248 | |||||
An analysis of the Company’s sensitivity to foreign currency exchange rate movements is not provided in these financial statements as the Company’s US dollar cash holdings and expected US dollar revenues are sufficient to cover US dollar expenses for the foreseeable future.
|
10.
|
Supplementary information
|
Accounts payable and accrued liabilities is comprised of the following:
|
December 31, 2014
|
December 31, 2013
|
|||||||
|
Trade accounts payable
|
$ | 2,044 | $ | 1,217 | ||||
|
Research and development accruals
|
2,391 | 669 | ||||||
| License fee accruals | 250 | - | ||||||
|
Professional fee accruals
|
1,294 | 247 | ||||||
|
Deferred lease inducements
|
250 | 16 | ||||||
| Payroll accruals | 2,873 | 1,224 | ||||||
|
Other accrued liabilities
|
226 | 307 | ||||||
| $ | 9,328 | $ | 3,680 | |||||
|
11.
|
Interim financial data (unaudited)
|
|
2014
|
||||||||||||||||||||
|
Q1
|
Q2
|
Q3
|
Q4
|
Total
|
||||||||||||||||
|
Revenue
|
4,430
|
1,811
|
4,362
|
4,350
|
14,953
|
|||||||||||||||
|
Loss from operations
|
(5,958
|
)
|
(9,423
|
)
|
(6,844
|
)
|
(10,747
|
)
|
(32,972
|
)
|
||||||||||
|
Net loss
|
(17,984
|
)
|
(6,081
|
)
|
(8,604
|
)
|
(6,168
|
)
|
(38,837
|
)
|
||||||||||
|
Basic and diluted net loss per share
|
$
|
(0.91
|
)
|
$
|
(0.28
|
)
|
$
|
(0.39
|
)
|
$
|
(0.27
|
)
|
$
|
(1.80
|
)
|
|||||
83
|
2013
|
||||||||||||||||||||
|
Q1
|
Q2
|
Q3
|
Q4
|
Total
|
||||||||||||||||
|
Revenue
|
2,132
|
2,844
|
2,963
|
7,52
|
15,465
|
|||||||||||||||
|
Loss from operations
|
(2,994
|
)
|
(3,071
|
)
|
(3,652
|
)
|
(2,435
|
)
|
(12,152
|
)
|
||||||||||
|
Net loss
|
(2,546
|
)
|
(3,015
|
)
|
(5,906
|
)
|
(2,596
|
)
|
(14,063
|
)
|
||||||||||
|
Basic and diluted net loss per share
|
$
|
(0.18
|
)
|
$
|
(0.21
|
)
|
$
|
(0.41
|
)
|
$
|
(0.15
|
)
|
$
|
(0.92
|
)
|
|||||
|
12.
|
Subsequent events
|
Merger with OnCore Biopharma, Inc. (“OnCore”)
On January 11, 2015, the Company entered into a Merger Agreement to acquire 100% of the outstanding shares of OnCore, a privately owned US company focused on discovery, development and commercialization of an all-oral cure regimen for patients with HBV. The merger was approved by the Company’s shareholders on March 3, 2015 and consummated on March 4, 2015
by issuing 23,973,317 common shares of the Company.
The results from the acquisition of the merger will be included in the statement of operations commencing March 4, 2015.
The transaction will be accounted for using the acquisition method based on ASC 805, Business Combinations, on the basis that Tekmira is the acquirer, which is based on managements’ analysis and the number of shares to be issued. Under the acquisition method, the consideration transferred is measured at the market price as at the acquisition date. The excess of the purchase price over the preliminary value assigned to the net assets acquired will be recorded as goodwill.
Due to the timing of the acquisition of OnCore, the initial accounting for the business acquisition is incomplete as of the date of this report. The aggregate fair value of the consideration, assets acquired and liabilities assumed are our best estimates that are based upon certain valuations and analyses that have yet to be finalized and are subject to adjustments once the detailed analyses are completed. Certain of the common shares issued in consideration of the merger are subject to repurchase by the Company in specified circumstances under employment agreements with the holders.
The fair value of consideration to be transferred to acquire OnCore’s outstanding shares has been estimated to be approximately
$381,942,000
, and has been attributed to the preliminary valuation of assets acquired and liabilities assumed are as follows:
|
Consideration paid:
|
|
|||
|
Common shares issued without subjects
|
|
$
|
371,553
|
|
|
Common shares issued subject to repurchase provision
|
|
9,262
|
|
|
|
Common shares issuable for OnCore stock options
|
|
1,127
|
|
|
|
|
$
|
381,942
|
|
|
|
|
||||
|
Identifiable assets acquired and liabilities assumed:
|
|
|||
|
Cash
|
|
$
|
325
|
|
|
Prepaid expenses and other assets
|
|
125
|
|
|
|
Accounts receivable
|
|
7
|
|
|
|
Property and equipment
|
|
149
|
|
|
|
Acquired intangible assets from combined OnCore
|
|
393,192
|
|
|
|
Accounts payable and accrued liabilities
|
|
(3,182
|
)
|
|
|
Other noncurrent liabilities
|
|
(8,674
|
)
|
|
|
Total purchase price allocation
|
|
$
|
381,942
|
|
84
|
Item 9.
|
Changes in and Disagreements with Accountants on Accounting and Financial Disclosure
|
|
Item 9A.
|
Controls and Procedures
|
Disclosure Controls and Procedures
As of the end of our fiscal year ended December 31, 2014, an evaluation of the effectiveness of our “disclosure controls and procedures” (as such term is defined in Rules 13a-15(e) and 15d-15(e) under the Securities Exchange Act of 1934) was carried out by our management, with the participation of our Chief Executive Officer (CEO) and Chief Financial Officer (CFO). Based upon that evaluation, the CEO and CFO have concluded that as of the end of that fiscal year, our disclosure controls and procedures are effective to ensure that information required to be disclosed by us in reports that we file or submit under the Exchange Act is (i) recorded, processed, summarized and reported within the time periods specified in Securities and Exchange Commission (the “Commission”) rules and forms and (ii) accumulated and communicated to the management of the registrant, including the CEO and CFO, to allow timely decisions regarding required disclosure.
It should be noted that while the CEO and CFO believe that our disclosure controls and procedures provide a reasonable level of assurance that they are effective, they do not expect that our disclosure controls and procedures or internal control over financial reporting will prevent all errors and fraud. A control system, no matter how well conceived or operated, can provide only reasonable, not absolute, assurance that the objectives of the control system are met.
Management’s Annual Report on internal control over financial reporting
Management is responsible for establishing and maintaining adequate internal control over our financial reporting, as such term is defined in Rule 13a-15(f) of the Securities Exchange Act of 1934. Our internal control system was designed to provide reasonable assurance that all transactions are accurately recorded, that transactions are recorded as necessary to permit preparation of financial statements in accordance with generally accepted accounting principles, and that our assets are safeguarded.
Management has assessed the effectiveness of our internal control over financial reporting as at December 31, 2014. In making its assessment, management used the Committee of Sponsoring Organizations of the Treadway Commission (COSO) framework in Internal Control – Integrated Framework (2013) to evaluate the effectiveness of our internal control over financial reporting. Based on this assessment, management has concluded that our internal control over financial reporting was effective as of December 31, 2014.
Attestation report of the registered public accounting firm
The Company is an “accelerated filer” within the meaning of Rule 12b-2 under the Exchange Act. The independent registered public accounting firm’s report on the effectiveness of our internal control over financial reporting are included in Item 8 of this annual report on Form 10-K and are incorporated herein by reference.
Changes in internal control over financial reporting
There have been no changes in our internal control over financial reporting during the period covered by the annual report, being the fiscal year ended December 31, 2014, that materially affected, or are reasonably likely to materially affect, our internal control over financial reporting and disclosure controls and procedures.
|
Item 9B.
|
Other Information
|
85
|
Item 10.
|
Directors, Executive Officers and Corporate Governance
|
The
information required by this item is incorporated herein by reference to the information contained under the sections captioned “Proposal One — Election of Directors,” “Section 16(a) Beneficial Ownership Reporting Compliance” and “Corporate Governance” of the Proxy Statement. The information required by this item relating to executive officers is included in Part I, Item 1, “— Business-Executive Officers of the Registrant,” of this annual report on Form 10-K.
|
Item 11.
|
Executive Compensation
|
The
information required by this item is incorporated herein by reference to the information contained under the sections captioned “Information about Executive Officer and Director Compensation,” “Compensation Committee Interlocks and Insider Participation,” “Employment Arrangements” and “Compensation Committee Report” of the Proxy Statement.
|
Item 12.
|
Security Ownership of Certain Beneficial Owners and Management and Related Stockholder Matters
|
The
information required by this item is incorporated herein by reference to the information contained under the sections captioned “Security Ownership of Certain Beneficial Owners and Management,” “Information about Executive Officer and Director Compensation” and “Securities Authorized for Issuance Under Equity Compensation Plans” of the Proxy Statement.
|
Item 13.
|
Certain Relationships and Related Transactions, and Director Independence
|
The
information required by this item is incorporated herein by reference to the information contained under the sections captioned “Corporate Governance,” “Employment Arrangements” and “Certain Relationships and Related Transactions” of the Proxy Statement.
|
Item 14.
|
Principal Accountant Fees and Services
|
The
information required by this item is incorporated herein by reference to the information contained under the sections captioned “Corporate Governance,” “Principal Accountant Fees and Services” and “Pre-Approval Policies and Procedures” of the Proxy Statement.
86
|
Item 15.
|
Exhibits and Financial Statement Schedules
|
Financial
Statements
See Index to Consolidated Financial Statements under Item 8 of Part II.
Financial Statement Schedules
None
SIGNATURES
Pursuant to the requirements of Section 13 or 15(d) of the Securities Exchange Act of 1934, the Registrant has duly caused this report to be signed on its behalf by the undersigned, thereunto duly
authorized on
March 13, 2015
.
|
TEKMIRA PHARMACEUTICALS CORPORATION
|
||
|
By:
|
/s/ Mark Murray
|
|
|
Mark Murray
|
||
|
President and Chief Executive Officer
|
||
Pursuant to the requirements of the Securities Exchange Act of 1934, this report has been signed below by the following persons on behalf of the Registrant and in the capacities indicated on March 13, 2015.
|
Signatures
|
Capacity in Which Signed
|
|
|
/s/ Vivek Ramaswamy
|
Director (Chairman)
|
|
|
Vivek Ramaswamy
|
||
|
/s/ Mark Murray
|
President and
Chief Executive Officer and Director
|
|
|
Mark Murray
|
(Principal Executive Officer)
|
|
|
/s/ Bruce Cousins
|
Executive Vice President, Finance and Chief Financial Officer
|
|
|
Bruce Cousins
|
(Principal Financial Officer and Accounting Officer)
|
|
|
/s/ Herbert J. Conrad
|
Director
|
|
|
Herbert J. Conrad
|
||
|
/s/ Richard C. Henriques
|
Director
|
|
|
Richard C. Henriques
|
||
|
/s/ Frank Karbe
|
Director
|
|
|
Frank Karbe
|
||
|
/s/ Keith Manchester
|
Director
|
|
|
Keith Manchester
|
|
|
| /s/ William T. Symonds |
Chief Development Officer
|
|
|
William T. Symonds
|
87
|
Exhibit
Number
|
Description
|
|
|
2.1*
|
Subscription Agreement, between the Company and Alnylam Pharmaceuticals, Inc., dated March 28, 2008 (incorporated herein by reference to Exhibit 2.1 to the Registrant’s Annual Report on Form 20-F for the year ended December 31, 2010 filed with the SEC on June 3, 2011).
|
|
|
2.2*
|
Subscription Agreement, between the Company and Roche Finance Ltd., dated March 31, 2008 (incorporated herein by reference to Exhibit 2.2 to the Registrant’s Annual Report on Form 20-F for the year ended December 31, 2010 filed with the SEC on June 3, 2011).
|
|
|
2.3*
|
Agreement and Plan of Merger and Reorganization, dated January 11, 2015, by and among Tekmira Pharmaceuticals Corporation, TKM Acquisition Corporation and OnCore Biopharma, Inc. (incorporated herein by reference to Exhibit 2.1 to the Registrant’s Current Report on Form 8-K/A filed with the SEC on January 26, 2015).
|
|
|
3.1*
|
Notice of Articles and Articles of the Company (incorporated herein by reference to Exhibit 1.1 to the Registrant’s Annual Report on Form 20-F for the year ended December 31, 2010 filed with the SEC on June 3, 2011).
|
|
|
3.2*
|
Amendment to the Articles of the Company dated May 14, 2013 (incorporated herein by reference to Exhibit 3.2 to the Registrant’s Annual Report on Form 10-K for the year ended December 31, 2013 filed with the SEC on March 28, 2014).
|
|
|
3.3*
|
Governance Amendment to the Articles of the Company dated March 4, 2015, (incorporated herein by reference to Exhibit 3.1 to the Registrant’s Current Report on Form 8-K filed with the SEC on March 4, 2015).
|
|
|
3.4*
|
Approval of Quorum Policy of the Company, adopted January 31, 2015 (incorporated herein by reference to Exhibit 3.1 to the Registrant’s Current Report on Form 8-K filed with the SEC on February 5, 2015).
|
|
|
4.1*
|
Governance Agreement between the Company and Roivant Sciences Ltd., a Bermuda exempted company, dated January 11, 2015 (incorporated herein by reference to Exhibit 2.1 to the Registrant’s Current Report on Form 8-K/A filed with the SEC on January 26, 2015).
|
|
|
10.1†*
|
Amendment No. 1 to the Amended and Restated Agreement, between the Company (formerly Inex Pharmaceuticals Corporation) and Hana Biosciences, Inc., effective as of May 27, 2009 (incorporated herein by reference to Exhibit 4.1 to the Registrant’s Annual Report on Form 20-F for the year ended December 31, 2010 filed with the SEC on June 3, 2011).
|
|
|
10.2†*
|
Amended and Restated License Agreement, between Inex Pharmaceuticals Corporation and Hana Biosciences, Inc., dated April 30, 2007 (incorporated herein by reference to Exhibit 4.2 to the Registrant’s Amendment No. 1 to Form 20-F for the year ended December 31, 2010 filed with the SEC on January 31, 2012).
|
|
|
10.3†*
|
Sublicense Agreement, between Inex Pharmaceuticals Corporation and Alnylam Pharmaceuticals, Inc., dated January 8, 2007 (incorporated herein by reference to Exhibit 4.3 to the Registrant’s Amendment No. 1 to Form 20-F for the year ended December 31, 2010 filed with the SEC on January 31, 2012).
|
|
|
10.4†*
|
Amended and Restated License and Collaboration Agreement, between the Company and Alnylam Pharmaceuticals, Inc., effective as of May 30, 2008 (incorporated herein by reference to Exhibit 4.4 to the Registrant’s Amendment No. 1 to Form 20-F for the year ended December 31, 2010 filed with the SEC on January 31, 2012).
|
|
|
10.5†*
|
Amended and Restated Cross-License Agreement, between Alnylam Pharmaceuticals, Inc. and Protiva Biotherapeutics Inc., dated May 30, 2008 (incorporated herein by reference to Exhibit 4.5 to the Registrant’s Amendment No. 1 to Form 20-F for the year ended December 31, 2010 filed with the SEC on January 31, 2012).
|
|
|
10.6†*
|
License Agreement, between Inex Pharmaceuticals and Aradigm Corporation, dated December 8, 2004 (incorporated herein by reference to Exhibit 4.6 to the Registrant’s Amendment No. 1 to Form 20-F for the year ended December 31, 2010 filed with the SEC on January 31, 2012).
|
|
|
10.7†*
|
Settlement Agreement, between Sirna Therapeutics, Inc. and Merck & Co., Inc. and Protiva Biotherapeutics Inc. and Protiva Biotherapeutics (USA), Inc., effective as of October 9, 2007 (incorporated herein by reference to Exhibit 4.7 to the Registrant’s Amendment No. 1 to Form 20-F for the year ended December 31, 2010 filed with the SEC on January 31, 2012).
|
|
|
10.8†*
|
Development, Manufacturing and Supply Agreement, between the Company and Alnylam Pharmaceuticals, Inc., dated January 2, 2009 (incorporated herein by reference to Exhibit 4.8 to the Registrant’s Amendment No. 1 to Form 20-F for the year ended December 31, 2010 filed with the SEC on January 31, 2012).
|
|
88
|
10.9†*#
|
Executive Employment Agreement with Ian Mortimer, dated March 26, 2008 (incorporated herein by reference to Exhibit 4.9 to the Registrant’s Annual Report on Form 20-F for the year ended December 31, 2010 filed with the SEC on June 3, 2011).
|
|
|
10.10*#
|
Executive Employment Agreement with Ian MacLachlan, dated May 30, 2008 (incorporated herein by reference to Exhibit 4.10 to the Registrant’s Annual Report on Form 20-F for the year ended December 31, 2010 filed with the SEC on June 3, 2011).
|
|
|
10.11*#
|
Executive Employment Agreement with Mark Murray, dated May 30, 2008 (incorporated herein by reference to Exhibit 4.11 to the Registrant’s Annual Report on Form 20-F for the year ended December 31, 2010 filed with the SEC on June 3, 2011).
|
|
|
10.12*#
|
Executive Employment Agreement with Peter Lutwyche, dated January 1, 2009 (incorporated herein by reference to Exhibit 4.12 to the Registrant’s Annual Report on Form 20-F for the year ended December 31, 2010 filed with the SEC on June 3, 2011).
|
|
|
10.13*#
|
Share Option Plan amended through May 12, 2009 (including form stock option agreements) (incorporated herein by reference to Exhibit 4.13 to the Registrant’s Annual Report on Form 20-F for the year ended December 31, 2010 filed with the SEC on June 3, 2011).
|
|
|
10.14*
|
Lease Agreement with Canada Lands Company CLC Limited dated December 15, 1997, as amended (incorporated herein by reference to Exhibit 4.14 to the Registrant’s Annual Report on Form 20-F for the year ended December 31, 2010 filed with the SEC on June 3, 2011).
|
|
|
10.15*#
|
Form of Indemnity Agreement (incorporated herein by reference to Exhibit 4.15 to the Registrant’s Annual Report on Form 20-F for the year ended December 31, 2010 filed with the SEC on June 3, 2011).
|
|
|
10.16*
|
Award Contract with USASMDC/ARSTRAT effective date July 14, 2010 (incorporated herein by reference to Exhibit 4.16 to the Registrant’s Annual Report on Form 20-F for the year ended December 31, 2010 filed with the SEC on June 3, 2011).
|
|
|
10.17†*
|
License Agreement between the University of British Columbia and Inex Pharmaceuticals Corporation executed on July 30, 2001 (incorporated herein by reference to Exhibit 4.17 to the Registrant’s Annual Report on Form 20-F for the year ended December 31, 2010 filed with the SEC on June 3, 2011).
|
|
|
10.18†*
|
Amendment Agreement between the University of British Columbia and Inex Pharmaceuticals Corporation dated July 11, 2006 (incorporated herein by reference to Exhibit 4.18 to the Registrant’s Annual Report on Form 20-F for the year ended December 31, 2010 filed with the SEC on June 3, 2011).
|
|
|
10.19†*
|
Second Amendment Agreement between the University of British Columbia and Inex Pharmaceuticals Corporation dated January 8, 2007 (incorporated herein by reference to Exhibit 4.19 to the Registrant’s Annual Report on Form 20-F for the year ended December 31, 2010 filed with the SEC on June 3, 2011).
|
|
|
10.20†*
|
Consent Agreement of the University of British Columbia to Inex/Alnylam Sublicense Agreement dated January 8, 2007 (incorporated herein by reference to Exhibit 4.20 to the Registrant’s Annual Report on Form 20-F for the year ended December 31, 2010 filed with the SEC on June 3, 2011).
|
|
|
10.21†*
|
Amendment No. 2 to the Amended and Restated Agreement, between the Company (formerly Inex Pharmaceuticals Corporation) and Hana Biosciences, Inc., effective as of September 20, 2010 (incorporated herein by reference to Exhibit 4.21 to the Registrant’s Annual Report on Form 20-F for the year ended December 31, 2010 filed with the SEC on June 3, 2011).
|
|
|
10.22†*
|
License and Collaboration Agreement between the Company and Halo-Bio RNAi Therapeutics, Inc. as of August 24, 2011 (incorporated herein by reference to Exhibit 4.22 to the Registrant’s Annual Report on Form 20-F for the year ended December 31, 2011 filed with the SEC on March 27, 2012).
|
|
|
10.23*
|
Loan Agreement with Silicon Valley Bank dated as of December 21, 2011 (incorporated herein by reference to Exhibit 4.23 to the Registrant’s Annual Report on Form 20-F for the year ended December 31, 2011 filed with the SEC on March 27, 2012).
|
|
|
10.24*#
|
Employment Agreement with Paul Brennan dated August 24, 2010 (incorporated herein by reference to Exhibit 4.24 to the Registrant’s Annual Report on Form 20-F for the year ended December 31, 2011 filed with the SEC on March 27, 2012).
|
|
|
10.25*#
|
Tekmira 2011 Omnibus Share Compensation Plan approved by shareholders on June 22, 2011 (incorporated herein by reference to Exhibit 4.25 to the Registrant’s Annual Report on Form 20-F for the year ended December 31, 2011 filed with the SEC on March 27, 2012).
|
|
89
|
10.26†*
|
Settlement Agreement and General Release, by and among Tekmira Pharmaceuticals Corporation, Protiva Biotherapeutics Inc., Alnylam Pharmaceuticals, Inc., and AlCana Technologies, Inc., dated November 12, 2012 (incorporated herein by reference to Exhibit 4.26 to the Registrant’s Annual Report on Form 20-F for the year ended December 31, 2012 filed with the SEC on March 27, 2013).
|
|
10.27†*
|
Cross-License Agreement by and among Alnylam Pharmaceuticals, Inc., Tekmira Pharmaceuticals Corporation and Protiva Biotherapeutics Inc., dated November 12, 2012(incorporated herein by reference to Exhibit 4.27 to the Registrant’s Annual Report on Form 20-F for the year ended December 31, 2012 filed with the SEC on March 27, 2013).
|
|
|
10.28†*
|
License Agreement by and among Protiva Biotherapeutics Inc. and Marina Biotech, Inc. dated November 28, 2012 (incorporated herein by reference to Exhibit 4.28 to the Registrant’s Annual Report on Form 20-F for the year ended December 31, 2012 filed with the SEC on March 27, 2013).
|
|
|
10.29*#
|
Employment Agreement with Diane Gardiner dated March 1, 2013 (incorporated herein by reference to Exhibit 4.29 to the Registrant’s Annual Report on Form 20-F for the year ended December 31, 2012 filed with the SEC on March 27, 2013).
|
|
|
10.30*#
|
Employment Agreement with Mark Kowalski dated August 12, 2013 (incorporated herein by reference to Exhibit 10.30 to the Registrant’s Annual Report on Form 10-K for the year ended December 31, 2013 filed with the SEC on March 28, 2014).
|
|
|
10.31*#
|
Employment Agreement with Bruce Cousins dated October 7, 2013 (incorporated herein by reference to Exhibit 10.31 to the Registrant’s Annual Report on Form 10-K for the year ended December 31, 2013 filed with the SEC on March 28, 2014).
|
|
|
10.32†*
|
Services Agreement by and among Protiva Biotherapeutics Inc., Protiva Agricultural Development Company Inc. and Monsanto Company dated January 12, 2014 (incorporated herein by reference to Exhibit 10.32 to the Registrant’s Annual Report on Form 10-K for the year ended December 31, 2013 filed with the SEC on March 28, 2014).
|
|
|
10.33†*
|
Option Agreement by and among Tekmira Pharmaceuticals Corporation, Protiva Biotherapeutics Inc., Protiva Agricultural Development Company Inc. and Monsanto Canada Inc. dated January 12, 2014 (incorporated herein by reference to Exhibit 10.33 to the Registrant’s Annual Report on Form 10-K for the year ended December 31, 2013 filed with the SEC on March 28, 2014).
|
|
|
10.34†*
|
License and Services Agreement by and among Protiva Biotherapeutics Inc., Protiva Agricultural Development Company Inc. and Tekmira Pharmaceuticals Corporation dated January 12, 2014 (incorporated herein by reference to Exhibit 10.34 to the Registrant’s Annual Report on Form 10-K for the year ended December 31, 2013 filed with the SEC on March 28, 2014).
|
|
|
10.35*
|
Forms of Lock-Up Agreement (incorporated herein by reference to Exhibit 2.1 to the Registrant’s Current Report on Form 8-K/A filed with the SEC on January 26, 2015).
|
|
|
10.36*
|
Form of Registration Rights Agreement (incorporated herein by reference to Exhibit 2.1 to the Registrant’s Current Report on Form 8-K/A filed with the SEC on January 26, 2015).
|
|
|
10.37*
|
Form of Standstill Agreement (incorporated herein by reference to Exhibit 2.1 to the Registrant’s Current Report on Form 8-K/A filed with the SEC on January 26, 2015).
|
|
|
10.38*
|
Form of Representation Letter (incorporated herein by reference to Exhibit 2.1 to the Registrant’s Current Report on Form 8-K/A filed with the SEC on January 26, 2015).
|
|
90
|
10.39**#
|
Executive Employment Agreement with Michael Abrams, dated November 14, 2013
|
|
|
10.40**#
|
Executive Employment Agreement with Kirk Rosemark, dated December 8, 2014
|
|
|
10.41**††
|
License Agreement, between Tekmira Pharmaceuticals and Protiva Biotherapeutics and Dicerna Pharmaceuticals dated November 16, 2014
|
|
|
10.42**††
|
Manufacturing and Clinical Trial Agreement between Tekmira Pharmaceuticals and Protiva Biotherapeutics and the Chancellor Masters and Scholars of the University of Oxford, dated December 18, 2014
|
|
|
10.43**
|
Modification Contract P0001, dated July 19, 2010, to Award Contract, dated July 14, 2010 (Exhibit 10.16)
|
|
|
10.44**
|
Modification Contract P0002, dated April 15, 2011, to Award Contract, dated July 14, 2010 (Exhibit 10.16)
|
|
|
10.45**
|
Modification Contract P0003, dated June 13, 2011, to Award Contract, dated July 14, 2010 (Exhibit 10.16)
|
|
|
10.46**††
|
Modification Contract P0004, dated October 3, 2011, to Award Contract, dated July 14, 2010 (Exhibit 10.16)
|
|
|
10.47**
|
Modification Contract P0005, dated December 2, 2011, to Award Contract, dated July 14, 2010 (Exhibit 10.16)
|
|
|
10.48**
|
Modification Contract P0006, dated January 25, 2012, to Award Contract, dated July 14, 2010 (Exhibit 10.16)
|
|
|
10.49**††
|
Modification Contract P0007, dated March 5, 2012, to Award Contract, dated July 14, 2010 (Exhibit 10.16)
|
|
|
10.50**
|
Modification Contract P0008, dated April 23, 2012, to Award Contract, dated July 14, 2010 (Exhibit 10.16)
|
|
|
10.51**
|
Modification Contract P0009, dated June 29, 2012, to Award Contract, dated July 14, 2010 (Exhibit 10.16)
|
|
|
10.52**
|
Modification Contract P00010, dated July 16, 2012, to Award Contract, dated July 14, 2010 (Exhibit 10.16)
|
|
|
10.53**
|
Modification Contract P00011, dated July 25, 2012, to Award Contract, dated July 14, 2010 (Exhibit 10.16)
|
|
|
10.54**††
|
Modification Contract P00012, dated August 2, 2012, to Award Contract, dated July 14, 2010 (Exhibit 10.16)
|
|
|
10.55**
|
Modification Contract P00013, dated August 27, 2012, to Award Contract, dated July 14, 2010 (Exhibit 10.16)
|
|
|
10.56 **
|
Modification Contract P00014, dated August 31, 2012, to Award Contract, dated July 14, 2010 (Exhibit 10.16)
|
|
|
10.57**
|
Modification Contract P00015, dated October 1, 2012, to Award Contract, dated July 14, 2010 (Exhibit 10.16)
|
|
|
10.58**
|
Modification Contract P00016, dated October 2, 2012, to Award Contract, dated July 14, 2010 (Exhibit 10.16)
|
|
|
10.59**
|
Modification Contract P00017, dated October 19, 2012, to Award Contract, dated July 14, 2010 (Exhibit 10.16)
|
|
|
10.60**
|
Modification Contract P00018, dated December 31, 2012, to Award Contract, dated July 14, 2010 (Exhibit 10.16)
|
|
|
10.61**
|
Modification Contract P00019, dated January 23, 2013, to Award Contract, dated July 14, 2010 (Exhibit 10.16)
|
|
|
10.62 **
|
Modification Contract P00020, dated February 19, 2013, to Award Contract, dated July 14, 2010 (Exhibit 10.16)
|
|
|
10.63 **
|
Modification Contract P00021, dated March 29, 2013, to Award Contract, dated July 14, 2010 (Exhibit 10.16)
|
|
| 10.64**†† | Modification Contract P00022, dated April 30, 2013, to Award Contract, dated July 14, 2010 (Exhibit 10.16) | |
|
10.65**††
|
Modification Contract P00023, dated May 21, 2013, to Award Contract, dated July 14, 2010 (Exhibit 10.16)
|
|
|
10.66 **
|
Modification Contract P00024, dated June 19, 2013, to Award Contract, dated July 14, 2010 (Exhibit 10.16)
|
|
|
10.67**††
|
Modification Contract P00025, dated April 22, 2014, to Award Contract, dated July 14, 2010 (Exhibit 10.16)
|
|
|
10.68**††
|
Modification Contract P00026, dated July 25, 2014, to Award Contract, dated July 14, 2010 (Exhibit 10.16)
|
|
91
|
10.69**
|
Modification Contract P00027, dated July 25, 2014, to Award Contract, dated July 14, 2010 (Exhibit 10.16)
|
|
|
10.70 **††
|
Modification Contract P00028, dated September 5, 2014, to Award Contract, dated July 14, 2010 (Exhibit 10.16)
|
|
|
10.71 **
|
Modification Contract P00029, dated September 30, 2014, to Award Contract, dated July 14, 2010 (Exhibit 10.16)
|
|
|
10.72**††
|
Modification Contract P00030, dated October 31, 2014, to Award Contract, dated July 14, 2010 (Exhibit 10.16)
|
|
|
10.73**
|
Modification Contract P00031, dated November 17, 2014, to Award Contract, dated July 14, 2010 (Exhibit 10.16)
|
|
|
10.74**††
|
Modification Contract P00032, dated March 4, 2015, to Award Contract, dated July 14, 2010 (Exhibit 10.16)
|
|
|
10.75**††
|
Modification Contract P00033, dated March 4, 2015, to Award Contract, dated July 14, 2010 (Exhibit 10.16)
|
|
|
10.76**
|
Underwriting Agreement for 3,750,000 Common Shares with Stifel, Nicolaus & Company, dated October 17, 2013
|
|
|
10.77**
|
Underwriting Agreement for 2,125,000 Common Shares with Leerink Partners LLC, dated March 14, 2014
|
|
|
21.1**
|
List of Subsidiaries
|
|
|
23.1**
|
Consent of KPMG LLP, an Independent Registered Public Accounting Firm
|
|
|
31.1**
|
Certification of Chief Executive Officer pursuant to Rule 13a-14 or 15d-14 of the Securities Exchange Act of 1934, as adopted pursuant to Section 302 of the Sarbanes-Oxley Act of 2002
|
|
|
31.2**
|
Certification of Chief Financial Officer pursuant to Rule 13a-14 or 15d-14 of the Securities Exchange Act of 1934, as adopted pursuant to Section 302 of the Sarbanes-Oxley Act of 2002
|
|
|
32.1**
|
Certification of Chief Executive Officer pursuant to 18 U.S.C. Section 1350, as adopted pursuant to Section 906 of the Sarbanes-Oxley Act of 2002.
|
|
|
32.2**
|
Certification of Chief Financial Officer pursuant to 18 U.S.C. Section 1350, as adopted pursuant to Section 906 of the Sarbanes-Oxley Act of 2002.
|
|
|
101.INS**
|
XBRL Instance Document
|
|
|
101.SCH**
|
XBRL Taxonomy Extension Schema Document
|
|
|
101.CAL**
|
XBRL Taxonomy Extension Calculation Linkbase Document
|
|
|
101.DEF**
|
XBRL Taxonomy Extension Definition Linkbase Document
|
|
|
101.LAB**
|
XBRL Taxonomy Extension Label Linkbase Document
|
|
|
101.PRE**
|
XBRL Taxonomy Extension Presentation Linkbase Document
|
________________
|
*
**
|
Previously filed
Filed herewith
|
|
†
|
Confidential treatment granted as to portions of this exhibit.
|
|
††
#
|
Confidential treatment has been requested as to portions of this exhibit.
Management Contract
|
92
TABLE OF CONTENTS
Part IItem 1. BusinessItem 1A. Risk FactorsItem 1B. Unresolved Staff CommentsItem 2. PropertiesItem 3. Legal ProceedingsItem 4. Mine Safety DisclosuresPart IIItem 5. Market For Registrant S Common Equity, Related Stockholder Matters and Issuer Purchases Of Equity SecuritiesItem 6. Selected Consolidated Financial DataItem 7. Management S Discussion and Analysis Of Financial Condition and Results Of OperationsItem 7A. Quantitative and Qualitative Disclosures About Market RiskItem 8. Financial Statements and Supplementary DataItem 9. Changes in and Disagreements with Accountants on Accounting and Financial DisclosureItem 9A. Controls and ProceduresItem 9B. Other InformationPart IIIItem 10. Directors, Executive Officers and Corporate GovernanceItem 11. Executive CompensationItem 12. Security Ownership Of Certain Beneficial Owners and Management and Related Stockholder MattersItem 13. Certain Relationships and Related Transactions, and Director IndependenceItem 14. Principal Accountant Fees and ServicesPart IVItem 15. Exhibits and Financial Statement Schedules