ARBUTUS BIOPHARMA CORP
10-Ks,20-Fs and 10-Qs
|
|
|
|
|
|
|
|
|
|
|
|
|
|
|
|
|
|
|
|
|
|
|
|
|
|
|
|
|
|
|
|
|
|
|
|
|
|
|
|
|
|
|
|
|
|
|
UNITED STATES
SECURITIES AND EXCHANGE COMMISSION
Washington, D.C. 20549
FORM 10-Q
[X] QUARTERLY REPORT PURSUANT TO SECTION 13 OR 15(d) OF THE SECURITIES EXCHANGE ACT OF 1934
For the quarterly period ended
March 31, 2018
OR
[ ] TRANSITION REPORT PURSUANT TO SECTION 13 OR 15(d) OF THE SECURITIES EXCHANGE ACT OF 1934
For the Transition Period from to
Commission File Number:
001-34949
ARBUTUS BIOPHARMA CORPORATION
(Exact Name of Registrant as Specified in Its Charter)
|
British Columbia, Canada
|
98-0597776
|
|
|
(State or Other Jurisdiction of
|
(I.R.S. Employer
|
|
|
Incorporation or Organization)
|
Identification No.)
|
|
100-8900 Glenlyon Parkway, Burnaby, BC, Canada V5J 5J8
(Address of Principal Executive Offices)
604-419-3200
(Registrant’s Telephone Number, Including Area Code)
Indicate by check mark whether the registrant (1) has filed all reports required to be filed by Section 13 or 15(d) of the Securities Exchange Act of 1934 during the preceding 12 months (or for such shorter period that the registrant was required to file such reports), and (2) has been subject to such filing requirements for the past 90 days.
Yes [X] No [ ]
Indicate by check mark whether the registrant has submitted electronically and posted on its corporate Web site, if any, every Interactive Data File required to be submitted and posted pursuant to Rule 405 of Regulation S-T during the preceding 12 months (or for such shorter period that the registrant was required to submit and post such files).
Yes [X] No [ ]
Indicate by check mark whether the registrant is a large accelerated filer, an accelerated filer, a non-accelerated filer, or a smaller reporting company. See the definitions of “large accelerated filer,” “accelerated filer” and “smaller reporting company” in Rule 12b-2 of the Exchange Act. (Check one):
|
Large accelerated filer [ ]
|
Accelerated filer [X]
|
Non-accelerated filer [ ]
|
Smaller reporting company [ ]
|
Emerging growth company [ ]
|
|
|
|
(Do not check if a smaller reporting company)
|
|
|
If an emerging growth company, indicate by check mark if the registrant has elected not to use the extended transition period for complying with any new or revised financial accounting standards provided pursuant to Section 13(a) of the Exchange Act.
1
[ ]
Indicate by check mark whether the registrant is a shell company (as defined in Rule 12b-2 of the Exchange Act).
Yes [ ] No [X]
As of
April 30, 2018
, the registrant had 55,167,997 common shares, no par value, outstanding. In addition, the Company had 6,768,966 stock options outstanding and 1,164,000 Series A participating convertible preferred shares (the “Preferred Shares”), outstanding, which will be subject to mandatory conversion into 22,589,601 common shares on October 16, 2021 (subject to limited exceptions in the event of certain fundamental corporate transactions relating to Arbutus’ capital structure or assets, which would permit earlier conversion at Roivant’s option). Assuming the stock options were exercised and preferred shares were converted as of April 30, 2018, the Company would have had 78,836,494 common shares outstanding at April 30, 2018.
2
ARBUTUS BIOPHARMA CORP.
TABLE OF CONTENTS
|
Page
|
||
|
|
|
|
|
|
||
3
4
ARBUTUS BIOPHARMA CORPORATION
(Unaudited)
(Expressed in thousands of U.S. dollars, except share and per share amounts)
(Prepared in accordance with US GAAP)
|
|
March 31,
|
December 31,
|
|||||
|
|
2018
|
2017
|
|||||
|
Assets
|
|
|
|||||
|
Current assets:
|
|
|
|||||
|
Cash and cash equivalents
|
$
|
12,461
|
|
$
|
54,292
|
|
|
|
Short-term investments (note 2)
|
160,079
|
|
72,060
|
|
|||
|
Accounts receivable
|
719
|
|
402
|
|
|||
|
Accrued revenue
|
128
|
|
128
|
|
|||
|
Investment tax credits receivable
|
342
|
|
340
|
|
|||
|
Prepaid expenses and other assets
|
1,457
|
|
2,144
|
|
|||
|
Total current assets
|
175,186
|
|
129,366
|
|
|||
|
Restricted cash (note 2)
|
—
|
|
12,601
|
|
|||
|
Property and equipment
|
25,080
|
|
24,854
|
|
|||
|
Less accumulated depreciation
|
(13,251
|
)
|
(12,671
|
)
|
|||
|
Property and equipment, net of accumulated depreciation
|
11,829
|
|
12,183
|
|
|||
|
Intangible assets (note 3)
|
58,647
|
|
58,647
|
|
|||
|
Goodwill (note 3)
|
24,364
|
|
24,364
|
|
|||
|
Total assets
|
$
|
270,026
|
|
$
|
237,161
|
|
|
|
Liabilities and stockholders' equity
|
|
|
|||||
|
Current liabilities:
|
|
|
|||||
|
Accounts payable and accrued liabilities (note 6)
|
$
|
6,459
|
|
$
|
10,646
|
|
|
|
Deferred revenue (note 4)
|
1,720
|
|
2,742
|
|
|||
|
Liability-classified options (note 2)
|
1,188
|
|
1,239
|
|
|||
|
Site consolidation accrual (note 8)
|
1,029
|
|
—
|
|
|||
|
Total current liabilities
|
10,396
|
|
14,627
|
|
|||
|
Deferred lease incentives, net of current portion
|
693
|
|
693
|
|
|||
|
Loan payable (note 7)
|
—
|
|
12,001
|
|
|||
|
Contingent consideration (notes 2 and 9)
|
9,576
|
|
10,424
|
|
|||
|
Deferred tax liability
|
16,943
|
|
16,943
|
|
|||
|
Total liabilities
|
37,608
|
|
54,688
|
|
|||
|
Stockholders’ equity:
|
|
|
|||||
|
Preferred shares (note 5)
|
|||||||
|
Authorized - 1,164,000 with no par value
|
|||||||
|
Issued and outstanding: 1,164,000 (December 31, 2017 - 500,000)
|
118,381
|
|
49,780
|
|
|||
|
Common shares
|
|
|
|
|
|||
|
Authorized - unlimited number with no par value
|
|
|
|
|
|||
|
Issued and outstanding: 55,087,191
(December 31, 2017 - 55,060,662)
|
876,288
|
|
876,108
|
|
|||
|
Additional paid-in capital
|
43,769
|
|
42,840
|
|
|||
|
Deficit
|
(757,835
|
)
|
(738,070
|
)
|
|||
|
Accumulated other comprehensive loss
|
(48,185
|
)
|
(48,185
|
)
|
|||
|
Total stockholders' equity
|
232,418
|
|
182,473
|
|
|||
|
Total liabilities and stockholders' equity
|
$
|
270,026
|
|
$
|
237,161
|
|
|
Nature of business and future operations (note 1)
Contingencies and commitments (note 9)
Subsequent events (note 11)
See accompanying notes to the condensed consolidated financial statements.
F- 1
ARBUTUS BIOPHARMA CORPORATION
(Unaudited)
(Expressed in thousands of U.S. dollars, except share and per share amounts)
(Prepared in accordance with US GAAP)
|
Three months ended
|
|||||||
|
March 31,
|
|||||||
|
2018
|
|
2017
|
|
||||
|
Revenue (note 4)
|
$
|
1,436
|
|
$
|
235
|
|
|
|
Expenses
|
|
|
|||||
|
Research, development, collaborations and contracts
|
13,949
|
|
13,872
|
|
|||
|
General and administrative
|
3,669
|
|
4,328
|
|
|||
|
Depreciation of property and equipment
|
602
|
|
334
|
|
|||
|
Site consolidation (note 8)
|
1,621
|
|
—
|
|
|||
|
Total expenses
|
19,841
|
|
18,534
|
|
|||
|
Loss from operations
|
(18,405
|
)
|
(18,299
|
)
|
|||
|
Other income (losses)
|
|
|
|||||
|
Interest income
|
758
|
|
368
|
|
|||
|
Interest expense
|
(104
|
)
|
(42
|
)
|
|||
|
Foreign exchange gain (loss)
|
(526
|
)
|
427
|
|
|||
|
Decrease (increase) in fair value of warrant liability (note 2)
|
—
|
|
(22
|
)
|
|||
|
Decrease (increase) in fair value of contingent consideration (note 9)
|
848
|
|
(1,059
|
)
|
|||
|
Total other income (losses)
|
976
|
|
(328
|
)
|
|||
|
Net loss
|
$
|
(17,429
|
)
|
$
|
(18,627
|
)
|
|
|
Items applicable to preferred shares
|
|||||||
|
Accrual of coupon on convertible preferred shares
|
(2,336
|
)
|
—
|
|
|||
|
Net loss attributable to common shares
|
$
|
(19,765
|
)
|
$
|
(18,627
|
)
|
|
|
Net loss attributable to common shareholders, per share
|
|
|
|||||
|
Basic and diluted
|
$
|
(0.36
|
)
|
$
|
(0.34
|
)
|
|
|
Weighted average number of common shares
|
|
|
|||||
|
Basic and diluted
|
55,071,964
|
|
54,307,464
|
|
|||
See accompanying notes to the condensed consolidated financial statements.
F- 2
ARBUTUS BIOPHARMA CORPORATION
Condensed Consolidated Statement of Stockholders’ Equity
(Unaudited)
(Expressed in thousands of U.S. dollars, except share and per share amounts)
(Prepared in accordance with US GAAP)
|
Convertible Preferred Shares
|
Common Shares
|
|||||||||||||||||||||||||||
|
|
Number
of shares
|
Share
capital
|
Number
of shares |
Share
capital |
Additional paid-in
capital |
Deficit
|
Accumulated other comprehensive
loss |
Total
stockholders' equity |
||||||||||||||||||||
|
December 31, 2017
|
500,000
|
|
$
|
49,780
|
|
55,060,650
|
|
$
|
876,108
|
|
$
|
42,840
|
|
$
|
(738,070
|
)
|
$
|
(48,185
|
)
|
$
|
182,473
|
|
||||||
|
Issuance of Preferred Shares, net of issuance cost of $135
|
664,000
|
|
66,265
|
|
66,265
|
|
||||||||||||||||||||||
|
Accrual of coupon on Preferred Shares (note 5)
|
2,336
|
|
(2,336
|
)
|
—
|
|
||||||||||||||||||||||
|
Stock-based compensation
|
|
|
|
|
|
|
|
|
1,510
|
|
|
|
|
|
1,510
|
|
||||||||||||
|
Certain fair value adjustments to liability stock option awards
|
|
|
|
|
|
|
|
|
(504
|
)
|
|
|
|
|
(504
|
)
|
||||||||||||
|
Issuance of common shares
pursuant to exercise of options |
|
|
|
|
26,541
|
|
180
|
|
(77
|
)
|
|
|
|
|
103
|
|
||||||||||||
|
Net loss
|
|
|
|
|
|
|
|
|
|
|
(17,429
|
)
|
|
|
(17,429
|
)
|
||||||||||||
|
Balance, March 31, 2018
|
1,164,000
|
|
$
|
118,381
|
|
55,087,191
|
|
$
|
876,288
|
|
$
|
43,769
|
|
$
|
(757,835
|
)
|
$
|
(48,185
|
)
|
$
|
232,418
|
|
||||||
See accompanying notes to the condensed consolidated financial statements.
F- 3
ARBUTUS BIOPHARMA CORPORATION
(Unaudited)
(Expressed in thousands of U.S. dollars)
(Prepared in accordance with US GAAP)
|
|
Three months ended
|
||||||
|
|
March 31,
|
||||||
|
|
2018
|
2017
|
|||||
|
OPERATING ACTIVITIES
|
|
|
|||||
|
Net loss for the period
|
$
|
(17,429
|
)
|
$
|
(18,627
|
)
|
|
|
Items not involving cash:
|
|
|
|||||
|
Depreciation of property and equipment
|
602
|
|
334
|
|
|||
|
Stock-based compensation - research, development, collaborations and contract expenses
|
783
|
|
2,622
|
|
|||
|
Stock-based compensation - general and administrative
expenses |
172
|
|
1,881
|
|
|||
|
Unrealized foreign exchange (gains) losses
|
565
|
|
(425
|
)
|
|||
|
Change in fair value of warrant liability
|
—
|
|
22
|
|
|||
|
Change in fair value of contingent consideration
|
(848
|
)
|
1,059
|
|
|||
|
Net change in non-cash operating items:
|
|
|
|||||
|
Accounts receivable
|
(317
|
)
|
(7,605
|
)
|
|||
|
Investment tax credits receivable
|
(2
|
)
|
(15
|
)
|
|||
|
Prepaid expenses and other assets
|
687
|
|
(264
|
)
|
|||
|
Accounts payable and accrued liabilities
|
(4,187
|
)
|
(3,909
|
)
|
|||
|
Deferred revenue
|
(1,022
|
)
|
7,392
|
|
|||
|
Site consolidation accrual
|
1,029
|
|
—
|
|
|||
|
Net cash used in operating activities
|
(19,967
|
)
|
(17,535
|
)
|
|||
|
INVESTING ACTIVITIES
|
|
|
|||||
|
Disposition (acquisition) of short and long-term investments, net
|
(75,418
|
)
|
26,618
|
|
|||
|
Acquisition of property and equipment
|
(248
|
)
|
(3,423
|
)
|
|||
|
Net cash provided by (used) in investing activities
|
(75,666
|
)
|
23,195
|
|
|||
|
FINANCING ACTIVITIES
|
|
|
|||||
|
Promissory note repayment (note 7)
|
(12,001
|
)
|
—
|
|
|||
|
Proceeds from sale of Series A Preferred Shares, net of issuance costs
|
66,265
|
|
—
|
|
|||
|
Issuance of common shares pursuant to exercise of options
|
103
|
|
1
|
|
|||
|
Issuance of common shares pursuant to exercise of warrants
|
—
|
|
353
|
|
|||
|
Net cash provided by financing activities
|
54,367
|
|
354
|
|
|||
|
Effect of foreign exchange rate changes on cash and cash equivalents
|
(565
|
)
|
424
|
|
|||
|
(Decrease) Increase in cash and cash equivalents
|
(41,831
|
)
|
6,438
|
|
|||
|
Cash and cash equivalents, beginning of period
|
54,292
|
|
23,413
|
|
|||
|
Cash and cash equivalents, end of period
|
$
|
12,461
|
|
$
|
29,851
|
|
|
|
Supplemental cash flow information
|
|
|
|||||
|
Non-cash transactions:
|
|
|
|||||
|
Acquired property and equipment in trade payables
|
—
|
|
1,427
|
|
|||
See accompanying notes to the condensed consolidated financial statements.
F- 4
ARBUTUS BIOPHARMA CORPORATION
Notes to Condensed Consolidated Financial Statements
(Tabular amounts in thousands of US Dollars, except share and per share amounts)
1.
Nature of business and future operations
Arbutus Biopharma Corporation (the “Company” or “Arbutus”) is a biopharmaceutical business dedicated to discovering, developing, and commercializing a cure for patients suffering from chronic hepatitis B infection, a disease of the liver caused by the hepatitis B virus (“HBV”). To pursue its strategy of developing a curative combination regimen, the Company has assembled a pipeline of multiple drug candidates with differing and complementary mechanisms of action targeting HBV.
The success of the Company is dependent on obtaining the necessary regulatory approvals to bring its products to market and achieve profitable operations. The continuation of the research and development activities and the commercialization of its products are dependent on the Company’s ability to successfully complete these activities and to obtain adequate financing through a combination of financing activities and operations. It is not possible to predict either the outcome of future research and development programs or the Company’s ability to continue to fund these programs in the future.
2.
Significant accounting policies
Basis of presentation
These unaudited condensed consolidated financial statements have been prepared in accordance with generally accepted accounting principles of the United States of America (“U.S. GAAP”) for interim financial statements and accordingly, do not include all disclosures required for annual financial statements. These statements should be read in conjunction with the Company’s audited consolidated financial statements and notes thereto for the year ended
December 31, 2017
and included in the Company’s Annual Report on Form 10-K for the year ended
December 31, 2017
. The unaudited condensed consolidated financial statements reflect, in the opinion of management, all adjustments and reclassifications necessary to present fairly the financial position, results of operations and cash flows at
March 31, 2018
and for all periods presented. The results of operations for the three months ended
March 31, 2018
and
March 31, 2017
are not necessarily indicative of the results for the full year. These unaudited condensed consolidated financial statements follow the same significant accounting policies as those described in the notes to the audited consolidated financial statements of the Company for the year ended
December 31, 2017
, except as described below.
Principles of Consolidation
These unaudited condensed consolidated financial statements include the accounts of the Company and its
two
wholly-owned subsidiaries, Arbutus Biopharma Inc. ("Arbutus Inc.") and Protiva Biotherapeutics Inc. ("Protiva"). On January 1, 2018, Protiva was amalgamated with Arbutus Biopharma Corporation. All intercompany transactions and balances have been eliminated on consolidation.
Income or loss per share
The Company follows the two-class method when computing net loss attributable to common shareholders per share as the Company has issued Preferred Shares (note 5) that meet the definition of participating securities. The Preferred Shares entitle the holders to participate in dividends but do not require the holders to participate in losses of the Company. Accordingly, if the Company reports a net loss attributable to common shareholders net losses are not allocated to Preferred Shareholders.
F- 5
Income or loss per share is calculated based on the weighted average number of common shares outstanding. Diluted loss per share does not differ from basic loss per share since the effect of the Company’s stock options, liability-classified stock option awards, and warrants are anti-dilutive. During the three months ended
March 31, 2018
, potential common shares of
22,095,109
, consisting of the as-if converted number of Class A Preferred shares and stock options, (
March 31, 2017
–
5,961,443
) were excluded from the calculation of loss per common share because their inclusion would be anti-dilutive.
The following table sets out the computation of basic and diluted net loss attributable to common shareholders per share:
|
|
For the period ended March 31,
|
|||||||||
|
|
2018
|
2017
|
||||||||
|
Numerator:
|
Common Shares
|
Preferred Shares
|
Common Shares
|
|||||||
|
Allocation of distributable earnings
|
$
|
—
|
|
$
|
2,336
|
|
$
|
—
|
|
|
|
Allocation of undistributed earnings (loss)
|
(19,765
|
)
|
—
|
|
(18,627
|
)
|
||||
|
Allocation of earnings (loss) attributed to shareholders
|
$
|
(19,765
|
)
|
$
|
2,336
|
|
$
|
(18,627
|
)
|
|
|
Denominator:
|
|
|
|
|
||||||
|
Weighted average number of shares - basic and diluted
|
55,071,964
|
|
1,075,467
|
|
54,307,464
|
|
||||
|
Basic and diluted net loss attributable to shareholders per share
|
$
|
(0.36
|
)
|
$
|
2.17
|
|
$
|
(0.34
|
)
|
|
Fair value of financial instruments
The Company measures certain financial instruments and other items at fair value.
To determine the fair value, the Company uses the fair value hierarchy for inputs used in measuring fair value that maximizes the use of observable inputs and minimizes the use of unobservable inputs by requiring that the most observable inputs be used when available. Observable inputs are inputs market participants would use to value an asset or liability and are developed based on market data obtained from independent sources. Unobservable inputs are inputs based on assumptions about the factors market participants would use to value an asset or liability. The three levels of inputs that may be used to measure fair value are as follows:
|
•
|
Level 1 inputs are quoted market prices for identical instruments available in active markets.
|
|
•
|
Level 2 inputs are inputs other than quoted prices included within Level 1 that are observable for the asset or liability either directly or indirectly. If the asset or liability has a contractual term, the input must be observable for substantially the full term. An example includes quoted market prices for similar assets or liabilities in active markets.
|
|
•
|
Level 3 inputs are unobservable inputs for the asset or liability and will reflect management’s assumptions about market assumptions that would be used to price the asset or liability.
|
The following table presents information about the Company’s assets and liabilities that are measured at fair value on a recurring basis, and indicates the fair value hierarchy of the valuation techniques used to determine such fair value:
F- 6
|
|
Level 1
|
|
Level 2
|
|
Level 3
|
|
March 31, 2018
|
|
||||||
|
Assets
|
|
|
|
|
||||||||||
|
Cash and cash equivalents
|
$
|
12,461
|
|
—
|
|
—
|
|
$
|
12,461
|
|
||||
|
Short-term investments
|
160,079
|
|
—
|
|
—
|
|
160,079
|
|
||||||
|
Long-term investment
|
—
|
|
—
|
|
—
|
|
—
|
|
||||||
|
Total
|
$
|
172,540
|
|
—
|
|
—
|
|
$
|
172,540
|
|
||||
|
Liabilities
|
|
|
|
|
||||||||||
|
Liability-classified options
|
—
|
|
—
|
|
$
|
1,188
|
|
$
|
1,188
|
|
||||
|
Contingent consideration
|
—
|
|
—
|
|
9,576
|
|
9,576
|
|
||||||
|
Site consolidation accrual
|
1,029
|
|
1,029
|
|
||||||||||
|
Total
|
—
|
|
—
|
|
$
|
11,793
|
|
$
|
11,793
|
|
||||
|
|
Level 1
|
|
Level 2
|
|
Level 3
|
|
December 31, 2017
|
|
||||||
|
Assets
|
|
|
|
|
||||||||||
|
Cash and cash equivalents
|
$
|
54,292
|
|
—
|
|
—
|
|
$
|
54,292
|
|
||||
|
Short-term investments
|
72,060
|
|
—
|
|
—
|
|
72,060
|
|
||||||
|
Restricted cash
|
12,601
|
|
—
|
|
—
|
|
12,601
|
|
||||||
|
Total
|
$
|
138,953
|
|
—
|
|
—
|
|
$
|
138,953
|
|
||||
|
Liabilities
|
|
|
|
|
||||||||||
|
Liability-classified options
|
$
|
1,239
|
|
$
|
1,239
|
|
||||||||
|
Contingent consideration
|
—
|
|
—
|
|
10,424
|
|
10,424
|
|
||||||
|
Total
|
—
|
|
—
|
|
$
|
11,663
|
|
$
|
11,663
|
|
||||
The following table presents the changes in fair value of the Company’s liability-classified stock option awards:
|
|
Liability at beginning of the period
|
Fair value of liability-classified options exercised in the period
|
Increase (decrease) in fair
value of liability
|
Liability at end
of the period
|
|||||||||||
|
Three months ended March 31, 2017
|
$
|
553
|
|
$
|
—
|
|
$
|
266
|
|
$
|
819
|
|
|||
|
Three months ended March 31, 2018
|
$
|
1,239
|
|
$
|
—
|
|
$
|
(51
|
)
|
$
|
1,188
|
|
|||
The following table presents the changes in fair value of the Company’s contingent consideration:
|
|
Liability at beginning of the period
|
Increase in fair value of Contingent Consideration
|
Liability at end of the period
|
||||||||
|
Three months ended March 31, 2017
|
$
|
9,065
|
|
$
|
1,059
|
|
$
|
10,124
|
|
||
|
Three months ended March 31, 2018
|
$
|
10,424
|
|
$
|
(848
|
)
|
$
|
9,576
|
|
||
Site consolidation accrual
Site consolidation accrual includes one-time employee termination benefits, employee relocation costs, and site closure costs. The Company accounts for site consolidation expense in accordance with ASC 420,
Exit or Disposal Cost Obligations
. ASC 420 specifies that a liability for a cost associated with an exit or disposal activity be recognized when the liability is incurred,
F- 7
except for a liability where employees are required to render service until they are terminated in order to receive termination benefits and will be retained to render service beyond the minimum retention period. A liability for such one-time termination benefits shall be measured initially at the communication date based on the fair value of the liability as of the termination date and recognized ratably over the future service period. The fair value of these liabilities is based present value model using a credit-adjusted risk-free rate.
Recent accounting pronouncements
From time to time, new accounting pronouncements are issued by the Financial Accounting Standards Board (FASB) or other standard setting bodies that are adopted by the Company as of the specified effective date. Unless otherwise discussed, we believe that the impact of recently issued standards that are not yet effective will not have a material impact on our financial position or results of operations upon adoption.
The new revenue standard (Accounting Standards Codification “ASC" 606) became effective for the Company on January 1, 2018, and was adopted using the modified retrospective method under which previously presented financial statements are not restated and the cumulative effect of adopting the new revenue standard on contracts in process is recognized by an adjustment to retained earnings at the effective date. The adoption of the new revenue standard did not change the Company’s recognized revenue under its ongoing significant collaborative research and license agreements and no cumulative effect adjustment was required.
The new guidance in ASC 606 requires an entity to recognize the amount of revenue to which it expects to be entitled for the transfer of promised goods or services to customers under a five-step model: (1) identify contract(s) with a customer; (ii) identify the performance obligations in the contract; (iii) determine the transaction price; (iv) allocate the transaction price to the performance obligations in the contract; and (5) recognize revenue when or as a performance obligation is satisfied.
The Company generates revenue primarily through collaboration agreements. Such agreements may require the Company to deliver various rights and/or services, including intellectual property rights or licenses and research and development services. Under such collaboration agreements, the Company is generally eligible to receive non-refundable upfront payments, funding for research and development services, milestone payments, and royalties.
In contracts where the Company has more than one performance obligation to provide its customer with goods or services, each performance obligation is evaluated to determine whether it is distinct based on whether (i) the customer can benefit from the good or service either on its own or together with other resources that are readily available and (ii) the good or service is separately identifiable from other promises in the contract. The consideration under the contract is then allocated between the distinct performance obligations based on their respective relative stand-alone selling prices. The estimated stand-alone selling price of each deliverable reflects the Company’s best estimate of what the selling price would be if the deliverable was regularly sold on a stand-alone basis and is determined by reference to market rates for the good or service when sold to others or by using an adjusted market assessment approach if selling price on a stand-alone basis is not available.
The consideration allocated to each distinct performance obligation is recognized as revenue when control is transferred to the customer for the related goods or services. Consideration associated with at-risk substantive performance milestones, including sales-based milestones, is recognized as revenue when it is probable that a significant reversal of the cumulative revenue recognized will not occur. Sales-based royalties received in connection with licenses of intellectual property are subject to a specific exception in the revenue standards, whereby the consideration is not included in the transaction price and recognized in revenue until the customer’s subsequent sales or usages occur.
In February 2016, the FASB issued ASU 2016-02, Leases (Topic 842): Recognition and Measurement of Financial Assets and Financial Liabilities. The update supersedes Topic 840, Leases and requires the recognition of lease assets and lease liabilities by lessees for those leases classified as operating leases under previous GAAP. Topic 842 retains a distinction between finance leases and operating leases, with cash payments from operating leases classified within operating activities in the statement of cash flows. The amendments in this update are effective for fiscal years beginning after December 15, 2018 for public business entities, which for the Company means January 1, 2019. The Company does not plan to early adopt this update. The extent of the impact of this adoption has not yet been determined.
F- 8
In August 2016, the FASB issued ASU No. 2016-15, Statement of Cash Flows (Topic 230): Classification of Certain Cash Receipts and Cash Payments. The new standard clarifies certain aspects of the statement of cash flows, and aims to reduce diversity in practice regarding how certain transactions are classified in the statement of cash flows. This standard was effective January 1, 2018. The Company adopted ASU No. 2016-15 in the first quarter of 2018. The adoption of this guidance did not have a material impact on the Company's financial position and results of operations.
In October 2016 the FASB issued ASU No. 2016-16, Income Taxes (Topic 740): Intra-Entity Transfer of Assets Other Than Inventory. This new standard eliminates the deferral of the tax effects of intra-entity asset transfers other than inventory. As a result, the income tax consequences from the intra-entity transfer of an asset other than inventory and associated changes to deferred taxes will be recognized when the transfer occurs. The Company adopted ASU No. 2016-16 in the first quarter of 2018. The adoption of this guidance did not have a material impact on the Company's financial position and results of operations.
In November 2016, the FASB issued a new standard that clarifies how entities should present restricted cash in the statement of cash flows. Under the new standard, changes in total cash, inclusive of restricted cash, should be reflected in the statement of cash flows. As a result, transfers between cash and restricted cash will no longer be reflected as activity within the statement of cash flows. We adopted the new standard on January 1, 2018. The adoption of this standard did not have a material impact on our condensed consolidated statements of cash flows.
3.
Intangible assets and goodwill
All in-process research and development (IPR&D) acquired is currently classified as indefinite-lived and is not currently being amortized. IPR&D becomes definite-lived upon the completion or abandonment of the associated research and development efforts, and will be amortized from that time over an estimated useful life based on respective patent terms. The Company evaluates the recoverable amount of intangible assets on an annual basis and performs an annual evaluation of goodwill as of December 31 each year, unless there is an event or change in the business that could indicate impairment, in which case earlier testing is performed.
The following table summarizes the carrying values of the intangible assets as at
March 31, 2018
:
|
March 31, 2018
|
|
December 31, 2017
|
|
|||
|
IPR&D – Immune Modulators
|
$
|
—
|
|
$
|
—
|
|
|
IPR&D – Antigen Inhibitors
|
14,811
|
|
14,811
|
|
||
|
IPR&D – cccDNA Sterilizers
|
43,836
|
|
43,836
|
|
||
|
Total Intangible Assets
|
$
|
58,647
|
|
$
|
58,647
|
|
Impairment evaluation of goodwill
At
March 31, 2018
, the Company did not identify any new indicators of impairment.
No
impairment charge on intangible assets or goodwill was recorded for the period ended
March 31, 2018
(three months ended March 31, 2017 -
nil
).
4.
Collaborations, contracts and licensing agreements
The following table set forth revenue recognized under collaborations, contracts and licensing agreements, in thousands:
F- 9
|
|
Three months ended March 31,
|
||||||
|
|
2018
|
|
2017
|
|
|||
|
Alexion (a)
|
$
|
—
|
|
$
|
127
|
|
|
|
Gritstone (b)
|
1,150
|
|
—
|
|
|||
|
Other milestone and royalty payments (c)
|
286
|
|
108
|
|
|||
|
Total revenue
|
$
|
1,436
|
|
$
|
235
|
|
|
The following table sets forth deferred collaborations and contracts revenue:
|
|
March 31, 2018
|
|
December 31, 2017
|
|
|||
|
Gritstone (b)
|
$
|
1,705
|
|
$
|
2,727
|
|
|
|
DoD
|
15
|
|
15
|
|
|||
|
Deferred revenue, current portion
|
1,720
|
|
2,742
|
|
|||
|
Total deferred revenue
|
$
|
1,720
|
|
$
|
2,742
|
|
|
(a) License Agreement with Alexion Pharmaceuticals, Inc. ("Alexion")
On March 16, 2017, the Company signed a license agreement with Alexion that entitles Alexion to research, develop, manufacture, and commercialize products with the Company's lipid nanoparticle ("LNP") technology in their single orphan disease target. In consideration for the rights granted under the agreement, the Company received a
$7,500,000
non-refundable upfront cash payment, as well as payments for services provided. This upfront payment was amortized over the period of expected benefit.
On July 27, 2017, the Company received notice of termination from Alexion for the Company's LNP license agreement. The termination was driven by a strategic review of Alexion's business and research and development portfolio, which included a decision to discontinue development of mRNA therapeutics. The
$7,500,000
upfront payment received in March 2017 is non-refundable, and the Company recorded the remaining deferred revenue balance, as well as any revenue and costs related to closeout procedures in the statement of operations and comprehensive loss for the period ended September 30, 2017.
(b) License agreement with Gritstone
On October 16, 2017, the Company entered into a license agreement with Gritstone that entitles Gritstone to research, develop, manufacture and commercialize products with the Company’s LNP technology. The Company received an upfront payment in November 2017, and is eligible to receive future potential payments including research services, development and commercial milestone payments and royalty payments on future product sales.
The Company determined the promised goods and services under the Agreements included the rights and license granted, involvement in the joint steering committee, and other services provided, as determined under the research plan. The license and involvement in the joint steering committee have been determined by the Company to be distinct. Therefore, these promised goods and services are treated as one performance obligation and recognized as revenue over the performance period as the Company transfers the technical "know-how" for the customized formulations. As at January 1, 2018 and March 31, 2018 the Company had
$2,727,000
and
$1,705,000
of contract liabilities related to the upfront payment from this licensing agreement,
$1,022,000
was recognized as revenue during the three months ended March 31, 2018.
The Company has determined that other materials and services provided have standalone value. The relative fair values are estimated upon the execution of each activity and charged at rates comparable to market with embedded margins on each service activity.
F- 10
(c) Agreements with Spectrum Pharmaceuticals, Inc. (“Spectrum”)
On May 6, 2006, the Company signed a number of agreements with Talon Therapeutics, Inc. (“Talon”, formerly Hana Biosciences, Inc.) including the grant of worldwide licenses (the “Talon License Agreement”) for
three
of the Company’s chemotherapy products, Marqibo®, Alocrest
™
(Optisomal Vinorelbine) and Brakiva
™
(Optisomal Topotecan).
On August 9, 2012, the Company announced that Talon had received accelerated approval for Marqibo from the FDA for the treatment of adult patients with Philadelphia chromosome negative acute lymphoblastic leukemia in second or greater relapse or whose disease has progressed following two or more anti-leukemia therapies. Marqibo is a liposomal formulation of the chemotherapy drug vincristine. In the year ended December 31, 2012, the Company received a milestone of
$1,000,000
based on the FDA's approval of Marqibo and will receive royalty payments based on Marqibo's commercial sales. There are no further milestones related to Marqibo but the Company is eligible to receive total milestone payments of up to
$18,000,000
on Alocrest and Brakiva.
Talon was acquired by Spectrum in July 2013. The acquisition does not affect the terms of the license between Talon and the Company. On September 3, 2013, Spectrum announced that they had shipped the first commercial orders of Marqibo. For the three months ended
March 31, 2018
, the Company recorded
$22,000
in Marqibo royalty revenue (three months ended
March 31, 2017
-
$54,000
). For the three months ended
March 31, 2018
, the Company accrued
2.5%
in royalties due to TPC in respect of the Marqibo royalty earned by the Company – see note 9, contingencies and commitments.
5. Share capital
Series A participating convertible preferred shares ("Preferred Shares")
On October 2, 2017, the Company announced that it entered into a subscription agreement with Roivant for the sale of Preferred Shares to Roivant for gross proceeds of
$116,400,000
. The Preferred Shares are non-voting and are convertible into common shares at a conversion price of
$7.13
per share. The purchase price for the Preferred Shares plus an amount equal to
8.75%
per annum, compounded annually, will be subject to mandatory conversion into 22,589,601 common shares on October 16, 2021 (subject to limited exceptions in the event of certain fundamental corporate transactions relating to Arbutus’ capital structure or assets, which would permit earlier conversion at Roivant’s option). After conversion of the Preferred Shares into common shares, based on the number of common shares outstanding on October 2, 2017, Roivant would hold
49.90%
of the Company's common shares. Roivant has agreed to a
four
year lock-up period for this investment and its existing holdings in Arbutus. Roivant has also agreed to a
four
year standstill whereby Roivant will not acquire greater than
49.99%
of the Company's common shares or securities convertible into common shares.
The initial investment of
$50,000,000
closed on October 16, 2017, and the remaining amount of
$66,400,000
closed on January 12, 2018 following regulatory and shareholder approvals, as applicable, under Canadian securities law.
The Company records the Preferred Shares wholly as equity under ASC 480, with no bifurcation of conversion feature from the host contract, given that the Preferred Shares cannot be cash settled and the redemption features are within the Company's control, which include a fixed conversion ratio with predetermined timing and proceeds. The Company accrues for the
8.75%
per annum compounding coupon at each reporting period end date as an increase to preferred share capital, and an increase to deficit (see statement of stockholder's equity).
6. Accounts payable and accrued liabilities
Accounts payable and accrued liabilities are comprised of the following, in thousands:
F- 11
|
|
March 31, 2018
|
|
December 31, 2017
|
|
|||
|
Trade accounts payable
|
$
|
943
|
|
$
|
1,987
|
|
|
|
Research and development accruals
|
3,683
|
|
4,937
|
|
|||
|
Professional fee accruals
|
1,222
|
|
429
|
|
|||
|
Deferred lease inducements
|
97
|
|
42
|
|
|||
|
Payroll accruals
|
192
|
|
2,893
|
|
|||
|
Other accrued liabilities
|
322
|
|
358
|
|
|||
|
|
$
|
6,459
|
|
$
|
10,646
|
|
|
7. Loan payable
On December 27, 2016, the Company obtained a
three
-year loan of
$12,001,000
from Wells Fargo in the form of a promissory note for the purpose of financing its operations, including the expansion of laboratory facilities for its U.S. operations. The loan accrued interest daily. The variable component is the one-month London Interbank Offered Rate (LIBOR), and a margin of
1.25%
per annum. The carrying value of the loan is recorded at the principal plus any accrued interest not yet paid. The loan was due on December 27, 2019.
The loan was secured by the Company's cash of
$12,601,000
, and is restricted from use until the loan has been settled in full. The Company invested the restricted cash in a
two
-year fixed certificate of deposit with Wells Fargo (see note 2).
In March 2018, the Company repaid the loan and accrued interest in full, resulting in the release of
$12,601,000
from restricted cash to short-term investments on the Company's balance sheet for the period ended March 31, 2018.
8. Site consolidation
On February 8, 2018, the Company announced a site consolidation and organizational restructuring to align its HBV business in Warminster, PA, by reducing its global workforce by approximately
35%
and by closing its Burnaby facility. In March 2018, the Company began executing its site consolidation plan and began to incur related costs.
Included in the site consolidation plan is the payment of one-time employee termination benefits, employee relocation costs, and site closure costs, which is expected to be primarily paid in cash in the second quarter of 2018.
The Company accounts for site consolidation expense in accordance with ASC 420,
Exit or Disposal Cost Obligations
. ASC 420 specifies that a liability for a cost associated with an exit or disposal activity be recognized when the liability is incurred, except for a liability where employees are required to render service until they are terminated in order to receive termination benefits and will be retained to render service beyond the minimum retention period. A liability for such one-time termination benefits shall be measured initially at the communication date based on the fair value of the liability as of the termination date and recognized rateably over the future service period.
The Company estimates that the total expenses to complete the site consolidation will be approximately
$5,000,000
.
The following table shows expenses recorded in the three months ended March 31, 2018 and the liability as at March 31, 2018.
F- 12
|
Description of expense
|
Three months ended March 31, 2018
|
|
|
Employee severance
|
1,381
|
|
|
Employee relocation
|
240
|
|
|
Lease and facility
|
—
|
|
|
Total site consolidation
|
1,621
|
|
|
Paid up to March 31, 2018
|
592
|
|
|
Accrual at March 31, 2018
|
1,029
|
|
9. Contingencies and commitments
Product development partnership with the Canadian Government
The Company entered into a Technology Partnerships Canada ("TPC") agreement with the Canadian Federal Government on November 12, 1999. Under this agreement, TPC agreed to fund
27%
of the costs incurred by the Company, prior to March 31, 2004, in the development of certain oligonucleotide product candidates up to a maximum contribution from TPC of
$7,179,000
(
C$9,256,000
). As at
March 31, 2018
, a cumulative contribution of
$2,871,000
(
C$3,702,000
) had been received and the Company does not expect any further funding under this agreement. In return for the funding provided by TPC, the Company agreed to pay royalties on the share of future licensing and product revenue, if any, that are received by the Company on certain non-siRNA oligonucleotide product candidates covered by the funding under the agreement. These royalties are payable until a certain cumulative payment amount is achieved or until a pre-specified date. In addition, until a cumulative amount equal to the funding actually received under the agreement has been paid to TPC, the Company agreed to pay
2.5%
royalties on any royalties the Company receives for Marqibo. For the three months ended
March 31, 2018
, the Company earned royalties on Marqibo sales in the amount of
$22,000
(
March 31, 2017
–
$54,000
) (see note 4(c)), resulting in
$1,000
being recorded by the Company as royalty payable to TPC (
March 31, 2017
-
$1,000
). The cumulative amount paid or accrued up to
March 31, 2018
was
$23,000
, therefore the remaining contingent amount due to TPC is
$2,849,000
(
C$3,673,000
).
Arbitration with the University of British Columbia (“UBC”)
Certain early work on lipid nanoparticle delivery systems and related inventions was undertaken at the Company and assigned to the University of British Columbia (UBC). These inventions are licensed to the Company by UBC under a license agreement, initially entered in 1998 as amended in 2001, 2006 and 2007. The Company has granted sublicenses under the UBC license to Alnylam. Alnylam has in turn sublicensed back to the Company under the licensed UBC patents for discovery, development and commercialization of siRNA products. Certain sublicenses to other parties were also granted.
On November 10, 2014, UBC filed a notice of arbitration against the Company and on January 16, 2015, filed a Statement of Claim, which alleges entitlement to
$3,500,000
in allegedly unpaid royalties based on publicly available information, and an unspecified amount based on non-public information. UBC also seeks interest and costs, including legal fees. The Company filed its Statement of Defense to UBC's Statement of Claims, as well as filed a Counterclaim involving a patent application that Arbutus alleges UBC wrongly licensed to a third party rather than to Arbutus. The proceedings have been divided into
three
phases, with a first hearing that took place in June 2017. The arbitrator determined in the first phase which agreements are sublicense agreements within UBC's claim, and which are not. No finding was made as to whether any licensing fees are due to UBC under these agreements; this will be the subject of the second phase of arbitration. A schedule for the remaining phases has not yet been set. Arbitration and related matters are costly and may divert the attention of the Company’s management and other resources that would otherwise be engaged in other activities. The Company continues to dispute UBC's allegations, and seeks license payments for said application, and an exclusive worldwide license to said application. However, the Company notes that arbitration is subject to inherent uncertainty and an arbitrator could rule against the Company. The Company has not recorded an estimate of the possible loss associated with this arbitration, due to the uncertainties related to both the likelihood and amount of any possible loss or range of loss. Costs related to the arbitration are recorded by the Company as incurred.
F- 13
Contingent consideration from Arbutus Inc. acquisition of Enantigen and License Agreements between Enantigen and the Baruch S. Blumberg Institute (“Blumberg”) and Drexel University (“Drexel”)
In October 2014, Arbutus Inc. acquired all of the outstanding shares of Enantigen pursuant to a stock purchase agreement. Through this transaction, Arbutus Inc. acquired a HBV surface antigen secretion inhibitor program and a capsid assembly inhibitor program, each of which are now assets of the Company, following the Company’s merger with Arbutus Inc.
Under the stock purchase agreement, Arbutus Inc. agreed to pay up to a total of
$21,000,000
to Enantigen’s selling stockholders upon the achievement of certain triggering events related to Enantigen’s
two
programs in pre-clinical development related to HBV therapies. The first triggering event is the enrollment of the first patient in a Phase 1b clinical trial in HBV patients, which the Company believes is likely to occur in the next twelve-month period.
The regulatory, development and sales milestone payments had an initial estimated fair value of approximately
$6,727,000
as at the date of acquisition of Arbutus Inc., and have been treated as contingent consideration payable in the purchase price allocation, based on information available at the date of acquisition, using a probability weighted assessment of the likelihood the milestones would be met and the estimated timing of such payments, and then the potential contingent payments were discounted to their present value using a probability adjusted discount rate that reflects the early stage nature of the development program, time to complete the program development, and market comparative data.
Contingent consideration is recorded as a financial liability, and measured at its fair value at each reporting date, based on an updated consideration of the probability-weighted assessment of expected milestone timing, with any changes in fair value from the previous reporting date recorded in the statement of operations and comprehensive loss (see note 2).
Blumberg and Drexel
In February 2014, Arbutus Inc. entered into a license agreement with Blumberg and Drexel that granted Arbutus Inc. an exclusive, worldwide, sub-licensable license to
three
different compound series: cccDNA inhibitors, capsid assembly inhibitors and HCC inhibitors.
In partial consideration for this license, Arbutus Inc. paid a license initiation fee of
$150,000
and issued warrants to Blumberg and Drexel. The warrants were exercised in 2014. Under this license agreement, Arbutus Inc. also agreed to pay up to
$3,500,000
in development and regulatory milestones per licensed compound series, up to
$92,500,000
in sales performance milestones per licensed product, and royalties in the mid-single digits based upon the proportionate net sales of licensed products in any commercialized combination. The Company is obligated to pay Blumberg and Drexel a double digit percentage of all amounts received from the sub-licensees, subject to customary exclusions.
In November 2014, Arbutus Inc. entered into an additional license agreement with Blumberg and Drexel pursuant to which it received an exclusive, worldwide, sub-licensable license under specified patents and know-how controlled by Blumberg and Drexel covering epigenetic modifiers of cccDNA and STING agonists. In consideration for these exclusive licenses, Arbutus Inc. made an upfront payment of
$50,000
. Under this agreement, the Company is required to pay up to
$1,200,000
for each licensed product upon the achievement of a specified regulatory milestone and a low single digit royalty, based upon the proportionate net sales of compounds covered by this intellectual property in any commercialized combination. The Company is also obligated to pay Blumberg and Drexel a double digit percentage of all amounts received from its sub-licensees, subject to exclusions.
F- 14
Research Collaboration and Funding Agreement with Blumberg
In October 2014, Arbutus Inc. entered into a research collaboration and funding agreement with Blumberg under which the Company will provide
$1,000,000
per year of research funding for
three
years, renewable at the Company’s option for an additional
three
years, for Blumberg to conduct research projects in HBV and liver cancer pursuant to a research plan to be agreed upon by the parties. Blumberg has exclusivity obligations to Arbutus with respect to HBV research funded under the agreement. In addition, the Company has the right to match any third party offer to fund HBV research that falls outside the scope of the research being funded under the agreement. Blumberg has granted the Company the right to obtain an exclusive, royalty bearing, worldwide license to any intellectual property generated by any funded research project. If the Company elects to exercise its right to obtain such a license, the Company will have a specified period of time to negotiate and enter into a mutually agreeable license agreement with Blumberg. This license agreement will include the following pre-negotiated upfront, milestone and royalty payments: an upfront payment in the amount of
$100,000
; up to
$8,100,000
upon the achievement of specified development and regulatory milestones; up to
$92,500,000
upon the achievement of specified commercialization milestones; and royalties at a low single to mid-single digit rates based upon the proportionate net sales of licensed products from any commercialized combination.
On June 5, 2016, the Company and Blumberg entered into an amended and restated research collaboration and funding agreement, primarily to: (i) increase the annual funding amount to Blumberg from
$1,000,000
to
$1,100,000
; (ii) extend the initial term through to October 29, 2018; (iii) provide an option for the Company to extend the term past October 29, 2018 for
two
additional
one
year terms; and (iv) expand our exclusive license under the Agreement to include the sole and exclusive right to obtain and exclusive, royalty-bearing, worldwide and all-fields license under Blumberg's rights in certain other inventions described in the agreement.
10.
Concentrations of credit risk
Credit risk is defined by the Company as an unexpected loss in cash and earnings if a collaborative partner is unable to pay its obligations on a timely basis. The Company’s main source of credit risk is related to its accounts receivable balance which principally represents temporary financing provided to collaborative partners in the normal course of operations.
The Company does not currently maintain a provision for bad debts as the majority of accounts receivable are from collaborative partners or government agencies and are considered low risk.
The carrying amount of financial assets represents the maximum credit exposure. The maximum exposure to credit risk at
March 31, 2018
was the accounts receivable balance of
$719,000
(
December 31, 2017
-
$402,000
).
All accounts receivable balances were current at
March 31, 2018
and at
December 31, 2017
.
11. Subsequent event
Arbutus and Roivant launch Genevant Sciences Corporation ("Genevant")
On April 11, 2018, the Company announced that it had entered into an agreement with Roivant to launch Genevant, a jointly-owned company focused on the discovery, development, and commercialization of a broad range of RNA-based therapeutics enabled by Arbutus' proprietary lipid nanoparticle (LNP) and ligand conjugate delivery technologies.
Under the terms of the agreement, the Company will license exclusive rights to its LNP and ligand conjugate delivery platforms to Genevant for RNA-based applications outside of HBV, and Roivant will contribute
$37,500,000
in transaction-related seed capital for Genevant in exchange for which each party will initially have a
50%
ownership interest in Genevant. Roivant's contribution consists of an initial capital contribution of
$22,500,000
, and a commitment to contribute a further
$15,000,000
at a pre-determined, stepped-up valuation. The Company will retain all rights to the LNP and conjugate delivery platforms for HBV, and will be entitled to a tiered royalty from Genevant on future sales of products enabled by those delivery platforms. The Company will also retain the entirety of its royalty entitlement on the commercialization of Alnylam's patisiran. Refer to Part I, Item 2, "Management's Discussion and Analysis of Financial Condition and Results of Operations - Overview" for additional information.
F- 15
You should read the following discussion and analysis by our management of our financial position and results of operations in conjunction with our audited consolidated financial statements and related notes thereto included as part of our Annual Report on Form 10-K for the year ended
December 31, 2017
. Our consolidated financial statements have been prepared in accordance with U.S. generally accepted accounting principles and are presented in U.S. dollars.
FORWARD-LOOKING STATEMENTS
The information in this report contains forward-looking statements within the meaning of the Section 27A of the Securities Act of 1933 and Section 21E of the Securities Exchange Act of 1934, and forward looking information within the meaning of Canadian securities laws (collectively, “forward-looking statements”). Forward-looking statements in this report include statements about our strategy, future operations, clinical trials, prospects and the plans of management; the discovery, development and commercialization of a cure for HBV; our beliefs and development path and strategy to achieve a cure for HBV; obtaining necessary regulatory approvals; obtaining adequate financing through a combination of financing activities and operations; the possibility of receiving total milestone payments of up to $18,000,000 on Alocrest and Brakiva; the payment of one-time employee termination benefits, employee relocation costs, and site closure costs, totalling approximately $5,000,000, to be primarily paid in cash in the second quarter of 2018; the expected timing of certain triggering events for payments by Arbutus Inc. related to Enantigen’s programs; the execution of the terms of the agreement with Roivant to launch Genevant; the potential of our LNP platform to provide royalties and significant additional capital to fund development of our many HBV assets; developing a suite of products that intervene at different points in the viral life cycle, with the potential to reactivate the host immune system; using preclinical results to adaptively design clinical studies for additional cohorts of patients, testing the combination and the duration of therapy; evaluating different treatment durations to determine the optimal finite duration of therapy; selecting combination therapy regimens and treatment durations to conduct Phase III clinical trials intended to ultimately support regulatory filings for marketing approval; approval for a single product from our pipeline by combining with available agents to improve upon the cure rate with the current standard of care; expanding our HBV drug candidate pipeline through internal development, acquisitions and in-licenses; interim results from a 30-week Phase II study of ARB-1467 in combination with tenofovir and pegylated interferon expected in the second half of 2018, followed by final results in 2019; continuing to focus on rapidly advancing AB-506 into clinical testing before proceeding with additional clinical evaluation of AB-423; an IND (or equivalent) filing for AB-506 in mid-2018; an IND (or equivalent) filing for AB-452 in mid-2018, with the potential to be a 'best-in-class' capsid inhibitor and once-daily oral dosing;the potential for once daily, oral dosing of AB-452, along with an IND/CTA filing in 2018; presenting results of additional preclinical studies in 2018; an IND/CTA filing in 2019 for AB-729; possible low to mid-single-digit royalty payments escalating based on sales performance as Alnylam’s LNP-enabled products, including patisiran, are commercialized; payments from the Gritstone licensing agreement; retaining all rights to our LNP and conjugate delivery platforms for HBV, with an entitlement to a tiered royalty from Genevant on future sales of products enabled by those delivery platforms; the members of Genevant’s executive team; the expectation for organizational changes to result in increased efficiency, a more flexible variable cost structure, and additional preservation of our cash reserves; reducing our global workforce by approximately 35% and closing our Burnaby, BC facility during the second quarter of 2018; the belief that current legal proceedings will not have a material adverse effect on our consolidated results of operations, cash flows, or financial condition; the expected return from strategic alliances, licensing agreements, and research collaborations; statements with respect to revenue and expense fluctuation and guidance; having sufficient cash resources to fund our operations for at least the next 12 months; obtaining funding to maintain and advance our business from a variety of sources including public or private equity or debt financing, collaborative arrangements with pharmaceutical companies and government grants and contracts; and the quantum and timing of potential funding.
With respect to the forward-looking statements contained in this report, we have made numerous assumptions regarding, among other things: LNP’s status as a leading RNAi delivery technology; our research and development capabilities and resources; the effectiveness of our products as a treatment for chronic HBV infection or other diseases; continued positive results from pre-clinical and clinical trials; the timing and quantum of payments to be received under contracts with our partners; assumptions related to our share price volatility, expected lives of warrants, and warrant issuances and/or exercises; and our financial position and its ability to execute our business strategy. While we consider these assumptions to be reasonable, these assumptions are inherently subject to significant business, economic, competitive, market and social uncertainties and contingencies.
Our actual results could differ materially from those discussed in the forward-looking statements as a result of a number of important factors, including the risk factors discussed in this report and the risk factors discussed in our Annual Report on Form 10-K under the heading “Risk Factors,” and the risks discussed in our other filings with the Securities and Exchange Commission and Canadian Securities Regulators. Readers are cautioned not to place undue reliance on these forward-looking statements, which reflect management’s analysis, judgment, belief or expectation only as of the date hereof. All forward-looking statements herein
are qualified in their entirety by this cautionary statement, and we explicitly disclaim any obligation to revise or update any such forward-looking statements or to publicly announce the result of any revisions to any of the forward-looking statements contained herein to reflect future results, events or developments, except as required by law.
F- 16
OVERVIEW
Arbutus Biopharma Corporation ("Arbutus", the "Company", "we", "us", and "our") is a publicly traded (Nasdaq Global Market: ABUS) industry-leading therapeutic solutions company dedicated to discovering, developing, and commercializing a cure for patients suffering from chronic Hepatitis B Virus (HBV) infection. HBV represents a significant, global unmet medical need and is the cause of the most common serious liver infection in the world. The World Health Organization (WHO) estimates that approximately 300 million people worldwide are chronically infected (WHO, 2017), and other estimates suggest this could include approximately 2 million people in the United States (Kowdley et al., 2012).
To pursue our strategy of developing a curative combination regimen for chronic HBV, we have assembled a robust pipeline consisting of multiple drug candidates with differing but complementary mechanisms of action (MOA), each of which have the potential to improve upon the standard of care and contribute to curative combination treatment regimen. In addition to our HBV pipeline, we have a lipid nanoparticle delivery (LNP) platform with broad applications that extend beyond HBV that we have licensed to Genevant Sciences (Genevant), in which Arbutus initially holds a 50% ownership interest. Related to the LNP platform, we retain a royalty entitlement on a drug that may be approved later in 2018. These assets have the potential to provide significant additional capital to fund development of our many HBV assets.
HBV Product Pipeline
Our product pipeline, like our business, is focused on finding a cure for chronic HBV infection, with the objective of developing a suite of products that intervene at different points in the viral life cycle, and have the potential to reactivate the host immune system. We are conducting preclinical combination studies to evaluate combinations of our proprietary pipeline candidates with HBV SOC therapies and with our own proprietary assets. These results support the design and execution of drug combination studies in cohorts of patients with chronic HBV infection. We expect to use these results to adaptively design clinical studies for additional cohorts of patients, testing the combination and the duration of therapy. We plan to continue this process to select a regimen to conduct Phase III clinical trials intended to ultimately support regulatory filings for marketing approval.
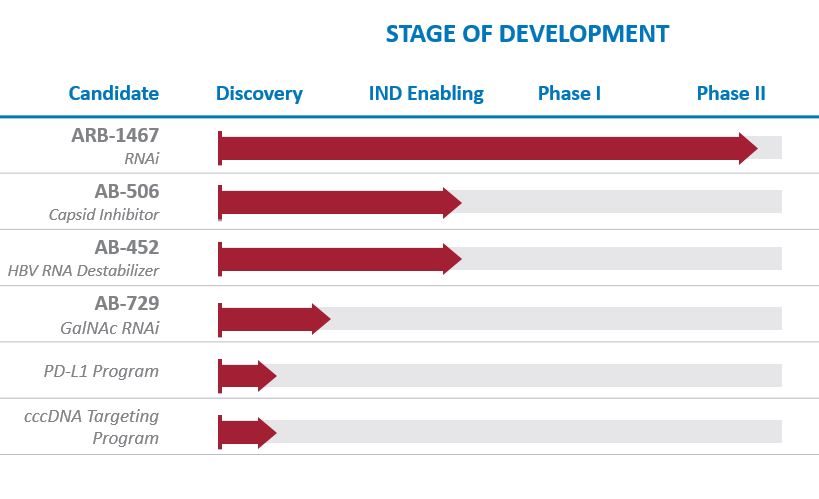
Our very broad pipeline of HBV product candidates includes ARB-1467 (RNAi); AB-506 (capsid inhibitor); AB-452 (HBV RNA destabilizer); AB-729 (GalNAc RNAi), and multiple preclinical agents in development with novel mechanisms of action (MOA).
We continue to expand our HBV pipeline through internal discovery and development and possibly acquisitions and in-licenses. We also have a research collaboration agreement with the Baruch S. Blumberg Institute that provides exclusive rights to in-license any intellectual property generated through the collaboration.
F- 17
RNAi (ARB-1467)
Our lead RNA interference (RNAi) HBV candidate, ARB-1467, is designed to reduce Hepatitis B surface antigen (HBsAg) expression in patients chronically infected with HBV. Reducing HBsAg is thought to be a key prerequisite to enable a patient’s immune system to raise an adequate immune response against the virus. The ability of ARB-1467 to inhibit numerous viral elements in addition to HBsAg increases the likelihood of affecting the viral infection.
ARB-1467 is a multi-component RNAi therapeutic that simultaneously targets three sites on the HBV genome, including the HBsAg coding region. Targeting three distinct and highly conserved sites on the HBV genome is intended to facilitate potent knockdown of all viral mRNA transcripts and viral antigens across a broad range of HBV genotypes and lower the risk of developing antiviral resistance. In preclinical models, ARB-1467 treatment results in reductions in intrahepatic and serum HBsAg, HBV DNA, covalently closed circular DNA (cccDNA), Hepatitis B e antigen (HBeAg) and Hepatitis B c antigen (HBcAg). ARB-1467 was evaluated in a Phase I Single Ascending Dose (SAD) trial designed to assess the safety, tolerability, and pharmacokinetics of intravenous administration of the product in healthy adult subjects. In the Phase I SAD study, dosing healthy volunteer subjects was well-tolerated to a dose of 0.4 mg/kg but a maximum tolerated dose was not reached.
The Phase II trial was a multi-dose study in virally suppressed (NA therapy) patients with chronic HBV. The study enrolled 4 cohorts and explored two doses of ARB-1467 (0.2 and 0.4 mg/kg) at two dose frequencies (monthly and bi-weekly) in two patient populations (HBeAg-negative and positive patients). Cohorts 1, 2, and 4 enrolled HBeAg- patients and Cohort 3 enrolled HBeAg+ patients. The first three cohorts each enrolled eight subjects; six received three monthly doses of ARB-1467, and two received placebo. Cohort 4 enrolled twelve patients, all of whom received five bi-weekly doses of ARB-1467, followed by monthly dosing if pre-defined criteria were met. ARB-1467 was administered at 0.2 mg/kg in Cohort 1 and 0.4 mg/kg in Cohorts 2, 3, and 4. Overall, treatment was well tolerated across all cohorts (Cohorts 1, 2, 3, and 4).
Results from monthly doses in Cohorts 1, 2 and 3 demonstrated a significant reduction in serum HBsAg and a step-wise, additive reduction in serum HBsAg with each subsequent dose. The HBsAg reduction achieved after three monthly doses of 0.4mg/kg in Cohort 2 was greater than that seen at 0.2 mg/kg in Cohort 1, demonstrating a dose-response with repeat dosing. We observed no significant differences in serum HBsAg reductions between HBeAg-negative and HBeAg-positive patients. In Cohort 4, five doses of ARB-1467 were administered on a bi-weekly dosing schedule. Results after 5 doses of bi-weekly administration demonstrated a deeper reduction in HBsAg levels compared to the results observed during the monthly administration, with a mean reduction of 1.4 log
10
and a maximum reduction of 2.7 log
10
. Seven of the twelve patients met the predefined response criteria (a reduction greater than 1 log
10
and HBsAg levels < 1000 IU/ml) at or before day 71. Five of the seven patients who met the response criteria had their serum HBsAg reduced to low absolute levels (below 50 IU/mL). Results for the extension suggested that monthly dosing was not sufficient to maintain or improve upon these reductions in HBsAg levels, thus new studies exploring prolonged bi-weekly administration of ARB-1467 have been initiated.
We have initiated a triple combination study of our RNAi agent ARB-1467 with tenofovir (TDF) and pegylated interferon (PegIFN) therapy to determine if this regimen will result in patients reaching undetectable HBV DNA and HBsAg levels. The Phase II combination trial is a 30-week multi-dose study in 20 HBV DNA -positive, HBeAg-negative, treatment naïve, patients who will receive bi-weekly doses of ARB-1467 at 0.4 mg/kg and daily oral TDF doses for 30 weeks. Those patients who reach predetermined criteria 6 weeks will qualify for the addition of weekly PegIFN treatment, while continuing to receive bi-weekly doses of ARB-1467 and daily doses of TDF for the remaining 24 weeks. Patients will be followed for 24 weeks after the treatment period concludes. Interim on-treatment results from this trial are expected in the second half of 2018, followed by final results in 2019.
Capsid Inhibitors (AB-506 & AB-423)
HBV core protein, or capsid, is required for viral replication and core protein may have additional roles in cccDNA function. Current NA therapy significantly reduces HBV DNA levels in the serum but HBV replication continues in the liver, thereby enabling HBV infection to persist. Effective therapy for patients requires new agents which will effectively block viral replication. We are developing core protein inhibitors (also known as capsid assembly inhibitors) as oral therapeutics for the treatment of chronic HBV infection. By inhibiting assembly of the viral capsid, the ability of HBV to replicate is impaired, resulting in reduced cccDNA.
F- 18
AB-423 was our first-generation capsid inhibitor candidate, which was evaluated in a Phase I SAD and Multiple Ascending Dose (MAD) trial designed to assess the safety, tolerability, and pharmacokinetics (PK) of oral administration of the product in healthy volunteers. AB-423 was well-tolerated with no serious adverse events following single doses up to 800 mg. Multiple doses up to 400 mg twice daily were also well tolerated.
In addition to AB-423, our capsid inhibitor discovery effort generated promising back-up compounds in 2017, which led to the nomination of a next-generation capsid inhibitor AB-506 for Investigational New Drug (IND)/Clinical Trial Authorization (CTA)-enabling studies. AB-506 is an orally administered, highly selective capsid inhibitor that has shown striking potency and improved PK in preclinical studies. We presented these preclinical data at AASLD annual meeting in October 2017 in a presentation titled, "Antiviral Characterization of a Next Generation Chemical Series of HBV Capsid Inhibitors In Vitro and In Vivo," which showed potent inhibition of HBV replication and pgRNA encapsidation, an accelerated rate of capsid assembly, and binding to the HBV core protein at the dimer:dimer interface that indicates improved target engagement compared to first generation capsid inhibitors.
We will continue to focus on rapidly advancing AB-506 into clinical testing before proceeding with additional clinical evaluation of AB-423. We plan to file an IND/CTA in mid-2018 (pending successful IND/CTA-enabling studies) for AB-506, which has the potential to be a 'best-in-class' capsid inhibitor based on its favorable drug-like properties and potent inhibition of HBV replication. This molecule has the potential for once-daily oral dosing, making it an ideal candidate for inclusion in a combination regimen.
We evaluated the anti-HBV activities of two novel orally administered agents, an HBV capsid inhibitor AB-506 and an HBV RNA destabilizer AB-452, in combination with approved SOC therapies: NA, entecavir (ETV), tenofovir disproxil fumarate (TDF), tenofovir alafenamide (TAF), as well as with our lead RNAi agent, ARB-1467. The in vitro dual combinations of AB-506 or AB-452 with approved NAs or ARB-1467 ranged from additive to moderately synergistic at reducing HBV rcDNA and HBsAg levels with no significant effects on cell viability.
HBV RNA Destabilizer (AB-452)
One of our most advanced preclinical programs is an HBV RNA Destabilizer, AB-452 (formerly known as our oral HBsAg inhibitor program), which has novel activity in destabilizing HBV RNA, broad activity against HBV RNAs, and reduces HBsAg. This molecule has the potential for once daily, oral dosing. We presented these preclinical data at AASLD annual meeting in October 2017 in a presentation titled, "Identification and Characterization of AB-452, a Potent Small Molecule HBV RNA Destabilizer In Vitro and In Vivo," which showed that AB-452 has shown synergistic effects when combined with two of our proprietary HBV RNAi agents in vitro. In vivo, twice-a-day oral administration of AB-452 resulted in up to 1.4 log
10
reduction of serum HBsAg in a dose dependent manner and correlated well with liver HBV RNA levels. When combined, our capsid inhibitor AB-506 and HBV RNA destabilizer AB-452 show distinct but mechanistically compatible antiviral activities that suggest feasibility of inclusion in a clinical combination regimen. Pending successful IND/CTA-enabling studies, this product candidate could be the subject of an IND/CTA filing in 2018.
We also evaluated the anti-HBV activities of AB-506 and AB-452 in combination with approved SOC therapies: NA, entecavir (ETV), tenofovir disoproxil fumarate (TDF), tenofovir alafenamide (TAF), and our lead RNAi agent, ARB-1467. The in vitro dual combinations of AB-506 or AB-452 with approved NAs or ARB-1467 ranged from additive to moderately synergistic at reducing HBV rcDNA and HBsAg levels with no significant effects on cell viability. Results of additional preclinical studies will be presented in 2018.
GalNAc RNAi (AB-729)
We recently nominated for development a next-generation RNAi therapeutic, AB-729, targeted to hepatocytes using our novel covalently conjugated N-acetylgalactosamine (GalNAc) delivery technology to enable subcutaneous delivery. This is a promising new agent that acts on multiple HBV viral transcripts, enabling inhibition of viral replication and suppression of all viral antigens. AB-729 showed more durable in vivo preclinical activity than earlier-generation RNAi agents for the treatment of chronic HBV infection.
We observed a significant dose response, and a stepwise reduction in viral proteins when multi-dosing.
Pending successful IND/CTA-enabling studies, this product candidate could be the subject of an IND/CTA filing in 2019.
Additional Research Programs
F- 19
In addition to our clinical candidates, we have a number of research programs aimed at discovery and development of proprietary HBV candidates with different and complementary MOAs. We have ongoing discovery efforts focused on cccDNA targeting and checkpoint inhibition.
Our Proprietary Delivery Technology
Development of RNAi therapeutic products is currently limited by the instability of the RNAi trigger molecules in the bloodstream and the inability of these molecules to access target cells or tissues following administration. Delivery technology is necessary to protect these drugs in the bloodstream to allow efficient delivery and cellular uptake by the target cells. Arbutus has developed a proprietary delivery LNP platform. The broad applicability of this platform to RNAi development has established Arbutus as a leader in this new area of innovative medicine.
Our proprietary LNP delivery technology allows for the successful encapsulation of RNAi trigger molecules in LNP administered intravenously, which travel through the bloodstream to target tissues or disease sites. LNPs are designed to protect the triggers, and stay in the circulation long enough to accumulate at disease sites, such as the liver or cancerous tumors. LNPs are then taken up into the target cells by a process called endocytosis. Subsequent activation by the changing environment inside the cell causes the LNP to release the trigger molecules, which can then successfully enable nucleic acid-based therapies.
Ongoing Advancements in LNP Technology
Our LNP technology represents the most widely adopted delivery technology in RNAi, which has enabled several clinical trials and has been administered to hundreds of human subjects. We are the leaders in LNP delivery and hold a dominant intellectual property position in this field. We have applied our extensive technical expertise and clinical experience gained from our LNP-based programs to further advance our platform technology and its broad application to mRNA delivery.
We have generated value from our LNP platform technology, which is well suited to deliver therapies based on RNAi, mRNA, and gene editing constructs. We have also made progress in developing a proprietary GalNAc conjugate technology to enable subcutaneous delivery of an RNAi therapeutic targeting HBsAg and/or other HBV targets.
In April 2018, we entered into an agreement with Roivant Sciences (Roivant) to launch Genevant Sciences (Genevant), a jointly-owned company focused on the discovery, development, and commercialization of a broad range of RNA-based therapeutics enabled by our proprietary lipid nanoparticle (LNP) and ligand (GalNAc) conjugate delivery technologies (collectively, the Delivery Technologies) for all applications except HBV. See further discussion under Recent Developments below.
Partner Programs
Patisiran (ALN-TTR02)
Alnylam Pharmaceuticals, Inc., or Alnylam (Nasdaq: ALNY), has a license to use our intellectual property to develop and commercialize products and may only grant access to our LNP technology to its partners if it is part of a product sublicense. Alnylam’s license rights are limited to patents that we have filed, or that claim priority to a patent that was filed, before April 15, 2010. Alnylam's patisiran (ALN-TTR02) program represents the most clinically advanced application of our LNP delivery technology, and results demonstrate that our LNP has been well tolerated and efficacy maintained with long-term (>36 months) treatment.
Patisiran is Alnylam`s most clinically advanced RNAi therapeutic in development, targeting transthyretin (TTR) for the treatment of TTR-mediated amyloidosis (ATTR). In September 2017, Alnylam successfully completed its APOLLO Phase III clinical trial of LNP-enabled patisiran, which initiated in November 2013. Results showed that patisiran met its primary efficacy endpoint and all secondary endpoints in this trial. As a result, Alnylam completed a New Drug Application (NDA) to the U.S. Food and Drug Administration (FDA) and a Marketing Authorisation Application (MAA) to the European Medicines Agency (EMA) for patisiran. Alnylam has estimated that first regulatory approval may be obtained in the second half of 2018. We retain full rights to royalties on patisiran global sales and are entitled to low-to-mid single-digit royalty payments escalating based on sales performance as Alnylam’s LNP-enabled products are commercialized, therefore we could receive our first royalty payments in the second half of 2018.
F- 20
Gritstone Oncology
In October 2017, we entered into a license agreement with Gritstone Oncology (Gritstone) that granted them worldwide access to our portfolio of proprietary and clinically validated LNP products and associated intellectual property to deliver Gritstone’s RNA-based neoantigen immunotherapy products. Gritstone paid us an upfront payment and agreed to future payments for achievement of development, regulatory, and commercial milestones as well as royalties, and reimbursements for conducting technology development, manufacturing and regulatory support for Gritstone’s product candidates. Genevant will be entitled to 50% of any milestones and royalties that may be payable by Gritstone.
Marqibo®
Marqibo, originally developed by Arbutus, is a novel, sphingomyelin/cholesterol liposome-encapsulated formulation of the FDA-approved anticancer drug vincristine. Marqibo’s approved indication is for the treatment of adult patients with Philadelphia chromosome-negative acute lymphoblastic leukemia (Ph-ALL) in second or greater relapse or whose disease has progressed following two or more lines of anti-leukemia therapy. Our licensee, Spectrum Pharmaceuticals, Inc. (Spectrum), launched Marqibo through its existing hematology sales force in the United States. Spectrum has ongoing trials evaluating Marqibo in three additional indications, which are: first line use in patients with Philadelphia Negative Acute Lymphoblastic Leukemia (Ph-ALL), Pediatric ALL and Non-Hodgkin’s lymphoma. We are receiving mid-single digit royalty payments on sales of Marqibo.
Recent Developments
Genevant Sciences
In April 2018, we entered into an agreement with Roivant to launch Genevant, a jointly-owned company focused on the discovery, development, and commercialization of a broad range of RNA-based therapeutics enabled by our proprietary Delivery Technologies. We have licensed exclusive rights to our LNP and ligand conjugate delivery platforms to Genevant for RNA-based applications outside of HBV. Genevant plans to develop products in-house and pursue industry partnerships to build a diverse pipeline of therapeutics across multiple modalities, including RNAi, mRNA, and gene editing.
Under the terms of the agreement, Roivant will contribute $37.5 million in transaction-related seed capital for Genevant, consisting of an initial $22.5 million and a subsequent investment of $15 million at a pre-determined, stepped-up valuation. We will retain all rights to our LNP and conjugate delivery platforms for HBV, and will be entitled to a tiered royalty from Genevant on future sales of products enabled by those delivery platforms. We will also retain the entirety of our royalty entitlement on the commercialization of Alnylam’s patisiran.
Genevant will be led by Executive Chairman Paris Panayiotopoulos, former CEO of ARIAD Pharmaceuticals, accompanied by a management team of RNA experts like Dr. Bo Rode Hansen as President, Chief Scientific Officer, and Head of R&D; Dr. Peter Lutwyche as Chief Technology Officer; Dr. Konstantin Linnik as General Counsel; Dr. James Heyes as Senior VP; and a scientific team with decades of RNA development experience.
Acuitas Therapeutics Inc.
In accordance with a settlement agreement signed in November 2012, we finalized and entered a cross-license agreement with Acuitas Therapeutics Inc. (Acuitas) in December 2013. The terms of the cross-license agreement provided Acuitas with access to certain of our earlier IP generated prior to mid-April 2010 in the fields of gene replacement therapy and antisense. Acuitas was only able to grant access to our LNP technology to its partners if it is part of a product sublicense. At the same time, the terms provided us with certain access to Acuitas’ technology and licenses in the RNAi field, along with a percentage of each milestone and royalty payment with respect to certain products. Acuitas had agreed that it would not compete in the RNAi field for a period of five years, ending in November 2017. Arbutus considered Acuitas to be in material breach of their cross-license agreement and provided notice to Acuitas in August 2016 to terminate the cross license agreement, resulting in litigation between the two parties. In February 2018, Arbutus and Acuitas reached a settlement terminating Acuitas’ right to further use or sublicense Arbutus' LNP technology. Please refer to "Item 1. Legal Proceedings" for additional information.
Site Consolidation
F- 21
In February 2018, we announced a site consolidation and organizational restructuring to better align our HBV business in Warminster, PA. These organizational changes are expected to result in increased efficiency, a more flexible variable cost structure, and additional preservation of our cash reserves. To achieve this alignment, during the second quarter of 2018 we will reduce our global workforce by approximately 35% and close our Burnaby, BC facility. For further detail, refer to note 8 "Site Consolidation" in the condensed consolidated financial statements in Part I.
CRITICAL ACCOUNTING POLICIES AND ESTIMATES
Site consolidation expense
/ We account for site consolidation expense in accordance with ASC 420,
Exit or Disposal Cost Obligations
. ASC 420 specifies that a liability for a cost associated with an exit or disposal activity be recognized when the liability is incurred, except for a liability where employees are required to render service until they are terminated in order to receive termination benefits and will be retained to render service beyond the minimum retention period. A liability for such one-time termination benefits shall be measured initially at the communication date based on the fair value of the liability as of the termination date and recognized rateably over the future service period.
Revenue recognition
/ We adopted the new revenue standard (Accounting Standards Codification “ASC" 606) effective January 1, 2018, using the modified retrospective method under which previously presented financial statements are not restated and the cumulative effect of adopting the new revenue standard on contracts in process is recognized by an adjustment to retained earnings at the effective date. The adoption of the new revenue standard did not change recognized revenue under our ongoing significant collaborative research and license agreements and no cumulative effect adjustment was required.
The new guidance in ASC 606 requires an entity to recognize the amount of revenue to which it expects to be entitled for the transfer of promised goods or services to customers under a five-step model: (1) identify contract(s) with a customer; (ii) identify the performance obligations in the contract; (iii) determine the transaction price; (iv) allocate the transaction price to the performance obligations in the contract; and (5) recognize revenue when or as a performance obligation is satisfied.
We generate revenue primarily through collaboration agreements, which may require delivery of various rights and/or services, including intellectual property rights or licenses and research and development services. Under such collaboration agreements, we are generally eligible to receive non-refundable upfront payments, funding for research and development services, milestone payments, and royalties.
In contracts where more than one performance obligation exists to provide its customer with goods or services, each performance obligation is evaluated to determine whether it is distinct based on whether (i) the customer can benefit from the good or service either on its own or together with other resources that are readily available and (ii) the good or service is separately identifiable from other promises in the contract. The consideration under the contract is then allocated between the distinct performance obligations based on their respective relative stand-alone selling prices. The estimated stand-alone selling price of each deliverable reflects the our best estimate of what the selling price would be if the deliverable was regularly sold on a stand-alone basis and is determined by reference to market rates for the good or service when sold to others or by using an adjusted market assessment approach if selling price on a stand-alone basis is not available.
The consideration allocated to each distinct performance obligation is recognized as revenue when control is transferred to the customer for the related goods or services. Consideration associated with at-risk substantive performance milestones, including sales-based milestones, is recognized as revenue when it is probable that a significant reversal of the cumulative revenue recognized will not occur. Sales-based royalties received in connection with licenses of intellectual property are subject to a specific exception in the revenue standards, whereby the consideration is not included in the transaction price and recognized in revenue until the customer’s subsequent sales or usages occur.
There are no other changes to our critical accounting policies and estimates from those disclosed in our annual MD&A contained in our Annual Report Form 10-K for the year ended December 31, 2017.
RECENT ACCOUNTING PRONOUNCEMENTS
From time to time, new accounting pronouncements are issued by the Financial Accounting Standards Board or other standard setting bodies that are adopted by us as of the specified effective date. Unless otherwise discussed, we believe that the impact of recently issued standards that are not yet effective will not have a material impact on our financial position or results of operations upon adoption.
F- 22
Please refer to Note 2 to our consolidated financial statements included in Part I, Item 1, "Financial Statements (Unaudited)" of this Quarterly Report on Form 10-Q for a description of recent accounting pronouncements applicable to our business.
RESULTS OF OPERATIONS
The following summarizes the results of our operations for the periods shown, in thousands (except for per share figures):
|
|
Three Months Ended
|
||||||
|
|
March 31,
|
||||||
|
|
2018
|
2017
|
|||||
|
Total revenue
|
$
|
1,436
|
|
$
|
235
|
|
|
|
Operating expenses
|
19,841
|
|
18,534
|
|
|||
|
Loss from operations
|
(18,405
|
)
|
(18,299
|
)
|
|||
|
Net loss
|
$
|
(17,429
|
)
|
$
|
(18,627
|
)
|
|
|
Net loss attributable to common shares
|
(19,765
|
)
|
$
|
(18,627
|
)
|
||
|
Basic and diluted loss per common share
|
(0.36
|
)
|
(0.34
|
)
|
|||
Revenue
/ Revenue is summarized in the following table, in thousands:
|
|
Three months ended March 31,
|
||||||||||||
|
|
2018
|
% of Total
|
2017
|
% of Total
|
|||||||||
|
Alexion
|
$
|
—
|
|
—
|
%
|
$
|
127
|
|
54
|
%
|
|||
|
Gritstone
|
1,150
|
|
80
|
%
|
$
|
—
|
|
—
|
%
|
||||
|
Other milestone and royalty payments
|
286
|
|
20
|
%
|
108
|
|
46
|
%
|
|||||
|
Total revenue
|
$
|
1,436
|
|
|
$
|
235
|
|
|
|||||
Revenue contracts are addressed in detail in the Overview section of Part I, Item 2, "Management's Discussion and Analysis of Financial Condition and Results of Operations" above.
Alexion revenue
In March 2017, we signed a License Agreement with Alexion that granted them exclusive use of our proprietary LNP technology in one of Alexion's rare disease programs, and began recognizing a portion of the non-refundable upfront payment and services provided. In July 2017, we received notice of termination from Alexion for our LNP license agreement. The termination was driven by a strategic review of Alexion's business and research and development portfolio, which included a decision to discontinue development of mRNA therapeutics.
Gritstone revenue
On October 16, 2017, we entered into a license agreement with Gritstone that entitles Gritstone to research, develop, manufacture and commercialize products with the Company’s LNP technology. In October 2017, we received the upfront license payment, and are eligible to receive further potential payments for development and commercial milestone payments and royalty payments on future product sales. Revenue recognized in the three months ended March 31, 2018 relates to the earned portion of the upfront license fee, as well as services provided to Gritstone.
Other milestone and royalty payments
Under our licensing and collaboration arrangements with Alnylam and Acuitas, we earn licensing fee revenue from Acuitas as well as further potential development and commercial milestones from Alnylam for the use of our LNP technology. Our cross-license agreement with Acuitas has been terminated in accordance with the settlement agreement described under Part II, Item 1, "Legal Proceedings."
In September 2013, Spectrum announced that they had shipped the first commercial orders of Marqibo. We continue to earn royalties on the sales of Marqibo, which uses a license to our technology.
F- 23
Expenses
/ Expenses are summarized in the following table, in thousands:
|
|
Three months ended March 31,
|
||||||||||||
|
|
2018
|
% of Total
|
2017
|
% of Total
|
|||||||||
|
Research, development, collaborations and contracts
|
$
|
13,949
|
|
70
|
%
|
$
|
13,872
|
|
75
|
%
|
|||
|
General and administrative
|
3,669
|
|
18
|
%
|
4,328
|
|
23
|
%
|
|||||
|
Depreciation
|
602
|
|
3
|
%
|
334
|
|
2
|
%
|
|||||
|
Site consolidation charges
|
1,621
|
|
8
|
%
|
$
|
—
|
|
—
|
%
|
||||
|
Total operating expenses
|
$
|
19,841
|
|
|
$
|
18,534
|
|
|
|||||
Research, development, collaborations and contracts
Research, development, collaborations and contracts expenses consist primarily of clinical and pre-clinical trial expenses, personnel expenses, consulting and third party expenses, consumables and materials, as well as a portion of stock-based compensation and general overhead costs.
R&D expenses remained consistent in the three months ended
March 31, 2018
and
March 31, 2017
. In Q1 2017, we initiated a Phase 1 clinical trial for AB-423. In Q1 2018 we continued to focus on rapidly advancing AB-506 into clinical testing as it has shown striking potency and improved PK over AB-423 in preclinical studies. We will wait for AB-506 results before deciding whether or not to proceed with additional clinical evaluation of AB-423. We continue to incur costs related to our other programs including efforts towards filing an IND/CTA for AB-452 later this year.
A significant portion of our research, development, collaborations and contracts expenses are not tracked by project as they benefit multiple projects or our technology platform and because our most-advanced programs are not yet in late-stage clinical development. However, our collaboration agreements contain cost-sharing arrangements pursuant to which certain costs incurred under the project are reimbursed. Costs reimbursed under collaborations typically include certain direct external costs and hourly or full-time equivalent labor rates for the actual time worked on the project. As a result, although a significant
portion of our research, development, collaborations and contracts expenses are not tracked on a project-by-project basis, we do, however, track direct external costs attributable to, and the actual time our employees worked on our collaborations.
General and administrative
General and administrative expenses decreased in the three months ended
March 31, 2018
compared to the three months ended
March 31, 2017
primarily due to a decrease in non-cash compensation expense related to the expiry of repurchase rights in Q3 2017, offset by professional fees incurred related to the launch of Genevant Sciences - see Part I, Item 2, "Management's Discussion and Analysis of Financial Condition and Results of Operations - Overview".
Site consolidation charges
In February 2018, we announced a site consolidation and organizational restructuring to better align our HBV business in Warminster, PA, by reducing our global workforce and closing our Burnaby facility. For the three months ended March 31, 2018, we began executing our site consolidation plan and recorded expenses of $1.6 million in this respect. Most of the site consolidation expenses will be expensed ratably over the period that employees continue to provide services. We expect total site consolidation expenses to be approximately $5.0 million.
F- 24
Other income (losses) /
Other income (losses) are summarized in the following table, in thousands:
|
|
Three Months Ended
|
||||||
|
|
March 31,
|
||||||
|
|
2018
|
2017
|
|||||
|
Interest income
|
$
|
758
|
|
$
|
368
|
|
|
|
Interest expense
|
(104
|
)
|
(42
|
)
|
|||
|
Foreign exchange gains (losses)
|
(526
|
)
|
427
|
|
|||
|
Decrease (increase) in fair value of warrant liability
|
—
|
|
(22
|
)
|
|||
|
Decrease (increase) in fair value of contingent consideration
|
848
|
|
(1,059
|
)
|
|||
|
Total other income (losses)
|
$
|
976
|
|
$
|
(328
|
)
|
|
Foreign exchange gains (losses)
We continue to incur substantial expenses and hold cash and investment balances in Canadian dollars, and as such, will remain subject to risks associated with foreign currency fluctuations. For the three months ended
March 31, 2018
, we recorded a foreign exchange loss of
$0.5 million
, which is primarily an unrealized loss related to an depreciation in the value of our Canadian dollar funds, from the previous period, when converted to our functional currency of U.S. dollars.
Decrease (increase) in fair value of contingent consideration
Contingent consideration is a liability assumed by the Company from our acquisition of Arbutus Inc. in March 2015. In general, increases in the fair value of the contingent consideration are related to the progress of our programs as they get closer to triggering contingent payments. The decrease in contingent consideration for the three months ended March 31, 2018 is due to a delay in the progress of our program related to the first payment, which reduces the estimated fair value of the liability.
LIQUIDITY AND CAPITAL RESOURCES
The following table summarizes our cash flow activities for the periods indicated, in thousands:
|
|
Three Months Ended
|
||||||
|
|
March 31,
|
||||||
|
|
2018
|
2017
|
|||||
|
Net loss for the period
|
$
|
(17,429
|
)
|
$
|
(18,627
|
)
|
|
|
Adjustments to reconcile net loss to net cash provided by operating activities
|
1,274
|
|
5,493
|
|
|||
|
Changes in operating assets and liabilities
|
(3,812
|
)
|
(4,401
|
)
|
|||
|
Net cash used in operating activities
|
(19,967
|
)
|
(17,535
|
)
|
|||
|
Net cash provided by (used in) investing activities
|
(75,666
|
)
|
23,195
|
|
|||
|
Net cash provided by financing activities
|
54,367
|
|
354
|
|
|||
|
Effect of foreign exchange rate changes on cash & cash equivalents
|
(565
|
)
|
424
|
|
|||
|
Net increase (decrease) in cash and cash equivalents
|
(41,831
|
)
|
6,438
|
|
|||
|
Cash and cash equivalents, beginning of period
|
54,292
|
|
23,413
|
|
|||
|
Cash and cash equivalents, end of period
|
12,461
|
|
29,851
|
|
|||
Since our incorporation, we have financed our operations through the sales of shares, units, debt, revenues from research and development collaborations and licenses with corporate partners, interest income on funds available for investment, and government contracts, grants and tax credits.
F- 25
At
March 31, 2018
, we had an aggregate of $
172.6 million
in cash and cash equivalents and short-term investments, as compared to an aggregate of $
139.0 million
in cash and cash equivalents, short-term investments, and restricted investments at
December 31, 2017
.
For the three months ended
March 31, 2018
, operating activities used $20.0 million in cash as compared to $17.5 million of cash used in the three months ended
March 31, 2017
. The increase in net cash used in operating activities is largely related to site consolidation expenses.
For the three months ended
March 31, 2018
, investing activities decreased cash by $75.7 million as we invested the cash received from the preferred share financing.
For the three months ended
March 31, 2018
, financing activities increased cash by $54.4 million due to the completion of Tranche 2 of the private financing netting $66.3 million, offset by repayment of our promissory note to Wells Fargo.
Cash requirements /
At
March 31, 2018
we held an aggregate of $
172.6 million
in cash, comprised of
$12.5 million
in cash and cash equivalents and $
160.1 million
in short-term investments. In October 2017, we announced that we had entered into a subscription agreement with Roivant Sciences Ltd. ("Roivant") for the sale of Preferred Shares to Roivant for gross proceeds of $116.4 million. The initial investment of $50.0 million closed in October 2017, and the remaining amount of $66.4 million closed in January 2018.
We believe we have sufficient cash resources to fund our operations for at least the next 12 months. In the future, substantial additional funds will be required to continue with the active development of our pipeline products and technologies. In particular, our funding needs may vary depending on a number of factors including:
•
the need for additional capital to fund future business development programs;
|
•
|
revenue earned from our legacy collaborative partnerships and licensing agreements, including royalty payments from Alnylam and royalties from sales of Marqibo from Spectrum;
|
|
•
|
revenue earned from ongoing collaborative partnerships, including milestone and royalty payments;
|
|
•
|
the extent to which we continue the development of our product candidates, add new product candidates to our pipeline, or form collaborative relationships to advance our products;
|
|
•
|
our decisions to in-license or acquire additional products or technology for development, in particular for our HBV therapeutics programs;
|
|
•
|
our ability to attract and retain corporate partners, and their effectiveness in carrying out the development and ultimate commercialization of our product candidates;
|
|
•
|
whether batches of drugs that we manufacture fail to meet specifications resulting in delays and investigational and remanufacturing costs;
|
|
•
|
the decisions, and the timing of decisions, made by health regulatory agencies regarding our technology and products;
|
|
•
|
competing technological and market developments;
|
|
•
|
costs associated with prosecuting and enforcing our patent claims and other intellectual property rights, including litigation and arbitration arising in the course of our business activities; and
|
|
•
|
costs associated with our site consolidation plans
|
We intend to seek to obtain funding to maintain and advance our business from a variety of sources including public or private equity or debt financing, collaborative arrangements with pharmaceutical companies and government grants and contracts. There can be no assurance that funding will be available at all or on acceptable terms to permit further development of our products.
If adequate funding is not available, we may be required to delay, reduce or eliminate one or more of our research or development programs or reduce expenses associated with non-core activities. We may need to obtain funds through arrangements with collaborators or others that may require us to relinquish most or all of our rights to product candidates at an earlier stage of development or on less favorable terms than we would otherwise seek if we were better funded. Insufficient financing may also mean failing to prosecute our patents or relinquishing rights to some of our technologies that we would otherwise develop or commercialize.
OFF-BALANCE SHEET ARRANGEMENTS
We do not have any off-balance sheet arrangements that have or are reasonably likely to have a current or future effect on our financial condition, changes in financial condition, revenues or expenses, results of operations, liquidity, capital expenditures or capital resources that is material to investors.
CONTRACTUAL OBLIGATIONS
The following table summarizes our contractual obligations as at
March 31, 2018
:
|
(in millions)
|
Payments Due by Period
|
||||||||||||||||||
|
|
Total
|
Less
than 1 year
|
1 – 3
years
|
3 – 5
years
|
More than
5 years
|
||||||||||||||
|
Contractual Obligations
|
|
|
|
|
|
||||||||||||||
|
Facility leases
|
$
|
7.6
|
|
$
|
1.6
|
|
$
|
1.6
|
|
$
|
1.4
|
|
$
|
3.0
|
|
||||
|
Total
|
$
|
7.6
|
|
$
|
1.6
|
|
$
|
1.6
|
|
$
|
1.4
|
|
$
|
3.0
|
|
||||
F- 26
IMPACT OF INFLATION
Inflation has not had a material impact on our operations.
RELATED PARTY TRANSACTIONS
Series A participating convertible preferred shares
On October 2, 2017, we entered into a subscription agreement with Roivant for the sale of Preferred Shares to Roivant for gross proceeds of
$116.4
million. The Preferred Shares are non-voting and are convertible into common shares at a conversion price of
$7.13
per share (which represents a
15%
premium to the closing price of
$6.20
per share). The purchase price for the Preferred Shares plus an amount equal to
8.75%
per annum, compounded annually, will be subject to mandatory conversion into 22,589,601 common shares on October 16, 2021 (subject to limited exceptions in the event of certain fundamental corporate transactions relating to Arbutus’ capital structure or assets, which would permit earlier conversion at Roivant’s option). After conversion of the Preferred Shares into common shares, based on the number of common shares outstanding on April 30, 2018, Roivant would hold
49.90%
of the Company's common shares. Roivant has agreed to a
four
year lock-up period for this investment and its existing holdings in Arbutus. Roivant has also agreed to a
four
year standstill whereby Roivant will not acquire greater than
49.99%
of the Company's common shares or securities convertible into common shares.
The initial investment of
$50.0
million closed on October 16, 2017, and the remaining amount of
$66.4
million closed on January 12, 2018 following regulatory and shareholder approvals.
Launch with Roivant of jointly-owned Genevant Sciences ("Genevant")
On April 11, 2018, we entered into a agreements with Roivant to launch Genevant, a jointly-owned company focused on the discovery, development, and commercialization of a broad range of RNA-based therapeutics enabled by Arbutus' proprietary lipid nanoparticle (LNP) and ligand conjugate delivery technologies.
Under the terms of the agreement, we will license exclusive rights to our LNP and ligand conjugate delivery platforms to Genevant for RNA-based applications outside of HBV, and Roivant will contribute $37.5 million in transaction-related seed capital for Genevant in exchange for which each party will initially have a
50%
ownership interest in Genevant. Roivant's contribution consists of an initial capital contribution of $22.5 million, and a commitment to contribute a further $15 million at a pre-determined, stepped-up valuation. We will retain all rights to the LNP and conjugate delivery platforms for HBV, and will be entitled to a tiered royalty from Genevant on future sales of products enabled by those delivery platforms. We will also retain the entirety of our royalty entitlement on the commercialization of Alnylam's patisiran. Refer to Part I, Item 2 "Management's Discussion and Analysis of Financial Condition and Results of Operations - Overview" for additional information.
F- 27
OUTSTANDING SHARE DATA
As of
April 30, 2018
, we had 55,167,997 common shares, no par value, outstanding. In addition, we had 6,768,966 stock options outstanding and 1,164,000 Series A participating convertible preferred shares outstanding, which will be mandatorily convertible into 22,589,601 common shares on October 16, 2021. Assuming the stock options were exercised and the preferred shares were converted as of April 30, 2018, we would have had 78,836,494 common shares outstanding at April 30, 2018.
ITEM 3.
QUANTITATIVE AND QUALITATIVE DISCLOSURES ABOUT MARKET RISK
There have been no material changes in our quantitative and qualitative disclosures about market risk from those disclosed in our Annual Report on Form 10-K for the year ended
December 31, 2017
.
ITEM 4.
CONTROLS AND PROCEDURES
As of
March 31, 2018
, an evaluation of the effectiveness of our “disclosure controls and procedures” (as such term is defined in Rules 13a-15(e) and 15d-15(e) under the Securities Exchange Act of 1934) was carried out by our management, with the participation of our Chief Executive Officer (CEO) and Chief Financial Officer (CFO). Based upon this evaluation, the CEO and CFO have concluded that as of
March 31, 2018
, our disclosure controls and procedures are effective to ensure that information required to be disclosed by us in reports that we file or submit under the Exchange Act is (i) recorded, processed, summarized and reported within the time periods specified in Securities and Exchange Commission (the “Commission”) rules and forms and (ii) accumulated and communicated to the management of the registrant, including the CEO and CFO, to allow timely decisions regarding required disclosure.
It should be noted that while the CEO and CFO believe that our disclosure controls and procedures provide a reasonable level of assurance that they are effective, they do not expect that our disclosure controls and procedures or internal control over financial reporting will prevent all errors and fraud. A control system, no matter how well conceived or operated, can provide only reasonable, not absolute, assurance that the objectives of the control system are met.
There have been no changes in our internal control over financial reporting (as defined in Rules 13a–15(f) and 15d–15(f) under the Exchange Act) during the three months ended
March 31, 2018
that have materially affected, or are reasonably likely to materially affect, our internal control over financial reporting.
F- 28
We are involved with various legal matters arising in the ordinary course of business. We make provisions for liabilities when it is both probable that a liability has been incurred and the amount of the loss can be reasonably estimated. Such provisions are reviewed at least quarterly and adjusted to reflect the impact of any settlement negotiations, judicial and administrative rulings, advice of legal counsel, and other information and events pertaining to a particular case. Litigation is inherently unpredictable. Although the ultimate resolution of these various matters cannot be determined at this time, we do not believe that such matters, individually or in the aggregate, will have a material adverse effect on our consolidated results of operations, cash flows, or financial condition.
UBC Arbitration
Certain early work on liposomal delivery systems and related inventions was undertaken by us and assigned to the University of British Columbia (UBC). These inventions are licensed to us by UBC under a license agreement initially entered into in 1998 and subsequently amended in 2001, 2006 and 2007. We have granted sublicenses to these inventions to Alnylam. Alnylam has in turn sublicensed these inventions back to us for discovery, development and commercialization of RNAi products.
On November 10, 2014, the University of British Columbia filed a demand for arbitration against Arbutus Biopharma Corp., BCICAC File No.: DCA-1623. We received UBC’s Statement of Claims on January 16, 2015. In its Statement of Claims, UBC alleges that it is entitled to $3.5 million in allegedly unpaid royalties based on publicly available information, and an unspecified amount based on non-public information. UBC also seeks interest and costs, including legal fees. Arbutus filed its Statement of Defense to UBC’s Statement of Claims on April 27, 2015, denying that UBC is entitled to any unpaid royalties. Arbutus also filed a Counterclaim involving a patent application that Arbutus alleges UBC wrongly licensed to a third party rather than to Arbutus. Arbutus seeks any license payments for said application, and an exclusive worldwide license to said application. The proceeding has been bifurcated into phases, beginning with a liability phase, addressing UBC’s Claims and Arbutus’ Counterclaim, that took place June 2017. The arbitrator determined in the first phase which agreements are sublicense agreements within UBC's claim, and which are not. No finding was made as to whether any licensing fees are due to UBC under these agreements; this will be the subject of the second phase of arbitration. The arbitrator also held that the patent application that is the subject of the Counterclaim was not required to be licensed to Arbutus. A schedule for the remaining phases has not yet been set.
Acuitas Therapeutics
On August 29, 2016, Arbutus provided Acuitas with notice that Arbutus considered Acuitas to be in material breach of their cross-license agreement. The cross-license agreement provides that it may be terminated upon any material breach by the other party 60 days after receipt of written notice of termination describing the material breach in reasonable detail. On October 25, 2016, Acuitas filed a Notice of Civil Claim in the Supreme Court of British Columbia seeking an order that Arbutus perform its obligations under the cross license agreement, for damages ancillary to specific performance, injunctive relief, interest and costs. We disputed Acuitas' position and filed a counterclaim seeking, among other relief, a declaration that the cross-license agreement had been terminated.
On January 10, 2017, we filed an application seeking an order to enjoin Acuitas from entering into any further agreements purporting to sublicense Arbutus' technology from the date of the order to the date of trial or further order from the court. Acuitas filed a response to Arbutus' application and the matter was the subject of a hearing on January 26, 2017, which resulted in the Supreme Court of British Columbia granting a pre-trial injunction against Acuitas. Under the terms of the pre-clinical trial injunction, Acuitas was prevented from entering into any new agreements which include sublicensing of Arbutus’ LNP. On March 7, 2017, Acuitas appealed the injunction decision and on April 3, 2017, the appeal was denied. On September 29, 2017, the injunction order was extended by consent to March 2, 2018. On February 21, 2018, the contractual issues concerning the cross-license agreement (excluding the claims for damages) were settled out of court, resulting in the termination of Acuitas’ rights to further use or sublicense our LNP technology, making permanent the effect of the Court’s prior injunction. We have now consolidated our LNP intellectual property estate, which is the most clinically validated delivery technology suitable for RNAi, mRNA therapeutics, and gene editing applications. The settlement stipulates that the four non-exclusive viral vaccine sublicenses previously granted to Moderna are the only sublicenses to survive. These four sublicenses, previously granted by Acuitas to Moderna under the pre-April 15, 2010 LNP patent families are each limited to a specific viral target. Moderna has no other rights to Arbutus’ broad suite of LNP intellectual property. No other sublicenses of Arbutus
F- 29
technology were provided to third parties by Acuitas and accordingly, no other sublicenses of Arbutus technology by Acuitas survived the settlement. This milestone further establishes us as the owner and only source of an industry-leading LNP delivery technology with the ability to develop a full range of nucleic acid-based applications.
There have been no material changes in our risk factors from those disclosed in our Annual Report on Form 10-K for the fiscal year-ended December 31, 2017.
None.
None.
Not applicable.
None.
See the Exhibit Index hereto.
F- 30
EXHIBIT INDEX
|
Number
|
Description
|
|
|
|
|
|
|
|
|
|
|
|
|
|
101
|
Interactive Data Files
|
* Filed herewith.
F- 31
SIGNATURES
Pursuant to the requirements of the Securities Exchange Act of 1934, the Registrant has duly caused this report to be signed on its behalf by the undersigned, thereunto duly authorized on
May 3, 2018
.
|
ARBUTUS BIOPHARMA CORPORATION
|
||
|
|
By:
|
/s/ Mark Murray
|
|
|
|
Mark Murray
|
|
|
|
President and Chief Executive Officer
|
F- 32
TABLE OF CONTENTS
Part I. Financial InformationItem 1. Financial Statements (unaudited)Item 2. Management S Discussion and Analysis Of Financial Condition and Results Of OperationsItem 3. Quantitative and Qualitative Disclosures About Market RiskItem 4. Controls and ProceduresPart II. Other InformationItem 1. Legal ProceedingsItem 1A. Risk FactorsItem 2. Unregistered Sales Of Equity Securities and Use Of ProceedsItem 3. Defaults Upon Senior SecuritiesItem 4. Mine Safety DisclosuresItem 5. Other InformationItem 6. Exhibits