ARBUTUS BIOPHARMA CORP
10-Ks,20-Fs and 10-Qs
|
|
|
|
|
|
|
|
|
|
|
|
|
|
|
|
|
|
|
|
|
|
|
|
|
|
|
|
|
|
|
|
|
|
|
|
|
|
|
|
|
|
|
|
|
|
|
UNITED STATES
SECURITIES AND EXCHANGE COMMISSION
Washington, D.C. 20549
FORM 10-Q
[X] QUARTERLY REPORT PURSUANT TO SECTION 13 OR 15(d) OF THE SECURITIES EXCHANGE ACT OF 1934
For the quarterly period ended
September 30, 2018
OR
[ ] TRANSITION REPORT PURSUANT TO SECTION 13 OR 15(d) OF THE SECURITIES EXCHANGE ACT OF 1934
For the Transition Period from to
Commission File Number:
001-34949
ARBUTUS BIOPHARMA CORPORATION
(Exact Name of Registrant as Specified in Its Charter)
|
British Columbia, Canada
|
98-0597776
|
|
|
(State or Other Jurisdiction of
|
(I.R.S. Employer
|
|
|
Incorporation or Organization)
|
Identification No.)
|
|
100-8900 Glenlyon Parkway, Burnaby, BC, Canada V5J 5J8
(Address of Principal Executive Offices and Zip Code)
604-419-3200
(Registrant’s Telephone Number, Including Area Code)
Indicate by check mark whether the registrant (1) has filed all reports required to be filed by Section 13 or 15(d) of the Securities Exchange Act of 1934 during the preceding 12 months (or for such shorter period that the registrant was required to file such reports), and (2) has been subject to such filing requirements for the past 90 days. Yes [X] No [ ]
Indicate by check mark whether the registrant has submitted electronically every Interactive Data File required to be submitted pursuant to Rule 405 of Regulation S-T during the preceding 12 months (or for such shorter period that the registrant was required to submit such files). Yes [X] No [ ]
Indicate by check mark whether the registrant is a large accelerated filer, an accelerated filer, a non-accelerated filer, a smaller reporting company, or an emerging growth company. See the definitions of “large accelerated filer,” “accelerated filer,” “smaller reporting company,” and “emerging growth company” in Rule 12b-2 of the Exchange Act. (Check one):
|
Large accelerated filer [ ]
|
Accelerated filer [X]
|
Non-accelerated filer [ ]
|
Smaller reporting company [X]
|
Emerging growth company [ ]
|
If an emerging growth company, indicate by check mark if the registrant has elected not to use the extended transition period for complying with any new or revised financial accounting standards provided pursuant to Section 13(a) of the Exchange Act. [ ]
Indicate by check mark whether the registrant is a shell company (as defined in Rule 12b-2 of the Exchange Act).
Yes [ ] No [X]
As of
October 31, 2018
, the registrant had
55,477,235
common shares, no par value, outstanding.
1
ARBUTUS BIOPHARMA CORP.
TABLE OF CONTENTS
|
Page
|
||
|
|
|
|
|
|
||
2
ARBUTUS BIOPHARMA CORPORATION
(Unaudited)
(Expressed in thousands of U.S. dollars, except share and per share amounts)
(Prepared in accordance with US GAAP)
|
|
September 30,
|
December 31,
|
|||||
|
|
2018
|
2017
|
|||||
|
Assets
|
|
|
|||||
|
Current assets:
|
|
|
|||||
|
Cash and cash equivalents (note 2)
|
$
|
21,933
|
|
$
|
54,292
|
|
|
|
Short-term investments (note 2)
|
120,085
|
|
72,060
|
|
|||
|
Accounts receivable
|
538
|
|
402
|
|
|||
|
Accrued revenue
|
—
|
|
128
|
|
|||
|
Investment tax credits receivable
|
342
|
|
340
|
|
|||
|
Prepaid expenses and other assets
|
1,127
|
|
2,144
|
|
|||
|
Total current assets
|
144,025
|
|
129,366
|
|
|||
|
Restricted investment (note 2)
|
—
|
|
12,601
|
|
|||
|
Investment in Genevant (note 3)
|
24,665
|
|
—
|
|
|||
|
Property and equipment
|
16,813
|
|
24,854
|
|
|||
|
Less accumulated depreciation
|
(6,392
|
)
|
(12,671
|
)
|
|||
|
Property and equipment, net of accumulated depreciation
|
10,421
|
|
12,183
|
|
|||
|
Intangible assets (note 4)
|
43,836
|
|
58,647
|
|
|||
|
Goodwill (note 4)
|
22,471
|
|
24,364
|
|
|||
|
Total assets
|
$
|
245,418
|
|
$
|
237,161
|
|
|
|
Liabilities and stockholders' equity
|
|
|
|||||
|
Current liabilities:
|
|
|
|||||
|
Accounts payable and accrued liabilities (note 7)
|
$
|
8,511
|
|
$
|
10,646
|
|
|
|
Deferred revenue (note 5)
|
649
|
|
2,742
|
|
|||
|
Liability-classified options (note 2)
|
2,738
|
|
1,239
|
|
|||
|
Site consolidation accrual (note 9)
|
770
|
|
—
|
|
|||
|
Total current liabilities
|
12,668
|
|
14,627
|
|
|||
|
Deferred lease incentives, net of current portion
|
656
|
|
693
|
|
|||
|
Loan payable (note 8)
|
—
|
|
12,001
|
|
|||
|
Contingent consideration (notes 2 and 10)
|
4,161
|
|
10,424
|
|
|||
|
Deferred tax liability (note 4)
|
12,661
|
|
16,943
|
|
|||
|
Total liabilities
|
30,146
|
|
54,688
|
|
|||
|
Stockholders’ equity:
|
|
|
|||||
|
Preferred shares (note 6)
|
|||||||
|
Authorized - 1,164,000 with no par value
|
|||||||
|
Issued and outstanding: 1,164,000 (December 31, 2017 - 500,000)
|
123,489
|
|
49,780
|
|
|||
|
Common shares
|
|
|
|
|
|||
|
Authorized - unlimited number with no par value
|
|
|
|
|
|||
|
Issued and outstanding: 55,472,319
(December 31, 2017 - 55,060,662)
|
878,805
|
|
876,108
|
|
|||
|
Additional paid-in capital
|
45,500
|
|
42,840
|
|
|||
|
Deficit
|
(784,325
|
)
|
(738,070
|
)
|
|||
|
Accumulated other comprehensive loss
|
(48,197
|
)
|
(48,185
|
)
|
|||
|
Total stockholders' equity
|
215,272
|
|
182,473
|
|
|||
|
Total liabilities and stockholders' equity
|
$
|
245,418
|
|
$
|
237,161
|
|
|
Nature of business and future operations (note 1)
Contingencies and commitments (note 10)
Related party transactions (note 12)
See accompanying notes to the condensed consolidated financial statements.
1
ARBUTUS BIOPHARMA CORPORATION
(Unaudited)
(Expressed in thousands of U.S. dollars, except share and per share amounts)
(Prepared in accordance with US GAAP)
|
Three months ended
|
Nine months ended
|
|||||||||||||
|
September 30,
|
September 30,
|
|||||||||||||
|
2018
|
2017
|
2018
|
2017
|
|||||||||||
|
Revenue (note 5)
|
$
|
1,587
|
|
$
|
6,892
|
|
$
|
4,267
|
|
$
|
8,166
|
|
||
|
Expenses
|
|
|
||||||||||||
|
Research, development, collaborations and contracts
|
16,566
|
|
15,537
|
|
46,871
|
|
44,854
|
|
||||||
|
General and administrative
|
2,631
|
|
3,659
|
|
10,075
|
|
12,586
|
|
||||||
|
Depreciation of property and equipment
|
497
|
|
593
|
|
1,677
|
|
1,407
|
|
||||||
|
Site consolidation (note 9)
|
(492
|
)
|
—
|
|
3,710
|
|
—
|
|
||||||
|
Impairment of intangible assets (note 4)
|
14,811
|
|
—
|
|
14,811
|
|
—
|
|
||||||
|
Total expenses
|
34,013
|
|
19,789
|
|
77,144
|
|
58,847
|
|
||||||
|
Loss from operations
|
(32,426
|
)
|
(12,897
|
)
|
(72,877
|
)
|
(50,681
|
)
|
||||||
|
Other income (loss)
|
|
|
||||||||||||
|
Interest income
|
756
|
|
337
|
|
2,319
|
|
1,095
|
|
||||||
|
Interest expense
|
—
|
|
(76
|
)
|
(104
|
)
|
(186
|
)
|
||||||
|
Foreign exchange (loss) gain
|
145
|
|
1,233
|
|
(740
|
)
|
2,458
|
|
||||||
|
Gain on investment (note 3)
|
—
|
|
—
|
|
24,884
|
|
—
|
|
||||||
|
Equity investment loss (note 3)
|
(2,838
|
)
|
—
|
|
(2,838
|
)
|
—
|
|
||||||
|
Increase in fair value of warrant liability
|
—
|
|
—
|
|
—
|
|
(22
|
)
|
||||||
|
Decrease (increase) in fair value of contingent consideration (notes 2 and 10)
|
5,608
|
|
(197
|
)
|
6,263
|
|
(1,146
|
)
|
||||||
|
Total other income
|
3,671
|
|
1,297
|
|
29,784
|
|
2,199
|
|
||||||
|
Net (loss) before income taxes
|
$
|
(28,755
|
)
|
$
|
(11,600
|
)
|
$
|
(43,093
|
)
|
$
|
(48,482
|
)
|
||
|
Income tax benefit (note 4)
|
4,282
|
|
—
|
|
4,282
|
|
—
|
|
||||||
|
Net (loss)
|
$
|
(24,473
|
)
|
$
|
(11,600
|
)
|
$
|
(38,811
|
)
|
$
|
(48,482
|
)
|
||
|
Items applicable to preferred shares:
|
||||||||||||||
|
Accrual of coupon on convertible preferred shares
|
(2,567
|
)
|
—
|
|
(7,444
|
)
|
$
|
—
|
|
|||||
|
Net (loss) attributable to common shares
|
$
|
(27,040
|
)
|
$
|
(11,600
|
)
|
$
|
(46,255
|
)
|
$
|
(48,482
|
)
|
||
|
Net (loss) attributable to common shareholders, per share (note 2)
|
|
|
||||||||||||
|
Basic and diluted
|
$
|
(0.49
|
)
|
$
|
(0.21
|
)
|
$
|
(0.84
|
)
|
$
|
(0.89
|
)
|
||
|
Weighted average number of common shares
|
|
|
||||||||||||
|
Basic and diluted
|
55,421,504
|
|
54,877,103
|
|
55,241,284
|
|
54,612,081
|
|
||||||
See accompanying notes to the condensed consolidated financial statements.
2
ARBUTUS BIOPHARMA CORPORATION
Condensed Consolidated Statements of Comprehensive Loss
(Unaudited)
(Expressed in thousands of U.S. dollars, except share and per share amounts)
|
Three months ended
|
Nine months ended
|
||||||||||||||
|
September 30,
|
September 30,
|
||||||||||||||
|
2018
|
2017
|
2018
|
2017
|
||||||||||||
|
Net loss
|
$
|
(24,473
|
)
|
$
|
(11,600
|
)
|
$
|
(38,811
|
)
|
$
|
(48,482
|
)
|
|||
|
Other comprehensive loss:
|
|||||||||||||||
|
Share of other comprehensive loss of equity method investment (note 3)
|
(12
|
)
|
—
|
|
(12
|
)
|
—
|
|
|||||||
|
Comprehensive loss
|
$
|
(24,485
|
)
|
$
|
(11,600
|
)
|
$
|
(38,823
|
)
|
$
|
(48,482
|
)
|
|||
3
ARBUTUS BIOPHARMA CORPORATION
Condensed Consolidated Statement of Stockholders’ Equity
(Unaudited)
(Expressed in thousands of U.S. dollars, except share and per share amounts)
(Prepared in accordance with US GAAP)
|
Convertible Preferred Shares
|
Common Shares
|
|||||||||||||||||||||
|
|
Number
of shares
|
Share
capital
|
Number
of shares |
Share
capital |
Additional paid-in
capital |
Deficit
|
Accumulated other comprehen-
sive loss |
Total
stockholders' equity |
||||||||||||||
|
December 31, 2017
|
500,000
|
|
$
|
49,780
|
|
55,060,662
|
|
$
|
876,108
|
|
$
|
42,840
|
|
$
|
(738,070
|
)
|
$
|
(48,185
|
)
|
$
|
182,473
|
|
|
Issuance of Preferred Shares, net of issuance cost of $135
|
664,000
|
|
66,265
|
|
—
|
|
—
|
|
—
|
|
—
|
|
—
|
|
66,265
|
|
||||||
|
Accretion of coupon on Preferred Shares
|
|
|
2,336
|
|
—
|
|
—
|
|
—
|
|
(2,336
|
)
|
—
|
|
—
|
|
||||||
|
Stock-based compensation
|
—
|
|
—
|
|
—
|
|
—
|
|
1,510
|
|
—
|
|
—
|
|
1,510
|
|
||||||
|
Certain fair value adjustments to liability stock option awards
|
—
|
|
—
|
|
—
|
|
—
|
|
(504
|
)
|
—
|
|
—
|
|
(504
|
)
|
||||||
|
Issuance of common shares pursuant to exercise of options
|
—
|
|
—
|
|
26,541
|
|
180
|
|
(77
|
)
|
—
|
|
—
|
|
103
|
|
||||||
|
Net loss
|
—
|
|
—
|
|
—
|
|
—
|
|
—
|
|
(17,429
|
)
|
—
|
|
(17,429
|
)
|
||||||
|
Balance, March 31, 2018
|
1,164,000
|
|
$
|
118,381
|
|
55,087,203
|
|
$
|
876,288
|
|
$
|
43,769
|
|
$
|
(757,835
|
)
|
$
|
(48,185
|
)
|
$
|
232,418
|
|
|
Accretion of coupon on Preferred Shares
|
—
|
|
2,541
|
|
—
|
|
—
|
|
—
|
|
(2,541
|
)
|
—
|
|
—
|
|
||||||
|
Stock-based compensation
|
—
|
|
—
|
|
—
|
|
—
|
|
1,862
|
|
—
|
|
—
|
|
1,862
|
|
||||||
|
Certain fair value adjustments to liability stock option awards
|
—
|
|
—
|
|
—
|
|
—
|
|
(34
|
)
|
—
|
|
—
|
|
(34
|
)
|
||||||
|
Issuance of common shares pursuant to exercise of options
|
—
|
|
—
|
|
238,059
|
|
1,903
|
|
(1,168
|
)
|
—
|
|
—
|
|
735
|
|
||||||
|
Net loss
|
—
|
|
—
|
|
—
|
|
—
|
|
—
|
|
3,091
|
|
—
|
|
3,091
|
|
||||||
|
Balance, June 30, 2018
|
1,164,000
|
|
$
|
120,922
|
|
55,325,250
|
|
$
|
878,191
|
|
$
|
44,429
|
|
$
|
(757,285
|
)
|
$
|
(48,185
|
)
|
$
|
238,072
|
|
|
Accretion of coupon on Preferred Shares
|
—
|
|
2,567
|
|
—
|
|
—
|
|
—
|
|
(2,567
|
)
|
—
|
|
—
|
|
||||||
|
Stock-based compensation
|
—
|
|
—
|
|
—
|
|
—
|
|
1,658
|
|
—
|
|
—
|
|
1,658
|
|
||||||
|
Certain fair value adjustments to liability stock option awards
|
—
|
|
—
|
|
—
|
|
—
|
|
(407
|
)
|
—
|
|
—
|
|
(407
|
)
|
||||||
|
Issuance of common shares pursuant to exercise of options
|
—
|
|
—
|
|
147,069
|
|
614
|
|
(180
|
)
|
—
|
|
—
|
|
434
|
|
||||||
|
Other comprehensive income (loss) - currency translation adjustment
|
—
|
|
—
|
|
—
|
|
—
|
|
—
|
|
—
|
|
(12
|
)
|
(12
|
)
|
||||||
|
Net loss
|
—
|
|
—
|
|
—
|
|
—
|
|
—
|
|
(24,473
|
)
|
—
|
|
(24,473
|
)
|
||||||
|
Balance, September 30, 2018
|
1,164,000
|
|
$
|
123,489
|
|
55,472,319
|
|
$
|
878,805
|
|
$
|
45,500
|
|
$
|
(784,325
|
)
|
$
|
(48,197
|
)
|
$
|
215,272
|
|
See accompanying notes to the condensed consolidated financial statements.
4
ARBUTUS BIOPHARMA CORPORATION
(Unaudited)
(Expressed in thousands of U.S. dollars)
(Prepared in accordance with US GAAP)
|
|
Three months ended
|
Nine months ended
|
||||||||||||
|
|
September 30,
|
September 30,
|
||||||||||||
|
|
2018
|
2017
|
2018
|
2017
|
||||||||||
|
OPERATING ACTIVITIES
|
|
|
||||||||||||
|
Net (loss) for the period
|
$
|
(24,473
|
)
|
$
|
(11,600
|
)
|
$
|
(38,811
|
)
|
$
|
(48,482
|
)
|
||
|
Items not involving cash:
|
|
|
||||||||||||
|
Deferred income tax benefit
|
(4,282
|
)
|
—
|
|
(4,282
|
)
|
—
|
|
||||||
|
Depreciation of property and equipment
|
497
|
|
593
|
|
1,677
|
|
1,407
|
|
||||||
|
Gain on sale of property and equipment
|
(26
|
)
|
—
|
|
(26
|
)
|
—
|
|
||||||
|
Stock-based compensation - research, development, collaborations and contract expenses
|
1,301
|
|
2,468
|
|
3,952
|
|
8,145
|
|
||||||
|
Stock-based compensation - general and administrative
expenses |
527
|
|
1,511
|
|
1,493
|
|
5,440
|
|
||||||
|
Unrealized foreign exchange (gains) losses
|
(131
|
)
|
(1,328
|
)
|
795
|
|
(2,578
|
)
|
||||||
|
Change in fair value of warrant liability
|
—
|
|
—
|
|
—
|
|
22
|
|
||||||
|
Change in fair value of contingent consideration
|
(5,608
|
)
|
197
|
|
(6,263
|
)
|
1,146
|
|
||||||
|
Impairment of intangible assets
|
14,811
|
|
—
|
|
14,811
|
|
—
|
|
||||||
|
Site consolidation non-cash portion
|
—
|
|
—
|
|
396
|
|
—
|
|
||||||
|
Gain on equity investment
|
—
|
|
—
|
|
(24,884
|
)
|
—
|
|
||||||
|
Equity investment loss
|
2,838
|
|
—
|
|
2,838
|
|
—
|
|
||||||
|
Net change in non-cash operating items:
|
|
|
||||||||||||
|
Accounts receivable
|
784
|
|
196
|
|
(136
|
)
|
(573
|
)
|
||||||
|
Accrued revenue
|
—
|
|
—
|
|
128
|
|
—
|
|
||||||
|
Deferred lease incentives
|
—
|
|
744
|
|
—
|
|
744
|
|
||||||
|
Investment tax credits receivable
|
—
|
|
—
|
|
(2
|
)
|
133
|
|
||||||
|
Prepaid expenses and other assets
|
109
|
|
83
|
|
1,017
|
|
(189
|
)
|
||||||
|
Accounts payable and accrued liabilities
|
1,094
|
|
(1,805
|
)
|
(2,171
|
)
|
(3,513
|
)
|
||||||
|
Deferred revenue
|
(325
|
)
|
(6,739
|
)
|
(2,093
|
)
|
—
|
|
||||||
|
Site consolidation accrual
|
(320
|
)
|
—
|
|
770
|
|
—
|
|
||||||
|
Net cash used in operating activities
|
(13,204
|
)
|
(15,680
|
)
|
(50,791
|
)
|
(38,298
|
)
|
||||||
|
INVESTING ACTIVITIES
|
|
|
||||||||||||
|
Disposition (acquisition) of short and long-term investments, net
|
24,590
|
|
5,843
|
|
(48,025
|
)
|
34,192
|
|
||||||
|
Proceeds from sale of property and equipment
|
25
|
|
—
|
|
25
|
|
—
|
|
||||||
|
Acquisition of property and equipment
|
(237
|
)
|
(538
|
)
|
(911
|
)
|
(7,076
|
)
|
||||||
|
Net cash provided by (used) in investing activities
|
24,378
|
|
5,305
|
|
(48,911
|
)
|
27,116
|
|
||||||
|
FINANCING ACTIVITIES
|
|
|
||||||||||||
|
Promissory note repayment (note 8)
|
—
|
|
—
|
|
(12,001
|
)
|
—
|
|
||||||
|
Proceeds from sale of Series A Preferred Shares, net of
issuance costs
|
—
|
|
—
|
|
66,265
|
|
—
|
|
||||||
|
Issuance of common shares pursuant to exercise of options
|
435
|
|
61
|
|
1,273
|
|
66
|
|
||||||
|
Issuance of common shares pursuant to exercise of warrants
|
—
|
|
—
|
|
—
|
|
353
|
|
||||||
|
Net cash provided by financing activities
|
435
|
|
61
|
|
55,537
|
|
419
|
|
||||||
|
Effect of foreign exchange rate changes on cash and cash equivalents
|
131
|
|
1,327
|
|
(795
|
)
|
2,575
|
|
||||||
|
Increase (Decrease) in cash, cash equivalents, and restricted investment
|
11,740
|
|
(8,987
|
)
|
(44,960
|
)
|
(8,188
|
)
|
||||||
|
Cash, cash equivalents, and restricted investment, beginning of period
|
10,193
|
|
24,212
|
|
66,893
|
|
23,413
|
|
||||||
|
Cash, cash equivalents, and restricted investment, end of period
|
$
|
21,933
|
|
$
|
15,225
|
|
$
|
21,933
|
|
$
|
15,225
|
|
||
|
Supplemental cash flow information
|
|
|
||||||||||||
|
Non-cash transactions:
|
|
|
||||||||||||
|
Investment tax credit received
|
$
|
—
|
|
$
|
108
|
|
$
|
—
|
|
$
|
108
|
|
||
|
Acquired property and equipment in trade payables
|
$
|
—
|
|
$
|
—
|
|
$
|
—
|
|
$
|
6
|
|
||
|
Preferred shares dividends accrued (note 6)
|
$
|
2,567
|
|
$
|
—
|
|
$
|
7,444
|
|
$
|
—
|
|
||
|
Investment in Genevant (note 3)
|
$
|
—
|
|
$
|
—
|
|
$
|
24,665
|
|
$
|
—
|
|
||
See accompanying notes to the condensed consolidated financial statements.
5
ARBUTUS BIOPHARMA CORPORATION
Notes to Condensed Consolidated Financial Statements
(Tabular amounts in thousands of US Dollars, except share and per share amounts)
1.
Nature of business and future operations
Arbutus Biopharma Corporation (the “Company” or “Arbutus”) is a biopharmaceutical business dedicated to discovering, developing, and commercializing a cure for patients suffering from chronic hepatitis B infection, a disease of the liver caused by the hepatitis B virus (“HBV”). To pursue its strategy of developing a curative combination regimen, the Company has assembled a pipeline of multiple drug candidates with differing and complementary mechanisms of action targeting HBV.
The success of the Company is dependent on obtaining the necessary regulatory approvals to bring its products to market and achieving profitable operations. The Company's research and development activities and commercialization of its products are dependent on its ability to successfully complete these activities and to obtain adequate financing through a combination of financing activities and operations. It is not possible to predict either the outcome of the Company's existing or future research and development programs or the Company’s ability to continue to fund these programs in the future.
2.
Significant accounting policies
Basis of presentation
These unaudited condensed consolidated financial statements have been prepared in accordance with U.S. generally accepted accounting principles (“U.S. GAAP”) for interim financial statements and accordingly, do not include all disclosures required for annual financial statements. These statements should be read in conjunction with the Company’s audited consolidated financial statements and notes thereto for the year ended
December 31, 2017
included in the Company’s Annual Report on Form 10-K for the year ended
December 31, 2017
. These unaudited condensed consolidated financial statements reflect, in the opinion of management, all adjustments and reclassifications necessary to fairly present the financial position, results of operations and cash flows as of
September 30, 2018
and for all other periods presented. The results of operations for the three and
nine
months ended
September 30, 2018
and
September 30, 2017
, respectively, are not necessarily indicative of the results for the full year. These unaudited condensed consolidated financial statements follow the same significant accounting policies as those described in the notes to the audited consolidated financial statements of the Company for the year ended
December 31, 2017
, except as described below under Recent Accounting Pronouncements.
Principles of Consolidation
These unaudited condensed consolidated financial statements include the accounts of the Company and its
two
wholly-owned subsidiaries, Arbutus Biopharma Inc. ("Arbutus Inc.") and Protiva Biotherapeutics Inc. ("Protiva"). On January 1, 2018, Protiva was amalgamated with the Company. All intercompany transactions and balances have been eliminated in consolidation.
Income or loss per share
The Company follows the two-class method when computing net loss attributable to common shareholders per share as the Company has issued Series A participating convertible preferred shares (the "Preferred Shares" (as further described in note 6) that meet the definition of participating securities. The Preferred Shares entitle the holders to participate in dividends but do not require the holders to participate in losses of the Company. Accordingly, if the Company reports a net loss attributable to common shareholders net losses are not allocated to holders of the Preferred Shares.
6
Loss per share is calculated based on the weighted average number of common shares outstanding. Diluted loss per share does not differ from basic loss per share since the effect of the Company’s stock options, liability-classified stock option awards, and warrants are anti-dilutive. During the
nine
months ended
September 30, 2018
, potential common shares of
24,211,817
, (
nine
months ended
September 30, 2017
–
5,339,714
), consisting of the as-if converted number of Preferred shares, warrants and stock options, were excluded from the calculation of loss per common share because their inclusion would be anti-dilutive.
The following table sets out the computation of basic and diluted net income (loss) attributable to shareholders per share:
|
|
Three months ended September 30,
|
Nine months ended September 30,
|
|||||||||||
|
|
2018
|
2018
|
|||||||||||
|
Numerator:
|
Common Shares
|
Preferred Shares
|
Common Shares
|
Preferred Shares
|
|||||||||
|
Allocation of distributable earnings
|
$
|
—
|
|
$
|
2,567
|
|
$
|
—
|
|
$
|
7,444
|
|
|
|
Allocation of undistributed loss
|
(27,040
|
)
|
—
|
|
(46,255
|
)
|
—
|
|
|||||
|
Allocation of income (loss) attributed to shareholders
|
$
|
(27,040
|
)
|
$
|
2,567
|
|
$
|
(46,255
|
)
|
$
|
7,444
|
|
|
|
Denominator:
|
|
|
|||||||||||
|
Weighted average number of shares - basic and diluted
|
55,421,504
|
|
1,164,000
|
|
55,241,284
|
|
1,134,813
|
|
|||||
|
Basic and diluted net income (loss) attributable to shareholders per share
|
$
|
(0.49
|
)
|
$
|
2.21
|
|
$
|
(0.84
|
)
|
$
|
6.56
|
|
|
Fair value of financial instruments
The Company measures certain financial instruments and other items at fair value.
To determine the fair value, the Company uses the fair value hierarchy for inputs used in measuring fair value that maximizes the use of observable inputs and minimizes the use of unobservable inputs by requiring that the most observable inputs be used when available. Observable inputs are inputs market participants would use to value an asset or liability and are developed based on market data obtained from independent sources. Unobservable inputs are inputs based on assumptions about the factors market participants would use to value an asset or liability. The three levels of inputs that may be used to measure fair value are as follows:
|
•
|
Level 1 inputs are quoted market prices for identical instruments available in active markets.
|
|
•
|
Level 2 inputs are inputs other than quoted prices included within Level 1 that are observable for the asset or liability either directly or indirectly. If the asset or liability has a contractual term, the input must be observable for substantially the full term. An example includes quoted market prices for similar assets or liabilities in active markets.
|
|
•
|
Level 3 inputs are unobservable inputs for the asset or liability and will reflect management’s assumptions about market assumptions that would be used to price the asset or liability.
|
7
The following table presents information about the Company’s assets and liabilities that are measured at fair value on a recurring basis, and indicates the fair value hierarchy of the valuation techniques used to determine such fair value:
|
|
Level 1
|
|
Level 2
|
|
Level 3
|
|
September 30, 2018
|
|
|||||||
|
Assets
|
|
|
|
|
|||||||||||
|
Cash and cash equivalents
|
$
|
21,933
|
|
—
|
|
—
|
|
$
|
21,933
|
|
|||||
|
Short-term investments
|
120,085
|
|
—
|
|
—
|
|
120,085
|
|
|||||||
|
Total
|
$
|
142,018
|
|
$
|
—
|
|
$
|
—
|
|
$
|
142,018
|
|
|||
|
Liabilities
|
|
|
|
|
|||||||||||
|
Liability-classified options
|
—
|
|
—
|
|
$
|
2,738
|
|
$
|
2,738
|
|
|||||
|
Contingent consideration
|
—
|
|
—
|
|
4,161
|
|
4,161
|
|
|||||||
|
Total
|
$
|
—
|
|
$
|
—
|
|
$
|
6,899
|
|
$
|
6,899
|
|
|||
|
|
Level 1
|
|
Level 2
|
|
Level 3
|
|
December 31, 2017
|
|
|||||||
|
Assets
|
|
|
|
|
|||||||||||
|
Cash and cash equivalents
|
$
|
54,292
|
|
—
|
|
—
|
|
$
|
54,292
|
|
|||||
|
Short-term investments
|
72,060
|
|
—
|
|
—
|
|
72,060
|
|
|||||||
|
Restricted cash
|
12,601
|
|
—
|
|
—
|
|
12,601
|
|
|||||||
|
Total
|
$
|
138,953
|
|
$
|
—
|
|
$
|
—
|
|
$
|
138,953
|
|
|||
|
Liabilities
|
|
|
|
|
|||||||||||
|
Liability-classified options
|
—
|
|
—
|
|
$
|
1,239
|
|
$
|
1,239
|
|
|||||
|
Contingent consideration
|
—
|
|
—
|
|
10,424
|
|
10,424
|
|
|||||||
|
Total
|
$
|
—
|
|
$
|
—
|
|
$
|
11,663
|
|
$
|
11,663
|
|
|||
The following table presents the changes in fair value of the Company’s liability-classified stock option awards:
|
|
Liability at beginning of the period
|
Fair value of liability-classified options exercised in the period
|
Increase in fair
value of liability
|
Liability at end
of the period
|
|||||||||||
|
Nine months ended September 30, 2017
|
$
|
553
|
|
$
|
(103
|
)
|
$
|
1,367
|
|
$
|
1,817
|
|
|||
|
Nine months ended September 30, 2018
|
$
|
1,239
|
|
$
|
—
|
|
$
|
1,499
|
|
$
|
2,738
|
|
|||
The following table presents the changes in fair value of the Company’s contingent consideration:
|
|
Liability at beginning of the period
|
Increase (decrease) in fair value of Contingent Consideration
|
Liability at end of the period
|
||||||||
|
Nine months ended September 30, 2017
|
$
|
9,065
|
|
$
|
1,146
|
|
$
|
10,211
|
|
||
|
Nine months ended September 30, 2018
|
$
|
10,424
|
|
$
|
(6,263
|
)
|
$
|
4,161
|
|
||
8
Equity method investment
The Company accounts for its investment in associated companies in accordance with the Financial Accounting Standards Board ("FASB") Accounting Standards Codification ("ASC") 323,
Investments - Equity Method and Joint Ventures
("ASC
323"). In accordance with ASC 323, associated companies are accounted for as equity method investments. Results of associated companies are presented on a one-line basis. Investments in, and advances to, associated companies are presented on a one-line basis in the caption “Investment in Genevant” in the Company's condensed consolidated balance sheets, net of allowance for losses, which represents the Company's best estimate of probable losses inherent in such assets. The Company's proportionate share of any associated companies' net income or loss is presented on a one-line basis in the caption "Equity investment loss" in the Company's condensed consolidated statement of operations Transactions between the Company and any associated companies are eliminated on a basis proportional to the Company's ownership interest. Financial results of Genevant are recorded on a one-quarter lag basis.
Recent accounting pronouncements
From time to time, new accounting pronouncements are issued by the FASB or other standard setting bodies that are adopted by the Company as of the specified effective date. Unless otherwise discussed, the Company believes that the impact of recently issued standards that are not yet effective will not have a material impact on the Company's financial position or results of operations upon adoption.
ASC 606,
Revenue From Contracts with Customers
("ASC 606") became effective for the Company on January 1, 2018, and was adopted using the modified retrospective method under which previously presented financial statements are not restated and the cumulative effect of adopting ASC 606 on contracts in process is recognized by an adjustment to retained earnings at the effective date. The adoption of ASC 606 did not change the Company’s recognized revenue under its ongoing significant collaboration and license agreements and no cumulative effect adjustment was required.
The new guidance in ASC 606 requires an entity to recognize the amount of revenue to which it expects to be entitled for the transfer of promised goods or services to customers under a five-step model: (i) identify contract(s) with a customer; (ii) identify the performance obligations in the contract; (iii) determine the transaction price; (iv) allocate the transaction price to the performance obligations in the contract; and (v) recognize revenue when or as a performance obligation is satisfied.
The Company generates revenue primarily through collaboration agreements and license agreements. Such agreements may require the Company to deliver various rights and/or services, including intellectual property rights or licenses and research and development services. Under such agreements, the Company is generally eligible to receive non-refundable upfront payments, funding for research and development services, milestone payments, and royalties.
In contracts where the Company has more than one performance obligation to provide its customer with goods or services, each performance obligation is evaluated to determine whether it is distinct based on whether (i) the customer can benefit from the good or service either on its own or together with other resources that are readily available and (ii) the good or service is separately identifiable from other promises in the contract. The consideration under the contract is then allocated between the distinct performance obligations based on their respective relative stand-alone selling prices. The estimated stand-alone selling price of each deliverable reflects the Company’s best estimate of what the selling price would be if the deliverable was regularly sold on a stand-alone basis and is determined by reference to market rates for the good or service when sold to others or by using an adjusted market assessment approach if the selling price on a stand-alone basis is not available.
The consideration allocated to each distinct performance obligation is recognized as revenue when control is transferred to the customer for the related goods or services. Consideration associated with at-risk substantive performance milestones, including sales-based milestones, is recognized as revenue when it is probable that a significant reversal of the cumulative revenue recognized will not occur. Sales-based royalties received in connection with licenses of intellectual property are subject to a specific exception in the revenue standards, whereby the consideration is not included in the transaction price and recognized in revenue until the customer’s subsequent sales or usages occur.
9
In August 2016, the FASB issued ASU No. 2016-15, Statement of Cash Flows (Topic 230): Classification of Certain Cash Receipts and Cash Payments ("ASU 2016-15"). ASU 2016-15 clarifies certain aspects of the statement of cash flows, and aims to reduce diversity in practice regarding how certain transactions are classified in the statement of cash flows. ASU 2016-15 was effective as of January 1, 2018 and was adopted by the Company in the first quarter of 2018. The adoption of ASU 2016-15 did not have a material impact on the Company's condensed consolidated balance sheets or condensed consolidated statements of operations and comprehensive income (loss).
In November 2016, the FASB issued ASU No. 2016-18, Statement of Cash Flows (Topic 230): Restricted Cash ("ASU 2016-18") that clarifies how entities should present restricted cash in the statement of cash flows. Under ASU 2015-18, changes in total cash, inclusive of restricted cash, should be reflected in the statement of cash flows. As a result, transfers between cash and restricted cash are no longer reflected as activity within the statement of cash flows. The Company adopted ASU 2016-18 on January 1, 2018. The adoption of ASU 2018-18 did not have a material impact on the Company's condensed consolidated statements of cash flows.
In October 2016 the FASB issued ASU No. 2016-16, Income Taxes (Topic 740): Intra-Entity Transfer of Assets Other Than Inventory ("ASU 2016-16"). ASU 2016-16 eliminates the deferral of the tax effects of intra-entity asset transfers other than inventory. As a result, the income tax consequences from the intra-entity transfer of an asset other than inventory and associated changes to deferred taxes will be recognized when the transfer occurs. The Company adopted ASU 2016-16 in the first quarter of 2018. The adoption of ASU 2016-16 did not have a material impact on the Company's condensed consolidated balance sheets or condensed consolidated statements of operations and comprehensive income (loss).
In February 2016, the FASB issued ASU No. 2016-02, Leases (Topic 842): Recognition and Measurement of Financial Assets and Financial Liabilities ("ASU 2016-02"). ASU 2016-02 supersedes Topic 840, Leases and requires the recognition of lease assets and lease liabilities by lessees for those leases classified as operating leases under previous GAAP. ASU 2016-02 retains a distinction between finance leases and operating leases, with cash payments from operating leases classified within operating activities in the statement of cash flows. The amendments in ASU 2016-02 are effective for fiscal years beginning after December 15, 2018 for public business entities, which for the Company means January 1, 2019. The Company does not plan to early adopt ASU 2016-02 and the extent of the impact of its adoption has not yet been determined.
In June 2018, the FASB issued ASU No. 2018-07, Compensation-Stock Compensation (Topic 718), Improvements to Nonemployee Share-Based Payment Accounting ("ASU 2018-07"). ASU 2018-07 provides guidance about aligning nonemployee and employee share-based payment accounting. ASU 2018-07 is effective for all entities for annual periods, and interim periods within those annual periods, beginning after December 15, 2018. The Company early adopted the new standard as of January 1, 2018. The adoption of ASU 2018-07 did not have a material impact on the Company's condensed consolidated balance sheets or condensed consolidated statements of operations and comprehensive income (loss).
3.
Equity method investment
On April 11, 2018, the Company entered into an agreement (the "Genevant Agreement") with Roivant Sciences Ltd.("Roivant") to launch Genevant Sciences Ltd. ("Genevant"), a jointly-owned company focused on the discovery, development, and commercialization of a broad range of RNA-based therapeutics enabled by the Company's proprietary lipid nanoparticle ("LNP") and ligand conjugate delivery technologies.
Under the terms of the Genevant Agreement, the Company contributed a license for the delivery technologies and fixed assets with a carrying value of
$600,000
. The contributed license provides Genevant with exclusive rights to the LNP and ligand conjugate delivery platforms for RNA-based applications outside of HBV. Roivant contributed $
37,500,000
in transaction-related seed capital to Genevant, consisting of an initial capital contribution of
$22,500,000
and a subsequent investment of
$15,000,000
at a pre-determined, stepped-up valuation. The Company retains all rights to the LNP and ligand conjugate delivery platforms for HBV, and is entitled to a tiered low single-digit royalty from Genevant on future sales of products enabled by those delivery platforms. The Company also retains the entirety of its royalty entitlement on the commercialization of Alnylam Pharmaceutical, Inc.'s ("Alnylam") Onpattro.
10
The Company determined that, since the Genevant Agreement stipulates that significant decisions relating to the management of Genevant must be shared between the Company and Roivant, the Company does not control Genevant but does exercise significant influence over it and, will therefore, account for its investment in Genevant using the equity method. On April 11, 2018, the Company and Roivant each received a
50%
ownership interest in Genevant. As a result of a subsequent investment in Genevant by Roivant and other parties, as of September 30, 2018, the Company owned approximately
40%
of the common equity of Genevant.
The Company determined that the transfer of assets, license and fixed assets to Genevant did not constitute a discontinuance of operations.
The Company's contribution of licenses to the delivery technologies and fixed assets in exchange for an equity interest in Genevant resulted in a gain of
$24,884,000
during the second quarter of 2018. The gain reflects the fair value of the equity in Genevant received by the Company less the
$600,000
carrying value of the fixed assets contributed by the Company and
$1,893,000
of goodwill allocated to Genevant based upon the relative fair value of Genevant to the Company as of April 11, 2018. The fair value of equity in Genevant received by the Company was based on a valuation performed by external valuation experts.
The following table provides a summary of the Company's investment in Genevant for the three and nine months ended
September 30, 2018
, in thousands:
|
Three months ended September 30, 2018
|
Nine months ended September 30, 2018
|
|||||
|
Beginning balance
|
$
|
27,446
|
|
$
|
—
|
|
|
Investment in Genevant
|
—
|
|
27,377
|
|
||
|
Stock based compensation expense
|
69
|
|
138
|
|
||
|
Share of loss
|
(2,838
|
)
|
(2,838
|
)
|
||
|
Share of comprehensive loss - currency translation adjustment
|
(12
|
)
|
(12
|
)
|
||
|
Ending balance
|
$
|
24,665
|
|
$
|
24,665
|
|
The basis difference between the Company’s carrying value in Genevant and the Company’s share of Genevant's net assets is attributed primarily to definite-lived intangible assets (the delivery technology transferred to Genevant) and is being amortized over 11 years.
4.
Intangible assets and goodwill
All in-process research and development ("IPR&D") acquired is currently classified as indefinite-lived and is not currently being amortized. IPR&D becomes definite-lived upon the completion or abandonment of the associated research and development efforts, and will be amortized from that time over an estimated useful life based on respective patent terms. The Company evaluates the recoverable amount of intangible assets on an annual basis and performs an annual evaluation of goodwill as of December 31 of each year, unless there is an event or change in the business that could indicate impairment, in which case earlier testing is performed.
Intangible assets impairment evaluation
During the three months ended
September 30, 2018
, the Company recorded an intangible assets impairment charge of
$14,811,000
and a corresponding income tax benefit of $
4,282,000
related to the decrease in deferred tax liability for the indefinite delay of further development of its AB-423 program in the Antigen Inhibitor drug class as a result of the Company's decision to advance its second generation capsid agent into the HBV patient portion of its phase 1 clinical trial.
11
The following table summarizes the carrying values of the intangible assets as of
September 30, 2018
, in thousands:
|
September 30, 2018
|
|
December 31, 2017
|
|
|||
|
IPR&D – Immune Modulators
|
$
|
—
|
|
$
|
—
|
|
|
IPR&D – Antigen Inhibitors
|
—
|
|
14,811
|
|
||
|
IPR&D – cccDNA Sterilizers
|
43,836
|
|
43,836
|
|
||
|
Total Intangible Assets
|
$
|
43,836
|
|
$
|
58,647
|
|
Goodwill
The Company has one reporting unit for goodwill purposes due to the fact that resource allocation and performance is largely driven by consolidated metrics. In addition, there is limited discrete financial information available and reviewed below the consolidated level.
In the nine months ended
September 30, 2018
, the Company allocated
$1,893,000
of goodwill to its investment in Genevant based upon the relative fair value of Genevant to the Company as of April 11, 2018 (see note 3 above), as a result of which the carrying value of goodwill decreased by this same amount. As of September 30, 2018, the Company performed a qualitative assessment and had not identified any indicators of impairment of goodwill, and therefore
no
impairment charge on goodwill was recorded during the three and nine months then ended (three and
nine
months ended
September 30, 2017
-
$0
). The intangible impairment charge of
$14,811,000
described above represents a discrete, program specific event and was not considered to be an indicator of impairment of goodwill.
5.
Collaborations, contracts and licensing agreements
The following table set forth revenue recognized under collaborations, contracts and licensing agreements, in thousands:
|
|
Three months ended September 30,
|
Nine months ended September 30,
|
|||||||||||||
|
|
2018
|
|
2017
|
|
2018
|
|
2017
|
|
|||||||
|
Alexion (a)
|
$
|
—
|
|
$
|
6,859
|
|
$
|
—
|
|
$
|
7,956
|
|
|||
|
Gritstone (b)
|
313
|
|
—
|
|
2,400
|
|
—
|
|
|||||||
|
Gritstone milestone (c)
|
1,250
|
|
—
|
|
1,250
|
|
—
|
|
|||||||
|
Other milestone and royalty payments
|
24
|
|
33
|
|
617
|
|
210
|
|
|||||||
|
Total revenue
|
$
|
1,587
|
|
$
|
6,892
|
|
$
|
4,267
|
|
$
|
8,166
|
|
|||
The following table sets forth deferred collaborations and contracts revenue:
|
|
September 30, 2018
|
|
December 31, 2017
|
|
|||
|
Gritstone (b)
|
$
|
649
|
|
$
|
2,727
|
|
|
|
Other deferred revenue
|
—
|
|
15
|
|
|||
|
Total deferred revenue
|
$
|
649
|
|
$
|
2,742
|
|
|
(a) License Agreement with Alexion Pharmaceuticals, Inc. ("Alexion")
On March 16, 2017, the Company entered into a license agreement with Alexion that entitles Alexion to research, develop, manufacture, and commercialize products with the Company's "LNP" technology in their single orphan disease target. In consideration for the rights granted under the agreement, the Company received a
$7,500,000
non-refundable upfront cash payment, as well as payments for services provided. This upfront payment was amortized over the period of expected benefit.
On July 27, 2017, the Company received notice of termination from Alexion for the Company's LNP license agreement. The termination was driven by a strategic review of Alexion's business and research and development portfolio, which included a decision to discontinue development of mRNA therapeutics. The
$7,500,000
upfront payment received in March 2017 is non-
12
refundable and the Company recorded the remaining deferred revenue balance, as well as any revenue and costs related to closeout procedures, in the condensed consolidated statement of operations and comprehensive loss for the period ended September 30, 2017.
(b) License agreement with Gritstone Oncology, Inc. ("Gritstone")
On October 16, 2017, the Company entered into a license agreement with Gritstone that entitles Gritstone to research, develop, manufacture and commercialize products with the Company’s LNP technology. The Company received an upfront payment in November 2017, and is eligible to receive future potential payments including research services, development and commercial milestone payments and royalty payments on future product sales. As a result of the Company's agreement with Genevant (see note 3 for details), from April 11, 2018 going forward Genevant is entitled to
50%
of the revenues earned by the Company from Gritstone and the Company will record revenues on a net basis.
The Company determined the promised goods and services under the license agreement included the rights and license granted, involvement in the joint steering committee, and other services provided, as determined under the research plan. The license and involvement in the joint steering committee have been determined by the Company to be distinct. Therefore, these promised goods and services are treated as one performance obligation and recognized as revenue over the performance period as the Company transfers the technical "know-how" for the customized formulations.
The Company has determined that other materials and services provided have standalone value. The relative fair values are estimated upon the execution of each activity and charged at rates comparable to market with embedded margins on each service activity.
(c) Gritstone Milestone
During the three months ended September 30, 2018, Gritstone paid a milestone payment of
$2,500,000
pursuant to the license agreement, half of which went to the Company and half of which ($
1,250,000
) was paid to Genevant.
6. Share capital
Series A participating convertible preferred shares
On October 2, 2017, the Company announced that it entered into a subscription agreement with Roivant for the sale of
1,164,000
Preferred Shares to Roivant for gross proceeds of
$116,400,000
. The Preferred Shares are non-voting and are convertible into common shares at an initial conversion price of
$7.13
per share. The purchase price for the Preferred Shares plus an amount equal to
8.75%
per annum, compounded annually, will be subject to mandatory conversion into
22,589,601
common shares on October 16, 2021 (subject to limited exceptions in the event of certain fundamental corporate transactions relating to Arbutus’ capital structure or assets, which would permit earlier conversion at Roivant’s option). After conversion of the Preferred Shares into common shares, based on the number of common shares outstanding on October 2, 2017, Roivant would hold
49.90%
of the Company's common shares. Roivant agreed to a
four
year lock-up period for this investment and its existing holdings in the Company. Roivant also agreed to a
four
year standstill whereby Roivant will not acquire greater than
49.99%
of the Company's common shares or securities convertible into common shares.
The initial investment of
$50,000,000
closed on October 16, 2017, and the remaining amount of
$66,400,000
closed on January 12, 2018 following regulatory and shareholder approvals.
The Company records the Preferred Shares wholly as equity under ASC 480,
Distinguishing Liabilities From Equity,
with no bifurcation of conversion feature from the host contract, given that the Preferred Shares cannot be cash settled and the redemption features are within the Company's control, which include a fixed conversion ratio with predetermined timing and proceeds. The Company accrues for the
8.75%
per annum compounding coupon at each reporting period end date as an increase to preferred share capital, and an increase to deficit (see Condensed Consolidated Statement of Stockholders' Equity).
13
7. Accounts payable and accrued liabilities
Accounts payable and accrued liabilities are comprised of the following, in thousands:
|
|
September 30, 2018
|
|
December 31, 2017
|
|
|||
|
Trade accounts payable
|
$
|
3,075
|
|
$
|
1,987
|
|
|
|
Research and development accruals
|
4,178
|
|
4,937
|
|
|||
|
Professional fee accruals
|
722
|
|
429
|
|
|||
|
Deferred lease inducements
|
18
|
|
42
|
|
|||
|
Payroll accruals
|
514
|
|
2,893
|
|
|||
|
Other accrued liabilities
|
4
|
|
358
|
|
|||
|
|
$
|
8,511
|
|
$
|
10,646
|
|
|
8. Loan payable
On December 27, 2016, the Company obtained a
three
-year loan of
$12,001,000
from Wells Fargo in the form of a promissory note for the purpose of financing its operations, including the expansion of laboratory facilities for its U.S. operations. The loan accrued interest daily. The variable component was the one-month London Interbank Offered Rate (LIBOR), and a margin of
1.25%
per annum. The carrying value of the loan was recorded at the principal plus any accrued interest not yet paid. The loan was due on December 27, 2019.
The loan was secured by the Company's cash of
$12,601,000
, that was restricted from use until the loan was settled in full. The Company invested the restricted cash in a
two
-year fixed certificate of deposit with Wells Fargo (see note 2).
In March 2018, the Company repaid the loan and accrued interest in full, resulting in the release of
$12,601,000
from restricted cash to short-term investments on the Company's condensed consolidated balance sheet.
9. Site consolidation
On February 8, 2018, the Company announced a site consolidation and organizational restructuring to align its HBV business in Warminster, PA, by reducing its global workforce by approximately
35%
and by closing its Burnaby facility. In March 2018, the Company began executing its site consolidation plan and began to incur related costs.
The Company estimates that the total expenses to complete the site consolidation will be approximately
$5,000,000
. Included in the site consolidation plan is the payment of one-time employee termination benefits, employee relocation costs, and site closure costs, which were primarily paid in cash in the second quarter of 2018. In addition, as of June 30, 2018 the Company ceased to use its Burnaby facility. The Company entered into a sublease with its equity investee, Genevant (refer to note 3) for a portion of its facility, during the three months ended June 30, 2018. During the three months ended September 30, 2018, the Company entered into two additional subleases, which, together with the Genevant sublease, represents 80% of the available space now under sublease. The Company does not expect the subleasing income to completely cover the costs under the head lease to which the Company remains the primary obligor. Therefore, the Company has recognized the remaining committed cost, less sublease income currently under contract, in site consolidation expenses.
The Company accounts for site consolidation expense in accordance with ASC 420,
Exit or Disposal Cost Obligations ("ASC 420")
. ASC 420 specifies that a liability for a cost associated with an exit or disposal activity be recognized when the liability is incurred, except for a liability where employees are required to render service until they are terminated in order to receive termination benefits and will be retained to render service beyond the minimum retention period. A liability for such one-time termination benefits shall be measured initially at the communication date based on the fair value of the liability as of the termination date and recognized ratably over the future service period.
14
The following table shows expenses recorded in the
three and nine
months ended
September 30, 2018
and the liability as of
September 30, 2018
, in thousands:
|
Description of expense
|
Jan 1, 2018 - March 31, 2018
|
April 1, 2018 - June 30, 2018
|
July 1, 2018 - Sept 30, 2018
|
Nine months ended September 30, 2018
|
||||||||
|
Employee severance
|
$
|
1,381
|
|
$
|
1,285
|
|
$
|
50
|
|
$
|
2,716
|
|
|
Employee relocation
|
240
|
|
295
|
|
148
|
|
683
|
|
||||
|
Lease and facility
|
—
|
|
1,001
|
|
(690
|
)
|
311
|
|
||||
|
Total site consolidation expense
|
1,621
|
|
2,581
|
|
(492
|
)
|
3,710
|
|
||||
|
Amounts paid during the period
|
592
|
|
2,520
|
|
(172
|
)
|
2,940
|
|
||||
|
Adjustment to accrual
|
$
|
1,029
|
|
$
|
61
|
|
$
|
(320
|
)
|
$
|
770
|
|
10. Contingencies and commitments
Product development partnership with the Canadian Government
The Company entered into a Technology Partnerships Canada ("TPC") agreement with the Canadian Federal Government on November 12, 1999. Under this agreement, TPC agreed to fund
27%
of the costs incurred by the Company, prior to March 31, 2004, in the development of certain oligonucleotide product candidates up to a maximum contribution from TPC of
$7,179,000
(
C$9,256,000
). As at
September 30, 2018
, a cumulative contribution of
$2,848,000
(
C$3,702,000
) had been received and the Company does not expect any further funding under this agreement. In return for the funding provided by TPC, the Company agreed to pay royalties on the share of future licensing and product revenue, if any, that are received by the Company on certain non-siRNA oligonucleotide product candidates covered by the funding under the agreement. These royalties are payable until a certain cumulative payment amount is achieved or until a pre-specified date. In addition, until a cumulative amount equal to the funding actually received under the agreement has been paid to TPC, the Company agreed to pay
2.5%
royalties on any royalties the Company receives from Spectrum Pharmaceuticals, Inc., for licensing Marqibo®. For the three and nine months ended
September 30, 2018
, the Company earned royalties on Marqibo sales in the amount of
$30,000
and
$93,000
respectively
(three and nine months ended
September 30, 2017
–
$33,000
and
$156,000
, respectively) resulting in
$2,000
being recorded by the Company as royalty payable to TPC (
September 30, 2017
-
$4,000
). The cumulative amount paid or accrued as of
September 30, 2018
was
$24,000
, therefore the remaining contingent amount due to TPC is
$2,824,000
(
C$3,671,000
).
Arbitration with the University of British Columbia (“UBC”)
Certain early work on lipid nanoparticle delivery systems and related inventions was undertaken at the Company and assigned to the UBC. These inventions are licensed to the Company by UBC under a license agreement, initially entered into in 1998 and subsequently amended in 2001, 2006 and 2007. The Company has granted sublicenses under the UBC license to Alnylam. Alnylam has in turn sublicensed back to the Company under the licensed UBC patents for discovery, development and commercialization of siRNA products. Certain sublicenses to other parties were also granted.
On November 10, 2014, UBC filed a notice of arbitration against the Company and on January 16, 2015, filed a Statement of Claim, which alleges entitlement to
$3,500,000
in allegedly unpaid royalties based on publicly available information, and an unspecified amount based on non-public information. UBC also seeks interest and costs, including legal fees. The Company filed its Statement of Defense to UBC's Statement of Claims, as well as a Counterclaim involving a patent application that the Company alleges UBC wrongly licensed to a third party. The proceedings have been divided into
three
phases, with a first hearing that took place in June 2017. In the first phase, the arbitrator determined which agreements are sublicense agreements within UBC's claim. No finding was made as to whether any licensing fees are due to UBC under these agreements; this will be the subject of the second phase of arbitration. The second phase of the Arbitration is set for February 2019.
Arbitration and related matters are costly and may divert the attention of the Company’s management and other resources that would otherwise be engaged in other activities. The Company continues to dispute UBC's allegations, and seeks license payments for said application, and an exclusive worldwide license to said application. However, arbitration is subject to inherent uncertainty and an arbitrator could rule against the Company. The Company has not recorded an estimate of the possible loss associated with this arbitration, due to the uncertainties related to both the likelihood and amount of any possible loss or range of loss. Costs related to the arbitration are recorded by the Company as incurred.
15
Acquisition of Enantigen Therapeutics, Inc. ("Enantigen")
In October 2014, Arbutus Inc. acquired all of the outstanding shares of Enantigen pursuant to a stock purchase agreement. Through this transaction, Arbutus Inc. acquired an HBV surface antigen secretion inhibitor program and a capsid assembly inhibitor program, each of which are now assets of the Company, following the Company’s merger with Arbutus Inc.
Under the stock purchase agreement, Arbutus Inc. agreed to pay up to a total of
$21,000,000
to Enantigen’s selling stockholders upon the achievement of certain triggering events related to Enantigen’s
two
programs in pre-clinical development related to HBV therapies. The first triggering event, which would trigger a
$3,000,000
milestone, is the enrollment of the first patient in a Phase 1b clinical trial in HBV patients.
The regulatory, development and sales milestone payments had an initial estimated fair value of approximately
$6,727,000
as of the date of acquisition of Arbutus Inc., and have been treated as contingent consideration payable in the purchase price allocation, based on information available at the date of acquisition, using a probability weighted assessment of the likelihood the milestones would be met and the estimated timing of such payments, and then the potential contingent payments were discounted to their present value using a probability adjusted discount rate that reflects the early stage nature of the development program, time to complete the program development, and market comparative data.
Contingent consideration is recorded as a financial liability, and measured at its fair value at each reporting date, based on an updated consideration of the probability-weighted assessment of expected milestone timing, with any changes in fair value from the previous reporting date recorded in the statement of operations and comprehensive loss (see note 2). The decrease in contingent consideration for the three and nine months ended September 30, 2018 was primarily due to the Company's decision in the third quarter 2018 to indefinitely defer further development of AB-423 thereby reducing the probability of achieving future development milestones, as well as a recalibration in the timing of future sales milestones being achieved, resulting in a reduction in the estimated fair value of the liability.
License Agreement with the Baruch S. Blumberg Institute ("Blumberg") and Drexel University ("Drexel")
In February 2014, Arbutus Inc. entered into a license agreement with Blumberg and Drexel that granted Arbutus Inc. an exclusive, worldwide, sub-licensable license to
three
different compound series: cccDNA inhibitors, capsid assembly inhibitors and HCC inhibitors.
In partial consideration for this license, Arbutus Inc. paid a license initiation fee of
$150,000
and issued warrants to Blumberg and Drexel. The warrants were exercised in 2014. Under this license agreement, Arbutus Inc. also agreed to pay up to
$3,500,000
in development and regulatory milestones per licensed compound series, up to
$92,500,000
in sales performance milestones per licensed product, and royalties in the mid-single digits based upon the proportionate net sales of licensed products in any commercialized combination. The Company is obligated to pay Blumberg and Drexel a double digit percentage of all amounts received from the sub-licensees, subject to customary exclusions.
In November 2014, Arbutus Inc. entered into an additional license agreement with Blumberg and Drexel pursuant to which it received an exclusive, worldwide, sub-licensable license under specified patents and know-how controlled by Blumberg and Drexel covering epigenetic modifiers of cccDNA and STING agonists. In consideration for these exclusive licenses, Arbutus Inc. made an upfront payment of
$50,000
. Under this agreement, the Company is required to pay up to
$1,200,000
for each licensed product upon the achievement of a specified regulatory milestone and a low single digit royalty, based upon the proportionate net sales of compounds covered by this intellectual property in any commercialized combination. The Company is also obligated to pay Blumberg and Drexel a double digit percentage of all amounts received from its sub-licensees, subject to exclusions.
16
Research Collaboration and Funding Agreement with Blumberg
In October 2014, Arbutus Inc. entered into a research collaboration and funding agreement with Blumberg under which the Company will provide
$1,000,000
per year of research funding for
three
years, renewable at the Company’s option for an additional
three
years, for Blumberg to conduct research projects in HBV and liver cancer pursuant to a research plan to be agreed upon by the parties. Blumberg has exclusivity obligations to Arbutus with respect to HBV research funded under the agreement. In addition, the Company has the right to match any third party offer to fund HBV research that falls outside the scope of the research being funded under the agreement. Blumberg has granted the Company the right to obtain an exclusive, royalty bearing, worldwide license to any intellectual property generated by any funded research project. If the Company elects to exercise its right to obtain such a license, the Company will have a specified period of time to negotiate and enter into a mutually agreeable license agreement with Blumberg. This license agreement will include the following pre-negotiated upfront, milestone and royalty payments: an upfront payment in the amount of
$100,000
; up to
$8,100,000
upon the achievement of specified development and regulatory milestones; up to
$92,500,000
upon the achievement of specified commercialization milestones; and royalties at a low single to mid-single digit rates based upon the proportionate net sales of licensed products from any commercialized combination.
On June 5, 2016, the Company and Blumberg entered into an amended and restated research collaboration and funding agreement, primarily to: (i) increase the annual funding amount to Blumberg from
$1,000,000
to
$1,100,000
; (ii) extend the initial term through to October 29, 2018; (iii) provide an option for the Company to extend the term past October 29, 2018 for
two
additional
one
year terms; and (iv) expand the Company's exclusive license under the Agreement to include the sole and exclusive right to obtain and exclusive, royalty-bearing, worldwide and all-fields license under Blumberg's rights in certain other inventions described in the agreement.
11.
Concentrations of credit risk
Credit risk is defined by the Company as an unexpected loss in cash and earnings if a collaborative partner is unable to pay its obligations on a timely basis. The Company’s main source of credit risk is related to its accounts receivable balance which principally represents temporary financing provided to collaborative partners in the normal course of operations.
The Company does not currently maintain a provision for bad debts as the majority of accounts receivable are from collaborative partners or government agencies and are considered low risk.
The carrying amount of financial assets represents the maximum credit exposure. The maximum exposure to credit risk as of
September 30, 2018
was the accounts receivable balance of
$538,000
(
December 31, 2017
-
$402,000
).
All accounts receivable balances were current at
September 30, 2018
and at
December 31, 2017
.
12.
Related Party Transactions
During 2018, the Company purchased certain research and development services from Roivant, which are billed at agreed hourly rates and reflective of market rates for such services. The total cost of these services was $
0
and
$644,000
for the
three and nine
months ended
September 30, 2018
, respectively and is included in the income statement under research, development, collaborations and contracts expenses.
During 2018, the Company purchased certain research and development services from Genevant. These services are billed at agreed hourly rates and reflective of market rates for such services. The total cost of these services was
$104,000
and
$227,000
for the
three and nine
months ended
September 30, 2018
, respectively and are included in the income statement under research, development, collaborations and contracts expenses. Conversely, Genevant purchased certain administrative and transitional services from the Company and has a sublease for
17,900
square feet in the Company's Burnaby facility. The total income for these services was
$147,000
and
$318,000
for the three and
nine
months ended
September 30, 2018
, respectively and is netted against research, development, collaborations and contracts expenses in the income statement.
17
You should read the following discussion and analysis by our management of our financial position and results of operations in conjunction with our audited consolidated financial statements and related notes thereto included as part of our Annual Report on Form 10-K for the year ended
December 31, 2017
and our unaudited condensed consolidated financial statements for the
three and nine
month periods ended
September 30, 2018
. Our consolidated financial statements have been prepared in accordance with U.S. generally accepted accounting principles and are presented in U.S. dollars.
FORWARD-LOOKING STATEMENTS
The information in this report contains forward-looking statements within the meaning of the Section 27A of the Securities Act of 1933 and Section 21E of the Securities Exchange Act of 1934, as amended (the "Exchange Act"), and forward looking information within the meaning of Canadian securities laws (collectively, “forward-looking statements”). Forward-looking statements in this report include statements about our strategy, future operations, preclinical research, clinical trials, prospects and the plans of management; the discovery, development and commercialization of a cure for chronic hepatitis B infection, a disease of the liver caused by the hepatitis B virus ("HBV"); our beliefs and development path and strategy to achieve a cure for HBV; obtaining necessary regulatory approvals; obtaining adequate financing through a combination of financing activities and operations; the payment of one-time employee termination benefits, employee relocation costs, and site closure costs, totaling approximately $5,000,000; the expected timing of certain triggering events for payments related to Enantigen Therapeutics, Inc.'s programs; the potential of our proprietary lipid nanoparticle ("LNP") platform to provide royalties and significant additional capital to fund development of our many HBV assets; the potential of our drug candidates to improve upon the standard of care and contribute to a curative combination treatment regimen; royalty entitlements for Onpattro; developing a suite of products that intervene at different points in the viral life cycle, with the potential to reactivate the host immune system; using preclinical results to adaptively design clinical studies for additional cohorts of patients, testing the combination and the duration of therapy; selecting combination therapy regimens and treatment durations to conduct Phase III clinical trials intended to ultimately support regulatory filings for marketing approval; expanding our HBV drug candidate pipeline through internal development, acquisitions and in-licenses; interim results from a 30-week Phase II trial of ARB-1467 in combination with tenofovir and pegylated interferon expected in the second half of 2018, followed by final results; continuing to focus on rapidly advancing AB-506, with topline results by mid-2019; the potential of AB-506 to be a 'best-in-class' capsid inhibitor with once-daily dosing; the potential further development of AB-452; an Investigational New Drug ("IND")/Clinical Trial Authorization ("CTA") filing in 2019 for AB-729; possible low to mid-single-digit royalty payments escalating based on sales performance as Alnylam Pharmaceuticals, Inc.'s ("Alnylam") LNP-enabled products, including Onpattro, are commercialized; payments from the Gritstone Oncology, Inc. ("Gritstone") licensing agreement; the expectation for organizational changes to result in increased efficiency, a more flexible variable cost structure, and additional preservation of our cash reserves; the belief that current legal proceedings will not have a material adverse effect on our consolidated results of operations, cash flows, or financial condition; the expected return from strategic alliances, licensing agreements, and research collaborations; statements with respect to revenue and expense fluctuation and guidance; having sufficient cash resources to fund our operations for at least the next 12 months; obtaining funding to maintain and advance our business from a variety of sources including public or private equity or debt financing, collaborative arrangements with pharmaceutical companies and government grants and contracts; and the quantum and timing of potential funding.
With respect to the forward-looking statements contained in this report, we have made numerous assumptions regarding, among other things: LNP’s status as a leading RNA interface ("RNAi ") delivery technology; our research and development capabilities and resources; the effectiveness of our HBV pipeline as a treatment for chronic HBV infection or other diseases; results from pre-clinical and clinical trials; the timing and quantum of payments to be received under contracts with our partners; and our financial position and our ability to execute our business strategy. While we consider these assumptions to be reasonable, these assumptions are inherently subject to significant business, economic, competitive, market and social uncertainties and contingencies.
Our actual results could differ materially from those discussed in the forward-looking statements as a result of a number of important factors, including the risk factors discussed in this report and the risk factors discussed in our Annual Report on Form 10-K for the year ended December 31, 2017, under the heading “Risk Factors,” and the risks discussed in our other filings with the Securities and Exchange Commission (the "SEC") and Canadian Securities Regulators. Readers are cautioned not to place undue reliance on these forward-looking statements, which reflect management’s analysis, judgment, belief or expectation only as of the date hereof. All forward-looking statements herein are qualified in their entirety by this cautionary statement, and we explicitly disclaim any obligation to revise or update any such forward-looking statements or to
18
publicly announce the result of any revisions to any of the forward-looking statements contained herein to reflect future results, events or developments, except as required by law.
19
OVERVIEW
Arbutus Biopharma Corporation ("Arbutus", the "Company", "we", "us", and "our") is a publicly traded (Nasdaq Global Market: ABUS) industry-leading therapeutic solutions company dedicated to discovering, developing, and commercializing a cure for patients suffering from chronic HBV infection. HBV represents a significant, global unmet medical need. The World Health Organization estimates that more than 257 million people worldwide are chronically infected, and other estimates suggest this could include approximately 2 million people in the United States.
To pursue our strategy of developing a curative combination regimen for chronic HBV, we have assembled a robust pipeline consisting of multiple drug candidates with complementary mechanisms of action ("MOA"), each of which has the potential to improve upon the standard of care and contribute to a curative combination treatment regimen. Our pipeline includes agents that have the potential to form an effective proprietary combination therapy.
In addition to our drug pipeline focused on HBV, we have additional assets that have the potential to provide value to our Company. The first is our approximate 40% equity ownership interest in Genevant Sciences Ltd. ("Genevant"), a newly created company to which we have licensed our LNP platform and conjugate delivery platform (the "Delivery Platforms") for all applications except HBV. Secondly, we retain a royalty entitlement on Onpattro™ (Patisiran), a drug developed by Alnylam that incorporates our LNP technology and was approved by the U.S. Food and Drug Administration ("FDA") during the third quarter of 2018. This royalty entitlement has the potential to provide an active royalty stream or to be otherwise monetized in full or in part. These additional assets have the potential to provide significant non-dilutive capital to fund development of our HBV pipeline.
HBV Product Pipeline
Our product pipeline is entirely focused on finding a cure for chronic HBV infection, with the objective of developing a suite of products that intervene at different points in the viral life cycle and reactivate the host immune system. We are currently conducting one clinical trial and several preclinical combination studies to evaluate combinations of proprietary HBV therapeutic agents in addition to standard of care therapies to support their clinical use in combination. We expect to use the results from these studies to adaptively design additional clinical trials to test the efficacy of the combination therapy and the duration of the result in patients. We plan to identify a combination regimen to conduct Phase III clinical trials intended to ultimately support regulatory filings for marketing approval.
Our HBV product pipeline consists of the following programs:
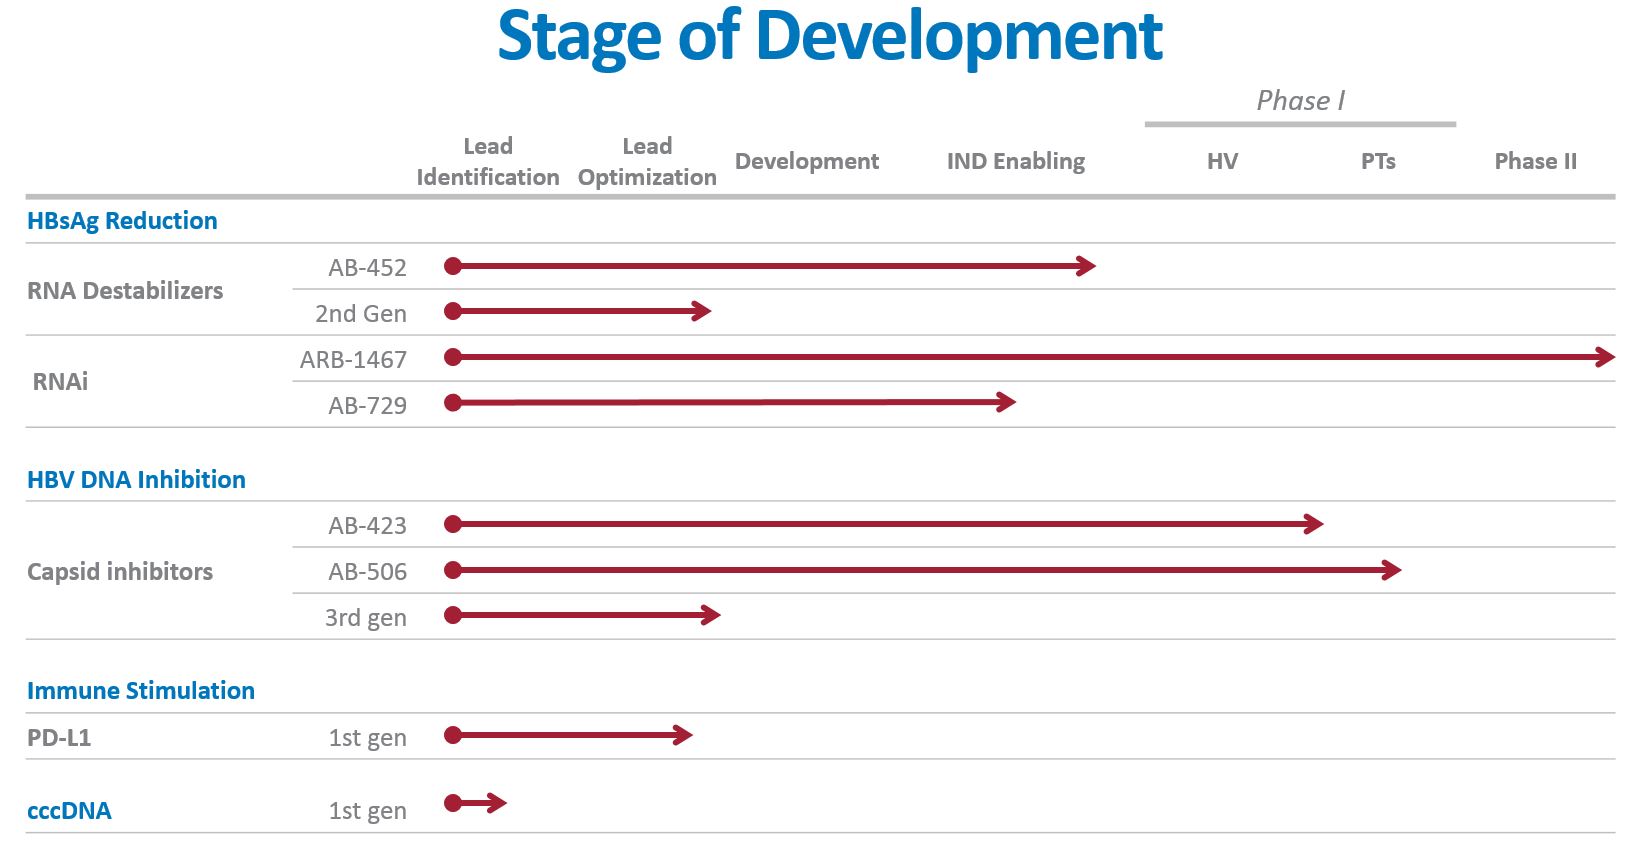
20
In October 2018, we announced that we became aware of emerging nonclinical safety findings in the AB-452 RNA Destabilizer program. Given the nature of these observations and the novel mechanism of action of this drug, we feel a sufficient amount of time must be allocated to understanding these findings and their implications before potentially commencing a clinical program. Given these observations we will continue to advance back-up compounds which are now in the lead optimization stage. This decision does not hamper our commitment to fully understand the nature of the AB-452 pre-clinical findings and continue to pursue the search for other oral HBsAg reducing agents in the RNA destabilizer space.
We will continue to expand our HBV pipeline through internal discovery and development and possibly acquisitions and in-licenses.
Agents for combination therapy
Capsid Inhibitors (AB-506 & AB-423)
HBV core protein assembles into a capsid structure, which is required for viral replication. The current standard of care therapy (nucleoside analogues) significantly reduces HBV DNA levels in the serum but HBV replication continues in the liver, thereby enabling HBV infection to persist. Effective therapy for patients requires new agents which will effectively block viral replication. We are developing capsid inhibitors (also known as core protein inhibitors) as oral therapeutics which, in combination with nucleoside analog therapy, could block HBV DNA replication for the treatment of chronic HBV infection. By inhibiting assembly of the viral capsid, the ability of HBV to replicate is impaired. Capsid inhibitor molecules also inhibit the uncoating step of the viral life cycle and thus reduce the formation of new cccDNA, the viral structure which resides in the cell nucleus.
Our capsid inhibitor discovery effort generated promising second generation compounds in 2017, which led to the nomination AB-506 for IND/CTA-enabling studies. AB-506 is an orally administered, highly selective capsid inhibitor that has shown improved potency and PK over AB-423 in preclinical studies. We presented these preclinical data at the American Association for the Study of Liver Disease ("AASLD") annual meeting in October 2017 in a presentation titled, "Antiviral Characterization of a Next Generation Chemical Series of HBV Capsid Inhibitors In Vitro and In Vivo," which showed potent inhibition of HBV replication and pgRNA encapsidation, an accelerated rate of capsid assembly, and binding to the HBV core protein at the dimer:dimer interface that indicates improved target engagement compared to first generation capsid inhibitors, including AB-423.
We received regulatory approval of our CTA for AB-506 in the second quarter of 2018. During the third quarter of 2018, AB-506 progressed through the healthy volunteer portion of a multi-component phase 1a/1b clinical trial in which it was demonstrated to be generally safe and well-tolerated after 10 days of dosing. In October 2018, AB-506 entered into the 28-day HBV patient portion of the trial, where it is being evaluated both with and without a nucleoside analog. Top-line results of the phase 1a/1b clinical trial are expected in the second quarter of 2019.
AB-423 was our first-generation capsid inhibitor candidate, which was evaluated in a Phase I Single Ascending Dose ("SAD") and Multiple Ascending Dose ("MAD") trial designed to assess the safety, tolerability, and pharmacokinetics ("PK") of oral administration of the product candidate in healthy volunteers. AB-423 was well-tolerated with no serious adverse events.
Due to the successful progression of AB-506 through clinical testing into patients, we have indefinitely deferred further development of AB-423.
RNAi Agents
Our RNAi HBV candidates, ARB-1467 and AB-729, are designed to reduce Hepatitis B surface antigen ("HBsAg") expression in patients chronically infected with HBV. Reducing HBsAg is thought to be a key prerequisite to enable a patient’s immune system to raise an adequate immune response against the virus.
GalNAc RNAi (AB-729)
Early in 2018, we nominated for development a second generation RNAi therapeutic, AB-729, targeted to hepatocytes using our novel covalently conjugated N-acetylgalactosamine (GalNAc) delivery technology to enable subcutaneous delivery. This is a promising new agent that acts on multiple HBV viral transcripts, which is designed to inhibit viral replication and
21
suppress all viral antigens. AB-729 will be administered to patients subcutaneously and our preclinical in vivo findings support more durable HBsAg reduction than earlier generation RNAi agents, such as ARB-1467. We are completing IND/CTA enabling studies, and pending success of those studies, this agent is expected to enter clinical trials in the second quarter of 2019. We believe this compound could be combined with our Capsid Inhibitor AB-506 in our first proprietary combination therapy for HBV patients. Provided the clinical trials for AB-506 and AB-729 proceed as expected, we anticipate initiating combination clinical trials with these two agents in the first half of 2020.
RNAi (ARB-1467)
ARB-1467, one of our early LNP delivered, intravenous administered, RNAi agents targeting HBV, is currently in a 30-week trial in HBV patients, in combination with tenofovir and pegylated interferon ("PEG-IFN"). To date, six HBV patients have enrolled and been treated. Two of these patients have met the predetermined criteria to proceed into the PEG-IFN treatment phase of the trial. The results from this proof-of-concept trial suggest that this regimen has the potential to drive HBsAg levels to undetectable in some patients thus confirming our hypothesis that a combination of multiple mechanisms will be required to improve clinical outcomes for HBV patients. While the trial remains open to enrollment, the Company does not plan to advance this program beyond this trial. We intend to present results from this trial in a future scientific meeting.
Additional Research Programs
In addition to our clinical candidates, we have a number of research programs aimed at discovery and development of proprietary HBV candidates with different and complementary MOAs. We have ongoing discovery efforts focused on cccDNA targeting and checkpoint inhibition to identify novel, orally administered small molecule drug candidates to complement our pipeline of agents to form an effective combination therapy.
Partner Programs
Onpattro™ (patisiran / ALN-TTR02)
Alnylam (Nasdaq: ALNY), has a license to use our LNP delivery intellectual property to develop and commercialize products. Alnylam's patisiran (ALN-TTR02) program represents the most clinically advanced application of our LNP delivery technology.
Onpattro™ is Alnylam`s RNAi therapeutic targeting transthyretin ("TTR") for the treatment of TTR-mediated amyloidosis ("ATTR"), which was approved by the FDA and the European Medicines Agency ("EMA") during the third quarter of 2018.
We retain full rights to royalties on patisiran global sales and are entitled to low-to-mid single-digit royalty payments escalating based on sales performance as Alnylam’s LNP-enabled products are commercialized. We could receive our first royalty payments in 2018, or seek to otherwise monetize all or part of this royalty stream as a source of non-dilutive cash.
Gritstone Oncology
In October 2017, we entered into a license agreement with Gritstone that granted them worldwide access to our portfolio of proprietary and clinically validated LNP products and associated intellectual property to deliver Gritstone’s RNA-based neoantigen immunotherapy products. Gritstone paid us an upfront payment and agreed to future payments for achievement of development, regulatory, and commercial milestones as well as royalties, and reimbursements for conducting technology development, manufacturing and regulatory support for Gritstone’s product candidates. Genevant will be entitled to 50% of any milestones and royalties that may be payable by Gritstone. During the third quarter of 2018, we received a milestone payment from Gritstone of $2.5 million of which we retained $1.25 million.
22
Recent Developments
Genevant Sciences
In April 2018, we entered into an agreement with Roivant to launch Genevant, a jointly-owned company focused on the discovery, development, and commercialization of a broad range of RNA-based therapeutics enabled by our Delivery Technologies. We have licensed exclusive rights to our LNP and ligand conjugate delivery platforms to Genevant for RNA-based applications outside of HBV. Genevant plans to develop products in-house and pursue industry partnerships to build a diverse pipeline of therapeutics across multiple modalities, including RNAi, mRNA, and gene editing.
Under the terms of the agreement, Roivant contributed $37.5 million in transaction-related seed capital for Genevant, consisting of an initial $22.5 million and a subsequent investment of $15 million at a pre-determined, stepped-up valuation. We retain all rights to our LNP and conjugate delivery platforms for HBV, and are entitled to a tiered royalty from Genevant on future sales of products enabled by those delivery platforms. We also retain the entirety of our royalty entitlement on the commercialization of Alnylam’s Onpattro. The initial investment and the subsequent investment were completed during the second quarter of 2018. As of September 30, 2018, we held an equity interest in Genevant of approximately 40%. We recorded a $24.9 million non-cash gain in the second quarter of 2018 as a result of this transaction.
Acuitas Therapeutics Inc.
In accordance with a settlement agreement signed in November 2012, we finalized and entered a cross-license agreement with Acuitas Therapeutics Inc. ("Acuitas") in December 2013. The terms of the cross-license agreement provided Acuitas with access to certain of our early IP generated prior to mid-April 2010 in the fields of gene replacement therapy and antisense. Acuitas was only able to grant access to our LNP technology to its partners if it is part of a product sublicense. At the same time, the terms of the cross-license agreement provided us with certain access to Acuitas’ technology and licenses in the RNAi field, along with a percentage of each milestone and royalty payment with respect to certain products. Acuitas had agreed that it would not compete in the RNAi field for a period of five years, ending in November 2017. We considered Acuitas to be in material breach of its cross-license agreement and provided notice to Acuitas in August 2016 to terminate the cross license agreement, resulting in litigation between the two parties. In February 2018, we reached a settlement with Acuitus terminating Acuitas’ right to further use or sublicense Arbutus' LNP technology. Please refer to "Item 1. Legal Proceedings" for additional information.
Site Consolidation
In February 2018, we announced a site consolidation and organizational restructuring to better align our HBV business in Warminster, PA. These organizational changes are expected to result in increased efficiency, a more flexible variable cost structure, and additional preservation of our cash reserves. To achieve this alignment, during the second quarter of 2018 we reduced our global workforce by approximately 35% and closed our Burnaby BC facility. These activities were successfully completed during the second quarter. For further detail, refer to note 9 "Site Consolidation" in the condensed consolidated financial statements in Part I.
CRITICAL ACCOUNTING POLICIES AND ESTIMATES
Equity method investment
/ We account for our investment in associated companies in accordance with the Financial Accounting Standards Board ("FASB") Accounting Standards Codification ("ASC") ASC 323,
Investments - Equity Method and Joint Ventures
. ("ASC 323") In accordance with ASC 323, associated companies are accounted for as equity method investments. Our share of the results of associated companies are presented on a one-line basis. Investments in, and advances to, associated companies are presented on a one-line basis in the caption “Investment in Genevant” in our condensed consolidated balance sheets, net of allowance for losses, which represents our best estimate of probable losses inherent in such assets. The investment in Genevant balance recorded was based on the fair value of equity received. Our proportionate share of an associated company's net income or loss is presented on a one-line basis in the caption "Gain on Investment" in our condensed consolidated statements of operations. Transactions between the Company and an associated company are eliminated on a basis proportional to our ownership interest. Financial results of Genevant are recorded on a one-quarter lag basis.
Site consolidation expense
/ We account for site consolidation expense in accordance with ASC 420,
Exit or Disposal Cost Obligations
("ASC 420"). ASC 420 specifies that a liability for a cost associated with an exit or disposal activity be recognized
23
when the liability is incurred, except for a liability where employees are required to render service until they are terminated in order to receive termination benefits and will be retained to render service beyond the minimum retention period. A liability for such one-time termination benefits shall be measured initially at the communication date based on the fair value of the liability as of the termination date and recognized ratably over the future service period.
Revenue recognition
/ We adopted ASC 606,
Revenue From Contracts With Customers
("ASC 606"), effective January 1, 2018, using the modified retrospective method under which previously presented financial statements are not restated and the cumulative effect of adopting ASC 606 on contracts in process is recognized by an adjustment to retained earnings at the effective date. The adoption of ASC 606 did not change recognized revenue under our ongoing significant collaborative research and license agreements and no cumulative effect adjustment was required.
The new guidance in ASC 606 requires an entity to recognize the amount of revenue to which it expects to be entitled for the transfer of promised goods or services to customers under a five-step model: (i) identify contract(s) with a customer; (ii) identify the performance obligations in the contract; (iii) determine the transaction price; (iv) allocate the transaction price to the performance obligations in the contract; and (v) recognize revenue when or as a performance obligation is satisfied.
We generate revenue primarily through collaboration agreements, which may require delivery of various rights and/or services, including intellectual property rights or licenses and research and development services. Under such collaboration agreements, we are generally eligible to receive non-refundable upfront payments, funding for research and development services, milestone payments, and royalties.
In contracts where more than one performance obligation exists to provide its customer with goods or services, each performance obligation is evaluated to determine whether it is distinct based on whether (i) the customer can benefit from the good or service either on its own or together with other resources that are readily available and (ii) the good or service is separately identifiable from other promises in the contract. The consideration under the contract is then allocated between the distinct performance obligations based on their respective relative stand-alone selling prices. The estimated stand-alone selling price of each deliverable reflects the our best estimate of what the selling price would be if the deliverable was regularly sold on a stand-alone basis and is determined by reference to market rates for the good or service when sold to others or by using an adjusted market assessment approach if the selling price on a stand-alone basis is not available.
The consideration allocated to each distinct performance obligation is recognized as revenue when control is transferred to the customer for the related goods or services. Consideration associated with at-risk substantive performance milestones, including sales-based milestones, is recognized as revenue when it is probable that a significant reversal of the cumulative revenue recognized will not occur. Sales-based royalties received in connection with licenses of intellectual property are subject to a specific exception in the revenue standards, whereby the consideration is not included in the transaction price and recognized in revenue until the customer’s subsequent sales or usages occur.
Stock-based compensation
/ In June 2018, the FASB issued ASU 2018-07,
Compensation - Stock Compensation
(Topic 718),
Improvements to Nonemployee Share-Based Payment Accounting ("ASU 2018-07")
. The amendments in ASU 2018-07 provide guidance about aligning nonemployee and employee share-based payment accounting. The amendments in ASU 2017-07 are effective for all entities for annual periods, and interim periods within those annual periods, beginning after December 15, 2018. We early adopted the new standard as of January 1, 2018. The adoption of this ASU 2018-07 did not have a material impact on the Company's financial position and results of operations.
There are no other changes to our critical accounting policies and estimates from those disclosed in our annual MD&A contained in our Annual Report Form 10-K for the year ended December 31, 2017.
RECENT ACCOUNTING PRONOUNCEMENTS
From time to time, new accounting pronouncements are issued by the FASB or other standard setting bodies that are adopted by us as of the specified effective date. Unless otherwise discussed, we believe that the impact of recently issued standards that are not yet effective will not have a material impact on our financial position or results of operations upon adoption.
Please refer to Note 2 to our condensed consolidated financial statements included in Part I, Item 1, "Financial Statements (Unaudited)" of this Quarterly Report on Form 10-Q for a description of recent accounting pronouncements applicable to our business.
RESULTS OF OPERATIONS
24
The following summarizes the results of our operations for the periods shown, in thousands (except for per share figures):
|
|
Three Months Ended
|
Nine Months Ended
|
||||||||||||
|
|
September 30,
|
September 30,
|
||||||||||||
|
|
2018
|
2017
|
2018
|
2017
|
||||||||||
|
Total revenue
|
$
|
1,587
|
|
$
|
6,892
|
|
$
|
4,267
|
|
8,166
|
|
|||
|
Operating expenses
|
34,013
|
|
19,789
|
|
77,144
|
|
58,847
|
|
||||||
|
Loss from operations
|
(32,426
|
)
|
(12,897
|
)
|
(72,877
|
)
|
(50,681
|
)
|
||||||
|
Net income (loss)
|
$
|
(28,755
|
)
|
$
|
(11,600
|
)
|
$
|
(43,093
|
)
|
(48,482
|
)
|
|||
|
Net income (loss) attributable to common shares
|
(27,040
|
)
|
(11,600
|
)
|
(46,255
|
)
|
(48,482
|
)
|
||||||
|
Basic and diluted loss per common share
|
(0.49
|
)
|
(0.21
|
)
|
(0.84
|
)
|
(0.89
|
)
|
||||||
Revenue
/ Revenue is summarized in the following table, in thousands:
|
|
Three months ended September 30,
|
Nine months ended September 30,
|
|||||||||||||||||||||||||
|
|
2018
|
% of Total
|
2017
|
% of Total
|
2018
|
% of Total
|
2017
|
% of Total
|
|||||||||||||||||||
|
Alexion
|
$
|
—
|
|
—
|
%
|
$
|
6,859
|
|
100
|
%
|
$
|
—
|
|
—
|
%
|
$
|
7,956
|
|
97
|
%
|
|||||||
|
Gritstone
|
313
|
|
20
|
%
|
—
|
|
—
|
%
|
2,400
|
|
56
|
%
|
—
|
|
—
|
%
|
|||||||||||
|
Gritstone Milestone
|
1,250
|
|
79
|
%
|
—
|
|
—
|
%
|
1,250
|
|
29
|
%
|
—
|
|
—
|
%
|
|||||||||||
|
Other milestone and royalty payments
|
24
|
|
1
|
%
|
33
|
|
—
|
%
|
617
|
|
15
|
%
|
210
|
|
3
|
%
|
|||||||||||
|
Total revenue
|
$
|
1,587
|
|
|
$
|
6,892
|
|
|
$
|
4,267
|
|
$
|
8,166
|
|
|||||||||||||
Revenue contracts are addressed in detail in the Overview section of Part I, Item 2, "Management's Discussion and Analysis of Financial Condition and Results of Operations" above.
Alexion revenue
In March 2017, we signed a License Agreement with Alexion Pharmaceuticals, Inc. ("Alexion") that granted them exclusive use of our proprietary LNP technology in one of Alexion's rare disease programs, and began recognizing a portion of the non-refundable upfront payment and services provided. In July 2017, we received notice of termination from Alexion for our LNP license agreement. The termination was driven by a strategic review of Alexion's business and research and development portfolio, which included a decision to discontinue development of mRNA therapeutics.
Gritstone revenue
On October 16, 2017, we entered into a license agreement with Gritstone that entitles Gritstone to research, develop, manufacture and commercialize products with the Company’s LNP technology. In October 2017, we received the upfront license payment, and are eligible to receive further potential payments for development and commercial milestone payments and royalty payments on future product sales. Revenue recognized in the three and
nine
months ended
September 30, 2018
relates to the earned portion of the upfront license fee, as well as services provided to Gritstone. As a result of our agreement with Genevant (see note 3 of the financial statements for details), from April 11, 2018 onwards, Genevant is entitled to 50% of the revenues earned (excluding the upfront license payment discussed above) by Arbutus from Gritstone. We record service revenues from Gritstone net of charges by Genevant for services provided to Gritstone.
During the three months ended September 30, 2018, Gritstone paid a milestone payment of $2,500,000 pursuant to the license agreement, half of which went to the Company and half of which went to Genevant.
Other milestone and royalty payments
Under our licensing and collaboration arrangements with Alnylam and Acuitas, we earn licensing fee revenue from Acuitas as well as further potential development and commercial milestones from Alnylam for the use of our LNP technology. Our cross-license agreement with Acuitas has been terminated in accordance with the settlement agreement described under Part II, Item 1, "Legal Proceedings."
25
In September 2013, Spectrum announced that they had shipped the first commercial orders of Marqibo. We continue to earn royalties on the sales of Marqibo, which utilizes a license to our technology.
In the third quarter of 2010 we signed a contract with the U.S. Department of Defense ("DoD") to develop TKM-Ebola and have since incurred significant program costs related to equipment, materials and preclinical and clinical studies. In the fourth quarter of 2015, the DoD contract was terminated and in the second quarter of 2018 we completed contract close out procedures with the DoD and recorded the final reimbursement.
Expenses
/ Expenses are summarized in the following table, in thousands:
|
|
Three months ended September 30,
|
||||||||||||
|
|
2018
|
|
% of Total
|
|
2017
|
|
% of Total
|
||||||
|
Research, development, collaborations and contracts
|
$
|
16,566
|
|
49
|
%
|
$
|
15,537
|
|
79
|
%
|
|||
|
General and administrative
|
2,631
|
|
8
|
%
|
3,659
|
|
18
|
%
|
|||||
|
Depreciation
|
497
|
|
1
|
%
|
593
|
|
3
|
%
|
|||||
|
Site consolidation
|
(492
|
)
|
(1
|
)%
|
—
|
|
—
|
%
|
|||||
|
Impairment of intangible assets
|
14,811
|
|
43
|
%
|
$
|
—
|
|
—
|
%
|
||||
|
Total operating expenses
|
$
|
34,013
|
|
|
$
|
19,789
|
|
|
|||||
|
|
Nine months ended September 30,
|
||||||||||||
|
|
2018
|
|
% of Total
|
|
2017
|
|
% of Total
|
||||||
|
Research, development, collaborations and contracts
|
$
|
46,871
|
|
61
|
%
|
$
|
44,854
|
|
76
|
%
|
|||
|
General and administrative
|
10,075
|
|
13
|
%
|
12,586
|
|
22
|
%
|
|||||
|
Depreciation
|
1,677
|
|
2
|
%
|
1,407
|
|
2
|
%
|
|||||
|
Site consolidation
|
3,710
|
|
5
|
%
|
—
|
|
—
|
%
|
|||||
|
Impairment of intangible assets
|
14,811
|
|
19
|
%
|
—
|
|
—
|
|
|||||
|
Total operating expenses
|
$
|
77,144
|
|
|
$
|
58,847
|
|
|
|||||
Research, development, collaborations and contracts
Research, development, collaborations and contracts expenses consist primarily of clinical and pre-clinical trial expenses, personnel expenses, consulting and third party expenses, consumables and materials, as well as a portion of stock-based compensation and general overhead costs.
R&D expenses increased in both the three and
nine
months ended
September 30, 2018
as compared to the three and
nine
months ended
September 30, 2017
. Stock based compensation expense for the
nine
months ended
September 30, 2018
was roughly $4.0 million less than the
nine
months ended
September 30, 2017
due to the expiry of certain share repurchase rights in the third quarter of 2017. Program R&D expenses, however, have increased in the first nine months of 2018 over the first nine months of 2017 as our pipeline expands and goes further into the clinic. In early 2017, we initiated a Phase 1 clinical trial for AB-423. In the first half of 2018 we initiated a Phase I clinical trial in healthy volunteers for AB-506 (capsid inhibitor), which we anticipate to progress into HBV patients in the fourth quarter of 2018. Given the progression of AB-506, we have decided to discontinue additional clinical evaluation of AB-423. During the nine month period ended
September 30, 2018
, we continued to incur costs related to our clinical programs including IND/CTA-enabling work and CTA regulatory filings for AB-452 (HBV RNA Destabilizer), pre-IND/CTA work on AB-729 (GalNAc-RNAi), as well as our ongoing clinical trial of ARB-1467 in combination with nucs and interferon. In addition, we continue to incur research costs related to our discovery and pre-clinical programs.
A significant portion of our research, development, collaborations and contracts expenses are not tracked by project as they benefit multiple projects or our technology platform and because our most-advanced programs are not yet in late-stage clinical development. However, our collaboration agreements contain cost-sharing arrangements pursuant to which certain costs incurred under the project are reimbursed. Costs reimbursed under collaborations typically include certain direct external costs and hourly or full-time equivalent labor rates for the actual time worked on the project. As a result, although a significant
26
portion of our research, development, collaborations and contracts expenses are not tracked on a project-by-project basis, we do, however, track direct external costs attributable to, and the actual time our employees worked on our collaborations.
General and administrative
General and administrative expenses decreased in the three and
nine
months ended
September 30, 2018
as compared to the three and
nine
months ended
September 30, 2017
, due primarily to a decrease in non-cash compensation expense related to the expiry of repurchase rights in the third quarter of 2017, offset by professional fees incurred related to the launch of Genevant Sciences - see Overview.
Site consolidation charges
In February 2018, we announced a site consolidation and organizational restructuring to better align our HBV business in Warminster, PA, by reducing our global workforce and closing our Burnaby facility. Most of the employee-related site consolidation expenses have been expensed ratably over the period that employees have provided services, which was substantially complete by June 30, 2018. Further, in the second quarter of 2018, we recorded the cost of remaining lease payments for the remaining term of the Burnaby lease to July 2019, offset by income that we expected to receive under a sublease contract entered into prior to June 30, 2018. There were further sub-leases of our Burnaby facility signed in the third quarter of 2018. These resulted in a credit to site consolidation expense in the third quarter. We have now sub-let approximately 80% of our Burnaby facility. We continue to expect total site consolidation expenses to be approximately $5.0 million.
Impairment of intangible assets
In the three and nine months ended September 30, 2018, we recorded a non-cash expense for the impairment of intangible assets of $14.8 million ($10.5 million net of tax benefit) for the indefinite delay of further development of our AB-423 program due to the successful progression of our AB-506 program.
Other income (losses) /
Other income (losses) are summarized in the following table, in thousands:
|
|
Three Months Ended
|
Nine Months Ended
|
||||||||||||
|
|
September 30,
|
September 30,
|
||||||||||||
|
|
2018
|
2017
|
2018
|
2017
|
||||||||||
|
Interest income
|
$
|
756
|
|
$
|
337
|
|
$
|
2,319
|
|
$
|
1,095
|
|
||
|
Interest expense
|
—
|
|
(76
|
)
|
(104
|
)
|
(186
|
)
|
||||||
|
Foreign exchange gains (losses)
|
145
|
|
1,233
|
|
(740
|
)
|
2,458
|
|
||||||
|
Gain on investment
|
—
|
|
—
|
|
24,884
|
|
—
|
|
||||||
|
(Increase) in fair value of warrant liability
|
—
|
|
—
|
|
—
|
|
(22
|
)
|
||||||
|
Equity investment income (loss)
|
(2,838
|
)
|
—
|
|
(2,838
|
)
|
—
|
|
||||||
|
Decrease (increase) in fair value of contingent consideration
|
5,608
|
|
(197
|
)
|
6,263
|
|
(1,146
|
)
|
||||||
|
Total other income (losses)
|
$
|
3,671
|
|
$
|
1,297
|
|
$
|
29,784
|
|
$
|
2,199
|
|
||
Interest income
As described in our quantitative and qualitative disclosures about market risk in our Annual Report on Form 10-K for the year ended
December 31, 2017
, we invest our cash reserves in high interest savings accounts and guaranteed investment certificates and term deposits with varying terms to maturity (not exceeding two years) issued by major banks. The increase in interest income for the three and
nine
months ended
September 30, 2018
is due to the proceeds received from the Series A participating convertible preferred shares (the "Preferred Shares") sold to Roivant (as further described in note 6 of our condensed consolidated financial statements) and more favorable interest rates during 2018.
Foreign exchange gains (losses)
We continue to incur substantial expenses and hold cash and investment balances in Canadian dollars, and as such, will remain subject to risks associated with foreign currency fluctuations. For the
nine
months ended
September 30, 2018
, we recorded foreign exchange losses, which are primarily unrealized losses related to the depreciation in value of our Canadian dollar funds,
27
from the previous period, when converted to our functional currency of U.S. dollars. For the three months ended September 30, 2018, we recorded a foreign exchange gain as the Canadian dollar appreciated against the U.S. dollar. In the future, we expect that the proportion of cash and investment balances and expenses incurred in Canadian dollars, relative to U.S. dollars, will continue to decrease as a result of the site consolidation.
Gain on investment in Genevant
As described in Management's Discussion and Analysis of Financial Condition and Results of Operations - Overview section of this discussion and in the Notes to the Condensed Consolidated Financial Statements, in the second quarter of 2018, together with Roivant, we launched Genevant, a jointly-owned company focused on the discovery, development, and commercialization of a broad range of RNA-based therapeutics enabled by our Delivery Technologies. This transaction, together with a subsequent secondary financing of Genevant, resulted in a gain on investment of $24.9 million.
Decrease (increase) in fair value of contingent consideration
Contingent consideration is a liability assumed by the Company from our acquisition of Arbutus Inc. in March 2015. In general, increases in the fair value of the contingent consideration are related to the progress of our programs as they get closer to triggering contingent payments. The decrease in contingent consideration for the three and
nine
months ended
September 30, 2018
is primarily due to our decision in the third quarter of 2018 to indefinitely delay further clinical development of AB-423 thereby reducing the probability of achieving future development milestones, as well as a recalibration in the timing of future sales milestones being achieved, resulting in a reduction in the estimated fair value of the liability.
LIQUIDITY AND CAPITAL RESOURCES
The following table summarizes our cash flow activities for the periods indicated, in thousands:
|
|
Three Months Ended
|
Nine months ended
|
|||||||||||||
|
|
September 30,
|
September 30,
|
|||||||||||||
|
|
2018
|
2017
|
2018
|
2017
|
|||||||||||
|
Net income loss for the period
|
$
|
(24,473
|
)
|
$
|
(11,600
|
)
|
$
|
(38,811
|
)
|
$
|
(48,482
|
)
|
|||
|
Adjustments to reconcile net loss to net cash provided by operating activities
|
9,927
|
|
3,441
|
|
(9,493
|
)
|
13,582
|
|
|||||||
|
Changes in operating assets and liabilities
|
1,342
|
|
(7,521
|
)
|
(2,487
|
)
|
(3,398
|
)
|
|||||||
|
Net cash used in operating activities
|
(13,204
|
)
|
(15,680
|
)
|
(50,791
|
)
|
(38,298
|
)
|
|||||||
|
Net cash provided by (used in) investing activities
|
24,378
|
|
5,305
|
|
(48,911
|
)
|
27,116
|
|
|||||||
|
Net cash provided by financing activities
|
435
|
|
61
|
|
55,537
|
|
419
|
|
|||||||
|
Effect of foreign exchange rate changes on cash & cash equivalents
|
131
|
|
1,327
|
|
(795
|
)
|
2,575
|
|
|||||||
|
Net (decrease) increase in cash, cash equivalents, and restricted cash
|
11,740
|
|
(8,987
|
)
|
(44,960
|
)
|
(8,188
|
)
|
|||||||
|
Cash, cash equivalents, and restricted cash, beginning of period
|
10,193
|
|
24,212
|
|
66,893
|
|
23,413
|
|
|||||||
|
Cash, cash equivalents, and restricted cash, end of period
|
$
|
21,933
|
|
$
|
15,225
|
|
$
|
21,933
|
|
15,225
|
|
||||
Since our incorporation, we have financed our operations through the sales of shares, units, debt, revenues from research and development collaborations and licenses with corporate partners, interest income on funds available for investment, and government contracts, grants and tax credits.
As of
September 30, 2018
, we had an aggregate of $
142.0 million
in cash and cash equivalents and short-term investments, as compared to an aggregate of $
139.0 million
in cash and cash equivalents, short-term investments, and restricted investments at
December 31, 2017
.
28
For the
nine
months ended
September 30, 2018
, operating activities used $50.8 million in cash as compared to $38.3 million of cash used in the
nine
months ended
September 30, 2017
. The increase in net cash used in operating activities is largely related to increased development spending along with site consolidation expenses in the nine months ended September 30, 2018 and, conversely, cash in-flows from the Alexion collaboration in the nine months ended September 30, 2017.
For the
nine
months ended
September 30, 2018
, investing activities decreased cash by $48.9 million as we invested the cash received from the preferred share financing in short-term investments.
For the
nine
months ended
September 30, 2018
, financing activities increased cash by $55.5 million due to the completion of the second tranche of the Preferred Shares financing netting $66.3 million, offset by repayment of our promissory note to Wells Fargo.
Cash requirements /
As of
September 30, 2018
we held an aggregate of $
142.0 million
in cash, comprised of
$21.9 million
in cash and cash equivalents and $
120.1 million
in short-term investments. In October 2017, we announced that we had entered into a subscription agreement with Roivant for the sale of Preferred Shares to Roivant for gross proceeds of $116.4 million. The initial investment of $50.0 million closed in October 2017, and the remaining amount of $66.4 million closed in January 2018.
We believe we have sufficient cash resources to fund our operations for at least the next 12 months. In the future, substantial additional funds will be required to continue with the active development of our pipeline products and technologies. In particular, our funding needs may vary depending on a number of factors including:
•
the need for additional capital to fund future business development programs;
|
•
|
revenue earned from our legacy collaborative partnerships and licensing agreements, including potential royalty payments from Alnylam's Onpattro;
|
|
•
|
revenue earned from ongoing collaborative partnerships, including milestone and royalty payments;
|
|
•
|
the extent to which we continue the development of our product candidates, add new product candidates to our pipeline, or form collaborative relationships to advance our products;
|
|
•
|
our decisions to in-license or acquire additional products or technology for development, in particular for our HBV therapeutics programs;
|
|
•
|
our ability to attract and retain corporate partners, and their effectiveness in carrying out the development and ultimate commercialization of our product candidates;
|
|
•
|
whether batches of drugs that we manufacture fail to meet specifications resulting in delays and investigational and remanufacturing costs;
|
|
•
|
the decisions, and the timing of decisions, made by health regulatory agencies regarding our technology and products;
|
|
•
|
competing technological and market developments;
|
|
•
|
costs associated with prosecuting and enforcing our patent claims and other intellectual property rights, including litigation and arbitration arising in the course of our business activities; and
|
|
•
|
costs associated with our site consolidation plans.
|
We intend to seek to obtain funding to maintain and advance our business from a variety of sources including public or private equity or debt financing, collaborative arrangements with pharmaceutical companies and government grants and contracts. There can be no assurance that funding will be available at all or on acceptable terms to permit further development of our products.
If adequate funding is not available, we may be required to delay, reduce or eliminate one or more of our research or development programs or reduce expenses associated with non-core activities. We may need to obtain funds through arrangements with collaborators or others that may require us to relinquish most or all of our rights to product candidates at an earlier stage of development or on less favorable terms than we would otherwise seek if we were better funded. Insufficient financing may also mean failing to prosecute our patents or relinquishing rights to some of our technologies that we would otherwise develop or commercialize.
OFF-BALANCE SHEET ARRANGEMENTS
We do not have any off-balance sheet arrangements that have or are reasonably likely to have a current or future effect on our financial condition, changes in financial condition, revenues or expenses, results of operations, liquidity, capital expenditures or capital resources that is material to investors.
29
ITEM 3.
QUANTITATIVE AND QUALITATIVE DISCLOSURES ABOUT MARKET RISK
There have been no material changes in our quantitative and qualitative disclosures about market risk from those disclosed in our Annual Report on Form 10-K for the year ended
December 31, 2017
.
ITEM 4.
CONTROLS AND PROCEDURES
Evaluation of Disclosure Controls and Procedures
Our management, with the participation of our principal executive officer and principal financial officer, evaluated the effectiveness of our disclosure controls and procedures as of
September 30, 2018
. The term “disclosure controls and procedures”, as defined in Rules 13a-15(e) and 15d-15(e) under the Exchange Act, means controls and other procedures of a company that are designed to ensure that information required to be disclosed by us in the reports that we file or submit under the Exchange Act is recorded, processed, summarized and reported within the time periods specified in the SEC's rules and forms, and that such information is accumulated and communicated to our management, including our principal executive officer and principal financial officer, as appropriate, to allow timely decisions regarding required disclosure, particularly during the period in which this Quarterly Report on Form 10-Q was being prepared. Management recognizes that any controls and procedures, no matter how well designed and operated, can provide only reasonable assurance of achieving their desired objectives, and our management necessarily applies its judgment in evaluating the cost-benefit relationship of possible controls and procedures. Based on the evaluation of our disclosure controls and procedures as of
September 30, 2018
, our principal executive officer and principal financial officer concluded that, as of such date, our disclosure controls and procedures were effective at the reasonable assurance level.
Changes in Internal Control over Financial Reporting
There have been no changes in our internal control over financial reporting (as defined in Rules 13a–15(f) and 15d–15(f) under the Exchange Act) during the three months ended
September 30, 2018
that have materially affected, or are reasonably likely to materially affect, our internal control over financial reporting.
30
For information regarding legal matters, please refer to Note 10. Contingencies and Commitments to the condensed consolidated financial statements contained in Part I of this Quarterly Report on Form 10-Q, which is incorporated herein by reference.
There have been no material changes in our risk factors from those disclosed in our Annual Report on Form 10-K for the fiscal year-ended December 31, 2017.
None.
None.
Not applicable.
During October 2018, the Company determined that its intangible assets, which represent research and development assets, related to the Company's AB-423 program in the Antigent Inhibitor drug class, had become impaired. This determination was based on the Company's decision to indefinitely defer further development of its AB-423 program in the Antigen Inhibitor drug class. Accordingly, a non-cash impairment charge of $14,811,000 is being recorded for the quarter ended
September 30, 2018
to eliminate these intangible assets from the Company's condensed consolidated balance sheet. We do not expect that this impairment charge will result in future cash expenditures.
See the Exhibit Index hereto.
31
EXHIBIT INDEX
|
Number
|
Description
|
|
3.1
|
|
|
10.1*
|
|
|
31.1*
|
|
|
|
|
|
31.2*
|
|
|
|
|
|
32.1*
|
|
|
|
|
|
32.2*
|
|
|
|
|
|
101
|
The following materials from Arbutus Biopharma Corporation's Quarterly Report on Form 10-Q for the quarter ended September 30, 2018, formatted in XBRL (eXtensible Business Reporting Language): (i) Condensed Consolidated Balance Sheets; (ii) Condensed Consolidated Statements of Operations; (iii) Condensed Consolidated Statements of Comprehensive Loss; (iv) Condensed Consolidated Statements of Stockholders' Equity; (v) Condensed Consolidated Statements of Cash Flows; and (vi) Notes to Condensed Consolidated Financial Statements
|
* Filed herewith.
SIGNATURES
Pursuant to the requirements of the Securities Exchange Act of 1934, the Registrant has duly caused this report to be signed on its behalf by the undersigned, thereunto duly authorized on
November 7, 2018
.
|
ARBUTUS BIOPHARMA CORPORATION
|
||
|
|
By:
|
/s/ Mark Murray
|
|
|
|
Mark Murray
|
|
|
|
President and Chief Executive Officer
|
32
TABLE OF CONTENTS
Part I. Financial InformationItem 1. Financial Statements (unaudited)Item 2. Management S Discussion and Analysis Of Financial Condition and Results Of OperationsItem 3. Quantitative and Qualitative Disclosures About Market RiskItem 4. Controls and ProceduresPart II. Other InformationItem 1. Legal ProceedingsItem 1A. Risk FactorsItem 2. Unregistered Sales Of Equity Securities and Use Of ProceedsItem 3. Defaults Upon Senior SecuritiesItem 4. Mine Safety DisclosuresItem 5. Other InformationItem 6. Exhibits