ARBUTUS BIOPHARMA CORP
10-Ks,20-Fs and 10-Qs
|
|
|
|
|
|
|
|
|
|
|
|
|
|
|
|
|
|
|
|
|
|
|
|
|
|
|
|
|
|
|
|
|
|
|
|
|
|
|
|
|
|
|
|
|
|
|
UNITED STATES
SECURITIES AND EXCHANGE COMMISSION
Washington, D.C. 20549
FORM 10-Q
[X] QUARTERLY REPORT PURSUANT TO SECTION 13 OR 15(d) OF THE SECURITIES EXCHANGE ACT OF 1934
For the quarterly period ended
September 30, 2019
OR
[ ] TRANSITION REPORT PURSUANT TO SECTION 13 OR 15(d) OF THE SECURITIES EXCHANGE ACT OF 1934
For the Transition Period from to
Commission File Number:
001-34949
ARBUTUS BIOPHARMA CORPORATION
(Exact Name of Registrant as Specified in Its Charter)
|
British Columbia, Canada
|
98-0597776
|
|
|
(State or Other Jurisdiction of
|
(I.R.S. Employer
|
|
|
Incorporation or Organization)
|
Identification No.)
|
|
701 Veterans Circle, Warminster, PA 18974
(Address of Principal Executive Offices and Zip Code)
267-469-0914
(Registrant’s Telephone Number, Including Area Code)
Securities registered pursuant to Section 12(b) of the Act:
|
Title of each class
|
Trading Symbol(s)
|
Name of each exchange on which registered
|
|
Common Shares, without par value
|
ABUS
|
The Nasdaq Stock Market LLC
|
Indicate by check mark whether the registrant (1) has filed all reports required to be filed by Section 13 or 15(d) of the Securities Exchange Act of 1934 during the preceding 12 months (or for such shorter period that the registrant was required to file such reports), and (2) has been subject to such filing requirements for the past 90 days. Yes [X] No [ ]
Indicate by check mark whether the registrant has submitted electronically every Interactive Data File required to be submitted pursuant to Rule 405 of Regulation S-T during the preceding 12 months (or for such shorter period that the registrant was required to submit such files). Yes [X] No [ ]
Indicate by check mark whether the registrant is a large accelerated filer, an accelerated filer, a non-accelerated filer, a smaller reporting company, or an emerging growth company. See the definitions of “large accelerated filer,” “accelerated filer,” “smaller reporting company,” and “emerging growth company” in Rule 12b-2 of the Exchange Act.:
|
Large accelerated filer [ ]
|
Accelerated filer [X]
|
Non-accelerated filer [ ]
|
Smaller reporting company [X]
|
Emerging growth company [ ]
|
If an emerging growth company, indicate by check mark if the registrant has elected not to use the extended transition period for complying with any new or revised financial accounting standards provided pursuant to Section 13(a) of the Exchange Act. [ ]
1
Indicate by check mark whether the registrant is a shell company (as defined in Rule 12b-2 of the Exchange Act).
Yes [ ] No [X]
As of
October 31, 2019
, the registrant had
56,850,172
common shares, without par value, outstanding.
2
ARBUTUS BIOPHARMA CORPORATION
TABLE OF CONTENTS
|
Page
|
||
|
|
|
|
|
|
||
3
PART I. FINANCIAL INFORMATION
ITEM 1. FINANCIAL STATEMENTS (UNAUDITED)
ARBUTUS BIOPHARMA CORPORATION
Condensed Consolidated Balance Sheets
(Unaudited)
(In thousands of U.S. Dollars, except share and per share amounts)
|
|
September 30, 2019
|
December 31, 2018
|
|||||
|
Assets
|
|
|
|||||
|
Current assets:
|
|
||||||
|
Cash and cash equivalents (note 3)
|
$
|
90,082
|
|
$
|
36,942
|
|
|
|
Short-term investments (note 3)
|
—
|
|
87,675
|
|
|||
|
Accounts receivable
|
2,488
|
|
1,431
|
|
|||
|
Prepaid expenses and other current assets
|
1,771
|
|
3,181
|
|
|||
|
Total current assets
|
94,341
|
|
129,229
|
|
|||
|
Investment in Genevant (note 4)
|
10,969
|
|
22,224
|
|
|||
|
Property and equipment, net accumulated depreciation $8,612 (December 31, 2018: $7,090)
|
9,150
|
|
10,145
|
|
|||
|
Right of use asset (note 5)
|
2,817
|
|
—
|
|
|||
|
Intangible assets (note 6)
|
—
|
|
43,836
|
|
|||
|
Goodwill (note 6)
|
—
|
|
22,471
|
|
|||
|
Total assets
|
$
|
117,277
|
|
$
|
227,905
|
|
|
|
Liabilities and stockholders' equity
|
|
|
|||||
|
Current liabilities:
|
|
|
|||||
|
Accounts payable and accrued liabilities (note 7)
|
$
|
8,199
|
|
$
|
9,429
|
|
|
|
Site consolidation accrual (note 8)
|
203
|
|
1,331
|
|
|||
|
Liability-classified options (note 3)
|
86
|
|
479
|
|
|||
|
Lease liability, current (note 5)
|
329
|
|
—
|
|
|||
|
Total current liabilities
|
8,817
|
|
11,239
|
|
|||
|
Liability related to sale of future royalties (note 9)
|
18,675
|
|
—
|
|
|||
|
Deferred rent and inducements, non-current
|
—
|
|
645
|
|
|||
|
Contingent consideration (notes 3 and 10)
|
3,005
|
|
3,126
|
|
|||
|
Lease liability, non-current (note 5)
|
3,143
|
|
—
|
|
|||
|
Deferred tax liability (note 6)
|
—
|
|
12,661
|
|
|||
|
Total liabilities
|
33,640
|
|
27,671
|
|
|||
|
Stockholders’ equity:
|
|
|
|||||
|
Preferred shares (note 12)
|
|||||||
|
Authorized: 1,164,000 without par value
|
|||||||
|
Issued and outstanding: 1,164,000 (December 31, 2018: 1,164,000)
|
134,405
|
|
126,136
|
|
|||
|
Common shares
|
|||||||
|
Authorized: unlimited number without par value
|
|||||||
|
Issued and outstanding: 56,850,172 (December 31, 2018: 55,518,800)
|
884,623
|
|
879,405
|
|
|||
|
Additional paid-in capital
|
55,385
|
|
48,084
|
|
|||
|
Deficit
|
(942,559
|
)
|
(805,221
|
)
|
|||
|
Accumulated other comprehensive loss
|
(48,217
|
)
|
(48,170
|
)
|
|||
|
Total stockholders' equity
|
83,637
|
|
200,234
|
|
|||
|
Total liabilities and stockholders' equity
|
$
|
117,277
|
|
$
|
227,905
|
|
|
See accompanying notes to the condensed consolidated financial statements.
1
ARBUTUS BIOPHARMA CORPORATION
Condensed Consolidated Statements of Operations
(Unaudited)
(In thousands of U.S. Dollars, except share and per share amounts)
|
Three Months Ended September 30,
|
Nine Months Ended September 30,
|
||||||||||||||
|
2019
|
2018
|
2019
|
2018
|
||||||||||||
|
Revenue
(note 11)
|
$
|
3,061
|
|
$
|
1,587
|
|
$
|
4,393
|
|
$
|
4,267
|
|
|||
|
Operating expenses
|
|
|
|||||||||||||
|
Research and development
|
17,731
|
|
16,566
|
|
45,183
|
|
46,871
|
|
|||||||
|
General and administrative
|
3,249
|
|
2,631
|
|
15,850
|
|
10,075
|
|
|||||||
|
Depreciation
|
507
|
|
497
|
|
1,521
|
|
1,677
|
|
|||||||
|
Site consolidation (note 8)
|
182
|
|
(492
|
)
|
33
|
|
3,710
|
|
|||||||
|
Impairment of intangible assets (note 6)
|
43,836
|
|
14,811
|
|
43,836
|
|
14,811
|
|
|||||||
|
Impairment of goodwill (note 6)
|
22,471
|
|
—
|
|
22,471
|
|
—
|
|
|||||||
|
Arbitration (note 10)
|
6,486
|
|
—
|
|
6,486
|
|
—
|
|
|||||||
|
Total operating expenses
|
94,462
|
|
34,013
|
|
135,380
|
|
77,144
|
|
|||||||
|
Loss from operations
|
(91,401
|
)
|
(32,426
|
)
|
(130,987
|
)
|
(72,877
|
)
|
|||||||
|
Other income (loss)
|
|
|
|||||||||||||
|
Interest income
|
503
|
|
756
|
|
1,709
|
|
2,319
|
|
|||||||
|
Interest expense (note 9)
|
(1,100
|
)
|
—
|
|
(1,114
|
)
|
(104
|
)
|
|||||||
|
Foreign exchange gain (loss)
|
(25
|
)
|
145
|
|
43
|
|
(740
|
)
|
|||||||
|
Gain on investment (note 4)
|
—
|
|
—
|
|
—
|
|
24,884
|
|
|||||||
|
Equity investment loss (note 4)
|
(3,512
|
)
|
(2,838
|
)
|
(11,497
|
)
|
(2,838
|
)
|
|||||||
|
Change in fair value of contingent consideration (notes 3 and 10)
|
376
|
|
5,608
|
|
121
|
|
6,263
|
|
|||||||
|
Total other income (loss)
|
(3,758
|
)
|
3,671
|
|
(10,738
|
)
|
29,784
|
|
|||||||
|
Loss before income taxes
|
$
|
(95,159
|
)
|
$
|
(28,755
|
)
|
$
|
(141,725
|
)
|
$
|
(43,093
|
)
|
|||
|
Income tax benefit (note 6)
|
12,656
|
|
4,282
|
|
12,656
|
|
4,282
|
|
|||||||
|
Net loss
|
$
|
(82,503
|
)
|
$
|
(24,473
|
)
|
$
|
(129,069
|
)
|
$
|
(38,811
|
)
|
|||
|
Items applicable to preferred shares:
|
|||||||||||||||
|
Accrual of coupon on convertible preferred shares
|
(2,792
|
)
|
(2,567
|
)
|
(8,269
|
)
|
$
|
(7,444
|
)
|
||||||
|
Net loss attributable to common shareholders
(note 2)
|
$
|
(85,295
|
)
|
$
|
(27,040
|
)
|
$
|
(137,338
|
)
|
$
|
(46,255
|
)
|
|||
|
Net loss attributable to common shareholders, per share
|
|
|
|||||||||||||
|
Basic and diluted
|
$
|
(1.50
|
)
|
$
|
(0.49
|
)
|
$
|
(2.43
|
)
|
$
|
(0.84
|
)
|
|||
|
Weighted average number of common shares
|
|
|
|
||||||||||||
|
Basic and diluted
|
56,850,172
|
|
55,421,504
|
|
56,469,358
|
|
55,241,284
|
|
|||||||
See accompanying notes to the condensed consolidated financial statements.
2
ARBUTUS BIOPHARMA CORPORATION
Condensed Consolidated Statements of Comprehensive Income (Loss)
(Unaudited)
(In thousands of U.S. Dollars)
|
|
Three Months Ended September 30,
|
Nine Months Ended September 30,
|
|||||||||||||
|
|
2019
|
2018
|
2019
|
2018
|
|||||||||||
|
Net loss
|
$
|
(82,503
|
)
|
$
|
(24,473
|
)
|
$
|
(129,069
|
)
|
$
|
(38,811
|
)
|
|||
|
Other comprehensive income (loss):
|
|||||||||||||||
|
Share of other comprehensive income (loss) of equity method investment (note 4)
|
27
|
|
(12
|
)
|
(47
|
)
|
(12
|
)
|
|||||||
|
Comprehensive loss
|
$
|
(82,476
|
)
|
$
|
(24,485
|
)
|
$
|
(129,116
|
)
|
$
|
(38,823
|
)
|
|||
See accompanying notes to the condensed consolidated financial statements.
3
ARBUTUS BIOPHARMA CORPORATION
Condensed Consolidated Statement of Stockholders’ Equity
(Unaudited)
(In thousands of U.S. Dollars, except share and per share amounts)
|
Convertible Preferred Shares
|
Common Shares
|
|||||||||||||||||||||
|
|
Number of Shares
|
Share Capital
|
Number of Shares
|
Share Capital
|
Additional Paid-In Capital
|
Deficit
|
Accumulated Other Comprehensive Loss
|
Total Stockholders' Equity
|
||||||||||||||
|
Balance, December 31, 2018
|
1,164,000
|
|
$
|
126,136
|
|
55,518,800
|
|
$
|
879,405
|
|
$
|
48,084
|
|
$
|
(805,221
|
)
|
$
|
(48,170
|
)
|
$
|
200,234
|
|
|
Accretion of accumulated dividends on Preferred Shares
|
—
|
|
2,715
|
|
—
|
|
—
|
|
—
|
|
(2,715
|
)
|
—
|
|
—
|
|
||||||
|
Stock-based compensation
|
—
|
|
—
|
|
—
|
|
—
|
|
1,665
|
|
—
|
|
—
|
|
1,665
|
|
||||||
|
Certain fair value adjustments to liability-classified
|
—
|
|
—
|
|
—
|
|
—
|
|
47
|
|
—
|
|
—
|
|
47
|
|
||||||
|
Issuance of common shares pursuant to our ATM
|
—
|
|
—
|
|
614,401
|
|
2,248
|
|
—
|
|
—
|
|
—
|
|
2,248
|
|
||||||
|
Issuance of common shares pursuant to exercise of options
|
—
|
|
—
|
|
122,603
|
|
490
|
|
(202
|
)
|
—
|
|
—
|
|
288
|
|
||||||
|
Currency translation adjustment
|
—
|
|
—
|
|
—
|
|
—
|
|
—
|
|
—
|
|
(22
|
)
|
(22
|
)
|
||||||
|
Net loss
|
—
|
|
—
|
|
—
|
|
—
|
|
—
|
|
(23,251
|
)
|
—
|
|
(23,251
|
)
|
||||||
|
Balance, March 31, 2019
|
1,164,000
|
|
$
|
128,851
|
|
56,255,804
|
|
$
|
882,143
|
|
$
|
49,594
|
|
$
|
(831,187
|
)
|
$
|
(48,192
|
)
|
$
|
181,209
|
|
|
Accretion of accumulated dividends on Preferred Shares
|
—
|
|
2,762
|
|
—
|
|
—
|
|
—
|
|
(2,762
|
)
|
—
|
|
—
|
|
||||||
|
Stock-based compensation
|
—
|
|
—
|
|
—
|
|
—
|
|
3,915
|
|
—
|
|
—
|
|
3,915
|
|
||||||
|
Certain fair value adjustments to liability-classified
|
—
|
|
—
|
|
—
|
|
—
|
|
230
|
|
—
|
|
—
|
|
230
|
|
||||||
|
Issuance of common shares pursuant to our ATM
|
—
|
|
—
|
|
593,689
|
|
2,477
|
|
—
|
|
—
|
|
—
|
|
2,477
|
|
||||||
|
Issuance of common shares pursuant to exercise of options
|
—
|
|
—
|
|
679
|
|
3
|
|
(1
|
)
|
—
|
|
—
|
|
2
|
|
||||||
|
Currency translation adjustment
|
—
|
|
—
|
|
—
|
|
—
|
|
—
|
|
—
|
|
(52
|
)
|
(52
|
)
|
||||||
|
Net loss
|
—
|
|
—
|
|
—
|
|
—
|
|
—
|
|
(23,315
|
)
|
—
|
|
(23,315
|
)
|
||||||
|
Balance, June 30, 2019
|
1,164,000
|
|
$
|
131,613
|
|
56,850,172
|
|
$
|
884,623
|
|
$
|
53,738
|
|
$
|
(857,264
|
)
|
$
|
(48,244
|
)
|
$
|
164,466
|
|
|
Accretion of accumulated dividends on Preferred Shares
|
—
|
|
2,792
|
|
—
|
|
—
|
|
—
|
|
(2,792
|
)
|
—
|
|
—
|
|
||||||
|
Stock-based compensation
|
—
|
|
—
|
|
—
|
|
—
|
|
1,592
|
|
—
|
|
—
|
|
1,592
|
|
||||||
|
Certain fair value adjustments to liability-classified
|
—
|
|
—
|
|
—
|
|
—
|
|
55
|
|
—
|
|
—
|
|
55
|
|
||||||
|
Currency translation adjustment
|
—
|
|
—
|
|
—
|
|
—
|
|
—
|
|
—
|
|
27
|
|
27
|
|
||||||
|
Net loss
|
—
|
|
—
|
|
—
|
|
—
|
|
—
|
|
(82,503
|
)
|
—
|
|
(82,503
|
)
|
||||||
|
Balance, September 30, 2019
|
1,164,000
|
|
$
|
134,405
|
|
56,850,172
|
|
$
|
884,623
|
|
$
|
55,385
|
|
$
|
(942,559
|
)
|
$
|
(48,217
|
)
|
$
|
83,637
|
|
See accompanying notes to the condensed consolidated financial statements.
4
ARBUTUS BIOPHARMA CORPORATION
Condensed Consolidated Statement of Stockholders’ Equity (continued)
(Unaudited)
(In thousands of U.S. Dollars, except share and per share amounts)
|
Convertible Preferred Shares
|
Common Shares
|
|||||||||||||||||||||
|
|
Number of Shares
|
Share Capital
|
Number of Shares
|
Share Capital
|
Additional Paid-In Capital
|
Deficit
|
Accumulated Other Comprehensive Loss
|
Total Stockholders' Equity
|
||||||||||||||
|
Balance, December 31, 2017
|
500,000
|
|
$
|
49,780
|
|
55,060,650
|
|
$
|
876,108
|
|
$
|
42,840
|
|
$
|
(738,070
|
)
|
$
|
(48,185
|
)
|
$
|
182,473
|
|
|
Issuance of Preferred Shares, net of issuance costs of $135
|
664,000
|
|
66,265
|
|
—
|
|
—
|
|
—
|
|
—
|
|
—
|
|
66,265
|
|
||||||
|
Accretion of coupon on Preferred Shares
|
—
|
|
2,336
|
|
—
|
|
—
|
|
—
|
|
(2,336
|
)
|
—
|
|
—
|
|
||||||
|
Stock-based compensation
|
—
|
|
—
|
|
—
|
|
—
|
|
1,510
|
|
—
|
|
—
|
|
1,510
|
|
||||||
|
Certain fair value adjustments to liability stock option awards
|
—
|
|
—
|
|
—
|
|
—
|
|
(504
|
)
|
—
|
|
—
|
|
(504
|
)
|
||||||
|
Issuance of common shares pursuant to exercise of options
|
—
|
|
—
|
|
26,541
|
|
180
|
|
(77
|
)
|
—
|
|
—
|
|
103
|
|
||||||
|
Net loss
|
—
|
|
—
|
|
—
|
|
—
|
|
—
|
|
(17,429
|
)
|
—
|
|
(17,429
|
)
|
||||||
|
Balance, March 31, 2018
|
1,164,000
|
|
$
|
118,381
|
|
55,087,191
|
|
$
|
876,288
|
|
$
|
43,769
|
|
$
|
(757,835
|
)
|
$
|
(48,185
|
)
|
$
|
232,418
|
|
|
Accretion of coupon on Preferred Shares
|
—
|
|
2,541
|
|
—
|
|
—
|
|
—
|
|
(2,541
|
)
|
—
|
|
—
|
|
||||||
|
Stock-based compensation
|
—
|
|
—
|
|
—
|
|
—
|
|
1,862
|
|
—
|
|
—
|
|
1,862
|
|
||||||
|
Certain fair value adjustments to liability stock option awards
|
—
|
|
—
|
|
—
|
|
—
|
|
(34
|
)
|
—
|
|
—
|
|
(34
|
)
|
||||||
|
Issuance of common shares pursuant to exercise of options
|
—
|
|
—
|
|
238,059
|
|
1,903
|
|
(1,168
|
)
|
—
|
|
—
|
|
735
|
|
||||||
|
Net income
|
—
|
|
—
|
|
—
|
|
—
|
|
—
|
|
3,091
|
|
—
|
|
3,091
|
|
||||||
|
Balance, June 30, 2018
|
1,164,000
|
|
$
|
120,922
|
|
55,325,250
|
|
$
|
878,191
|
|
$
|
44,429
|
|
$
|
(757,285
|
)
|
$
|
(48,185
|
)
|
$
|
238,072
|
|
|
Accretion of coupon on Preferred Shares
|
—
|
|
2,567
|
|
—
|
|
—
|
|
—
|
|
(2,567
|
)
|
—
|
|
—
|
|
||||||
|
Stock-based compensation
|
—
|
|
—
|
|
—
|
|
—
|
|
1,658
|
|
—
|
|
—
|
|
1,658
|
|
||||||
|
Certain fair value adjustments to liability stock option awards
|
—
|
|
—
|
|
—
|
|
—
|
|
(407
|
)
|
—
|
|
—
|
|
(407
|
)
|
||||||
|
Issuance of common shares pursuant to exercise of options
|
—
|
|
—
|
|
147,069
|
|
614
|
|
(180
|
)
|
—
|
|
—
|
|
434
|
|
||||||
|
Currency translation adjustment
|
—
|
|
—
|
|
—
|
|
—
|
|
—
|
|
—
|
|
(12
|
)
|
(12
|
)
|
||||||
|
Net loss
|
—
|
|
—
|
|
—
|
|
—
|
|
—
|
|
(24,473
|
)
|
—
|
|
(24,473
|
)
|
||||||
|
Balance, September 30, 2018
|
1,164,000
|
|
$
|
123,489
|
|
55,472,319
|
|
$
|
878,805
|
|
$
|
45,500
|
|
$
|
(784,325
|
)
|
$
|
(48,197
|
)
|
$
|
215,272
|
|
See accompanying notes to the condensed consolidated financial statements.
5
ARBUTUS BIOPHARMA CORPORATION
Condensed Consolidated Statements of Cash Flow
(Unaudited)
(In thousands of U.S. Dollars)
|
|
Three Months Ended September 30,
|
Nine Months Ended September 30,
|
|||||||||||||
|
|
2019
|
2018
|
2019
|
2018
|
|||||||||||
|
OPERATING ACTIVITIES
|
|
|
|
|
|||||||||||
|
Net loss
|
$
|
(82,503
|
)
|
$
|
(24,473
|
)
|
$
|
(129,069
|
)
|
$
|
(38,811
|
)
|
|||
|
Items not involving cash:
|
|||||||||||||||
|
Deferred income tax benefit
|
(12,661
|
)
|
(4,282
|
)
|
(12,661
|
)
|
(4,282
|
)
|
|||||||
|
Depreciation
|
507
|
|
497
|
|
1,521
|
|
1,677
|
|
|||||||
|
Loss (gain) on sale of property and equipment
|
—
|
|
(26
|
)
|
(11
|
)
|
(26
|
)
|
|||||||
|
Stock-based compensation expense
|
1,516
|
|
1,828
|
|
6,822
|
|
5,445
|
|
|||||||
|
Unrealized foreign exchange losses (gains)
|
24
|
|
(131
|
)
|
(71
|
)
|
795
|
|
|||||||
|
Change in fair value of contingent consideration
|
(376
|
)
|
(5,608
|
)
|
(121
|
)
|
(6,263
|
)
|
|||||||
|
Impairment of intangible assets
|
43,836
|
|
14,811
|
|
43,836
|
|
14,811
|
|
|||||||
|
Impairment of goodwill
|
22,471
|
|
—
|
|
22,471
|
|
—
|
|
|||||||
|
Site consolidation non-cash portion
|
—
|
|
—
|
|
—
|
|
396
|
|
|||||||
|
Gain on investment
|
—
|
|
—
|
|
—
|
|
(24,884
|
)
|
|||||||
|
Equity investment loss
|
3,512
|
|
2,838
|
|
11,497
|
|
2,838
|
|
|||||||
|
Non-cash royalty revenue
|
(979
|
)
|
—
|
|
(979
|
)
|
—
|
|
|||||||
|
Non-cash interest expense
|
1,106
|
|
—
|
|
1,106
|
|
—
|
|
|||||||
|
Net change in non-cash operating items:
|
|||||||||||||||
|
Accounts receivable
|
(957
|
)
|
784
|
|
(1,057
|
)
|
(136
|
)
|
|||||||
|
Prepaid expenses and other assets
|
1,080
|
|
109
|
|
1,839
|
|
1,017
|
|
|||||||
|
Accrued revenue
|
—
|
|
—
|
|
—
|
|
128
|
|
|||||||
|
Accounts payable and accrued liabilities
|
538
|
|
1,094
|
|
(1,320
|
)
|
(2,171
|
)
|
|||||||
|
Deferred revenue
|
—
|
|
(325
|
)
|
—
|
|
(2,093
|
)
|
|||||||
|
Restructuring accrual
|
(138
|
)
|
(320
|
)
|
(917
|
)
|
770
|
|
|||||||
|
Other liabilities
|
(446
|
)
|
—
|
|
(541
|
)
|
(2
|
)
|
|||||||
|
Net cash used in operating activities
|
(23,470
|
)
|
(13,204
|
)
|
(57,655
|
)
|
(50,791
|
)
|
|||||||
|
INVESTING ACTIVITIES
|
|
|
|||||||||||||
|
Acquisition of short and long-term investments
|
—
|
|
—
|
|
—
|
|
(48,025
|
)
|
|||||||
|
Disposition of short and long-term investments
|
16,410
|
|
24,590
|
|
87,675
|
|
—
|
|
|||||||
|
Proceeds from sale of property and equipment
|
—
|
|
25
|
|
11
|
|
25
|
|
|||||||
|
Acquisition of property and equipment
|
(255
|
)
|
(237
|
)
|
(526
|
)
|
(911
|
)
|
|||||||
|
Net cash provided by (used) in investing activities
|
16,155
|
|
24,378
|
|
87,160
|
|
(48,911
|
)
|
|||||||
|
FINANCING ACTIVITIES
|
|
|
|||||||||||||
|
Proceeds from sale of future royalties, net
|
18,549
|
|
—
|
|
18,549
|
|
—
|
|
|||||||
|
Promissory note repayment
|
—
|
|
—
|
|
—
|
|
(12,001
|
)
|
|||||||
|
Proceeds from sale of Series A Preferred Shares, net of issuance costs
|
—
|
|
—
|
|
—
|
|
66,265
|
|
|||||||
|
Issuance of common shares pursuant to the ATM
|
—
|
|
—
|
|
4,725
|
|
—
|
|
|||||||
|
Issuance of common shares pursuant to exercise of options
|
—
|
|
435
|
|
290
|
|
1,273
|
|
|||||||
|
Net cash provided by financing activities
|
18,549
|
|
435
|
|
23,564
|
|
55,537
|
|
|||||||
|
Effect of foreign exchange rate changes on cash and cash equivalents
|
(24
|
)
|
131
|
|
71
|
|
(795
|
)
|
|||||||
|
Increase in cash and cash equivalents
|
11,210
|
|
11,740
|
|
53,140
|
|
(44,960
|
)
|
|||||||
|
Cash and cash equivalents, beginning of period
|
78,872
|
|
10,193
|
|
36,942
|
|
66,893
|
|
|||||||
|
Cash and cash equivalents, end of period
|
$
|
90,082
|
|
$
|
21,933
|
|
$
|
90,082
|
|
$
|
21,933
|
|
|||
|
Supplemental cash flow information
|
|
|
|||||||||||||
|
Non-cash transactions:
|
|
|
|||||||||||||
|
Preferred shares dividends accrued
|
$
|
(2,792
|
)
|
$
|
(2,567
|
)
|
$
|
(8,269
|
)
|
$
|
(7,444
|
)
|
|||
|
Investment in Genevant
|
$
|
—
|
|
$
|
—
|
|
$
|
—
|
|
$
|
24,665
|
|
|||
See accompanying notes to the condensed consolidated financial statements.
6
ARBUTUS BIOPHARMA CORPORATION
Notes to Condensed Consolidated Financial Statements
(Tabular amounts in thousands of U.S. Dollars, except share and per share amounts)
1.
Nature of business and future operations
Arbutus Biopharma Corporation (the “Company” or “Arbutus”) is a biopharmaceutical business dedicated to discovering, developing, and commercializing a cure for patients suffering from chronic hepatitis B infection, a disease of the liver caused by the hepatitis B virus (“HBV”). To pursue its strategy of developing a curative combination regimen, the Company has assembled a pipeline of multiple drug candidates with differing and complementary mechanisms of action targeting HBV. These include AB-729, the Company's subcutaneously-delivered RNA interference ("RNAi") therapeutic candidate currently in a Phase 1a/1b clinical trial, AB-452, the Company's lead oral HBV RNA destabilizer candidate currently in pre-clinical testing, next-generation oral capsid inhibitor compounds, and compounds that inhibit PD-L1.
The success of the Company is dependent on obtaining the necessary regulatory approvals to bring its products to market and achieving profitable operations. The Company's research and development activities and commercialization of its products are dependent on its ability to successfully complete these activities and to obtain adequate financing through a combination of financing activities and operations. It is not possible to predict either the outcome of the Company's existing or future research and development programs or the Company’s ability to continue to fund these programs in the future.
2.
Significant accounting policies
Basis of presentation
These unaudited condensed consolidated financial statements have been prepared in accordance with U.S. generally accepted accounting principles (“U.S. GAAP”) for interim financial statements and accordingly, do not include all disclosures required for annual financial statements. These statements should be read in conjunction with the Company’s audited consolidated financial statements and notes thereto for the year ended
December 31, 2018
included in the Company’s Annual Report on Form 10-K for the year ended
December 31, 2018
(the “2018 Form 10-K”). These unaudited condensed consolidated financial statements reflect, in the opinion of management, all adjustments and reclassifications necessary to fairly present the Company's financial position as of
September 30, 2019
and the Company's results of operations and cash flows for the
three and nine months ended September 30, 2019 and 2018
. The results of operations for the
three and nine months ended September 30, 2019 and 2018
, respectively, are not necessarily indicative of the results for the full year. These unaudited condensed consolidated financial statements follow the same significant accounting policies as those described in the notes to the audited consolidated financial statements of the Company for the year ended
December 31, 2018
, except as described below under Recent Accounting Pronouncements.
Principles of consolidation
These unaudited condensed consolidated financial statements include the accounts of the Company and its
two
wholly-owned subsidiaries, Arbutus Biopharma Inc. ("Arbutus Inc.") and Arbutus Biopharma US Holdings, Inc. All intercompany transactions and balances have been eliminated in consolidation.
Income or loss per share
The Company follows the two-class method when computing net loss attributable to common shareholders per share as the Company has issued Series A participating convertible preferred shares (the "Preferred Shares"), as further described in note 12, that meet the definition of participating securities. The Preferred Shares entitle the holders to participate in dividends but do not require the holders to participate in losses of the Company. Accordingly, if the Company reports a net loss attributable to holders of the Company's common shares, net losses are not allocated to holders of the Preferred Shares.
Net loss attributable to common shareholders per share is calculated based on the weighted average number of common shares outstanding. The calculation of diluted net loss attributable to common shareholders per share does not differ from the calculation of basic net loss attributable to common shareholders per share, as the effect of the Company’s dilutive potential common shares
7
was anti-dilutive. During the
nine months ended September 30, 2019 and 2018
, potential common shares of approximately
28.2 million
and
24.2 million
, respectively, consisting of the "if-converted" number of Preferred Shares and outstanding stock options, were excluded from the calculation of net loss per common share because their inclusion would be anti-dilutive.
The following table sets out the computation of basic and diluted net loss attributable to common shareholders per share:
|
Three Months Ended September 30,
|
Nine Months Ended September 30,
|
||||||||||||||
|
|
2019
|
2018
|
2019
|
2018
|
|||||||||||
|
(in thousands, except share and per share amounts)
|
|||||||||||||||
|
Numerator:
|
|||||||||||||||
|
Allocation of distributable earnings
|
$
|
—
|
|
$
|
—
|
|
$
|
—
|
|
$
|
—
|
|
|||
|
Allocation of undistributable loss
|
(85,295
|
)
|
(27,040
|
)
|
(137,338
|
)
|
(46,255
|
)
|
|||||||
|
Allocation of loss attributed to common shareholders
|
$
|
(85,295
|
)
|
$
|
(27,040
|
)
|
$
|
(137,338
|
)
|
$
|
(46,255
|
)
|
|||
|
Denominator:
|
|||||||||||||||
|
Weighted average number of common shares - basic and diluted
|
56,850,172
|
|
55,421,504
|
|
56,469,358
|
|
55,241,284
|
|
|||||||
|
Basic and diluted net loss attributable to common shareholders per share
|
$
|
(1.50
|
)
|
$
|
(0.49
|
)
|
$
|
(2.43
|
)
|
$
|
(0.84
|
)
|
|||
Equity method investment
The Company accounts for its investment in associated companies in accordance with the Financial Accounting Standards Board ("FASB") Accounting Standards Codification ("ASC") 323,
Investments - Equity Method and Joint Ventures
("ASC
323"). In accordance with ASC 323, associated companies are accounted for as equity method investments. Results of associated companies are presented on a one-line basis. Investments in, and advances to, associated companies are presented on a one-line basis in the caption “Investment in Genevant” in the Company's Condensed Consolidated Balance Sheets, net of allowance for losses, which represents the Company's best estimate of probable losses inherent in such assets. The Company's proportionate share of any associated companies' net income or loss is presented on a one-line basis in the caption "Equity investment (loss)" in the Company's Condensed Consolidated Statement of Operations. Transactions between the Company and any associated companies are eliminated on a basis proportional to the Company's ownership interest. Financial results of Genevant Sciences Ltd. ("Genevant") are recorded on a one-quarter lag basis.
Revenue recognition
The Company recognizes the amount of revenue to which it expects to be entitled for the transfer of promised goods or services to customers under a five-step model: (i) identify contract(s) with a customer; (ii) identify the performance obligations in the contract; (iii) determine the transaction price; (iv) allocate the transaction price to the performance obligations in the contract; and (v) recognize revenue when or as a performance obligation is satisfied.
The Company generates revenue primarily through collaboration agreements and license agreements. Such agreements may require the Company to deliver various rights and/or services, including intellectual property rights or licenses and research and development services. Under such agreements, the Company is generally eligible to receive non-refundable upfront payments, funding for research and development services, milestone payments, and royalties.
In contracts where the Company has more than one performance obligation to provide its customer with goods or services, each performance obligation is evaluated to determine whether it is distinct based on whether (i) the customer can benefit from the good or service either on its own or together with other resources that are readily available and (ii) the good or service is separately identifiable from other promises in the contract. The consideration under the contract is then allocated between the distinct performance obligations based on their respective relative stand-alone selling prices. The estimated stand-alone selling price of each deliverable reflects the Company's best estimate of what the selling price would be if the deliverable was regularly sold on
8
a stand-alone basis and is determined by reference to market rates for the good or service when sold to others or by using an adjusted market assessment approach if the selling price on a stand-alone basis is not available.
The consideration allocated to each distinct performance obligation is recognized as revenue when control is transferred to the customer for the related goods or services. Consideration associated with at-risk substantive performance milestones, including sales-based milestones, is recognized as revenue when it is probable that a significant reversal of the cumulative revenue recognized will not occur. Sales-based royalties received in connection with licenses of intellectual property are subject to a specific exception in the revenue standards, whereby the consideration is not included in the transaction price and recognized in revenue until the customer’s subsequent sales or usages occur.
Segment information
The Company operates as a single segment.
Recent accounting pronouncements
From time to time, new accounting pronouncements are issued by the FASB or other standard setting bodies that are adopted by the Company as of the specified effective date. Unless otherwise discussed, the Company believes that the impact of recently issued standards that are not yet effective will not have a material impact on the Company's financial position or results of operations upon adoption.
The Company adopted Accounting Standard Update (“ASU”) No. 2016-02,
Leases
(Topic 842), as of January 1, 2019, using the modified retrospective approach with the effective date transition method (note 5). Accordingly, all periods prior to adoption are presented in accordance with legacy accounting and the Company recorded no retrospective adjustments to the comparative periods presented. In addition, the Company elected the package of practical expedients permitted under the transition guidance within ASC 842, which among other things, allowed the Company to carry forward its historical lease classification. In addition, the Company elected the short term exemption, which allows entities to not capitalize their leases with a term of 12 months or less. Adoption of the new standard resulted in the recording of operating lease right-of-use assets (“ROU assets”) and lease liabilities of approximately
$3.2 million
and
$4.1 million
, respectively, as of January 1, 2019. The standard did not materially impact the Company’s consolidated statements of operations and statements of cash flow.
In November 2018, the FASB issued targeted amendments to ASU No. 2018-18,
Collaborative Arrangements
(Topic 808), and ASU No. 2016-10,
Revenue from Contracts with Customers
(Topic 606), to clarify that certain transactions between parties to collaborative arrangements should be accounted for in accordance with FASB revenue guidance when the counterparty is a customer. This guidance also prohibits the presentation of collaborative arrangements as revenues from contracts with customers if the counterparty is not a customer. This guidance, which is required to be applied retrospectively and is effective for interim and annual periods beginning after December 15, 2019, with early adoption permitted, is not expected to have a material impact on the Company’s consolidated financial statements.
3. Fair value of financial instruments
The Company measures certain financial instruments and other items at fair value.
To determine the fair value, the Company uses the fair value hierarchy for inputs used in measuring fair value that maximizes the use of observable inputs and minimizes the use of unobservable inputs by requiring that the most observable inputs be used when available. Observable inputs are inputs market participants would use to value an asset or liability and are developed based on market data obtained from independent sources. Unobservable inputs are inputs based on assumptions about the factors market participants would use to value an asset or liability. The three levels of inputs that may be used to measure fair value are as follows:
|
•
|
Level 1 inputs are quoted market prices for identical instruments available in active markets.
|
|
•
|
Level 2 inputs are inputs other than quoted prices included within Level 1 that are observable for the asset or liability either directly or indirectly. If the asset or liability has a contractual term, the input must be observable for substantially the full term. An example includes quoted market prices for similar assets or liabilities in active markets.
|
|
•
|
Level 3 inputs are unobservable inputs for the asset or liability and will reflect management’s assumptions about market assumptions that would be used to price the asset or liability.
|
The following table presents information about the Company’s assets and liabilities that are measured at fair value on a recurring basis, and indicates the fair value hierarchy of the valuation techniques used to determine such fair value:
|
Level 1
|
Level 2
|
Level 3
|
Total
|
||||||||||||
|
As of September 30, 2019
|
(in thousands)
|
||||||||||||||
|
Assets
|
|||||||||||||||
|
Cash and cash equivalents
|
$
|
90,082
|
|
$
|
—
|
|
$
|
—
|
|
$
|
90,082
|
|
|||
|
Liabilities
|
|||||||||||||||
|
Liability-classified options
|
—
|
|
—
|
|
86
|
|
86
|
|
|||||||
|
Contingent consideration
|
—
|
|
—
|
|
3,005
|
|
3,005
|
|
|||||||
|
Total
|
$
|
—
|
|
$
|
—
|
|
$
|
3,091
|
|
$
|
3,091
|
|
|||
|
Level 1
|
Level 2
|
Level 3
|
Total
|
||||||||||||
|
As of December 31, 2018
|
(in thousands)
|
||||||||||||||
|
Assets
|
|||||||||||||||
|
Cash and cash equivalents
|
$
|
36,942
|
|
$
|
—
|
|
$
|
—
|
|
$
|
36,942
|
|
|||
|
Short-term investments
|
87,675
|
|
—
|
|
—
|
|
87,675
|
|
|||||||
|
Total
|
124,617
|
|
—
|
|
—
|
|
124,617
|
|
|||||||
|
Liabilities
|
|||||||||||||||
|
Liability-classified stock option awards
|
—
|
|
—
|
|
479
|
|
479
|
|
|||||||
|
Contingent consideration
|
—
|
|
—
|
|
3,126
|
|
3,126
|
|
|||||||
|
Total
|
$
|
—
|
|
$
|
—
|
|
$
|
3,605
|
|
$
|
3,605
|
|
|||
The Company's liability-classified options are measured at fair value using the Black-Scholes valuation model. Assumptions about the Company's expected stock-price volatility are based on the historical volatility of the Company's publicly-traded stock. The risk-free interest rate used for each grant is equal to the zero coupon rate for instruments with a similar expected life. The assumptions around the expected life are based on the Company's historical data.
To determine the fair value of the contingent consideration, the Company uses a probability-weighted assessment of the likelihood the milestones would be met and the estimated timing of such payments (see note 10). The potential contingent payments are then discounted to their present value using a probability-adjusted discount rate that reflects the early-stage nature of the development program, time to complete the program development, and overall biotech indices.
The following table presents the changes in fair value of the Company’s liability-classified stock option awards:
|
|
Liability at beginning of the period
|
Fair value of liability-classified options exercised in the period
|
Increase (decrease) in fair value of liability
|
Liability at end of the period
|
|||||||||||
|
(in thousands)
|
|||||||||||||||
|
Nine months ended September 30, 2018
|
$
|
1,239
|
|
$
|
—
|
|
$
|
1,499
|
|
$
|
2,738
|
|
|||
|
Nine months ended September 30, 2019
|
$
|
479
|
|
$
|
—
|
|
$
|
(393
|
)
|
$
|
86
|
|
|||
The following table presents the changes in fair value of the Company’s contingent consideration:
|
|
Liability at beginning of the period
|
Increase (decrease) in fair value of liability
|
Liability at end of the period
|
||||||||
|
(in thousands)
|
|||||||||||
|
Nine months ended September 30, 2018
|
$
|
10,424
|
|
$
|
(6,263
|
)
|
$
|
4,161
|
|
||
|
Nine months ended September 30, 2019
|
$
|
3,126
|
|
$
|
(121
|
)
|
$
|
3,005
|
|
||
4.
Equity method investment
In April 2018, the Company entered into an agreement with Roivant Sciences Ltd. (“Roivant”), its largest shareholder, to launch Genevant, a company focused on the discovery, development, and commercialization of a broad range of RNA-based therapeutics enabled by the Company's lipid nanoparticle ("LNP") and ligand conjugate delivery technologies. The Company licensed exclusive rights to its LNP and ligand conjugate delivery platforms to Genevant for RNA-based applications outside of HBV. Genevant plans to develop products in-house and pursue industry partnerships to build a diverse pipeline of therapeutics across multiple modalities, including RNAi, mRNA, and gene editing.
Under the terms of the agreement, Roivant contributed $
37.5
million in seed capital to Genevant. The Company retained all rights to its LNP and conjugate delivery platforms for HBV, and is entitled to a tiered low single-digit royalty from Genevant on future sales of products enabled by the delivery platforms licensed to Genevant. The Company also retained the entirety of its royalty entitlement on the commercialization of Alnylam Pharmaceuticals Inc.'s ("Alnylam") ONPATTRO™ (Patisiran/ALN-TTR02). The Company recognized a non-cash gain of
$24.9 million
in the second quarter of 2018 in connection with the equity interest received by Arbutus upon Genevant’s formation.
As of
September 30, 2019
, the Company held an equity interest of approximately
40%
of the common equity of Genevant and accounts for its interest in Genevant using the equity method. The carrying value of the Company's interest in Genevant as of
September 30, 2019
was
$11.0 million
. The basis difference between the Company’s carrying value in Genevant and the Company’s share of Genevant's net assets is attributed primarily to indefinite-lived in-process research and development ("IPR&D") (the delivery technology transferred to Genevant). For the
three and nine months ended September 30, 2019
, the Company recorded equity investment losses of
$3.5 million
and
$11.5 million
, respectively, for its proportionate share of Genevant’s net loss, recorded on a one-quarter lag basis.
|
5.
|
Leases
|
The Company has
two
operating leases for office and laboratory space. The Company's corporate headquarters is located at 701 Veterans Circle, Warminster, Pennsylvania. The lease expires on April 30, 2027, and the Company has the option of extending the lease for
two
further
five
-year terms. The Company also leases office space located at 626 Jacksonville Rd, Warminster, Pennsylvania under a lease that expires on December 31, 2021, and the Company has an option to extend the lease term to April 30, 2027. In connection with the Company's site consolidation in 2018, the Company ceased using its office and laboratory space located in Burnaby, British Columbia, Canada on June 30, 2018. The Company subleased a portion of the Burnaby facility to various tenants, including Genevant, until the lease expired on July 31, 2019. The Company recognized the remaining lease payments for the Burnaby facility, less sublease income under contract, in site consolidation expenses in 2018. The Company’s lease agreements do not contain any material residual value guarantees or material restrictive covenants.
The Company adopted ASU No. 2016-02,
Leases
(Topic 842) on January 1, 2019 using the modified retrospective basis applied at the effective date of the new standard and elected to utilize a package of practical expedients. Leases with an initial term of 12 months or less are not recorded on the balance sheet. The Company determines if an arrangement is a lease at inception. Right-of-use assets represent the Company's right to use an underlying asset for the lease term and lease liabilities represent the Company's obligation to make lease payments arising from the lease. Operating lease right-of-use assets and lease liabilities are recognized based on the present value of lease payments over the lease term. The leases do not provide an implicit rate so, in determining the present value of lease payments, the Company utilized its incremental borrowing rate for the applicable lease, which was
9.0%
for the 701 Veterans Circle lease,
7.6%
for the 626 Jacksonville Rd. lease and
5.0%
for the Burnaby lease. The Company recognizes lease expense on a straight-line basis over the remaining lease term.
During the
nine months ended September 30, 2019
, the Company incurred total operating lease expenses of
$1.1 million
, which included lease expenses associated with fixed lease payments of
$0.9 million
, and variable payments associated with common area maintenance and similar expenses of
$0.2 million
. For the
nine months ended September 30, 2018
, the straight-line fixed expense for leases was
$0.9 million
. Sublease income for the
nine months ended September 30, 2019
was
$0.2 million
, versus
$0.1 million
for the
nine months ended September 30, 2018
.
9
Weighted average remaining lease term and discount rate were as follows:
|
As of September 30, 2019
|
|
|
Weighted-average remaining lease term (years)
|
7.3
|
|
Weighted average discount rate
|
8.9%
|
The Company did not include options to extend its lease terms as part of its ROU asset and lease liabilities.
Supplemental cash flow information related to the Company's operating leases was as follows:
|
Nine Months Ended September 30,
|
|||||||
|
2019
|
2018
|
||||||
|
(in thousands)
|
|||||||
|
Cash paid for amounts included in the measurement of lease liabilities
|
$
|
921
|
|
$
|
—
|
|
|
Maturities of lease liabilities were as follows:
|
As of September 30, 2019
|
|||
|
(in thousands)
|
|||
|
October through December 2019
|
$
|
188
|
|
|
2020
|
657
|
|
|
|
2021
|
677
|
|
|
|
2022
|
581
|
|
|
|
2023
|
598
|
|
|
|
Thereafter
|
2,039
|
|
|
|
Total Lease Payments
|
$
|
4,740
|
|
|
Less: interest
|
(1,268
|
)
|
|
|
Present value of lease payments
|
$
|
3,472
|
|
6.
Intangible assets and goodwill
Acquired IPR&D intangible assets relate to the Company's covalently closed circular DNA ("cccDNA") program. During the
three months ended September 30, 2019
, the Company recorded a
$43.8 million
non-cash impairment expense to reduce the carrying value of its IPR&D intangible assets to
zero
as of September 30, 2019. The Company also recognized a corresponding income tax benefit of
$12.7 million
related to the decrease in its deferred tax liability related to the IPR&D intangible assets. The impairment was due to a decision to delay indefinitely the further development of the Company's cccDNA program while the Company focuses on its other development programs.
Goodwill represents the excess of purchase price over the value assigned to the net tangible and identifiable intangible assets in connection with the business combination that formed Arbutus. In the third quarter of 2019, the Company assessed the changes in circumstances that occurred during the quarter to determine if it was more likely than not that the fair value of its single reporting unit was below its carrying amount. Although the Company's annual impairment test is performed during the fourth quarter, the Company performs this qualitative assessment each interim reporting period. Due to a sustained decrease in the Company's share price in recent months, the Company's market capitalization was reduced below the book value of its net assets and the Company concluded that the fair value of its single reporting unit was below its carrying amount by an amount in excess of the carrying value of the goodwill. As a result, the Company recorded a
$22.5 million
non-cash impairment expense to reduce the carrying value of its goodwill asset to
zero
as of September 30, 2019.
10
7. Accounts payable and accrued liabilities
Accounts payable and accrued liabilities are comprised of the following:
|
|
September 30, 2019
|
December 31, 2018
|
|||||
|
(in thousands)
|
|||||||
|
Trade accounts payable
|
$
|
1,400
|
|
$
|
3,192
|
|
|
|
Research and development accruals
|
4,112
|
|
2,716
|
|
|||
|
Professional fee accruals
|
1,177
|
|
871
|
|
|||
|
Payroll accruals
|
1,509
|
|
2,341
|
|
|||
|
Other accrued liabilities
|
1
|
|
309
|
|
|||
|
|
$
|
8,199
|
|
$
|
9,429
|
|
|
|
8.
|
Site consolidation
|
In 2018, the Company substantially completed a site consolidation and organizational restructuring to align its HBV business in Warminster, PA, including a reduction of its global workforce and closure of its Burnaby facility. The Company estimates that the total expenses to complete the site consolidation will be approximately
$5.0
million, of which
$4.8 million
has been incurred as of
September 30, 2019
. Included in the site consolidation plan was the payment of one-time employee termination benefits, employee relocation costs, and site closure costs. The Company ceased using its Burnaby facility as of June 30, 2018 and recognized the remaining committed cost, less sublease income under contract, in site consolidation expenses in 2018. The lease for the Burnaby facility expired on July 31, 2019.
Site consolidation expenses were as follows:
|
Three Months Ended September 30,
|
Nine Months Ended September 30,
|
||||||||||||||
|
2019
|
2018
|
2019
|
2018
|
||||||||||||
|
(in thousands)
|
|||||||||||||||
|
Employee severance and relocation
|
$
|
231
|
|
$
|
198
|
|
$
|
429
|
|
$
|
3,399
|
|
|||
|
Facility and other expenses
|
(49
|
)
|
(690
|
)
|
(396
|
)
|
311
|
|
|||||||
|
Total site consolidation expense
|
$
|
182
|
|
$
|
(492
|
)
|
$
|
33
|
|
$
|
3,710
|
|
|||
Site consolidation activity was as follows:
|
Employee severance and relocation
|
Facility and other expenses
|
Total
|
|||||||||
|
(in thousands)
|
|||||||||||
|
Site consolidation accrual as of December 31, 2018
|
$
|
697
|
|
$
|
634
|
|
$
|
1,331
|
|
||
|
Additional accruals and other adjustments
|
429
|
|
(396
|
)
|
33
|
|
|||||
|
Payments
|
(923
|
)
|
(238
|
)
|
(1,161
|
)
|
|||||
|
Site consolidation accrual as of September 30, 2019
|
$
|
203
|
|
$
|
—
|
|
$
|
203
|
|
||
|
9.
|
Sale of future royalties
|
On July 2, 2019, the Company entered into a Purchase and Sale Agreement (the "Agreement") with the Ontario Municipal Employees Retirement System (or "OMERS"), pursuant to which the Company sold to OMERS part of its royalty interest on future global net sales of ONPATTRO™ (Patisiran) ("ONPATTRO"), an RNA interference therapeutic currently being sold by Alnylam.
11
ONPATTRO utilizes Arbutus’ LNP technology, which was licensed to Alnylam pursuant to the Cross-License Agreement, dated November 12, 2012, by and between the Company and Alnylam (the “LNP License Agreement”). Under the terms of the LNP License Agreement, the Company is entitled to tiered royalty payments on global net sales of ONPATTRO ranging from
1.00%
to
2.33%
after offsets, with the highest tier applicable to annual net sales above
$500 million
. This royalty interest was sold to OMERS, effective as of January 1, 2019, for
$20 million
in gross proceeds before advisory fees. OMERS will retain this entitlement until it has received
$30 million
in royalties, at which point
100%
of such royalty interest on future global net sales of ONPATTRO will revert to the Company. OMERS has assumed the risk of collecting up to
$30 million
of future royalty payments from Alnylam and Arbutus is not obligated to reimburse OMERS if they fail to collect any such future royalties.
The
$30 million
in royalties to be paid to OMERS is accounted for as a liability, with the difference between the liability and the gross proceeds received accounted for as a discount. The discount, as well as
$1.5 million
of transaction costs, will be amortized as interest expense based on the projected balance of the liability as of the beginning of each period. Management estimated an effective annual interest rate of approximately
25%
. Over the course of the Agreement, the actual interest rate will be affected by the amount and timing of royalty revenue recognized and changes in the timing of forecasted royalty revenue. On a quarterly basis, the Company will reassess the expected timing of the royalty revenue, recalculate the amortization and effective interest rate and adjust the accounting prospectively as needed.
The Company will recognize non-cash royalty revenue related to the sales of ONPATTRO during the term of the Agreement. As royalties are remitted to OMERS from Alnylam, the balance of the recognized liability will be effectively repaid over the life of the Agreement. There are a number of factors that could materially affect the amount and timing of royalty payments from Alnylam, none of which are within the Company's control.
During the
three and nine months ended September 30, 2019
, the Company recognized non-cash royalty revenue of
$1.0 million
and
$1.1 million
of related non-cash interest expense.
The table below shows the activity related to the net liability from inception of the Agreement through
September 30, 2019
:
|
Nine Months Ended September 30, 2019
|
|||
|
(in thousands)
|
|||
|
Net liability related to sale of future royalties - beginning balance
|
$
|
—
|
|
|
Initial recognition of liability
|
30,000
|
|
|
|
Debt discount and issuance costs
|
(11,451
|
)
|
|
|
Non-cash royalty revenue
|
(979
|
)
|
|
|
Non-cash interest expense
|
1,106
|
|
|
|
Net liability related to sale of future royalties - ending balance
|
$
|
18,675
|
|
In addition to the royalty from the Alnylam LNP License Agreement, the Company is also receiving a second, lower royalty interest on global net sales of ONPATTRO originating from a settlement agreement and subsequent license agreement with Acuitas Therapeutics, Inc. ("Acuitas"). The royalty from Acuitas has been retained by the Company and was not part of the royalty sale to OMERS.
10. Contingencies and commitments
Arbitration with the University of British Columbia
Certain early work on LNP delivery systems and related inventions was undertaken by the Company and assigned to the University of British Columbia ("UBC"). These inventions were subsequently licensed back to the Company by UBC under a license agreement, initially entered into in 1998 and subsequently amended in 2001, 2006 and 2007. The Company has granted sublicenses under the UBC license to Alnylam. Alnylam has in turn sublicensed back to the Company under the licensed UBC patents for discovery, development and commercialization of siRNA products. Certain sublicenses were also granted to other parties.
12
On November 10, 2014, UBC filed a notice of arbitration against the Company and on January 16, 2015, filed a Statement of Claim, which alleged entitlement to
$3.5
million in allegedly unpaid royalties based on publicly available information, and an unspecified amount based on non-public information. UBC also sought interest and costs, including legal fees. The Company filed its Statement of Defense to UBC's Statement of Claims, as well as a Counterclaim involving a patent application that the Company alleged UBC wrongly licensed to a third party. The proceedings were divided into
three
phases, with the first hearing taking place in June 2017. In the first phase, the arbitrator determined which agreements are sublicense agreements within UBC's claim. Also in the first phase, UBC updated its alleged entitlement from
$3.5
million originally claimed to seek
$10.9
million in alleged unpaid royalties, plus interest arising from payments as early as 2008. The arbitrator also held in the first phase of the arbitration that the patent application that is the subject of the Counterclaim was not required to be licensed to Arbutus. The second phase of arbitration took place in April 2019. On August 20, 2019, the arbitrator issued his decision for the second phase of the arbitration, awarding UBC
$5.9 million
, which includes interest of approximately
$2.6 million
. The Company paid the
$5.9 million
award to UBC in September 2019. The arbitrator also held that the third phase of the arbitration, which would address patent validity, should the Company choose to pursue a third phase, would not provide a defense to the award. An award for costs and attorneys’ fees is still to be determined.
The Company recorded a charge of
$6.5 million
in the third quarter of 2019, consisting of
$5.9 million
for the award (including interest) and
$0.6 million
for an estimate of a potential award for costs and attorney's fees.
License Agreements between Enantigen and Blumberg and Drexel
In October 2014, Arbutus Inc. acquired all of the outstanding shares of Enantigen Therapeutics, Inc. (“Enantigen”) pursuant to a stock purchase agreement. Through this transaction, Arbutus Inc. acquired a HBV surface antigen secretion inhibitor program and a capsid assembly inhibitor program.
Under the stock purchase agreement, Arbutus Inc. agreed to pay up to a total of
$21.0
million to Enantigen’s selling shareholders upon the achievement of specified development and regulatory milestones for (a) the first
two
products that contain either a capsid compound or an HBV surface antigen compound that is covered by a patent acquired under this agreement, or (b) a capsid compound from an agreed upon list of compounds. The amount paid could be up to an additional
$102.5 million
in sales performance milestones in connection with the sale of the first commercialized product by Arbutus Inc. for the treatment of HBV, regardless of whether such product is based upon assets acquired under this agreement, and a low single-digit royalty on net sales of such first commercialized HBV product, up to a maximum royalty payment of
$1.0 million
that, if paid, would be offset against Arbutus Inc.'s milestone payment obligations. The contingent consideration for this acquisition is a financial liability and measured at its fair value at each reporting period, with any changes in fair value from the previous reporting period recorded in the statement of operations and comprehensive loss (see note 3). The fair value of the contingent consideration was
$3.0 million
as of
September 30, 2019
.
Under the stock purchase agreement, Enantigen must also fulfill its obligations as they relate to the
three
patent license agreements with The Baruch S. Blumberg Institute ("Blumberg") and Drexel University ("Drexel"). Pursuant to each patent license agreement, Enantigen is obligated to pay Blumberg and Drexel up to approximately
$0.5
million in development and regulatory milestones per licensed product, royalties in the low single-digits, and a percentage of revenue it receives from its sub-licensees.
Research Collaboration and Funding Agreement with Blumberg
In November 2018, the Company entered into a new
two
-year master services agreement with Blumberg that expires in November 2020. The new agreement replaces all rights and obligations of the prior research collaboration and funding agreements, as amended. Under the new agreement, Blumberg will perform specific research activities based upon statements of work and the Company will no longer provide a fixed amount of funding to Blumberg. As of September 30, 2019, the Company has executed statements of work with Blumberg for an aggregate cost of
$0.8
million under this new agreement. Intellectual property that is generated during the research activities is the Company's exclusive property and all financial obligations for it to utilize the intellectual property are satisfied in the upfront cost of the research activities. Under the terms of the new agreement, the Company retains all rights to any inventions arising from performance of the agreement and no license is granted to Blumberg, nor are milestones for said inventions due to Blumberg.
13
11.
Collaborations, contracts and licensing agreements
Revenue contracts are described in detail in the Overview section of Part I, Item 2, "Management's Discussion and Analysis of Financial Condition and Results of Operations" in the Company's 2018 Form 10-K.
In 2012, the Company entered into a license agreement with Alnylam that entitles Alnylam to develop and commercialize products with the Company's LNP technology. Alnylam's ONPATTRO program, which represents the first approved application of LNP technology, was approved by the U.S. Food and Drug Administration ("FDA") and the European Medicines Agency ("EMA") during the third quarter of 2018 and was launched immediately upon approval in the US. The Company is entitled to tiered low to mid single-digit royalty payments on global net sales of ONPATTRO and received its first royalty payment in the fourth quarter of 2018. In July 2019, the Company sold a portion of its royalty entitlement for Alnylam's ONPATTRO to OMERS. See note 9 - Sale of future royalties for further details.
Revenue for the
three and nine months ended September 30, 2019
consists primarily of a net
$1.5 million
development milestone earned under our license agreement with Gritstone, royalties on net global sales of Alnylam's ONPATTRO, a milestone and royalties on net sales of Spectrum Pharmaceuticals, Inc.'s ("Spectrum") Marqibo
®
and services provided to Gritstone Oncology, Inc. ("Gritstone"). Revenue for the three and nine months ended September 30, 2018 consisted primarily of revenue earned under our license agreement with Gritstone, including a net
$1.3 million
development milestone payment, the earned portion of an upfront license fee and services provided to Gritstone.
12. Stockholders' equity and stock-based compensation
Open Market Sale Agreement
In December 2018, the Company entered into an Open Market Sale Agreement (“Sale Agreement”) with Jefferies LLC, under which it may issue and sell common shares, from time to time, for an aggregate sales price of up to
$50.0 million
. For the
nine months ended September 30, 2019
, the Company issued
1,208,090
common shares pursuant to the Sale Agreement, resulting in gross proceeds of approximately
$5.2 million
. There were
no
shares issued during the
three months ended September 30, 2019
under the Sale Agreement.
Series A participating convertible preferred shares
In October 2017, the Company entered into a subscription agreement with Roivant for the sale of
1,164,000
Preferred Shares for gross proceeds of
$116.4
million. These Preferred Shares are non-voting and accrue an
8.75%
per annum coupon in the form of additional Preferred Shares, compounded annually, until October 16, 2021, at which time all the Preferred Shares will be subject to mandatory conversion into common shares (subject to limited exceptions in the event of certain fundamental corporate transactions relating to Arbutus’ capital structure or assets, which would permit earlier conversion at Roivant’s option). The conversion price is
$7.13
per share, which will result in the Preferred Shares being converted into approximately
23
million common shares. After conversion of the Preferred Shares into common shares, based on the number of common shares outstanding
as of September 30, 2019
, Roivant would hold approximately
49%
of the Company's common shares. Roivant agreed to a
four
year lock-up period for this investment and its existing holdings in the Company. Roivant also agreed to a
four
year standstill whereby Roivant will not acquire greater than
49.99%
of the Company's common shares or securities convertible into common shares. The initial investment of
$50.0
million closed in October 2017, and the remaining amount of
$66.4
million closed in January 2018 following regulatory and shareholder approvals.
The Company records the Preferred Shares wholly as equity under ASC 480,
Distinguishing Liabilities From Equity,
with no bifurcation of conversion feature from the host contract, given that the Preferred Shares cannot be cash settled and the redemption features are within the Company's control, which include a fixed conversion ratio with predetermined timing and proceeds. The Company accrues for the
8.75%
per annum compounding coupon at each reporting period end date as an increase to preferred share capital, and an increase to deficit (see Condensed Consolidated Statement of Stockholders' Equity).
14
13.
Related Party Transactions
Through the first quarter of 2019, the Company purchased certain research and development services from Genevant. These services were billed at agreed hourly rates and were reflective of market rates for such services. The total cost of these services for the
nine months ended September 30, 2019
was
$33 thousand
. There were
no
such costs incurred during the second and third quarter of 2019. The total cost of these services was
$0.1 million
and
$0.2 million
for the
three and nine months ended September 30, 2018
, respectively, and are included in the Condensed Consolidated Statements of Operations under research and development.
Conversely, Genevant purchased certain administrative and transitional services from the Company totaling
$40 thousand
and
$284 thousand
for the
three and nine months ended September 30, 2019
, respectively. The total income from these services was
$0.1 million
and
$0.3 million
for the
three and nine months ended September 30, 2018
, which were netted against research and development expenses in the Condensed Consolidated Statements of Operations. In addition, Genevant had a sublease for
17,900
square feet in the Company's Burnaby facility. Sublease income from Genevant was
$21 thousand
and
$0.1 million
for the
three and nine months ended September 30, 2019
, respectively, and was netted against site consolidation costs and lease liability (see notes 7 and 8). The Company’s Burnaby facility lease and the corresponding sublease to Genevant expired on July 31, 2019.
15
ITEM 2. MANAGEMENT’S DISCUSSION AND ANALYSIS OF FINANCIAL CONDITION AND RESULTS OF OPERATIONS
You should read the following discussion and analysis by our management of our financial position and results of operations in conjunction with our audited consolidated financial statements and related notes thereto included as part of our Annual Report on Form 10-K for the year ended
December 31, 2018
and our unaudited condensed consolidated financial statements for the
three and nine months ended September 30, 2019
. Our consolidated financial statements have been prepared in accordance with U.S. generally accepted accounting principles and are presented in U.S. dollars.
CAUTIONARY NOTE REGARDING FORWARD-LOOKING STATEMENTS
This Quarterly Report on Form 10-Q (“Form 10-Q”) contains “forward-looking statements” or “forward-looking information” within the meaning of applicable U.S. and Canadian securities laws (we collectively refer to these items as “forward-looking statements”). Forward-looking statements are generally identifiable by use of the words “believes,” “may,” “plans,” “will,” “anticipates,” “intends,” “budgets,” “could,” “estimates,” “expects,” “forecasts,” “projects” and similar expressions that are not based on historical fact or that are predictions of or indicate future events and trends, and the negative of such expressions. Forward-looking statements in this Form 10-Q, including the documents incorporated by reference, include statements about, among other things:
|
•
|
our strategy, future operations, pre-clinical research, pre-clinical studies, clinical trials, prospects and the plans of management;
|
|
•
|
the discovery, development and commercialization of a cure for chronic hepatitis B infection, a disease of the liver caused by the hepatitis B virus ("HBV");
|
|
•
|
our beliefs and development path and strategy to achieve a cure for HBV;
|
|
•
|
obtaining necessary regulatory approvals;
|
|
•
|
obtaining adequate financing through a combination of financing activities and operations;
|
|
•
|
using the results from our HBV studies to adaptively design additional clinical trials to test the efficacy of the combination therapy and the duration of the result in patients;
|
|
•
|
the expected timing of and amount for payments related to Enantigen Therapeutics, Inc.'s (“Enantigen”) transaction and its programs;
|
|
•
|
the potential of our drug candidates to improve upon the standard of care and contribute to a curative combination treatment regimen;
|
|
•
|
the potential benefits of the reversion of the OMERS royalty monetization transaction for our ONPATTRO™ (Patisiran) royalty interest;
|
|
•
|
developing a suite of products that intervene at different points in the viral life cycle, with the potential to reactivate the host immune system;
|
|
•
|
using pre-clinical results to adaptively design clinical trials for additional cohorts of patients, testing the combination and the duration of therapy;
|
|
•
|
selecting combination therapy regimens and treatment durations to conduct Phase 3 clinical trials intended to ultimately support regulatory filings for marketing approval;
|
|
•
|
expanding our HBV drug candidate pipeline through internal development, acquisitions and in-licenses;
|
|
•
|
the potential of our assets, including our ownership stake in Genevant Sciences Ltd. (Genevant”) and the royalty entitlement on ONPATTRO, to provide significant non-dilutive capital;
|
|
•
|
our expectation to present results from the AB-506 Phase 1a/1b clinical trial along with further details regarding the two cases of acute hepatitis at the AASLD meeting in November 2019;
|
|
•
|
our expectation to select one of several oral next-generation capsid inhibitor lead compounds for IND-enabling studies in December of this year;
|
|
•
|
our expectation to make a decision regarding AB-452 clinical development in early 2020;
|
|
•
|
our expectation for AB-729 for preliminary safety and efficacy data from both healthy subjects and several single dose cohorts of subjects with CHB to be available in the first quarter of 2020.
|
|
•
|
payments from the Gritstone Oncology, Inc. ("Gritstone") licensing agreement;
|
|
•
|
the belief that current legal proceedings will not have a material adverse effect on our consolidated results of operations, cash flows, or financial condition;
|
|
•
|
the expected return from strategic alliances, licensing agreements, and research collaborations;
|
|
•
|
statements with respect to revenue and expense fluctuation and guidance;
|
|
•
|
the sufficiency of our cash and cash equivalents to extend into early 2021;
|
|
•
|
obtaining funding to maintain and advance our business from a variety of sources including public or private equity or debt financing, collaborative arrangements with pharmaceutical companies and government grants and contracts;
|
16
|
•
|
on-going arbitration; and
|
|
•
|
the amount and timing of potential funding,
|
as well as other statements relating to our future operations, financial performance or financial condition, prospects or other future events. Forward-looking statements appear primarily in the sections of this Form 10-Q entitled “Part I, Item 1- Financial Statements (Unaudited),” and “Part I, Item 2-Management’s Discussion and Analysis of Financial Condition and Results of Operations”.
Forward-looking statements are based upon current expectations and assumptions and are subject to a number of known and unknown risks, uncertainties and other factors that could cause actual results to differ materially and adversely from those expressed or implied by such statements. Factors that could cause or contribute to such differences include, but are not limited to, those discussed in this Form 10-Q and our Annual Report on Form 10-K for the year ended
December 31, 2018
(“Form 10-K”), and in particular the risks and uncertainties discussed under "Item 1A-Risk Factors" of this Form 10-Q and the Form 10-K. As a result, you should not place undue reliance on forward-looking statements.
Additionally, the forward-looking statements contained in this Form 10-Q represent our views only as of the date of this Form 10-Q (or any earlier date indicated in such statement). While we may update certain forward-looking statements from time to time, we specifically disclaim any obligation to do so, even if new information becomes available in the future. However, you are advised to consult any further disclosures we make on related subjects in the periodic and current reports that we file with the Securities and Exchange Commission.
The foregoing cautionary statements are intended to qualify all forward-looking statements wherever they may appear in this Form 10-Q. For all forward-looking statements, we claim protection of the safe harbor for the forward-looking statements contained in the Private Securities Litigation Reform Act of 1995.
This Form 10-Q also contains estimates, projections and other information concerning our industry, our business, and the markets for certain diseases, including data regarding the estimated size of those markets, and the incidence and prevalence of certain medical conditions. Information that is based on estimates, forecasts, projections, market research or similar methodologies is inherently subject to uncertainties and actual events or circumstances may differ materially from events and circumstances reflected in this information. Unless otherwise expressly stated, we obtained this industry, business, market and other data from reports, research surveys, studies and similar data prepared by market research firms and other third parties, industry, medical and general publications, government data and similar sources.
17
OVERVIEW
Arbutus Biopharma Corporation ("Arbutus", the "Company", "we", "us", and "our") is a publicly traded (Nasdaq Global Select Market: ABUS) therapeutic solutions company dedicated to discovering, developing, and commercializing a cure for patients suffering from chronic hepatitis B infection, a disease of the liver caused by the hepatitis B virus (“HBV”). HBV represents a significant, global unmet medical need. The World Health Organization estimates that approximately 257 million people worldwide suffer from HBV infection. With high morbidity and mortality, and a cure rate for HBV patients taking standard of care ("SOC") treatment regimens of less than 5%, our objective is to develop safe and effective therapies that can be combined and lead to higher cure rates with finite treatment durations.
To pursue our strategy of developing a potential curative combination regimen for chronic HBV, we are developing a diverse product pipeline consisting of multiple drug candidates with potential complementary mechanisms of action, each of which has the potential to improve upon the SOC and contribute to a curative combination treatment regimen. Our clinical and pre-clinical pipeline includes agents that have the potential to form an effective proprietary combination therapy.
In addition to our drug pipeline focused on HBV, we have additional assets that have the potential to provide value to our company. The first is our royalty entitlement on ONPATTRO™ (Patisiran), a drug developed by Alnylam Pharmaceuticals, Inc. ("Alnylam") that incorporates our lipid nanoparticle delivery ("LNP") technology and was approved by the U.S. Food and Drug Administration ("FDA") and the European Medicines Agency (“EMA”) during the third quarter of 2018 and launched immediately upon approval in the U.S. In July 2019, we sold a portion of this royalty interest to an affiliate of the Ontario Municipal Employees Retirement System (“OMERS”), effective as of January 1, 2019, for $20 million in gross proceeds before advisory fees. OMERS will retain this entitlement until it has received $30 million in royalties, at which point 100% of such royalty interest on future global net sales of ONPATTRO will revert to us. OMERS has assumed the risk of collecting up to $30 million of future royalty payments from Alnylam and Arbutus is not obligated to reimburse OMERS if they fail to collect any such future royalties. If this royalty entitlement reverts to us, it has the potential to provide an active royalty stream or to be otherwise monetized again in full or in part. In addition to this royalty from the Alnylam LNP license agreement, we are also receiving a second, lower royalty interest on global net sales of ONPATTRO originating from a settlement agreement and subsequent license agreement with Acuitas Therapeutics, Inc. (Acuitas). The royalty from Acuitas has been retained by us and was not part of the royalty sale to OMERS. The second asset is our approximate 40% equity ownership interest in Genevant, a company to which we have licensed our LNP platform and conjugate delivery platform (the "Delivery Platforms") for all applications except HBV. These additional assets have the potential to provide significant non-dilutive capital to fund development of our HBV pipeline.
Strategy
Our objective is to develop a cure for patients with chronic HBV infection. We believe this can best be achieved by:
|
•
|
developing a pipeline of proprietary therapeutic agents that target multiple elements of the HBV viral lifecycle, the most important of which we believe are HBV replication and hepatitis B surface antigen ("HBsAg") expression, and the host immune system; and
|
|
•
|
identifying an effective combination of complementary proprietary therapeutic agents administered for a finite treatment duration.
|
Our primary focus is to:
|
•
|
progress our clinical and pre-clinical product candidates through Phase 1 and Phase 2 clinical trials;
|
|
•
|
identify a safe and effective combination regimen to support a robust Phase 3 clinical registration program;
|
|
•
|
obtain regulatory approval for such combination regimen; and
|
|
•
|
commercialize such combination regimen.
|
We are currently conducting a Phase 1a/1b clinical trial and pre-clinical and investigational new drug ("IND")-enabling studies to evaluate proprietary HBV therapeutic agents alone, together with SOC therapies and in combination with each other. We expect to use the results from these clinical trials and other studies to adaptively design future clinical trials to test the safety, efficacy and duration of potential combination therapies.
18
Our HBV product pipeline consists of the following programs:
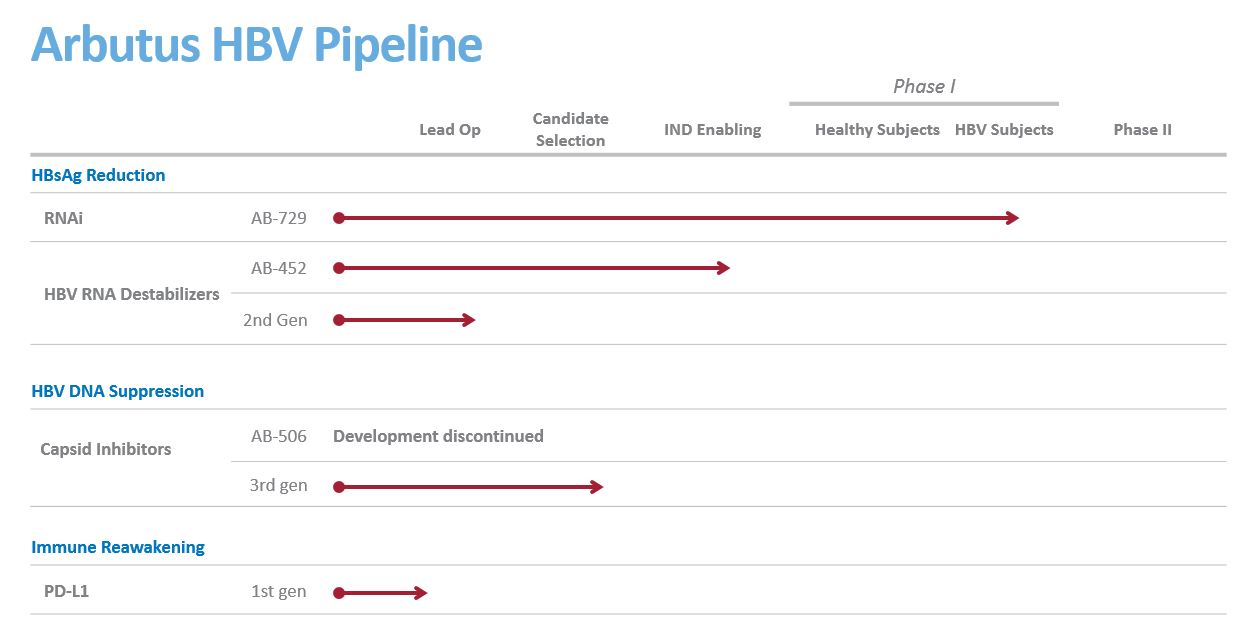
We intend to expand our HBV pipeline through internal discovery and development and possibly acquisitions and in-licenses.
Agents for Combination Therapy
Current treatments for HBV include pegylated interferon-α ("Peg-IFNα") and nucleos(t)ide analogues ("NAs"). These treatments reduce viral load, but have low cure rates of less than 5%. Peg-IFNα, a synthetic version of a substance produced by the body to fight infection, is administered by injection and has numerous side effects including flu-like symptoms and depression. NAs are oral antiviral medications which when taken chronically reduce virus replication and eliminate HBV DNA in the blood. However, liver inflammation and fibrosis still develop and virus replication resumes once NA therapy is stopped.
Given the biology of HBV, we believe combination therapies are the key to more effective HBV treatment and a potential cure. Additionally, we believe the development of an effective combination therapy can be accelerated when multiple components are controlled by a single company. Therefore, our R&D pipeline includes multiple drug candidates that target various steps in the viral lifecycle. We believe each of these mechanisms, when combined with an approved NA, have the potential to improve upon the standard of care and contribute to a curative treatment regimen and a finite treatment duration.
We believe that our RNAi agent, AB-729, could be combined with a capsid inhibitor and approved NAs, in our first combination therapy for HBV patients. In parallel, we are advancing our HBV RNA destabilizer program forward. This program includes AB-452 and several follow-on compounds from distinct chemical scaffolds.
HBsAg Reduction
RNAi Agents
The development of RNAi drugs, which utilize the RNA interference pathway, allows for a novel approach to treating disease. There is one approved RNAi product, ONPATTRO, and there are a number of RNAi products currently advancing in human clinical trials. RNAi products are broadly applicable as they can eliminate the production of disease-causing or disease-associated proteins from cells, creating opportunities for therapeutic intervention that have not been achievable with conventional drugs. Our extensive experience in antiviral drug development has been applied to our RNAi program to develop therapeutics for chronic HBV infection.
Our RNAi HBV candidates are designed to reduce HBsAg expression in patients chronically infected with HBV. Reducing HBsAg is thought to be a key prerequisite to enable a patient’s immune system to reawaken and respond against the virus.
19
GalNAc RNAi (AB-729)
Early in 2018, we nominated AB-729 for development. AB-729 is a subcutaneously-delivered RNAi therapeutic targeted to hepatocytes using our novel covalently conjugated N-acetylgalactosamine ("GalNAc") delivery technology. This promising new agent acts on multiple HBV viral transcripts and was designed to inhibit viral replication and suppress all viral antigens. AB-729 reduces HBsAg, is administered subcutaneously, and we anticipate will be dosed monthly.
We presented data from pre-clinical studies at the International Liver Congress of the European Association for the Study of the Liver (“EASL”) meeting in April 2018 in a presentation titled, “Durable Inhibition of Hepatitis B Virus Replication and Antigenemia Using Subcutaneously Administered siRNA Agent AB-729 in Preclinical Models”, which showed robust HBsAg knockdown and more durable in vivo activity than earlier-generation siRNA agents, including our LNP-based ARB-1467 product candidate, for the treatment of chronic HBV infection.
We successfully completed IND-enabling studies for AB-729 which we filed as part of a CTA. In July 2019, we initiated a single and multiple dose Phase 1a/1b clinical trial for AB-729 to investigate the safety, tolerability, pharmacokinetics, and pharmacodynamics of AB-729 in healthy subjects and CHB subjects. Preliminary safety data in single-dose cohorts of healthy subjects and safety and efficacy data in cohorts of subjects with CHB are expected in the first quarter of 2020.
Our initial RNAi candidate, ARB-1467, demonstrated the ability to reduce HBsAg in patients but utilized a lipid nanoparticle delivery vehicle which required intravenous delivery and bi-weekly administration. We have discontinued development of ARB-1467 and are focused on AB-729.
HBV Suppression
Capsid Inhibitors (AB-506 & AB-423)
HBV core protein assembles into a capsid structure, which is required for viral replication. The current SOC therapy (nucleoside analogues) significantly reduces HBV DNA levels in the serum, but HBV replication continues in the liver, thereby enabling HBV infection to persist. More effective therapy for patients requires new agents which will further block viral replication. We are developing capsid inhibitors (also known as core protein inhibitors) as oral therapeutics which, in combination with NAs, could sufficiently block HBV replication for the treatment of chronic HBV infection. By inhibiting assembly of functional viral capsids, the ability of HBV to replicate is impaired. Capsid inhibitor molecules also inhibit the uncoating step of the viral life cycle and thus reduce the formation of new covalently closed circular DNA ("cccDNA"), the viral reservoir which resides in the cell nucleus.
Our capsid inhibitor discovery effort generated promising second generation compounds in 2017, which led to the nomination of AB-506 for IND/clinical trial authorization ("CTA")-enabling studies. AB-506 was an orally administered, highly selective capsid inhibitor that had shown improved potency and pharmacokinetics (“PK”) over our first generation capsid inhibitor, AB-423, in pre-clinical studies. We presented AB-506 pre-clinical data at the American Association for the Study of Liver Disease ("AASLD") annual meeting in October 2017 in a presentation titled, "Antiviral Characterization of a Next Generation Chemical Series of HBV Capsid Inhibitors In Vitro and In Vivo," which showed potent inhibition of HBV replication and pre-genomic RNA encapsidation and an accelerated rate of capsid assembly leading to the production of non-functional viral capsids, which results in a disruption of viral replication. Together, these factors indicated improved target engagement compared to first generation capsid inhibitors, including AB-423.
We received regulatory approval of our CTA for AB-506 in the second quarter of 2018. During the third quarter of 2018, we began a double-blind, randomized, placebo controlled, single and multiple dose Phase 1a/1b clinical trial for AB-506 evaluating the safety, tolerability and pharmacokinetics of AB-506, in healthy subjects and HBV-DNA positive subjects with chronic hepatitis B (CHB) infection. The healthy subject portion consisted of a single ascending dose part in which subjects were randomized 6:2 (active: placebo), n=21, to receive AB-506 doses ranging from 30-1000 mg, including investigation of food effect, and a multiple dose part in which subjects (randomized 10:2, n=12) received 400 mg of AB-506 once daily for 10 days. The third part of the trial enrolled HBV DNA+, HBeAg-positive or -negative CHB subjects (randomized 10:2; n=12 per cohort) at different doses of AB-506, with or without a nucleoside analogue, once daily for 28 days.
In July 2019, we announced preliminary results from a Phase 1a/1b clinical trial in healthy subjects and two cohorts of CHB subjects who received AB-506 monotherapy, which indicated that AB-506 was a potent oral capsid inhibitor in CHB subjects. No serious adverse events (“SAEs”) or clinically significant safety findings were observed in healthy subjects (N=33). Alanine aminotransferase (“ALT”) levels and other liver function tests remained normal throughout the 10 days of dosing in healthy subjects.
20
In two cohorts of CHB subjects, mean HBV DNA and HBV RNA decreases at Day 28 (end of treatment) ranged from -2.0 log (160mg dose) to -2.8 log (400mg dose) and -2.4 log (for both doses), respectively, comparable with other capsid inhibitors currently in development. No SAEs were observed in CHB subjects (N= 24). Four CHB subjects (two in each of the cohorts) experienced Grade 4 ALT flares which returned to baseline levels upon AB-506 discontinuation or completion of the 28-day treatment period. Aspartate aminotransferase values were also elevated to a lesser degree, however, none of the subjects met the criteria for drug induced liver injury as bilirubin values and liver synthetic function remained normal. All four ALT flares occurred after the subjects experienced a >2 log decline in HBV DNA from baseline. We believe at least one of the ALT flare cases was immune-mediated and beneficial, as one subject in the 400 mg cohort who experienced a Grade 4 ALT flare also had notable declines in Hepatitis B surface antigen and Hepatitis B e-antigen of -1.4 log and -2.0 log, respectively, by Day 100 following AB-506 discontinuation. This subject was immediately put on nucleoside analogue therapy after AB-506 discontinuation per investigator’s decision. In addition, serum-based cytokine analysis of this subject showed an abrupt increase in IFN-gamma at the time of the flare, suggesting an immune-mediated response. For the other 3 subjects we continued to investigate the nature of the flares. Of these four subjects, two (one in each cohort) were asymptomatic, the other two (one in each cohort) had various mild to moderate adverse events at the time of their flares, one with mild heaviness in head, flatulence, discomfort and moderate fatigue, one with mild rash (knees, ankles, fingers and buttock). Two subjects in the 160 mg cohort experienced Grade 2 ALT flares. Both were asymptomatic and returned to baseline levels upon completing the 28-day treatment period.
To further investigate the nature of the ALT flares, we initiated a healthy subjects study testing 28 days of dosing. Before completing the study, we observed two cases of acute hepatitis. Consequently, we immediately stopped the clinical trial and decided to discontinue all further development of AB-506. We intend to present results from the AB-506 Phase 1a/1b clinical trial along with further details regarding the two cases of acute hepatitis at the AASLD meeting in November 2019. As a result of our decision to discontinue further development of AB-506, we no longer expect to initiate a combination study of AB-506 and AB-729 in the second half of 2020.
We have a number of oral next-generation capsid inhibitor compounds with chemical scaffolds different from AB-506 that we believe have the potential to contribute to the inhibition of HBV replication as part of a combination regimen. Our objective is to select one of several lead compounds for IND-enabling studies in December of this year.
HBV RNA Destabilizer (AB-452)
Our HBV RNA destabilizer AB-452, an orally administered agent, has shown novel and broad activity in pre-clinical studies in destabilizing HBV RNA, which leads to RNA degradation and subsequent reduction in all viral antigens, including HBsAg. We presented these preclinical data at the AASLD annual meeting in October 2017 in a presentation titled, "Identification and Characterization of AB-452, a Potent Small Molecule HBV RNA destabilizer In Vitro and In Vivo," which showed that AB-452 has complementary effects when combined with two of Arbutus’ proprietary HBV RNAi agents in vitro.
Additional data was presented at the EASL meeting in April 2018 in a presentation titled, “Preclinical antiviral drug combination studies utilizing novel orally bioavailable agents for chronic hepatitis B infection: AB-506, a next generation HBV capsid inhibitor, and AB-452, an HBV RNA destabilizer,” which showed that in vivo combinations of AB-452, AB-506 and tenofovir, an NA, led to greater reductions in serum HBV DNA relative to monotherapy with the individual compounds, and an impact on HBsAg when AB-452 was included in the treatment regimen. At the International HBV Meeting in October 2018, in a presentation titled “Mode of Action Studies on HBV RNA Destabilizer AB-452,” we presented data that showed that the HBV post-regulatory element is essential to AB-452 activity and that AB-452 induces HBV RNA shortening and RNA body degradation, further elucidating the mechanism of action of AB-452.
In October 2018, we announced the emergence of nonclinical safety findings in the AB-452 HBV RNA destabilizer program. Given the nature of these observations and the novel mechanism of action of this drug, additional studies were necessary to understand these findings and their implications before deciding whether to advance AB-452 into clinical trials. We have been evaluating AB-452 in a series of in vitro and in vivo studies to further characterize the compound, its mechanism of action, safety and pharmacokinetic profile. Following careful assessment of the nonclinical safety findings that led to pausing the entry of AB-452 into human clinical studies, we have concluded that the nonclinical safety study resulted in several confounding observations which included observations with no histological correlation, a lack of dose response regarding some key findings and an unexplained vehicle effect. Because of these confounding observations, we have determined that repeating the 90-day preclinical safety study in two species is appropriate before making a go/no-go decision. We expect that the results of this study will allow us to make that decision early in 2020. We remain committed to the development of oral HBV RNA destabilizers that have shown compelling anti-viral effects in multiple HBV pre-clinical models. While we work to fully understand the nature of the AB-452 pre-clinical findings, we are also continuing to advance back-up compounds with chemical scaffolds different from AB-452 into the lead optimization stage.
21
Research Programs
In addition to our clinical candidates, we have a number of research programs aimed at discovery and development of proprietary HBV candidates with different and complementary mechanisms of action. We have ongoing discovery efforts focused on checkpoint inhibition to identify novel, orally administered small molecule drug candidates to complement our pipeline of agents to form an effective combination therapy for the treatment of HBV.
Strategic Alliances and Licensing Agreements
ONPATTRO® (Patisiran/ALN-TTR02)
In 2012, we entered into a license agreement with Alnylam that entitles Alnylam to develop and commercialize products with our LNP technology. Alnylam's ONPATTRO™ (Patisiran), which represents the first approved application of our LNP technology, was approved by the FDA and EMA during the third quarter of 2018 and was launched immediately upon approval in the US. Under the terms of this license agreement, we are entitled to tiered royalty payments on global net sales of ONPATTRO ranging from 1.00% - 2.33% after offsets, with the highest tier applicable to annual net sales above $500 million. This royalty interest was sold to OMERS, effective as of January 1, 2019, for $20 million in gross proceeds before advisory fees. OMERS will retain this entitlement until it has received $30 million in royalties, at which point 100% of this royalty entitlement on future global net sales of ONPATTRO will revert to us.
In addition to the royalty entitlement from the Alnylam LNP license agreement, we are also receiving a second, lower royalty entitlement on global net sales of ONPATTRO originating from a settlement agreement and subsequent license agreement with Acuitas Therapeutics. The royalty entitlement from Acuitas has been retained by us and was not part of the royalty entitlement sale to OMERS.
Genevant Sciences
In April 2018, we entered into an agreement with Roivant Sciences Ltd. (“Roivant”), our largest shareholder, to launch Genevant, a company focused on the discovery, development, and commercialization of a broad range of RNA-based therapeutics enabled by our LNP and ligand conjugate delivery technologies. We have licensed exclusive rights to these delivery platforms to Genevant for RNA-based applications outside of HBV. Genevant plans to develop products in-house and pursue industry partnerships to build a diverse pipeline of therapeutics across multiple modalities, including RNAi, mRNA, and gene editing.
Under the terms of the agreement, Roivant contributed $37.5 million in transaction-related seed capital to Genevant, consisting of an initial $22.5 million investment and a subsequent investment of $15 million at a pre-determined, stepped-up valuation. We retain all rights to our delivery platforms for HBV, and are entitled to a tiered low single-digit royalty from Genevant on future sales of products enabled by the delivery platforms licensed to Genevant. We also retained the entirety of our royalty entitlement on the commercialization of Alnylam’s ONPATTRO. As of
September 30, 2019
, we held an equity interest in Genevant of approximately
40%
.
CRITICAL ACCOUNTING POLICIES AND SIGNIFICANT JUDGEMENTS AND ESTIMATES
This management’s discussion and analysis of our financial condition and results of operations is based on our consolidated financial statements, which have been prepared in accordance with U.S. generally accepted accounting principles (“U.S. GAAP”). The preparation of these financial statements requires us to make estimates and assumptions that affect the reported amounts of assets, liabilities, revenues, and expenses. Our estimates are based on our historical experience and on various other factors that we believe are reasonable under the circumstances, the results of which form the basis for making judgments about the carrying value of assets and liabilities that are not readily apparent from other sources. Actual results may differ from these estimates under different assumptions or conditions.
We believe there have been no significant changes in our critical accounting policies and estimates as discussed in “Item 7. Management’s Discussion and Analysis of Financial Condition and Results of Operations” of our Annual Report on Form 10-K for the year ended
December 31, 2018
.
RECENT ACCOUNTING PRONOUNCEMENTS
22
From time to time, new accounting pronouncements are issued by the Financial Accounting Standards Board or other standard setting bodies that are adopted by us as of the specified effective date. Unless otherwise discussed, we believe that the impact of recently issued standards that are not yet effective will not have a material impact on our financial position or results of operations upon adoption.
Please refer to note 2 to our condensed consolidated financial statements included in Part I, Item 1, "Financial Statements (Unaudited)" of this Quarterly Report on Form 10-Q for a description of recent accounting pronouncements applicable to our business.
RESULTS OF OPERATIONS
The following summarizes the results of our operations for the periods shown:
|
|
Three Months Ended
|
Nine Months Ended
|
|||||||||||||
|
|
September 30,
|
September 30,
|
|||||||||||||
|
|
2019
|
2018
|
2019
|
2018
|
|||||||||||
|
(in thousands except per share amounts)
|
|||||||||||||||
|
Total revenue
|
$
|
3,061
|
|
$
|
1,587
|
|
$
|
4,393
|
|
$
|
4,267
|
|
|||
|
Operating expenses
|
94,462
|
|
34,013
|
|
135,380
|
|
77,144
|
|
|||||||
|
Loss from operations
|
(91,401
|
)
|
(32,426
|
)
|
(130,987
|
)
|
(72,877
|
)
|
|||||||
|
Net loss
|
(82,503
|
)
|
(24,473
|
)
|
(129,069
|
)
|
(38,811
|
)
|
|||||||
|
Net loss attributable to common shares
|
$
|
(85,295
|
)
|
$
|
(27,040
|
)
|
$
|
(137,338
|
)
|
$
|
(46,255
|
)
|
|||
|
Basic and diluted loss per common share
|
(1.50
|
)
|
(0.49
|
)
|
(2.43
|
)
|
(0.84
|
)
|
|||||||
Revenue
Revenue contracts are addressed in detail in the Overview section of Part I, Item 2, "Management's Discussion and Analysis of Financial Condition and Results of Operations" in our 2018 Form 10-K.
Revenue
increased
$1.5 million
and
increased
$0.1 million
for the
three and nine months ended September 30, 2019
, respectively, as compared to the same periods in
2018
. Revenue for the
three and nine months ended September 30, 2019
consisted primarily of a net $1.5 million development milestone earned under our license agreement with Gritstone, royalties from sales of Alnylam's ONPATTRO
TM
, a milestone and royalties from Spectrum Pharmaceuticals, Inc.'s Marqibo
®
and revenue from services provided to Gritstone.
During the third quarter of 2018, Alnylam's ONPATTRO, which utilizes our LNP technology, was approved by the FDA and the EMA and was launched immediately upon approval in the US. In July 2019, a portion of the ONPATTRO
royalty interest was sold to OMERS, effective as of January 1, 2019, for $20 million in gross proceeds before advisory fees. OMERS will retain this entitlement until it has received $30 million in royalty payments, at which point 100% of such royalty interest on future global net sales of ONPATTRO will revert to us. Revenue for the nine months ended September 30, 2019 included $1.0 million of non-cash revenue for ONPATTRO royalty payments remitted to OMERS.
Revenue for the
three and nine months ended September 30, 2018
consisted primarily of revenue earned under our license agreement with Gritstone, including a net $1.3 million development milestone payment, the earned portion of a deferred upfront license fee and services provided to Gritstone.
23
Expenses
Expenses are summarized in the following tables:
|
Three Months Ended September 30,
|
|||||||||||||
|
2019
|
% of Total
|
2018
|
% of Total
|
||||||||||
|
(in thousands)
|
|||||||||||||
|
Research and development
|
$
|
17,731
|
|
19
|
%
|
$
|
16,566
|
|
49
|
%
|
|||
|
General and administrative
|
3,249
|
|
3
|
%
|
2,631
|
|
8
|
%
|
|||||
|
Depreciation
|
507
|
|
1
|
%
|
497
|
|
1
|
%
|
|||||
|
Site consolidation (note 8)
|
182
|
|
—
|
%
|
(492
|
)
|
(1
|
)%
|
|||||
|
Impairment of intangible assets (note 6)
|
43,836
|
|
46
|
%
|
14,811
|
|
44
|
%
|
|||||
|
Impairment of goodwill (note 6)
|
22,471
|
|
24
|
%
|
—
|
|
—
|
%
|
|||||
|
Arbitration (note 10)
|
6,486
|
|
7
|
%
|
—
|
|
—
|
%
|
|||||
|
Total operating expenses
|
$
|
94,462
|
|
100
|
%
|
$
|
34,013
|
|
100
|
%
|
|||
|
Nine Months Ended September 30,
|
|||||||||||||
|
2019
|
% of Total
|
2018
|
% of Total
|
||||||||||
|
(in thousands)
|
|||||||||||||
|
Research and development
|
$
|
45,183
|
|
33
|
%
|
$
|
46,871
|
|
61
|
%
|
|||
|
General and administrative
|
15,850
|
|
12
|
%
|
10,075
|
|
13
|
%
|
|||||
|
Depreciation
|
1,521
|
|
1
|
%
|
1,677
|
|
2
|
%
|
|||||
|
Site consolidation (note 8)
|
33
|
|
—
|
%
|
3,710
|
|
5
|
%
|
|||||
|
Impairment of intangible assets (note 6)
|
43,836
|
|
32
|
%
|
14,811
|
|
19
|
%
|
|||||
|
Impairment of goodwill (note 6)
|
22,471
|
|
17
|
%
|
—
|
|
—
|
%
|
|||||
|
Arbitration (note 10)
|
6,486
|
|
5
|
%
|
—
|
|
—
|
%
|
|||||
|
Total operating expenses
|
$
|
135,380
|
|
100
|
%
|
$
|
77,144
|
|
100
|
%
|
|||
Research and development
Research and development expenses consist primarily of clinical and pre-clinical trial expenses, personnel expenses, consulting and third party expenses, consumables and materials, as well as a portion of stock-based compensation and general overhead costs.
Research and development expenses increased $1.2 million and
decreased
$1.7 million
for the three and
nine months ended September 30, 2019
, respectively, as compared to the same periods in
2018
. Research and development expenses during 2019 included: (i) patient enrollment in our Phase 1a/1b clinical trial for our capsid inhibitor AB-506; (ii) IND/CTA enabling pre-clinical studies and patient enrollment in our Phase 1a/1b clinical trial for our RNAi agent (AB-729); and (iii) in vitro and in vivo studies to further characterize our HBV RNA destabilizer (AB-452), including the compound itself, its mechanism of action and pharmacokinetic profile.
The increase in research and development expenses for the
three months ended September 30, 2019
as compared to the same period in
2018
was due primarily to costs associated with our two Phase 1a/b clinical trials for AB-729 and AB-506. In October 2019, we announced we had observed two cases of acute hepatitis in our healthy subjects study testing 28 days of dosing of AB-506. Consequently, we immediately stopped the clinical trial and decided to discontinue all further development of AB-506.
The decrease in research and development expenses for the nine months ended September 30, 2019 as compared to the same period in
2018
was due primarily to costs in 2018 associated with AB-452, including drug product manufacturing, expenses in 2018 associated with the Phase 2 clinical trial for AB-1467, and IND/CTA-enabling work and CTA regulatory filings in 2018 for AB-506, AB-452 and AB-729. These decreases were partially offset by increased spending in 2019 for the two Phase 1a/1b clinical trials for AB-506 and AB-729.
24
A significant portion of our research and development expenses are not tracked by project as they benefit multiple projects or our technology platform and because our most-advanced programs are not yet in late-stage clinical development.
General and administrative
General and administrative expenses
increased
$0.6 million
and
$5.8 million
for the
three and nine months ended September 30, 2019
, respectively, as compared to the same periods in
2018
. The
increase
for the three months ended September 30, 2019 compared to the same period in 2018 was due primarily to increased stock compensation expense and an increase in insurance premiums. The
increase
for the nine months ended September 30, 2019 compared to the same period in 2018 was due primarily to our former President and Chief Executive Officer's departure from the company in June 2019. In accordance with the terms of his legacy employment agreement, he received $2.3 million of cash severance (paid in July 2019) and we recognized $2.2 million of non-cash stock-based compensation expense for accelerated vesting of his stock options. Additionally, general and administrative expenses increased for the nine months ended September 30, 2019 due to increased stock compensation expense and an increase in insurance premiums.
Site consolidation
In February 2018, we announced a site consolidation and organizational restructuring to better align our HBV business in Warminster, PA, by reducing our global workforce and closing our Burnaby, Canada facility. Most of the employee-related site consolidation expenses were expensed ratably over the period that employees provided services, which was substantially completed by June 30, 2018. We expect total site consolidation expenses to be approximately $5.0 million, of which approximately $4.8 million has been incurred as of
September 30, 2019
.
Impairment of intangible assets and goodwill
In the third quarter of 2019, we recorded a $43.8 million non-cash impairment expense to reduce the carrying value of our in-process research and development ("IPR&D") assets to zero as of September 30, 2019. We also recognized a corresponding income tax benefit of $12.7 million related to the decrease in our deferred tax liability associated with the IPR&D intangible assets. The impairment was due to a decision to delay indefinitely the further development of our cccDNA program while we focus on our other development programs.
Also in the third quarter of 2019, we recorded a $22.5 million non-cash impairment expense to reduce the carrying value of our goodwill asset to zero as of September 30, 2019. Due to a sustained decrease in our share price in recent months, our market capitalization was reduced below the book value of our net assets and we concluded that the fair value of our single reporting unit was below its carrying amount by an amount in excess of the carrying value of the goodwill asset.
Arbitration
In the third quarter of 2019, the arbitrator in the arbitration proceedings between the University of British Columbia (“UBC”) and Arbutus issued his decision for the second phase of the arbitration, awarding UBC approximately $5.9 million, which includes interest of approximately $2.6 million. The arbitrator also held that the third phase of the arbitration, which would address patent validity, should Arbutus choose to pursue a third phase, would not provide a defense to the award. An award for costs and attorneys’ fees is still to be determined.
The Company recorded expense of $6.5 million in the third quarter of 2019, consisting of $5.9 million for the award (including interest) and $0.6 million for an estimate of a potential award for costs and attorney's fees.
As previously disclosed, this arbitration concerned certain early work on lipid nanoparticle delivery systems and related inventions undertaken by Arbutus and assigned to UBC. These inventions were subsequently licensed back to us by UBC under a license agreement, initially entered into in 1998 and subsequently amended in 2001, 2006 and 2007. We have granted sublicenses under the UBC license to Alnylam Pharmaceuticals as well as other third parties. In the arbitration, UBC’s claim was for $10.9 million plus interest.
25
Other income (loss)
Other income (loss) is summarized in the following table:
|
|
Three Months Ended
|
Nine Months Ended
|
|||||||||||||
|
|
September 30,
|
September 30,
|
|||||||||||||
|
|
2019
|
2018
|
2019
|
2018
|
|||||||||||
|
(in thousands)
|
|||||||||||||||
|
Interest income
|
$
|
503
|
|
$
|
756
|
|
$
|
1,709
|
|
$
|
2,319
|
|
|||
|
Interest expense (note 9)
|
(1,100
|
)
|
—
|
|
(1,114
|
)
|
(104
|
)
|
|||||||
|
Foreign exchange gain (loss)
|
(25
|
)
|
145
|
|
43
|
|
(740
|
)
|
|||||||
|
Gain on investment (note 4)
|
—
|
|
—
|
|
—
|
|
24,884
|
|
|||||||
|
Equity investment loss (note 4)
|
(3,512
|
)
|
(2,838
|
)
|
(11,497
|
)
|
(2,838
|
)
|
|||||||
|
Change in fair value of contingent consideration (notes 3 and 10)
|
376
|
|
5,608
|
|
121
|
|
6,263
|
|
|||||||
|
Total other income (loss)
|
$
|
(3,758
|
)
|
$
|
3,671
|
|
$
|
(10,738
|
)
|
$
|
29,784
|
|
|||
Interest income
The
$0.3 million
and
$0.6 million
decrease
in interest income for the
three and nine months ended September 30, 2019
, respectively, compared to the same periods in
2018
was due primarily to a lower average balance of cash, cash equivalents and short-term investments.
Interest expense
Interest expense in 2019 consisted primarily of non-cash amortization of the liability related to the sale of future royalties. In July 2019, we sold a portion of our future royalties on sales of ONPATTRO™ to OMERS.
Foreign exchange gains (losses)
In connection with our site consolidation to Warminster, PA, our Canadian dollar denominated expenses and cash balances have decreased significantly now that a majority of our business transactions are based in the United States. We continue to incur expenses and hold some cash balances in Canadian dollars, and as such, will remain subject to risks associated with foreign currency fluctuations. In the future, we expect that the proportion of cash balances and expenses incurred in Canadian dollars, relative to U.S. dollars, will continue to decrease as a result of the site consolidation.
Gain on investment and equity investment losses
In the second quarter of 2018, together with Roivant, we launched Genevant, a company focused on the discovery, development, and commercialization of a broad range of RNA-based therapeutics enabled by our LNP Delivery Technologies. We recognized a non-cash gain of $24.9 million in the second quarter of 2018 in connection with the equity interest received by Arbutus upon Genevant’s formation. We account for our
40%
ownership interest in Genevant using the equity method of accounting. For the
three and nine months ended September 30, 2019
, we recorded
$3.5 million
and
$11.5 million
, respectively, of equity investment
losses
, reflecting our proportionate share of Genevant's net results on a one-quarter lag basis.
Change in fair value of contingent consideration
Contingent consideration is a liability we assumed from our acquisition of Arbutus, Inc. in March 2015. In general, as time passes and assuming no changes to the assumptions related to the contingency, the fair value of the contingent consideration increases as the progress of our programs get closer to triggering contingent payments.
The change in the fair value of our contingent consideration liability
decreased
$5.2 million
and
$6.1 million
for the
three and nine months ended September 30, 2019
, respectively, compared to the same periods in 2018. During 2018, we recalibrated the estimated timing of future development milestones being achieved, resulting in a significant reduction of the estimated fair value of the liability. During the third quarter of 2019, we made some adjustments to the timing of future commercial milestones being achieved, resulting in a small
decrease
in the estimated fair value of the liability.
26
LIQUIDITY AND CAPITAL RESOURCES
The following table summarizes our cash flow activities for the periods indicated:
|
|
Three Months Ended September 30,
|
Nine Months Ended September 30,
|
|||||||||||||
|
|
2019
|
2018
|
2019
|
2018
|
|||||||||||
|
(in thousands)
|
|||||||||||||||
|
Net loss
|
$
|
(82,503
|
)
|
$
|
(24,473
|
)
|
$
|
(129,069
|
)
|
$
|
(38,811
|
)
|
|||
|
Items not involving cash:
|
58,956
|
|
9,927
|
|
73,410
|
|
(9,493
|
)
|
|||||||
|
Net change in non-cash operating items:
|
77
|
|
1,342
|
|
(1,996
|
)
|
(2,487
|
)
|
|||||||
|
Net cash used in operating activities
|
(23,470
|
)
|
(13,204
|
)
|
(57,655
|
)
|
(50,791
|
)
|
|||||||
|
Net cash provided by (used) in investing activities
|
16,155
|
|
24,378
|
|
87,160
|
|
(48,911
|
)
|
|||||||
|
Net cash provided by financing activities
|
18,549
|
|
435
|
|
23,564
|
|
55,537
|
|
|||||||
|
Effect of foreign exchange rate changes on cash and cash equivalents
|
(24
|
)
|
131
|
|
71
|
|
(795
|
)
|
|||||||
|
Increase in cash and cash equivalents
|
11,210
|
|
11,740
|
|
53,140
|
|
(44,960
|
)
|
|||||||
|
Cash and cash equivalents, beginning of period
|
78,872
|
|
10,193
|
|
36,942
|
|
66,893
|
|
|||||||
|
Cash and cash equivalents, end of period
|
$
|
90,082
|
|
$
|
21,933
|
|
$
|
90,082
|
|
21,933
|
|
||||
Since our incorporation, we have financed our operations through the sales of equity, debt, revenues from research and development collaborations and licenses with corporate partners, royalty monetization, interest income on funds available for investment, and government contracts, grants and tax credits.
For the
nine months ended September 30, 2019
, operating activities used
$57.7 million
in cash as compared to
$50.8 million
of cash used in the
nine months ended September 30, 2018
. The
increase
in net cash used in operating activities is due primarily to payment of a $5.9 million arbitration award to UBC during the nine months ended September 30, 2019.
For the
nine months ended September 30, 2019
, investing activities
increased
cash by
$87.2 million
as certain short-term investments matured. For the
nine months ended September 30, 2018
, investing activities included investment of the proceeds from the second tranche of the Series A participating convertible preferred shares (the "Preferred Shares") financing in short-term investments.
For the
nine months ended September 30, 2019
, financing activities
increased
cash by
$23.6 million
due primarily to net proceeds from the sale a portion of our future royalties from sales of ONPATTRO. For the
nine months ended September 30, 2018
, financing activities included $66.3 million of net proceeds from the second tranche of the Preferred Shares financing, offset by repayment of a $12.0 million promissory note with a bank.
Sources of Liquidity
As of
September 30, 2019
, we had cash and cash equivalents of
$90.1 million
. We had no outstanding debt at
September 30, 2019
.
In December 2018, we entered into the Sale Agreement, under which we may issue and sell common shares, from time to time, for an aggregate sales price of up to $50.0 million. For the
nine months ended September 30, 2019
, we issued
1,208,090
common shares pursuant to the Sale Agreement, resulting in gross proceeds of approximately
$5.2 million
.
In addition to our drug pipeline focused on HBV, we have additional assets that have the potential to provide value to our company. The first is our royalty entitlement on ONPATTRO, a drug developed by Alnylam that incorporates our LNP technology and was approved by the FDA and the EMA during the third quarter of 2018 and was launched immediately upon approval in the US. In July 2019, we sold a portion of this royalty interest to OMERS, effective as of January 1, 2019, for $20 million in gross proceeds before advisory fees. OMERS will retain this entitlement until it has received $30 million in royalties, at which point 100% of such royalty interest on future global net sales of ONPATTRO will revert to us. OMERS has assumed the risk of collecting up to $30 million of future royalty payments from Alnylam and Arbutus is not obligated to reimburse OMERS if they fail to collect any such future royalties. If this royalty entitlement reverts to us, it has the potential to provide an active royalty stream or to be otherwise monetized again in full or in part. In addition to the royalty from the Alnylam LNP license agreement, we are also receiving a second, lower royalty interest on global net sales of ONPATTRO originating from a settlement agreement and subsequent license agreement with Acuitas. The royalty from Acuitas has been retained by us and was not part of the royalty sale to OMERS.
27
The second asset is our approximate 40% equity ownership interest in Genevant, a company to which we have licensed our Delivery Platforms for all applications except HBV. These additional assets have the potential to provide significant non-dilutive capital to fund development of our HBV pipeline.
In October 2017, we closed the sale of 500,000 Preferred Shares to Roivant for gross proceeds of $50.0 million. A second tranche of 664,000 Preferred Shares for gross proceeds of $66.4 million closed in January 2018, following receipt of the approval of our shareholders. We are using these proceeds to develop and advance product candidates through clinical trials, as well as for working capital and general corporate purposes.
Cash requirements
At
September 30, 2019
, we held an aggregate of
$90.1 million
in cash and cash equivalents. In October 2019, we announced we had observed two cases of acute hepatitis in our healthy subjects study testing 28 days of dosing of AB-506. Consequently, we immediately stopped the clinical trial and decided to discontinue all further development of AB-506. As a result of discontinuing development of AB-506 and the delay in a potential combination clinical trial beyond 2020, we believe that our cash and cash equivalents as of
September 30, 2019
will be sufficient to fund our operations into early 2021. In the future, substantial additional funds will be required to continue with the active development of our pipeline products and technologies. In particular, our funding needs may vary depending on a number of factors including:
•
the need for additional capital to fund future business development programs;
|
•
|
revenue earned from our legacy collaborative partnerships and licensing agreements, including potential royalty payments from Alnylam's ONPATTRO;
|
|
•
|
revenue earned from ongoing collaborative partnerships, including milestone and royalty payments;
|
|
•
|
the extent to which we continue the development of our product candidates, add new product candidates to our pipeline, or form collaborative relationships to advance our products;
|
|
•
|
delays in the development of our product candidates due to pre-clinical and clinical findings;
|
|
•
|
our decisions to in-license or acquire additional products, product candidates or technology for development, in particular for our HBV therapeutics programs;
|
|
•
|
our ability to attract and retain corporate partners, and their effectiveness in carrying out the development and ultimate commercialization of our product candidates;
|
|
•
|
whether batches of drugs that we manufacture fail to meet specifications resulting in delays and investigational and remanufacturing costs;
|
|
•
|
the decisions, and the timing of decisions, made by health regulatory agencies regarding our technology and products;
|
|
•
|
competing technological and market developments; and
|
|
•
|
costs associated with prosecuting and enforcing our patent claims and other intellectual property rights, including litigation and arbitration arising in the course of our business activities.
|
We intend to seek funding to maintain and advance our business from a variety of sources including public or private equity or debt financing, potential monetization transactions, collaborative arrangements with pharmaceutical companies and government grants and contracts. There can be no assurance that funding will be available at all or on acceptable terms to permit further development of our products.
If adequate funding is not available, we may be required to delay, reduce or eliminate one or more of our research or development programs or reduce expenses associated with our non-core activities. We may need to obtain funds through arrangements with collaborators or others that may require us to relinquish most or all of our rights to product candidates at an earlier stage of development or on less favorable terms than we would otherwise seek if we were better funded. Insufficient financing may also mean failing to prosecute our patents or relinquishing rights to some of our technologies that we would otherwise develop or commercialize.
OFF-BALANCE SHEET ARRANGEMENTS
We do not have any off-balance sheet arrangements that have or are reasonably likely to have a current or future effect on our financial condition, changes in financial condition, revenues or expenses, results of operations, liquidity, capital expenditures or capital resources that is material to investors.
ITEM 3.
QUANTITATIVE AND QUALITATIVE DISCLOSURES ABOUT MARKET RISK
There have been no material changes in our quantitative and qualitative disclosures about market risk from those disclosed in our Annual Report on Form 10-K for the year ended
December 31, 2018
.
ITEM 4.
CONTROLS AND PROCEDURES
Evaluation of Disclosure Controls and Procedures
Our management, with the participation of our principal executive officer and principal financial officer, evaluated the effectiveness of our disclosure controls and procedures as of
September 30, 2019
. The term “disclosure controls and procedures”, as defined in Rules 13a-15(e) and 15d-15(e) under the Exchange Act, means controls and other procedures of a company that are designed to ensure that information required to be disclosed by us in the reports that we file or submit under the Exchange Act is recorded, processed, summarized and reported within the time periods specified in the SEC's rules and forms, and that such information is accumulated and communicated to our management, including our principal executive officer and principal financial officer, as appropriate, to allow timely decisions regarding required disclosure, particularly during the period in which this Quarterly Report on Form 10-Q was being prepared. Management recognizes that any controls and procedures, no matter how well designed and operated, can provide only reasonable assurance of achieving their desired objectives, and our management necessarily applies its judgment in evaluating the cost-benefit relationship of possible controls and procedures. Based on the evaluation of our disclosure controls and procedures as of
September 30, 2019
, our principal executive officer and principal financial officer concluded that, as of such date, our disclosure controls and procedures were effective at the reasonable assurance level.
Changes in Internal Control over Financial Reporting
There have been no changes in our internal control over financial reporting (as defined in Rules 13a–15(f) and 15d–15(f) under the Exchange Act) during the three months ended
September 30, 2019
that have materially affected, or are reasonably likely to materially affect, our internal control over financial reporting.
28
PART II. OTHER INFORMATION
ITEM 1. LEGAL PROCEEDINGS
For information regarding legal matters, please refer to note 10. Contingencies and Commitments to the condensed consolidated financial statements contained in Part I of this Quarterly Report on Form 10-Q, which is incorporated herein by reference.
ITEM 1A. RISK FACTORS
There have been no material changes in our risk factors from those disclosed in our Annual Report on Form 10-K for the fiscal year-ended December 31, 2018.
ITEM 2. UNREGISTERED SALES OF EQUITY SECURITIES AND USE OF PROCEEDS
None.
ITEM 3. DEFAULTS UPON SENIOR SECURITIES
None.
ITEM 4. MINE SAFETY DISCLOSURES
Not applicable.
ITEM 5. OTHER INFORMATION
None.
ITEM 6. EXHIBITS
29
EXHIBIT INDEX
|
Number
|
Description
|
|
|
3.1
|
||
|
3.2
|
||
|
4.1
|
||
|
10.1*
|
||
|
10.2†
|
||
|
10.3*
|
||
|
31.1*
|
||
|
|
|
|
|
31.2*
|
||
|
|
||
|
32.1**
|
||
|
|
|
|
|
32.2**
|
||
|
|
|
|
|
101
|
The following materials from Arbutus Biopharma Corporation's Quarterly Report on Form 10-Q for the quarter ended September 30, 2019, formatted in XBRL (eXtensible Business Reporting Language): (i) Condensed Consolidated Balance Sheets; (ii) Condensed Consolidated Statements of Operations; (iii) Condensed Consolidated Statements of Comprehensive Loss; (iv) Condensed Consolidated Statements of Stockholders' Equity; (v) Condensed Consolidated Statements of Cash Flows; and (vi) Notes to Condensed Consolidated Financial Statements
|
|
* Filed herewith.
** Furnished herewith.
† Certain exhibits of this Exhibit have been omitted pursuant to Item 601(a)(5) of Regulation S-K. Arbutus Biopharma Corporation agrees to furnish a copy of this Exhibit to the Securities and Exchange Commission on a confidential basis upon request.
30
SIGNATURES
Pursuant to the requirements of the Securities Exchange Act of 1934, the registrant has duly caused this report to be signed on its behalf by the undersigned, thereunto duly authorized on
November 6, 2019
.
|
ARBUTUS BIOPHARMA CORPORATION
|
||
|
|
By:
|
/s/ William H Collier
|
|
|
|
William H Collier
|
|
|
|
President and Chief Executive Officer
|
31
TABLE OF CONTENTS
Part I. Financial InformationItem 1. Financial Statements (unaudited)Item 2. Management S Discussion and Analysis Of Financial Condition and Results Of OperationsItem 3. Quantitative and Qualitative Disclosures About Market RiskItem 4. Controls and ProceduresPart II. Other InformationItem 1. Legal ProceedingsItem 1A. Risk FactorsItem 2. Unregistered Sales Of Equity Securities and Use Of ProceedsItem 3. Defaults Upon Senior SecuritiesItem 4. Mine Safety DisclosuresItem 5. Other InformationItem 6. Exhibits