ACCO BRANDS CORP
10-Ks and 10-Qs
|
|
|
|
|
|
|
|
|
|
|
|
|
|
|
|
|
|
|
|
|
|
|
|
|
|
|
|
|
|
|
|
|
|
|
|
|
|
|
|
|
|
|
|
|
|
|
|
|
|
|
|
|
UNITED STATES
SECURITIES AND EXCHANGE COMMISSION
Washington, D.C. 20549
___________________________________________________________
Form 10-K
|
þ
|
ANNUAL REPORT PURSUANT TO SECTION 13 OR 15(d) OF THE SECURITIES EXCHANGE ACT OF 1934
|
For the Fiscal Year Ended
December 31, 2016
|
¨
|
TRANSITION REPORT PURSUANT TO SECTION 13 OR 15(d) OF THE SECURITIES EXCHANGE ACT OF 1934
|
For the transition period from to
Commission File Number 001-08454
ACCO Brands Corporation
(Exact Name of Registrant as Specified in Its Charter)
|
Delaware
|
|
36-2704017
|
|
(State or Other Jurisdiction
of Incorporation or Organization)
|
|
(I.R.S. Employer
Identification Number)
|
Four Corporate Drive
Lake Zurich, Illinois 60047
(Address of Registrant’s Principal Executive Office, Including Zip Code)
(847) 541-9500
(Registrant’s Telephone Number, Including Area Code)
Securities registered pursuant to Section 12(b) of the Act:
|
Title of Each Class
|
|
Name of Each Exchange on Which Registered
|
|
Common Stock, par value $.01 per share
|
|
New York Stock Exchange
|
Securities registered pursuant to Section 12(g) of the Act:
None
Indicate by check mark if the registrant is a well-known seasoned issuer, as defined in Rule 405 of the Securities Act.
Yes
þ
No
¨
Indicate by check mark if the registrant is not required to file reports pursuant to Section 13 or Section 15(d) of the Act.
Yes
¨
No
þ
Indicate by check mark whether the registrant: (1) has filed all reports required to be filed by Section 13 or 15(d) of the Securities Exchange Act of 1934 during the preceding 12 months (or for such shorter period that the registrant was required to file such reports), and (2) has been subject to such filing requirements for the past 90 days. Yes
þ
No
¨
Indicate by check mark whether the registrant has submitted electronically and posted on its corporate website, if any, every Interactive Data File required to be submitted and posted pursuant to Rule 405 of Regulation S-T during the preceding 12 months (or for such shorter period that the registrant was required to submit and post such files). Yes
þ
No
¨
Indicate by check mark if disclosure of delinquent filers pursuant to Item 405 of Regulation S-K is not contained herein, and will not be contained, to the best of registrant’s knowledge, in definitive proxy or information statements incorporated by reference in Part III of this Form 10-K or any amendment to this Form 10-K.
þ
Indicate by check mark whether the registrant is a large accelerated filer, an accelerated filer, a non-accelerated filer or a smaller reporting company (as defined in Rule 12b-2 of the Exchange Act).
|
Large accelerated filer
þ
|
Accelerated filer
¨
|
Non-accelerated filer
¨
|
Smaller reporting company
¨
|
|||
Indicate by check mark whether the registrant is a shell company (as defined in Rule 12b-2 of the Act). Yes
¨
No
þ
As of
06/30/16
, the aggregate market value of the shares of Common Stock held by non-affiliates of the registrant was approximately
$947.3 million
. As of
February 6, 2017
, the registrant had outstanding
107,913,840
shares of Common Stock.
DOCUMENTS INCORPORATED BY REFERENCE
Portions of the registrant’s definitive proxy statement to be issued in connection with registrant’s annual stockholder’s meeting expected to be held on
May 16, 2017
are incorporated by reference into Part III of this report.
Cautionary Statement Regarding Forward-Looking Statements
Certain statements made in this Annual Report on Form 10-K are "forward-looking statements" within the meaning of Section 21E of the Securities Exchange Act of 1934, as amended. We intend such forward-looking statements to be covered by the safe harbor provisions for forward-looking statements contained in the Private Securities Litigation Reform Act of 1995, and are including this statement for purposes of invoking these safe harbor provisions. These forward-looking statements, which are based on certain assumptions and describe future plans, strategies and expectations of ACCO Brands Corporation (the "Company"), are generally identifiable by use of the words "will," "believe," "expect," "intend," "anticipate," "estimate," "forecast," "project," "plan," or similar expressions. In particular, our business outlook is based on certain assumptions, which we believe to be reasonable under the circumstances. These include, without limitation, assumptions regarding changes in the macro environment, fluctuations in foreign currency rates, changes in the competitive landscape and consumer behavior and the effect of consolidation in the office products industry, as well as other factors described below.
Our ability to predict results or the actual effect of future plans or strategies is inherently uncertain. Because actual results may differ from those predicted by such forward-looking statements, you should not place undue reliance on them when deciding whether to buy, sell or hold the Company’s securities. Our forward-looking statements are made as of the date hereof and we undertake no obligation to update these forward-looking statements in the future, except as may be required by law.
Some of the factors that could affect our results or cause plans, actions and results to differ materially from current expectations are detailed in "Part I, Item 1. Business" and "Part I, Item 1A. Risk Factors" and the financial statement line item discussions set forth in "Part II, Item 7. Management’s Discussion and Analysis of Financial Condition and Results of Operations" of this report and from time to time in our other Securities and Exchange Commission (the "SEC") filings. Other factors include our ability to realize the synergies, growth opportunities and other potential benefits of acquiring Pelikan Artline and Esselte and successfully combine them with our existing businesses.
Website Access to Securities and Exchange Commission Reports
The Company’s Internet website can be found at
www.accobrands.com
. The Company makes available free of charge on or through its website its Annual Reports on Form 10-K, Quarterly Reports on Form 10-Q, Current Reports on Form 8-K, and amendments to those reports filed or furnished pursuant to Section 13(a) or 15(d) of the Securities Exchange Act of 1934 as soon as practicable after the Company files them with, or furnishes them to, the SEC. We also make available the following documents on our Internet website: the Audit Committee Charter; the Compensation Committee Charter; the Corporate Governance and Nominating Committee Charter; the Finance and Planning Committee Charter; the Executive Committee Charter; our Corporate Governance Principles; and our Code of Business Conduct and Ethics. The Company’s Code of Business Conduct and Ethics applies to all of our directors, officers (including the Chief Executive Officer, Chief Financial Officer and Principal Accounting Officer) and employees. You may obtain a copy of any of the foregoing documents, free of charge, if you submit a written request to ACCO Brands Corporation, Four Corporate Drive, Lake Zurich, IL. 60047, Attn: Investor Relations.
TABLE OF CONTENTS
|
PART I
|
||
|
ITEM 1.
|
||
|
ITEM 1A.
|
||
|
ITEM 1B.
|
||
|
ITEM 2.
|
||
|
ITEM 3.
|
||
|
ITEM 4.
|
||
|
PART II
|
||
|
ITEM 5.
|
||
|
ITEM 6.
|
||
|
ITEM 7.
|
||
|
ITEM 7A.
|
||
|
ITEM 8.
|
||
|
ITEM 9.
|
||
|
ITEM 9A.
|
||
|
ITEM 9B.
|
||
|
PART III
|
||
|
ITEM 10.
|
||
|
ITEM 11.
|
||
|
ITEM 12.
|
||
|
ITEM 13.
|
||
|
ITEM 14.
|
||
|
PART IV
|
||
|
ITEM 15.
|
||
ITEM 1.
BUSINESS
As used in this Annual Report on Form 10-K for the fiscal year ended
December 31, 2016
, the terms "ACCO Brands," "ACCO," the "Company," "we," "us," and "our" refer to ACCO Brands Corporation, a Delaware corporation incorporated in 2005, and its consolidated domestic and international subsidiaries.
Overview of the Company
ACCO Brands is one of the world's largest designers, marketers and manufacturers of branded business, academic and selected consumer products. Our widely recognized brands include Artline
®
, AT-A-GLANCE
®
, Derwent
®
,
Esselte
®
, Five Star
®
, GBC
®
, Hilroy
®
, Kensington
®
, Leitz
®
, Marbig
®
, Mead
®
, NOBO
®
, Quartet
®
, Rapid
®
, Rexel
®
, Swingline
®
, Tilibra
®
, Wilson Jones
®
and many others. More than 80% of our net sales come from brands that occupy the number one or number two positions in the select product categories in which we compete. We seek to develop new products that meet the needs of our consumer and commercial end-users. We compete through a balance of product innovation, category management, a low-cost operating model and an efficient supply chain. We sell our products to consumers and commercial end-users primarily through resellers, including wholesalers and retailers, on-line retailers, and traditional office supply resellers. Our products are sold primarily to markets located in the U.S., Northern Europe, Australia, Canada, Brazil and Mexico.
For the year ended
December 31, 2016
, approximately
43%
of our sales were outside the U.S., up from
40%
in
2015
.
The majority of our revenue is concentrated in geographies where demand for our product categories is in mature stages, but we see opportunities to grow sales through share gains, channel expansion and new products. Over the long-term we expect to derive growth in faster growing emerging geographies where demand in the product categories in which we compete is strong, such as in Latin America and parts of Asia, the Middle East and Eastern Europe. We plan to grow organically, supplemented by strategic acquisitions in both existing and adjacent categories. Historically, key drivers of demand for our products have included trends in white-collar employment levels, education enrollment levels, gross domestic product (GDP), growth in the number of small businesses and home offices, as well as consumer usage trends for our product categories.
We believe our leading product positions provide the scale to enable us to invest in product innovation and drive growth across our product categories. We currently manufacture approximately half of our products locally where we operate, and source approximately half of our products, primarily from China.
On May 2, 2016, the Company completed the acquisition of Australia Stationery Industries, Inc. (the "PA Acquisition"), which indirectly owned the
50%
of the Pelikan Artline joint-venture and the issued capital stock of Pelikan Artline Pty Limited (collectively, "Pelikan Artline") that was not already owned by the Company. Prior to the PA Acquisition, the Company's investment in the Pelikan Artline joint-venture was accounted for under the equity method. The results of Pelikan Artline joint-venture are included in the Company's condensed consolidated financial statements from the date of the PA Acquisition, May 2, 2016.
Pelikan Artline's product categories include writing instruments, notebooks, binding and lamination, visual communication, cleaning and janitorial supplies, as well as general stationery. Its industry-leading brands include Artline
®
, Quartet
®,
GBC
®
, Spirax
®
and Texta
®
, among others.
Pelikan Artline is currently being integrated with our existing businesses in Australia and New Zealand.
On
January 31, 2017
, ACCO Europe, an indirect wholly-owned subsidiary of the Company, completed its previously announced acquisition (the "Esselte Acquisition") of Esselte Group Holdings AB ("Esselte"). The results of Esselte are not included in the 2016 results. For further information, see "
Note 20. Subsequent Events
" to the consolidated financial statements contained in Part II, Item 8. of this report.
Reportable Segments
The Company's three business segments are described below.
ACCO Brands North America and ACCO Brands International
ACCO Brands North America and ACCO Brands International design, market, source, manufacture and sell traditional office products, academic supplies and calendar products. ACCO Brands North America comprises the U.S. and Canada, and ACCO Brands International comprises the rest of the world, primarily Northern Europe, Australia, Brazil and Mexico.
1
Our business, academic and calendar product lines use name brands such as Artline
®
, AT-A-GLANCE
®
, Derwent
®
, Esselte
®
, Five Star
®
, GBC
®
, Hilroy
®
, Leitz
®
, Marbig
®
, Mead
®
, NOBO
®
, Quartet
®
, Rapid
®
, Rexel
®
, Swingline
®
, Tilibra
®
, Wilson Jones
®
and many others. Products and brands are not confined to one channel or product category and are sold based on end-user preference in each geographic location.
The majority of our office products, such as stapling, binding and laminating equipment and related consumable supplies, shredders and whiteboards, are used by businesses. Most of these end-users purchase their products from our customers, which include traditional office supply resellers, wholesalers and other retailers, including on-line retailers. We supply some of our products directly to large commercial and industrial end-users, and provide business machine maintenance and certain repair services. Additionally, we supply some similar private label products.
Our academic products include notebooks, folders, decorative calendars and stationery products. We distribute our academic products primarily through mass merchandisers and other retailers, such as grocery, drug and office superstores, as well as on-line retailers. We also distribute to small independent retailers in emerging markets and supply some private label academic products.
Our calendar products are sold through all the same channels where we sell business or academic products, as well as directly to consumers, both on-line and through direct mail.
Computer Products Group
Our Computer Products Group designs, sources, distributes, markets and sells accessories for laptop and desktop computers and tablets. These accessories primarily include security products, input devices such as presenters, mice and trackballs, ergonomic aids such as foot and wrist rests, docking stations, and other PC and tablet accessories. We sell these products mostly under the Kensington
®
, Microsaver
®
and ClickSafe
®
brand names, with the majority of revenue coming from the U.S. and Northern Europe. Our computer products are manufactured by third-party suppliers, principally in Asia, and are distributed from our regional facilities. Our computer products are sold primarily to consumer electronics retailers, information technology value-added resellers, original equipment manufacturers, and office products retailers, as well as directly to consumers on-line.
For further information on our business segments see "
Note 16. Information on Business Segments
" to the consolidated financial statements contained in Part II, Item 8. of this report.
Customers/Competition
Our sales are generated principally in the U.S., Northern Europe, Australia, Canada, Brazil and Mexico. For the year ended
December 31, 2016
, approximately
43%
of our net sales were outside the U.S. Our top ten customers accounted for
56%
of net sales for the year ended
December 31, 2016
. Sales to Staples, our largest customer, amounted to approximately
14%
,
14%
and
13%
of net sales for each of the years ended
December 31, 2016
,
2015
and
2014
respectively. Sales to Wal-Mart amounted to approximately
10%
of net sales for the year ended
December 31, 2016
. Sales to Office Depot amounted to approximately
10%
and
11%
of net sales for each of the years ended
December 31, 2015
and
2014
respectively. Sales to Office Depot were below 10% for the year ended
December 31, 2016
. See also "Item 1A.
Risk Factors -
Our business serves a limited number of large and sophisticated customers, and a substantial reduction in sales to one or more of these customers could adversely impact our operating results
,
" and "Item 7.
Management's Discussion and Analysis of Financial Condition and Results of Operations.
"
Our customers are primarily large global and regional resellers of our products including traditional office supply resellers, wholesalers, on-line retailers and other retailers. Mass merchandisers and retail channels primarily sell to individual consumers but also to small businesses. We also sell to office supply retailers, commercial contract dealers, wholesalers, distributors and independent dealers who primarily serve commercial end-users. Over half of our product sales by our customers are to commercial end-users, who generally seek premium products that have added value or ease-of-use features and a reputation for reliability, performance and professional appearance. Some of our binding and laminating equipment products are sold directly to high-volume end-users and commercial reprographic centers. We also sell directly to consumers.
Current trends among our customers include fostering high levels of competition among suppliers, demanding innovative new products and requiring suppliers to maintain or reduce product prices and deliver products with shorter lead times and in smaller quantities. Another trend is for retailers to import products directly from foreign sources and sell those products, which compete with our products, under the retailer's own private-label brands. Our increased focus on the mass channel and sales growth with on-line retailers has helped to partially offset declines in the office superstore and wholesaler channels due to consolidation and channel shifts. Historically, large office superstores and wholesalers have maintained a significant market share in business, academic and dated goods, but these customers are experiencing increasing competition from mass merchandisers and on-line
2
retailers. The combination of these market influences, along with a continuing trend of consolidation among office superstores, resellers and wholesalers has created an intensely competitive environment in which our principal customers continuously evaluate which product suppliers they use. This results in pricing pressures and the need for stronger end-user brands, broader product penetration within categories, ongoing introduction of innovative new products and continuing improvements in customer service.
Competitors of our ACCO Brands North America and ACCO Brands International segments include 3M, Blue Sky, Carolina Pad, CCL Industries, Dominion Blueline, Fellowes, Franklin Covey, Hamelin, House of Doolittle, LSC Communications, Newell Rubbermaid, Smead, Spiral Binding and numerous private label suppliers and importers. Competitors of the Computer Products Group include Belkin, Fellowes, Logitech, Targus and Zagg.
See also "Item 1A.
Risk Factors -
Our historical office superstore and wholesale customers may further transform their business models, which could adversely impact our sales and margins
,
" "
-
Shifts in the channels of distribution for our products could adversely impact our business
,
" "
- Challenges related to the highly competitive business segments in which we operate could have an adverse effect on our ongoing business, results of operation and financial condition,
" "
-
Our success partially depends on our ability to continue to develop and market innovative products that meet end-user demands, including price expectations
,
" and "-
The market for computer products is rapidly changing and highly competitive
.
"
Certain financial information for each of our business segments and geographic regions is incorporated by reference to "
Note 16. Information on Business Segments
" to the consolidated financial statements contained in Part II, Item 8. of this report.
Product Development
Our strong commitment to understanding our consumers and defining products that fulfill their needs drives our product development strategy, which we believe is and will continue to be a key contributor to our success. Our new products are developed from our own consumer understanding, our own research and development or through partnership initiatives with inventors and vendors. Costs related to consumer and product research when paid directly by ACCO Brands are included in marketing costs and research and development expenses, respectively. Research and development expenses amounted to
$21.0 million
,
$20.0 million
and
$20.2 million
for the years ended
December 31, 2016
,
2015
and
2014
, respectively. As a percentage of sales, research and development expenses were
1.3%
,
1.3%
and
1.2%
for the years ended
December 31, 2016
,
2015
and
2014
, respectively. See also "Item 1A.
Risk Factors -
Our success partially depends on our ability to continue to develop and market innovative products that meet end-user demands, including price expectations
.
"
We consistently review our businesses and product offerings, assess their strategic fit and seek opportunities to divest nonstrategic businesses and rationalize our product offerings. The criteria we use in assessing the strategic fit include: the ability to increase sales for the business; the ability to create strong, differentiated brands; the importance of the business to key customers; the business's relationship with existing product lines; the importance of the business to the market; and the business's actual and potential impact on our operating performance. See also "Part II. Item 7.
Management's Discussion and Analysis of Financial Condition and Results of Operations.
"
Raw Materials
The primary materials used in the manufacturing of many of our products are paper, plastics, resin, polyester and polypropylene substrates, steel, wood, aluminum, melamine, zinc and cork. These materials are available from a number of suppliers, and we are not dependent upon any single supplier for any of these materials. Based on our experience, we believe that adequate quantities of these materials will be available in the foreseeable future. See also "Item 1A.
Risk Factors -
Risks associated with currency volatility could adversely affect our sales, profitability, cash flow and results of operations
,
" "
-
Fluctuation in the costs of raw materials, labor and transportation and changes in international shipping capacity as well as issues affecting port availability and efficiency, such as labor strikes, could adversely affect our business, results of operations and financial condition
," and "-
Changes to current policies by the U.S. government could adversely affect our business
."
3
Supply
Our products are either manufactured or sourced to ensure that we supply our customers with appropriate customer service, quality products, innovative solutions and attractive pricing. We have built a customer-focused business model with a flexible supply chain to ensure that these factors are appropriately balanced. Using a combination of manufacturing and third-party sourcing also enables us to reduce our costs and effectively manage our production assets by lowering capital investment and working capital requirements. Our strategy is to manufacture locally those products that would incur a relatively high freight and/or duty expense or have high service needs and source those products that have a high proportion of direct labor cost. We currently manufacture approximately half of our products locally where we operate, and source the remaining half. Low-cost sourcing primarily comes from China, but we also source from other Far Eastern countries and Eastern Europe.
Seasonality
Historically, our business has experienced higher sales and earnings in the third and fourth quarters of the calendar year. Two principal factors contribute to this seasonality: (1) we are a major supplier of products related to the "back-to-school" season, which occurs principally from June through September for our North American business and from November through February for our Australian and Brazilian businesses; and (2) several products we sell lend themselves to calendar year-end purchase timing, including AT-A-GLANCE
®
planners, paper organization and storage products (including bindery) and Kensington
®
computer accessories, which have higher sales in the fourth quarter driven by traditionally strong fourth-quarter sales of personal computers and tablets.
As a result, we have generated, and expect to continue to generate, most of our earnings in the second half of the year and much of our cash flow in the first, third and fourth quarters as receivables are collected.
|
Sales Percentages by Fiscal Quarter
|
2016
|
2015
|
2014
|
||||||
|
1st Quarter
|
18
|
%
|
19
|
%
|
20
|
%
|
|||
|
2nd Quarter
|
26
|
%
|
26
|
%
|
25
|
%
|
|||
|
3rd Quarter
|
28
|
%
|
28
|
%
|
28
|
%
|
|||
|
4th Quarter
|
28
|
%
|
27
|
%
|
27
|
%
|
|||
|
100
|
%
|
100
|
%
|
100
|
%
|
||||
See also "Item 1A.
Risk Factors -
Our business is subject to risks associated with seasonality, which could adversely affect our cash flow, results of operations and financial condition
.
"
Intellectual Property
We have many patents, trademarks, brand names and trade names that are, in the aggregate, important to our business. The loss of any individual patent or license, however, would not be material to any business segment or to the Company as a whole. Many of ACCO Brands' trademarks are only important in particular geographic markets or regions. Our principal registered trademarks are: ACCO
®
,
Artline
®
, AT-A-GLANCE
®
, ClickSafe
®
, Derwent
®
, Esselte
®
, Five Star
®
, GBC
®
, Hilroy
®
, Kensington
®
, Leitz
®
, Marbig
®
, Mead
®
, MicroSaver
®
NOBO
®
, Quartet
®
, Rapid
®
, Rexel
®
, Swingline
®
, Tilibra
®
, and Wilson Jones
®
. See also "Item 1A.
Risk Factors -
Our inability to secure, protect and maintain rights to intellectual property could have an adverse impact on our business
.
"
Environmental Matters
We are subject to national, state, provincial and/or local environmental laws and regulations concerning the discharge of materials into the environment and the handling, disposal and clean-up of waste materials and otherwise relating to the protection of the environment. It is not possible to quantify with certainty the potential impact of actions regarding environmental matters, particularly remediation and other compliance efforts that we may undertake in the future. In the opinion of our management, compliance with the present environmental protection laws, before taking into account estimated recoveries from third parties, will not have a material adverse effect upon our capital expenditures, financial condition and results of operations or competitive position.
See also "Item 1A.
Risk Factors -
We are subject to global environmental regulation and environmental risks, product content and product safety laws and regulations, international trade laws and regulations as well as laws, regulations and self-regulatory requirements relating to privacy and data security
."
Employees
As of
December 31, 2016
, we had approximately
5,040
full-time and part-time employees. There have been no strikes or material labor disputes at any of our facilities during the past five years. We consider our employee relations to be good.
4
For a description of certain factors that may have had, or may in the future have, a significant impact on our business, financial condition or results of operations, see "Item 1A.
Risk Factors
."
5
Executive Officers of the Company
The following sets forth certain information with regard to our executive officers as of February 22, 2017 (ages are as of December 31, 2016).
Mark C. Anderson
, age 54
|
•
|
2007 - present, Senior Vice President, Corporate Development
|
|
•
|
Joined the Company in 2007
|
Boris Elisman
, age 54
|
•
|
2016 - present, Chairman, President and Chief Executive Officer
|
|
•
|
2013 - 2016, President and Chief Executive Officer
|
|
•
|
2010 - 2013, President and Chief Operating Officer
|
|
•
|
2008 - 2010, President, ACCO Brands Americas
|
|
•
|
2008, President, Global Office Products Group
|
|
•
|
2004 - 2008, President, Computer Products Group
|
|
•
|
Joined the Company in 2004
|
Neal V. Fenwick
, age 55
|
•
|
2005 - present, Executive Vice President and Chief Financial Officer
|
|
•
|
1999 - 2005, Vice President Finance and Administration, ACCO World
|
|
•
|
1994 - 1999 Vice President Finance, ACCO Europe
|
|
•
|
Joined the Company in 1984
|
Christopher M. Franey
, age 60
|
•
|
2010 - present, Executive Vice President and President, Computer Products Group
|
|
•
|
2010 - 2013, Executive Vice President; President, ACCO Brands International and President, Computer Products Group
|
|
•
|
2008 - 2010, President, Computer Products Group
|
|
•
|
Joined the Company in 2008
|
|
•
|
Mr. Franey is expected to retire effective March 31, 2017
|
Ralph P. Hargrow
, age 64
|
•
|
2013 - present, Senior Vice President, Global Chief People Officer
|
|
•
|
2005 - 2013, Global Chief People Officer, Molson Coors Brewing Company
|
|
•
|
Joined the Company in 2013
|
Gregory J. McCormack
, age 53
|
•
|
2013 - present, Senior Vice President, Global Products
|
|
•
|
2012 - 2013, Senior Vice President, Operations, ACCO Brands Emerging Markets
|
|
•
|
2010 - 2012, Senior Vice President, Operations - ACCO Brands International
|
|
•
|
2008 - 2010, Senior Vice President, Operations, Americas
|
|
•
|
Joined the Company in 1996
|
Kathleen D. Schnaedter
, age 47
|
•
|
2015 - present, Senior Vice President, Corporate Controller and Chief Accounting Officer
|
|
•
|
2008 - 2015, Vice President and Corporate Controller
|
|
•
|
Joined the Company in 1994
|
Pamela R. Schneider
, age 57
|
•
|
2012 - present, Senior Vice President, General Counsel and Secretary
|
|
•
|
2010 - 2012, General Counsel, Accertify, Inc.
|
|
•
|
2008 - 2010, Executive Vice President, General Counsel and Secretary, Movie Gallery, Inc. (filed for Chapter 11 in February 2010)
|
|
•
|
2005 - 2008, Senior Vice President, General Counsel and Secretary, APAC Customer Services, Inc.
|
|
•
|
Joined the Company in 2012
|
Thomas W. Tedford
, age 46
|
•
|
2015 - present, Executive Vice President and President, ACCO Brands North America Office and Consumer Products
|
|
•
|
2010 - 2015, Executive Vice President; President, ACCO Brands U.S. Office and Consumer Products
|
|
•
|
2010, Chief Marketing and Product Development Officer
|
|
•
|
2007 - 2010, Group Vice President, APAC Customer Services, Inc.
|
|
•
|
Joined the Company in 2010
|
6
ITEM 1A.
RISK FACTORS
The factors that are discussed below, as well as the matters that are generally set forth in this Annual Report on Form 10-K and the documents incorporated by reference herein, could materially and adversely affect the Company’s business, results of operations and financial condition.
Our business serves a limited number of large and sophisticated customers, and a substantial reduction in sales to one or more of these customers could adversely impact our operating results
.
A relatively limited number of customers account for a large percentage of our total net sales. Our top ten customers accounted for
56%
of our net sales for the year ended December 31,
2016
. Sales to Staples, our largest customer, amounted to approximately
14%
of our
2016
net sales. Sales to Wal-Mart amounted to approximately
10%
of our
2016
net sales.
Our large customers may seek to leverage their size to obtain favorable pricing and other terms. In addition, they have the ability to directly source their own private label products and to create and support new and competing suppliers. The loss of, or a significant reduction in sales to, one or more of our top customers, or significant changes to the terms on which we sell our products to our top customers, could have a material adverse effect on our business, results of operations and financial condition.
Our historical office superstore and wholesale customers may further transform their business models, which could adversely impact our sales and margins
.
Our historical customers, especially our large office superstore and wholesale customers, have steadily consolidated over the last two decades. Following a customer consolidation, the combined company typically takes actions to harmonize pricing from its suppliers, close retail outlets, reduce inventories and rationalize its supply chain, which negatively impacts our sales and margins. Customers who have consolidated or may consolidate in the future may not continue to buy from us across our different product segments or geographic regions or at the same levels as prior to consolidation, which could adversely impact our financial results.
Historically, consolidation of our customers has had a material impact on our sales and margins and continues to impact our business performance.
Recently, these same customers have sought other means to address the challenges of increased competition, seeking to transform their businesses in a variety of ways. Such actions may result in our customers changing their historical buying patterns, which may result in further reductions in our sales and margins and have an adverse effect on our business, results of operations and financial condition.
See also "-
Shifts in the channels of distribution for our products could adversely impact our business
" and "-
Challenges related to the highly competitive business environments in which we operate could have an adverse effect on our ongoing business, results of operations and financial condition
" and
"Part II. Item 7.
Management's Discussion and Analysis of Financial Condition and Results of Operations.
"
Risks associated with currency volatility could adversely affect our sales, profitability, cash flow and results of operations
.
With approximately
43%
of our sales for the fiscal year ended
December 31, 2016
arising from international operations, fluctuations in currency exchange rates against the U.S. dollar can have a material impact on our results of operations. Our current risk exposure is primarily related to the Brazilian real, the Canadian dollar, the Euro, the Australian dollar, the British pound, the Mexican peso and the Japanese yen. Currency fluctuations impact the financial results of our non-U.S. operations, which are reported in U.S. dollars. As a result, a strong U.S. dollar reduces the dollar-denominated financial contributions from foreign operations and a weak U.S. dollar benefits us in the form of higher reported financial results.
Additionally,
approximately half of the products we sell are sourced from China and other Far Eastern countries. The prices for these sourced products are denominated in U.S. dollars. Accordingly, movements in the value of local currencies relative to the U.S. dollar affect the cost of goods sold by our non-U.S. businesses when they source products from Asia. A weaker dollar decreases costs of goods sold and a stronger dollar increases costs of goods sold relative to the local selling price. In response to the strengthening of the U.S. dollar, we typically seek to raise prices in our international markets in an effort to recover lost gross margin. Due to competitive pressures and the timing of these price increases relative to the changes in currency exchange rates, it is often difficult to increase prices fast enough to fully offset the cumulative impact of the foreign-exchange-related inflation on our cost of goods sold in these markets. Additionally, where possible, we seek to hedge our exposure to provide more time to raise prices, but this is not always possible where our competitors are not similarly affected.
7
We cannot predict the rate at which the U.S. dollar will trade against other currencies in the future. When the U.S. dollar strengthens, it makes the dollar more valuable relative to other currencies in the global market, and negatively impacts the U.S. dollar value of our international sales, profits and cash flow and adversely impacts our ability to compete or competitively price our products in those markets. Conversely, if the U.S. dollar weakens, it has the opposite effect.
Additionally, as we increase the size of our business in international markets, through acquisitions (including the PA and Esselte Acquisitions) or otherwise, or if we increase the amount of products we source from China and other Far Eastern countries, our exposure to the risks associated with currency volatility increases. See also "
-
Growth in emerging geographies may be difficult to achieve and exposes us to risks not present or not as prevalent in more established markets, such as greater economic volatility, unstable political conditions and civil unrest
."
Shifts in the channels of distribution for our products could adversely impact our business
.
Our customers operate in a very competitive environment. Historically, large office superstores and wholesalers have maintained a significant market share in business, academic and dated goods, but these customers are experiencing increasing competition from mass merchandisers and on-line retailers. This shift in channels may impact our sales and margins due to the more limited range of products carried in these alternate channels and their overall inventory efficiencies. Additionally, if we are unable to grow sales and gain market share with customers operating in these alternate channels of distribution or if the margins we realize in these channels are lower, our business, results of operations and financial condition could be adversely affected.
Challenges related to the highly competitive business environments in which we operate could have an adverse effect on our ongoing business, results of operations and financial condition
.
We operate in highly competitive business environment, which presents a number of challenges, including:
|
•
|
low barriers to entry;
|
|
•
|
sophisticated and large customers who have the ability to source their own private label products;
|
|
•
|
limited retail space which constrains our ability to offer certain products;
|
|
•
|
competitors with strong brands;
|
|
•
|
imports from a range of countries, including countries with lower production costs;
|
|
•
|
competitors' ability to source lower cost products in local currencies; and
|
|
•
|
competition from a range of products and services, including electronic, digital or web-based products that can replace or render obsolete or less desirable some of the products we sell.
|
As a result, our business is likely to be affected by: (1) decisions and actions of our customers to increase their purchases of private label products or otherwise change product assortments; (2) decisions of current and potential suppliers of competing products to take advantage of low entry barriers to expand their production or lower prices; and (3) decisions of end-users of our products to expand their use of lower priced, substitute or alternative products. Any such decisions could result in lower sales and margins and adversely affect our business, results of operations and financial condition.
Historically, during periods of economic weakness and uncertainty, we have seen the above trends accelerate resulting in increased competition from private label and other branded and/or generic products that compete on price and quality and changes in end-user spending. Similarly, when the U.S. dollar is strong, we face more competition from locally produced products, which are paid for in local currency. We have recently experienced these competitive pressures due to economic weakness in certain international markets in which we operate, especially Brazil. See also "-
Sales of our products may be adversely affected by issues that affect business, commercial and consumer spending decisions during periods of economic uncertainty or weakness
," "-
Risks associated with currency volatility could adversely affect our sales, profitability, cash flow and results of operations
" and "-
Changes to current policies by the U.S. government could adversely affect our business
."
Our success partially depends on our ability to continue to develop and market innovative products that meet end-user demands, including price expectations
.
Our competitive position depends on continued investment in innovation and product development, manufacturing and sourcing, quality standards, marketing and customer service and support. Our success will depend, in part, on our ability to anticipate and offer products that appeal to the changing needs and preferences of our customers and end-users in a market where many of our product categories are affected by continuing improvements in technology and shortened product lifecycles and others are experiencing secular declines. We may not have sufficient resources to make the investments that may be necessary to anticipate
8
or react to the changing needs, and we may not identify, develop and market products successfully or otherwise be able to maintain our competitive position.
Sales of our products may be adversely affected by issues that affect business, commercial and consumer spending decisions during periods of economic uncertainty or weakness
.
Demand for our products, especially business machines and other durable goods, can be very sensitive to uncertain or weak economic conditions. In addition, during periods of economic uncertainty or weakness, we tend to see the demand for our products decrease, increased competition from private label and other branded and/or generic products that compete on price and quality, and our reseller customers reduce inventories. In addition, end-users tend to purchase more lower-cost, private label or other economy brands, more readily switch to electronic, digital or web-based products serving similar functions, or forgo certain purchases altogether. As a result, adverse changes in economic conditions or sustained periods of economic uncertainty or weakness could negatively affect our earnings and have an adverse effect on our business, results of operations, cash flow and financial condition.
The economic climate in some of countries in which we operate is unstable, negatively impacting our sales, profitability and cash flow in these countries, and we expect that this situation may continue. Any economic recovery in these countries may be weak and slow to materialize.
We rely extensively on information technology systems to operate, transact and otherwise manage our business. Any material failure, inadequacy, interruption or security breach of that technology or its supporting infrastructure could adversely affect our business, results of operations or financial condition
.
We rely extensively on our information technology systems, many of which are outsourced to third-party service providers. We depend on these systems and our third-party service providers to effectively manage our business and execute the production, distribution and sale of our products as well as to manage and report our financial results and run other support functions. Although we have implemented service level agreements and have established monitoring controls, if our outsourcing vendors fail to perform their obligations in a timely manner or at satisfactory levels, our business could suffer. The failure of these systems to operate effectively, problems with transitioning to upgraded or replacement systems, or a breach in the security of these systems could disrupt service to our customers, negatively impact our ability to report our financial results in a timely and accurate manner, damage our reputation and adversely affect our business, results of operations and financial condition.
Our information technology general controls are an important element of our internal control over financial reporting and our disclosure controls and procedures. Failure to successfully execute our information technology general controls could adversely impact the effectiveness of our internal control over financial reporting and our disclosure controls and procedures and impair our ability to accurately report our financial results in a timely manner.
If services to our customers are negatively impacted by the failure or breach of our information systems, or if we are unable to accurately report our financial results in a timely manner or to conclude that our internal control over financial reporting and disclosure controls and procedures are effective, investor, supplier and customer confidence in our reported financial information as well as market perception of our Company and/or the trading price of our common stock could be adversely affected. The occurrence of any of these events could have an adverse impact on our business, results of operations and financial condition.
Our information technology and other systems are subject to cyber security risk, including misappropriation of customer information or other breaches of information security
.
We rely upon sophisticated information technology networks, systems and infrastructure, some of which are managed by third-parties, to process, transmit and store electronic information, and to manage or support a variety of business processes and activities. Additionally, we collect and store sensitive data, including proprietary business and personal information. Despite security measures, our information technology networks and infrastructure may be vulnerable to damage, disruptions or shutdowns due to attack by hackers or breaches, employee error or malfeasance, power outages, computer viruses, telecommunication or utility failures, systems failures, natural disasters or other catastrophic events. Likewise, data privacy or security breaches by employees and others with permitted access to our systems, including in some cases third-party service providers to which we may outsource certain business functions, may pose a risk that sensitive data, including proprietary business information, intellectual property or personal information, may be exposed to unauthorized persons or to the public. Security breaches and other disruptions to our information technology infrastructure could interfere with our operations, compromise information belonging to us and our customers and suppliers, and expose us to liability, which could adversely impact our business and/or result in the loss of critical or sensitive information, which could result in financial, legal, business or reputational harm.
9
Changes to current policies by the U.S. government could adversely affect our business
.
We anticipate possible changes to current policies by the U.S. government that could affect our business, including potentially through increased import tariffs and other changes in U.S. trade relations with other countries (e.g., Mexico and China) and/or changes to U.S. tax laws. The imposition of tariffs or other trade barriers could increase our costs in certain markets, and may cause our customers to find alternative sourcing. In addition, other countries may change their own policies on business and foreign investment in companies in their respective countries. Additionally, it is possible that U.S. policy changes and uncertainty about policy could increase the volatility of currency exchange rates, which could impact our results of operations and financial condition. Tax changes could have different impacts depending on the specific policies enacted. See also "-
Risks associated with currency volatility could adversely affect our sales, profitability, cash flow and results of operations
," "-
Sales of our products may be adversely affected by issues that affect business, commercial and consumer spending decisions during periods of economic uncertainty or weakness
," and "-
Growth in emerging geographies may be difficult to achieve and exposes us to risks not present or not as prevalent in more established markets, such as greater economic volatility, unstable political conditions and civil unrest
."
Growth in emerging geographies may be difficult to achieve and exposes us to risks not present or not as prevalent in more established markets, such as greater economic volatility, unstable political conditions and civil unrest
.
A portion of our sales are derived from emerging markets such as Latin America and parts of Asia, the Middle East and Eastern Europe. Moreover, the profitable growth of our business in emerging markets, through both organic investments and through acquisitions, is a key element to our long-term growth strategy.
Emerging markets generally involve more financial and operational risks than more mature markets. In some cases, emerging markets have greater political and economic volatility, greater vulnerability to infrastructure and labor disruptions, are more susceptible to corruption, and are in locations where it may be more difficult to impose corporate standards and procedures and the extraterritorial laws of the United States. Negative or uncertain political climates and military disruptions in developing and emerging markets could also adversely affect us. Further, weak legal systems may affect our ability to protect our intellectual property, contractual and other rights.
As we seek to grow our business in these emerging markets, we increase our exposure to these financial and operational risks as well as legal and other risks, including currency transfer restrictions, the impact of currency fluctuations, hyperinflation or devaluation, changes in international trade policies and regulations (including import and export restrictions), the lack of well-established or reliable legal systems, corruption, adverse economic conditions, political actions or instability, terrorism and civil unrest. Likewise, our cost of doing business increases due to costs of compliance with complex and numerous foreign and U.S. laws and regulations, including the U.S. Foreign Corrupt Practices Act and the UK Bribery Act, and regulations on the transfer of funds to and from foreign countries, which, from time to time, result in significant cash balances in foreign countries due to limitations on the repatriation of funds. See also "
-
Sales of our products may be adversely affected by issues that affect business, commercial and consumer spending decisions during periods of economic uncertainty or weakness
," "-
Risks associated with currency volatility could adversely affect our sales, profitability, cash flow and results of operations
," "-
Changes to current policies by the U.S. government could adversely affect our business
," and "-
Material disruptions resulting from telecommunication failures, labor strikes, power and/or water shortages, acts of God, war, terrorism, other geopolitical incidents or other circumstances outside our control could adversely impact our business, results of operations and financial condition
."
If we are unable to successfully expand our businesses in emerging markets, achieve the return on capital we expect as a result of our investments, or effectively manage the risks inherent in our growth strategy in these markets, our business, results of operations and financial condition could be adversely affected.
Our strategy is partially based on growth through acquisitions either to expand our business into adjacent product categories that are experiencing higher growth rates or into existing categories to enhance our ability to compete effectively and realize cost synergies. Failure to properly identify, value, manage and integrate any of the acquisitions or to expand into adjacent categories may impact our business, results of operations and financial condition
.
One key element of our growth strategy involves acquisitions. We are focused on acquiring companies that are either in our existing categories or geographic markets to enhance our ability to compete effectively and realize cost synergies, or that have the potential to accelerate our growth or our entry into adjacent product categories.
We may not be successful in identifying suitable acquisition opportunities, prevailing against competing potential acquirers, negotiating appropriate acquisition terms, obtaining financing, completing proposed acquisitions, integrating acquired businesses or expanding in new markets or product categories. In addition, an acquisition may not perform as anticipated, be accretive to earnings or prove to be beneficial to our operations and cash flow. If we fail to effectively identify, value, consummate, manage
10
and integrate any acquired company we may not realize the potential growth opportunities or achieve the synergies or financial results anticipated at the time of its acquisition.
An acquisition could also adversely impact our operating performance as a result of the issuance of acquisition-related debt, pre-acquisition assumed liabilities, acquisition expense and the amortization of acquisition assets or possible future impairments of goodwill or intangible assets associated with the acquisition.
To the extent acquisitions increase our exposure to emerging markets, the risks associated with doing business in these markets will increase. See also "
-
Growth in emerging geographies may be difficult to achieve and exposes us to risks not present or not as prevalent in more established markets, such as greater economic volatility, unstable political conditions and civil unrest
."
Additionally, part of our strategy is to expand our product assortment into new and adjacent product categories with a higher growth profile. There can be no assurance that we will successfully execute these strategies. If we are unable to successfully increase sales by expanding our product assortment, our business, results of operations and financial condition could be adversely affected.
We may face challenges in integrating Pelikan Artline and Esselte with our operations following the PA and Esselte Acquisitions
.
In May 2016, we completed the PA Acquisition, and the Esselte Acquisition (“Esselte”) was completed in January 2017.
We may face challenges in integrating Pelikan Artline and Esselte with our existing operations. These challenges may include, among other things, integrating Pelikan Artline and Esselte while carrying on the ongoing operations of each business; integrating the business cultures of Pelikan Artline and Esselte and ACCO; possible difficulties in retaining key employees and key customers of ACCO, Pelikan Artline and Esselte; and the difficulty of integrating the acquired business's finance, accounting and other business systems without negatively impacting our internal control over financial reporting, our disclosure controls and procedures and compliance with the regulatory requirements under the Sarbanes-Oxley Act of 2002.
The process of integrating operations also could cause an interruption of, or loss of momentum in, the activities of one or more of our businesses, including the Pelikan Artline and Esselte businesses. Members of our senior management may need to devote considerable amounts of time to the integration process, which will decrease the time they will have to manage the businesses. If our senior management is not able to effectively manage the integration processes, or if any significant business activities are interrupted as a result of the integration process, our business and financial results could suffer.
Additionally, we expect that we will realize synergy savings and other financial and operating benefits from our acquisition of Pelikan Artline and Esselte. Our success in realizing these synergy savings and other financial and operating benefits, and the timing of this realization depends on the successful integration of the business operations of Pelikan Artline and Esselte with ACCO. We cannot predict with certainty if or when these synergy savings and other benefits will occur, or the extent to which they actually will be achieved.
Finally, the integration of Pelikan Artline and Esselte will involve changes to, or implementation of critical information technology systems, modifications to our internal controls systems, processes and information technology systems, and the establishment of disclosure controls and procedures and internal control over financial reporting necessary to meet our obligations as a publicly traded company in the U.S. Failure to successfully complete any of these tasks could adversely affect our internal control over financial reporting, our disclosure controls and procedures and our ability to effectively and timely report our financial results. If we are unable to accurately report our financial results in a timely manner and establish internal control over financial reporting and disclosure controls and procedures that are effective, our business, results of operation and financial condition, investor, supplier and customer confidence in our reported financial information, the market perception of our Company and/or the trading price of our common stock could be materially and adversely affected.
The market for computer products is rapidly changing and highly competitive
.
We sell computer products in a market that is characterized by rapid technological changes, short product life cycles and a dependency on the introduction by third party manufacturers of new products and devices, which drives demand for accessories sold by the Company. To compete successfully, we need to anticipate and bring to market innovative new accessories in a timely and effective way, which requires significant skills and investment. We may not have sufficient market intelligence, talent or resources to successfully meet these challenges. Additionally, the short product life cycles increase the risk that our products will become commoditized or obsolete and that we could be left with an excess of old and slow-moving inventory. Rapid changes in technology, shifting demand for personal computers, laptops, tablets and mobile devices, as well as delays in the introduction of
11
new technology and our ability to anticipate and respond to these changes and delays, could adversely affect the demand for our products and have an adverse effect on the business, results of operations and financial condition. Recently, rapid changes in technology led to the commoditization of many of our tablet accessories resulting in increased competition and a degradation in sales and margins. Ultimately, we elected to exit the commodity tablet and smartphone accessories business. See also "Part II, Item 7.
Management's Discussion and Analysis of Financial Condition and Results of Operations
."
Litigation or legal proceedings could expose us to significant liabilities and damage our reputation
.
In connection with our May 1, 2012 acquisition of Mead Consumer and Office Products business, we assumed all of the tax liabilities for the acquired foreign operations including Tilibra Produtos de Papelaria Ltda. ("Tilibra"). In December of 2012, the Federal Revenue Department of the Ministry of Finance of Brazil ("FRD") issued a tax assessment (the "Brazilian Tax Assessment") against Tilibra, which challenged the tax deduction of goodwill from Tilibra's taxable income for the year 2007. A second assessment challenging the deduction of goodwill from Tilibra's taxable income for the years 2008, 2009 and 2010 was issued by FRD in October 2013.
Tilibra is disputing both of the tax assessments through established administrative procedures. We believe we have meritorious defenses and intend to vigorously contest these matters; however, there can be no assurances that we will ultimately prevail. We are still in the administrative stages of the process to challenge the FRD's tax assessments, and the ultimate outcome will not be determined until the Brazilian tax appeal process is complete, which is expected to take a number of years. In addition, Tilibra's 2011-2012 tax years remain open and subject to audit, and there can be no assurances that we will not receive additional tax assessments regarding the goodwill for one or both of those years. The time limit for issuing an assessment for 2011 expires in January 2018.
If the FRD's initial position is ultimately sustained, the amount assessed would materially and adversely affect our cash flow in the year of settlement.
Because there is no settled legal precedent on which to base a definitive opinion as to whether we will ultimately prevail, we consider the outcome of this dispute to be uncertain. Since it is not more likely than not that we will prevail, in 2012, we recorded a reserve in the amount of
$44.5 million
(at December 31, 2012
exchange rates) in consideration of this contingency, of which
$43.3 million
was recorded as an adjustment to the purchase price and which included the 2007-2012 tax years plus penalties and interest through December 2012. Included in this reserve is an assumption of penalties at
75%, which is the standard penalty. While there is a possibility that a penalty of 150% could be imposed, based on the facts in our case and existing precedent, we believe the likelihood of a 150%
penalty being imposed is not more likely than not at December 31, 2016. In the meantime, we continue to actively monitor administrative and judicial court decisions and evaluate their impact, if any, on our legal assessment of the ultimate outcome of our case. In addition, we will continue to accrue interest related to this contingency until such time as the outcome is known or until evidence is presented that we are more likely than not to prevail. During
2016
,
2015
and
2014
,
we accrued additional interest as a charge to current tax expense of
$2.8 million
,
$2.7 million
and
$3.2 million
, respectively. At current exchange rates, our accrual through
December 31, 2016
, including tax, penalties and interest is
$37.3 million
.
There are various other claims, lawsuits and pending actions against us incidental to our operations. It is the opinion of management that (other than the Brazilian Tax Assessment) the ultimate resolution of these matters will not have a material adverse effect on our financial condition, results of operations or cash flow. However, there is no assurance that we will ultimately be successful in our defense of any of these matters or that an adverse outcome in any matter will not affect our results of operations, financial condition or cash flow.
Outsourcing the production of certain of our products, our information technology systems and other administrative functions could adversely affect our business, results of operations and financial condition
.
We outsource certain manufacturing functions to suppliers in China, other Far Eastern countries and Eastern Europe. Outsourcing of product design and production creates a number of risks, including decreased control over the engineering and manufacturing processes resulting in unforeseen production delays or interruptions, inferior product quality, loss or misappropriation of trade secrets and other performance issues, which could result in cost overruns, delayed deliveries or shortages. Additionally, our suppliers must comply with our design and product content specifications, and all applicable laws, including product safety, security, labor and environmental laws. We also expect our suppliers to conform to our and our customers’ expectations with respect to product safety, product quality and social responsibility, be responsive to our audits and otherwise be certified as meeting our and our customers’ supplier codes of conduct. Failure to meet any of these requirements may result in our having to cease doing business with a supplier or cease production at a particular facility. Substitute suppliers might not be available or, if available, might be unwilling or unable to offer products on acceptable terms or in a timely manner. Any of these circumstances could result in unforeseen production delays and increased costs and negatively affect our ability to deliver products and services to our customers, all of which could adversely affect our business, results of operations and financial condition.
12
Moreover, if one or more of our suppliers is unable or unwilling to continue to provide products of acceptable quality, at acceptable cost or in a timely manner due to financial difficulties, insolvency or otherwise, or if customer demand for our products increases, we may be unable to secure sufficient additional capacity from our current suppliers, or others, in a timely manner or on acceptable terms. Any of these events could result in unforeseen production delays and increased costs and negatively affect our ability to deliver our products and services to our customers, all of which could adversely affect our business, results of operations and financial condition.
We also outsource important portions of our information technology infrastructure and systems support to third party service providers. Outsourcing of information technology services creates risks to our business, which are similar to those created by our product production outsourcing. If one or more of our information technology suppliers is unable or unwilling to continue to provide services at acceptable cost due to financial difficulties, insolvency or otherwise, or if our third party service providers experience a security breach or disruptions in service, our business could be adversely affected.
In addition, we outsource certain administrative functions, such as payroll processing, benefit plan administration and accounts payable to third party service providers and may outsource other functions in the future to achieve cost savings and efficiencies. If the service providers to which we outsource these functions do not perform effectively, we may not be able to achieve the expected cost savings and may have to incur additional costs to correct errors they make. Depending on the function involved, such errors may lead to business disruption, processing inefficiencies or loss of, or damage to intellectual property, or harm to employee morale. See also "
-
We rely extensively on information technology systems to operate, transact and otherwise manage our business. Any material failure, inadequacy, interruption or security breach of that technology or its supporting infrastructure could adversely affect our business, results of operations or financial condition
," and "-
Our information technology and other systems are subject to cyber security risk, including misappropriation of customer information or other breaches of information security
.
"
Continued declines in the use of certain of our products, especially paper-based dated, time management and productivity tools, could adversely affect our business
.
A number of our products and brands consist of paper-based dated, time management and productivity tools that historically have tended to be higher-margin products. However, consumer preference for technology-based solutions for time management and planning continues to grow worldwide. Many consumers use or have access to electronic tools that may serve as substitutes for traditional paper-based time management and productivity tools. Accordingly, the continued introduction of new digital software applications and web-based services by companies offering time management and productivity solutions could continue to adversely impact the revenue and profitability of our largely paper-based portfolio of dated, time management and productivity products.
Additionally, the demand for other product categories, such as decorative calendars, ring binders and mechanical binding equipment, are also declining. A continued decline in the overall demand for any of the products we sell could adversely impact our business, results of operations and financial condition.
Our business is subject to risks associated with seasonality, which could adversely affect our cash flow, results of operations and financial condition
.
Historically, our business has experienced higher sales and earnings in the third and fourth quarters of the calendar year. Two principal factors contribute to this seasonality: (1) we are a major supplier of products related to the "back-to-school" season, which occurs principally from June through September for our North American business and from November through February for our Australian and Brazilian businesses; and (2) several products we sell lend themselves to calendar year-end purchase timing, including AT-A-GLANCE
®
planners, paper organization and storage products (including bindery) and Kensington
®
computer accessories, which have higher sales in the fourth quarter driven by traditionally strong fourth-quarter sales of personal computers and tablets.
As a result, we have generated, and expect to continue to generate, most of our earnings in the second half of the year and much of our cash flow in the first, third and fourth quarters as receivables are collected.
If these typical seasonal increases in sales of certain products do not materialize or if sales of these product lines were to represent a larger overall percentage of our sales or profitability it may have an outsized impact on our business, which could adversely affect our cash flow, results of operations and financial condition.
13
Fluctuation in the costs of raw materials, labor and transportation and changes in international shipping capacity as well as issues affecting port availability and efficiency, such as labor strikes, could adversely affect our business, results of operations and financial condition
.
The primary materials used in the manufacturing of many of our products are paper, plastics, resin, polyester and polypropylene substrates, steel, wood, aluminum, melamine, zinc and cork. In general, our gross profit may be affected from time to time by fluctuations in the prices of these materials. We attempt to reduce our exposure to increases in these costs through a variety of measures, including obtaining price increases from our customers when appropriate as well as executing periodic purchases, future delivery contracts, longer-term price contracts and holding our own inventory. Likewise, we attempt to take advantage of price decreases by negotiating cost reductions with our suppliers to ensure that our customer pricing remains competitive. There can be no assurances that we will successfully negotiate price increases or decreases or that the other measures we take to manage the risk of fluctuation in raw material costs will be effective in avoiding a negative impact in our sales and profitability. See also "
Note 13. Derivative Financial Instruments
" to the consolidated financial statements contained in Part II, Item 8. of this report.
Inflationary and other substantial increases and decreases in costs of materials, labor and transportation have occurred in the past and may recur, and raw materials may not continue to be available in adequate supply in the future. Shortages in the supply of any of the raw materials we use in our products and services, the availability of international shipping capacity or labor strife at ports we use, could result in price increases or decreases or negatively impact our ability to deliver our products to our customers, which could have an adverse effect on our business, results of operations and financial condition.
Some of our suppliers are dependent upon other industries for raw materials as well as the other products and services necessary to produce the products they supply to us. Any adverse impacts to those industries could have a ripple effect on our suppliers, which could adversely impact their ability to supply us at levels or costs we consider necessary or appropriate for our business, or at all. Any such disruptions could negatively impact our ability to deliver products and services to our customers, which in turn could have an adverse impact on our business, results of operations and financial condition.
We are subject to global environmental regulation and environmental risks, product content and product safety laws and regulations, international trade laws and regulations as well as laws, regulations and self-regulatory requirements relating to privacy and data security
.
Our business is subject to national, state, provincial and/or local environmental laws and regulations in both the United States and abroad, which govern the discharge and emission of certain materials and waste, and establish standards for their use, disposal and management. We are also subject to laws regulating the content of toxic chemicals and materials in the products we sell as well as laws, directives and self-regulatory requirements related to the safety of our products, law and regulations governing international trade as well as privacy and data security. There has also been a sharp increase in laws and regulations in Europe, the United States and elsewhere, imposing requirements on our handling of personal data, including data of employees, consumers and business contacts.
All of these laws, regulations and self-regulatory frameworks are complex and may change frequently. Capital and operating expenses required to comply with environmental, product content and product safety laws and regulations and information security and privacy obligations can be significant, and violations may result in substantial fines, penalties and civil damages as well as damage to our reputation. Any significant increase in our costs to comply with applicable environmental and product content and safety laws and obligations relating to privacy and data security as well as claims or liability arising from noncompliance with such laws, regulations and self-regulatory frameworks, and changes in tariffs or duties associated with the international transfer of goods could have an adverse effect on our business, results of operations and financial condition as well as damage to our reputation. See also, "-
Changes to current policies by the U.S. government could adversely affect our business
."
In addition, as we expand our business into emerging and new markets, we increase the number of laws and regulations with which we are required to comply, which increases the complexity and costs of compliance as well as the risks of noncompliance. See also "
-
Growth in emerging geographies may be difficult to achieve and exposes us to risks not present or not as prevalent in more established markets, such as greater economic volatility, unstable political conditions and civil unrest
."
Our pension costs and cash contributions could substantially increase as a result of volatility in the equity markets, changes in interest rates or other factors
.
Our defined benefit pension plans are not fully funded and the funding status of our plans is a significant factor in determining the net periodic benefit costs of our pension plans and the ongoing funding requirements of those plans. Changes in interest rates and the market value of plan assets impact the funded status of these plans and cause volatility in the net periodic benefit cost and future plan funding requirements. Our cash contributions to pension and defined benefit plans totaled
$6.2 million
in
2016
; however
14
the exact amount of cash contributions made to pension plans in any year is dependent upon a number of factors, including the investment returns on pension plan assets and laws relating to pension funding requirements. A significant increase in our pension funding requirements could have an adverse impact on our cash flow, results of operations and financial condition.
We also participate in a multi-employer pension plan for our union employees at our Ogdensburg, NY facility. The plan has reported significant underfunded liabilities and declared itself in critical and declining status. As a result, the trustees of the plan adopted a rehabilitation plan in an effort to forestall insolvency. Our required contributions to this plan could increase due to the shrinking contribution base resulting from the insolvency of, or withdrawal of other participating employers, from the inability or the failure of withdrawing participating employers to pay their withdrawal liability, from lower than expected returns on pension fund assets, and from other funding deficiencies. In the event that we withdraw from participation in the plan, we will be required to make withdrawal liability payments for a period of 20 years or longer in certain circumstances. The present value of our withdrawal liability payments would be recorded as an expense in our
Consolidated Statements of Income
and as a liability on our Consolidated Balance Sheets in the first year of our withdrawal.
In connection with the Esselte Acquisition we have acquired substantial pension liabilities.
See also "Part II, Item 7. Critical Accounting Policies -
Employee Benefit Plans
" and "
Note 5. Pension and Other Retiree Benefits
" to the consolidated financial statements contained in Part II, Item 8. of this report.
Impairment of intangible assets could have a material adverse effect on our financial results
.
We have recorded significant amounts of goodwill and other intangible assets, which increased substantially due to acquisitions. The fair values of certain indefinite-lived trade names are not significantly above their carrying values. Recent events have significantly reduced the fair value of certain indefinite-lived trade names and future events may occur that could further adversely affect the reported value of our assets and require impairment charges, which could negatively affect our financial results. Such events may include, but are not limited to, a sustained decline in our stock price or sales of one or more of our branded product lines, or strategic decisions we make regarding how we use our brands in various global markets. As of
December 31, 2016
the aggregate carrying value of indefinite-lived trade names not substantially above their fair values was
$188.1 million
, which relates to the following trade names, Mead
®
, Tilibra
®
and Hilroy
®
. See also "Part II, Item 7. Critical Accounting Policies -
Intangible Assets
", " -
Goodwill
" and "
Note 9. Goodwill and Identifiable Intangible Assets
" to the consolidated financial statements contained in Part II, Item 8, of this report.
Our existing borrowing arrangements require us to dedicate a substantial portion of our cash flow to debt payments and limits our ability to engage in certain activities. If we are unable to meet our obligations under these agreements or are contractually restricted from pursuing activities or transactions that we believe are in our long-term best interests, our business, results of operations and financial condition could be adversely affected.
As of
December 31, 2016
, we had $
703.5 million
of outstanding debt, which increased by approximately $326 million in early 2017 due to the borrowings to fund the Esselte Acquisition and related fees and expenses.
Our debt service obligations require us to dedicate a substantial portion of our cash flow from operating activities to payments on our indebtedness, which reduces the availability of our cash flow to fund working capital, capital expenditures, research and product development efforts, potential acquisitions and for other general corporate purposes. Our indebtedness also may increase our vulnerability to economic downturns and changing market conditions and place us at a competitive disadvantage relative to competitors that have less debt. In addition, as of December 31, 2016,
$302.9 million
of our outstanding debt is subject to floating interest rates, which increases our exposure to fluctuations in interest rates.
The terms of our debt agreements also limit our ability to engage in certain activities and transactions that may be in our and our shareholders' long-term interest. Among other things, the covenants and financial ratios and tests contained in our debt agreements restrict or limit our ability to incur additional indebtedness, incur certain liens on our assets, issue preferred stock or certain disqualified stock, make restricted payments, including investments, sell our assets or merge with other companies, and enter into certain transactions with affiliates. We are also required to maintain specified financial ratios under certain circumstances and satisfy financial condition tests. Our ability to comply with these covenants and financial ratios and tests may be affected by events beyond our control, and we may not be able to continue to meet those covenants, ratios and tests.
Our ability to meet our debt obligations, including our financial covenants, and to refinance our existing indebtedness upon maturity, will depend upon our future operating performance, which will be affected by general economic, financial, competitive, regulatory, business and other factors. Breach of any of the covenants, ratios and tests contained in the agreements governing our
15
indebtedness, or our inability to pay interest on, or principal of, our outstanding debt as it becomes due, could result in an event of default, in which case our lenders could declare all amounts outstanding to be immediately due and payable. If our lenders accelerate our indebtedness or we are not able to refinance our debts at maturity, our assets may not be sufficient to repay in full such indebtedness and any other indebtedness that would become due as a result of such acceleration. If we then are unable to obtain replacement financing or any such replacement financing is on terms that are less favorable than the indebtedness being replaced, our liquidity, results of operations and financial condition would be adversely affected.
Should any of the risks associated with our indebtedness be realized, our business, results of operations and financial condition could be adversely affected. See also "Part II, Item 7.
Management's Discussion and Analysis of Financial Condition and Results of Operations - Liquidity and Capital Resources
."
Our failure to comply with customer contracts may lead to fines or loss of business, which could adversely impact our revenue and results of operations
.
Our contracts with our customers include specific performance requirements. In addition, some of our contracts with governmental customers are subject to various procurement regulations, contract provisions and other requirements. If we fail to comply with the specific provisions of our customer contracts or violate government contracting regulations, we could be subject to fines, suffer a loss of business or incur other penalties, which in the case of government contracts, could include suspension from further government contract opportunities. If our customer contracts are terminated, if we fail to meet our contractual obligations, are suspended or disbarred from government work, or if our ability to compete for new contracts is adversely affected, we could suffer a reduction in expected revenue and margins.
Should one of our customers or suppliers experience financial difficulties or file for bankruptcy, our cash flow, results of operations and financial condition could be adversely affected
.
Our concentrated customer base increases our customer credit risk. Were any of our customers to face liquidity issues, become insolvent or file for bankruptcy, we could be adversely impacted due to not only a reduction in future sales but also delays in payment and/or losses associated with the inability to collect any outstanding accounts receivable from that customer. Such a result could adversely impact our cash flow, results of operations and financial condition.
In addition, should one of our suppliers or third party service providers experience financial difficulties our business, results of operations and financial condition could be adversely affected. See
also "
-
Outsourcing the production of certain of our products, our information technology systems and other administrative functions could adversely affect our business, results of operations and financial condition
."
Our inability to secure, protect and maintain rights to intellectual property could have an adverse impact on our business
.
We own and license many patents, trademarks, brand names, trade names, and proprietary content that are, in the aggregate, important to our business. If third parties challenge the validity or enforceability of our intellectual property rights and we cannot successfully defend these challenges, or our intellectual property is invalidated or our patents expire, or if our licenses are terminated due to breach by us, or if licenses expire or are not renewed, our business, results of operations and financial condition could be adversely impacted. The loss, expiration or non-renewal of any individual trademark, patent or license may not be material to us, but the loss of a number of patents or trademarks, or the expiration or non-renewal of a significant number of licenses that relate to principal portions of our business, could negatively impact our competitive position in the market and have an adverse effect on our business.
We could also incur substantial costs to pursue legal actions relating to the unauthorized use by third parties of our intellectual property. If our brands become diluted, if our patents are infringed, or if our competitors introduce brands and products that cause confusion with our brands in the marketplace, the value of our brands may be diminished, which could adversely impact our sales and profitability.
We may also become involved in defending intellectual property infringement claims being asserted against us that could cause us to incur substantial costs, divert the efforts of our management and require us to pay substantial damages or require us to obtain a license, which might not be available on reasonable terms, if at all.
Product liability claims or regulatory actions could adversely affect our financial results or harm our reputation or the value of our end-user brands
.
Claims for losses or injuries purportedly caused by some of our products arise in the ordinary course of our business. In
16
addition to the risk of substantial monetary judgments and penalties, which could have an adverse effect on our results of operations and financial condition, product liability claims or regulatory actions, could result in negative publicity that could harm our reputation in the marketplace or the value of our end-user brands. We also could be required to recall and possibly discontinue the sale of possible defective or unsafe products, which could result in adverse publicity, significant expenses and loss of revenue.
Our success depends on our ability to attract and retain qualified personnel
.
Our success depends on our ability to attract and retain qualified personnel, including executive officers and other key personnel. We rely to a significant degree on compensating our executive officers and key employees with performance-based incentive awards that pay out only if specified performance goals have been met. To the extent these performance goals are not met and our incentive awards do not pay out, or pay out less than the targeted amount, it may motivate certain executive officers and key employees to seek other opportunities and affect our ability to attract and retain qualified personnel. The loss of key management personnel or other key employees or our potential inability to attract such personnel may adversely affect our ability to manage our overall operations and successfully implement our business strategy.
Our stock price has been volatile historically and may continue to be volatile in the future
.
The market price for our common stock has been volatile historically. Our results may be significantly affected by factors including those described elsewhere in this "Part I, Item 1A.
Risk Factors
" as well as the following:
•
quarterly fluctuations in our operating results compared to market expectations;
•
fluctuations in the stock market prices and volumes;
•
changes in financial estimates by us or securities analysts and recommendations by securities analysts;
•
actual or anticipated negative earnings or other announcements by us or our top customers;
•
investors' perceptions of the office products industry; and
•
the composition of our shareholders, particularly the presence of "short sellers" trading in our stock.
Volatility in our stock price could adversely affect our business and financing opportunities and force us to increase our cash compensation to our employees or grant larger stock awards, which could hurt our operating results and reduce the percentage ownership of our existing stockholders.
Material disruptions resulting from telecommunication failures, labor strikes, power and/or water shortages, acts of God, war, terrorism, other geopolitical incidents or other circumstances outside our control could adversely impact our business, results of operations and financial condition
.
A disruption at one of our or at one of our suppliers' or third-party service providers' facilities (especially facilities in China and other Asia-Pacific countries as well as Latin America) or a disruption of international transportation or at ports could adversely impact production, and customer deliveries or otherwise negatively impact the operation of our business and result in increased costs. Such a disruption could occur as a result of any number of events including but not limited to a major equipment failure, labor stoppages, transportation failures affecting the supply and shipment of materials and finished goods, the unavailability of raw materials, severe weather conditions, natural disasters, civil unrest, war or terrorism and disruptions in utility and other services. Any such disruptions could adversely impact our business, results of operations and financial condition.
ITEM 1B.
UNRESOLVED STAFF COMMENTS
None.
17
ITEM 2.
PROPERTIES
We have manufacturing facilities in North America, Europe, Brazil, Mexico and Australia, and maintain distribution centers in the regional markets we service. We lease our corporate and U.S. headquarters in Lake Zurich, Illinois. The following table lists our principal facilities by segment as of
December 31, 2016
:
|
Location
|
Functional Use
|
Owned/Leased
|
|
|
North America:
|
|||
|
Ontario, California
|
Distribution/Manufacturing
|
Leased
|
|
|
Booneville, Mississippi
|
Distribution/Manufacturing
|
Owned
|
|
|
Ogdensburg, New York
|
Distribution/Manufacturing
|
Owned
|
|
|
Sidney, New York
|
Distribution/Manufacturing
|
Owned
|
|
|
Alexandria, Pennsylvania
|
Distribution/Manufacturing
|
Owned
|
|
|
Pleasant Prairie, Wisconsin
|
Distribution/Manufacturing
|
Leased
|
|
|
Mississauga, Canada
|
Distribution/Manufacturing/Office
|
Leased
|
|
|
International:
|
|||
|
Sydney, Australia
|
Distribution/Manufacturing/Office
|
Owned/Leased (2)
|
|
|
Bauru, Brazil
|
Distribution/Manufacturing/Office
|
Owned
|
|
|
Aylesbury, England
|
Office
|
Leased
|
|
|
Halesowen, England
|
Distribution
|
Owned
|
|
|
Lillyhall, England
|
Manufacturing
|
Leased
|
|
|
Tornaco, Italy
|
Distribution
|
Owned
|
|
|
Tokyo, Japan
|
Office
|
Leased
|
|
|
Lerma, Mexico
|
Manufacturing/Office
|
Owned
|
|
|
Born, Netherlands
|
Distribution
|
Leased
|
|
|
Wellington, New Zealand
|
Distribution/Office
|
Owned
|
|
|
Auckland, New Zealand
|
Distribution/Office
|
Leased
|
|
|
Arcos de Valdevez, Portugal
|
Manufacturing
|
Owned
|
|
|
Computer Products Group:
|
|||
|
San Mateo, California
|
Office
|
Leased
|
|
The Computer Products Group also utilizes many of the above distribution centers. We believe that the properties are suitable to the respective businesses and have production capacities adequate to meet the needs of our businesses.
ITEM 3.
LEGAL PROCEEDINGS
In connection with our May 1, 2012 acquisition of Mead Consumer and Office Products business, we assumed all of the tax liabilities for the acquired foreign operations including Tilibra Produtos de Papelaria Ltda. ("Tilibra"). In December of 2012, the Federal Revenue Department of the Ministry of Finance of Brazil ("FRD") issued a tax assessment (the "Brazilian Tax Assessment") against Tilibra, which challenged the tax deduction of goodwill from Tilibra's taxable income for the year 2007. A second assessment challenging the deduction of goodwill from Tilibra's taxable income for the years 2008, 2009 and 2010 was issued by FRD in October 2013.
Tilibra is disputing both of the tax assessments through established administrative procedures. We believe we have meritorious defenses and intend to vigorously contest these matters; however, there can be no assurances that we will ultimately prevail. We are still in the administrative stages of the process to challenge the FRD's tax assessments, and the ultimate outcome will not be determined until the Brazilian tax appeal process is complete, which is expected to take a number of years. In addition, Tilibra's 2011-2012 tax years remain open and subject to audit, and there can be no assurances that we will not receive additional tax assessments regarding the goodwill for one or both of those years. The time limit for issuing an assessment for 2011 expires in January 2018.
If the FRD's initial position is ultimately sustained, the amount assessed would materially and adversely affect our cash flow in the year of settlement.
18
Because there is no settled legal precedent on which to base a definitive opinion as to whether we will ultimately prevail, we consider the outcome of this dispute to be uncertain. Since it is not more likely than not that we will prevail, in 2012, we recorded a reserve in the amount of
$44.5 million
(at December 31, 2012
exchange rates) in consideration of this contingency, of which
$43.3 million
was recorded as an adjustment to the purchase price and which included the 2007-2012 tax years plus penalties and interest through December 2012. Included in this reserve is an assumption of penalties at
75%, which is the standard penalty. While there is a possibility that a penalty of 150% could be imposed, based on the facts in our case and existing precedent, we believe the likelihood of a150%
penalty being imposed is not more likely than not at December 31, 2016. In the meantime, we continue to actively monitor administrative and judicial court decisions and evaluate their impact, if any, on our legal assessment of the ultimate outcome of our case. In addition, we will continue to accrue interest related to this contingency until such time as the outcome is known or until evidence is presented that we are more likely than not to prevail. During
2016
,
2015
and
2014
,
we accrued additional interest as a charge to current tax expense of
$2.8 million
,
$2.7 million
and
$3.2 million
, respectively. At current exchange rates, our accrual through
December 31, 2016
, including tax, penalties and interest is
$37.3 million
.
There are various other claims, lawsuits and pending actions against us incidental to our operations. It is the opinion of management that (other than the Brazilian Tax Assessment) the ultimate resolution of these matters will not have a material adverse effect on our financial condition, results of operations or cash flow. However, there is no assurance that we will ultimately be successful in our defense of any of these matters or that an adverse outcome in any matter will not affect our results of operations, financial condition or cash flow.
ITEM 4.
MINE SAFETY DISCLOSURES
Not applicable.
19
ITEM 5.
MARKET FOR REGISTRANT’S COMMON EQUITY, RELATED STOCKHOLDER MATTERS AND ISSUER
PURCHASES OF EQUITY SECURITIES
Common Stock Information
Our common stock is traded on the New York Stock Exchange ("NYSE") under the symbol "ACCO." The following table sets forth, for the periods indicated, the high and low sales prices for our common stock as reported on the NYSE for
2015
and
2016
:
|
High
|
Low
|
||||||
|
2015
|
|||||||
|
First Quarter
|
$
|
9.20
|
|
$
|
7.05
|
|
|
|
Second Quarter
|
$
|
8.75
|
|
$
|
7.15
|
|
|
|
Third Quarter
|
$
|
8.40
|
|
$
|
6.80
|
|
|
|
Fourth Quarter
|
$
|
8.48
|
|
$
|
6.91
|
|
|
|
2016
|
|||||||
|
First Quarter
|
$
|
9.05
|
|
$
|
5.47
|
|
|
|
Second Quarter
|
$
|
10.75
|
|
$
|
8.58
|
|
|
|
Third Quarter
|
$
|
11.75
|
|
$
|
9.35
|
|
|
|
Fourth Quarter
|
$
|
14.00
|
|
$
|
9.06
|
|
|
As of
February 6, 2017
, we had approximately 15,190 record holders of our common stock.
Stock Performance Graph
The following graph compares the cumulative total stockholder return on our common stock to that of the S&P Office Services and Supplies (SuperCap1500) Index and the Russell 2000 Index assuming an investment of $100 in each from December 31,
2011
through December 31,
2016
.
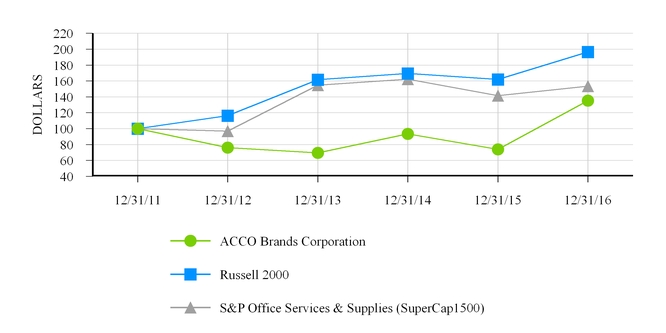
|
Cumulative Total Return
|
|||||||||||||||||||||||
|
12/31/11
|
12/31/12
|
12/31/13
|
12/31/14
|
12/31/15
|
12/31/16
|
||||||||||||||||||
|
ACCO Brands Corporation.
|
$
|
100.00
|
|
$
|
76.06
|
|
$
|
69.64
|
|
$
|
93.37
|
|
$
|
73.89
|
|
$
|
135.23
|
|
|||||
|
Russell 2000
|
100.00
|
|
116.35
|
|
161.52
|
|
169.43
|
|
161.95
|
|
196.45
|
|
|||||||||||
|
S&P Office Services and Supplies
(SuperCap1500)
|
100.00
|
|
96.93
|
|
154.75
|
|
162.10
|
|
141.58
|
|
153.49
|
|
|||||||||||
20
Common Stock Purchases
The following table provides information about our purchases of equity securities during the quarter ended
December 31, 2016
:
|
Period
|
Total Number of Shares Purchased
|
Average Price Paid per Share
|
Total Number of Shares Purchased as Part of Publicly Announced Plan or Program
(1)
|
Approximate Dollar Value of Shares that May Yet Be Purchased Under the Program
(1)
|
||||||||||
|
October 1, 2016 to October 31, 2016
|
—
|
|
$
|
—
|
|
—
|
|
$
|
120,571,849
|
|
||||
|
November 1, 2016 to November 30, 2016
|
—
|
|
—
|
|
—
|
|
120,571,849
|
|
||||||
|
December 1, 2016 to December 31, 2016
|
—
|
|
—
|
|
—
|
|
120,571,849
|
|
||||||
|
Total
|
—
|
|
$
|
—
|
|
—
|
|
$
|
120,571,849
|
|
||||
(1) On August 21, 2014, the Company announced that its Board of Directors had approved the repurchase of up to $100 million in shares of its common stock. On October 28, 2015, the Company announced that its Board of Directors had approved an authorization to repurchase up to an additional $100 million in shares of its common stock.
For the year ended
December 31, 2015
, we repurchased
$60.0 million
of our common stock in the open market. We did not repurchase any of our common stock in the open market during the year ended
December 31, 2016
.
The number of shares to be purchased, if any, and the timing of purchases will be based on the Company's stock price, leverage ratios, cash balances, general business and market conditions, and other factors, including alternative investment opportunities and working capital needs. The Company may repurchase its shares, from time to time, through a variety of methods, including open-market purchases, privately negotiated transactions and block trades or pursuant to repurchase plans designed to comply with the Rule 10b5-1 of the Securities Exchange Act of 1934. Any stock repurchases will be subject to market conditions, SEC regulations and other considerations and may be commenced or suspended at any time or from time to time, without prior notice. Accordingly, there is no guarantee as to the number of shares that will be repurchased, if any, or the timing of such repurchases.
Dividend Policy
We have not paid any dividends on our common stock since becoming a public company. We intend to retain any
2017
earnings to reduce our indebtedness and repurchase our shares, absent value-creating acquisitions. Any determination as to the declaration of dividends is at our Board of Directors’ sole discretion based on factors it deems relevant at that time.
21
ITEM 6.
SELECTED FINANCIAL DATA
SELECTED HISTORICAL FINANCIAL DATA
The following table sets forth our selected consolidated financial data. The selected consolidated financial data as of and for the five fiscal years ended December 31 are derived from our consolidated financial statements. The data should be read in conjunction with the consolidated financial statements and related notes contained in Part II, Item 8. of this report.
|
Year Ended December 31,
|
|||||||||||||||||||
|
(in millions of dollars, except per share data)
|
2016
(1)
|
2015
|
2014
|
2013
|
2012
|
||||||||||||||
|
|
|||||||||||||||||||
|
Net sales
|
$
|
1,557.1
|
|
$
|
1,510.4
|
|
$
|
1,689.2
|
|
$
|
1,765.1
|
|
$
|
1,758.5
|
|
||||
|
Operating income
(2)
|
167.3
|
|
163.5
|
|
173.6
|
|
145.8
|
|
139.3
|
|
|||||||||
|
Interest expense
|
49.3
|
|
44.5
|
|
49.5
|
|
59.0
|
|
91.3
|
|
|||||||||
|
Interest income
|
(6.4
|
)
|
(6.6
|
)
|
(5.6
|
)
|
(4.3
|
)
|
(2.0
|
)
|
|||||||||
|
Other expense, net
(3)
|
1.4
|
|
2.1
|
|
0.8
|
|
7.6
|
|
61.3
|
|
|||||||||
|
Net income
(4)
|
95.5
|
|
85.9
|
|
91.6
|
|
77.1
|
|
115.4
|
|
|||||||||
|
Per common share:
|
|||||||||||||||||||
|
Net income
(4)
|
|||||||||||||||||||
|
Basic
|
$
|
0.89
|
|
$
|
0.79
|
|
$
|
0.81
|
|
$
|
0.68
|
|
$
|
1.24
|
|
||||
|
Diluted
|
$
|
0.87
|
|
$
|
0.78
|
|
$
|
0.79
|
|
$
|
0.67
|
|
$
|
1.22
|
|
||||
|
|
|||||||||||||||||||
|
Total assets
|
$
|
2,064.5
|
|
$
|
1,953.4
|
|
$
|
2,215.1
|
|
$
|
2,368.3
|
|
$
|
2,482.3
|
|
||||
|
Total debt, net
|
696.2
|
|
720.5
|
|
789.3
|
|
906.3
|
|
1,046.7
|
|
|||||||||
|
Total stockholders’ equity
|
708.7
|
|
581.2
|
|
681.0
|
|
702.3
|
|
639.2
|
|
|||||||||
|
Other Data:
|
|||||||||||||||||||
|
Cash provided (used) by operating activities
|
$
|
165.9
|
|
$
|
171.2
|
|
$
|
171.7
|
|
$
|
194.5
|
|
$
|
(7.5
|
)
|
||||
|
Cash (used) by investing activities
|
(106.4
|
)
|
(24.6
|
)
|
(25.8
|
)
|
(33.3
|
)
|
(432.2
|
)
|
|||||||||
|
Cash (used) provided by financing activities
|
(75.2
|
)
|
(137.8
|
)
|
(142.0
|
)
|
(155.5
|
)
|
360.1
|
|
|||||||||
|
(1)
|
The Company acquired Pelikan Artline on May 2, 2016; the results of Pelikan Artline are included in 2016 results only from that date forward.
|
|
(2)
|
Operating income for the years
2016
,
2015
,
2014
,
2013
and
2012
was impacted by restructuring charges (credits) of
$5.4 million
,
$(0.4) million
,
$5.5 million
, $30.1 million and $24.3 million, respectively. Such charges were largely severance related, and were principally associated with post-merger integration activities following the acquisition of the Mead Consumer & Office Products business ("MC&OP") in 2012.
|
|
(3)
|
Other expense, net
for the year 2016 was impacted by a
$28.9 million
gain arising from the PA Acquisition due to the revaluation of the Company's previously held equity interest to fair value, see "
Note 3. Acquisition
" to the consolidated financial statements contained in Part II, Item 8 of this report.
Other expense, net
for the years 2016, 2015, 2013 and 2012 was also impacted by incremental charges related to various refinancings of
$29.9 million
,
$1.9 million
,
$9.4 million
and
$61.4 million
, respectively. For further information on the refinancings completed in 2016 and 2015 see "
Note 4. Long-term Debt and Short-term Borrowings
" to the consolidated financial statements contained in Part II, Item 8. of this report.
|
|
(4)
|
Due to the acquisition of MC&OP in 2012, we analyzed our need to maintain valuation allowances against our U.S. deferred taxes, which were established in 2009. Based on our analysis we determined in 2012 that there existed sufficient evidence in the form of future taxable income from the combined operations to release
$126.1 million
of the valuation allowance that had been previously recorded against the U.S. deferred income tax assets. In 2013 and 2012, we also released
$11.6 million
and
$19.0 million
, respectively, of valuation allowances in certain foreign jurisdictions.
|
22
SUPPLEMENTAL NON-GAAP FINANCIAL MEASURES
To supplement our consolidated financial statements presented in accordance with generally accepted accounting principles in the U.S. ("GAAP"), we provide investors with certain non-GAAP financial measures. See below for an explanation of how we calculate and use these non-GAAP financial measures and for a reconciliation of these non-GAAP financial measures to the most comparable GAAP financial measures.
We believe these non-GAAP financial measures are appropriate to enhance an overall understanding of our past financial performance and also our prospects for the future, as well as to facilitate comparisons with our historical operating results. Adjustments to our GAAP results are made with the intent of providing both management and investors a more complete understanding of our underlying operational results and trends. For example, the non-GAAP results are an indication of our baseline performance before gains, losses or other charges that are considered by management to be outside our core operating results. In addition, these non-GAAP financial measures are among the primary indicators management uses as a basis for our planning and forecasting of future periods and senior management’s incentive compensation is derived, in part, using certain of these non-GAAP financial measures.
There are limitations in using non-GAAP financial measures because the non-GAAP financial measures are not prepared in accordance with generally accepted accounting principles and may be different from non-GAAP financial measures used by other companies. The non-GAAP financial measures are limited in value because they exclude certain items that may have a material impact upon our reported financial results; such as unusual tax items, restructuring and integration charges, goodwill or other intangible asset impairment charges, foreign currency fluctuation, and other one-time or non-recurring items. The presentation of this additional information is not meant to be considered in isolation or as a substitute for the directly comparable financial measures prepared in accordance with GAAP. Investors should review the reconciliations of the non-GAAP financial measures to their most directly comparable GAAP financial measures as provided in the tables below as well as our consolidated financial statements and related notes included elsewhere in this report.
Net Sales at Constant Currency
We provide net sales at constant currency in order to facilitate comparisons of our historical sales results as well as highlight the underlying sales trends in our business. We calculate net sales at constant currency by translating the current period foreign operation net sales at prior year periodic currency rates.
The following table provides a reconciliation of GAAP net sales as reported to non-GAAP net sales at constant currency:
|
Year Ended December 31, 2016
|
Year Ended December 31, 2015
|
|||||||||||||||||
|
(in millions of dollars)
|
GAAP Reported Net Sales
|
Currency Translation
|
Non-GAAP Net Sales at Constant Currency
|
GAAP Reported Net Sales
|
% Change at Constant Currency
|
|||||||||||||
|
ACCO Brands North America
|
$
|
955.5
|
|
$
|
3.9
|
|
$
|
959.4
|
|
$
|
963.3
|
|
(0.4
|
)%
|
||||
|
ACCO Brands International
|
485.0
|
|
11.8
|
|
496.8
|
|
426.9
|
|
16.4
|
%
|
||||||||
|
Computer Products Group
|
116.6
|
|
1.2
|
|
117.8
|
|
120.2
|
|
(2.0
|
)%
|
||||||||
|
Total
|
$
|
1,557.1
|
|
$
|
16.9
|
|
$
|
1,574.0
|
|
$
|
1,510.4
|
|
4.2
|
%
|
||||
23
Adjusted Operating Income
We provide adjusted operating income in order to facilitate comparisons of our historical operating results by excluding one-time gains, losses and other charges, such as restructuring (credits) charges.
The following table provides a reconciliation of GAAP operating income as reported to non-GAAP adjusted operating income:
|
Year Ended December 31, 2016
|
|||||||||||
|
(in millions of dollars)
|
GAAP Reported Operating Income
|
Adjustments
(1)
|
Non-GAAP Adjusted Operating Income
|
||||||||
|
ACCO Brands North America
|
$
|
150.6
|
|
$
|
1.2
|
|
$
|
151.8
|
|
||
|
ACCO Brands International
|
53.1
|
|
6.8
|
|
59.9
|
|
|||||
|
Computer Products Group
|
11.6
|
|
—
|
|
11.6
|
|
|||||
|
Corporate
|
(48.0
|
)
|
10.6
|
|
(37.4
|
)
|
|||||
|
Total
|
$
|
167.3
|
|
$
|
18.6
|
|
$
|
185.9
|
|
||
(1) Represents the adjustment of transaction and integration expenses associated with the PA Acquisition and the Esselte Acquisition, restructuring charges and the amortization of step-up in the value of finished goods inventory associated with the acquisition of Pelikan Artline.
Free Cash Flow
We provide free cash flow in order to show the cash available to pay down debt, buy back common shares and fund acquisitions. Free cash flow represents cash flow from operating activities less cash used for additions to property, plant and equipment and plus cash proceeds from the disposition of assets and other investing activity.
The following table sets forth a reconciliation of GAAP net cash provided by operating activities as reported to non-GAAP free cash flow:
|
(in millions of dollars)
|
Year Ended December 31, 2016
|
||
|
Net cash provided by operating activities
|
$
|
165.9
|
|
|
Net cash (used) provided by:
|
|||
|
Additions to property, plant and equipment
|
(18.5
|
)
|
|
|
Proceeds from the disposition of assets
|
0.7
|
|
|
|
Other
|
0.2
|
|
|
|
Free cash flow (non-GAAP)
|
148.3
|
|
|
24
ITEM 7.
MANAGEMENT’S DISCUSSION AND ANALYSIS OF FINANCIAL CONDITION AND RESULTS OF
OPERATIONS
INTRODUCTION
Management’s Discussion and Analysis of Financial Condition and Results of Operations should be read in conjunction with the consolidated financial statements of ACCO Brands Corporation and the accompanying notes contained in Part II, Item 8. of this report. Unless otherwise noted, the following discussion pertains only to our continuing operations.
Overview of the Company
ACCO Brands is one of the world's largest designers, marketers and manufacturers of branded business, academic and selected consumer products. Our widely recognized brands include Artline
®
, AT-A-GLANCE
®
, Derwent
®
,
Esselte
®
, Five Star
®
, GBC
®
, Hilroy
®
, Kensington
®
, Leitz
®
, Marbig
®
, Mead
®
, NOBO
®
, Quartet
®
, Rapid
®
, Rexel
®
, Swingline
®
, Tilibra
®
, Wilson Jones
®
and many others. More than 80% of our net sales come from brands that occupy the number one or number two positions in the select product categories in which we compete. We seek to develop new products that meet the needs of our consumer and commercial end-users. We compete through a balance of product innovation, category management, a low-cost operating model and an efficient supply chain. We sell our products to consumers and commercial end-users primarily through resellers, including wholesalers and retailers, on-line retailers, and traditional office supply resellers. Our products are sold primarily to markets located in the U.S., Northern Europe, Australia, Canada, Brazil and Mexico.
For the year ended
December 31, 2016
, approximately
43%
of our sales were outside the U.S., up from
40%
in
2015
.
The majority of our revenue is concentrated in geographies where demand for our product categories is in mature stages, but we see opportunities to grow sales through share gains, channel expansion and new products. Over the long-term we expect to derive growth in faster growing emerging geographies where demand in the product categories in which we compete is strong, such as in Latin America and parts of Asia, the Middle East and Eastern Europe. We plan to grow organically, supplemented by strategic acquisitions in both existing and adjacent categories. Historically, key drivers of demand for our products have included trends in white-collar employment levels, education enrollment levels, gross domestic product (GDP), growth in the number of small businesses and home offices, as well as consumer usage trends for our product categories.
We believe our leading product positions provide the scale to enable us to invest in product innovation and drive growth across our product categories. We currently manufacture approximately half of our products locally where we operate, and source approximately half of our products, primarily from China.
Pelikan Artline Joint-Venture Acquisition
On May 2, 2016, the Company completed the PA Acquisition. Prior to the PA Acquisition, the Company's investment in the Pelikan Artline joint-venture was accounted for under the equity method. The results of Pelikan Artline joint-venture are included in the Company's consolidated financial statements from the date of the PA Acquisition, May 2, 2016.
Pelikan Artline's product categories include writing instruments, notebooks, binding and lamination, visual communication, cleaning and janitorial supplies, as well as general stationery. Its industry-leading brands include Artline
®
, Quartet
®,
GBC
®
, Spirax
®
and Texta
®
, among others.
The PA Acquisition was financed through a borrowing of
A$100.0 million
(US
$76.6 million
based on May 2, 2016 exchange rates) under our credit facilities. For further information on the financing see also "
Note 4. Long-term Debt and Short-term Borrowings
" to the consolidated financial statements contained in Item 8. of this report.
During 2016, we recognized a
$28.9 million
gain in connection with the PA Acquisition due to the revaluation of the Company's previously held equity interest in the Pelikan Artline joint-venture. This amount was reported in "
Other expense, net
." For further information on the PA Acquisition see also "
Note 3. Acquisition
" to the consolidated financial statements contained in Item 8. of this report.
Reportable Segments
ACCO Brands North America and ACCO Brands International
ACCO Brands North America and ACCO Brands International design, market, source, manufacture and sell traditional office products, academic supplies and calendar products. ACCO Brands North America comprises the U.S. and Canada, and ACCO Brands International comprises the rest of the world, primarily Northern Europe, Australia, Brazil and Mexico.
25
Our business, academic and calendar product lines use name brands such as Artline
®
, AT-A-GLANCE
®
, Derwent
®
, Esselte
®
, Five Star
®
, GBC
®
, Hilroy
®
, Leitz
®
, Marbig
®
, Mead
®
, NOBO
®
, Quartet
®
, Rapid
®
, Rexel
®
, Swingline
®
, Tilibra
®
, Wilson Jones
®
and many others. Products and brands are not confined to one channel or product category and are sold based on end-user preference in each geographic location.
The majority of our office products, such as stapling, binding and laminating equipment and related consumable supplies, shredders and whiteboards, are used by businesses. Most of these end-users purchase their products from our customers, which include traditional office supply resellers, wholesalers and other retailers, including on-line retailers. We supply some of our products directly to large commercial and industrial end-users, and provide business machine maintenance and certain repair services. Additionally, we supply some similar private label products.
Our academic products include notebooks, folders, decorative calendars and stationery products. We distribute our academic products primarily through mass merchandisers and other retailers, such as grocery, drug and office superstores, as well as on-line retailers. We also distribute to small independent retailers in emerging markets and supply some private label academic products.
Our calendar products are sold through all the same channels where we sell business or academic products, as well as directly to consumers, both on-line and through direct mail.
Our customers are primarily large global and regional resellers of our products including traditional office supply resellers, wholesalers, on-line retailers and other retailers. Mass merchandisers and retail channels primarily sell to individual consumers but also to small businesses. We also sell to office supply retailers, commercial contract dealers, wholesalers, distributors and independent dealers who primarily serve commercial end-users. Over half of our product sales by our customers are to commercial end-users, who generally seek premium products that have added value or ease-of-use features and a reputation for reliability, performance and professional appearance. Some of our binding and laminating equipment products are sold directly to high-volume end-users and commercial reprographic centers. We also sell directly to consumers.
Computer Products Group
Our Computer Products Group designs, sources, distributes, markets and sells accessories for laptop and desktop computers and tablets. These accessories primarily include security products, input devices such as presenters, mice and trackballs, ergonomic aids such as foot and wrist rests, docking stations, and other PC and tablet accessories. We sell these products mostly under the Kensington
®
, Microsaver
®
and ClickSafe
®
brand names, with the majority of revenue coming from the U.S. and Northern Europe. Our computer products are manufactured by third-party suppliers, principally in Asia, and are distributed from our regional facilities. Our computer products are sold primarily to consumer electronics retailers, information technology value-added resellers, original equipment manufacturers, and office products retailers, as well as directly to consumers on-line.
Overview of
2016
Company Performance
In 2016, the Company effectively executed against its business strategy, including increasing penetration in growing channels, strategic acquisitions and effective management of its capital structure and deployment of operating cash flow.
Specifically, net sales increased
3%
to
$1.56 billion
compared to
$1.51 billion
in the prior-year period. The PA Acquisition, which was completed on May 2, 2016, contributed
5%
to sales. Foreign currency translation reduced sales by
1%
. The underlying decline in sales was primarily due to
declines at certain wholesalers and office superstores customers
, partially offset by strong growth with mass channel and e-tail customers. Net income was
$95.5 million
, or
$0.87
per share, compared to net income of
$85.9 million
, or
$0.78
per share, in the prior-year period. The increase was primarily due to the lower effective tax rate for 2016.
During 2016, the company entered into two new financing arrangements. The first refinancing was in connection with the PA Acquisition. In addition, in December 2016, the Company refinanced its Senior Unsecured Notes at a lower interest rate, extending the maturity of the debt an additional 4 years to 2024.
In connection with the PA Acquisition and the Esselte Acquisition, announced in October 2016, the Company incurred
$12.8 million
of transaction and integration costs in 2016.
Foreign Currency
The strong U.S. dollar impacted our 2016 results from both a translation and transaction perspective. With respect to translation the strong U.S. dollar decreased our 2016 reported sales by
$16.9 million
, or
1%
, but slightly benefited our operating income.
26
Foreign currency translation increased operating income by
$1.6 million
, or
1%
, due to the seasonality of our Brazilian business, which earns most of its income in the fourth quarter when the Brazilian real strengthened.
With respect to the transaction impact, in response to the strengthening of the U.S. dollar during both the second half of 2015 and into 2016, we implemented price increases in 2016 in certain foreign markets in an effort to recover our lost gross margin. Due to competitive pressures and the timing of these price increases relative to changes in currency exchange rates, we were not able to increase our prices enough to fully offset the cumulative impact of the foreign exchange related inflation on our cost of products sold in these markets.
The annual average foreign exchange rates have moved as follows for our major currencies relative to the U.S. dollar:
|
2016 Average Versus 2015 Average
|
2015 Average Versus 2014 Average
|
|||
|
Currency
|
Increase/(Decline)
|
Increase/(Decline)
|
||
|
Brazilian real
|
(6)%
|
(28)%
|
||
|
Euro
|
—%
|
(17)%
|
||
|
Canadian dollar
|
(4)%
|
(14)%
|
||
|
Australian dollar
|
(1)%
|
(17)%
|
||
|
Mexican peso
|
(15)%
|
(16)%
|
||
|
British pound
|
(11)%
|
(7)%
|
||
|
Japanese yen
|
11%
|
(13)%
|
||
Fluctuations in the currency exchange rates can also have a material impact on our Consolidated Balance Sheet. The strengthening of the U.S. dollar has reduced the value of our reported assets and liabilities by
$16.8 million
versus
December 31, 2015
. Therefore, our reported shareholders' equity has decreased by this amount.
We expect the adverse effects from the strong U.S. dollar to continue to impact us in 2017. See also "Part I, Item 1A.
Risk Factors -
Risks associated with currency volatility could adversely affect our sales, profitability, cash flow and results of operations
,
" "Item 6.
Selected Financial Data - Supplemental Non-GAAP Financial Measures
" and "
Note 13. Derivative Financial Instruments
" to the consolidated financial statements contained in Item 8. of this report
.
Senior Unsecured Notes
On December 22, 2016, the Company completed a private offering of $400.0 million in aggregate principal amount of 5.25% senior unsecured notes due December 2024 (the "New Notes") which were issued under an indenture, dated December 22, 2016 (the "New Indenture"), among the Company, as issuer, the guarantors named therein (the "Guarantors") and Wells Fargo Bank, National Association, as trustee (the "Trustee").
In addition, effective December 22, 2016, the Company irrevocably deposited with the trustee of its 6.75% Senior Notes due 2020 (the "Existing Notes") an amount necessary to pay the aggregate redemption price for the Existing Notes, and satisfied and discharged all its obligations related to the Existing Notes indenture. The Company borrowed
$73.9 million
under its revolving credit facility and applied the funds, together with the net proceeds from the issuance of the New Notes and cash on hand, toward the payment of the redemption price for all of the Existing Notes. The aggregate redemption price of
$531.5 million
, consisted of principal due and payable on the Existing Notes, a "make-whole" call premium of
$25.0 million
(included in "
Other expense, net
"), and accrued and unpaid interest of
$6.5 million
(included in "
Interest expense
").
Also included in "
Other expense, net
" is a
$4.9 million
charge for the write-off of debt issuance costs associated with the Existing Notes. Additionally, we incurred and capitalized approximately
$6.1 million
in bank, legal and other fees associated with the issuance of the New Notes.
For further information on the refinancing of our Existing Notes and the issuance of the New Notes see "
Note 4. Long-term Debt and Short-term Borrowings
" to the consolidated financial statements contained in Item 8. of this report.
27
Fiscal
2016
versus Fiscal
2015
The following table presents the Company’s results for the years ended
December 31, 2016
, and
2015
.
|
Year Ended December 31,
|
Amount of Change
|
||||||||||||||
|
(in millions of dollars, except per share data)
|
2016
(1)
|
2015
|
$
|
%
|
|||||||||||
|
Net sales
|
$
|
1,557.1
|
|
$
|
1,510.4
|
|
$
|
46.7
|
|
3
|
%
|
||||
|
Cost of products sold
|
1,042.0
|
|
1,032.0
|
|
10.0
|
|
1
|
%
|
|||||||
|
Gross profit
|
515.1
|
|
478.4
|
|
36.7
|
|
8
|
%
|
|||||||
|
Gross profit margin
|
33.1
|
%
|
31.7
|
%
|
1.4
|
|
pts
|
||||||||
|
Advertising, selling, general and administrative expenses
|
320.8
|
|
295.7
|
|
25.1
|
|
8
|
%
|
|||||||
|
Amortization of intangibles
|
21.6
|
|
19.6
|
|
2.0
|
|
10
|
%
|
|||||||
|
Restructuring charges (credits)
|
5.4
|
|
(0.4
|
)
|
5.8
|
|
NM
|
|
|||||||
|
Operating income
|
167.3
|
|
163.5
|
|
3.8
|
|
2
|
%
|
|||||||
|
Operating income margin
|
10.7
|
%
|
10.8
|
%
|
(0.1)
|
|
pts
|
||||||||
|
Interest expense
|
49.3
|
|
44.5
|
|
4.8
|
|
11
|
%
|
|||||||
|
Interest income
|
(6.4
|
)
|
(6.6
|
)
|
0.2
|
|
(3
|
)%
|
|||||||
|
Equity in earnings of joint ventures
|
(2.1
|
)
|
(7.9
|
)
|
5.8
|
|
(73
|
)%
|
|||||||
|
Other expense, net
|
1.4
|
|
2.1
|
|
(0.7
|
)
|
(33
|
)%
|
|||||||
|
Income tax expense
|
29.6
|
|
45.5
|
|
(15.9
|
)
|
(35
|
)%
|
|||||||
|
Effective tax rate
|
23.7
|
%
|
34.6
|
%
|
|
(10.9)
|
|
pts
|
|||||||
|
Net income
|
95.5
|
|
85.9
|
|
9.6
|
|
11
|
%
|
|||||||
|
Weighted average number of diluted shares outstanding:
|
109.2
|
|
110.6
|
|
(1.4
|
)
|
(1
|
)%
|
|||||||
|
Diluted income per share
|
0.87
|
|
0.78
|
|
0.09
|
|
12
|
%
|
|||||||
|
(1)
|
The Company acquired Pelikan Artline on May 2, 2016, the results of which are included in 2016 results only from that date forward.
|
Net Sales
Net sales increased
$46.7 million
, or
3%
, to
$1,557.1 million
from
$1,510.4 million
in the prior-year period. The PA Acquisition contributed sales of
$78.5 million
, or
5%
. Foreign currency translation reduced sales by
$16.9 million
, or
1%
. The underlying sales decrease was due to
declines at certain wholesalers and office superstores customers
, partially offset by strong growth at mass and e-tail customers.
Cost of Products Sold
Cost of products sold includes all manufacturing, product sourcing and distribution costs, including depreciation related to assets used in the manufacturing, procurement and distribution process, allocation of certain information technology costs supporting those processes, inbound and outbound freight, shipping and handling costs, purchasing costs associated with materials and packaging used in the production processes and inventory valuation adjustments. Cost of products sold increased
$10.0 million
, or
1%
, to
$1,042.0 million
, from
$1,032.0 million
in the prior-year period. The PA Acquisition contributed
$47.7 million
to increased cost of products sold. Foreign currency translation reduced cost of products sold by
$13.3 million
, or
1%
. The underlying decline was due to lower sales volume, cost savings and productivity improvements, partially offset by foreign-exchange-related inflationary increases in certain foreign markets' cost of products sold.
Gross Profit
Management believes that gross profit and gross profit margin provide enhanced shareholder appreciation of underlying profit drivers. Gross profit increased
$36.7 million
, or
8%
, to
$515.1 million
, from
$478.4 million
in the prior-year period. The PA Acquisition increased gross profit by
$30.8 million
. Foreign currency translation reduced gross profit by
$3.6 million
, or
1%
. The underlying increase was due to higher pricing, cost savings and productivity improvements, which were partially offset by foreign-exchange-related inflationary increases in certain foreign markets' costs of products sold.
28
Gross profit margin increased to
33.1%
from
31.7%
. The increase was primarily due to cost savings and productivity improvements, higher pricing and the positive impact of the PA Acquisition.
Advertising, selling, general and administrative expenses
Advertising, selling, general and administrative expenses ("SG&A") include advertising, marketing, selling (including commissions), research and development, customer service, depreciation related to assets outside the manufacturing and distribution processes and all other general and administrative expenses outside the manufacturing and distribution functions (e.g., finance, human resources, information technology and corporate expenses). SG&A increased
$25.1 million
, or
8%
, to
$320.8 million
from
$295.7 million
in the prior-year period. The PA Acquisition increased SG&A by
$16.6 million
, including
$3.6 million
of costs related to the PA Acquisition. Foreign currency translation reduced SG&A by
$4.8 million
, or
2%
. The underlying increase was driven by higher professional fees, including $9.2 million related to the recently announced Esselte Acquisition. Additionally, the prior year benefited from a one-time $2.3 million benefit from the recovery of an indirect tax in Brazil.
As a percentage of sales, SG&A increased to
20.6%
from
19.6%
in the prior-year period, for the reasons mentioned above.
Restructuring Charges (Credits)
The Company initiated cost reduction plans related to the consolidation and integration of Pelikan Artline with our already existing Australian and New Zealand businesses, and as a result incurred
$4.2 million
in charges, primarily related to severance. In addition, the Company initiated additional cost reduction plans and incurred $1.2 million in severance charges related to the consolidation of certain functions in the North America segment.
Operating Income
Operating income increased
$3.8 million
, or
2%
, to
$167.3 million
, from
$163.5 million
in the prior-year period. Foreign currency translation increased operating income by
$1.6 million
, or
1%
. The underlying increase was due to the PA Acquisition, partially offset by increased SG&A and restructuring charges.
Interest Expense and Other Expense, Net
Interest expense
increased
$4.8 million
, or
11%
, to
$49.3 million
from
$44.5 million
in the prior-year period. The increase was primarily due to additional debt incurred to finance the PA Acquisition and the early refinancing of our Existing Notes, in which the Company incurred
$2.5 million
of incremental interest expense. Also contributing to the increase was the accelerated amortization of debt issuance cost related to the prepayment of $70 million on our U.S. Dollar Senior Secured Term Loan A.
Other expense, net
decreased by
$0.7 million
to
$1.4 million
from
$2.1 million
in the prior-year period. The current year included charges associated with the refinancing of our Existing Notes. The charges consisted of
$25.0 million
in a "make-whole" call premium and a
$4.9 million
charge for the write-off of debt issuance costs, which were offset by a
$28.9 million
gain arising from the PA Acquisition due to the revaluation of the Company's previously held equity interest to fair value and a $1.0 million gain on the settlement of an intercompany loan, previously deemed permanently invested. In the prior year we wrote-off $1.9 million of debt issuance costs related to the refinancing completed in 2015.
Income Taxes
Income tax expense was
$29.6 million
on income before taxes of
$125.1 million
, with an effective tax rate of
23.7%
. For the prior-year period, income tax expense was
$45.5 million
on income before taxes of
$131.4 million
, with an effective tax rate of
34.6%
. The lower effective tax rate in the current year period was primarily due to the following: 1) the
$28.9 million
gain from the PA Acquisition due to the revaluation of the previously held equity interest to fair value, which was not subject to tax, and 2) tax losses on foreign exchange on the repayment of intercompany loans, for which the pre-tax effect was recorded in equity.
Net Income
Net income increased
$9.6 million
, or
11%
, to
$95.5 million
or
$0.87
per diluted share, from
$85.9 million
, or
$0.78
per diluted share in the prior-year period. The underlying increase was primarily due to the lower effective tax rate in the current year.
29
Segment Discussion
|
Year Ended December 31, 2016
|
Amount of Change
|
|||||||||||||||||||||||||
|
Net Sales
|
Segment Operating Income (1)
|
Operating Income Margin
|
Net Sales
|
Net Sales
|
Segment Operating Income
|
Segment Operating Income
|
Margin Points
|
|||||||||||||||||||
|
(in millions of dollars)
|
$
|
%
|
$
|
%
|
||||||||||||||||||||||
|
ACCO Brands North America
|
$
|
955.5
|
|
$
|
150.6
|
|
15.8
|
%
|
$
|
(7.8
|
)
|
(1)%
|
$
|
3.0
|
|
2
|
%
|
50
|
|
|||||||
|
ACCO Brands International
|
485.0
|
|
53.1
|
|
10.9
|
%
|
58.1
|
|
14%
|
12.3
|
|
30
|
%
|
130
|
|
|||||||||||
|
Computer Products Group
|
116.6
|
|
11.6
|
|
9.9
|
%
|
(3.6
|
)
|
(3)%
|
1.3
|
|
13
|
%
|
130
|
|
|||||||||||
|
Total
|
$
|
1,557.1
|
|
$
|
215.3
|
|
$
|
46.7
|
|
$
|
16.6
|
|
||||||||||||||
|
Year Ended December 31, 2015
|
||||||||||||||||||||||||||
|
Net Sales
|
Segment Operating Income (A)
|
Operating Income Margin
|
||||||||||||||||||||||||
|
(in millions of dollars)
|
||||||||||||||||||||||||||
|
ACCO Brands North America
|
$
|
963.3
|
|
$
|
147.6
|
|
15.3
|
%
|
||||||||||||||||||
|
ACCO Brands International
|
426.9
|
|
40.8
|
|
9.6
|
%
|
||||||||||||||||||||
|
Computer Products Group
|
120.2
|
|
10.3
|
|
8.6
|
%
|
||||||||||||||||||||
|
Total
|
$
|
1,510.4
|
|
$
|
198.7
|
|
||||||||||||||||||||
(1) Segment operating income excludes corporate costs; "
Interest expense
;" "
Interest income
;" "
Equity in earnings of joint-venture
" and "
Other expense, net
." See "
Note 16. Information on Business Segments
" to the consolidated financial statements contained in Item 8. of this report for a reconciliation of total "
Segment operating income
" to "
Income before income tax
."
ACCO Brands North America
ACCO Brands North America net sales decreased
$7.8 million
, or
1%
, to
$955.5 million
from
$963.3 million
in the prior-year period. Foreign currency translation reduced sales by
$3.9 million
, or
0.4%
. The underlying sales decrease was primarily due to declines at certain wholesalers and an office products superstore due to inventory destocking and consumers purchasing in different channels. This was partially offset by strong back-to-school sales, notably with mass-market customers and on-line retailers, due to increased product placements and broadened product offerings.
ACCO Brands North America operating income increased
$3.0 million
, or
2%
, to
$150.6 million
from
$147.6 million
in the prior-year period, and operating income margin increased to
15.8%
from
15.3%
. Foreign currency translation reduced operating income by
$0.3 million
, or
0.2%
. The underlying improvement was driven by cost savings and productivity improvements.
ACCO Brands International
ACCO Brands International net sales increased
$58.1 million
, or
14%
, to
$485.0 million
from
$426.9 million
in the prior-year period. The PA Acquisition contributed sales of
$78.5 million
, or
18%
. Foreign currency translation reduced sales by
$11.8 million
, or
3%
. The underlying sales decrease was due to lower volume as a result of the ongoing channel destocking, most notably in Europe, as well as lost share with some customers and lower consumer demand. Partially offsetting the sales decline was price increases, which benefited sales by
8%
. Price increases were implemented to recover gross margins following foreign-exchange-related cost of products sold increases, particularly in Mexico as well as to offset paper related inflation in Brazil.
ACCO Brands International operating income increased
$12.3 million
, or
30%
, to
$53.1 million
from
$40.8 million
in the prior-year period, and operating income margin increased to
10.9%
from
9.6%
. The PA Acquisition contributed operating income of
$6.9 million
, net of
$4.2 million
of restructuring charges and
$2.3 million
of integration expenses. Foreign currency translation increased operating income by
$1.7 million
, or
4%
, due to the recovery of the Brazilian real, which occurred in the seasonally stronger fourth quarter. The underlying increase was due to higher pricing and productivity improvements, partially offset by lower volumes. In addition, the prior year results included a one-time $2.3 million recovery of an indirect tax and $1.3 million of severance charges, both in Brazil.
30
Computer Products Group
Computer Products Group net sales decreased
$3.6 million
, or
3%
, to
$116.6 million
from
$120.2 million
in the prior-year period. Foreign currency translation reduced sales by
$1.2 million
, or
1%
. Increased sales of PC accessory products were offset by lower sales of tablet accessories.
Computer Products Group operating income increased
$1.3 million
, or
13%
, to
$11.6 million
from
$10.3 million
in the prior-year period, and operating margin increased to
9.9%
from
8.6%
. Foreign currency translation increased operating income by
$0.2 million
, or
2%
. Operating income and margin increased due to higher pricing in international markets and a favorable product mix driven by lower sales of tablet accessories. The prior-year period also included $0.3 million in restructuring charges.
Fiscal
2015
versus Fiscal
2014
The following table presents the Company’s results for the years ended
December 31, 2015
and
2014
.
|
Year Ended December 31,
|
Amount of Change
|
||||||||||||||
|
(in millions of dollars, except per share data)
|
2015
|
2014
|
$
|
%
|
|||||||||||
|
Net sales
|
$
|
1,510.4
|
|
$
|
1,689.2
|
|
$
|
(178.8
|
)
|
(11
|
)%
|
||||
|
Cost of products sold
|
1,032.0
|
|
1,159.3
|
|
(127.3
|
)
|
(11
|
)%
|
|||||||
|
Gross profit
|
478.4
|
|
529.9
|
|
(51.5
|
)
|
(10
|
)%
|
|||||||
|
Gross profit margin
|
31.7
|
%
|
31.4
|
%
|
0.3
|
|
pts
|
||||||||
|
Advertising, selling, general and administrative expenses
|
295.7
|
|
328.6
|
|
(32.9
|
)
|
(10
|
)%
|
|||||||
|
Amortization of intangibles
|
19.6
|
|
22.2
|
|
(2.6
|
)
|
(12
|
)%
|
|||||||
|
Restructuring (credits) charges
|
(0.4
|
)
|
5.5
|
|
(5.9
|
)
|
NM
|
|
|||||||
|
Operating income
|
163.5
|
|
173.6
|
|
(10.1
|
)
|
(6
|
)%
|
|||||||
|
Operating income margin
|
10.8
|
%
|
10.3
|
%
|
0.5
|
|
pts
|
||||||||
|
Interest expense
|
44.5
|
|
49.5
|
|
(5.0
|
)
|
(10
|
)%
|
|||||||
|
Interest income
|
(6.6
|
)
|
(5.6
|
)
|
(1.0
|
)
|
18
|
%
|
|||||||
|
Equity in earnings of joint ventures
|
(7.9
|
)
|
(8.1
|
)
|
0.2
|
|
(2
|
)%
|
|||||||
|
Other expense, net
|
2.1
|
|
0.8
|
|
1.3
|
|
163
|
%
|
|||||||
|
Income tax expense
|
45.5
|
|
45.4
|
|
0.1
|
|
—
|
%
|
|||||||
|
Effective tax rate
|
34.6
|
%
|
33.1
|
%
|
1.5
|
|
pts
|
||||||||
|
Net income
|
85.9
|
|
91.6
|
|
(5.7
|
)
|
(6
|
)%
|
|||||||
|
Weighted average number of diluted shares outstanding:
|
110.6
|
|
116.3
|
|
(5.7
|
)
|
(5
|
)%
|
|||||||
|
Diluted income per share
|
0.78
|
|
0.79
|
|
(0.01
|
)
|
(1
|
)%
|
|||||||
Net Sales
Net sales decreased $178.8 million, or 11%, to $1,510.4 million from $1,689.2 million in the prior-year period. Foreign currency translation reduced sales by $123.9 million, or 7%. The underlying sales declined in all segments, but primarily in the International and North America segments. Within the International segment, sales volume declined in most of our markets, partially offset by price increases. Brazil accounted for $61.7 million of our total sales decline. Underlying sales decreased by $21.6 million due to the on-going deterioration of economic conditions, and currency translation reduced sales by $40.1 million. North America declined primarily due to lower sales to office superstores driven by the loss of product placement and continuing impact of distribution center and store closures.
Cost of Products Sold
Cost of products sold includes all manufacturing, product sourcing and distribution costs, including depreciation related to assets used in the manufacturing, procurement and distribution process, allocation of certain information technology costs supporting those processes, inbound and outbound freight, shipping and handling costs, purchasing costs associated with materials and packaging used in the production processes and inventory valuation adjustments. Cost of products sold decreased $127.3 million, or 11%, to $1,032.0 million, from $1,159.3 million in the prior-year period. Foreign currency translation reduced cost of products sold by $88.2 million, or 8%. The underlying decline was driven by lower sales volume, cost savings and productivity
31
improvements (primarily in the North America segment), partially offset by foreign-exchange-related increases in cost of products sold at our foreign business units that source their inventory in U.S. dollars.
Gross Profit
Management believes that gross profit and gross profit margin provide enhanced shareholder appreciation of underlying profit drivers. Gross profit decreased $51.5 million, or 10%, to $478.4 million, from $529.9 million in the prior-year period. Foreign currency translation reduced gross profit by $35.7 million, or 7%. The underlying decrease was primarily due to lower sales.
Gross profit margin increased to 31.7% from 31.4%. The increase was primarily due to cost savings and productivity improvements, which more than offset the adverse impact of unfavorable sales mix and deleveraging from lower volumes. Higher pricing primarily offset the increased cost of goods sourced as a result of the strong U.S. dollar.
Advertising, selling, general and administrative expenses
Advertising, selling, general and administrative expenses ("SG&A") include advertising, marketing, selling (including commissions), research and development, customer service, depreciation related to assets outside the manufacturing and distribution processes and all other general and administrative expenses outside the manufacturing and distribution functions (e.g., finance, human resources, information technology and corporate expenses). SG&A decreased $32.9 million, or 10%, to $295.7 million from $328.6 million in the prior-year period. Foreign currency translation reduced SG&A by $18.0 million, or 5%. The underlying decrease was driven by cost savings (primarily in marketing), lower professional fees and a one-time $2.3 million recovery of an indirect tax in Brazil.
As a percentage of sales, SG&A increased to 19.6% from 19.5% in the prior-year period primarily due to lower sales volume, partially offset by cost reductions.
Restructuring (Credits) Charges
There were no new restructuring initiatives commenced in 2015; restructuring credits in the current year reflect adjustments to the initiatives commenced in 2014. Restructuring charges decreased $5.9 million from the prior-year period.
Operating Income
Operating income decreased $10.1 million, or 6%, to $163.5 million, from $173.6 million in the prior-year period. Foreign currency translation reduced operating income by $17.2 million, or 10%. The underlying increase was primarily due to lower restructuring charges.
Interest Expense and Other Expense, Net
Interest expense decreased $5.0 million, or 10%, to $44.5 million from $49.5 million in the prior-year period. The decrease was primarily due to lower debt outstanding compared to the prior year.
Other expense, net increased by $1.3 million to $2.1 million from $0.8 million in the prior-year period. The increase was due to a $1.9 million write-off of debt issuance costs related to the second quarter of 2015 refinancing.
Income Taxes
Income tax expense was $45.5 million on income before taxes of $131.4 million, with an effective tax rate of 34.6%. For the prior-year period, income tax expense was $45.4 million on income before taxes of $137.0 million, with an effective tax rate of 33.1%. The effective tax rate for 2015 was higher than 2014 due to a greater percentage of U.S. income, which is taxed at a higher rate than income from most foreign jurisdictions.
Net Income
Net income decreased $5.7 million, or 6%, to $85.9 million, or
$0.78
per diluted share, from $91.6 million, or
$0.79
per diluted share in the prior-year period. Foreign currency translation reduced net income by $16.4 million, or 18%. The underlying increase was primarily due to lower restructuring charges and lower interest expense.
32
Segment Discussion
|
Year Ended December 31, 2015
|
Amount of Change
|
|||||||||||||||||||||||||
|
Net Sales
|
Segment Operating Income (1)
|
Operating Income Margin
|
Net Sales
|
Net Sales
|
Segment Operating Income
|
Segment Operating Income
|
Margin Points
|
|||||||||||||||||||
|
(in millions of dollars)
|
$
|
%
|
$
|
%
|
||||||||||||||||||||||
|
ACCO Brands North America
|
$
|
963.3
|
|
$
|
147.6
|
|
15.3
|
%
|
$
|
(42.7
|
)
|
(4)%
|
$
|
6.9
|
|
5
|
%
|
130
|
|
|||||||
|
ACCO Brands International
|
426.9
|
|
40.8
|
|
9.6
|
%
|
(120.0
|
)
|
(22)%
|
(22.1
|
)
|
(35
|
)%
|
(190
|
)
|
|||||||||||
|
Computer Products Group
|
120.2
|
|
10.3
|
|
8.6
|
%
|
(16.1
|
)
|
(12)%
|
2.1
|
|
26
|
%
|
260
|
|
|||||||||||
|
Total
|
$
|
1,510.4
|
|
$
|
198.7
|
|
$
|
(178.8
|
)
|
$
|
(13.1
|
)
|
||||||||||||||
|
Year Ended December 31, 2014
|
||||||||||||||||||||||||||
|
Net Sales
|
Segment Operating Income (A)
|
Operating Income Margin
|
||||||||||||||||||||||||
|
(in millions of dollars)
|
||||||||||||||||||||||||||
|
ACCO Brands North America
|
$
|
1,006.0
|
|
$
|
140.7
|
|
14.0
|
%
|
||||||||||||||||||
|
ACCO Brands International
|
546.9
|
|
62.9
|
|
11.5
|
%
|
||||||||||||||||||||
|
Computer Products Group
|
136.3
|
|
8.2
|
|
6.0
|
%
|
||||||||||||||||||||
|
Total
|
$
|
1,689.2
|
|
$
|
211.8
|
|
||||||||||||||||||||
(1) Segment operating income excludes corporate costs; "
Interest expense
;" "
Interest income
;" "
Equity in earnings of joint-venture
" and "
Other expense, net
." See "
Note 16. Information on Business Segments
" to the consolidated financial statements contained in Item 8. of this report for a reconciliation of total "
Segment operating income
" to "
Income before income tax
."
ACCO Brands North America
ACCO Brands North America net sales decreased $42.7 million, or 4%, to $963.3 million from $1,006.0 million in the prior-year period. Foreign currency translation reduced sales by $18.3 million, or 2%. The underlying sales decline was primarily due to lower sales to Office Depot, where 2015 global sales declined $38 million, the vast majority of which impacted North America. The decline with Office Depot was largely related to its merger with OfficeMax, which has adversely impacted our sales primarily through lost placement and inventory reductions (including the effects of distribution center and store closures). We expect inventory reductions due to the merger to continue to adversely impact our sales in 2016, although to a lesser degree than in 2015. Partially offsetting the decline in the office superstore channel were increased sales in the e-commerce and mass-retailer channels.
ACCO Brands North America operating income increased $6.9 million, or 5%, to $147.6 million from $140.7 million in the prior-year period, and operating income margin increased to 15.3% from 14.0%. Foreign currency translation reduced operating income by $1.9 million, or 1%. The underlying improvement was due to a reduction in restructuring charges of $3.3 million as well as cost savings from prior-year restructuring initiatives, productivity improvements and lower pension expenses. The improvements were partially offset by lower sales volume.
ACCO Brands International
ACCO Brands International net sales decreased $120.0 million, or 22%, to $426.9 million from $546.9 million in the prior-year period. Foreign currency translation reduced sales by $94.3 million, or 17%, with all regions experiencing currency depreciation, but most notably Brazil, which accounted for $40.1 million of the reduction. The underlying sales decline was primarily driven by $21.6 million of lower sales volume in Brazil, which declined due to the adverse economic conditions. Sales in Europe also declined, primarily due to lost placement. These declines were partially offset by increased pricing of 7% as we sought to recover foreign-exchange-related increases in our cost of products sold.
ACCO Brands International operating income decreased $22.1 million, or 35%, to $40.8 million from $62.9 million in the prior-year period, and operating income margin decreased to 9.6% from 11.5%. Foreign currency translation reduced operating income by $12.4 million, or 20%. The underlying decline in operating income and margin was primarily due to Brazil where we have experienced both lower sales volume and an unfavorable product mix as customers traded down to lower-price-point items. The decline was partially offset by price increases and a one-time $2.3 million recovery of an indirect tax in Brazil.
33
Computer Products Group
Computer Products Group net sales decreased $16.1 million, or 12%, to $120.2 million from $136.3 million in the prior-year period. Foreign currency translation reduced sales by $11.3 million, or 8%. The underlying sales decline was due to a $10 million reduction in our sales of tablet accessories, primarily resulting from our strategic decision to shift focus away from certain commoditized low margin products in this category. Sales of our security and laptop and desktop accessory products that collectively account for approximately 90% of our sales were up 5% compared to the prior year.
Computer Products Group operating income increased $2.1 million, or 26%, to $10.3 million from $8.2 million in the prior-year period, and operating margin increased to 8.6% from 6.0%. Foreign currency translation reduced operating income by $2.9 million, or 35%. The underlying operating income and margin increased as the cost associated with moving our business away from commoditized low margin tablet accessories was significantly lower and improved operational execution on our security and laptop accessory products resulted in a favorable product mix.
Liquidity and Capital Resources
Our primary liquidity needs are to service indebtedness, fund capital expenditures and support working capital requirements. Our principal sources of liquidity are cash flows from operating activities, cash and cash equivalents held and seasonal borrowings under our revolving credit facilities in effect from time to time. As of
December 31, 2016
, there were
$151.6 million
borrowings under our
$300.0 million
revolving credit facility and the amount available for borrowings was
$140.6 million
(allowing for
$7.8 million
of letters of credit outstanding on that date).
See "
Note 20. Subsequent Events
" to the consolidated financial statements contained in Item 8. of this report for details on the Company's refinancing associated with the Esselte Acquisition completed on
January 31, 2017
.
We maintain adequate financing arrangements at market rates. Because of the seasonality of our business, we typically generate much of our cash flow in the first, third and fourth quarters, as accounts receivables are collected, and we use cash in the second quarter to fund working capital in order to support the North America back-to-school season. Our Brazilian business is highly seasonal due to the timing of the back-to-school season, which coincides with the calendar year-end in the fourth quarter. Due to various tax laws, it is costly to transfer short-term working capital in and out of Brazil; therefore, our normal practice is to hold seasonal cash requirements in Brazil, and invest in short-term Brazilian government securities. Consolidated cash and cash equivalents was
$42.9 million
as of
December 31, 2016
, approximately $14.0 million of which was held in Brazil. Our priorities for all other cash flow use over the near term, after funding internal growth, is debt reduction.
Our senior secured credit facilities had a weighted average interest rate of
2.85%
as of
December 31, 2016
.
Debt Amendments and Refinancing
Senior Unsecured Notes
On December 22, 2016, the Company completed a private offering of $400.0 million in New Notes, which bear interest at 5.25%.
In addition, effective December 22, 2016, the Company irrevocably deposited with the trustee of its Existing Notes an amount necessary to pay the aggregate redemption price for the Existing Notes, and satisfied and discharged all its obligations related to the Existing Notes indenture. The Company borrowed
$73.9 million
under its revolving credit facility and applied the funds, together with the net proceeds from the issuance of the New Notes and cash on hand, toward the payment of the redemption price for all of the Existing Notes. The aggregate redemption price of
$531.5 million
consisted of principal due and payable on the Existing Notes, a "make-whole" call premium of
$25.0 million
(included in "
Other expense, net
"), and accrued and unpaid interest of
$6.5 million
(included in "
Interest expense
").
Also included in "
Other expense, net
" is a
$4.9 million
charge for the write-off of debt issuance costs associated with the Existing Notes. Additionally, we incurred and capitalized approximately
$6.1 million
in bank, legal and other fees associated with the issuance of the New Notes.
34
Second Amended and Restated Credit Agreement
During 2016, the Company’s credit facilities were governed by a Second Amended and Restated Credit Agreement, dated April 28, 2015 (as subsequently amended, the "2015 Credit Agreement"), among the Company, certain subsidiaries of the Company, Bank of America, N.A., as administrative agent, and the other agents and lenders party thereto. The
2015 Credit Agreement
provided for a
$600.0 million
five
-year senior secured credit facility, which consisted of a
$300.0 million
revolving credit facility (the "2015 Revolving Facility") and a
$300.0 million
term loan.
In connection with the PA Acquisition, effective May 1, 2016, the Company entered into a Second Amendment and Additional Borrower Consent, among the Company, certain guarantor subsidiaries of the Company, Bank of America, N.A., as administrative agent, and the other lenders party thereto, which amended the 2015 Credit Agreement. Among other things, the Second Amendment amended the 2015 Credit Agreement to include ACCO Brands Australia Holding Pty. Ltd. ("ACCO Australia") as a foreign borrower and, together with a related incremental joinder agreement, facilitated borrowings under the 2015 Credit Agreement by ACCO Australia.
On May 2, 2016, the Company completed the PA Acquisition. The purchase price, net of cash acquired was
$88.8 million
. The PA Acquisition was financed through borrowings under the 2015 Credit Agreement consisting of
A$100.0 million
(US
$76.6 million
based on May 2, 2016 exchange rates) in the form of an incremental Term A loan and additional borrowings of
A$152.0 million
(US
$116.4 million
based on May 2, 2016 exchange rates) under the Company’s revolving credit facility.
Loan Covenants
Under the
2015 Credit Agreement
, the Company was required to meet certain financial tests, including a maximum Consolidated Leverage Ratio (as defined in the
2015 Credit Agreement
) as determined by reference to the following ratio:
|
Period
|
Maximum Consolidated Leverage Ratio
(1)
|
|
|
July 1, 2015 and thereafter
|
3.75:1.00
|
|
|
(1)
|
The Consolidated Leverage Ratio is computed by dividing the Company's net funded indebtedness by the cumulative four-quarter-trailing EBITDA, which excludes transaction costs, restructuring and other charges up to certain limits as well as other adjustments defined in the
2015 Credit Agreement
.
|
The Credit Agreement also required the Company to maintain a Consolidated Fixed Charge Coverage Ratio (as defined in the
2015 Credit Agreement
) as of the end of any fiscal quarter at or above
1.25
to 1.00.
As of December 31, 2016, our Consolidated Leverage Ratio was approximately 2.5 to 1 and our Fixed Charge Coverage Ratio (as defined in the
2015 Credit Agreement
) was approximately 5.5 to 1. As of and for the period ended December 31, 2016, we were in compliance with all applicable loan covenants.
Third Amended and Restated Credit Agreement
Effective January 27, 2017, the Company entered into a Third Amended and Restated Credit Agreement (the "2017 Credit Agreement"), dated as of January 27, 2017, among the Company, certain subsidiaries of the Company, Bank of America, N.A., as administrative agent, and the other agents and various lenders party thereto. The 2017 Credit Agreement amended and restated the Company’s 2015 Credit Agreement.
The 2017 Credit Agreement provides a five-year senior secured credit facility, which consists of a
€300 million
(US
$320.8 million
) Euro denominated term loan facility (the "Euro Term Loan A"), an
A$80 million
(US
$60.4 million
) Australian Dollar denominated term loan facility (the "AUD Term Loan A"), and together with the Euro Term Loan A, the ("Term A Loan Facility"), and a
US$400 million
multi-currency revolving credit facility (the "2017 Revolving Facility"). At closing, additional borrowings under the 2017 Revolving Facility of
US$91.3 million
were applied toward, among other things, (i) the repayment of all outstanding U.S. Dollar denominated term loans under the 2015 Credit Agreement, (ii) the repayment of a portion of the Australian Dollar denominated term loans under the 2015 Credit Agreement, of which
A$80 million
(US
$60.4 million
) outstanding principal amount was continued under the AUD Term Loan A, and (iii) the payment of related financing fees and expenses. Immediately following the effective date of the 2017 Credit Agreement, approximately
US$156.7 million
was available for borrowing under the 2017 Revolving Facility.
35
Maturity and amortization
Borrowings under the 2017 Revolving Facility and the Term A Loan Facility mature on January 27, 2022. Amounts under the 2017 Revolving Facility are non-amortizing. Beginning June 30, 2017, the outstanding principal amounts under the Term A Loan Facility will be payable in quarterly installments in an amount representing, on an annual basis, 5.0% of the initial aggregate principal amount of such loan facility and increasing to 12.5% on an annual basis by June 30, 2020.
Interest rates
Amounts outstanding under the
2017 Credit Agreement
will bear interest at a rate per annum equal to the Eurodollar Rate, the Australian BBSR Rate, the Canadian BA Rate or the Base Rate, as applicable and as each such rate is defined in the 2017 Credit Agreement, plus an “applicable rate.” For the first fiscal quarter of 2017, the applicable rate will be 2.00% per annum for Eurodollar Rate Loans and Australian and Canadian denominated loans, and 1.00% per annum for Base Rate loans. Thereafter, the applicable rate applied to outstanding Eurodollar Rate loans, Australian and Canadian dollar denominated loans and Base Rate loans will be based on the Company’s Consolidated Leverage Ratio (as defined in the
2017 Credit Agreement
) as follows:
|
Consolidated
Leverage Ratio
|
Applicable Rate on Euro/AUD/CDN Dollar Loans
|
Applicable Rate on Base Rate Loans
|
||
|
> 4.00 to 1.00
|
2.50%
|
1.50%
|
||
|
≤ 4.00 to 1.00 and > 3.50 to 1.00
|
2.25%
|
1.25%
|
||
|
≤ 3.50 to 1.00 and > 3.00 to 1.00
|
2.00%
|
1.00%
|
||
|
≤ 3.00 to 1.00 and > 2.00 to 1.00
|
1.50%
|
0.50%
|
||
|
≤ 2.00 to 1.00
|
1.25%
|
0.25%
|
||
Undrawn amounts under the 2017 Revolving Facility are subject to a commitment fee rate of 0.25% to 0.40% per annum, depending on the Company’s Consolidated Leverage Ratio. At closing, the commitment fee rate was 0.35%.
Prepayments
Subject to certain conditions and specific exceptions, the
2017 Credit Agreement
requires the Company to prepay outstanding amounts under the
2017 Credit Agreement
under various circumstances, including (a) if sales or dispositions of certain property or assets in any fiscal year results in the receipt of net cash proceeds of $12.0 million, then an amount equal to 100% of the net cash proceeds received in excess of such $12.0 million, and (b) with respect to the AUD Term Loan A, in an amount equal to 100% of the net cash proceeds received from the disposition of any real property located in Australia. The Company also would be required to make prepayments in the event it receives amounts related to certain property insurance or condemnation awards, from additional debt other than debt permitted under the
2017 Credit Agreement
and from excess cash flow as determined under the
2017 Credit Agreement
. The
2017 Credit Agreement
also contains other customary prepayment obligations and provides for voluntary commitment reductions and prepayment of loans, subject to certain conditions and exceptions.
Dividends and share repurchases
Under the
2017 Credit Agreement
, the Company may pay dividends and/or repurchase shares in an aggregate amount not to exceed the sum of: (i) the greater of $30 million and 1.00% of the Company’s Consolidated Total Assets (as defined in the
2017 Credit Agreement
); plus (ii) an additional amount not to exceed $75 million in any fiscal year (provided the Company’s Consolidated Leverage Ratio after giving pro forma effect to the restricted payment would be greater than 2.50:1.00 and less than or equal to 3.75:1.00); plus (iii) an additional amount so long as the Consolidated Leverage Ratio after giving pro forma effect to the restricted payment would be less than or equal to 2.50:1.00; plus (iv) any Net Equity Proceeds (as defined in the
2017 Credit Agreement
).
Financial Covenants
The Company’s Consolidated Leverage Ratio as of the end of any fiscal quarter may not exceed 3.75:1.00; provided that following the consummation of certain material acquisitions, and as of the end of the fiscal quarter in which such material acquisition occurred and as of the end of the three fiscal quarters thereafter, the maximum Consolidated Leverage Ratio level above will increase by 0.50:1.00, provided that no more than one such increase can be in effect at any time.
36
The
2017 Credit Agreement
also required the Company to maintain a Consolidated Fixed Charge Coverage Ratio (as defined in the
2017 Credit Agreement
) as of the end of any fiscal quarter at or above
1.25
to 1.00.
Other Covenants and Restrictions
The
2017 Credit Agreement
contains customary affirmative and negative covenants as well as events of default, including payment defaults, breach of representations and warranties, covenant defaults, cross-defaults, certain bankruptcy or insolvency events, certain ERISA-related events, changes in control or ownership and invalidity of any loan document. The
2017 Credit Agreement
also establishes limitations on the aggregate amount of certain permitted acquisitions and investments that the Company and its subsidiaries may make during the term of the
2017 Credit Agreement
.
Guarantees and Security
Generally, obligations under the
2017 Credit Agreement
are guaranteed by certain of the Company’s existing and future subsidiaries, and are secured by substantially all of the Company’s and certain guarantor subsidiaries’ assets, subject to certain exclusions and limitations.
Incremental facilities
The
2017 Credit Agreement
permits the Company to seek increases in the size of the 2017 Revolving Facility and the Term A Facility prior to maturity by up to $500.0 million in the aggregate, subject to lender commitment and the conditions set forth in the
2017 Credit Agreement
.
Cash Flow
Fiscal
2016
versus Fiscal
2015
Cash Flow from Operating Activities
For the year ended
December 31, 2016
, cash provided by operating activities was
$165.9 million
, compared to cash provided by the prior-year operating activities of
$171.2 million
. Net income for
2016
was
$95.5 million
, compared to
$85.9 million
in
2015
.
The net operating cash inflow for the 2016 year of
$165.9 million
was generated by enhanced profitability across all operating segments, improved net working capital management (Accounts Receivable, Inventories, Accounts Payable) and incremental cash flow from the PA Acquisition. Cash outflows in 2016 included an accelerated interest payment of
$6.5 million
, in association with the early satisfaction and discharge of our $500 million principal amount of outstanding Senior Unsecured Notes due April 2020. Additionally,
$11.6 million
of cash payments were made related to transaction and integration costs associated with the Esselte Acquisition and the PA Acquisition. Accounts receivable contributed
$13.4 million
in 2016 due to improved management of year-end collections. Inventory provided cash of
$16.7 million
as a result of increased real-time inventory purchases earlier in the fourth quarter and improved forecasting, which also contributed to an increased use of cash for accounts payable, which was
$19.3 million
in 2016, compared to
$2.6 million
in the prior year. Partially offsetting the cash generated from operating profit and net working capital were significant cash payments related to the settlement of customer program liabilities, which were higher than the prior year due to changes in 2016 customer mix and increased settlements in early 2016 (related to higher year-end 2015 purchases by certain customers to achieve rebate levels). Outflows related to employee annual incentive payments made in the first quarter, underlying interest payments, income tax payments and restructuring cash payments were similar to those made during the prior year.
The table below shows our cash flow from accounts receivable, inventories and accounts payable for the years ended
December 31, 2016
and
2015
, respectively:
|
(in millions of dollars)
|
2016
|
2015
|
||||||
|
Accounts receivable
|
$
|
13.4
|
|
$
|
(3.9
|
)
|
||
|
Inventories
|
16.7
|
|
9.8
|
|
||||
|
Accounts payable
|
(19.3
|
)
|
(2.6
|
)
|
||||
|
Cash flow provided by net working capital
|
$
|
10.8
|
|
$
|
3.3
|
|
||
37
Cash Flow from Investing Activities
Cash used by investing activities was
$106.4 million
and
$24.6 million
for the
twelve
months ended
December 31, 2016
and
2015
, respectively. The 2016 cash outflow reflects
$88.8 million
of purchase price net of cash acquired to finance the PA Acquisition. See "
Note 3. Acquisition
" to the condensed consolidated financial statements contained in Part II of this report for details on the PA Acquisition. Capital expenditures were
$18.5 million
and
$27.6 million
for the
twelve
months ended
December 31, 2016
and
2015
, respectively. The lower expenditure in the current-year reflects lower spend on information technology resulting from the implementation of a new enterprise resource planning ("ERP") system in our European operations in the first quarter of 2016.
Cash Flow from Financing Activities
Cash used by financing activities was
$75.2 million
for the
twelve
months ended
December 31, 2016
, compared to a use of
$137.8 million
for the same period of
2015
. Cash used in 2016 reflected long-term borrowings of
$587.4 million
, consisting primarily of a private issuance of New Notes of
$400.0 million
and incremental Term A loan in the amount of
A$100.0 million
(
US$74.4 million
based on June 30, 2016 exchange rates), along with additional borrowings under the Company’s existing revolving facility, to fund the PA Acquisition. Repayments of long-term debt of
$685.1 million
primarily reflects the early satisfaction and discharge of our $500 million principal amount of Existing Notes, repayments totaling
$148.0 million
on the U.S. Dollar Senior Secured Term Loan A and payment of $24.5 million of debt assumed with the PA Acquisition. In 2016, we also made a "make-whole" call premium payment of
$25.0 million
and paid
$6.9 million
in debt issuance fees in connection with the New Notes. Cash used in 2015 reflected net repayments of long-term debt of $70.1 million and $65.9 million to repurchase the Company's common stock and for payments related to tax withholding for share-based compensation.
Fiscal 2015 versus Fiscal 2014
Cash Flow from Operating Activities
For the year ended December 31, 2015, cash provided by operating activities was $171.2 million, compared to the cash provided by the prior-year period of $171.7 million. Net income for 2015 was $85.9 million, compared to $91.6 million in 2014.
The net cash inflow for the 2015 year of $171.2 million was primarily generated by operating profits, and was only slightly less than the prior year 2014 despite lower earnings in our international businesses. While severe economic conditions in Brazil put pressure on working capital efficiency, improved working capital management in the U.S. and Europe overcame this effect. The net cash inflow from working capital (accounts receivable, inventories and accounts payable) was $3.3 million. Of this, cash sourced from inventory of $9.8 million reflects improved supply chain management in the U.S. and Europe and reduced fourth quarter inventory purchases. Cash used by accounts payable of $2.6 million reflects the lower inventory purchases, partially offset by extended payment terms. Accounts receivable used $3.9 million, down $24.3 million from the prior year, due to timing of year-end collections and the adverse effect of foreign exchange. Cash settlements of customer rebate program liabilities, although significant, were lower than the prior year due to lower sales and the effects of foreign exchange. Other significant cash outflow reductions in 2015 helped offset the effects of lower earnings and reduced contribution from working capital, including: cash restructuring payments in 2015 which were $6.7 million and lower than the $16.9 million in the prior-year period (as we complete payments associated with restructuring actions taken in prior years), income tax payments of $16.9 million which were lower than the $28.9 million paid in 2014 due to certain one-off payments in the U.S., cash contributions to the Company's post-retirement plans that were $7.1 million in 2015, compared to $12.4 million in 2014 due to reduced U.S. funding requirements and interest payments that were reduced $4.1 million to $41.0 million in 2015 from $45.1 million in the prior year due to lower debt and the benefit of refinancing.
The table below shows our cash flow from accounts receivable, inventories and accounts payable for the years ended December 31,
2015
and
2014
, respectively:
|
(in millions of dollars)
|
2015
|
2014
|
||||||
|
Accounts receivable
|
$
|
(3.9
|
)
|
$
|
20.4
|
|
||
|
Inventories
|
9.8
|
|
11.6
|
|
||||
|
Accounts payable
|
(2.6
|
)
|
(10.1
|
)
|
||||
|
Cash flow provided by net working capital
|
$
|
3.3
|
|
$
|
21.9
|
|
||
38
Cash Flow from Investing Activities
Cash used by investing activities was $24.6 million and $25.8 million for the years ended December 31, 2015 and 2014, respectively. Gross capital expenditures were $27.6 million and $29.6 million for the years ended December 31, 2015 and 2014, respectively, and continue to be information technology focused. Proceeds from the sale of properties and other assets were $2.8 million in 2015 primarily due to the sale of properties in the Czech Republic and Brazil, and $3.8 million in 2014 largely due to the sale of our East Texas, Pennsylvania facility.
Cash Flow from Financing Activities
Cash used by financing activities for the year ended December 31, 2015 and 2014 was $137.8 million and $142.0 million, respectively. Cash used in 2015 reflected net repayments of long-term debt of $70.1 million and $65.9 million to repurchase the Company's common stock and for payments related to tax withholding for share-based compensation. In 2014, net repayments of long-term debt were $121.1 million and $21.9 million was used to repurchase our Company's common stock and for payments related to tax withholding for share-based compensation.
Capitalization
The Company had
107.9 million
common shares outstanding as of
December 31, 2016
.
Adequacy of Liquidity Sources
Based on our
2017
business plan and current forecasts, we believe that cash flow from operations, our current cash balance and other sources of liquidity, including borrowings available under our 2017 Revolving Facility, will be adequate to support our requirements for working capital, capital expenditures and to service indebtedness for the foreseeable future. Our future operating performance is dependent on many factors, some of which are beyond our control, including prevailing economic, financial and industry conditions. For more information on these risks see "Part I, Item1A.
Risk Factors -
Our significant indebtedness requires us to dedicate a substantial portion of our cash flow to debt payments and limits our ability to engage in certain activities
"
Off-Balance-Sheet Arrangements and Contractual Financial Obligations
The Company does not have any material off-balance-sheet arrangements that have, or are reasonably likely to have, a current or future effect on our financial condition, revenues or expenses, results of operations, liquidity, capital expenditures or capital resources.
Our contractual obligations and related payments by period at
December 31, 2016
were as follows:
|
(in millions of dollars)
|
2017
|
2018 - 2019
|
2020 - 2021
|
Thereafter
|
Total
|
||||||||||||||
|
Debt
|
$
|
5.1
|
|
$
|
14.4
|
|
$
|
284.0
|
|
$
|
400.0
|
|
$
|
703.5
|
|
||||
|
Interest on debt
(1)
|
29.9
|
|
59.3
|
|
44.6
|
|
62.1
|
|
195.9
|
|
|||||||||
|
Operating lease obligations
|
22.2
|
|
35.1
|
|
27.3
|
|
15.8
|
|
100.4
|
|
|||||||||
|
Purchase obligations
(2)
|
84.8
|
|
0.7
|
|
—
|
|
—
|
|
85.5
|
|
|||||||||
|
Other long-term liabilities
(3)
|
10.7
|
|
2.0
|
|
1.8
|
|
4.4
|
|
18.9
|
|
|||||||||
|
Total
|
$
|
152.7
|
|
$
|
111.5
|
|
$
|
357.7
|
|
$
|
482.3
|
|
$
|
1,104.2
|
|
||||
|
(1)
|
Interest calculated at
December 31, 2016
rates for variable rate debt.
|
|
(2)
|
Purchase obligations primarily consist of contracts and non-cancelable purchase orders for raw materials and finished goods.
|
|
(3)
|
Other long-term liabilities consist of estimated expected employer contributions for 2017, along with estimated future payments, for pension and post-retirement plans that are not paid from assets held in a plan trust.
|
Due to the uncertainty with respect to the timing of future cash flows associated with our unrecognized tax benefits at
December 31, 2016
, we are unable to make reasonably reliable estimates of the period of cash settlement with the respective taxing authorities. Therefore,
$43.7 million
of unrecognized tax benefits have been excluded from the contractual obligations table above. See "
Note 11. Income Taxes
" to the consolidated financial statements contained in Item 8. of this report for a discussion on income taxes.
Critical Accounting Policies
39
Our financial statements are prepared in conformity with accounting principles generally accepted in the U.S. ("GAAP"). Preparation of our financial statements requires us to make judgments, estimates and assumptions that affect the amounts of actual assets, liabilities, revenues and expenses presented for each reporting period. Actual results could differ significantly from those estimates. We regularly review our assumptions and estimates, which are based on historical experience and, where appropriate, current business trends. We believe that the following discussion addresses our critical accounting policies, which require more significant, subjective and complex judgments to be made by our management.
Revenue Recognition
We recognize revenue from product sales when earned, net of applicable provisions for discounts, returns and allowances. We consider revenue to be realized or realizable and earned when all of the following criteria are met: title and risk of loss have passed to the customer, persuasive evidence of an arrangement exists, delivery has occurred, the price is fixed or determinable and collectability is reasonably assured. We also provide for our estimate of potential bad debt at the time of revenue recognition.
Customer Program Costs
Customer programs and incentives are a common practice in our industry. We incur customer program costs to obtain favorable product placement, to promote sell-through of products and to maintain competitive pricing. Customer program costs and incentives, including rebates, promotional funds and volume allowances, are accounted for as a reduction to gross sales. These costs are recorded at the time of sale based on management’s best estimates. Estimates are based on individual customer contracts and projected sales to the customer in comparison to any thresholds indicated by contract. In the absence of a signed contract, estimates are based on historical or projected experience for each program type or customer. Management periodically reviews accruals for these rebates and allowances, and adjusts accruals when circumstances indicate (typically as a result of a change in sales volume expectations or customer contracts).
Allowances for Doubtful Accounts and Sales Returns
Trade receivables are recorded at the stated amount, less allowances for discounts, doubtful accounts and returns. The allowance for doubtful accounts represents estimated uncollectible receivables associated with potential customer defaults on contractual obligations, usually due to customers’ potential insolvency. The allowance includes amounts for certain customers where a risk of default has been specifically identified. In addition, the allowance includes a provision for customer defaults on a general formula basis when it is determined the risk of some default is probable and estimable, but cannot yet be associated with specific customers. The assessment of the likelihood of customer defaults is based on various factors, including the length of time the receivables are past due, historical experience and existing economic conditions.
The allowance for sales returns represents estimated uncollectible receivables associated with the potential return of products previously sold to customers, and is recorded at the time that the sales are recognized. The allowance includes a general provision for product returns based on historical trends. In addition, the allowance includes a reserve for currently authorized customer returns that are considered to be abnormal in comparison to the historical basis.
Inventories
Inventories are priced at the lower of cost (principally first-in, first-out with minor amounts at average) or market. A reserve is established to adjust the cost of inventory to its net realizable value. Inventory reserves are recorded for obsolete or slow-moving inventory based on assumptions about future demand and marketability of products, the impact of new product introductions and specific identification of items, such as product discontinuance or engineering/material changes. These estimates could vary significantly, either favorably or unfavorably, from actual requirements if future economic conditions, customer inventory levels or competitive conditions differ from our expectations.
Long-Lived Assets
We test long-lived assets for impairment whenever events or changes in circumstances indicate that the assets’ carrying amount may not be recoverable from its undiscounted cash flow. When such events occur, we compare the sum of the undiscounted cash flow expected to result from the use and eventual disposition of the asset or asset group to the carrying amount of a long-lived asset or asset group. The cash flows are based on our best estimate at the time of future cash flow, derived from the most recent business projections. If this comparison indicates that there is an impairment, the amount of the impairment is typically calculated using discounted expected future cash flow. The discount rate applied to these cash flows is based on our weighted average cost of capital, computed by selecting market rates at the valuation dates for debt and equity that are reflective of the risks associated with an investment in our industry as estimated by using comparable publicly traded companies.
40
Intangible Assets
Intangible assets are comprised primarily of indefinite-lived and amortizable intangible assets acquired and arising from the application of purchase accounting. Indefinite-lived intangible assets are not amortized, but are evaluated at least annually to determine whether the indefinite useful life is appropriate. In addition, amortizable intangible assets other than goodwill are amortized over their useful lives. Certain of our trade names have been assigned an indefinite life as we currently anticipate that these trade names will contribute cash flows to ACCO Brands indefinitely.
We review indefinite-lived intangibles for impairment at least annually, normally in the second quarter, and whenever market or business events indicate there may be a potential adverse impact on a particular intangible. The review may be on a qualitative or quantitative basis as allowed by GAAP. We consider the implications of both external factors (e.g., market growth, pricing, competition, and technology) and internal factors (e.g., product costs, margins, support expenses, and capital investment) and their potential impact on cash flows for each business in both the near and long term, as well as their impact on any identifiable intangible asset associated with the business. Based on recent business results, consideration of significant external and internal factors, and the resulting business projections, indefinite-lived intangible assets are reviewed to determine whether they are likely to remain indefinite-lived, or whether a finite life is more appropriate. In addition, based on events in the period and future expectations, management considers whether the potential for impairment exists.
Finite lived intangibles are amortized over 10, 15, 23 or 30 years.
We performed our annual assessment, on a qualitative basis, as allowed by GAAP, for the majority of indefinite-lived trade names in the second quarter of
2016
and concluded that no impairment existed. For two of our indefinite-lived trade names that are not substantially above their carrying values, Mead
®
and Hilroy
®
, we performed quantitative tests (Step 1) in the second quarter of 2016. The following long-term growth rates and discount rates were used,
1.5%
and
10.0%
for Mead
®
, and
1.5%
and
10.5%
for Hilroy
®
, respectively.
We concluded that neither Mead
®
nor Hilroy
®
were impaired.
In the fourth quarter of 2015, we performed a quantitative test, as we identified the recession in Brazil as a triggering event related to our trade name, Tilibra
®
primarily used in Brazil. While we concluded that no impairment existed, the trade name's fair value has been significantly reduced. Key financial assumptions utilized to determine the fair value of Tilibra
®
included a long-term growth rate of 6.5% and a 14.5% discount rate. In 2016, the Tilibra
®
trade name slightly outperformed the forecast used in the fourth quarter of 2015 quantitative test; however, the economic conditions in Brazil could deteriorate further triggering additional future reviews.
The fair values of Mead
®
, Tilibra
®
and Hilroy
®
trade names are less than 30% above their carrying values. As of
December 31, 2016
the carrying values of those trade names were as follows: Mead
®
(
$113.3 million
), Tilibra
®
(
$63.0 million
) and Hilroy
®
(
$11.8 million
).
Goodwill
Goodwill has been recorded on our balance sheet and represents the excess of the cost of an acquisition when compared to the fair value of the net assets acquired. The authoritative guidance on goodwill and other intangible assets requires that goodwill be tested for impairment at a reporting unit level. We have determined that our reporting units are the ACCO Brands North America, ACCO Brands International and Computer Products Group segments.
We test goodwill for impairment at least annually and whenever events or circumstances make it more likely than not that an impairment may have occurred. As permitted by GAAP, we may perform a qualitative assessment to determine if it is more likely than not that the fair value of a reporting unit is less than its carrying amount as a basis for determining whether it is necessary to perform the two-step goodwill impairment test included in GAAP. Entities are not required to calculate the fair value of a reporting unit unless they determine that it is more likely than not that the fair value is less than the carrying amount. We performed our annual assessment in the second quarter of
2016
,
on a qualitative basis, and concluded that it was not more likely than not that the fair value of any reporting unit is less than its carrying amount.
If the qualitative assessment determines that it is more likely than not that the fair value of a reporting unit is less than its carrying amount, or if it is determined that a qualitative assessment is not appropriate, we move onto the two-step goodwill impairment test where we calculate the fair value of the reporting units. When applying a fair-value-based test the fair value of a reporting unit is compared to its carrying value. If the fair value of a reporting unit exceeds the carrying value of the net assets assigned to a reporting unit, goodwill is considered not impaired and no further testing is required. If the carrying value of the net assets assigned to a reporting unit exceeds the fair value of a
reporting unit, the second step of the impairment test is performed in order to determine the implied fair value of a reporting unit’s goodwill. Determining the implied fair value of goodwill requires
41
valuation of a reporting unit’s tangible and intangible assets and liabilities in a manner similar to the allocation of purchase price in a business combination. If the carrying value of a reporting unit’s goodwill exceeds its implied fair value, goodwill is deemed impaired and is written down to the extent of the difference.
Given the current economic environment and the uncertainties regarding their impact on our business, there can be no assurance that our estimates and assumptions made for purposes of our qualitative impairment testing during
2016
will prove to be accurate predictions of the future. If our assumptions regarding forecasted revenue or margin growth rates of certain reporting units are not achieved, we may be required to record impairment charges in future periods, whether in connection with our next annual impairment testing in the second quarter of fiscal year
2017
or prior to that, if a triggering event is identified outside of the quarter when the annual impairment test is performed. It is not possible at this time to determine if any such future impairment charge would result or, if it does, whether such charge would be material.
Employee Benefit Plans
We provide a range of benefits to our employees and retired employees, including pension, post-retirement, post-employment and health care benefits. We record annual amounts relating to these plans based on calculations specified by GAAP, which include various actuarial assumptions, including discount rates, assumed rates of return, compensation increases, turnover rates and health care cost trend rates. Actuarial assumptions are reviewed on an annual basis and modifications to these assumptions are made based on current rates and trends when it is deemed appropriate. As required by GAAP, the effect of our modifications are generally recorded and amortized over future periods.
We believe that the assumptions utilized in recording our obligations under the plans are reasonable based on our experience. The actuarial assumptions used to record our plan obligations could differ materially from actual results due to changing economic and market conditions, higher or lower withdrawal rates or other factors which may impact the amount of retirement-related benefit expense recorded by us in future periods.
The discount rate assumptions used to determine the pension and post-retirement obligations of the benefit plans are based on a spot-rate yield curve that matches projected future benefit payments with the appropriate interest rate applicable to the timing of the projected future benefit payments. The assumed discount rates reflect market rates for high-quality corporate bonds currently available. Our discount rates were determined by considering the average of pension yield curves constructed of a large population of high quality corporate bonds. The resulting discount rates reflect the matching of plan liability cash flows to the yield curves.
The expected long-term rate of return on plan assets reflects management’s expectations of long-term average rates of return on funds invested based on our investment profile to provide for benefits included in the projected benefit obligations. The expected return is based on the outlook for inflation, fixed income returns and equity returns, while also considering historical returns over the last 10 years, and asset allocation and investment strategy.
We estimate the service and interest components of net periodic benefit cost (income) for pension and post-retirement benefits utilizing a full yield curve approach in the estimation of these components by applying the specific spot rates along the yield curve used in the determination of the benefit obligation to the relevant projected cash flows.
At the end of each calendar year an actuarial evaluation is performed to determine the funded status of our pension and post-retirement obligations and any actuarial gain or loss is recognized in other comprehensive income (loss) and then amortized into the income statement in future periods.
Pension income was
$5.3 million
,
$5.1 million
and
$0.2 million
for the years ended
December 31, 2016
,
2015
and
2014
, respectively. The
$4.9 million
increase in pension income in
2015
compared to
2014
was primarily due to the change in the amortization of our net actuarial loss included in accumulated other comprehensive income (loss) for the U.S. Salaried Plan from the average remaining service period of active employees expected to receive benefits under the plan to the average remaining life expectancy of all participants (this change was the result of the Company's decision to permanently freeze the benefits under the plan) and lower interest costs due to lower average interest rates and the weakening of currencies relative to the U.S. dollar. Post-retirement income was
$0.7 million
,
$0.7 million
and
$0.5 million
for the years ended
December 31, 2016
,
2015
and
2014
, respectively.
42
The weighted average assumptions used to determine benefit obligations for the years ended
December 31, 2016
,
2015
, and
2014
were as follows:
|
Pension
|
Post-retirement
|
|||||||||||||||||||||||||
|
U.S.
|
International
|
|||||||||||||||||||||||||
|
2016
|
2015
|
2014
|
2016
|
2015
|
2014
|
2016
|
2015
|
2014
|
||||||||||||||||||
|
Discount rate
|
4.3
|
%
|
4.6
|
%
|
4.2
|
%
|
2.7
|
%
|
3.7
|
%
|
3.4
|
%
|
3.4
|
%
|
3.9
|
%
|
3.7
|
%
|
||||||||
|
Rate of compensation increase
|
N/A
|
|
N/A
|
|
N/A
|
|
3.1
|
%
|
3.0
|
%
|
3.3
|
%
|
N/A
|
|
N/A
|
|
N/A
|
|
||||||||
The weighted average assumptions used to determine net periodic benefit cost for the years ended December 31,
2016
,
2015
and
2014
were as follows:
|
Pension
|
Post-retirement
|
|||||||||||||||||||||||||
|
U.S.
|
International
|
|||||||||||||||||||||||||
|
2016
|
2015
|
2014
|
2016
|
2015
|
2014
|
2016
|
2015
|
2014
|
||||||||||||||||||
|
Discount rate
|
4.6
|
%
|
4.2
|
%
|
5.0
|
%
|
3.7
|
%
|
3.4
|
%
|
4.3
|
%
|
3.9
|
%
|
3.7
|
%
|
4.4
|
%
|
||||||||
|
Expected long-term rate of return
|
7.8
|
%
|
8.0
|
%
|
8.2
|
%
|
6.0
|
%
|
6.5
|
%
|
6.8
|
%
|
N/A
|
|
N/A
|
|
N/A
|
|
||||||||
|
Rate of compensation increase
|
N/A
|
|
N/A
|
|
N/A
|
|
3.0
|
%
|
3.0
|
%
|
3.3
|
%
|
N/A
|
|
N/A
|
|
N/A
|
|
||||||||
In
2017
, we expect pension income of approximately
$6.5 million
and post-retirement income of approximately
$0.2 million
. The estimated
$1.2 million
increase in pension income for
2017
compared to
2016
is primarily due to lower discount rates, which have reduced interest costs and have been partially offset by a reduction in the expected return on plan assets, primarily due to lowered expectations for our international pension plans.
A 25-basis point change (0.25%) in our discount rate assumption would lead to an increase or decrease in our pension and post-retirement expense of approximately
$0.03 million
for
2017
. A 25-basis point change (0.25%) in our long-term rate of return assumption would lead to an increase or decrease in pension and post-retirement expense of approximately
$1.2 million
for
2017
.
Pension and post-retirement liabilities of
$98.0 million
as of December 31,
2016
, increased from
$89.1 million
at December 31,
2015
,
primarily due to lower discount rates compared to prior year assumptions for the U.K. plan.
Income Taxes
Deferred tax liabilities or assets are established for temporary differences between financial and tax reporting bases and are subsequently adjusted to reflect changes in tax rates expected to be in effect when the temporary differences reverse. A valuation allowance is recorded to reduce deferred tax assets to an amount that is more likely than not to be realized. Facts and circumstances may change and cause us to revise the conclusions on our ability to realize certain net operating losses and other deferred tax attributes.
The amount of income taxes that we pay is subject to ongoing audits by federal, state and foreign tax authorities. Our estimate of the potential outcome of any uncertain tax position is subject to management’s assessment of relevant risks, facts and circumstances existing at that time. We believe that we have adequately provided for reasonably foreseeable outcomes related to these matters. However, our future results may include favorable or unfavorable adjustments to our estimated tax liabilities in the period the assessments are revised or resolved.
Deferred income taxes are not provided on certain undistributed earnings of foreign subsidiaries that are expected to be permanently reinvested in those companies, aggregating approximately
$555 million
and
$540 million
as of
December 31, 2016
and
2015
, respectively. If these amounts were distributed to the U.S., in the form of a dividend or otherwise, we would be subject to additional U.S. income taxes. Determination of the amount of unrecognized deferred income tax liabilities on these earnings is not practicable.
Recent Accounting Standards Updates and Recently Adopted Accounting Standards
For information on recent accounting pronouncements see "
Note 2. Significant Accounting Policies
" to the consolidated financial statements contained in Item 8. of this report.
43
ITEM 7A.
QUANTITATIVE AND QUALITATIVE DISCLOSURES ABOUT MARKET RISK
Our industry is concentrated in a small number of major customers, primarily large global and regional resellers of our products including traditional office supply resellers, wholesalers, on-line retailers and other retailers, such as mass merchandisers. Customer consolidation, shifts in the channels of distribution for our products and share growth of private-label products continue to increase pricing pressures, which may adversely affect margins for our competitors and us. We are addressing these challenges through design innovations, value-added features and services, as well as continued cost and asset reductions.
We are exposed to various market risks, including changes in foreign currency exchange rates and interest rate changes. We enter into financial instruments to manage and reduce the impact of these risks, not for trading or speculative purposes. The counterparties to these financial instruments are major financial institutions. See also "Item 1A.
Risk Factors.
"
Foreign Exchange Risk Management
We enter into forward foreign currency contracts to reduce the effect of fluctuating foreign currencies, primarily on foreign denominated inventory purchases and intercompany loans. The majority of the Company's exposure to local currency movements is in
Europe (both the Euro and the British pound), Australia, Canada, Brazil, Mexico and Japan
.
Principal currencies hedged include the U.S. dollar, Euro, Australian dollar, Canadian dollar, British pound and Japanese yen.
All of the existing foreign exchange contracts as of
December 31, 2016
have maturity dates in
2017
. Increases and decreases in the fair market values of the forward agreements are expected to be offset by gains/losses in recognized net underlying foreign currency transactions or loans. Notional amounts of outstanding foreign currency forward exchange contracts were
$128.6 million
and
$101.5 million
at
December 31, 2016
and
2015
, respectively. The net fair value of these foreign currency contracts was
$4.1 million
and
$2.2 million
at
December 31, 2016
and
2015
, respectively. At
December 31, 2016
, a 10% unfavorable exchange rate movement in our portfolio of foreign currency forward contracts would have reduced our unrealized gains by
$11.6 million
. Consistent with the use of these contracts to neutralize the effect of exchange rate fluctuations, such unrealized losses or gains would be offset by corresponding gains or losses, respectively, in the remeasurement of the underlying transactions being hedged. When taken together, we believe these forward contracts and the offsetting underlying commitments do not create material market risk.
For more information related to outstanding foreign currency forward exchange contracts see "
Note 13. Derivative Financial Instruments
" and "
Note 14. Fair Value of Financial Instruments
" to the consolidated financial statements contained in Item 8. of this report.
For our most recent acquisitions (the PA Acquisition and the Esselte Acquisition) we have taken on additional debt in the local currency of the targets to reduce our foreign exchange leverage risk. In the case of the PA Acquisition, which primarily conducts its business in the Australian dollar, we took on
A$100.0 million
in debt. For the Esselte Acquisition, completed on
January 31, 2017
, which primarily conducts its business in the Euro, we took on
€300.0 million
in debt. For more information see "
Note 3. Acquisition
", "
Note 4. Long-term Debt and Short-term Borrowings
," and "
Note 20. Subsequent Events
" to the consolidated financial statements contained in Item 8. of this report.
44
Interest Rate Risk Management
Amounts outstanding under the
2015 Credit Agreement
bore interest (i) in the case of Eurodollar loans, at a rate per annum equal to the Eurodollar rate (which is based on an average British Bankers Association Interest Settlement Rate) plus the applicable rate; (ii) in the case of loans made at the Base Rate (which means the highest of (a) the Bank of America, N.A. prime rate then in effect, (b) the Federal Funds effective rate then in effect plus ½ of 1.00% and (c) the Eurodollar rate that would be payable on such day for a Eurodollar loan with a one-month interest period plus 1.00%), at a rate per annum equal to the Base Rate plus the applicable rate; and (iii) in the case of swing line loans, at a rate per annum equal to the Base Rate plus the applicable rate. Separate base interest rate and applicable rate provisions applied for any Canadian or Australian currency denominated loans.
The applicable rate applied to outstanding Eurodollar loans and Base Rate loans was based on the Company’s Consolidated Leverage Ratio (as defined in the
2015 Credit Agreement
) as follows:
|
Consolidated
Leverage Ratio
|
Eurodollar Credit Spread
|
Base Rate Credit Spread
|
||
|
> 4.00 to 1.00
|
2.50%
|
1.50%
|
||
|
≤ 4.00 to 1.00 and > 3.50 to 1.00
|
2.25%
|
1.25%
|
||
|
≤ 3.50 to 1.00 and > 3.00 to 1.00
|
2.00%
|
1.00%
|
||
|
≤ 3.00 to 1.00 and > 2.00 to 1.00
|
1.50%
|
0.50%
|
||
|
≤ 2.00 to 1.00
|
1.25%
|
0.25%
|
||
Amounts outstanding under the
2017 Credit Agreement
will bear interest at a rate per annum equal to the Eurodollar Rate, the Australian BBSR Rate, the Canadian BA Rate or the Base Rate, as applicable and as each such rate is defined in the 2017 Credit Agreement, plus an “applicable rate.” For the first fiscal quarter of 2017, the applicable rate will be 2.00% per annum for Eurodollar Rate Loans and Australian and Canadian denominated loans, and 1.00% per annum for Base Rate loans. Thereafter, the applicable rate applied to outstanding Eurodollar Rate loans, Australian and Canadian dollar denominated loans and Base Rate loans will be based on the Company’s Consolidated Leverage Ratio (as defined in the
2017 Credit Agreement
) as follows:
|
Consolidated
Leverage Ratio
|
Applicable Rate on Euro/AUD/CDN Dollar Loans
|
Applicable Rate on Base Rate Loans
|
||
|
> 4.00 to 1.00
|
2.50%
|
1.50%
|
||
|
≤ 4.00 to 1.00 and > 3.50 to 1.00
|
2.25%
|
1.25%
|
||
|
≤ 3.50 to 1.00 and > 3.00 to 1.00
|
2.00%
|
1.00%
|
||
|
≤ 3.00 to 1.00 and > 2.00 to 1.00
|
1.50%
|
0.50%
|
||
|
≤ 2.00 to 1.00
|
1.25%
|
0.25%
|
||
The New Notes have a fixed interest rate and, accordingly, are not exposed to market risk resulting from changes in interest rates. However, the fair market value of our long-term fixed interest rate debt is subject to interest rate risk. Generally, the fair market value of fixed interest rate debt will increase as interest rates fall and decrease as interest rates rise. In addition, fair market values will also reflect the credit markets' view of credit risk spreads and our risk profile. These interest rate changes may affect the fair market value of our fixed interest rate debt and any repurchases of these New Notes, but do not impact our earnings or cash flows.
45
The following table summarizes information about our major debt components as of
December 31, 2016
, including the principal cash payments and interest rates.
Debt Obligations
|
Stated Maturity Date
|
|||||||||||||||||||||||||||||||
|
(in millions of dollars)
|
2017
|
2018
|
2019
|
2020
|
2021
|
Thereafter
|
Total
|
Fair Value
|
|||||||||||||||||||||||
|
Long term debt:
|
|||||||||||||||||||||||||||||||
|
Fixed rate Senior Unsecured Notes, due December 2024
|
$
|
—
|
|
$
|
—
|
|
$
|
—
|
|
$
|
—
|
|
$
|
—
|
|
$
|
400.0
|
|
$
|
400.0
|
|
$
|
405.0
|
|
|||||||
|
Fixed interest rate
|
|
|
|
|
|
|
|
|
|
|
5.25
|
%
|
|||||||||||||||||||
|
Variable rate U.S. Dollar Senior Secured Term Loan A, due April 2020
(1)
|
$
|
—
|
|
$
|
—
|
|
$
|
—
|
|
$
|
81.0
|
|
$
|
—
|
|
$
|
—
|
|
$
|
81.0
|
|
$
|
81.0
|
|
|||||||
|
Variable rate Australian Dollar Senior Secured Term Loan A, due April 2020
|
$
|
4.5
|
|
$
|
6.3
|
|
$
|
8.1
|
|
$
|
51.4
|
|
$
|
—
|
|
$
|
—
|
|
$
|
70.3
|
|
$
|
70.3
|
|
|||||||
|
Variable rate U.S. Dollar Senior Secured Revolving Credit Facility, due April 2020
|
$
|
—
|
|
$
|
—
|
|
$
|
—
|
|
$
|
63.7
|
|
$
|
—
|
|
$
|
—
|
|
$
|
63.7
|
|
$
|
63.7
|
|
|||||||
|
Variable rate Australian Dollar Senior Secured Revolving Credit Facility, due April 2020
|
$
|
—
|
|
$
|
—
|
|
$
|
—
|
|
$
|
87.9
|
|
$
|
—
|
|
$
|
—
|
|
$
|
87.9
|
|
$
|
87.9
|
|
|||||||
|
Average variable interest rate
(2)
|
2.85
|
%
|
2.85
|
%
|
2.85
|
%
|
2.85
|
%
|
|
|
|
|
|||||||||||||||||||
|
(1)
|
The required 2017, 2018 and 2019 principal cash payments were made in 2016.
|
|
(2)
|
Rates presented are as of
December 31, 2016
.
|
46
ITEM 8.
FINANCIAL STATEMENTS AND SUPPLEMENTARY DATA
INDEX TO CONSOLIDATED FINANCIAL STATEMENTS
|
Page
|
|
47
Report of Independent Registered Public Accounting Firm
The Board of Directors and Stockholders of ACCO Brands Corporation:
We have audited the accompanying consolidated balance sheets of ACCO Brands Corporation and subsidiaries as of December 31, 2016 and 2015, and the related consolidated statements of income, comprehensive income (loss), stockholders’ equity, and cash flows for each of the years in the three-year period ended December 31, 2016. In connection with our audits of the consolidated financial statements, we also audited financial statement schedule, Schedule II - Valuation and Qualifying Accounts and Reserves. We also have audited ACCO Brands Corporation’s internal control over financial reporting as of December 31, 2016, based on criteria established in
Internal Control - Integrated Framework
(2013)
issued by the Committee of Sponsoring Organizations of the Treadway Commission (COSO). ACCO Brands Corporation’s management is responsible for these consolidated financial statements and the financial statement schedule, for maintaining effective internal control over financial reporting, and for its assessment of the effectiveness of internal control over financial reporting, included in the accompanying Management’s Report on Internal Control over Financial Reporting. Our responsibility is to express an opinion on these consolidated financial statements and financial statement schedule and an opinion on the company’s internal control over financial reporting based on our audits.
We conducted our audits in accordance with the standards of the Public Company Accounting Oversight Board (United States). Those standards require that we plan and perform the audits to obtain reasonable assurance about whether the financial statements are free of material misstatement and whether effective internal control over financial reporting was maintained in all material respects. Our audits of the consolidated financial statements included examining, on a test basis, evidence supporting the amounts and disclosures in the financial statements, assessing the accounting principles used and significant estimates made by management, and evaluating the overall financial statement presentation. Our audit of internal control over financial reporting included obtaining an understanding of internal control over financial reporting, assessing the risk that a material weakness exists, and testing and evaluating the design and operating effectiveness of internal control based on the assessed risk. Our audits also included performing such other procedures as we considered necessary in the circumstances. We believe that our audits provide a reasonable basis for our opinions.
A company’s internal control over financial reporting is a process designed to provide reasonable assurance regarding the reliability of financial reporting and the preparation of financial statements for external purposes in accordance with generally accepted accounting principles. A company’s internal control over financial reporting includes those policies and procedures that (1) pertain to the maintenance of records that, in reasonable detail, accurately and fairly reflect the transactions and dispositions of the assets of the company; (2) provide reasonable assurance that transactions are recorded as necessary to permit preparation of financial statements in accordance with generally accepted accounting principles, and that receipts and expenditures of the company are being made only in accordance with authorizations of management and directors of the company; and (3) provide reasonable assurance regarding prevention or timely detection of unauthorized acquisition, use, or disposition of the company’s assets that could have a material effect on the financial statements.
Because of its inherent limitations, internal control over financial reporting may not prevent or detect misstatements. Also, projections of any evaluation of effectiveness to future periods are subject to the risk that controls may become inadequate because of changes in conditions, or that the degree of compliance with the policies or procedures may deteriorate.
In our opinion, the consolidated financial statements referred to above present fairly, in all material respects, the financial position of ACCO Brands Corporation and subsidiaries as of December 31, 2016 and 2015, and the results of its operations and its cash flows for each of the years in the three-year period ended December 31, 2016, in conformity with U.S. generally accepted accounting principles. Also in our opinion, the related financial statement schedule, when considered in relation to the basic consolidated financial statements taken as a whole, presents fairly, in all material respects, the information set forth therein. Also in our opinion, ACCO Brands Corporation maintained, in all material respects, effective internal control over financial reporting as of December 31, 2016, based on criteria established in
Internal Control - Integrated Framework (2013)
issued by the Committee of Sponsoring Organizations of the Treadway Commission (COSO).
ACCO Brands Corporation acquired Australia Stationary Industries, Inc. (PA Acquisition) during 2016, and management excluded from its assessment of the effectiveness of ACCO Brands Corporation’s internal control over financial reporting as of December 31, 2016, PA Acquisition’s internal control over financial reporting associated with total assets of $70.4 million and total net sales of $78.5 million included in the consolidated financial statements of ACCO Brands Corporation and subsidiaries as of and for the year ended December 31, 2016. Our audit of internal control over financial reporting of ACCO Brands Corporation also excluded an evaluation of the internal control over financial reporting of PA Acquisition.
/s/ KPMG LLP
Chicago, Illinois
February 27, 2017
48
ACCO Brands Corporation and Subsidiaries
Consolidated Balance Sheets
|
(in millions of dollars, except share data)
|
December 31, 2016
|
December 31, 2015
|
|||||
|
Assets
|
|||||||
|
Current assets:
|
|||||||
|
Cash and cash equivalents
|
$
|
42.9
|
|
$
|
55.4
|
|
|
|
Accounts receivable less allowances for discounts, doubtful accounts and sales returns of $15.7 and $18.7, respectively
|
391.0
|
|
369.3
|
|
|||
|
Inventories
|
210.0
|
|
203.6
|
|
|||
|
Other current assets
|
26.8
|
|
25.3
|
|
|||
|
Total current assets
|
670.7
|
|
653.6
|
|
|||
|
Total property, plant and equipment
|
528.0
|
|
526.1
|
|
|||
|
Less: accumulated depreciation
|
(329.6
|
)
|
(317.0
|
)
|
|||
|
Property, plant and equipment, net
|
198.4
|
|
209.1
|
|
|||
|
Deferred income taxes
|
27.3
|
|
25.1
|
|
|||
|
Goodwill
|
587.1
|
|
496.9
|
|
|||
|
Identifiable intangibles, net of accumulated amortization of $167.1 and $169.3, respectively
|
565.7
|
|
520.9
|
|
|||
|
Other non-current assets
|
15.3
|
|
47.8
|
|
|||
|
Total assets
|
$
|
2,064.5
|
|
$
|
1,953.4
|
|
|
|
Liabilities and Stockholders' Equity
|
|||||||
|
Current liabilities:
|
|||||||
|
Notes payable
|
$
|
63.7
|
|
$
|
—
|
|
|
|
Current portion of long-term debt
|
4.8
|
|
—
|
|
|||
|
Accounts payable
|
135.1
|
|
147.6
|
|
|||
|
Accrued compensation
|
42.8
|
|
34.0
|
|
|||
|
Accrued customer program liabilities
|
94.0
|
|
108.7
|
|
|||
|
Accrued interest
|
1.3
|
|
6.3
|
|
|||
|
Other current liabilities
|
64.7
|
|
58.7
|
|
|||
|
Total current liabilities
|
406.4
|
|
355.3
|
|
|||
|
Long-term debt, net of debt issuance costs of $7.3 and $8.5, respectively
|
627.7
|
|
720.5
|
|
|||
|
Deferred income taxes
|
146.7
|
|
142.3
|
|
|||
|
Pension and post-retirement benefit obligations
|
98.0
|
|
89.1
|
|
|||
|
Other non-current liabilities
|
77.0
|
|
65.0
|
|
|||
|
Total liabilities
|
1,355.8
|
|
1,372.2
|
|
|||
|
Stockholders' equity:
|
|||||||
|
Preferred stock, $0.01 par value, 25,000,000 shares authorized; none issued and outstanding
|
—
|
|
—
|
|
|||
|
Common stock, $0.01 par value, 200,000,000 shares authorized; 110,086,283 and 107,129,051 shares issued and 107,906,644 and 105,640,003 outstanding, respectively
|
1.1
|
|
1.1
|
|
|||
|
Treasury stock, 2,179,639 and 1,489,048 shares, respectively
|
(17.0
|
)
|
(11.8
|
)
|
|||
|
Paid-in capital
|
2,015.7
|
|
1,988.3
|
|
|||
|
Accumulated other comprehensive loss
|
(419.4
|
)
|
(429.2
|
)
|
|||
|
Accumulated deficit
|
(871.7
|
)
|
(967.2
|
)
|
|||
|
Total stockholders' equity
|
708.7
|
|
581.2
|
|
|||
|
Total liabilities and stockholders' equity
|
$
|
2,064.5
|
|
$
|
1,953.4
|
|
|
See notes to consolidated financial statements.
49
ACCO Brands Corporation and Subsidiaries
Consolidated Statements of Income
|
Year Ended December 31,
|
|||||||||||
|
(in millions of dollars, except per share data)
|
2016
|
2015
|
2014
|
||||||||
|
Net sales
|
$
|
1,557.1
|
|
$
|
1,510.4
|
|
$
|
1,689.2
|
|
||
|
Cost of products sold
|
1,042.0
|
|
1,032.0
|
|
1,159.3
|
|
|||||
|
Gross profit
|
515.1
|
|
478.4
|
|
529.9
|
|
|||||
|
Operating costs and expenses:
|
|||||||||||
|
Advertising, selling, general and administrative expenses
|
320.8
|
|
295.7
|
|
328.6
|
|
|||||
|
Amortization of intangibles
|
21.6
|
|
19.6
|
|
22.2
|
|
|||||
|
Restructuring charges (credits)
|
5.4
|
|
(0.4
|
)
|
5.5
|
|
|||||
|
Total operating costs and expenses
|
347.8
|
|
314.9
|
|
356.3
|
|
|||||
|
Operating income
|
167.3
|
|
163.5
|
|
173.6
|
|
|||||
|
Non-operating expense (income):
|
|||||||||||
|
Interest expense
|
49.3
|
|
44.5
|
|
49.5
|
|
|||||
|
Interest income
|
(6.4
|
)
|
(6.6
|
)
|
(5.6
|
)
|
|||||
|
Equity in earnings of joint-venture
|
(2.1
|
)
|
(7.9
|
)
|
(8.1
|
)
|
|||||
|
Other expense, net
|
1.4
|
|
2.1
|
|
0.8
|
|
|||||
|
Income before income tax
|
125.1
|
|
131.4
|
|
137.0
|
|
|||||
|
Income tax expense
|
29.6
|
|
45.5
|
|
45.4
|
|
|||||
|
Net income
|
$
|
95.5
|
|
$
|
85.9
|
|
$
|
91.6
|
|
||
|
Per share:
|
|||||||||||
|
Basic income per share
|
$
|
0.89
|
|
$
|
0.79
|
|
$
|
0.81
|
|
||
|
Diluted income per share
|
$
|
0.87
|
|
$
|
0.78
|
|
$
|
0.79
|
|
||
|
Weighted average number of shares outstanding:
|
|||||||||||
|
Basic
|
107.0
|
|
108.8
|
|
113.7
|
|
|||||
|
Diluted
|
109.2
|
|
110.6
|
|
116.3
|
|
|||||
See notes to consolidated financial statements.
50
ACCO Brands Corporation and Subsidiaries
Consolidated Statements of Comprehensive Income (Loss)
|
Year Ended December 31,
|
|||||||||||
|
(in millions of dollars)
|
2016
|
2015
|
2014
|
||||||||
|
Net income
|
$
|
95.5
|
|
$
|
85.9
|
|
$
|
91.6
|
|
||
|
Other comprehensive income (loss), net of tax:
|
|||||||||||
|
Unrealized gain (loss) on derivative instruments, net of tax (expense) benefit of $(0.7), $0.8, and $(1.0), respectively
|
1.7
|
|
(1.9
|
)
|
2.4
|
|
|||||
|
Foreign currency translation adjustments
|
16.8
|
|
(136.7
|
)
|
(76.4
|
)
|
|||||
|
Recognition of deferred pension and other post-retirement items, net of tax benefit of $0.6, $0.1, and $15.9, respectively
|
(8.7
|
)
|
2.0
|
|
(33.0
|
)
|
|||||
|
Other comprehensive income (loss), net of tax
|
9.8
|
|
(136.6
|
)
|
(107.0
|
)
|
|||||
|
Comprehensive income (loss)
|
$
|
105.3
|
|
$
|
(50.7
|
)
|
$
|
(15.4
|
)
|
||
See notes to consolidated financial statements.
51
ACCO Brands Corporation and Subsidiaries
|
Year Ended December 31,
|
|||||||||||
|
(in millions of dollars)
|
2016
|
2015
|
2014
|
||||||||
|
Operating activities
|
|||||||||||
|
Net income
|
$
|
95.5
|
|
$
|
85.9
|
|
$
|
91.6
|
|
||
|
Gain on revaluation of previously held joint-venture equity interest
|
(28.9
|
)
|
—
|
|
—
|
|
|||||
|
Amortization of inventory step-up
|
0.4
|
|
—
|
|
—
|
|
|||||
|
(Loss) gain on disposal of assets
|
(0.3
|
)
|
0.1
|
|
0.8
|
|
|||||
|
Deferred income tax expense
|
6.0
|
|
27.4
|
|
20.6
|
|
|||||
|
Depreciation
|
30.4
|
|
32.4
|
|
35.3
|
|
|||||
|
Amortization of debt issuance costs
|
3.8
|
|
3.5
|
|
4.6
|
|
|||||
|
Amortization of intangibles
|
21.6
|
|
19.6
|
|
22.2
|
|
|||||
|
Stock-based compensation
|
19.4
|
|
16.0
|
|
15.7
|
|
|||||
|
Loss on debt extinguishment
|
29.9
|
|
1.9
|
|
—
|
|
|||||
|
Other non-cash charges
|
0.1
|
|
—
|
|
0.7
|
|
|||||
|
Equity in earnings of joint-venture, net of dividends received
|
(1.6
|
)
|
(3.8
|
)
|
(2.4
|
)
|
|||||
|
Changes in balance sheet items:
|
|||||||||||
|
Accounts receivable
|
13.4
|
|
(3.9
|
)
|
20.4
|
|
|||||
|
Inventories
|
16.7
|
|
9.8
|
|
11.6
|
|
|||||
|
Other assets
|
5.5
|
|
1.2
|
|
(6.1
|
)
|
|||||
|
Accounts payable
|
(19.3
|
)
|
(2.6
|
)
|
(10.1
|
)
|
|||||
|
Accrued expenses and other liabilities
|
(31.2
|
)
|
(19.2
|
)
|
(28.9
|
)
|
|||||
|
Accrued income taxes
|
4.5
|
|
2.9
|
|
(4.3
|
)
|
|||||
|
Net cash provided by operating activities
|
165.9
|
|
171.2
|
|
171.7
|
|
|||||
|
Investing activities
|
|||||||||||
|
Additions to property, plant and equipment
|
(18.5
|
)
|
(27.6
|
)
|
(29.6
|
)
|
|||||
|
Proceeds from the disposition of assets
|
0.7
|
|
2.8
|
|
3.8
|
|
|||||
|
Cost of acquisitions, net of cash acquired
|
(88.8
|
)
|
—
|
|
—
|
|
|||||
|
Other
|
0.2
|
|
0.2
|
|
—
|
|
|||||
|
Net cash used by investing activities
|
(106.4
|
)
|
(24.6
|
)
|
(25.8
|
)
|
|||||
|
Financing activities
|
|||||||||||
|
Proceeds from long-term borrowings
|
587.4
|
|
300.0
|
|
—
|
|
|||||
|
Repayments of long-term debt
|
(685.1
|
)
|
(370.1
|
)
|
(121.1
|
)
|
|||||
|
Borrowings (repayments) of notes payable, net
|
51.5
|
|
(0.8
|
)
|
1.0
|
|
|||||
|
Payment for debt premium
|
(25.0
|
)
|
—
|
|
—
|
|
|||||
|
Payments for debt issuance costs
|
(6.9
|
)
|
(1.7
|
)
|
(0.3
|
)
|
|||||
|
Repurchases of common stock
|
—
|
|
(60.0
|
)
|
(19.4
|
)
|
|||||
|
Payments related to tax withholding for share-based compensation
|
(5.1
|
)
|
(5.9
|
)
|
(2.5
|
)
|
|||||
|
Excess tax benefit from stock-based compensation
|
1.2
|
|
—
|
|
—
|
|
|||||
|
Proceeds from the exercise of stock options
|
6.8
|
|
0.7
|
|
0.3
|
|
|||||
|
Net cash used by financing activities
|
(75.2
|
)
|
(137.8
|
)
|
(142.0
|
)
|
|||||
|
Effect of foreign exchange rate changes on cash and cash equivalents
|
3.2
|
|
(6.6
|
)
|
(4.2
|
)
|
|||||
|
Net (decrease) increase in cash and cash equivalents
|
(12.5
|
)
|
2.2
|
|
(0.3
|
)
|
|||||
|
Cash and cash equivalents
|
|||||||||||
|
Beginning of the period
|
55.4
|
|
53.2
|
|
53.5
|
|
|||||
|
End of the period
|
$
|
42.9
|
|
$
|
55.4
|
|
$
|
53.2
|
|
||
|
Cash paid during the year for:
|
|||||||||||
|
Interest
|
$
|
50.1
|
|
$
|
41.0
|
|
$
|
45.1
|
|
||
|
Income taxes
|
$
|
16.9
|
|
$
|
16.9
|
|
$
|
28.9
|
|
||
See notes to consolidated financial statements.
52
ACCO Brands Corporation and Subsidiaries
Consolidated Statements of Stockholders’ Equity
|
(in millions of dollars)
|
Common
Stock |
Paid-in
Capital |
Accumulated
Other Comprehensive Income (Loss) |
Treasury
Stock |
Accumulated
Deficit |
Total
|
|||||||||||||||||
|
Balance at December 31, 2013
|
$
|
1.1
|
|
$
|
2,035.0
|
|
$
|
(185.6
|
)
|
$
|
(3.5
|
)
|
$
|
(1,144.7
|
)
|
$
|
702.3
|
|
|||||
|
Net income
|
—
|
|
—
|
|
—
|
|
—
|
|
91.6
|
|
91.6
|
|
|||||||||||
|
Income on derivative financial instruments, net of tax
|
—
|
|
—
|
|
2.4
|
|
—
|
|
—
|
|
2.4
|
|
|||||||||||
|
Translation impact
|
—
|
|
—
|
|
(76.4
|
)
|
—
|
|
—
|
|
(76.4
|
)
|
|||||||||||
|
Pension and post-retirement adjustment, net of tax
|
—
|
|
—
|
|
(33.0
|
)
|
—
|
|
—
|
|
(33.0
|
)
|
|||||||||||
|
Common stock repurchases
|
—
|
|
(19.4
|
)
|
—
|
|
—
|
|
—
|
|
(19.4
|
)
|
|||||||||||
|
Stock-based compensation
|
—
|
|
15.7
|
|
—
|
|
—
|
|
—
|
|
15.7
|
|
|||||||||||
|
Common stock issued, net of shares withheld for employee taxes
|
—
|
|
0.3
|
|
—
|
|
(2.5
|
)
|
—
|
|
(2.2
|
)
|
|||||||||||
|
Other
|
—
|
|
(0.1
|
)
|
—
|
|
0.1
|
|
—
|
|
—
|
|
|||||||||||
|
Balance at December 31, 2014
|
1.1
|
|
2,031.5
|
|
(292.6
|
)
|
(5.9
|
)
|
(1,053.1
|
)
|
681.0
|
|
|||||||||||
|
Net income
|
—
|
|
—
|
|
—
|
|
—
|
|
85.9
|
|
85.9
|
|
|||||||||||
|
Loss on derivative financial instruments, net of tax
|
—
|
|
—
|
|
(1.9
|
)
|
—
|
|
—
|
|
(1.9
|
)
|
|||||||||||
|
Translation impact
|
—
|
|
—
|
|
(136.7
|
)
|
—
|
|
—
|
|
(136.7
|
)
|
|||||||||||
|
Pension and post-retirement adjustment, net of tax
|
—
|
|
—
|
|
2.0
|
|
—
|
|
—
|
|
2.0
|
|
|||||||||||
|
Common stock repurchases
|
(0.1
|
)
|
(59.9
|
)
|
—
|
|
—
|
|
—
|
|
(60.0
|
)
|
|||||||||||
|
Stock-based compensation
|
—
|
|
16.0
|
|
—
|
|
—
|
|
—
|
|
16.0
|
|
|||||||||||
|
Common stock issued, net of shares withheld for employee taxes
|
—
|
|
0.7
|
|
—
|
|
(5.9
|
)
|
—
|
|
(5.2
|
)
|
|||||||||||
|
Other
|
0.1
|
|
—
|
|
—
|
|
—
|
|
—
|
|
0.1
|
|
|||||||||||
|
Balance at December 31, 2015
|
1.1
|
|
1,988.3
|
|
(429.2
|
)
|
(11.8
|
)
|
(967.2
|
)
|
581.2
|
|
|||||||||||
|
Net income
|
—
|
|
—
|
|
—
|
|
—
|
|
95.5
|
|
95.5
|
|
|||||||||||
|
Income on derivative financial instruments, net of tax
|
—
|
|
—
|
|
1.7
|
|
—
|
|
—
|
|
1.7
|
|
|||||||||||
|
Translation impact
|
—
|
|
—
|
|
16.8
|
|
—
|
|
—
|
|
16.8
|
|
|||||||||||
|
Pension and post-retirement adjustment, net of tax
|
—
|
|
—
|
|
(8.7
|
)
|
—
|
|
—
|
|
(8.7
|
)
|
|||||||||||
|
Stock-based compensation
|
—
|
|
19.4
|
|
—
|
|
—
|
|
—
|
|
19.4
|
|
|||||||||||
|
Common stock issued, net of shares withheld for employee taxes
|
—
|
|
6.8
|
|
—
|
|
(5.2
|
)
|
—
|
|
1.6
|
|
|||||||||||
|
Excess tax benefit on stock-based compensation
|
—
|
|
1.2
|
|
—
|
|
—
|
|
—
|
|
1.2
|
|
|||||||||||
|
Balance at December 31, 2016
|
$
|
1.1
|
|
$
|
2,015.7
|
|
$
|
(419.4
|
)
|
$
|
(17.0
|
)
|
$
|
(871.7
|
)
|
$
|
708.7
|
|
|||||
Shares of Capital Stock
|
Common
Stock |
Treasury
Stock |
Net
Shares |
||||||
|
Shares at December 31, 2013
|
114,056,416
|
|
392,560
|
|
113,663,856
|
|
||
|
Common stock issued, net of shares withheld for employee taxes
|
1,369,740
|
|
366,664
|
|
1,003,076
|
|
||
|
Common stock repurchases
|
(2,755,642
|
)
|
—
|
|
(2,755,642
|
)
|
||
|
Shares at December 31, 2014
|
112,670,514
|
|
759,224
|
|
111,911,290
|
|
||
|
Common stock issued, net of shares withheld for employee taxes
|
2,149,165
|
|
729,824
|
|
1,419,341
|
|
||
|
Common stock repurchases
|
(7,690,628
|
)
|
—
|
|
(7,690,628
|
)
|
||
|
Shares at December 31, 2015
|
107,129,051
|
|
1,489,048
|
|
105,640,003
|
|
||
|
Common stock issued, net of shares withheld for employee taxes
|
2,957,232
|
|
690,591
|
|
2,266,641
|
|
||
|
Shares at December 31, 2016
|
110,086,283
|
|
2,179,639
|
|
107,906,644
|
|
||
See notes to consolidated financial statements.
53
ACCO Brands Corporation and Subsidiaries
Notes to Consolidated Financial Statements
1. Basis of Presentation
As used in this Annual Report on Form 10-K for the fiscal year ended
December 31, 2016
, the terms "ACCO Brands," "ACCO," the "Company," "we," "us," and "our" refer to ACCO Brands Corporation, a Delaware corporation incorporated in 2005, and its consolidated domestic and international subsidiaries.
The management of ACCO Brands Corporation is responsible for the accuracy and internal consistency of the preparation of the consolidated financial statements and notes contained in this Annual Report on Form 10-K.
The consolidated financial statements include the accounts of ACCO Brands Corporation and its domestic and international subsidiaries. Intercompany accounts and transactions have been eliminated in consolidation. Our investments in companies that are between 20% and 50% owned are accounted for using the equity method of accounting. ACCO Brands had an equity investment in the following joint-venture: Pelikan Artline Pty Ltd -
50%
ownership until May 2, 2016, at which time the company owned
100%
. Our share of earnings from equity investments is included on the line entitled "
Equity in earnings of joint-venture
" in the
Consolidated Statements of Income
.
On May 2, 2016, the Company completed the acquisition of Australia Stationery Industries, Inc. (the "PA Acquisition"), which indirectly owned the
50%
of the Pelikan Artline joint-venture and the issued capital stock of Pelikan Artline Pty Limited (collectively, the "Pelikan Artline") that was not already owned by the Company. Prior to the PA Acquisition, the Pelikan Artline joint-venture was accounted for under the equity method. Accordingly, the results of the Pelikan Artline joint-venture are included in the Company's condensed consolidated financial statements and will be reported in the ACCO Brands International segment from the date of the PA Acquisition, May 2, 2016. See "
Note 3. Acquisition
" for details on the PA Acquisition and see "
Note 17. Joint-Venture Investment
" for details on the joint-venture.
The preparation of financial statements in conformity with generally accepted accounting principles in the U.S. ("GAAP") requires management to make certain estimates and assumptions that affect the reported assets and liabilities at the date of the financial statements and the reported revenues and expenses during the reporting periods. Actual results could differ from those estimates.
2. Significant Accounting Policies
Nature of Business
ACCO Brands is primarily involved in the manufacturing, marketing and distribution of office products, school products and accessories for laptop and desktop computers and tablets. We sell primarily to large resellers, and our subsidiaries operate principally in the United States, Northern Europe, Australia, Canada, Brazil and Mexico.
The majority of our office products, such as stapling, binding and laminating equipment and related consumable supplies, shredders and whiteboards, are used by businesses. Most of these end-users purchase their products from our customers, which include traditional office supply resellers, wholesalers and other retailers, including on-line retailers. We supply some of our products directly to large commercial and industrial end-users, and provide business machine maintenance and certain repair services. Additionally, we supply some similar private label products.
Our academic products include notebooks, folders, decorative calendars and stationery products. We distribute our academic products primarily through mass merchandisers and other retailers, such as grocery, drug and office superstores, as well as on-line retailers. We also distribute to small independent retailers in emerging markets and supply some private label academic products.
Our calendar products are sold through all the same channels where we sell business or academic products, as well as directly to consumers, both on-line and through direct mail.
Our Computer Products Group designs, sources, distributes, markets and sells accessories for laptop and desktop computers and tablets. These accessories primarily include security products, input devices such as presenters, mice and trackballs, ergonomic aids such as foot and wrist rests, docking stations, and other PC and tablet accessories.
54
ACCO Brands Corporation and Subsidiaries
Notes to Consolidated Financial Statements (Continued)
Use of Estimates
The preparation of financial statements in conformity with GAAP requires management to make estimates and assumptions that affect the reported amounts of assets and liabilities and the disclosure of contingent assets and liabilities at the date of the financial statements, and the reported amounts of revenues and expenses during the reporting period. Actual results could differ from these estimates.
Cash and Cash Equivalents
Highly liquid investments with an original maturity of three months or less are included in cash and cash equivalents.
Allowances for Doubtful Accounts, Discounts and Returns
Trade receivables are recorded at the stated amount, less allowances for discounts, doubtful accounts and returns. The allowance for doubtful accounts represents estimated uncollectible receivables associated with potential customer defaults on contractual obligations, usually due to customers’ potential insolvency. The allowance includes amounts for certain customers where a risk of default has been specifically identified. In addition, the allowance includes a provision for customer defaults on a general formula basis when it is determined the risk of some default is probable and estimable, but cannot yet be associated with specific customers. The assessment of the likelihood of customer defaults is based on various factors, including the length of time the receivables are past due, historical experience and existing economic conditions.
The allowance for sales returns represents estimated uncollectible receivables associated with the potential return of products previously sold to customers, and is recorded at the time that the sales are recognized. The allowance includes a general provision for product returns based on historical trends. In addition, the allowance includes a reserve for currently authorized customer returns that are considered to be abnormal in comparison to the historical basis.
Inventories
Inventories are priced at the lower of cost (principally first-in, first-out with minor amounts at average) or market. A reserve is established to adjust the cost of inventory to its net realizable value. Inventory reserves are recorded for obsolete or slow-moving inventory based on assumptions about future demand and marketability of products, the impact of new product introductions and specific identification of items, such as product discontinuance or engineering/material changes. These estimates could vary significantly, either favorably or unfavorably, from actual requirements if future economic conditions, customer inventory levels or competitive conditions differ from our expectations.
Property, Plant and Equipment
Property, plant and equipment are carried at cost. Depreciation is provided, principally on a straight-line basis, over the estimated useful lives of the assets. Gains or losses resulting from dispositions are included in operating income. Betterments and renewals, which improve and extend the life of an asset are capitalized; maintenance and repair costs are expensed. Purchased computer software is capitalized and amortized over the software’s useful life. The following table shows estimated useful lives of property, plant and equipment:
|
Property, plant and equipment
|
Useful Life
|
|
|
Buildings
|
40 to 50 years
|
|
|
Leasehold improvements
|
Lesser of lease term or the life of the asset
|
|
|
Machinery, equipment and furniture
|
3 to 10 years
|
|
|
Computer software
|
5 to 10 years
|
|
We capitalize interest for major capital projects. Capitalized interest is added to the cost of the underlying assets and is depreciated over the useful lives of those assets. We capitalized interest of
$0.1 million
,
$1.3 million
and
$0.9 million
for the years ended
December 31, 2016
,
2015
and
2014
, respectively.
55
ACCO Brands Corporation and Subsidiaries
Notes to Consolidated Financial Statements (Continued)
Long-Lived Assets
We test long-lived assets for impairment whenever events or changes in circumstances indicate that the assets’ carrying amount may not be recoverable from its undiscounted cash flow. When such events occur, we compare the sum of the undiscounted cash flow expected to result from the use and eventual disposition of the asset or asset group to the carrying amount of a long-lived asset or asset group. The cash flows are based on our best estimate at the time of future cash flow, derived from the most recent business projections. If this comparison indicates that there is an impairment, the amount of the impairment is typically calculated using discounted expected future cash flow. The discount rate applied to these cash flows is based on our weighted average cost of capital, computed by selecting market rates at the valuation dates for debt and equity that are reflective of the risks associated with an investment in our industry as estimated by using comparable publicly traded companies.
Intangible Assets
Intangible assets are comprised primarily of indefinite-lived and amortizable intangible assets acquired and arising from the application of purchase accounting. Indefinite-lived intangible assets are not amortized, but are evaluated at least annually to determine whether the indefinite useful life is appropriate. In addition, amortizable intangible assets other than goodwill are amortized over their useful lives. Certain of our trade names have been assigned an indefinite life as we currently anticipate that these trade names will contribute cash flows to ACCO Brands indefinitely.
We review indefinite-lived intangibles for impairment at least annually, normally in the second quarter, and whenever market or business events indicate there may be a potential adverse impact on a particular intangible. The review may be on a qualitative or quantitative basis as allowed by GAAP. We consider the implications of both external factors (e.g., market growth, pricing, competition, and technology) and internal factors (e.g., product costs, margins, support expenses, and capital investment) and their potential impact on cash flows for each business in both the near and long term, as well as their impact on any identifiable intangible asset associated with the business. Based on recent business results, consideration of significant external and internal factors, and the resulting business projections, indefinite-lived intangible assets are reviewed to determine whether they are likely to remain indefinite-lived, or whether a finite life is more appropriate. In addition, based on events in the period and future expectations, management considers whether the potential for impairment exists.
Finite lived intangibles are amortized over
10
,
15
,
23
or
30
years.
We performed our annual assessment, on a qualitative basis, as allowed by GAAP, for the majority of indefinite-lived trade names in the second quarter of
2016
and concluded that no impairment existed. For two of our indefinite-lived trade names that are not substantially above their carrying values, Mead
®
and Hilroy
®
, we performed quantitative tests (Step 1) in the second quarter of 2016. The following long-term growth rates and discount rates were used,
1.5%
and
10.0%
for Mead
®
, and
1.5%
and
10.5%
for Hilroy
®
, respectively.
We concluded that neither Mead
®
nor Hilroy
®
were impaired.
In the fourth quarter of 2015, we performed a quantitative test, as we identified the recession in Brazil as a triggering event related to our trade name, Tilibra
®
primarily used in Brazil. While we concluded that no impairment existed, the trade name's fair value has been significantly reduced. Key financial assumptions utilized to determine the fair value of Tilibra
®
included a long-term growth rate of
6.5%
and a
14.5%
discount rate. In 2016, the Tilibra
®
trade name slightly outperformed the forecast used in the fourth quarter of 2015 quantitative test; however, the economic conditions in Brazil could deteriorate further triggering additional future reviews.
The fair values of Mead
®
, Tilibra
®
and Hilroy
®
trade names are less than
30%
above their carrying values. As of
December 31, 2016
the carrying values of those trade names were as follows: Mead
®
(
$113.3 million
), Tilibra
®
(
$63.0 million
) and Hilroy
®
(
$11.8 million
).
Goodwill
Goodwill has been recorded on our balance sheet and represents the excess of the cost of an acquisition when compared to the fair value of the net assets acquired. The authoritative guidance on goodwill and other intangible assets requires that goodwill be tested for impairment at a reporting unit level. We have determined that our reporting units are the ACCO Brands North America, ACCO Brands International and Computer Products Group segments.
We test goodwill for impairment at least annually and whenever events or circumstances make it more likely than not that an impairment may have occurred. As permitted by GAAP, we may perform a qualitative assessment to determine if it is more
56
ACCO Brands Corporation and Subsidiaries
Notes to Consolidated Financial Statements (Continued)
likely than not that the fair value of a reporting unit is less than its carrying amount as a basis for determining whether it is necessary to perform the two-step goodwill impairment test included in GAAP. Entities are not required to calculate the fair value of a reporting unit unless they determine that it is more likely than not that the fair value is less than the carrying amount. We performed our annual assessment in the second quarter of
2016
,
on a qualitative basis, and concluded that it was not more likely than not that the fair value of any reporting unit is less than its carrying amount.
If the qualitative assessment determines that it is more likely than not that the fair value of a reporting unit is less than its carrying amount, or if it is determined that a qualitative assessment is not appropriate, we move onto the two-step goodwill impairment test where we calculate the fair value of the reporting units. When applying a fair-value-based test the fair value of a reporting unit is compared to its carrying value. If the fair value of a reporting unit exceeds the carrying value of the net assets assigned to a reporting unit, goodwill is considered not impaired and no further testing is required. If the carrying value of the net assets assigned to a reporting unit exceeds the fair value of a
reporting unit, the second step of the impairment test is performed in order to determine the implied fair value of a reporting unit’s goodwill. Determining the implied fair value of goodwill requires valuation of a reporting unit’s tangible and intangible assets and liabilities in a manner similar to the allocation of purchase price in a business combination. If the carrying value of a reporting unit’s goodwill exceeds its implied fair value, goodwill is deemed impaired and is written down to the extent of the difference.
Employee Benefit Plans
We provide a range of benefits to our employees and retired employees, including pension, post-retirement, post-employment and health care benefits. We record annual amounts relating to these plans based on calculations specified by GAAP, which include various actuarial assumptions, including discount rates, assumed rates of return, compensation increases, turnover rates and health care cost trend rates. Actuarial assumptions are reviewed on an annual basis and modifications to these assumptions are made based on current rates and trends when it is deemed appropriate. As required by GAAP, the effect of our modifications are generally recorded and amortized over future periods.
Income Taxes
Deferred tax liabilities or assets are established for temporary differences between financial and tax reporting bases and are subsequently adjusted to reflect changes in tax rates expected to be in effect when the temporary differences reverse. A valuation allowance is recorded to reduce deferred tax assets to an amount that is more likely than not to be realized. Facts and circumstances may change and cause us to revise the conclusions on our ability to realize certain net operating losses and other deferred tax attributes.
The amount of income taxes that we pay is subject to ongoing audits by federal, state and foreign tax authorities. Our estimate of the potential outcome of any uncertain tax position is subject to management’s assessment of relevant risks, facts and circumstances existing at that time. We believe that we have adequately provided for reasonably foreseeable outcomes related to these matters. However, our future results may include favorable or unfavorable adjustments to our estimated tax liabilities in the period the assessments are revised or resolved.
Revenue Recognition
We recognize revenue from product sales when earned, net of applicable provisions for discounts, returns and allowances. We consider revenue to be realized or realizable and earned when all of the following criteria are met: title and risk of loss have passed to the customer, persuasive evidence of an arrangement exists, delivery has occurred, the price is fixed or determinable and collectability is reasonably assured. We also provide for our estimate of potential bad debt at the time of revenue recognition.
Customer Program Costs
Customer program costs include, but are not limited to, sales rebates, which are generally tied to achievement of certain sales volume levels, in-store promotional allowances, shared media and customer catalog allowances and other cooperative advertising arrangements, and freight allowance programs. We generally recognize customer program costs as a deduction to gross sales at the time that the associated revenue is recognized. Certain customer incentives that do not directly relate to future revenues are expensed when initiated.
57
ACCO Brands Corporation and Subsidiaries
Notes to Consolidated Financial Statements (Continued)
In addition, accrued customer program liabilities principally include, but are not limited to, sales volume rebates, promotional allowances, shared media and customer catalog allowances and other cooperative advertising arrangements and freight allowances as discussed above.
Cost of Products Sold
Cost of products sold includes all manufacturing, product sourcing and distribution costs, including depreciation related to assets used in the manufacturing, procurement and distribution process, allocation of certain information technology costs supporting those processes, inbound and outbound freight, shipping and handling costs, purchasing costs associated with materials and packaging used in the production processes.
Advertising, Selling, General and Administrative Expenses
Advertising, selling, general and administrative expenses ("SG&A") include advertising, marketing, selling (including commissions), research and development, customer service, depreciation related to assets outside the manufacturing and distribution processes and all other general and administrative expenses outside the manufacturing and distribution functions (e.g., finance, human resources, information technology, corporate expenses, etc.).
Advertising Costs
Advertising costs amounted to
$110.1 million
,
$120.9 million
and
$130.8 million
for the years ended
December 31, 2016
,
2015
and
2014
, respectively. These costs primarily include, but are not limited to, cooperative advertising and promotional allowances as described in "
Customer Program Costs
" above, and are principally expensed as incurred.
Shipping and Handling
We reflect all amounts billed to customers for shipping and handling in net sales and the costs incurred from shipping and handling product (including costs to ship and move product from the seller’s place of business to the buyer’s place of business, as well as costs to store, move and prepare products for shipment) in cost of products sold.
Warranty Reserves
We offer our customers various warranty terms based on the type of product that is sold. Estimated future obligations related to products sold under these warranty terms are provided by charges to cost of products sold in the period in which the related revenue is recognized.
Research and Development
Research and development expenses, which amounted to
$21.0 million
,
$20.0 million
and
$20.2 million
for the years ended
December 31, 2016
,
2015
and
2014
, respectively, are classified as SG&A expenses and are charged to expense as incurred.
Stock-Based Compensation
Our primary types of share-based compensation consist of stock options, restricted stock unit awards and performance stock unit awards. Stock-based compensation cost is measured at the grant date, based on the fair value of the award, and is recognized as expense over the requisite service period. Where awards are made with non-substantive vesting periods (for example, where a portion of the award vests upon retirement eligibility), we estimate and recognize expense based on the period from the grant date to the date on which the employee is retirement eligible.
Foreign Currency Translation
Foreign currency balance sheet accounts are translated into U.S. dollars at the rates of exchange at the balance sheet date. Income and expenses are translated at the average rates of exchange in effect during the period. The related translation adjustments are made directly to a separate component of accumulated other comprehensive income (loss) in stockholders’ equity. Some transactions are made in currencies different from an entity’s functional currency. Gains and losses on these foreign currency transactions are included in income as they occur.
58
ACCO Brands Corporation and Subsidiaries
Notes to Consolidated Financial Statements (Continued)
Derivative Financial Instruments
We recognize all derivatives as either assets or liabilities on the balance sheet and measure those instruments at fair value. If the derivative is designated as a fair value hedge and is effective, the changes in the fair value of the derivative and of the hedged item attributable to the hedged risk are recognized in earnings in the same period. If the derivative is designated as a cash flow hedge, the effective portions of changes in the fair value of the derivative are recorded in other comprehensive income (loss) and are recognized in the income statement when the hedged item affects earnings. Ineffective portions of changes in the fair value of cash flow hedges are recognized in earnings.
Certain forecasted transactions, assets and liabilities are exposed to foreign currency risk. We continually monitor our foreign currency exposures in order to maximize the overall effectiveness of our foreign currency hedge positions.
Principal currencies hedged include the U.S. dollar, Euro, Australian dollar, Canadian dollar, British pound and Japanese yen.
Recent Accounting Standards Updates
In May 2014 the FASB issued Accounting Standards Update (ASU) No. 2014-09, Revenue from Contracts with Customers (Topic 606), which supersedes substantially all existing revenue recognition requirements, including most industry-specific guidance. The new standard requires a company to recognize revenue when it transfers goods or services to customers in an amount that reflects the consideration that the company expects to receive for those goods or services. The FASB has subsequently issued the following amendments to ASU 2014-09, which have the same effective date and transition date of January 1, 2018:
|
•
|
In August 2015 the FASB issued ASU No. 2015-14, Revenue from Contracts with Customers (Topic 606): Deferral of the Effective Date, which delayed the effective date of the new standard from January 1, 2017 to January 1, 2018. The FASB also agreed to allow entities to choose to adopt the standard as of the original effective date.
|
|
•
|
In March 2016 the FASB issued ASU No. 2016-08, Revenue from Contracts with Customers (Topic 606): Principal versus Agent Considerations, which clarifies the implementation guidance on principal versus agent considerations.
|
|
•
|
In April 2016 the FASB issued ASU No. 2016-10, Revenue from Contracts with Customers (Topic 606): Identifying Performance Obligations and Licensing, which clarifies certain aspects of identifying performance obligations and licensing implementation guidance.
|
|
•
|
In May 2016 the FASB issued ASU No. 2016-12, Revenue from Contracts with Customers (Topic 606): Narrow-Scope Improvements and Practical Expedients related to disclosures of remaining performance obligations, as well as other amendments to guidance on collectability, non-cash consideration and the presentation of sales and other similar taxes collected from customers.
|
|
•
|
In December 2016 the FASB issued ASU No. 2016-20, Technical Corrections and Improvements to Topic 606, Revenue from Contracts with Customers, which amends certain narrow aspects of the guidance issued in ASU 2014-09 including guidance related to the disclosure of remaining performance obligations and prior-period performance obligations, as well as other amendments to the guidance on loan guarantee fees, contract costs, refund liabilities, advertising costs and the clarification of certain examples
|
There are two methods of adoption allowed, either a "full" retrospective adoption or a "modified" retrospective adoption. The Company has not yet decided which implementation method it will adopt. The Company has hired outside consultants to help in the process of evaluating the potential impact of ASU 2014-09, but it does not expect the adoption of ASU 2014-09 will have a material impact on the Company’s consolidated financial statements in any one annual period. The Company will adopt ASU 2014-09 effective with its 2018 fiscal year.
In March 2016, the FASB issued ASU No. 2016-09, Compensation - Stock Compensation (Topic 718): Improvements to Employee Share-Based Payment Accounting. This new standard simplifies the accounting for employee share-based payments and involves several aspects of the accounting for share-based transactions, including the potential timing of expenses, the income tax consequences, classification of awards as either equity or liabilities and classification on the statement of cash flows. ASU 2016-09 is effective for annual periods beginning after December 15, 2016, and interim periods within those annual periods. The
59
ACCO Brands Corporation and Subsidiaries
Notes to Consolidated Financial Statements (Continued)
Company has determined that ASU 2016-09 will have an immaterial effect on the Company's consolidated financial statements and the Company will adopt ASU 2016-09 effective with its 2017 fiscal year.
In February 2016, the FASB issued ASU No. 2016-02, Leases (Topic 842). This new standard will require the recognition, on the balance sheet, of most leases as lease assets (right-of-use assets) and lease liabilities by lessees for those leases classified as operating leases under current GAAP. This new standard also includes increased disclosures to meet the objective of enabling users of financial statements to understand more about the nature of an entity’s leasing activities. ASU 2016-02 is effective for fiscal years beginning after December 15, 2018, including interim periods within those fiscal years. Early adoption is permitted and adoption of ASU 2016-02 is to be done on a modified retrospective basis. The Company is currently in the process of evaluating the impact of adoption of ASU 2016-02 on the Company’s consolidated financial statements and it currently expects that most of its operating lease commitments will be subject to the new standard and will be recognized as operating lease liabilities and right-of-use assets upon the adoption of ASU 2016-02. It is expected that these changes will be material to the Company's consolidated financial statements. The Company will adopt ASU 2016-02 effective with its 2019 fiscal year.
In July 2015, the FASB issued ASU No. 2015-11, Inventory (Topic 330): Simplifying the Measurement of Inventory. This new standard applies to inventory that is measured using first-in, first-out (FIFO) or average cost. An entity should measure inventory within the scope of ASU 2015-11 at the lower of cost or net realizable value. Net realizable value is the estimated selling price in the ordinary course of business, less reasonably predictable costs of completion, disposal and transportation. ASU 2015-11 is effective for fiscal years beginning after December 15, 2016. The Company has determined that ASU 2015-11 will have an immaterial effect on the Company's consolidated financial statements and the Company will adopt ASU 2015-11 effective with its 2017 fiscal year.
Other than the items mentioned above, there are no other recently issued accounting standards that are expected to have a material effect on the Company’s financial condition, results of operations or cash flow.
Recently Adopted Accounting Standards
In August 2016 the FASB issued ASU No. 2016-15, Statement of Cash Flows (Topic 230): Classification of Certain Cash Receipts and Cash Payments. This new standard clarifies certain aspects of the statement of cash flows, including the classification of debt prepayment or debt extinguishment costs or other debt instruments with coupon interest rates that are insignificant in relation to the effective interest rate of the borrowing, contingent consideration payments made after a business combination, proceeds from the settlement of insurance claims, proceeds from the settlement of corporate-owned life insurance policies, distributions received from equity method investees and beneficial interests in securitization transactions. ASU 2016-15 also clarifies that an entity should determine each separately identifiable source of use within the cash receipts and payments based on the nature of the underlying cash flows. In situations in which cash receipts and payments have aspects of more than one class of cash flows and cannot be separated by source or use, the appropriate classification should depend on the activity that is likely to be the predominant source or use of cash flows for the item. ASU 2016-15 is effective for annual periods beginning after December 15, 2017, and interim periods within those annual periods. Early adoption is permitted. The Company has elected to early adopt ASU 2016-15. The only material effect has been that "
Net cash provided by operating activities
" has been increased by
$25.0 million
and our "
Net cash used by financing activities
" has been increased by
$25.0 million
, due to a
$25.0 million
"make-whole" call premium in association with the early satisfaction and discharge of our $500 million principal amount of outstanding Senior Unsecured Notes due April 2020.
In May 2015, the FASB issued ASU No. 2015-07, Fair Value Measurement (Topic 820): Disclosures for Investment in Certain Entities That Calculate Net Asset Value per Share (or Its Equivalent). The amendments in ASU 2015-07 remove the requirement to categorize within the fair value hierarchy all investments for which fair value is measured using the net asset value per share practical expedient. ASU 2015-07 is effective for annual reporting periods beginning after December 15, 2015. The guidance is required to be applied retrospectively to all periods presented. The Company adopted this new guidance and it did not have a material impact on the Company’s consolidated financial statements.
3. Acquisition
On May 2, 2016, the Company completed the PA Acquisition, which included the remaining
50%
interest in the former Pelikan Artline joint-venture, which it did not already own. Prior to the PA Acquisition, the Company's investment in the Pelikan Artline joint-venture was accounted for under the equity method.
Pelikan Artline's product categories include writing instruments,
60
ACCO Brands Corporation and Subsidiaries
Notes to Consolidated Financial Statements (Continued)
notebooks, binding and lamination, visual communication, cleaning and janitorial supplies, as well as general stationery. Its industry-leading brands include Artline
®
, Quartet
®,
GBC
®
, Spirax
®
and Texta
®
, among others.
In the PA Acquisition, ACCO Brands Australia Pty Limited and Bigadale Pty Limited (collectively, ''ACCO Australia"), two wholly-owned indirect subsidiaries of the Company, entered into a Share Sale Agreement (the "Agreement") with Andrew Kaldor, Cherington Investments Pty Ltd, Freiburg Nominees Proprietary Limited, Enora Pty Ltd and Bruce Haynes and certain Guarantors named therein (collectively, the "Seller Parties") to purchase directly or indirectly
100%
of the capital stock of Australia Stationery Industries, Inc. which indirectly owned the
50%
of the Pelikan Artline joint-venture and the issued capital stock of Pelikan Artline Pty Limited (collectively "Pelikan Artline") that was not already owned by ACCO Brands Australia Pty Limited.
The purchase price was
$103.7 million
, net of working capital adjustments, and was
$88.8 million
, net of cash acquired.
Following completion of the PA Acquisition, ACCO Australia owns, directly and indirectly,
100%
of Pelikan Artline. In addition to representations, warranties and covenants, the Agreement contains indemnification obligations and certain non-competition and non-solicitation covenants made by the Seller Parties in favor of ACCO Australia. A portion of the purchase price was allocated to fund the redemption of a
19.83%
minority interest from a shareholder of a subsidiary of Pelikan Artline (the "Minority Interest Redemption"), which occurred shortly following the closing of the PA Acquisition. Additionally, approximately
10%
of the purchase price after deducting the Minority Interest Redemption is held in escrow as security with respect to post-closing warranty, tax claims and indemnification obligations.
The Company financed the PA Acquisition through increased borrowings under its existing credit facility. See "
Note 4. Long-term Debt and Short-term Borrowings
" for details on these additional borrowings.
For accounting purposes, the Company is the acquiring enterprise. The PA Acquisition is being accounted for as a purchase business combination and Pelikan Artline's results are included in the Company’s consolidated financial statements from the date of the PA Acquisition, May 2, 2016.
The Company’s previously held equity interest in the Pelikan Artline joint-venture was remeasured to fair value at the date the controlling interest was acquired. The fair value of the previously held equity interest in Pelikan Artline joint-venture was determined by applying the income approach and using significant inputs that market participants would consider, including: revenue growth rates, operating margins, a discount rate and an adjustment for lack of control. The
$28.9 million
excess of the fair value of the previously held equity interest when compared to the carrying value was recognized as a gain in "
Other expense, net
” in the income statement.
The calculation of consideration given in the PA Acquisition is described in the following table.
|
(in millions of dollars)
|
At May 2, 2016
|
||
|
Purchase price, net of working capital adjustments
|
$
|
103.7
|
|
|
Fair value of previously held equity interest
|
69.3
|
|
|
|
Consideration for Pelikan Artline
|
$
|
173.0
|
|
61
ACCO Brands Corporation and Subsidiaries
Notes to Consolidated Financial Statements (Continued)
The following table presents the preliminary allocation of the consideration given to the fair values of the assets acquired and liabilities assumed at the date of the PA Acquisition.
|
(in millions of dollars)
|
At May 2, 2016
|
||
|
Calculation of Goodwill:
|
|||
|
Purchase price, net of working capital adjustments
|
$
|
103.7
|
|
|
Fair value of previously held equity interest
|
69.3
|
|
|
|
Plus fair value of liabilities assumed:
|
|||
|
Accounts payable and accrued liabilities
|
21.7
|
|
|
|
Deferred tax liabilities
|
0.2
|
|
|
|
Debt
|
24.7
|
|
|
|
Other non-current liabilities
|
1.4
|
|
|
|
Fair value of liabilities assumed
|
$
|
48.0
|
|
|
Less fair value of assets acquired:
|
|||
|
Cash acquired
|
14.9
|
|
|
|
Accounts receivable
|
27.0
|
|
|
|
Inventory
|
24.1
|
|
|
|
Property and equipment
|
2.2
|
|
|
|
Identifiable intangibles
|
58.0
|
|
|
|
Deferred tax assets
|
5.7
|
|
|
|
Other assets
|
8.6
|
|
|
|
Fair value of assets acquired
|
$
|
140.5
|
|
|
Goodwill
|
$
|
80.5
|
|
We have finalized our fair value estimate of assets acquired and liabilities assumed as of the acquisition date. No additional adjustments to the goodwill related to the PA Acquisition will be recognized.
The excess of the purchase price over the fair value of net assets acquired has been allocated to goodwill. The goodwill of
$80.5 million
is primarily attributable to synergies expected to be realized from facility integration, headcount reduction and other operational streamlining activities, and from the existence of an assembled workforce.
Transaction costs related to the PA Acquisition of
$1.3 million
were incurred during the
twelve months ended December 31,
2016
, and
$0.6 million
were incurred during 2015 and were reported as advertising, selling, general and administrative expenses.
Unaudited Pro Forma Consolidated Results
The accounting literature establishes guidelines regarding, and requires the presentation of, the following unaudited pro forma information. Therefore, the unaudited pro forma information presented below is not intended to represent, nor do we believe it is indicative of, the consolidated results of operations of the Company that would have been reported had the PA Acquisition been completed on January 1, 2015. Furthermore, the unaudited pro forma information does not give effect to the anticipated synergies or other anticipated benefits of the PA Acquisition.
62
ACCO Brands Corporation and Subsidiaries
Notes to Consolidated Financial Statements (Continued)
Had the PA Acquisition occurred on January 1, 2015, unaudited pro forma consolidated results for the
twelve
month period ending
December 31, 2016
and
2015
would have been as follows:
|
Unaudited
|
|||||||
|
Twelve Months Ended December 31,
|
|||||||
|
(in millions of dollar, except per share data)
|
2016
|
2015
|
|||||
|
Net sales
|
$
|
1,593.1
|
|
$
|
1,627.6
|
|
|
|
Net income
|
65.3
|
|
119.4
|
|
|||
|
Net income per common share (diluted)
|
$
|
0.60
|
|
$
|
1.08
|
|
|
The pro forma amounts are based on the Company's historical results of operations and the historical results of operations for the acquired Pelikan Artline business, which have been translated at the average foreign exchange rates for the presented periods. The pro forma results of operations have been adjusted for amortization of finite-lived intangibles, and other charges related to acquisition accounting. The pro forma results of operations for the
twelve
months ended
December 31, 2015
have also been adjusted to include transaction costs related to the PA Acquisition of
$1.9 million
, amortization of the purchase accounting step-up in inventory cost of
$0.3 million
and financing related costs. These 2015 adjustments include the
$28.9 million
gain (
$32.2 million
based on 2015 exchange rates) associated with the PA Acquisition due to the revaluation of the Company's previously held equity interest in the Pelikan Artline joint-venture. All adjustments were made on a net of income tax basis, where applicable. In addition, the equity in earnings of the Pelikan Artline joint-venture that were previously included in the Company's results has been excluded.
Notes payable and long-term debt, listed in order of their security interests, consisted of the following as of
December 31, 2016
and
2015
:
|
(in millions of dollars)
|
2016
|
2015
|
|||||
|
U.S. Dollar Senior Secured Term Loan A, due April 2020 (floating interest rate of 2.27% at December 31, 2016 and 1.88% at December 31, 2015)
(1)
|
$
|
81.0
|
|
$
|
229.0
|
|
|
|
Australian Dollar Senior Secured Term Loan A, due April 2020 (floating interest rate of 3.25% at December 31, 2016)
(1)
|
70.3
|
|
—
|
|
|||
|
U.S. Dollar Senior Secured Revolving Credit Facility, due April 2020 (floating interest rate of 2.59% at December 31, 2016)
(1)
|
63.7
|
|
—
|
|
|||
|
Australian Dollar Senior Secured Revolving Credit Facility, due April 2020 (floating interest rate of 3.27% at December 31, 2016)
|
87.9
|
|
—
|
|
|||
|
Senior Unsecured Notes, due December 2024 (fixed interest rate of 5.25%)
|
400.0
|
|
—
|
|
|||
|
Senior Unsecured Notes, due April 2020 (fixed interest rate of 6.75%)
|
—
|
|
500.0
|
|
|||
|
Other borrowings
|
0.6
|
|
—
|
|
|||
|
Total debt
|
703.5
|
|
729.0
|
|
|||
|
Less:
|
|||||||
|
Current portion
|
68.5
|
|
—
|
|
|||
|
Debt issuance costs, unamortized
|
7.3
|
|
8.5
|
|
|||
|
Long-term debt, net
|
$
|
627.7
|
|
$
|
720.5
|
|
|
|
(1)
|
In connection with the consummation of the Esselte Acquisition, the Company entered into a Third Amended and Restated Credit Agreement dated January 27, 2017. See also "
Note 20. Subsequent Events
" to the consolidated financial statements.
|
Senior Unsecured Notes due December 2024
On December 22, 2016, the Company completed a private offering of
$400.0 million
in aggregate principal amount of
5.25%
senior notes due December 2024 (the "New Notes"), which we issued under an indenture, dated December 22, 2016 (the "New Indenture"), among the Company, as issuer, the guarantors named therein (the "Guarantors") and Wells Fargo Bank, National
63
ACCO Brands Corporation and Subsidiaries
Notes to Consolidated Financial Statements (Continued)
Association, as trustee (the "Trustee"). Pursuant to the New Indenture, the Company will pay interest on the New Notes semiannually on June 15 and December 15 of each year, beginning on June 15, 2017.
The New Notes are fully and unconditionally guaranteed, jointly and severally, on a senior unsecured basis by each of the Company’s existing and future U.S. subsidiaries, other than certain excluded subsidiaries.
The New Indenture contains covenants that limit the ability of the Company and its restricted subsidiaries’ to, among other things: (i) incur additional indebtedness or issue disqualified stock or, in the case of the Company’s restricted subsidiaries, preferred stock; (ii) create liens; (iii) pay dividends, make certain investments or make other restricted payments; (iv) sell certain assets or merge with or into other companies; (v) enter into transactions with affiliates; and (vi) allow limitations on any restricted subsidiary’s ability to pay dividends, loans, or assets to the Company or other restricted subsidiaries. These covenants are subject to a number of important limitations and exceptions. The New Indenture also provides for events of default, which, if any of them occurs, would permit or require the principal, premium, if any, and accrued but unpaid interest on all the then outstanding Notes to be immediately due and payable.
In addition, effective December 22, 2016, the Company irrevocably deposited with the trustee of its 6.75% Senior Notes due 2020 (the "Existing Notes") an amount necessary to pay the aggregate redemption price for the Existing Notes, and satisfied and discharged all its obligations related to the Existing Notes indenture. The Company borrowed
$73.9 million
under its revolving credit facility and applied the funds, together with the net proceeds from the issuance of the New Notes and cash on hand, toward the payment of the redemption price for all of the Existing Notes. The aggregate redemption price of
$531.5 million
consisted of principal due and payable on the Existing Notes, a "make-whole" call premium of
$25.0 million
(included in "
Other expense, net
"), and accrued and unpaid interest of
$6.5 million
(included in "
Interest expense
").
Also included in "
Other expense, net
" is a
$4.9 million
charge for the write-off of debt issuance costs associated with the Existing Notes. Additionally, we incurred and capitalized approximately
$6.1 million
in bank, legal and other fees associated with the issuance of the New Notes.
During the third quarter of 2016 the Company paid down
$70.0 million
on the U.S. Dollar Senior Secured Term Loan A.
Second Amended and Restated Credit Agreement
During 2016, the Company was party to a Second Amended and Restated Credit Agreement, dated April 28, 2015 (as subsequently amended the "
2015 Credit Agreement
"), among the Company, certain subsidiaries of the Company, Bank of America, N.A., as administrative agent, and the other agents and lenders party thereto.
The
2015 Credit Agreement
provided for a
$600.0 million
five
-year senior secured credit facility, which consisted of a
$300.0 million
revolving credit facility (the "
2015 Revolving Facility
") and a
$300.0 million
term loan (the "
2015 Term Loan A
").
As of
December 31, 2016
, there were
$151.6 million
in borrowings
under the
2015 Revolving Facility
. The amount available for borrowings was
$140.6 million
(allowing for
$7.8 million
of letters of credit outstanding on that date). Effective January 27, 2017, the Company entered into a new credit agreement that replaced the facilities under the
2015 Credit Agreement
. See "
Note 20. Subsequent Events
."
Amortization
Amounts under the
2015 Revolving Facility
were non-amortizing. Beginning September 30, 2015, the outstanding principal amount under the
2015 Term Loan A
was payable in quarterly installments in an amount representing, on an annual basis,
5.0%
of the initial aggregate principal amount of such loan and increasing to
12.5%
by September 30, 2018.
Interest rates
Amounts outstanding under the
2015 Credit Agreement
bore interest (i) in the case of Eurodollar loans, at a rate per annum equal to the Eurodollar rate (which is based on an average British Bankers Association Interest Settlement Rate) plus the applicable rate; (ii) in the case of loans made at the Base Rate (which means the highest of (a) the Bank of America, N.A. prime rate then in effect, (b) the Federal Funds effective rate then in effect plus
½ of 1.00%
and (c) the Eurodollar rate that would be payable on such day for a Eurodollar loan with a
one
-month interest period plus
1.00%
), at a rate per annum equal to the Base Rate plus the
64
ACCO Brands Corporation and Subsidiaries
Notes to Consolidated Financial Statements (Continued)
applicable rate; and (iii) in the case of swing line loans, at a rate per annum equal to the Base Rate plus the applicable rate. Separate base interest rate and applicable rate provisions applied for any Canadian or Australian currency denominated loans.
The applicable rate applied to outstanding Eurodollar loans and Base Rate loans is based on the Company's Consolidated Leverage Ratio (as defined in the
2015 Credit Agreement
) as follows:
|
Consolidated
Leverage Ratio
|
Eurodollar Credit Spread
|
Base Rate Credit Spread
|
||
|
> 4.00 to 1.00
|
2.50%
|
1.50%
|
||
|
≤ 4.00 to 1.00 and > 3.50 to 1.00
|
2.25%
|
1.25%
|
||
|
≤ 3.50 to 1.00 and > 3.00 to 1.00
|
2.00%
|
1.00%
|
||
|
≤ 3.00 to 1.00 and > 2.00 to 1.00
|
1.50%
|
0.50%
|
||
|
≤ 2.00 to 1.00
|
1.25%
|
0.25%
|
||
As of
December 31, 2016
, all of the amounts outstanding under the
2015 Term Loan A
bore interest at a Eurodollar rate plus the applicable rate of
1.50%
and the amounts drawn under the
2015 Revolving Facility
bore interest at either a Eurodollar rate plus
1.50%
or a Base Rate plus the applicable rate of
0.50%
.
Covenants
The
2015 Credit Agreement
contained customary affirmative and negative covenants as well as events of default, including payment defaults, breach of representations and warranties, covenant defaults, cross-defaults, certain bankruptcy or insolvency events, certain ERISA-related events, changes in control or ownership and invalidity of any loan document. The indenture governing the senior unsecured notes also contains certain covenants.
Under the
2015 Credit Agreement
, the Company was required to meet certain financial tests, including a maximum Consolidated Leverage Ratio as determined by reference to the following ratio:
|
Period
|
Maximum Consolidated Leverage Ratio
(1)
|
|
|
July 1, 2015 and thereafter
|
3.75:1.00
|
|
|
(1)
|
The Consolidated Leverage Ratio is computed by dividing the Company's net funded indebtedness by the cumulative four-quarter-trailing EBITDA, which excludes transaction costs, restructuring and other charges up to certain limits as well as other adjustments defined in the
2015 Credit Agreement
.
|
The
2015 Credit Agreement
also required the Company to maintain a Consolidated Fixed Charge Coverage Ratio (as defined in the
2015 Credit Agreement
) as of the end of any fiscal quarter at or above
1.25
to 1.00.
Compliance with Loan Covenants
As of and for the year ended
December 31, 2016
, we were in compliance with all applicable loan covenants.
Guarantees and Security
Generally, obligations under the
2015 Credit Agreement
were guaranteed by certain of the Company's existing and future subsidiaries, and are secured by substantially all of the Company's and certain guarantor subsidiaries' assets, subject to certain exclusions and limitations.
The New Notes
are
irrevocably
and unconditionally guaranteed, jointly and severally, on a senior unsecured basis by each of our existing and future domestic subsidiaries other than certain excluded subsidiaries. The New Notes and the related guarantees will rank equally in right of payment with all of the existing and future senior debt of the Company and the guarantors, senior in right of payment to all of the existing and future subordinated debt of the Company, and the guarantors, and effectively subordinated to all of the existing and future secured indebtedness of the Company and the guarantors to the extent of the value of the assets securing such indebtedness. The New Notes and the guarantees are and will be structurally subordinated to all existing and future liabilities, including trade payables, of each of the Company's subsidiaries that do not guarantee the notes.
65
ACCO Brands Corporation and Subsidiaries
Notes to Consolidated Financial Statements (Continued)
Finance of PA Acquisition
The PA Acquisition, which closed in the second quarter of 2016, was financed through a borrowing of
A$100.0 million
(US
$76.6 million
based on May 2, 2016 exchange rates) by ACCO Australia in the form of an incremental Australian Dollar Senior Secured Term A loan under the
2015 Credit Agreement
along with additional borrowings of
A$152.0 million
(US
$116.4 million
based on May 2, 2016 exchange rates) under the
2015 Revolving Facility
. The Company used some of the proceeds from the borrowings to reduce the U.S. Dollar Senior Secured Term Loan A by
$78.0 million
and to pay off the debt assumed in the PA Acquisition of
A$32.1 million
(US
$24.5 million
based on May 2, 2016 exchange rates).
5. Pension and Other Retiree Benefits
We have a number of pension plans, principally in the U.K. and the U.S. The plans provide for payment of retirement benefits, primarily commencing between the ages of
60
and
65
, and also for payment of certain disability and severance benefits. After meeting certain qualifications, an employee acquires a vested right to future benefits. The benefits payable under the plans are generally determined based on an employee’s length of service and earnings. The majority of these plans have been frozen and are no longer accruing additional service benefits. Cash contributions to the plans are made as necessary to ensure legal funding requirements are satisfied.
On January 20, 2009, the Company’s Board of Directors approved plan amendments to temporarily freeze our ACCO Brands Corporation Pension Plan for Salaried and Certain Hourly Paid Employees in the U.S. (the "U.S. Salaried Plan") effective March 7, 2009. During the fourth quarter of 2014, the U.S. Salaried Plan became permanently frozen and, as of December 31, 2014, we have permanently frozen a portion of our U.S. pension plan for certain bargained hourly employees.
On September 30, 2012, our U.K. pension plan was frozen. As of December 31, 2016, all of our Canadian pension plans are now frozen.
We also provide post-retirement health care and life insurance benefits to certain employee and retirees in the U.S., U.K. and Canada. All but
one
of these benefit plans have been frozen to new participants. Many employees and retirees outside of the U.S. are covered by government health care programs.
66
ACCO Brands Corporation and Subsidiaries
Notes to Consolidated Financial Statements (Continued)
The following table sets forth our defined benefit pension and post-retirement plans funded status and the amounts recognized in our Consolidated Balance Sheets:
|
Pension
|
Post-retirement
|
||||||||||||||||||||||
|
U.S.
|
International
|
||||||||||||||||||||||
|
(in millions of dollars)
|
2016
|
2015
|
2016
|
2015
|
2016
|
2015
|
|||||||||||||||||
|
Change in projected benefit obligation (PBO)
|
|||||||||||||||||||||||
|
Projected benefit obligation at beginning of year
|
$
|
198.7
|
|
$
|
212.9
|
|
$
|
347.1
|
|
$
|
391.8
|
|
$
|
8.1
|
|
$
|
12.2
|
|
|||||
|
Service cost
|
1.3
|
|
1.6
|
|
0.8
|
|
0.9
|
|
0.1
|
|
0.1
|
|
|||||||||||
|
Interest cost
|
7.3
|
|
8.7
|
|
10.3
|
|
12.9
|
|
0.2
|
|
0.4
|
|
|||||||||||
|
Actuarial loss (gain)
|
3.1
|
|
(14.4
|
)
|
55.6
|
|
(19.0
|
)
|
(0.2
|
)
|
(3.4
|
)
|
|||||||||||
|
Participants’ contributions
|
—
|
|
—
|
|
0.1
|
|
0.2
|
|
0.1
|
|
0.1
|
|
|||||||||||
|
Benefits paid
|
(10.3
|
)
|
(10.1
|
)
|
(13.0
|
)
|
(15.9
|
)
|
(0.5
|
)
|
(0.5
|
)
|
|||||||||||
|
Curtailment gain
|
—
|
|
—
|
|
(0.6
|
)
|
—
|
|
(0.8
|
)
|
—
|
|
|||||||||||
|
Plan amendments
|
—
|
|
—
|
|
—
|
|
—
|
|
—
|
|
(0.2
|
)
|
|||||||||||
|
Foreign exchange rate changes
|
—
|
|
—
|
|
(55.2
|
)
|
(23.8
|
)
|
(0.3
|
)
|
(0.6
|
)
|
|||||||||||
|
Projected benefit obligation at end of year
|
200.1
|
|
198.7
|
|
345.1
|
|
347.1
|
|
6.7
|
|
8.1
|
|
|||||||||||
|
Change in plan assets
|
|||||||||||||||||||||||
|
Fair value of plan assets at beginning of year
|
145.8
|
|
163.9
|
|
318.9
|
|
351.2
|
|
—
|
|
—
|
|
|||||||||||
|
Actual return on plan assets
|
14.1
|
|
(9.3
|
)
|
41.8
|
|
(0.8
|
)
|
—
|
|
—
|
|
|||||||||||
|
Employer contributions
|
0.9
|
|
1.3
|
|
4.9
|
|
5.4
|
|
0.4
|
|
0.4
|
|
|||||||||||
|
Participants’ contributions
|
—
|
|
—
|
|
0.1
|
|
0.2
|
|
0.1
|
|
0.1
|
|
|||||||||||
|
Benefits paid
|
(10.3
|
)
|
(10.1
|
)
|
(13.0
|
)
|
(15.9
|
)
|
(0.5
|
)
|
(0.5
|
)
|
|||||||||||
|
Foreign exchange rate changes
|
—
|
|
—
|
|
(50.0
|
)
|
(21.2
|
)
|
—
|
|
—
|
|
|||||||||||
|
Fair value of plan assets at end of year
|
150.5
|
|
145.8
|
|
302.7
|
|
318.9
|
|
—
|
|
—
|
|
|||||||||||
|
Funded status (Fair value of plan assets less PBO)
|
$
|
(49.6
|
)
|
$
|
(52.9
|
)
|
$
|
(42.4
|
)
|
$
|
(28.2
|
)
|
$
|
(6.7
|
)
|
$
|
(8.1
|
)
|
|||||
|
Amounts recognized in the Consolidated Balance Sheets consist of:
|
|||||||||||||||||||||||
|
Other non-current assets
|
$
|
—
|
|
$
|
—
|
|
$
|
0.3
|
|
$
|
0.9
|
|
$
|
—
|
|
$
|
—
|
|
|||||
|
Other current liabilities
|
—
|
|
—
|
|
0.4
|
|
0.4
|
|
0.6
|
|
0.6
|
|
|||||||||||
|
Pension and post-retirement benefit obligations
(1)
|
49.6
|
|
52.9
|
|
42.3
|
|
28.7
|
|
6.1
|
|
7.5
|
|
|||||||||||
|
Components of accumulated other comprehensive income, net of tax:
|
|||||||||||||||||||||||
|
Unrecognized actuarial loss (gain)
|
54.2
|
|
55.1
|
|
83.7
|
|
75.0
|
|
(3.5
|
)
|
(4.2
|
)
|
|||||||||||
|
Unrecognized prior service cost (credit)
|
2.0
|
|
2.0
|
|
(0.2
|
)
|
(0.3
|
)
|
(0.2
|
)
|
(0.2
|
)
|
|||||||||||
|
(1)
|
Pension and post-retirement obligations of
$98.0 million
as of December 31,
2016
, increased from
$89.1 million
as of December 31,
2015
,
primarily due to lower discount rates compared to prior year assumptions for the U.K. plan.
|
67
ACCO Brands Corporation and Subsidiaries
Notes to Consolidated Financial Statements (Continued)
Of the amounts included within accumulated other comprehensive income (loss), we expect to recognize the following pre-tax amounts as components of net periodic benefit cost (income) for the year ended December 31,
2017
:
|
Pension
|
Post-retirement
|
||||||||||
|
(in millions of dollars)
|
U.S.
|
International
|
|||||||||
|
Actuarial loss (gain)
|
$
|
2.0
|
|
$
|
2.9
|
|
$
|
(0.4
|
)
|
||
|
Prior service cost
|
0.4
|
|
—
|
|
—
|
|
|||||
|
$
|
2.4
|
|
$
|
2.9
|
|
$
|
(0.4
|
)
|
|||
All of our plans have projected benefit obligations in excess of plan assets, except for
one
of our Canadian plans.
The accumulated benefit obligation for all pension plans was
$536.8 million
and
$533.6 million
at
December 31, 2016
and
2015
, respectively.
The following table sets out information for pension plans with an accumulated benefit obligation in excess of plan assets:
|
U.S.
|
International
|
||||||||||||||
|
(in millions of dollars)
|
2016
|
2015
|
2016
|
2015
|
|||||||||||
|
Projected benefit obligation
|
$
|
200.1
|
|
$
|
198.7
|
|
$
|
326.9
|
|
$
|
334.1
|
|
|||
|
Accumulated benefit obligation
|
198.3
|
|
196.1
|
|
320.4
|
|
324.7
|
|
|||||||
|
Fair value of plan assets
|
150.5
|
|
145.8
|
|
284.2
|
|
305.0
|
|
|||||||
The components of net periodic benefit (income) cost for pension and post-retirement plans for the years ended
December 31, 2016
,
2015
, and
2014
, respectively, were as follows:
|
Pension
|
Post-retirement
|
||||||||||||||||||||||||||||||||||
|
U.S.
|
International
|
||||||||||||||||||||||||||||||||||
|
(in millions of dollars)
|
2016
|
2015
|
2014
|
2016
|
2015
|
2014
|
2016
|
2015
|
2014
|
||||||||||||||||||||||||||
|
Service cost
|
$
|
1.3
|
|
$
|
1.6
|
|
$
|
2.1
|
|
$
|
0.8
|
|
$
|
0.9
|
|
$
|
0.8
|
|
$
|
0.1
|
|
$
|
0.1
|
|
$
|
0.2
|
|
||||||||
|
Interest cost
|
7.3
|
|
8.7
|
|
8.6
|
|
10.3
|
|
12.9
|
|
15.7
|
|
0.2
|
|
0.4
|
|
0.5
|
|
|||||||||||||||||
|
Expected return on plan assets
|
(11.9
|
)
|
(12.2
|
)
|
(12.0
|
)
|
(17.6
|
)
|
(21.9
|
)
|
(22.8
|
)
|
—
|
|
—
|
|
—
|
|
|||||||||||||||||
|
Amortization of net loss (gain)
|
1.8
|
|
2.1
|
|
5.1
|
|
2.3
|
|
2.4
|
|
1.9
|
|
(0.4
|
)
|
(0.4
|
)
|
(1.1
|
)
|
|||||||||||||||||
|
Amortization of prior service cost (credit)
|
0.4
|
|
0.4
|
|
0.4
|
|
—
|
|
—
|
|
—
|
|
—
|
|
(0.3
|
)
|
—
|
|
|||||||||||||||||
|
Curtailment gain
|
—
|
|
—
|
|
—
|
|
—
|
|
—
|
|
—
|
|
(0.6
|
)
|
—
|
|
—
|
|
|||||||||||||||||
|
Settlement gain
|
—
|
|
—
|
|
—
|
|
—
|
|
—
|
|
—
|
|
—
|
|
(0.5
|
)
|
(0.1
|
)
|
|||||||||||||||||
|
Net periodic benefit (income) cost
|
$
|
(1.1
|
)
|
$
|
0.6
|
|
$
|
4.2
|
|
$
|
(4.2
|
)
|
$
|
(5.7
|
)
|
$
|
(4.4
|
)
|
$
|
(0.7
|
)
|
$
|
(0.7
|
)
|
$
|
(0.5
|
)
|
||||||||
Effective from January 1, 2015 we changed the amortization of our net actuarial loss included in accumulated other comprehensive income (loss) for the U.S. Salaried Plan from the average remaining service period of active employees expected to receive benefits under the plan to the average remaining life expectancy of all participants. This change was the result of the Company's decision to permanently freeze the benefits under the plan.
68
ACCO Brands Corporation and Subsidiaries
Notes to Consolidated Financial Statements (Continued)
Other changes in plan assets and benefit obligations that were recognized in other comprehensive income (loss) during the years ended
December 31, 2016
,
2015
, and
2014
were as follows:
|
Pension
|
Post-retirement
|
||||||||||||||||||||||||||||||||||
|
U.S.
|
International
|
||||||||||||||||||||||||||||||||||
|
(in millions of dollars)
|
2016
|
2015
|
2014
|
2016
|
2015
|
2014
|
2016
|
2015
|
2014
|
||||||||||||||||||||||||||
|
Current year actuarial loss (gain)
|
$
|
0.9
|
|
$
|
7.1
|
|
$
|
35.4
|
|
$
|
27.9
|
|
$
|
3.8
|
|
$
|
27.3
|
|
$
|
(1.0
|
)
|
$
|
(3.4
|
)
|
$
|
(0.3
|
)
|
||||||||
|
Amortization of actuarial (loss) gain
|
(1.8
|
)
|
(2.1
|
)
|
(5.1
|
)
|
(2.3
|
)
|
(2.4
|
)
|
(1.9
|
)
|
1.0
|
|
0.9
|
|
1.1
|
|
|||||||||||||||||
|
Current year prior service (credit) cost
|
—
|
|
—
|
|
—
|
|
—
|
|
—
|
|
(0.2
|
)
|
—
|
|
(0.2
|
)
|
(0.3
|
)
|
|||||||||||||||||
|
Amortization of prior service (cost) credit
|
(0.4
|
)
|
(0.4
|
)
|
(0.4
|
)
|
—
|
|
—
|
|
—
|
|
—
|
|
0.3
|
|
—
|
|
|||||||||||||||||
|
Foreign exchange rate changes
|
—
|
|
—
|
|
—
|
|
(15.5
|
)
|
(5.6
|
)
|
(6.8
|
)
|
0.5
|
|
0.1
|
|
0.1
|
|
|||||||||||||||||
|
Total recognized in other comprehensive income (loss)
|
$
|
(1.3
|
)
|
$
|
4.6
|
|
$
|
29.9
|
|
$
|
10.1
|
|
$
|
(4.2
|
)
|
$
|
18.4
|
|
$
|
0.5
|
|
$
|
(2.3
|
)
|
$
|
0.6
|
|
||||||||
|
Total recognized in net periodic benefit cost (credit) and other comprehensive income (loss)
|
$
|
(2.4
|
)
|
$
|
5.2
|
|
$
|
34.1
|
|
$
|
5.9
|
|
$
|
(9.9
|
)
|
$
|
14.0
|
|
$
|
(0.2
|
)
|
$
|
(3.0
|
)
|
$
|
0.1
|
|
||||||||
Assumptions
The weighted average assumptions used to determine benefit obligations for the years ended
December 31, 2016
,
2015
, and
2014
were as follows:
|
Pension
|
Post-retirement
|
|||||||||||||||||||||||||
|
U.S.
|
International
|
|||||||||||||||||||||||||
|
2016
|
2015
|
2014
|
2016
|
2015
|
2014
|
2016
|
2015
|
2014
|
||||||||||||||||||
|
Discount rate
|
4.3
|
%
|
4.6
|
%
|
4.2
|
%
|
2.7
|
%
|
3.7
|
%
|
3.4
|
%
|
3.4
|
%
|
3.9
|
%
|
3.7
|
%
|
||||||||
|
Rate of compensation increase
|
N/A
|
|
N/A
|
|
N/A
|
|
3.1
|
%
|
3.0
|
%
|
3.3
|
%
|
N/A
|
|
N/A
|
|
N/A
|
|
||||||||
The weighted average assumptions used to determine net periodic benefit cost (income) for the years ended
December 31, 2016
,
2015
, and
2014
were as follows:
|
Pension
|
Post-retirement
|
|||||||||||||||||||||||||
|
U.S.
|
International
|
|||||||||||||||||||||||||
|
2016
|
2015
|
2014
|
2016
|
2015
|
2014
|
2016
|
2015
|
2014
|
||||||||||||||||||
|
Discount rate
|
4.6
|
%
|
4.2
|
%
|
5.0
|
%
|
3.7
|
%
|
3.4
|
%
|
4.3
|
%
|
3.9
|
%
|
3.7
|
%
|
4.4
|
%
|
||||||||
|
Expected long-term rate of return
|
7.8
|
%
|
8.0
|
%
|
8.2
|
%
|
6.0
|
%
|
6.5
|
%
|
6.8
|
%
|
N/A
|
|
N/A
|
|
N/A
|
|
||||||||
|
Rate of compensation increase
|
N/A
|
|
N/A
|
|
N/A
|
|
3.0
|
%
|
3.0
|
%
|
3.3
|
%
|
N/A
|
|
N/A
|
|
N/A
|
|
||||||||
The weighted average health care cost trend rates used to determine post-retirement benefit obligations and net periodic benefit cost (income) as of
December 31, 2016
,
2015
, and
2014
were as follows:
|
Post-retirement
|
||||||||
|
2016
|
2015
|
2014
|
||||||
|
Health care cost trend rate assumed for next year
|
8
|
%
|
7
|
%
|
8
|
%
|
||
|
Rate that the cost trend rate is assumed to decline (the ultimate trend rate)
|
5
|
%
|
5
|
%
|
5
|
%
|
||
|
Year that the rate reaches the ultimate trend rate
|
2025
|
|
2024
|
|
2023
|
|
||
69
ACCO Brands Corporation and Subsidiaries
Notes to Consolidated Financial Statements (Continued)
Assumed health care cost trend rates may have a significant effect on the amounts reported for the health care plans. A one-percentage-point change in assumed health care cost trend rates would have the following effects:
|
1-Percentage-
|
1-Percentage-
|
||||||
|
(in millions of dollars)
|
Point Increase
|
Point Decrease
|
|||||
|
Increase (decrease) on total of service and interest cost
|
$
|
—
|
|
$
|
—
|
|
|
|
Increase (decrease) on post-retirement benefit obligation
|
0.5
|
|
(0.4
|
)
|
|||
Plan Assets
The investment strategy for the Company is to optimize investment returns through a diversified portfolio of investments, taking into consideration underlying plan liabilities and asset volatility. Each plan has a different target asset allocation, which is reviewed periodically and is based on the underlying liability structure. The target asset allocation for our U.S. plan is
65%
in equity securities,
20%
in fixed income securities and
15%
in alternative assets. The target asset allocation for non-U.S. plans is set by the local plan trustees.
Our pension plan weighted average asset allocations as of
December 31, 2016
and
2015
were as follows:
|
2016
|
2015
|
|||||||||||
|
U.S.
|
International
|
U.S.
|
International
|
|||||||||
|
Asset category
|
||||||||||||
|
Equity securities
|
68
|
%
|
33
|
%
|
61
|
%
|
45
|
%
|
||||
|
Fixed income
|
25
|
|
51
|
|
31
|
|
39
|
|
||||
|
Real estate
|
—
|
|
3
|
|
—
|
|
4
|
|
||||
|
Other
(2)
|
7
|
|
13
|
|
8
|
|
12
|
|
||||
|
Total
|
100
|
%
|
100
|
%
|
100
|
%
|
100
|
%
|
||||
|
(2)
|
Insurance contracts, multi-strategy hedge funds and cash and cash equivalents for certain of our plans.
|
U.S. Pension Plan Assets
The fair value measurements of our U.S. pension plan assets by asset category as of
December 31, 2016
were as follows:
|
(in millions of dollars)
|
Quoted Prices
in Active Markets for Identical Assets (Level 1) |
Significant
Other Observable Inputs (Level 2) |
Significant
Unobservable Inputs (Level 3) |
Fair Value
as of December 31, 2016 |
|||||||||||
|
Mutual funds
|
$
|
89.3
|
|
$
|
—
|
|
$
|
—
|
|
$
|
89.3
|
|
|||
|
Exchange traded funds
|
13.5
|
|
—
|
|
—
|
|
13.5
|
|
|||||||
|
Common collective trust funds
|
—
|
|
7.9
|
|
—
|
|
7.9
|
|
|||||||
|
Corporate debt securities
|
—
|
|
16.3
|
|
—
|
|
16.3
|
|
|||||||
|
Asset-backed securities
|
—
|
|
3.4
|
|
—
|
|
3.4
|
|
|||||||
|
Government mortgage-backed securities
|
—
|
|
5.4
|
|
—
|
|
5.4
|
|
|||||||
|
Collateralized mortgage obligations, mortgage backed securities, and other
|
—
|
|
5.2
|
|
—
|
|
5.2
|
|
|||||||
|
Investments measured at net asset value
(3)
|
|||||||||||||||
|
Multi-strategy hedge funds
|
9.5
|
|
|||||||||||||
|
Total
|
$
|
102.8
|
|
$
|
38.2
|
|
$
|
—
|
|
$
|
150.5
|
|
|||
70
ACCO Brands Corporation and Subsidiaries
Notes to Consolidated Financial Statements (Continued)
The fair value measurements of our U.S. pension plan assets by asset category as of
December 31, 2015
were as follows:
|
(in millions of dollars)
|
Quoted Prices
in Active Markets for Identical Assets (Level 1) |
Significant
Other Observable Inputs (Level 2) |
Significant
Unobservable Inputs (Level 3) |
Fair Value
as of December 31, 2015 |
|||||||||||
|
Common stocks
|
$
|
6.9
|
|
$
|
—
|
|
$
|
—
|
|
$
|
6.9
|
|
|||
|
Mutual funds
|
82.6
|
|
—
|
|
—
|
|
82.6
|
|
|||||||
|
Common collective trust funds
|
—
|
|
2.1
|
|
—
|
|
2.1
|
|
|||||||
|
Government debt securities
|
—
|
|
3.1
|
|
—
|
|
3.1
|
|
|||||||
|
Corporate debt securities
|
—
|
|
19.0
|
|
—
|
|
19.0
|
|
|||||||
|
Asset-backed securities
|
—
|
|
8.8
|
|
—
|
|
8.8
|
|
|||||||
|
Government mortgage-backed securities
|
—
|
|
7.3
|
|
—
|
|
7.3
|
|
|||||||
|
Collateralized mortgage obligations, mortgage backed securities, and other
|
—
|
|
6.8
|
|
—
|
|
6.8
|
|
|||||||
|
Investments measured at net asset value
(3)
|
|||||||||||||||
|
Multi-strategy hedge funds
|
9.2
|
|
|||||||||||||
|
Total
|
$
|
89.5
|
|
$
|
47.1
|
|
$
|
—
|
|
$
|
145.8
|
|
|||
Mutual funds, common stocks and exchange traded funds:
The fair values of mutual fund and common stock fund investments are determined by obtaining quoted prices on nationally recognized securities exchanges (level 1 inputs).
Common collective trusts
: The fair values of participation units held in common collective trusts are based on their net asset values, as reported by the managers of the common collective trusts and as supported by the unit prices of actual purchase and sale transactions occurring as of or close to the financial statement date (level 2 inputs).
Debt securities:
Fixed income securities, such as corporate and government bonds, collateralized mortgage obligations, asset-backed securities, government mortgage-backed securities and other debt securities are valued using quotes from independent pricing vendors based on recent trading activity and other relevant information, including market interest rate curves, referenced credit spreads, and estimated prepayment rates, where applicable (level 2 inputs).
International Pension Plans Assets
The fair value measurements of our international pension plans assets by asset category as of
December 31, 2016
were as follows:
|
(in millions of dollars)
|
Quoted Prices
in Active Markets for Identical Assets (Level 1) |
Significant
Other Observable Inputs (Level 2) |
Significant
Unobservable Inputs (Level 3) |
Fair Value
as of December 31, 2016 |
|||||||||||
|
Cash and cash equivalents
|
$
|
0.5
|
|
$
|
—
|
|
$
|
—
|
|
$
|
0.5
|
|
|||
|
Equity securities
|
99.2
|
|
—
|
|
—
|
|
99.2
|
|
|||||||
|
Corporate debt securities
|
—
|
|
145.3
|
|
—
|
|
145.3
|
|
|||||||
|
Multi-strategy hedge funds
|
—
|
|
20.2
|
|
—
|
|
20.2
|
|
|||||||
|
Insurance contracts
|
—
|
|
17.8
|
|
—
|
|
17.8
|
|
|||||||
|
Government debt securities
|
—
|
|
10.1
|
|
—
|
|
10.1
|
|
|||||||
|
Investments measured at net asset value
(3)
|
|||||||||||||||
|
Real estate
|
9.6
|
|
|||||||||||||
|
Total
|
$
|
99.7
|
|
$
|
193.4
|
|
$
|
—
|
|
$
|
302.7
|
|
|||
71
ACCO Brands Corporation and Subsidiaries
Notes to Consolidated Financial Statements (Continued)
The fair value measurements of our international pension plans assets by asset category as of
December 31, 2015
were as follows:
|
(in millions of dollars)
|
Quoted Prices
in Active Markets for Identical Assets (Level 1) |
Significant
Other Observable Inputs (Level 2) |
Significant
Unobservable Inputs (Level 3) |
Fair Value
as of December 31, 2015 |
|||||||||||
|
Cash and cash equivalents
|
$
|
1.2
|
|
$
|
—
|
|
$
|
—
|
|
$
|
1.2
|
|
|||
|
Equity securities
|
142.6
|
|
—
|
|
—
|
|
142.6
|
|
|||||||
|
Corporate debt securities
|
—
|
|
121.6
|
|
—
|
|
121.6
|
|
|||||||
|
Multi-strategy hedge funds
|
—
|
|
23.7
|
|
—
|
|
23.7
|
|
|||||||
|
Insurance contracts
|
—
|
|
15.3
|
|
—
|
|
15.3
|
|
|||||||
|
Government debt securities
|
—
|
|
3.2
|
|
—
|
|
3.2
|
|
|||||||
|
Investments measured at net asset value
(3)
|
|||||||||||||||
|
Real estate
|
11.3
|
|
|||||||||||||
|
Total
|
$
|
143.8
|
|
$
|
163.8
|
|
$
|
—
|
|
$
|
318.9
|
|
|||
|
(3)
|
Certain investments that are measured at fair value using the net asset value per share practical expedient have not been categorized in the fair value hierarchy. The fair value amounts presented in these tables are intended to permit reconciliation of the fair value hierarchy to the amounts presented in the table that presents our defined benefit pension and post-retirement plans funded status.
|
Equity securities:
The fair values of equity securities are determined by obtaining quoted prices on nationally recognized securities exchanges (level 1 inputs).
Debt securities:
Fixed income securities, such as corporate and government bonds and other debt securities, consist of index-linked securities. These debt securities are valued using quotes from independent pricing vendors based on recent trading activity and other relevant information, including market interest rate curves, referenced credit spreads, and estimated prepayment rates, where applicable (level 2 inputs).
Insurance contracts:
Valued at contributions made, plus earnings, less participant withdrawals and administrative expenses, which approximate fair value (level 2 inputs).
Multi-strategy hedge funds
: The fair values of participation units held in multi-strategy hedge funds are based on their net asset values, as reported by the managers of the funds and are based on the daily closing prices of the underlying investments (level 2 inputs).
Cash Contributions
We contributed
$6.2 million
to our pension and post-retirement plans in
2016
and expect to contribute
$10.7 million
in
2017
.
The following table presents estimated future benefit payments to participants for the next ten fiscal years:
|
Pension
|
Post-retirement
|
||||||
|
(in millions of dollars)
|
Benefits
|
Benefits
|
|||||
|
2017
|
$
|
23.0
|
|
$
|
0.6
|
|
|
|
2018
|
23.7
|
|
0.6
|
|
|||
|
2019
|
24.0
|
|
0.6
|
|
|||
|
2020
|
24.7
|
|
0.5
|
|
|||
|
2021
|
25.1
|
|
0.5
|
|
|||
|
Years 2022 - 2026
|
134.4
|
|
2.3
|
|
|||
72
ACCO Brands Corporation and Subsidiaries
Notes to Consolidated Financial Statements (Continued)
We also sponsor a number of defined contribution plans. Contributions are determined under various formulas. Costs related to such plans amounted to
$11.3 million
,
$9.8 million
and
$8.6 million
for the years ended
December 31, 2016
,
2015
, and
2014
, respectively. The increase of
$1.5 million
in defined contribution plan costs in 2016 compared to 2015 is due to the PA Acquisition and additional matching contributions in the U.S. The
$1.2 million
increase in defined contribution plan costs in 2015 compared to 2014 was due to additional contributions for certain hourly employees who agreed to have their pension benefits frozen.
Multi-Employer Pension Plan
We are a participant in a multi-employer pension plan. The plan has reported significant underfunded liabilities and declared itself in critical and declining status (red). As a result, the trustees of the plan adopted a rehabilitation plan (RP) in an effort to forestall insolvency. Our required contributions to this plan could increase due to the shrinking contribution base resulting from the insolvency of or withdrawal of other participating employers, from the inability or the failure of withdrawing participating employers to pay their withdrawal liability, from lower than expected returns on pension fund assets, and from other funding deficiencies. In the event that we withdraw from participation in the plan, we will be required to make withdrawal liability payments for a period of
20
years or longer in certain circumstances. The present value of our withdrawal liability payments would be recorded as an expense in our
Consolidated Statements of Income
and as a liability on our Consolidated Balance Sheets in the first year of our withdrawal. The most recent Pension Protection Act (PPA) zone status available in
2016
and
2015
is for the plan’s years ended
December 31, 2015
and
2014
, respectively. The zone status is based on information that we received from the plan and is certified by the plan’s actuary. Plans in the red zone are generally less than 65 percent funded, plans in the yellow zone are less than 80 percent funded, and plans in the green zone are at least 80 percent funded. Details regarding the plan are outlined in the table below.
|
Pension Protection Act Zone Status
|
FIP/RP Status Pending/Implemented
|
Contributions
|
Expiration Date of Collective-Bargaining Agreement
|
|||||||||||||||||||||
|
Year Ended December 31,
|
||||||||||||||||||||||||
|
Pension Fund
|
EIN/Pension Plan Number
|
2016
|
2015
|
2016
|
2015
|
2014
|
Surcharge Imposed
|
|||||||||||||||||
|
PACE Industry Union-Management Pension Fund
|
11-6166763 / 001
|
Red
|
Red
|
Implemented
|
$
|
0.3
|
|
$
|
0.3
|
|
$
|
0.4
|
|
Yes
|
6/30/2017
|
|||||||||
6. Stock-Based Compensation
The ACCO Brands Corporation Incentive Plan provides for stock based awards in the form of stock options, stock-settled appreciation rights ("SSARs"), restricted stock units ("RSUs") and performance stock units ("PSUs"), any of which may be granted alone or with other types of awards and dividend equivalents. We have
one
share-based compensation plan under which a total of
13,118,430
shares may be issued under awards to key employees and non-employee directors.
The following table summarizes the impact of all stock-based compensation expense on our
Consolidated Statements of Income
for the years ended
December 31, 2016
,
2015
and
2014
.
|
(in millions of dollars)
|
2016
|
2015
|
2014
|
||||||||
|
Advertising, selling, general and administrative expense
|
$
|
19.4
|
|
$
|
16.0
|
|
$
|
15.7
|
|
||
|
Loss before income tax
|
(19.4
|
)
|
(16.0
|
)
|
(15.7
|
)
|
|||||
|
Income tax benefit
|
(7.0
|
)
|
(5.7
|
)
|
(5.7
|
)
|
|||||
|
Net (loss)
|
$
|
(12.4
|
)
|
$
|
(10.3
|
)
|
$
|
(10.0
|
)
|
||
There was no capitalization of stock-based compensation expense.
Stock-based compensation expense by award type for the years ended
December 31, 2016
,
2015
and
2014
was as follows:
|
(in millions of dollars)
|
2016
|
2015
|
2014
|
||||||||
|
Stock option compensation expense
|
$
|
2.9
|
|
$
|
3.9
|
|
$
|
3.7
|
|
||
|
RSU compensation expense
|
4.5
|
|
4.7
|
|
6.6
|
|
|||||
|
PSU compensation expense
|
12.0
|
|
7.4
|
|
5.4
|
|
|||||
|
Total stock-based compensation expense
|
$
|
19.4
|
|
$
|
16.0
|
|
$
|
15.7
|
|
||
73
ACCO Brands Corporation and Subsidiaries
Notes to Consolidated Financial Statements (Continued)
Stock Option and SSAR Awards
The exercise price of each stock option equals or exceeds the fair market price of our stock on the date of grant. Options can generally be exercised over a maximum term of up to seven years. Stock options outstanding as of
December 31, 2016
generally vest ratably over three years. During
2016
, we did not grant option or SSAR awards and in
2015
and
2014
, we granted only option awards. The fair value of each option grant is estimated on the date of grant using the Black-Scholes option-pricing model and the weighted average assumptions as outlined in the following table:
|
Year Ended December 31,
|
|||||||||
|
2015
|
2014
|
||||||||
|
Weighted average expected lives
|
4.5
|
|
years
|
4.5
|
|
years
|
|||
|
Weighted average risk-free interest rate
|
1.47
|
|
%
|
1.33
|
|
%
|
|||
|
Weighted average expected volatility
|
46.5
|
|
%
|
52.2
|
|
%
|
|||
|
Expected dividend yield
|
0.0
|
|
%
|
0.0
|
|
%
|
|||
|
Weighted average grant date fair value
|
$
|
3.00
|
|
$
|
2.69
|
|
|||
Volatility was calculated using ACCO Brands' historic volatility. The weighted average expected option term reflects the application of the simplified method, which defines the life as the average of the contractual term of the option and the weighted average vesting period for all option tranches. The risk-free interest rate for the expected term of the option is based on the U.S. Treasury yield curve in effect at the time of grant. Forfeitures are estimated at the time of grant in order to calculate the amount of share-based payment awards ultimately expected to vest. The forfeiture rate is based on historical experience.
A summary of the changes in stock options/SSARs outstanding under our stock compensation plan during the year ended
December 31, 2016
are presented below:
|
Number
Outstanding |
Weighted
Average Exercise Price |
Weighted Average
Remaining Contractual Term |
Aggregate
Intrinsic Value |
|||||||||
|
Outstanding at December 31, 2015
|
5,583,531
|
|
$
|
7.20
|
|
|||||||
|
Exercised
|
(1,359,515
|
)
|
$
|
5.30
|
|
|||||||
|
Lapsed
|
(90,142
|
)
|
$
|
7.35
|
|
|||||||
|
Outstanding at December 31, 2016
|
4,133,874
|
|
$
|
7.82
|
|
3.8 years
|
$
|
21.6
|
million
|
|||
|
Options vested or expected to vest
|
4,099,827
|
|
$
|
7.83
|
|
3.8 years
|
$
|
21.4
|
million
|
|||
|
Exercisable shares at December 31, 2016
|
2,782,697
|
|
$
|
8.20
|
|
3.2 years
|
$
|
13.5
|
million
|
|||
We received cash of
$6.8 million
,
$0.7 million
and
$0.3 million
from the exercise of stock options for the years ended
December 31, 2016
,
2015
and
2014
, respectively. The aggregate intrinsic value of options exercised during the years ended
December 31, 2016
and
2015
totaled
$3.5 million
and
$0.7 million
, respectively. For the year ended
December 31, 2014
the aggregate intrinsic value of options exercised was not significant.
The aggregate intrinsic value of SSARs exercised during the years ended
December 31, 2016
,
2015
and
2014
totaled
$2.9 million
,
$2.0 million
and
$3.6 million
, respectively. As of
December 31, 2016
there were no SSARs outstanding.
The fair value of options vested during the years ended
December 31, 2016
,
2015
and
2014
was
$4.1 million
,
$3.8 million
and
$3.2 million
, respectively. As of
December 31, 2016
, we had unrecognized compensation expense related to stock options of
$1.7 million
, which will be recognized over a weighted-average period of
0.8
years.
74
ACCO Brands Corporation and Subsidiaries
Notes to Consolidated Financial Statements (Continued)
Stock Unit Awards
RSUs vest over a pre-determined period of time, generally three years from the date of grant. Stock-based compensation expense for the years ended
December 31, 2016
,
2015
and
2014
includes
$0.9 million
,
$0.8 million
and
$0.8 million
, respectively, of expense that consisted of shares of stock (included in RSU compensation expense) and RSUs granted to non-employee directors, which became fully vested on the grant date. PSUs also vest over a pre-determined period of time, minimally three years, but are further subject to the achievement of certain business performance criteria in future periods. Based upon the level of achieved performance, the number of shares actually awarded can vary from
0%
to
150%
of the original grant.
There were
1,910,669
RSUs outstanding as of
December 31, 2016
. All outstanding RSUs as of
December 31, 2016
vest within three years of their date of grant. We generally recognize compensation expense for our RSU awards ratably over the service period. Also outstanding as of
December 31, 2016
were
4,281,792
PSUs. All outstanding PSUs as of
December 31, 2016
vest at the end of their respective performance periods subject to percentage achieved of the performance targets associated with such awards. Upon vesting, all of the remaining RSU and PSU awards will be converted into the right to receive one share of common stock of the Company for each unit that vests. The cost of these awards is determined using the fair value of the shares on the date of grant, and compensation expense is generally recognized over the period during which the employee provides the requisite service to the Company. We generally recognize compensation expense for our PSU awards ratably over the performance period based on management’s judgment of the likelihood that performance measures will be attained.
A summary of the changes in the RSUs outstanding under our equity compensation plan during
2016
are presented below:
|
Stock
Units |
Weighted
Average Grant Date Fair Value |
|||||
|
Outstanding at December 31, 2015
|
2,007,127
|
|
$
|
7.11
|
|
|
|
Granted
|
516,739
|
|
$
|
8.05
|
|
|
|
Vested and distributed
|
(577,997
|
)
|
$
|
7.56
|
|
|
|
Forfeited and cancelled
|
(35,200
|
)
|
$
|
6.88
|
|
|
|
Outstanding at December 31, 2016
|
1,910,669
|
|
$
|
7.23
|
|
|
|
Vested and deferred at December 31, 2016
(1)
|
295,453
|
|
$
|
8.51
|
|
|
|
(1)
|
Included in outstanding at
December 31, 2016
. Vested and deferred RSUs are primarily related to deferred compensation for non-employee directors.
|
For the years ended
December 31, 2015
and
2014
we granted
668,619
and
881,554
shares of RSUs, respectively. The weighted-average grant date fair value of our RSUs was
$8.05
,
$7.58
, and
$6.12
for the years ended
December 31, 2016
,
2015
and
2014
, respectively. The fair value of RSUs that vested during the years ended
December 31, 2016
,
2015
and
2014
was
$5.2 million
,
$10.3 million
and
$3.2 million
, respectively. As of
December 31, 2016
, we have unrecognized compensation expense related to RSUs of
$3.6 million
. The unrecognized compensation expense related to RSUs will be recognized over a weighted-average period of
1.7
years.
A summary of the changes in the PSUs outstanding under our equity compensation plan during
2016
are presented below:
|
Stock
Units |
Weighted
Average Grant Date Fair Value |
|||||
|
Outstanding at December 31, 2015
|
3,197,735
|
|
$
|
7.07
|
|
|
|
Granted
|
1,013,242
|
|
$
|
7.65
|
|
|
|
Vested
|
(1,072,692
|
)
|
$
|
7.58
|
|
|
|
Forfeited and cancelled
|
(58,959
|
)
|
$
|
7.21
|
|
|
|
Other - increase due to performance of PSU's
|
1,202,466
|
|
$
|
7.08
|
|
|
|
Outstanding at December 31, 2016
|
4,281,792
|
|
$
|
7.09
|
|
|
75
ACCO Brands Corporation and Subsidiaries
Notes to Consolidated Financial Statements (Continued)
For the years ended
December 31, 2015
and
2014
we granted
1,017,702
and
1,316,867
shares of PSUs, respectively. For the years ended
December 31, 2016
,
2015
and
2014
,
1,072,692
,
697,172
and
496,926
shares of PSUs vested, respectively. The weighted-average grant date fair value of our PSUs was
$7.65
,
$7.52
, and
$6.14
for the years ended
December 31, 2016
,
2015
and
2014
, respectively. The fair value of PSUs that vested during the years ended
December 31, 2016
,
2015
and
2014
was
$8.1 million
,
$5.4 million
and
$4.4 million
respectively. As of
December 31, 2016
, we have unrecognized compensation expense related to PSUs of
$10.1 million
. The unrecognized compensation expense related to PSUs will be recognized over a weighted-average period of
1.7
years.
We will satisfy the requirement for delivering the common shares for our stock-based plan by issuing new shares.
7. Inventories
Inventories are stated at the lower of cost or market value. The components of inventories were as follows:
|
December 31,
|
|||||||
|
(in millions of dollars)
|
2016
|
2015
|
|||||
|
Raw materials
|
$
|
30.3
|
|
$
|
33.3
|
|
|
|
Work in process
|
3.0
|
|
2.6
|
|
|||
|
Finished goods
|
176.7
|
|
167.7
|
|
|||
|
Total inventories
|
$
|
210.0
|
|
$
|
203.6
|
|
|
8. Property, Plant and Equipment, Net
The components of net property, plant and equipment were as follows:
|
December 31,
|
|||||||
|
(in millions of dollars)
|
2016
|
2015
|
|||||
|
Land and improvements
|
$
|
18.9
|
|
$
|
17.6
|
|
|
|
Buildings and improvements to leaseholds
|
119.1
|
|
120.0
|
|
|||
|
Machinery and equipment
|
382.0
|
|
358.5
|
|
|||
|
Construction in progress
|
8.0
|
|
30.0
|
|
|||
|
528.0
|
|
526.1
|
|
||||
|
Less: accumulated depreciation
|
(329.6
|
)
|
(317.0
|
)
|
|||
|
Property, plant and equipment, net
(1)
|
$
|
198.4
|
|
$
|
209.1
|
|
|
|
(1)
|
Net property, plant and equipment as of
December 31, 2016
and
2015
contained
$34.7 million
and
$40.7 million
of computer software assets, which are classified within machinery and equipment and construction in progress. Amortization of software costs was
$7.0 million
,
$6.1 million
and
$7.4 million
for the years ended
December 31, 2016
,
2015
and
2014
, respectively.
|
76
ACCO Brands Corporation and Subsidiaries
Notes to Consolidated Financial Statements (Continued)
9. Goodwill and Identifiable Intangible Assets
Goodwill
Changes in the net carrying amount of goodwill by segment were as follows:
|
(in millions of dollars)
|
ACCO
Brands
North America
|
ACCO
Brands
International
|
Computer
Products
Group
|
Total
|
||||||||||||
|
Balance at December 31, 2014
|
$
|
387.6
|
|
$
|
150.5
|
|
$
|
6.8
|
|
$
|
544.9
|
|
||||
|
Translation
|
(10.1
|
)
|
(37.9
|
)
|
—
|
|
(48.0
|
)
|
||||||||
|
Balance at December 31, 2015
|
377.5
|
|
112.6
|
|
6.8
|
|
496.9
|
|
||||||||
|
PA Acquisition
|
—
|
|
80.5
|
|
—
|
|
80.5
|
|
||||||||
|
Translation
|
1.5
|
|
8.2
|
|
—
|
|
9.7
|
|
||||||||
|
Balance at December 31, 2016
|
$
|
379.0
|
|
$
|
201.3
|
|
$
|
6.8
|
|
$
|
587.1
|
|
||||
|
Goodwill
|
$
|
509.9
|
|
$
|
285.5
|
|
$
|
6.8
|
|
$
|
802.2
|
|
||||
|
Accumulated impairment losses
|
(130.9
|
)
|
(84.2
|
)
|
—
|
|
(215.1
|
)
|
||||||||
|
Balance at December 31, 2016
|
$
|
379.0
|
|
$
|
201.3
|
|
$
|
6.8
|
|
$
|
587.1
|
|
||||
Goodwill has been recorded on our balance sheet related to the PA Acquisition and represents the excess of the cost of the PA Acquisition when compared to the fair value estimate of the net assets acquired on May 2, 2016 (the date of the PA Acquisition). See
Note 3. Acquisition
,
for details on the calculation of the goodwill acquired in the PA Acquisition.
The authoritative guidance on goodwill and other intangible assets requires that goodwill be tested for impairment at a reporting unit level. We have determined that our reporting units are the ACCO Brands North America, ACCO Brands International and Computer Products Group segments. We test goodwill for impairment at least annually and on an interim basis if an event or circumstance indicates that it is more likely than not that an impairment loss has been incurred. The Company performed this annual assessment, on a qualitative basis, as allowed by GAAP, in the second quarter of 2016 and concluded that no impairment existed.
A considerable amount of management judgment and assumptions are required in performing the impairment tests, principally in determining the fair value of each reporting unit and the indefinite lived intangible assets. While we believe our judgments and assumptions are reasonable, different assumptions could change the estimated fair values and, therefore, impairment charges could be required. Significant negative industry or economic trends, disruptions to our business, loss of significant customers, inability to effectively integrate acquired businesses, unexpected significant changes or planned changes in the use of the assets or in entity structure and divestitures may adversely impact the assumptions used in the valuations and ultimately result in future impairment charges.
Identifiable Intangibles
We test indefinite-lived intangibles for impairment at least annually and on an interim basis if an event or circumstance indicates that it is more likely than not that an impairment loss has been incurred. We performed this annual assessment, on a qualitative basis, as allowed by GAAP, for the majority of indefinite-lived trade names in the second quarter of
2016
and concluded that no impairment exists. For two of our indefinite-lived trade names that are not substantially above their carrying values, Mead
®
and Hilroy
®
, we performed quantitative tests (Step 1) in the second quarter of 2016. The following long-term growth rates and discount rates were used,
1.5%
and
10.0%
for Mead
®
, and
1.5%
and
10.5%
for Hilroy
®
, respectively. We concluded that neither Mead
®
nor Hilroy
®
were impaired.
In the fourth quarter of 2015, we performed a quantitative test, as we identified the recession in Brazil as a triggering event related to our trade name, Tilibra
®
, primarily used in Brazil. While we concluded that no impairment existed, the trade name's fair value has been significantly reduced. Key financial assumptions utilized to determine the fair value of the Tilibra
®
trade name included a long-term growth rate of
6.5%
and a
14.5%
discount rate. In 2016, the Tilibra
®
trade name has over performed the forecast used in the fourth quarter of 2015 quantitative test; however, the economic conditions in Brazil could deteriorate further triggering additional future reviews.
77
ACCO Brands Corporation and Subsidiaries
Notes to Consolidated Financial Statements (Continued)
The fair values of the Mead
®
, Tilibra
®
and Hilroy
®
trade names are less than
30%
above their carrying values. As of
December 31, 2016
, the carrying values of those trade names were as follows: Mead
®
(
$113.3 million
), Tilibra
®
(
$63.0 million
) and Hilroy
®
(
$11.8 million
).
The identifiable intangible assets of
$58.0 million
acquired in the PA Acquisition include amortizable customer relationships and trade names and were recorded at their estimated fair values. The values assigned were based on the estimated future discounted cash flows attributable to the assets. These future cash flows were estimated based on the historical cash flows and then adjusted for anticipated future changes, primarily expected changes in sales volume or price.
Amortizable customer relationships and trade names are being amortized over lives ranging from 12 to 30 years from the PA Acquisition date of May 2, 2016. The customer relationships are being amortized on an accelerated basis. The allocations of the identifiable intangibles acquired in the PA Acquisition are as follows:
|
(in millions of dollars)
|
Fair Value
|
Remaining Useful Life Ranges
|
|||
|
Customer relationships
|
$
|
36.0
|
|
12 Years
|
|
|
Trade names - amortizable
|
22.0
|
|
12-30 Years
|
||
|
Total identifiable intangibles acquired
|
$
|
58.0
|
|
||
The gross carrying value and accumulated amortization by class of identifiable intangible assets as of
December 31, 2016
and
2015
were as follows:
|
December 31, 2016
|
December 31, 2015
|
||||||||||||||||||||||
|
(in millions of dollars)
|
Gross
Carrying Amounts |
Accumulated
Amortization |
Net
Book Value |
Gross
Carrying Amounts |
Accumulated
Amortization |
Net
Book Value |
|||||||||||||||||
|
Indefinite-lived intangible assets:
|
|||||||||||||||||||||||
|
Trade names
|
$
|
483.3
|
|
$
|
(44.5
|
)
|
(1)
|
$
|
438.8
|
|
$
|
471.8
|
|
$
|
(44.5
|
)
|
(1)
|
$
|
427.3
|
|
|||
|
Amortizable intangible assets:
|
|||||||||||||||||||||||
|
Trade names
|
121.2
|
|
(48.8
|
)
|
72.4
|
|
122.6
|
|
(61.7
|
)
|
60.9
|
|
|||||||||||
|
Customer and contractual relationships
|
128.3
|
|
(73.8
|
)
|
54.5
|
|
95.8
|
|
(63.1
|
)
|
32.7
|
|
|||||||||||
|
Subtotal
|
249.5
|
|
(122.6
|
)
|
126.9
|
|
218.4
|
|
(124.8
|
)
|
93.6
|
|
|||||||||||
|
Total identifiable intangibles
|
$
|
732.8
|
|
$
|
(167.1
|
)
|
$
|
565.7
|
|
$
|
690.2
|
|
$
|
(169.3
|
)
|
$
|
520.9
|
|
|||||
|
(1)
|
Accumulated amortization prior to the adoption of authoritative guidance on goodwill and other intangible assets, at which time further amortization ceased.
|
The Company’s intangible amortization was $
21.6 million
, $
19.6 million
and $
22.2 million
for the years ended
December 31, 2016
,
2015
and
2014
, respectively.
Estimated amortization expense for amortizable intangible assets for the next five years is as follows:
|
(in millions of dollars)
|
2017
|
2018
|
2019
|
2020
|
2021
|
||||||||||||||
|
Estimated amortization expense
(2)
|
$
|
20.1
|
|
$
|
17.5
|
|
$
|
15.0
|
|
$
|
12.4
|
|
$
|
9.9
|
|
||||
|
(2)
|
Actual amounts of amortization expense may differ from estimated amounts due to changes in foreign currency exchange rates, additional intangible asset acquisitions, impairment of intangible assets, accelerated amortization of intangible assets and other events.
|
78
ACCO Brands Corporation and Subsidiaries
Notes to Consolidated Financial Statements (Continued)
10. Restructuring
During 2016, the Company initiated cost savings plans related to the consolidation and integration of the recently acquired Pelikan Artline business into the Company's already existing Australia and New Zealand business. Included in these plans are exit costs and liabilities associated with facility lease exits of
$1.0 million
and an IT contract termination of
$0.7 million
that were not recorded yet pursuant to GAAP rules. In addition, the Company initiated additional cost savings plans to further enhance its North America operations.
During 2014, we initiated restructuring actions that further enhanced our ongoing efforts to centralize, control and streamline our global and regional operational, supply chain and administrative functions, primarily associated with our North American school, office and Computer Products Group workforce. The remaining balance reported at December 31, 2015 has been substantially paid in 2016.
For the years ended
December 31, 2016
,
2015
and
2014
, we recorded restructuring charges (credits) of
$5.4 million
,
$(0.4) million
and
$5.5 million
, respectively.
A summary of the activity in the restructuring accounts and a reconciliation of the liability for the year ended
December 31, 2016
was as follows:
|
(in millions of dollars)
|
Balance at December 31, 2015
|
Provision
|
Cash
Expenditures |
Balance at December 31, 2016
|
|||||||||||
|
Employee termination costs
|
$
|
0.9
|
|
$
|
5.2
|
|
$
|
(4.7
|
)
|
$
|
1.4
|
|
|||
|
Termination of lease agreements
|
0.1
|
|
0.2
|
|
(0.2
|
)
|
0.1
|
|
|||||||
|
Total restructuring liability
|
$
|
1.0
|
|
$
|
5.4
|
|
$
|
(4.9
|
)
|
$
|
1.5
|
|
|||
Management expects the
$1.4 million
employee termination costs balance to be substantially paid within the next
twelve
months.
A summary of the activity in the restructuring accounts and a reconciliation of the liability for the year ended
December 31, 2015
was as follows:
|
(in millions of dollars)
|
Balance at December 31, 2014
|
Provision/(Credits)
|
Cash
Expenditures |
Non-cash
Items/ Currency Change |
Balance at December 31, 2015
|
||||||||||||||
|
Employee termination costs
|
$
|
7.8
|
|
$
|
(0.6
|
)
|
$
|
(6.0
|
)
|
$
|
(0.3
|
)
|
$
|
0.9
|
|
||||
|
Termination of lease agreements
|
0.6
|
|
0.2
|
|
(0.7
|
)
|
—
|
|
0.1
|
|
|||||||||
|
Total restructuring liability
|
$
|
8.4
|
|
$
|
(0.4
|
)
|
$
|
(6.7
|
)
|
$
|
(0.3
|
)
|
$
|
1.0
|
|
||||
The Company's manufacturing facility located in the Czech Republic was sold during the second quarter of 2015 and generated net cash proceeds of
$1.0 million
. An immaterial gain was recognized on the sale and the cash proceeds are excluded from the table above.
A summary of the activity in the restructuring accounts and a reconciliation of the liability for the year ended
December 31, 2014
was as follows:
|
(in millions of dollars)
|
Balance at December 31, 2013
|
Provision
|
Cash
Expenditures |
Non-cash
Items/ Currency Change |
Balance at December 31, 2014
|
||||||||||||||
|
Employee termination costs
|
$
|
19.1
|
|
$
|
4.3
|
|
$
|
(15.3
|
)
|
$
|
(0.3
|
)
|
$
|
7.8
|
|
||||
|
Termination of lease agreements
|
1.4
|
|
0.5
|
|
(1.5
|
)
|
0.2
|
|
0.6
|
|
|||||||||
|
Asset impairments/net loss on disposal of assets resulting from restructuring activities
|
—
|
|
0.6
|
|
—
|
|
(0.6
|
)
|
—
|
|
|||||||||
|
Other
|
—
|
|
0.1
|
|
(0.1
|
)
|
—
|
|
—
|
|
|||||||||
|
Total restructuring liability
|
$
|
20.5
|
|
$
|
5.5
|
|
$
|
(16.9
|
)
|
$
|
(0.7
|
)
|
$
|
8.4
|
|
||||
79
ACCO Brands Corporation and Subsidiaries
Notes to Consolidated Financial Statements (Continued)
The Company's East Texas, Pennsylvania manufacturing and distribution facility was sold during 2014 and generated net cash proceeds of
$3.2 million
. An immaterial loss was recognized on the sale and the cash proceeds are excluded from the table above.
11. Income Taxes
The components of income from continuing operations before income tax were as follows:
|
(in millions of dollars)
|
2016
|
2015
|
2014
|
||||||||
|
Domestic operations
|
$
|
33.9
|
|
$
|
60.9
|
|
$
|
43.5
|
|
||
|
Foreign operations
|
91.2
|
|
70.5
|
|
93.5
|
|
|||||
|
Total
|
$
|
125.1
|
|
$
|
131.4
|
|
$
|
137.0
|
|
||
The reconciliation of income taxes computed at the U.S. federal statutory income tax rate of 35% to our effective income tax rate for continuing operations was as follows:
|
(in millions of dollars)
|
2016
|
2015
|
2014
|
||||||||
|
Income tax at U.S. statutory rate of 35%
|
$
|
43.8
|
|
$
|
46.0
|
|
$
|
47.9
|
|
||
|
State, local and other tax, net of federal benefit
|
2.4
|
|
2.1
|
|
2.1
|
|
|||||
|
U.S. effect of foreign dividends and withholding taxes
|
4.6
|
|
3.9
|
|
7.4
|
|
|||||
|
Unrealized foreign currency expense (benefit) on intercompany debt
|
0.7
|
|
(0.7
|
)
|
(3.0
|
)
|
|||||
|
Realized foreign exchange net loss on intercompany loans
|
(9.6
|
)
|
—
|
|
—
|
|
|||||
|
Revaluation of previously held equity interest
|
(12.0
|
)
|
—
|
|
—
|
|
|||||
|
Foreign income taxed at a lower effective rate
|
(4.6
|
)
|
(5.6
|
)
|
(8.6
|
)
|
|||||
|
Interest on Brazilian Tax Assessment
|
2.8
|
|
2.7
|
|
3.2
|
|
|||||
|
Expiration of tax credits
|
10.9
|
|
1.0
|
|
11.7
|
|
|||||
|
Decrease in valuation allowance
|
(9.9
|
)
|
(1.3
|
)
|
(11.5
|
)
|
|||||
|
Other
|
0.5
|
|
(2.6
|
)
|
(3.8
|
)
|
|||||
|
Income taxes as reported
|
$
|
29.6
|
|
$
|
45.5
|
|
$
|
45.4
|
|
||
|
Effective tax rate
|
23.7
|
%
|
34.6
|
%
|
33.1
|
%
|
|||||
For
2016
, we recorded income tax expense of
$29.6 million
on income before taxes of
$125.1 million
. The lower effective rate for
2016
of
23.7%
is due to the following: 1) a tax benefit of
$12.0 million
on the previously held equity interest; due to no tax expense, under Australian tax law, on the
$28.9 million
gain arising from the PA Acquisition due to the revaluation of the Company's ownership interest to fair value and due to the release of a deferred tax liability related to a tax basis difference in the Pelikan Artline joint-venture assets, 2) a tax benefit of
$9.6 million
on a net foreign exchange loss on the repayment of intercompany loans, for which the pre-tax effect is recorded in equity and 3) earnings from foreign jurisdictions which are taxed at a lower rate. In addition, in
2016
, the Foreign Tax Credit Carryover from 2007 of
$10.9 million
expired, and the associated valuation allowance on the carryover was removed; the combination of these two items does not affect income tax expense.
For
2015
, we recorded income tax expense of
$45.5 million
on income before taxes of
$131.4 million
. The effective rate for
2015
of
34.6%
approximated the U.S. statutory tax rate of
35%
.
For
2014
, we recorded income tax expense of
$45.4 million
on income before taxes of
$137.0 million
. The effective rate for
2014
of
33.1%
was less than the U.S. statutory income tax rate primarily due to earnings from foreign jurisdictions, which are taxed at a lower rate. In
2014
, the Foreign Tax Credit Carryover from 2005 of
$11.7 million
expired; the valuation allowance was also removed; the combination of these items does not affect income tax expense.
We continually review the need for establishing or releasing valuation allowances on our deferred tax attributes. In
2016
, the Company had a net tax benefit from the release and generation of valuation allowances in U.S. state and certain foreign jurisdictions of
$0.7 million
. In
2015
, the company had a net tax expense from the release and generation of valuation allowances in U.S. state and certain foreign jurisdictions of
$0.3 million
. In
2014
, the company had a net tax expense from the release and generation of valuation allowances in U.S. state and certain foreign jurisdictions of
$0.2 million
.
80
ACCO Brands Corporation and Subsidiaries
Notes to Consolidated Financial Statements (Continued)
The U.S. federal statute of limitations remains open for the year
2013
and forward. Foreign and U.S. state jurisdictions have statutes of limitations generally ranging from
2
to
5
years. Years still open to examination by foreign tax authorities in major jurisdictions include Australia (
2012
forward), Brazil (
2011
forward), Canada (
2008
forward) and the U.K. (
2014
forward). We are currently under examination in various foreign jurisdictions.
The components of the income tax expense (benefit) from continuing operations were as follows:
|
(in millions of dollars)
|
2016
|
2015
|
2014
|
||||||||
|
Current expense
|
|||||||||||
|
Federal and other
|
$
|
0.7
|
|
$
|
2.1
|
|
$
|
1.6
|
|
||
|
Foreign
|
22.9
|
|
16.0
|
|
23.2
|
|
|||||
|
Total current income tax expense
|
23.6
|
|
18.1
|
|
24.8
|
|
|||||
|
Deferred expense
|
|||||||||||
|
Federal and other
|
3.5
|
|
22.8
|
|
15.4
|
|
|||||
|
Foreign
|
2.5
|
|
4.6
|
|
5.2
|
|
|||||
|
Total deferred income tax expense
|
6.0
|
|
27.4
|
|
20.6
|
|
|||||
|
Total income tax expense
|
$
|
29.6
|
|
$
|
45.5
|
|
$
|
45.4
|
|
||
The components of deferred tax assets (liabilities) were as follows:
|
(in millions of dollars)
|
2016
|
2015
|
|||||
|
Deferred tax assets
|
|||||||
|
Compensation and benefits
|
$
|
20.7
|
|
$
|
17.3
|
|
|
|
Pension
|
28.6
|
|
27.9
|
|
|||
|
Inventory
|
12.4
|
|
11.4
|
|
|||
|
Other reserves
|
19.1
|
|
17.1
|
|
|||
|
Accounts receivable
|
7.0
|
|
7.7
|
|
|||
|
Foreign tax credit carryforwards
|
—
|
|
10.9
|
|
|||
|
Net operating loss carryforwards
|
47.2
|
|
56.9
|
|
|||
|
Unrealized foreign currency benefit on intercompany debt
|
—
|
|
3.0
|
|
|||
|
Other
|
10.3
|
|
9.4
|
|
|||
|
Gross deferred income tax assets
|
145.3
|
|
161.6
|
|
|||
|
Valuation allowance
|
(11.7
|
)
|
(22.1
|
)
|
|||
|
Net deferred tax assets
|
133.6
|
|
139.5
|
|
|||
|
Deferred tax liabilities
|
|||||||
|
Depreciation
|
(12.6
|
)
|
(16.0
|
)
|
|||
|
Identifiable intangibles
|
(240.4
|
)
|
(240.7
|
)
|
|||
|
Gross deferred tax liabilities
|
(253.0
|
)
|
(256.7
|
)
|
|||
|
Net deferred tax liabilities
|
$
|
(119.4
|
)
|
$
|
(117.2
|
)
|
|
Deferred income taxes are not provided on certain undistributed earnings of foreign subsidiaries that are expected to be permanently reinvested in those companies, which aggregate to approximately
$555 million
and
$540 million
as of
December 31, 2016
and at
2015
, respectively. If these amounts were distributed to the U.S., in the form of a dividend or otherwise, we would be subject to additional U.S. income taxes. Determination of the amount of unrecognized deferred income tax liabilities on these earnings is not practicable.
As of
December 31, 2016
,
$135.0 million
of net operating loss carryforwards are available to reduce future taxable income of domestic and international companies. These loss carryforwards expire in the years
2017
through
2031
or have an unlimited carryover period.
81
ACCO Brands Corporation and Subsidiaries
Notes to Consolidated Financial Statements (Continued)
Interest and penalties related to unrecognized tax benefits are recognized within "
Income tax expense
" in the
Consolidated Statements of Income
. As of
December 31, 2016
, we have accrued a cumulative amount of
$12.5 million
for interest and penalties on unrecognized tax benefits.
A reconciliation of the beginning and ending amount of unrecognized tax benefits were as follows:
|
(in millions of dollars)
|
2016
|
2015
|
2014
|
||||||||
|
Balance at beginning of year
|
$
|
34.8
|
|
$
|
45.9
|
|
$
|
52.1
|
|
||
|
Additions for tax positions of prior years
|
3.0
|
|
3.0
|
|
3.5
|
|
|||||
|
Reductions for tax positions of prior years
|
(0.5
|
)
|
—
|
|
(4.2
|
)
|
|||||
|
Increase resulting from foreign currency translation
|
6.4
|
|
—
|
|
—
|
|
|||||
|
Decrease resulting from foreign currency translation
|
—
|
|
(14.1
|
)
|
(5.5
|
)
|
|||||
|
Balance at end of year
|
$
|
43.7
|
|
$
|
34.8
|
|
$
|
45.9
|
|
||
As of
December 31, 2016
, the amount of unrecognized tax benefits increased to
$43.7 million
, of which
$42.0 million
would affect our effective tax rate, if recognized. We expect the amount of unrecognized tax benefits to change within the next twelve months, but these changes are not expected to have a significant impact on our results of operations or financial position. None of the positions included in the unrecognized tax benefit relate to tax positions for which the ultimate deductibility is highly certain, but for which there is uncertainty about such deductibility.
Income Tax Assessment
In connection with our May 1, 2012 acquisition of Mead Consumer and Office Products business, we assumed all of the tax liabilities for the acquired foreign operations including Tilibra Produtos de Papelaria Ltda. ("Tilibra"). In December of 2012, the Federal Revenue Department of the Ministry of Finance of Brazil ("FRD") issued a tax assessment (the "Brazilian Tax Assessment") against Tilibra, which challenged the tax deduction of goodwill from Tilibra's taxable income for the year 2007. A second assessment challenging the deduction of goodwill from Tilibra's taxable income for the years 2008, 2009 and 2010 was issued by FRD in October 2013.
Tilibra is disputing both of the tax assessments through established administrative procedures. We believe we have meritorious defenses and intend to vigorously contest these matters; however, there can be no assurances that we will ultimately prevail. We are still in the administrative stages of the process to challenge the FRD's tax assessments, and the ultimate outcome will not be determined until the Brazilian tax appeal process is complete, which is expected to take a number of years. In addition, Tilibra's 2011-2012 tax years remain open and subject to audit, and there can be no assurances that we will not receive additional tax assessments regarding the goodwill for one or both of those years. The time limit for issuing an assessment for 2011 expires in January 2018.
If the FRD's initial position is ultimately sustained, the amount assessed would materially and adversely affect our cash flow in the year of settlement.
Because there is no settled legal precedent on which to base a definitive opinion as to whether we will ultimately prevail, we consider the outcome of this dispute to be uncertain. Since it is not more likely than not that we will prevail, in 2012, we recorded a reserve in the amount of
$44.5 million
(at December 31, 2012
exchange rates) in consideration of this contingency, of which
$43.3 million
was recorded as an adjustment to the purchase price and which included the 2007-2012 tax years plus penalties and interest through December 2012. Included in this reserve is an assumption of penalties at
75%
, which is the standard penalty. While there is a possibility that a penalty of
150%
could be imposed, based on the facts in our case and existing precedent, we believe the likelihood of a 150%
penalty being imposed is not more likely than not at December 31, 2016. In the meantime, we continue to actively monitor administrative and judicial court decisions and evaluate their impact, if any, on our legal assessment of the ultimate outcome of our case. In addition, we will continue to accrue interest related to this contingency until such time as the outcome is known or until evidence is presented that we are more likely than not to prevail. During
2016
,
2015
and
2014
,
we accrued additional interest as a charge to current tax expense of
$2.8 million
,
$2.7 million
and
$3.2 million
, respectively. At current exchange rates, our accrual through
December 31, 2016
, including tax, penalties and interest is
$37.3 million
.
82
ACCO Brands Corporation and Subsidiaries
Notes to Consolidated Financial Statements (Continued)
12. Earnings per Share
Total outstanding shares as of December 31,
2016
and
2015
were
107.9 million
and
105.6 million
, respectively. Under our stock repurchase program, for the year ended December 31,
2015
, we repurchased and retired
7.7 million
shares of common stock. No shares were repurchased during the year ended December 31,
2016
. In addition, for the years ended December 31,
2016
and
2015
we acquired
0.7 million
and
0.7 million
of treasury shares respectively, primarily related to tax withholding for share-based compensation. The calculation of basic earnings per common share is based on the weighted average number of common shares outstanding in the year, or period, over which they were outstanding. Our calculation of diluted earnings per common share assumes that any common shares outstanding were increased by shares that would be issued upon exercise of those stock units for which the average market price for the period exceeds the exercise price less the shares that could have been purchased by the Company with the related proceeds, including compensation expense measured but not yet recognized, net of tax.
|
(in millions)
|
2016
|
2015
|
2014
|
|||||
|
Weighted-average number of common shares outstanding — basic
|
107.0
|
|
108.8
|
|
113.7
|
|
||
|
Stock options
|
0.8
|
|
0.2
|
|
0.1
|
|
||
|
Stock-settled stock appreciation rights
|
—
|
|
0.3
|
|
0.6
|
|
||
|
Restricted stock units
|
1.4
|
|
1.3
|
|
1.9
|
|
||
|
Adjusted weighted-average shares and assumed conversions — diluted
|
109.2
|
|
110.6
|
|
116.3
|
|
||
Awards of potentially dilutive shares of common stock, which have exercise prices that were higher than the average market price during the period, are not included in the computation of dilutive earnings per share as their effect would have been anti-dilutive. For the years ended December 31,
2016
,
2015
and
2014
, these shares were approximately
3.6 million
,
5.5 million
and
4.3 million
, respectively.
13. Derivative Financial Instruments
We are exposed to various market risks, including changes in foreign currency exchange rates and interest rate changes. We enter into financial instruments to manage and reduce the impact of these risks, not for trading or speculative purposes. The counterparties to these financial instruments are major financial institutions. We continually monitor our foreign currency exposures in order to maximize the overall effectiveness of our foreign currency hedge positions. The majority of the Company’s exposure to local currency movements is in
Europe (both the Euro and the British pound), Australia, Canada, Brazil, Mexico and Japan
.
Principal currencies hedged include the U.S. dollar, Euro, Australian dollar, Canadian dollar, British pound and Japanese yen.
We are subject to credit risk, which relates to the ability of counterparties to meet their contractual payment obligations or the potential non-performance by counterparties to financial instrument contracts. Management continues to monitor the status of our counterparties and will take action, as appropriate, to further manage our counterparty credit risk. There are no credit contingency features in our derivative financial instruments.
When hedge accounting is applicable, on the date we enter into a derivative, the derivative is designated as a hedge of the identified exposure. We measure the effectiveness of our hedging relationships both at hedge inception and on an ongoing basis.
Forward Currency Contracts
We enter into forward foreign currency contracts to reduce the effect of fluctuating foreign currencies, primarily on foreign denominated inventory purchases and intercompany loans.
Forward currency contracts are used to hedge foreign denominated inventory purchases for Europe, Canada, Australia and Japan and are designated as cash flow hedges. Unrealized gains and losses on these contracts for inventory purchases are deferred in other comprehensive income (loss) until the contracts are settled and the underlying hedged transactions are recognized, at which time the deferred gains or losses will be reported in the "
Cost of products sold
" line in the
Consolidated Statements of Income
. As of
December 31, 2016
and
2015
, the Company had cash flow designated foreign exchange contracts outstanding with a U.S. dollar equivalent notional value of
$76.5 million
and
$68.2 million
, respectively.
Forward currency contracts used to hedge foreign denominated intercompany loans are not designated as hedging instruments. Gains and losses on these derivative instruments are recognized within "
Other expense (income), net
" in the
Consolidated Statements of Income
and are largely offset by the change in the current translated value of the hedged item. The periods of the forward foreign
83
ACCO Brands Corporation and Subsidiaries
Notes to Consolidated Financial Statements (Continued)
exchange contracts correspond to the periods of the hedged transactions, and do not extend beyond
2017
. As of
December 31, 2016
and
2015
, we have undesignated foreign exchange contracts outstanding with a U.S. dollar equivalent notional value of
$52.1 million
and
$33.3 million
, respectively.
The following table summarizes the fair value of our derivative financial instruments as of
December 31, 2016
and
2015
:
|
Fair Value of Derivative Instruments
|
|||||||||||||||||||
|
Derivative Assets
|
Derivative Liabilities
|
||||||||||||||||||
|
(in millions of dollars)
|
Balance Sheet
Location |
December 31, 2016
|
December 31, 2015
|
Balance Sheet
Location |
December 31, 2016
|
December 31, 2015
|
|||||||||||||
|
Derivatives designated as hedging instruments:
|
|||||||||||||||||||
|
Foreign exchange contracts
|
Other current assets
|
$
|
4.0
|
|
$
|
1.9
|
|
Other current liabilities
|
$
|
—
|
|
$
|
0.3
|
|
|||||
|
Derivatives not designated as hedging instruments:
|
|||||||||||||||||||
|
Foreign exchange contracts
|
Other current assets
|
0.4
|
|
0.7
|
|
Other current liabilities
|
0.3
|
|
0.1
|
|
|||||||||
|
Total derivatives
|
$
|
4.4
|
|
$
|
2.6
|
|
$
|
0.3
|
|
$
|
0.4
|
|
|||||||
The following tables summarize the pre-tax effect of the Company’s derivative financial instruments on the
Consolidated Statements of Income
for the years ended
December 31, 2016
,
2015
and
2014
:
|
The Effect of Derivative Instruments in Cash Flow Hedging Relationships on the Consolidated Financial Statements
|
|||||||||||||||||||||||||
|
Amount of Gain (Loss) Recognized in OCI (Effective Portion)
|
Location of (Gain) Loss Reclassified from OCI to Income
|
Amount of (Gain) Loss
Reclassified from AOCI to Income (Effective Portion) |
|||||||||||||||||||||||
|
(in millions of dollars)
|
2016
|
2015
|
2014
|
2016
|
2015
|
2014
|
|||||||||||||||||||
|
Cash flow hedges:
|
|||||||||||||||||||||||||
|
Foreign exchange contracts
|
$
|
(0.1
|
)
|
$
|
8.2
|
|
$
|
6.9
|
|
Cost of products sold
|
$
|
2.5
|
|
$
|
(10.9
|
)
|
$
|
(3.5
|
)
|
||||||
|
The Effect of Derivatives Not Designated as Hedging Instruments on the Condensed Consolidated Statements of Operations
|
|||||||||||||
|
Location of (Gain) Loss Recognized in
Income on Derivatives |
Amount of (Gain) Loss
Recognized in Income year ended December 31, |
||||||||||||
|
(in millions of dollars)
|
2016
|
2015
|
2014
|
||||||||||
|
Foreign exchange contracts
|
Other expense (income), net
|
$
|
(2.0
|
)
|
$
|
(0.5
|
)
|
$
|
1.3
|
|
|||
14. Fair Value of Financial Instruments
In establishing a fair value, there is a fair value hierarchy that prioritizes the inputs to valuation techniques used to measure fair value. The basis of the fair value measurement is categorized in three levels, in order of priority, as described below:
|
Level 1
|
Unadjusted quoted prices in active markets for identical assets or liabilities
|
|
Level 2
|
Unadjusted quoted prices in active markets for similar assets or liabilities, or
|
|
Unadjusted quoted prices for identical or similar assets or liabilities in markets that are not active, or
|
|
|
Inputs other than quoted prices that are observable for the asset or liability
|
|
|
Level 3
|
Unobservable inputs for the asset or liability
|
We utilize the best available information in measuring fair value. Financial assets and liabilities are classified in their entirety based on the lowest level of input that is significant to the fair value measurement.
84
ACCO Brands Corporation and Subsidiaries
Notes to Consolidated Financial Statements (Continued)
We have determined that our financial assets and liabilities described in "
Note 13. Derivative Financial Instruments
" are Level 2 in the fair value hierarchy. The following table sets forth our financial assets and liabilities that were accounted for at fair value on a recurring basis as of
December 31, 2016
and
2015
:
|
(in millions of dollars)
|
December 31, 2016
|
December 31, 2015
|
|||||
|
Assets:
|
|||||||
|
Forward currency contracts
|
$
|
4.4
|
|
$
|
2.6
|
|
|
|
Liabilities:
|
|||||||
|
Forward currency contracts
|
0.3
|
|
0.4
|
|
|||
Our forward currency contracts are included in "
Other current assets
" or "
Other current liabilities
" and mature within
12
months. The forward foreign currency exchange contracts are primarily valued based on the foreign currency spot and forward rates quoted by the banks or foreign currency dealers. As such, these derivative instruments are classified within Level 2.
The fair values of cash and cash equivalents, notes payable to banks, accounts receivable and accounts payable approximate carrying amounts due principally to their short maturities. The carrying amount of total debt was
$703.5 million
and
$729.0 million
and the estimated fair value of total debt was
$708.4 million
and
$740.3 million
as of
December 31, 2016
and
2015
, respectively. The fair values are determined from quoted market prices, where available, and from investment bankers using current interest rates considering credit ratings and the remaining terms of maturity.
15. Accumulated Other Comprehensive Income (Loss)
Comprehensive income is defined as net income (loss) and other changes in stockholders’ equity from transactions and other events from sources other than stockholders. The components of, and changes in, accumulated other comprehensive income (loss) were as follows:
|
(in millions of dollars)
|
Derivative
Financial Instruments |
Foreign Currency Adjustments |
Unrecognized
Pension and Other Post-retirement Benefit Costs |
Accumulated
Other Comprehensive Income (Loss) |
|||||||||||
|
Balance at December 31, 2014
|
$
|
2.7
|
|
$
|
(166.0
|
)
|
$
|
(129.3
|
)
|
$
|
(292.6
|
)
|
|||
|
Other comprehensive income (loss) before reclassifications, net of tax
|
5.8
|
|
(136.7
|
)
|
(0.5
|
)
|
(131.4
|
)
|
|||||||
|
Amounts reclassified from accumulated other comprehensive income (loss), net of tax
|
(7.7
|
)
|
—
|
|
2.5
|
|
(5.2
|
)
|
|||||||
|
Balance at December 31, 2015
|
0.8
|
|
(302.7
|
)
|
(127.3
|
)
|
(429.2
|
)
|
|||||||
|
Other comprehensive income (loss) before reclassifications, net of tax
|
—
|
|
16.8
|
|
(11.5
|
)
|
5.3
|
|
|||||||
|
Amounts reclassified from accumulated other comprehensive income, net of tax
|
1.7
|
|
—
|
|
2.8
|
|
4.5
|
|
|||||||
|
Balance at December 31, 2016
|
$
|
2.5
|
|
$
|
(285.9
|
)
|
$
|
(136.0
|
)
|
$
|
(419.4
|
)
|
|||
85
ACCO Brands Corporation and Subsidiaries
Notes to Consolidated Financial Statements (Continued)
The reclassifications out of accumulated other comprehensive income (loss) for the years ended
December 31, 2016
,
2015
and
2014
were as follows:
|
Year Ended December 31,
|
||||||||||||||
|
(in millions of dollars)
|
2016
|
2015
|
2014
|
|||||||||||
|
Details about Accumulated Other Comprehensive Income Components
|
Amount Reclassified from Accumulated Other Comprehensive Income
|
Location on Income Statement
|
||||||||||||
|
(Loss) gain on cash flow hedges:
|
||||||||||||||
|
Foreign exchange contracts
|
$
|
(2.4
|
)
|
$
|
10.9
|
|
$
|
3.5
|
|
Cost of products sold
|
||||
|
Tax expense
|
0.7
|
|
(3.2
|
)
|
(1.0
|
)
|
Income tax expense
|
|||||||
|
Net of tax
|
$
|
(1.7
|
)
|
$
|
7.7
|
|
$
|
2.5
|
|
|||||
|
Defined benefit plan items:
|
||||||||||||||
|
Amortization of actuarial loss
|
$
|
(3.1
|
)
|
$
|
(3.6
|
)
|
$
|
(5.9
|
)
|
(1)
|
||||
|
Amortization of prior service cost
|
(0.4
|
)
|
(0.1
|
)
|
(0.3
|
)
|
(1)
|
|||||||
|
Total before tax
|
(3.5
|
)
|
(3.7
|
)
|
(6.2
|
)
|
||||||||
|
Tax benefit
|
0.7
|
|
$
|
1.2
|
|
$
|
2.1
|
|
Income tax expense
|
|||||
|
Net of tax
|
$
|
(2.8
|
)
|
$
|
(2.5
|
)
|
$
|
(4.1
|
)
|
|||||
|
Total reclassifications for the period, net of tax
|
$
|
(4.5
|
)
|
$
|
5.2
|
|
$
|
(1.6
|
)
|
|||||
|
(1)
|
This accumulated other comprehensive income component is included in the computation of net periodic benefit cost (income) for pension and post-retirement plans (See "
|
16. Information on Business Segments
The Company's three business segments are described below.
ACCO Brands North America and ACCO Brands International
ACCO Brands North America and ACCO Brands International design, market, source, manufacture and sell traditional office products, academic supplies and calendar products. ACCO Brands North America comprises the U.S. and Canada, and ACCO Brands International comprises the rest of the world, primarily Northern Europe, Australia, Brazil and Mexico.
Our business, academic and calendar product lines use name brands such as Artline
®
, AT-A-GLANCE
®
, Derwent
®
, Esselte
®
, Five Star
®
, GBC
®
, Hilroy
®
, Leitz
®
, Marbig
®
, Mead
®
, NOBO
®
, Quartet
®
, Rapid
®
, Rexel
®
, Swingline
®
, Tilibra
®
, Wilson Jones
®
and many others. Products and brands are not confined to one channel or product category and are sold based on end-user preference in each geographic location.
The majority of our office products, such as stapling, binding and laminating equipment and related consumable supplies, shredders and whiteboards, are used by businesses. Most of these end-users purchase their products from our customers, which include traditional office supply resellers, wholesalers and other retailers, including on-line retailers. We supply some of our products directly to large commercial and industrial end-users, and provide business machine maintenance and certain repair services. Additionally, we supply some similar private label products.
Our academic products include notebooks, folders, decorative calendars and stationery products. We distribute our academic products primarily through mass merchandisers and other retailers, such as grocery, drug and office superstores, as well as on-line retailers. We also distribute to small independent retailers in emerging markets and supply some private label academic products.
Our calendar products are sold through all the same channels where we sell business or academic products, as well as directly to consumers, both on-line and through direct mail.
86
ACCO Brands Corporation and Subsidiaries
Notes to Consolidated Financial Statements (Continued)
Our customers are primarily large global and regional resellers of our products including traditional office supply resellers, wholesalers, on-line retailers and other retailers. Mass merchandisers and retail channels primarily sell to individual consumers but also to small businesses. We also sell to office supply retailers, commercial contract dealers, wholesalers, distributors and independent dealers who primarily serve commercial end-users. Over half of our product sales by our customers are to commercial end-users, who generally seek premium products that have added value or ease-of-use features and a reputation for reliability, performance and professional appearance. Some of our binding and laminating equipment products are sold directly to high-volume end-users and commercial reprographic centers. We also sell directly to consumers.
Computer Products Group
Our Computer Products Group designs, sources, distributes, markets and sells accessories for laptop and desktop computers and tablets. These accessories primarily include security products, input devices such as presenters, mice and trackballs, ergonomic aids such as foot and wrist rests, docking stations, and other PC and tablet accessories. We sell these products mostly under the Kensington
®
, Microsaver
®
and ClickSafe
®
brand names, with the majority of revenue coming from the U.S. and Northern Europe. Our computer products are manufactured by third-party suppliers, principally in Asia, and are distributed from our regional facilities. Our computer products are sold primarily to consumer electronics retailers, information technology value-added resellers, original equipment manufacturers, and office products retailers, as well as directly to consumers on-line.
Net sales by business segment for the years ended
December 31, 2016
,
2015
and
2014
were as follows:
|
(in millions of dollars)
|
2016
|
2015
|
2014
|
||||||||
|
ACCO Brands North America
|
$
|
955.5
|
|
$
|
963.3
|
|
$
|
1,006.0
|
|
||
|
ACCO Brands International
|
485.0
|
|
426.9
|
|
546.9
|
|
|||||
|
Computer Products Group
|
116.6
|
|
120.2
|
|
136.3
|
|
|||||
|
Net sales
|
$
|
1,557.1
|
|
$
|
1,510.4
|
|
$
|
1,689.2
|
|
||
Operating income by business segment for the years ended
December 31, 2016
,
2015
and
2014
was as follows:
|
(in millions of dollars)
|
2016
|
2015
|
2014
|
||||||||
|
ACCO Brands North America
|
$
|
150.6
|
|
$
|
147.6
|
|
$
|
140.7
|
|
||
|
ACCO Brands International
|
53.1
|
|
40.8
|
|
62.9
|
|
|||||
|
Computer Products Group
|
11.6
|
|
10.3
|
|
8.2
|
|
|||||
|
Segment operating income
|
215.3
|
|
198.7
|
|
211.8
|
|
|||||
|
Corporate
(1)
|
(48.0
|
)
|
(35.2
|
)
|
(38.2
|
)
|
|||||
|
Operating income
(2)
|
167.3
|
|
163.5
|
|
173.6
|
|
|||||
|
Interest expense
|
49.3
|
|
44.5
|
|
49.5
|
|
|||||
|
Interest income
|
(6.4
|
)
|
(6.6
|
)
|
(5.6
|
)
|
|||||
|
Equity in earnings of joint-venture
|
(2.1
|
)
|
(7.9
|
)
|
(8.1
|
)
|
|||||
|
Other expense, net
|
1.4
|
|
2.1
|
|
0.8
|
|
|||||
|
Income before income tax
|
$
|
125.1
|
|
$
|
131.4
|
|
$
|
137.0
|
|
||
|
(1)
|
Corporate operating income in
2016
includes transaction costs of
$10.5 million
, primarily for legal and due diligence expenditures associated with the Esselte and PA acquisitions. In
2015
this was
$0.6 million
.
|
|
(2)
|
Operating income as presented in the segment table above is defined as i) net sales; ii) less cost of products sold; iii) less advertising, selling, general and administrative expenses; iv) less amortization of intangibles; and v) less restructuring charges.
|
87
ACCO Brands Corporation and Subsidiaries
Notes to Consolidated Financial Statements (Continued)
The following table presents the measure of segment assets used by the Company’s chief operating decision maker.
|
December 31,
|
|||||||
|
(in millions of dollars)
|
2016
|
2015
|
|||||
|
ACCO Brands North America
(3)
|
$
|
378.1
|
|
$
|
413.8
|
|
|
|
ACCO Brands International
(3)
|
397.2
|
|
335.0
|
|
|||
|
Computer Products Group
(3)
|
56.4
|
|
61.5
|
|
|||
|
Total segment assets
|
831.7
|
|
810.3
|
|
|||
|
Unallocated assets
|
1,232.0
|
|
1,142.0
|
|
|||
|
Corporate
(3)
|
0.8
|
|
1.1
|
|
|||
|
Total assets
|
$
|
2,064.5
|
|
$
|
1,953.4
|
|
|
|
(3)
|
Represents total assets, excluding: goodwill and identifiable intangibles resulting from business acquisitions, intercompany balances, cash, deferred taxes, prepaid pension assets, prepaid debt issuance costs and joint ventures accounted for on an equity basis.
|
As a supplement to the presentation of segment assets presented above, the table below presents segment assets, including the allocation of identifiable intangible assets and goodwill resulting from business combinations.
|
December 31,
|
|||||||
|
(in millions of dollars)
|
2016
|
2015
|
|||||
|
ACCO Brands North America
(4)
|
$
|
1,171.3
|
|
$
|
1,220.7
|
|
|
|
ACCO Brands International
(4)
|
742.6
|
|
531.5
|
|
|||
|
Computer Products Group
(4)
|
70.6
|
|
75.9
|
|
|||
|
Total segment assets
|
1,984.5
|
|
1,828.1
|
|
|||
|
Unallocated assets
|
79.2
|
|
124.2
|
|
|||
|
Corporate
(4)
|
0.8
|
|
1.1
|
|
|||
|
Total assets
|
$
|
2,064.5
|
|
$
|
1,953.4
|
|
|
|
(4)
|
Represents total assets, excluding: intercompany balances, cash, deferred taxes, prepaid pension assets, prepaid debt issuance costs and joint ventures accounted for on an equity basis.
|
Property, plant and equipment, net by geographic region was as follows:
|
December 31,
|
|||||||
|
(in millions of dollars)
|
2016
|
2015
|
|||||
|
U.S.
|
$
|
103.0
|
|
$
|
111.5
|
|
|
|
Brazil
|
36.8
|
|
31.9
|
|
|||
|
U.K.
|
30.3
|
|
38.9
|
|
|||
|
Australia
|
12.5
|
|
10.6
|
|
|||
|
Other countries
|
15.8
|
|
16.2
|
|
|||
|
Property, plant and equipment, net
|
$
|
198.4
|
|
$
|
209.1
|
|
|
88
ACCO Brands Corporation and Subsidiaries
Notes to Consolidated Financial Statements (Continued)
Net sales by geographic region
(5)
for the years ended
December 31, 2016
,
2015
and
2014
were as follows:
|
(in millions of dollars)
|
2016
|
2015
|
2014
|
||||||||
|
U.S.
|
$
|
894.4
|
|
$
|
904.3
|
|
$
|
921.0
|
|
||
|
Australia
|
156.5
|
|
91.8
|
|
108.5
|
|
|||||
|
Canada
|
121.7
|
|
121.4
|
|
150.6
|
|
|||||
|
Brazil
|
102.6
|
|
92.0
|
|
154.0
|
|
|||||
|
Netherlands
|
101.4
|
|
108.7
|
|
130.2
|
|
|||||
|
U.K.
|
59.1
|
|
76.4
|
|
89.1
|
|
|||||
|
Mexico
|
47.3
|
|
49.6
|
|
58.8
|
|
|||||
|
Other countries
|
74.1
|
|
66.2
|
|
77.0
|
|
|||||
|
Net sales
|
$
|
1,557.1
|
|
$
|
1,510.4
|
|
$
|
1,689.2
|
|
||
|
(5)
|
Net sales are attributed to geographic areas based on the location of the selling subsidiaries.
|
Top Customers
Net sales to our
five
largest customers totaled
$663.5 million
,
$637.7 million
and
$706.0 million
for the years ended
December 31, 2016
,
2015
and
2014
, respectively. Net sales to Staples, our largest customer, were
$210.5 million
(
14%
),
$204.1 million
(
14%
) and
$224.1 million
(
13%
) for the years ended
December 31, 2016
,
2015
and
2014
, respectively. Net sales to Wal-Mart were
$161.7 million
(
10%
) for the year ended
December 31, 2016
. Net sales to Office Depot were
$152.5 million
(
10%
) and
$190.9 million
(
11%
) for the years ended
December 31, 2015
, and
2014
, respectively. Net sales to no other customers exceeded 10% of net sales for any of the last three years.
A significant percentage of our sales are to customers engaged in the office products resale industry. Concentration of credit risk with respect to trade accounts receivable is partially mitigated because a large number of geographically diverse customers make up each operating company's domestic and international customer base, thus spreading the credit risk. As of
December 31, 2016
and
2015
, our top five trade account receivables totaled
$162.2 million
and
$152.3 million
, respectively.
89
ACCO Brands Corporation and Subsidiaries
Notes to Consolidated Financial Statements (Continued)
17. Joint-Venture Investment
Summarized below is the financial information for the Pelikan Artline joint-venture, in which we owned a
50%
non-controlling interest through May 1, 2016, which was accounted for under the equity method. Accordingly, we recorded our proportionate share of earnings or losses on the line entitled "
Equity in earnings of joint-venture
" in the "
Consolidated Statements of Income
."
On May 2, 2016, the Company completed the PA Acquisition and accordingly, the results of the Pelikan Artline joint-venture are included in the Company's condensed consolidated financial statements from the date of the PA Acquisition, May 2, 2016. See "
Note 3. Acquisition
" for details on the PA Acquisition.
|
Year Ended December 31,
|
|||||||||||
|
(in millions of dollars)
|
2016
|
2015
|
2014
|
||||||||
|
Net sales
|
$
|
34.9
|
|
$
|
111.2
|
|
$
|
121.4
|
|
||
|
Gross profit
|
14.1
|
|
45.5
|
|
48.2
|
|
|||||
|
Net income
|
4.1
|
|
15.8
|
|
16.4
|
|
|||||
|
December 31,
|
|||
|
(in millions of dollars)
|
2015
|
||
|
Current assets
|
$
|
76.6
|
|
|
Non-current assets
|
43.6
|
|
|
|
Current liabilities
|
37.5
|
|
|
|
Non-current liabilities
|
13.1
|
|
|
18. Commitments and Contingencies
Pending Litigation
In connection with our May 1, 2012 acquisition of Mead C&OP, we assumed all of the tax liabilities for the acquired foreign operations, including Tilibra Produtos de Papelaria Ltda. ("Tilibra"). See "
Note 11. Income Taxes
- Income Tax Assessment
" for details on tax assessments issued by the FRD against Tilibra, which challenged the tax deduction of goodwill from Tilibra's taxable income for the years 2007 through 2010.
There are various other claims, lawsuits and pending actions against us incidental to our operations. It is the opinion of management that (other than the Brazilian Tax Assessment) the ultimate resolution of these matters will not have a material adverse effect on our financial condition, results of operations or cash flow. However, there is no assurance that we will ultimately be successful in our defense of any of these matters or that an adverse outcome in any matter will not affect our results of operations, financial condition or cash flow.
90
ACCO Brands Corporation and Subsidiaries
Notes to Consolidated Financial Statements (Continued)
Lease Commitments
Future minimum rental payments for all non-cancelable operating leases (reduced by minor amounts from subleases) as of
December 31, 2016
were as follows:
|
(in millions of dollars)
|
|||
|
2017
|
$
|
22.2
|
|
|
2018
|
18.5
|
|
|
|
2019
|
16.6
|
|
|
|
2020
|
15.1
|
|
|
|
2021
|
12.2
|
|
|
|
Thereafter
|
15.8
|
|
|
|
Total minimum rental payments
|
100.4
|
|
|
|
Less minimum rentals to be received under non-cancelable subleases
|
2.8
|
|
|
|
Future minimum payments for operating leases, net of sublease rental income
|
$
|
97.6
|
|
Total rental expense reported in our
Consolidated Statements of Income
for all non-cancelable operating leases (reduced by minor amounts for subleases) amounted to
$24.2 million
,
$21.2 million
and
$23.1 million
for the years ended
December 31, 2016
,
2015
and
2014
, respectively.
Unconditional Purchase Commitments
Future minimum payments under unconditional purchase commitments, primarily for inventory purchase commitments as of
December 31, 2016
were as follows:
|
(in millions of dollars)
|
|||
|
2017
|
$
|
84.8
|
|
|
2018
|
0.7
|
|
|
|
2019
|
—
|
|
|
|
2020
|
—
|
|
|
|
2021
|
—
|
|
|
|
Thereafter
|
—
|
|
|
|
Total unconditional purchase commitments
|
$
|
85.5
|
|
Environmental
We are subject to national, state, provincial and/or local environmental laws and regulations concerning the discharge of materials into the environment and the handling, disposal and clean-up of waste materials and otherwise relating to the protection of the environment. It is not possible to quantify with certainty the potential impact of actions regarding environmental matters, particularly remediation and other compliance efforts that we may undertake in the future. In the opinion of our management, compliance with the present environmental protection laws, before taking into account estimated recoveries from third parties, will not have a material adverse effect upon our capital expenditures, financial condition and results of operations or competitive position.
91
ACCO Brands Corporation and Subsidiaries
Notes to Consolidated Financial Statements (Continued)
19. Quarterly Financial Information (Unaudited)
The following is an analysis of certain line items in the
Consolidated Statements of Income
by quarter for
2016
and
2015
:
|
(in millions of dollars, except per share data)
|
1
st
Quarter
|
2
nd
Quarter
|
3
rd
Quarter
|
4
th
Quarter
|
|||||||||||
|
2016
|
|||||||||||||||
|
Net sales
(1)
|
$
|
278.1
|
|
$
|
410.1
|
|
$
|
431.3
|
|
$
|
437.6
|
|
|||
|
Gross profit
|
82.4
|
|
134.8
|
|
144.2
|
|
153.7
|
|
|||||||
|
Operating income
|
6.5
|
|
45.4
|
|
55.7
|
|
59.7
|
|
|||||||
|
Net income
|
$
|
4.8
|
|
$
|
61.9
|
|
$
|
22.7
|
|
$
|
6.1
|
|
|||
|
Per share:
|
|||||||||||||||
|
Basic income per share
(2)
|
$
|
0.05
|
|
$
|
0.58
|
|
$
|
0.21
|
|
$
|
0.06
|
|
|||
|
Diluted income per share
(2)
|
$
|
0.04
|
|
$
|
0.57
|
|
$
|
0.21
|
|
$
|
0.06
|
|
|||
|
2015
|
|||||||||||||||
|
Net sales
(1)
|
$
|
290.0
|
|
$
|
394.7
|
|
$
|
413.6
|
|
$
|
412.1
|
|
|||
|
Gross profit
|
80.2
|
|
126.7
|
|
133.7
|
|
137.8
|
|
|||||||
|
Operating income
|
2.6
|
|
49.2
|
|
54.8
|
|
56.9
|
|
|||||||
|
Net income (loss)
|
$
|
(5.8
|
)
|
$
|
27.7
|
|
$
|
32.6
|
|
$
|
31.4
|
|
|||
|
Per share:
|
|||||||||||||||
|
Basic income (loss) per share
(2)
|
$
|
(0.05
|
)
|
$
|
0.25
|
|
$
|
0.30
|
|
$
|
0.30
|
|
|||
|
Diluted income (loss) per share
(2)
|
$
|
(0.05
|
)
|
$
|
0.25
|
|
$
|
0.30
|
|
$
|
0.29
|
|
|||
|
(1)
|
Historically, our business has experienced higher sales and earnings in the third and fourth quarters of the calendar year. Two principal factors contribute to this seasonality: (1) we are a major supplier of products related to the "back-to-school" season, which occurs principally from June through September for our North American business and from November through February for our Australian and Brazilian businesses; and (2) several products we sell lend themselves to calendar year-end purchase timing, including AT-A-GLANCE
®
planners, paper organization and storage products (including bindery) and Kensington
®
computer accessories, which have higher sales in the fourth quarter driven by traditionally strong fourth-quarter sales of personal computers and tablets.
|
|
(2)
|
The sum of the quarterly earnings per share amounts may not equal the total for the year due to the effects of rounding, dilution as a result of issuing common shares and repurchasing of common shares during the year.
|
92
ACCO Brands Corporation and Subsidiaries
Notes to Consolidated Financial Statements (Continued)
20. Subsequent Events
Acquisition of Esselte Group Holdings AB
On
January 31, 2017
, ACCO Europe, an indirect wholly-owned subsidiary of the Company, completed its previously announced acquisition of Esselte Group Holdings AB (the "Esselte Acquisition"). The Esselte Acquisition was made pursuant to the share purchase agreement, dated October 21, 2016 (the "Purchase Agreement") among ACCO Europe, the Company and an entity controlled by J. W. Childs (the "Seller"), as amended.
The cash purchase price paid at closing was
€296.9 million
(
US$317.7 million
). A warranty and indemnity insurance policy held by the Company and ACCO Europe insures certain of Seller’s contractual obligations to ACCO Europe under the Purchase Agreement for up to
€40.0 million
(
US$42.8 million
) for a period of up to
seven
years, subject to certain deductibles and limitations set forth in the policy.
Esselte Group Holdings AB ("Esselte") is a leading European manufacturer and marketer of branded business products. It takes products to market under the Leitz
®
, Rapid
®
and Esselte
®
brands in the storage and organization, stapling and punch, business machines and do-it-yourself tools product categories. The combination improves ACCO Brands’ scale and enhances its position as an industry leader in Europe.
The Esselte Acquisition and related expenses were funded through the Euro Term Loan A (see below) and cash on hand. Transaction costs related to the Esselte Acquisition of
$9.2 million
were incurred during the year ended
December 31, 2016
and were reported as advertising, selling, general and administrative expenses.
As part of the acquisition, the Company assumed an estimated
$160 million
of unfunded pension liabilities, net of associated deferred tax, predominantly in Germany.
The Company is unable to make all the disclosures required by ASC 805-10-50-2 at this time as the initial accounting and pro forma analysis for this business combination is incomplete.
Third Amended and Restated Credit Agreement
In connection with the consummation of the Esselte Acquisition, the Company entered into a Third Amended and Restated Credit Agreement (the "
2017 Credit Agreement
"), dated as of January 27, 2017 (the "Effective Date"), among the Company, certain subsidiaries of the Company, Bank of America, N.A., as administrative agent, and the other agents and various lenders party thereto. The
2017 Credit Agreement
amended and restated the Company’s Second Amended and Restated Credit Agreement, dated April 28, 2015, as amended, among the Company, certain subsidiaries of the Company, Bank of America, N.A., as administrative agent, and the other lenders party thereto (the "
2015 Credit Agreement
"). Borrowings under the
2017 Credit Agreement
mature on January 27, 2022.
The
2017 Credit Agreement
provides for a
five
-year senior secured credit facility, which consists of a
€300 million
(US
$320.8 million
) Euro denominated term loan facility (the "Euro Term Loan A"), an
A$80 million
(US
$60.4 million
) Australian Dollar denominated term loan facility (the "AUD Term Loan A" and together with the Euro Term Loan A, (the "2017 Term A Loan Facility"), and a
US$400 million
multi-currency revolving credit facility (the "2017 Revolving Facility"). At closing, borrowings under the 2017 Revolving Facility of
US$91.3 million
were applied toward, among other things, (i) the repayment of all outstanding U.S. Dollar denominated term loans under the
2015 Credit Agreement
, (ii) the repayment of a portion of the Australian Dollar denominated term loans under the
2015 Credit Agreement
, of which
A$80 million
(US
$60.4 million
) outstanding principal amount was continued under the AUD Term Loan A, and (iii) the payment of related financing fees and expenses. Immediately following the Effective Date, approximately
US$156.7 million
was available for borrowing under the 2017 Revolving Facility.
The Company is still considering the appropriate accounting treatment related to the
2017 Credit Agreement
.
ITEM 9.
CHANGES IN AND DISAGREEMENTS WITH ACCOUNTANTS ON ACCOUNTING AND FINANCIAL
DISCLOSURE
Not applicable.
93
ITEM 9A.
CONTROLS AND PROCEDURES
(a) Management's Evaluation of Disclosure Controls and Procedures
We seek to maintain disclosure controls and procedures that are designed to ensure that information required to be disclosed in reports filed or submitted under the Securities Exchange Act of 1934, as amended (the "Exchange Act") is recorded, processed, summarized, and reported within the time periods specified in the applicable Securities and Exchange Commission rules and forms, and that such information is accumulated and communicated to management, including our Chief Executive Officer and Chief Financial Officer, to allow timely decisions regarding required disclosures.
As of the end of the period covered by this report, our management, under the supervision and with the participation of our Disclosure Committee and our Chief Executive Officer and Chief Financial Officer, conducted an evaluation of the effectiveness of our disclosure controls and procedures. Based upon that evaluation, our Chief Executive Officer and Chief Financial Officer concluded that our disclosure controls and procedures were effective.
(b) Changes in Internal Control over Financial Reporting
In May 2016, we completed the PA Acquisition, which represented
$78.5 million
of our consolidated net sales for the year ended
December 31, 2016
and $70.4 million of consolidated assets as of
December 31, 2016
. As the PA Acquisition occurred in the second quarter of 2016, the scope of our evaluation of the effectiveness of internal control over financial reporting does not include Pelikan Artline. This exclusion is in accordance with the SEC's general guidance that an assessment of a recently acquired business may be omitted from our scope in the year of acquisition.
There were no changes in our internal control over financial reporting during the quarter ended
December 31, 2016
that have materially affected or are reasonably likely to materially affect our internal control over financial reporting.
(c) Management’s Report on Internal Control Over Financial Reporting
Our management is responsible for establishing and maintaining adequate internal control over financial reporting, as defined in Rules 13a-15(f) and 15d-15(f) under the Securities Exchange Act of 1934. Our internal control over financial reporting is designed by and under the supervision of our Chief Executive Officer and Chief Financial Officer and effected by management and our board of directors to provide reasonable assurance regarding the reliability of the Company’s financial reporting and the preparation of financial statements for external purposes in accordance with generally accepted accounting principles in the U.S.
In designing and evaluating our internal control over financial reporting, management recognizes that any controls and procedures, no matter how well designed and operated, can provide only reasonable, and not absolute, assurance of achieving the desired control objective. Also, projections of any evaluation of the effectiveness of our internal control over financial reporting to future periods are subject to the risk that controls may become inadequate because of changes in conditions, or that the degree of compliance with the policies or procedures may deteriorate.
As required by Section 404 of the Sarbanes-Oxley Act of 2002, management assessed the effectiveness of the Company’s internal control over financial reporting as of
December 31, 2016
. In making this assessment, management used the criteria set forth by the Committee of Sponsoring Organizations of the Treadway Commission in Internal Control-Integrated Framework (2013). Excluding the PA Acquisition, which represented
$78.5 million
of our consolidated net sales for the year ended
December 31, 2016
and $70.4 million of consolidated assets as of
December 31, 2016
, our management concluded that our internal control over financial reporting was effective as of
December 31, 2016
.
The effectiveness of the Company’s internal control over financial reporting as of
December 31, 2016
has been audited by KPMG LLP, an independent registered public accounting firm, as stated in their report, which is included in Part II, Item 8. of this report.
ITEM 9B.
OTHER INFORMATION
Not applicable.
94
ITEM 10.
DIRECTORS, EXECUTIVE OFFICERS AND CORPORATE GOVERNANCE
Information required under this Item is contained in the Company’s
2017
Definitive Proxy Statement, which is to be filed with the Securities and Exchange Commission prior to
April 30, 2017
, and is incorporated herein by reference.
Code of Business Conduct
The Company has adopted a code of business conduct as required by the listing standards of the New York Stock Exchange and rules of the Securities and Exchange Commission. This code applies to all of the Company’s directors, officers and employees. The code of business conduct is published and available at the Investor Relations Section of the Company’s internet website at
www.accobrands.com.
The Company will post on its website any amendments to, or waivers from, our code of business conduct applicable to any of its directors or executive officers. The foregoing information will be available in print to any shareholder who requests such information from ACCO Brands Corporation, Four Corporate Drive, Lake Zurich, IL 60047-2997, Attn: Office of the General Counsel.
As required by Section 303A.12(a) of the New York Stock Exchange Listed Company Manual, the Company’s Chief Executive Officer certified to the NYSE within 30 days after the Company’s
2016
Annual Meeting of Stockholders that he was not aware of any violation by the Company of the NYSE Corporate Governance Listing Standards.
ITEM 11.
EXECUTIVE COMPENSATION
Information required under this Item is contained in the Company’s
2017
Definitive Proxy Statement, which is to be filed with the Securities and Exchange Commission prior to
April 30, 2017
, and is incorporated herein by reference.
ITEM 12.
SECURITY OWNERSHIP OF CERTAIN BENEFICIAL OWNERS AND MANAGEMENT AND RELATED
STOCKHOLDER MATTERS
Equity Compensation Plan Information
The following table gives information, as of
December 31, 2016
, about our common stock that may be issued upon the exercise of options and other equity awards under all compensation plans under which equity securities are reserved for issuance.
|
Plan category
|
Number of
securities to be
issued upon
exercise of
outstanding
options, warrants
and rights
(a)
|
Weighted-average
exercise price of
outstanding
options, warrants
and rights
(b)
|
Number of securities
remaining available for
future issuance under
equity compensation
plans (excluding
securities reflected in
column (a)
(c)
|
|||||||
|
Equity compensation plans approved by security holders
|
4,133,874
|
|
$
|
7.82
|
|
9,650,538
|
|
(1)
|
||
|
Equity compensation plans not approved by security holders
|
—
|
|
—
|
|
—
|
|
||||
|
Total
|
4,133,874
|
|
$
|
7.82
|
|
9,650,538
|
|
(1)
|
||
|
(1)
|
These are shares available for grant as of
December 31, 2016
under the ACCO Brands Corporation Incentive Plan (the "Plan") pursuant to which the Compensation Committee of the Board of Directors or the Board of Directors may make various stock-based awards including grants of stock options, stock-settled appreciation rights, restricted stock, restricted stock units and performance stock units. In addition to these shares, shares covered by outstanding awards under the Plan that were forfeited or otherwise terminated may become available for grant under the Plan and, to the extent such shares have become available as of
December 31, 2016
, they are included in the table as available for grant.
|
Other information required under this Item is contained in the Company’s
2017
Definitive Proxy Statement, which is to be filed with the Securities and Exchange Commission prior to
April 30, 2017
, and is incorporated herein by reference.
95
ITEM 13.
CERTAIN RELATIONSHIPS AND RELATED TRANSACTIONS, AND DIRECTOR INDEPENDENCE
Information required under this Item is contained in the Company’s
2017
Definitive Proxy Statement, which is to be filed with the Securities and Exchange Commission prior to
April 30, 2017
, and is incorporated herein by reference.
ITEM 14.
PRINCIPAL ACCOUNTANT FEES AND SERVICES
Information required under this Item is contained in the Company’s
2017
Definitive Proxy Statement, which is to be filed with the Securities and Exchange Commission prior to
April 30, 2017
, and is incorporated herein by reference.
96
ITEM 15.
EXHIBITS AND FINANCIAL STATEMENT SCHEDULES
The following Exhibits are filed herewith or are incorporated by reference to exhibits previously filed with the Commission, as indicated in the description of each. We agree to furnish to the Commission upon request a copy of any instrument with respect to long-term debt not filed herewith as to which the total amount of securities authorized thereunder does not exceed 10 percent of our total assets on a consolidated basis.
|
(a)
|
Financial Statements, Financial Statement Schedules and Exhibits
|
|
1.
|
All Financial Statements
|
The following consolidated financial statements of the Company and its subsidiaries are filed as part of this report under Part II, Item 8. - Financial Statements and Supplementary Data:
|
Page
|
|
|
Reports of Independent Registered Public Accounting Firm
|
|
|
Consolidated Balance Sheets as of December 31, 2016 and 2015
|
|
|
Consolidated Statements of Income for the years ended December 31, 2016, 2015 and 2014
|
|
|
Consolidated Statements of Comprehensive Income (Loss) for the years ended December 31, 2016, 2015 and 2014
|
|
|
Consolidated Statements of Cash Flows for the years ended December 31, 2016, 2015 and 2014
|
|
|
Consolidated Statements of Stockholders’ Equity for the years ended December 31, 2016, 2015 and 2014
|
|
|
Notes to Consolidated Financial Statements
|
|
|
2.
|
Financial Statement Schedule:
|
Schedule II - Valuation and Qualifying Accounts and Reserves, for each of the years ended
December 31, 2016
,
2015
and
2014
.
|
3.
|
Exhibits:
|
A list of exhibits filed or furnished with this Report on Form 10-K (or incorporated by reference to exhibits previously filed or furnished by the Company) is provided in the accompanying Exhibit Index.
97
EXHIBIT INDEX
Number Description of Exhibit
Plans of acquisition, reorganization, arrangement, liquidation or succession
|
2.1
|
Share Sale Agreement, dated as of March 22, 2016, among ACCO Brands Australia Pty Limited, Bigadale Pty Limited, Andrew Kaldor, Cherington Investments Pty Ltd, Freiburg Nominees Proprietary Limited and Enora Pty Ltd and certain Guarantors named therein. (incorporated by reference to Exhibit 2.1 to Form 8-K filed by the Registrant on March 21, 2016 (File No. 001-08454))
|
|
2.2
|
Share Purchase Agreement, dated as of October 21, 2016, among ACCO Brands Corporation, ACCO Europe Limited and Esselte Group Holdings (Luxembourg) S.A. (incorporated by reference to Exhibit 2.1 to Form 8-K filed by the Registrant on October 24, 2016 (File No. 001-08454))
|
|
2.3
|
Amendment Deed, dated as of January 31, 2017, to Share Purchase Agreement among ACCO Brands Corporation, ACCO Europe Limited and Esselte Group Holdings (Luxembourg) S.A.
*
|
Certificate of Incorporation and Bylaws
|
3.1
|
Restated Certificate of Incorporation of ACCO Brands Corporation, as amended (incorporated by reference to Exhibit 3.1 to Form 8-K filed by the Registrant on May 19, 2008 (File No. 001-08454))
|
|
3.2
|
Certificate of Designation of Series A Junior Participating Preferred Stock (incorporated by reference to Exhibit 3.2 to the Registrant’s Current Report on Form 8-K filed August 17, 2005 (File No. 001-08454))
|
|
3.3
|
Certificate of Elimination of the Series A Junior Participating Preferred Stock of the Company, as filed with the Secretary of State of the State of Delaware on September 11, 2015 (incorporated by reference to Exhibit 3.2 to ACCO Brands Corporation's Current Report on Form 8-K filed with the SEC on September 11, 2015 (File No. 001-08454))
|
|
3.4
|
By-laws of ACCO Brands Corporation, as amended through December 9, 2015 (incorporated by reference to Exhibit 3.1 to the Registrant’s Current Report on Form 8-K filed December 14, 2015 (File No. 001-08454))
|
Instruments defining the rights of security holders, including indentures
|
4.1
|
Indenture, dated as of December 22, 2016, among ACCO Brands Corporation, as issuer, the guarantors named therein, and Wells Fargo Bank, National Association, as trustee*
|
Material Contracts
|
10.1
|
Tax Allocation Agreement, dated as of August 16, 2005, between ACCO World Corporation and Fortune Brands, Inc. (incorporated by reference to Exhibit 10.1 to the Registrant’s Current Report on Form 8-K dated August 12, 2005 and filed August 17, 2005 (File No. 001-08454))
|
|
10.2
|
Separation Agreement, dated November 17, 2011, by and between MeadWestvaco and Monaco SpinCo Inc. (incorporated by reference to Exhibit 10.1 of Registrant's Form 8-K filed on November 22, 2011 (File No. 001-08454))
|
|
10.3
|
Employee Benefits Agreement, dated as of November 17, 2011, by and among MeadWestvaco Corporation, Monaco Spinco Inc. and ACCO Brands Corporation. (incorporated by reference to Exhibit 10.3 of Registrant's Form S-4/A filed on February 13, 2012 (File No. 333-178869))
|
|
10.4
|
Amendment No. 1, dated as of March 19, 2012, to the Separation Agreement, dated as of November 17, 2011, by and among MeadWestvaco Corporation and Monaco SpinCo Inc. (incorporated by reference to Exhibit 10.1 to Form 8-K filed by the Registrant on March 22, 2012 (File No. 001-08454))
|
98
EXHIBIT INDEX
Number Description of Exhibit
|
10.5
|
Tax Matters Agreement, effective as of May 1, 2012, among the Company, MeadWestvaco Corporation and Monaco SpinCo Inc. (incorporated by reference to Exhibit 10.2 of the Registrant's Form 8-K filed on May 7, 2012 (File No. 001-08454))
|
|
10.6
|
Second Amended and Restated Credit Agreement, dated as of April 28, 2015, among the Company, certain subsidiaries of the Company, Bank of America, N.A., as administrative agent, and the lenders party thereto (incorporated by reference to Exhibit 10.2 to Form 10-Q filed by the Registrant on July 29, 2015 (File No. 001-08454))
|
|
10.7
|
First Amendment, dated as of July 7, 2015, to the Second Amended and Restated Credit Agreement, dated as of April 28, 2015, among the Company, certain subsidiaries of the Company, Bank of America, N.A., as administrative agent, and the lenders party thereto (incorporated by reference to Exhibit 10.3 to Form 10-Q filed by the Registrant on July 29, 2015 (File No. 001-08454))
|
|
10.8
|
Second Amendment and Additional Borrower Consent, dated as of May 1, 2016, among the Company, certain guarantor subsidiaries of the Company, Bank of America, N.A., as administrative agent and the other lenders party thereto. (incorporated by reference to Exhibit 10.1 to ACCO Brands Corporation's Current Report on Form 8-K filed with the SEC on May 2, 2016 (File No. 001-08454))
|
|
10.9
|
Third Amendment to Second Amended and Restated Credit Agreement, dated as of October 21, 2016, by and among the Company, certain subsidiaries of the Company, Bank of America, N.A., as administrative agent, and the other lenders party hereto. (incorporated by reference to Exhibit 10.1 to ACCO Brands Corporation's Current Report on Form 8-K filed with the SEC on October 24, 2016 (File No. 001-08454))
|
|
10.10
|
Amendment to the Third Amendment to the Second Amended and Restated Credit Agreement, dated as of January 27, 2017, among the Company, certain subsidiaries of the Company, Bank of America, N.A., as administrative agent, and the other lenders party hereto.*
|
|
10.11
|
Third Amended and Restated Credit Agreement, dated as of January 27, 2017, among the Company, certain subsidiaries of the Company, Bank of America, N.A., as administrative agent, and the other agents and various lenders party hereto.*
|
Executive Compensation Plans and Management Contracts
|
10.12
|
ACCO Brands Corporation Executive Severance Plan (effective December 1, 2007) (incorporated by reference to Exhibit 10.1 to Form 8-K filed by the Registrant on November 29, 2007 (File No. 001-08454))
|
|
10.13
|
Form of Indemnification Agreement (incorporated by reference to Exhibit 10.1 to Form 8-K filed by the Registrant on December 24, 2008 (File No. 001-08454))
|
|
10.14
|
Amended and Restated ACCO Brands Deferred Compensation Plan for Non-Employee Directors, effective December 14, 2009 (incorporated by reference to Exhibit 10.41 to Form 10-K filed by the Registrant on February 26, 2010 (File No. 001-089454))
|
|
10.15
|
Amendment to Deferred Compensation Plan for Non-Employee Directors, effective January 1, 2014 (incorporated by reference to Exhibit 10.15 to Form 10-K filed by the Registrant on February 25, 2014 (File No. 001-089454))
|
|
10.16
|
Form of 2011 Amended and Restated Incentive Plan Directors Restricted Stock Unit Award Agreement (incorporated by reference to Exhibit 10.16 to Form 10-K filed by the Registrant on February 25, 2014 (File No. 001-089454))
|
|
10.17
|
Letter agreement, dated November 4, 2008, from ACCO Brands Corporation to Christopher M. Franey (incorporated by reference to Exhibit 10.42 to Form 10-K filed by the Registrant on February 26, 2010 (File No. 001-08454))
|
|
10.18
|
2011 Amended and Restated ACCO Brands Corporation Incentive Plan (incorporated by reference to Exhibit 10.1 to ACCO Brands Corporation's Current Report on Form 8-K filed with the SEC on May 20, 2011 (File No. 001-08454))
|
99
EXHIBIT INDEX
Number Description of Exhibit
|
10.19
|
Form of Directors Restricted Stock Unit Award Agreement under the 2011 Amended and Restated ACCO Brands Corporation Incentive Plan (incorporated by reference to Exhibit 10.2 to ACCO Brands Corporation's Current Report on Form 8-K filed with the SEC on May 20, 2011 (File No. 001-08454))
|
|
10.20
|
Form of Nonqualified Stock Option Agreement under the 2011 Amended and Restated ACCO Brands Corporation Incentive Plan (incorporated by reference to Exhibit 10.3 to ACCO Brands Corporation's Current Report on Form 8-K filed with the SEC on May 20, 2011 (File No. 001-08454))
|
|
10.21
|
Amendment of 2011 Amended and Restated ACCO Brands Corporation Incentive Plan (incorporated by reference to Exhibit 10.1 of the Registrant's Form 8-K filed on April 24, 2012 (File No. 001-08454))
|
|
10.22
|
Amendment of the ACCO Brands Corporation Executive Severance Plan, adopted as of October 23, 2012 (incorporated by reference to Exhibit 10.1 to Form 10-Q filed by the Registrant on October 31, 2012 (File No. 001-08454))
|
|
10.23
|
Form of Non-qualified Stock Option Agreement (Robert J. Keller) under the 2011 Amended and Restated Incentive Plan (incorporated by reference to Exhibit 10.2 of the Registrant's Form 8-K filed on February 26, 2013 (File No. 001-08454))
|
|
10.24
|
Form of Performance Stock Unit Award Agreement under the 2011 Amended and Restated Incentive Plan (incorporated by reference to Exhibit 10.3 of the Registrant's Form 8-K filed on February 26, 2013 (File No. 001-08454))
|
|
10.25
|
ACCO Brands 2013 Annual Incentive Plan (incorporated by reference to 10.5 of the Registrant’s Form 10-Q filed May 8, 2013 (File No. 001-08454))
|
|
10.26
|
Form of Performance Stock Unit Award Agreement under the 2011 Amended and Restated Incentive Plan (incorporated by reference to Exhibit 10.1 of the Registrant's Form 8-K filed on March 10, 2014 (File No. 001-08454))
|
|
10.27
|
Form of Non-qualified Stock Option Agreement under the 2011 Amended and Restated Incentive Plan (incorporated by reference to Exhibit 10.2 of the Registrant's Form 8-K filed on March 10, 2014 (File No. 001-08454))
|
|
10.28
|
Form of Restricted Stock Unit Award Agreement under the 2011 Amended and Restated Incentive Plan (incorporated by reference to Exhibit 10.3 of the Registrant's Form 8-K filed on March 10, 2014 (File No. 001-08454))
|
|
10.29
|
Second Amendment of 2011 Amended and Restated ACCO Brands Corporation Incentive Plan (incorporated by reference to Exhibit 10.4 to Form 10-Q filed by the Registrant on April 30, 2014 (File No. 001-08454))
|
|
10.30
|
ACCO Brands Corporation Annual Incentive Plan (incorporated by reference to Exhibit 4.4 of the Registrant’s Form S-8 filed May 12, 2015 (File No. 001-08454))
|
|
10.31
|
Form of Directors Restricted Stock Unit Award Agreement under the ACCO Brands Corporation Incentive Plan (incorporated by reference to Exhibit 10.1 to ACCO Brands Corporation's Current Report on Form 8-K filed with the SEC on May 18, 2015 (File No. 001-08454))
|
|
10.32
|
Form of Restricted Stock Unit Award Agreement under the ACCO Brands Corporation Incentive Plan (incorporated by reference to Exhibit 10.2 to ACCO Brands Corporation's Current Report on Form 8-K filed with the SEC on May 18, 2015 (File No. 001-08454))
|
|
10.33
|
Form of Performance Stock Unit Award Agreement under the ACCO Brands Corporation Incentive Plan (incorporated by reference to Exhibit 10.3 to ACCO Brands Corporation's Current Report on Form 8-K filed with the SEC on May 18, 2015 (File No. 001-08454))
|
|
10.34
|
Form of Nonqualified Stock Option Award Agreement under the ACCO Brands Corporation Incentive Plan (incorporated by reference to Exhibit 10.4 to ACCO Brands Corporation's Current Report on Form 8-K filed with the SEC on May 18, 2015 (File No. 001-08454))
|
|
10.35
|
Form of 2016-2018 Performance-Based Cash Award Agreement under the ACCO Brands Corporation Incentive Plan*
|
100
EXHIBIT INDEX
Number Description of Exhibit
Other Exhibits
|
21.1
|
Subsidiaries of the Registrant*
|
|
23.1
|
Consent of KPMG LLP*
|
|
24.1
|
Power of attorney*
|
|
31.1
|
Certification of the Chief Executive Officer pursuant to Section 302 of the Sarbanes-Oxley Act of 2002*
|
|
31.2
|
Certification of the Chief Financial Officer pursuant to Section 302 of the Sarbanes-Oxley Act of 2002*
|
|
32.1
|
Certification of the Chief Executive Officer pursuant to Section 906 of the Sarbanes-Oxley Act of 2002*
|
|
32.2
|
Certification of the Chief Financial Officer pursuant to Section 906 of the Sarbanes-Oxley Act of 2002*
|
|
101
|
The following financial statements from the Company's Annual Report on Form 10-K for the year ended
December 31, 2016
formatted in XBRL (eXtensible Business Reporting Language): (i) the Consolidated Balance Sheets as of
December 31, 2016
and
2015
, (ii) the Consolidated Statements of Income for the years ended
December 31, 2016
,
2015
and
2014
, (iii) the Consolidated Statements of Comprehensive Income (Loss) for the years ended
December 31, 2016
,
2015
and
2014
, (iv) the Consolidated Statements of Cash Flows for the years ended
December 31, 2016
,
2015
and
2014
, (v) Consolidated Statements of Stockholders Equity for the years ended
December 31, 2016
,
2015
and
2014
, and (vi) related notes to those financial statements*
|
|
*
|
Filed herewith.
|
101
SIGNATURES
Pursuant to the requirements of Section 13 or 15(d) of the Securities Exchange Act of 1934, the Registrant has duly caused this report to be signed on its behalf by the undersigned thereunto duly authorized.
|
REGISTRANT:
|
||
|
ACCO BRANDS CORPORATION
|
||
|
By:
|
/s/ Boris Elisman
|
|
|
Boris Elisman
|
||
|
Chairman, President and Chief Executive
Officer (principal executive officer)
|
||
|
By:
|
/s/ Neal V. Fenwick
|
|
|
Neal V. Fenwick
|
||
|
Executive Vice President and Chief Financial
Officer (principal financial officer)
|
||
|
By:
|
/s/ Kathleen D. Schnaedter
|
|
|
Kathleen D. Schnaedter
|
||
|
Senior Vice President, Corporate Controller and Chief Accounting Officer (principal accounting officer)
|
||
February 27, 2017
Pursuant to the requirements of the Securities Exchange Act of 1934, this report has been signed on its behalf by the following persons on behalf of the Registrant and in the capacities and on the dates indicated.
|
Signature
|
Title
|
Date
|
||
|
/s/ Boris Elisman
|
Chairman, President and
Chief Executive Officer (principal executive officer) |
February 27, 2017
|
||
|
Boris Elisman
|
||||
|
/s/ Neal V. Fenwick
|
Executive Vice President and
Chief Financial Officer
(principal financial officer)
|
February 27, 2017
|
||
|
Neal V. Fenwick
|
||||
|
/s/ Kathleen D. Schnaedter
|
Senior Vice President, Corporate Controller and Chief Accounting Officer
(principal accounting officer)
|
February 27, 2017
|
||
|
Kathleen D. Schnaedter
|
||||
|
/s/ Robert J. Keller*
|
Director
|
February 27, 2017
|
||
|
Robert J. Keller
|
||||
|
/s/ George V. Bayly*
|
Director
|
February 27, 2017
|
||
|
George V. Bayly
|
||||
|
/s/ James A. Buzzard*
|
Director
|
February 27, 2017
|
||
|
James A. Buzzard
|
||||
102
|
Signature
|
Title
|
Date
|
||
|
/s/ Kathleen S. Dvorak*
|
Director
|
February 27, 2017
|
||
|
Kathleen S. Dvorak
|
||||
|
/s/ Robert H. Jenkins*
|
Director
|
February 27, 2017
|
||
|
Robert H. Jenkins
|
||||
|
/s/ Pradeep Jotwani*
|
Director
|
February 27, 2017
|
||
|
Pradeep Jotwani
|
||||
|
/s/ Thomas Kroeger*
|
Director
|
February 27, 2017
|
||
|
Thomas Kroeger
|
||||
|
/s/ Graciela Monteagudo*
|
Director
|
February 27, 2017
|
||
|
Graciela Monteagudo
|
||||
|
/s/ Hans Michael Norkus*
|
Director
|
February 27, 2017
|
||
|
Hans Michael Norkus
|
||||
|
/s/ E. Mark Rajkowski*
|
Director
|
February 27, 2017
|
||
|
E. Mark Rajkowski
|
||||
|
/s/ Neal V. Fenwick
|
||||
|
* Neal V. Fenwick as
Attorney-in-Fact |
||||
103
ACCO Brands Corporation
VALUATION AND QUALIFYING ACCOUNTS AND RESERVES
SCHEDULE II
Allowances for Doubtful Accounts
Changes in the allowances for doubtful accounts were as follows:
|
Year Ended December 31,
|
|||||||||||
|
(in millions of dollars)
|
2016
|
2015
|
2014
|
||||||||
|
Balance at beginning of year
|
$
|
4.8
|
|
$
|
5.5
|
|
$
|
6.1
|
|
||
|
Additions charged to expense
|
0.2
|
|
3.2
|
|
1.0
|
|
|||||
|
Deductions - write offs
|
(0.8
|
)
|
(3.5
|
)
|
(1.3
|
)
|
|||||
|
PA Acquisition
|
0.1
|
|
—
|
|
—
|
|
|||||
|
Foreign exchange changes
|
0.2
|
|
(0.4
|
)
|
(0.3
|
)
|
|||||
|
Balance at end of year
|
$
|
4.5
|
|
$
|
4.8
|
|
$
|
5.5
|
|
||
Allowances for Sales Returns and Discounts
Changes in the allowances for sales returns and discounts were as follows:
|
Year Ended December 31,
|
|||||||||||
|
(in millions of dollars)
|
2016
|
2015
|
2014
|
||||||||
|
Balance at beginning of year
|
$
|
11.7
|
|
$
|
12.0
|
|
$
|
12.9
|
|
||
|
Additions charged to expense
|
22.5
|
|
30.3
|
|
37.4
|
|
|||||
|
Deductions - returns
|
(24.9
|
)
|
(30.4
|
)
|
(38.4
|
)
|
|||||
|
Foreign exchange changes
|
0.1
|
|
(0.2
|
)
|
0.1
|
|
|||||
|
Balance at end of year
|
$
|
9.4
|
|
$
|
11.7
|
|
$
|
12.0
|
|
||
Allowances for Cash Discounts
Changes in the allowances for cash discounts were as follows:
|
Year Ended December 31,
|
|||||||||||
|
(in millions of dollars)
|
2016
|
2015
|
2014
|
||||||||
|
Balance at beginning of year
|
$
|
2.2
|
|
$
|
2.0
|
|
$
|
2.2
|
|
||
|
Additions charged to expense
|
13.6
|
|
14.2
|
|
15.5
|
|
|||||
|
Deductions - discounts taken
|
(14.1
|
)
|
(13.9
|
)
|
(15.6
|
)
|
|||||
|
PA Acquisition
|
0.2
|
|
—
|
|
—
|
|
|||||
|
Foreign exchange changes
|
(0.1
|
)
|
(0.1
|
)
|
(0.1
|
)
|
|||||
|
Balance at end of year
|
$
|
1.8
|
|
$
|
2.2
|
|
$
|
2.0
|
|
||
104
ACCO Brands Corporation
VALUATION AND QUALIFYING ACCOUNTS AND RESERVES
SCHEDULE II (Continued)
Warranty Reserves
Changes in the reserve for warranty claims were as follows:
|
Year Ended December 31,
|
|||||||||||
|
(in millions of dollars)
|
2016
|
2015
|
2014
|
||||||||
|
Balance at beginning of year
|
$
|
1.7
|
|
$
|
1.8
|
|
$
|
2.2
|
|
||
|
Provision for warranties issued
|
2.2
|
|
1.8
|
|
2.0
|
|
|||||
|
Deductions - settlements made (in cash or in kind)
|
(2.2
|
)
|
(1.8
|
)
|
(2.4
|
)
|
|||||
|
PA Acquisition
|
0.3
|
|
—
|
|
—
|
|
|||||
|
Foreign exchange changes
|
(0.1
|
)
|
(0.1
|
)
|
—
|
|
|||||
|
Balance at end of year
|
$
|
1.9
|
|
$
|
1.7
|
|
$
|
1.8
|
|
||
Income Tax Valuation Allowance
Changes in the deferred tax valuation allowances were as follows:
|
Year Ended December 31,
|
|||||||||||
|
(in millions of dollars)
|
2016
|
2015
|
2014
|
||||||||
|
Balance at beginning of year
|
$
|
22.1
|
|
$
|
23.9
|
|
$
|
33.0
|
|
||
|
(Credits) charges to expense
|
(0.7
|
)
|
(0.3
|
)
|
0.2
|
|
|||||
|
Credited to other accounts
|
(9.3
|
)
|
(1.1
|
)
|
(8.7
|
)
|
|||||
|
Foreign exchange changes
|
(0.4
|
)
|
(0.4
|
)
|
(0.6
|
)
|
|||||
|
Balance at end of year
|
$
|
11.7
|
|
$
|
22.1
|
|
$
|
23.9
|
|
||
See accompanying report of independent registered public accounting firm.
105
TABLE OF CONTENTS
Part IItem 1. BusinessNote 20. Subsequent EventsNote 16. Information on Business SegmentsItem 1A. Risk FactorsNote 13. Derivative Financial InstrumentsNote 5. Pension and Other Retiree BenefitsNote 9. Goodwill and Identifiable Intangible AssetsItem 1B. Unresolved Staff CommentsItem 2. PropertiesItem 3. Legal ProceedingsItem 4. Mine Safety DisclosuresPart IIItem 5. Market For Registrant S Common Equity, Related Stockholder Matters and IssuerItem 6. Selected Financial DataNote 3. AcquisitionNote 4. Long-term Debt and Short-term BorrowingsItem 7. Management S Discussion and Analysis Of Financial Condition and Results OfNote 11. Income TaxesNote 2. Significant Accounting PoliciesItem 7A. Quantitative and Qualitative Disclosures About Market RiskNote 14. Fair Value Of Financial InstrumentsItem 8. Financial Statements and Supplementary DataNote 17. Joint-venture InvestmentItem 9. Changes in and Disagreements with Accountants on Accounting and FinancialItem 9A. Controls and ProceduresItem 9B. Other InformationPart IIIItem 10. Directors, Executive Officers and Corporate GovernanceItem 11. Executive CompensationItem 12. Security Ownership Of Certain Beneficial Owners and Management and RelatedItem 13. Certain Relationships and Related Transactions, and Director IndependenceItem 14. Principal Accountant Fees and ServicesPart IVItem 15. Exhibits and Financial Statement Schedules