ACORN ENERGY, INC.
10-Ks and 10-Qs
|
|
|
|
|
|
|
|
|
|
|
|
|
|
|
|
|
|
|
|
|
|
|
|
|
|
|
|
|
|
|
|
|
|
|
|
|
|
|
|
|
|
|
|
|
|
|
|
|
|
UNITED STATES
SECURITIES AND EXCHANGE COMMISSION
WASHINGTON, D.C. 20549
FORM 10-K
ANNUAL REPORT PURSUANT TO SECTION 13 OR 15(d) OF THE
SECURITIES EXCHANGE ACT OF 1934
|
For the fiscal year ended December 31, 2011
|
Commission file number: 0-19771
|
ACORN ENERGY, INC.
(Exact name of registrant as specified in charter)
|
Delaware
(State or other jurisdiction of incorporation or organization)
|
|
22-2786081
(I.R.S. Employer Identification No.)
|
|
|
|
|
|
4 West Rockland Road, Montchanin, Delaware
(Address of principal executive offices)
|
|
19710
(Zip Code)
|
302-656-1707
Registrant’s telephone number, including area code
Securities registered pursuant to Section 12(b) of the Act:
|
Title of Class
|
Name of Each Exchange on Which Registered
|
|
|
|
|
Common Stock, par value $.01 per share
|
The NASDAQ Global Market
|
Securities registered pursuant to Section 12(g) of the Act:
None
Indicate by check mark if the registrant is a well-known seasoned issuer, as defined in Rule 405 of the Securities Act.
Yes
¨
No
x
Indicate by check mark if the registrant is not required to file reports pursuant to Section 13 or Section 15(d) of the Exchange Act. Yes
¨
No
x
Indicate by check mark whether the registrant (1) has filed all reports required to be filed by Section 13 or 15(d) of the Securities Exchange Act of 1934 during the preceding 12 months (or for such shorter period that the registrant was required to file such reports), and (2) has been subject to such filing requirements for the past 90 days. Yes
x
No
¨
Indicate by check mark whether the registrant has submitted electronically and posted on its corporate Web site, if any, every Interactive Data File required to be submitted and posted pursuant to Rule 405 of Regulation S-T during the preceding 12 months (or for such shorter period that the registrant was required to submit and post such files). Yes
x
No
¨
Indicate by check mark if disclosure of delinquent filers pursuant to Item 405 of Regulation S-K is not contained herein, and will not be contained, to the best of registrant’s knowledge, in definitive proxy or information statements incorporated by
reference in Part III of this Form 10-K or any amendment to this Form 10-K.
¨
Indicate by check mark whether the registrant is a large accelerated filer, an accelerated filer, a non-accelerated filer, or a smaller reporting company. See the definitions of “large accelerated filer,” “accelerated filer” and “smaller reporting company” in Rule 12b-2 of the Exchange Act. (Check one):
Large accelerated filer
¨
Accelerated filer
x
Non-accelerated filer
¨
Smaller reporting company
¨
Indicate by check mark whether the registrant is a shell company (as defined in Rule 12b-2 of the Exchange Act).
Yes
¨
No
x
As of last day of the second fiscal quarter of 2011, the aggregate market value of the registrant’s common stock held by non-affiliates of the registrant was approximately $64.5 million based on the closing sale price on that date as reported on the NASDAQ Global Market. As of March 8, 2012 there we
re 17,750,352 sha
res of Common Stock, $0.01 par value per share, outstanding.
DOCUMENTS INCORPORATED BY REFERENCE:
None.
TABLE OF CONTENTS
Certain statements contained in this report are forward-looking in nature. These statements can be identified by the use of forward-looking terminology such as “believes”, “expects”, “may”, “will”, “should” or “anticipates”, or the negatives thereof, or comparable terminology, or by discussions of strategy. You are cautioned that our business and operations are subject to a variety of risks and uncertainties and, consequently, our actual results may materially differ from those projected by any forward-looking statements. Certain of such risks and uncertainties are discussed below under the heading “Item 1A. Risk Factors.”
AquaShield
™ and
PointShield
™
are trademarks of our DSIT Solutions Ltd. subsidiary.
Line IQ
™
,
Transformer IQ
™
,
Bushing IQ
™
,
Cable IQ
™
and
PowerMonic
™
are trademarks of our GridSense subsidiaries.
LazerLok
™
is a trademark of our US Seismic Systems, Inc. subsidiary.
|
ITEM 1.
|
BUSINESS
|
OVERVIEW
Acorn Energy, Inc. ("Acorn" or "the Company”) is a holding company focused on technology driven solutions for energy infrastructure asset management. Our four businesses improve the world's energy infrastructure by making it more secure by providing security solutions for underwater energy infrastructure (DSIT), more reliable by providing condition monitoring instruments for critical assets on the electric grid (GridSense and OmniMetrix LLC) and more productive and efficient by increasing oil and gas production while lowering costs through use of ultra-high sensitive seismic tools for more precise pinpointing of oil and gas reservoirs (USSI). We acquired OmniMetrix, LLC ("OmniMetrix") in February 2012 (see Recent Developments). Accordingly, OmniMetrix results are not included in this report.
Through our majority or wholly-owned operating subsidiaries we provided the following services and products in 2011:
·
Energy & Security Sonar Solutions
. We provide sonar and acoustic related solutions for energy, defense and commercial markets with a focus on underwater site security for strategic energy installations and other advanced acoustic systems and real-time embedded hardware and software development and production through our DSIT Solutions Ltd. ("DSIT") subsidiary.
·
Smart Grid Distribution Automation.
These
products and services are provided by our GridSense subsidiaries (GridSense Inc. in the United States and GridSense Pty Ltd. and CHK GridSense Pty Ltd. in Australia - collectively "GridSense") which develop, market and sell remote monitoring and control systems to electric utilities and industrial facilities worldwide.
·
Energy and Security Sensor Systems.
These products and services are provided by our US Seismic Systems, Inc. subsidiary ("USSI") which develops and produces “state of the art” fiber optic sensing systems for the energy, commercial security and defense markets worldwide.
During 2011, each of the three abovementioned activities represented a reportable segment. In addition, our “Other” segment represents IT and consulting activities at our DSIT subsidiary.
REVENUES BY COMPANY
The following table shows, for the periods indicated, the dollar amount (in thousands) of the consolidated revenues attributable to each of our consolidated companies. The revenues of USSI are included in our consolidated financial statements effective February 23, 2010. The revenues of GridSense are included in our consolidated financial statements effective May 12, 2010. Accordingly, there are no comparative revenues reported for these activities for 2009. On August 31, 2011, we sold our interests in CoaLogix Inc. ("CoaLogix") and on December 17, 2010, we discontinued our Coreworx Inc. ("Coreworx") activities. Accordingly, CoaLogix' and Coreworx' revenues and results are excluded for all periods indicated.
|
|
Year ended December 31,
|
Three months ended December 31,
|
||||||||||||||||||||||
|
|
2009
|
2010
|
2011
|
2009
|
2010
|
2011
|
||||||||||||||||||
|
DSIT Solutions
|
$
|
9,219
|
|
$
|
11,457
|
|
$
|
10,493
|
|
$
|
2,746
|
|
$
|
2,843
|
|
$
|
3,807
|
|
||||||
|
GridSense
|
—
|
|
2,382
|
|
7,119
|
|
—
|
|
1,194
|
|
2,435
|
|
||||||||||||
|
USSI
|
—
|
|
405
|
|
1,316
|
|
—
|
|
212
|
|
433
|
|
||||||||||||
|
Total
|
$
|
9,219
|
|
$
|
14,244
|
|
$
|
18,928
|
|
$
|
2,746
|
|
$
|
4,249
|
|
$
|
6,675
|
|
||||||
1
ENERGY & SECURITY SONAR SOLUTIONS – DSIT SOLUTIONS LTD.
DSIT Solutions Ltd., which is 84% owned by the Company, is a globally-oriented company based in Israel with expertise in sonar and acoustics and development capabilities in the areas of real-time and embedded systems. Based on these capabilities, we offer a full range of sonar and acoustic-related solutions to strategic energy installations as well as defense and homeland security markets. In addition, based on expertise in fields such as signal acquisition and processing applications, communication technologies, computerized vision for the semiconductor industry and command, control and communication management (“C3”) we provide wide ranging solutions to both governmental and commercial customers.
Products and Services
DSIT’s Energy & Security Sonar Solutions activities are focused on two areas – sonar and acoustic solutions for energy and security markets and other real-time and embedded hardware and software development and production.
Energy & Security Sonar Solutions
. Our energy & security sonar solutions include a full range of sonar and acoustic-related solutions to the strategic energy installation, defense and homeland security markets. These solutions include:
· AquaShield™ Diver Detection Sonar (“DDS”) – DSIT has developed an innovative, cost-effective DDS system, the AquaShield™, that provides critical coastal and offshore protection of sites through long-range detection, tracking, classification and warning of unauthorized divers and Swimmer Delivery Vehicles (“SDVs”) for rapid deployment and effective response. Our AquaShield™ DDS system is fully automatic and customizable, and requires intervention of a security person only for final decision and response to the threat. The DDS sensors can be integrated with other sensors into a comprehensive command and control (“C&C”) system to provide a complete tactical picture both above and below the water for more intelligent evaluation of and effective response to threats.
· PointShield™ Portable Diver Detection Sonar (PDDS) – The PointShield™ PDDS is a medium range portable diver detection sonar aimed at protecting vessels at anchorage and covers restricted areas such as water canals and intakes. The PointShield™ is a cost-effective system tailored to meet the needs of customers, whose main concern is portability and flexibility.
· Mobile Acoustic Range (“MAR”) – The MAR accurately measures a submarine’s or surface vessel’s radiated noise; thus enabling navies and shipyards to monitor and control the radiated noise and to silence their submarines and ships. By continuously tracking the measured vessel and transmitting the data to a measurement ship, the MAR system enables real time radiated noise processing, analysis and display. The system also includes a platform database for measurement results management and provides playback and post analysis capability.
· Generic Sonar Simulator (“GSS”) – DSIT has developed a GSS for the rapid and comprehensive training of Anti-Submarine Warfare (“ASW”), submarine, and mine detection sonar operators. This advanced, low cost, PC-based training simulator is designed for all levels of sonar operators from beginners to the most experienced, including ship ASW teams. The simulator includes all aspects of sonar operation, with emphasis on training in weak target detection in the presence of noise and reverberation, torpedo detection, audio listening and classification.
· Underwater Acoustic Signal Analysis system ("UASA") – DSIT’s UASA system processes and analyzes all types of acoustic signals radiated by various sources and received by naval sonar systems (submarine, surface and air platforms, fixed bottom moored sonar systems, etc.).
· Sonar Building Blocks – based on our sonar capabilities and development of the DDS, DSIT has developed a number of generic building blocks of sonar systems such as Signal Processing Systems and Sonar Power Amplifiers. Some customers designing and building their own sonar systems have purchased these building blocks from us. These elements are specifically tailored and optimized for sonar systems and have advantages over generic standard building blocks.
Other Real-Time and Embedded Solutions
Additional areas of development and production in real-time and embedded hardware and software include:
· Applications - DSIT specializes in Weapon/C&C Operating Consoles for unique naval and air applications, designed through synergistic interaction with the end-user. Weapon/C&C Consoles utilize Human-Machine Interface (“HMI”) prototyping supported on a variety of platforms as an integral part of the HMI definition and refinement process. Weapon/C&C Console specific applications driven by HMI include signal processing and data fusion and tracking.
2
· Computerized Vision for the Semiconductor Industry - DSIT has been cooperating with global leaders of state-of-the-art semiconductor wafer inspection systems in developing cutting edge technologies to enable the semiconductor industry to detect defects in the manufacture of silicon wafers. DSIT develops and manufactures hardware and embedded software for computerized vision systems, and we supply this multi-disciplinary field in the integration of digital and analog technologies, image processing and intricate logic development.
· Modems, data links and telemetry systems – DSIT is working with major defense industries in Israel such as Rafael Advanced Defense Systems Ltd. and Israel Aerospace Industries Ltd., developing modems, advanced wide-band data links and telemetry systems for airborne and missile systems. DSIT is providing development and production services of hardware and embedded signal processing software with high quality control standards.
DSIT’s other operations include IT and consulting activities whose results are not included in the Energy & Security Sonar Solutions segment.
Customers and Markets
According to a recent Wall Street Journal article, nearly 30% of U.S. oil production and 15% of gas production is produced from wells on the Outer Continental Shelf. Globally, some 30% of the world's oil output comes from offshore production. An enormous amount of capital investment has gone into creating this underwater energy infrastructure. This includes the oil platforms that drill, extract and temporarily store oil and gas, as well as the oil and gas wellheads, pipelines and pumps required to transfer the product from its location to shore. While this infrastructure was built with the assumption that it would be able to weather natural disasters, much of this infrastructure comprises what is known in the military as "soft" targets from beneath the water that would not require much in the way of explosives to cause significant, and perhaps catastrophic, damage.
This vulnerability, combined with the development and proliferation of technologies such as mini-submarines which can submerge to depths of a few dozen feet making detection difficult, unmanned underwater vehicles, divers with underwater scooters, as well as conventional scuba divers threaten the undersea economy with significant damage resulting from lost energy resources, damaged infrastructure and environmental degradation should an attack occur. DSIT looks to target potential customers in such areas that have significant underwater energy assets and infrastructure.
All of this segment’s operations (excluding sales and product delivery, set-up and service) take place in Israel. In recent years, an increasing share of this segments revenues were derived from outside of Israel (68% in 2011, 55% in 2010, 43% in 2009 and 15% in 2008). We expect this trend of increasing shares of this segment’s revenues to be generated from outside of Israel to continue in 2012, particularly following the recently announced $12.3 million order for AquaShield
TM
and PointShield
TM
DDS systems with an Asian customer. DSIT continues to invest considerable effort to penetrate European, Asian, South American, U.S. and other markets in order to broaden its geographic sales base with respect to its sonar technology solutions. We have significant customer relationships with some of Israel’s largest companies in its defense and electronics industries as well as relationships with some of the biggest Asian defense integrators. We are currently exploring several cooperation opportunities within Asia and the U.S.
We believe that in 2012, we will see an increased flow of orders for our AquaShield
TM
DDS and PointShield
TM
DDS systems generated by customers realizing the potential threat to their coastal and offshore critical facilities as well as vessels, canals and water intakes. DSIT is currently in discussions with numerous potential energy, commercial and governmental customers who have shown interest in the company's underwater security systems.
Four customers accounted for approximately 79% of segment sales in 2011 (28%, 24%, 15% and 12%), two of which accounted for 25% ($4.7 million) of Acorn’s consolidated revenues for 2011 ($2.6 million and $2.2 million or 14% and 11%, respectively). The loss of any one or more of these customers could have a material adverse effect on this segment.
Competition
Our Energy & Security Sonar Solutions segment faces competition from several competitors, large and small, operating in worldwide markets, (such as Sonardyne International Ltd. (based in the United Kingdom), Atlas Elektronik (based in Germany) and the Kongsberg group of companies (based in Norway)) with substantially greater financial and marketing resources, particularly with respect to our energy and security sonar solutions. We believe that our wide range of experience and long-term relationships with large businesses as well as the strategic partnerships that we are developing will enable us to compete successfully and obtain future business. In 2011, DSIT successfully performed a demonstration in an Asian country to a number of potential customers.
3
DSIT's AquaShield
TM
achieved a much better performance regarding detection range and automatic classification, than its competitor who performed a demonstration to these customers at an earlier date. DSIT has sold its AquaShieldTM DDS and PointShieldTM PDDS systems to the Israeli Navy following a comprehensive review and evaluation process in which the Navy investigated competing systems and selected those of DSIT.
Intellectual Property
DSIT rigorously attempts to protect its proprietary know-how, proprietary technologies, processes and other intellectual property.
DSIT's systems are heavily based on software implementing advanced acoustic signal processing algorithms. The foundation of the systems and DSIT's competitive edge lies in these algorithms. DSIT's strategy is to identify these key intellectual property elements developed by us in order to protect them in a timely and effective manner, and to continually use such intellectual property to our competitive advantage in the marketplace.
We keep the detailed description of these core algorithms as proprietary information and accordingly they are not disclosed to the public or to customers. We use contractual measures such as non-disclosure agreements and special contract terms to protect this intellectual and proprietary information. It is uncommon for companies such as DSIT to rely heavily on patents, as the patent itself may disclose critical information. Nonetheless, in certain cases the benefits of patent protection can outweigh the risks. We anticipate that we may apply for certain patents during the course of 2012.
A significant portion of our know-how is protected as commercial secrets and supported through agreements with our employees, suppliers, partners and customers.
Facilities
DSIT’s activities are conducted in approximately 19,000 square feet of office space in the Tel Aviv metropolitan area under a lease that expires in August 2012. We believe that DSIT’s current premises are sufficient to handle the anticipated increase in sales for the near future. DSIT anticipates renewing its lease at its current location when its lease expires.
SMART GRID DISTRIBUTION AUTOMATION – GRIDSENSE
In accordance with applicable accounting standards, we began consolidating the results of GridSense beginning May 12, 2010, the date we acquired the outstanding GridSense shares not previously owned by us. Prior to that date we accounted for our GridSense investment using the equity method.
GridSense develops and markets remote monitoring systems to electric utilities and industrial facilities worldwide. These systems, used in a wide range of utility applications including outage management, power quality monitoring, system planning, trouble shooting and proactive maintenance, and condition monitoring, provide transmission and distribution network operators with the intelligence to better and more efficiently operate grid operations.
Due to increasing stresses on these systems, old and aging infrastructure and greater demands for power quality and reliability of supply, utilities are striving to modernize their electrical infrastructures with "SmartGrid" initiatives. Cost-effective and easily deployable, GridSense solutions provide critical components of the present and future grid.
GridSense's solutions allow end-users to cost effectively monitor the power quality and reliability parameters of electric transmission and distribution systems in applications where competitive offerings are non-existent or cost-prohibitive. GridSense has developed a range of offerings that addresses all the critical points of the electricity delivery system, including distribution and transmission lines, substations and transformers, and the point of electricity consumption.
GridSense operates from offices in the U.S. and Australia and has utility customers throughout the world, including the Americas, Asia, Australia, Africa, and the United Kingdom.
4
GridSense Offerings & Solutions
GridSense has a range of commercially proven offerings sold to customers worldwide. The success of GridSense's offerings is based on being able to provide identifiable and quantifiable value to its utility customers by minimizing inconveniences and productivity losses for their consumers, optimizing operations of existing assets, reducing costs of identifying and rectifying outages and disturbances on their networks, and providing them with the requisite information to make better capital expenditure decisions. GridSense's offerings include:
•
PowerMonic
TM
Systems - The PowerMonic
TM
range of outdoor power analyzers and analytical software allows electric utilities to monitor and investigate power quality problems in homes, offices, factories, and key points on the electricity distribution infrastructure.
•
Line IQ
TM
Systems - The Line IQ
TM
provides real-time monitoring of electricity grids and captures important operational, maintenance, planning and regulatory reporting information such as current, temperature and power factor. The Line IQ
TM
provides all these applications at a fraction of the cost of alternative solutions in the market.
•
Cable IQ
TM
- This system provides real-time monitoring of underground infrastructure, enabling utilities to optimize the loading of underground feeders, detect outages and other events, and monitor various power quality parameters.
•
Transformer IQ
TM
- The Transformer IQ
TM
is a comprehensive monitoring system that consolidates all transformer monitoring functions onto a single platform using industry-proven hardware, and allows utilities to effectively predict nearly all the failure modes known to occur to transformers.
•
Bushing IQ
TM
- The Bushing IQ
TM
is a continuous online system for monitoring power factor in high voltage capacitive bushings.
Customers and Markets
Within Australia where GridSense has an established sales team and support infrastructure, GridSense sells the PowerMonic
TM
, Line IQ
TM
, Cable IQ
TM
, Transformer IQ
TM
and Bushing IQ
TM
range of products directly to electric utilities and industrial customers. Outside of Australia, GridSense utilizes a network of resellers, including rental companies, electrical engineering firms, distributors, independent manufacturers' representatives and agents. In addition, in North America, GridSense employs four sales professionals. By leveraging off this indirect sales network, GridSense has expanded into international territories while minimizing the risk and financial burden of maintaining a direct sales organization.
Strategically important markets outside of Australia include North America, South America, China and South Africa. Having invested heavily in an organization to support its customers in the U.S. and Canada, GridSense has grown its customer base from just a handful a few years ago to over 200 utility companies ranging from municipal utilities and cooperatives to large investor owned utilities. The penetration of this market in the relatively short time since GridSense established operations in the US has been made possible with the establishment of a manufacturer's representative network covering the region. Given the size of the North American utility market, sales from this territory are expected to grow, and we believe North America will eventually represent the largest portion of overall GridSense sales in the future. Unlike North America which is characterized by a large number of electricity suppliers over a vast geographic territory, the opportunities in South America, China and South Africa are focused on a small number of large electric utility operators. We are currently pursuing deployment opportunities in these aforementioned markets having already established relationships with local utilities and currently supporting pilots or evaluation trials.
GridSense has activities in other international markets but continues a measured and disciplined approach toward expansion. Validation of the market opportunity takes place before actual deployment of resources. GridSense mitigates its operational and financial risks by aligning itself with resellers that exhibit technical competency, established customer relationships and on-the-ground resources to support our offerings.
In 2011, two customers accounted for approximately 46% ($3.3 million) of GridSense's revenues (34% and 12% or $2.4 million and $0.9 million, respectively). One of those customers represented approximately 13% of Acorn's consolidated revenues for 2011. This customer was a U.S. utility that deployed a large number of TransformerIQ
TM
systems across a fleet of transformers. Although follow-on sales are expected in future periods from this existing customer, it is unknown whether GridSense will enter into a similar sized transaction with this utility in the future. The loss of one or more of the company's top customers could have a material effect on the overall sales of GridSense. To mitigate this risk, the company is aggressively expanding its sales pipeline and supporting a larger base of customers.
5
Competition
The industry in which GridSense operates is characterized by intense competition from both large, established companies as well as smaller companies with specialized offerings. Such competitors include General Electric, Siemens, Qualitrol Company LLC, PowerSense and Schweitzer Engineering Laboratories. To avoid direct competition with larger, more established companies, GridSense focuses on niches where it can offer a differentiated product based on superior cost and performance. As GridSense grows and penetrates markets where larger companies have been established, it may experience more competition. GridSense is in a field where electronics and software/firmware dominate. This fast changing area may generate new methods of detecting and monitoring disturbances. GridSense closely monitors trends and changes in technologies and customer demand that could adversely impact its competitiveness and overall success. Price, quality and experience are the primary competitive factors.
Intellectual Property
GridSense invests significant resources in product development and research in order to maintain its competitiveness in the marketplace. Keeping proprietary information safe from unauthorized use or disclosure is therefore an important objective. In order to protect its proprietary know-how and technology, GridSense uses a combination of patents, trade secrets, contracts, copyrights and trademarks. GridSense owns three Australian patents and three U.S. patents, and has one patent pending in both Australia and the U.S. In addition, GridSense owns three patents in Canada, two in Europe, two in South Africa and one in Great Britain. Some of GridSense's know-how and technology may not be patentable. To protect its rights, GridSense requires employees, as well as select consultants, advisors and collaborators to enter into confidentiality agreements. While these agreements will provide some level of protection, they cannot provide absolute assurance that GridSense's trade secrets, know-how or other proprietary information are fully safeguarded. Whenever intellectual property is developed internally or acquired, GridSense will evaluate and determine the optimal mix of controls to protect itself.
Production Facilities and Locations
GridSense has headquarters in Sydney, Australia and Sacramento, CA. The leased facility in Sydney covers 8,100 square feet while the leased facility in Sacramento has approximately 10,400 square feet. GridSense management believes both facilities are sufficient to meet the company's needs for the foreseeable future. GridSense has successfully outsourced many production processes to external parties while maintaining strict quality assurance standards including the internal testing of all finished goods. The transfer of production to accredited contract manufacturers has reduced the Company's fixed manufacturing overhead and freed up resources to focus on quality assurance and service.
ENERGY AND SECURITY SENSOR SYSTEMS - US SEISMIC SYSTEMS, INC.
In accordance with applicable accounting standards, we began consolidating the results of US Seismic Systems, Inc. ("USSI") beginning February 23, 2010, the date we effectively acquired USSI. USSI is a Delaware corporation based in Chatsworth, California which was established in October 2007. In a series of investments, option exercises and exchanges of shares beginning in November 2009 through May 2011, we acquired an aggregate of approximately 81% of USSI. In addition, we have in the period from May 2011 to January 2012, advanced to USSI $2.5 million in contemplation of a new investment agreement. In February 2012, we entered into a new Stock Purchase Agreement with USSI pursuant to which we converted these advanced funds into additional shares of USSI common stock and shares of USSI's new Series A-1 Preferred Stock. We currently own approximately 87% of USSI (See Recent Developments).
USSI's primary focus is to develop and produce “state of the art” fiber optic sensing systems for the energy and security (both commercial and defense) markets. USSI’s patented ultra-high sensitivity fiber optic sensors are being designed to replace the legacy expensive, unreliable, and bulky electronic sensors currently in widespread use today with small, low cost, ultra-reliable, and inherently-safe fiber optic sensors. USSI’s fiber optic sensors have demonstrated greater than three hundred times the sensitivity as compared to the legacy electronic sensors and sell for a fraction of the cost of traditional electronic sensors.
Products and Services
USSI’s new fiber optic sensing systems provide its users with a competitive advantage over those relying on existing sensor technology. As further described below, primary product lines for which USSI is currently developing products include downhole fiber optic sensor systems for oilfield 4D seismic reservoir monitoring, shale gas microseismic monitoring, fiber optic perimeter security systems (including commercial and defense), and fiber optic pipeline/coal mine monitoring systems. USSI’s systems are currently being installed for evaluation by companies in North America, Asia, and Eastern Europe. Except as noted below, USSI has not yet made significant sales of products for commercial use by customers.
6
4D reservoir & shale gas monitoring.
New oil discoveries are not keeping pace with the worldwide demand for oil. To make up for this shortfall, more oil must be produced from existing fields, which dictates increased use of 4D seismic techniques (repeated 3D seismic images to monitor the movement of oil reservoir fluids over time) to increase the percentage of oil extracted. For 4D to be cost-effective, permanently-installed seismic sensors are needed. Current mainstream oilfield seismic sensing systems are based upon 50 year-old technology that is too costly and unreliable for permanent installations. USSI’s fiber optic seismic sensors can meet the demanding performance, cost, and reliability requirements needed for advanced 4D seismic analysis.
In addition to oilfield seismic sensing, there is also a great need for the USSI technology in the harvesting of natural gas. There is a fundamental shift underway within the oil and gas industry as major oil companies are increasingly focusing on natural gas as new horizontal drilling techniques combined with hydro fracking are making the world’s vast tight gas shale fields economical to produce. Natural gas is significantly cheaper per BTU than oil, burns cleaner than oil and is also gaining traction as a fuel for transportation. USSI’s fiber optic sensors can provide the ability to monitor the fracking process to improve production efficiency and minimize potential environmental damage at a fraction of the cost of competing technology.
Fiber optic pipeline monitoring.
There are currently approximately 160,000 miles of oil transmission pipelines and 305,000 miles of gas transmission pipelines in the US, most of which were built before the end of World War II. USSI provides pipeline monitoring for Oil and Gas pipelines, through a similar revolutionary, all-in-one, fiber optic sensing cable. Since the optical fiber is the sensor, there are no electronics required in the sensor cable, and every inch of the cable is acoustically sensitive ensuring that there are no gaps in coverage. The USSI system detects unusual acoustic activity such as leaks, tampering, theft or damage caused by construction equipment. The USSI system can effectively detect attempted illegal tapping of pipelines in remote areas as well as intrusion into pipeline facilities for terrorist activities. The unique ability of USSI’s sensor to monitor hundreds of miles of pipeline in real-time, with no electronics on the pipeline is a distinct advantage over competing systems.
Fiber optic perimeter security.
USSI has developed an all-optical security system based upon a microphonic cable that can be mounted on a fence, buried along a border/perimeter, or placed underwater in a harbor. We believe the USSI fiber optic microphonic cable is the most sensitive available as it can detect disturbance signals that are 100 times quieter than competing systems. In addition, the USSI system is unique in its ability to detect and classify multiple simultaneous events. The system utilizes sophisticated signal processing techniques to screen out false alarms, and will detect, pinpoint and notify on any attempts to infiltrate a facility.
The USSI security sensing system features low noise, high sensitivity, and high dynamic range, providing a true reproduction of acoustic signals, and clearly defined, independent sensing zones. We believe the USSI buried fiber optic sensing system has the lowest noise floor of any competing fiber optic perimeter security system. This advantage enables the USSI system to detect in-ground disturbance signals that may be very weak or that occur at much larger distances. In addition, the USSI system is unique in its ability to detect and classify multiple simultaneous events on single or multiple zones. This capability is very important in that it prevents a potential intruder from foiling the system by masking an intrusion attempt by simultaneously applying loud noise at an alternate location. Certain of these products are already in use by customers.
Customers and Markets
In the period since our acquisition of USSI in February 2010, it has recorded total revenues of approximately $1.7 million ($0.4 million in 2010 and $1.3 million in 2011). Although the value of orders to date remains small, USSI has initiated numerous project proposals for all of its products and services as well as successfully demonstrated its sensor technology at numerous test sites for potential customers.
Energy.
USSI targets its products into the oilfield geophysics market, which has about a $12 billion annual market size, of which about $10 billion is for seismic acquisition and processing activities, and about $2 billion is for equipment such as seismic sources and sensors. USSI’s sensor systems fall into the oilfield geophysical equipment market, and its potential customers are the oilfield service companies. The leading oilfield service companies are Schlumberger, Halliburton, and Baker Hughes.
Three companies account for 90% of the Oilfield Geophysical Equipment market. Sercel, S.A, a subsidiary of Compagnie Generale de Geophysique-Veritas (CGGVeritas) represents 54% of the market, ION Geophysical Corporation represents 28% and Oyo Geospace Corporation represents about 8%. The majority of this equipment is currently used for marine seismic and land (surface) seismic applications, with downhole seismic and microseismic making up only about 10%. USSI is initially pursuing the downhole seismic and microseismic market as these are the least mature but the fastest growing markets. USSI believes the size of this market can grow to in excess of $1B as the microseismic monitoring percentage of shale gas wells increases from today's 2-3% to 50%. After addressing these markets, USSI plans to pursue the larger, more mature marine and land seismic markets.
7
Security.
As a result of the attacks of September 11, the United States and many of its international partners have embarked on a massive, long-term effort to enhance the security of their homelands. Waging a cost effective campaign to enhance homeland security demands new, highly developed technologies
.
USSI’s all fiber optic security systems are an example of one of those technologies.
For these applications, what is needed is an unobtrusive sensor system that will allow military forces and/or border security personnel to monitor long stretches of territory from protected sites at extended standoff ranges.
According to Homeland Security Research Corporation ("HSRC"), a consulting firm, the U.S. Homeland Security-Homeland Defense market is larger and is growing faster than many realize. HSRC forecasts it to grow from $69 billion in 2010 to $85 billion by 2014. USSI’s potential customers are the large and small commercial security system integrators, government organizations such as the U.S. Department of Homeland Security, and large government contractors such as Boeing, Northrop Grumman, Lockheed Martin, and Raytheon as well as leading commercial system integrators such as ADT Ltd. (a subsidiary of Tyco International Ltd.), Protection One, Inc., and Monitronics, International, Inc.
Competition
Oil & Gas.
USSI’s primary competition comes from oilfield equipment providers using conventional retrievable downhole sensor technology. This technology is well-proven and widely used. The leaders include OYO Geospace Corporation, Sercel S.A., and ION Geophysical Corporation. Our target market is the emerging permanent downhole sensor market. The existing conventional technology is not suited for permanent installations for the following reasons:
|
•
|
Cost - downhole sensor arrays using existing technology cost $4M to $6M per copy. The equivalent USSI downhole system sells for a fraction of that price.
|
|
•
|
Reliability - existing technology requires expensive downhole electronics that cannot be serviced or repaired if permanently installed. The USSI system has no downhole electronics.
|
USSI also has competition from other oilfield fiber optic sensor companies such as Stingray Geophysical Ltd. (Stingray), Weatherford International Ltd., and Petroleum Geo-Services ASA (PGS). We believe that some of our competitors use early generation fiber optic sensor technology which is expensive and difficult to manufacture. In another case, the highest reported performance of one competitor is significantly less than published USSI performance.
Security Systems.
USSI’s competition in the security market comes from well established companies utilizing conventional (leaky-coax cable) technology and relatively new companies utilizing fiber optic technology. Both technologies can be mounted to a fence or buried around a perimeter. The leading competitors using conventional technology are Southwest Microwave Inc., and Magal Security Systems, Ltd. The leading fiber optic competitors are Future Fibre Technologies Pty Ltd., FiberSensys Inc., Sensoptics Ltd., and Senstar Corporation.
Existing conventional technology, which has been installed in tens of thousands of locations, has multiple drawbacks. These drawbacks include susceptibility to electromagnetic interference ("EMI"), radio frequency interference ("RFI") and lightning. The traditional geophones that are part of existing conventional technology consist of a moving coil of wires around a stationary magnet. If EMI from an outside magnetic field is introduced, it will interfere with the geophone’s performance. If RFI from a radio (or cell phone, or other wireless device) is transmitting near a system that contains existing conventional technology, it could interfere with the system’s performance as well. Furthermore, it is expensive to install and maintain the existing conventional technology, requiring multiple electronics boxes and unreliable batteries in the field. These problems with existing conventional technology led to the emergence of fiber optic-based security systems. The problems with the competing fiber optic security systems include an inability to detect multiple simultaneous events, low sensitivity (10 to 100 times less sensitive than USSI technology), and low signal fidelity (making it difficult to distinguish false alarms).
Intellectual Property
USSI invests significant resources in product development and research in order to protect its future competitiveness in the marketplace. Keeping proprietary information safe from unauthorized use or disclosure is an important objective. In order to protect its proprietary know-how and technology, USSI uses a combination of patents, trade secrets, contracts, and trademarks. However, some of USSI’s know-how and technology may not be patentable. To protect its rights, USSI requires employees, as well as select consultants, advisors and collaborators to enter into confidentiality agreements. While these agreements will provide some level of protection, they cannot provide absolute assurance that USSI’s trade secrets, know-how or other proprietary information are fully safeguarded. Whenever intellectual property is developed internally or acquired, USSI
8
will evaluate and determine the optimal mix of controls to protect itself. USSI owns three U.S. patents, one U.S. trademark, and has 16 applications pending in the U.S. and internationally (PCT filings).
Facilities
USSI's activities are conducted in approximately 21,000 square feet of office and production space in the San Fernando Valley (a suburb north of Los Angeles, CA) under a lease that expires in April 2015. We believe USSI's facilities are sufficient for expected expanding production requirements over the next six to twelve months. Thereafter, it may be necessary to seek expanded or new facilities, and whether they will be available at such time, location and on terms acceptable to USSI cannot be determined. Any inability to expand our production facilities as required to meet customer demand could result in loss of, or a delay in fulfilling, orders and loss of associated revenue.
BACKLOG
As of December 31, 2011, our backlog of work to be completed and the amounts expected to be completed in 2012 were as follows (amounts in millions of U.S. dollars):
|
|
Backlog at December 31, 2011
|
Amount expected to be completed in 2012
|
||||||
|
DSIT Solutions
|
$
|
13.6
|
|
$
|
9.9
|
|
||
|
GridSense
|
0.5
|
|
0.5
|
|
||||
|
USSI
|
1.5
|
|
1.5
|
|
||||
|
Total
|
$
|
15.6
|
|
$
|
11.9
|
|
||
RESEARCH AND DEVELOPMENT EXPENSE, NET
Research and development expense recorded for the years ended December 31, 2009, 2010 and 2011 for each of our consolidated subsidiaries is as follows (amounts in thousands of U.S. dollars):
|
|
Years ended December 31,
|
|||||||||||
|
|
2009
|
2010
|
2011
|
|||||||||
|
DSIT Solutions
|
$
|
457
|
|
$
|
323
|
|
$
|
568
|
|
|||
|
GridSense *
|
—
|
|
259
|
|
1,370
|
|
||||||
|
USSI **
|
—
|
|
383
|
|
1,057
|
|
||||||
|
Total
|
$
|
457
|
|
$
|
965
|
|
$
|
2,995
|
|
|||
* GridSense was acquired on May 12, 2010. Accordingly, the research and development expense recorded with respect to GridSense relates only to the period after its acquisition.
** USSI was effectively acquired on February 23, 2010. Accordingly, the research and development expense recorded with respect to USSI relates only to the period after its acquisition.
Research and development expense recorded is net of participation by third parties in the Company’s research and development costs as well as credits arising from qualifying research and experimental development expenditures.
9
EMPLOYEES
At December 31, 2011, we employed a total of 159 employees, including 132 full-time employees. We consider our relationship with our employees to be satisfactory.
A breakdown of our full-time employees by geographic location can be seen below:
|
|
||||||||||||
|
|
Full-time employee count at December 31, 2011
|
|||||||||||
|
|
U.S
|
Australia
|
Israel
|
Total
|
||||||||
|
DSIT Solutions
|
—
|
|
—
|
|
57
|
|
57
|
|
||||
|
GridSense
|
23
|
|
22
|
|
45
|
|
||||||
|
USSI *
|
28
|
|
—
|
|
—
|
|
28
|
|
||||
|
Acorn
|
2
|
|
2
|
|
||||||||
|
Total
|
53
|
|
22
|
|
57
|
|
132
|
|
||||
A breakdown of our full-time employees by activity can be seen below:
|
|
Full-time employee count at December 31, 2011
|
|||||||||||
|
|
Production, Engineering and Technical Support
|
Marketing and Sales
|
Management, Administrative and Finance
|
Total
|
||||||||
|
DSIT Solutions
|
46
|
|
2
|
|
9
|
|
57
|
|
||||
|
GridSense
|
34
|
|
7
|
|
4
|
|
45
|
|
||||
|
USSI *
|
24
|
|
2
|
|
2
|
|
28
|
|
||||
|
Acorn
|
—
|
|
—
|
|
2
|
|
2
|
|
||||
|
Total
|
104
|
|
11
|
|
17
|
|
132
|
|
||||
* USSI's full-time employee count includes eight full-time consultants in Production, Engineering and Technical Support.
We have no collective bargaining agreements with any of our employees. However, with regard to our Israeli activities, certain provisions of the collective bargaining agreements between the Israeli Histadrut (General Federation of Labor in Israel) and the Israeli Coordination Bureau of Economic Organizations (including the Industrialists Association) are applicable by order of the Israeli Ministry of Labor. These provisions mainly concern the length of the workday, contributions to a pension fund, insurance for work-related accidents, procedures for dismissing employees, determination of severance pay and other conditions of employment. We generally provide our Israeli employees with benefits and working conditions beyond the required minimums. Israeli law generally requires severance pay upon the retirement or death of an employee or termination of employment without due cause. Furthermore, Israeli employees and employers are required to pay specified amounts to the National Insurance Institute, which administers Israel’s social security programs. The payments to the National Insurance Institute include health tax and are approximately 5.5% of wages (up to a specified amount), of which the employee contributes approximately 70% and the employer approximately 30%.
In Australia, all employers are required to make contributions to retirement investment funds benefiting employees called Superannuation. GridSense is required to pay 9% of salary as a contribution toward Superannuation funds nominated by its employees. Further, the Australian Government stipulates that employees are entitled to severance pay if their position is terminated as a result of company restructuring.
ADDITIONAL FINANCIAL INFORMATION
For additional financial information regarding our operating segments, foreign and domestic operations and sales, see “Item 7. Management’s Discussion and Analysis of Financial Condition and Results of Operations” and Note 22 to our Consolidated Financial Statements included in this Annual Report.
10
AVAILABLE INFORMATION
We file annual, quarterly and current reports, proxy statements and other information with the Securities and Exchange Commission (the “SEC”). These filings are available to the public over the internet at the SEC's website at http://www.sec.gov. You may also read and copy any document we file at the SEC's public reference room located at 100 F Street, NE, Washington, DC 20549. Please call the SEC at 1-800-SEC-0330 for further information on the public reference room.
Our website can be found at http://www.acornenergy.com. We make available free of charge on or through our website, access to our annual report on Form 10-K, quarterly reports on Form 10-Q, current reports on Form 8-K, and amendments to those reports as soon as reasonably practicable after such material is electronically filed, or furnished, to the SEC. Our website also includes our Code of Business Conduct and Ethics, Board of Directors' Committee Charters for the Audit, Compensation and Nominating Committees.
11
|
ITEM 1A.
|
RISK FACTORS
|
We may from time to time make written or oral statements that contain forward-looking information. However, our actual results may differ materially from our expectations, statements or projections. The following risks and uncertainties could cause actual results to differ from our expectations, statements or projections.
GENERAL FACTORS
The ongoing instability in global credit and financial markets could materially and adversely affect our business and results of operations.
The ongoing global financial crisis may limit our ability to access the capital markets at a time when we would like, or need, to raise capital, which could have an impact on our ability to react to changing economic and business conditions. Accordingly, if the global financial crisis and current economic downturn continue or worsen, our business, results of operations and financial condition could be materially and adversely affected.
We have a history of operating losses and have used increasing amounts of cash for operations and to fund our acquisitions and investments.
Despite our recent gain on our sale of CoaLogix, we have a history of operating losses, and have used significant amounts of cash to fund our operating activities over the years. In 2009, 2010 and 2011, we had operating losses of $
2.3 million
, $
6.5 million
and $
8.0 million
, respectively. Cash used in operating activities of continuing operations in 2009, 2010 and 2011 was $1.4 million, $6.3 million and $7.8 million, respectively.
In addition, we continue to pursue additional acquisitions and investment opportunities and may need to support the financing needs of our subsidiaries. Following the sale of CoaLogix, we currently have enough cash on hand to fund our operations for the next 12 months. However, we may need additional funds to finance future investment and acquisition activity we wish to undertake. We do not know if such funds will be available if needed on terms that we consider acceptable. We may have to limit or adjust our investment/acquisition strategy in order to continue to pursue our corporate goals.
There can be no assurance that we will continue to declare cash dividends.
In October 2011, our Board of Directors adopted a dividend policy pursuant to which Acorn would pay quarterly dividends on our common stock. The source of our current dividends are the proceeds from our recent sale of CoaLogix. We intend to continue to pay such dividends subject to capital availability and periodic determinations by our Board of Directors that cash dividends are in the best interest of our stockholders and are in compliance with all laws and agreements of Acorn applicable to the declaration and payment of cash dividends.
Future dividends may be affected by, among other factors:
|
•
|
our views on potential future capital requirements for investments in acquisitions or our subsidiaries;
|
|
•
|
use of cash to consummate various acquisition transactions;
|
|
•
|
stock repurchase programs;
|
|
•
|
the ability of our subsidiaries to generate sufficient cash flow in the future to enable Acorn to continue to pay dividends;
|
|
•
|
changes in federal and state income tax laws or corporate laws; and
|
|
•
|
changes to our business model.
|
Our dividend payments may change from time to time, and we cannot provide assurance that we will continue to declare dividends in any particular amounts or at all. A reduction in our dividend payments could have a negative effect on our stock price.
12
We depend on key management for the success of our business.
Our success is largely dependent on the skills, experience and efforts of our senior management team and other key personnel. In particular, our success depends on the continued efforts of John A. Moore, our CEO, Benny Sela, CEO of DSIT, Lindon Shiao, CEO of GridSense and Jim Andersen, CEO of USSI and other key management level employees. The loss of the services of any of these key employees could materially harm our business, financial condition, future results and cash flow. We do not maintain “key person” life insurance policies on any of our employees other than for our CEO, John A. Moore. Although to date we have been successful in retaining the services of senior management and have entered into employment agreements with them, members of our senior management may terminate their employment agreements without cause and with various notice periods. We may also not be able to locate or employ on acceptable terms qualified replacements for our senior management or key employees if their services were no longer available.
Loss of the services of a few key employees could harm our operations.
We depend on key technical employees and sales personnel. The loss of certain personnel could diminish our ability to develop and maintain relationships with customers and potential customers. The loss of certain technical personnel could harm our ability to meet development and implementation schedules. The loss of key sales personnel could have a negative effect on sales to certain current customers. Although most of our significant employees are bound by confidentiality and non-competition agreements, the enforceability of such agreements cannot be assured. Our future success also depends on our continuing ability to identify, hire, train and retain other highly qualified technical and managerial personnel. If we fail to attract or retain highly qualified technical and managerial personnel in the future, our business could be disrupted.
We have recently hired an individual who is our Senior Director of External Relations to assist in certain legislative and other governmental relations matters - such activities may be deemed to be lobbying efforts.
To the extent that our Senior Director of External Relations engages in activities that constitute “lobbying” under federal, state, or local laws, we have to register him and possibly ourselves and one or more of our subsidiaries under such applicable laws. Lobbying laws typically require periodic financial and other reports to be timely made and any failure to register or to comply with the applicable regulations could subject us, our employees and officers and directors to civil or criminal penalties. We intend to comply with such laws.
Our awards of stock options to employees may not have their intended effect.
A portion of our total compensation program for our executive officers and key personnel has historically included the award of options to buy our common stock or the common stock of our subsidiaries. If the price of our common stock performs poorly, such performance may adversely affect our ability to retain or attract critical personnel. In addition, any changes made to our stock option policies, or to any other of our compensation practices, which are made necessary by governmental regulations or competitive pressures could affect our ability to retain and motivate existing personnel and recruit new personnel.
Compliance with changing regulation of corporate governance, public disclosure and financial accounting standards may result in additional expenses and affect our reported results of operations.
Keeping informed of, and in compliance with, changing laws, regulations and standards relating to corporate governance, public disclosure and accounting standards, including the Sarbanes-Oxley Act, Dodd-Frank Act, as well as new and proposed SEC regulations and accounting standards, has required an increased amount of management attention and external resources. Compliance with such requirements may result in increased general and administrative expenses and an increased allocation of management time and attention to compliance activities.
We may not be able to successfully integrate companies which we may invest in or acquire in the future, which could materially and adversely affect our business, financial condition, future results and cash flow.
Part of our business model includes the acquisition of new companies either as new platform companies (OmniMetrix in February 2012 (see Recent Developments), USSI in February 2010 and GridSense in May 2010) or complimentary companies for our subsidiaries. Any failure to effectively integrate any future acquisition's management into our controls, systems and procedures could materially adversely affect our business, results of operations and financial condition.
Our strategy is to continue to integrate our newly acquired companies and grow the businesses of all of our companies. Integrating acquisitions is often costly, and we may not be able to successfully integrate our acquired companies with existing operations without substantial costs, delays or other adverse operational or financial consequences. Integrating acquired
13
companies involves a number of risks that could materially and adversely affect our business, including:
|
•
|
failure of the acquired companies to achieve the results we expect;
|
|
•
|
inability to retain key personnel of the acquired companies;
|
|
•
|
dilution of existing stockholders;
|
|
•
|
potential disruption of our ongoing business activities and distraction of our management;
|
|
•
|
difficulties in retaining business relationships with suppliers and customers of the acquired companies;
|
|
•
|
difficulties in coordinating and integrating overall business strategies, sales and marketing, and research and development efforts; and
|
|
•
|
the difficulty of establishing and maintaining uniform standards, controls, procedures and policies, including accounting controls and procedures.
|
If any of our acquired companies suffers customer dissatisfaction or performance problems, the same could adversely affect the reputation of our group of companies and could materially and adversely affect our business, financial condition, future results and cash flow.
In order to grow, one or more of our companies may decide to pursue growth through acquisitions. Any significant acquisition by one or more of our operating companies could require substantial use of our capital and may require significant debt or equity financing. We cannot provide any assurance as to the availability or terms of any such financing or its effect on our liquidity and capital resources.
We incur substantial costs as a result of being a public company.
As a public company, we incur significant legal, accounting, and other expenses in connection with our reporting requirements. The Sarbanes-Oxley Act of 2002, Dodd-Frank Act and the rules subsequently implemented by the Securities and Exchange Commission ("SEC") and NASDAQ, have required changes in corporate governance practices of public companies. These rules and regulations have already increased our legal and financial compliance costs and the amount of time and effort we devote to compliance activities. We expect that as a result of continued compliance with these rules and regulations, we will continue to incur significant legal and financial compliance costs. We continue to regularly monitor and evaluate developments with respect to these new rules with our legal counsel, but we cannot predict or estimate the amount of additional costs we may incur or the timing of such costs.
We may in the future become involved in litigation that may materially adversely affect us.
From time to time in the ordinary course of our business, we may become involved in various legal proceedings, including commercial, product liability, employment, class action and other litigation and claims, as well as governmental and other regulatory investigations and proceedings. Such matters can be time-consuming, divert management’s attention and resources and cause us to incur significant expenses. Furthermore, because litigation is inherently unpredictable, the results of any such actions may have a material adverse effect on our business, operations or financial condition.
Goodwill recorded in connection with our acquisitions is subject to mandatory annual impairment evaluations and as a result, we could be required to write off some or all of this goodwill, which may adversely affect our financial condition and results of operations.
In accordance with applicable accounting principles, goodwill is not amortized but is reviewed annually or more frequently for impairment and other intangibles are also reviewed if certain conditions exist. During the year ended December 31, 2010, we recorded a $5.0 million impairment of goodwill associated with our former Coreworx subsidiary following our decision to stop funding it and an impairment of $1.2 million associated with our GridSense segment. Any additional impairment of the value of goodwill will result in an additional charge against earnings which could materially adversely affect our reported results of operations and financial position in future periods.
While we have not reported any material weaknesses in internal controls over financial reporting in the past, we cannot assure you that material weaknesses will not be identified in the future. If our internal control over financial reporting or disclosure controls and procedures are not effective, there may be errors in our financial statements that could require a restatement or our filings may not be timely and investors may lose confidence in our reported financial information.
Section 404 of the Sarbanes-Oxley Act of 2002 requires us to evaluate the effectiveness of our internal control over financial reporting as of the end of each year, and to include a management report assessing the effectiveness of our internal control over financial reporting in each Annual Report on Form 10-K.
14
Our management, including our Chief Executive Officer and Chief Financial Officer, does not expect that our internal control over financial reporting will prevent all errors and all fraud. A control system, no matter how well designed and operated, can provide only reasonable, not absolute, assurance that the control system’s objectives will be met. Further, the design of a control system must reflect the fact that there are resource constraints, and the benefits of controls must be considered relative to their costs. Controls can be circumvented by the individual acts of some persons, by collusion of two or more people, or by management override of the controls. Over time, controls may become inadequate because changes in conditions or deterioration in the degree of compliance with policies or procedures may occur. Because of the inherent limitations in a cost-effective control system, misstatements due to error or fraud may occur and not be detected.
As a result, we cannot assure you that significant deficiencies or material weaknesses in our internal control over financial reporting will not be identified in the future. Any failure to maintain or implement required new or improved controls, or any difficulties we encounter in their implementation, could result in significant deficiencies or material weaknesses, cause us to fail to timely meet our periodic reporting obligations, or result in material misstatements in our financial statements. Any such failure could also adversely affect the results of periodic management evaluations regarding disclosure controls and the effectiveness of our internal control over financial reporting required under Section 404 of the Sarbanes-Oxley Act of 2002 and the rules promulgated thereunder. The existence of a material weakness could result in errors in our financial statements that could result in a restatement of financial statements, cause us to fail to timely meet our reporting obligations and cause investors to lose confidence in our reported financial information.
If we are unable to protect our intellectual property, or our intellectual property protection efforts are unsuccessful, others may duplicate our technology.
Our operating companies rely on a combination of patents, trademarks, copyrights, trade secret laws and restrictions on disclosure to protect our intellectual property rights. Our ability to compete effectively will depend, in part, on our ability to protect our proprietary technology, systems designs and manufacturing processes. The ability of others to use our intellectual property could allow them to duplicate the benefits of our products and reduce our competitive advantage. We do not know whether any of our pending patent applications will be issued or, in the case of patents issued, that the claims allowed are or will be sufficiently broad to protect our technology or processes. Further, a patent issued covering one use of our technology may not be broad enough to cover uses of that technology in other business areas. Even if all our patent applications are issued and are sufficiently broad, they may be challenged or invalidated or our competitors may independently develop or patent technologies or processes that are equivalent or superior to ours. We could incur substantial costs in prosecuting patent and other intellectual property infringement suits and defending the validity of our patents and other intellectual property. While we have attempted to safeguard and maintain our property rights, we do not know whether we have been or will be completely successful in doing so. These actions could place our patents, trademarks and other intellectual property rights at risk and could result in the loss of patent, trademark or other intellectual property rights protection for the products, systems and services on which our business strategy partly depends.
We rely, to a significant degree, on contractual provisions to protect our trade secrets and proprietary knowledge. These trade secrets cannot be protected by patent protection. These agreements may be breached, and we may not have adequate remedies for any breach. Our trade secrets may also be known without breach of such agreements or may be independently developed by competitors.
Third parties may claim that we are infringing their intellectual property, and we could suffer significant litigation or licensing expenses or be prevented from selling products and services if these claims are successful. We also may incur significant expenses in affirmatively protecting our intellectual property rights.
In recent years, there has been significant litigation involving patents and other intellectual property rights in many technology-related industries and we believe that the industries that certain of our subsidiaries operate have a significant amount of patent activity. Third parties may claim that the technology or intellectual property that we incorporate into or use to develop, manufacture or provide our current and future products, systems or services infringe, induce or contribute to the infringement of their intellectual property rights, and we may be found to infringe, induce or contribute to the infringement of those intellectual property rights and may be required to obtain a license to use those rights. We may also be required to engage in costly efforts to design our products, systems and services around the intellectual property rights of others. The intellectual property rights of others may cover some of our technology, products, systems and services. In addition, the scope and validity of any particular third party patent may be subject to significant uncertainty.
Litigation regarding patents or other intellectual property rights is costly and time consuming, and could divert the attention of our management and key personnel from our business operations. The complexity of the technology involved and the uncertainty
15
of intellectual property litigation increase these risks. Claims of intellectual property infringement might also require us to enter into costly royalty or license agreements or to indemnify our customers. However, we may not be able to obtain royalty or license agreements on terms acceptable to us or at all. Any inability on our part to obtain needed licenses could delay or prevent the development, manufacture and sale of our products, systems or services. We may also be subject to significant damages or injunctions against development, manufacture and sale of our products, systems or services.We also may be required to incur significant time and expense in pursuing claims against companies we believe are infringing or have misappropriated our intellectual property rights.
Concentrations of credit risk
Financial instruments, which potentially subject us to concentrations of credit risk, consist principally of cash and cash equivalents, short-term deposits, escrowed funds, restricted deposits and trade receivables. The counterparty to a significant amount of our cash equivalents is a money market of a major financial institution. We do not believe there is significant risk of non-performance by this counterparty. The counterparty to our restricted deposits are two major Israeli banks. We do not believe there is significant risk of non-performance by these counterparties. Short-term deposits are in FDIC insured certificates of deposit through the Certificate of Deposit Account Registry Service. The Company does not believe there is significant risk of non-performance by the counterparties. The counterparty to our escrowed funds is a major financial institution. We do not believe there is significant risk of non-performance by this counterparty. Approximately 32% of the trade accounts receivable at December 31, 2011 was due from two customers that pay their trade receivables over usual credit periods. Credit risk with respect to the balance of trade receivables is generally diversified due to the number of entities comprising our customer base. Approximately 71% of the balance in unbilled revenue at December 31, 2011 was due from two customers that when billed, pay their trade receivables over usual credit periods. Credit risk with respect to the balance of unbilled revenue is generally diversified due to the number of entities comprising our customer base.
Results from our past successful sales of subsidiary companies may not be repeated
In the past, we have sold certain former subsidiaries (Comverge and CoaLogix) at a profit, but there can be no assurance that we will be able to repeat these successes with one or more of our current subsidiaries. We invest in companies before they have a meaningful history of revenues and whether we can operate these entities successfully or realize any profit on our investments in them cannot be determined.
RISKS RELATED TO DSIT SOLUTIONS
Failure to accurately forecast costs of fixed-priced contracts could reduce DSIT's margins.
When working on a fixed-price basis, DSIT undertakes to deliver software or integrated hardware/software solutions to a customer’s specifications or requirements for a particular project. The profits from these projects are primarily determined by DSIT's success in correctly estimating and thereafter controlling project costs. Costs may in fact vary substantially as a result of various factors, including underestimating costs, difficulties with new technologies and economic and other changes that may occur during the term of the contract. If, for any reason, DSIT's costs are substantially higher than expected, it may incur losses on fixed-price contracts.
Hostilities in the Middle East region may slow down the Israeli high-tech market and may harm DSIT's operations.
DSIT's operations are conducted in Israel. Accordingly, political, economic and military conditions in Israel may directly affect DSIT. Any increase in hostilities in the Middle East involving Israel could weaken the Israeli hi-tech market, which may result in a deterioration of the results DSIT's operations. In addition, an increase in hostilities in Israel could cause serious disruption to DSIT's operations if acts associated with such hostilities result in any serious damage to its offices or those of its customers or harm to its personnel.
Exchange rate fluctuations could increase the cost of DSIT's operations.
A majority of DSIT’s sales are based on contracts or orders which are in U.S dollars or are in New Israeli Shekels (“NIS”) linked to the U.S. dollar. At the same time, most of DSIT’s expenses are denominated in NIS (primarily labor costs) and are not linked to any foreign currency. The net effect of a devaluation of the U.S. dollar relative to the NIS is that DSIT’s costs in dollar terms increases more than its revenues. DSIT enters into forward contracts to try to mitigate its exposures to exchange rate fluctuations; however, we can provide no assurance that such controls will be implemented successfully. In 2011 the U.S. dollar strengthened in relation to the NIS by 7.7%.
16
DSIT is substantially dependent on a small number of customers and the loss of one or more of these customers may cause revenues and cash flow to decline.
In 2011, approximately 70% of DSIT’s revenues were concentrated in four customers. These customers are expected to continue to make up a significant portion of DSIT’s revenues and cash flow for 2012. A significant reduction of future orders or delay in milestone payments from any of these customers could have a material adverse effect on the performance of DSIT.
DSIT is dependent on meeting milestones to provide cash flow for its operations.
DSIT's operations place a great reliance on it meeting project milestones in order to generate cash flow to finance its operations. Should DSIT encounter difficulties in meeting significant project milestones, resulting cash flow difficulties could have a material adverse effect on its operations.
DSIT must at times provide significant guarantees in order to secure projects. These guarantees are often collateralized by restricted deposits.
Some of the projects DSIT performs require significant performance and/or bank guarantees. At December 31, 2011, DSIT had $5.7 million of performance and bank guarantees outstanding. In addition, DSIT had on deposit at two Israeli banks approximately $2.4 million collateralizing some of these guarantees. These deposits are restricted and, accordingly, DSIT cannot use these funds for operations until the guarantees which are being collateralized are released. At times, this can create cash flow difficulties which could have a material adverse effect on its operations.
In addition, DSIT may not always be able to supply such guarantees or restricted deposits without financial assistance from Acorn. If Acorn needs to provide financial guarantees for DSIT, Acorn may not have sufficient funds available to it to invest in other emerging ventures or take advantage of opportunities available to it in a timely manner.
If DSIT is unable to keep pace with rapid technological change, its results of operations, financial condition and cash flows may suffer.
Some of DSIT's solutions are characterized by rapidly changing technologies and industry standards and technological obsolescence. DSIT's competitiveness and future success depends on its ability to keep pace with changing technologies and industry standards on a timely and cost-effective basis. A fundamental shift in technologies could have a material adverse effect on its competitive position. A failure to react to changes in existing technologies could materially delay DSIT's development of new products, which could result in technological obsolescence, decreased revenues, and/or a loss of market share to competitors. To the extent that DSIT fails to keep pace with technological change, its revenues and financial condition could be materially adversely affected.
DSIT is dependent on a number of suppliers who provide it with components for some of its products.
A number of DSIT's suppliers provide it with major components for some of its products for the Energy & Security Sonar Solutions segment. Some of these components are long-lead items. If for some reason, the suppliers cannot provide DSIT with the component when it is needed and DSIT cannot easily find substitute suppliers on similar terms, DSIT may have increased costs and/or delays in delivering a product to a customer and incur penalties and lose customer confidence. In addition, project delays can also slow down revenue recognition and our financial condition could be materially adversely affected. While DSIT is constantly attempting to develop secondary and tertiary suppliers for these components, it can provide no assurance that it will be successful in doing so on acceptable terms.
DSIT is a relatively small company with limited resources compared to some of its current and potential competitors, which may hinder its ability to compete effectively.
Some of DSIT's current and potential competitors have longer operating histories, significantly greater resources and broader name recognition than it does. As a result, these competitors may have greater credibility with DSIT's existing and potential customers. They also may be able to adopt more aggressive pricing policies and devote greater resources to the development, promotion and sale of their products which would allow them to respond more quickly to new or emerging technologies or changes in customer requirements.
17
RISKS RELATED TO GRIDSENSE
GridSense has incurred net losses and may never achieve sustained profitability.
GridSense incurred net losses for the years ended December 31, 2009, 2010 and 2011. We believe that GridSense will reduce its losses in 2012; however, we can provide no assurance that GridSense will generate sufficient revenues and cash flow to allow it to become profitable or to sustain profitability or to have positive cash flows.
GridSense will need additional financing to grow and finance its operations
We expect that GridSense will continue to require working capital support in order to finance its operations in 2012 as it continues to grow its production, engineering and technical support team in 2012. This support may be in the form of a bank line, new investment by others, additional investment by Acorn, or a combination of the above. We have no assurance that such additional support will be available in sufficient amounts, in a timely manner and on acceptable terms. The availability and amount of any additional investment from Acorn may be limited by the investment and working capital needs of our corporate activities and other operating companies. In addition to support from Acorn, GridSense is in the process of negotiating a line of credit facility from a commercial bank. Management believes that establishment of a bank facility is achievable during 2012. We have no assurance the GridSense will be successful in establishing a bank facility in 2012 or beyond.
GridSense’s products and services may not gain market acceptance or competitors may introduce offerings that surpass those of GridSense.
The primary market for GridSense’s products and services is rapidly evolving which means that the level of acceptance of products and services that have been released recently or that are planned for future release by the marketplace is not certain. If the markets for GridSense’s products and services fail to develop, develop more slowly than expected or become subject to intense competition, its business will suffer. As a result, GridSense may be unable to: (i) successfully market its current products and services, (ii) develop new products, services and enhancements to current products and services, (iii) complete customer installations on a timely basis or (iv) complete products and services currently under development. If GridSense’s products and services are not accepted by its customers or by other businesses in the marketplace, GridSense’s business and operating results will be materially affected. In addition, we can provide no assurance that GridSense will be successful in deriving significant revenue growth through its current strategy and marketing initiatives.
GridSense’s products are subject to regulatory approvals.
Numerous regulations govern the manufacture and sale of GridSense’s products in the United States and other countries where GridSense intends to market its products. Such regulation bears upon the approval of manufacturing techniques, testing procedures and approval for the manufacturing and sale of GridSense’s products, including advertising and labeling.
Any failure or delay in obtaining regulatory approvals would adversely affect our ability to market our products. Furthermore, product approvals may be withdrawn if problems occur following initial marketing or if compliance with regulatory standards is not maintained. The failure, delay or withdrawal of a previously given regulatory approval could materially adversely affect our revenues, cash flows and financial position.
Sales to utilities are generally characterized by long sales cycles.
GridSense’s sales are largely dependent on the sales cycle of electric utilities which is typically long and requires much technical and application support. The purchasing cycle for a utility may involve an evaluation trial or pilot, analysis of data and results, review of competitor’s offerings and smaller scale deployments, before a purchasing decision is made. For large orders, some utilities are required to solicit competitive bids from other vendors which can contribute more time. The entire process can take anywhere between several weeks to several quarters. Delays in securing purchase orders can materially adversely affect our revenues, cash flows and financial condition.
GridSense is attempting to broaden its revenue base by expanding into the North American market.
GridSense is currently recording a significant portion of its revenue from sales generated in Australia (more than 45% in 2011 and more than 60% for the 2010 calendar year). GridSense believes that its continued growth and profitability will require additional expansion of sales in other markets, most notably the North American market. To the extent that GridSense is unable to expand sales into other markets in a timely and cost-effective manner, its business, operating results and financial condition could be materially adversely affected. In addition, even with the successful recruitment of additional personnel and international
18
resellers, there can be no assurance that GridSense will be successful in maintaining or increasing international market demand for its products.
Exchange rate fluctuations could increase the cost of GridSense’s Australian operations.
GridSense has operations in both the U.S. and Australia. Its Australian operations are subject to the volatility of the Australian dollar vis-à-vis the U.S. dollar (in 2011 the Australian dollar was virtually unchanged vis-a-vis the U.S. dollar while in 2010, the Australian dollar strengthened by 13.3%). While risks are somewhat mitigated by the fact that GridSense’s Australian operation’s sales and expenses are primarily denominated in Australian dollars, currency fluctuations may impact the translation of certain balance sheet items, affect the economics of manufacturing and ultimately affect its financial performance. GridSense does not employ specific strategies, such as the use of derivative instruments or hedging, to manage its foreign currency exchange rate exposures.
GridSense’s market is subject to rapidly changing technologies.
GridSense markets its products in a field where electronics and software/firmware dominate. This fast changing area may generate unknown methods of detecting and monitoring disturbances that could render GridSense’s technology inferior, resulting in GridSense’s results of operations being materially adversely affected. GridSense does, however, closely monitor trends and changes in technologies and customer demand that could adversely impact its competitiveness and overall success.
GridSense is subject to vigorous competition with very large competitors that have substantially greater resources and operating histories.
Some of GridSense’s competitors in the markets it serves are larger, better capitalized and have greater resources than GridSense. As GridSense grows and penetrates markets where larger companies have been established, it may experience a reduced rate of growth due to competitive forces. Competition from these competitors may have a material adverse effect on our operations, including a potential reduction in operating margins and a loss of potential business.
RISKS RELATED TO USSI
USSI has a limited operating history.
USSI was formed in November 2007 and has a limited operating history. Many of its products are at a research and development stage and substantial time, effort and financial resources will be required before it can become profitable. USSI’s operations are subject to all of the risks inherent in the establishment of a new business enterprise, especially one that is dependent on developing new products for the oil & gas and security industries. The likelihood of USSI’s success should be considered in light of the problems, expenses, difficulties, complications and delays frequently encountered in connection with establishing a new business such as uncertainty in product development, uncertainty in market acceptance of its products, competition, and changes in business strategy. USSI has no assurance that it will be successful in its business activities.
USSI has incurred net losses and may never achieve sustained profitability.
Since its inception, USSI has had annual operating losses. USSI expects to continue to have operating losses for the year ending December 31, 2012 and possibly beyond as a result of increases in operating expenses required to commence manufacturing and production and to expand its sales and marketing operations. USSI can provide no assurance that it will ultimately generate sufficient revenues to allow it to become profitable, to sustain profitability or to have positive cash flows.
USSI will need additional financing to grow its business and finance its operations
In the period since Acorn's initial investment in November 2009 through May 2011, it has invested $2.5 million directly in USSI. During the period from May 2011 through January 2012, Acorn advanced $2.5 million in contemplation of a new investment agreement that was signed in February 2012 (see Recent Developments). We have no assurance that USSI’s future capital needs will not exceed these amounts or that USSI will generate sufficient cash flow in the future to fund its operations in the absence of additional funding sources. USSI may need to raise additional funds if revenues fail to meet projections or to fund a rapid expansion to meet product demand, respond to competitive pressures or acquire complementary products, businesses or technologies. If additional funds are raised through the direct issuance of equity or convertible debt securities to third parties, Acorn’s percentage ownership of USSI may be reduced.
In addition, should additional funds be needed, there can be no assurance that additional financing will be available on
19
terms acceptable to USSI. If funds are not available, or are not available on acceptable terms, USSI may not be able to fund its growth, respond to competitive pressures or take advantage of unanticipated acquisition opportunities. Accordingly, this could materially and adversely affect USSI’s business, results of operations and financial condition.
USSI is a small company with limited resources compared to some of its current and potential competitors, which may hinder its ability to compete effectively.
Some of USSI’s current and potential competitors have longer operating histories, significantly greater resources and broader name recognition than does USSI. As a result, these competitors may have greater credibility with USSI’s existing and potential customers. They also may be able to adopt more aggressive pricing policies and devote greater resources to the development, promotion and sale of their products than can USSI to its products, which would allow them to respond more quickly than USSI to new or emerging technologies or changes in customer requirements.
If USSI is unable to keep pace with technological change, USSI’s results of operations, financial condition and cash flows may suffer.
Many of USSI’s products are in the research and development stage. In addition, some of USSI’s existing products may require additional engineering and upgrades in conjunction with market developments as well as specific customer needs. There can be no assurance that USSI will continue to be successful in its engineering efforts regarding the development of its products and future technological difficulties could adversely affect its business, results of operations and financial condition.
USSI is not yet ready to manufacture its products in commercial quantities.
In order to be successful, USSI's products must be manufactured in commercial quantities at an acceptable cost and must meet the specifications required by the customers regarding quality. We believe that USSI's space and manufacturing capabilities at its current facilities in Chatsworth, California to be sufficient to handle a large increase in sales for the future. USSI has begun to increase its production staff and has purchased or is planning purchases of automation, control and tracking systems necessary to support larger scale production, but such systems have either not yet been purchased or if acquired, are not yet fully operational. In addition to adding internal staffing and resources, USSI may consider potential opportunities to acquire third party manufacturing capacity through acquisition or contract manufacturing arrangements, and whether or when any will exist on terms acceptable to USSI cannot be determined. Whether such systems and the personnel with the skills to effectively operate them can be put in place to meet customer orders on a timely and high quality basis can also not be determined. Failure to do so could result in delays or failures in meeting customer demand, resulting in a loss of customer confidence and orders. Such difficulties could materially and adversely affect the business, results of operations and financial condition of USSI.
USSI is dependent on a number of suppliers who provide it with key components for some of its products.
USSI’s products incorporate “state of the art” technologies. As such, in many cases there are limited supplies of key components. In particular, USSI currently relies on a single source for the development of its high-end interrogators for some of its technologically advanced product offerings. USSI has not yet found a second source supplier that is economically feasible to use at this time. While USSI continues to try to mitigate the risks associated with this key component, any production delays by this supplier or any adverse change to its financial condition could materially and adversely affect USSI’s business, results of operations and financial condition.
USSI’s targeted customers may be reluctant to try its alternative solution despite its increased reliability and lower cost.
Potential customers may elect to continue to use the existing expensive and less reliable technologies given their familiarity of the existing products in the market. The competition in USSI’s markets may have superior resources and marketing ability which could lead to potential customers selecting existing products over USSI’s products.
While USSI continues to develop its products and invest in marketing efforts accordingly, there is no assurance that USSI’s products will be preferred in the market place relative to the competition with superior overall resources. If the market place does not adopt USSI’s products as anticipated, USSI’s business, results of operations and financial condition could be materially and adversely affected.
Failure to accurately forecast costs of fixed-priced contracts could reduce USSI’s margins.
When working on a fixed-price basis, USSI undertakes to deliver solutions to a customer’s specifications or requirements for a particular project. The profits from these projects are primarily determined by USSI’s success in correctly estimating and thereafter controlling project costs. Costs may in fact vary substantially as a result of various factors, including underestimating costs, difficulties with new technologies and economic and other changes that may occur during the term of the contract. If, for
20
any reason, USSI’s costs are substantially higher than expected, USSI may incur losses on fixed-price contracts.
USSI may lose sales if it is unable to obtain government authorization to export its products.
The export of some of USSI’s products may be subject to export controls imposed by the U.S. government and administered by the U.S. Departments of State and Commerce. In certain instances, these regulations may require pre-shipment authorization from the administering department. For products subject to the Export Administration Regulations (“EAR”) administered by the Department of Commerce’s Bureau of Industry and Security, the requirement for a license is dependent on the type and end use of the product, the final destination and the identity of the end user. All USSI products that are exported are subject to EAR; however, most of USSI’s equipment is considered EAR99. EAR99 items generally consist of low-technology consumer goods and do not require a license in many situations. However, if USSI were to attempt to export an EAR99 item to an embargoed country, to an end-user of concern (as defined by the U.S. Department of Commerce) or in support of a prohibited end-use (as defined by the U.S. Department of Commerce), USSI would be required to obtain a license.
Exports of certain USSI products may also be subject to the International Traffic in Arms Regulations (“ITAR”) regulations administered by the Department of State’s Directorate of Defense Trade Controls and may require a license.
Obtaining export licenses can be difficult and time-consuming. Failure to obtain export licenses could significantly reduce our revenue and materially adversely affect USSI’s business, financial condition and results of operations. Compliance with U.S. government regulations may also subject USSI to additional fees and costs. The absence of comparable restrictions on competitors in other countries may adversely affect USSI’s competitive position.
Limited Protection of Proprietary Technology; Risks of Infringement
USSI’s success is heavily dependent upon its internally developed technology. USSI has filed patents covering the specific use and novel inventions developed internally. To further protect its proprietary rights, USSI relies on a combination of patent, trade secret, nondisclosure and other contractual restrictions. As part of its confidentiality procedures, USSI enters into nondisclosure agreements with its employees, as well as select consultants and strategic partners and limit access to and distribution of its designs and proprietary information. Despite these efforts, USSI may be unable to effectively protect its proprietary rights. In addition, the expense associated with the enforcement of USSI’s proprietary rights may be substantial.
RISKS RELATED TO OUR SECURITIES
Our stock price is highly volatile.
The market price of our common stock has fluctuated substantially in the past and is likely to continue to be highly volatile and subject to wide fluctuations. During 2011, our common stock has traded at prices as low as $3.46 and as high as $6.30 per share. Fluctuations in our stock price may continue to occur in response to various factors, many of which we cannot control, including:
|
•
|
general economic and political conditions and specific conditions in the markets we address, including the continued volatility in the energy industry and the general economy;
|
|
•
|
quarter-to-quarter variations in our operating results;
|
|
•
|
announcements of changes in our senior management;
|
|
•
|
the gain or loss of one or more significant customers or suppliers;
|
|
•
|
announcements of technological innovations or new products by our competitors, customers or us;
|
|
•
|
the gain or loss of market share in any of our markets;
|
|
•
|
changes in our dividend policy;
|
|
•
|
changes in accounting rules;
|
|
•
|
changes in investor perceptions; or
|
|
•
|
changes in expectations relating to our products, plans and strategic position or those of our competitors or customers.
|
In addition, the market prices of securities of energy related companies have been and remain volatile. This volatility has significantly affected the market prices of securities of many companies for reasons frequently unrelated to the operating performance of the specific companies.
Our share price may decline due to the large number of shares of our common stock eligible for future sale in the public market including shares underlying warrants and options.
21
Almost all of our outstanding shares of common stock are, or could upon exercise of options or warrants would become, eligible for sale in the public market as described below. Sales of a substantial number of shares of our common stock in the public market, or the possibility of these sales, may adversely affect our stock price.
As of March 1, 2012, 17,743,772 shares of our common stock were issued and outstanding. As of that date we had 223,645 warrants outstanding and exercisable with a weighted average exercise price of $4.20 and 1,157,915 options outstanding and exercisable with a weighted average exercise price of $4.34 per share, which if exercised would result in the issuance of additional shares of our common stock. In addition to the options noted above, at March 1, 2011, 185,418 options are outstanding, but have not yet vested and are not yet exercisable.
22
|
ITEM 1B.
|
UNRESOLVED STAFF COMMENTS
|
None.
23
|
ITEM 2.
|
PROPERTIES
|
Our corporate activities are conducted in office space in Wilmington, Delaware under a lease that expires in June 2012 at a monthly rent of $3,450 per month. We anticipate either renewing our lease or finding a similar space near Wilmington.
Our DSIT subsidiary’s activities are conducted in approximately 19,000 square feet of office space in the Tel Aviv, Israel metropolitan area under a lease that expires in August 2012. The annual rent is approximately $220,000. DSIT anticipates renewing its lease remaining at its current location and does not anticipate a material change in its annual rent.
GridSense operates facilities in Sydney, Australia and West Sacramento, CA. The Sydney office occupies approximately 8,100 square feet of office, testing laboratory, production and warehouse space. The lease in Sydney expires in July 2013. The annual rent is approximately $90,000 and is subject to annual increases based on the Australian CPI index. The West Sacramento office is approximately 10,400 square feet and its annual rent is approximately $90,000. The lease agreement expires in May 2015. The annual rent at the West Sacramento office increases 3% per year.
USSI's activities are conducted in approximately 21,000 square feet of office and production space in the San Fernando Valley (a suburb north of Los Angeles, CA) under a lease that expires in April 2015. The annual rent at this facility is approximately $150,000.
24
|
ITEM 3.
|
LEGAL PROCEEDINGS
|
None.
25
|
ITEM 4.
|
MINE SAFETY DISCLOSURES
|
Not applicable.
26
|
ITEM 5.
|
MARKET FOR REGISTRANT’S COMMON EQUITY, RELATED STOCKHOLDER MATTERS AND ISSUER PURCHASES OF EQUITY SECURITIES
|
Our common stock is currently traded on the NASDAQ Global Market under the symbol “ACFN”. The following table sets forth, for the periods indicated, the high and low reported sales prices per share of our common stock on NASDAQ.
|
|
High
|
Low
|
||||||
|
2010:
|
|
|
||||||
|
First Quarter
|
$
|
7.49
|
|
$
|
5.63
|
|
||
|
Second Quarter
|
6.68
|
|
4.45
|
|
||||
|
Third Quarter
|
5.51
|
|
4.30
|
|
||||
|
Fourth Quarter
|
5.04
|
|
3.55
|
|
||||
|
2011:
|
|
|
|
|
||||
|
First Quarter
|
$
|
4.37
|
|
$
|
3.56
|
|
||
|
Second Quarter
|
4.16
|
|
3.46
|
|
||||
|
Third Quarter
|
5.72
|
|
4.07
|
|
||||
|
Fourth Quarter
|
6.30
|
|
4.64
|
|
||||
As of March 8, 2012
, the last reported sales price of our common stock on the Nasdaq Global Market was $8.94, there were 133 record holders of our common stock and we estimate that there were approximately 3,300 beneficial owners of our common stock.
We paid no dividends in 2009 or 2010. On October 17, 2011, our Board of Directors approved the payment of a quarterly dividend of $0.035 per share and a 2011 year-end declaration of a special dividend of $0.05 per share. The quarterly dividend was paid ($614,000) on November 28, 2011 to common shareholders of record on November 16, 2011. The special year-end dividend was paid ($876,000) on January 9, 2012 to stockholders of record on December 30, 2011. On February 7, 2012, our Board of Directors approved a dividend of $0.035 per share to be paid on March 1, 2012 to common stockholders of record on February 20, 2012. On March 1, 2012, the total dividend payment was $618,000. Our decision to pay a similar dividend in the future will be affected by our future results of operations, financial position, business, changes to applicable tax laws and regulations, and the various other factors that may affect our overall business, including those set forth in "Risk Factors." Accordingly, we cannot assure you that in the future we will continue to pay a quarterly dividend of this amount, or at all.
27
PERFORMANCE GRAPH
The following stock price performance graph compares the cumulative total return of the Company's Common Stock during the period December 31, 2006 to December 31, 2011, to the cumulative total return during such period of (i) the NASDAQ Composite Index and (ii) the Russell MicroCap Index. The graph assumes that the value of the investment in our Common Stock and each index (including reinvestment of dividends) was $100.00 on December 31, 2006.
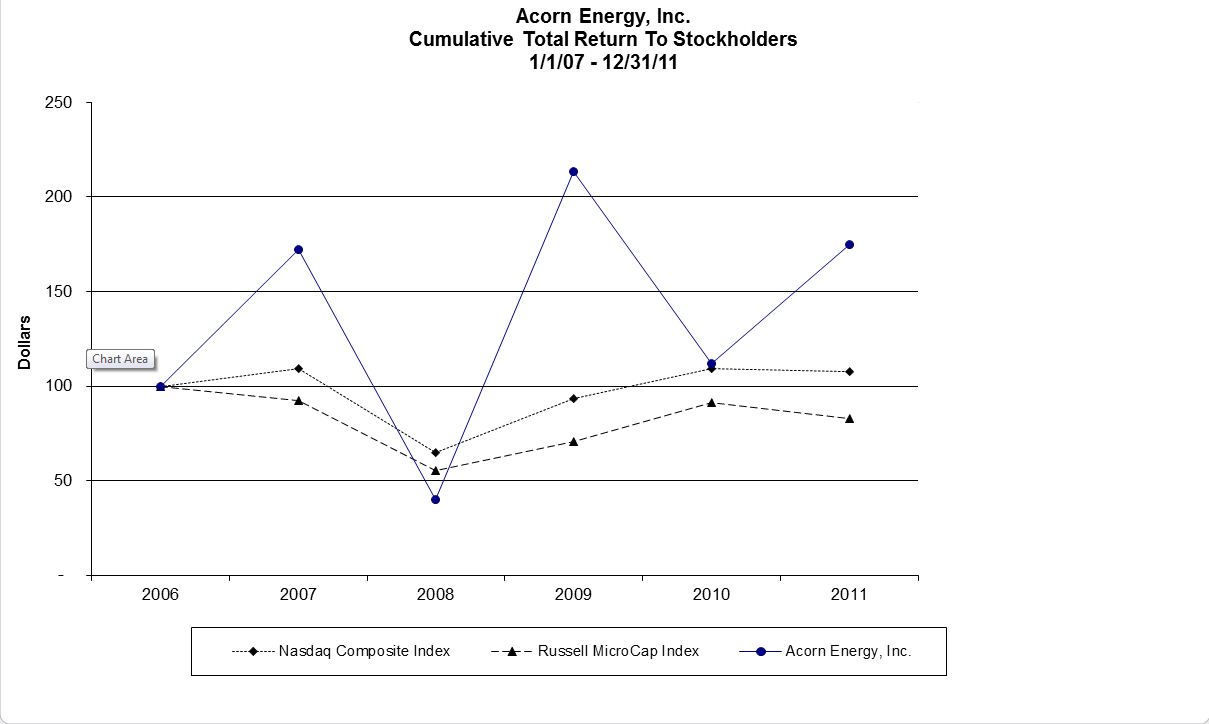
28
|
ITEM 6.
|
SELECTED FINANCIAL DATA
|
The selected consolidated statement of operations data for the years ended December 31, 2009, 2010 and 2011 and consolidated balance sheet data as of December 31, 2010 and 2011 has been derived from our audited Consolidated Financial Statements included in this Annual Report. The selected consolidated statement of operations data for the years ended December 31, 2007 and 2008 and the selected consolidated balance sheet data as of December 31, 2007, 2008 and 2009 has been derived from our unaudited consolidated financial statements not included herein.
This data should be read in conjunction with our Consolidated Financial Statements and related notes included herein and “Item 7. Management’s Discussion and Analysis of Financial Condition and Results of Operations.”
29
Selected Consolidated Statement of Operations Data:
|
|
For the Years Ended December 31,
|
|||||||||||||||||||
|
|
2007
|
2008
|
2009
|
2010
|
2011
|
|||||||||||||||
|
|
(in thousands, except per share data)
|
|||||||||||||||||||
|
Revenues
|
$
|
4,863
|
|
$
|
8,267
|
|
$
|
9,219
|
|
$
|
14,244
|
|
$
|
18,928
|
|
|||||
|
Cost of sales
|
3,567
|
|
5,600
|
|
5,264
|
|
8,200
|
|
12,015
|
|
||||||||||
|
Gross profit
|
1,296
|
|
2,667
|
|
3,955
|
|
6,044
|
|
6,913
|
|
||||||||||
|
Research and development expenses, net
|
415
|
|
236
|
|
457
|
|
965
|
|
2,995
|
|
||||||||||
|
Selling, general and administrative expenses
|
5,022
|
|
6,282
|
|
5,702
|
|
10,440
|
|
11,952
|
|
||||||||||
|
Impairments
|
112
|
|
3,664
|
|
81
|
|
1,166
|
|
—
|
|
||||||||||
|
Operating loss
|
(4,253
|
)
|
(7,515
|
)
|
(2,285
|
)
|
(6,527
|
)
|
(8,034
|
)
|
||||||||||
|
Finance expense, net
|
(1,585
|
)
|
(2,871
|
)
|
(71
|
)
|
(224
|
)
|
(26
|
)
|
||||||||||
|
Gain on early redemption of Convertible Debentures
|
—
|
|
1,259
|
|
—
|
|
—
|
|
—
|
|
||||||||||
|
Gain on Comverge IPO
|
16,169
|
|
—
|
|
—
|
|
—
|
|
—
|
|
||||||||||
|
Gain on sale of shares in Comverge
|
23,124
|
|
8,861
|
|
1,403
|
|
—
|
|
—
|
|
||||||||||
|
Gain (loss) on private placement of equity investments
|
(37
|
)
|
7
|
|
—
|
|
—
|
|
—
|
|
||||||||||
|
Gain on investment in GridSense
|
—
|
|
—
|
|
—
|
|
1,327
|
|
—
|
|
||||||||||
|
Dividends received from EnerTech
|
—
|
|
—
|
|
—
|
|
135
|
|
—
|
|
||||||||||
|
Loss on sale of EnerTech
|
—
|
|
—
|
|
—
|
|
(1,821
|
)
|
—
|
|
||||||||||
|
Gain on sale of HangXing
|
—
|
|
—
|
|
—
|
|
—
|
|
492
|
|
||||||||||
|
Income (loss) from operations before taxes on income
|
33,418
|
|
(259
|
)
|
(953
|
)
|
(7,110
|
)
|
(7,568
|
)
|
||||||||||
|
Income tax benefit (expense)
|
445
|
|
(342
|
)
|
719
|
|
(671
|
)
|
12,767
|
|
||||||||||
|
Income (loss) from operations of the Company and its consolidated subsidiaries
|
33,863
|
|
(601
|
)
|
(234
|
)
|
(7,781
|
)
|
5,199
|
|
||||||||||
|
Share of income (losses) in Paketeria
|
(1,206
|
)
|
(1,560
|
)
|
263
|
|
—
|
|
—
|
|
||||||||||
|
Share of losses in GridSense
|
—
|
|
(926
|
)
|
(129
|
)
|
—
|
|
—
|
|
||||||||||
|
Income (loss) from continuing operations
|
32,657
|
|
(3,087
|
)
|
(100
|
)
|
(7,781
|
)
|
5,199
|
|
||||||||||
|
Gain on the sale of discontinued operations, net of income taxes
|
—
|
|
—
|
|
—
|
|
—
|
|
31,069
|
|
||||||||||
|
In-process research and development expense recorded in acquisition of discontinued operation
|
—
|
|
(2,444
|
)
|
—
|
|
—
|
|
—
|
|
||||||||||
|
Loss from discontinued operations, net of income taxes
|
(140
|
)
|
(2,612
|
)
|
(6,076
|
)
|
(17,969
|
)
|
(1,948
|
)
|
||||||||||
|
Non-controlling interest share of loss from discontinued operations
|
—
|
|
248
|
|
626
|
|
67
|
|
540
|
|
||||||||||
|
Net income (loss)
|
32,517
|
|
(7,895
|
)
|
(5,550
|
)
|
(25,683
|
)
|
34,860
|
|
||||||||||
|
Net (income) loss attributable to non-controlling interests
|
—
|
|
—
|
|
(206
|
)
|
595
|
|
549
|
|
||||||||||
|
Net income (loss) attributable to Acorn Energy, Inc. shareholders
|
$
|
32,517
|
|
$
|
(7,895
|
)
|
$
|
(5,756
|
)
|
$
|
(25,088
|
)
|
$
|
35,409
|
|
|||||
|
Basic net income (loss) per share attributable to Acorn Energy, Inc. shareholders:
|
|
|
|
|
|
|
|
|
|
|
||||||||||
|
Income (loss) from continuing operations
|
$
|
3.31
|
|
$
|
(0.48
|
)
|
$
|
(0.02
|
)
|
$
|
(0.48
|
)
|
$
|
0.33
|
|
|||||
|
Discontinued operations
|
(0.01
|
)
|
(0.21
|
)
|
(0.48
|
)
|
(1.20
|
)
|
1.70
|
|
||||||||||
|
Net income (loss) per share attributable to Acorn Energy, Inc. shareholders
|
$
|
3.30
|
|
$
|
(0.69
|
)
|
$
|
(0.50
|
)
|
$
|
(1.68
|
)
|
$
|
2.03
|
|
|||||
|
Weighted average number of shares outstanding attributable to Acorn Energy, Inc shareholders - basic
|
9,848
|
|
11,374
|
|
11,445
|
|
14,910
|
|
17,462
|
|
||||||||||
|
Diluted net income (loss) per share attributable to Acorn Energy, Inc. shareholders:
|
|
|
|
|
|
|
|
|
|
|
||||||||||
|
Income (loss) from continuing operations attributable to Acorn Energy, Inc. shareholders
|
$
|
2.81
|
|
$
|
(0.48
|
)
|
$
|
(0.02
|
)
|
$
|
(0.48
|
)
|
$
|
0.32
|
|
|||||
|
Discontinued operations
|
(0.01
|
)
|
(0.21
|
)
|
(0.48
|
)
|
(1.20
|
)
|
$
|
1.67
|
|
|||||||||
|
Net income (loss) per share
|
$
|
2.80
|
|
$
|
(0.69
|
)
|
$
|
(0.50
|
)
|
$
|
(1.68
|
)
|
$
|
1.99
|
|
|||||
|
Weighted average number of shares outstanding attributable to Acorn Energy, Inc shareholders - diluted
|
12,177
|
|
11,374
|
|
11,445
|
|
14,910
|
|
17,743
|
|
||||||||||
30
Selected Consolidated Balance Sheet Data:
|
|
As of December 31,
|
|||||||||||||||||||
|
|
2007
|
2008
|
2009
|
2010
|
2011
|
|||||||||||||||
|
|
(in thousands, except per share data)
|
|||||||||||||||||||
|
Working capital
|
$
|
13,843
|
|
$
|
13,838
|
|
$
|
16,220
|
|
$
|
14,599
|
|
$
|
60,217
|
|
|||||
|
Total assets
|
96,967
|
|
51,055
|
|
48,735
|
|
59,785
|
|
85,805
|
|
||||||||||
|
Short-term and long-term debt
|
4,995
|
|
3,591
|
|
635
|
|
1,610
|
|
818
|
|
||||||||||
|
Total Acorn Energy, Inc. shareholders’ equity
|
67,325
|
|
33,448
|
|
30,777
|
|
33,373
|
|
69,651
|
|
||||||||||
|
Non-controlling interests
|
—
|
|
2,675
|
|
5,321
|
|
8,504
|
|
(84
|
)
|
||||||||||
|
Total equity
|
67,325
|
|
36,123
|
|
36,098
|
|
41,877
|
|
69,567
|
|
||||||||||
|
Cash dividends paid per share
|
—
|
|
—
|
|
—
|
|
—
|
|
0.035
|
|
||||||||||
31
|
ITEM 7.
|
MANAGEMENT’S DISCUSSION AND ANALYSIS OF FINANCIAL CONDITION AND RESULTS OF OPERATIONS
|
RECENT DEVELOPMENTS
Acquisition of OmniMetrix
On February 15, 2012, we entered into a definitive agreement pursuant to which we acquired, through our XYZ Holdings, Inc. wholly-owned Georgia subsidiary ("Holdings" which has been renamed OMX Holdings, Inc.), all of the issued and outstanding limited liability company membership interests (the "Interests") in OmniMetrix, LLC, a Georgia limited liability company ("OmniMetrix"). OmniMetrix is in the business of designing, manufacturing, marketing and selling (i) wireless remote systems that monitor standby power generation, backup power generators, remote powered equipment, cellular towers, emergency towered communications and remote tower sites, (ii) cathodic protection products to monitor pipeline integrity, and (iii) other wireless remote systems. Holdings purchased the Interests in OmniMetrix from its three individual holders in consideration for an aggregate cash payment of $8.5 million, subject to certain adjustments as provided in the definitive agreement. The acquisition of OmniMetrix adds to the Company's growing product lines of remote monitoring systems for aging energy infrastructure.
Acorn investment in USSI
On February 6, 2012, we entered into a new Stock Purchase Agreement (the “USSI Purchase Agreement”) with USSI pursuant to which we converted certain advanced funds ($2.5 million) into additional shares of USSI common stock (“USSI Common Stock”) and shares of USSI's new Series A-1 Preferred Stock (“USSI Preferred Stock”). We also made a further payment to USSI of $2.25 million on February 6, 2012 to purchase additional shares of USSI Preferred Stock, and we anticipate that we will purchase more shares of USSI Preferred Stock for an aggregate purchase price of $2.5 million at a future date. The USSI Preferred Stock provides that upon any future liquidation of USSI, to the extent funds are available for distribution to USSI's stockholders after the satisfaction of any USSI liabilities at that time, USSI would first repay us for the purchase price of our USSI Preferred Stock. Thereafter, we would receive a further payment for such shares ratably with all other USSI Common Stock holders as though our shares of USSI Preferred Stock were the same number of shares of USSI Common Stock.
We currently own approximately 87% of USSI, which would increase to approximately 92% if and when the second closing occurs. In connection with the USSI Purchase Agreement, we also agreed to permit USSI to establish a new 2012 Stock Plan (the “USSI 2012 Plan”) under which key employees, directors and consultants of USSI may receive options to purchase up to an aggregate of 1,180,000 shares of USSI Common Stock on such terms as the USSI 2012 Plan provides and as determined by USSI's board of directors or by such committee designated by USSI's board to administer the USSI 2012 Plan, if any. If options to purchase all shares of USSI Common Stock available under the USSI 2012 Plan are granted and exercised, and provided that we have made the additional $2.5 million USSI Preferred Stock purchase as contemplated by the USSI Purchase Agreement, we would own approximately 81% of USSI on a fully diluted basis.
Acorn investment in GridSense
In February, our Board of Directors committed to make up to a $2 million additional investment in our GridSense subsidiaries. We advanced the initial $1 million on February 29, 2012. We anticipate that these funds will be used to fund working capital. We expect to make an additional $1 million investment pursuant to this commitment later this year. We did not receive additional shares in connection with the foregoing as we already own 100% of their outstanding shares.
Acorn Dividend
On February 7, 2012, we announced that our Board of Directors approved a dividend of $0.035 per share to be paid on March 1, 2012 to common stockholders of record on February 20, 2012. The dividend is a continuation of our policy to pay a regular quarterly per share dividend of $.035 per quarter. On March 1, 2012, the total dividend payment was $618,000.
32
OVERVIEW AND TREND INFORMATION
The following discussion includes statements that are forward-looking in nature. Whether such statements ultimately prove to be accurate depends upon a variety of factors that may affect our business and operations. Certain of these factors are discussed in “Item 1A. Risk Factors.”
We operate in three reportable segments: Energy & Security Sonar Solutions (through our DSIT subsidiary), GridSense and USSI. In addition, our “Other” segment represents IT and consulting activities at our DSIT subsidiary.
The following analysis should be read together with the segment information provided in Note 22 to our Consolidated Financial Statements included in this report.
DSIT Solutions
In 2011, DSIT increased its focus on marketing and developing its energy and security sonar solutions and products; particularly its products related to underwater security for energy and other strategic sites. Revenue of our DSIT subsidiary decreased by $1.0 million, or 8%, from $11.5 million in 2010 to $10.5 million in 2011. The decrease was due to decreased revenue in the Energy & Security Sonar Solutions segment (from $10.2 million in 2010 to $9.1 million in 2011) while Other revenue (representing certain IT and consulting work performed by DSIT) increased slightly ($0.1 million). Fourth quarter 2011 revenue for DSIT was $3.8 million reflecting a significant increase (34%) over fourth quarter 2010 revenue of $2.8 million. Fourth quarter 2011 revenues were also well above (103%) third quarter 2011 revenues ($1.9 million). The increase in fourth quarter revenues was due to DSIT's recent receipt of its largest order ever ($12.3 million) for underwater security systems. The contract calls for the delivery of a large number of AquaShield™ Diver Detection Sonar (DDS) and PointShield™ Portable Diver Detection Sonar (PDDS) systems to protect offshore oil platforms, coastal energy terminals and high value vessels against underwater intrusion and sabotage. DSIT began delivery of the systems in the fourth quarter of 2011. DSIT's decreased revenues in 2011 compared to 2010 was due to the completion of an AquaShield™ DDS project in the end of 2010 without another project to replace those lost revenues. Furthermore, work on another AquaShield
TM
DDS project slowed down in 2011 due to the delay in an expected follow-up order of a large expansion to the project changing the configuration of the already ordered DDS systems. The receipt of the recent $12.3 million order and delivery of systems in the fourth quarter reversed the trend of declining revenues for DSIT during 2011.
Gross profit in DSIT in 2011 was $3.7 million which reflects a decrease of $1.2 million or 24% from $4.9 million in 2010. DSIT’s gross profit of $1.5 million during the fourth quarter of 2011 represented a $0.5 million increase over DSIT’s gross profit in the fourth quarter of 2010. The decrease in the year-on-year gross profit was attributable to both decreased revenues and gross margins in DSIT’s Energy & Sonar Security projects. The increase in DSIT’s quarter-on-quarter gross profit was due to the revenues recognized associated with the recent $12.3 million AquaShield
TM
DDS systems order and the high margins associated with that order. Fourth quarter 2011 gross profit was also $1.1 million above third quarter 2011 gross profit ($0.4 million) due to the revenue recognized and associated with the aforementioned AquaShield
TM
systems.
DSIT's gross margin in 2011 was 35%, down from 2010’s gross margin of 42%. This followed a slight decrease in its gross margin from 43% in 2009. The decrease in gross margin in 2011 was attributable to the slow-down of work on an AquaShield
TM
DDS project which caused deterioration in the gross margin associated with that project. In addition, decreased margins in a number of non-Naval projects in our Energy & Sonar Security Solutions segment occurred when we encountered technological difficulties which caused greater than expected labor costs to bring those projects to completion. Fourth quarter 2011 gross margin was 39% as compared to 34% in the fourth quarter of 2010 and 20% in the third quarter of 2011. The increase in gross margins in the fourth quarter of 2011 was due to increased margins associated with the new project received in the fourth quarter of 2011.
During 2011, DSIT recorded approximately $3.1 million of selling, general and administrative ("SG&A") expense as compared to approximately $3.0 million recorded during 2010. The increase in DSIT SG&A expense is attributable to increased marketing costs ($0.2 million) which offset decreased other general and administrative costs.
DSIT recorded a net income of $0.1 million in 2011 ($1.1 million in 2010 and $1.3 million in 2009). The decrease of $1.0 million from 2010 to 2011 was due to the decreased gross profit (which resulted from lower revenues and gross margins) and increased developments costs ($0.2 million) and SG&A expenses ($0.1 million) which were partially offset by a decrease in income tax expenses ($0.5 million). DSIT’s backlog at December 31, 2011 was approximately $13.6 million of which it expects to recognize approximately $9.9 million in 2012. DSIT expects to show significant revenue growth in 2012 compared to 2011 due to revenue it expects to recognize on it recently received $12.3 million order and additional orders it expects to receive during 2012. DSIT's level of profitability in 2012 will be affected by anticipated increased development and marketing costs as DSIT
33
looks to expand its product portfolio and its marketing activities.
Energy & Security Sonar Solutions
During 2009, 2010 and 2011, revenues from our Energy & Security Sonar Solutions segment in our DSIT subsidiary were $8.0 million, $10.2 million and $9.1 million, respectively, accounting for approximately 87% , 89% and 87% of DSIT’s revenues for 2009, 2010 and 2011, respectively. The balance of DSIT’s revenues of $1.2 million, $1.3 million and $1.4 million for the years ending December 31, 2009, 2010 and 2011 were derived from DSIT’s other IT and consulting activities.
This segment’s revenues decreased by $1.1 million or 11% in 2011 as compared to 2010. While in 2010, this segment’s revenues increased by $2.2 million or 27% as compared to 2009. The decrease in revenues was due to the completion of an AquaShield™ DDS project in the end of 2010 without another project to replace those lost revenues until the receipt of the recent $12.3 million order received in December 2011. Furthermore, work on another AquaShield
TM
DDS project slowed down in 2011 due to the delay in an expected follow-up order of a large expansion to the project changing the configuration of the already ordered DDS systems.
Segment gross profit decreased in 2011 as compared to 2010 to $3.0 million from $4.4 million following an increase in 2010 from 2009 from $3.5 million in 2009 to $4.4 million in 2010. The decreased gross profit in 2011 as compared to 2010 was due to decreased revenues of our energy and sonar solutions products combined with reductions in gross margins which decreased from 43% in 2010 to 33% in 2011. The reduced margins in 2011 were caused the previously mentioned slow-down of work on an AquaShield
TM
DDS project and decreased margins in a number of non-Naval projects.
We anticipate significant growth in sales in 2012, particularly from our acoustic and sonar solutions projects as a result of our increased backlog with our revenues from embedded hardware and software development projects expected to remain relatively stable. We anticipate new customers from new regions (primarily Asia based) placing orders for our sonar and acoustic products in 2012. The level of DSIT's net income in 2012 will further depend on amounts we choose to invest in expanded research and development and marketing efforts.
GridSense
In 2011, GridSense continued to focus on delivering solutions that address the power quality and reliability needs of utilities. Each of GridSense's main product lines (the Line IQ
™
,Cable IQ
™
,PowerMonic
™
and Transformer IQ
™
) addresses different aspects of the power delivery system. In addition to its existing product range, GridSense continues to invest in new technology which may lead to the commercialization of new products and revenue drivers for the business. GridSense intends to expand its transformer monitoring capabilities and is expected to launch derivative products related to the TransformerIQ
TM
in future periods.
In accordance with applicable accounting standards, we began consolidating the results of GridSense beginning May 12, 2010, the date we acquired the outstanding GridSense shares not previously owned by us. Accordingly, full year results for 2010 and years prior were not included in Acorn's consolidated financial statements. In 2011, GridSense recorded revenues of $7.1 million, more than doubling 2010's full year revenues of $3.3 million. The increase of $3.8 million or 116% from 2010 to 2011 was primarily due to an order GridSense received in June 2011 from a leading electric utility in the Southeastern USA to use GridSense’s TransformerIQ
TM
to monitor over 2,000 transformers in one metropolitan county of its service territory. This project is expected to be a showcase for Smart Grid distribution optimization demonstrating the scalability and impact of affordable monitoring solutions on electric reliability. The American Recovery and Reinvestment Act provided half the funding for this project.
In 2011, gross profit was $3.3 million compared with 2010's full year gross profit of $1.7 million representing an increase of $1.6 million or 94% from 2010 to 2011. The gross margin percentage decreased in 2011 to 47% compared to 53% in 2010. The decrease in gross margin was due to non-recurring production set up costs related to large initial production batch runs of certain products. In future periods, we expect the gross margin percentage to rebound to historical levels of 50% or greater.
In 2011, GridSense's U.S. operations contributed approximately $3.7 million to GridSense's total revenue compared to approximately $1.2 million in 2010, an increase of over 200%. The increase in revenues is attributable to the June 2011 order GridSense received from a leading electric utility in the Southeastern USA to use its TransformerIQ
TM
to monitor over 2,000 transformers. The order was completed in 2011. Australia operations contributed approximately $3.4 million of revenues in 2011 compared to $2.2 million in 2010, an increase of $1.1 million or 50%. The increase is attributable to the adoption of new products such as a new PowerMonic
TM
version capable of remote communications which was launched during the year.
34
GridSense’s full year revenues by main product lines for 2009, 2010 and 2011 are as follows:
|
|
2009*
|
2010*
|
2011
|
|||||||||
|
|
(in thousands of U.S dollars)
|
|||||||||||
|
PowerMonic
™
|
$
|
1,698
|
|
$
|
1,386
|
|
$
|
2,891
|
|
|||
|
Line IQ
™
|
1,230
|
|
1,116
|
|
1,187
|
|
||||||
|
Transformer IQ
™
|
—
|
|
89
|
|
2,696
|
|
||||||
|
Other
|
681
|
|
724
|
|
345
|
|
||||||
|
Total
|
$
|
3,609
|
|
$
|
3,315
|
|
$
|
7,119
|
|
|||
* 2009 revenues are prior to Acorn's acquisition of GridSense. 2010 revenues include revenues for the period prior to Acorn's acquisition of GridSense in May 2010.
Sales across all major product lines increased in 2011 compared to 2010. Management expects sales for all product lines to continue to grow as market conditions continue to improve. In 2011, Line IQ
™
sales represented 17% of GridSense's revenues while Transformer IQ
™
sales represented 38% of overall company sales. Management expects sales from both the Line IQ
™
and Transformer IQ
™
to represent a greater portion of overall sales in the future. These product lines are expected to drive sales growth for the company.
The Line IQ
™
product family has introduced a newly redesigned advanced sensor which improves both the functionality and price of its predecessor product. This new sensor will be available to customers during 2012. Due to the improved cost of deploying this line monitoring system, utilities will be able to justify larger scale roll-outs. Management expects increases in the size of deployment with existing Line IQ
™
users as well as adoption by new utility customers.
The Transformer IQ
™
was commercially introduced during 2010. During 2011, GridSense was awarded a sizeable order by a U.S. utility to monitor a fleet of over 2,000 transformers, validating the technology and market demand. Since fulfillment of this large order, GridSense has generated traction with other utility customers involving various applications of transformer monitoring. Management expects growth from new customers as a number of prospective utility customers are in various stages of evaluating TransformerIQ
TM
in pilots or trials. In addition, increased marketing and sales efforts is expected to expand GridSense's market penetration.
USSI
In 2011, USSI continued to focus on customer “proof-of-concept” contracts for its major product lines. In particular, USSI had revenue related to “proof-of-concept” contracts for its 4D reservoir and shale gas monitoring, from fiber optic perimeter security systems and government contract revenue from fiber optic underwater security system development for diver detection.
In 2011, full year revenues were $1.3 million compared to $0.4 million in 2010. The increase of $0.9 million or 196% from 2010 to 2011 was due primarily to the interest of the oil and gas market in entering into “proof-of-concept” contracts for USSI's downhole and marine seismic products.
USSI's full year revenues by main markets for 2010 and 2011 are as follows:
|
2010*
|
2011
|
|||||||
|
(in thousands of U.S dollars)
|
||||||||
|
Oil & Gas
|
$
|
120
|
$
|
955
|
|
|||
|
Commercial Security
|
106
|
226
|
|
|||||
|
Defense
|
219
|
135
|
|
|||||
|
Total
|
$
|
445
|
$
|
1,316
|
|
|||
* 2010 revenues include revenues for the period prior to Acorn's effective acquisition of USSI in February 2010.
35
In 2011, full year gross profit was a negative $98,000 compared to a positive $48,000 in 2010. The decline is primarily due to increased engineering and production costs as USSI transitions from development of its products to production. USSI is currently engaged in developing cost cutting measures for the manufacturing of its commercial products, including investment in equipment that will make manufacturing more efficient and improving the production process that will ultimately result in less man-hours required for each product sold. Furthermore, USSI expects that its gross margin will grow as it benefits from allocating its fixed costs over a larger revenue base and as it begins to utilize lower cost personnel in its production.
We anticipate significant growth in revenues in 2012, particularly from new customers related to our 4D reservoir & shale gas monitoring systems following the numerous demonstrations scheduled for early 2012 as well as follow-on projects from our existing 2011 "proof-of-concept" projects, each of which has the potential for annual multi-million dollar follow-up orders. We also anticipate significantly increased costs as we have grown our employee base from seven at the end of 2010 to 28 full-time employees (including eight full-time consultants) as of December 31, 2011. USSI expects to continue to grow its Engineering and Operations staff into 2012.
CoaLogix
On August 31, 2011, Acorn completed the sale of its majority owned CoaLogix Inc. subsidiary (“CoaLogix”) pursuant to which Acorn and the other owner of CoaLogix sold all the outstanding capital stock of CoaLogix for $101 million (subject to certain adjustments) in cash. Acorn owned approximately 65% of CoaLogix on a fully diluted basis and received $61.9 million in consideration for its CoaLogix shares, of which $6.0 million was deposited in an escrow account to secure possible indemnification claims which Acorn expects to be released by August 31, 2012 and $347,000 which was deposited in an escrow account against a possible working capital shortfall and which was released to Acorn in the fourth quarter of 2011.
In connection with the sale of Acorn's shares of the common stock of CoaLogix, Acorn recorded a gain of $47.0 million (included in the gain is approximately $485,000 which was received as part of an additional working capital adjustment in the fourth quarter of 2011). Acorn also recorded income taxes of approximately $16.0 million based on a Federal income tax rate of 34%. The net gain of $31.0 million is reflected in Acorn's Condensed Consolidated Statement of Operations as a “Gain on the sale of discontinued operations, net of income taxes”.
Coreworx
On November 9, 2010, following a decision by Acorn's board of directors to cease providing funding for Coreworx, Acorn entered into a letter of intent with Coreworx for Acorn to sell all of its common stock in Coreworx to a management buyout group consisting of Coreworx’ management and certain employees and other investors. The management buyout transaction was consummated on December 17, 2010, following which Acorn retained a 10% interest in Coreworx, warrants to acquire an additional 10% of Coreworx, $4.0 million of Coreworx debt and a $40,000 restructuring fee due from Coreworx on July 1, 2011. Acorn did not attribute any value to any of the above on its financial statements of December 31, 2010.
On October 31, 2011, Acorn sold its 10% stake in Coreworx and the entire $4.0 million of Coreworx debt, its right to royalties and the $40,000 restructuring fee (which was at the time still unpaid) back to Coreworx for $100,000. The Company recorded a $64,000 gain (net of income taxes of $34,000) on the transaction in Gain on the sale of discontinued operations, net of income taxes in the Company's Consolidated Statements of Operations. Acorn still retains its warrants to acquire 10% of Coreworx and continues not to ascribe any value to those warrants.
Corporate
Corporate general and administrative expense in 2011 reflected a $0.4 million decrease to $3.9 million as compared to $4.3 million of expense in 2010. The decrease in corporate general and administrative expense in 2011 is primarily attributable to decreased professional fees associated with certain 2010 activities (an SEC inquiry regarding our sales of Comverge stock, a registered direct offering and our acquisitions and dispositions), as well as decreased compensation costs primarily attributable to reduced stock compensation expense in 2011. These decreases were partially offset by increased investor relations costs. Fourth quarter corporate general and administrative expense of $1.4 million reflected a $0.4 million increase as compared to the third quarter corporate general and administrative expense primarily due to corporate bonuses. We expect our annual corporate general and administrative costs to increase in 2012 as compared to 2011. We anticipate increasing our investor relation costs as well as incurring increasing personnel costs associated with compensation increases. We have hired a Senior Director of External Relations who is available to assist our subsidiaries with marketing and, in the case of our U.S. subsidiaries, certain legislative and other governmental relations matters. We have also retained one of our directors as a paid consultant to work with our operating companies in developing and monitoring their business plans, provide investor relations services in Europe and help identify acquisition and partnership opportunities.
36
CRITICAL ACCOUNTING POLICIES
The SEC defines “critical accounting policies” as those that require application of management’s most difficult, subjective or complex judgments, often as a result of the need to make estimates about the effect of matters that are inherently uncertain and may change in subsequent periods.
The following discussion of critical accounting policies represents our attempt to report on those accounting policies, which we believe are critical to our consolidated financial statements and other financial disclosure. It is not intended to be a comprehensive list of all of our significant accounting policies, which are more fully described in Note 2 of the Notes to the Consolidated Financial Statements included in this Annual Report. In many cases, the accounting treatment of a particular transaction is specifically dictated by generally accepted accounting principles, with no need for management’s judgment in their application. There are also areas in which the selection of an available alternative policy would not produce a materially different result.
We have identified the following as critical accounting policies affecting our Company: principles of consolidation and investments in associated companies; business combinations, impairments in goodwill and intangible assets, revenue recognition, foreign currency transactions and stock-based compensation.
Principles of Consolidation and Investments in Associated Companies
Our consolidated financial statements include the accounts of all majority-owned subsidiaries. All intercompany balances and transactions have been eliminated.
Investments in other entities are accounted for using the equity method or cost basis depending upon the level of ownership and/or our ability to exercise significant influence over the operating and financial policies of the investee. Investments of this nature are recorded at original cost and adjusted periodically to recognize our proportionate share of the investee’s net income or losses after the date of investment. When net losses from an investment accounted for under the equity method exceed its carrying amount, the investment balance is reduced to zero and additional losses are not recorded. We resume accounting for the investment under the equity method when the entity subsequently reports net income and our share of that net income exceeds the share of net losses not recognized during the period the equity method was suspended. Investments are written down only when there is clear evidence that a decline in value that is other than temporary has occurred.
In the year ending December 31, 2010, we began consolidating the results of USSI effective February 23, 2010 following the signing of option agreements with USSI and certain shareholders of USSI whereby we received options to acquire up to 87% of the company (see Note 4(b) to our Consolidated Financial Statements). We also began consolidating the results of GridSense on May 12, 2010 following our acquisition of the approximately 70% of the company we did not previously own (see Note 4(a) to our Consolidated Financial Statements). On December 17, 2010, we ceased consolidating the results of Coreworx following the sale of all of our common stock in the company to a management buyout group consisting of Coreworx’ management and certain employees and other investors (see Note 5(b) to our Consolidated Financial Statements). On August 31, 2011, we ceased consolidating the results of CoaLogix following the sale of all of our common stock in the company (see Note 3(b) to our Consolidated Financial Statements). The results of CoaLogix and Coreworx are presented as discontinued operations for all the periods since our acquisition of them in November 2007 and August 2008, respectively.
Business combination accounting
We have acquired a number of businesses during the last several years, and we may acquire additional businesses in the future. Business combination accounting, often referred to as purchase accounting, requires us to determine the fair value of all assets acquired, including identifiable intangible assets, and liabilities assumed. The cost of the acquisition is allocated to the assets acquired and liabilities assumed in amounts equal to the estimated fair value of each asset and liability, and any remaining acquisition cost is classified as an amortizable intangible asset, a non-amortizable intangible asset or goodwill. This allocation process requires extensive use of estimates and assumptions, including estimates of future cash flows to be generated by the acquired assets. Certain identifiable intangible assets, such as customer lists and covenants not to compete, are amortized based on the pattern in which the economic benefits of the intangible assets are consumed over the intangible asset’s estimated useful life. The estimated useful life of our amortizable identifiable intangible assets ranges from three to twenty years. Goodwill is not amortized. Accordingly, the acquisition cost allocation has had, and will continue to have, a significant impact on our current operating results.
37
Goodwill and Intangibles
As a result of our various acquisitions, we have recorded goodwill and various amortizable intangible assets. Businesses acquired are recorded at their fair value on the date of acquisition. The excess of the purchase price over the fair value of assets acquired and liabilities assumed is recognized as goodwill.
Our goodwill at December 31, 2011 was approximately $
4.6 million
representing approximately
5.4%
of our total assets. Our goodwill is allocated to our segments as follows: Energy & Security Sonar Solutions – approximately $
0.5 million
, GridSense – approximately $
2.7 million
and USSI – approximately $
1.4 million
.
Our intangible assets that have finite useful lives recorded at fair value at the time of the acquisition, and are carried at such value less accumulated amortization. Our net intangible asset balance at December 31, 2011 was approximately
$4.8 million
representing approximately
5.6%
of our total assets. The composition of our intangible assets at December 31, 2011 consisted of Naval Technologies in our Energy & Security Sonar Solutions segment (
$0.2 million
, net of accumulated amortization), Software and Customer Relationships in our GridSense segment (
$2.2 million
, net of accumulated amortization) and Sensor Technologies in our USSI segment (
$2.3 million
, net of accumulated amortization). We amortize these intangible assets on a straight-line basis over their estimated useful lives.
We review our goodwill for impairment annually at the reporting unit level in the fourth quarter of each fiscal year. Each of our reportable operating segments (Energy & Security Sonar Solutions, GridSense and USSI) is deemed to be a reporting unit. These reporting units have been identified based on appropriate accounting principles, which considers, among other things, the manner in which we operate our business and the availability of discrete financial information. Assets acquired and liabilities assumed are assigned to a reporting unit as of the date of acquisition. In the event we reorganize our business, we reassign the assets (including goodwill) and liabilities among the affected reporting units. Our corporate activities and those relating to our non-reporting segment are not assigned to our reporting units. We periodically review these reporting units to ensure that they continue to reflect the manner in which the business is operated.
We also analyze whether any indicators of impairment for goodwill and intangibles exist each quarter. A significant amount of judgment is involved in determining if an indicator of impairment has occurred. Such indicators may include a sustained, significant decline in our share price and market capitalization, a decline in our expected future cash flows, a significant adverse change in legal factors or in the business climate, unanticipated competition, the testing for recoverability of our long-lived assets, and/or slower growth rates, among others.
In September 2011, the Financial Accounting Standards Board (“FASB”) issued guidance that simplified how entities test for goodwill impairment. This guidance permits entities to first assess qualitative factors to determine whether it is more likely than not that the fair value of a reporting unit is less than its carrying amount as a basis for determining whether it is necessary to perform a two-step goodwill impairment test. This guidance is effective for annual and interim goodwill impairment tests performed for fiscal years beginning after December 15, 2011, and early adoption is permitted. As discussed more fully in Note 12(a) to the Consolidated Financial Statements, we early adopted this guidance for our annual goodwill impairment test that was conducted in the fourth quarter of 2011.
If we had determined that was necessary to perform a two-step goodwill impairment test, we would determine the fair value of each reporting unit and compare it to the carrying amount of the reporting unit. Calculating the fair value of the reporting units requires significant estimates and assumptions by management. To the extent the carrying amount of a reporting unit exceeds the fair value of the reporting unit, there is an indication that the reporting unit goodwill may be impaired and a second step of the impairment test is performed to determine the amount of the impairment to be recognized, if any.
The first step of our annual evaluation in the two-step goodwill impairment test is to compare the estimated fair value of our reporting units to their respective carrying values to determine whether there is an indicator of potential impairment. If the carrying amount of a reporting unit exceeds its estimated fair value, we conduct a second step, in which we calculate the implied fair value of goodwill. If the carrying amount of the reporting unit’s goodwill exceeds the calculated implied fair value of that goodwill, an impairment loss is recognized in an amount equal to that excess. The implied fair value of goodwill is determined in the same manner as the amount of goodwill recognized in a business combination. The fair value of the reporting unit is allocated to all of the assets and liabilities of that unit (including any unrecognized intangible assets such as the assembled workforce) as if the reporting unit had been acquired in a business combination at the date of assessment and the fair value of the reporting unit was the purchase price paid to acquire the reporting unit.
We estimate the fair value of our reporting units using discounted expected future cash flows. We perform a valuation analysis, utilizing an income approach in our goodwill assessment process. The following describes the valuation methodology
38
typically used to derive the fair value of our reporting units.
Income Approach: To determine each reporting unit’s estimated fair value, we discount the expected cash flows of our reporting units. We estimate our future cash flows after considering current economic conditions and trends; estimated future operating results, growth rates, anticipated future economic and regulatory conditions; and the availability of necessary technology. The discount rate used represents the estimated weighted average cost of capital, which reflects the overall level of inherent risk involved in our operations and the rate of return an outside investor would expect to earn. To estimate cash flows beyond the final year of our model, we use a terminal value approach. Under this approach, we use estimated operating income before depreciation and amortization in the final year of our model, adjust it to estimate a normalized cash flow, apply a perpetuity growth assumption and discount by a perpetuity discount factor to determine the terminal value. We incorporate the present value of the resulting terminal value into our estimate of fair value.
The preparation of the long-range forecasts, the selection of the discount rates and the estimation of the multiples used in valuing the terminal year involve significant judgments. Changes to these assumptions could affect the estimated fair value of our reporting units and could result in a goodwill impairment charge in a future period.
For 2011, as required, the Company performed an annual impairment test of recorded goodwill (during the fourth quarter of each year), or more frequently if impairment indicators or triggering events are present. As previously noted, in September 2011, the FASB issued guidance that simplified how entities test for goodwill impairment by permitting entities to first assess qualitative factors to determine whether it is more likely than not that the fair value of a reporting unit is less than its carrying amount as a basis for determining whether it is necessary to perform a two-step goodwill impairment test. We early adopted this guidance for our annual goodwill impairment test that was conducted in the fourth quarter of 2011.
In performing the 2011 goodwill impairment test for each of our reporting units, we assessed the relevant qualitative factors and concluded that it is more likely than not that the fair values of our reporting units are greater than their carrying amounts. After reaching this conclusion, no further testing was performed. The qualitative factors we considered included, but were not limited to, general economic conditions, industry and market conditions, pipeline and backlog, our recent and projected financial performance and the price of the Company's common stock.
Revenue Recognition
Revenue from time-and-materials service contracts, maintenance agreements and other services is recognized as services are provided.
In the year ended December 31, 2011, we recorded approximately $10.5 million of revenues representing approximately
55%
of our consolidated revenues in our DSIT subsidiary. In 2011, DSIT derived approximately $8.9 million or 85% of its revenues from fixed-price type contracts. Fixed-price type contracts require the accurate estimation of the cost, scope and duration of each engagement. Revenue and the related costs for these projects are recognized for a particular period, using the percentage-of-completion method as costs (primarily direct labor) are incurred, with revisions to estimates reflected in the period in which changes become known. If we do not accurately estimate the resources required or the scope of work to be performed, or do not manage our projects properly within the planned periods of time or satisfy our obligations under the contracts, then future revenue and margins may be significantly and negatively affected and losses on existing contracts may need to be recognized. Any such resulting changes in revenues and reductions in margins or contract losses could be material to our results of operations.
In 2011, GridSense recorded approximately $7.1 million of revenue representing approximately
38%
of our consolidated revenue for the year.
Revenue from sales of GridSense monitoring equipment is recognized at the time title to the equipment and significant risks of ownership pass to the customer (which is generally upon shipment), when all significant contractual obligations have been satisfied and collection is reasonably assured. Revenue from customer support services on monitoring equipment includes sales of parts and servicing of equipment. Sales of parts revenue is recognized when the parts are shipped to the customer or when the part is installed in the customer's equipment. Servicing of equipment revenue is recognized as the related service work is performed.
In 2011, USSI recorded approximately $1.3 million of revenue representing approximately
7%
of our consolidated revenue for the year.
Revenue from sales of USSI equipment is recognized at the time title to the equipment and significant risks of ownership pass to the customer (which is generally upon shipment), when all significant contractual obligations have been satisfied and collection is reasonably assured.
39
Foreign Currency Transactions
The currency of the primary economic environment in which our corporate headquarters and our U.S. subsidiaries operate is the United States dollar (“dollar”). Accordingly, the Company and all of its U.S. subsidiaries use the dollar as their functional currency.
DSIT’s functional currency is the New Israeli Shekel (“NIS”) while GridSense’s functional currency for its Australian operations is the Australian dollar (“AUS$”). In the year ended December 31, 2011, 55% of our consolidated revenues (80% and 100% in the years ended December 31, 2010 and 2009, respectively) came from our DSIT subsidiary while 18% of our consolidated revenue in the year ended December 31, 2011 (11% in the year ended December 31, 2010) came from GridSense’s Australian subsidiary. Their financial statements have been translated using the exchange rates in effect at the balance sheet date. Statements of operations amounts have been translated using the average exchange rate for the year or the specific exchange rate on the date of a specific transaction. All exchange gains and losses denominated in non-functional currencies are reflected in finance expense, net in the consolidated statement of operations when they arise.
Stock-based Compensation
We recognize stock-based compensation expense based on the fair value recognition provision of applicable accounting principles, using the Black-Scholes option valuation method. Accordingly, we are required to measure the cost of employee services received in exchange for an award of equity instruments based on the grant-date fair value of the award and to recognize that cost over the period during which an employee is required to provide service in exchange for the award. Under the Black-Scholes method, we make assumptions with respect to the expected lives of the options that have been granted and are outstanding, the expected volatility and the dividend yield percentage of our common stock and the risk-free interest rate at the respective dates of grant.
The expected volatility factor used to value stock options in 2011 was based on the historical volatility of the market price of the Company’s common stock over a period equal to the estimated weighted average life of the options. For the expected term of the option, we used an estimate of the expected option life based on historical experience. The risk-free interest rate used is based upon U.S. Treasury yields for a period consistent with the expected term of the options. Historically, we had not paid dividends up until the decision by our Board in October 2011 to pay a quarterly dividend of $0.035 beginning in November 2011. Accordingly, our expected dividend rate was zero for all option grants prior to October 2011. Subsequent to the declaration of the quarterly dividend, our expected dividend rate was approximately 2.7%. We recognize stock-based compensation expense on an accelerated basis over the requisite service period. Due to the numerous assumptions involved in calculating share-based compensation expense, the expense recognized in our consolidated financial statements may differ significantly from the value realized by employees on exercise of the share-based instruments. In accordance with the prescribed methodology, we do not adjust our recognized compensation expense to reflect these differences. Recognition of stock-based compensation expense had, and will likely continue to have, a material effect on our selling, general and administrative and other items within our consolidated statements of operations and also may have a material effect on our deferred income taxes and additional paid-in capital line items within our consolidated balance sheets. We are also required to use judgment in estimating the amount of stock-based awards that are expected to be forfeited. If actual forfeitures differ significantly from the original estimate, stock-based compensation expense and our results of operations could be materially impacted.
For each of the years ended December 31, 2011, 2010 and 2009, we incurred stock compensation expense with respect to options of approximately $0.4, $0.7 million and $0.7 million, respectively.
See Note 18(d) the consolidated financial statements for the assumptions used to calculate the fair value of share-based employee compensation.
40
RESULTS OF OPERATIONS
The following table sets forth selected consolidated statement of operations data as a percentage of our total sales:
|
|
Year ended December 31,
|
||||||||||||||
|
|
2007
|
2008
|
2009
|
2010
|
2011
|
||||||||||
|
Revenues
|
100
|
%
|
100
|
%
|
100
|
%
|
100
|
%
|
100
|
%
|
|||||
|
Cost of sales
|
73
|
|
68
|
|
57
|
|
58
|
|
63
|
|
|||||
|
Gross profit
|
27
|
|
32
|
|
43
|
|
42
|
|
37
|
|
|||||
|
Research and development expenses
|
9
|
|
3
|
|
5
|
|
7
|
|
16
|
|
|||||
|
Selling, general and administrative expenses
|
103
|
|
76
|
|
62
|
|
73
|
|
63
|
|
|||||
|
Impairments
|
2
|
|
44
|
|
1
|
|
8
|
|
—
|
|
|||||
|
Operating loss
|
(87
|
)
|
(91
|
)
|
(25
|
)
|
(46
|
)
|
(42
|
)
|
|||||
|
Finance expense, net
|
(33
|
)
|
(35
|
)
|
(1
|
)
|
(2
|
)
|
—
|
|
|||||
|
Gain on early redemption of convertible debentures
|
—
|
|
15
|
|
—
|
|
—
|
|
—
|
|
|||||
|
Gain on sale of shares in Comverge
|
476
|
|
107
|
|
15
|
|
—
|
|
—
|
|
|||||
|
Gain on IPO of Comverge
|
332
|
|
—
|
|
—
|
|
—
|
|
—
|
|
|||||
|
Loss on private placement of equity investments
|
(1
|
)
|
—
|
|
—
|
|
—
|
|
—
|
|
|||||
|
Gain on investment in GridSense
|
—
|
|
—
|
|
—
|
|
9
|
|
—
|
|
|||||
|
Dividends received from EnerTech
|
—
|
|
—
|
|
—
|
|
1
|
|
—
|
|
|||||
|
Gain on sale of HangXing
|
—
|
|
—
|
|
—
|
|
—
|
|
3
|
|
|||||
|
Loss on sale of EnerTech
|
—
|
|
—
|
|
—
|
|
(13
|
)
|
—
|
|
|||||
|
Income (loss) from operations before taxes on income
|
687
|
|
(3
|
)
|
(10
|
)
|
(50
|
)
|
(40
|
)
|
|||||
|
Income tax benefit (expense)
|
9
|
|
(4
|
)
|
8
|
|
(5
|
)
|
67
|
|
|||||
|
Income (loss) from operations of the Company and its consolidated subsidiaries
|
696
|
|
(7
|
)
|
(3
|
)
|
(55
|
)
|
27
|
|
|||||
|
Share of income (losses) in Paketeria
|
(25
|
)
|
(19
|
)
|
3
|
|
—
|
|
—
|
|
|||||
|
Share of losses in GridSense
|
—
|
|
(11
|
)
|
(1
|
)
|
—
|
|
—
|
|
|||||
|
Share of losses in Comverge
|
—
|
|
—
|
|
—
|
|
—
|
|
—
|
|
|||||
|
Income (loss) from continuing operations
|
672
|
|
(37
|
)
|
(1
|
)
|
(55
|
)
|
27
|
|
|||||
|
In-process research and development expense recorded in acquisition of discontinued operation
|
—
|
|
(30
|
)
|
—
|
|
—
|
|
—
|
|
|||||
|
Loss from discontinued operations, net of income taxes
|
(3
|
)
|
(32
|
)
|
(66
|
)
|
(126
|
)
|
(10
|
)
|
|||||
|
Gain on the sale of discontinued operations, net of income taxes
|
—
|
|
—
|
|
—
|
|
—
|
|
164
|
|
|||||
|
Non-controlling interest share of loss from discontinued operations
|
—
|
|
3
|
|
7
|
|
—
|
|
3
|
|
|||||
|
Net income (loss)
|
669
|
|
(96
|
)
|
(60
|
)
|
(181
|
)
|
184
|
|
|||||
|
Net income (loss) attributable to non-controlling interests
|
—
|
|
—
|
|
(2
|
)
|
4
|
|
3
|
|
|||||
|
Net income (loss) attributable to Acorn Energy, Inc.
|
669
|
|
(96
|
)
|
(62
|
)
|
(177
|
)
|
187
|
|
|||||
The following table sets forth certain information with respect to revenues and profits of our reportable business segments for the years ended December 31, 2011, 2010 and 2009, including the percentages of revenues attributable to such segments. (See Note 22 to our consolidated financial statements for the definitions of our reporting segments). The column marked “Other” aggregates information relating to miscellaneous operating activities in our DSIT subsidiary, which may be combined for reporting under applicable accounting principles.
41
|
|
Energy & Security Sonar Solutions
|
GridSense
|
USSI
|
Other
|
Total
|
|||||||||||||||
|
Year ended December 31, 2011:
|
|
|
|
|
|
|||||||||||||||
|
Revenues from external customers
|
$
|
9,104
|
|
$
|
7,119
|
|
$
|
1,316
|
|
$
|
1,389
|
|
$
|
18,928
|
|
|||||
|
Percentage of total revenues from external customers
|
48
|
%
|
38
|
%
|
7
|
%
|
7
|
%
|
100
|
%
|
||||||||||
|
Segment gross profit
|
3,019
|
|
3,327
|
|
(98
|
)
|
665
|
|
6,913
|
|
||||||||||
|
Depreciation and amortization
|
220
|
|
375
|
|
224
|
|
28
|
|
847
|
|
||||||||||
|
Stock compensation expense
|
—
|
|
—
|
|
—
|
|
—
|
|
—
|
|
||||||||||
|
Segment net income (loss) before income taxes
|
(244
|
)
|
(1,448
|
)
|
(2,775
|
)
|
298
|
|
(4,169
|
)
|
||||||||||
|
Year ended December 31, 2010:
|
|
|
|
|
|
|||||||||||||||
|
Revenues from external customers
|
$
|
10,179
|
|
$
|
2,382
|
|
$
|
405
|
|
$
|
1,278
|
|
$
|
14,244
|
|
|||||
|
Percentage of total revenues from external customers
|
71
|
%
|
17
|
%
|
3
|
%
|
9
|
%
|
100
|
%
|
||||||||||
|
Segment gross profit
|
4,380
|
|
1,172
|
|
23
|
|
469
|
|
6,044
|
|
||||||||||
|
Depreciation and amortization
|
172
|
|
242
|
|
141
|
|
23
|
|
578
|
|
||||||||||
|
Stock compensation expense
|
42
|
|
—
|
|
—
|
|
—
|
|
42
|
|
||||||||||
|
Impairments
|
—
|
|
1,166
|
|
—
|
|
—
|
|
1,166
|
|
||||||||||
|
Segment net income (loss) before income taxes
|
1,488
|
|
(2,852
|
)
|
*
|
(1,191
|
)
|
77
|
|
(2,478
|
)
|
|||||||||
|
Year ended December 31, 2009:
|
|
|
|
|
|
|
|
|
|
|
||||||||||
|
Revenues from external customers
|
$
|
7,985
|
|
$
|
—
|
|
$
|
—
|
|
$
|
1,234
|
|
$
|
9,219
|
|
|||||
|
Percentage of total revenues from external customers
|
87
|
%
|
—
|
|
—
|
|
13
|
%
|
100
|
%
|
||||||||||
|
Segment gross profit
|
3,540
|
|
—
|
|
—
|
|
415
|
|
3,955
|
|
||||||||||
|
Depreciation and amortization
|
189
|
|
—
|
|
—
|
|
25
|
|
214
|
|
||||||||||
|
Stock compensation expense
|
2
|
|
—
|
|
—
|
|
—
|
|
2
|
|
||||||||||
|
Impairments
|
—
|
|
—
|
|
—
|
|
—
|
|
—
|
|
||||||||||
|
Segment net income before income taxes
|
1,051
|
|
—
|
|
—
|
|
64
|
|
1,115
|
|
||||||||||
* includes the impairment charge of $1,166
42
2011 COMPARED TO 2010
Revenues
. Revenues increased by $4.7 million or 33% to $18.9 million in 2011 as compared to revenues of $14.2 million in 2010. DSIT’s revenue decreased $1.0 million (8%) from $11.5 million to $10.5 million. GridSense's revenue for 2011 was $7.1 million compared to $2.4 million in 2010 since we began consolidating results in May 2010. USSI's revenue for 2011 was $1.3 million compared to $0.4 million in 2010 since we began consolidating its results in February 2010.
The decrease in DSIT's Energy & Security Sonar Solutions revenues was due to decreased revenue from DSIT's AquaShield
™
projects which resulted from a project which was completed in late 2010. GridSense's increased revenue were attributable to increased revenue in both its U.S and Australian operations. The increased revenue in its U.S. operations was due to an order GridSense received in June 2011 from a leading electric utility in the Southeastern USA to use GridSense's TransformerIQ
TM
to monitor over 2,000 transformers in one metropolitan county of its service territory. The increased revenues in its Australian operations was attributable to the adoption of new products such as a new PowerMonic
TM
version capable of remote communications which was launched during the year. USSI's increase in revenues was attributable to its receipt and delivery on several "proof-of-concept" projects for its major product lines (4D reservoir & shale gas monitoring, fiber optic perimeter security systems and underwater security systems for diver detection) throughout 2011.
Gross profit
. Gross profit in 2011 increased by $0.9 million or 14%, to $6.9 million from $6.0 million in 2010. DSIT recorded decreased gross profits (approximately $1.2 million or 24%). GridSense's gross profit for 2011 was $3.3 million compared to $1.2 million in 2010 since we began consolidating its results in May 2010. USSI's gross profit for 2011 was a negative $98,000 compared to a marginal gross profit of $23,000 in 2010 since we began consolidating its results in February 2010.
The decrease in DSIT gross profits was attributable to both decreased revenues and a decrease in consolidated gross margins from 42% in 2010 to 35% in 2011. DSIT's decline in gross margins was due to the slow-down of work on an AquaShield
TM
DDS project which caused deterioration in the gross margin associated with that project as well as decreased margins in a number of non-Naval projects in our Energy & Sonar Security Solutions segment which encountered technological difficulties to bring those projects to completion. GridSense's increase in gross profits was wholly attributable to its increased revenues as its gross margin declined slightly from 49% in 2010 to 47% in 2011. GridSense's decreased gross margin is due to non-recurring production set up costs related to large initial production batch runs of certain products. USSI's negative gross
profit in 2011 is due to negative margins incurred
as it works through its “proof-of-concept” contracts and as it transitions from development to production.
Research and development expenses (“R&D”)
. R&D of $3.0 million in 2011 reflects an increase of $2.0 million or 210% as compared to 2010's R&D of $1.0 million. Our R&D reflects significant increases by both GridSense and USSI who recorded R&D of $1.4 million and $1.1 million, respectively, in 2011 compared to $0.3 million and $0.4 in 2010 in the period after our acquisition of them.
Selling, general and administrative expenses (“SG&A”)
. SG&A increased by $1.5 million from $10.4 million in 2010 to $11.9 million in 2011. DSIT’s SG&A costs in 2010 increased by $0.1 million to $3.1 million in 2011. Corporate general and administrative costs decreased by $0.4 million in 2011 compared to 2010 to $3.9 million. In addition, our 2011 SG&A includes full year SG&A costs by GridSense and USSI ($3.4 million and $1.6 million, respectively) whereas 2010's SG&A costs ($2.3 million and $0.8 million, respectively) were only for the period following our acquisition of them.
DSIT’s increased SG&A costs primarily reflect increased marketing costs. Decreased corporate general and administrative costs primarily reflect decreased professional fees associated with certain 2010 activities as well as decreased compensation costs primarily attributable to reduced stock compensation expense in 2011. SG&A costs at GridSense were relatively unchanged on a pro-rata basis
, while increased SG&A costs at USSI were primarily driven by the growth of the company's infrastructure to handle anticipated sales growth.
Gain on sale of HangXing.
In March 2011, we sold our 25% interest in HangXing International Automation Engineering Co. Ltd. (“HangXing”) back to the majority owner, China Aero-Polytechnology Establishment for $492,000. Our investment of approximately $250,000 in HangXing was made in 1995. The investment was entirely written-off in 1999.
Income tax benefit (expense).
In 2011, the $12.8 million of income tax benefit recorded is primarily due to the release of a valuation allowance on previously reserved deferred tax assets of approximately $14.6 million of deferred tax assets as a result of the current period taxable gain on the sale of CoaLogix. The deferred tax assets were primarily related to recognition of previous years’ net losses. This was offset by current tax expense of approximately $1.8 million.
43
Loss from discontinued operations, net of income taxes.
In December 2010, we entered into an agreement to sell all of our common stock in Coreworx to a management buyout group consisting of Coreworx’ management and certain employees and other investors. As a result, all of Coreworx’ activity for 2010 (a net loss of $19.5 million) is presented as a loss from discontinued operations, net of income taxes as is the $1.8 million gain we recorded on the deconsolidation of Coreworx. In addition, as a result of the sale of all of our common stock in CoaLogix, all of CoaLogix’ activity for 2011 (a net loss prior to attribution to non-controlling interests) of $1.9 million and $0.3 million for the years ended December 31, 2011 and 2010, respectively, are also presented as a loss from discontinued operations, net of income taxes.
Gain on the sale of discontinued operations, net of income taxes.
In August 2011, we completed the sale of our majority owned CoaLogix Inc. subsidiary pursuant to a Stock Purchase Agreement with EnerTech Capital Partners III L.P., certain management employees of the CoaLogix subsidiary (collectively with the Company, the "Sellers"), CoaLogix and CoaLogix Holdings, Inc. (the "Buyer"), pursuant to which the Sellers sold all the outstanding capital stock of CoaLogix to the Buyer for $101 million (subject to certain adjustments) in cash. We received approximately $61.9 million in consideration for our CoaLogix shares, of which approximately $6.3 million was deposited into various escrow accounts, of which approximately $0.3 million was released in the fourth quarter of 2011 and the balance is expected to be released in the third quarter of 2012. During the fourth quarter of 2011, we recorded an additional gain on the sale of CoaLogix of approximately $0.5 million following our receipt of an additional $0.5 million as part of a working capital adjustment. In connection with the sale of our shares of the common stock of CoaLogix, we recorded a net gain of approximately $31.0 million (a gain of $47.0 million net of income taxes of $16.0 million).
Net income (loss).
We had net income of $35.4 million in 2011 compared with net loss of $25.1 million in 2010. Our net income in 2011 attributable to gains of $31.0 million and $0.5 million recorded on the sales of CoaLogix and HangXing, respectively. Those gains were offset by losses from our operating companies, corporate operating and tax expenses and losses recorded with respect to discontinued operations of our former CoaLogix subsidiary. GridSense and USSI losses for the year were $1.4 million and $2.8 million, respectively. In addition we recorded corporate operating expenses of $3.9 million and losses from discontinued operations of $1.9 million. Those losses were partially offset by an income tax benefit of $12.8 million, DSIT's income of $0.1 million, the non-controlling interest share of our subsidiary losses of $0.5 million and the non-controlling interest share of CoaLogix losses of $0.5 million.
2010 COMPARED TO 2009
Revenues
. Revenues increased by $5.0 million or 55% to $14.2 million in 2010 as compared to sales of $9.2 million in 2009. DSIT’s revenue increased $2.2 million (24%) from $9.2 million to $11.5 million. Our 2010 sales also include $2.4 million and $0.4 million of sales by our GridSense and USSI subsidiaries whose results since our acquisition are included in our results for 2010. The increase in DSIT's Energy & Security Sonar Solutions revenues was due to increased revenues from DSIT's AquaShield
™
projects.
Gross profit
. Gross profit in 2010 increased by $2.1 million or 53%, to $6.0 million from $4.0 million in 2009. DSIT recorded increased gross profit ($0.9 million or 23% ). Our 2010 gross profit also includes $1.2 million of gross profit by our GridSense subsidiary whose results since our acquisition are included in our results for 2010. USSI’s contribution to our gross profit since our acquisition of it was negligible. The increase in DSIT gross profit were almost wholly attributable to the increase in sales as gross margins decreased slightly. Consolidated gross margin at DSIT was 42% in 2010, a slight decrease from 43% in 2009.
Research and development expenses (“R&D”)
. R&D of $1.0 million in 2010 reflects an increase of $0.5 million or 111% as compared to 2009. Our 2010 R&D includes $0.3 million and $0.4 million of R&D by our GridSense and USSI subsidiaries whose results since our acquisition are included in our results for 2010.
Impairments.
During 2010, we recorded a non-cash impairment charge of $1.2 million. The 2010 impairment was with respect to previously recorded goodwill associated with our GridSense subsidiary. The impairment was recorded following our annual impairment analysis which is performed in the fourth quarter.
Selling, general and administrative expenses (“SG&A”)
. SG&A increased from $5.7 million in 2009 by $4.7 million to $10.4 million in 2010. DSIT’s SG&A costs in 2010 increased by $0.6 million as compared to 2009. Corporate general and administrative costs increased by $1.0 million in 2010 compared to 2009. In addition, our 2010 SG&A includes $2.3 million and $0.8 million of SG&A by our GridSense and USSI subsidiaries whose results since our acquisition are included in our results for 2010.
44
DSIT’s increased SG&A costs primarily reflect increased marketing costs as well as increased salary costs and non-recurring provisions recorded associated with salary adjustments. Increased corporate general and administrative costs reflect bonuses recorded in the first half of 2010 combined with increased administrative and salary costs and professional and investor relation fees.
Loss on sale of EnerTech
. In December 2010, we sold our investment in EnerTech and received proceeds of approximately $1.1 million. We recorded a loss of approximately $1.8 million on the sale. As a result of the sale, we no longer have any commitment to fund capital calls in EnerTech.
Loss from discontinued operations, net of income taxes
. On December 17, 2010, we entered into an agreement to sell all of our common stock in Coreworx to a management buyout group consisting of Coreworx’ management and certain employees and other investors. As a result, all of Coreworx’s net activity for 2010 (a loss of $19.5 million) through that date which includes a charge of $9.5 million with respect to the impairment of the goodwill and intangibles associated with Coreworx. In addition, we recorded a gain of $1.8 million on the disposition of Coreworx which is comprised of a gain of $5.9 million on the deconsolidation of Coreworx assets and liabilities less a full provision on Coreworx debt of $4.0 million due to us from Coreworx following the management buyout transaction and an estimated $0.1 million of legal fees. In addition, as a result of the sale of all of our common stock in CoaLogix, all of CoaLogix’ activity for 2010 (a net loss prior to attribution to non-controlling interests) of $0.3 million for the year ended December 31, 2010, is also presented as a loss from discontinued operations, net of income taxes.
Net loss
. We had a net loss of $25.1 million in 2010 compared with net loss of $5.8 million in 2009. Our loss in 2010 was primarily due to losses associated with our former Coreworx’ subsidiary which are reflected in discontinued operations ($19.5 million of losses is losses from discontinued operation partially offset by the gain of $1.8 million on the deconsolidation of Coreworx) as well as CoaLogix losses of $0.3 million which are also included in losses from discontinued operations. In addition, we also recorded losses in GridSense and USSI since our acquisition of them of $3.0 million (which includes a non-cash $1.2 million impairment charge against goodwill) and $1.2 million, respectively, corporate expenses of $4.3 million and a loss of $1.8 million on the sale of our EnerTech investment which were partially offset by net income from our DSIT subsidiary of $1.1 million, $0.7 million of non-controlling interests’ share in our losses and a gain of $1.3 million we recorded with respect to the step-up of the previous carrying value of our investment in GridSense to fair value in accordance with generally accepted accounting principles for step acquisitions.
45
LIQUIDITY AND CAPITAL RESOURCES
As of December 31, 2011, we had working capital of $60.2 million, including $34.3 million of cash and cash equivalents, short-term deposits of $18.0 million, $6.0 million of funds held in escrow and current restricted deposits of $2.2 million . Net cash and cash equivalents increased during the year ended December 31, 2011 by $27.7 million. Approximately $7.8 million was used in operating activities of our continuing operations during the year.
The primary use of cash in our operating activities during the year ended December 31, 2011 was the cash used in operations by our USSI and GridSense subsidiaries ($2.8 million and $1.8 million, respectively) combined with the approximately $5.7 million of cash used in our corporate operating activities. The $5.7 million of cash used in our corporate activities includes tax payments of approximately $2.1 million on our expected taxable income for 2011.These uses of cash were partially offset by the $2.5 million of cash provided by DSIT's operating activities during the year.
Net cash provided by investment activities of $36.6 million was primarily from the proceeds from the sale of our interest in CoaLogix ($62.1 million of which $6.3 million was placed in escrow and $0.3 million was subsequently released in 2011) and the sale of our interest in HangXing ($0.5 million) . This was partially offset by $18.0 million that was placed in short-term deposits, $0.5 million which was used for the acquisition of property and equipment during the year and $1.1 million (net) of new restricted deposits during the period.
Net cash of $1.2 million was used in financing activities, primarily from the repayment of both long and short-term debt (net of long-term debt borrowings) of $0.8 million and our dividend payment in November 2011 of $0.6 million. This was partially offset by proceeds from the exercise of options ($0.2 million).
At December 31, 2011, DSIT had approximately $1.0 million in Israeli credit lines available to it from two Israeli banks (approximately $523,000 from each bank), of which approximately $0.5 million was then being used. DSIT’s credit lines at one bank expires on September 4, 2012. The line of credit at the second bank formally expired on February 29, 2012. DSIT continues to obtain credit from the bank and is currently negotiating terms of renewal. The credit lines at the bank whose term expired in February 2012 are expected to be renewed for another year at terms similar to current terms. The lines of credit are denominated in NIS and bear interest at a weighted average rate of the Israeli prime rate per annum plus 2.5%. The Israeli prime rate fluctuates and as of December 31, 2011 was 4.25% . The lines-of-credit are subject to maintaining certain financial covenants. At December 31, 2011, DSIT was in compliance with its financial covenants. Acorn has a floating lien and provided guarantees with respect to DSIT’s outstanding lines of credit.
As at December 31, 2011, DSIT also has an outstanding term loan from an Israeli bank in the amount of approximately $275,000. The loan is denominated in NIS and bears interest at the rate of the Israeli prime rate per annum plus 0.9%. The loan is to be repaid over the next 24 months in equal payments of approximately $12,000 per month (principal and interest).
As collateral for the term-loan, DSIT has deposited with an Israeli bank approximately $78,000 as a non-current restricted deposit. In addition to this restricted deposit, DSIT has also deposited with two Israeli banks approximately $2.5 million as collateral for various performance and bank guarantees for various projects as well as for its credit facilities at the banks. DSIT expects that most of these deposits will be released during 2012 ($2.2 million are recorded as current restricted deposits), but expects to redeposit a majority of these funds again as collateral for new guarantees for new projects and for renewing its credit facilities.
On February 29, 2012, DSIT had approximately $2.3 million of cash of which $2.2 million was restricted ($1.9 million current and $0.3 million non-current) and was utilizing approximately $0.7 million of its lines-of-credit. We believe that DSIT will have sufficient liquidity to finance its activities from cash flows from its own operations over the next 12 months. This is based on continued utilization of its line-of-credit and expected continued improvement of operating results from anticipated growth in sales.
As of February 29, 2012, GridSense had approximately $1.0 million cash on hand following Acorn's transfer of $1.0 million for working capital (see Recent Developments). During the 2011 calendar year, Acorn provided GridSense with approximately $2.2 million for its working capital needs. Due to seasonality and the budget cycles of utility customers, GridSense expects its operations to be cash-flow negative in certain quarters and cash flow neutral or positive in other quarters. In order to attempt to accelerate its growth, GridSense may require additional working capital. In the long-term, while GridSense continues to have a strong sales pipeline, and we believe that it will be able to replicate large-scale projects similar to the TransformerIQTM project in the future, the timing of these projects is difficult to predict and there may be delays in getting awarded such contracts. As a result, we have no assurance that GridSense will be able to maintain its increased sales or be able to reduce its need for additional financing to support its working capital needs in 2012 and beyond. Accordingly, GridSense may continue to need additional working capital support, while it works to increase its sales. This support may be in the form of a bank line, additional investment or loan by Acorn, or a combination of the above. GridSense is currently in discussions with a bank to provide working capital financing; however, there is no assurance that such financing will be available in sufficient amounts, in a timely manner
46
or on acceptable terms.
USSI currently has no other sources of financing other than its internally generated sales and investments by Acorn. On February 6, 2012, we entered into the USSI Purchase Agreement with USSI pursuant to which we converted previously advanced funds ($2.5 million during the period from May 2011 to January 2012) into additional shares of USSI Common Stock and shares of USSI Preferred Stock (see Recent Developments). We also made a further payment to USSI of $2.25 million February 6, 2012 to purchase additional shares of USSI Preferred Stock, and we anticipate that we will purchase more shares of USSI Preferred Stock for an aggregate purchase price of $2.5 million at a future date. This subsequent purchase is subject to the satisfaction of certain customary conditions. As of February 29, 2012, USSI had cash on hand of approximately $1.4 million. We have no assurance that USSI will not need additional financing from time-to-time to finance its working capital needs. Additional financing for USSI may be in the form of a bank line, new investment by others, a loan or investment by Acorn, or a combination of the above. There is no assurance that such support will be available from such sources in sufficient amounts, in a timely manner or on acceptable terms.
As at March 1, 2012, the Company's corporate operations (not including cash at any of our subsidiaries) had a total of approximately $19.4 million in cash and cash equivalents reflecting a $14.2 million decrease from the balance as of December 31, 2011. The decrease in corporate cash is primarily due the acquisition of OmniMetrix for $8.5 million (see Recent Developments), to an additional advance ($250,000) and investments ($2.25 million) in USSI (see Recent Developments), $1.5 million dividends (a special dividend paid in January and our regular quarterly dividend paid on March 1, 2012 (see Recent Developments)), a transfer to GridSense of $1.0 million and our corporate expenses.
We believe that the cash remaining from the sale of CoaLogix will provide more than sufficient liquidity to finance the operating activities of Acorn and the operations of its operating subsidiaries for the foreseeable future and for the next 12 months in particular.
Contractual Obligations and Commitments
The table below provides information concerning obligations under certain categories of our contractual obligations as of December 31, 2011.
CASH PAYMENTS DUE TO CONTRACTUAL OBLIGATIONS
|
|
Years Ending December 31,
(in thousands)
|
|||||||||||||||||||
|
|
Total
|
2012
|
2013-2014
|
2015-2016
|
2017 and
thereafter
|
|||||||||||||||
|
Bank and other debt, utilized lines-of-credit and capital leases
|
$
|
818
|
|
$
|
677
|
|
$
|
141
|
|
$
|
—
|
|
$
|
—
|
|
|||||
|
Operating leases
|
1,669
|
|
719
|
|
768
|
|
182
|
|
—
|
|
||||||||||
|
Potential severance obligations (1)
|
3,837
|
|
—
|
|
957
|
|
322
|
|
2,558
|
|
||||||||||
|
Total contractual cash obligations
|
$
|
6,324
|
|
$
|
1,396
|
|
$
|
1,866
|
|
$
|
504
|
|
$
|
2,558
|
|
|||||
We expect to finance these contractual commitments from cash currently on hand and cash generated from operations.
(1) Under Israeli law and labor agreements, DSIT is required to make severance payments to dismissed employees and to employees leaving employment under certain other circumstances. The obligation for severance pay benefits, as determined by the Israeli Severance Pay Law, is based upon length of service and last salary. These obligations are substantially covered by regular deposits with recognized severance pay and pension funds and by the purchase of insurance policies. As of December 31, 2011, we accrued a total of $3.8 million for potential severance obligations to our Israeli employees of which approximately $2.6 million was funded.
Certain Information Concerning Off-Balance Sheet Arrangements
Our DSIT subsidiary provides various performance, advance and tender guarantees as required in the normal course of its operations. As at December 31, 2011, such guarantees totaled approximately $5.7 million and a majority were due to expire in 2013 and 2014. As security for a portion of these guarantees, DSIT has deposited approximately $2.4 million which is shown as restricted cash on our Consolidated Balance Sheets ($2.2 million as current restricted cash and $0.2 million as non-current restricted cash). As DSIT’s restricted cash is released from the completion of projects and the end of the guarantees, it expects to
47
provide additional security deposits for new guarantees for new projects throughout the 2012 calendar year.
Impact of Inflation and Interest Rate & Currency Fluctuations
In the normal course of business, we are exposed to fluctuations in interest rates on our lines-of-credit ($1.0 million available) and long-term debt incurred ($0.3 million balance at December 31, 2011) to finance our operations in Israel. Such lines-of-credit and loan bear interest at interest rates that are linked to the Israeli prime rate (4.25% at December 31, 2011 and 3.5% at December 31, 2010).
Our non-US dollar monetary assets and liabilities (net liabilities of approximately $1.7 million at December 31, 2011) in Israel are exposed to fluctuations in exchange rates.
Historically, a majority of DSIT’s sales have been denominated in dollars or denominated in NIS linked to the dollar. Such sales transactions are negotiated in dollars; however, for the convenience of the customer they are often settled in NIS. These transaction amounts are linked to the dollar between the date the transactions are entered into until the date they are effected and billed. From the time these transactions are effected and billed through the date of settlement, amounts are primarily unlinked. As DSIT increases its sales to customers outside of Israel, a greater portion of its receipts from customers will be settled in dollars. In 2012, we expect an increasing portion of DSIT’s sales to be settled in dollars. A significant majority of DSIT’s expenses in Israel are in NIS (primarily labor costs), while a portion is in dollars or dollar-linked NIS.
The dollar cost of our operations in Israel may be adversely affected in the future by a revaluation of the NIS in relation to the dollar. In 2011 the appreciation of the dollar against the NIS was 7.6% while in 2010 the NIS appreciated against the dollar by 6.0%.
As of December 31, 2011, virtually all of DSIT’s monetary assets and liabilities that were not denominated in dollars or dollar-linked NIS were denominated in NIS. In the event that in the future we have material net monetary assets or liabilities that are not denominated in dollar-linked NIS, such net assets or liabilities would be subject to the risk of currency fluctuations. DSIT purchases forward contracts to attempt to reduce its exposure to currency fluctuations.
In addition, our non-US dollar assets and liabilities (net liability of approximately $0.1 million at December 31, 2011) in Australia at our GridSense subsidiary’s Australian operations are also exposed to fluctuations in exchange rates. The dollar cost of our operations in Australia may also be adversely affected in the future by a revaluation of the Australian dollar in relation to the U.S. dollar. In 2011 the Australian dollar was virtually unchanged against the U.S. dollar. During 2010, the Australian dollar appreciated against the U.S. dollar by 13.3%.
48
SUMMARY QUARTERLY FINANCIAL DATA (Unaudited)
The following table sets forth certain of our unaudited quarterly consolidated financial information for the years ended December 31, 2010 and 2011. This information should be read in conjunction with our Consolidated Financial Statements and the notes thereto.
|
|
2010
|
2011
|
||||||||||||||||||||||||||||||
|
First
Quarter
|
Second
Quarter
|
Third
Quarter
|
Fourth
Quarter
|
First
Quarter
|
Second
Quarter
|
Third
Quarter
|
Fourth
Quarter
|
|||||||||||||||||||||||||
|
|
(in thousands, except per share amounts
|
|||||||||||||||||||||||||||||||
|
Revenues
|
$
|
2,606
|
|
$
|
3,372
|
|
$
|
4,018
|
|
$
|
4,249
|
|
$
|
3,095
|
|
$
|
4,107
|
|
$
|
5,051
|
|
$
|
6,675
|
|
||||||||
|
Cost of sales
|
1,424
|
|
1,749
|
|
2,221
|
|
2,807
|
|
1,921
|
|
2,760
|
|
3,244
|
|
4,090
|
|
||||||||||||||||
|
Gross profit
|
1,182
|
|
1,623
|
|
1,797
|
|
1,442
|
|
1,174
|
|
1,347
|
|
1,807
|
|
2,585
|
|
||||||||||||||||
|
Research and development expenses, net
|
41
|
|
179
|
|
281
|
|
463
|
|
490
|
|
384
|
|
713
|
|
1,408
|
|
||||||||||||||||
|
Impairments
|
—
|
|
—
|
|
—
|
|
1,166
|
|
—
|
|
—
|
|
—
|
|
—
|
|
||||||||||||||||
|
Selling, general and administrative expenses
|
2,247
|
|
2,592
|
|
2,830
|
|
2,772
|
|
2,743
|
|
2,724
|
|
3,142
|
|
3,343
|
|
||||||||||||||||
|
Operating loss
|
(1,106
|
)
|
(1,148
|
)
|
(1,314
|
)
|
(2,959
|
)
|
(2,059
|
)
|
(1,761
|
)
|
(2,048
|
)
|
(2,166
|
)
|
||||||||||||||||
|
Finance income (expense), net
|
5
|
|
(197
|
)
|
53
|
|
(85
|
)
|
(117
|
)
|
(100
|
)
|
262
|
|
(71
|
)
|
||||||||||||||||
|
Gain on investment in GridSense
|
—
|
|
1,327
|
|
—
|
|
—
|
|
—
|
|
—
|
|
—
|
|
—
|
|
||||||||||||||||
|
Gain on sale of HangXing
|
—
|
|
—
|
|
—
|
|
—
|
|
492
|
|
—
|
|
—
|
|
—
|
|
||||||||||||||||
|
Distribution received from EnerTech
|
135
|
|
—
|
|
—
|
|
—
|
|
—
|
|
—
|
|
—
|
|
—
|
|
||||||||||||||||
|
Loss on the sale of EnerTech
|
—
|
|
—
|
|
—
|
|
(1,821
|
)
|
—
|
|
—
|
|
—
|
|
—
|
|
||||||||||||||||
|
Income (loss) before taxes on income
|
(966
|
)
|
(18
|
)
|
(1,261
|
)
|
(4,865
|
)
|
(1,684
|
)
|
(1,861
|
)
|
(1,786
|
)
|
(2,237
|
)
|
||||||||||||||||
|
Income tax benefit (expense)
|
(75
|
)
|
(123
|
)
|
(372
|
)
|
(101
|
)
|
(65
|
)
|
26
|
|
12,111
|
|
695
|
|
||||||||||||||||
|
Net income (loss) from continuing operations
|
(1,041
|
)
|
(141
|
)
|
(1,633
|
)
|
(4,966
|
)
|
(1,749
|
)
|
(1,835
|
)
|
10,325
|
|
(1,542
|
)
|
||||||||||||||||
|
Gain on the sale of CoaLogix, net of income taxes
|
—
|
|
—
|
|
—
|
|
—
|
|
—
|
|
—
|
|
30,683
|
|
386
|
|
||||||||||||||||
|
Loss from discontinued operations, net of income taxes
|
(2,132
|
)
|
(3,275
|
)
|
(3,307
|
)
|
(9,255
|
)
|
(836
|
)
|
(568
|
)
|
(544
|
)
|
—
|
|
||||||||||||||||
|
Non-controlling interests share of loss from discontinued operations
|
(5
|
)
|
45
|
|
244
|
|
(217
|
)
|
232
|
|
157
|
|
151
|
|
—
|
|
||||||||||||||||
|
Net income (loss)
|
(3,178
|
)
|
(3,371
|
)
|
(4,696
|
)
|
(14,438
|
)
|
(2,353
|
)
|
(2,246
|
)
|
40,615
|
|
(1,156
|
)
|
||||||||||||||||
|
Net (income) loss attributable to non-controlling interests
|
55
|
|
220
|
|
129
|
|
191
|
|
136
|
|
167
|
|
181
|
|
65
|
|
||||||||||||||||
|
Net income (loss) attributable to Acorn
Energy, Inc
|
$
|
(3,123
|
)
|
$
|
(3,151
|
)
|
$
|
(4,567
|
)
|
$
|
(14,247
|
)
|
$
|
(2,217
|
)
|
$
|
(2,079
|
)
|
$
|
40,796
|
|
$
|
(1,091
|
)
|
||||||||
|
Basic net income (loss) per share attributable to Acorn Energy, Inc. shareholders:
|
|
|
|
|
|
|
|
|
|
|
|
|
|
|
|
|
||||||||||||||||
|
From continuing operations
|
$
|
(0.08
|
)
|
$
|
—
|
|
$
|
(0.10
|
)
|
$
|
(0.30
|
)
|
$
|
(0.10
|
)
|
$
|
(0.10
|
)
|
$
|
0.60
|
|
$
|
(0.08
|
)
|
||||||||
|
From discontinued operations
|
(0.17
|
)
|
(0.21
|
)
|
(0.19
|
)
|
(0.58
|
)
|
(0.03
|
)
|
(0.02
|
)
|
1.73
|
|
0.02
|
|
||||||||||||||||
|
Total attributable to Acorn Energy, Inc. shareholders.
|
$
|
(0.25
|
)
|
$
|
(0.21
|
)
|
$
|
(0.29
|
)
|
$
|
(0.88
|
)
|
$
|
(0.13
|
)
|
$
|
(0.12
|
)
|
$
|
2.33
|
|
$
|
(0.06
|
)
|
||||||||
|
Diluted net income (loss) per share attributable to Acorn Energy, Inc. shareholders:
|
|
|
|
|
|
|
|
|
|
|
|
|
|
|
|
|
||||||||||||||||
|
From continuing operations
|
$
|
(0.08
|
)
|
$
|
—
|
|
$
|
(0.10
|
)
|
$
|
(0.30
|
)
|
$
|
(0.10
|
)
|
$
|
(0.10
|
)
|
$
|
0.59
|
|
$
|
(0.08
|
)
|
||||||||
|
From discontinued operations
|
(0.17
|
)
|
(0.21
|
)
|
(0.19
|
)
|
(0.58
|
)
|
(0.03
|
)
|
(0.02
|
)
|
1.70
|
|
0.02
|
|
||||||||||||||||
|
Total attributable to Acorn Energy, Inc. shareholders.
|
$
|
(0.25
|
)
|
$
|
(0.21
|
)
|
$
|
(0.29
|
)
|
$
|
(0.88
|
)
|
$
|
(0.13
|
)
|
$
|
(0.12
|
)
|
$
|
2.29
|
|
$
|
(0.06
|
)
|
||||||||
|
Weighted average number of shares outstanding attributable to Acorn Energy, Inc. – basic
|
12,498
|
|
15,161
|
|
15,721
|
|
16,254
|
|
17,449
|
|
17,489
|
|
17,508
|
|
17,521
|
|
||||||||||||||||
|
Weighted average number of shares outstanding attributable to Acorn Energy, Inc. – diluted
|
12,498
|
|
15,161
|
|
15,721
|
|
16,254
|
|
17,449
|
|
17,489
|
|
17,810
|
|
17,521
|
|
||||||||||||||||
49
|
ITEM 7A.
|
QUANTITATIVE AND QUALITATIVE DISCLOSURE ABOUT MARKET RISK
|
General
We are required to make certain disclosures regarding our financial instruments, including derivatives, if any.
A financial instrument is defined as cash, evidence of an ownership interest in an entity, or a contract that imposes on one entity a contractual obligation either to deliver or receive cash or another financial instrument to or from a second entity. Examples of financial instruments include cash and cash equivalents, deposits, trade accounts receivable, loans, investments, trade accounts payable, accrued expenses, options and forward contracts. The disclosures below include, among other matters, the nature and terms of derivative transactions, information about significant concentrations of credit risk, and the fair value of financial assets and liabilities.
Foreign Currency Risk
The translation of the balance sheets of our Israeli operations from NIS into U.S. dollars is sensitive to changes in foreign currency exchange rates as are the balance sheets of our Australian operations from Australian dollars into U.S. dollars. These translation gains or losses are recorded either as cumulative translation adjustments (“CTA) within stockholders' equity, or foreign exchange gains or losses in the statement of operations. In 2011 the U.S dollar strengthened in relation to the NIS by 7.7%. In 2011 the Australian dollar was virtually unchanged against the U.S. dollar. To test the sensitivity of these operations to fluctuations in the exchange rate, the hypothetical change in CTA and foreign exchange gains and losses is calculated by multiplying the net assets of these non-U.S. operations by a 10% change in the currency exchange rates.
As of December 31, 2011, a 10% weakening of the U.S. dollar against the NIS and against the Australian dollar would have increased stockholders' equity by approximately $260,000 (arising from a CTA adjustment of approximately $460,000 and net exchange losses of approximately $200,000). These hypothetical changes are based on adjusting the December 31, 2011 exchange rates by 10%.
Our DSIT subsidiary enters into various forward contracts which do not qualify as hedging instruments under accounting principles to try to mitigate its foreign currency exposure risks. At December 31, 2011, DSIT had entered into monthly forward contracts (through July 2012) to purchase U.S. dollars (ranging from $300,000 to $315,000 per month at exchange rates ranging from 3.74 to 3.81) in order to mitigate risk to its NIS denominated expenses.
GridSense does not employ specific strategies, such as the use of derivative instruments or hedging, to manage its foreign currency exchange rate exposures.
Fair Value of Financial Instruments
Fair values of financial instruments included in current assets and current liabilities are estimated to approximate their book values due to the short maturity of such investments. Fair value for long-term debt and long-term deposits are estimated based on the current rates offered to us for debt and deposits with similar terms and remaining maturities. The fair value of our long-term debt and non-current restricted deposits are not materially different from their book values.
Concentrations of Credit Risk
Financial instruments, which potentially subject us to concentrations of credit risk, consist principally of cash and cash equivalents, short-term deposits, escrowed funds, restricted deposits and trade receivables. The counterparty to a large majority of our cash and cash equivalents ($26.5 million) is a money market of a major financial institution. We do not believe there is significant risk of non-performance by this counterparty. The counterparty to our restricted deposits ($2.5 million) are two major Israeli banks. We do not believe there is significant risk of non-performance by these counterparties. Short-term deposits ($18.0 million) are in FDIC insured certificates of deposit through the Certificate of Deposit Account Registry Service. The Company does not believe there is significant risk of non-performance by the counterparties. The counterparty to our escrowed funds is a major financial institution. We do not believe there is significant risk of non-performance by this counterparty.Approximately 32% ($1.6 million) of the trade accounts receivable at December 31, 2011 was due from two customers that pay their trade receivables over usual credit periods. Credit risk with respect to the balance of trade receivables is generally diversified due to the number of entities comprising our customer base. Approximately 71% of the balance in unbilled revenue at December 31, 2011 was due from two customers that when billed, pay their trade receivables over usual credit periods. Credit risk with respect to the balance of unbilled revenue is generally diversified due to the number of entities comprising our customer base.
50
Interest Rate Risk
In the normal course of business, we are exposed to fluctuations in interest rates on our lines-of-credit ($1.0 million available) and long-term debt incurred ($0.3 million balance at December 31, 2011) to finance our operations in Israel. Such lines-of-credit and loan bear interest at interest rates that are linked to the Israeli prime rate (4.25% at December 31, 2011 and 3.5% at December 31, 2010).
51
|
ITEM 8.
|
FINANCIAL STATEMENTS AND SUPPLEMENTARY DATA
|
Furnished at the end of this report commencing on page F-1.
52
|
ITEM 9.
|
CHANGES IN AND DISAGREEMENTS WITH ACCOUNTANTS ON ACCOUNTING AND FINANCIAL DISCLOSURE
|
None.
53
|
ITEM 9A.
|
CONTROLS AND PROCEDURES
|
Evaluation of Disclosure Controls and Procedures
Our management, with the participation of our Chief Executive Officer and Chief Financial Officer, has evaluated the effectiveness of the design and operation of our disclosure controls and procedures (as defined in Rule 13a-15(e) under the Securities Exchange Act of 1934, as amended (the “Act”) as of the end of the period covered by this annual report on Form 10-K. Based on this evaluation, our Chief Executive Officer and Chief Financial Officer concluded that these disclosure controls and procedures were effective as of such date, at a reasonable level of assurance, in ensuring that the information required to be disclosed by our company in the reports we file or submit under the Act is (i) accumulated and communicated to our management (including the Chief Executive Officer and Chief Financial Officer) in a timely manner, and (ii) recorded, processed, summarized and reported within the time periods specified in the SEC’s rules and forms.
Internal Control Over Financial Reporting
Management is responsible for establishing and maintaining adequate internal control over financial reporting, as such term is defined in Exchange Act Rules 13a-15(f). Under the supervision and with the participation of our management, including our Chief Executive Officer and Chief Financial Officer, we conducted an evaluation of the effectiveness of our internal control over financial reporting based on the criteria in Internal Control – Integrated Framework issued by the Committee of Sponsoring Organizations of the Treadway Commission.
Based on our evaluation, management has concluded that our internal control over financial reporting was effective as of December 31, 2011. Because of its inherent limitations, internal control over financial reporting may not prevent or detect misstatements. Also, projections of any evaluation of effectiveness to future periods are subject to the risks that controls may become inadequate because of changes in conditions, or that the degree of compliance with the policies or procedures may deteriorate. The effectiveness of our internal controls over financial reporting as of December 31, 2011, has been audited by Friedman LLP, our independent registered public accounting firm, as stated in their attestation report contained in their report, which is included herein.
Changes in Internal Control Over Financial Reporting
There was no change in our internal control over financial reporting (as defined in Rule 13a-15(f) under the Securities Exchange Act of 1934, as amended) during our last fiscal quarter that has materially affected, or is reasonably likely to materially affect, our internal control over financial reporting.
54
|
ITEM 9B.
|
OTHER INFORMATION
|
None.
55
|
ITEM 10.
|
DIRECTORS, EXECUTIVE OFFICERS AND CORPORATE GOVERNANCE
|
Directors and Executive Officers
Set forth below is certain information concerning the directors and certain officers of the Company:
|
Name
|
Age
|
Position
|
||
|
John A. Moore
|
46
|
Director, Chairman of the Board, President and Chief Executive Officer
|
||
|
George Morgenstern
|
78
|
Founder, Chairman Emeritus; Chairman of the Board of our DSIT Solutions Ltd. subsidiary (“DSIT”)
|
||
|
Samuel M. Zentman
|
67
|
Director and member of our Audit Committee
|
||
|
Richard J. Giacco
|
59
|
Director and member of our Audit Committee
|
||
|
Richard Rimer
|
46
|
Director and Vice Chairman of the Board
|
||
|
Joe Musanti
|
54
|
Director and Chairman of our Audit Committee
|
||
|
Christopher E. Clouser
|
59
|
Director
|
||
|
Benny Sela
|
64
|
Chief Executive Officer and President of DSIT
|
||
|
Lindon Shiao
|
37
|
Chief Executive Officer and President of GridSense
|
||
|
Jim Andersen
|
55
|
Chief Executive Officer and President of USSI
|
||
|
Deena Redding
|
43
|
Chief Executive Officer and President of OmniMetrix
|
||
|
Michael Barth
|
51
|
Chief Financial Officer of the Company and DSIT
|
||
|
Heather K. Mallard
|
48
|
Vice President, General Counsel & Secretary
|
||
John A. Moore
has been a director and President and Chief Executive Officer of our Company since March 2006. Mr. Moore was elected Chairman of the Board on March 25, 2009. Mr. Moore also served as a director of Comverge from March 2006 through January 2008. Mr. Moore is the President and founder of Edson Moore Healthcare Ventures, which he founded to acquire $150 million of drug delivery assets from Elan Pharmaceuticals in 2002. Mr. Moore was Chairman and EVP of ImaRx Therapeutics, a drug and medical therapy development company, from February 2004 to February 2006 and Chairman of Elite Pharmaceuticals from February 2003 to October 2004. He is currently a member of the Board of Directors of Voltaix, Inc., a leading provider of specialty gases to the solar and semiconductor industries. He was CEO of Optimer, Inc. (a research based polymer development company) from inception in 1994 until 2002 and Chairman from inception until its sale in February 2008 to Sterling Capital. Mr. Moore serves as a director on the board of directors for each of our subsidiaries.
Key Attributes, Experience and Skills.
Mr. Moore brings his strategic vision for our Company to the Board together with his leadership and business, deal making and investor relations skills. Mr. Moore has an immense knowledge of our Company and the energy technology industry which is beneficial to the Board. Mr. Moore’s service as Chairman and CEO of the Company bridges a critical gap between the Company’s management and the Board, enabling the Board to benefit from management’s perspective on the Company’s business while the Board performs its oversight function.
George Morgenstern
, founder of the Company, has been a director since 1986. Mr. Morgenstern served as Chairman of the Board from June 1993 through March 2009 and has served as Chairman Emeritus since March 2009. Mr. Morgenstern served as our President and Chief Executive Officer from our incorporation in 1986 until March 2006. Mr. Morgenstern also serves as Chairman of the Board of DSIT. Mr. Morgenstern served as a member of the Board of Directors of Comverge from October 1997 to March 2006 and as Chairman until April 2003.
Key Attributes, Experience and Skills.
Mr. Morgenstern, as founder of the Company, brings a unique perspective to the Board. Mr. Morgenstern has over 50 years of experience in all aspects of the computer software and systems industry and has special knowledge of the business environment in Israel. Mr. Morgenstern is an accomplished businessman experienced in fostering growth of developing companies. Mr. Morgenstern’s deep knowledge of our Company and his leadership and management experience are valuable resources to the Company. Mr. Morgenstern serves as Chairman of the Board of DSIT, and has a strong understanding of DSIT’s business and industry segment.
Samuel M. Zentman
has been one of our directors since November 2004. From 1980 until 2006, Dr. Zentman was the
56
president and chief executive officer of a privately-held textile firm, where he also served as vice president of finance and administration from 1978 to 1980. From 1973 to 1978, Dr. Zentman served in various capacities at American Motors Corporation. He holds a Ph.D. in Complex Analysis. Dr. Zentman serves on the boards of Powersafe Technology Corp. as well as several national charitable organizations devoted to advancing the quality of education.
Key Attributes, Experience and Skills.
Dr. Zentman’s long-time experience as a businessman trained together with his experience with computer systems and software enables him to bring valuable insights to the Board. Dr. Zentman has a broad, fundamental understanding of the business drivers affecting our Company, in particular our DSIT subsidiary. Dr. Zentman also brings leadership and oversight experience to the Board.
Richard J. Giacco
was elected to the Board in September 2006. Mr. Giacco has been President of Empower Materials, Inc., a manufacturer of carbon dioxide based thermoplastics, since January 1999. Mr. Giacco was the Managing Member of Ajedium Film Group, LLC, a manufacturer of thermoplastic films from its inception until its sale in 2008. Mr. Giacco served as Associate General Counsel of Safeguard Scientifics, Inc. from 1984 to 1990.
Key Attributes, Experience and Skills.
Mr. Giacco brings strong operational and strategic background and valuable business, leadership and management experience to our Company. Mr. Giacco’s experience helping to lead the growth and ultimate sale of a family business provides strategic vision and insights as the Company implements its growth strategies. Mr. Giacco also brings legal experience to the Board.
Richard Rimer
was elected to the Board in September 2006 and was appointed Vice-Chairman of the Board effective January 1, 2012. Mr. Rimer is a principal of Top Quartile Partners, an investment fund and is a consultant to Acorn. From 2001 to 2006, Mr. Rimer was a Partner at Index Ventures, a private investment company. He formerly served on the boards of Direct Medica, a provider of marketing services to pharmaceutical companies, and Addex Pharmaceuticals, a pharmaceutical research and development company. Prior to joining Index Ventures, Mr. Rimer was the co-founder of MediService, the leading direct service pharmacy in Switzerland and had served as a consultant with McKinsey & Co.
Key Attributes, Experience and Skills.
Mr. Rimer brings to the Board broad business experience, and a deep understanding of capital markets. As a successful entrepreneur, Mr. Rimer founded a company in Holland which he successfully sold and went on to found MediService – one of Europe’s leading mail service pharmacies (sold to Galenica GALN-SW). While at Index Ventures, Mr. Rimer led work on multiple deals including sourcing, due diligence, deal structuring and negotiation, monitored growth of portfolio companies, syndicated subsequent financings, supported exit negotiations as well as helped with key recruits. These experiences enable Mr. Rimer to bring valuable resources to the Company in addition to Mr. Rimer’s leadership, analytical skills and broad familiarity with international and cross-border transactions.
Joe Musanti
was elected to the Board in September 2007. Mr. Musanti currently serves as General Manager/CFO of Main Tape a leading manufacturer of surface protection film and paper products, based in Cranbury, New Jersey. Prior to the acquisition of Film Tech Inc. and their merger into Main Tape in 2010 Mr. Musanti served as President of Main Tape Inc. From 2003 to 2006, prior to becoming President, Mr. Musanti served as Vice President Finance of Main Tape. Prior to that, Mr. Musanti was Vice President Finance of Rheometric Scientific, Inc., a manufacturer of thermal analytical instrumentation products where he held significant domestic and foreign, operational, managerial, financial and accounting positions.
Key Attributes, Experience and Skills.
Mr. Musanti’s training and extensive experience in financial management at both public and private companies provide the Board with valuable insights and skills necessary to lead the Audit Committee. Mr. Musanti’s strong operational and business background complement his accounting and finance experience, and are valuable resources to the Board as it exercises its oversight duties and support of the Company’s growth strategies.
Christopher E. Clouser
was appointed to the Board on November 16, 2011. Mr. Clouser has held senior level positions including: President of Burger King Brands; President and CEO of Preview Travel/Travelocity; CEO of the Minnesota Twins Major League Baseball Club; Senior Vice President & Chief Communications Officer of Northwest Airlines; Corporate Vice President of Public Affairs and Communications of Hallmark Cards; and Senior Vice President and Chief Administrative Officer of Sprint. In addition, he has served on the corporate Boards of Directors of Piper Jaffray Inc., Gibson Guitar/Baldwin Corp., Mall of America, Pepsi Americas, Marquette Bancshares, Delta Beverage and Mesaba Aviation. He also serves as Chairman of the International Tennis Hall of Fame and Museum in Newport, Rhode Island. Prior to his current positions, he was President of the Association of Tennis Professions (ATP), where he also served as Chairman of ATP Properties and Chair of the ATP Foundation.
Key Attributes, Experience and Skills.
Mr. Clouser brings to Acorn a wealth of operational and managerial experience culled from decades of service in key roles at major corporations. He has particular skills in marketing and business development, which will enable the Board to better position our companies for customer growth.
57
Benny Sela
serves as the CEO of DSIT, a position he has held since July 2007. Previously, he held the position of Executive Vice President and head of the company’s Real Time Division since 1996. Mr. Sela joined DSIT in February 1989. Prior to that, Mr. Sela served in the Israeli Air Force reaching the position of Lt. Colonel (Ret.). During his service in the Israeli Air Force, Mr. Sela was head of the Electronic Warfare branch, working on both the F-16 and Lavi projects. He holds a B.Sc. in Electrical Engineering, a Masters Degree in Operations Research from Stanford University, and an MBA.
Lindon Shiao
serves as CEO and President of GridSense, a position he has held since 2006. Mr. Shiao was a co-founder and principal of Prime Powered Holdings LLC and a main shareholder of Prime Energy Partners Ltd. As an integral member of a team from AES-New Energy, Mr. Shiao co-led the spin-off and growth management of Catalyst PowerPartners LLC as a principal and key member of the operating team. Prior to Catalyst Power, Mr. Shiao led M&A teams at Arthur Andersen supporting buy-side transactions across different industries, including manufacturing, consumer marketing & distribution, healthcare services, and real estate. Mr. Shiao earned a B.S. from the Haas Business School at the University of California at Berkeley, and is a C.P.A.
Jim Andersen
serves as CEO and President of USSI, positions that he has held since he founded USSI in October 2007. Mr. Andersen began his career as an Engineering Officer on US Navy Nuclear Submarines, and upon leaving the Navy, went on to hold a variety of technical and senior management positions in high technology companies, including Westinghouse, Whitehall/Hydroscience, Litton Industries and Northrop Grumman. He was the Business Unit Director for Litton’s Fiber Optic Acoustic Systems, heading the company’s fastest growing business unit from 1995 to 2002. At Litton, he landed the first major (and still the largest) production contract for fiber optic sensors, a sonar system on the US Navy’s newest Virginia class submarines, valued at over $400 million. Prior to that, Mr. Andersen held technical and executive positions in companies that developed systems for oil exploration and ocean applications.
Deena Redding
Deena Redding serves as CEO and President of OmniMetrix, LLC. She began her more than twenty years of management experience responsible for more than a billion dollars of insurance reserves for UPS and Ryder Integrated Logistics. Deena partnered with Remote Business Management, LLC during the pioneer era of Digital Video Recording and led her company to a successful multi-million dollar venture with a publicly traded South Korean satellite technology company. Her accomplishments led her to the appointed position of President of Kyros, LLC, a distributor of high tech video and camera security products, where her role guided another successful acquisition.
Michael Barth
has been our Chief Financial Officer and the Chief Financial Officer of DSIT since December 2005. For the six years prior, he served as Deputy Chief Financial Officer and Controller of DSIT. Mr. Barth is a Certified Public Accountant in both the U.S. and Israel and has over twenty years of experience in public and private accounting.
Heather K. Mallard
joined Acorn as Vice President, General Counsel and Secretary effective February 1, 2012. For the twenty three years prior, Ms. Mallard practiced with the law firm Womble Carlyle Sandridge & Rice, LLP, most recently in the firm’s Raleigh, North Carolina office. Ms. Mallard is a seasoned corporate and business lawyer, with a practice that has spanned a variety of industries.
Audit Committee; Audit Committee Financial Expert
The Company has a separately designated standing Audit Committee established and administered in accordance with SEC rules. The three members of the Audit Committee are Joe Musanti, Richard J. Giacco and Samuel M. Zentman. Richard Rimer resigned from the Audit Committee in December 2011, prior to his appointment as Vice-Chairman of the Board of Acorn. The Board of Directors has determined that each member of the Audit Committee meets the independence criteria prescribed by NASDAQ governing the qualifications of for audit committee members and each Audit Committee member meets NASDAQ’s financial knowledge requirements. Our Board has determined that Joe Musanti qualifies as an “audit committee financial expert,” as defined in the rules and regulations of the SEC.
Compliance with Section 16(a) of the Securities Exchange Act of 1934
Section 16(a) of the Securities Exchange Act of 1934 (the “Exchange Act”) requires our executive officers and directors, and persons who own more than 10% of a registered class of our equity securities to file reports of ownership and changes in ownership with the SEC. These persons are also required by SEC regulation to furnish us with copies of all Section 16(a) forms they file. Based solely on our review of such forms or written representations from certain reporting persons, we believe that during 2011 our executive officers and directors complied with the filing requirements of Section 16(a) except: Christopher E. Clouser filed a late Form 3 and Form 4, and Benny Sela, Michael Barth and Samuel M. Zentman each filed a late Form 4.
58
We have implemented measures to assure timely filing of Section 16(a) reports by our executive officers and directors in the future.
Code of Ethics
We have adopted a code of ethics that applies to our principal executive officer, principal financial officer, and principal accounting officer or controller, and/or persons performing similar functions. Our code of ethics may be accessed on the Internet at
http://www.acornenergy.com/rsc/docs/55.pdf
59
|
ITEM 11.
|
EXECUTIVE COMPENSATION
|
EXECUTIVE AND DIRECTOR COMPENSATION
Compensation Discussion and Analysis
The following discussion and analysis of compensation arrangements of our named executive officers for the year ended December 31, 2011 should be read together with the compensation tables and related disclosures set forth below. This discussion contains forward looking statements that are based on our current plans, considerations, expectations and determinations regarding future compensation programs. Actual compensation programs that we adopt may differ materially from currently planned programs as summarized in this discussion.
Compensation determinations
.
Our executive compensation is administered by the Compensation Committee of the Board of Directors (the “Committee”) which was formed in October, 2011. The members of the Committee are Richard Giacco (Chairman) and Joseph Musanti, both of whom are independent in accordance with NASDAQ's requirement for independent Director oversight of executive officer compensation. In fulfilling its role, the Committee (1) reviews periodically and approves the Company's general philosophy concerning executive compensation and the components of the Company's executive compensation program to align them with the Company's compensation philosophy; (2) reviews and approves goals and objectives that it considers relevant to the compensation of the Company's chief executive officer, evaluates his performance and sets the terms of his compensation; and (3) establishes the compensation of each of the Company's other executive officers, as well approves employment agreements, severance agreements and change in control agreements for the Company's chief executive officer and other executive officers. In addition, the Committee periodically evaluates the Company's long-term and short-term incentive plans and employee benefit plans, together with the Company's methodology for awarding equity-based and other incentive compensation to all non-executive employees (including new hires) and other service providers and the levels of such compensation. Prior to the establishment of the Committee, our Board of Directors as whole set compensation policies and made compensation decisions, including the specific compensation levels for each executive officer, and also administered the Company's equity compensation plans and practices. As required by NASDAQ, all action with respect to the compensation of our executive officers was also approved or recommended for approval by a majority of our independent directors.
Compensation objectives and philosophy.
Our executive compensation programs are designed to motivate and reward sustainable long-term performance, and a key component of our executive compensation is long-term incentives. This ensures that executive compensation aligns appropriately with long-term stockholder interests and the Company's performance. We continuously evaluate our executive compensation programs and make prudent changes when necessary to ensure alignment with stockholder interests. The Board believes that the objectives of our executive compensation program are appropriate for a company of our size and stage of development and that our compensation policies and practices help meet those objectives. Considering the approval of executive compensation in the stockholder advisory vote at our 2011 annual meeting, the Compensation Committee has taken a similar approach to compensation decisions and policies as the Board of Directors did previously.
Compensation program.
The elements of our compensation program include base salary and performance-based cash bonuses, as well as long-term compensation in the form of stock options. The Board believes that our executive compensation program achieves an appropriate balance between fixed compensation and variable incentive compensation and pays for performance. The Board also believes that the Company's executive compensation program effectively aligns the interests of our executive officers with those of our stockholders by tying a significant portion of their compensation to the Company's performance and by providing a competitive level of compensation needed to recruit, retain and motivate talented executives critical to the Company's long-term success. The costs of our compensation programs are a significant determinant of our competitiveness. Accordingly, we are focused on ensuring that the balance of the various components of our compensation program is optimized to motivate employees to achieve our corporate objectives on a cost-effective basis. Changes in each named executive officer's base compensation for 2011, together with the methodology for determining their respective bonuses, if any, are described below. The Boards of Directors of our subsidiary companies (DSIT, USSI and GridSense) determine the compensation of their own executive officers and other employees; provided that we made a separate bonus award to Mr. Cogdell in 2011 as described below.
John A. Moore.
In October 2010, Mr. Moore agreed to a voluntary reduction of his base compensation from $375,000 per year to $300,000 per year to assist us in managing our cash resources. We restored the amount of Mr. Moore's base salary to $375,000 per annum effective November 1, 2011 in recognition of his efforts to lead us through the successful sale of CoaLogix. We also made a payment to Mr. Moore of a discretionary cash bonus of approximately $422,000. This bonus was based on Mr. Moore's efforts
60
in leading the successful sale of CoaLogix, his voluntary reduction of his salary during the prior twelve month period and in lieu of an award of additional options which the Board of Directors had intended to make to Mr. Moore in connection with the one-year extension of his employment agreement in early 2011. He was also awarded an additional cash bonus of up to $25,000, the amount to be determined and paid when we receive our portion of the escrowed sales proceeds from the sale of CoaLogix (scheduled for release on August 31, 2012).
Michael Barth.
Mr. Barth's base compensation for 2011 increased by approximately $7,400 currency due to exchange rates and contractual cost of living adjustments.
William J. McMahon
. Mr. McMahon received a $25,000 increase in his base salary for 2011 from $280,000 to $305,000 in recognition of his efforts in connection with expanding the international scope of CoaLogix' operations. He was also entitled under the terms of his employment agreement to receive his full year maximum cash bonus upon the sale of CoaLogix, which was $152,000. In connection with the closing of the CoaLogix sale in August 2011, Mr. McMahon received a payment of $1,462,785 under the CoaLogix Capital Appreciation Rights Plan.
Benny Sela
. Mr. Sela's base compensation for 2011 increased by approximately $15,000 due to currency exchange rates and contractual cost of living adjustments. He also received a cash bonus of approximately $67,000 in accordance with the terms of his contract whereby he is entitled to a a bonus payment equal to 1.75% of DSIT's gross profit.
Lindon Shiao
. Mr. Shiao received no increase in his base compensation for 2011 and was not entitled to a bonus from us under the terms of his employment through a management company.
Joe B. Cogdell
. Mr. Cogdell received a $6,240 increase in his base salary for 2011 from $312,000 to approximately $318,000 representing a 2% as a cost of living adjustment. He was also entitled under the terms of his employment agreement to receive his full year maximum cash bonus upon the sale of CoaLogix, which was approximately $48,000, and was paid an additional discretionary bonus in the amount of $63,000 in recognition of his past efforts for the Company and helping to lead us through the successful sale of CoaLogix. In connection with the closing of the CoaLogix sale in August 2011, Mr. Cogdell received a payment of $445,971 under the CoaLogix Capital Appreciation Rights Plan.
Stockholder input on executive compensation
. Stockholders can provide the Company with their views on executive compensation matters at each year's annual meeting through the stockholder advisory vote on executive compensation and during the interval between stockholder advisory votes. The Company welcomes stockholder input on our executive compensation matters, and stockholders are able to reach out directly to our independent directors by emailing to
board@acornenergy.com
to express their views on executive compensation matters.
61
Summary Compensation Table
|
Name and Principal Position
|
Year
|
Salary ($)
|
Bonus ($)
|
Option
Awards ($)
|
|
|
All Other
Compensation
($)
|
|
Total ($)
|
|||||||||||
|
John A. Moore
|
||||||||||||||||||||
|
President and CEO
|
2011
|
325,962
|
|
446,890
|
|
124,232
|
|
(2
|
)
|
12,000
|
|
(1
|
)
|
909,084
|
|
|||||
|
2010
|
364,904
|
|
—
|
|
—
|
|
|
|
12,000
|
|
(1
|
)
|
376,904
|
|
||||||
|
2009
|
350,000
|
|
160,000
|
|
103,652
|
|
(3
|
)
|
12,000
|
|
(1
|
)
|
625,652
|
|
||||||
|
Michael Barth
|
||||||||||||||||||||
|
CFO and CFO of DSIT
|
2011
|
188,529
|
|
—
|
|
—
|
|
74,944
|
|
(4
|
)
|
263,473
|
|
|||||||
|
2010
|
181,106
|
|
—
|
|
25,644
|
|
(5
|
)
|
67,758
|
|
(4
|
)
|
274,508
|
|
||||||
|
2009
|
162,244
|
|
75,000
|
|
48,371
|
|
(6
|
)
|
58,122
|
|
(4
|
)
|
343,737
|
|
||||||
|
William J. McMahon
|
||||||||||||||||||||
|
CEO and President of CoaLogix and SCR-Tech (7)
|
2011
|
203,334
|
|
(8)
|
152,500
|
|
—
|
|
1,475,385
|
|
(9
|
)
|
1,831,219
|
|
||||||
|
2010
|
280,000
|
|
93,500
|
|
—
|
|
|
|
13,725
|
|
(10
|
)
|
387,225
|
|
||||||
|
2009
|
250,000
|
|
136,880
|
|
175,574
|
|
(11
|
)
|
13,200
|
|
(10
|
)
|
575,654
|
|
||||||
|
Benny Sela
|
|
|
||||||||||||||||||
|
CEO and President of DSIT
|
2011
|
210,509
|
|
67,168
|
|
—
|
|
87,657
|
|
(4
|
)
|
365,334
|
|
|||||||
|
2010
|
195,432
|
|
85,995
|
|
25,644
|
|
(4
|
)
|
80,633
|
|
(4
|
)
|
387,704
|
|
||||||
|
2009
|
167,259
|
|
70,688
|
|
18,041
|
|
(12
|
)
|
66,320
|
|
(4
|
)
|
322,308
|
|
||||||
|
Joe B. Cogdell, Jr.
|
||||||||||||||||||||
|
Vice President, General Counsel and Secretary of Acorn and CoaLogix (13)
|
2011
|
300,553
|
|
(14
|
)
|
110,472
|
|
—
|
|
458,085
|
|
(15
|
)
|
869,110
|
|
|||||
|
2010
|
312,000
|
|
43,000
|
|
—
|
|
18,005
|
|
(10
|
)
|
373,005
|
|
||||||||
|
2009
|
300,000
|
|
90,380
|
|
265,357
|
|
(16
|
)
|
15,941
|
|
(10
|
)
|
671,678
|
|
||||||
|
Lindon Shiao
|
||||||||||||||||||||
|
Chief Executive Officer and President of GridSense
|
2011
|
240,000
|
|
—
|
|
—
|
|
—
|
|
240,000
|
|
|||||||||
|
2010
|
153,863
|
|
(17
|
)
|
—
|
|
—
|
|
18,253
|
|
(18
|
)
|
172,116
|
|
||||||
|
(1)
|
Consists of automobile expense allowance.
|
|
(2)
|
In 2011, represents the grant date fair value calculated in accordance with applicable accounting principles with respect to 66,666 stock options granted on March 14, 2011 with an exercise price of $3.70.The fair value of the options was determined using the Black-Scholes option pricing model using the following assumptions: (i) a risk-free interest rate of 2.0% (ii) an expected term of 4.5 years (iii) an assumed volatility of 61% and (iv) no dividends.
|
|
(3)
|
Represents the grant date fair value calculated in accordance with applicable accounting principles with respect to 75,000 stock options granted on February 20, 2009 with an exercise price of $2.51.The fair value of the options was determined using the Black-Scholes option pricing model using the following assumptions: (i) a risk-free interest rate of 1.8% (ii) an expected term of 4.5 years (iii) an assumed volatility of 68% and (iv) no dividends.
|
|
(4)
|
Consists of contributions to severance and pension funds and automobile fringe benefits. Contributions to severance
|
and pension funds are made on substantially the same basis as those made on behalf of other Israeli executives.
|
(5)
|
Represents the grant date fair value calculated in accordance with applicable accounting principles with respect to 10,000 stock options granted on December 27, 2010 with an exercise price of $4.09.The fair value of the options was determined using the Black-Scholes option pricing model using the following assumptions: (i) a risk-free interest rate of 2.02% (ii) an expected term of 6.3 years (iii) an assumed volatility of 67% and (iv) no dividends.
|
|
(6)
|
In 2009, represents the grant date fair value calculated in accordance with applicable accounting principles with respect to 35,000 stock options granted on February 20, 2009 with an exercise price of $2.51.The fair value of the options was determined using the Black-Scholes option pricing model using the following assumptions: (i) a risk-free interest rate of 1.8% (ii) an expected term of 4.5 years (iii) an assumed volatility of 68% and (iv) no dividends.
|
62
|
(7)
|
Served as a named executive officer through August 31, 2011 (the date of the sale of CoaLogix).
|
|
(8)
|
Represents salary for the period January 1, 2011 to August 31, 2011 (the date of the sale of CoaLogix).
|
|
(9)
|
Represents 401k contributions for the period January 1, 2011 to August 31, 2011 (the date of the sale of CoaLogix) of $12,600, plus a payment under the CoaLogix CAR Plan of $1,462,785.
|
|
(10)
|
Represents 401k contributions.
|
|
(11)
|
Represents the grant date fair value calculated in accordance with applicable accounting principles with respect to 40,513 CoaLogix stock options granted on April 8, 2009 with an exercise price of $7.20. The fair value of the options was determined using the Black-Scholes option pricing model using the following assumptions: (i) a risk-free interest rate of 1.8% (ii) an expected term of 6.1 years (iii) an assumed volatility of 65% and (iv) no dividends.
|
|
(12)
|
Represents the grant date fair value calculated in accordance with applicable accounting principles with respect to 20,000 stock options granted on February 12, 2009 with an exercise price of $2.51 per share. The fair value of the options was determined using the Black-Scholes option pricing model using the following assumptions: (i) a risk-free interest rate of 0.95% (ii) an expected term of 1.8 years (iii) an assumed volatility of 68% and (iv) no dividends.
|
|
(13)
|
Served as a named executive officer through December 31, 2011.
|
|
(14)
|
Represents salary ($212,134) for the period January 1, 2011 to August 31, 2011 (the date of the sale of CoaLogix) and Acorn's share ($88,419) of salary paid to Mr. Cogdell during the period September 1, 2011 to December 31, 2011 under an agreement with CoaLogix.
|
|
(15)
|
Represents 401k contributions ($8,931) for the period January 1, 2011 to August 31, 2011 (the date of the sale of CoaLogix)and Acorn's share ($3,183) of 401k paid during the period September 1, 2011 to December 31, 2011 under an agreement with CoaLogix, plus a payment under the CoaLogix CAR Plan of $445,971.
|
|
(16)
|
Represents the grant date fair value calculated in accordance with applicable accounting principles with respect to
|
120,000 Acorn stock options granted on January 5, 2009 with an exercise price of $1.61 ($243,389) and 5,069
CoaLogix stock options granted on April 8, 2009 with an exercise price of $7.20 ($21,968). The fair value of the
Acorn stock options was determined using the Black-Scholes option pricing model using the following assumptions:
(i) a risk-free interest rate of 2.5% (ii) an expected term of 9.0 years (iii) an assumed volatility of 73% and (iv) no
dividends. The fair value of the CoaLogix stock options was determined using the Black-Scholes option pricing
model using the following assumptions: (i) a risk-free interest rate of 2.6% (ii) an expected term of 5.9 years (iii) an
assumed volatility of 56% and (iv) no dividends.
|
(17)
|
Represents Mr. Shiao's salary from the period from May 12, 2010 (the date of our acquisition of GridSense) to December 31, 2010.
|
|
(18)
|
Represents a housing allowance of $2,600 Australian dollars per month from the period from May 12, 2010 (the date of our acquisition of GridSense) to December 31, 2010.
|
Grants of Plan Based Awards
|
Name
|
Grant Date
|
Number of Shares of Common Stock Underlying Options
|
Exercise Price of Options Awards (Per Share)
|
Grant Date Fair Value of Options Awards
|
||||
|
John A. Moore
|
March 14, 2011
|
66,666 (1)
|
$3.70
|
$124,232
|
||||
|
Michael Barth
|
—
|
—
|
—
|
|||||
|
William J. McMahon
|
—
|
—
|
—
|
—
|
||||
|
Benny Sela
|
—
|
—
|
—
|
—
|
||||
|
Joe B Cogdell Jr.
|
—
|
—
|
—
|
—
|
||||
|
Lindon Shiao
|
—
|
—
|
—
|
—
|
||||
(1) One-fourth of the options were immediately vested; the remainder vested in equal installments on June 30, September 30 and December 31, 2011.
63
Employment Arrangements
The employment arrangements of each named executive officer and certain other officers are described below.
John A. Moore
became our President and Chief Executive Officer in March 2006. In March, 2008, we entered into a three-year Employment Agreement with Mr. Moore, providing for an initial base salary of $325,000 per annum, retroactive to January 1, 2008, increasing to $350,000 per annum on the first anniversary of the Employment Agreement and increasing to $375,000 per annum on the second anniversary. Effective November 1, 2010, Mr. Moore voluntarily reduced his annual salary to $300,000 per annum. In March 2011, we entered into a one-year extension of the Employment Agreement with Mr. Moore at the reduced salary of $300,000 per annum. In November 2011, we entered into a second amendment to Mr. Moore's Employment Agreement restoring his salary to $375,000 per annum effective November 1, 2011. In March 2012, we amended Mr. Moore's Employment Agreement such that Mr. Moore's employment shall continue until the earlier of any Extension Term End (as defined below) and the date his employment is otherwise terminated according to the provisions of the Agreement. “Extension Term End” means the fourth day of any month if either we or Mr. Moore shall have given the other written notice of termination of the Agreement ten days prior to such date. Mr. Moore is eligible to receive an annual cash bonus of up to $200,000, based upon the attainment of agreed upon personal and company performance goals and milestones for the preceding fiscal year, as determined by the Board. Under the Employment Agreement, Mr. Moore is also entitled to (i) the employee benefits generally made available to the registrant's executive officers, (ii) short-term and long-term disability insurance for the benefit of Mr. Moore, and (iii) a monthly automobile expense allowance of $1,000.
In February 2009, in lieu of a bonus for 2008, Mr. Moore was awarded 75,000 stock options exercisable until February 20, 2014 at an exercise price of $2.51 per share, exercisable immediately as to one-fourth of the options, with the remainder vesting in equal installments on June 30, September 30 and December 31, 2009. Mr. Moore received a bonus of $160,000 for 2009 that was paid in 2010. In March 2011, in lieu of a bonus for 2010, Mr. Moore was awarded 66,666 stock options exercisable until March 14, 2016 at an exercise price of $3.70 per share, exercisable immediately as to one-fourth of the options, with the remainder vesting in equal installments on June 30, September 30 and December 31, 2011.
William J. McMahon
served as Chief Executive Officer and President of our CoaLogix subsidiary between November 7, 2007, and August 31, 2011, the date CoaLogix was sold. Under the terms of his employment agreement, in addition to his base salary, Mr. McMahon was eligible to receive an annual bonus with a target payment equal to 50% of his base salary based upon criteria developed by the board of directors of CoaLogix. In April 2009, Mr. McMahon also received options under the CoaLogix Inc. 2008 Stock Option Plan and a 40% participation in the CoaLogix Capital Appreciation Rights Plan. Under the Capital Appreciation Rights Plan, plan participants were entitled to participate in an award pool based upon the sales proceeds (less sales expenses) attributable to a sale or other change of control of CoaLogix which exceeded an internal rate of return of 30% on the Company's initial investment in CoaLogix of $11,038,200 and any additional capital contributed by Acorn to CoaLogix. If such internal rate of return threshold were met, the award pool under the Capital Appreciation Rights Plan would be equal to 5% of the sales proceeds less sales expenses, the CoaLogix' stockholders' initial investment and any additional capital contributed by the stockholders to CoaLogix. In connection with the closing of the CoaLogix sale in August 2011, Mr. McMahon received a payment of $1,462,785 under the Capital Appreciation Rights Plan.
Benny Sela
has served as President and Chief Executive Officer of DSIT beginning July 1, 2007. Mr. Sela’s employment agreement provided for a base salary which is denominated in Israeli Consumer Price Index (“CPI”) linked NIS, currently equivalent to approximately $199,000 per annum. In addition to his base salary, Mr. Sela is also entitled to receive a bonus payment equal to 1.75% of DSIT’s gross profit. Mr. Sela’s bonus for 2009 was $70,688 which was paid in 2010. Mr. Sela’s bonus for 2010 was $85,995 which was paid in 2011. Mr. Sela's bonus for 2011 was $67,168.
Lindon Shiao
has served as CEO and President of GridSense since 2006. Mr. Shiao’s employment terms are based on a management agreement signed effective October 1, 2002 between a company of which Mr. Shiao is a principal and GridSense. The agreement has no fixed term and the employment is on an “at-will” basis. For 2011, Mr. Shiao’s annual salary was $240,000 and is unchanged for 2012. Mr. Shiao did not receive a bonus for 2011.
Jim Andersen
has served as CEO and President of USSI since he founded USSI in October 2007. Mr. Andersen’s employment terms are based on employment agreement signed effective November 1, 2007 between Mr. Andersen and USSI. The agreement has no fixed term and the employment is on an “at-will” basis. The agreement does not state any salary or other compensation terms. For 2011, Mr. Andersen’s salary was approximately $149,000. Mr Andersen's salary for 2012 is $170,000. Mr. Andersen did not receive a bonus for 2011.
Deena Redding
has served as CEO and President of OmniMetrix since 2009, prior to which she was the controller for the period from 2008 to 2009. She is party to an at-will employment agreement that commenced with our acquisition and has no
64
fixed term. Ms. Redding is entitled to receive a base salary of $200,000 per annum and is eligible to receive up to a 30% bonus based on performance goals established by the OmniMetrix board of managers each year. She also received a one-time payment of $50,000 in connection with the termination of her prior employment agreement in effect at the time we acquired OmniMetrix.
Michael Barth
has served as Chief Financial Officer of the Company and Chief Financial Officer of DSIT beginning December 1, 2005. In August 2009, the Board approved new employment terms for Mr. Barth effective August 1, 2009. According to the terms of the new employment terms, Mr. Barth was entitled to a salary increase from $150,000 to $175,000 per annum retroactive to August 1, 2009. One half of Mr. Barth’s salary is fixed in NIS at the November 1, 2007 exchange rate and linked to the Israel CPI and adjusted semi-annually. Mr. Barth’s current annual salary following such linkage adjustments is approximately $187,500. The cost of Mr. Barth's total compensation (excluding bonuses) is shared by an arrangement between Acorn (75%) and DSIT (25%). Each of Acorn and DSIT separately determine any bonus (if any) to be paid to Mr. Barth. Barth's bonus for 2009 was $75,000 (from Acorn) which was paid in 2010. Mr. Barth did not receive any bonus for 2010 or 2011.
Joe B. Cogdell, Jr.
served as Vice President, General Counsel and Secretary of each of the Company and CoaLogix between January 2, 2009, and August 31, 2011, when CoaLogix was sold. Under the terms of his employment agreement, in addition to his base salary, he was eligible to receive an annual bonus of up to 30% of his base salary, based upon the attainment of performance goals. Under the employment agreement, in January 2009, Mr. Cogdell was awarded 120,000 options to purchase Acorn common stock at an exercise price of $1.61 per share, vesting as to 30,000 on the first anniversary of the date of grant and as to the remainder in equal quarterly installments over a three year period following the first anniversary of the date of grant, exercisable through January 5, 2019. Mr. Cogdell also received options under the CoaLogix Inc. 2008 Stock Option Plan and a participation in the CoaLogix Capital Appreciation Rights Plan. In connection with the closing of the CoaLogix sale in August 2011, Mr. Cogdell received a payment of $445,971 under the CoaLogix Capital Appreciation Rights Plan. Mr. Cogdell was also entitled to the employee benefits generally made available to other senior executives, officer's liability and legal malpractice insurance, as well as bar and legal association dues and continuing legal education programs.
Heather K. Mallard
became Vice President, General Counsel and Secretary of the Company commencing February 1, 2012. Under her employment agreement, Ms. Mallard's initial base salary is $225,000 per annum. The agreement has no fixed term, and the employment is on an “at-will” basis. She is eligible to receive an annual bonus of up to 30% of her base salary, based upon the attainment of performance goals. Ms. Mallard is eligible for relocation reimbursement assistance of up to $20,000.
Under the employment agreement, Ms. Mallard was awarded 50,000 options to purchase Acorn common stock at an exercise price of $6.49 per share, vesting equally over a three year period following the first anniversary of the date of grant, exercisable through February 1, 2019.
65
Outstanding Equity Awards at 2011 Fiscal Year End
The following tables set forth all outstanding equity awards made to each of the Named Executive Officers that are outstanding at December 31, 2011.
|
OPTIONS TO PURCHASE ACORN ENERGY, INC. STOCK
|
||||||||
|
Name
|
Number of Securities Underlying Unexercised Options (#) Exercisable
|
Number of Securities Underlying Unexercised Options (#) Unexercisable
|
Option
Exercise Price
($)
|
Option Expiration Date
|
||||
|
John A. Moore
|
187,500
|
12,500 (1)
|
5.11
|
March 4, 2018
|
||||
|
|
75,000
|
—
|
2.51
|
February 20, 2014
|
||||
|
|
66,666
|
—
|
3.70
|
March 14, 2016
|
||||
|
Michael Barth
|
30,000
|
—
|
3.90
|
September 19, 2014
|
||||
|
35,000
|
—
|
2.51
|
February 20, 2014
|
|||||
|
10,000
|
—
|
4.09
|
December 28, 2017
|
|||||
|
William J. McMahon
|
—
|
—
|
—
|
—
|
||||
|
Benny Sela
|
10,000
|
—
|
4.09
|
December 28, 2017
|
||||
|
Joe B. Cogdell, Jr.
|
120,000 (2)
|
—
|
1.61
|
January 5, 2019
|
||||
|
Lindon Shiao
|
—
|
—
|
—
|
—
|
||||
|
(1)
|
These options vest on March 4, 2012.
|
|
(2)
|
Vesting of all of these options was accelerated in December 2011 in connection with the termination of the transition services agreement between Acorn and CoaLogix.
|
|
OPTIONS TO PURCHASE DSIT SOLUTIONS LTD. STOCK
|
||||||||
|
Name
|
Number of Securities Underlying Unexercised Options (#) Exercisable
|
Number of Securities Underlying Unexercised Options (#) Unexercisable
|
Option
Exercise Price
($)
|
Option Expiration Date
|
||||
|
John A. Moore
|
—
|
—
|
—
|
—
|
||||
|
Michael Barth
|
—
|
16,774
|
1.05
|
August 10, 2018
|
||||
|
William J. McMahon
|
—
|
—
|
—
|
—
|
||||
|
Benny Sela
|
—
|
47,600
|
1.26
|
August 10, 2018
|
||||
|
—
|
19,336
|
2.45
|
August 10, 2018
|
|||||
|
Joe B. Cogdell, Jr.
|
—
|
—
|
—
|
—
|
||||
|
Lindon Shiao
|
—
|
—
|
—
|
—
|
||||
All options to purchase DSIT Solutions Ltd. common stock vest only upon an exit transaction by Acorn.
66
Option Exercises
|
Acorn Option Awards
|
CoaLogix Option Awards
|
|||||||
|
Name
|
Number of Shares Acquired on Exercise (#)
|
Value Realized on Exercise ($)
|
Number of Shares Acquired on Exercise (#)
|
Value Realized on Exercise ($)
|
||||
|
John A. Moore
|
113,636
|
$437,499
|
—
|
$—
|
||||
|
Michael Barth
|
19,394
|
93,867
|
—
|
|||||
|
William J. McMahon
|
—
|
—
|
(1)
|
2,302,229
|
||||
|
Benny Sela
|
20,000
|
24,000
|
—
|
—
|
||||
|
Joe B Cogdell Jr.
|
—
|
—
|
(2)
|
288,001
|
||||
|
Lindon Shiao
|
—
|
—
|
—
|
—
|
||||
|
(1)
|
In connection with the sale of CoaLogix in August 2011, 170,062 of Mr. McMahon's CoaLogix options were cashed out using the spread between the exercise price of the options and the per share value of the CoaLogix common stock based on the CoaLogix purchase price.
|
|
(2)
|
In connection with the sale of CoaLogix in August 2011, 21,279 of Mr. Cogdell's CoaLogix options were cashed out using the spread between the exercise price of the options and the per share value of the CoaLogix common stock based on the CoaLogix purchase price.
|
67
Non-qualified Deferred Compensation
The following table provides information on the executive non-qualified deferred compensation activity for each of our named executive officers for the year ended December 31, 2011.
|
Named Executive Officer
|
Executive Contributions in Last Fiscal Year ($)
|
Registrant Contributions in Last Fiscal Year ($)
|
Aggregate Earnings (Losses) in Last Fiscal Year ($)
|
Aggregate Withdrawals/Distributions ($)
|
Aggregate Balance at Last Fiscal Year End ($)
|
||||||
|
John A. Moore
|
$—
|
$—
|
$—
|
$—
|
$—
|
||||||
|
Michael Barth
|
—
|
19,076
|
(1)
|
(10,719)
|
(2)
|
—
|
240,127
|
(3)
|
|||
|
William J. McMahon
|
—
|
—
|
—
|
—
|
—
|
||||||
|
Benny Sela
|
—
|
26,692
|
(1)
|
(33,971)
|
(2)
|
—
|
733,393
|
(3)
|
|||
|
Joe B Cogdell Jr.
|
—
|
—
|
—
|
—
|
—
|
||||||
|
Lindon Shiao
|
—
|
—
|
—
|
—
|
—
|
||||||
|
(1)
|
Represents a contribution to a manager's insurance policy. Such amount is included in the "All Other Compensation" column of the Summary Compensation Table.
|
|
(2)
|
Represents the dollar value by which the aggregate balance of the manager's insurance policy as of December 31, 2011 is less than the sum of (i)the balance of the manager's insurance policy as of December 31, 2010, and (ii) the employer and employee contributions to the manager's insurance policy during 2011.
|
|
(3)
|
Represents the aggregate balance of the manager's insurance policy as of December 31, 2011.
|
Estimated Payments and Benefits Upon Termination or Change in Control
The amount of compensation and benefits payable to each named executive officer and certain other officers in various termination situations is described in the tables below.
John A. Moore
Under the terms of the employment agreement with Mr. Moore, our President and Chief Executive Officer, upon termination by the Company for cause (as defined in the agreement) and upon termination by Mr. Moore without good reason (as defined in the agreement), all compensation due to Mr. Moore under his agreement would cease, except that Mr. Moore would receive all accrued but unpaid base salary up to the date of termination, and reimbursement of all previously unreimbursed expenses. All vested and unexercised options granted by the Company as of the date of termination would be exercisable in accordance with the terms of the applicable stock option plan and agreements, provided that Mr. Moore would have only three months to exercise such previously vested options. All options that had not vested as of the date of termination would expire.
In the event that within three months prior to or one year following a change of control (as defined in the agreement), either (i) the Company terminates the employment of Mr. Moore, other than for cause, or (ii) Mr. Moore terminates for good reason, Mr. Moore would receive the following (except to the extent that any payment would constitute an “excess parachute payment” under the IRS Code): (i) an amount equal to (A) 24 months of then-current base salary and (B) two times his most recent annual bonus; (ii) reimbursement of all previously unreimbursed expenses; (iii) the full vesting of any and all stock options granted to Mr. Moore by the Company prior to such termination, and extended exercisability thereof until their respective expiration dates; and (iv) the continuation of all medical and dental benefits at the Company’s sole expense for a period of one year after termination.
In the event that (i) the Company terminates the employment of Mr. Moore (including a non-renewal of his agreement at the end of the three-year term provided therein, but not including non-renewal following any subsequent renewal of the term), other than upon a change of control, death, disability or for cause, or (ii) Mr. Moore terminates for good reason, other than in connection with a change of control, Mr. Moore shall receive the following (except to the extent that any payment would constitute
68
an “excess parachute payment” under the IRS Code): (i) an amount equal to (A) 12 months of then-current base salary and (B) his most recent annual bonus; (ii) reimbursement of all previously unreimbursed expenses; (iii) accelerated vesting of all unvested options that otherwise would have vested within 24 months of the date of termination, with such accelerated options and all other vested and unexercised options granted by the Company as of the date of termination to be exercisable for a period of one year from the date of termination of employment in accordance with the terms of the applicable stock option plan and agreements; and (iv) the continuation of all medical and dental benefits at the Company’s sole expense for a period of one year after termination.
In the event of any change of control, all stock options granted to Mr. Moore prior to such change of control vest and remain exercisable until their respective expiration dates.
The term of Mr. Moore’s agreement would end immediately upon his death, or upon termination by the Company for cause or disability (as defined in the agreement) or by Mr. Moore for good reason. Upon termination due to Mr. Moore’s death, all compensation due Mr. Moore under his agreement would cease.
The following table describes the potential payments and benefits upon termination of employment for Mr. Moore, as if his employment terminated as of December 31, 2011, the last day of our last fiscal year.
|
|
Circumstances of Termination
|
|||||||||||||||
|
Payments and benefits
|
Voluntary resignation
|
|
Termination not for cause
|
|
Change of control
|
|
Death or disability
|
|||||||||
|
Compensation:
|
|
|
|
|
|
|
|
|||||||||
|
Base salary
|
$
|
—
|
|
(1)
|
$
|
375,000
|
|
(2)
|
$
|
750,000
|
|
(5)
|
$
|
—
|
|
|
|
Bonus
|
—
|
|
|
—
|
|
(3)
|
—
|
|
(3)
|
—
|
|
|||||
|
Benefits and perquisites:
|
|
|
|
|
|
|
|
|
|
|
|
|||||
|
Perquisites and other personal benefits
|
—
|
|
|
9,012
|
|
(4)
|
9,012
|
|
(4)
|
—
|
|
|||||
|
Total
|
—
|
|
|
$
|
384,012
|
|
|
$
|
759,012
|
|
|
—
|
|
|||
|
(1)
|
Assumes that there is no earned but unpaid base salary at the time of termination.
|
|
(2)
|
The $375,000 represents 12 months of Mr. Moore’s base salary.
|
|
(3)
|
No amounts are included for target bonus as there were no defined targets for a bonus in 2011.
|
|
(4)
|
The $9,012 represents 12 months of health insurance payments.
|
|
(5)
|
The $750,000 represents 24 months of Mr. Moore’s base salary.
|
Michael Barth
Under the terms of the employment arrangement with Mr. Barth, our Chief Financial Officer, we are obligated to make certain payments to fund in part our severance obligations to him. We would be required to pay Mr. Barth an amount equal to 120% of his last month’s salary multiplied by the number of years (including partial years) that Mr. Barth worked for us. This severance obligation, which is customary for executives of Israeli companies, would be reduced by the amount contributed by us to certain Israeli pension and severance funds pursuant to Mr. Barth’s employment arrangement. As of December 31, 2011, the unfunded portion of these payments was $126,992. In addition, the arrangement with Mr. Barth provides for an additional payment equal to six times his last month’s total compensation, payable at the end of his employment with us.
The following table describes the potential payments and benefits upon termination of employment for Mr. Barth, as if his employment terminated as of December 31, 2011, the last day of our last fiscal year.
69
|
|
Circumstances of Termination
|
|
||||||||||||||
|
Payments and benefits
|
Voluntary resignation
|
|
Termination not for cause
|
|
Change of control
|
Death or disability
|
|
|||||||||
|
Compensation:
|
|
|
|
|
|
|
|
|||||||||
|
Base salary
|
$
|
30,452
|
|
(1)
|
$
|
91,355
|
|
(2)
|
—
|
|
$
|
91,355
|
|
(2)
|
||
|
Benefits and perquisites:
|
|
|
|
|
|
|
|
|
|
|
|
|||||
|
Perquisites and other personal benefits
|
83,250
|
|
(3)
|
227,519
|
|
(4)
|
—
|
|
227,519
|
|
(4)
|
|||||
|
Total
|
$
|
113,702
|
|
|
$
|
318,874
|
|
|
—
|
|
$
|
318,874
|
|
|
||
|
(1)
|
Assumes that there is no earned but unpaid base salary at the time of termination. The $30,452 represents a lump sum payment of two months’ salary due to Mr. Barth.
|
|
(2)
|
Assumes that there is no earned but unpaid base salary at the time of termination. The $91,355 represents a lump sum payment of 6 months’ salary due to Mr. Barth upon termination without cause or by death or disability.
|
|
(3)
|
Includes $94,463 of severance pay based on the amounts funded in for Mr. Barth’s severance in accordance with Israeli labor law. Also includes accumulated, but unpaid vacation days ($28,149), car benefits ($2,000) and payments for pension and education funds ($6,638) less $48,000 of benefits waived in support of DSIT’s operations in 2007.
|
|
(4)
|
Includes $221,455 of severance pay based in accordance with Israeli labor law calculated based on his last month’s salary multiplied by the number of years (including partial years) that Mr. Barth worked for us multiplied by 120% in accordance with his contract. Of the $221,455 due Mr. Barth, we have funded $94,463 in an insurance fund. Also includes accumulated, but unpaid vacation days ($28,149), car benefits ($6,000) and payments for pension and education funds ($19,915) less $48,000 of benefits waived in support of DSIT’s operations in 2007.
|
William J. McMahon
No termination payments were made to Mr. McMahon following the sale of CoaLogix by Acorn in August 2011. In connection with the closing of the CoaLogix sale, Mr. McMahon received a payment of $1,462,785 under the CoaLogix Capital Appreciation Rights Plan.
Benny Sela
Under the terms of the employment agreement with Mr. Sela, the President and Chief Executive Officer of our DSIT subsidiary, we are obligated to make certain payments to fund in part our severance obligations to him. We are required to pay Mr. Sela an amount equal to 150% of his last month’s salary multiplied by the number of years (including partial years) that Mr. Sela has worked for us. This severance obligation would be reduced by the amount contributed by us to certain Israeli pension and severance funds pursuant to Mr. Sela’s employment agreement. As of December 31, 2011, the unfunded portion of these payments was $200,202. Mr. Sela would also receive a lump sum payment equal to six months base salary in the event of a voluntary resignation, and a lump sum payment equal to nine months salary in the event of termination not for cause.
The following table describes the potential payments and benefits upon termination of employment for Mr. Sela, as if his employment terminated as of December 31, 2011, the last day of our last fiscal year.
|
|
Circumstances of Termination
|
|
||||||||||||||
|
Payments and benefits
|
Voluntary resignation
|
|
Termination not for cause
|
|
Change of control
|
Death or disability
|
|
|||||||||
|
Compensation:
|
|
|
|
|
|
|
|
|||||||||
|
Base salary
|
$
|
99,395
|
|
(1)
|
$
|
149,092
|
|
(2)
|
—
|
|
$
|
149,092
|
|
(2)
|
||
|
Benefits and perquisites:
|
|
|
|
|
|
|
|
|
|
|
|
|||||
|
Perquisites and other personal benefits
|
559,205
|
|
(3)
|
572,784
|
|
(4)
|
—
|
|
572,784
|
|
(4)
|
|||||
|
Total
|
$
|
658,600
|
|
|
$
|
721,876
|
|
|
—
|
|
$
|
721,876
|
|
|
||
|
(1)
|
Assumes that there is no earned but unpaid base salary at the time of termination. The $99,395 represents a lump sum payment of six months’ salary due to Mr. Sela.
|
70
|
(2)
|
Assumes that there is no earned but unpaid base salary at the time of termination. The $149,092 represents a lump sum payment of nine months’ salary due to Mr. Sela.
|
|
(3)
|
Includes $569,751 of severance pay based in accordance with Israeli labor law calculated based on his last month’s salary multiplied by the number of years (including partial years) that Mr. Sela worked for us multiplied by 150% in accordance with his contract. Of the $569,751 due Mr. Sela, we have funded $369,548 in an insurance fund. Also includes accumulated, but unpaid vacation days ($40,294), car benefits ($6,000) and payments for pension and education funds ($21,160) less $78,000 of benefits waived in support of DSIT’s operations in 2007.
|
|
(4)
|
Includes $569,751 of severance pay based in accordance with Israeli labor law calculated based on his last month’s salary multiplied by the number of years (including partial years) that Mr. Sela worked for us multiplied by 150% in accordance with his contract. Of the $569,751 due Mr. Sela, we have funded $369,548 in an insurance fund. Also includes accumulated, but unpaid vacation days ($40,294), car benefits ($9,000) and payments for pension and education funds ($31,739) less $78,000 of benefits waived in support of DSIT’s operations in 2007.
|
Lindon Shiao
Under the terms of the employment agreement with Mr. Shiao, there are no amounts due under any termination scenario.
Jim Andersen
Under the terms of the employment agreement with Mr. Andersen, there are no amounts due under any termination scenario.
Joe B. Cogdell, Jr.
Under the terms of the transition services agreement between the Company and CoaLogix relating to Mr. Cogdell's service to the Company following the sale of CoaLogix, there were no amounts due under any termination scenario. In connection with the closing of the CoaLogix sale in August 2011, Mr. Cogdell received a payment of $445,971 under the CoaLogix Capital Appreciation Rights Plan.
Compensation of Directors
In October 2007, we agreed that each of our non-employee directors would be paid an annual cash retainer of $40,000 payable quarterly in advance, as well as meeting fees for Board and Committee meetings of $1,000 per meeting. In 2009, we agreed that certain directors would receive an additional annual cash retainer; $12,000 for the lead director for CoaLogix matters (in an effort to conserve corporate cash, the lead director for CoaLogix matters voluntarily reduced the payment to $1,000 per CoaLogix board meeting, which payments ceased following the CoaLogix sale in August 2011) and $10,000 for the Chairman of the Audit Committee. As an employee, Mr. Moore is not entitled to separate compensation in his capacity as a director.
Our 2006 Stock Option Plan for Non-Employee Directors, which was adopted in February 2007 and amended and restated in November 2008, provides for formula grants to non-employee directors equal to an option to purchase (i) 25,000 shares of our common stock upon a member’s initial appointment or election to the Board of Directors and (ii) 10,000 shares of our common stock to each director, other than newly appointed or elected directors, immediately following each annual meeting of stockholders. The initial grant to purchase 25,000 shares of our common stock vests one-third per year for each of the three years following the date of appointment or election and the annual grant to purchase 10,000 shares vests one year from the date of grant. Both options shall be granted at an exercise price equal to the closing price on NASDAQ on the day preceding the date of grant and shall be exercisable until the earlier of (a) seven years from the date of grant or (b) 18 months from the date that the director ceases to be a director, officer, employee, or consultant. The plan also provides for non-formula grants at the Board’s discretion. The maximum number of shares of our common stock to be issued under the plan is 400,000. The Plan is administered by the Board of Directors.
Consulting Agreement with Mr. Morgenstern
Mr. Morgenstern, our Chairman Emeritus, has been retained as a consultant by Acorn since March 2006 primarily to provide oversight of our Israeli activities. Mr. Morgenstern’s consulting agreement provides for the payment of an annual consulting fee of $1.00 and a non-accountable expense allowance of $56,250 per year. The Company anticipates the arrangement will be extended by the Board of Directors on the same terms on a month to month basis following its scheduled termination at the end of March.
71
Consulting Agreement with Mr. Rimer
We entered into a Consulting Agreement effective January 1, 2012 with Richard Rimer pursuant to which Mr. Rimer will work with our operating companies in developing and monitoring their business plans, provide investor relations services in Europe and help identify acquisition and partnership opportunities. The agreement is for a term of six months ending June 30, 2012, and provides that our Board of Directors will determine whether to renew the agreement for an additional period of six months upon expiration. Either party may, however, terminate the agreement at any time without penalty. Mr. Rimer will receive total compensation of $125,000 for the six-month period assuming no early termination, payable in two installments. He also is entitled to be reimbursed certain expenses in connection with the performance of his services, subject to prior approval by our Chief Executive Officer in the case of travel and entertainment costs. During the period of this Consulting Agreement, Mr. Rimer continues to receive regular director compensation retainer and meeting fees as noted above.
The following table sets forth information concerning the compensation earned for service on our Board of Directors during the fiscal year ended December 31, 2011 by each individual (other than Mr. Moore who is not separately compensated for Board service) who served as a director at any time during the fiscal year.
DIRECTOR COMPENSATION IN 2011
|
Name
|
Fees Earned or Paid in Cash ($)
|
|
Option Awards ($) (1)
|
All Other Compensation ($)
|
|
Total ($)
|
||||||
|
Joe Musanti
|
53,000
|
|
(2)
|
25,213
|
|
—
|
|
|
78,213
|
|
||
|
George Morgenstern
|
43,000
|
|
|
25,213
|
|
60,942
|
|
(3)
|
129,155
|
|
||
|
Samuel M. Zentman
|
43,000
|
|
|
25,213
|
|
—
|
|
68,213
|
|
|||
|
Richard J. Giacco
|
42,000
|
|
|
25,213
|
|
—
|
|
67,213
|
|
|||
|
Richard Rimer
|
43,000
|
|
|
25,213
|
|
—
|
|
|
68,213
|
|
||
|
Steven Ledger (4)
|
20,000
|
|
|
—
|
|
—
|
|
|
20,000
|
|
||
|
Christopher E. Clouser (5)
|
5,000
|
|
|
56,886
|
|
—
|
|
|
61,886
|
|
||
|
(1)
|
On October 17, 2011, Joe Musanti, George Morgenstern, Samuel M. Zentman, Richard J. Giacco and Richard Rimer were each granted 10,000 options to acquire stock in the Company. The options have an exercise price of $5.37 and expire on October 17, 2018. The fair value of the options was determined using the Black-Scholes option pricing model using the following assumptions: (i) a risk-free interest rate of 1.65% (ii) an expected term of 6.3 years (iii) an assumed volatility of 62% and (iv) an annual rate of quarterly dividends of 2.61%. On November 16, 2011, Christopher E. Clouser was granted 25,000 options to acquire stock in the Company. The options have an exercise price of $4.96 and expire on November 16, 2018. The fair value of the options was determined using the Black-Scholes option pricing model using the following assumptions: (i) a risk-free interest rate of 1.44% (ii) an expected term of 6.3 years (iii) an assumed volatility of 62% and (iv) an annual rate of quarterly dividends of 2.82%. All options awarded to directors in 2011 remained outstanding at fiscal year-end. As of December 31, 2011, the number of stock options held by each of the above persons was: Joe Musanti, 65,000; George Morgenstern, 257,500; Samuel M. Zentman, 72,500; Richard Giacco, 75,000; Richard Rimer, 125,000; Steven Ledger, 25,000; and Christopher E. Clouser, 25,000.
|
|
(2)
|
Includes $10,000 Mr. Musanti received for services rendered as the Chairman of the Audit Committee.
|
|
(3)
|
Mr. Morgenstern received a non-accountable expense allowance of $60,942 to cover travel and other expenses pursuant to a consulting agreement.
|
|
(4)
|
Mr. Ledger resigned from his position on the Board on May 2, 2011.
|
|
(5)
|
Mr. Clouser was appointed to be a Director on November 16, 2011.
|
72
Compensation Committee Interlocks and Insider Participation
All members of the Compensation Committee of the Board of Directors during the fiscal year ended December 31, 2011, and all members of the Board who approved, or recommended for approval, all action with respect to the compensation of our executive officers prior to the formation of the Compensation Committee in October 2011, were independent directors and none of them were our employees or our former employees. During the fiscal year ended December 31, 2011, none of our executive officers served on the Compensation Committee (or equivalent), or the board of directors, of another entity whose executive officers served on the Compensation Committee of our Board of Directors.
Compensation Committee Report
The Compensation Committee has reviewed and discussed the Compensation Discussion and Analysis required by Item 402(b) of Regulation S-K with management. Based on such review and discussions, the Compensation Committee recommended to the Board of Directors that the Compensation Discussion and Analysis be included in this annual report on Form 10-K.
Richard Giacco
Joseph Musanti
73
|
ITEM 12.
|
SECURITY OWNERSHIP OF CERTAIN BENEFICIAL OWNERS AND MANAGEMENT AND RELATED STOCKHOLDER MATTERS
|
The following table and the notes thereto set forth information, as of March 1, 2012 (except as otherwise set forth herein), concerning beneficial ownership (as defined in Rule 13d-3 under the Securities Exchange Act of 1934) of common stock by (i) each director of the Company, (ii) each executive officer (iii) all executive officers and directors as a group, and (iv) each holder of 5% or more of the Company’s outstanding shares of common stock.
|
Name and Address of Beneficial Owner (1) (2)
|
Number of Shares of common stock Beneficially Owned (2)
|
|
Percentage of common stock Outstanding (2)
|
||
|
George Morgenstern
|
358,861
|
|
(3)
|
2.0%
|
|
|
John A. Moore
|
1,193,578
|
|
(4)
|
6.6%
|
|
|
Richard J. Giacco
|
96,000
|
|
(5)
|
*
|
|
|
Joseph Musanti
|
61,200
|
|
(6)
|
*
|
|
|
Richard Rimer
|
155,000
|
|
(7)
|
*
|
|
|
Samuel M. Zentman
|
113,370
|
|
(8)
|
*
|
|
|
Christopher E. Clouser
|
19,452
|
|
(9)
|
*
|
|
|
Michael Barth
|
107,183
|
|
(10)
|
*
|
|
|
Heather K. Mallard
|
—
|
|
—
|
||
|
Benny Sela
|
10,000
|
|
(11)
|
*
|
|
|
Lindon Shiao
|
5,684
|
|
(12)
|
*
|
|
|
Deena Redding
|
—
|
|
—
|
||
|
Jim Andersen
|
—
|
|
(13)
|
—
|
|
|
All executive officers and directors of the Company as a group (13 people)
|
2,120,328
|
|
(14)
|
11.3%
|
|
|
Columbia Wanger Asset Management, LLC
|
2,455,000
|
|
(15)
|
13.8%
|
|
|
Verition Fund Management LLC
|
888,541
|
|
(16)
|
5.0%
|
|
* Less than 1%
|
(1)
|
Unless otherwise indicated, the address for each of the beneficial owners listed in the table is in care of the Company, 4 West Rockland Road, Montchanin, Delaware 19710.
|
|
(2)
|
Unless otherwise indicated, each person has sole investment and voting power with respect to the shares indicated. For purposes of this table, a person or group of persons is deemed to have “beneficial ownership” of any shares as of a given date which such person has the right to acquire within 60 days after such date. Percentage information is based on the 17,743,772 shares outstanding as of March 1, 2012 (exclusive of 801,920 treasury shares outstanding).
|
|
(3)
|
Consists of 61,922 shares, 247,500 shares underlying currently exercisable options, and 49,439 shares owned by Mr. Morgenstern’s wife.
|
|
(4)
|
Consists of 851,912 shares (2,800 of which are held in an IRA account) and 329,166 shares underlying currently exercisable options.
|
|
(5)
|
Consists of 31,000 shares and 65,000 shares underlying currently exercisable options.
|
|
(6)
|
Consists of 6,200 shares and 55,000 shares underlying currently exercisable options.
|
|
(7)
|
Consists of 40,000 shares and 115,000 shares underlying currently exercisable options.
|
|
(8)
|
Consists of 50,870 shares and 62,500 shares underlying currently exercisable options.
|
|
(9)
|
Consists solely of shares.
|
|
(10)
|
Consists of 32,183 shares and 75,000 shares underlying currently exercisable options. Mr. Barth also owns 56,900 shares of DSIT representing approximately 4.0% of the DSIT’s outstanding shares.
|
|
(11)
|
Consists of 10,000 shares underlying currently exercisable options. Mr. Sela also owns 92,500 shares of DSIT representing approximately 6.5% of the DSIT’s outstanding shares.
|
|
(12)
|
Consists solely of shares.
|
|
(13)
|
Mr. Andersen does not own any shares of Acorn stock nor does he have any options to purchase Acorn stock. Mr. Andersen owns 370,000 shares of USSI, representing approximately 7.7% of the USSI’s outstanding shares as of March 1, 2012.
|
|
(14)
|
Consists of 1,148,662 shares and 959,166 shares underlying currently exercisable options.
|
74
|
(15)
|
The information presented with respect to this beneficial owner is based on a Schedule 13G filed with the SEC on February 10, 2012. The business address for Columbia Wanger Asset Management, LLC is 227 West Monroe Street, Suite 3000, Chicago, IL 60606.
|
|
(16)
|
The information presented with respect to this beneficial owner is based on a Schedule 13G filed with the SEC on January
|
6, 2012. The business address for Verition Fund Management LLC is One American Lance, Greenwich CT 06831.
EQUITY COMPENSATION PLAN INFORMATION
The table below provides certain information concerning our equity compensation plans as of December 31, 2011.
|
Plan Category
|
Number of Securities to be Issued Upon Exercise of Outstanding Options, Warrants and Rights (a)
|
Weighted-average Exercise Price of Outstanding Options, Warrants and Rights
|
Number of Securities Remaining Available for Future Issuance Under Equity Compensation Plans (Excluding Securities Reflected in Column (a))
|
|||||||
|
Equity Compensation Plans Approved by Security Holders
|
602,386
|
|
$
|
4.10
|
|
1,193,115
|
|
|||
|
Equity Compensation Plans Not Approved by Security Holders
|
545,833
|
|
$
|
4.24
|
|
—
|
|
|||
|
Total
|
1,148,219
|
|
$
|
4.17
|
|
1,193,115
|
|
|||
The grants made under our equity compensation plans not approved by security holders were made under non-plan option agreements and under our 2006 Stock Incentive Plan and 2006 Stock Option Plan for Non-Employee Directors during the period from the adoption of such plans in January 2007 and the date of the approval of such plans by shareholders in November 2008. These grants were made to directors, officers, employees and consultants at exercise prices equal to the fair market value on the date of the grant. The options generally vest over a three year period and expire five to ten years from the date of the grant.
75
|
ITEM 13.
|
CERTAIN RELATIONSHIPS, RELATED TRANSACTIONS AND DIRECTOR INDEPENDENCE
|
Transactions With Related Persons
We paid approximately $309,000, $393,000 and $275,000 in the years ended December 31, 2011, 2010 and 2009, respectively, for legal services rendered and reimbursement of out-of-pocket expenses to Eilenberg & Krause LLP, a law firm in which Sheldon Krause, our Assistant Secretary and former General Counsel, is a member. Such fees related to services rendered by Mr. Krause and other members and employees of his firm. Mr. Krause is the son-in-law of George Morgenstern, a director and our Chairman Emeritus, who up until March 2006, also served as our President and Chief Executive Officer. Mr. Krause continues to provide legal services to us in 2012.
In November 2010, the CEO of GridSense lent GridSense $50,000. In 2010, $12,000 of the loan was repaid with the balance being repaid in 2011. The loan from the CEO of GridSense bore no interest.
We entered into a Consulting Agreement effective January 1, 2012 with Richard Rimer pursuant to which Mr. Rimer will work with our operating companies in developing and monitoring their business plans, provide investor relations services in Europe and help identify acquisition and partnership opportunities. The agreement is for a term of six months ending June 30, 2012, and provides that our Board of Directors will determine whether to renew the agreement for an additional period of six months upon expiration. Either party may, however, terminate the agreement at any time without penalty. Mr. Rimer will receive total compensation of $125,000 for the six-month period assuming no early termination, payable in two installments. He also is entitled to be reimbursed certain expenses in connection with the performance of his services, subject to prior approval by our Chief Executive Officer in the case of travel and entertainment costs. During the period of this Consulting Agreement, Mr. Rimer continues to receive regular director compensation retainer and meeting fees as noted above.
Director Independence
Applying the definition of independence provided under the NASDAQ rules, the Board has determined that with the exception of Mr. Moore and Mr. Rimer during the period of his consulting agreement, all of the members of the Board of Directors are independent.
76
|
ITEM 14.
|
PRINCIPAL ACCOUNTING FEES AND SERVICES
|
Accounting Fees
Friedman LLP
The following table summarized the fees billed to Acorn for professional services rendered by Friedman LLP for the years ended December 31, 2010 and 2011.
|
|
2010
|
2011
|
|||||
|
Audit Fees
|
$
|
240,000
|
|
$
|
175,000
|
|
|
|
Audit- Related Fees
|
6,000
|
|
9,000
|
|
|||
|
Tax Fees
|
3,000
|
|
—
|
|
|||
|
Other Fees
|
19,000
|
|
5,000
|
|
|||
|
Total
|
$
|
268,000
|
|
$
|
189,000
|
|
|
Audit Fees
were for professional services rendered for the audits of the consolidated financial statements of the Company, assistance with review of documents filed with the SEC, consents, and other assistance required to be performed by our independent accountants.
Audit-Related Fees
were for travel costs associated with our audit.
Tax Fees
were for tax planning advice for one of our subsidiaries.
Other Fees
were for due diligence services related to our GridSense acquisition and for a consent with respect to our capital raise.
Pre-Approval Policies and Procedures
The Audit Committee’s current policy is to pre-approve all audit and non-audit services that are to be performed and fees to be charged by our independent auditor to assure that the provision of these services does not impair the independence of the auditor. The Audit Committee pre-approved all audit and non-audit services rendered by our principal accountant in 2011 and 2010.
77
|
ITEM 15.
|
EXHIBITS AND FINANCIAL STATEMENT SCHEDULES
|
(a)(1) List of Financial Statements of the Registrant
The consolidated financial statements of the Registrant and the report thereon of the Registrant’s Independent Registered Public Accounting Firms are included in this Annual Report beginning on page F-1.
|
Report of Friedman LLP
|
|
Report of Kesselman & Kesselman
|
|
Consolidated Balance Sheets as of December 31, 2010 and 2011
|
|
Consolidated Statements of Operations
|
|
Consolidated Statements of Changes in Equity
|
|
Consolidated Statements of Cash Flows
|
|
Notes to Consolidated Financial Statements
|
(a)(3) List of Exhibits
|
No.
|
|
|
#3.1
|
Amended and Restated Certificate of Incorporation of the Registrant.
|
|
3.2
|
By laws of the Registrant (incorporated herein by reference to Exhibit 3.2 to the Registrant’s Registration Statement on Form S 1 (File No. 33 44027) (the “1992 Registration Statement”)).
|
|
3.3
|
Amendments to the By Laws of the Registrant adopted December 27, 1994 (incorporated herein by reference to Exhibit 3.3 of the Registrant’s Current Report on Form 8-K dated January 10, 1995).
|
|
4.1
|
Specimen certificate for the common stock (incorporated herein by reference to Exhibit 4.2 to the 1992 Registration Statement).
|
|
4.2
|
Form of Warrant (incorporated herein by reference to Exhibit 4.1 to the Registrant’s Quarterly Report on Form 10-Q for the quarter ended June 30, 2006).
|
|
4.3
|
Form of Convertible Debenture (incorporated herein by reference to Exhibit 4.9 to the Registrant’s Annual Report on Form 10-K for the fiscal year ended December 31, 2006).
|
|
4.4
|
Form of Warrant (incorporated herein by reference to Exhibit 4.10 to the Registrant’s Annual Report on Form 10-K for the fiscal year ended December 31, 2006).
|
|
4.5
|
Form of Agent Warrant (incorporated herein by reference to Exhibit 4.3 to the Registrant’s Quarterly Report on Form 10-Q for the quarter ended March 31, 2007).
|
|
4.6
|
Form of Placement Agent Warrant (incorporated herein by reference to Exhibit 4.1 of the Registrant’s Current Report on Form 8-K dated December 20, 2010).
|
|
10.1
|
1994 Stock Incentive Plan, as amended. (incorporated herein by reference to Exhibit 10.4 to the Registrant’s Annual Report on Form 10-K for the year ended December 31, 2004 (the “2004 10-K”)).*
|
|
10.2
|
1994 Stock Option Plan for Outside Directors, as amended (incorporated herein by reference to Exhibit 10.5 to the Registrant’s Form 10-K for the year ended December 31, 1995 (the “1995 10- K”)).*
|
|
10.3
|
1995 Stock Option Plan for Non-management Employees, as amended (incorporated herein by reference to Exhibit 10.6 to the 2004 10-K).*
|
78
|
10.4
|
Form of Stock Option Agreement to employees under the 1994 Stock Incentive Plan (incorporated herein by reference to Exhibit 10.35 of the Registrant’s Annual Report on Form 10-K for the year ended December 31, 2004 (the “2004 10-K”).*
|
|
10.5
|
Form of Stock Option Agreement under the 1994 Stock Option Plan for Outside Directors (incorporated herein by reference to Exhibit 10.36 of the 2004 10-K).*
|
|
10.6
|
Form of Stock Option Agreement under the 1995 Stock Option Plan for Nonmanagement Employees (incorporated herein by reference to Exhibit 10.37 of the 2004 10-K).
|
|
10.7
|
Stock Option Agreement dated as of December 30, 2004 by and between George Morgenstern and the Registrant (incorporated herein by reference to Exhibit 10.38 of the 2004 10-K).*
|
|
10.8
|
Stock Option Agreement dated as of December 30, 2004 by and between Sheldon Krause and the Registrant (incorporated herein by reference to Exhibit 10.35 of the 2004 10-K).*
|
|
10.9
|
Stock Purchase Agreement dated as of March 9, 2006 by and between Shlomie Morgenstern, Databit Inc., and the Registrant (incorporated herein by reference to Exhibit 10.1 to the Registrant’s Current Report on Form 8-K dated March 16, 2006 (the “2006 8-K”)).
|
|
10.10
|
Amendment Agreement to Option Agreements and Restricted Stock Agreement dated as of March 9, 2006 by and between George Morgenstern and the Registrant (incorporated herein by reference to Exhibit D to Exhibit 10.1 to the Registrant’s Current Report on Form 8-K dated March 16, 2006 (the “2006 8-K”)).*
|
|
10.11
|
Consulting Agreement dated as of March 9, 2006 by and between George Morgenstern and the Registrant (incorporated by reference to Exhibit E to Exhibit 10.1 to the 2006 8-K).*
|
|
10.12
|
Form of Common Stock Purchase Agreement (incorporated herein by reference to Exhibit 10.1 to the Registrant’s Current Report on Form 8-K dated August 17, 2006 (the “August 2006 8-K”)).
|
|
10.13
|
Form of Note Purchase Agreement with Form of Convertible Promissory Note attached (incorporated herein by reference to Exhibit 10.2 to the August 2006 8-K).
|
|
10.14
|
Form of Stock Purchase Agreement (incorporated herein by reference to Exhibit 10.3 to the August 2006 8-K).
|
|
10.15
|
Form of Investors’ Rights Agreement (incorporated herein by reference to Exhibit 10.4 to the August 2006 8-K).
|
|
10.16
|
Form of Non-Plan Option Agreement (incorporated herein by reference to Exhibit 10.5 to the August 2006 8-K).*
|
|
10.17
|
Acorn Factor, Inc. 2006 Stock Option Plan for Non-Employee Directors (incorporated herein by reference to Exhibit 10.1 to the Registrant’s Current Report on Form 8-K filed March 6, 2007).*
|
|
10.18
|
Acorn Energy, Inc. 2006 Amended and Restated Stock Incentive Plan (as amended and restated effective June 10, 2010) (incorporated herein by reference to Exhibit 10.1 to the Registrant’s Current Report on Form 8-K filed June 16, 2010).*
|
|
10.19
|
Placement Agent Agreement between First Montauk Securities Corp. and the Registrant dated March 8, 2007 (incorporated herein by reference to Exhibit 10.48 to the Registrant’s Annual Report on Form 10-K for the year ended December 31, 2006).
|
|
10.20
|
Employment Agreement, dated as of March 4, 2008, by and between Acorn Energy, Inc. and John A. Moore (incorporated herein by reference to Exhibit 10.1 to the Registrant’s Quarterly Report on Form 10-Q for the quarter ended March 31, 2008).*
|
|
10.21
|
Acorn Energy, Inc. 2006 Stock Option Plan For Non-Employee Directors (as amended and restated effective November 3, 2008)
(incorporated herein by reference to Appendix B to the Registrant’s Definitive Proxy Statement on Schedule 14A filed on October 8, 2008)*
|
79
|
10.22
|
Form of Option Agreement between the Registrant and John A. Moore dated March 4, 2008 (incorporated herein by reference to Exhibit 10.52 to Registrant’s Annual Report on Form 10-K for the fiscal year ended December 31, 2008).*
|
|
10.23
|
Amendment dated as of March 31, 2009 by and between George Morgenstern and the Registrant to the Consulting Agreement dated as of March 9, 2006 by and between George Morgenstern and the Registrant (incorporated herein by reference to Exhibit 10.2 to Registrant’s Quarterly Report on Form 10-Q for the quarter ended March 31, 2009).*
|
|
10.24
|
Form of Letter of Intent by and among Registrant, Gridsense Pty Ltd and certain shareholders of Gridsense Pty Ltd named therein dated October 29, 2009 (incorporated herein by reference to Exhibit 10.50 to Registrant’s Annual Report on Form 10-K for the year ended December 31, 2009).
|
|
10.25
|
Form of Arrangement Agreement by and among the Registrant, Coreworx Inc. and Decision Dynamics Technology LTD dated as of March 2, 2010 (incorporated herein by reference to Exhibit 10.51 to Registrant’s Annual Report on Form 10-K for the year ended December 31, 2009).
|
|
10.26
|
Forms of Option Award Certificate and Option Award Agreement under the Registrant’s Amended and Restated 2006 Stock Incentive Plan (incorporated herein by reference to Exhibit 10.52 to Registrant’s Annual Report on Form 10-K for the year ended December 31, 2009).
|
|
10.27
|
Forms of Option Award Certificate and Option Award Agreement under the Registrant’s Amended and Restated 2006 Stock Option Plan for Non-Employee Directors (incorporated herein by reference to Exhibit 10.53 to Registrant’s Annual Report on Form 10-K for the year ended December 31, 2009).
|
|
10.28
|
Placement Agency Agreement between the Registrant and Merriman Curhan Ford & Co. dated as of March 8, 2010 (incorporated herein by reference to Exhibit 1.1 to the Registrant’s Current Report on Form 8-K dated March 8, 2010).
|
|
10.29
|
Form of Investor Purchase Agreement (incorporated herein by reference to Exhibit 1.2 to the Registrant’s Current Report on Form 8-K dated March 8, 2010).
|
|
10.30
|
Common Stock Option Purchase Agreement between the Registrant and US Sensor Systems Inc. dated as of February 23, 2010 (incorporated herein by reference to Exhibit 10.1 to the Registrant’s Quarterly Report on Form 10-Q for the quarter ended March 31, 2010).
|
|
10.31
|
Capital Stock Option Purchase Agreement by and among the Registrant, US Sensor Systems Inc. and other parties named therein dated as of February 23, 2010 (incorporated herein by reference to Exhibit 10.2 to the Registrant’s Quarterly Report on Form 10-Q for the quarter ended March 31, 2010).
|
|
10.32
|
Stockholders Agreement by and among the Registrant, US Sensor Systems Inc. and other parties named therein dated as of February 23, 2010 (incorporated herein by reference to Exhibit 10.3 to the Registrant’s Quarterly Report on Form 10-Q for the quarter ended March 31, 2010).
|
|
10.33
|
Amended and Restated Investors Rights Agreement by and among the Registrant, US Sensor Systems Inc. and other parties named therein dated as of February 23, 2010 (incorporated herein by reference to Exhibit 10.4 to the Registrant’s Quarterly Report on Form 10-Q for the quarter ended March 31, 2010).
|
|
10.34
|
Share Sale Agreement by and among the Registrant, GridSense Pty Ltd and the other parties named therein dated as of April 28, 2010. (incorporated herein by reference to Exhibit 10.60 to the Registrant's Annual Report on Form 10-K for the year ended December 31, 2010).
|
|
10.35
|
Amended and Restated Loan and Security Agreement by and among CoaLogix Solutions Inc., CoaLogix Tech LLC, SCR-Tech, LLC, CoaLogix Technology Holdings Inc., Metallifix LLC and Square 1 Bank dated as of July 22, 2010.(incorporated herein by reference to Exhibit 10.61 to the Registrant's Annual Report on Form 10-K for the year ended December 31, 2010).
|
|
10.36
|
Share Exchange Agreement by and between the Registrant and Coreworx Inc. dated as of December 17, 2010. (incorporated herein by reference to Exhibit 10.62 to the Registrant's Annual Report on Form 10-K for the year ended December 31, 2010).
|
80
|
10.37
|
Debt Conversion Agreement by and between the Registrant and Coreworx Inc. dated as of December 17, 2010. (incorporated herein by reference to Exhibit 10.63 to the Registrant's Annual Report on Form 10-K for the year ended December 31, 2010).
|
|
10.38
|
Amended and Restated Loan Agreement by and between the Registrant and Coreworx Inc. dated as of December 17, 2010. (incorporated herein by reference to Exhibit 10.64 to the Registrant's Annual Report on Form 10-K for the year ended December 31, 2010).
|
|
10.39
|
Placement Agent Agreement, dated as of December 17, 2010, by and between the Registrant and HFP Capital Markets LLC (incorporated herein by reference to Exhibit 1.1 of the Registrant’s Current Report on Form 8-K dated December 20, 2010).
|
|
10.40
|
Form of Subscription Agreement (incorporated herein by reference to Exhibit 1.2 of the Registrant’s Current Report on Form 8-K dated December 20, 2010).
|
|
10.41
|
Amended Subscription Agreement by and among the Registrant, Samuel M. Zentman and other parties named therein dated as of January 12, 2011 (incorporated herein by reference to Exhibit 10.1 to the Registrant's Quarterly Report on Form 10-Q for the quarter ended March 31, 2011).
|
|
10.42
|
Amended Subscription Agreement by and among the Registrant, Joe B. Cogdell, Jr. and other parties named therein dated as of January 12, 2011 (incorporated herein by reference to Exhibit 10.2 to the Registrant's Quarterly Report on Form 10-Q for the quarter ended March 31, 2011).
|
|
10.43
|
Amendment to Employment Agreement by and between the Registrant and John A. Moore dated March 15, 2011 (incorporated herein by reference to Exhibit 10.3 to the Registrant's Quarterly Report on Form 10-Q for the quarter ended March 31, 2011).*
|
|
10.44
|
Amendment to Amended and Restated Non-Plan Stock Option Agreement by and between the Registrant and John A. Moore dated March 10, 2011 (incorporated herein by reference to Exhibit 10.4 to the Registrant's Quarterly Report on Form 10-Q for the quarter ended March 31, 2011).*
|
|
10.45
|
Amendment to Amended and Restated Non-Plan Stock Option Agreement by and between the Registrant and John A. Moore dated March 10, 2011 (incorporated herein by reference to Exhibit 10.5 to the Registrant's Quarterly Report on Form 10-Q for the quarter ended March 31, 2011).*
|
|
10.46
|
Amendment to Amended and Restated Non-Plan Stock Option Agreement by and between the Registrant and Samuel M. Zentman dated March 30, 2011 (incorporated herein by reference to Exhibit 10.6 to the Registrant's Quarterly Report on Form 10-Q for the quarter ended March 31, 2011).*
|
|
#10.47
|
Form of Indemnification Agreement.*
|
|
#10.48
|
Amendment to Acorn Energy, Inc. 2006 Stock Incentive Plan and Acorn Energy, Inc. 2006 Stock Option Plan For Non-Employee Directors.*
|
|
#10.49
|
Stock Purchase and Contribution Agreement, dated as of July 28, 2011, by and among the Registrant, the other sellers named therein, CoaLogix, Inc. and Coalogix Holdings, Inc. (confidential portions of this exhibit have been redacted and filed separately with the Commission pursuant to a confidential treatment request in accordance with Rule 24b-2 promulgated under the Securities Exchange Act of 1934, as amended).
|
|
#10.50
|
Amendment No.1 to Stock Purchase and Contribution Agreement, dated as of August 31, 2011, by and among the Registrant, the other sellers named therein and CoaLogix Holdings, Inc. (confidential portions of this exhibit have been redacted and filed separately with the Commission pursuant to a confidential treatment request in accordance with Rule 24b-2 promulgated under the Securities Exchange Act of 1934, as amended).
|
|
#10.51
|
Letter Agreement, dated August 31, 2011, between the Registrant and CoaLogix Holdings, Inc., regarding executive employment agreements.*
|
|
#10.52
|
Secondment Agreement, dated August 31, 2011 between the Registrant and CoaLogix Holdings, Inc., regarding Joe B. Cogdell, Jr.*
|
81
|
#10.53
|
Escrow Agreement, dated August 31, 2011, by and among the Registrant, EnerTech Capital Partners III LP, CoaLogix Holdings, Inc., and the other parties listed therein (confidential portions of this exhibit have been redacted and filed separately with the Commission pursuant to a confidential treatment request in accordance with Rule 24b-2 promulgated under the Securities Exchange Act of 1934, as amended).
|
|
#10.54
|
Letter Agreement between the Registrant and Richard Rimer dated December 12, 2011.*
|
|
#10.55
|
Amendment of Consulting Agreement between the Registrant and George Morgenstern dated March 15, 2011
|
|
14.1
|
Code of Business Conduct and Ethics of the Registrant (incorporated herein by reference to Exhibit 14 to the Registrant’s Current Report on Form 8-K filed November 2, 2007).
|
|
#21.1
|
List of subsidiaries.
|
|
#23.1
|
Consent of Friedman LLP.
|
|
#23.2
|
Consent of Kesselman & Kesselman CPA.
|
|
#31.1
|
Certification of Chief Executive Officer pursuant to Section 302 of the Sarbanes-Oxley Act of 2002.
|
|
#31.2
|
Certification of Chief Financial Officer pursuant to Section 302 of the Sarbanes-Oxley Act of 2002.
|
|
#32.1
|
Certification of Chief Executive Officer pursuant to Section 906 of the Sarbanes-Oxley Act of 2002.
|
|
#32.2
|
Certification of Chief Financial Officer pursuant to Section 906 of the Sarbanes-Oxley Act of 2002.
|
|
#101.1
|
The following financial statements from Acorn Energy's Form 10-K for the year ended December 31, 2011, filed on March 15, 2012, formatted in XBRL (eXtensible Business Reporting Language): (i) Consolidated Balance Sheets, (ii) Consolidated Statements of Operations, (iii) Consolidated Statements of Changes in Equity (iv) Consolidated Statements of Cash Flows, and (v) Notes to Consolidated Financial Statements, tagged as blocks of text.
|
|
*
|
This exhibit includes a management contract, compensatory plan or arrangement in which one or more directors or executive officers of the Registrant participate.
|
|
#
|
This exhibit is filed or furnished herewith.
|
82
SIGNATURES
Pursuant to the requirements of Section 13 or 15(d) of the Securities Exchange Act of 1934, the Registrant has duly caused this report to be signed on its behalf by the undersigned, thereunto duly authorized, in the Township of Montchanin, State of Delaware, on
March 15, 2012
.
|
ACORN ENERGY, INC.
|
|
|
|
|
|
|
|
|
/s/ John A. Moore
|
|
|
By:
|
John A. Moore
|
|
|
Chairman of the Board; President and Chief Executive Officer
|
Pursuant to the requirements of the Securities Exchange Act of 1934, this report has been signed by the following persons on behalf of the registrant, in the capacities and on the dates indicated.
|
Signature
|
|
Title
|
|
Date
|
|
|
|
|
|
|
|
/s/ John A. Moore
|
|
Chairman of the Board; President; Chief Executive Officer; and Director
|
|
March 15, 2012
|
|
John A. Moore
|
|
|
||
|
|
|
|
|
|
|
/s/ Michael Barth
|
|
Chief Financial Officer (Principal Financial Officer and Principal Accounting Officer)
|
|
March 15, 2012
|
|
Michael Barth
|
|
|
|
|
|
/s/ George Morgenstern
|
|
Director
|
|
March 15, 2012
|
|
George Morgenstern
|
|
|
||
|
|
|
|
|
|
|
|
Director
|
|
||
|
Samuel M. Zentman
|
|
|
|
|
|
|
|
|
|
|
|
/s/ Richard J. Giacco
|
|
Director
|
|
March 15, 2012
|
|
Richard J. Giacco
|
|
|
|
|
|
|
|
|
|
|
|
/s/ Richard Rimer
|
|
Director and Vice-Chairman of the Board
|
|
March 15, 2012
|
|
Richard Rimer
|
|
|
|
|
|
|
|
|
|
|
|
/s/ Joe Musanti
|
|
Director
|
|
March 15, 2012
|
|
Joe Musanti
|
|
|
|
|
|
|
|
|
|
|
|
/s/ Christopher E. Clouser
|
|
Director
|
|
March 15, 2012
|
|
Christopher E. Clouser
|
|
|
|
|
83
ACORN ENERGY, INC.
AND SUBSIDIARIES
INDEX TO CONSOLIDATED FINANCIAL STATEMENTS
1
Report of Independent Registered Public Accounting Firm
To the Board of Directors and Shareholders of
Acorn Energy, Inc.
We have audited the accompanying balance sheets of Acorn Energy, Inc. and its subsidiaries (the "Company") as of
December 31, 2011
and 2010 and the related consolidated statements of operations, stockholders’ equity and comprehensive income and cash flows for each of the two years ended
December 31, 2011
. We also have audited the Company’s internal control over financial reporting as of
December 31, 2011
, based on criteria established in
Internal Control—Integrated Framework
issued by the Committee of Sponsoring Organizations of the Treadway Commission (COSO). The Company’s management is responsible for these financial statements, for maintaining effective internal control over financial reporting, and for its assessment of the effectiveness of internal control over financial reporting, included in the accompanying Management’s Report on Internal Control over Financial Reporting, appearing in Item 9A. Our responsibility is to express an opinion on these financial statements and an opinion on the company’s internal control over financial reporting based on our audits.
We conducted our audits in accordance with the standards of the Public Company Accounting Oversight Board (United States). Those standards require that we plan and perform the audits to obtain reasonable assurance about whether the financial statements are free of material misstatement and whether effective internal control over financial reporting was maintained in all material respects. Our audits of the financial statements included examining, on a test basis, evidence supporting the amounts and disclosures in the financial statements, assessing the accounting principles used and significant estimates made by management, and evaluating the overall financial statement presentation. Our audit of internal control over financial reporting included obtaining an understanding of internal control over financial reporting, assessing the risk that a material weakness exists, and testing and evaluating the design and operating effectiveness of internal control based on the assessed risk. Our audits also included performing such other procedures as we considered necessary in the circumstances. We believe that our audits provide a reasonable basis for our opinions.
A company’s internal control over financial reporting is a process designed to provide reasonable assurance regarding the reliability of financial reporting and the preparation of financial statements for external purposes in accordance with generally accepted accounting principles. A company’s internal control over financial reporting includes those policies and procedures that (1) pertain to the maintenance of records that, in reasonable detail, accurately and fairly reflect the transactions and dispositions of the assets of the company; (2) provide reasonable assurance that transactions are recorded as necessary to permit preparation of financial statements in accordance with generally accepted accounting principles, and that receipts and expenditures of the company are being made only in accordance with authorizations of management and directors of the company; and (3) provide reasonable assurance regarding prevention or timely detection of unauthorized acquisition, use, or disposition of the company’s assets that could have a material effect on the financial statements.
Because of its inherent limitations, internal control over financial reporting may not prevent or detect misstatements. Also, projections of any evaluation of effectiveness to future periods are subject to the risk that controls may become inadequate because of changes in conditions, or that the degree of compliance with the policies or procedures may deteriorate.
In our opinion, the financial statements referred to above present fairly, in all material respects, the financial position of the Company as of
December 31, 2011
and 2010 and the results of its operations and its cash flows for each of the two years ended
December 31, 2011
in conformity with accounting principles generally accepted in the United States of America. Also in our opinion, the Company. maintained, in all material respects, effective internal control over financial reporting as of
December 31, 2011
, based on criteria established in
Internal Control—Integrated Framework
issued by the Committee of Sponsoring Organizations of the Treadway Commission (COSO).
/s/ Friedman LLP
East Hanover, New Jersey
March 15, 2012
F- 1
Report of Independent Registered Public Accounting Firm
To the Board of Directors and Shareholders of
Acorn Energy, Inc.
We have audited the consolidated statement of operations, changes in equity and cash flows of Acorn Energy, Inc. (the “Company”) and its subsidiaries for the year ended December 31, 2009. These financial statements are the responsibility of the Company's Board of Directors and management. Our responsibility is to express an opinion on these financial statements based on our audits.
We conducted our audits in accordance with the standards of the Public Company Accounting Oversight Board (United States). Those standards require that we plan and perform the audit to obtain reasonable assurance about whether the financial statements are free of material misstatement. An audit includes examining, on a test basis, evidence supporting the amounts and disclosures in the financial statements. An audit also includes assessing the accounting principles used and significant estimates made by the Company's Board of Directors and management, as well as evaluating the overall financial statement presentation. We believe that our audits provide a reasonable basis for our opinion.
In our opinion, the financial statements referred to above present fairly, in all material respects, the results of operations and cash flows of the Company and its subsidiaries for the year ended December 31, 2009, in conformity with accounting principles generally accepted in the United States of America.
As discussed in Note 2 to the consolidated financial statements, the Company changed the manner in which it accounts for non-controlling interests as of January 1, 2009
March 22, 2010, except for Note 5(b) which is as of March 16, 2011 and Notes 3(b) and 18(g) which are as of March 15, 2012.
/s/ Kesselman & Kesselman
Certified Public Accountants
A member of PricewaterhouseCoopers International Limited
Tel-Aviv, Israel
F- 2
ACORN ENERGY, INC. AND SUBSIDIARIES
(IN THOUSANDS, EXCEPT SHARE AND PER SHARE DATA)
|
|
As of December 31,
|
|||||||
|
|
2010
|
2011
|
||||||
|
ASSETS
|
|
|
||||||
|
Current assets:
|
|
|
||||||
|
Cash and cash equivalents
|
$
|
6,549
|
|
$
|
34,280
|
|
||
|
Short-term deposits
|
—
|
|
18,000
|
|
||||
|
Restricted deposit
|
1,317
|
|
2,223
|
|
||||
|
Funds held in escrow
|
—
|
|
5,961
|
|
||||
|
Accounts receivable
|
5,273
|
|
4,965
|
|
||||
|
Unbilled revenue
|
3,806
|
|
3,778
|
|
||||
|
Inventory
|
1,114
|
|
2,144
|
|
||||
|
Other current assets
|
333
|
|
922
|
|
||||
|
Current assets of discontinued operations
|
9,424
|
|
—
|
|
||||
|
Total current assets
|
27,816
|
|
72,273
|
|
||||
|
Property and equipment, net
|
490
|
|
635
|
|
||||
|
Severance assets
|
2,498
|
|
2,620
|
|
||||
|
Restricted deposit
|
85
|
|
271
|
|
||||
|
Intangible assets, net
|
5,339
|
|
4,780
|
|
||||
|
Goodwill
|
4,679
|
|
4,637
|
|
||||
|
Deferred taxes
|
302
|
|
440
|
|
||||
|
Other assets
|
378
|
|
149
|
|
||||
|
Non-current assets of discontinued operations
|
18,198
|
|
—
|
|
||||
|
Total assets
|
$
|
59,785
|
|
$
|
85,805
|
|
||
|
LIABILITIES AND EQUITY
|
|
|
|
|
||||
|
Current liabilities:
|
|
|
|
|
||||
|
Short-term bank credit and current maturities of long-term debt
|
$
|
1,308
|
|
$
|
677
|
|
||
|
Accounts payable
|
2,578
|
|
2,052
|
|
||||
|
Accrued payroll, payroll taxes and social benefits
|
1,531
|
|
1,907
|
|
||||
|
Other current liabilities
|
3,428
|
|
7,420
|
|
||||
|
Current liabilities of discontinued operations
|
4,372
|
|
—
|
|
||||
|
Total current liabilities
|
13,217
|
|
12,056
|
|
||||
|
Long-term liabilities:
|
|
|
|
|
||||
|
Accrued severance
|
3,715
|
|
3,837
|
|
||||
|
Long-term debt
|
302
|
|
141
|
|
||||
|
Other long-term liabilities
|
240
|
|
204
|
|
||||
|
Long-term liabilities of discontinued operations
|
434
|
|
—
|
|
||||
|
Total long-term liabilities
|
4,691
|
|
4,182
|
|
||||
|
Commitments and contingencies (Note 17)
|
|
|
|
|
||||
|
Equity:
|
|
|
|
|
||||
|
Acorn Energy, Inc. shareholders
|
|
|
|
|
||||
|
Common stock - $0.01 par value per share:
|
|
|
|
|
||||
|
Authorized – 30,000,000 shares; Issued –18,067,925 and 18,325,529 shares at December 31, 2010 and 2011, respectively
|
180
|
|
183
|
|
||||
F- 3
|
Additional paid-in capital
|
83,596
|
|
84,614
|
|
||||
|
Warrants
|
427
|
|
427
|
|
||||
|
Accumulated deficit
|
(48,431
|
)
|
(13,022
|
)
|
||||
|
Treasury stock, at cost – 801,920 shares at December 31, 2010 and 2011
|
(3,036
|
)
|
(3,036
|
)
|
||||
|
Accumulated other comprehensive income
|
637
|
|
485
|
|
||||
|
Total Acorn Energy, Inc. shareholders’ equity
|
33,373
|
|
69,651
|
|
||||
|
Non-controlling interests
|
8,504
|
|
(84
|
)
|
||||
|
Total equity
|
41,877
|
|
69,567
|
|
||||
|
Total liabilities and equity
|
$
|
59,785
|
|
$
|
85,805
|
|
||
The accompanying notes are an integral part of these consolidated financial statements.
F- 4
ACORN ENERGY, INC. AND SUBSIDIARIES
(IN THOUSANDS, EXCEPT NET INCOME (LOSS) PER SHARE DATA)
|
|
Year ended December 31,
|
|||||||||||
|
|
2009
|
2010
|
2011
|
|||||||||
|
Revenues:
|
|
|
||||||||||
|
Projects
|
$
|
8,807
|
|
$
|
11,235
|
|
$
|
11,368
|
|
|||
|
Smart grid distribution products and services
|
—
|
|
2,382
|
|
7,119
|
|
||||||
|
Other
|
412
|
|
627
|
|
441
|
|
||||||
|
Total revenues
|
9,219
|
|
14,244
|
|
18,928
|
|
||||||
|
Cost of sales:
|
|
|
|
|
||||||||
|
Projects
|
4,946
|
|
6,646
|
|
7,886
|
|
||||||
|
Smart grid distribution products and services
|
—
|
|
1,210
|
|
3,792
|
|
||||||
|
Other
|
318
|
|
344
|
|
337
|
|
||||||
|
Total cost of sales
|
5,264
|
|
8,200
|
|
12,015
|
|
||||||
|
Gross profit
|
3,955
|
|
6,044
|
|
6,913
|
|
||||||
|
Operating expenses:
|
|
|
|
|
||||||||
|
Research and development expenses, net
|
457
|
|
965
|
|
2,995
|
|
||||||
|
Impairments
|
81
|
|
1,166
|
|
—
|
|
||||||
|
Selling, general and administrative expenses
|
5,702
|
|
10,440
|
|
11,952
|
|
||||||
|
Total operating expenses
|
6,240
|
|
12,571
|
|
14,947
|
|
||||||
|
Operating loss
|
(2,285
|
)
|
(6,527
|
)
|
(8,034
|
)
|
||||||
|
Finance expense, net
|
(71
|
)
|
(224
|
)
|
(26
|
)
|
||||||
|
Gain on sale of shares in Comverge
|
1,403
|
|
—
|
|
—
|
|
||||||
|
Gain on investment in GridSense
|
—
|
|
1,327
|
|
—
|
|
||||||
|
Gain on sale of HangXing
|
—
|
|
—
|
|
492
|
|
||||||
|
Distributions received from EnerTech
|
—
|
|
135
|
|
—
|
|
||||||
|
Loss on sale of EnerTech
|
—
|
|
(1,821
|
)
|
—
|
|
||||||
|
Loss before taxes on income
|
(953
|
)
|
|
(7,110
|
)
|
(7,568
|
)
|
|||||
|
Income tax benefit (expense)
|
719
|
|
(671
|
)
|
12,767
|
|
||||||
|
Income (loss) from operations of the Company and its consolidated subsidiaries
|
(234
|
)
|
(7,781
|
)
|
5,199
|
|
||||||
|
Share of income of Paketeria
|
263
|
|
—
|
|
—
|
|
||||||
|
Share of losses of GridSense
|
(129
|
)
|
—
|
|
—
|
|
||||||
|
Net income (loss) from continuing operations
|
(100
|
)
|
(7,781
|
)
|
5,199
|
|
||||||
|
Loss from discontinued operations, net of income taxes
|
(6,076
|
)
|
(17,969
|
)
|
(1,948
|
)
|
||||||
|
Gain on the sale of discontinued operations, net of income taxes
|
—
|
|
—
|
|
31,069
|
|
||||||
|
Non-controlling interest share of loss from discontinued operations
|
626
|
|
67
|
|
540
|
|
||||||
|
Net income (loss)
|
(5,550
|
)
|
(25,683
|
)
|
34,860
|
|
||||||
|
Net (income) loss attributable to non-controlling interests
|
(206
|
)
|
595
|
|
549
|
|
||||||
|
Net income (loss) attributable to Acorn Energy, Inc. shareholders.
|
$
|
(5,756
|
)
|
$
|
(25,088
|
)
|
$
|
35,409
|
|
|||
|
Basic net income (loss) per share attributable to Acorn Energy, Inc. shareholders:
|
||||||||||||
|
From continuing operations
|
$
|
(0.02
|
)
|
$
|
(0.48
|
)
|
$
|
0.33
|
|
|||
|
From discontinued operations
|
$
|
(0.48
|
)
|
$
|
(1.20
|
)
|
$
|
1.70
|
|
|||
|
Basic net income (loss) per share attributable to Acorn Energy, Inc. shareholders
|
$
|
(0.50
|
)
|
$
|
(1.68
|
)
|
$
|
2.03
|
|
|||
|
Weighted average number of shares outstanding attributable to Acorn Energy, Inc. shareholders – basic
|
11,445
|
|
14,910
|
|
17,462
|
|
||||||
F- 5
|
Diluted net income (loss) per share attributable to Acorn Energy, Inc. shareholders:
|
||||||||||||
|
From continuing operations
|
$
|
(0.02
|
)
|
$
|
(0.48
|
)
|
$
|
0.32
|
|
|||
|
From discontinued operations
|
$
|
(0.48
|
)
|
$
|
(1.20
|
)
|
$
|
1.67
|
|
|||
|
Diluted net income (loss) per share attributable to Acorn Energy, Inc. shareholders
|
$
|
(0.50
|
)
|
$
|
(1.68
|
)
|
$
|
1.99
|
|
|||
|
Weighted average number of shares outstanding attributable to Acorn Energy, Inc. shareholders – diluted
|
11,445
|
|
14,910
|
|
17,743
|
|
||||||
The accompanying notes are an integral part of these consolidated financial statements.
F- 6
ACORN ENERGY, INC. AND SUBSIDIARIES
CONSOLIDATED STATEMENTS OF CHANGES IN EQUITY
(IN THOUSANDS)
|
|
Acorn Energy, Inc. Shareholders
|
|
|
|||||||||||||||||||||||||||||||||||||
|
|
Number of Shares
|
Common Stock
|
Additional Paid-In Capital
|
Warrants
|
Accumulated Deficit
|
Treasury Stock
|
Accumulated Other Comprehensive Income (Loss)
|
Total Acorn Energy, Inc. Shareholders’ Equity
|
Non-controlling interests
|
Total Equity
|
||||||||||||||||||||||||||||||
|
Balances as of December 31, 2010
|
18,068
|
|
$
|
180
|
|
$
|
83,596
|
|
$
|
427
|
|
$
|
(48,431
|
)
|
$
|
(3,036
|
)
|
$
|
637
|
|
$
|
33,373
|
|
$
|
8,504
|
|
$
|
41,877
|
|
|||||||||||
|
Net income (loss) from continuing operations
|
—
|
|
—
|
|
—
|
|
—
|
|
5,748
|
|
—
|
|
—
|
|
5,748
|
|
(549
|
)
|
5,199
|
|
||||||||||||||||||||
|
Net income (loss) from discontinued operations
|
—
|
|
—
|
|
—
|
|
—
|
|
—
|
|
29,661
|
|
—
|
|
—
|
|
29,661
|
|
(540
|
)
|
29,121
|
|
||||||||||||||||||
|
Differences from translation of subsidiaries’ financial statements
|
—
|
|
—
|
|
—
|
|
—
|
|
—
|
|
—
|
|
(152
|
)
|
(152
|
)
|
(16
|
)
|
(168
|
)
|
||||||||||||||||||||
|
Comprehensive income
|
—
|
|
—
|
|
—
|
|
—
|
|
—
|
|
—
|
|
—
|
|
35,257
|
|
(1,105
|
)
|
34,152
|
|
||||||||||||||||||||
|
Dividends (see Note 18(b))
|
—
|
|
—
|
|
(1,490
|
)
|
—
|
|
—
|
|
—
|
|
—
|
|
(1,490
|
)
|
—
|
|
(1,490
|
)
|
||||||||||||||||||||
|
Adjustment of non-controlling interests in USSI following exercise of USSI option (see Note 4(b)(i))
|
—
|
|
—
|
|
600
|
|
—
|
|
—
|
|
—
|
|
—
|
|
600
|
|
(600
|
)
|
—
|
|
||||||||||||||||||||
|
Other
|
—
|
|
—
|
|
—
|
|
—
|
|
—
|
|
—
|
|
—
|
|
—
|
|
30
|
|
30
|
|
||||||||||||||||||||
|
Stock option compensation
|
—
|
|
—
|
|
406
|
|
—
|
|
—
|
|
—
|
|
—
|
|
406
|
|
—
|
|
406
|
|
||||||||||||||||||||
|
Stock option compensation of subsidiaries
|
—
|
|
—
|
|
—
|
|
—
|
|
—
|
|
—
|
|
—
|
|
—
|
|
176
|
|
176
|
|
||||||||||||||||||||
|
Deconsolidation of CoaLogix (see Note 3(b))
|
—
|
|
—
|
|
1,193
|
|
—
|
|
—
|
|
—
|
|
—
|
|
1,193
|
|
(7,089
|
)
|
(5,896
|
)
|
||||||||||||||||||||
|
Compensation of consultant granted in stock
|
26
|
|
—
|
|
*
|
101
|
|
—
|
|
—
|
|
—
|
|
—
|
|
101
|
|
—
|
|
101
|
|
|||||||||||||||||||
|
Exercise of options
|
232
|
|
3
|
|
208
|
|
—
|
|
—
|
|
—
|
|
—
|
|
211
|
|
—
|
|
211
|
|
||||||||||||||||||||
|
Balances as of December 31, 2011
|
18,326
|
|
$
|
183
|
|
$
|
84,614
|
|
$
|
427
|
|
$
|
(13,022
|
)
|
$
|
(3,036
|
)
|
$
|
485
|
|
$
|
69,651
|
|
$
|
(84
|
)
|
$
|
69,567
|
|
|||||||||||
|
|
*
|
Less than $1
|
The accompanying notes are an integral part of these consolidated financial statements.
F- 7
ACORN ENERGY, INC. AND SUBSIDIARIES
CONSOLIDATED STATEMENTS OF CHANGES IN EQUITY
(IN THOUSANDS)
|
|
Acorn Energy, Inc. Shareholders
|
|
|
||||||||||||||||||||||||||||||||||||
|
|
Number of Shares
|
Common Stock
|
Additional Paid-In Capital
|
Warrants
|
Accumulated Deficit
|
Treasury Stock
|
Accumulated Other Comprehensive Income (Loss)
|
Total Acorn Energy, Inc. Shareholders’ Equity
|
Non-controlling interests
|
Total Equity
|
|||||||||||||||||||||||||||||
|
Balances as of December 31, 2009
|
13,249
|
|
$
|
132
|
|
$
|
58,373
|
|
$
|
290
|
|
$
|
(23,343
|
)
|
$
|
(4,827
|
)
|
$
|
152
|
|
$
|
30,777
|
|
$
|
5,321
|
|
$
|
36,098
|
|
||||||||||
|
Net loss from continuing operations
|
—
|
|
—
|
|
—
|
|
—
|
|
(7,186
|
)
|
—
|
|
—
|
|
(7,186
|
)
|
(595
|
)
|
(7,781
|
)
|
|||||||||||||||||||
|
Net loss from discontinued operations
|
—
|
|
—
|
|
—
|
|
—
|
|
(17,902
|
)
|
—
|
|
—
|
|
(17,902
|
)
|
(67
|
)
|
(17,969
|
)
|
|||||||||||||||||||
|
Differences from translation of subsidiaries’ financial statements (see Deconsolidation of Coreworx below)
|
—
|
|
—
|
|
—
|
|
—
|
|
—
|
|
—
|
|
871
|
|
871
|
|
—
|
|
871
|
|
|||||||||||||||||||
|
Comprehensive loss
|
—
|
|
—
|
|
—
|
|
—
|
|
—
|
|
—
|
|
—
|
|
(24,217
|
)
|
(662
|
)
|
(24,879
|
)
|
|||||||||||||||||||
|
Issuance by CoaLogix of CoaLogix shares to non-controlling interests (see Note 3(a))
|
—
|
|
—
|
|
587
|
|
—
|
|
—
|
|
—
|
|
—
|
|
587
|
|
2,423
|
|
3,010
|
|
|||||||||||||||||||
|
Shares issued in March capital raise, net of transaction costs (see Note 18(c)(i))
|
2,232
|
|
22
|
|
11,445
|
|
—
|
|
—
|
|
—
|
|
—
|
|
11,467
|
|
—
|
|
11,467
|
|
|||||||||||||||||||
|
Shares issued in the acquisition of Decision Dynamics (see Note 5(a))
|
1,000
|
|
10
|
|
5,630
|
|
—
|
|
—
|
|
—
|
|
—
|
|
5,640
|
|
—
|
|
5,640
|
|
|||||||||||||||||||
|
Shares issued in the acquisition of GridSense (see Note 4(a)(ii))
|
356
|
|
4
|
|
1,863
|
|
—
|
|
—
|
|
—
|
|
—
|
|
1,867
|
|
—
|
|
1,867
|
|
|||||||||||||||||||
|
Issuance of treasury shares in exercise of USSI option (see Note 4(b))
|
—
|
|
—
|
|
(1,791
|
)
|
*
|
—
|
|
—
|
|
1,791
|
|
—
|
|
—
|
|
—
|
|
—
|
|
||||||||||||||||||
|
Non-controlling interests created in USSI consolidation
|
—
|
|
—
|
|
—
|
|
—
|
|
—
|
|
—
|
|
—
|
|
—
|
|
3,600
|
|
3,600
|
|
|||||||||||||||||||
|
Adjustment of non-controlling interests in USSI following exercise of USSI options (see Note 4 (b)(i))
|
—
|
|
—
|
|
2,224
|
|
—
|
|
—
|
|
—
|
|
—
|
|
2,224
|
|
(2,224
|
)
|
—
|
|
|||||||||||||||||||
|
Shares issued in December capital raise, net of transaction costs (see Note 18(b)(ii))
|
1,150
|
|
11
|
|
3,545
|
|
153
|
|
—
|
|
—
|
|
—
|
|
3,709
|
|
—
|
|
3,709
|
|
|||||||||||||||||||
|
Stock option compensation
|
—
|
|
—
|
|
690
|
|
—
|
|
—
|
|
—
|
|
—
|
|
690
|
|
—
|
|
690
|
|
|||||||||||||||||||
|
Stock option compensation of subsidiaries
|
—
|
|
—
|
|
—
|
|
—
|
|
—
|
|
—
|
|
—
|
|
—
|
|
779
|
|
779
|
|
|||||||||||||||||||
|
Deconsolidation of Coreworx
|
—
|
|
—
|
|
795
|
|
—
|
|
—
|
|
—
|
|
(386
|
)
|
409
|
|
(795
|
)
|
(386
|
)
|
|||||||||||||||||||
|
Other
|
—
|
|
—
|
|
—
|
|
—
|
|
—
|
|
—
|
|
—
|
|
—
|
|
62
|
|
62
|
|
|||||||||||||||||||
|
Exercise of options and warrants
|
81
|
|
1
|
|
235
|
|
(16
|
)
|
—
|
|
—
|
|
—
|
|
220
|
|
—
|
|
220
|
|
|||||||||||||||||||
|
Balances as of December 31, 2010
|
18,068
|
|
$
|
180
|
|
$
|
83,596
|
|
$
|
427
|
|
$
|
(48,431
|
)
|
$
|
(3,036
|
)
|
$
|
637
|
|
$
|
33,373
|
|
$
|
8,504
|
|
$
|
41,877
|
|
||||||||||
|
|
*
|
Includes approximately $438 of a gain on re-issuance
|
The accompanying notes are an integral part of these consolidated financial statements.
F- 8
ACORN ENERGY, INC. AND SUBSIDIARIES
CONSOLIDATED STATEMENTS OF CHANGES IN EQUITY
(IN THOUSANDS)
|
|
Acorn Energy, Inc. Shareholders
|
|
|
||||||||||||||||||||||||||||||||||||
|
|
Number of Shares
|
Common Stock
|
Additional Paid-In Capital
|
Warrants
|
Accumulated Deficit
|
Treasury Stock
|
Accumulated Other Comprehensive Income (Loss)
|
Total Acorn Energy, Inc. Shareholders’ Equity
|
Non-controlling interests
|
Total Equity
|
|||||||||||||||||||||||||||||
|
Balances as of December 31, 2008
|
12,455
|
|
$
|
124
|
|
$
|
54,035
|
|
$
|
1,020
|
|
$
|
(17,587
|
)
|
$
|
(3,719
|
)
|
$
|
(425
|
)
|
$
|
33,448
|
|
$
|
2,675
|
|
$
|
36,123
|
|
||||||||||
|
Net loss from continuing operations
|
—
|
|
—
|
|
—
|
|
—
|
|
(306
|
)
|
—
|
|
—
|
|
(306
|
)
|
206
|
|
(100
|
)
|
|||||||||||||||||||
|
Net loss from discontinued operations
|
—
|
|
—
|
|
—
|
|
—
|
|
(5,450
|
)
|
—
|
|
—
|
|
(5,450
|
)
|
(626
|
)
|
(6,076
|
)
|
|||||||||||||||||||
|
Adjustment to fair market value of Comverge shares, net
|
—
|
|
—
|
|
—
|
|
—
|
|
—
|
|
—
|
|
125
|
|
125
|
|
—
|
|
125
|
|
|||||||||||||||||||
|
Differences from translation of subsidiaries’ financial statements
|
—
|
|
—
|
|
—
|
|
—
|
|
—
|
|
—
|
|
452
|
|
452
|
|
42
|
|
494
|
|
|||||||||||||||||||
|
Comprehensive loss
|
—
|
|
—
|
|
—
|
|
—
|
|
—
|
|
—
|
|
—
|
|
(5,179
|
)
|
(378
|
)
|
(5,557
|
)
|
|||||||||||||||||||
|
Issuance by CoaLogix of CoaLogix shares to non-controlling interests (see Note 3(a))
|
—
|
|
—
|
|
596
|
|
—
|
|
—
|
|
—
|
|
—
|
|
596
|
|
2,277
|
|
2,873
|
|
|||||||||||||||||||
|
Stock option compensation
|
—
|
|
—
|
|
678
|
|
—
|
|
—
|
|
—
|
|
—
|
|
678
|
|
—
|
|
678
|
|
|||||||||||||||||||
|
Stock option compensation of subsidiaries
|
—
|
|
—
|
|
—
|
|
—
|
|
—
|
|
—
|
|
—
|
|
—
|
|
747
|
|
747
|
|
|||||||||||||||||||
|
Exercise of options and warrants
|
794
|
|
8
|
|
3,064
|
|
(730
|
)
|
—
|
|
—
|
|
—
|
|
2,342
|
|
—
|
|
2,342
|
|
|||||||||||||||||||
|
Purchase of treasury shares
|
—
|
|
—
|
|
—
|
|
—
|
|
—
|
|
(1,108
|
)
|
—
|
|
(1,108
|
)
|
—
|
|
(1,108
|
)
|
|||||||||||||||||||
|
Balances as of December 31, 2009
|
13,249
|
|
$
|
132
|
|
$
|
58,373
|
|
$
|
290
|
|
$
|
(23,343
|
)
|
$
|
(4,827
|
)
|
$
|
152
|
|
$
|
30,777
|
|
$
|
5,321
|
|
$
|
36,098
|
|
||||||||||
The accompanying notes are an integral part of these consolidated financial statements.
F- 9
ACORN ENERGY, INC. AND SUBSIDIARIES
(IN THOUSANDS)
|
|
2009
|
2010
|
2011
|
|||||||||
|
Cash flows used in operating activities:
|
|
|
||||||||||
|
Net income (loss) before non-controlling interests
|
$
|
(6,176
|
)
|
$
|
(25,750
|
)
|
$
|
34,320
|
|
|||
|
Less net loss (income) from discontinued operations
|
6,076
|
|
17,969
|
|
(29,121
|
)
|
||||||
|
Net income (loss) from continuing operations
|
(100
|
)
|
(7,781
|
)
|
5,199
|
|
||||||
|
Adjustments to reconcile net loss to net cash used in operating activities (see Schedule A)
|
(1,312
|
)
|
1,527
|
|
(13,038
|
)
|
||||||
|
Net cash used in operating activities – continuing operations
|
(1,412
|
)
|
(6,254
|
)
|
(7,839
|
)
|
||||||
|
Cash flows provided by (used in) investing activities:
|
|
|
|
|
||||||||
|
Acquisitions of property and equipment
|
(240
|
)
|
(237
|
)
|
(502
|
)
|
||||||
|
Proceeds from the sale of Comverge shares
|
3,990
|
|
—
|
|
—
|
|
||||||
|
Proceeds from the sale of EnerTech
|
—
|
|
1,116
|
|
—
|
|
||||||
|
Restricted deposits
|
(971
|
)
|
(1,301
|
)
|
(1,930
|
)
|
||||||
|
Release of restricted deposits
|
2,468
|
|
1,029
|
|
839
|
|
||||||
|
Investment in EnerTech
|
(1,000
|
)
|
(900
|
)
|
—
|
|
||||||
|
Investment in USSI prior to acquisition.
|
(200
|
)
|
—
|
|
—
|
|
||||||
|
Investment in and loans to GridSense prior to acquisition
|
(550
|
)
|
(200
|
)
|
—
|
|
||||||
|
Amounts funded for severance assets
|
(377
|
)
|
(281
|
)
|
(315
|
)
|
||||||
|
Advances to CoaLogix prior to sale
|
—
|
|
—
|
|
(278
|
)
|
||||||
|
Proceeds from the sale of CoaLogix net of CoaLogix cash
|
—
|
|
—
|
|
62,117
|
|
||||||
|
Escrow deposits from CoaLogix sale
|
—
|
|
—
|
|
(6,308
|
)
|
||||||
|
Proceeds from the sale of Coreworx debt and shares
|
—
|
|
—
|
|
100
|
|
||||||
|
Release of escrow deposits
|
—
|
|
—
|
|
347
|
|
||||||
|
Proceeds from the sale of HangXing
|
—
|
|
—
|
|
492
|
|
||||||
|
Investment in short-term deposits
|
—
|
|
—
|
|
(18,000
|
)
|
||||||
|
Deconsolidation of Coreworx
|
—
|
|
(217
|
)
|
—
|
|
||||||
|
Acquisition of USSI net of cash acquired (see Schedule C)
|
—
|
|
7
|
|
—
|
|
||||||
|
Acquisition of GridSense, net of cash acquired (see Schedule D)
|
—
|
|
(1,352
|
)
|
—
|
|
||||||
|
Acquisition of OMI net of cash acquired (see Schedule E)
|
—
|
|
—
|
|
—
|
|
||||||
|
Net cash provided by (used in) investing activities – continuing operations
|
3,120
|
|
(2,336
|
)
|
36,562
|
|
||||||
|
Cash flows provided by (used in) financing activities:
|
|
|
|
|
||||||||
|
Proceeds from capital raises, net of transaction costs
|
—
|
|
15,176
|
|
—
|
|
||||||
|
Proceeds from employee stock option and warrant exercises
|
2,342
|
|
220
|
|
211
|
|
||||||
|
Purchase of additional shares in DSIT
|
(294
|
)
|
—
|
|
—
|
|
||||||
|
Acquisition of treasury shares
|
(1,108
|
)
|
—
|
|
—
|
|
||||||
|
Repayment of notes payable to the former shareholders of Coreworx
|
(3,400
|
)
|
—
|
|
—
|
|
||||||
|
Issuance of shares to non-controlling interests in consolidated subsidiary
|
2,873
|
|
3,010
|
|
—
|
|
||||||
|
Short-term bank credit, net
|
(82
|
)
|
962
|
|
(557
|
)
|
||||||
|
Proceeds from borrowings of long-term debt
|
530
|
|
129
|
|
68
|
|
||||||
|
Repayments of long-term debt
|
(4
|
)
|
(140
|
)
|
(342
|
)
|
||||||
|
Dividends paid
|
—
|
|
—
|
|
(614
|
)
|
||||||
|
Other
|
—
|
|
62
|
|
31
|
|
||||||
|
Net cash provided by (used in) financing activities – continuing operations
|
857
|
|
19,419
|
|
(1,203
|
)
|
||||||
F- 10
ACORN ENERGY, INC. AND SUBSIDIARIES
CONSOLIDATED STATEMENTS OF CASH FLOWS
(IN THOUSANDS)
|
Discontinued operations:
|
|
|
|
|
||||||||
|
Operating cash flows
|
(4,016
|
)
|
(8,536
|
)
|
(2,020
|
)
|
||||||
|
Investing cash flows
|
(2,450
|
)
|
(7,051
|
)
|
(187
|
)
|
||||||
|
Financing cash flows
|
(54
|
)
|
479
|
|
1,683
|
|
||||||
|
Net cash used in discontinued operations
|
(6,520
|
)
|
(15,108
|
)
|
(524
|
)
|
||||||
|
Effect of exchange rate changes on cash and cash equivalents
|
—
|
|
273
|
|
(72
|
)
|
||||||
|
Effect of exchange rate changes on cash and cash equivalents of discontinued operations
|
21
|
|
154
|
|
—
|
|
||||||
|
Net increase (decrease) in cash and cash equivalents
|
(3,934
|
)
|
(3,852
|
)
|
26,924
|
|
||||||
|
Cash and cash equivalents at beginning of the year of discontinued operations
|
2,508
|
|
3,175
|
|
807
|
|
||||||
|
Cash and cash equivalents at beginning of year of continuing operations
|
12,634
|
|
8,033
|
|
6,549
|
|
||||||
|
Cash and cash equivalents at end of year
|
11,208
|
|
7,356
|
|
34,280
|
|
||||||
|
Cash and cash equivalents of discontinued operations
|
(3,175
|
)
|
(807
|
)
|
—
|
|
||||||
|
Cash and cash equivalents at held by continuing operations at end of year
|
$
|
8,033
|
|
$
|
6,549
|
|
$
|
34,280
|
|
|||
|
Supplemental cash flow information:
|
|
|
|
|
||||||||
|
Cash paid during the year for:
|
|
|
|
|
||||||||
|
Interest
|
$
|
267
|
|
$
|
151
|
|
$
|
144
|
|
|||
|
Income taxes, net of refunds
|
$
|
(357
|
)
|
$
|
(85
|
)
|
$
|
2,180
|
|
|||
The accompanying notes are an integral part of these consolidated financial statements.
F- 11
ACORN ENERGY, INC. AND SUBSIDIARIES
CONSOLIDATED STATEMENTS OF CASH FLOWS
(IN THOUSANDS)
|
|
|
2009
|
2010
|
2011
|
||||||||||
|
A.
|
Adjustments to reconcile net loss to net cash provided by (used in) operating activities:
|
|
|
|
||||||||||
|
|
Depreciation and amortization
|
$
|
216
|
|
$
|
603
|
|
$
|
851
|
|
||||
|
|
Share in income of Paketeria
|
(263
|
)
|
—
|
|
—
|
|
|||||||
|
|
Share in losses of GridSense
|
129
|
|
—
|
|
—
|
|
|||||||
|
|
Change in deferred taxes
|
(250
|
)
|
23
|
|
(13,206
|
)
|
|||||||
|
|
Impairments
|
81
|
|
1,166
|
|
—
|
|
|||||||
|
|
Exchange rate adjustment on restricted deposits
|
109
|
|
—
|
|
|
|
|||||||
|
|
Exchange rate adjustment on amounts severance assets net of exchange adjustment on accrued severance
|
—
|
|
58
|
|
(75
|
)
|
|||||||
|
|
Exchange rate adjustment on long-term debt
|
—
|
|
(38
|
)
|
|
|
|||||||
|
|
Increase in liability for accrued severance
|
453
|
|
385
|
|
390
|
|
|||||||
|
|
Gain on sale of shares in Comverge
|
(1,403
|
)
|
—
|
|
—
|
|
|||||||
|
|
Gain on investment in GridSense
|
—
|
|
(1,327
|
)
|
—
|
|
|||||||
|
|
Loss on sale of EnerTech
|
—
|
|
1,821
|
|
—
|
|
|||||||
|
Gain on sale of HangXing
|
—
|
|
—
|
|
(492
|
)
|
||||||||
|
|
Loss on sale of property and equipment, net
|
6
|
|
—
|
|
—
|
|
|||||||
|
|
Stock and stock option compensation
|
678
|
|
690
|
|
458
|
|
|||||||
|
|
Other
|
4
|
|
9
|
|
(12
|
)
|
|||||||
|
|
Changes in operating assets and liabilities:
|
|
|
|
|
|
|
|||||||
|
|
Decrease (increase) in accounts receivable
|
814
|
|
(2,659
|
)
|
305
|
|
|||||||
|
|
Decrease (increase) unbilled revenue and work-in- process
|
(1,594
|
)
|
(1,806
|
)
|
28
|
|
|||||||
|
|
Decrease (increase) in other current assets and other assets
|
(92
|
)
|
597
|
|
(422
|
)
|
|||||||
|
|
Increase in inventory
|
—
|
|
(203
|
)
|
(1,027
|
)
|
|||||||
|
|
Increase (decrease) in accounts payable, accrued payroll, payroll taxes and social benefits, other current liabilities and other non-current liabilities
|
(200
|
)
|
2,208
|
|
164
|
|
|||||||
|
|
|
$
|
(1,312
|
)
|
$
|
1,527
|
|
$
|
(13,038
|
)
|
||||
|
B.
|
Non-cash investing and financing activities:
|
|
|
|
|
|||||||||
|
|
Intangibles acquired by discontinued operations in consideration for future royalties
|
$
|
99
|
|
|
|
||||||||
|
|
Adjustment of additional paid-in-capital and non-controlling interests from investment in discontinued operations by non-controlling interests
|
$
|
596
|
|
$
|
587
|
|
|||||||
|
|
Adjustment of additional paid-in-capital and non-controlling interests from exercise of option by Acorn in USSI
|
|
|
$
|
1,791
|
|
$
|
600
|
|
|||||
|
|
Value of Acorn shares issued in the acquisition of GridSense
|
|
|
$
|
1,867
|
|
||||||||
|
|
Value of treasury shares issued in the exercise of an option to invest in USSI
|
|
|
$
|
2,229
|
|
||||||||
|
|
Value of warrants issued in capital raise
|
|
|
$
|
153
|
|
||||||||
|
Value of shares issued as compensation
|
$
|
101
|
|
|||||||||||
|
Dividends payable
|
$
|
876
|
|
|||||||||||
|
C.
|
Assets/liabilities acquired in the acquisition of USSI:
|
|
|
|
|
|||||||||
|
|
Other current assets
|
|
|
$
|
(55
|
)
|
||||||||
|
|
Property and equipment
|
|
|
(56
|
)
|
|||||||||
|
|
Intangibles
|
|
|
(2,565
|
)
|
|||||||||
|
|
Goodwill
|
|
|
(1,402
|
)
|
|||||||||
|
|
Current liabilities
|
|
|
285
|
|
|||||||||
|
|
Prior year investment in USSI
|
|
|
200
|
|
|||||||||
|
|
Non-controlling interests
|
|
|
3,600
|
|
|||||||||
|
|
|
|
|
$
|
7
|
|
||||||||
The accompanying notes are an integral part of these consolidated financial statements.
F- 12
ACORN ENERGY, INC. AND SUBSIDIARIES
CONSOLIDATED STATEMENTS OF CASH FLOWS
(IN THOUSANDS)
|
D.
|
Assets/liabilities acquired in the acquisition of GridSense:
|
|
||||||||
|
|
Inventory
|
$
|
(833
|
)
|
||||||
|
|
Other current assets
|
(482
|
)
|
|||||||
|
|
Property and equipment
|
(71
|
)
|
|||||||
|
|
Other assets
|
(370
|
)
|
|||||||
|
|
Intangibles
|
(2,314
|
)
|
|||||||
|
|
Goodwill
|
(3,655
|
)
|
|||||||
|
|
Current liabilities
|
2,003
|
|
|||||||
|
|
Short term and long-term debt
|
113
|
|
|||||||
|
|
Gain on step-up of investment
|
1,327
|
|
|||||||
|
|
Consideration paid – see Note 4(a) for detail
|
4,406
|
|
|||||||
|
|
Less cash included in consideration paid
|
(1,476
|
)
|
|||||||
|
|
|
$
|
(1,352
|
)
|
||||||
|
E.
|
Assets/liabilities acquired in the acquisition of OMI:
|
|
|
|||||||
|
|
Other current assets
|
(39
|
)
|
|||||||
|
|
Property and equipment
|
(41
|
)
|
|||||||
|
|
Intangibles
|
(322
|
)
|
|||||||
|
|
Current liabilities
|
402
|
|
|||||||
|
|
|
$
|
—
|
|
||||||
The accompanying notes are an integral part of these consolidated financial statements.
F- 13
|
(a)
|
Description of Business
|
Acorn Energy, Inc. (“Acorn” or the “Company”) is a Delaware corporation which is a holding company focused on technology driven solutions for energy infrastructure management.
Through its majority-owned operating subsidiaries the Company provides the following products and services:
|
•
|
Sonar and acoustic related solutions for energy, defense and commercial markets and other real-time embedded hardware & software development is reported in the Company’s Energy & Security Sonar Solutions (formerly known as Naval and RT Solutions) segment whose activities are conducted through its DSIT Solutions Ltd. (“DSIT”) subsidiary.
|
|
•
|
Smart grid distribution automation products and services provided through the Company’s GridSense Pty Ltd. and GridSense Inc. subsidiaries (“GridSense”) which were acquired in May 2010 (see Note 4(a)).
|
|
•
|
Energy and security sensor systems services which is provided by the Company’s U.S. Seismic Systems, Inc. (“USSI”) subsidiary which was effectively acquired in February 2010 (see Note 4(b)).
|
The Company’s operations are based in the United States, Israel and Australia. Acorn’s shares are traded on the NASDAQ Global Market under the symbol ACFN.
See Note 22 for segment information and major customers.
|
(b)
|
Accounting Principles
|
The consolidated financial statements have been prepared in conformity with accounting principles generally accepted in the United States of America (“GAAP”).
|
(c)
|
Use of Estimates in Preparation of Financial Statements
|
The preparation of consolidated financial statements requires management to make estimates and assumptions that affect the reported amounts of assets and liabilities and the disclosure of contingent assets and liabilities as of the date of the financial statements, and the reported amounts of revenues and expenses during the reporting periods.
As applicable to these consolidated financial statements, the most significant estimates and assumptions relate to percentages of completion with respect to revenue recognition, uncertainties with respect to income taxes, inventories, contingencies, purchase price allocations and analyses of the possible impairment of goodwill.
|
(d)
|
Amounts in the Footnotes in the Financial Statements
|
All dollar amounts in the footnotes of the consolidated financial statements are in thousands except for per share data.
F- 14
Principles of Consolidation and Presentation
The consolidated financial statements include the accounts of the Company and its subsidiaries. In these financial statements, “subsidiaries” are companies that are over 50% controlled, the financial statements of which are consolidated with those of the Company. Significant intercompany transactions and balances are eliminated in consolidation; profits from intercompany sales, are also eliminated; non-controlling interests are included in equity.
Functional Currency and Foreign Currency Transactions
The currency of the primary economic environment in which the operations of Acorn and its U.S. subsidiaries are conducted is the United States dollar (“dollar”). Accordingly, the Company and all of its U.S. subsidiaries use the dollar as their functional currency. The financial statements of the Company’s Israeli subsidiary whose functional currency is the New Israeli Shekel (“NIS”), the Company’s Australian subsidiary whose functional currency is the Australian dollar (“AU”) and the Company’s former Canadian subsidiary whose functional currency was the Canadian dollar have been translated in accordance with applicable accounting principles. Assets and liabilities are translated at year-end exchange rates, while revenues and expenses are translated at average exchange rates during the year. Differences resulting from translation are presented in equity as Accumulated Other Comprehensive Income. Gains and losses on foreign currency transactions and exchange gains and losses denominated in non-functional currencies are reflected in finance income (expense), net, in the Consolidated Statements of Operations when they arise.
Cash Equivalents
The Company considers all highly liquid investments, which include money market funds and short-term bank deposits (up to three months from date of deposit or with maturity of three months from date of purchase) that are not restricted as to withdrawal or use, to be cash equivalents.
Accounts Receivable
Accounts receivable consists of trade receivables. Trade receivables are recorded at the invoiced amount.
Allowance for Doubtful Accounts
The Company maintains allowances for doubtful accounts for estimated losses resulting from the inability of customers to make required payments. This allowance is based on specific customer account reviews and historical collections experience. If the financial condition of the Company’s funding parties or customers were to deteriorate, resulting in an impairment of their ability to make payments, additional allowances may be required. The Company performs ongoing credit evaluations of its customers and does not require collateral.
No allowance was charged to expense related to trade accounts receivable in the years ended December 31, 2009, 2010 or 2011. There was no allowance for doubtful accounts as of December 31, 2009, 2010 or 2011.
Inventory
GridSense - Inventories are comprised of components (raw materials), work-in-process and finished goods, which are measured at the lower of cost and net realizable value. Costs are determined at cost of acquisition on a weighted average basis and include all production and shipping costs.
USSI - Raw materials inventory is generally comprised of: specialized fiber, cables, optical components and electrical components. Work-in-process inventory is primarily comprised of systems that have commenced with assembly as well as capitalized labor time associated with the development of the system. Finished Goods inventory consists of fully assembled systems ready for final shipment to the customer. Inventories are stated at the lower of cost or market using the first-in, first-out method.
All inventories are periodically reviewed for impairment due for slow-moving and obsolete inventory. No impairment was recorded in 2009, 2010 or 2011. There was no reserve for inventory recorded as of December 31, 2009, 2010 or 2011.
F- 15
Investments in Companies Accounted for Using the Equity or Cost Method
Investments in other non-consolidated entities are accounted for using the equity method or cost basis depending upon the level of ownership and/or the Company’s ability to exercise significant influence over the operating and financial policies of the investee. When the equity method is used, investments are recorded at original cost and adjusted periodically to recognize the Company’s proportionate share of the investees’ net income or losses after the date of investment. When net losses from an investment accounted for under the equity method exceed its carrying amount, the investment balance is reduced to zero and additional losses are not provided for as the Company is not obligated to provide additional capital. The Company resumes accounting for the investment under the equity method if the entity subsequently reports net income and the Company’s share of that net income exceeds the share of net losses not recognized during the period the equity method was suspended.
When an investment accounted for using the equity method issues its own shares, the subsequent reduction in the Company’s proportionate interest in the investee is reflected in equity as an adjustment to paid-in-capital. The Company evaluates its investments in companies accounted for by the equity or cost method for impairment when there is evidence or indicators that a decrease in value may be other than temporary.
The Company’s investment in GridSense was accounted for by the equity method until the Company completed its acquisition of GridSense in May 2010 (see Note 4(a)) at which time the Company began consolidating GridSense's results. The Company’s investment in Paketeria AG ("Paketeria") was accounted for by the equity method until its disposition in 2009 (see Note 7(b)). The Company’s investment in USSI was accounted for by the cost method until the Company increased its investment and began consolidating USSI’s results in February 2010 (see Note 4(b)). The Company’s investment in EnerTech Capital III L.P. ("EnerTech") (see Note 7(a)) was accounted for by the cost method until its disposition in December 2010.
Non-Controlling Interests
The Financial Accounting Standards Board (“FASB”) issued a statement which established accounting and reporting standards that require noncontrolling interests (previously referred to as minority interest) to be reported as a component of equity, changes in a parent’s ownership interest while the parent retains its controlling interest be accounted for as equity transactions, and upon a loss of control, retained ownership interest will be re-measured at fair value, with any gain or loss recognized in earnings. Prior to adoption of the statement on January 1, 2009, the Company had stopped attributing losses to its DSIT subsidiary because the losses exceeded the carrying amount of the noncontrolling interest. Upon adoption of the statement, the Company prospectively attributed income and losses to the noncontrolling interests associated with DSIT. The presentation and disclosure requirements of the statement were applied retrospectively.
Property and Equipment
Property and equipment are presented at cost at the date of acquisition. Depreciation and amortization is calculated based on the straight-line method over the estimated useful lives of the depreciable assets, or in the case of leasehold improvements, the shorter of the lease term or the estimated useful life of the asset. Improvements are capitalized while repairs and maintenance are charged to operations as incurred.
Goodwill and Acquired Intangible Assets
Goodwill and intangible assets determined to have an indefinite useful life are not amortized, but instead are tested for impairment at least annually. Intangible assets with estimable useful lives are amortized over their respective estimated useful lives and reviewed for impairment in accordance applicable accounting principles.
The Company assesses annually whether there is an indication that goodwill is impaired, or more frequently if events and circumstances indicate that the asset might be impaired during the year. The Company performs its annual impairment test in the fourth quarter of each year.
Application of the goodwill impairment test requires judgment, including the identification of reporting units, assignment of assets and liabilities to reporting units, assignment of goodwill to reporting units, and determination of the fair value of each reporting unit. The Company has identified its operating segments as its reporting units for purposes of the impairment test. The Company’s existing goodwill and intangible assets are associated with its Energy & Security Sonar Solutions, GridSense and USSI segments.
In September 2011, the Financial Accounting Standards Board (“FASB”) issued guidance that simplified how entities test for goodwill impairment. This guidance permits entities to first assess qualitative factors to determine whether it is more likely than
F- 16
not that the fair value of a reporting unit is less than its carrying amount as a basis for determining whether it is necessary to perform a two-step goodwill impairment test. This guidance is effective for annual and interim goodwill impairment tests performed for fiscal years beginning after December 15, 2011, and early adoption is permitted. As discussed more fully in Note 12(a) to the Consolidated Financial Statements, the Company early adopted this guidance for its annual goodwill impairment test that was conducted in the fourth quarter of 2011.
If the Company determined that is was necessary to perform a two-step goodwill impairment test, it would determine the fair value of each reporting unit and compare it to the carrying amount of the reporting unit. Calculating the fair value of the reporting units requires significant estimates and assumptions by management. To the extent the carrying amount of a reporting unit exceeds the fair value of the reporting unit, there is an indication that the reporting unit goodwill may be impaired and a second step of the impairment test is performed to determine the amount of the impairment to be recognized, if any.
Other intangible assets that have finite useful lives (e.g. purchased technology), are recorded at fair value at the time of the acquisition, and are carried at such value less accumulated amortization. The Company amortizes these intangible assets on a straight-line basis over their estimated useful lives. The Company's intangibles and their estimated useful lives are as follows:
|
|
Estimated
Useful
Life
(in years)
|
|
Naval technologies
|
7
|
|
GridSense technologies
|
5-12
|
|
Customer relationships associated with GridSense
|
10
|
|
GridSense trade name
|
15
|
|
GridSense non-compete agreements
|
3
|
|
USSI sensor technologies
|
20
|
Impairment of Long-Lived Assets
Long-lived assets including certain intangible assets are reviewed for impairment whenever events or changes in circumstances indicate that the carrying amount of an asset may not be recoverable. Recoverability of assets to be held and used is measured by a comparison of the carrying amount of an asset to the undiscounted future net cash flows expected to be generated by the asset. If the carrying amount of an asset exceeds its estimated future undiscounted cash flows, an impairment charge is recognized by the amount by which the carrying amount of the asset exceeds the fair value of the asset. No such events occurred in any of the years ending December 31, 2009, 2010 or 2011.
Treasury Stock
Shares of common stock repurchased are recorded at cost as treasury stock. When shares are reissued, the cost method is used for determining cost. In accordance with GAAP, the excess of the acquisition cost over the reissuance price of the treasury stock, if any, is charged to additional paid-in capital, limited to the amount previously credited to additional paid-in capital, if any. Any excess is charged to accumulated deficit.
Revenue Recognition
The Company’s revenue recognition policy is consistent with applicable revenue recognition guidance and interpretations.
The Company recognizes revenue when persuasive evidence of an arrangement exists, services have been rendered, the price is fixed or determinable, and collectability is reasonably assured.
Revenues from management and consulting, time-and-materials service contracts, maintenance agreements and other services are recognized as services are provided.
Revenues from fixed-price contracts which require significant production, modification and/or customization to customer specifications are recognized using the percentage-of-completion method. Percentage-of-completion estimates are in man-months of labor and are reviewed periodically, and any adjustments required are reflected in the period when such estimates are revised. Losses on contracts, if any, are recognized in the period in which the loss is determined.
F- 17
The Company assesses whether payment terms are customary or extended in accordance with normal practice relative to the market in which the sale is occurring. The Company’s sales arrangements generally include standard payment terms. These terms effectively relate to all customers, products, and arrangements regardless of customer type, product mix or arrangement size.
If the revenue recognition criteria above are not satisfied, amounts received from customers are classified as deferred revenue on the balance sheet until such time as the revenue recognition criteria are met.
Equipment and customer support services revenue is recognized upon delivery of the systems when persuasive evidence of an arrangement exists that includes obtaining a written agreement in the form of a sales order with the customer, collection is probable, and the fee is fixed and determinable.
Revenue from sales of monitoring equipment is recognized at the time title to the equipment and significant risks of ownership pass to the customer, which is generally upon shipment when all significant contractual obligations have been satisfied and collection is reasonably assured.
Revenue from customer support services on monitoring equipment includes sales of parts and servicing of equipment. Sales of parts revenue is recognized when the parts are shipped to the customer or when the part is installed in the customer's equipment. Servicing of equipment revenue is recognized as the related service work is performed.
Revenue from sales of sensor products is recognized at the time title to the products and significant risks of ownership pass to the customer, which is generally upon shipment and installation, when all significant contractual obligations have been satisfied and collection is reasonably assured.
Milestone payments are recognized as revenue when milestones are deemed to be substantive and are achieved. A substantive milestone is one that is based on successful performance by the Company and not solely contingent upon the passage of time or performance by another party. Milestone payments collected in advance that have significant future performance obligations are presented as deferred revenue and recognized when the milestone is achieved.
Unbilled Revenue
Revenues may be earned for those services in advance of amounts billable to the customer and are recognized when the service is performed. Revenues recognized in excess of amounts billed for projects in process are recorded as unbilled revenue. Such amounts are generally billed upon the completion of a project milestone.
Warranty Provision
The Company’s DSIT subsidiary generally grants its customers one to two year warranty on its projects. The Company’s GridSense and USSI subsidiaries generally grants its customers a one year warranty on their respective products.
Estimated warranty obligations are provided for as a cost of sales in the period in which the related revenues are recognized, based on management’s estimate of future potential warranty obligations and limited historical experience. Adjustments are made to accruals as warranty claim data and historical experience warrant.
The Company’s warranty obligations may be materially affected by product or service failure rates and other costs incurred in correcting a product or service failure. Should actual product or service failure rates or other related costs differ from the Company’s estimates, revisions to the accrued warranty liability would be required.
The following table summarizes the changes in accrued warranty liability from December 31, 2009 to the year ended December 31, 2011:
F- 18
|
Balance at December 31, 2009
|
$
|
104
|
|
|
|
|
Warranties issued
|
103
|
|
|
||
|
Adjustment of warranty provision
|
(3
|
)
|
|||
|
Warranty claims
|
—
|
|
|
||
|
Balance at December 31, 2010*
|
204
|
|
|
||
|
Warranties issued
|
54
|
|
|
||
|
Adjustment of warranty provision
|
(24
|
)
|
|||
|
Warranty claims
|
(46
|
)
|
|
||
|
Balance at December 31, 2011*
|
$
|
188
|
|
||
* The balance at December 31, 2011 is included in other current liabilities ($37) and other long-term liabilities ($151). At December 31, 2010, the balance is included in other current liabilities ($56) and other long-term liabilities ($148).
Concentration of Credit Risk
Financial instruments, which potentially subject the Company to concentrations of credit risk, consist principally of cash and cash equivalents, escrowed deposits, short-term deposits, restricted deposits and accounts receivable. The Company’s cash, cash equivalents, escrowed deposits, short-term deposits and restricted cash deposits were deposited with U.S., Israeli and Australian banks and other financial institutions and amounted to $60,735 at December 31, 2011. The Company uses major banks and brokerage firms to invest its excess cash, primarily in money market funds and FDIC insured certificates of deposit through the Certificate of Deposit Account Registry Service. The Company also uses a major bank for its escrowed deposits. The Company does not believe there is significant risk of non-performance by the counterparties. The counterparty to the Company's restricted deposits are two major Israeli banks. The Company does not believe there is significant risk of non-performance by these counterparties. Related credit risk would result from a default by the financial institutions or issuers of investments to the extent of the recorded carrying value of these assets. Approximately 32% of the accounts receivable at December 31, 2011, were due from two customers (18% and 14%, respectively), both of whom pay their receivables over usual credit periods (as to revenues from significant customers – see Note 22(d)). Credit risk with respect to the balance of trade receivables is generally diversified due to the number of entities comprising the Company’s customer base. Approximately 71% of the balance in unbilled revenue at December 31, 2011 was due from two customers that when billed, pay their trade receivables over usual credit periods. Credit risk with respect to the balance of unbilled revenue is generally diversified due to the number of entities comprising our customer base.
Research and Development Expenses
Research and development expenses consist primarily of labor and related expenses and are charged to operations as incurred. Participation by third parties in the Company’s research and development costs as well as credits arising from qualifying research and experimental development expenditures are netted against research and development.
In connection with business combinations, amounts assigned to tangible and intangible assets to be used in a particular research and development project that have not reached technological feasibility and have no alternative future use are charged to acquired in-process research and development at the acquisition date.
Advertising Expenses
Advertising expenses are charged to operations as incurred. Advertising expense was $9, $66 and $127 for each the years ended December 31, 2009, 2010 and 2011, respectively.
Stock-Based Compensation
The Company accounts for stock-based awards to employees in accordance with applicable accounting principles, which requires compensation expense related to share-based transactions, including employee stock options, to be measured and recognized in the financial statements based on a determination of the fair value of the stock options. The grant date fair value is determined using the Black-Scholes-Merton (“Black-Scholes”) pricing model. For all employee stock options, we recognize expense over the requisite service period on an accelerated basis over the employee’s requisite service period (generally the vesting period of the equity grant). The Company’s option pricing model requires the input of highly subjective assumptions, including the expected stock price volatility, expected term, and forfeiture rate. Any changes in these highly subjective assumptions significantly impact stock-based compensation expense.
F- 19
Options awarded to purchase shares of common stock issued to non-employees in exchange for services are accounted for as variable awards in accordance with applicable accounting principles. Such options are valued using the Black-Scholes option pricing model.
See Note 18(d) and 18(e) for the assumptions used to calculate the fair value of stock-based employee and non-employee compensation. Upon the exercise of options, it is the Company’s policy to issue new shares rather than utilizing treasury shares.
Deferred Income Taxes
Deferred income taxes reflects the net tax effects of temporary differences between the carrying amounts of assets and liabilities for financial reporting purposes and the amounts used for income tax purposes, as well as operating loss, capital loss and tax credit carryforwards. Deferred tax assets and liabilities are classified as current or non-current based on the classification of the related assets or liabilities for financial reporting, or according to the expected reversal dates of the specific temporary differences, if not related to an asset or liability for financial reporting. Valuation allowances are established against deferred tax assets if it is more likely than not that the assets will not be realized. Deferred tax assets and liabilities are measured using enacted tax rates expected to apply to taxable income in the years in which those temporary differences are expected to be recovered or settled. The effect on deferred tax assets and liabilities of a change in tax rates or laws is recognized in operations in the period that includes the enactment date.
Income Tax Uncertainties
The calculation of the Company’s tax liabilities involves dealing with uncertainties in the application of complex tax regulations. The Company recognizes liabilities for uncertain tax positions based on the two-step process prescribed by applicable accounting principles. The first step is to evaluate the tax position for recognition by determining if the weight of available evidence indicates that it is more likely than not that the position will be sustained on audit, including resolution of related appeals or litigation processes, if any. The second step requires the Company to estimate and measure the tax benefit as the largest amount that is more than 50% likely of being realized upon ultimate settlement. It is inherently difficult and subjective to estimate such amounts, as this requires the Company to determine the probability of various possible outcomes. The Company reevaluates these uncertain tax positions on a quarterly basis. This evaluation is based on factors including, but not limited to, changes in facts or circumstances, changes in tax law, effectively settled issues under audit, and new audit activity. Such a change in recognition or measurement would result in the recognition of a tax benefit or an additional charge to the tax provision in the period. The Company recognizes interest and penalties as incurred in finance income (expense), net in the Consolidated Statements of Operations.
Basic and Diluted Net Income (Loss) Per Share
Basic net income (loss) per share is computed by dividing the net income (loss) attributable to Acorn Energy, Inc. by the weighted average number of shares outstanding during the year, excluding treasury stock. Diluted net income (loss) per share is computed by dividing the net income (loss) by the weighted average number of shares outstanding plus the dilutive potential of common shares which would result from the exercise of stock options and warrants. The dilutive effects of stock options and warrants are excluded from the computation of diluted net loss per share if doing so would be antidilutive. The weighted average number of options and warrants that were excluded from the computation of diluted net loss per share, as they had an antidilutive effect, was approximately 1,669,000, 2,095,000 and 867,000 for the years ending December 31, 2009, 2010 and 2011, respectively.
The following data represents the amounts used in computing EPS and the effect on net income and the weighted average number of shares of dilutive potential common stock:
F- 20
|
Year ended December 31,
|
||||||||||||
|
2009
|
2010
|
2011
|
||||||||||
|
Net income available to common stockholders
|
$
|
(5,756
|
)
|
$
|
(25,088
|
)
|
$
|
35,841
|
|
|||
|
Weighted average shares outstanding:
|
||||||||||||
|
-Basic
|
11,445
|
|
14,910
|
|
17,462
|
|
||||||
|
Add: Warrants
|
—
|
|
—
|
|
26
|
|
||||||
|
Add: Stock options
|
—
|
|
—
|
|
255
|
|
||||||
|
-Diluted
|
11,445
|
|
14,910
|
|
17,743
|
|
||||||
|
Basic net income per share
|
$
|
(0.50
|
)
|
$
|
(1.68
|
)
|
$
|
2.03
|
|
|||
|
Diluted net income per share
|
$
|
(0.50
|
)
|
$
|
(1.68
|
)
|
$
|
1.99
|
|
|||
Fair Value Measurement
The Company adopted the provisions of the accounting pronouncement which defines fair value, establishes a framework for measuring fair value and enhances fair value measurement disclosure. Under the provisions of the pronouncement, fair value is defined as the price that would be received to sell an asset or paid to transfer a liability (i.e., the “exit price”) in an orderly transaction between market participants at the measurement date.
The pronouncement establishes a hierarchy for inputs used in measuring fair value that maximizes the use of observable inputs and minimizes the use on unobservable inputs by requiring that the most observable inputs be used when available. Observable inputs are inputs that market participants would use in pricing the asset or liability developed based on market data obtained from sources independent of the Company. Unobservable inputs are inputs that reflect the Company’s assumptions about the assumptions market participants would use in pricing the asset or liability developed based on the best information available in the circumstances. The hierarchy is described below:
Level 1: Quoted prices (unadjusted) in active markets that are accessible at the measurement date for assets or liabilities. The fair value hierarchy gives the highest priority to Level 1 inputs.
Level 2: Observable prices that are based on inputs not quoted on active markets, but corroborated by market data.
Level 3: Unobservable inputs are used when little or no market data is available. The fair value hierarchy gives the lowest priority to Level 3 inputs.
Accumulated Comprehensive Income
The Company’s accumulated comprehensive income is comprised of $152, $637 and
$485
of differences from translation of subsidiaries’ financial statements as of December 31, 2009, 2010 and 2011, respectively. Included in aforementioned balances is $42, $0 and
$(16)
with respect to non-controlling interests as of December 31, 2009, 2010 and 2011, respectively.
Recently Issued Accounting Principles
With the exception of those stated below, there have been no recent accounting pronouncements or changes in accounting pronouncements during the year ended December 31, 2011, that are of material significance, or have potential material significance, to the Company.
In September 2011, the FASB issued ASU No. 2011-08, Testing Goodwill for Impairment ("ASU 2011-08") that gives an entity the option of performing a qualitative assessment to determine whether it is necessary to perform Step 1 of the annual goodwill impairment test. An entity is required to perform Step 1 only if it concludes that it is more likely than not that a reporting unit's fair value is less than its carrying amount. An entity may choose to perform the qualitative assessment on none, some or all of its reporting units or an entity may bypass the qualitative assessment for any reporting unit in any period and proceed directly to Step 1 of the impairment test. This guidance is effective for annual and interim goodwill impairment tests performed for fiscal years beginning after December 15, 2011, and early adoption is permitted. As discussed more fully in Note 12, the Company early
F- 21
adopted this guidance for its annual goodwill impairment test that was conducted in the fourth quarter of 2011.
In June 2011, the FASB issued ASU No. 2011-05, "Comprehensive Income (ASC Topic 220): Presentation of Comprehensive Income," ("ASU 2011-05") which amends current comprehensive income guidance. This accounting update eliminates the option to present the components of other comprehensive income as part of the statement of shareholders' equity. Instead, the Company must report comprehensive income in either a single continuous statement of comprehensive income which contains two sections, net income and other comprehensive income, or in two separate but consecutive statements. ASU 2011-05 will be effective for public companies during the interim and annual periods beginning after Dec. 15, 2011 with early adoption permitted. The Company does not believe that the adoption of ASU 2011-05 will have a material impact on the Company's consolidated results of operation and financial condition.
In May 2011, the FASB issued ASU 2011-04, "Fair Value Measurement (Topic 820): Amendments to Achieve Common Fair Value Measurement and Disclosure Requirements in U.S. GAAP and International Financial Reporting Standards ("IFRSs")." Under ASU 2011-04, the guidance amends certain accounting and disclosure requirements related to fair value measurements to ensure that fair value has the same meaning in U.S. GAAP and in IFRSs and that their respective fair value measurement and disclosure requirements are the same. ASU 2011-04 is effective for public entities during interim and annual periods beginning after December 15, 2011. Early adoption by public entities is not permitted. The Company does not believe that the adoption of ASU 2011-04 will have a material impact on the Company's consolidated results of operation and financial condition.
Reclassifications
Certain reclassifications have been made to the Company’s prior year's consolidated financial statements to conform to the current year’s consolidated financial statement presentation.
F- 22
(a) Investment in CoaLogix
On April 8, 2009, the Company entered into a Common Stock Purchase Agreement (the “Purchase Agreement”) with CoaLogix, EnerTech and certain members of CoaLogix’s senior management pursuant to which each of the Company and EnerTech agreed to purchase from CoaLogix 781,111 shares of common stock for a purchase price of $5,624 each, and certain members of CoaLogix’s senior management agreed to purchase 36,111 shares of common stock of CoaLogix for an aggregate purchase price of $259 for a total of $11,507. The Purchase Agreement provides that the Company, EnerTech and senior management will purchase such shares of common stock in stages as funding is needed by CoaLogix for plant expansion, technology development, legal expenses and computer software. Prior to the investments by EnerTech and certain members of CoaLogix’s senior management, the Company owned 85% of CoaLogix. Following completion of all the stages of the stock purchase under the Purchase Agreement, the Company owned approximately 72.3% of CoaLogix.
In 2009, CoaLogix issued capital calls of $5,620 of which the Company’s share was $2,747. Such capital calls were funded by the Company ($2,747), EnerTech ($2,747) and CoaLogix’ senior management ($126). At December 31, 2009, the Company’s interest in CoaLogix was diluted to approximately 77.4% as a result of these capital calls. In accordance with applicable accounting principles, the Company recorded an increase of $596 in additional paid-in-capital as a result of the $2,873 investment by non-controlling interests.
In 2010, CoaLogix issued capital calls of $5,887 of which the Company's share was $2,877. Such capital calls were funded by the Company ($2,877), EnerTech ($2,877) and CoaLogix’ senior management ($133). At December 31, 2010, the Company’s interest in CoaLogix was diluted to approximately 72.3% as a result of these capital calls. In accordance with applicable accounting principles, the Company recorded an increase of $587 in additional paid-in-capital as a result of the $3,010 investment by non-controlling interests in 2010. As of December 31, 2010, the Company owned approximately 65% of CoaLogix on a fully diluted basis.
The non-controlling interests’ share of CoaLogix’s net loss in the years ending December 31, 2009 and 2010 and the period from January 1, 2011 to August 31, 2011 was $626, $67 and $540, respectively.
(b) Sale of CoaLogix
On August 31, 2011 (the “Closing Date”), the Company completed its sale of its majority owned CoaLogix Inc. subsidiary (“CoaLogix”) pursuant to a Stock Purchase Agreement (the "Stock Purchase Agreement") with EnerTech Capital Partners III L.P., certain management employees of the CoaLogix subsidiary (collectively with the Company, the "Sellers"), CoaLogix and CoaLogix Holdings, Inc. (the "Buyer"), pursuant to which the Sellers sold all the outstanding capital stock of CoaLogix to the Buyer for $101 million (subject to certain adjustments) in cash. The Company owned approximately 65% of CoaLogix on a fully diluted basis and received $61,915 in consideration for its CoaLogix shares, of which $5,961 was deposited in an escrow account to secure possible indemnification claims which the Company expects to be released to it within one year from the Closing Date and $347 was deposited in an escrow account against a possible working capital shortfall and which was released to the Company in the fourth quarter of 2011.
In connection with the sale of the Company's shares of common stock of CoaLogix, the Company recorded a gain of $46,974 (included in the gain is $485 which was received as part of an additional working capital adjustment in the fourth quarter of 2011). The Company also recorded income taxes of $15,971 based on a Federal income tax rate of 34%. The net gain of $31,003 is reflected in the Company's Condensed Consolidated Statement of Operations as a “Gain on the sale of discontinued operations”. Concurrently, the Company recorded an income tax benefit of approximately $14,571 with respect to the recognition of previously unrecognized deferred tax assets primarily associated with previous years' net losses.
Assets and liabilities related to the discontinued operations of CoaLogix are as follows:
F- 23
|
December 31, 2010
|
August 31, 2011
|
|||||||
|
Current assets:
|
||||||||
|
Cash and cash equivalents
|
$
|
807
|
|
$
|
284
|
|
||
|
Restricted deposits
|
608
|
|
108
|
|
||||
|
Accounts receivable
|
3,600
|
|
3,123
|
|
||||
|
Unbilled revenue
|
54
|
|
587
|
|
||||
|
Inventory
|
3,200
|
|
4,810
|
|
||||
|
Other current assets
|
1,155
|
|
3,205
|
|
||||
|
Total current assets
|
9,424
|
|
12,117
|
|
||||
|
Property and equipment, net
|
10,453
|
|
9,781
|
|
||||
|
Intangible assets, net
|
3,961
|
|
4,233
|
|
||||
|
Goodwill
|
3,714
|
|
3,714
|
|
||||
|
Other assets
|
70
|
|
102
|
|
||||
|
Total assets
|
$
|
27,622
|
|
$
|
29,947
|
|
||
|
Current liabilities:
|
||||||||
|
Short-term bank credit and current maturities of long-term bank debt
|
$
|
223
|
|
$
|
723
|
|
||
|
Accounts payable
|
1,969
|
|
3,046
|
|
||||
|
Accrued payroll, payroll taxes and social benefits
|
512
|
|
442
|
|
||||
|
Other current liabilities
|
1,668
|
|
2,753
|
|
||||
|
Total current liabilities
|
4,372
|
|
6,964
|
|
||||
|
Long-term liabilities:
|
||||||||
|
Long-term debt
|
87
|
|
1,269
|
|
||||
|
Other long-term liabilities
|
347
|
|
391
|
|
||||
|
Total long-term liabilities
|
434
|
|
1,660
|
|
||||
|
Total liabilities
|
$
|
4,806
|
|
$
|
8,624
|
|
||
CoaLogix losses for the years ended December 31, 2009, 2010 and the period from January 1, 2011 to the Closing Date reflected as “Loss from discontinued operations, net of income taxes” in the Company's Consolidated Statements of Income. “Loss from discontinued operations, net of income taxes” in the Company's Consolidated Statements of Income also includes losses of $3,334 and $19,494 from the Company's former Coreworx subsidiary for the years ended December 31, 2009 and 2010, respectively (see Note 5(b)).
Summarized financial information for CoaLogix' operations for the years ended December 31, 2009, 2010 and the period from January 1, 2011 to the Closing Date are presented below:
F- 24
|
Year ended December 31, 2009
|
Year ended December 31, 2010
|
January 1, 2011 to August 31, 2011
|
|||||||||
|
Revenues
|
$
|
18,099
|
|
$
|
21,450
|
|
$
|
12,084
|
|
||
|
Cost of sales
|
11,803
|
|
14,333
|
|
8,837
|
|
|||||
|
Gross profit
|
6,296
|
|
7,117
|
|
3,247
|
|
|||||
|
Research and development expenses
|
86
|
|
166
|
|
390
|
|
|||||
|
Impairments
|
2,611
|
|
—
|
|
—
|
|
|||||
|
Selling, general and administrative expenses
|
6,326
|
|
7,245
|
|
4,786
|
|
|||||
|
Operating loss
|
(2,727
|
)
|
(294
|
)
|
(1,929
|
)
|
|||||
|
Finance expense, net
|
15
|
|
15
|
|
19
|
|
|||||
|
Net loss
|
(2,742
|
)
|
(309
|
)
|
(1,948
|
)
|
|||||
|
Net loss attributable to non-controlling interests
|
626
|
|
67
|
|
540
|
|
|||||
|
Net loss attributable to Acorn Energy Inc.
|
$
|
(2,116
|
)
|
$
|
(242
|
)
|
$
|
(1,408
|
)
|
||
F- 25
|
(a)
|
GridSense
|
(i) Privatization of GridSense
On June 15, 2009, GridSense Systems Inc. (“GSI”) effectively completed a plan which was approved by a majority of GSI's shareholders in February 2009, whereby GSI transferred its grid monitoring business to a newly formed private Australian corporation known as GridSense Pty Ltd. (“GPL”). Concurrently, certain GSI shareholders (including Acorn) transferred their shares to a third party and received shares in GPL. Under the plan, GPL assumed all the debt of GSI including its debt to Acorn. As a result, the Company’s percentage ownership in the grid monitoring business increased from approximately 23% (in GSI) to approximately 30% of the newly formed Australian corporation (GPL). The Company recorded no gain or loss on the privatization transaction. The carrying value of the Company’s investment in GPL was zero as was the carrying value of the Company’s investment in GSI prior to the going private transaction.
(ii) Acquisition of the Balance of GPL
On November 4, 2009, the Company entered into a binding Letter of Intent with GPL and the principal shareholders of GPL. The final Share Sale Agreement was entered into by and among the Company, GPL (“GridSense”), the GridSense stockholders and certain note holders of GridSense on May 12, 2010. Under the terms of the Share Sale Agreement, the Company acquired the outstanding GridSense shares that were not owned by it (approximately 70%).
The total purchase price for the acquisition of the balance GPL of $4,406 was comprised of the following: (1) the market value of the 206,995 shares of Acorn common stock issued to the former stockholders of GridSense ($1,085 - based on the market price of Acorn shares on the date of the transaction in accordance with generally accepted accounting principles); (2) the $882 of cash paid and the market value of the 149,201 shares of Acorn common stock issued ($782) for the purchase of the promissory notes; (3) $594 of cash that was provided to GridSense at closing to pay a stockholder loan; (4) an earn-out based on sales over a certain period which was estimated to be $287 (see below); and (5) $750 of loans provided to GridSense in 2009 ($550) and in 2010 ($200) in contemplation of the acquisition and accrued interest ($26) on those loans.
Under the Share Sale Agreement, the Company agreed to pay an earn-out to the stockholders of GridSense as part of the consideration for their shares. To the extent that GridSense’s sales for the period April 1, 2010 through March 31, 2011 exceed $4,384, the Company will pay the GridSense stockholders an amount equal to 50% of that excess, up to $2,435, multiplied by 69.86% (representing their ownership interest in GridSense) for a maximum earn-out payment of $1,701. The Company has the option of paying any earn-out in cash and/or shares of its common stock and has estimated this amount to be $287, which is included in the purchase price above. In the fourth quarter of 2010, the Company estimated that no earn-out would be paid and the earn-out, accordingly, was reduced to zero, with the credit being recorded to selling, general and administrative expense.
In connection with the acquisition of GridSense, the Company recorded a gain of $1,327 on the step-up of the Company’s previous carrying value of its investment in GridSense to fair value in accordance with generally accepted accounting principles for step acquisitions.
The transaction was accounted for as a purchase business combination. GridSense’s results from operations for the period from acquisition (May 12, 2010) to December 31, 2010 have been included in the Company’s consolidated statement of operations.
In accordance with generally accepted accounting principles, the fair value of GridSense is allocated to GridSense’s identifiable tangible and intangible assets and liabilities assumed based on their fair values as of the date of the completion of the transaction. Based upon a third-party valuation of intangible assets as of that date, the Company allocated the $5,733 of fair value to assets and liabilities as follows:
F- 26
|
Cash
|
$
|
124
|
|
|
Inventory
|
833
|
|
|
|
Other current assets
|
482
|
|
|
|
Property and equipment
|
71
|
|
|
|
Other assets
|
370
|
|
|
|
Intangible assets
|
2,314
|
|
|
|
Goodwill
|
3,655
|
|
|
|
Total assets acquired
|
7,849
|
|
|
|
|
|
|
|
|
Current liabilities
|
(2,003
|
)
|
|
|
Long-term debt
|
(23
|
)
|
|
|
Non-current liabilities
|
(90
|
)
|
|
|
Fair value acquired
|
$
|
5,733
|
|
|
|
|
|
|
|
Total purchase price
|
$
|
4,406
|
|
|
Previous carrying value of investment
|
—
|
|
|
|
Gain on step-up of fair value of prior ownership interest
|
1,327
|
|
|
|
|
$
|
5,733
|
|
Intangible assets with estimated useful lives are amortized over that period. The acquired intangible assets with useful lives include approximately $1,793 for the estimated market value of GridSense technologies, (weighted average estimated useful life of 11 years), $253 for the estimated market values of acquired customer relationships (estimated useful life of 10 years), $187 for the estimated market value of the GridSense trade name (estimated useful life of 15 years) and $81 for the estimated market value on non-compete agreements (estimated useful life of three years). The goodwill is not amortized for financial statement purposes in accordance with generally accepted accounting principles. The intangible assets and the goodwill acquired were assigned to the Company’s new GridSense segment. See Note 12(a) with respect to the impairment of goodwill associated to GridSense recorded by the Company in 2010.
(iii) Acquisition of OMI by GridSense
On May 20, 2010, GridSense acquired the assets of On-Line Monitoring Inc. (“OMI”), a manufacturer of on-line substation monitoring equipment based in Exton, PA.
Under the terms of the Asset Purchase Agreement, GridSense acquired all the assets (including receivables, inventory, equipment and intellectual property) and assumed certain liabilities of OMI as defined. The net liabilities assumed by GridSense in the transaction were $352. In addition, GridSense agreed to pay to the seller of OMI an incremental sales payment equal to the dollar amount of orders received for OMI products for the period from July 1, 2010 to June 30, 2011 which is in excess of $450. In accordance with the Asset Purchase Agreement, the incremental sales payment could be no more than $200. The Company estimated the incremental sales payment to be $50, and accordingly, the purchase price of OMI was $402. No incremental sales payment was due based upon the sales for OMI products during the period from July 1, 2010 to June 30, 2011 and accordingly, the Company reduced its liability for the incremental sales payment to zero, with the credit being recorded to selling, general and administrative expense.
The transaction was accounted for as a purchase business combination. In accordance with generally accepted accounting principles, the purchase price of $402 of OMI was allocated to identifiable tangible and intangible assets and liabilities assumed based on their fair values as of the date of the completion of the transaction. The Company has allocated the fair value as follows:
F- 27
|
Accounts receivable
|
$
|
16
|
|
|
Inventory
|
23
|
|
|
|
Equipment
|
41
|
|
|
|
Intangible assets
|
322
|
|
|
|
Total assets acquired
|
402
|
|
|
|
|
|
|
|
|
Current liabilities
|
(352
|
)
|
|
|
Estimated earn-out payment
|
(50
|
)
|
|
|
Total liabilities acquired
|
$
|
(402
|
)
|
The acquired intangible assets with estimated useful lives is comprised of approximately $222 for the estimated fair market value of OMI’s intellectual property (estimated useful life of five years) and $100 for non-compete agreements to certain employees (estimated useful life of three years). The intangible assets acquired were assigned to the Company’s new GridSense segment.
|
(b)
|
U.S. Seismic Systems, Inc. ("USSI") (formerly known as U.S. Sensor Systems, Inc.)
|
On November 27, 2009, the Company signed a term sheet with USSI, whereby subject to definitive agreements, it agreed to acquire an approximate 4% interest (on a fully diluted basis) in USSI for $200. USSI is a Delaware corporation based in Chatsworth, California. USSI's primary focus is to develop and produce fiber optic sensing systems for the energy and defense markets.
The Company accounted for its initial investment in USSI under the cost method in accordance with applicable accounting principles.
(i) Acorn Investment and Option Agreements
On February 23, 2010, following its $200 investment in USSI common stock in November 2009, the Company entered into an option agreement with USSI and a related option agreement with certain stockholders of USSI (the “Option Agreements”).
Immediately following the signing of the Option Agreements, the Company exercised an option and purchased an additional 95,469 shares of USSI on February 23, 2010 for $300. Of the $500 the Company initially paid to USSI with respect to the acquisition of shares and options, the Company has allocated $100 of the purchase price to the value of the options received with the remaining $400 being allocated to the initial 10% investment in USSI imputing a fair value of USSI of $4,100.
Under the terms of the Option Agreements, the Company had the right to acquire up to an additional 254,854 shares of USSI’s common stock for a purchase price of $800 as follows:
|
•
|
The Company had the right to acquire 95,469 of these shares under the option in consideration for payment of $300 on or before March 31, 2010. (This option was exercised immediately following the signing of the Option Agreements).
|
|
•
|
The Company had the right to acquire 63,646 of these shares in consideration for payment of $200 on or before May 31, 2010. (This option was exercised on May 23, 2010)
|
|
•
|
The Company had the right to acquire an additional 95,469 shares on or before August 27, 2010 in consideration for payment of $300 (This option was exercised in part ($40) on June 14, 2010 and the balance ($260) on August 23, 2010).
|
On August 23, 2010, the Company acquired 516,378 shares of USSI common stock held by stockholders in consideration for payment to them of $2,229. The purchase price for these shares was made in the Company’s common stock which was priced on the basis of the average of the daily volume weighted average of the Company’s common stock for the 20 trading days ending on the day that is five days prior to August 23, 2010 (the exercise date). The Company used its treasury stock as consideration for these shares. The shares of the Company’s common stock issued to the USSI stockholders in consideration for their shares were restricted securities under Securities Act of 1933 and were subject to a lock-up by certificate legend. All of these shares have been released from the lock-up as at December 31, 2011. Following these option exercises, the Company owned common stock of USSI representing approximately 57.6% of USSI’s capitalization.
Under the Option Agreements, the Company had the right to acquire 1,693,391 additional shares of USSI’s common stock from USSI on or before November 30, 2010 in consideration for payment of $1,500. On November 4, 2010, the Option Agreements were amended such that the Company may exercise options on a monthly basis (November 30, 2010, December 30, 2010, January 31, 2011, February 28, 2011, March 30, 2011 and May 1, 2011) with a payment of $250 per exercise (the “Monthly Options”). The options could only be exercised sequentially, and if the Company did not exercise a particular option, all subsequent options
F- 28
would expire.
Through December 31, 2010, the Company exercised the first two of the Monthly Options and the Company owned 1,155,160 shares of USSI’s common stock representing 65.6% of USSI’s capitalization.
If the Company exercised all of the Monthly Options, it would have the right to acquire 1,693,391 additional shares of common stock from USSI (increasing its holdings to 87.4% of USSI's capitalization) on or before May 30, 2011 in consideration for payment of $1,500.
On January 25, 2011 the Company exercised one of its options to increase its investment in USSI and transferred $250 to USSI. On February 9, 2011, the Company exercised additional options and transferred an additional $750 to USSI. Following these option exercises, the Company increased its holdings in USSI to 80.6%. The Company's final option to invest $1,500 in USSI and increase its holdings to 87.4% expired in May 2011. In the period from June to December 2011, the Company advanced USSI $2,000 in contemplation of a new investment agreement. (See Note 26 - Subsequent Events).
In 2010, in accordance with generally accepted accounting principles, the Company recorded an adjustment of $2,224 to the non-controlling interests balance initially recorded with respect to the Company’s investment in USSI to reflect the updated balance of the non-controlling interests share in USSI to $1,376. The non-controlling interest’s share of USSI’s loss in the year ended December 31, 2010 was $776.
In 2011, in accordance with generally accepted accounting principles, the Company recorded an adjustment of $600 to the non-controlling interests balance initially recorded with respect to the Company’s investment in USSI to reflect the updated balance of the non-controlling interests share in USSI to $776. The non-controlling interest’s share of USSI’s loss in the year ended December 31, 2011 was $571.
(ii) USSI as a Consolidated Variable Interest Entity
As a result of the above-mentioned investments and option agreements, USSI was deemed a variable interest entity by virtue of the Company's initial $500 investment and the call options that gave the Company control of USSI within a short period of time and were considered "in-the-money". USSI was dependent upon the Company exercising its options under the Option Agreements for it cash requirements. The Company considered several factors to determine whether it or another stockholder is the primary beneficiary of the activities of USSI, including the existence of the Company's options in USSI and the likelihood of the Company's exercising those options as well as the level of control and influence the Company has in USSI and USSI's dependence on the Company's exercising its options in order to finance its operations. Based on those factors, the Company determined that it is most closely associated with USSI and is therefore the primary beneficiary. Accordingly, the financial results of USSI are included in the Company’s consolidated financial statements effective February 23, 2010 and all amounts pertaining to other stockholders’ interests in USSI are reported as non-controlling interests in subsidiaries. USSI is presented as the Company’s new USSI segment.
The transaction is accounted for as a purchase business combination. USSI’s results from operations for the period from acquisition (February 23, 2010) have been included in the Company’s consolidated statement of operations.
In accordance with generally accepted accounting principles, the $4,100 of initial fair value of USSI is allocated to USSI’s identifiable tangible and intangible assets and liabilities assumed based on their fair values as of the date of the completion of the transaction. The Company has received third-party valuation of intangible assets as of that date, for the purposes of allocating the fair value to assets and liabilities and has allocated the purchase price as follows:
F- 29
|
Cash
|
$
|
307
|
|
|
Other current assets
|
37
|
|
|
|
Property and equipment
|
56
|
|
|
|
Other assets
|
18
|
|
|
|
Intangible assets
|
2,565
|
|
|
|
Goodwill
|
1,402
|
|
|
|
Total assets acquired
|
4,385
|
|
|
|
|
|
|
|
|
Current liabilities
|
(285
|
)
|
|
|
Fair value acquired
|
$
|
4,100
|
|
The third-party valuation of intangible assets with estimated useful lives are amortized over that period. The acquired intangible assets with useful lives are comprised of approximately $2,565 for the estimated fair market value of USSI's sensor technologies (estimated useful life of 20 years). Neither the goodwill nor the intangibles resulting from the acquisition are deductible for income tax purposes. The goodwill is not amortized for financial statement purposes in accordance with applicable accounting principles. The intangible assets and the goodwill acquired were assigned to the Company’s new USSI segment. Pro-forma information with respect to GridSense, OMI and USSI are not required as they are not material.
F- 30
(a) Acquisition of Decision Dynamics Technology Ltd.
On April 30, 2010, the Company's former subsidiary (see Note 5(b)), Coreworx, completed the acquisition of all of the issued and outstanding common shares of Decision Dynamics Technology Ltd., a Canadian corporation (“Decision Dynamics”), in consideration for issuance of 1,000,000 shares of the Company's common stock to the stockholders of Decision Dynamics. Decision Dynamics is a provider of capital project controls and cost management software for normal operations and capital projects in the energy industry and, until completion of the acquisition by Coreworx, had been a TSX Venture Exchange-traded company.
The acquisition was structured as a plan of arrangement under the Canada Business Corporations Act and was subject to approval by the holders of at least two-thirds of the outstanding common shares and options of Decision Dynamics, each voting as a separate class, which was obtained at a meeting held on April 27, 2010. The acquisition was also approved on April 29, 2010 by the Court of Queen's Bench of Alberta, which conducted a hearing upon the fairness of the terms of the transaction.
Of the Company's shares issued in connection with completion of the acquisition, approximately 340,000 were escrowed at closing, with one-half released 90 days after the date of closing (July 29, 2010) and the balance to be released 180 days after the date of closing (October 27, 2010). Subject to such escrow, the shares issued to the Decision Dynamics stockholders are freely tradable under US federal securities laws. The issuance of the Company’s common stock to the Decision Dynamics stockholders was made without registration under the Securities Act of 1933, as amended, in reliance upon Section 3(a) (10).
The transaction was accounted for as a purchase business combination. Decision Dynamics’ results from operations for the period from acquisition (April 30, 2010) were included in the Company’s consolidated statement of operations (see Note 5(b) – Deconsolidation of Coreworx).
The purchase price of $5,640 represents the market value of the 1,000,000 shares of Acorn common stock issued to the former stockholders of Decision Dynamics (based on the closing price of Acorn shares on the date of the transaction in accordance with generally accepted accounting principles).
The assets and liabilities of Decision Dynamics were required to be adjusted to their fair values. The fair value of Decision Dynamics is allocated to identifiable tangible and intangible assets and liabilities assumed based on their fair values as of the date of the completion of the transaction. Based upon a third-party valuation of intangible assets as of that date, the Company allocated the $5,640 purchase price to assets and liabilities as follows:
|
Cash
|
$
|
1,021
|
|
|
Other current assets
|
1,149
|
|
|
|
Property and equipment
|
339
|
|
|
|
Intangible assets
|
1,248
|
|
|
|
Goodwill
|
2,476
|
|
|
|
Total assets acquired
|
6,233
|
|
|
|
|
|
|
|
|
Current liabilities
|
(593
|
)
|
|
|
Fair value acquired
|
$
|
5,640
|
|
Intangible assets with estimated useful lives are amortized over that period. The acquired intangible assets with useful lives include approximately $367 for the estimated market value of Decision Dynamics’ customer contracts and relationships (estimated useful life of eight years) and approximately $881 for the estimated market value of Decision Dynamics’ software (estimated useful life of 12 years). The goodwill of $2,476 was not amortized for financial statement purposes in accordance with generally accepted accounting principles.
(b) Deconsolidation of Coreworx
On November 9, 2010, following a decision by the Company’s board of directors to cease providing funding for Coreworx, the Company entered into a letter of intent with Coreworx (the “Letter of Intent”) for the Company to sell all of its common stock in Coreworx to a management buyout group consisting of Coreworx’ management, certain employees and other investors. On December 17, 2010, the Company and Coreworx entered into agreements (the “MBO Transaction”) to effectuate the terms of the
F- 31
Letter of Intent and close on the transactions described therein, which agreements included a Share Exchange Agreement, Debt Conversion Agreement, Amended and Restated Loan Agreement and other ancillary agreements and documents (collectively the “Transaction Documents”). The Company has not attributed any value to the any of the instruments noted below. Under the terms of the Transaction Documents:
|
i.
|
|
Coreworx’ remaining indebtedness owed to the Company of approximately $5,436 was reduced by $1,436 to $4,000 with the Company exchanging all of its shares of common stock of Coreworx for 10% (or 3,625,209 shares) of the newly issued and outstanding shares of common stock of Coreworx with such shares received by the Company being non-voting shares (“New Coreworx Shares”);
|
|
ii.
|
|
The Company received a warrant to acquire 3,625,209 shares of common stock of Coreworx for C$0.10 (US$ 0.10) per share for 5 years from the closing date, Dec. 17, 2010. The warrant represent 10% of Coreworx current common stock outstanding.
|
|
iii.
|
|
The debt of $4,000 owed by Coreworx to the Company (the “Coreworx Debt”) is non-interest bearing, and the first payment is due January 31, 2012.
|
|
iv.
|
|
The Coreworx Debt shall be repaid in an amount equal to 4% of Coreworx’ gross revenues commencing at the date of closing, and payments for the period commencing on the closing date through December 31, 2011 are to be paid in 12 equal monthly installments starting on January 31, 2012 and on the last day of each of the following 11 months.
|
|
v.
|
|
The payments of the Coreworx Debt for revenue periods subsequent to Coreworx’ 2011 fiscal year will be payable on a quarterly basis within 45 days following the end of Coreworx’ fiscal quarter-end periods.
|
|
vi.
|
|
Following repayment of the Coreworx Debt, Coreworx is to pay the Company a royalty fee (the “Royalty”) equal to 4% of Coreworx’ gross revenues up to a maximum amount of $20,000.
|
|
vii
|
|
The Royalty shall be paid on a quarterly basis within 45 days following the end of Coreworx’ fiscal quarter-end periods.
|
|
vii
|
|
Coreworx shall pay the Company a restructuring fee of $40 on or before July 1, 2011.
|
Repayment of the Coreworx Debt is secured by a security interest in Coreworx’ intellectual property on a pari passu basis with the other holders of Coreworx’ common stock following closing which necessitated the Company releasing at closing its prior security interest in Coreworx’ other personal property and intangibles.
In connection with the sale of the Company’s shares of common stock of Coreworx, the Company recorded a gain of $1,834 as a result of the deconsolidation of Coreworx which is included in Loss from discontinued operations in the Company’s Consolidated Statements of Income.
The gain on the deconsolidation of Coreworx is comprised of the following:
|
•
|
A gain of $5,929 on the deconsolidation of Coreworx of assets and liabilities.
|
|
•
|
A full provision on the Coreworx Debt of $4,000 due the Company from Coreworx following the MBO Transaction as there is significant doubt as to Coreworx' ability to repay the debt.
|
|
•
|
An estimated $95 of legal fees.
|
In addition, Coreworx losses of $3,334 and $19,494 for the year ended December 31, 2009 and for the period from January 1, 2010 to December 17, 2010, respectively, are reflected as Loss from discontinued operations, net of income taxes in the Company’s Consolidated Statements of Income. The Company’s Loss from discontinued operations, net of income taxes in 2010 includes an impairment of the Company’s goodwill and other intangible assets related to Coreworx of $9,474 representing the
F- 32
book value of the goodwill ($4,970) and other intangible assets ($4,504) related to Coreworx (see Note 12(b)). The impairments were recorded as at October 31, 2010 following the Company’s decision to stop funding Coreworx and included in Loss from discontinued operations, net of income taxes in the Company’s Consolidated Statements of Income.
Net assets related to the discontinued operations of Coreworx are as follows:
|
|
December 31,
2009
|
||
|
|
|
||
|
Cash and cash equivalents
|
$
|
306
|
|
|
Accounts receivable, net
|
140
|
|
|
|
Other current assets
|
519
|
|
|
|
Total current assets of discontinued operations
|
965
|
|
|
|
|
|
|
|
|
Property and equipment, net
|
151
|
|
|
|
Intangible assets, net
|
3,468
|
|
|
|
Goodwill
|
2,431
|
|
|
|
Other assets
|
23
|
|
|
|
Total non-current assets of discontinued operations
|
6,073
|
|
|
|
Total assets of discontinued operations
|
$
|
7,038
|
|
|
|
|
|
|
|
Accounts payable
|
$
|
415
|
|
|
Accrued payroll, payroll taxes and social benefits
|
95
|
|
|
|
Other current liabilities
|
1,166
|
|
|
|
Total current liabilities of discontinued operations
|
1,676
|
|
|
|
|
|
|
|
|
Other liabilities
|
95
|
|
|
|
Total non-current liabilities of discontinued operations
|
95
|
|
|
|
Total liabilities of discontinued operations
|
$
|
1,771
|
|
|
|
|
|
|
|
Net assets of discontinued operations
|
$
|
5,267
|
|
Summarized financial information for Coreworx’ operations for the year ended December 31, 2009 and for the period January 1, 2010 to December 17, 2010 are below:
|
|
Year
ended
December 31, 2009
|
Period from
January 1–
December 17,
2010
|
||||||
|
Revenues
|
$
|
3,999
|
|
$
|
3,200
|
|
||
|
Cost of sales
|
698
|
|
741
|
|
||||
|
Gross profit
|
3,301
|
|
2,459
|
|
||||
|
Research and development expenses, net of credits of $1,016 in 2009
|
26
|
|
2,440
|
|
||||
|
Impairments
|
—
|
|
9,474
|
|
||||
|
Selling, general and administrative expenses
|
6,489
|
|
10,036
|
|
||||
|
Operating loss
|
(3,214
|
)
|
(19,491
|
)
|
||||
|
Finance expense, net
|
145
|
|
3
|
|
||||
|
Loss before taxes on income
|
(3,359
|
)
|
(19,494
|
)
|
||||
|
Income tax benefit
|
25
|
|
—
|
|
||||
|
Net loss
|
$
|
(3,334
|
)
|
$
|
(19,494
|
)
|
||
The Company did not attribute any value to the 10% holdings retained by the Company following the sale of its stake in
F- 33
Coreworx on December 17, 2010, the warrants to acquire an additional 10% of Coreworx, the $4,000 of Coreworx Debt or the $40 restructuring fee due from Coreworx on July 1, 2011.
On October 31, 2011, the Company sold its 10% stake in Coreworx and the entire $4,000 of Coreworx Debt, its right to future royalties and the $40 restructuring fee (which was at the time still unpaid) back to Coreworx for $100. The Company recorded a $64 gain (net of income taxes of $34) on the transaction in Gain on the sale of discontinued operations, net of income taxes in the Company's Consolidated Statements of Operations. The Company still retains its warrants to acquire 10% of Coreworx.
F- 34
During the year ended December 31, 2009, the Company sold all of the 502,500 Comverge shares it held at the beginning of 2009. The Company received proceeds of $3,990 (including $112 received from covered-call options) and recorded a pre-tax gain of $1,403 on the sale of these shares. The $125 that was included in accumulated other comprehensive loss at December 31, 2008 was eliminated following the sale of the Comverge shares in 2009.
F- 35
|
(a)
|
EnerTech Capital Partners
|
In August 2007, the Company committed to invest up to $5,000 over a ten-year period in EnerTech, a proposed $250 million venture capital fund targeting early and expansion stage energy and clean energy technology companies that can enhance the profits of the producers and consumers of energy. Through November 2010, the Company funded $3,050 of its $5,000 investment commitment in EnerTech and owned approximately 5.7% of EnerTech. The Company accounted for its investment in EnerTech under the cost method in accordance with applicable accounting principles. In December 2010, the Company sold its investment in EnerTech and received proceeds of $1,116. Accordingly, the Company recorded a loss of $1,821 on the sale. As a result of the sale, the Company no longer has any commitment to fund capital calls in EnerTech.
The following table summarizes the Company's investment in EnerTech.
|
|
Gross Carrying
Amount
|
||
|
Balance at December 31, 2008
|
$
|
1,117
|
|
|
Capital calls during the year ended December 31, 2009
|
1,000
|
|
|
|
Impairments recorded during the year ended December 31, 2009
|
(80
|
)
|
|
|
Balance at December 31, 2009
|
2,037
|
|
|
|
Capital calls during the year ended December 31, 2010
|
900
|
|
|
|
Proceeds from sale
|
(1,116
|
)
|
|
|
Loss on sale
|
(1,821
|
)
|
|
|
Balance at December 31, 2010
|
$
|
—
|
|
During 2010, the Company received a distribution from EnerTech of $135 which is reflected in the Consolidated Statements of Operations as distributions received from EnerTech.
|
(b)
|
Paketeria
|
The Company accounted for its investment in Paketeria using the equity method in accordance with applicable accounting principles. As a result of the losses recorded in the year ended December 31, 2008, the Company’s net investment in Paketeria was written down to zero.
In the third quarter of 2009, liquidation proceedings began with respect to Paketeria. As a result of the liquidation proceedings, the Company eliminated the previously recorded cumulative translation adjustment of $263 associated with the investment in Paketeria and recognized that amount as share of income in Paketeria. In the fourth quarter of 2009, the Company sold its investment in Paketeria for a nominal amount.
|
(c)
|
HangXing
|
In March 2011, the Company sold its 25% interest in HangXing International Automation Engineering Co. Ltd. (“HangXing”) back to the majority owner, China Aero-Polytechnology Establishment for $492 ($454 net of taxes withheld). HangXing is a value-added reseller for PLC based industrial automation systems for steel manufacturing. Acorn’s investment of approximately $250 in HangXing was made in 1995. The investment was entirely written-off in 1999.
F- 36
The composition of the net loss attributable to non-controlling interests (“NCI”) is as follows:
|
|
Year ended December 31,
|
|||||||||||
|
|
2009
|
2010
|
2011
|
|||||||||
|
Net (income) attributable to NCI in DSIT
|
$
|
(206
|
)
|
$
|
(181
|
)
|
$
|
(22
|
)
|
|||
|
Net loss attributable to NCI in USSI
|
—
|
|
776
|
|
571
|
|
||||||
|
Net loss attributable to NCI
|
$
|
(206
|
)
|
$
|
595
|
|
$
|
549
|
|
|||
F- 37
|
|
As of December 31,
|
|||||||
|
|
2010
|
2011
|
||||||
|
Raw materials
|
$
|
507
|
|
$
|
1,663
|
|
||
|
Work-in-process
|
18
|
|
481
|
|
||||
|
Finished goods
|
589
|
|
—
|
|
||||
|
|
$
|
1,114
|
|
$
|
2,144
|
|
||
The Company had no reserves on its inventory at either December 31, 2010 or 2011.
F- 38
|
|
As of December 31,
|
|||||||
|
|
2010
|
2011
|
||||||
|
Prepaid expenses and deposits
|
$
|
169
|
|
$
|
284
|
|
||
|
Taxes receivable
|
—
|
|
504
|
|
||||
|
Employee advances
|
65
|
|
132
|
|
||||
|
Derivative assets
|
93
|
|
—
|
|
||||
|
Other
|
6
|
|
2
|
|
||||
|
|
$
|
333
|
|
$
|
922
|
|
||
F- 39
Property and equipment consists of the following:
|
|
Estimated Useful Life (in years)
|
As of December 31,
|
||||||||
|
|
|
2010
|
2011
|
|||||||
|
Cost:
|
|
|
|
|
|
|||||
|
Computer hardware and software
|
2 - 5
|
$
|
616
|
|
$
|
779
|
|
|||
|
Equipment
|
4 - 10
|
471
|
|
700
|
|
|||||
|
Vehicles
|
3
|
16
|
|
40
|
|
|||||
|
Leasehold improvements
|
Term of
lease
|
387
|
|
410
|
|
|||||
|
|
|
1,490
|
|
1,929
|
|
|||||
|
Accumulated depreciation and amortization
|
|
|
|
|
|
|||||
|
Computer hardware and software
|
|
445
|
|
547
|
|
|||||
|
Equipment
|
|
245
|
|
367
|
|
|||||
|
Vehicles
|
|
5
|
|
15
|
|
|||||
|
Leasehold improvements
|
|
305
|
|
365
|
|
|||||
|
|
|
1,000
|
|
1,294
|
|
|||||
|
Property and equipment, net
|
|
$
|
490
|
|
$
|
635
|
|
|||
Depreciation and amortization in respect of property and equipment amounted to $140, $219 and $317 for 2009, 2010 and 2011, respectively.
F- 40
(a) Goodwill
The changes in the carrying amounts of goodwill by segment from December 31, 2009 to December 31, 2011 were as follows:
|
|
Energy & Security Sonar Solutions segment
|
GridSense segment
|
USSI segment
|
Total
|
||||||||||||
|
Balance as of December 31, 2009
|
$
|
534
|
|
$
|
—
|
|
$
|
—
|
|
$
|
534
|
|
||||
|
Goodwill recorded in the acquisition of GridSense
(see Note 4(a)(ii))
|
—
|
|
3,655
|
|
—
|
|
3,655
|
|
||||||||
|
Goodwill recorded in the acquisition of USSI
(see Note 4(b)(ii))
|
—
|
|
—
|
|
1,402
|
|
1,402
|
|
||||||||
|
Translation adjustment
|
34
|
|
220
|
|
—
|
|
254
|
|
||||||||
|
Goodwill impairment
|
—
|
|
(1,166
|
)
|
—
|
|
(1,166
|
)
|
||||||||
|
Balance as of December 31, 2010
|
568
|
|
2,709
|
|
1,402
|
|
4,679
|
|
||||||||
|
Translation adjustment
|
(41
|
)
|
(1
|
)
|
(42
|
)
|
||||||||||
|
Balance as of December 31, 2011
|
$
|
527
|
|
$
|
2,708
|
|
$
|
1,402
|
|
$
|
4,637
|
|
||||
As required, the Company performs an annual impairment test of recorded goodwill (during the fourth quarter of each year), or more frequently if impairment indicators or triggering events are present. In September 2011, the FASB issued guidance that simplified how entities test for goodwill impairment. This guidance permits entities to first assess qualitative factors to determine whether it is more likely than not that the fair value of a reporting unit is less than its carrying amount as a basis for determining whether it is necessary to perform a two-step goodwill impairment test. We early adopted this guidance for our annual goodwill impairment test that was conducted in the fourth quarter of 2011. In 2010, when performing the two-step goodwill impairment test, the fair value of the goodwill of each segment was determined by using a discounted cash flow methodology based on projections of the amounts and timing of future revenues and cash flows, assumed discount rates and other assumptions as deemed appropriate.
In performing the 2011 goodwill impairment test for each of our reporting units, we assessed the relevant qualitative factors and concluded that it is more likely than not that the fair values of our reporting units are greater than their carrying amounts. After reaching this conclusion, no further testing was performed. The qualitative factors we considered included, but were not limited to, general economic conditions, industry and market conditions, pipeline and backlog, our recent and forecasted financial performance and the price of the Company's common stock.
In April, 2010, the Company recorded goodwill of $2,476 associated with Coreworx’ acquisition of Decision Dynamics (see Note 5(a)). In October 2010, The Company recorded an impairment of the Company’s goodwill ($4,970) related to Coreworx (see Note 5(b)). The impairment was recorded at October 31, 2010 following the Company’s decision to stop funding Coreworx which was deemed to be a triggering event. The impairment associated with Coreworx is comprised of the $2,476 of goodwill associated with Decision Dynamics, $2,431 of goodwill associated with Coreworx (acquired in 2008) and $63 of cumulative translation adjustments. The impairment of $4,970 is included in Loss from Discontinued Operations in the Company’s Consolidated Statements of Income. In addition, in 2010, as a result of the annual impairment test of the goodwill recorded with respect to the Company’s GridSense reporting unit, the Company recorded a goodwill impairment charge of $1,166. The impairment test was based upon expected discounted cash flows from the Company’s GridSense reporting unit.
No impairment was recorded in the year ended December 31, 2009.
(b) Intangibles
(i) Discontinued operations - Coreworx
On April 23, 2009, the Company’s former Coreworx subsidiary signed an agreement with ProExecute LLC for the rights to its Contract Management Solution technology (“ProExecute”). The Company determined that the acquisition of ProExecute should
F- 41
be recorded as a business combination under applicable accounting principles, as Coreworx acquired substantially all of the net assets of the ProExecute business including its core intellectual property, full use of ProExecute’s physical assets, as well as the access to all intellectual knowledge. In accordance with applicable accounting principles, the Company recorded the assets acquired and the liabilities assumed (including any contractual contingencies) measured at their fair values as of the date of acquisition. The Company determined that the fair value of the acquired assets on the date of acquisition was $99, all of which was allocated to license technology – an amortizable intangible asset. This asset was being amortized over a 30-month period until the deconsolidation of Coreworx (see Note 5(b)) and was included in the Company’s Coreworx segment.
In April, 2010, the Company recorded intangibles of $1,248 associated with Coreworx’ acquisition of Decision Dynamics (see Note 5(a)). In October 2010, The Company recorded an impairment of the Company’s intangibles ($4,504) related to Coreworx (see Note 5(b)). The impairment was recorded as at October 31, 2010 following the Company’s decision to stop funding Coreworx which was deemed to be a triggering event. The impairment associated with Coreworx is comprised of the $1,248 of intangibles associated with Decision Dynamics (net of accumulated amortization of $97), $3,841 of intangibles associated with Coreworx (net of accumulated amortization of $583) and $95 of cumulative translation adjustments. The impairment of $4,504 is included in Loss from discontinued operations, net of income taxes in the Company’s Consolidated Statements of Income.
(ii) Discontinued operations - CoaLogix
In May 2008, the Company’s CoaLogix subsidiary entered into a strategic alliance and license agreement with Solucorp Industries, Ltd. (“Solucorp”) pursuant to which CoaLogix obtained exclusive, worldwide commercialization and marketing rights to Solucorp’s IFS-2C technology ("MetalliFix") for use in applications which remove heavy metals, such as mercury, from power plant emissions. The agreement had a term of ten years, with an option in favor of CoaLogix to renew for an additional five-year period. In consideration for its rights under the agreement, CoaLogix paid a license fee of $2,000 and agreed to pay royalties on net sales of, and to share a portion of any royalties received in respect of, licensed product with Solucorp based on specified formula. The license fee of $2,000 was included in the intangibles of the Company's CoaLogix segment. On December 31, 2009, the Company recorded an impairment charge of $1,672 associated with the unamortized balance of the Solucorp license. Such impairment is included in Loss from discontinued operations, net of income taxes (see Note 3(b)).
In 2010, CoaLogix signed an agreement to acquire a license to use certain technology developed by a third-party for $82. CoaLogix was amortizing the license over its estimated useful life of 115 months. The license agreement was terminated by CoaLogix in May 2011. Accordingly, CoaLogix wrote-off the $74 unamortized balance of the license. Such impairment is included in Loss from discontinued operations, net of income taxes (see Note 3(b)).
(iii) Summary
The changes in the carrying amounts of and accumulated amortization of intangible assets from December 31, 2009 to December 31, 2011 were as follows:
F- 42
|
|
Energy &
Security Sonar
Solutions
segment
|
GridSense segment
|
USSI segment
|
|
||||||||||||||||||||||||
|
|
Naval
Technologies
|
Software and
Customer
Relationships
|
Sensor
Technologies
|
|
||||||||||||||||||||||||
|
|
Cost
|
A.A.*
|
Cost
|
A.A.*
|
Cost
|
A.A.*
|
Total
|
|||||||||||||||||||||
|
Balance as of December 31, 2008
|
$
|
523
|
|
$
|
(48
|
)
|
$
|
—
|
|
$
|
—
|
|
$
|
—
|
|
$
|
—
|
|
$
|
475
|
|
|||||||
|
Amortization
|
—
|
|
(78
|
)
|
—
|
|
—
|
|
—
|
|
—
|
|
(78
|
)
|
||||||||||||||
|
Cumulative translation adjustment
|
4
|
|
(2
|
)
|
—
|
|
—
|
|
—
|
|
—
|
|
2
|
|
||||||||||||||
|
Balance as of December 31, 2009
|
527
|
|
(128
|
)
|
—
|
|
—
|
|
—
|
|
—
|
|
399
|
|
||||||||||||||
|
Intangibles recorded in the acquisition of USSI (see Note 4(b)(ii))
|
—
|
|
—
|
|
—
|
|
—
|
|
2,565
|
|
—
|
|
2,565
|
|
||||||||||||||
|
Intangibles recorded in the acquisition of GridSense (see Note 4(a)(ii))
|
—
|
|
—
|
|
2,314
|
|
—
|
|
—
|
|
—
|
|
2,314
|
|
||||||||||||||
|
Intangibles recorded in the acquisition of OMI (see Note 4(a)(iii))
|
—
|
|
—
|
|
322
|
|
—
|
|
—
|
|
—
|
|
322
|
|
||||||||||||||
|
Amortization
|
—
|
|
(65
|
)
|
—
|
|
(212
|
)
|
—
|
|
(107
|
)
|
(384
|
)
|
||||||||||||||
|
Cumulative translation adjustment
|
33
|
|
(14
|
)
|
111
|
|
(7
|
)
|
—
|
|
—
|
|
123
|
|
||||||||||||||
|
Balance as of December 31, 2010
|
560
|
|
(207
|
)
|
2,747
|
|
(219
|
)
|
2,565
|
|
(107
|
)
|
5,339
|
|
||||||||||||||
|
Amortization
|
—
|
|
(81
|
)
|
—
|
|
(323
|
)
|
—
|
|
(128
|
)
|
(532
|
)
|
||||||||||||||
|
Cumulative translation adjustment
|
(41
|
)
|
14
|
|
1
|
|
(1
|
)
|
—
|
|
—
|
|
(27
|
)
|
||||||||||||||
|
Balance as of December 31, 2011
|
$
|
519
|
|
$
|
(274
|
)
|
$
|
2,748
|
|
$
|
(543
|
)
|
$
|
2,565
|
|
$
|
(235
|
)
|
$
|
4,780
|
|
|||||||
* Accumulated amortization
All intangible assets are being amortized over their estimated useful lives, whose weighted average lives were estimated to be seven years for Naval Technologies, ten years for GridSense Software and Customer Relationships and twenty years for USSI Sensor Technologies.
Amortization in respect of intangible assets amounted to $1,086, $1,246 and $939 for 2009, 2010 and 2011, respectively (such amortization includes amounts associated with discontinued operations of $1,008, $862 and $405 for 2009, 2010 and 2011, respectively).
Amortization expense with respect to intangible assets is estimated to be $528, $480, $464, $352 and $341 for each of the years ending December 31, 2012 through 2016.
F- 43
Impairments are composed of the following:
|
|
Years ended
December 31,
|
|||||||||||
|
|
2009
|
2010
|
2011
|
|||||||||
|
Impairment of investment in EnerTech
|
$
|
81
|
|
$
|
—
|
|
$
|
—
|
|
|||
|
Impairment of GridSense goodwill (see Note 12(a))
|
—
|
|
1,166
|
|
—
|
|
||||||
|
|
$
|
81
|
|
$
|
1,166
|
|
$
|
—
|
|
|||
Impairments included in Discontinued Operations
During 2009, CoaLogix engaged an outside firm to assist CoaLogix with the determination of the economic viability of MetalliFix. On December 18, 2009, the outside firm issued its assessment that MetalliFix is not economically viable and not competitive with other commercial products for mercury control that are currently available. On December 30, 2009, the management of CoaLogix determined that a material impairment of MetalliFix had occurred. Accordingly, CoaLogix recorded an impairment charge of the remaining unamortized balance of the Solucorp license ($1,672) as well as associated assets (chemicals - $383 and prepaid chemicals - $317).
In 2008, CoaLogix lent $200 to Environmental Energy Services, Inc. (“EES”) on a convertible promissory note in contemplation of the acquisition by CoaLogix of the assets of EES. CoaLogix did not enter into a definitive agreement with EES by the target date provided for in the convertible promissory note and did not intend to proceed with the acquisition. In the fourth quarter of 2009, CoaLogix recorded an impairment charge on the loan balance ($200) and accrued interest ($40).
The impairment of goodwill and other intangible assets associated with the Company’s discontinued operations in Coreworx ($9,474) and the impairment of the Coreworx Debt ($4,000) are not reflected above as they are included in Loss from discontinued operations, net of income taxes in the Company’s Consolidated Statements of Income.
F- 44
|
(a)
|
Lines of credit
|
The Company's DSIT subsidiary has lines-of-credit of approximately $1,046 from two Israeli banks (approximately $523 at each bank), of which $510 (net) was being used at December 31, 2011. The lines-of-credit are subject to certain financial covenants. DSIT was in compliance with its financial covenants at December 31, 2011. The line-of-credit at one bank expires on September 4, 2012. The line-of-credit at the second bank formally expired on February 29, 2012. The Company is currently negotiating terms of renewal. The lines-of-credit are denominated in NIS and bears interest at a weighted average rate of the Israeli prime rate per annum plus 2.50%. The Israeli prime rate as of December 31, 2011 was 4.25% (December 31, 2010, 3.5%).
|
(b)
|
Bank Debt
|
On December 31, 2009, the Company's DSIT subsidiary took a loan from an Israeli bank in the amount of $530. The loan is denominated in NIS and bears interest at the rate of the Israeli prime rate per annum plus 0.9%. The loan is to be repaid over a period of 48 months of equal payments of approximately $12 per month (principal and interest). Principal payments with respect to the loan are $133 and $141 for each of the years ending December 31, 2012 and 2013, respectively. As a security for this loan, DSIT has deposited with the Israeli bank $78, reflected as a non-current restricted deposit on the Company’s Consolidated Balance Sheets.
|
(c)
|
Other Debt
|
During 2010, the CEO and a director of the Company’s GridSense subsidiary lent GridSense $50 and $75, respectively. The loan from the director bears interest at 8% per year while the loan from the CEO bears no interest. During 2010, $12 was repaid to GridSense’s CEO while no repayments were made to the director. During 2011, the remaining $38 was paid to the CEO and and $65 of principal and $1 of interest was paid to the director. The remaining $10 due to the director is expected to be paid in 2012.
|
(d)
|
Debt summary
|
|
|
As of December 31,
|
|||||||
|
|
2010
|
2011
|
||||||
|
Lines of credit
|
$
|
1,067
|
|
$
|
510
|
|
||
|
Bank debt
|
431
|
|
274
|
|
||||
|
Other debt
|
112
|
|
10
|
|
||||
|
Capital lease obligations
|
—
|
|
24
|
|
||||
|
Total debt
|
1,610
|
|
818
|
|
||||
|
Less: Lines-of-credit
|
(1,067
|
)
|
(510
|
)
|
||||
|
Less: Current portion of debt
|
(241
|
)
|
(167
|
)
|
||||
|
Long-term debt
|
$
|
302
|
|
$
|
141
|
|
||
With respect to DSIT’s line-of-credit (see (a) above), a lien in favor of the Israeli bank was placed on DSIT’s assets. In addition, the Company has guaranteed DSIT’s line-of-credit.
F- 45
Other current liabilities consist of the following:
|
|
As of December 31,
|
|||||||
|
|
2010
|
2011
|
||||||
|
Taxes payable
|
$
|
685
|
|
$
|
475
|
|
||
|
Advances from customers
|
—
|
|
2,876
|
|
||||
|
Accrued expenses
|
2,580
|
|
1,504
|
|
||||
|
Dividends payable
|
—
|
|
876
|
|
||||
|
Warranty provision
|
56
|
|
37
|
|
||||
|
Deferred taxes
|
75
|
|
1,578
|
|
||||
|
Other
|
32
|
|
74
|
|
||||
|
|
$
|
3,428
|
|
$
|
7,420
|
|
||
F- 46
(a) Israeli labor law and certain employee contracts generally require payment of severance pay upon dismissal of an employee or upon termination of employment in certain other circumstances. The Company has recorded under liability for employee termination benefits the amount that would be paid if all its Israeli employees were dismissed at the balance sheet date, on an undiscounted basis, in accordance with Israeli labor law. This liability is computed based upon the employee’s number of years of service and salary components, which in the opinion of management create entitlement to severance pay in accordance with labor agreements in force. The liability is reflected on the Company’s Consolidated Balance Sheets as accrued severance.
The liability is partially funded by sums deposited in dedicated funds in respect of employee termination benefits and is reflected on the Company’s Consolidated Balance Sheets as severance assets. For certain Israeli employees, the Company’s liability is covered mainly by regular contributions to defined contribution plans. These funded amounts are not reflected in the balance sheets, since they are not under the control and management of the Company.
(b) Severance pay expenses amounted to approximately, $244, $382 and $380 for the years ended December 31, 2009, 2010 and 2011, respectively.
(c) The Company expects to contribute approximately $318 in respect of its severance pay obligations in the year ending December 31, 2012.
(d) The Company does not expect to pay any future benefits to its employees upon their normal retirement age during the years 2012 and 2013 and expects to pay $1,742 during the years 2014 to 2021. These amounts do not include amounts that might be paid to employees that will cease working with the Company before their normal retirement age. The liability as at December 31, 2011 for future benefit payments in the next ten years is included under liability for employee termination benefits. The liability for future benefits has not been reduced to reflect any amounts already deposited in dedicated funds with respect to those employees. The amounts due were determined based on the employees’ current salary rates and the number of service years that will be accumulated upon their retirement date.
F- 47
|
(a)
|
Leases of Property and Equipment
|
Office rental and automobile leasing expenses, for 2009, 2010 and 2011, were $513, $662 and $871 respectively. The Company and its subsidiaries lease office space, cars and equipment under operating lease agreements. Those leases will expire on different dates from 2012 to 2015. Future minimum lease payments on non-cancelable operating leases as of December 31, 2011 are as follows:
|
Years ending December 31,
|
|
||
|
2012
|
$
|
719
|
|
|
2013
|
493
|
|
|
|
2014
|
275
|
|
|
|
2015
|
163
|
|
|
|
2016
|
19
|
|
|
|
2017 and thereafter
|
—
|
|
|
|
|
$
|
1,669
|
|
|
(b)
|
Guarantees
|
The Company’s DSIT subsidiary provides various performance, advance and tender guarantees as required in the normal course of its operations. As at December 31, 2011, such guarantees totaled approximately $5,565 with $4,430 due to expire in 2011 and the remaining $1,135 in 2013. As a security for these guarantees, DSIT has deposited with an Israeli bank $2,416 as restricted deposits ($2,223 as current restricted deposits and $193 as non-current restricted deposits) on the Company’s Consolidated Balance Sheets.
See Note 14(d) with respect to guarantees on the Company’s lines of credit.
F- 48
|
(a)
|
General
|
At the annual meeting of stockholders on June 10, 2010, the Company’s stockholders approved an amendment to its Certificate of Incorporation to increase the number of authorized shares of capital stock from 20,000,000 shares to 30,000,000 shares, all of which shall be Common Stock. The increase in authorized shares was done pursuant to a Certificate of Amendment to the Certificate of Incorporation filed with the Secretary of State of the State of Delaware on, and effective as of, June 15, 2010.
At December 31, 2011 the Company had issued and outstanding 17,523,609 shares of its common stock, par value $0.01 per share. Holders of outstanding common stock are entitled to receive dividends when, as and if declared by the Board and to share ratably in the assets of the Company legally available for distribution in the event of a liquidation, dissolution or winding up of the Company. Holders of common stock do not have subscription, redemption, conversion or other preemptive rights. Holders of the common stock are entitled to elect all of the Directors on the Company’s Board. Holders of the common stock do not have cumulative voting rights, meaning that the holders of more than 50% of the common stock can elect all of the Company’s Directors. Except as otherwise required by Delaware General Corporation Law, all stockholder action is taken by vote of a majority of shares of common stock present at a meeting of stockholders at which a quorum (a majority of the issued and outstanding shares of common stock) is present in person or by proxy or by written consent pursuant to Delaware law (other than the election of Directors, who are elected by a plurality vote).
The Company is not authorized to issue preferred stock. Accordingly, no preferred stock is issued or outstanding.
(b)
Dividends
On October 17, 2011, the Board of Directors of the Company approved the payment of a quarterly dividend of $0.035 per share and a 2011 year-end declaration of a special dividend of $0.05 per share.
The quarterly dividend was paid on November 28, 2011 ($614) to common shareholders of record on November 16, 2011. The special year-end dividend ($876) was paid on January 9, 2012 to stockholders of record on December 30, 2011. The special year-end dividend is reflected in the Company's year end Consolidated Balance Sheet in Other Current Liabilities (see Note 15). (See Note 26 - Subsequent Events.)
|
(c)
|
Capital Raise
|
(i) March 2010 Capital Raise
On March 8, 2010, the Company completed a registered direct offering through a placement agent of 2,231,818 shares of its common stock pursuant to separate subscription agreements between the Company and each of the investors at $5.50 per share to certain accredited investors for gross proceeds of approximately $12,275. The aggregate net proceeds from the offering, after deducting the placement agent’s fee and the offering expenses payable by the Company in connection with the offering, was $11,467.
(ii) December 2010 Capital Raise
On December 17, 2010, the Company entered into a Placement Agent Agreement (the “Placement Agent Agreement”) related to a registered direct offering of up to 1,150,000 shares of its common stock. Under the terms of the transaction and pursuant to separate subscription agreements between the Company and each of the investors, the Company sold the common stock at $3.50 per share for gross proceeds of $4,027. The Placement Agent Agreement provided for the payment of a placement agent fee equal to 7% ($282) of the gross proceeds of the offering, plus a warrant exercisable for an additional 80,500 shares (see Note 18(i)). The aggregate net proceeds from the offering, after deducting the placement agent’s fee and expenses in connection with the offering, was $3,709.
|
(d)
|
Summary Employee Option Information
|
The Company’s stock option plans provide for the grant to officers, directors and other key employees of options to purchase shares of common stock. The purchase price may be paid in cash or at the end of the option term, if the option is "in-the-money", it is automatically exercised "net" . In a net exercise of an option, the Company does not require a payment of the exercise price of the option from the optionee, but reduces the number of shares of common stock issued upon the exercise of the option by the smallest number of whole shares that has an aggregate fair market value equal to or in excess of the aggregate exercise price for
F- 49
the option shares covered by the option exercised. Each option is exercisable to one share of the Company’s common stock. Most options expire within five to ten years from the date of the grant, and generally vest over three year period from the date of the grant. At December 31, 2011, 876,334 options were available for grant under the 2006 Amended and Restated Stock Incentive Plan and 76,667 options were available for grant under the 2006 Director Plan. In 2009, 2010 and 2011, all options granted to non-employees were from the 2006 Amended and Restated Stock Incentive Plan which permits grants to non-employees.
In connection with the stock option exercises during the years ended December 31, 2009, 2010 and 2011, the Company received proceeds of $273, $159 and $211, respectively. During the years ended December 31, 2009, 2010 and 2011, all 257,168, 67,500 and 231,831 shares issued in connection with option exercises were newly issued shares. The intrinsic value of options exercised in 2009, 2010 and 2011 were $1,592, $247 and $707, respectively. The intrinsic value of options outstanding and options exercisable at December 31, 2011 was $2,631 and $2,513, respectively.
During 2011, 148,165 options were exercised and 304,167 options were forfeited in connection with the “net exercise” of 452,332 options. The 452,332 options which were exercised under this method had a weighted average exercise price exercise price of $2.69. In addition, during 2011, 83,666 options were exercised for cash. Such options had a weighted average exercise price exercise price of $2.51.
Of the 359,500, 235,000 and 141,666 options the Company granted to employees in the years ended December 31, 2009, 2010 and 2011, respectively, 300,000, 95,000 and 141,666 options were granted to employees who were related parties (directors and executive officers) under various option plans. During 2009, 224,668 options were exercised by related parties and 46,667 options were forfeited. During 2010, 67,500 options were exercised by related parties and 120,000 options were forfeited. During 2011, 159,779 options were exercised by related parties and 351,221 options were forfeited. As of December 31, 2009, 2010 and 2011, the number of outstanding options held by the related parties was 1,547,165, 1,574,665 and 1,199,999 options, respectively.
The weighted average grant-date fair value of the options granted during 2009 , 2010 and 2011, amounted to $1.47, $3.47 and $2.17 per option, respectively. The Company utilized the Black-Scholes option-pricing model to estimate fair value, utilizing the following assumptions for the respective years (all in weighted averages):
|
|
2009
|
2010
|
2011
|
||||||
|
Risk-free interest rate
|
2.1
|
%
|
2.8
|
%
|
1.8
|
%
|
|||
|
Expected term of options, in years
|
5.7
|
|
6.3
|
|
5.5
|
|
|||
|
Expected annual volatility
|
70
|
%
|
68
|
%
|
62
|
%
|
|||
|
Expected dividend yield
|
None
|
|
None
|
|
1.8
|
%
|
|||
The expected term of the options is the length of time until the expected date of exercising the options. With respect to determining expected exercise behavior, the Company has grouped its option grants into certain groups in order to track exercise behavior and establish historical rates. The Company estimated volatility by considering historical stock volatility over the expected term of the option. The risk-free interest rates are based on the U.S. Treasury yields for a period consistent with the expected term. Up to October 17, 2011, the Company expected no dividends to be paid. On October 17, 2011, the Company approved the payment of a quarterly dividend of $0.035 per share and a 2011 year-end declaration of a special dividend of $0.05 per share (see Note 18(b)). The expected dividend yield for 2011 takes into account a quarterly dividend of $0.035 per share on options grants from that date. The Company believes that the valuation technique and the approach utilized to develop the underlying assumptions are appropriate in determining the estimated fair value of the Company’s stock options granted in the years ended December 31, 2009, 2010 and 2011. Estimates of fair value are not intended to predict actual future events or the value ultimately realized by persons who receive equity awards.
|
(e)
|
Non-Employee Options
|
On October 4, 2011, the Company granted an outside consultant an option for the purchase of 25,000 shares of the Company’s common stock. The options vest over 90 days, have an exercise price of $5.30 and expire after seven years. The Company used the Black-Scholes valuation method to estimate the fair value of the options granted to the consultant. The Company used a risk free interest rate of 1.3%, an expected life of seven years, an annual volatility of 62% and no expected dividends to determine the value the options granted. The Company estimated the fair value of each option granted to be $3.23. The Company recorded $79 to selling, general and administrative expense with respect to the option granted to the consultant in the year ended December 31, 2011.
F- 50
In January 2010, the Company granted an outside consultant an option for the purchase of 25,000 shares of the Company’s common stock. The options vested after twelve months, have an exercise price of $7.38 and expire after seven years. The Company used the Black-Scholes valuation method to estimate the fair value of the options granted to the consultant. The Company used a risk free interest rate of 3.4%, an expected life of seven years, an annual volatility of 69% and no expected dividends to determine the value the options granted. The Company estimated the fair value of each option granted to be $5.01. The Company recorded $124 and $1 to selling, general and administrative expense with respect to the option granted to the consultant in the year ended December 31, 2010 and 2011, respectively.
In June 2009, the Company granted several outside consultants options for the purchase of a total of 20,000 shares of the Company’s common stock. The options vested over a period of three years, have an exercise price of $2.56 and expire after seven years. The Company used the Black-Scholes valuation method to estimate the fair value of the options granted to the consultants. The Company used a risk free interest rate of 3.3%, an expected life of seven years, an annual volatility of 75% and no expected dividends to determine the value the options granted. The Company estimated the fair value of each option granted to be $1.83. The Company recorded $13 , $15 and $7 to selling, general and administrative expense with respect to the option granted to the outside consultants in the years ended December 31, 2009, 2010 and 2011, respectively.
In the years ended December 31, 2009, 2010 and 2011, the Company included $13, $139 and $87 respectively, of stock-based compensation expense in selling, general and administrative expense in its Consolidated Statements of Operations with respect to options granted to non-employees.
|
(f)
|
Summary Employee and Non-Employee Option Information
|
A summary of the Company’s option plans as of December 31, 2009, 2010 and 2011, as well as changes during each of the years then ended, is presented below:
|
|
2009
|
2010
|
2011
|
|||||||||||||||||||
|
|
Number
of Options
(in shares)
|
Weighted
Average
Exercise
Price
|
Number
of Options
(in shares)
|
Weighted
Average
Exercise
Price
|
Number
of Options
(in shares)
|
Weighted
Average
Exercise
Price
|
||||||||||||||||
|
Outstanding at beginning of year
|
1,876,500
|
|
$
|
3.27
|
|
1,745,165
|
|
$
|
3.52
|
|
1,817,665
|
|
$
|
3.69
|
|
|||||||
|
Granted at market price
|
379,500
|
|
$
|
2.52
|
|
260,000
|
|
$
|
5.58
|
|
166,666
|
|
$
|
4.63
|
|
|||||||
|
Exercised
|
(257,168
|
)
|
$
|
1.06
|
|
(67,500
|
)
|
$
|
2.36
|
|
(231,831
|
)
|
$
|
2.62
|
|
|||||||
|
Forfeited or expired
|
(253,667
|
)
|
$
|
2.65
|
|
(120,000
|
)
|
$
|
6.13
|
|
(364,167
|
)
|
$
|
3.00
|
|
|||||||
|
Outstanding at end of year
|
1,745,165
|
|
$
|
3.52
|
|
1,817,665
|
|
$
|
3.69
|
|
1,388,333
|
|
$
|
4.17
|
|
|||||||
|
Exercisable at end of year
|
1,421,831
|
|
$
|
3.52
|
|
1,572,455
|
|
$
|
3.62
|
|
1,267,915
|
|
$
|
4.08
|
|
|||||||
Summary information regarding the options outstanding and exercisable at December 31, 2011 is as follows:
|
|
Outstanding
|
Exercisable
|
|||||||||||||||
|
Range of Exercise Prices
|
Number
Outstanding
|
Weighted
Average
Remaining
Contractual
Life
|
Weighted
Average
Exercise
Price
|
Number
Exercisable
|
Weighted
Average
Exercise
Price
|
||||||||||||
|
|
(in shares)
|
(in years)
|
|
(in shares)
|
|
||||||||||||
|
$1.61 – 2.56
|
285,834
|
|
4.55
|
|
$
|
2.10
|
|
277,916
|
|
$
|
2.08
|
|
|||||
|
$2.96 – 3.90
|
316,666
|
|
2.15
|
|
$
|
3.48
|
|
316,666
|
|
$
|
3.48
|
|
|||||
|
$4.09 – 4.96
|
238,333
|
|
3.71
|
|
$
|
4.54
|
|
213,333
|
|
$
|
4.50
|
|
|||||
|
$5.00 – 6.00
|
522,500
|
|
4.48
|
|
$
|
5.39
|
|
435,000
|
|
$
|
5.41
|
|
|||||
|
$7.38
|
25,000
|
|
5.01
|
|
$
|
7.38
|
|
25,000
|
|
7.38
|
|
||||||
|
|
1,388,333
|
|
|
|
|
|
1,267,915
|
|
|
|
|||||||
F- 51
Stock-based compensation expense included in the Company’s Statements of Operations was:
|
|
Year ended
December 31,
|
|||||||||||
|
|
2009
|
2010
|
2011
|
|||||||||
|
Cost of sales
|
$
|
2
|
|
$
|
—
|
|
$
|
—
|
|
|||
|
Selling, general and administrative expense*
|
676
|
|
690
|
|
458
|
|
||||||
|
Total stock based compensation expense
|
$
|
678
|
|
$
|
690
|
|
$
|
458
|
|
|||
* Stock compensation expense in 2011, includes $51 with respect to stock granted to a consultant for the year ended December 31, 2011.
In addition to the above amounts, the Company recorded stock compensation expense of $234 and $339 which is including in Loss from discontinued operations, net of income taxes with respect to Coreworx with respect to the year ended December 31, 2009 and period ending December 17, 2010, respectively. The Company also recorded stock compensation expense of $513, $440 and $176 with respect to CoaLogix operations in the years ended December 31, 2009 and 2010, and the period ended August 31, 2011, respectively which are also included in the Loss from discontinued operations, net of income taxes.
As at December 31, 2011, the total compensation cost related to non-vested awards not yet recognized was approximately $160 which the Company expects to recognize over a weighted-average period of approximately 1.1 years.
|
(g)
|
DSIT Stock Option Plan
|
In November 2006, the Company adopted a Key Employee Stock Option Plan (the “DSIT Plan”) for its DSIT subsidiary to be administrated by a committee of board members of DSIT, currently comprised of the entire board of directors of DSIT. The purpose of the DSIT Plan and associated grants is to provide incentives to key employees of DSIT to further the growth, development and financial success of DSIT.
A summary status of the DSIT Plan as of December 31, 2009, 2010 and 2011, as well as changes during the years then ended, is presented below (the table below has been adjusted to reflect a 100:1 stock split in 2011) :
|
|
2009
|
2010
|
2011
|
||||||||||||||||||
|
|
Number
of
Options
(in
shares)
|
Weighted
Average
Exercise
Price
|
Number
of
Options
(in
shares)
|
Weighted
Average
Exercise
Price
|
Number
of
Options
(in
shares)
|
Weighted
Average
Exercise
Price
|
|||||||||||||||
|
Outstanding at beginning of year
|
152,400
|
|
$
|
1.18
|
|
152,400
|
|
$
|
1.18
|
|
152,400
|
|
$
|
1.18
|
|
||||||
|
Granted at fair value
|
—
|
|
—
|
|
—
|
|
—
|
|
93,054
|
|
$
|
2.45
|
|
||||||||
|
Exercised
|
—
|
|
—
|
|
—
|
|
—
|
|
—
|
|
—
|
|
|||||||||
|
Forfeited
|
—
|
|
—
|
|
—
|
|
—
|
|
(4,630
|
)
|
$
|
1.09
|
|
||||||||
|
Outstanding at end of year
|
152,400
|
|
$
|
1.18
|
|
152,400
|
|
$
|
1.18
|
|
240,824
|
|
1.67
|
|
|||||||
|
Exercisable at end of year*
|
—
|
|
—
|
|
—
|
|
—
|
|
—
|
|
—
|
|
|||||||||
* Options vest only upon an exit event for the Company.
On August 10, 2011, DSIT granted options to purchase 93,054 of its ordinary shares to senior management and employees of DSIT at an exercise price of NIS 9.38 ($2.67 at the then exchange rate) per share and exercisable for a period of seven years. These options vest and become exercisable only upon the occurrence of an initial public offering of DSIT or a merger, acquisition, reorganization, consolidation or similar transaction involving DSIT. In addition, DSIT also extended the expiration date of 147,770 previously granted options from December 31, 2013 to August 10, 2018. No other option terms were modified.
F- 52
Summary information regarding the options under the Plan outstanding and exercisable at December 31, 2011 is as follows:
|
|
Outstanding
|
Exercisable
|
|||||||||||||
|
Range of Exercise
Prices
|
Number
Outstanding
|
Weighted
Average
Remaining
Contractual
Life
|
Weighted
Average
Exercise
Price
|
Number
Exercisable
|
Weighted
Average
Exercise
Price
|
||||||||||
|
|
(in shares)
|
(in years)
|
|
(in shares)
|
|
||||||||||
|
$1.05 – $1.26
|
147,770
|
|
7.6
|
$
|
1.18
|
|
—
|
|
—
|
|
|||||
|
$2.45
|
93,054
|
|
7.6
|
$
|
2.45
|
|
—
|
|
—
|
|
|||||
|
|
240,824
|
|
|
$
|
1.68
|
|
—
|
|
—
|
|
|||||
If all the options in the DSIT Plan are exercised, the Company’s holdings in DSIT will be diluted from 84% to approximately 71.4%.
|
(h)
|
DSIT Warrants
|
As part of the Company’s August 2005 sale of its 68% owned dsIT Technologies subsidiary and its associated outsourcing consulting business, the Company issued to the purchaser a warrant to purchase 10% of DSIT for $200. Such warrant expires in August 2012.
|
(i)
|
Warrants
|
The Company has issued warrants at exercise prices equal to or greater than market value of the Company’s common stock at the date of issuance. A summary of warrant activity follows:
|
|
2009
|
2010
|
2011
|
||||||||||||||||||
|
|
Number of shares underlying warrants
|
Weighted Average Exercise Price
|
Number of shares underlying warrants
|
Weighted Average Exercise Price
|
Number of shares underlying warrants
|
Weighted Average Exercise Price
|
|||||||||||||||
|
Outstanding at beginning of year
|
784,023
|
|
$
|
4.06
|
|
246,904
|
|
$
|
4.50
|
|
313,806
|
|
$
|
4.29
|
|
||||||
|
Granted
|
—
|
|
—
|
|
80,500
|
|
$
|
3.68
|
|
—
|
|
—
|
|
||||||||
|
Exercised
|
(537,119
|
)
|
$
|
3.85
|
|
(13,598
|
)
|
$
|
4.50
|
|
—
|
|
—
|
|
|||||||
|
Forfeited or expired
|
—
|
|
—
|
|
—
|
|
—
|
|
—
|
|
—
|
|
|||||||||
|
Outstanding and exercisable at end of year
|
246,904
|
|
$
|
4.50
|
|
313,806
|
|
$
|
4.29
|
|
313,806
|
|
$
|
4.29
|
|
||||||
Summary information regarding the warrants is as follows:
|
Exercise Price
|
Warrants
Outstanding
|
Weighted Average Remaining Contractual Life
|
||
|
|
(in shares)
|
(in years)
|
||
|
$3.68
|
80,500
|
4.0
|
||
|
$4.50
|
233,306
|
0.3
|
||
The 80,500 warrants that were granted in connection with the December 2010 Capital Raise (see Note 18(c)) are exercisable for shares of the Company’s Common Stock for five years at an exercise price of $3.68 per share. The Company allocated $153 to the value of the warrants based on a Black Scholes calculation using a five year expected life, an annual volatility of 59%, a discount rate of 2.0% and no dividends. The value allocated to the warrants was offset against additional paid-in-capital.
The warrants with an exercise price of $4.50 are subject to call for cancellation at the option of the Company on 20 business
F- 53
days notice, upon the common stock having achieved a volume weighted average price of $6.00 or more for 20 consecutive trading days.
During the years ended December 31, 2009 and 2010, the Company received proceeds of $2,069 and $61, respectively, from the exercise of warrants. No warrants were exercised in 2011.
|
(j)
|
Stock Repurchase Program
|
In October, 2008, the Company’s Board of Directors authorized a share repurchase program of up to 1,000,000 shares of its common stock. The share repurchase program will be implemented at management’s discretion from time to time. During 2009, the Company acquired 433,795 shares of its common stock for $1,108.
As indicated in Note 4(b), the Company used 473,161 of its treasury shares to acquire shares of USSI. The treasury shares had a basis of $1,791 and a value of $2,229 on the date of the transfer. In accordance with generally accepted accounting principles, the Company recorded an adjustment of $438 to additional paid-in-capital as a result of the transfer of the treasury shares. As at December 31, 2010 and 2011, the Company owned a total of 801,920 of its own shares.
F- 54
Finance expense, net consists of the following:
|
|
Year ended
December 31,
|
|||||||||||
|
|
2009
|
2010
|
2011
|
|||||||||
|
Interest income
|
$
|
42
|
|
$
|
44
|
|
$
|
39
|
|
|||
|
Interest expense
|
(181
|
)
|
(181
|
)
|
(198
|
)
|
||||||
|
Exchange gain (loss), net
|
68
|
|
(87
|
)
|
133
|
|
||||||
|
|
$
|
(71
|
)
|
$
|
(224
|
)
|
$
|
(26
|
)
|
|||
F- 55
|
(a)
|
Composition of loss from continuing operations before income taxes is as follows:
|
|
|
Year ended
December 31,
|
|||||||||||
|
|
2009
|
2010
|
2011
|
|||||||||
|
Domestic
|
$
|
(2,564
|
)
|
$
|
(7,445
|
)
|
$
|
(7,053
|
)
|
|||
|
Foreign
|
1,611
|
|
335
|
|
(515
|
)
|
||||||
|
|
$
|
(953
|
)
|
$
|
(7,110
|
)
|
$
|
(7,568
|
)
|
|||
Income tax expense (benefit) consists of the following:
|
|
Year ended
December 31,
|
|||||||||||
|
|
2009
|
2010
|
2011
|
|||||||||
|
Current:
|
|
|
||||||||||
|
Federal
|
$
|
(550
|
)
|
$
|
190
|
|
$
|
1,800
|
|
|||
|
State and local
|
—
|
|
(3
|
)
|
2
|
|
||||||
|
Foreign
|
81
|
|
461
|
|
88
|
|
||||||
|
|
(469
|
)
|
648
|
|
1,890
|
|
||||||
|
Deferred:
|
|
|
|
|
||||||||
|
Federal
|
—
|
|
—
|
|
(14,571
|
)
|
||||||
|
State and local
|
—
|
|
—
|
|
—
|
|
||||||
|
Foreign
|
(250
|
)
|
23
|
|
(86
|
)
|
||||||
|
|
(250
|
)
|
23
|
|
(14,657
|
)
|
||||||
|
Total income tax expense (benefit)
|
$
|
(719
|
)
|
$
|
671
|
|
$
|
(12,767
|
)
|
|||
|
(b)
|
Effective Income Tax Rates
|
Set forth below is reconciliation between the federal tax rate and the Company’s effective income tax rates with respect to continuing operations:
|
|
Year ended
December 31,
|
||||||||
|
|
2009
|
2010
|
2011
|
||||||
|
Statutory Federal rates
|
34
|
%
|
34
|
%
|
34
|
%
|
|||
|
Increase (decrease) in income tax rate resulting from:
|
|
|
|
|
|||||
|
Tax on foreign activities
|
75
|
|
(5
|
)
|
2
|
|
|||
|
Other, net (primarily permanent differences)
|
—
|
|
(3
|
)
|
(2
|
)
|
|||
|
Valuation allowance
|
(34
|
)
|
(35
|
)
|
135
|
|
|||
|
Effective income tax rates
|
75
|
%
|
(9
|
)%
|
169
|
%
|
|||
|
(c)
|
Analysis of Deferred Tax Assets and (Liabilities)
|
F- 56
|
|
As of December 31,
|
|||||||
|
|
2010
|
2011
|
||||||
|
Deferred tax assets consist of the following:
|
|
|
|
|
||||
|
Employee benefits and deferred compensation
|
$
|
1,531
|
|
$
|
1,600
|
|
||
|
Investments and asset impairments
|
5,519
|
|
63
|
|
||||
|
Other temporary differences
|
569
|
|
391
|
|
||||
|
Net operating and capital loss carryforwards
|
5,268
|
|
2,624
|
|
||||
|
|
12,887
|
|
4,678
|
|
||||
|
Valuation allowance
|
(12,522
|
)
|
(3,843
|
)
|
||||
|
Net deferred tax assets
|
365
|
|
835
|
|
||||
|
Deferred tax liabilities consist of the following:
|
|
|
|
|
||||
|
Revenue recognition timing differences
|
(138
|
)
|
(539
|
)
|
||||
|
Installment sale on CoaLogix transaction
|
$
|
—
|
|
$
|
(1,434
|
)
|
||
|
Net deferred assets (liabilities), net
|
$
|
227
|
|
$
|
(1,138
|
)
|
||
Valuation allowances relate principally net operating loss carryforwards related to the Company's GridSense and USSI subsidiaries and book-tax differences related to stock compensation expense of the Company. The change in the valuation allowance was a decrease of $8,657 in 2011. The decrease in 2011 was primarily attributable to utilization of net loss carryforwards and losses associated with the Company’s investment in Coreworx.
Current deferred tax liabilities (see Note 15) is comprised of deferred taxes on the installment sale on the CoaLogix transaction and revenue recognition timing differences net of other temporary differences at DSIT. Deferred tax assets of $440 included in Other Assets relate to primarily to employee benefits at the Company's DSIT.
|
(d)
|
Summary of Tax Loss Carryforwards
|
As of December 31, 2011, the Company had various net operating loss carryforwards expiring as follows:
|
Expiration
|
Federal*
|
State
|
Foreign
|
|||||||||
|
2021-2031
|
$
|
3,114
|
|
$
|
7,384
|
|
$
|
—
|
|
|||
|
Unlimited
|
—
|
|
—
|
|
3,649
|
|
||||||
|
Total
|
$
|
3,114
|
|
$
|
7,384
|
|
$
|
3,649
|
|
|||
* The utilization of these net operating loss carryforwards is limited to a total of approximately $243 per year due to limits on utilizing the acquired net operating loss carryforwards under Internal Revenue Service regulations following a change in control.
|
(e)
|
Taxation in the United States
|
On October 22, 2004, The American Jobs Creation Act (the “Act”) was signed into law. The Act includes a deduction of 85% of certain foreign earnings that are repatriated, as defined in the Act. The Company’s foreign earnings are derived from the Company’s Israeli and Australian subsidiaries. Due to Israeli tax and company law constraints and DSIT’s own cash and finance needs as well as GridSense’s cash needs, the Company does not expect any foreign earnings to be repatriated to the United States in the near future.
As a holding company without other business activity in Delaware, the Company is exempt from Delaware state income tax. Thus, the Company’s statutory income tax rate on domestic earnings is the federal rate of 34%.
As a result of the acquisition of the balance of shares of GridSense not previously owned (see Note 4(a)(ii)), the Company began consolidating the U.S. operations of GridSense beginning in May 2010. As a result of the increased holdings in USSI during 2011 (see Note 4(b)(i)), the Company began consolidating the operations of USSI beginning in February 2011.
|
(f)
|
Taxation in Israel
|
The income of the Company’s Israeli subsidiaries taxed at regular rates. The provisions of the Law for the Amendment the
F- 57
Israel Income Tax Ordinance, 2005, which was passed into law in August 2005, prescribe a progressive reduction of corporate tax liability, resulting in the following rates for 2008 and thereafter: 2008 – 27%, 2009 – 26% and for 2010 and thereafter – 25%.
On July 23, 2009, the Israel Economic Efficiency Law (Legislation Amendments for Applying the Economic Plan for 2009 and 2010), became effective, stipulating, among other things, an additional gradual decrease in tax rates in 2011 and thereafter, as follows: 2011 – 24%, 2012 – 23%, 2013 – 22%, 2014 – 21%, 2015 – 20% and 2016 and thereafter – 18%.
On October 30, 2011, the Government of Israel adopted the main recommendations of the taxation chapter in the report of the Committee on Social-Economic Change (also known as the Trajtenberg Committee), which were submitted to the government on September 2, 2011. The government resolved, among other things, to set the corporate tax rate to 25% in 2012 and thereafter, instead of 23% in 2012 and a progressive reduction to 18% in 2016, as prescribed by the current legislation. The continued policy of rate reductions will be reconsidered not later than 2014, based on the economic and fiscal conditions of the Israeli economy and global market at that time. On December 5, 2011, the Knesset adopted the committee recommendation and approved the bill to change the tax rate.
|
(g)
|
Taxation in Australia
|
The income of the Company’s GridSense subsidiaries is taxed on their worldwide taxable income at the general corporate tax rate which currently stands at 30%. In addition, certain research and development expenditures may be eligible for increased deduction as well as a refundable rebate at the option of the company. In a situation where the refundable rebate is available, research and development expenses are not deductible and may create taxable income. Refundable rebates are netted against income tax payable if the company has a taxable income after excluding R&D deductions; otherwise the rebate (or excess rebate over income tax payable) is paid to the company. In the Consolidated Statements of Operations, refundable rebates are netted against research and development expense.
|
(h)
|
Uncertain Tax Positions (UTP)
|
As of December 31, 2010 and 2011, the amount of interest and penalties accrued on the balance sheet was $3 and $19, respectively, and is included in other liabilities.
Following is a reconciliation of the total amounts of the Company’s unrecognized tax benefits for the period from January 1, 2010 to December 31, 2011:
|
|
2010
|
2011
|
||||||
|
Balance at January 1
|
$
|
210
|
|
$
|
18
|
|
||
|
Increases (decreases) in unrecognized tax benefits and associated interest and penalties as a result of tax positions made during the prior period
|
(192
|
)
|
55
|
|
||||
|
Decreases in unrecognized tax benefits and associated interest and penalties as a result of tax positions taken during the current period
|
—
|
|
—
|
|
||||
|
Balance at December 31
|
$
|
18
|
|
$
|
73
|
|
||
The Company is subject to U.S. Federal and state income tax, Australian income tax and Israeli income tax. As of January 1, 2012, the Company is no longer subject to examination by U.S. Federal taxing authorities for years before 2008, for years before 2007 for state income taxes, before 2007 for Israeli income taxes and before 2008 for Australian taxes.
F- 58
(a) The Company paid consulting and other fees to directors of $264 for each the years ended December 31, 2009 and 2010, respectively, and $249 in the year ended December 31, 2011, all of which are included in selling, general and administrative expenses.
(b) The Company paid legal fees for services rendered and out-of-pocket disbursements to a firm in which a principal is the son-in-law of one of the Company’s Directors, of approximately $275, $393 and $309 for the years ended December 31, 2009, 2010 and 2011, respectively. Approximately $105 and $165 was owed to this firm as of December 31, 2010 and 2011, respectively, and is included in other current liabilities and trade accounts payable.
(c) In November 2010, the CEO of the Company’s GridSense subsidiary lent GridSense $50. The loan by the CEO of GridSense bore no interest. In 2010, $12 of the loan was repaid with the balance of $38 being repaid during 2011.
(d) In July 2000, the Company entered into a lease for space for its former Databit subsidiary. Following the 2006 sale of the Databit subsidiary to its CEO (the son of one of the Directors of the Company), the lease obligation was transferred to Databit with Databit being obligated to return the security deposit of $34 at the end of the lease. Prior to the sale of Databit, the Company participated in one-half of the lease costs associated with these premises. Following the end of the lease period, the landlord of the premises billed Databit for certain charges related to the period when Databit was owned by the Company. In 2009, the Company agreed to accept $22 from Databit as full repayment of the security deposit.
See Note 18(d) for information related to options and stock awards to related parties.
F- 59
|
(a)
|
General Information
|
As of December 31 2011, the Company’s operations are based upon three operating segments:
|
(1)
|
Energy & Security Sonar Solutions whose activities are focused on the following areas – sonar and acoustic related solutions for energy, defense and commercial markets and includes other real-time and embedded hardware & software development and production. Energy & Security Sonar Solutions activities are provided through the Company’s DSIT Solutions Ltd. subsidiary.
|
|
(2)
|
The Company’s GridSense segment provides Smart Grid Distribution Automation products and services. As these activities were acquired in May 2010 (see Note 4(a)(ii)), there are no comparative results reported for these activities for the year ended December 31, 2009. The Company’s GridSense segment also includes the activities of OMI which was acquired in May 2010 (see Note 4(a)(iii)).
|
|
(3)
|
The Company’s USSI segment provides Energy and Security Sensor Systems services. USSI was effectively acquired in February 2010 (see Note 4(b)). USSI's primary focus is to develop and produce fiber optic sensing systems for the energy and security markets. As these activities were effectively acquired in February 2010, there are no comparative results reported for these activities for the year ended December 31, 2009.
|
Other operations include various operations in DSIT that do not meet the quantitative thresholds under applicable accounting principles.
The Company’s reportable segments are strategic business units, offering different products and services and are managed separately as each business requires different technology and marketing strategies. Similar operating segments are aggregated into one reportable segment.
|
(b)
|
Information about Profit or Loss and Assets
|
The accounting policies of all the segments are those described in the summary of significant accounting policies. The Company evaluates performance based on net income or loss before taxes.
The Company does not systematically allocate assets to the divisions of the subsidiaries constituting its consolidated group, unless the division constitutes a significant operation. Accordingly, where a division of a subsidiary constitutes a segment that does not meet the quantitative thresholds of applicable accounting principles, depreciation expense is recorded against the operations of such segment, without allocating the related depreciable assets to that segment. However, where a division of a subsidiary constitutes a segment that does meet the quantitative thresholds, related depreciable assets, along with other identifiable assets, are allocated to such division.
The following tables represent segmented data for the years ended December 31, 2011, 2010 and 2009:
F- 60
|
|
Energy &
Security
Sonar
Solutions
|
GridSense
|
|
USSI
|
Other
|
Total
|
||||||||||||||
|
Year ended December 31, 2011:
|
|
|
|
|
|
|
||||||||||||||
|
Revenues from external customers
|
$
|
9,104
|
|
$
|
7,119
|
|
$
|
1,316
|
|
$
|
1,389
|
|
$
|
18,928
|
|
|||||
|
Intersegment revenues
|
—
|
|
—
|
|
—
|
|
—
|
|
—
|
|
||||||||||
|
Segment gross profit (loss)
|
3,019
|
|
3,327
|
|
(98
|
)
|
665
|
|
6,913
|
|
||||||||||
|
Depreciation and amortization
|
220
|
|
375
|
|
224
|
|
28
|
|
847
|
|
||||||||||
|
Stock compensation expense
|
—
|
|
—
|
|
—
|
|
—
|
|
—
|
|
||||||||||
|
Segment net income (loss) before income taxes
|
(244
|
)
|
(1,448
|
)
|
(2,775
|
)
|
298
|
|
(4,169
|
)
|
||||||||||
|
Non-controlling interests in segment income (loss)
|
(42
|
)
|
—
|
|
(571
|
)
|
51
|
|
(562
|
)
|
||||||||||
|
Segment assets
|
932
|
|
7,757
|
|
5,515
|
|
33
|
|
14,237
|
|
||||||||||
|
Expenditures for segment assets
|
103
|
|
74
|
|
276
|
|
22
|
|
475
|
|
||||||||||
|
Year ended December 31, 2010:
|
|
|
|
|
|
|
||||||||||||||
|
Revenues from external customers
|
$
|
10,179
|
|
$
|
2,382
|
|
|
$
|
405
|
|
$
|
1,278
|
|
$
|
14,244
|
|
||||
|
Intersegment revenues
|
—
|
|
—
|
|
|
—
|
|
—
|
|
—
|
|
|||||||||
|
Segment gross profit
|
4,380
|
|
1,172
|
|
|
23
|
|
469
|
|
6,044
|
|
|||||||||
|
Depreciation and amortization
|
172
|
|
242
|
|
|
141
|
|
23
|
|
578
|
|
|||||||||
|
Stock compensation expense
|
42
|
|
—
|
|
|
—
|
|
—
|
|
42
|
|
|||||||||
|
Impairments
|
—
|
|
1,166
|
|
|
—
|
|
—
|
|
1,166
|
|
|||||||||
|
Segment net income (loss) before income taxes
|
1,488
|
|
(2,852
|
)
|
*
|
(1,191
|
)
|
77
|
|
(2,478
|
)
|
|||||||||
|
Non-controlling interests in segment income (loss)
|
172
|
|
—
|
|
|
(776
|
)
|
9
|
|
(595
|
)
|
|||||||||
|
Segment assets
|
1,115
|
|
7,466
|
|
|
4,279
|
|
46
|
|
12,906
|
|
|||||||||
|
Expenditures for segment assets
|
89
|
|
9
|
|
|
90
|
|
21
|
|
209
|
|
|||||||||
|
Year ended December 31, 2009:
|
|
|
|
|
|
|
|
|
|
|
|
|||||||||
|
Revenues from external customers
|
$
|
7,985
|
|
$
|
—
|
|
|
$
|
—
|
|
$
|
1,234
|
|
$
|
9,219
|
|
||||
|
Intersegment revenues
|
5
|
|
—
|
|
|
—
|
|
—
|
|
5
|
|
|||||||||
|
Segment gross profit
|
3,540
|
|
—
|
|
|
—
|
|
415
|
|
3,955
|
|
|||||||||
|
Depreciation and amortization
|
189
|
|
—
|
|
|
—
|
|
25
|
|
214
|
|
|||||||||
|
Stock compensation expense
|
2
|
|
—
|
|
|
—
|
|
—
|
|
2
|
|
|||||||||
|
Impairments
|
—
|
|
—
|
|
|
—
|
|
—
|
|
—
|
|
|||||||||
|
Segment net income (loss) before income taxes
|
1,051
|
|
—
|
|
|
—
|
|
64
|
|
1,115
|
|
|||||||||
|
Non-controlling interests in segment income (loss)
|
194
|
|
—
|
|
|
—
|
|
12
|
|
206
|
|
|||||||||
|
Segment assets
|
1,116
|
|
—
|
|
|
—
|
|
45
|
|
1,161
|
|
|||||||||
|
Expenditures for segment assets
|
154
|
|
—
|
|
|
—
|
|
38
|
|
192
|
|
|||||||||
* Includes goodwill impairment of $1,166
(c) The following tables represent a reconciliation of the segment data to consolidated statement of operations and balance sheet data for the years ended and as of December 31, 2009, 2010 and 2011:
F- 61
|
|
Year ended December 31,
|
|||||||||||
|
|
2009
|
2010
|
2011
|
|||||||||
|
Revenues:
|
|
|
|
|||||||||
|
Total consolidated revenues for reportable segments
|
$
|
7,985
|
|
$
|
12,966
|
|
$
|
17,539
|
|
|||
|
Other operational segment revenues
|
1,234
|
|
1,278
|
|
1,389
|
|
||||||
|
Total consolidated revenues
|
$
|
9,219
|
|
$
|
14,244
|
|
$
|
18,928
|
|
|||
|
Income (loss):
|
|
|
|
|
|
|
||||||
|
Total net income (loss) before income taxes for reportable segments
|
$
|
1,051
|
|
(2,555
|
)
|
(4,467
|
)
|
|||||
|
Other operational segment net income before income taxes
|
64
|
|
77
|
|
298
|
|
||||||
|
Total segment net income (loss) before income taxes
|
1,115
|
|
(2,478
|
)
|
(4,169
|
)
|
||||||
|
Unallocated cost of corporate and DSIT headquarters*
|
(3,390
|
)
|
(4,273
|
)
|
(3,891
|
)
|
||||||
|
Income tax benefit (expense)
|
719
|
|
(671
|
)
|
12,767
|
|
||||||
|
Non-controlling interests (see Note 8)
|
(206
|
)
|
595
|
|
549
|
|
||||||
|
Impairments not allocated to reportable segments (see Note 13)
|
(81
|
)
|
—
|
|
—
|
|
||||||
|
Share of losses in GridSense (see Note 4)
|
(129
|
)
|
—
|
|
—
|
|
||||||
|
Share of income in Paketeria (see Note 7(b))
|
263
|
|
—
|
|
—
|
|
||||||
|
Gain on sale of shares in Comverge (see Note 6)
|
1,403
|
|
—
|
|
—
|
|
||||||
|
Gain on investment in GridSense (see Note 4(a)(ii))
|
—
|
|
1,327
|
|
—
|
|
||||||
|
Dividends from EnerTech (see Note 7(a))
|
—
|
|
135
|
|
—
|
|
||||||
|
Loss on the sale of EnerTech (see Note 7(a))
|
—
|
|
(1,821
|
)
|
—
|
|
||||||
|
Gain on sale of HangXing (see Note 7(c))
|
—
|
|
—
|
|
492
|
|
||||||
|
Loss from discontinued operations, net of income taxes (see Note 3(b))
|
(6,076
|
)
|
(19,803
|
)
|
(1,948
|
)
|
||||||
|
Non-controlling interest share of loss from discontinued operations
|
626
|
|
67
|
|
540
|
|
||||||
|
Gain on the sale of discontinued operations, net of income taxes
|
—
|
|
—
|
|
31,069
|
|
||||||
|
Gain on the deconsolidation of Coreworx (see Note 5(b))
|
—
|
|
1,834
|
|
—
|
|
||||||
|
Consolidated net income (loss) attributable to Acorn Energy, Inc. shareholders
|
$
|
(5,756
|
)
|
$
|
(25,088
|
)
|
$
|
35,409
|
|
|||
* Includes $676, $648, and $458 of stock compensation expense for the years ending December 31, 2009, 2010 and 2011, respectively.
|
|
As of December 31,
|
|||||||||||
|
|
2009
|
2010
|
2011
|
|||||||||
|
Assets:
|
|
|
|
|||||||||
|
Total assets for reportable segments
|
$
|
1,161
|
|
$
|
12,906
|
|
$
|
14,237
|
|
|||
|
Unallocated assets of DSIT headquarters
|
7,709
|
|
12,643
|
|
13,569
|
|
||||||
|
Assets of discontinued operations
|
28,176
|
|
27,597
|
|
—
|
|
||||||
|
Assets of corporate headquarters *
|
11,689
|
|
6,639
|
|
57,999
|
|
||||||
|
Total consolidated assets
|
$
|
48,735
|
|
$
|
59,785
|
|
$
|
85,805
|
|
|||
* In 2011, includes $33,666 of unrestricted cash, $18,000 of short-term deposits and $5,961 of funds held in escrow. In 2010, includes $6,259 of unrestricted cash and $300 of restricted deposits. In 2009, includes $8,031 of unrestricted cash, $300 of restricted deposits and $2,237 of other investments.
F- 62
|
Other Significant Items
|
Segment
Totals |
Adjustments
|
Consolidated
Totals
|
|||||||||
|
Year ended December 31, 2011
|
|
|
|
|||||||||
|
Depreciation and amortization
|
$
|
847
|
|
$
|
4
|
|
$
|
851
|
|
|||
|
Stock compensation expense
|
—
|
|
458
|
|
458
|
|
||||||
|
Expenditures for assets
|
475
|
|
27
|
|
502
|
|
||||||
|
Year ended December 31, 2010
|
|
|
|
|
|
|
||||||
|
Depreciation and amortization
|
$
|
578
|
|
$
|
25
|
|
$
|
603
|
|
|||
|
Stock compensation expense
|
42
|
|
648
|
|
690
|
|
||||||
|
Expenditures for assets
|
209
|
|
28
|
|
237
|
|
||||||
|
Year ended December 31, 2009
|
|
|
|
|
|
|
||||||
|
Depreciation and amortization
|
$
|
214
|
|
$
|
2
|
|
$
|
216
|
|
|||
|
Stock compensation expense
|
2
|
|
676
|
|
678
|
|
||||||
|
Expenditures for assets
|
192
|
|
48
|
|
240
|
|
||||||
Other reconciling items are primarily corporate headquarters data, which are not included in the segment information. None of the other adjustments are significant.
|
|
December 31,
|
|||||||||||
|
|
2009
|
2010
|
2011
|
|||||||||
|
Revenues based on location of customer:
|
|
|
|
|||||||||
|
United States and Canada
|
$
|
—
|
|
$
|
1,172
|
|
$
|
4,936
|
|
|||
|
Israel
|
5,754
|
|
5,830
|
|
4,268
|
|
||||||
|
Asia
|
3,456
|
|
5,558
|
|
6,280
|
|
||||||
|
Oceania
|
—
|
|
1,489
|
|
3,190
|
|
||||||
|
Other
|
9
|
|
195
|
|
254
|
|
||||||
|
|
$
|
9,219
|
|
$
|
14,244
|
|
$
|
18,928
|
|
|||
|
|
December 31,
|
|||||||||||
|
|
2009
|
2010
|
2011
|
|||||||||
|
Long-lived assets located in the following countries:
|
|
|
|
|||||||||
|
United States
|
$
|
9
|
|
$
|
141
|
|
$
|
350
|
|
|||
|
Israel
|
281
|
|
288
|
|
235
|
|
||||||
|
Australia
|
—
|
|
61
|
|
50
|
|
||||||
|
|
$
|
290
|
|
$
|
490
|
|
$
|
635
|
|
|||
|
(d)
|
Revenues from Major Customers
|
F- 63
|
|
|
Consolidated Revenues
|
|||||||||||||||||||||
|
|
|
2009
|
2010
|
2011
|
|||||||||||||||||||
|
Customer
|
Segment
|
Revenues
|
% of
Total
Revenues
|
Revenues
|
% of
Total
Revenues
|
Revenues
|
% of
Total
Revenues
|
||||||||||||||||
|
A
|
Energy & Security Sonar Solutions
|
$
|
2,999
|
|
33
|
%
|
$
|
3,998
|
|
28
|
%
|
$
|
1,104
|
|
6
|
%
|
|||||||
|
B
|
Energy & Security Sonar Solutions
|
$
|
2,625
|
|
28
|
%
|
1,725
|
|
12
|
%
|
89
|
|
—
|
%
|
|||||||||
|
C
|
Energy & Security Sonar Solutions
|
$
|
1,051
|
|
11
|
%
|
783
|
|
5
|
%
|
650
|
|
3
|
%
|
|||||||||
|
D
|
Energy & Security Sonar Solutions
|
$
|
969
|
|
11
|
%
|
1,057
|
|
7
|
%
|
1,077
|
|
6
|
%
|
|||||||||
|
E
|
Energy & Security Sonar Solutions
|
$
|
—
|
|
—
|
%
|
—
|
|
—
|
%
|
2,155
|
|
11
|
%
|
|||||||||
|
F
|
GridSense
|
$
|
—
|
|
—
|
%
|
5
|
|
—
|
%
|
2,436
|
|
13
|
%
|
|||||||||
F- 64
Fair values of financial instruments included in current assets and current liabilities are estimated to approximate their book values, due to the short maturity of such instruments.
F- 65
Financial items measured at fair value are classified in the table below in accordance with the hierarchy established in applicable accounting principles.
|
|
As at December 31, 2011
|
|||||||||||||||
|
|
Level 1
|
Level 2
|
Level 3
|
Total
|
||||||||||||
|
Cash and cash equivalents
|
$
|
34,280
|
|
$
|
—
|
|
$
|
—
|
|
$
|
34,280
|
|
||||
|
Short-term deposits
|
18,000
|
|
—
|
|
—
|
|
18,000
|
|
||||||||
|
Restricted deposits – current and non-current
|
2,494
|
|
—
|
|
—
|
|
2,494
|
|
||||||||
|
Funds held in escrow
|
5,961
|
|
—
|
|
—
|
|
5,961
|
|
||||||||
|
Derivative liabilities
|
(18
|
)
|
—
|
|
—
|
|
(18
|
)
|
||||||||
|
Total
|
$
|
60,717
|
|
$
|
—
|
|
$
|
—
|
|
$
|
60,717
|
|
||||
|
|
As at December 31, 2010
|
|||||||||||||||
|
|
Level 1
|
Level 2
|
Level 3
|
Total
|
||||||||||||
|
Cash and cash equivalents
|
$
|
6,549
|
|
$
|
—
|
|
$
|
—
|
|
$
|
6,549
|
|
||||
|
Restricted deposits – current and non-current
|
1,402
|
|
—
|
|
—
|
|
1,402
|
|
||||||||
|
Derivative assets
|
93
|
|
—
|
|
—
|
|
93
|
|
||||||||
|
Total
|
$
|
8,044
|
|
$
|
—
|
|
$
|
—
|
|
$
|
8,044
|
|
||||
Derivative assets and liabilities are forward contracts for the purchase of NIS for which market prices are readily available. Unrealized gains or losses from forward contracts are recorded in Finance expense, net.
F- 66
The following table sets forth certain of the Company's unaudited quarterly consolidated financial information for the years ended December 31, 2010 and 2011.
|
|
2010
|
2011
|
||||||||||||||||||||||||||||||
|
First
Quarter
|
Second
Quarter
|
Third
Quarter
|
Fourth
Quarter
|
First
Quarter
|
Second
Quarter
|
Third
Quarter
|
Fourth
Quarter
|
|||||||||||||||||||||||||
|
|
(in thousands, except per share amounts
|
|||||||||||||||||||||||||||||||
|
Revenues
|
$
|
2,606
|
|
$
|
3,372
|
|
$
|
4,018
|
|
$
|
4,249
|
|
$
|
3,095
|
|
$
|
4,107
|
|
$
|
5,051
|
|
$
|
6,675
|
|
||||||||
|
Cost of sales
|
1,424
|
|
1,749
|
|
2,221
|
|
2,807
|
|
1,921
|
|
2,760
|
|
3,244
|
|
4,090
|
|
||||||||||||||||
|
Gross profit
|
1,182
|
|
1,623
|
|
1,797
|
|
1,442
|
|
1,174
|
|
1,347
|
|
1,807
|
|
2,585
|
|
||||||||||||||||
|
Research and development expenses, net
|
41
|
|
179
|
|
281
|
|
463
|
|
490
|
|
384
|
|
713
|
|
1,408
|
|
||||||||||||||||
|
Impairments
|
—
|
|
—
|
|
—
|
|
1,166
|
|
—
|
|
—
|
|
—
|
|
—
|
|
||||||||||||||||
|
Selling, general and administrative expenses
|
2,247
|
|
2,592
|
|
2,830
|
|
2,772
|
|
2,743
|
|
2,724
|
|
3,142
|
|
3,343
|
|
||||||||||||||||
|
Operating loss
|
(1,106
|
)
|
(1,148
|
)
|
(1,314
|
)
|
(2,959
|
)
|
(2,059
|
)
|
(1,761
|
)
|
(2,048
|
)
|
(2,166
|
)
|
||||||||||||||||
|
Finance income (expense), net
|
5
|
|
(197
|
)
|
53
|
|
(85
|
)
|
(117
|
)
|
(100
|
)
|
262
|
|
(71
|
)
|
||||||||||||||||
|
Gain on investment in GridSense
|
—
|
|
1,327
|
|
—
|
|
—
|
|
—
|
|
—
|
|
—
|
|
—
|
|
||||||||||||||||
|
Gain on sale of HangXing
|
—
|
|
—
|
|
—
|
|
—
|
|
492
|
|
—
|
|
—
|
|
—
|
|
||||||||||||||||
|
Distribution received from EnerTech
|
135
|
|
—
|
|
—
|
|
—
|
|
—
|
|
—
|
|
—
|
|
—
|
|
||||||||||||||||
|
Loss on the sale of EnerTech
|
—
|
|
—
|
|
—
|
|
(1,821
|
)
|
—
|
|
—
|
|
—
|
|
—
|
|
||||||||||||||||
|
Income (loss) before taxes on income
|
(966
|
)
|
(18
|
)
|
(1,261
|
)
|
(4,865
|
)
|
(1,684
|
)
|
(1,861
|
)
|
(1,786
|
)
|
(2,237
|
)
|
||||||||||||||||
|
Income tax benefit (expense)
|
(75
|
)
|
(123
|
)
|
(372
|
)
|
(101
|
)
|
(65
|
)
|
26
|
|
12,111
|
|
695
|
|
||||||||||||||||
|
Net income (loss) from continuing operations
|
(1,041
|
)
|
(141
|
)
|
(1,633
|
)
|
(4,966
|
)
|
(1,749
|
)
|
(1,835
|
)
|
10,325
|
|
(1,542
|
)
|
||||||||||||||||
|
Gain on the sale of CoaLogix, net of income taxes
|
—
|
|
—
|
|
—
|
|
—
|
|
—
|
|
—
|
|
30,683
|
|
386
|
|
||||||||||||||||
|
Loss from discontinued operations, net of income taxes
|
(2,132
|
)
|
(3,275
|
)
|
(3,307
|
)
|
(9,255
|
)
|
(836
|
)
|
(568
|
)
|
(544
|
)
|
—
|
|
||||||||||||||||
|
Non-controlling interests share of loss from discontinued operations
|
(5
|
)
|
45
|
|
244
|
|
(217
|
)
|
232
|
|
157
|
|
151
|
|
—
|
|
||||||||||||||||
|
Net income (loss)
|
(3,178
|
)
|
(3,371
|
)
|
(4,696
|
)
|
(14,438
|
)
|
(2,353
|
)
|
(2,246
|
)
|
40,615
|
|
(1,156
|
)
|
||||||||||||||||
|
Net (income) loss attributable to non-controlling interests
|
55
|
|
220
|
|
129
|
|
191
|
|
136
|
|
167
|
|
181
|
|
65
|
|
||||||||||||||||
|
Net income (loss) attributable to Acorn
Energy, Inc
|
$
|
(3,123
|
)
|
$
|
(3,151
|
)
|
$
|
(4,567
|
)
|
$
|
(14,247
|
)
|
$
|
(2,217
|
)
|
$
|
(2,079
|
)
|
$
|
40,796
|
|
$
|
(1,091
|
)
|
||||||||
|
Basic net income (loss) per share attributable to Acorn Energy, Inc. shareholders:
|
|
|
|
|
|
|
|
|
|
|
|
|
|
|
|
|
||||||||||||||||
|
From continuing operations
|
$
|
(0.08
|
)
|
$
|
—
|
|
$
|
(0.10
|
)
|
$
|
(0.30
|
)
|
$
|
(0.10
|
)
|
$
|
(0.10
|
)
|
$
|
0.60
|
|
$
|
(0.08
|
)
|
||||||||
|
From discontinued operations
|
(0.17
|
)
|
(0.21
|
)
|
(0.19
|
)
|
(0.58
|
)
|
(0.03
|
)
|
(0.02
|
)
|
1.73
|
|
0.02
|
|
||||||||||||||||
|
Total attributable to Acorn Energy, Inc. shareholders.
|
$
|
(0.25
|
)
|
$
|
(0.21
|
)
|
$
|
(0.29
|
)
|
$
|
(0.88
|
)
|
$
|
(0.13
|
)
|
$
|
(0.12
|
)
|
$
|
2.33
|
|
$
|
(0.06
|
)
|
||||||||
|
Diluted net income (loss) per share attributable to Acorn Energy, Inc. shareholders:
|
|
|
|
|
|
|
|
|
|
|
|
|
|
|
|
|
||||||||||||||||
|
From continuing operations
|
$
|
(0.08
|
)
|
$
|
—
|
|
$
|
(0.10
|
)
|
$
|
(0.30
|
)
|
$
|
(0.10
|
)
|
$
|
(0.10
|
)
|
$
|
0.59
|
|
$
|
(0.08
|
)
|
||||||||
|
From discontinued operations
|
(0.17
|
)
|
(0.21
|
)
|
(0.19
|
)
|
(0.58
|
)
|
(0.03
|
)
|
(0.02
|
)
|
1.70
|
|
0.02
|
|
||||||||||||||||
|
Total attributable to Acorn Energy, Inc. shareholders.
|
$
|
(0.25
|
)
|
$
|
(0.21
|
)
|
$
|
(0.29
|
)
|
$
|
(0.88
|
)
|
$
|
(0.13
|
)
|
$
|
(0.12
|
)
|
$
|
2.29
|
|
$
|
(0.06
|
)
|
||||||||
|
Weighted average number of shares outstanding attributable to Acorn Energy, Inc. – basic
|
12,498
|
|
15,161
|
|
15,721
|
|
16,254
|
|
17,449
|
|
17,489
|
|
17,508
|
|
17,521
|
|
||||||||||||||||
|
Weighted average number of shares outstanding attributable to Acorn Energy, Inc. – diluted
|
12,498
|
|
15,161
|
|
15,721
|
|
16,254
|
|
17,449
|
|
17,489
|
|
17,810
|
|
17,521
|
|
||||||||||||||||
F- 67
Acquisition of OmniMetrix
On February 15, 2012, the Company entered into a definitive agreement pursuant to which it acquired, through its XYZ Holdings, Inc. wholly-owned Georgia subsidiary ("Holdings" which has been renamed OMX Holdings, Inc.), all of the issued and outstanding limited liability company membership interests (the "Interests") in OmniMetrix, LLC, a Georgia limited liability company ("OmniMetrix"). OmniMetrix is in the business of designing, manufacturing, marketing and selling (i) wireless remote systems that monitor standby power generation, backup power generators, remote powered equipment, cellular towers, emergency towered communications and remote tower sites, (ii) wireless remote systems that monitor landfill gas, and (iii) cathodic protection products to monitor pipeline integrity. Holdings purchased the Interests in OmniMetrix from its three individual holders (the "Sellers") in consideration for an aggregate cash payment of $8,500, subject to certain adjustments as provided in the definitive agreement. The acquisition of
OmniMetrix adds to the Company's growing product lines of remote monitoring systems for aging energy infrastructure.
Acorn investment in USSI
On February 6, 2012, the Company entered into a new Stock Purchase Agreement (the “USSI Purchase Agreement”) with USSI pursuant to which the Company converted advanced funds into additional shares of USSI common stock (“USSI Common Stock”) and shares of USSI's new Series A-1 Preferred Stock (“USSI Preferred Stock”). The Company also made a further payment to USSI of $2,250 on February 6, 2012 to purchase additional shares of USSI Preferred Stock. The Company may purchase more shares of USSI Preferred Stock for an aggregate purchase price of $2,500 at a future date. The USSI Preferred Stock provides that upon any future liquidation of USSI, to the extent funds are available for distribution to USSI's stockholders after the satisfaction of any USSI liabilities at that time, USSI would first repay the Company for the purchase price of our USSI Preferred Stock. Thereafter, the Company would receive a further payment for such shares ratably with all other USSI Common Stock holders as though the Company's shares of USSI Preferred Stock were the same number of shares of USSI Common Stock.
The Company currently owns approximately 87% of USSI, which amount would increase to approximately 92% if and when the second closing occurs. In connection with the USSI Purchase Agreement, the Company also agreed to permit USSI to establish a new 2012 Stock Plan (the “USSI 2012 Plan”) under which key employees, directors and consultants of USSI may receive options to purchase up to an aggregate of 1,180,000 shares of USSI Common Stock on such terms as the USSI 2012 Plan provides and as determined by USSI's board of directors or by such committee designated by USSI's board to administer the USSI 2012 Plan, if any. If options to purchase all shares of USSI Common Stock available under the USSI 2012 Plan are granted and exercised, and provided that the Company made the additional $2,500 USSI Preferred Stock purchase as contemplated by the USSI Purchase Agreement, the Company would own approximately 81% of USSI on a fully diluted basis.
Acorn Dividend
On February 7, 2012, the Company announced that its Board of Directors approved a dividend of $0.035 per share to be paid on March 1, 2012 to common stockholders of record on February 20, 2012. The dividend is a continuation of the Company's policy to pay a regular quarterly per share dividend of $.035 per quarter. On March 1, 2012, the total dividend payment was $618.
F- 68
TABLE OF CONTENTS
Part IItem 1. BusinessItem 1A. Risk FactorsItem 1B. Unresolved Staff CommentsItem 2. PropertiesItem 3. Legal ProceedingsItem 4. Mine Safety DisclosuresPart IIItem 5. Market For Registrant S Common Equity, Related Stockholder Matters and Issuer Purchases Of Equity SecuritiesItem 6. Selected Financial DataItem 7. Management S Discussion and Analysis Of Financial Condition and Results Of OperationsItem 7A. Quantitative and Qualitative Disclosure About Market RiskItem 8. Financial Statements and Supplementary DataItem 9. Changes in and Disagreements with Accountants on Accounting and Financial DisclosureItem 9A. Controls and ProceduresItem 9B. Other InformationPart IIIItem 10. Directors, Executive Officers and Corporate GovernanceItem 11. Executive CompensationItem 12. Security Ownership Of Certain Beneficial Owners and Management and Related Stockholder MattersItem 13. Certain Relationships, Related Transactions and Director IndependenceItem 14. Principal Accounting Fees and ServicesPart IVItem 15. Exhibits and Financial Statement SchedulesNote 1 Nature Of OperationsNote 2 Summary Of Significant Accounting PoliciesNote 3 Investment in and Sale Of CoalogixNote 4 AcquisitionsNote 5 CoreworxNote 6 Investment in ComvergeNote 7 Other InvestmentsNote 8 Non-controlling InterestsNote 9 InventoryNote 10 Other Current AssetsNote 11 Property and Equipment, NetNote 12 Goodwill and Intangible AssetsNote 13 ImpairmentsNote 14 Bank Debt and Other DebtNote 15 Other Current LiabilitiesNote 16 Accrued Severance and Severance AssetsNote 17 Commitments and ContingenciesNote 18 EquityNote 19 Finance Expense, NetNote 20 Income TaxesNote 21 Related Party Balances and TransactionsNote 22 Segment Reporting and Geographic InformationNote 23 Financial InstrumentsNote 24 Fair Value MeasurementsNote 23 Summary Quarterly Financial Data (unaudited)Note 26 Subsequent Events