ASSOCIATED CAPITAL GROUP, INC.
10-Ks and 10-Qs
|
|
|
|
|
|
|
|
|
|
|
|
|
|
|
|
|
|
|
|
|
|
|
|
|
|
|
|
|
|
|
|
|
|
|
|
|
|
|
|
|
|
|
|
|
|
|
|
|
|
|
|
|
|
|
|
|
|
|
|
|
|
|
|
|
|
|
|
|
|
|
|
|
|
|
|
|
|
|
|
|
|
|
|
|
|
|
|
|
|
|
|
|
|
|
|
|
|
|
|
|
|
|
|
|
|
|
|
|
|
|
|
|
|
|
|
|
|
|
|
|
|
|
|
|
|
|
|
|
|
|
|
|
|
|
|
|
|
|
|
|
|
|
|
|
|
|
|
|
|
|
|
|
|
|
|
|
|
|
|
SECURITIES & EXCHANGE COMMISSION
WASHINGTON, D.C. 20549
FORM 10-Q
(Mark One)
| ☒ |
QUARTERLY REPORT PURSUANT TO SECTION 13 OR 15(d) OF THE SECURITIES EXCHANGE ACT OF 1934
|
For the quarterly period ended
March 31, 2017
or
| ☐ |
TRANSITION REPORT PURSUANT TO SECTION 13 OR 15(d) OF THE SECURITIES EXCHANGE ACT OF 1934
|
For the transition period from ___ to ___
Commission File No.
001-37387
|
ASSOCIATED CAPITAL GROUP, INC.
|
|
(Exact name of Registrant as specified in its charter)
|
|
Delaware
|
|
47-3965991
|
|
(State of other jurisdiction of incorporation or organization)
|
|
(I.R.S. Employer Identification No.)
|
|
|
|
|
|
One Corporate Center, Rye, NY
|
|
10580-1422
|
|
(Address of principle executive offices)
|
|
(Zip Code)
|
|
(203) 629-9595
|
|
Registrant’s telephone number, including area code
|
Indicate by check mark whether the registrant (1) has filed all reports required to be filed by Section 13 or 15(d) of the Securities Exchange Act of 1934 during the preceding 12 months (or for such shorter period that the registrant was required to file such reports), and (2) has been subject to such filing requirements for the past 90 days.
Yes
☒
No
☐
Indicate by check mark whether the registrant has submitted electronically and posted on its corporate Web site, if any, every Interactive Data File required to be submitted and posted pursuant to Rule 405 of Regulation S-T during the preceding 12 months (or for such shorter period that the registrant was required to submit and post such files).
Yes
☒
No
☐
Indicate by check mark whether the registrant is a large accelerated filer, an accelerated filer, a non-accelerated filer, or a smaller reporting company. See the definitions of “large accelerated filer", "accelerated filer", and "smaller reporting company” in Rule 12b-2 of the Exchange Act. (Check one):
|
Large accelerated filer
☐
|
Accelerated filer
☒
|
|
|
|
|
Non-accelerated filer
☐
|
Smaller reporting company
☐
|
Indicate by check mark whether the registrant is a shell company (as defined in Rule 12b-2 of the Exchange Act).
Yes
☐
No
☒
Indicate the number of shares outstanding of each of the Registrant’s classes of Common Stock, as of the latest practical date.
|
Class
|
|
Outstanding at April 30, 2017
|
|
Class A Common Stock, .001 par value
|
(Including 420,240 restricted stock awards)
|
5,033,013
|
|
Class B Common Stock, .001 par value
|
|
19,195,649
|
|
INDEX
|
|
|
|
|
|
ASSOCIATED CAPITAL GROUP, INC. AND SUBSIDIARIES
|
|
|
|
|
|
PART I.
|
FINANCIAL INFORMATION
|
|
|
|
|
Item 1.
|
Unaudited Condensed Consolidated Financial Statements
|
|
|
|
|
|
Condensed Consolidated Statements of Financial Condition:
|
|
|
- March 31, 2017
|
|
|
- December 31, 2016
|
|
|
- March 31, 2016
|
|
|
|
|
|
Condensed Consolidated Statements of Income:
|
|
|
- Three months ended March 31, 2017 and 2016
|
|
|
|
|
|
Condensed Consolidated Statements of Comprehensive Income:
|
|
|
- Three months ended March 31, 2017 and 2016
|
|
|
|
|
|
Condensed Consolidated Statements of Equity:
|
|
|
- Three months ended March 31, 2017 and 2016
|
|
|
|
|
|
Condensed Consolidated Statements of Cash Flows:
|
|
|
- Three months ended March 31, 2017 and 2016
|
|
|
|
|
|
Notes to Unaudited Condensed Consolidated Financial Statements
|
|
|
|
|
Item 2.
|
Management’s Discussion and Analysis of Financial Condition and Results of Operations
|
|
|
|
|
Item 3.
|
Quantitative and Qualitative Disclosures About Market Risk (Included in Item 2)
|
|
|
|
|
Item 4.
|
Controls and Procedures
|
|
|
|
|
PART II.
|
OTHER INFORMATION
|
|
|
|
|
Item 1.
|
Legal Proceedings
|
|
Item 2.
|
Unregistered Sales of Equity Securities and Use of Proceeds
|
|
Item 6.
|
Exhibits
|
|
|
|
|
SIGNATURES
|
|
2
ASSOCIATED CAPITAL GROUP, INC. AND SUBSIDIARIES
CONDENSED CONSOLIDATED STATEMENTS OF FINANCIAL CONDITION
UNAUDITED
(Dollars in thousands, except per share data)
|
March 31,
|
December 31,
|
March 31,
|
||||||||||
|
|
2017
|
2016
|
2016
|
|||||||||
|
ASSETS
|
||||||||||||
|
Cash and cash equivalents
|
$
|
307,651
|
$
|
314,093
|
$
|
203,239
|
||||||
|
Investments in securities
|
193,120
|
207,096
|
184,819
|
|||||||||
|
Investment in GBL stock (4,393,055 shares)
|
129,990
|
135,701
|
162,807
|
|||||||||
|
Investments in affiliated registered investment companies
|
136,284
|
131,645
|
115,916
|
|||||||||
|
Investments in partnerships
|
130,058
|
129,398
|
113,147
|
|||||||||
|
Receivable from brokers
|
12,021
|
12,588
|
23,278
|
|||||||||
|
Investment advisory fees receivable
|
1,349
|
9,784
|
1,463
|
|||||||||
|
Receivable from affiliates
|
1,524
|
1,523
|
3,507
|
|||||||||
|
Goodwill
|
3,422
|
3,422
|
3,254
|
|||||||||
|
Other assets
|
2,214
|
7,353
|
1,270
|
|||||||||
|
Total assets
|
$
|
917,633
|
$
|
952,603
|
$
|
812,700
|
||||||
|
|
||||||||||||
|
LIABILITIES, REDEEMABLE NONCONTROLLING INTERESTS AND EQUITY
|
||||||||||||
|
Payable to brokers
|
$
|
6,168
|
$
|
2,396
|
$
|
12,251
|
||||||
|
Income taxes payable and deferred tax liabilities
|
4,506
|
6,978
|
13,357
|
|||||||||
|
Compensation payable
|
5,991
|
17,676
|
4,893
|
|||||||||
|
Securities sold, not yet purchased
|
7,519
|
9,984
|
8,014
|
|||||||||
|
Mandatorily redeemable noncontrolling interests
|
-
|
-
|
1,421
|
|||||||||
|
Payable to affiliates
|
560
|
1,455
|
673
|
|||||||||
|
Accrued expenses and other liabilities
|
7,008
|
35,862
|
4,072
|
|||||||||
|
Total liabilities
|
31,752
|
74,351
|
44,681
|
|||||||||
|
|
||||||||||||
|
Redeemable noncontrolling interests
|
4,050
|
4,230
|
3,752
|
|||||||||
|
|
||||||||||||
|
Equity:
|
||||||||||||
|
Preferred stock, $0.001 par value, 10,000,000 shares authorized; none issued and outstanding
|
-
|
-
|
-
|
|||||||||
|
Class A Common Stock, $0.001 par value; 100,000,000 shares authorized; 6,395,380, 6,398,580 and 6,244,452
|
||||||||||||
|
shares issued, respectively; 5,051,686, 5,058,648 and 6,154,674 shares outstanding, respectively
|
6
|
6
|
6
|
|||||||||
|
Class B Common Stock, $0.001 par value; 100,000,000 shares authorized; 19,196,792, 19,196,792 and
|
||||||||||||
|
19,196,792 shares issued and outstanding, respectively
|
19
|
19
|
19
|
|||||||||
|
Additional paid-in capital
|
1,007,471
|
1,007,027
|
999,644
|
|||||||||
|
Retained earnings
|
(5,751
|
)
|
7,327
|
1,131
|
||||||||
|
GBL 4% PIK Note
|
(90,000
|
)
|
(100,000
|
)
|
(250,000
|
)
|
||||||
|
Accumulated comprehensive income
|
11,886
|
1,317
|
12,933
|
|||||||||
|
Treasury stock, at cost (1,343,694, 1,339,932 and 89,778 shares, respectively)
|
(41,800
|
)
|
(41,674
|
)
|
(2,464
|
)
|
||||||
|
Total Associated Capital Group, Inc. equity
|
881,831
|
874,022
|
761,269
|
|||||||||
|
Noncontrolling interests
|
-
|
-
|
2,998
|
|||||||||
|
Total equity
|
881,831
|
874,022
|
764,267
|
|||||||||
|
Total liabilities and equity
|
$
|
917,633
|
$
|
952,603
|
$
|
812,700
|
||||||
See accompanying notes.
3
ASSOCIATED CAPITAL GROUP, INC. AND SUBSIDIARIES
CONDENSED CONSOLIDATED STATEMENTS OF INCOME
UNAUDITED
(Dollars in thousands, except per share data)
|
Three Months Ended
|
||||||||
|
|
March 31,
|
|||||||
|
|
2017
|
2016
|
||||||
|
Revenues
|
||||||||
|
Investment advisory and incentive fees
|
$
|
2,401
|
$
|
2,068
|
||||
|
Institutional research services
|
2,582
|
2,438
|
||||||
|
Other
|
4
|
11
|
||||||
|
Total revenues
|
4,987
|
4,517
|
||||||
|
Expenses
|
||||||||
|
Compensation
|
6,783
|
6,312
|
||||||
|
Management fee
|
-
|
274
|
||||||
|
Stock based compensation
|
444
|
644
|
||||||
|
Other operating expenses
|
2,092
|
1,802
|
||||||
|
Total expenses
|
9,319
|
9,032
|
||||||
|
|
||||||||
|
Operating loss
|
(4,332
|
)
|
(4,515
|
)
|
||||
|
Other income (expense)
|
||||||||
|
Net gain/(loss) from investments
|
(14,401
|
)
|
3,709
|
|||||
|
Interest and dividend income
|
2,257
|
3,434
|
||||||
|
Interest expense
|
(70
|
)
|
(420
|
)
|
||||
|
Shareholder-designated contribution
|
(4,895
|
)
|
-
|
|||||
|
Total other income/(expense), net
|
(17,109
|
)
|
6,723
|
|||||
|
Income/(loss) before income taxes
|
(21,441
|
)
|
2,208
|
|||||
|
Income tax provision
|
(8,424
|
)
|
661
|
|||||
|
Net income/(loss)
|
(13,017
|
)
|
1,547
|
|||||
|
Net income/(loss) attributable to noncontrolling interests
|
61
|
(46
|
)
|
|||||
|
Net income/(loss) attributable to Associated Capital Group, Inc.'s shareholders
|
$
|
(13,078
|
)
|
$
|
1,593
|
|||
|
Net income/(loss) attributable to Associated Capital Group, Inc.'s shareholders
|
||||||||
|
per share:
|
||||||||
|
Basic
|
$ |
(0.55
|
)
|
$ |
0.06
|
|||
|
Diluted
|
$ |
(0.55
|
)
|
$ |
0.06
|
|||
|
Weighted average shares outstanding:
|
||||||||
|
Basic
|
23,829
|
24,863
|
||||||
|
Diluted
|
23,829
|
25,177
|
||||||
|
Dividends declared:
|
$ |
-
|
$ |
0.10
|
||||
See accompanying notes.
4
ASSOCIATED CAPITAL GROUP, INC. AND SUBSIDIARIES
CONDENSED CONSOLIDATED STATEMENTS OF COMPREHENSIVE INCOME
UNAUDITED
(Dollars in thousands, except per share data)
|
Three Months Ended
|
||||||||
|
|
March 31,
|
|||||||
|
|
2017
|
2016
|
||||||
|
|
||||||||
|
Net income/(loss)
|
$
|
(13,017
|
)
|
$
|
1,547
|
|||
|
Other comprehensive income, net of tax:
|
||||||||
|
Net unrealized gains on securities available for sale (a)
|
10,569
|
15,514
|
||||||
|
Other comprehensive income
|
10,569
|
15,514
|
||||||
|
|
||||||||
|
Comprehensive income/(loss)
|
(2,448
|
)
|
17,061
|
|||||
|
Less: Comprehensive income attributable to noncontrolling interests
|
61
|
678
|
||||||
|
|
||||||||
|
Comprehensive income/(loss) attributable to Associated Capital Group, Inc.
|
$
|
(2,509
|
)
|
$
|
16,383
|
|||
| (a) |
Net of income tax expense of $5,945, and $8,726, respectively.
|
See accompanying notes.
5
ASSOCIATED CAPITAL GROUP, INC. AND SUBSIDIARIES
CONDENSED
CONSOLIDATED
STATEMENTS OF EQUITY
UNAUDITED
(In thousands)
For the Three Months Ended March 31, 2017
|
Associated Capital Group, Inc. shareholders
|
||||||||||||||||||||||||||||||||
|
Additional
|
Accumulated
|
Redeemable
|
||||||||||||||||||||||||||||||
|
Common
|
Retained
|
Paid-in
|
GBL 4%
|
Comprehensive
|
Treasury
|
Noncontrolling
|
||||||||||||||||||||||||||
|
Stock
|
Earnings
|
Capital
|
PIK Note
|
Income
|
Stock
|
Total
|
Interests
|
|||||||||||||||||||||||||
|
Balance at December 31, 2016
|
$
|
25
|
$
|
7,327
|
$
|
1,007,027
|
$
|
(100,000
|
)
|
$
|
1,317
|
$
|
(41,674
|
)
|
$
|
874,022
|
$
|
4,230
|
||||||||||||||
|
Redemptions of
|
||||||||||||||||||||||||||||||||
|
noncontrolling interests
|
-
|
-
|
-
|
-
|
-
|
-
|
-
|
(241
|
)
|
|||||||||||||||||||||||
|
Net income (loss)
|
-
|
(13,078
|
)
|
-
|
-
|
-
|
-
|
(13,078
|
)
|
61
|
||||||||||||||||||||||
|
Net unrealized losses on
|
||||||||||||||||||||||||||||||||
|
securities available for sale,
|
||||||||||||||||||||||||||||||||
|
net of income tax benefit ($942)
|
-
|
-
|
-
|
-
|
(1,675
|
)
|
-
|
(1,675
|
)
|
-
|
||||||||||||||||||||||
| Amounts reclassified from | ||||||||||||||||||||||||||||||||
| accumulated other | ||||||||||||||||||||||||||||||||
| comprehensive income, net of | ||||||||||||||||||||||||||||||||
|
income tax expense ($6,887)
|
-
|
-
|
-
|
-
|
12,244
|
-
|
12,244
|
-
|
||||||||||||||||||||||||
|
Stock based compensation
|
||||||||||||||||||||||||||||||||
|
expense
|
-
|
-
|
444
|
-
|
-
|
-
|
444
|
-
|
||||||||||||||||||||||||
|
Proceeds from payment of
|
||||||||||||||||||||||||||||||||
|
GBL 4% PIK Note
|
-
|
-
|
-
|
10,000
|
-
|
-
|
10,000
|
-
|
||||||||||||||||||||||||
|
Purchase of treasury stock
|
-
|
-
|
-
|
-
|
-
|
(126
|
)
|
(126
|
)
|
-
|
||||||||||||||||||||||
|
Balance at March 31, 2017
|
$
|
25
|
$
|
(5,751
|
)
|
$
|
1,007,471
|
$
|
(90,000
|
)
|
$
|
11,886
|
$
|
(41,800
|
)
|
$
|
881,831
|
$
|
4,050
|
|||||||||||||
See accompanying notes.
6
ASSOCIATED CAPITAL GROUP, INC. AND SUBSIDIARIES
CONDENSED CONSOLIDATED
STATEMENTS OF EQUITY
UNAUDITED
(In thousands)
For the Three Months Ended March 31, 2016
|
Associated Capital Group, Inc. shareholders
|
||||||||||||||||||||||||||||||||||||
|
Additional
|
Accumulated
|
Redeemable
|
||||||||||||||||||||||||||||||||||
|
Noncontrolling
|
Common
|
Retained
|
Paid-in
|
GBL 4%
|
Comprehensive
|
Treasury
|
Noncontrolling
|
|||||||||||||||||||||||||||||
|
Interests
|
Stock
|
Earnings
|
Capital
|
PIK Note
|
Income
|
Stock
|
Total
|
Interests
|
||||||||||||||||||||||||||||
|
Balance at December 31, 2015
|
$
|
2,353
|
$
|
25
|
$
|
2,072
|
$
|
999,000
|
$
|
(250,000
|
)
|
$
|
(1,857
|
)
|
$
|
(44
|
)
|
$
|
751,549
|
$
|
5,738
|
|||||||||||||||
|
Redemptions of
|
||||||||||||||||||||||||||||||||||||
|
noncontrolling interests
|
-
|
-
|
-
|
-
|
-
|
-
|
-
|
-
|
(208
|
)
|
||||||||||||||||||||||||||
|
Deconsolidation of an offshore
|
||||||||||||||||||||||||||||||||||||
|
fund
|
-
|
-
|
-
|
-
|
-
|
-
|
-
|
-
|
(1,811
|
)
|
||||||||||||||||||||||||||
|
Net income (loss)
|
(79
|
)
|
-
|
1,593
|
-
|
-
|
-
|
-
|
1,514
|
33
|
||||||||||||||||||||||||||
|
Net unrealized gains on
|
||||||||||||||||||||||||||||||||||||
|
securities available for sale,
|
||||||||||||||||||||||||||||||||||||
|
net of income tax expense ($8,726)
|
724
|
-
|
-
|
-
|
-
|
14,790
|
-
|
15,514
|
-
|
|||||||||||||||||||||||||||
|
Dividends declared ($.10 per share)
|
-
|
-
|
(2,534
|
)
|
-
|
-
|
-
|
-
|
(2,534
|
)
|
-
|
|||||||||||||||||||||||||
|
Stock based compensation
|
||||||||||||||||||||||||||||||||||||
|
expense
|
-
|
-
|
-
|
644
|
-
|
-
|
-
|
644
|
-
|
|||||||||||||||||||||||||||
|
Purchase of treasury stock
|
-
|
-
|
-
|
-
|
-
|
-
|
(2,420
|
)
|
(2,420
|
)
|
-
|
|||||||||||||||||||||||||
|
Balance at March 31, 2016
|
$
|
2,998
|
$
|
25
|
$
|
1,131
|
$
|
999,644
|
$
|
(250,000
|
)
|
$
|
12,933
|
$
|
(2,464
|
)
|
$
|
764,267
|
$
|
3,752
|
||||||||||||||||
See accompanying notes.
7
ASSOCIATED CAPITAL GROUP, INC. AND SUBSIDIARIES
CONDENSED CONSOLIDATED STATEMENTS OF CASH FLOWS
UNAUDITED
(In thousands)
|
Three Months Ended
|
||||||||
|
|
March 31,
|
|||||||
|
|
2017
|
2016
|
||||||
|
Operating activities
|
||||||||
|
Net income/(loss)
|
$
|
(13,017
|
)
|
$
|
1,547
|
|||
|
Adjustments to reconcile net income/(loss) to net cash provided by operating activities:
|
||||||||
|
Equity in net gains from partnerships
|
(696
|
)
|
(2,181
|
)
|
||||
|
Depreciation and amortization
|
4
|
3
|
||||||
|
Stock based compensation expense
|
444
|
644
|
||||||
|
Other-than-temporary loss on available for sale securities
|
19,131
|
-
|
||||||
|
Donated securities
|
566
|
-
|
||||||
|
(Increase) decrease in assets:
|
||||||||
|
Investments in trading securities
|
11,056
|
9,801
|
||||||
|
Investments in partnerships:
|
||||||||
|
Contributions to partnerships
|
(4,964
|
)
|
(17,617
|
)
|
||||
|
Distributions from partnerships
|
5,000
|
11,699
|
||||||
|
Receivable from affiliates
|
(1
|
)
|
3,951
|
|||||
|
Receivable from brokers
|
567
|
32,535
|
||||||
|
Investment advisory fees receivable
|
8,435
|
3,414
|
||||||
|
Other assets
|
5,134
|
628
|
||||||
|
Increase (decrease) in liabilities:
|
||||||||
|
Payable to brokers
|
3,772
|
(38,376
|
)
|
|||||
|
Income taxes payable and deferred tax liabilities
|
(8,416
|
)
|
(1,038
|
)
|
||||
|
Payable to affiliates
|
(895
|
)
|
673
|
|||||
|
Compensation payable
|
(11,685
|
)
|
(6,032
|
)
|
||||
|
Mandatorily redeemable noncontrolling interests
|
-
|
292
|
||||||
|
Accrued expenses and other liabilities
|
(28,853
|
)
|
132
|
|||||
|
Total adjustments
|
(1,401
|
)
|
(1,472
|
)
|
||||
|
Net cash (used in) provided by operating activities
|
$
|
(14,418
|
)
|
$
|
75
|
|||
8
ASSOCIATED CAPITAL GROUP, INC. AND SUBSIDIARIES
CONDENSED CONSOLIDATED STATEMENTS OF CASH FLOWS
UNAUDITED (continued)
(In thousands)
|
Three Months Ended
|
||||||||
|
|
March 31,
|
|||||||
|
|
2017
|
2016
|
||||||
|
Investing activities
|
||||||||
|
Purchases of available for sale securities
|
$
|
(2,080
|
)
|
$
|
(219
|
)
|
||
|
Return of capital on available for sale securities
|
423
|
263
|
||||||
|
Net cash (used in) provided by investing activities
|
(1,657
|
)
|
44
|
|||||
|
|
||||||||
|
Financing activities
|
||||||||
|
Redemptions of redeemable noncontrolling interests
|
(241
|
)
|
(208
|
)
|
||||
|
Purchase of treasury stock
|
(126
|
)
|
(2,420
|
)
|
||||
|
Proceeds from payment of GBL 4% PIK Note
|
10,000
|
-
|
||||||
|
Net cash provided by (used in) financing activities
|
9,633
|
(2,628
|
)
|
|||||
|
Net decrease in cash and cash equivalents
|
(6,442
|
)
|
(2,509
|
)
|
||||
|
Cash and cash equivalents at beginning of period
|
314,093
|
205,750
|
||||||
|
Decrease in cash from deconsolidation
|
-
|
(2
|
)
|
|||||
|
Cash and cash equivalents at end of period
|
$
|
307,651
|
$
|
203,239
|
||||
|
Supplemental disclosures of cash flow information:
|
||||||||
|
Cash paid for interest
|
$
|
70
|
$
|
128
|
||||
|
Cash paid for taxes
|
$
|
-
|
$
|
1,600
|
||||
Non-cash activity:
- For the three months ended March 31, 2017 and March 31, 2016, the Company accrued dividends on restricted stock awards of $0 and $49, respectively.
| - |
On January 1, 2016, Associated Capital Group, Inc. was no longer deemed to have control over a certain offshore fund which resulted in the deconsolidation of that offshore fund and a decrease of approximately $1 of cash and cash equivalents, a decrease of approximately $104 of net assets and a decrease of approximately $105 of redeemable noncontrolling interests.
|
| - |
On January 1, 2016, AC adopted ASU 2015-02, which amends the consolidation requirements in ASC 810. This resulted in the deconsolidation of a certain consolidated feeder fund and a certain limited partnership and a decrease of approximately $1 of cash and cash equivalents, a decrease of approximately $1,705 of net assets and a decrease of approximately $1,706 of redeemable noncontrolling interests.
|
See accompanying notes.
9
ASSOCIATED CAPITAL GROUP, INC. AND SUBSIDIARIES
NOTES TO CONDENSED CONSOLIDATED FINANCIAL STATEMENTS
March 31, 2017
(Unaudited)
A.
Basis of Presentation and Significant Accounting Policies
Unless we have indicated otherwise, or the context otherwise requires, references in this report to “Associated Capital Group, Inc.,” “AC Group,” “the Company,” “AC,” “we,” “us” and “our” or similar terms are to Associated Capital Group, Inc., its predecessors and its subsidiaries.
The Spin-off and Related Transactions
We are a Delaware corporation organized to be the parent operating company for the spin-off of GAMCO Investors, Inc.’s (“GAMCO’s” or “GBL’s”) alternative investment management business, institutional research services operations and certain cash and other assets.
On November 30, 2015, GAMCO distributed all the outstanding shares of each class of common stock of AC Group on a pro rata one-for-one basis to the holders of each class of GAMCO’s common stock. Prior to the distribution, GAMCO contributed the 93.9% interest it held in
Gabelli & Company Investment Advisers (“GCIA” f/k/a Gabelli Securities, Inc.) and certain cash and other assets to AC Group. GCIA is an investment adviser registered with the Securities and Exchange Commission under the Investment Advisers Act of 1940, as amended. GCIA and its wholly owned subsidiary, Gabelli & Partners, LLC ("Gabelli & Partners"), collectively serve as general partners or investment managers to investment funds including limited partnerships and offshore companies (collectively, "Investment Partnerships"), and separate accounts. We primarily manage assets in equity event-driven value strategies, across a range of risk and event arbitrage portfolios. The business earns fees from its advisory assets, and income (loss) from trading and investment portfolio activities. The advisory fees include management and incentive fees. Management fees are largely based on a percentage of the portfolios' levels of assets under management. Incentive fees are based on the percentage of profits derived from the investment performance delivered to clients' invested assets. GCIA is now a wholly owned subsidiary of AC.
We operate our institutional research services operations through G.research, LLC ("G.research") doing business as “Gabelli & Company”, a wholly owned subsidiary of Institutional Services Holdings, LLC which in turn is a wholly owned subsidiary of the Company. G.research is a broker-dealer registered under the Securities Exchange Act of 1934, as amended (the "Exchange Act"). Through G.research, we provide institutional research services as well as act as an underwriter. G.research is regulated by the Financial Industry Regulatory Authority ("FINRA"). G.research's revenues are derived primarily from institutional research services.
In addition, the following transactions were also undertaken in connection with the spin-off:
GAMCO issued a promissory note (the “GAMCO Note”) to AC Group in the original principal amount of $250.0 million used to partially capitalize the Company in connection with the spin-off. The GAMCO Note bears interest at 4.0% per annum and has a maturity date of November 30, 2020 with respect to the original principal amount of the GAMCO Note. Interest on the GAMCO Note will accrue from the most recent date for which interest has been paid, or if no interest has been paid, from the effective date of the GAMCO Note; provided, however, that at the election of GAMCO, payment of interest on the GAMCO Note may, in lieu of being paid in cash, be paid, in whole or in part, in kind on the then-outstanding principal amount (a “PIK Amount”).
GAMCO will repay all PIK Amounts added to the outstanding principal amount of the GAMCO Note, in cash, on the fifth anniversary of the date on which each such PIK Amount was added to the outstanding principal amount of the GAMCO Note. In no event may any interest be paid in kind subsequent to November 30, 2019. GAMCO may prepay the GAMCO Note prior to maturity without penalty.
AC has received principal repayments totaling $160 million on the GAMCO Note, of which $10 million was received during the first quarter of 2017. $50 million of the prepayment was applied against the principal amount due on November 30, 2016, $50 million against the principal amount due on November 30, 2017, $30 million against the principal amount due on November 30, 2018, and $30 million against the principal amount due on November 30, 2019. Of the $90 million principal amount outstanding, $20 million is due on November 30, 2018, $20 million is due on November 30, 2019, and $50 million is due on November 30, 2020.
In addition, AC Group through
GCIA
owns 4,393,055 shares of GAMCO Class A common stock. The sale was made from GAMCO to
GCIA
in advance of the spin-off.
GCIA
paid the purchase price by issuing a note to GAMCO in the principal amount of $150 million (the “
GCIA
Note”). In connection with the spin-off, AC Group received the
GCIA
Note from GAMCO and
GCIA
became a subsidiary of AC Group.
The GCIA Note is thus now an intercompany note within the AC Group.
10
Basis of Presentation
The unaudited interim condensed consolidated financial statements of AC Group included herein have been prepared in conformity with accounting principles generally accepted in the United States of America (“GAAP”) for interim financial information and with the instructions to Form 10-Q and Rule 10-01 of Regulation S-X. Accordingly, they do not include all the information and footnotes required by GAAP in the United States for complete financial statements. In the opinion of management, the unaudited interim condensed consolidated financial statements reflect all adjustments, which are of a normal recurring nature, necessary for a fair presentation of financial position, results of operations and cash flows of the Company for the interim periods presented and are not necessarily indicative of a full year’s results.
The interim condensed consolidated financial statements include the accounts of AC Group and its subsidiaries. Intercompany accounts and transactions are eliminated.
These interim condensed consolidated financial statements should be read in conjunction with our audited consolidated financial statements included in our Annual Report on Form 10-K for the year ended December 31, 2016.
Use of Estimates
The preparation of the condensed consolidated financial statements in conformity with GAAP requires management to make estimates and assumptions that affect the amounts reported on the condensed consolidated financial statements and accompanying notes. Actual results could differ from those estimates.
Reclassification
The Company has reclassified certain prior-period amounts to conform to the current-period presentation. For presentation of 2017 results, the Company reported revenue from its research services agreement with GAMCO in “Institutional Research Services Revenue” instead of “Other Revenue”. The reclassification did not impact revenue, operating expenses, operating income, net income, or equity.
Recent Accounting Developments
In March 2016, the Financial Accounting Standards Board (“FASB”) issued Accounting Standards Update (“ASU”) 2016-09, which simplifies several aspects of the accounting for employee share-based payment transactions for both public and nonpublic entities, including the accounting for income taxes, forfeitures, and statutory tax withholding requirements, as well as classification in the statement of cash flows. For public companies, the ASU is effective for annual reporting periods beginning after December 15, 2016, including interim periods within those annual reporting periods. The Company has adopted this ASU effective January 1, 2017 without a material impact on its condensed consolidated financial statements.
In August 2014, the FASB issued ASU No. 2014-15, “Presentation of Financial Statements – Going Concern,” which provides guidance on determining when and how reporting entities must disclose going-concern uncertainties in their financial statements. The new standard requires management to perform interim and annual assessments of an entity’s ability to continue as a going concern within one year of the date of issuance of the entity’s financial statements. Further, an entity must provide certain disclosures if there is “substantial doubt about the entity’s ability to continue as a going concern.” The FASB believes that requiring management to perform the assessment will enhance the timeliness, clarity, and consistency of related disclosures. The ASU is effective for annual periods ending after December 15, 2016, and for annual and interim periods thereafter. The Company has adopted this ASU effective December 31, 2016. No additional disclosures were required in this Report of Form 10Q based on management’s assessment that it does not have substantial doubt about the Company’s ability to continue as a going concern.
In May 2014, the FASB issued ASU No. 2014-09, "Revenue from Contracts with Customers," which supersedes the revenue recognition requirements in the Accounting Standards Codification ("ASC") Topic 605, Revenue Recognition, and most industry-specific guidance throughout the industry topics of the ASC. The core principle of the new ASU No. 2014-09 is for companies to recognize revenue from the transfer of goods or services to customers in amounts that reflect the consideration to which the company expects to be entitled in exchange for those goods or services. The new standard provides a five-step approach to be applied to all contracts with customers and also requires expanded disclosures about revenue recognition. The ASU is effective for annual reporting periods beginning after December 15, 2017, including interim periods and is either applied on a retrospective or modified retrospective basis. The Company is currently evaluating this guidance but does not expect it will have a material impact on its condensed consolidated financial statements, although the adoption will likely have an impact around disclosures related to revenue.
11
In January 2016, the FASB issued ASU 2016-01, which amends the guidance in GAAP on the classification and measurement of financial instruments. Although the ASU retains many current requirements, it significantly revises an entity’s accounting related to (1) the classification and measurement of investments in equity securities and (2) the presentation of certain fair value changes for financial liabilities measured at fair value. The ASU also amends certain disclosure requirements associated with the fair value of financial instruments. For public companies, the new standard is effective for fiscal years and interim periods within those fiscal years beginning after December 15, 2017. To adopt the amendments, entities will be required to make a cumulative-effect adjustment to beginning retained earnings as of the beginning of the fiscal year in which the guidance is effective. The Company is currently evaluating this guidance and the impact it will have on its condensed consolidated financial statements.
In August 2016, the FASB issued ASU 2016-15, which adds and clarifies guidance on the classification of certain cash receipts and payments in the consolidated statements of cash flows. For public companies, the ASU is effective for annual reporting periods beginning after December 15, 2017, including interim periods within those annual reporting periods. Early adoption is permitted. The Company is currently evaluating this guidance and the impact it will have on its condensed consolidated financial statements.
In January 2017, the FASB issued ASU 2017-04 to simplify the process used to test for goodwill. Under the new standard, if “the carrying amount of a reporting unit exceeds its fair value, an impairment loss shall be recognized in an amount equal to that excess, limited to the total amount of goodwill allocated to that reporting unit.” For public companies, the ASU is effective for annual and any interim impairment tests for periods beginning after December 15, 2019. Early adoption is permitted for impairment tests that occur after January 1, 2017. The Company is currently evaluating this guidance and the impact it will have on its condensed consolidated financial statements.
B.
Investment in Securities
Investments in securities (including GAMCO stock) at March 31, 2017, December 31, 2016 and March 31, 2016 consisted of the following:
|
|
March 31, 2017
|
December 31, 2016
|
March 31, 2016
|
|||||||||||||||||||||
|
|
Cost
|
Fair Value
|
Cost
|
Fair Value
|
Cost
|
Fair Value
|
||||||||||||||||||
|
|
(In thousands)
|
|||||||||||||||||||||||
|
Trading securities:
|
||||||||||||||||||||||||
|
Government obligations
|
$
|
99,687
|
$
|
99,820
|
$
|
119,755
|
$
|
119,823
|
$
|
99,841
|
$
|
99,964
|
||||||||||||
|
Common stocks
|
71,511
|
85,802
|
69,503
|
82,158
|
66,906
|
79,571
|
||||||||||||||||||
|
Mutual funds
|
2,405
|
3,333
|
2,402
|
3,143
|
2,579
|
3,215
|
||||||||||||||||||
|
Other investments
|
3,411
|
3,654
|
1,275
|
1,472
|
648
|
918
|
||||||||||||||||||
|
Total trading securities
|
177,014
|
192,609
|
192,935
|
206,596
|
169,974
|
183,668
|
||||||||||||||||||
|
|
||||||||||||||||||||||||
|
Available for sale securities:
|
||||||||||||||||||||||||
|
Common stocks
|
130,869
|
129,990
|
150,000
|
135,701
|
150,000
|
162,807
|
||||||||||||||||||
|
Mutual funds
|
206
|
511
|
206
|
500
|
627
|
1,151
|
||||||||||||||||||
|
Total available for sale securities
|
131,075
|
130,501
|
150,206
|
136,201
|
150,627
|
163,958
|
||||||||||||||||||
|
|
||||||||||||||||||||||||
|
Total investments in securities
|
$
|
308,089
|
$
|
323,110
|
$
|
343,141
|
$
|
342,797
|
$
|
320,601
|
$
|
347,626
|
||||||||||||
Securities sold, not yet purchased at March 31, 2017, December 31, 2016 and March 31, 2016 consisted of the following:
|
|
March 31, 2017
|
December 31, 2016
|
March 31, 2016
|
|||||||||||||||||||||
|
|
Proceeds
|
Fair Value
|
Proceeds
|
Fair Value
|
Proceeds
|
Fair Value
|
||||||||||||||||||
|
Trading securities:
|
(In thousands)
|
|||||||||||||||||||||||
|
Common stocks
|
$
|
7,279
|
$
|
7,467
|
$
|
9,583
|
$
|
9,947
|
$
|
7,951
|
$
|
7,947
|
||||||||||||
|
Other investments
|
1
|
52
|
27
|
37
|
2
|
67
|
||||||||||||||||||
|
Total securities sold, not yet purchased
|
$
|
7,280
|
$
|
7,519
|
$
|
9,610
|
$
|
9,984
|
$
|
7,953
|
$
|
8,014
|
||||||||||||
12
Investments in affiliated registered investment companies at March 31, 2017, December 31, 2016 and March 31, 2016 consisted of the following:
|
|
March 31, 2017
|
December 31, 2016
|
March 31, 2016
|
|||||||||||||||||||||
|
|
Cost
|
Fair Value
|
Cost
|
Fair Value
|
Cost
|
Fair Value
|
||||||||||||||||||
|
|
(In thousands)
|
|||||||||||||||||||||||
|
Trading securities:
|
||||||||||||||||||||||||
|
Mutual funds
|
$
|
40,096
|
$
|
45,250
|
$
|
40,096
|
$
|
45,351
|
$
|
40,097
|
$
|
43,798
|
||||||||||||
|
Total trading securities
|
40,096
|
45,250
|
40,096
|
45,351
|
40,097
|
43,798
|
||||||||||||||||||
|
|
||||||||||||||||||||||||
|
Available for sale securities:
|
||||||||||||||||||||||||
|
Closed-end funds
|
64,589
|
85,123
|
62,890
|
80,650
|
60,865
|
69,052
|
||||||||||||||||||
|
Mutual funds
|
4,387
|
5,911
|
4,396
|
5,644
|
1,841
|
3,066
|
||||||||||||||||||
|
Total available for sale securities
|
68,976
|
91,034
|
67,286
|
86,294
|
62,706
|
72,118
|
||||||||||||||||||
|
|
||||||||||||||||||||||||
|
Total investments in affiliated
|
||||||||||||||||||||||||
|
registered investment companies
|
$
|
109,072
|
$
|
136,284
|
$
|
107,382
|
$
|
131,645
|
$
|
102,803
|
$
|
115,916
|
||||||||||||
Management determines the appropriate classification of debt and equity securities at the time of purchase and reevaluates such designation as of the date of each consolidated statement of financial condition. Investments in United States Treasury Bills and Notes with maturities of greater than three months at the time of purchase are classified as investments in securities, and those with maturities of three months or less at the time of purchase are classified as cash equivalents. The portion of investments in securities held for resale in anticipation of short-term market movements are classified as trading securities. Trading securities are stated at fair value, with any unrealized gains or losses reported in current period earnings. Available for sale (“AFS”) investments are stated at fair value, with any unrealized gains or losses, net of taxes, reported as a component of equity except for losses deemed to be other than temporary (“OTT”) which are recorded as realized losses in the condensed consolidated statements of income.
The following table identifies all reclassifications out of accumulated other comprehensive income ("AOCI") into income for the three months ended March 31, 2017 and 2016 (in thousands):
|
Amount
|
Affected Line Items
|
Reason for
|
|||||||
|
Reclassified
|
in the Statements
|
Reclassification
|
|||||||
|
from AOCI
|
Of Income
|
from AOCI
|
|||||||
|
Three months ended March 31,
|
|
|
|||||||
|
2017
|
2016
|
|
|
||||||
|
$
|
(19,131
|
)
|
$
|
-
|
Net gain/(loss) from investments
|
Other than temporary impairment of AFS securities
|
|||
|
(19,131
|
)
|
-
|
Income/(loss) before income taxes
|
|
|||||
|
6,887
|
-
|
Income tax provision
|
|
||||||
|
$
|
(12,244
|
)
|
$
|
-
|
Net income/(loss)
|
|
|||
The Company recognizes all equity derivatives as either assets or liabilities measured at fair value and includes them in either investments in securities or securities sold, not yet purchased on the condensed consolidated statements of financial condition. From time to time, the Company and/or the partnerships and offshore funds that the Company consolidates will enter into hedging transactions to manage their exposure to foreign currencies and equity prices related to their proprietary investments. At March 31, 2017, December 31, 2016 and March 31, 2016, we held derivative contracts on (3,041) equity shares, 16,000 equity shares and 317,000 equity shares, respectively, that are included in investments in securities or securities sold, not yet purchased on the condensed consolidated statements of financial condition. We had no foreign exchange contracts outstanding at March 31, 2017 and December 31, 2016. We had two foreign exchange contracts outstanding at March 31, 2016 that are included in payable to brokers on the condensed consolidated statements of financial condition. Aside from one foreign exchange contract at March 31, 2016, these transactions are not designated as hedges for accounting purposes, and therefore changes in fair values of these derivatives are included in net gain/(loss) from investments on the condensed consolidated statements of income. The one foreign exchange contract that was designated as a hedge was for a short of British Pounds to hedge the long investment that we have in the London Stock Exchange listed Gabelli Value Plus+ Trust Ltd. closed-end fund which is denominated in British Pounds. As the underlying investment that is being hedged is an available for sale security, the portion of the change in value of the closed-end fund that is currency related is recorded in net gain/(loss) from investments on the condensed consolidated statements of income and not in accumulated comprehensive income.
13
The following tables identify the fair values and gains and losses of all derivatives held by the Company (in thousands):
|
|
|
Asset Derivatives
|
|
Liability Derivatives
|
||||||||||||||||||||||
|
|
Statement of
|
Fair Value
|
Statement of
|
Fair Value
|
||||||||||||||||||||||
|
|
Financial Condition
|
March 31,
|
December 31,
|
March 31,
|
Financial Condition
|
March 31,
|
December 31,
|
March 31,
|
||||||||||||||||||
|
|
Location
|
2017
|
2016
|
2016
|
Location
|
2017
|
2016
|
2016
|
||||||||||||||||||
|
Derivatives designated as hedging
|
||||||||||||||||||||||||||
|
instruments under FASB ASC 815-20
|
|
|||||||||||||||||||||||||
|
Foreign exchange
|
Receivable from
|
|||||||||||||||||||||||||
|
contracts
|
brokers
|
$
|
-
|
$
|
-
|
$
|
-
|
Payable to brokers
|
$
|
-
|
$
|
-
|
$
|
2,875
|
||||||||||||
|
Sub total
|
|
$
|
-
|
$
|
-
|
$
|
-
|
|
$
|
-
|
$
|
-
|
$
|
2,875
|
||||||||||||
|
Derivatives not designated as hedging
|
||||||||||||||||||||||||||
|
instruments under FASB ASC 815-20
|
|
|||||||||||||||||||||||||
|
Equity contracts
|
Investments in
|
Securities sold,
|
||||||||||||||||||||||||
|
|
securities
|
$
|
102
|
$
|
127
|
$
|
185
|
not yet purchased
|
$
|
52
|
$
|
37
|
$
|
67
|
||||||||||||
|
Foreign exchange
|
Receivable from
|
|||||||||||||||||||||||||
|
contracts
|
brokers
|
-
|
-
|
-
|
Payable to brokers
|
-
|
-
|
5,223
|
||||||||||||||||||
|
Sub total
|
|
$
|
102
|
$
|
127
|
$
|
185
|
|
$
|
52
|
$
|
37
|
$
|
5,290
|
||||||||||||
|
Total derivatives
|
|
$
|
102
|
$
|
127
|
$
|
185
|
|
$
|
52
|
$
|
37
|
$
|
8,165
|
||||||||||||
|
Type of Derivative
|
Income Statement Location
|
Three Months ended March 31,
|
|||||||
|
|
|
2017
|
2016
|
||||||
|
Foreign exchange contracts
|
Net gain/(loss) from investments
|
$
|
-
|
$
|
1,192
|
||||
|
Equity contracts
|
Net gain/(loss) from investments
|
(11
|
)
|
69
|
|||||
|
Total
|
|
$
|
(11
|
)
|
$
|
1,261
|
|||
The Company is a party to enforceable master netting arrangements for swaps entered into as part of the investment strategy of the Company’s proprietary portfolio. They are typically not used as hedging instruments. These swaps, while settled on a net basis with the counterparties, major U.S. financial institutions, are shown gross in assets and liabilities on the condensed consolidated statements of financial condition. The swaps have a firm contract end date and are closed out and settled when each contract expires.
|
|
Gross Amounts Not Offset in the
|
|||||||||||||||||||||||
|
|
Statements of Financial Condition
|
|||||||||||||||||||||||
|
Gross
|
Gross Amounts
|
Net Amounts of
|
||||||||||||||||||||||
|
Amounts of
|
Offset in the
|
Assets Presented
|
||||||||||||||||||||||
|
Recognized
|
Statements of
|
in the Statements of
|
Financial
|
Cash Collateral
|
||||||||||||||||||||
|
|
Assets
|
Financial Condition
|
Financial Condition
|
Instruments
|
Received
|
Net Amount
|
||||||||||||||||||
|
Swaps:
|
(In thousands)
|
|||||||||||||||||||||||
|
March 31, 2017
|
$
|
102
|
$
|
-
|
$
|
102
|
$
|
(51
|
)
|
$
|
-
|
$
|
51
|
|||||||||||
|
December 31, 2016
|
96
|
-
|
96
|
(9
|
)
|
-
|
87
|
|||||||||||||||||
|
March 31, 2016
|
$
|
185
|
$
|
-
|
$
|
185
|
$
|
(66
|
)
|
$
|
-
|
$
|
119
|
|||||||||||
|
|
Gross Amounts Not Offset in the
|
|||||||||||||||||||||||
|
|
Statements of Financial Condition
|
|||||||||||||||||||||||
|
Gross
|
Gross Amounts
|
Net Amounts of
|
||||||||||||||||||||||
|
Amounts of
|
Offset in the
|
Liabilities Presented
|
||||||||||||||||||||||
|
Recognized
|
Statements of
|
in the Statements of
|
Financial
|
Cash Collateral
|
||||||||||||||||||||
|
|
Liabilities
|
Financial Condition
|
Financial Condition
|
Instruments
|
Pledged
|
Net Amount
|
||||||||||||||||||
|
Swaps:
|
(In thousands)
|
|||||||||||||||||||||||
|
March 31, 2017
|
$
|
51
|
$
|
-
|
$
|
51
|
$
|
(51
|
)
|
$
|
-
|
$
|
-
|
|||||||||||
|
December 31, 2016
|
9
|
-
|
9
|
(9
|
)
|
-
|
-
|
|||||||||||||||||
|
March 31, 2016
|
$
|
66
|
$
|
-
|
$
|
66
|
$
|
(66
|
)
|
$
|
-
|
$
|
-
|
|||||||||||
14
The following is a summary of the cost, gross unrealized gains, gross unrealized losses and fair value of available for sale investments as of March 31, 2017, December 31, 2016 and March 31, 2016:
|
|
March 31, 2017
|
|||||||||||||||
|
Gross
|
Gross
|
|||||||||||||||
|
Unrealized
|
Unrealized
|
|||||||||||||||
|
|
Cost
|
Gains
|
Losses
|
Fair Value
|
||||||||||||
|
|
(In thousands)
|
|||||||||||||||
|
Common stocks
|
$
|
130,869
|
$
|
-
|
$
|
(879
|
)
|
$
|
129,990
|
|||||||
|
Closed-end funds
|
64,589
|
20,600
|
(66
|
)
|
85,123
|
|||||||||||
|
Mutual funds
|
4,593
|
1,829
|
-
|
6,422
|
||||||||||||
|
Total available for sale securities
|
$
|
200,051
|
$
|
22,429
|
$
|
(945
|
)
|
$
|
221,535
|
|||||||
|
|
December 31, 2016
|
|||||||||||||||
|
Gross
|
Gross
|
|||||||||||||||
|
Unrealized
|
Unrealized
|
|||||||||||||||
|
|
Cost
|
Gains
|
Losses
|
Fair Value
|
||||||||||||
|
|
(In thousands)
|
|||||||||||||||
|
Common stocks
|
$
|
150,000
|
$
|
-
|
$
|
(14,299
|
)
|
$
|
135,701
|
|||||||
|
Closed-end funds
|
62,890
|
17,760
|
-
|
80,650
|
||||||||||||
|
Mutual funds
|
4,602
|
1,542
|
-
|
6,144
|
||||||||||||
|
Total available for sale securities
|
$
|
217,492
|
$
|
19,302
|
$
|
(14,299
|
)
|
$
|
222,495
|
|||||||
|
|
March 31, 2016
|
|||||||||||||||
|
Gross
|
Gross
|
|||||||||||||||
|
Unrealized
|
Unrealized
|
|||||||||||||||
|
|
Cost
|
Gains
|
Losses
|
Fair Value
|
||||||||||||
|
|
(In thousands)
|
|||||||||||||||
|
Common stocks
|
$
|
150,000
|
$
|
12,807
|
$
|
-
|
$
|
162,807
|
||||||||
|
Closed-end funds
|
60,865
|
11,828
|
(3,641
|
)
|
69,052
|
|||||||||||
|
Mutual funds
|
2,468
|
1,749
|
-
|
4,217
|
||||||||||||
|
Total available for sale securities
|
$
|
213,333
|
$
|
26,384
|
$
|
(3,641
|
)
|
$
|
236,076
|
|||||||
Changes in net unrealized gains, net of taxes, for the three months ended March 31, 2017 and March 31, 2016 of $10.6 million and $15.5 million in gains, respectively, have been included in other comprehensive income, a component of equity, at March 31, 2017 and March 31, 2016. Return of capital on available for sale securities was $0.4 million and $0.3 million for the three months ended March 31, 2017 and 2016, respectively. For the three months ended March 31, 2017 and March 31, 2016, there were no proceeds from the sales of investments available for sale and no gross gains on the sale of investments available for sale. There were no losses on the sale of investments available for sale for the three months ended March 31, 2017 or March 31, 2016. The cost basis of a security sold is determined using specific identification.
Investments classified as available for sale that are in an unrealized loss position for which other-than-temporary impairment has not been recognized consisted of the following:
|
|
March 31, 2017
|
December 31, 2016
|
March 31, 2016
|
|||||||||||||||||||||||||||||||||
|
Unrealized
|
Unrealized
|
Unrealized
|
||||||||||||||||||||||||||||||||||
|
|
Cost
|
Losses
|
Fair Value
|
Cost
|
Losses
|
Fair Value
|
Cost
|
Losses
|
Fair Value
|
|||||||||||||||||||||||||||
|
(in thousands)
|
||||||||||||||||||||||||||||||||||||
|
Common stocks
|
$
|
130,869
|
$
|
(879
|
)
|
$
|
129,990
|
$
|
150,000
|
$
|
(14,299
|
)
|
$
|
135,701
|
$
|
-
|
$
|
-
|
$
|
-
|
||||||||||||||||
|
Closed-end funds
|
1,864
|
(66
|
)
|
1,798
|
-
|
-
|
-
|
39,413
|
(3,641
|
)
|
35,772
|
|||||||||||||||||||||||||
|
Total available for sale securities
|
$
|
132,733
|
$
|
(945
|
)
|
$
|
131,788
|
$
|
150,000
|
$
|
(14,299
|
)
|
$
|
135,701
|
$
|
39,413
|
$
|
(3,641
|
)
|
$
|
35,772
|
|||||||||||||||
At March 31, 2017, there were two holdings in loss positions that were not deemed to be other-than-temporarily impaired due to the length of time that they had been in a loss position and because they passed scrutiny in our evaluation of issuer-specific and industry-specific considerations. In these specific instances, one of the investments at March 31, 2017 was a closed-end fund with diversified holdings across multiple companies and across multiple industries. This holding was impaired for three months at March 31, 2017. The second holding was in GAMCO common stock that was recognized as having an “other than temporary impairment” during the quarter, but which has subsequently had further unrealized losses that were not deemed to be other-than-temporarily impaired at March 31, 2017. The value of these holdings at March 31, 2017 was $131.8 million. If these holdings were to continue to be impaired, we may need to record impairment in a future period on the condensed consolidated statement of income for the amount of unrealized loss, which at March 31, 2017 was $0.9 million.
15
At December 31, 2016, there was one holding in a loss position which was not deemed to be other-than-temporarily impaired due to the length of time that it has been consecutively in a loss position and because it passed scrutiny in our evaluation of issuer-specific and industry-specific considerations. This holding was a common stock and was impaired for seven consecutive months. This fair value of this holding has exceeded cost during the year ended December 31, 2016.
At March 31, 2016, there were three holdings in loss positions that were not deemed to be other-than-temporarily impaired due to the length of time that they had been in a loss position and because they passed scrutiny in our evaluation of issuer-specific and industry-specific considerations. In these specific instances, the investments at March 31, 2016 were closed-end funds with diversified holdings across multiple companies and across multiple industries. One holding was impaired for three months and two holdings were impaired for nine months at March 31, 2016. The value of these holdings at March 31, 2016 was $35.8 million.
For the three months ended March 31, 2017, there was a $19.1 million loss on an AFS security deemed to be other than temporary. This “other than temporary loss” was on the GAMCO shares. The magnitude and persistence of this loss resulted in the “other than temporary” designation. There were no “other than temporary losses” recognized on AFS securities for the three months ended March 31, 2016.
C.
Fair Value
The following tables present information about the Company’s assets and liabilities by major categories measured at fair value on a recurring basis as of March 31, 2017, December 31, 2016 and March 31, 2016 and indicates the fair value hierarchy of the valuation techniques utilized by the Company to determine such fair value. Note that the FASB issued new guidance effective for the Company’s first quarter of 2016 amending the current disclosure requirements for investments in certain entities that calculate net asset value per share. The guidance requires investments for which fair value is measured using the net asset value per share practical expedient to be removed from the fair value hierarchy. Instead, those investment amounts are provided as a separate item to permit reconciliation of the fair value of investments included in the fair value hierarchy to the line items presented in the condensed consolidated statements of financial condition.
Assets and Liabilities Measured at Fair Value on a Recurring Basis as of March 31, 2017 (in thousands)
|
Quoted Prices in Active
|
Significant Other
|
Significant
|
Investments
|
Other Assets
|
Balance as of
|
|||||||||||||||||||
|
Markets for Identical
|
Observable
|
Unobservable
|
Measured at
|
Not Held at
|
March 31,
|
|||||||||||||||||||
|
Assets
|
Assets (Level 1)
|
Inputs (Level 2)
|
Inputs (Level 3)
|
NAV (a)
|
Fair Value (b)
|
2017
|
||||||||||||||||||
|
Cash equivalents
|
$
|
307,640
|
$
|
-
|
$
|
-
|
$
|
-
|
$
|
-
|
$
|
307,640
|
||||||||||||
|
Investments in partnerships
|
-
|
-
|
-
|
126,187
|
3,871
|
130,058
|
||||||||||||||||||
|
Investments in securities (including GBL stock):
|
||||||||||||||||||||||||
|
AFS - Common stocks
|
129,990
|
-
|
-
|
-
|
-
|
129,990
|
||||||||||||||||||
|
AFS - Mutual funds
|
511
|
-
|
-
|
-
|
-
|
511
|
||||||||||||||||||
|
Trading - Gov't obligations
|
99,820
|
-
|
-
|
-
|
-
|
99,820
|
||||||||||||||||||
|
Trading - Common stocks
|
85,308
|
-
|
494
|
-
|
-
|
85,802
|
||||||||||||||||||
|
Trading - Mutual funds
|
3,333
|
-
|
-
|
-
|
-
|
3,333
|
||||||||||||||||||
|
Trading - Other
|
3,102
|
102
|
450
|
-
|
-
|
3,654
|
||||||||||||||||||
|
Total investments in securities
|
322,064
|
102
|
944
|
-
|
-
|
323,110
|
||||||||||||||||||
|
Investments in affiliated registered investment companies:
|
||||||||||||||||||||||||
|
AFS - Closed-end funds
|
85,123
|
-
|
-
|
-
|
-
|
85,123
|
||||||||||||||||||
|
AFS - Mutual funds
|
5,911
|
-
|
-
|
-
|
-
|
5,911
|
||||||||||||||||||
|
Trading - Mutual funds
|
45,250
|
-
|
-
|
-
|
-
|
45,250
|
||||||||||||||||||
| Total investments in affiliated | ||||||||||||||||||||||||
|
registered investment companies
|
136,284
|
-
|
-
|
-
|
-
|
136,284
|
||||||||||||||||||
|
Total investments
|
458,348
|
102
|
944
|
126,187
|
3,871
|
589,452
|
||||||||||||||||||
|
Total assets at fair value
|
$
|
765,988
|
$
|
102
|
$
|
944
|
$
|
126,187
|
$
|
3,871
|
$
|
897,092
|
||||||||||||
|
Liabilities
|
||||||||||||||||||||||||
|
Trading - Common stocks
|
$
|
7,467
|
$
|
-
|
$
|
-
|
$
|
-
|
$
|
-
|
$
|
7,467
|
||||||||||||
|
Trading - Other
|
-
|
52
|
-
|
-
|
-
|
52
|
||||||||||||||||||
|
Securities sold, not yet purchased
|
$
|
7,467
|
$
|
52
|
$
|
-
|
$
|
-
|
$
|
-
|
$
|
7,519
|
||||||||||||
16
Assets and Liabilities Measured at Fair Value on a Recurring Basis as of December 31, 2016 (in thousands)
|
Quoted Prices in Active
|
Significant Other
|
Significant
|
Investments
|
Other Assets
|
Balance as of
|
|||||||||||||||||||
|
Markets for Identical
|
Observable
|
Unobservable
|
Measured at
|
Not Held at
|
December 31,
|
|||||||||||||||||||
|
Assets
|
Assets (Level 1)
|
Inputs (Level 2)
|
Inputs (Level 3)
|
NAV (a)
|
Fair Value (b)
|
2016
|
||||||||||||||||||
|
Cash equivalents
|
$
|
314,082
|
$
|
-
|
$
|
-
|
$
|
-
|
$
|
-
|
$
|
314,082
|
||||||||||||
|
Investments in partnerships
|
-
|
-
|
-
|
125,527
|
3,871
|
129,398
|
||||||||||||||||||
|
Investments in securities (including GBL stock):
|
||||||||||||||||||||||||
|
AFS - Common stocks
|
135,701
|
-
|
-
|
-
|
-
|
135,701
|
||||||||||||||||||
|
AFS - Mutual funds
|
500
|
-
|
-
|
-
|
-
|
500
|
||||||||||||||||||
|
Trading - Gov't obligations
|
119,823
|
-
|
-
|
-
|
-
|
119,823
|
||||||||||||||||||
|
Trading - Common stocks
|
81,696
|
1
|
461
|
-
|
-
|
82,158
|
||||||||||||||||||
|
Trading - Mutual funds
|
3,143
|
-
|
-
|
-
|
-
|
3,143
|
||||||||||||||||||
|
Trading - Other
|
1,062
|
127
|
283
|
-
|
-
|
1,472
|
||||||||||||||||||
|
Total investments in securities
|
341,925
|
128
|
744
|
-
|
-
|
342,797
|
||||||||||||||||||
|
Investments in affiliated registered investment companies:
|
||||||||||||||||||||||||
|
AFS - Closed-end funds
|
80,650
|
-
|
-
|
-
|
-
|
80,650
|
||||||||||||||||||
|
AFS - Mutual funds
|
5,644
|
-
|
-
|
-
|
-
|
5,644
|
||||||||||||||||||
|
Trading - Mutual funds
|
45,351
|
-
|
-
|
-
|
-
|
45,351
|
||||||||||||||||||
| Total investments in affiliated | ||||||||||||||||||||||||
|
registered investment companies
|
131,645
|
-
|
-
|
-
|
-
|
131,645
|
||||||||||||||||||
|
Total investments
|
473,570
|
128
|
744
|
125,527
|
3,871
|
603,840
|
||||||||||||||||||
|
Total assets at fair value
|
$
|
787,652
|
$
|
128
|
$
|
744
|
$
|
125,527
|
$
|
3,871
|
$
|
917,922
|
||||||||||||
|
Liabilities
|
||||||||||||||||||||||||
|
Trading - Common stocks
|
$
|
9,947
|
$
|
-
|
$
|
-
|
$
|
-
|
$
|
-
|
$
|
9,947
|
||||||||||||
|
Trading - Other
|
-
|
37
|
-
|
-
|
-
|
37
|
||||||||||||||||||
|
Securities sold, not yet purchased
|
$
|
9,947
|
$
|
37
|
$
|
-
|
$
|
-
|
$
|
-
|
$
|
9,984
|
||||||||||||
Assets and Liabilities Measured at Fair Value on a Recurring Basis as of March 31, 2016 (in thousands)
|
Quoted Prices in Active
|
Significant Other
|
Significant
|
Investments
|
Other Assets
|
Balance as of
|
|||||||||||||||||||
|
Markets for Identical
|
Observable
|
Unobservable
|
Measured at
|
Not Held at
|
March 31,
|
|||||||||||||||||||
|
Assets
|
Assets (Level 1)
|
Inputs (Level 2)
|
Inputs (Level 3)
|
NAV (a)
|
Fair Value (b)
|
2016
|
||||||||||||||||||
|
Cash equivalents
|
$
|
203,231
|
$
|
-
|
$
|
-
|
$
|
-
|
$
|
-
|
$
|
203,231
|
||||||||||||
|
Investments in partnerships
|
-
|
-
|
-
|
109,552
|
3,595
|
113,147
|
||||||||||||||||||
|
Investments in securities (including GBL stock):
|
||||||||||||||||||||||||
|
AFS - Common stocks
|
162,807
|
-
|
-
|
-
|
-
|
162,807
|
||||||||||||||||||
|
AFS - Mutual funds
|
1,151
|
-
|
-
|
-
|
-
|
1,151
|
||||||||||||||||||
|
Trading - Gov't obligations
|
99,964
|
-
|
-
|
-
|
-
|
99,964
|
||||||||||||||||||
|
Trading - Common stocks
|
79,065
|
-
|
506
|
-
|
-
|
79,571
|
||||||||||||||||||
|
Trading - Mutual funds
|
3,215
|
-
|
-
|
-
|
-
|
3,215
|
||||||||||||||||||
|
Trading - Other
|
428
|
185
|
305
|
-
|
-
|
918
|
||||||||||||||||||
|
Total investments in securities
|
346,630
|
185
|
811
|
-
|
-
|
347,626
|
||||||||||||||||||
|
Investments in affiliated registered investment companies:
|
||||||||||||||||||||||||
|
AFS - Closed-end funds
|
69,052
|
-
|
-
|
-
|
-
|
69,052
|
||||||||||||||||||
|
AFS - Mutual funds
|
3,066
|
-
|
-
|
-
|
-
|
3,066
|
||||||||||||||||||
|
Trading - Mutual funds
|
43,798
|
-
|
-
|
-
|
-
|
43,798
|
||||||||||||||||||
| Total investments in affiliated | ||||||||||||||||||||||||
|
registered investment companies
|
115,916
|
-
|
-
|
-
|
-
|
115,916
|
||||||||||||||||||
|
Total investments
|
462,546
|
185
|
811
|
109,552
|
3,595
|
576,689
|
||||||||||||||||||
|
Total assets at fair value
|
$
|
665,777
|
$
|
185
|
$
|
811
|
$
|
109,552
|
$
|
3,595
|
$
|
779,920
|
||||||||||||
|
Liabilities
|
||||||||||||||||||||||||
|
Trading - Common stocks
|
$
|
7,947
|
$
|
-
|
$
|
-
|
$
|
-
|
$
|
-
|
$
|
7,947
|
||||||||||||
|
Trading - Other
|
-
|
67
|
-
|
-
|
-
|
67
|
||||||||||||||||||
|
Securities sold, not yet purchased
|
$
|
7,947
|
$
|
67
|
$
|
-
|
$
|
-
|
$
|
-
|
$
|
8,014
|
||||||||||||
|
(a)
|
Amounts are comprised of certain investments measured at fair value using NAV (or its equivalent) as a practical expedient. These investments have not been classified in the fair value hierarchy.
|
|
(b)
|
Amounts are comprised of certain equity method investments which are not accounted for under a fair value measure. In accordance with GAAP, certain equity method investees do not account for both their financial assets and liabilities under fair value measures; therefore, the Company’s investment in such equity method investees may not represent fair value.
|
17
The following tables present additional information about assets by major categories measured at fair value on a recurring basis and for which the Company has utilized Level 3 inputs to determine fair value:
Changes in Level 3 Assets and Liabilities Measured at Fair Value on a Recurring Basis for the Three Months Ended March 31, 2017 (in thousands)
|
Total
|
||||||||||||||||||||||||||||||||||||
|
Unrealized
|
||||||||||||||||||||||||||||||||||||
|
Gains or
|
Total
|
|||||||||||||||||||||||||||||||||||
|
Total Realized and
|
(Losses)
|
Realized
|
||||||||||||||||||||||||||||||||||
|
December 31,
|
Unrealized Gains or
|
Included in
|
and
|
Transfers
|
March
|
|||||||||||||||||||||||||||||||
|
|
2016
|
(Losses) in Income
|
Other
|
Unrealized
|
In and/or
|
31, 2017
|
||||||||||||||||||||||||||||||
|
Beginning
|
AFS
|
Comprehensive
|
Gains or
|
(Out) of
|
Ending
|
|||||||||||||||||||||||||||||||
|
Asset
|
Balance
|
Trading
|
Investments
|
Income
|
(Losses)
|
Purchases
|
Sales
|
Level 3
|
Balance
|
|||||||||||||||||||||||||||
|
Financial instruments owned:
|
||||||||||||||||||||||||||||||||||||
| Trading - Common | ||||||||||||||||||||||||||||||||||||
|
stocks
|
$
|
461
|
$
|
33
|
$
|
-
|
$
|
-
|
$
|
33
|
$
|
-
|
$
|
-
|
$
|
-
|
$
|
494
|
||||||||||||||||||
|
Trading - Other
|
283
|
-
|
-
|
-
|
-
|
167
|
-
|
-
|
450
|
|||||||||||||||||||||||||||
|
Total
|
$
|
744
|
$
|
33
|
$
|
-
|
$
|
-
|
$
|
33
|
167
|
$
|
-
|
$
|
-
|
$
|
944
|
|||||||||||||||||||
There were no transfers between any Levels during the three months ended March 31, 2017.
Changes in Level 3 Assets and Liabilities Measured at Fair Value on a Recurring Basis for the Three Months Ended March 31, 2016 (in thousands)
|
Total
|
||||||||||||||||||||||||||||||||||||
|
Unrealized
|
||||||||||||||||||||||||||||||||||||
|
Gains or
|
Total
|
|||||||||||||||||||||||||||||||||||
|
Total Realized and
|
(Losses)
|
Realized
|
||||||||||||||||||||||||||||||||||
|
December 31,
|
Unrealized Gains or
|
Included in
|
and
|
Transfers
|
March
|
|||||||||||||||||||||||||||||||
|
2015
|
(Losses) in Income
|
Other
|
Unrealized
|
In and/or
|
31, 2016
|
|||||||||||||||||||||||||||||||
|
|
Beginning
|
|
AFS
|
Comprehensive
|
Gains or
|
(Out) of
|
Ending
|
|||||||||||||||||||||||||||||
|
Asset
|
Balance
|
Trading
|
Investments
|
Income
|
(Losses)
|
Purchases
|
Sales
|
Level 3
|
Balance
|
|||||||||||||||||||||||||||
|
Financial instruments owned:
|
||||||||||||||||||||||||||||||||||||
| Trading - Common | ||||||||||||||||||||||||||||||||||||
|
stocks
|
$
|
508
|
$
|
(2
|
)
|
$
|
-
|
$
|
-
|
$
|
(2
|
)
|
$
|
-
|
$
|
-
|
$
|
-
|
$
|
506
|
||||||||||||||||
|
Trading - Other
|
305
|
-
|
-
|
-
|
-
|
-
|
-
|
-
|
305
|
|||||||||||||||||||||||||||
|
Total
|
$
|
813
|
$
|
(2
|
)
|
$
|
-
|
$
|
-
|
$
|
(2
|
)
|
$
|
-
|
$
|
-
|
$
|
-
|
$
|
811
|
||||||||||||||||
There were no transfers between any Levels during the three months ended March 31, 2016.
D.
Investments in Partnerships, Offshore Funds and Variable Interest Entities (“VIEs”)
The Company is general partner or co-general partner of various affiliated entities in which the Company has investments totaling $112.4 million, $112.3 million and $96.8 million at March 31, 2017, December 31, 2016 and March 31, 2016, respectively, and whose underlying assets consist primarily of marketable securities (the “affiliated entities”). We also have investments in unaffiliated entities of $17.6 million, $17.1 million and $16.3 million at March 31, 2017, December 31, 2016 and March 31, 2016, respectively (the “unaffiliated entities”). On a quarterly basis, we evaluate each entity for the appropriate accounting treatment and disclosure. In February 2015, the FASB issued an accounting update amending the consolidation requirements under GAAP. This guidance was effective for the Company beginning January 1, 2016. Based on the new consolidation guidance, we have determined that two of the affiliated entities, and none of the unaffiliated entities, are required to be consolidated in our condensed consolidated financial statements in the quarter ended March 31, 2017.
For those entities where consolidation is not deemed to be appropriate, we report them in our condensed consolidated statements of financial condition under the caption “Investments in partnerships”. This caption includes those investments, in both affiliated and unaffiliated entities, which the Company accounts for under the equity method of accounting, as well as certain investments that the feeder funds hold that are carried at fair value, as described in Note C. The Company reflects the equity in earnings of these equity method investees and the change in fair value of the consolidated feeder funds (“CFFs”) under the caption Net gain/(loss) from investments on the condensed consolidated statements of income.
18
The following table highlights the number of entities, including voting interest entities (“VOEs”), that we consolidate as well as under which accounting guidance they are consolidated, including CFFs, which retain their specialized investment company accounting in consolidation, partnerships and offshore funds:
|
Entities consolidated
|
CFFs
|
|
Partnerships
|
|
Offshore Funds
|
|
Total
|
||||||||||||||||
|
|
VIEs
|
|
VOEs
|
|
VIEs
|
|
VOEs
|
|
VIEs
|
|
VOEs
|
|
VIEs
|
|
VOEs
|
||||||||
|
Entities consolidated at December 31, 2015
|
|
1
|
|
|
2
|
|
|
-
|
|
|
2
|
|
|
1
|
|
|
-
|
|
|
2
|
|
|
4
|
|
Additional consolidated entities
|
|
-
|
|
|
-
|
|
|
1
|
|
|
-
|
|
|
-
|
|
|
-
|
|
|
1
|
|
|
-
|
|
Deconsolidated entities
|
|
(1)
|
|
|
(1)
|
|
|
-
|
|
|
(2)
|
|
|
(1)
|
|
|
-
|
|
|
(2)
|
|
|
(3)
|
|
Entities consolidated at March 31, 2016
|
|
-
|
|
|
1
|
|
|
1
|
|
|
-
|
|
|
-
|
|
|
-
|
|
|
1
|
|
|
1
|
|
Additional consolidated entities
|
|
-
|
|
|
-
|
|
|
-
|
|
|
-
|
|
|
-
|
|
|
-
|
|
|
-
|
|
|
-
|
|
Deconsolidated entities
|
|
-
|
|
|
-
|
|
|
-
|
|
|
-
|
|
|
-
|
|
|
-
|
|
|
-
|
|
|
-
|
|
Entities consolidated at December 31, 2016
|
|
-
|
|
|
1
|
|
|
1
|
|
|
-
|
|
|
-
|
|
|
-
|
|
|
1
|
|
|
1
|
|
Additional consolidated entities
|
|
-
|
|
|
-
|
|
|
-
|
|
|
-
|
|
|
-
|
|
|
-
|
|
|
-
|
|
|
-
|
|
Deconsolidated entities
|
|
-
|
|
|
-
|
|
|
-
|
|
|
-
|
|
|
-
|
|
|
-
|
|
|
-
|
|
|
-
|
|
Entities consolidated at March 31, 2017
|
|
-
|
|
|
1
|
|
|
1
|
|
|
-
|
|
|
-
|
|
|
-
|
|
|
1
|
|
|
1
|
At and for the three months ended March 31, 2017 and March 31, 2016, one CFF VOE is consolidated, as the Company owns a majority of the interests in the CFF. At and for the three months ended March 31, 2017 and March 31, 2016, one Partnership VIE is consolidated, as it is a VIE because the unaffiliated partners or shareholders lack substantive kick-out rights and the Company has been determined to be the primary beneficiary because it has an equity interest and absorbs the majority of the expected losses and/or expected gains.
The following table breaks down the investments in partnerships line by accounting method, either fair value or equity method, and investment type (in thousands):
|
March 31, 2017
|
||||||||||||||||||||||||
|
|
Investment Type
|
|||||||||||||||||||||||
|
|
Affiliated
|
Unaffiliated
|
||||||||||||||||||||||
|
Consolidated
|
||||||||||||||||||||||||
|
Accounting method
|
Feeder Funds
|
Partnerships
|
Offshore Funds
|
Partnerships
|
Offshore Funds
|
Total
|
||||||||||||||||||
|
|
||||||||||||||||||||||||
|
Fair Value
|
$
|
8,195
|
$
|
-
|
$
|
-
|
$
|
-
|
$
|
-
|
$
|
8,195
|
||||||||||||
|
Equity Method
|
-
|
31,982
|
72,263
|
6,873
|
10,745
|
121,863
|
||||||||||||||||||
|
|
||||||||||||||||||||||||
|
Total
|
$
|
8,195
|
$
|
31,982
|
$
|
72,263
|
$
|
6,873
|
$
|
10,745
|
$
|
130,058
|
||||||||||||
|
December 31, 2016
|
||||||||||||||||||||||||
|
|
Investment Type
|
|||||||||||||||||||||||
|
|
Affiliated
|
Unaffiliated
|
||||||||||||||||||||||
|
Consolidated
|
||||||||||||||||||||||||
|
Accounting method
|
Feeder Funds
|
Partnerships
|
Offshore Funds
|
Partnerships
|
Offshore Funds
|
Total
|
||||||||||||||||||
|
|
||||||||||||||||||||||||
|
Fair Value
|
$
|
8,343
|
$
|
-
|
$
|
-
|
$
|
-
|
$
|
-
|
$
|
8,343
|
||||||||||||
|
Equity Method
|
-
|
33,202
|
70,745
|
6,761
|
10,347
|
121,055
|
||||||||||||||||||
|
|
||||||||||||||||||||||||
|
Total
|
$
|
8,343
|
$
|
33,202
|
$
|
70,745
|
$
|
6,761
|
$
|
10,347
|
$
|
129,398
|
||||||||||||
|
March 31, 2016
|
||||||||||||||||||||||||
|
|
Investment Type
|
|||||||||||||||||||||||
|
|
Affiliated
|
Unaffiliated
|
||||||||||||||||||||||
|
Consolidated
|
||||||||||||||||||||||||
|
Accounting method
|
Feeder Funds
|
Partnerships
|
Offshore Funds
|
Partnerships
|
Offshore Funds
|
Total
|
||||||||||||||||||
|
|
||||||||||||||||||||||||
|
Fair Value
|
$
|
7,581
|
$
|
-
|
$
|
-
|
$
|
-
|
$
|
-
|
$
|
7,581
|
||||||||||||
|
Equity Method
|
-
|
36,168
|
53,099
|
8,007
|
8,292
|
105,566
|
||||||||||||||||||
|
|
||||||||||||||||||||||||
|
Total
|
$
|
7,581
|
$
|
36,168
|
$
|
53,099
|
$
|
8,007
|
$
|
8,292
|
$
|
113,147
|
||||||||||||
19
The following table includes the net impact by line item on the condensed consolidated statements of financial condition for each category of entity consolidated (in thousands):
|
|
March 31, 2017
|
|||||||||||||||||||
|
Prior to
|
Offshore
|
|||||||||||||||||||
|
|
Consolidation
|
CFFs
|
Partnerships
|
Funds
|
As Reported
|
|||||||||||||||
|
Assets
|
||||||||||||||||||||
|
Cash and cash equivalents
|
$
|
307,505
|
$
|
-
|
$
|
146
|
$
|
-
|
$
|
307,651
|
||||||||||
|
Investments in securities (including GBL stock)
|
316,424
|
-
|
6,686
|
-
|
323,110
|
|||||||||||||||
|
Investments in affiliated investment companies
|
136,284
|
-
|
-
|
-
|
136,284
|
|||||||||||||||
|
Investments in partnerships
|
135,129
|
3,764
|
(8,835
|
)
|
-
|
130,058
|
||||||||||||||
|
Receivable from brokers
|
9,666
|
-
|
2,355
|
-
|
12,021
|
|||||||||||||||
|
Investment advisory fees receivable
|
1,361
|
(5
|
)
|
(7
|
)
|
-
|
1,349
|
|||||||||||||
|
Other assets
|
7,160
|
-
|
-
|
-
|
7,160
|
|||||||||||||||
|
Total assets
|
$
|
913,529
|
$
|
3,759
|
$
|
345
|
$
|
-
|
$
|
917,633
|
||||||||||
|
Liabilities and equity
|
||||||||||||||||||||
|
Securities sold, not yet purchased
|
$
|
7,519
|
$
|
-
|
$
|
-
|
$
|
-
|
$
|
7,519
|
||||||||||
|
Accrued expenses and other liabilities
|
24,179
|
19
|
35
|
-
|
24,233
|
|||||||||||||||
|
Redeemable noncontrolling interests
|
-
|
3,740
|
310
|
-
|
4,050
|
|||||||||||||||
|
Total equity
|
881,831
|
-
|
-
|
-
|
881,831
|
|||||||||||||||
|
Total liabilities and equity
|
$
|
913,529
|
$
|
3,759
|
$
|
345
|
$
|
-
|
$
|
917,633
|
||||||||||
|
|
December 31, 2016
|
|||||||||||||||||||
|
Prior to
|
Offshore
|
|||||||||||||||||||
|
|
Consolidation
|
CFFs
|
Partnerships
|
Funds
|
As Reported
|
|||||||||||||||
|
Assets
|
||||||||||||||||||||
|
Cash and cash equivalents
|
$
|
313,785
|
$
|
-
|
$
|
308
|
$
|
-
|
$
|
314,093
|
||||||||||
|
Investments in securities (including GBL stock)
|
336,459
|
-
|
6,338
|
-
|
342,797
|
|||||||||||||||
|
Investments in affiliated investment companies
|
131,645
|
-
|
-
|
-
|
131,645
|
|||||||||||||||
|
Investments in partnerships
|
133,794
|
3,964
|
(8,360
|
)
|
-
|
129,398
|
||||||||||||||
|
Receivable from brokers
|
10,542
|
-
|
2,046
|
-
|
12,588
|
|||||||||||||||
|
Investment advisory fees receivable
|
9,800
|
(8
|
)
|
(8
|
)
|
-
|
9,784
|
|||||||||||||
|
Other assets
|
12,298
|
-
|
-
|
-
|
12,298
|
|||||||||||||||
|
Total assets
|
$
|
948,323
|
$
|
3,956
|
$
|
324
|
$
|
-
|
$
|
952,603
|
||||||||||
|
Liabilities and equity
|
||||||||||||||||||||
|
Securities sold, not yet purchased
|
$
|
9,984
|
$
|
-
|
$
|
-
|
$
|
-
|
$
|
9,984
|
||||||||||
|
Accrued expenses and other liabilities
|
64,317
|
13
|
37
|
-
|
64,367
|
|||||||||||||||
|
Redeemable noncontrolling interests
|
-
|
3,943
|
287
|
-
|
4,230
|
|||||||||||||||
|
Total equity
|
874,022
|
-
|
-
|
-
|
874,022
|
|||||||||||||||
|
Total liabilities and equity
|
$
|
948,323
|
$
|
3,956
|
$
|
324
|
$
|
-
|
$
|
952,603
|
||||||||||
|
|
March 31, 2016
|
|||||||||||||||||||
|
Prior to
|
Offshore
|
|||||||||||||||||||
|
|
Consolidation
|
CFFs
|
Partnerships
|
Funds
|
As Reported
|
|||||||||||||||
|
Assets
|
||||||||||||||||||||
|
Cash and cash equivalents
|
$
|
203,204
|
$
|
-
|
$
|
35
|
$
|
-
|
$
|
203,239
|
||||||||||
|
Investments in securities
|
341,730
|
-
|
5,896
|
-
|
347,626
|
|||||||||||||||
|
Investments in affiliated investment companies
|
115,916
|
-
|
-
|
-
|
115,916
|
|||||||||||||||
|
Investments in partnerships
|
117,589
|
3,487
|
(7,929
|
)
|
-
|
113,147
|
||||||||||||||
|
Receivable from brokers
|
20,958
|
-
|
2,320
|
-
|
23,278
|
|||||||||||||||
|
Investment advisory fees receivable
|
1,471
|
(4
|
)
|
(4
|
)
|
-
|
1,463
|
|||||||||||||
|
Other assets
|
8,031
|
-
|
-
|
-
|
8,031
|
|||||||||||||||
|
Total assets
|
$
|
808,899
|
$
|
3,483
|
$
|
318
|
$
|
-
|
$
|
812,700
|
||||||||||
|
Liabilities and equity
|
||||||||||||||||||||
|
Securities sold, not yet purchased
|
$
|
8,014
|
$
|
-
|
$
|
-
|
$
|
-
|
$
|
8,014
|
||||||||||
|
Accrued expenses and other liabilities
|
36,618
|
16
|
33
|
-
|
36,667
|
|||||||||||||||
|
Redeemable noncontrolling interests
|
-
|
3,467
|
285
|
-
|
3,752
|
|||||||||||||||
|
Total equity
|
764,267
|
-
|
-
|
-
|
764,267
|
|||||||||||||||
|
Total liabilities and equity
|
$
|
808,899
|
$
|
3,483
|
$
|
318
|
$
|
-
|
$
|
812,700
|
||||||||||
20
The following table includes the net impact by line item on the condensed consolidated statements of income for each category of entity consolidated (in thousands):
|
|
Three Months Ended March 31, 2017
|
|||||||||||||||||||
|
Prior to
|
Offshore
|
|||||||||||||||||||
|
|
Consolidation
|
CFFs
|
Partnerships
|
Funds
|
As Reported
|
|||||||||||||||
|
Total revenues
|
$
|
4,993
|
$
|
(5
|
)
|
$
|
(1
|
)
|
$
|
-
|
$
|
4,987
|
||||||||
|
Total expenses
|
9,277
|
32
|
10
|
-
|
9,319
|
|||||||||||||||
|
Operating loss
|
(4,284
|
)
|
(37
|
)
|
(11
|
)
|
-
|
(4,332
|
)
|
|||||||||||
|
Total other income/(expense), net
|
(17,218
|
)
|
75
|
34
|
-
|
(17,109
|
)
|
|||||||||||||
|
Income/(loss) before income taxes
|
(21,502
|
)
|
38
|
23
|
-
|
(21,441
|
)
|
|||||||||||||
|
Income tax provision
|
(8,424
|
)
|
-
|
-
|
-
|
(8,424
|
)
|
|||||||||||||
|
Net income/(loss)
|
(13,078
|
)
|
38
|
23
|
-
|
(13,017
|
)
|
|||||||||||||
|
Net income attributable to noncontrolling interests
|
-
|
38
|
23
|
-
|
61
|
|||||||||||||||
|
Net loss attributable to AC Group
|
$
|
(13,078
|
)
|
$
|
-
|
$
|
-
|
$
|
-
|
$
|
(13,078
|
)
|
||||||||
|
|
Three Months Ended March 31, 2016
|
|||||||||||||||||||
|
Prior to
|
Offshore
|
|||||||||||||||||||
|
|
Consolidation
|
CFFs
|
Partnerships
|
Funds
|
As Reported
|
|||||||||||||||
|
Total revenues
|
$
|
4,522
|
$
|
(4
|
)
|
$
|
(1
|
)
|
$
|
-
|
$
|
4,517
|
||||||||
|
Total expenses
|
8,985
|
33
|
14
|
-
|
9,032
|
|||||||||||||||
|
Operating loss
|
(4,463
|
)
|
(37
|
)
|
(15
|
)
|
-
|
(4,515
|
)
|
|||||||||||
|
Total other income/(expense), net
|
6,638
|
93
|
(8
|
)
|
-
|
6,723
|
||||||||||||||
|
Income/(loss) before income taxes
|
2,175
|
56
|
(23
|
)
|
-
|
2,208
|
||||||||||||||
|
Income tax provision
|
661
|
-
|
-
|
-
|
661
|
|||||||||||||||
|
Net income/(loss)
|
1,514
|
56
|
(23
|
)
|
-
|
1,547
|
||||||||||||||
|
Net income/(loss) attributable to noncontrolling interests
|
(79
|
)
|
56
|
(23
|
)
|
-
|
(46
|
)
|
||||||||||||
|
Net income attributable to AC Group
|
$
|
1,593
|
$
|
-
|
$
|
-
|
$
|
-
|
$
|
1,593
|
||||||||||
Variable Interest Entities
We sponsor a number of investment vehicles where we are the general partner or investment manager. At March 31, 2017, December 31, 2016 and March 31, 2016 we consolidated the only VIE. We consolidated VIEs where we are the primary beneficiary. The Company has not provided any financial or other support to those VIEs where we are not the primary beneficiary.
The assets of the VIEs may only be used to satisfy obligations of the VIEs. The following table presents the balances related to the VIE that is consolidated and is included on the condensed consolidated statements of financial condition as well as AC Group’s net interest in the VIE. There is one VIE consolidated at March 31, 2017, December 31, 2016 and March 31, 2016:
|
March 31,
|
December 31,
|
March 31,
|
||||||||||
|
|
2017
|
2016
|
2016
|
|||||||||
|
(In thousands)
|
||||||||||||
|
Cash and cash equivalents
|
$
|
146
|
$
|
308
|
$
|
35
|
||||||
|
Investments in securities
|
6,686
|
6,338
|
5,896
|
|||||||||
|
Receivable from broker
|
2,355
|
2,046
|
2,320
|
|||||||||
|
Other assets
|
(7
|
)
|
(8
|
)
|
(4
|
)
|
||||||
|
Accrued expenses and other liabilities
|
(35
|
)
|
(37
|
)
|
(33
|
)
|
||||||
|
Redeemable noncontrolling interests
|
(310
|
)
|
(287
|
)
|
(285
|
)
|
||||||
|
AC Group's net interests in consolidated VIE
|
$
|
8,835
|
$
|
8,360
|
$
|
7,929
|
||||||
E.
Income Taxes
The effective tax rate ("ETR") for the three months ended March 31, 2017 and March 31, 2016 was 39.3% and 29.9%, respectively. The differences in ETR primarily reflect the benefit of the dividends received deduction and appreciated donated securities in the first quarter of 2017 compared to the benefit of dividends received deduction in the first quarter of 2016 relative to the respective period’s net income/(loss) versus the standard corporate tax rate of 34%.
ASU 2016-09, which was issued in March 2016 and became effective for interim and annual reporting periods beginning after December 15, 2016, simplifies several aspects of accounting for employee share-based payment transactions. Upon adoption of ASU 2016-09 on January 1, 2017, our accounting for excess tax benefits has changed and we have adopted prospectively, resulting in recognition of excess tax benefits against income tax expenses rather than additional paid-in capital.
21
F. Earnings Per Share
Basic earnings per share is computed by dividing net income/(loss) per share attributable to our shareholders by the weighted average number of shares outstanding during the period. Diluted earnings per share is computed by dividing net income/(loss) per share attributable to our shareholders by the weighted average number of shares outstanding during the period, adjusted for the dilutive effect of restricted stock awards.
The computations of basic and diluted net income/(loss) per share are as follows:
|
Three Months Ended March 31,
|
||||||||
|
(in thousands, except per share amounts)
|
2017
|
2016
|
||||||
|
Basic:
|
||||||||
|
Net income/(loss) attributable to Associated Capital Group, Inc.'s shareholders
|
$
|
(13,078
|
)
|
$
|
1,593
|
|||
|
Weighted average shares outstanding
|
23,829
|
24,863
|
||||||
| Basic net income/(loss) attributable to Associated Capital Group, Inc.'s | ||||||||
|
shareholders per share
|
$
|
(0.55
|
)
|
$
|
0.06
|
|||
|
Diluted:
|
||||||||
|
Net income/(loss) attributable to Associated Capital Group, Inc.'s shareholders
|
$
|
(13,078
|
)
|
$
|
1,593
|
|||
|
Weighted average share outstanding
|
23,829
|
24,863
|
||||||
|
Dilutive restricted stock awards
|
-
|
314
|
||||||
|
Total
|
23,829
|
25,177
|
||||||
| Diluted net income/(loss) attributable to Associated Capital Group, Inc.'s | ||||||||
|
shareholders per share
|
$
|
(0.55
|
)
|
$
|
0.06
|
|||
Diluted weighted average shares outstanding for the first quarter 2017 exclude potential restricted stock awards as we have a net loss for that period and their inclusion would be anti-dilutive.
G.
Stockholders’ Equity
Shares outstanding were 24.2 million, 24.3 million and 25.4 million on March 31, 2017, December 31, 2016, and March 31, 2016, respectively.
Dividends
During three months ended March 31, 2017 and 2016, the Company declared dividends of $0.00 and $0.10 per share to class A and class B shareholders, respectively.
Voting Rights
The holders of Class A Common stock (“Class A Stock”) and Class B Common stock (“Class B Stock”) have identical rights except that (i) holders of Class A Stock are entitled to one vote per share, while holders of Class B Stock are entitled to ten votes per share on all matters to be voted on by shareholders in general, and (ii) holders of Class A Stock are not eligible to vote on matters relating exclusively to Class B Stock and vice versa.
Stock Award and Incentive Plan
The Company maintains one Plan approved by the shareholders, which is designed to provide incentives which will attract and retain individuals key to the success of AC through direct or indirect ownership of our common stock. Benefits under the Plan may be granted in any one or a combination of stock options, stock appreciation rights, restricted stock, restricted stock units, stock awards, dividend equivalents and other stock or cash based awards. A maximum of 2.0 million shares of Class A Stock have been reserved for issuance as approved by the Company's stockholders at the annual meeting of stockholders held on May 3, 2016. Under the Plan, the committee may grant RSAs and either incentive or nonqualified stock options with a term not to exceed ten years from the grant date and at an exercise price that the committee may determine.
On November 30, 2015, in connection with the spin-off of the Company from GAMCO on a one for one basis, the Company issued 554,100 AC RSA shares to employees who held 554,100 GAMCO RSA shares. As of March 31, 2017, December 31, 2016 and March 31, 2016, there were 420,240 RSA shares, 424,340 RSA shares and 553,100 RSA shares outstanding, respectively, that were previously issued at an average weighted GAMCO grant price of $65.59, $65.74 and $64.02, respectively. These RSA grants occurred prior to the spin-off of Associated Capital. On November 30, 2015, pursuant to the spin-off, all RSA grant holders received shares of Associated Capital’s Class A common stock as a result of their ownership of their GAMCO unvested RSAs (one share of Associated Capital for each share of GBL). All grants of the RSA shares were recommended by the Company's Chairman, who did not receive any RSAs, and approved by the Compensation Committee of the Board of Directors (the "Compensation Committee"). This expense, net of estimated forfeitures, is recognized over the vesting period for these awards which is either (1) 30% over three years from the date of grant and 70% over five years from the date of grant or (2) 30% over three years from the date of grant and 10% each year over years four through ten from the date of grant. During the vesting period, dividends to RSA holders are held for them until the RSA vesting dates and are forfeited if the grantee is no longer employed by the Company on the vesting dates. Dividends declared on these RSAs, less estimated forfeitures, are charged to retained earnings on the declaration date.
22
For the three months ended March 31, 2017 and March 31, 2016, we recognized stock-based compensation expense of $0.4 million and $0.6 million, respectively. Actual and projected stock-based compensation expense for RSA shares for the years ended December 31, 2016 through December 31, 2024 (based on awards currently issued or granted) is as follows (in thousands):
|
2016
|
2017
|
2018
|
2019
|
2020
|
2021
|
2022
|
2023
|
2024
|
||||||||||||||||||||||||||||||
|
Q1
|
$
|
644
|
$
|
444
|
$
|
297
|
$
|
239
|
$
|
127
|
$
|
80
|
$
|
52
|
$
|
27
|
$
|
5
|
||||||||||||||||||||
|
Q2
|
644
|
446
|
287
|
239
|
113
|
80
|
52
|
27
|
5
|
|||||||||||||||||||||||||||||
|
Q3
|
727
|
399
|
259
|
216
|
93
|
63
|
37
|
14
|
3
|
|||||||||||||||||||||||||||||
|
Q4
|
449
|
351
|
239
|
200
|
80
|
52
|
27
|
5
|
-
|
|||||||||||||||||||||||||||||
|
Full Year
|
$
|
2,464
|
$
|
1,640
|
$
|
1,082
|
$
|
894
|
$
|
413
|
$
|
275
|
$
|
168
|
$
|
73
|
$
|
13
|
||||||||||||||||||||
The total compensation cost related to non-vested RSAs not yet recognized is approximately $4.1 million as of March 31, 2017.
H.
Goodwill and Identifiable Intangible Assets
At March 31, 2017, $3.4 million of goodwill related to Gabelli & Company Investment Advisers, Inc. is separately disclosed on the condensed consolidated statements of financial condition. The Company assesses the recoverability of goodwill at least annually, or more often should events warrant, using a qualitative assessment of whether it is more likely than not that an impairment has occurred to determine if a quantitative analysis is required. There were no indicators of impairment for the three months ended March 31, 2017 or March 31, 2016, and as such there was no impairment analysis performed or charge recorded.
I.
Commitments and Contingencies
From time to time, the Company may be named in legal actions and proceedings. These actions may seek substantial or indeterminate compensatory as well as punitive damages or injunctive relief. The Company is also subject to governmental or regulatory examinations or investigations. The examinations or investigations could result in adverse judgments, settlements, fines, injunctions, restitutions or other relief. For any such matters, the condensed consolidated financial statements include the necessary provisions for losses that the Company believes are probable and estimable. Furthermore, the Company evaluates whether there exist losses which may be reasonably possible and will, if material, make the necessary disclosures. However, management believes such amounts, both those that are probable and those that are reasonably possible, are not material to the Company’s financial condition, operations or cash flows at March 31, 2017.
The Company indemnifies the clearing brokers of G.research, LLC, our broker-dealer subsidiary, for losses they may sustain from the customer accounts that trade on margin introduced by it. At March 31, 2017, the total amount of customer balances subject to indemnification (i.e. unsecured margin debits) was immaterial. The Company also has entered into arrangements with various other third parties many of which provide for indemnification of the third parties against losses, costs, claims and liabilities arising from the performance of obligations under the agreements. The Company has had no claims or payments pursuant to these or prior agreements and believes the likelihood of a claim being made is remote. The Company’s estimate of the value of such agreements is de minimis, and therefore an accrual has not been made on the condensed consolidated financial statements.
J. Shareholder-Designated Contribution Plan
During 2016, the Company established a Shareholder Designated Charitable Contribution program. Under the program, each shareholder is eligible to designate a charity to which the Company would make a donation at a rate of twenty-five cents per share based upon the actual number of shares registered in the shareholder’s name. Shares held in nominee or street name were not eligible to participate. On February 8, 2017, the Company announced it had again adopted a Shareholder Designated Charitable Contribution program for all registered Class A and Class B shareholders. The Company recorded a cost of $4.9 million related to this contribution which was included in shareholder-designated contribution in the condensed consolidated statements of income.
23
K. Contractual Obligations
In June 2016, AC entered into a sublease agreement with GAMCO effective from April 1, 2016 through March 31, 2017. The Company renewed the sublease agreement with GAMCO in March 2017 which extended the lease through March 31, 2018. Future minimum lease commitment under this operating lease as of March 31, 2017 is as follows:
|
(In thousands)
|
||||
|
2017
|
$
|
282
|
||
|
2018
|
94
|
|||
|
Total
|
$
|
376
|
||
L.
Subsequent Events
From April 1, 2017 to May 2, 2017, the Company repurchased 26,909 shares at $33.88 per share.
On May 1, 2017, GAMCO prepaid an additional $10 million of the GAMCO Note, reducing the principal outstanding to $80 million.
In addition, the Board of Directors declared a $0.10 dividend per share payable on July 11, 2017 to its shareholders of record on June 27, 2017.
24
ITEM 2:
MANAGEMENT’S DISCUSSION AND ANALYSIS OF FINANCIAL CONDITION AND RESULTS OF OPERATIONS (INCLUDING QUANTITATIVE AND QUALITATIVE DISCLOSURES ABOUT MARKET RISK)
Introduction
MD&A is provided as a supplement to, and should be read in conjunction with, the Company's unaudited Financial Statements and accompanying notes thereto included in this Quarterly Report on Form 10-Q, as well as the Company's audited annual financial statements included in our Form 10-K filed with the SEC on March 14, 2017 to help provide an understanding of our financial condition, changes in financial condition and results of operations. Unless the context otherwise requires, all references to “we,” “us,” “our,” “AC Group” or the “Company” refer collectively to Associated Capital Group, Inc., a holding company, and its subsidiaries through which our operations are actually conducted.
Overview
We are a Delaware corporation that operates alternative investment management vehicles, provides institutional research services and manages certain cash and other assets.
On November 30, 2015, GAMCO Investors, Inc. ("GAMCO") distributed all the outstanding shares of each class of common stock of AC Group on a pro rata one-for-one basis to the holders of each class of GAMCO’s common stock. Prior to the distribution, GAMCO contributed the 93.9% interest it held in Gabelli Securities, Inc. (“GCIA”) and certain cash and other assets to AC Group. GCIA is an investment adviser registered with the Securities and Exchange Commission under the Investment Advisers Act of 1940, as amended. GCIA and its wholly owned subsidiary, Gabelli & Partners, LLC ("Gabelli & Partners"), collectively serve as general partners or investment managers to investment funds including limited partnerships and offshore companies (collectively, "Investment Partnerships"), and separate accounts. We primarily manage assets in equity event-driven value strategies, across a range of risk and event arbitrage portfolios. The business earns fees from its advisory assets, and income (loss) from trading and investment portfolio activities. The advisory fees include management and incentive fees. Management fees are largely based on a percentage of the portfolios' levels of assets under management. Incentive fees are based on the percentage of profits derived from the investment performance delivered to clients' invested assets. GCIA is now a wholly owned subsidiary of AC.
We operate our institutional research services operations through G.research, LLC ("G.research") doing business as “Gabelli & Company”, a wholly owned subsidiary of Institutional Services Holdings, LLC which in turn is a wholly owned subsidiary of the Company. G.research is a broker-dealer registered under the Securities Exchange Act of 1934, as amended (the "Exchange Act"). Through G.research, we provide institutional research services as well as act as an underwriter. G.research is regulated by the Financial Industry Regulatory Authority ("FINRA"). G.research's revenues are derived primarily from institutional research services.
In addition, the following transactions were also undertaken in connection with the spin-off:
GAMCO issued a promissory note (the "GAMCO Note") to AC Group in the original principal amount of $250.0 million used to partially capitalize the Company in connection with the spin-off. The GAMCO Note bears interest at 4.0% per annum and has a maturity date of November 30, 2020 with respect to the original principal amount of the GAMCO Note. Interest on the GAMCO Note will accrue from the most recent date for which interest has been paid, or if no interest has been paid, from the effective date of the GAMCO Note; provided, however, that at the election of GAMCO, payment of interest on the GAMCO Note may, in lieu of being paid in cash, be paid, in whole or in part, in kind on the then-outstanding principal amount (a "PIK Amount"). GAMCO will repay all PIK Amounts added to the outstanding principal amount of the GAMCO Note, in cash, on the fifth anniversary of the date on which each such PIK Amount was added to the outstanding principal amount of the GAMCO Note. In no event may any interest be paid in kind subsequent to November 30, 2019. GAMCO may prepay the GAMCO Note prior to maturity without penalty.
AC has received principal repayments totaling $160 million on the GAMCO Note, of which $10 million was received during the first quarter of 2017. $50 million of the prepayment was applied against the principal amount due on November 30, 2016, $50 million against the principal amount due on November 30, 2017, $30 million against the principal amount due on November 30, 2018, and $30 million against the principal amount due on November 30, 2019. Of the $90 million principal amount outstanding, $20 million is due on November 30, 2018, $20 million is due on November 30, 2019, and $50 million is due on November 30, 2020.
As part of the spin-off from GAMCO, on November 27, 2015 GCIA purchased from GAMCO 4,393,055 shares of GAMCO class A common stock at a price of $34.1448 per share, based on the average of the volume weighted average price for GAMCO class A stock on an
“
ex-Distribution
”
basis from November 9, 2015 through and including November 27, 2015. GCIA paid for the purchase by issuing a note to GAMCO in the principal amount of $150.0 million (the
“
GCIA Note
”
). The GCIA Note was then contributed by GAMCO to AC and GCIA became a majority-owned subsidiary of AC on November 30, 2015 in connection with the completion of the spin-off. GCIA is a wholly owned subsidiary of AC.
25
Organizational Chart
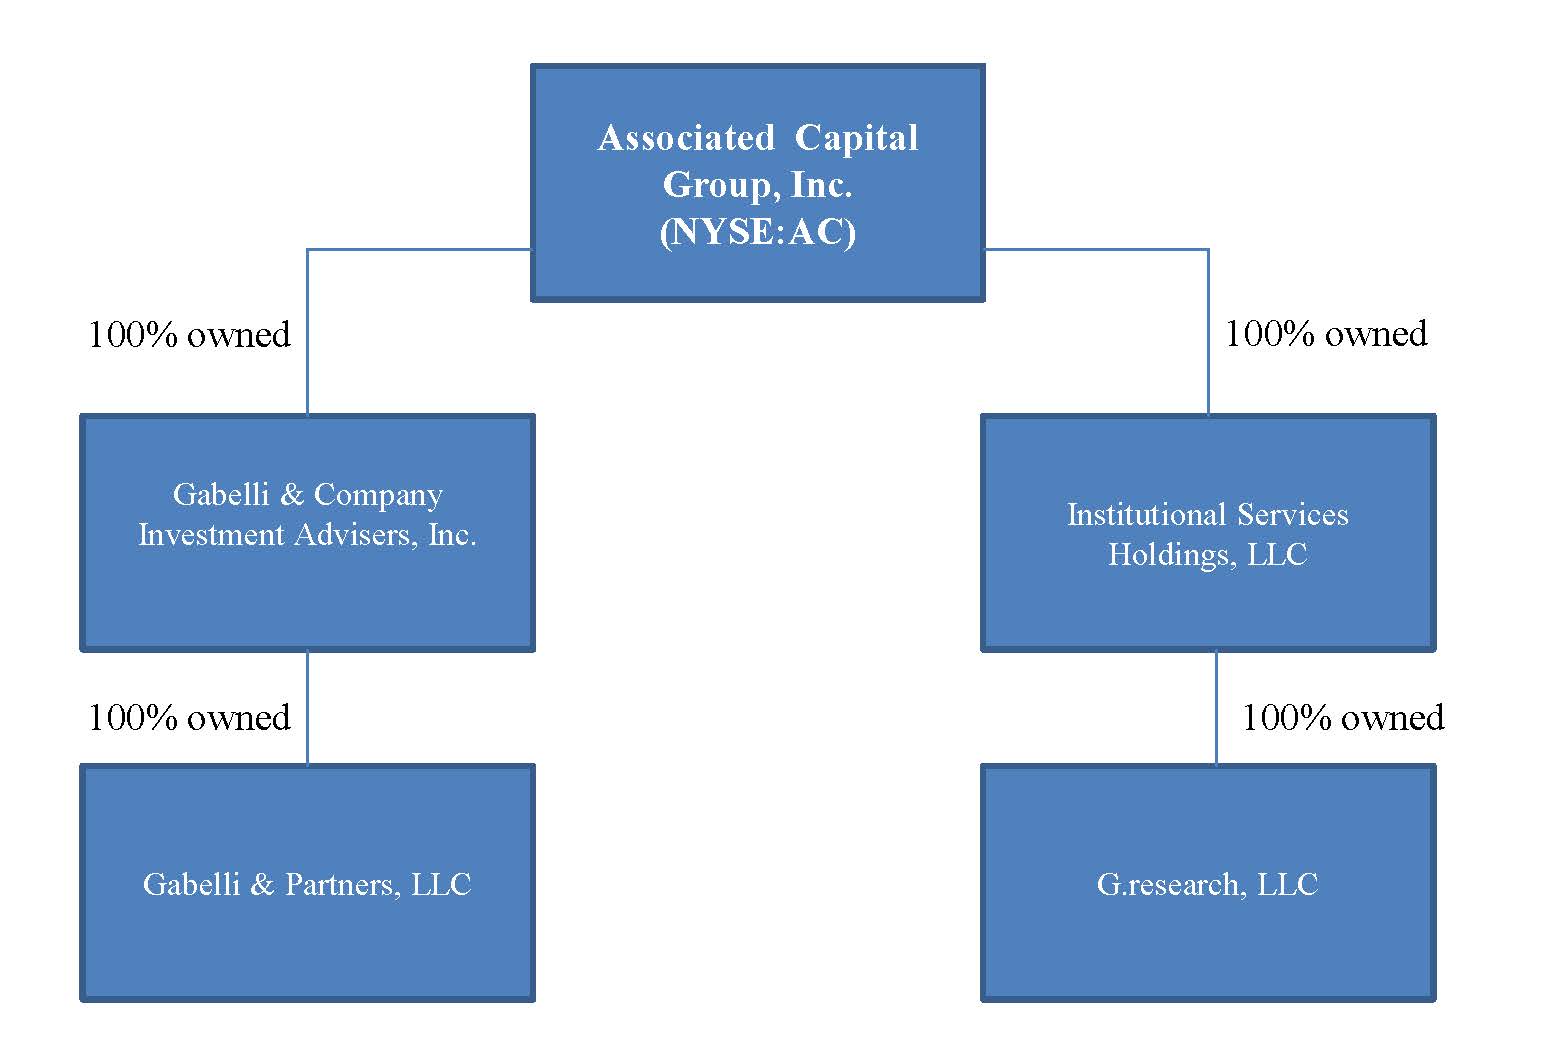
Condensed Consolidated Statements of Income
Investment advisory and incentive fees, which are based on the amount and composition of AUM in our funds and accounts, represent our largest source of revenues. Growth in revenues depends on good investment performance, which influences the value of existing AUM as well as contributes to higher investment and lower redemption rates and facilitates the ability to attract additional investors while maintaining current fee levels. Growth in AUM is also dependent on being able to access various distribution channels, which is usually based on several factors, including performance and service.
Incentive fees generally consist of an incentive allocation on the absolute gain in a portfolio or a fee of 20% of the economic profit, as defined in the agreements governing the investment vehicle. We recognize revenue only when the measurement period has been completed or at the time of an investor redemption.
Institutional research services revenues consist of brokerage commissions derived from securities transactions executed on an agency basis or direct payments on behalf of institutional clients. Commission revenues vary directly with the perceived value of the research, as well as account trading activity and new account generation.
Compensation costs include variable and fixed compensation and related expenses paid to officers, portfolio managers, sales, trading, research and all other professional staff. Variable compensation paid to sales personnel and portfolio management generally represents 40% of revenues and is the largest component of total compensation costs.
Management fee is incentive-based and entirely variable compensation in the amount of 10% of the aggregate pre-tax profits which is paid to Mr. Gabelli or his designee for acting as Executive Chairman pursuant to his Employment Agreement so long as he is an executive of AC.
Other operating expenses include general and administrative operating costs and clearing charges and fees incurred by the brokerage business.
Other income and expenses include net gains from investments (which include both realized and unrealized gains and losses from trading securities and equity in earnings of investments in partnerships), interest and dividend income, and interest expense. Net gains (losses) from investments are derived from our proprietary investment portfolio consisting of various public and private investments.
Net income (loss) attributable to non-controlling interests represents the share of net income (loss) attributable to the minority stockholders, as reported on a separate company basis, of our consolidated majority-owned subsidiary and net income (loss) attributable to third party limited partners of certain partnerships and investors of offshore funds we consolidate. Please refer to Notes A and D in our consolidated financial statements included elsewhere in this report.
26
Consolidated Statement of Financial Condition
We ended the first quarter 2017 with approximately $890 million in cash and investments, net of securities sold, not yet purchased of $8 million. This includes $407 million of cash and short term US treasuries; $217 million of securities, net, including 4.4 million shares of GAMCO stock; and $266 million invested in affiliated and third party funds and partnerships. Our financial resources underpin our flexibility to pursue strategic objectives that may include acquisitions, lift-outs, seeding new investment strategies, and co-investing, as well as shareholder compensation in the form of share repurchase and dividends.
Total shareholders’ equity was $882 million or $36.37 per share at March 31, 2017 compared to $874 million or $36.04 per share on December 31, 2016. The increase in equity from the end of 2016 is driven primarily by a $10 million prepayment of the GAMCO Note.
Adjusted Economic book value – a Non-GAAP measure
The Company also reviews an analysis of Adjusted Economic book value (“AEBV”), and AEBV per share, a non-GAAP financial measure that management believes is useful for analyzing AC’s financial condition because it reflects the impact on book value if and when the GAMCO Note is paid down. The GAMCO Note that was issued as part of the spin-off transaction is not treated as an asset for GAAP purposes, but as a reduction in equity, and will continue to be reflected as a reduction in equity in future periods in the amount of the principal then outstanding. As the GAMCO Note pays down, the Company's total equity will increase, and once the GAMCO Note is fully paid off by GAMCO, the Company's total equity and AEBV will be the same.
AEBV and AEBV per share represent book value and book value per share, respectively, without reducing equity for the period all or any portion of the GAMCO Note is outstanding.
AC has received principal repayments totaling $160 million on the GAMCO Note, of which $10 million was received during the first quarter of 2017. A prepayment of $50 million was applied against the principal amount due on November 30, 2016, $50 million against the principal amount due on November 30, 2017, $30 million against the principal amount due on November 30, 2018, and $30 million against the principal amount due on November 30, 2019. Of the $90 million principal amount outstanding, $20 million is due on November 30, 2018, $20 million is due on November 30, 2019, and $50 million is due on November 30, 2020.
At March 31, 2017, December 31, 2016 and March 31, 2016, AEBV for the Company was $972 million, $974 million and $1.014 billion, respectively, and the AEBV per diluted share was $40.08, $40.16 and $40.01, respectively, calculated as follows:
Reconciliation of Total Equity to Adjusted Economic Book Value
|
March 31, 2017
|
December 31, 2016
|
March 31, 2016
|
||||||||||||||||||||||
|
Total
|
Per Share
|
Total
|
Per Share
|
Total
|
Per Share
|
|||||||||||||||||||
|
Total equity as reported
|
$
|
881,831
|
$
|
36.37
|
$
|
874,022
|
$
|
36.04
|
$
|
764,267
|
$
|
30.15
|
||||||||||||
|
Add: GAMCO Note
|
90,000
|
3.71
|
100,000
|
4.12
|
250,000
|
9.86
|
||||||||||||||||||
|
Adjusted Economic book value
|
$
|
971,831
|
$
|
40.08
|
$
|
974,022
|
$
|
40.16
|
$
|
1,014,267
|
$
|
40.01
|
||||||||||||
27
RESULTS OF OPERATIONS
Three Months Ended March 31, 2017 Compared To Three Months Ended March 31, 2016
|
(Unaudited; in thousands, except per share data)
|
||||||||
|
|
2017
|
2016
|
||||||
|
Revenues
|
||||||||
|
Investment advisory and incentive fees
|
$
|
2,401
|
$
|
2,068
|
||||
|
Institutional research services
|
2,582
|
2,438
|
||||||
|
Other
|
4
|
11
|
||||||
|
Total revenues
|
4,987
|
4,517
|
||||||
|
Expenses
|
||||||||
|
Compensation
|
6,783
|
6,312
|
||||||
|
Management fee
|
-
|
274
|
||||||
|
Stock based compensation
|
444
|
644
|
||||||
|
Other operating expenses
|
2,092
|
1,802
|
||||||
|
Total expenses
|
9,319
|
9,032
|
||||||
|
Operating loss
|
(4,332
|
)
|
(4,515
|
)
|
||||
|
Other income (expense)
|
||||||||
|
Net gain/(loss) from trading securities
|
(14,401
|
)
|
3,709
|
|||||
|
Interest and dividend income
|
2,257
|
3,434
|
||||||
|
Interest expense
|
(70
|
)
|
(420
|
)
|
||||
|
Shareholder-designated contribution
|
(4,895
|
)
|
-
|
|||||
|
Total other income/(expense), net
|
(17,109
|
)
|
6,723
|
|||||
|
Income/(loss) before income taxes
|
(21,441
|
)
|
2,208
|
|||||
|
Income tax provision
|
(8,424
|
)
|
661
|
|||||
|
Net income/(loss)
|
(13,017
|
)
|
1,547
|
|||||
|
Net income/(loss) attributable to noncontrolling interests
|
61
|
(46
|
)
|
|||||
|
Net income/(loss) attributable to Associated Capital Group, Inc.'s shareholders
|
$
|
(13,078
|
)
|
$
|
1,593
|
|||
|
|
||||||||
|
Net income/(loss) attributable to Associated Capital Group, Inc.'s shareholders per share:
|
||||||||
|
Basic
|
$
|
(0.55
|
)
|
$
|
0.06
|
|||
|
Diluted
|
$
|
(0.55
|
)
|
$
|
0.06
|
|||
Overview
First quarter operating revenues increased to $5.0 million from $4.5 million in the year ago quarter, primarily due to higher fees on assets under management.
However, earnings were crimped by a $23.8 million negative swing in our first quarter investment and other non-operating income/(loss), with a $17.1 million loss in the first quarter of 2017 versus a $6.7 million gain in the first quarter 2016.
This unfavorable swing is mostly traceable to two items: (a) a non-cash mark-to-market loss (since inception) of $19.1 million on shares of GAMCO that was recognized entirely through net income in the first quarter of 2017, and (b) an expense of $4.9 million for AC’s second Shareholder Designated Charitable Contribution Program.
These two items plus our net operating loss resulted in a net loss of $13.1 million, or $0.55 per diluted share, compared to net income of $1.6 million, or $0.06 per diluted share in the first quarter of 2016.
Revenues
Total revenues were $5.0 million for the quarter ended March 31, 2017, $0.5 million, or 11.1%, higher than total revenues of $4.5 million for the quarter ended March 31, 2016.
28
Investment advisory income is directly influenced by the level and mix of average AUM. We earn advisory fees based on the level of average AUM in our products. Advisory fees, excluding incentive fees, were $2.4 million for the 2017 quarter compared to $2.1 million for the prior year quarter, an increase of $0.3 million. This increase is due to the increase in AUM to $1.349 billion in the first quarter of 2017 from $1.128 billion in the first quarter of 2016. Incentive fees are not recognized until the measurement period ends or at the time of an investor redemption and the fee is crystalized (typically in the fourth quarter, based on results for the calendar year). If the measurement period had instead ended on March 31, we would have recognized $0.04 million and $3.0 million for the quarters ended March 31, 2017 and 2016, respectively. Institutional research services revenues in the current year’s first quarter was increased to $2.6 million, $0.2 million higher than the prior year’s period of $2.4 million primarily due to renegotiation of the research services fee agreements with affiliates.
Expenses
Compensation costs, which include variable compensation, salaries, bonuses and benefits, were $6.8 million for the quarter ended March 31, 2017, versus $6.3 million for the quarter ended March 31, 2016. Fixed compensation costs, which include salaries and benefits, were $4.0 million for the first quarter 2017 in line with the 2016 period. Discretionary bonus accruals were $0.9 in the first quarter of 2017 and 2016. The remainder of the compensation expense represents variable compensation that fluctuates with management fee and incentive allocation revenues and gains on investment portfolios. Variable payouts as a percent of revenues are impacted by the mix of products upon which performance fees are earned and the extent to which they may exceed their allocated costs.
For the three months ended March 31, 2017 and 2016, stock based compensation was $0.4 million and $0.6 million, respectively.
Management fee expense is incentive-based and entirely variable compensation in the amount of 10% of the aggregate pre-tax profits which is paid to Mario J. Gabelli pursuant to his employment agreement. In the first quarter of 2017 and 2016, AC recorded management fee expense of $0 and $0.3 million, respectively.
Other operating expenses were $2.1 million during the first quarter of 2017 compared to $1.8 million in prior year first quarter, an increase of $0.3 million due to small increases across various expense categories.
Other
Net gain/(loss) from investments is directly related to the performance of our proprietary investment portfolio. Investment losses were $14.4 million in the 2017 quarter primarily due to a mark-to-market loss of $19.1 million on our shares of GAMCO recognized through net income in the 2017 period.
Absent the GAMCO loss, we had a $4.7 million gain on our investments in the first quarter of 2017 versus a gain of $3.7 million in the comparable 2016 quarter.
Interest and dividend income decreased to $2.3 million in the 2017 quarter from $3.4 million in the 2016 quarter due to interest earned on the initial principal amount of the GAMCO Note in the prior year. Interest expense decreased to $0.1 million in the first quarter of 2017 from $0.4 million in the prior year’s period.
During 2016, the Company established a Shareholder Designated Charitable Contribution program. Under the program, each shareholder is eligible to designate a charity to which the Company would make a donation at a rate of twenty-five cents per share based upon the actual number of shares registered in the shareholder’s name. Shares held in nominee or street name were not eligible to participate. On February 8, 2017, the Company announced it had again adopted a Shareholder Designated Charitable Contribution program for all registered Class A and Class B shareholders. The Company recorded a cost of $4.9 million related to this contribution which was included in shareholder-designated contribution in the condensed consolidated statements of income.
ASSETS UNDER MANAGEMENT
Our revenues are highly correlated to the level of assets under management and fees associated with our various investment products, rather than our own corporate assets. Assets under management, which are directly influenced by the level and changes of the overall equity markets, can also fluctuate through acquisitions, the creation of new products, the addition of new accounts or the loss of existing accounts. Since various equity products have different fees, changes in our business mix may also affect revenues. At times, the performance of our equity products may differ markedly from popular market indices, and this can also impact our revenues.
Assets under management (“AUM”) were $1.349 billion as of March 31, 2017, an increase of 6.1% from AUM of $1.272 billion at December 31, 2016 and increased 19.6% from the March 31, 2016 AUM of $1.128 billion. The increases were attributable both to market appreciation and increased investments, net of redemptions, by investors.
29
Table I: Fund Flows - 1st Quarter 2017
|
Market
|
||||||||||||||||
|
December 31,
|
appreciation/
|
Net cash
|
March 31,
|
|||||||||||||
|
|
2016
|
(depreciation)
|
flows
|
2017
|
||||||||||||
|
|
||||||||||||||||
|
Event Merger Arbitrage
|
$
|
1,076
|
$
|
-
|
$
|
68
|
$
|
1,144
|
||||||||
|
Event-Driven Value
|
133
|
3
|
5
|
141
|
||||||||||||
|
Other
|
63
|
1
|
-
|
64
|
||||||||||||
|
Total AUM
|
$
|
1,272
|
$
|
4
|
$
|
73
|
$
|
1,349
|
||||||||
Table II: Assets Under Management by Quarter
|
|
% Change From
|
|||||||||||||||||||
|
March 31,
|
December 31,
|
March 31,
|
December 31,
|
March 31,
|
||||||||||||||||
|
|
2017
|
2016
|
2016
|
2016
|
2016
|
|||||||||||||||
|
|
||||||||||||||||||||
|
Event Merger Arbitrage
|
$
|
1,144
|
$
|
1,076
|
$
|
924
|
6.3
|
23.8
|
||||||||||||
|
Event-Driven Value
|
141
|
133
|
143
|
6.0
|
(1.4
|
)
|
||||||||||||||
|
Other
|
64
|
63
|
61
|
1.6
|
4.9
|
|||||||||||||||
|
Total AUM
|
$
|
1,349
|
$
|
1,272
|
$
|
1,128
|
6.1
|
19.6
|
||||||||||||
LIQUIDITY AND CAPITAL RESOURCES
Our principal assets are highly liquid in nature and consist of cash and cash equivalents, short-term investments, securities held for investment purposes, investments in funds, and investment partnerships. Cash and cash equivalents are comprised primarily of U.S. Treasury money market funds. Although investments in partnerships and offshore funds are subject to restrictions as to the timing of distributions, the underlying investments of such partnerships or funds are, for the most part, liquid, and the valuations of these products reflect that underlying liquidity.
Summary cash flow data is as follows:
|
Three months ended
|
||||||||
|
|
March 31,
|
|||||||
|
|
2017
|
2016
|
||||||
|
Cash flows provided by (used in):
|
(in thousands)
|
|||||||
|
Operating activities
|
$
|
(14,418
|
)
|
$
|
75
|
|||
|
Investing activities
|
(1,657
|
)
|
44
|
|||||
|
Financing activities
|
9,633
|
(2,628
|
)
|
|||||
|
Net decrease
|
(6,442
|
)
|
(2,509
|
)
|
||||
|
Cash and cash equivalents at beginning of period
|
314,093
|
205,750
|
||||||
|
Decrease in cash from deconsolidation
|
-
|
(2
|
)
|
|||||
|
Cash and cash equivalents at end of period
|
$
|
307,651
|
$
|
203,239
|
||||
We require relatively low levels of capital expenditures and have a highly variable cost structure where costs increase and decrease based on the level of revenues we receive. Our revenues, in turn, are highly correlated to the level of AUM and to their investment performance. We anticipate that our available liquid assets should be more than sufficient to meet our cash requirements as we build out our operating businesses. At March 31, 2017, we had total cash and cash equivalents of $307.7 million and $203.2 million in investments. Cash and cash equivalents of $0.1 million and investments in securities of $6.7 million held by a consolidated investment partnership may not be readily available for the Company to access.
For the three months ended March 31, 2017, cash used in operating activities was $14.4 million. In the first three months of 2017, our sources of cash included a $42.1 million increase in payable to brokers, an other than temporary loss on available for sale securities of $19.1 million, a $12.7 million reduction in contributions to partnerships, $5.0 million from a decrease in investment advisory fees receivable and a $4.5 million decrease in other assets. Cash uses included a $32.0 million increase in receivable from brokers, decreased accrued expenses and other liabilities of $29.0 million, a decline in net income/(loss) of $14.6 million, $7.4 million decrease for income taxes payables and deferred tax liabilities, $6.7 million of decreases in distributions from partnerships, $5.7 million from a decrease in compensation payable, and a $4.0 million increase in receivable from affiliates. Cash used in investing activities, related to purchases and return of capital of available for sale securities, was $1.7 million in the first three months of 2017. Cash provided by financing activities in the first three months of 2017 was $9.6 million primarily due to $10.0 million of proceeds from payment of GBL 4% PIK Note.
30
For the three months ended March 31, 2016, cash provided by operating activities was $0.1 million. Cash provided by investing activities, related to purchases and return of capital of available for sale securities, was $0.044 million in the first three months of 2016. Cash used in financing activities in the first three months of 2016 was $2.6 million.
G.research is subject to certain net capital requirements. G.research computes its net capital under the alternative method permitted, which requires minimum net capital of the greater of $250,000 or 2% of the aggregate debit items in the reserve formula for those broker-dealers subject to Rule 15c3-3 promulgated under the Securities Exchange Act of 1934. The requirement was $250,000 for the broker-dealer at March 31, 2017. At March 31, 2017, G.research had net capital, as defined, of approximately $12.2 million, exceeding the regulatory requirement by approximately $12.0 million. Net capital requirements for our affiliated broker-dealer may increase in accordance with rules and regulations to the extent it engages in other business activities.
Market Risk
Our primary market risk exposure is to changes in equity prices and interest rates. Since a majority of our AUM are equities, our financial results are subject to equity market risk as revenues from our investment management services are sensitive to stock market dynamics. In addition, returns from our proprietary investment portfolio are exposed to interest rate and equity market risk.
The Company’s Chief Investment Officer oversees the proprietary investment portfolios and allocations of proprietary capital among the various strategies. The Chief Investment Officer and the Board of Directors review the proprietary investment portfolios throughout the year. Additionally, the Company monitors its proprietary investment portfolios to ensure that they are in compliance with the Company’s guidelines.
Equity Price Risk
The Company earns substantially all of its revenue as advisory from investment partnership and separate account assets. Such fees represent a percentage of AUM, and the majority of these assets are in equity investments. Accordingly, since revenues are proportionate to the value of those investments, a substantial increase or decrease in equity markets overall will have a corresponding effect on the Company's revenues.
With respect to our proprietary investment activities, included in investments in securities (including GBL stock) of $323.1 million and $342.8 million and investments in affiliated registered investment companies of $136.3 million and $131.6 at March 31, 2017 and December 31, 2016, respectively, were investments in United States Treasury Bills of $99.8 million and $119.8 million, open-end funds and closed-end funds, largely invested in equity products, of $140.1 million and $135.2 million, a selection of common and preferred stocks totaling $215.8 million and $217.9 million, and other investments of approximately $3.7 million and $1.5 million. In addition, we may alter our investment holdings from time to time in response to changes in market risks and other factors considered appropriate by management. Of the approximately $215.8 million and $217.9 million invested in common and preferred stocks at March 31, 2017 and December 31, 2016, respectively, $130.0 million and $135.7 million represented our investment in GBL, and $33.4 million and $31.0 million was invested by the Company in risk arbitrage opportunities in connection with mergers, consolidations, acquisitions, tender offers or other similar transactions. Risk arbitrage generally involves announced deals with agreed upon terms and conditions, including pricing, which typically involve less market risk than common stocks held in a trading portfolio. The principal risk associated with risk arbitrage transactions is the inability of the companies involved to complete the transaction. Securities sold, not yet purchased are stated at fair value and are subject to market risks resulting from changes in price and volatility. Of the investments in affiliated registered investment companies of $136.3 million and $131.6 at March 31, 2017 and December 31, 2016, respectively, $56.4 million and $56.4 million consisted of investment companies which invest in risk arbitrage opportunities. At March 31, 2017 and December 31, 2016, the fair value of securities sold, not yet purchased was $7.5 million and $10.0 million, respectively. Investments in partnerships totaled $130.1 million and $129.4 million at March 31, 2017 and December 31, 2016, respectively, $91.8 million and $91.8 million of which consisted of investment partnerships and offshore funds which invest in risk arbitrage opportunities.
31
The following table provides a sensitivity analysis for our investments in equity securities and partnerships and affiliates which invest primarily in equity securities, excluding arbitrage products for which the principal exposure is to deal closure and not overall market conditions, as of March 31, 2017 and December 31, 2016. The sensitivity analysis assumes a 10% increase or decrease in the value of these investments (in thousands):
|
Fair Value
|
Fair Value
|
|||||||||||
|
assuming
|
assuming
|
|||||||||||
|
10% decrease in
|
10% increase in
|
|||||||||||
|
(unaudited)
|
Fair Value
|
equity prices
|
equity prices
|
|||||||||
|
At March 31, 2017:
|
||||||||||||
|
Equity price sensitive investments, at fair value
|
$
|
308,125
|
$
|
277,313
|
$
|
338,938
|
||||||
|
At December 31, 2016:
|
||||||||||||
|
Equity price sensitive investments, at fair value
|
$
|
304,836
|
$
|
274,352
|
$
|
335,320
|
||||||
Interest Rate Risk
Our exposure to interest rate risk results, principally, from our investment of excess cash in a sponsored money market fund that holds U.S. Government securities. These investments are primarily short term in nature, and the carrying value of these investments generally approximates fair value. Based on March 31, 2017, cash and cash equivalent balance of $307.7 million, a 1% increase in interest rates would increase our interest income by $3.1 million annually. Given that our current return on these cash equivalent investments in this low interest rate environment is approximately 0.57% annually, an analysis of a 1% decrease is not meaningful.
Critical Accounting Policies and Estimates
The preparation of the condensed consolidated financial statements in conformity with GAAP requires management to make estimates and assumptions that affect the reported amounts of assets and liabilities and disclosures of contingent assets and liabilities at the date of the condensed consolidated financial statements and the reported amounts of revenues and expenses during the reporting periods. Actual results could differ significantly from those estimates. See Note A and the Company’s Critical Accounting Policies in Management’s Discussion and Analysis of Financial Condition and Results of Operations in AC’s 2016 Annual Report on Form 10-K filed with the SEC on March 14, 2017 for details on Critical Accounting Policies.
| Item 3. |
Quantitative and Qualitative Disclosures About Market Risk
|
In the normal course of its business, AC is exposed to risk of loss due to fluctuations in the securities market and general economy. Management is responsible for identifying, assessing and managing market and other risks.
Our exposure to pricing risk in equity securities is directly related to our role as financial intermediary and advisor for AUM in our investment partnerships and separate accounts as well as our proprietary investment and trading activities. At March 31, 2017, we had equity investments, including open-end funds and closed-end funds largely invested in equity products, of $359.6 million. Investments in open-end funds and closed-end funds, $140.1 million, usually generate lower market risk through the diversification of financial instruments within their portfolios. In addition, we may alter our investment holdings from time to time in response to changes in market risks and other factors considered appropriate by management. We also hold investments in partnerships which invest primarily in equity securities and which are subject to changes in equity prices. Investments in partnerships totaled $130.1 million, of which $91.8 million were invested in partnerships which invest in risk arbitrage. Risk arbitrage is primarily dependent upon deal closure rather than the overall market environment. The equity investment portfolio is at fair value and will move in line with the equity markets. The trading portfolio changes are recorded as net gain/(loss) from investments in the condensed consolidated statements of income while the available for sale portfolio changes are recorded in other comprehensive income in the condensed consolidated statements of financial condition.
| Item 4. |
Controls and Procedures
|
We evaluated the effectiveness of our disclosure controls and procedures as of March 31, 2017. Disclosure controls and procedures as defined under the Exchange Act Rule 13a-15(e), are designed to ensure that the information we are required to disclose in the reports that we file or submit under the Exchange Act is recorded, processed, summarized and reported within the time period specified in SEC rules and regulations. Disclosure controls and procedures include, without limitation, controls and procedures accumulated and communicated to our management, including our Chief Executive Officer (“CEO”) and Chief Financial Officer (“CFO”), to allow timely decisions regarding required disclosure. Our CEO and CFO participated in this evaluation and concluded that, as of the date of March 31, 2017, our disclosure controls and procedures were effective.
32
There have been no changes in our internal control over financial reporting as defined by Rule 13a-15(f) that occurred during our most recently completed fiscal quarter that have materially affected, or are reasonably likely to materially affect, our internal control over financial reporting.
Forward-Looking Information
Our disclosure and analysis in this report contain some forward-looking statements. Forward-looking statements give our current expectations or forecasts of future events. You can identify these statements because they do not relate strictly to historical or current facts. They use words such as “anticipate,” “estimate,” “expect,” “project,” “intend,” “plan,” “believe,” and other words and terms of similar meaning. They also appear in any discussion of future operating or financial performance. In particular, these include statements relating to future actions, future performance of our products, expenses, the outcome of any legal proceedings, and financial results. Although we believe that we are basing our expectations and beliefs on reasonable assumptions within the bounds of what we currently know about our business and operations, there can be no assurance that our actual results will not differ materially from what we expect or believe. Some of the factors that could cause our actual results to differ from our expectations or beliefs include, without limitation:
| • |
the adverse effect from a decline in the securities markets
|
| • |
a decline in the performance of our products
|
| • |
a general downturn in the economy
|
| • |
changes in government policy or regulation
|
| • |
changes in our ability to attract or retain key employees
|
| • |
unforeseen costs and other effects related to legal proceedings or investigations of governmental and self-regulatory organizations
|
We also direct your attention to any more specific discussions of risk contained in our Form 10-Q and other public filings. We are providing these statements as permitted by the Private Litigation Reform Act of 1995. We do not undertake to update publicly any forward-looking statements if we subsequently learn that we are unlikely to achieve our expectations or if we receive any additional information relating to the subject matters of our forward-looking statements.
Part II: Other Information
| Item 1. |
Legal Proceedings
|
From time to time, the Company may be named in legal actions and proceedings. These actions may seek substantial or indeterminate compensatory as well as punitive damages or injunctive relief. The Company is also subject to governmental or regulatory examinations or investigations. The examinations or investigations could result in adverse judgments, settlements, fines, injunctions, restitutions or other relief. For any such matters, the condensed consolidated financial statements include the necessary provisions for losses that the Company believes are probable and estimable. Furthermore, the Company evaluates whether there exist losses which may be reasonably possible and will, if material, make the necessary disclosures. However, management believes such amounts, both those that would be probable and those that would be reasonably possible, are not material to the Company’s financial condition, operations or cash flows at March 31, 2017.
33
| Item 2. |
Unregistered Sales of Equity Securities and Use of Proceeds
|
The following table provides information with respect to the repurchase of Class A Common Stock of AC during the three months ended March 31, 2017:
|
(c) Total Number of
|
(d) Maximum
|
|||||||||||||||
|
(a) Total
|
(b) Average
|
Shares Repurchased as
|
Number of Shares
|
|||||||||||||
|
Number of
|
Price Paid Per
|
Part of Publicly
|
That May Yet be
|
|||||||||||||
|
Shares
|
Shares, net of
|
Announced Plans
|
Purchased Under
|
|||||||||||||
|
Period
|
Repurchased
|
Commissions
|
or Programs
|
the Plans or Programs
|
||||||||||||
|
1/01/17 - 1/31/17
|
3,762
|
$
|
33.45
|
3,762
|
82,651
|
|||||||||||
|
2/01/17 - 2/28/17
|
-
|
-
|
-
|
500,000
|
||||||||||||
|
3/01/17 - 3/31/17
|
-
|
-
|
-
|
500,000
|
||||||||||||
|
Totals
|
3,762
|
$
|
33.45
|
3,762
|
||||||||||||
On February 7, 2017, the Board of Directors reset the available number of shares to be purchased under the stock repurchase program to 500,000 shares.
| Item 6. |
(a) Exhibits
|
| 31.1 |
Certification of CEO pursuant to Rule 13a-14(a).
|
| 31.2 |
Certification of CFO pursuant to Rule 13a-14(a).
|
| 32.1 |
Certification of CEO pursuant to 18 U.S.C. Section 1350, as adopted pursuant to Section 906 of the Sarbanes-Oxley Act of 2002.
|
| 32.2 |
Certification of CFO pursuant to 18 U.S.C. Section 1350, as adopted pursuant to Section 906 of the Sarbanes- Oxley Act of 2002.
|
| 101.INS |
XBRL Instance Document
|
| 101.SCH |
XBRL Taxonomy Extension Schema Document
|
| 101.CAL |
XBRL Taxonomy Extension Calculation Linkbase Document
|
| 101.DEF |
XBRL Taxonomy Extension Definition Linkbase Document
|
| 101.LAB |
XBRL Taxonomy Extension Label Linkbase Document
|
| 101.PRE |
XBRL Taxonomy Extension Presentation Linkbase Document
|
34
SIGNATURES
Pursuant to the requirements of the Securities Exchange Act of 1934, the registrant has duly caused this report to be signed on its behalf by the undersigned thereunto duly authorized.
ASSOCIATED CAPITAL GROUP, INC.
(Registrant)
|
By: /s/ Patrick Dennis
|
|
|
Name: Patrick Dennis
|
|
|
Title: Chief Financial Officer
|
|
|
|
|
|
Date: May 2, 2017
|
|
35
TABLE OF CONTENTS
Part IItem 1. Unaudited Condensed Consolidated Financial StatementsItem 2. Management S Discussion and Analysis Of Financial Condition and Results Of OperationsItem 3. Quantitative and Qualitative Disclosures About Market Risk (included in Item 2)Item 4. Controls and ProceduresPart II. Other InformationPart IIItem 1. Legal ProceedingsItem 2. Unregistered Sales Of Equity Securities and Use Of ProceedsItem 6. ExhibitsItem 3. Quantitative and Qualitative Disclosures About Market RiskPart Ii: Other InformationItem 6. (a) Exhibits