ARES COMMERCIAL REAL ESTATE CORP
10-Ks and 10-Qs
|
|
|
|
|
|
|
|
|
|
|
|
|
|
|
|
|
|
|
|
|
|
|
|
|
|
|
|
|
|
|
|
|
|
|
|
|
|
|
|
|
|
|
|
UNITED STATES
SECURITIES AND EXCHANGE COMMISSION
Washington, D.C. 20549
____________________________________________________________________________
FORM 10-K
__________________________________________________________________________
|
ý
|
ANNUAL REPORT PURSUANT TO SECTION 13 OR 15(d) OF THE SECURITIES EXCHANGE ACT OF 1934
|
|
For the fiscal year ended December 31, 2018
|
|
|
OR
|
|
|
o
|
TRANSITION REPORT PURSUANT TO SECTION 13 OR 15(d) OF THE SECURITIES EXCHANGE ACT OF 1934
|
|
For the transition period from _____ to _____
|
|
|
Commission File No. 001-35517
|
|

ARES COMMERCIAL REAL ESTATE CORPORATION
(Exact name of registrant as specified in its charter)
|
Maryland
|
|
45-3148087
|
|
(State or other jurisdiction of
incorporation or organization)
|
|
(I.R.S. Employer
Identification No.)
|
|
245 Park Avenue, 42nd Floor, New York, NY 10167
(Address of principal executive offices) (Zip Code)
|
||
|
(212) 750-7300
(Registrant’s telephone number, including area code)
|
||
_______________________________________________________________________
Securities registered pursuant to Section 12(b) of the Act:
|
Title of each class
|
|
Name of each exchange on which registered
|
|
Common Stock, $0.01 par value per share
|
|
New York Stock Exchange
|
Securities registered pursuant to Section 12(g) of the Act: None
Indicate by check mark if the registrant is a well-known seasoned issuer, as defined in Rule 405 of the Securities Act. Yes
o
No
ý
Indicate by check mark if the registrant is not required to file reports pursuant to Section 13 or Section 15(d) of the Act. Yes
o
No
ý
Indicate by check mark whether the registrant (1) has filed all reports required to be filed by Section 13 or 15(d) of the Securities Exchange Act of 1934 during the preceding 12 months (or for such shorter period that the registrant was required to file such reports), and (2) has been subject to such filing requirements for the past 90 days: Yes
ý
No
o
Indicate by check mark whether the registrant has submitted electronically every Interactive Data File required to be submitted pursuant to Rule 405 of Regulation S-T (Section §232.405 of this chapter) during the preceding 12 months (or for such shorter period that the registrant was required to submit such files). Yes
ý
No
o
Indicate by check mark if disclosure of delinquent filers pursuant to Item 405 of Regulation S-K is not contained herein, and will not be contained, to the best of registrant’s knowledge, in definitive proxy or information statements incorporated by reference in Part III of this Form 10-K or any amendment to this Form 10-K.
o
Indicate by check mark whether the registrant is a large accelerated filer, an accelerated filer, a non-accelerated filer, a smaller reporting company, or an emerging growth company. See the definitions of “large accelerated filer,” “accelerated filer,” “smaller reporting company” and “emerging growth company” in Rule 12b-2 of the Exchange Act:
|
Large accelerated filer
o
|
|
Accelerated filer
ý
|
|
Non-accelerated filer
o
|
|
Smaller reporting company
o
|
Emerging growth company
o
|
|
If an emerging growth company, indicate by check mark if the registrant has elected not to use the extended transition period complying with any new or revised financial accounting standards provided pursuant to Section 13(a) of the Exchange Act.
o
Indicate by check mark whether the registrant is a shell company (as defined in Rule 12b-2 of the Exchange Act). Yes
o
No
ý
The aggregate market value of the voting stock held by non-affiliates of the registrant on June 30, 2018, based on the closing price on that date of $
13.81
on the New York Stock Exchange, was approximately
$351,140,658
. As of
February 19, 2019
, there were
28,755,665
shares of the registrant’s common stock outstanding.
Portions of the registrant’s Proxy Statement for its
2019
Annual Meeting of Stockholders to be filed not later than 120 days after the end of the fiscal year covered by this annual report on Form 10-K are incorporated by reference into Part III of this Form 10-K.
TABLE OF CONTENTS
|
|
Page
|
|
|
|
|
|
|
|
|
|
|
|
|
|
|
|
1
FORWARD-LOOKING STATEMENTS
Some of the statements contained in this annual report constitute forward-looking statements, within the meaning of the Private Securities Litigation Reform Act of 1995 and Section 21E of the Securities Exchange Act of 1934, as amended, and we intend such statements to be covered by the safe harbor provisions contained therein. The information contained in this section should be read in conjunction with our consolidated financial statements and notes thereto appearing elsewhere in this annual report on Form 10-K. In addition, some of the statements in this annual report (including in the following discussion) constitute forward-looking statements, which relate to future events or the future performance or financial condition of Ares Commercial Real Estate Corporation (“ACRE” and, together with its consolidated subsidiaries, the “Company,” “we,” “us” and “our”). The forward-looking statements contained in this report involve a number of risks and uncertainties, including statements concerning:
|
•
|
our business and investment strategy;
|
|
•
|
our projected operating results;
|
|
•
|
the return or impact of current and future investments;
|
|
•
|
the timing of cash flows, if any, from our investments;
|
|
•
|
estimates relating to our ability to make distributions to our stockholders in the future;
|
|
•
|
defaults by borrowers in paying amounts due on outstanding indebtedness and our ability to collect all amounts due according to the contractual terms of our investments;
|
|
•
|
our ability to obtain and maintain financing arrangements, including securitizations;
|
|
•
|
market conditions and our ability to access alternative debt markets and additional debt and equity capital;
|
|
•
|
the amount of commercial mortgage loans requiring refinancing;
|
|
•
|
our expected investment capacity and available capital;
|
|
•
|
financing and advance rates for our target investments;
|
|
•
|
our expected leverage;
|
|
•
|
changes in interest rates, credit spreads and the market value of our investments;
|
|
•
|
the impact of changes in London Interbank Offered Rate on our operating results;
|
|
•
|
effects of hedging instruments on our target investments;
|
|
•
|
rates of default or decreased recovery rates on our target investments;
|
|
•
|
rates of prepayments on our mortgage loans and the effect on our business of such prepayments;
|
|
•
|
the degree to which our hedging strategies may or may not protect us from interest rate volatility;
|
|
•
|
availability of investment opportunities in mortgage-related and real estate-related investments and securities;
|
|
•
|
the ability of Ares Commercial Real Estate Management LLC (“ACREM” or our “Manager”) to locate suitable investments for us, monitor, service and administer our investments and execute our investment strategy;
|
|
•
|
allocation of investment opportunities to us by our Manager;
|
|
•
|
our ability to successfully identify, complete and integrate any acquisitions;
|
2
|
•
|
our ability to maintain our qualification as a real estate investment trust for U.S. federal income tax purposes;
|
|
•
|
our ability to maintain our exemption from registration under the Investment Company Act of 1940;
|
|
•
|
our understanding of our competition;
|
|
•
|
general volatility of the securities markets in which we may invest;
|
|
•
|
adverse changes in the real estate, real estate capital and credit markets and the impact of a protracted decline in the liquidity of credit markets on our business;
|
|
•
|
changes in governmental regulations, tax law and rates, and similar matters (including interpretation thereof);
|
|
•
|
authoritative or policy changes from standard-setting bodies such as the Financial Accounting Standards Board, the Securities and Exchange Commission, the Internal Revenue Service, the stock exchange where we list our common stock, and other authorities that we are subject to, as well as their counterparts in any foreign jurisdictions where we might do business;
|
|
•
|
actions and initiatives of the U.S. Government and changes to U.S. Government policies;
|
|
•
|
the state of the United States, European Union and Asian economies generally or in specific geographic regions;
|
|
•
|
global economic trends and economic recoveries; and
|
|
•
|
market trends in our industry, interest rates, real estate values, the debt securities markets or the general economy.
|
We use words such as “anticipates,” “believes,” “expects,” “intends,” “will,” “should,” “may” and similar expressions to identify forward-looking statements. Our actual results could differ materially from those expressed in the forward-looking statements for any reason, including the factors set forth under “Risk Factors” and elsewhere in this annual report on Form 10-K.
We have based the forward-looking statements included in this annual report on information available to us on the date of this annual report, and we assume no obligation to update any such forward-looking statements.
3
PART I
Item 1. Business
The following description of the business of Ares Commercial Real Estate Corporation (“ACRE”) should be read in conjunction with the information included elsewhere in this annual report on Form 10-K for the
year ended December 31, 2018
. We refer to ACRE together with our subsidiaries as “we,” “us,” “Company,” or “our,” unless we specifically state otherwise or the context indicates otherwise. We refer to our manager, Ares Commercial Real Estate Management LLC, as our “Manager” or “ACREM” and the parent company of our Manager, Ares Management Corporation, together with its consolidated subsidiaries, as “Ares Management.”
GENERAL
We are a specialty finance company primarily engaged in originating and investing in commercial real estate (“CRE”) loans and related investments. We are externally managed by Ares Commercial Real Estate Management LLC (“ACREM” or our “Manager”), a subsidiary of Ares Management Corporation (NYSE: ARES) (“Ares Management”), a publicly traded, leading global alternative asset manager, pursuant to the terms of the management agreement dated April 25, 2012, as amended, between us and our Manager (the “Management Agreement”). From the commencement of our operations in late 2011, we have been primarily focused on directly originating and managing a diversified portfolio of CRE debt-related investments for our own account.
We were formed and commenced operations in late 2011. We are a Maryland corporation and completed our initial public offering (the “IPO”) in May 2012. We have elected and qualified to be taxed as a real estate investment trust (“REIT”) for U.S. federal income tax purposes under the Internal Revenue Code of 1986, as amended (the “Code”), commencing with our taxable year ended December 31, 2012. We generally will not be subject to U.S. federal income taxes on our REIT taxable income, determined without regard to the deduction for dividends paid and excluding net capital gains, to the extent that we annually distribute all of our REIT taxable income to stockholders and comply with various other requirements as a REIT. We also operate our business in a manner that is intended to permit us to maintain our exemption from registration under the Investment Company Act of 1940, as amended (the “1940 Act”).
Our Investment Strategy
We target borrowers whose capital needs are not being suitably met by traditional bank or capital markets sources by offering these borrowers customized financing solutions. We implement a strategy focused on direct origination combined with experienced portfolio management. Targeted borrowers are generally pursuing value improving business plans on commercial real estate which we believe often face challenges in raising capital to meet their financing needs through traditional bank and capital markets sources. As a result, we continue to find increasing demand from borrowers and sponsors for customized solutions in this segment of the market. We act as a single “one stop” source of financing for our customers through our customized financing solutions. We generally hold our loans for investment and earn interest and interest-related income.
Direct Origination
We generally source new investments through our Manager’s national direct origination platform consisting of
four
offices across the United States
as of December 31, 2018
.
Investment Strategy
In pursuing investment opportunities with attractive risk-reward profiles, our Manager incorporates our views of the current and future economic environment, our outlook for real estate in general and particular asset classes and our assessment of the risk-reward profile derived from our underwriting. Our Manager’s underwriting standards center on the creditworthiness and valuation of the asset collateralizing the loan as well as the strength of the borrower and the underlying sponsor of a given asset, with particular focus on an asset’s business plan, competitive positioning within the market, existing capital structure and potential exit opportunities. All investment decisions are made to seek to ensure that we maintain our qualification as a REIT and our exemption from registration under the 1940 Act.
In addition, as part of our investment strategy, we may from time to time engage in discussions with counterparties with respect to various potential strategic transactions, including potential investments in, and acquisitions of, other real estate or finance companies or asset portfolios. In connection with evaluating potential strategic transactions and assets, we may incur significant expenses for the evaluation and due diligence investigation and negotiation of any potential transaction.
4
Our investment strategy may be amended from time to time without the approval of our stockholders, if recommended by our Manager and approved by our board of directors. We expect to disclose any material changes to our investment strategy in the periodic quarterly and annual reports that we file with the Securities and Exchange Commission (“SEC”).
Our Target Assets
Our target investments primarily include senior mortgage loans, subordinated debt, preferred equity, mezzanine loans and other CRE investment opportunities, including commercial mortgage-backed securities.
Investment Portfolio
For information about our investment portfolio, see “Management’s Discussion And Analysis Of Financial Condition And Results Of Operations-Investment Portfolio” and Note
3
to our consolidated financial statements included in this annual report on Form 10-K.
Targeted Investments
|
•
|
Senior Mortgage Loans:
These mortgage loans are typically secured by first liens on commercial properties, including the following property types: office, multifamily, self storage, retail, hotel, healthcare, student housing, industrial, mixed-use, residential and residential condominium. Our senior mortgage loans may include construction loans. In some cases, first lien mortgages may be divided into an A-Note and a B-Note. The A-Note is typically a privately negotiated loan that is secured by a first mortgage on a commercial property or group of related properties that is senior to a B-Note secured by the same first mortgage property or group.
|
|
•
|
Subordinated Debt:
These loans may include structurally subordinated first mortgage loans and junior participations in first mortgage loans or participations in these types of assets. As noted above, a B-Note is typically a privately negotiated loan that is secured by a first mortgage on a commercial property or group of related properties and is subordinate to an A-Note secured by the same first mortgage property or group. The subordination of a B-Note or junior participation typically is evidenced by participations or intercreditor agreements with other holders of interests in the note. B-Notes are subject to more credit risk with respect to the underlying mortgage collateral than the corresponding A-Note.
|
|
•
|
Mezzanine Loans:
Like B‑Notes, these loans are also subordinated CRE loans, but are usually secured by a pledge of the borrower’s equity ownership in the entity that owns the property or by a second lien mortgage on the property. In a liquidation, these loans are generally junior to any mortgage liens on the underlying property, but senior to any preferred equity or common equity interests in the entity that owns the property. Investor rights are usually governed by intercreditor agreements.
|
|
•
|
Preferred Equity:
Real estate preferred equity investments are subordinate to first mortgage loans and are not collateralized by the property underlying the investment. As a holder of preferred equity, we seek to enhance our position with covenants that limit the activities of the entity in which we have an interest and protect our equity by obtaining an exclusive right to control the underlying property after an event of default, should such a default occur on our investment.
|
|
•
|
Other CRE Investments:
To a lesser extent, we may invest in other loans and securities, subject to maintaining our qualification as a REIT, including but not limited to commercial mortgage-backed securities, loans to real estate or hospitality companies, debtor-in-possession loans and selected other income producing equity investments, such as triple net lease equity.
|
Ares Commercial Real Estate Management LLC and Ares Management Corporation
We are externally managed by our Manager, a subsidiary of Ares Management, pursuant to the terms of the Management Agreement.
As of December 31, 2018
, Ares Management had approximately
1,075
employees in
18
principal and originating offices across the United States, Europe, Asia and Australia. Since its inception in 1997, Ares Management has adhered to a disciplined investment philosophy that focuses on delivering strong risk-adjusted investment returns throughout market cycles. Ares Management believes each of its three distinct but complementary investment groups in Credit, Private Equity and Real Estate is a market leader based on investment performance. Ares Management was built upon the fundamental principle that each group benefits from being part of the greater whole.
5
Our Manager is responsible for administering our business activities and day-to-day operations and providing us our executive management team, principal investment team and appropriate support personnel. Pursuant to the Management Agreement, our Manager is entitled to receive a base management fee, an incentive fee and expense reimbursements. In addition, under certain circumstances, our Manager will be entitled to receive a termination fee if the Management Agreement is terminated. Our Manager, including our officers and employees of our Manager, may also receive grants of equity-based awards pursuant to our equity incentive plan that was adopted on April 23, 2012 and amended and restated in June 2018 (the “Amended and Restated 2012 Equity Incentive Plan”). For more information on the terms of the Management Agreement, see Note
10
to our consolidated financial statements included in this annual report on Form 10-K.
MARKET OPPORTUNITY
We believe market conditions continue to be favorable for disciplined and scaled direct lenders with broad and flexible product offerings. Supported by an active commercial real estate transaction market and growing capital for value-added and opportunistic real estate funds, we expect continued strong demand for shorter duration and often floating rate loans. We believe this will lead to a significant market of attractive financing opportunities, which we anticipate could lead to increased financing transaction volumes and enhance our market opportunity.
OUR FINANCING STRATEGY
We intend to use prudent amounts of leverage to fund the origination or acquisition of our target investments. Subject to maintaining our qualification as a REIT and our exemption from the 1940 Act, we expect that our primary sources of financing will be, to the extent available to us, through (a) credit, secured funding and other lending facilities, (b) securitizations, (c) other sources of private financing, including warehouse and repurchase facilities, and (d) public or private offerings of our equity or debt securities. In the future, we may utilize other sources of financing to the extent available to us.
Given current market conditions and our focus on first or senior mortgages, we currently expect that such leverage would not exceed, on a debt-to-equity basis, a 4-to-1 ratio. Our charter and bylaws do not restrict the amount of leverage that we may use. The amount of leverage we will deploy for particular investments in our target investments will depend upon our Manager’s assessment of a variety of factors, which may include, among others, the anticipated liquidity and price volatility of the assets in our investment portfolio, the potential for losses and extension risk in our portfolio, the gap between the duration of our assets and liabilities, including hedges, the availability and cost of financing the assets, our opinion of the creditworthiness of our financing counterparties, the health of the U.S. economy generally or in specific geographic regions and commercial mortgage markets, our outlook for the level and volatility of interest rates, the slope of the yield curve, the credit quality of our assets, the collateral underlying our assets, and our outlook for asset spreads relative to the London Interbank Offered Rate (“LIBOR”) curve.
Financing Agreements
We borrow funds, as applicable in a given period, under the Wells Fargo Facility, the Citibank Facility, the BAML Facility, the CNB Facility, the MetLife Facility, the UBS Facility and the U.S. Bank Facility (as individually defined in Note
4
to the consolidated financial statements included in this annual report on Form 10-K, and collectively, the “Secured Funding Agreements”) and the Secured Term Loan (as defined below). We refer to the Secured Funding Agreements and the Secured Term Loan as the “Financing Agreements.” While the borrowers under the Financing Agreements generally are our subsidiaries, all such debt agreements are guaranteed by us in whole or in part. Generally, we seek to partially offset interest rate risk by matching the interest index of loans held for investment with the interest index of the Secured Funding Agreements used to fund them.
As of December 31, 2018
, we had
$110.0 million
outstanding under our
$110.0 million
Credit and Guaranty Agreement with the lenders referred to therein and Cortland Capital Market Services LLC, as administrative agent and collateral agent for the lenders (the “Secured Term Loan”).
As of December 31, 2018
, our outstanding balance under the Financing Agreements was
$888.0 million
.
See Item 7, “Management’s Discussion And Analysis Of Financial Condition And Results Of Operations—Liquidity And Capital Resources—Summary of Financing Agreements” included in this annual report on Form 10-K for a further discussion of our borrowings
as of December 31, 2018
.
6
Securitizations
In addition to Financing Agreements, we may also, to the extent available, securitize the senior portion of some of our loans, while retaining the subordinate securities in our investment portfolio. The securitized portion of senior loans is reflected as securitization debt in our consolidated balance sheets. As of December 31, 2018, the outstanding balance of our CLO Securitization (as defined below) was $272.9 million. See “Recent Developments” and Note 15 to our consolidated financial statements included in this annual report on Form 10-K for a subsequent event related to the CLO Securitization.
TAXATION
We have elected and qualified to be taxed as a REIT for U.S. federal income tax purposes under the Code, commencing with our taxable year ended December 31, 2012. We generally will not be subject to U.S. federal income taxes on our REIT taxable income as long as we annually distribute all of our REIT taxable income to stockholders and comply with various other requirements as a REIT.
We formed a wholly-owned subsidiary, ACRC Lender W TRS LLC (“ACRC W TRS”), in December 2013 in order to issue and hold certain loans intended for sale. We also formed a wholly-owned subsidiary, ACRC 2017-FL3 TRS LLC (“FL3 TRS”), in March 2017 in order to hold a portion of the non-investment grade notes and the preferred equity of ACRE Commercial Mortgage 2017-FL3 Ltd. (the “CLO Securitization”) to the extent it generates excess inclusion income. ACRC W TRS and FL3 TRS filed elections seeking to be taxed as corporations and also filed elections, along with us, to be treated as taxable REIT subsidiaries (“TRS”). A TRS is an entity taxed as a corporation that has not elected to be taxed as a REIT, in which a REIT directly or indirectly holds equity, and that has made a joint election with such REIT to be treated as a TRS. A TRS generally may engage in any business, including investing in assets and engaging in activities that could not be held or conducted directly by us without jeopardizing our qualification as a REIT. A TRS is subject to applicable U.S. federal, state, and local income tax on its taxable income. In addition, as a REIT, we may also be subject to a 100% excise tax on certain transactions between us and our TRS that are not conducted on an arm’s-length basis.
COMPETITION
Our net income depends, in part, on our ability to originate or acquire assets at favorable spreads over our borrowing costs. We operate in a competitive market for the origination and acquisition of attractive investment opportunities. We compete with other public or private REITs, specialty finance companies, savings and loan associations, banks, mortgage bankers, insurance companies, mutual funds, institutional investors, investment banking firms, financial institutions, governmental bodies, fund managers and other entities. In addition, there are numerous REITs with similar asset origination and acquisition objectives and others may be organized in the future. These other REITs may increase competition for the available supply of mortgage assets suitable for purchase and origination. Many of our competitors are significantly larger than we are and may have considerably greater financial, technical, marketing and other resources than we do. Some competitors may have a lower cost of funds and access to funding sources that are not available to us, such as the U.S. Government. Many of our competitors are not subject to the operating constraints associated with REIT tax compliance or maintenance of an exemption from the 1940 Act. In addition, some of our competitors may have higher risk tolerances or different risk assessments, which could allow them to consider a wider variety of loans and investments and offer more attractive pricing or other terms than we would. Furthermore, competition for originations of, and investments in, assets we target may lead to decreasing yields, which may further limit our ability to generate targeted returns.
In the face of this competition, we have access to our Manager’s and Ares Management’s professionals and their collective industry expertise, which may provide us with a competitive advantage and help us assess investment risks and determine appropriate pricing for certain potential investments. These relationships enable us to compete more effectively for attractive investment opportunities. However, we may not be able to achieve our business goals or expectations due to the competitive risks that we face. For additional information concerning these competitive risks, see “Risk Factors—Risks Related to Our Investments—We operate in a competitive market for investment opportunities and loan originations and competition may limit our ability to originate or acquire desirable investments in our target investments on attractive terms” included in this annual report on Form 10-K.
STAFFING
We are externally managed by our Manager pursuant to the Management Agreement. Our executive officers also serve as officers of our Manager and certain of its affiliates. For more information on the terms of the Management Agreement, see Note
10
to our consolidated financial statements included in this annual report on Form 10-K.
7
AVAILABLE INFORMATION
We file with or submit to the SEC annual, quarterly and current periodic reports, proxy statements and other information meeting the informational requirements of the Securities Exchange Act of 1934 (the “Exchange Act”). This information is available on our website at
www.arescre.com.
The information on our website is not deemed incorporated by reference in this annual report.
Item 1A. Risk Factors
RISK FACTORS
You should carefully consider these risk factors, together with all of the other information included in this annual report, including our consolidated financial statements and the related notes thereto, before you decide whether to make an investment in our securities. The risks set out below are not the only risks we face. Additional risks and uncertainties not currently known to us or that we currently deem to be immaterial also may materially adversely affect our business, financial condition and/or operating results. If any of the following events occur, our business, financial condition and results of operations could be materially adversely affected. In such case, the value of our common stock and the trading price of our securities could decline, and you may lose all or part of your investment.
RISKS RELATED TO OUR RELATIONSHIP WITH OUR MANAGER AND ITS AFFILIATES
Our future success depends on our Manager, its key personnel and their access to the investment professionals of Ares Management. We may not find a suitable replacement for our Manager if our Management Agreement is terminated or if such key personnel or investment professionals leave the employment of our Manager or Ares Management or otherwise become unavailable to us.
We rely on the resources of our Manager to manage our day-to-day operations, as we do not employ any personnel. We rely completely on our Manager to provide us with investment advisory services.
Our executive officers also serve as officers of our Manager. Our Manager has significant discretion as to the implementation of our investment and operating policies and strategies. Accordingly, we believe that our success depends to a significant extent upon the efforts, experience, diligence, skill and network of business contacts of the officers and key personnel of our Manager. The officers and key personnel of our Manager evaluate, negotiate, close and monitor our investments; therefore, our success depends on their continued service. The departure of any of the officers or key personnel of our Manager could have a material adverse effect on our business.
Our Manager is not obligated to dedicate any specific personnel exclusively to us. None of our officers are obligated to dedicate any specific portion of their time to our business. Each of them has significant responsibilities for other investment vehicles managed by affiliates of Ares Management. As a result, these individuals may not always be able to devote sufficient time to the management of our business. Further, when there are turbulent conditions in the real estate markets or distress in the credit markets, the attention of our Manager’s personnel and our executive officers and the resources of Ares Management will also be required by other investment vehicles managed by affiliates of Ares Management.
In addition, we offer no assurance that our Manager will remain our investment manager or that we will continue to have access to our Manager’s officers and key personnel. The current term of our Management Agreement expires on May 1, 2019, and will be automatically renewed for one-year terms thereafter. Furthermore, our Manager may decline to renew the Management Agreement with 180 days’ written notice prior to the expiration of the renewal term. If the Management Agreement is terminated and no suitable replacement is found to manage us, we may not be able to execute our investment strategy.
We also depend on access to, and the diligence, skill and network of business contacts of the investment professionals of other groups within Ares Management and the information and deal flow generated by Ares Management’s investment professionals in the course of their investment and portfolio management activities. The departure of any of these individuals, or of a significant number of the investment professionals or partners of Ares Management, could have a material adverse effect on our business, financial condition or results of operations. We cannot assure you that we will continue to have access to Ares Management’s investment professionals or its information and deal flow.
8
Our growth depends on the ability of our Manager to make investments on favorable terms that satisfy our investment strategy and otherwise generate attractive risk-adjusted returns initially and consistently from time to time.
Our ability to achieve our investment objectives depends on our ability to grow, which depends, in turn, on the management and investment teams of our Manager and their ability to identify and to make investments on favorable terms in our target investments as well as on our access to financing on acceptable terms. The demands on the time of the professional staff of our Manager will increase as our portfolio grows, and we cannot assure you that our Manager will be able to hire, train, supervise, manage and retain new officers and employees to manage future growth effectively, and any such failure could have a material adverse effect on our business.
There are various conflicts of interest in our relationship with our Manager and Ares Management that could result in decisions that are not in the best interests of our stockholders.
We are subject to conflicts of interest arising out of our relationship with Ares Management, including our Manager and its affiliates. We are managed by our Manager, an Ares Management affiliate, and our executive officers are employees of our Manager or one or more of its affiliates. There is no guarantee that the policies and procedures adopted by us, the terms and conditions of the management agreement or the policies and procedures adopted by our Manager, Ares Management and their affiliates, will enable us to identify, adequately address or mitigate these conflicts of interest.
Some examples of conflicts of interest that may arise by virtue of our relationship with our Manager and Ares Management include:
Ares Management advisory activities.
While our Manager and Ares Management have agreed that for so long as our Manager is managing us, neither Ares Management nor any of its affiliates will sponsor or manage any other U.S. publicly traded REIT that invests primarily in the same asset classes as us, affiliates of our Manager may manage other investment vehicles (including non-traded or perpetual life REITs) that have investment objectives that compete or overlap with, and may from time to time invest in, our target asset classes. This may apply to existing investment vehicles or investment vehicles that may be organized in the future. Consequently, we, on the one hand, and these other investment vehicles, on the other hand, may from time to time pursue the same or similar investment opportunities. To the extent such existing vehicles or other Ares managed vehicles that may be organized in the future seek to acquire the same target assets as our Company, the scope of opportunities otherwise available to us may be adversely affected and/or reduced. Our Manager, Ares Management or their affiliates may also give advice to Ares managed investment vehicles that may differ from the advice given to us even though their investment objectives may be the same or similar to ours.
Allocation of investments.
Ares Management and our Manager endeavor to allocate investment opportunities in a fair and equitable manner, subject to Ares Management’s allocation policy. Ares Management’s allocation policy, which may be amended without our consent, is intended to enable us to share equitably with any other investment vehicles that are managed by Ares Management. In general, investment opportunities are allocated taking into consideration various factors, including, among others, the relevant investment vehicles’ available capital, their investment objectives or strategies, their risk profiles and their existing or prior positions in an issuer/security, their potential conflicts of interest, the nature of the opportunity and market conditions, as well as the rotation of investment opportunities. Nevertheless, it is possible that we may not be given the opportunity to participate in certain investments made by investment vehicles managed by affiliates of our Manager. In addition, there may be conflicts in the allocation of investment opportunities among us and the investment vehicles managed by affiliates of our Manager.
Co-investments.
Other Ares managed investment vehicles may co-invest with us or hold positions in an investment, or provide debt with respect to an underlying property
,
where we have also invested, including by means of splitting investments, participating in investments or other means of syndication of investments. Such investments may raise potential conflicts of interest between us and such other Ares managed investment vehicles. To the extent such existing vehicles or other Ares managed vehicles that may be organized in the future seek to acquire the same target assets as us, subject to Ares Management’s allocation policy described above, the scope of opportunities otherwise available to us may be adversely affected and/or reduced. In such circumstances, the size of the investment opportunity otherwise available to us may be less than it would otherwise have been, and we may participate in such opportunities on different and potentially less favorable economic terms than such other parties if our Manager deems such participation as being otherwise in our best interests. Furthermore, when such other Ares managed investment vehicles have interests or requirements that do not align with our interests, including differing liquidity needs or desired investment horizons, conflicts may arise in the manner in which any voting or control rights are exercised with respect to the relevant investment, potentially resulting in an adverse impact on us. If we participate in a co-investment with an Ares managed investment vehicle and such vehicle fails to fund a future advance on a loan, we may be required to, or we may elect to, cover such advance and invest additional funds. In addition, if we and such
9
other Ares managed investment vehicles invest in different classes or types of debt or investments relating to the same underlying property or properties, actions may be taken by such other Ares managed investment vehicles that are adverse to our interests, including, but not limited to, during a work-out, restructuring or insolvency proceeding or similar matter occurring with respect to such investment.
Investments in which Ares managed investment vehicles hold different investments.
We may invest in, acquire, sell assets to or provide financing to investment vehicles managed by Ares Management or its affiliates and their portfolio companies or purchase assets from, sell assets to, or arrange financing from any such investment vehicles and their portfolio companies. Any such transactions will require approval by a majority of our independent directors. There can be no assurance that any procedural protections will be sufficient to ensure that these transactions will be made on terms that will be at least as favorable to us as those that would have been obtained in an arm’s-length transaction.
Ares warehouse line.
Ares Management maintains a $200 million real estate debt warehouse investment vehicle that holds Ares Management originated real estate loans, which are made available to us and other Ares managed investment vehicles to purchase. Although our Manager will approve the purchase of such loans only on terms, including the consideration to be paid, that are determined by our Manager in good faith to be appropriate for us, it is possible that the interests of Ares Management could be in conflict with ours and the interests of our stockholders. Our opportunity to purchase loans from such vehicle may be on different and potentially less favorable economic terms than other Ares managed vehicles if our Manager deems such purchase as being otherwise in our best interests.
Fees and expenses.
We will be responsible for our proportionate share of certain fees and expenses, including due diligence costs, as determined by our Manager and Ares Management, including legal, accounting and financial advisor fees and related costs, incurred in connection with evaluating and consummating investment opportunities, regardless of whether such transactions are ultimately consummated by the parties thereto.
The ability of our Manager and its officers and employees to engage in other business activities may reduce the time our Manager spends managing our business and may result in certain conflicts of interest.
Certain of our officers and directors, and the officers and other personnel of our Manager, also serve or may serve as officers, directors or partners of Ares Management, as well as Ares Management sponsored investment vehicles, including new affiliated potential pooled investment vehicles or managed accounts not yet established, whether managed or sponsored by Ares Management’s affiliates or our Manager. Accordingly, the ability of our Manager and its officers and employees to engage in other business activities may reduce the time our Manager spends managing our business. These activities could be viewed as creating a conflict of interest insofar as the time and effort of the professional staff of our Manager and its officers and employees will not be devoted exclusively to our business; instead it will be allocated between our business and the management of these other investment vehicles.
In the course of our investing activities, we will pay base management fees to our Manager and will reimburse our Manager for certain expenses it incurs. As a result, investors in our common stock will invest on a “gross” basis and receive distributions on a “net” basis after expenses, resulting in, among other things, a lower rate of return than one might achieve through direct investments. As a result of this arrangement, our Manager’s interests may be less aligned with our interests.
Our Management Agreement with our Manager was not negotiated on an arm’s-length basis and may not be as favorable to us as if it had been negotiated with an unaffiliated third party.
We rely completely on our Manager to provide us with investment advisory services. Our executive officers also serve as officers of our Manager. Our Management Agreement was negotiated between related parties and its terms, including fees payable, may not be as favorable to us as if it had been negotiated with an unaffiliated third party.
We will pay our Manager substantial base management fees regardless of the performance of our portfolio. Our Manager’s entitlement to a base management fee, which is not based upon performance metrics or goals, might reduce its incentive to devote its time and effort to seeking investments that provide attractive risk-adjusted returns for our portfolio. This in turn could hurt both our ability to make distributions to our stockholders and the market price of our common stock.
The current term of our Management Agreement expires on May 1,
2019
. Thereafter, the Management Agreement automatically renews for one-year terms unless terminated upon 180 days’ written notice prior to the expiration of the then current term in accordance with its terms. If the Management Agreement is terminated and no suitable replacement is found to manage us, we may not be able to continue to execute our investment strategy.
10
Terminating our Management Agreement for unsatisfactory performance of the Manager or electing not to renew the Management Agreement may be difficult and terminating the agreement in certain circumstances requires payment of a substantial termination fee.
Terminating our Management Agreement without cause is difficult and costly. Our independent directors will review our Manager’s performance and the management fees annually and, upon 180 days’ written notice prior to the expiration of any renewal term, the Management Agreement may be terminated upon the affirmative vote of at least two-thirds of our independent directors based upon: (a) our Manager’s unsatisfactory performance that is materially detrimental to us; or (b) a determination that the management fees payable to our Manager are not fair, subject to our Manager’s right to prevent termination based on unfair fees by accepting a reduction of management fees agreed to by at least two-thirds of our independent directors. Additionally, upon any such termination, the Management Agreement provides that we will pay our Manager a termination fee equal to three times the sum of the average annual base management fee and incentive fee received by our Manager during the 24-month period before such termination, calculated as of the end of the most recently completed fiscal quarter. This provision increases the cost to us of terminating the Management Agreement and adversely affects our ability to terminate our Manager without cause.
The incentive fee payable to our Manager under the Management Agreement may cause our Manager to select investments in riskier assets to increase its incentive compensation.
Our Manager is entitled to receive incentive compensation based upon our achievement of targeted levels of Core Earnings. “Core Earnings” is defined in our Management Agreement as net income (loss) computed in accordance with generally accepted accounting principles (“GAAP”), excluding non-cash equity compensation expense, the incentive fee, depreciation and amortization (to the extent that any of our target investments are structured as debt and we foreclose on any properties underlying such debt), any unrealized gains, losses or other non-cash items recorded in net income (loss) for the period, regardless of whether such items are included in other comprehensive income or loss, or in net income (loss), and one-time events pursuant to changes in GAAP and certain non-cash charges after discussions between our Manager and our independent directors and after approval by a majority of our independent directors. For the
years ended December 31, 2018, 2017 and 2016
,
$1.2 million
, $381 thousand and $348 thousand of incentive fees were incurred, respectively. In evaluating investments and other management strategies, the opportunity to earn incentive fees based on Core Earnings may lead our Manager to place undue emphasis on the maximization of Core Earnings at the expense of other criteria, such as preservation of capital, in order to achieve higher incentive compensation. Investments with higher yield potential are generally riskier or more speculative. This could result in increased risk to the value of our investment portfolio.
Our Manager manages our portfolio in accordance with very broad investment guidelines and our board of directors does not approve each investment and financing decision made by our Manager, which may result in us making riskier investments than those currently comprising our investment portfolio.
While our directors periodically review our investment portfolio, they do not review all of our proposed investments. In addition, in conducting periodic reviews, our directors may rely primarily on information provided to them by our Manager. Our investment guidelines may be changed from time to time. Furthermore, our Manager may use complex strategies and transactions entered into by our Manager that may be difficult or impossible to unwind by the time they are reviewed by our directors. Our Manager has great latitude in determining the types of assets that are proper investments for us, which could result in investment returns that are substantially below expectations or that result in losses, which would materially and adversely affect our business operations and results. In addition, our Manager is not subject to any limits or proportions with respect to the mix of target investments that we originate or acquire other than as necessary to maintain our qualification as a REIT and our exemption from registration under the 1940 Act. Decisions made and investments entered into by our Manager may not fully reflect your best interests.
Our Manager may change its investment process, or elect not to follow it, without stockholder consent at any time, which may adversely affect our investments.
Our Manager may change its investment process without stockholder consent at any time. In addition, there can be no assurance that our Manager will follow its investment process in relation to the identification and underwriting of prospective investments. Changes in our Manager’s investment process may result in inferior, among other things, due diligence and underwriting standards, which may adversely affect the performance of our portfolio.
11
We do not have a policy that expressly prohibits our directors, officers, stockholders or affiliates from engaging for their own account in business activities of the types conducted by us.
We do not have a policy that expressly prohibits our directors, officers, stockholders or affiliates from engaging for their own account in business activities of the types conducted by us. However, our code of business conduct and ethics contains a conflicts of interest policy that prohibits our directors and officers, as well as employees of our Manager from engaging in any transaction that involves an actual conflict of interest with us without the approval of the audit committee of our board of directors. In addition, our Management Agreement does not prevent our Manager and its affiliates from engaging in additional management or investment opportunities, some of which could compete with us, and our code of business conduct and ethics acknowledges that such activities shall not be deemed a conflict of interest.
Our Manager is subject to extensive regulation as an investment adviser, which could adversely affect its ability to manage our business.
Our Manager is subject to regulation as an investment adviser by various regulatory authorities that are charged with protecting the interests of its clients, including us. Instances of criminal activity and fraud by participants in the investment management industry and disclosures of trading and other abuses by participants in the financial services industry have led the U.S. Government and regulators to consider increasing the rules and regulations governing, and oversight of, the U.S. financial system. This activity is expected to result in changes to the laws and regulations governing the investment management industry and more aggressive enforcement of the existing laws and regulations. Our Manager could be subject to civil liability, criminal liability, or sanction, including revocation of its registration as an investment adviser, revocation of the licenses of its employees, censures, fines, or temporary suspension or permanent bar from conducting business, if it is found to have violated any of these laws or regulations. Any such liability or sanction could adversely affect our Manager’s ability to manage our business. Our Manager must continually address conflicts between its interests and those of its clients, including us. In addition, the SEC and other regulators have increased their scrutiny of potential conflicts of interest. Our Manager has procedures and controls that are reasonably designed to address these issues. However, appropriately dealing with conflicts of interest is complex and difficult and if our Manager fails, or appears to fail, to deal appropriately with conflicts of interest, it could face litigation or regulatory proceedings or penalties, any of which could adversely affect its ability to manage our business.
We may not replicate Ares Management’s historical performance.
We cannot assure you that we will replicate Ares Management’s historical performance, and we caution you that our investment returns could be substantially lower than the returns achieved by other entities managed by Ares Management or its affiliates.
In addition to other analytical tools, our Manager may utilize financial models to evaluate commercial mortgage loans and CRE-related debt instruments, the accuracy and effectiveness of which cannot be guaranteed.
In addition to other analytical tools, our Manager may utilize financial models to evaluate commercial mortgage loans and CRE-related debt instruments, the accuracy and effectiveness of which cannot be guaranteed. In all cases, financial models are only estimates of future results which are based upon assumptions made at the time that the projections are developed. There can be no assurance that our Manager’s projected results will be attained and actual results may vary significantly from the projections. General economic and industry-specific conditions, which are not predictable, can have an adverse impact on the reliability of projections.
We do not own the Ares name, but we may use the name pursuant to a license agreement with Ares Management. Use of the name by other parties or the termination of our license agreement may harm our business.
We have entered into a license agreement with Ares Management pursuant to which it has granted us a non-exclusive, royalty-free license to use the name “Ares.” Under this agreement, we have a right to use this name for so long as ACREM serves as our Manager pursuant to the Management Agreement. Ares Management retains the right to continue using the “Ares” name. We cannot preclude Ares Management from licensing or transferring the ownership of the “Ares” name to third parties, some of whom may compete with us. Consequently, we would be unable to prevent any damage to goodwill that may occur as a result of the activities of Ares Management or others. Furthermore, in the event that the license agreement is terminated, we will be required to change our name and cease using the name. Any of these events could disrupt our recognition in the market place, damage any goodwill we may have generated and otherwise harm our business. The license agreement terminates upon expiration of the Management Agreement and may also be terminated by either party without penalty upon 180 days’ written notice to the other party.
12
Our Manager’s and Ares Management’s liability is limited under the Management Agreement, and we have agreed to indemnify our Manager against certain liabilities. As a result, we could experience poor performance or losses for which our Manager would not be liable.
Pursuant to the Management Agreement, our Manager does not assume any responsibility other than to render the services called for thereunder and will not be responsible for any action of our board of directors in following or declining to follow its advice or recommendations. Under the terms of the Management Agreement, our Manager, its officers, members, managers, directors, personnel, any person controlling or controlled by our Manager, including Ares Management, and any person providing services to our Manager will not be liable to us, any subsidiary of ours, our stockholders or partners or any subsidiary’s stockholders or partners for acts or omissions performed in accordance with and pursuant to the Management Agreement, except by reason of acts constituting bad faith, willful misconduct, gross negligence, or reckless disregard of their duties under the Management Agreement. In addition, we have agreed to indemnify our Manager, its officers, stockholders, members, managers, directors, personnel, any person controlling or controlled by our Manager and any person providing services to our Manager with respect to all expenses, losses, damages, liabilities, demands, charges and claims arising from acts of our Manager not constituting bad faith, willful misconduct, gross negligence, or reckless disregard of duties, performed in good faith in accordance with and pursuant to the Management Agreement.
RISKS RELATED TO OUR COMPANY GENERALLY
Our board of directors may change our investment strategy or guidelines, financing strategy or leverage policies without stockholder consent.
Our board of directors may change our investment strategy or guidelines, financing strategy or leverage policies with respect to investments, originations, acquisitions, growth, operations, indebtedness, capitalization and distributions at any time without the consent of our stockholders, which could result in an investment portfolio with a different risk profile than that of our current investment portfolio or of a portfolio comprised of our target investments. A change in our investment strategy may increase our exposure to interest rate risk, default risk and real estate market fluctuations. Furthermore, a change in our asset allocation could result in our making investments in asset categories different from those described in this annual report. These changes could adversely affect our financial condition, results of operations, the market price of our common stock and our ability to make distributions to our stockholders.
Changes in laws or regulations governing our operations, changes in the interpretation thereof or newly enacted laws or regulations and any failure by us to comply with these laws or regulations, could require changes to certain of our business practices, negatively impact our operations, cash flow or financial condition, impose additional costs on us or otherwise adversely affect our business.
We are subject to regulation by laws and regulations at the local, state and federal levels. These laws and regulations, as well as their interpretation, may change from time to time, and new laws and regulations may be enacted. Accordingly, any change in these laws or regulations, changes in their interpretation, or newly enacted laws or regulations and any failure by us to comply with current or new laws or regulations or such changes thereto, could require changes to certain of our business practices, negatively impact our operations, cash flow or financial condition, impose additional costs on us or otherwise adversely affect our business. Furthermore, if regulatory capital requirements imposed on our private lenders change, they may be required to limit, or increase the cost of, financing they provide to us. In general, this could potentially increase our financing costs and reduce our liquidity or require us to sell assets at an inopportune time or price.
On July 21, 2010, President Obama signed into law the Dodd-Frank Wall Street Reform and Consumer Protection Act (the “Dodd-Frank Act”). Many of the provisions of the Dodd-Frank Act have had extended implementation periods and delayed effective dates and have required extensive rulemaking by regulatory authorities. While many of the rules required to be written have been promulgated, some have not yet been implemented. Although the full impact of the Dodd-Frank Act on us may not be known for an extended period of time, the Dodd-Frank Act, including the rules implementing its provisions and the interpretation of those rules, may negatively impact our operations, cash flows or financial condition, impose additional costs on us, intensify the regulatory supervision of us or otherwise adversely affect our business.
On February 3, 2017, President Trump signed an Executive Order announcing the new Administration’s policy to regulate the U.S. financial system in a manner consistent with certain “Core Principles,” including regulation that is efficient, effective and appropriately tailored. The Executive Order directed the Secretary of the Treasury, in consultation with the heads of the member agencies of the Financial Stability Oversight Council, to report to the President on the extent to which existing laws, regulations and other government policies promote the Core Principles and to identify any laws, regulations or other
13
government policies that inhibit federal regulation of the U.S. financial system. On June 12, 2017, the U.S. Department of the Treasury (“Treasury”) published the first of several reports in response to the Executive Order on the depository system covering banks and other savings institutions. On October 6, 2017, the Treasury released a second report outlining ways to streamline and reform the U.S. regulatory system for capital markets, followed by a third report, on October 26, 2017, examining the current regulatory framework for the asset management and insurance industries. The Treasury released a fourth report on July 31, 2018 describing recommendations relating to non-bank financial institutions, financial technology and innovation. Subsequent reports are expected to address retail and institutional investment products and vehicles. At this time it is unclear what impact the Executive Order and the Administration’s policy will have on regulations that affect our and our competitors’ businesses.
On December 22, 2017, President Trump signed into law Public Law No. 115-97 (the “Tax Cuts and Jobs Act”), which significantly changed the Code, including, a reduction in the corporate income tax rate, a new limitation on the deductibility of interest expense, and significant changes to the taxation of income earned from foreign sources and foreign subsidiaries. The Tax Cuts and Jobs Act also authorizes the Internal Revenue Service (the “IRS”) to issue regulations with respect to the new provisions. We cannot predict how the changes in the Tax Cuts and Jobs Act, or regulations or other guidance issued under it, might affect us or our business.
On May 24, 2018, President Trump signed into law the Economic Growth, Regulatory Relief, and Consumer Protection Act, which increased from $50 billion to $250 billion the asset threshold for designation of “systemically important financial institutions” subject to enhanced prudential standards set by the Federal Reserve, staggering application of this change based on the size and risk of the covered bank holding company. On May 30, 2018, the Federal Reserve voted to consider changes to the Volcker Rule that would loosen compliance requirements for all banks. At this time it is not possible to determine the potential impact of these new laws and proposals on us.
Adoption of the Basel III standards and other proposed supplementary regulatory standards may negatively impact our access to financing or affect the terms of our future financing arrangements.
In response to various financial crises and the volatility of financial markets, the Basel Committee on Banking Supervision adopted the Basel III standards several years ago. The final package of Basel III reforms was approved by the G20 leaders in November 2010. In January 2013, the Basel Committee agreed to delay implementation of the Basel III standards and expanded the scope of assets permitted to be included in a bank’s liquidity measurement. In 2014, the Basel Committee announced that it would propose additional changes to capital requirements for banks over the next few years.
U.S. regulators have elected to implement substantially all of the Basel III standards. Financial institutions will have until 2019 to fully comply with the Basel III standards, which could cause an increase in capital requirements for, and could place constraints on, the financial institutions from which we borrow.
In January 2018, U.S. regulators implemented rules requiring enhanced supplementary leverage ratio standards, which impose capital requirements more stringent than those of the Basel III standards for the most systematically significant banking organizations in the U.S. Adoption and implementation of the Basel III standards and the supplemental regulatory standards adopted by U.S. regulators may negatively impact our access to financing or affect the terms of our future financing arrangements.
In January 2016, the Basel Committee published its revised capital requirements for market risk, known as Fundamental Review of the Trading Book or FRTB, which are expected to generally result in higher global capital requirements for banks that could, in turn, reduce liquidity and increase financing and hedging costs. The impact of FRTB will not be known until after any resulting rules are finalized and implemented by the U.S. federal bank regulatory agencies.
If we do not obtain and maintain the appropriate state licenses, we will not be allowed to originate real estate loans in some states, which could materially and adversely affect us.
State mortgage loan finance licensing laws vary considerably. Many states and the District of Columbia impose a licensing obligation to originate or purchase real estate loans. If we are unable to obtain the appropriate state licenses or do not qualify for an exemption, we could be materially and adversely affected.
If these licenses are obtained, state regulators impose additional ongoing obligations on licensees, such as maintaining certain minimum net worth or line of credit requirements. The minimum net worth requirements vary from state to state. Further, in limited instances, the net worth calculation may not include recourse on any contingent liabilities. If we do not meet these minimum net worth or line of credit requirements or satisfy other criteria, regulators may revoke or suspend our licenses and prevent us from continuing to originate real estate loans, which would materially and adversely affect us.
14
Uncertainty about the financial stability of the United States, China and several countries in Europe could have a significant adverse effect on our business, financial condition and results of operations.
Due to federal budget deficit concerns, S&P (as defined below) downgraded the federal government's credit rating from AAA to AA+ for the first time in history on August 5, 2011. Further, Moody's Investors Service and Fitch Ratings had warned that they may downgrade the federal government's credit rating. Further downgrades or warnings by S&P Global Inc. (“S&P”) or other rating agencies, and the U.S. Government's credit and deficit concerns in general, could cause interest rates and borrowing costs to rise, which may negatively impact both the perception of credit risk associated with our debt portfolio and our ability to access the debt markets on favorable terms. In addition, a decreased U.S. Government credit rating could create broader financial turmoil and uncertainty, which may weigh heavily on our financial performance and the value of our common stock.
In 2010, a financial crisis emerged in Europe, triggered by high budget deficits and rising direct and contingent sovereign debt in Greece, Ireland, Italy, Portugal and Spain, which created concerns about the ability of these nations to continue to service their sovereign debt obligations. While the financial stability of many of such countries has improved significantly, risks resulting from any future debt crisis in Europe or any similar crisis could have a detrimental impact on the global economic recovery, sovereign and non-sovereign debt in these countries and the financial condition of European financial institutions. In June 2016, British voters passed a referendum to exit the European Union leading to heightened volatility in global markets and foreign currencies. Market and economic disruptions have affected, and may in the future affect, consumer confidence levels and spending, personal bankruptcy rates, levels of incurrence and default on consumer debt and home prices, among other factors. We cannot assure you that market disruptions in Europe, including the increased cost of funding for certain governments and financial institutions, will not impact the global economy, and we cannot assure you that assistance packages will be available, or if available, be sufficient to stabilize countries and markets in Europe or elsewhere affected by a financial crisis. To the extent uncertainty regarding any economic recovery in Europe negatively impacts consumer confidence and consumer credit factors, our business, financial condition and results of operations could be significantly and adversely affected.
In the second quarter of 2015, stock prices in China experienced a significant drop, resulting primarily from continued sell-off of shares trading in Chinese markets. In addition, in August 2015, Chinese authorities sharply devalued China’s currency. Since then, the Chinese capital markets have continued to experience periods of instability. These market and economic disruptions have affected, and may in the future affect, the U.S. capital markets, which could adversely affect our business. Additionally, the Federal Reserve has periodically raised the federal funds rate during the period between December 2015 and December 2018, and has announced its intention to continue to raise the federal funds rate over time.
These developments, along with the U.S. Government’s credit and deficit concerns, the European market disruptions and the economic slowdown in China, could cause interest rates and borrowing costs to rise, which may negatively impact our ability to access the debt markets on favorable terms.
Uncertainty relating to the LIBOR calculation process may adversely affect the value of our portfolio of the LIBOR-indexed, floating-rate debt securities or the cost of our borrowings.
Concerns have been publicized that some of the member banks surveyed by the British Bankers' Association (“BBA”) in connection with the calculation of LIBOR across a range of maturities and currencies may have been under-reporting or otherwise manipulating the inter-bank lending rate applicable to them in order to profit on their derivatives positions or to avoid an appearance of capital insufficiency or adverse reputational or other consequences that may have resulted from reporting inter-bank lending rates higher than those they actually submitted. A number of BBA member banks have entered into settlements with their regulators and law enforcement agencies with respect to alleged manipulation of LIBOR, and investigations by regulators and governmental authorities in various jurisdictions are ongoing.
On July 27, 2017, the United Kingdom's Financial Conduct Authority, which regulates LIBOR, announced that it intends to phase out LIBOR by the end of 2021. It is unclear if at that time whether or not LIBOR will cease to exist or if new methods of calculating LIBOR will be established such that it continues to exist after 2021. The U.S. Federal Reserve, in conjunction with the Alternative Reference Rates Committee, a steering committee comprised of large U.S. financial institutions, is considering replacing U.S. dollar LIBOR with a new index calculated by short-term repurchase agreements, backed by Treasury securities. The future of LIBOR at this time is uncertain. Potential changes, or uncertainty related to such potential changes, may adversely affect the market for LIBOR-based loans, including our portfolio of LIBOR-indexed, floating rate loans, or the cost of our borrowings. In addition, changes or reforms to the determination or supervision of LIBOR may result in a sudden or prolonged increase or decrease in reported LIBOR, which could have an adverse impact on the market for
15
LIBOR-based loans, including the value of our portfolio of LIBOR-indexed, floating-rate loans, or the cost of our borrowings. Additionally, if LIBOR ceases to exist, we may need to renegotiate the credit agreements extending beyond 2021 that utilize LIBOR as a factor in determining the interest rate and certain of our existing mortgage loans to replace LIBOR with the new standard that is established.
We are highly dependent on information systems and systems failures could significantly disrupt our business, which may, in turn, negatively affect the market price of our common stock and our ability to pay dividends.
Our business is highly dependent on communications and information systems of Ares Management. Any failure or interruption of Ares Management’s systems could cause delays or other problems in our business, which could have a material adverse effect on our operating results and negatively affect the market price of our common stock and our ability to pay dividends to our stockholders.
Cybersecurity risks and cyber incidents may adversely affect our business or the business of our borrowers by causing a disruption to our operations or the operations of our borrowers, a compromise or corruption of our confidential information or the confidential information of our borrowers and/or damage to our business relationships or the business relationships of our borrowers, all of which could negatively impact the business, financial condition and operating results of us or our borrowers.
A cyber incident is considered to be any adverse event that threatens the confidentiality, integrity or availability of the information resources of us or our borrowers. These incidents may be an intentional attack or an unintentional event and could involve gaining unauthorized access to our information systems or those of our borrowers for purposes of misappropriating assets, stealing confidential information, corrupting data or causing operational disruption. We and our Manager’s employees have been and expect to continue to be the target of fraudulent calls, emails and other forms of activities. The result of these incidents may include disrupted operations, misstated or unreliable financial data, liability for stolen assets or information, increased cybersecurity protection and insurance costs, litigation and damage to our business relationships. The costs related to cyber or other security threats or disruptions may not be fully insured or indemnified by other means. As our and our borrowers’ reliance on technology has increased, so have the risks posed to our information systems, both internal and those provided by Ares Management and third party service providers, and the information systems of our borrowers. Ares Management has implemented processes, procedures and internal controls to help mitigate cybersecurity risks and cyber intrusions, but these measures, as well as our increased awareness of the nature and extent of a risk of a cyber incident, do not guarantee that a cyber incident will not occur and/or that our financial results, operations or confidential information will not be negatively impacted by such an incident. In addition, cybersecurity has become a top priority for regulators around the world, and some jurisdictions have enacted laws requiring companies to notify individuals of data security breaches involving certain types of personal data. If we fail to comply with the relevant laws and regulations, we could suffer financial loss, a disruption of our business, liability to investors, regulatory intervention or reputational damage.
We may not complete our analysis of our internal controls over financial reporting in a timely manner, or our internal controls may not be determined to be effective, which may adversely affect investor confidence in our company and, as a result, the value of our securities.
We may not be able to complete our internal control evaluation, testing and any required remediation in a timely fashion. If we are not able to comply with the applicable requirements of Section 404 of the Sarbanes-Oxley Act of 2002 in a timely manner or with adequate compliance, our operations, financial reporting or financial results could be adversely affected. Matters impacting our internal controls may cause us to be unable to report our financial information on a timely basis and thereby subject us to adverse regulatory consequences, including sanctions by the SEC or violations of applicable stock exchange listing rules, and result in a breach of the covenants under the agreements governing any of our financing arrangements. There could also be a negative reaction in the financial markets due to a loss of investor confidence in us and the reliability of our financial statements. Confidence in the reliability of our financial statements could also suffer if we or our independent registered public accounting firm were to report a material weakness in our internal controls over financial reporting. This could materially adversely affect us and lead to a decline in the price of our securities.
Ineffective internal controls could impact our business and operating results.
Our internal control over financial reporting may not prevent or detect misstatements because of its inherent limitations, including the possibility of human error, the circumvention or overriding of controls, or fraud. Even effective internal controls can provide only reasonable assurance with respect to the preparation and fair presentation of financial statements. If we fail to maintain the adequacy of our internal controls, including any failure to implement required new or
16
improved controls, or if we experience difficulties in their implementation, our business and operating results could be harmed and we could fail to meet our financial reporting obligations.
If we fail to comply with laws, regulations and market standards regarding the privacy, use and security of customer information, we may be subject to legal and regulatory actions and our reputation would be harmed, which would materially adversely affect us.
We receive, maintain and store the non-public personal information of our loan applicants. The technology and other controls and processes designed to secure our customer information and to prevent, detect and remedy any unauthorized access to that information were designed to obtain reasonable, not absolute, assurance that such information is secure and that any unauthorized access is identified and addressed appropriately. Accordingly, such controls may not have detected, and may in the future fail to prevent or detect, unauthorized access to our borrower information. If this information is inappropriately accessed and used by a third party or an employee for illegal purposes, such as identity theft, we may be responsible to the affected applicant or borrower for any losses he or she may have incurred as a result of misappropriation. In such an instance, we may be liable to a governmental authority for fines or penalties associated with a lapse in the integrity and security of our customers’ information, which could materially adversely affect us.
RISKS RELATED TO SOURCES OF FINANCING AND HEDGING
We may incur significant debt, which may subject us to increased risk of loss and may reduce cash available for distributions to our stockholders.
We borrow funds under the Financing Agreements and the CLO Securitization. As of December 31,
2018
, we had approximately
$888.0 million
of outstanding borrowings under the Financing Agreements and $272.9 million outstanding under the CLO Securitization. Subject to market conditions and availability, we may incur significant debt through bank credit facilities (including term loans and revolving facilities), repurchase agreements, warehouse facilities and structured financing arrangements, public and private debt issuances and derivative instruments, in addition to transaction or asset specific funding arrangements. The percentage of leverage we employ will vary depending on our available capital, our ability to obtain and access financing arrangements with lenders, debt restrictions contained in those financing arrangements and the lenders’ and rating agencies’ estimate of the stability of our investment portfolio’s cash flow. We may significantly increase the amount of leverage we utilize at any time without approval of our board of directors. In addition, we may leverage individual assets at substantially higher levels. Incurring substantial debt could subject us to many risks that, if realized, would materially and adversely affect us, including the risk that:
|
•
|
our cash flow from operations may be insufficient to make required payments of principal of and interest on the debt or we may fail to comply with all of the other covenants contained in the debt, which is likely to result in (a) acceleration of such debt (and any other debt containing a cross-default or cross-acceleration provision) that we may be unable to repay from internal funds or to refinance on favorable terms, or at all, (b) our inability to borrow unused amounts under our financing arrangements, even if we are current in payments on borrowings under those arrangements, and/or (c) the loss of some or all of our assets to foreclosure or sale;
|
|
•
|
our debt may increase our vulnerability to adverse economic and industry conditions with no assurance that investment yields will increase with higher financing costs;
|
|
•
|
we may be required to dedicate a substantial portion of our cash flow from operations to payments on our debt, thereby reducing funds available for operations, future business opportunities, stockholder distributions or other purposes;
|
|
•
|
we are not able to refinance debt that matures prior to the investment it was used to finance on favorable terms, or at all; and
|
|
•
|
as the holder of the subordinated classes of a securitization, we may be required to absorb losses.
|
There can be no assurance that our leveraging strategy will be successful.
17
The Financing Agreements impose, and any additional lending facilities will impose, restrictive covenants and other restrictions.
We borrow funds under the Financing Agreements. The documents that govern the Financing Agreements and our securitizations contain, and any additional lending facilities would be expected to contain, customary negative covenants and other financial and operating covenants, that among other things, may affect our ability to incur additional debt, make certain investments or acquisitions, reduce liquidity below certain levels, make distributions to our stockholders, redeem debt or equity securities, make other restricted payments, impose asset concentration limits, impact our flexibility to determine our operating policies and investment strategies. For example, certain of the Financing Agreements contain negative covenants that limit, among other things, our ability to repurchase our common stock, distribute more than a certain amount of our net income to our stockholders, employ leverage beyond certain amounts, sell assets, engage in mergers or consolidations, grant liens, and enter into transactions with affiliates (including amending the Management Agreement in a material respect). Certain of the restrictive covenants that apply to the Financing Agreements are further described in Note
4
to our consolidated financial statements included in this annual report on Form 10-K. If we fail to meet or satisfy any of these covenants, we would be in default under these agreements, and our lenders could elect to declare outstanding amounts due and payable, terminate their commitments, require the posting of additional collateral, including cash to satisfy margin calls, and enforce their interests against existing collateral. We are also subject to cross-default and acceleration rights and, with respect to collateralized debt, the posting of additional collateral, including cash to satisfy margin calls, and foreclosure rights upon default. Further, these restrictions could also make it difficult for us to satisfy the qualification requirements necessary to maintain our status as a REIT.
Monetary policy actions by the U.S. Federal Reserve could adversely impact our financial condition.
We are affected by the fiscal and monetary policies of the U.S. Government and its agencies, including the policies of the Federal Reserve, which regulates the supply of money and credit in the United States. The Federal Reserve raised the federal funds rate nine times during the period between December 2015 and December 2018, and has announced its intention to determine what future adjustments are appropriate to the federal funds rate over time. Changes in the federal funds rate as well as the other policies of the Federal Reserve affect interest rates, which have a significant impact on the demand for CRE loans. Changes in fiscal and monetary policies are beyond our control, are difficult to predict and could materially adversely affect us.
Fluctuations in interest rates and credit spreads could increase our financing costs and reduce our ability to generate income on our investments, each of which could lead to a significant decrease in our results of operations, cash flows and the market value of our investments.
Our primary interest rate exposures will relate to the yield on our investments and the financing cost of our debt as well as our interest rate swaps that we may utilize for hedging purposes. Changes in interest rates and credit spreads may affect our net interest margin, which is the difference between the interest income we earn on our interest-earning investments and the interest expense we incur in financing these investments. Fluctuations in interest rates and credit spreads resulting in our interest expense exceeding interest income would result in operating losses for us. Changes in the level of interest rates and credit spreads also may affect our ability to invest in investments, the value of our investments and our ability to realize gains from the disposition of assets. Changes in interest rates and credit spreads may also negatively affect demand for loans and could result in higher borrower default rates.
To the extent that our financing costs will be determined by reference to floating rates, such as LIBOR or a Treasury index, plus a margin, the amount of such costs will depend on a variety of factors, including, without limitation, (a) for collateralized debt, the value and liquidity of the collateral, and for non-collateralized debt, our credit, (b) the level and movement of interest rates, and (c) general market conditions and liquidity. Market credit spread over LIBOR is affected similarly by changes in LIBOR spreads. In a period of rising interest rates or widening credit spreads, our interest expense on floating rate debt would increase, while any additional interest income we earn on our floating rate investments may be subject to caps or may be subject to a tighter credit spread and as a result may not compensate for such increase in interest expense. At the same time, the interest income we earn on our fixed rate investments would not change, the duration and weighted average life of our fixed rate investments would increase and the market value of our fixed rate investments would decrease. Similarly, in a period of declining interest rates or tightening credit spreads, our interest income on floating rate investments would decrease, while any decrease in the interest we are charged on our floating rate debt may be subject to floors and not compensate for such decrease in interest income or tightened credit spread. Additionally, the interest we are charged on our fixed rate debt would not change. Any such scenario could materially and adversely affect us.
Our operating results will depend, in part, on differences between the income earned on our investments, net of credit losses, and our financing costs. The yields we earn on our floating-rate assets and our borrowing costs tend to move in the same
18
direction in response to changes in interest rates and credit spreads. However, one can rise or fall faster than the other, causing our net interest margin or our credit spreads to expand or contract. In addition, we could experience reductions in the yield on our investments and an increase in the cost of our financing. Although we seek to match the terms of our liabilities to the expected lives of loans that we acquire or originate, circumstances may arise in which our liabilities are shorter in duration than our assets, resulting in their adjusting faster in response to changes in interest rates and credit spreads. For any period during which our investments are not match-funded, the income earned on such investments may respond more slowly to interest rate and credit spread fluctuations than the cost of our borrowings. Consequently, changes in interest rates and credit spreads, particularly short-term interest rates and credit spreads, may immediately and significantly decrease our results of operations and cash flows and the market value of our investments.
Significant fluctuations in interest rates and credit spreads as well as protracted periods of increases or decreases in interest rates and credit spreads could adversely affect the operation and income of multifamily and other CRE properties, as well as the demand from investors for CRE debt in the secondary market. In particular, higher interest rates and widening credit spreads tend to decrease the number of loans originated. An increase in interest rates or widening credit spreads could cause refinancing of existing loans to become less attractive and qualifying for a loan to become more difficult. However, a decrease in interest rates or tightening credit spreads will increase the likelihood that certain holdings will be refinanced at lower rates that would negatively impact our earnings.
The Financing Agreements and any bank credit facilities and repurchase agreements that we may use in the future to finance our assets may require us to provide additional collateral or pay down debt.
We borrow funds under the Financing Agreements. We anticipate that we will also utilize additional bank credit facilities or repurchase agreements (including term loans and revolving facilities) to finance our assets if they become available on acceptable terms. Such financing arrangements would involve the risk that the value of the loans or securities pledged or sold by us to the provider of the bank credit facility or repurchase agreement counterparty may decline in value, in which case the lender may require us to provide additional collateral, including cash to satisfy margin calls, or to repay all or a portion of the funds advanced. With respect to certain facilities, subject to certain conditions, our lenders retain the sole discretion over the market value of loans or securities that serve as collateral for the borrowings under such facilities for purposes of determining whether we are required to pay margin to such lenders. We may not have the funds available to repay our debt at that time, which would likely result in defaults unless we are able to raise the funds from alternative sources, which we may not be able to achieve on favorable terms or at all. Posting additional collateral would reduce our liquidity and limit our ability to leverage our assets. If we cannot meet these requirements, the lender could accelerate our indebtedness, increase the interest rate on advanced funds and terminate our ability to borrow funds from it, which could materially and adversely affect our financial condition and ability to implement our investment strategy. In addition, if the lender files for bankruptcy or becomes insolvent, our loans may become subject to bankruptcy or insolvency proceedings, thus depriving us, at least temporarily, of the benefit of these assets. Such an event could restrict our access to bank credit facilities and increase our cost of capital. The providers of bank credit facilities and repurchase agreement financing may also require us to maintain a certain amount of cash or set aside assets sufficient to maintain a specified liquidity position that would allow us to satisfy our collateral obligations. As a result, we may not be able to leverage our assets as fully as we would choose, which could reduce our return on assets. If we are unable to meet these collateral obligations, our financial condition and prospects could deteriorate rapidly.
In addition, if a counterparty to our repurchase transactions defaults on its obligation to resell the underlying security back to us at the end of the transaction term, or if the value of the underlying security has declined as of the end of that term, or if we default on our obligations under the repurchase agreement, we will likely incur a loss on our repurchase transactions.
There can be no assurance that we will be able to obtain additional bank credit facilities or repurchase agreements on favorable terms, or at all.
Our access to sources of financing may be limited and thus our ability to grow our business and to maximize our returns may be adversely affected.
We borrow funds under various financing arrangements and our business requires a significant amount of funding capacity on an interim basis. Subject to market conditions and availability, we may incur significant additional debt through bank credit facilities (including term loans and revolving facilities), repurchase agreements, warehouse facilities and structured financing arrangements, public and private debt issuances and derivative instruments, in addition to transaction or asset specific funding arrangements. We may also issue additional debt or equity securities to fund our growth.
Our access to sources of financing will depend upon a number of factors, over which we have little or no control, including:
19
|
•
|
general economic or market conditions;
|
|
•
|
the market’s view of the quality of our assets;
|
|
•
|
the market’s perception of our growth potential;
|
|
•
|
our current and potential future earnings and cash distributions; and
|
|
•
|
the market price of the shares of our common stock.
|
From time to time, capital markets may experience periods of disruption and instability. For example, between 2008 and 2009, the global capital markets were unstable as evidenced by periodic disruptions in liquidity in the debt capital markets, significant write-offs in the financial services sector, the re-pricing of credit risk in the broadly syndicated credit market and the failure of major financial institutions. Despite actions of the U.S. Government and foreign governments, these events contributed to worsening general economic conditions that materially and adversely impacted the broader financial and credit markets and reduced the availability of debt and equity capital for the market as a whole and financial services firms in particular. While market conditions have largely recovered from the events of 2008 and 2009, there have been continuing periods of volatility, some lasting longer than others. For example, continued uncertainty surrounding the referendum by British voters to exit the European Union and uncertainty between the United States and other countries with respect to trade policies, treaties, and tariffs, among other factors, have caused disruption in the global markets, including the markets in which we participate. There can be no assurance that these market conditions will not continue or worsen in the future.
We will need to periodically access the capital markets to raise cash to fund new investments in excess of our repayments. A prolonged decline in the price of our shares of common stock compared to book value could negatively affect our access to these markets. We have elected and qualified for taxation as a REIT. Among other things, in order to maintain our REIT status, we are generally required to annually distribute to our stockholders an amount equal to at least 90% of our REIT taxable income, and, as a result, such distributions will not be available to fund investment originations. We must continue to borrow from financial institutions and issue additional securities to fund the growth of our investments and to ensure that we can meet ongoing maturities of our outstanding debt. Unfavorable economic or capital market conditions may increase our funding costs, limit our access to the capital markets or could result in a decision by our potential lenders not to extend credit. An inability to successfully access the capital markets could limit our ability to grow our business and fully execute our business strategy and could decrease our earnings, if any. In addition, weakness in the capital and credit markets could adversely affect one or more private lenders and could cause one or more of our private lenders to be unwilling or unable to provide us with financing or to increase the costs of that financing. In addition, if regulatory capital requirements imposed on our private lenders change, they may be required to limit, or increase the cost of, financing they provide to us. In general, this could potentially increase our financing costs and reduce our liquidity or require us to sell assets at an inopportune time or price. No assurance can be given that we will be able to obtain any such financing (including any replacement financing for our current financing arrangements) on favorable terms or at all.
Any warehouse facilities that we may obtain in the future may limit our ability to originate or acquire assets, and we may incur losses if the collateral is liquidated.
We may utilize, if available, warehouse facilities pursuant to which we would accumulate mortgage loans in anticipation of a securitization financing, which assets would be pledged as collateral for such facilities until the securitization transaction is consummated. In order to borrow funds to originate or acquire assets under any future warehouse facilities, we expect that our lenders thereunder would have the right to review the potential assets for which we are seeking financing. We may be unable to obtain the consent of a lender to originate or acquire assets that we believe would be beneficial to us and we may be unable to obtain alternate financing for such assets. In addition, no assurance can be given that a securitization structure would be consummated with respect to the assets being warehoused. If the securitization is not consummated, the lender could demand repayment of the facility, and in the event that we were unable to timely repay, could liquidate the warehoused collateral and we would then have to pay any amount by which the original purchase price of the collateral assets exceeds its sale price, subject to negotiated caps, if any, on our exposure. In addition, regardless of whether the securitization is consummated, if any of the warehoused collateral is sold before the completion, we would have to bear any resulting loss on the sale.
20
We have utilized and may continue to utilize in the future non-recourse long-term securitizations. Such structures may expose us to risks which could result in losses.
We have utilized and, if available, we may utilize in the future non-recourse long-term securitizations of our investments in mortgage loans, especially loan originations, if and when they become available. Prior to any such financing, we may seek to finance these investments with relatively short-term facilities until a sufficient portfolio is accumulated. As a result, we would be subject to the risk that we would not be able to originate or acquire, during the period that any short-term facilities are available, sufficient eligible assets to maximize the efficiency of a securitization. We also would bear the risk that we would not be able to obtain new short-term facilities or would not be able to renew any short-term facilities after they expire should we need more time to seek and originate or acquire sufficient eligible assets for a securitization. In addition, conditions in the capital markets, including volatility and disruption in the capital and credit markets, may not permit a non-recourse securitization at any particular time or may make the issuance of any such securitization less attractive to us even when we do have sufficient eligible assets. While we would intend to retain the unrated equity component of securitizations and, therefore, still have exposure to any investments included in such securitizations, our inability to enter into such securitizations would increase our overall exposure to risks associated with direct ownership of such investments, including the risk of default, as we may have utilized recourse facilities to finance such investments. Our inability to refinance any short-term facilities would also increase our risk because borrowings thereunder would likely be recourse to us as an entity. If we are unable to obtain and renew short-term facilities or to consummate securitizations to finance our investments on a long-term basis, we may be required to seek other forms of potentially less attractive financing or to liquidate assets at an inopportune time or price.
Moreover, we may also suffer losses if the value of the mortgage loans we originate declines prior to securitization. Declines in the value of a mortgage loan can be due to, among other things, changes in interest rates and changes in the credit quality of the loan. In addition, we may suffer a loss due to the incurrence of transaction costs related to executing these transactions. To the extent that we incur a loss executing or participating in future securitizations for the reasons described above or for other reasons, it could materially and adversely impact our business and financial condition.
The securitization process is subject to an evolving regulatory environment that may affect certain aspects of our current business.
The pools of commercial loans that we may originate, securitize or acquire as asset-backed securities and for which we act as special servicer are structures commonly referred to as securitizations. As a result of the dislocation of the credit markets, and in anticipation of more extensive regulation, including regulations promulgated pursuant to the Dodd-Frank Act, the securitization industry has crafted and continues to craft changes to securitization practices, including changes to representations and warranties in securitization transaction documents, new underwriting guidelines and disclosure guidelines. Pursuant to the Dodd-Frank Act, various federal agencies, including the SEC (collectively, “the agencies”) have promulgated regulations with respect to issues that affect securitizations. In August 2014, the SEC adopted amendments to Regulation AB and other rules that impose significant additional disclosure, review and reporting requirements on issuers in connection with registered offerings of asset-backed securities. These rules took effect beginning in late 2014 and throughout 2015, with some provisions taking effect in late 2016. The SEC has indicated that similar disclosure requirements for private offerings of asset-backed securities remain under consideration. In October 2014, the agencies adopted rules that require securitizers in both public and private securitization transactions to retain not less than 5% of the risk associated with the securities, subject to certain exceptions. Compliance with the rules with respect to commercial mortgage-backed securities and other asset-backed securities became a requirement in late 2016. These regulations, and other proposed regulations affecting securitization, could alter the structure of securitizations in the future, pose additional risks to our participation in future securitizations or reduce or eliminate the economic incentives for participating in future securitizations, increase the costs associated with our origination, securitization or acquisition activities, or otherwise increase the risks or costs of our doing business.
We may enter into hedging transactions that could expose us to contingent liabilities in the future.
Subject to maintaining our qualification as a REIT, part of our investment strategy will involve entering into hedging transactions that could require us to fund cash payments in certain circumstances (such as the early termination of the hedging instrument caused by an event of default or other early termination event, or the decision by a counterparty to request margin securities it is contractually owed under the terms of the hedging instrument). The amount due would be equal to the unrealized loss of the open swap positions with the respective counterparty and could also include other fees and charges. These economic losses will be reflected in our results of operations, and our ability to fund these obligations will depend on the liquidity of our assets and access to capital at the time, and the need to fund these obligations could adversely impact our financial condition.
21
Hedging against interest rate or currency exposure may adversely affect our earnings, which could reduce our cash available for distribution to our stockholders.
Subject to maintaining our qualification as a REIT, we may pursue various hedging strategies to seek to reduce our exposure to adverse changes in interest rates or currencies. This hedging activity may vary in scope based on the level and volatility of interest rates, the type of assets held and other changing market conditions. Interest rate hedging may fail to protect or could adversely affect us because, among other things:
|
•
|
interest rate hedging can be expensive, particularly during periods of rising and volatile interest rates;
|
|
•
|
available interest rate hedges may not correspond directly with the interest rate risk for which protection is sought;
|
|
•
|
due to a credit loss, the duration of the hedge may not match the duration of the related liability;
|
|
•
|
the amount of income that a REIT may earn from hedging transactions (other than hedging transactions that satisfy certain requirements of the Code or that are done through a TRS) to offset interest rate losses is limited by U.S. federal income tax provisions governing REITs;
|
|
•
|
the credit quality of the hedging counterparty owing money on the hedge may be downgraded to such an extent that it impairs our ability to sell or assign our side of the hedging transaction; and
|
|
•
|
the hedging counterparty owing money in the hedging transaction may default on its obligation to pay.
|
In addition, we may fail to recalculate, readjust and execute hedges in an efficient manner. Any hedging activity in which we engage may materially and adversely affect our business. Therefore, while we may enter into such transactions seeking to reduce interest rate risks, unanticipated changes in interest rates may result in poorer overall investment performance than if we had not engaged in any such hedging transactions. In addition, the degree of correlation between price movements of the instruments used in a hedging strategy and price movements in the portfolio positions or liabilities being hedged may vary materially. Moreover, for a variety of reasons, we may not seek to establish a perfect correlation between such hedging instruments and the portfolio positions or liabilities being hedged. Any such imperfect correlation may prevent us from achieving the intended hedge and expose us to risk of loss.
Hedging instruments often are not traded on regulated exchanges or guaranteed by an exchange or its clearing house, and involve risks and costs that could result in material losses.
The cost of using hedging instruments increases as the period covered by the instrument increases and during periods of rising and volatile interest rates, we may increase our hedging activity and thus increase our hedging costs. In addition, hedging instruments involve risk since they often are not traded on regulated exchanges or guaranteed by an exchange or its clearing house. Consequently, there are no requirements with respect to record keeping, financial responsibility or segregation of customer funds and positions. Furthermore, the enforceability of agreements underlying hedging transactions may depend on compliance with applicable statutory and commodity and other regulatory requirements and, depending on the identity of the counterparty, applicable international requirements. The business failure of a hedging counterparty with whom we enter into a hedging transaction will most likely result in its default. Default by a party with whom we enter into a hedging transaction may result in the loss of unrealized profits and force us to cover our commitments, if any, at the then current market price. Although generally we will seek to reserve the right to terminate our hedging positions, it may not always be possible to dispose of or close out a hedging position without the consent of the hedging counterparty and we may not be able to enter into an offsetting contract in order to cover our risk. We cannot assure you that a liquid secondary market will exist for hedging instruments purchased or sold, and we may be required to maintain a position until exercise or expiration, which could result in significant losses.
Changes to derivatives regulation imposed by the Dodd-Frank Act could increase our costs of entering into derivative transactions, which could adversely impact our results of operations, financial condition and business.
Through its comprehensive new regulatory regime for derivatives, the Dodd-Frank Act currently imposes, or will impose, mandatory clearing, exchange-trading, recordkeeping, reporting, disclosure, margin and other regulatory requirements on many derivatives transactions (including formerly unregulated over-the-counter derivatives) in which we may engage. The Dodd-Frank Act also creates new categories of regulated market participants, such as “swap dealers,” “security-based swap dealers,” “major swap participants,” and “major security-based swap participants” that are and will be subject to significant
22
new capital, margin, registration, trading, recordkeeping, reporting, disclosure, business conduct and other regulatory requirements. Certain of these requirements remain to be clarified through rulemaking or interpretations by the U.S. Commodity Futures Trading Commission (the “CFTC”), the SEC, the Federal Reserve and other regulators in a regulatory implementation process that has occurred over the past several years and remains to be completed in some areas.
The possible effects of various provisions of the Dodd-Frank Act may be to increase our overall costs of entering into derivatives transactions and/or to reduce the availability of derivatives. In particular, new margin requirements, position limits and capital charges, even if not directly applicable to us, may cause an increase in the pricing of derivatives transactions sold by market participants to whom such requirements apply. Administrative costs, due to new requirements such as registration, recordkeeping, reporting and compliance, even if not directly applicable to us, may also be reflected in higher pricing of derivatives or higher costs of servicing derivatives transactions. New exchange-trading and trade reporting requirements may lead to reductions in the liquidity of derivative transactions, causing higher pricing or reduced availability of derivatives.
In addition, it is possible that we may be determined by a governmental authority to be a swap dealer, major swap participant, security-based swap dealer, major security-based swap participant or otherwise become subject to new entity or transaction level regulation as a result of the Dodd-Frank Act. This additional regulation could lead to significant new costs which could materially adversely affect our business.
Federal bank regulatory authorities and the CFTC have adopted initial and variation margin requirements for swap dealers, security-based swap dealers, major swap participants and major security-based swap participants (“swap entities”), including permissible forms of margin, custodial arrangements and documentation requirements, for uncleared swaps and security-based swaps. As a result, swap entities will be required to collect margin for transactions and positions in uncleared swaps and security-based swaps by financial end users. The new rules became effective for end users on March 1, 2017. The effect of the regulations on us is not fully known at this time. However, these rules may increase the cost of our activity in uncleared swaps and security-based swaps, limit our ability to enter into such swaps or affect our available liquidity, to the extent we are determined to be a financial end user.
In December 2016, the CFTC reproposed rules that would set federal position limits for certain core physical commodity futures, options and swap contracts (“referenced contracts”), and issued final rules on aggregation among entities under common ownership or control, unless an exemption applies, for position limits on certain futures and options contracts that would apply to the proposed position limits on referenced contracts. It is possible that the CFTC could propose to expand such requirements to other types of contracts in the future. The proposal could affect our ability to enter into derivatives transactions if and when the CFTC’s position limits rules become effective.
We may fail to qualify for hedge accounting treatment.
We intend to record derivative and hedging transactions in accordance with Financial Accounting Standards Board (“FASB”) Accounting Standards Codification (“ASC”) 815,
Derivatives and Hedging
(“ASC 815”). Under these standards, we may fail to qualify for hedge accounting treatment for a number of reasons, including if we use instruments that do not meet the FASB ASC 815 definition of a derivative (such as short sales), we fail to satisfy FASB ASC 815 hedge documentation and hedge effectiveness assessment requirements or our instruments are not highly effective. If we fail to qualify for hedge accounting treatment, our operating results may suffer because losses on the derivatives that we enter into may not be offset by a change in the fair value of the related hedged transaction or item.
We may enter into derivative contracts that could expose us to contingent liabilities in the future.
Subject to maintaining our qualification as a REIT, we may enter into derivative contracts that could require us to fund cash payments in the future under certain circumstances (
e.g.
, the early termination of the derivative agreement caused by an event of default or other early termination event, or the decision by a counterparty to request margin securities it is contractually owed under the terms of the derivative contract). The amount due would be equal to the unrealized loss of the open swap positions with the respective counterparty and could also include other fees and charges. These economic losses may materially and adversely affect our business.
23
We are currently exempt from being regulated as a commodity pool operator in part because we comply with certain restrictions regarding our use of certain derivative instruments, and failure to comply with such restrictions could subject us to additional regulation and compliance requirements which could materially adversely affect our business and financial condition.
Rules under the Dodd-Frank Act have established a comprehensive regulatory framework for derivative contracts commonly referred to as “swaps.” Under these rules, any investment fund that trades in swaps may be considered a “commodity pool,” which would cause its directors to be regulated as “commodity pool operators,” or “CPOs.” Unless an exemption is available, a CPO must register with the CFTC and become a member of the National Futures Association (the “NFA”), which requires compliance with NFA’s rules, and renders such CPO subject to regulation by the CFTC, including with respect to disclosure, reporting, recordkeeping and business conduct.
We do not currently invest in any instruments that meet the definition of “swap” under the rules, and we do not currently expect to engage in any speculative derivatives activities or other non-hedging transactions using swaps, futures or options on futures. However, we may use hedging instruments in conjunction with our investment portfolio and related borrowings to reduce or mitigate risks associated with changes in interest rates, mortgage spreads, yield curve shapes, currency fluctuations and market volatility. These hedging instruments could include interest rate swaps, interest rate futures and options on interest rate futures, each of which is considered a “swap” under CFTC rules. We have submitted a claim for relief from any registration requirements pursuant to a no-action letter issued by the CFTC for mortgage REITs. In order to qualify for relief from registration, we are restricted to using swaps within certain specific parameters, including a limitation that our annual income derived from commodity interest trading be less than 5% of our gross annual income and that the initial margin and premiums required to establish commodity interest positions be no more than 5% of the fair market value of our total assets. If we fail to comply with the applicable restrictions, our directors may be compelled to register as CPOs, or we may be required to seek other hedging instruments or techniques at increased cost to us, or that may not be as effective as the use of swaps.
RISKS RELATED TO OUR INVESTMENTS
We will allocate our available capital without input from our stockholders.
You will not be able to evaluate the manner in which our available capital is invested or the economic merit of our expected investments. As a result, we may use our available capital to invest in investments with which you may not agree. Additionally, our investments will be selected by our Manager and our stockholders will not have input into such investment decisions. Both of these factors will increase the uncertainty, and thus the risk, of investing in our securities. The failure of our Manager to apply this capital effectively or find investments that meet our investment criteria in sufficient time or on acceptable terms could result in unfavorable returns, could cause a material adverse effect on our business, financial condition, liquidity, results of operations and ability to make distributions to our stockholders, and could cause the value of our common stock to decline.
Until appropriate investments can be identified, our Manager may invest our available capital in interest-bearing short-term investments, including money market accounts or funds, commercial mortgage-backed securities, or corporate bonds, which are consistent with our intention to qualify as a REIT. These investments are expected to provide a lower net return than we seek to achieve from investments in our target investments. Our Manager intends to conduct due diligence with respect to each investment and suitable investment opportunities may not be immediately available. Even if opportunities are available, there can be no assurance that our Manager’s due diligence processes will uncover all relevant facts or that any investment will be successful.
We cannot assure you that (i) we will be able to enter into definitive agreements to invest in any new investments that meet our investment objective, (ii) we will be successful in consummating any investment opportunities we identify or (iii) one or more investments we may make will yield attractive risk-adjusted returns. Our inability to do any of the foregoing likely would materially and adversely affect our business and our ability to make distributions to our stockholders.
The lack of liquidity in our investments may adversely affect our business.
The illiquidity of our target investments may make it difficult for us to sell such investments if the need or desire arises. Certain target investments such as senior mortgage loans, subordinated debt, preferred equity, mezzanine loans and other CRE investments are also particularly illiquid investments due to their short life, their potential unsuitability for securitization and the greater difficulty of recovery in the event of a borrower’s default. In addition, many of the loans and securities we invest in will not be registered under the relevant securities laws, resulting in a prohibition against their transfer, sale, pledge or disposition except in a transaction that is exempt from the registration requirements of, or otherwise in accordance with, those
24
laws. As a result, we expect many of our investments will be illiquid, and if we are required to liquidate all or a portion of our portfolio quickly, we may realize significantly less than the value at which we have previously recorded investments. Further, we may face other restrictions on our ability to liquidate an investment in a business entity to the extent that we or our Manager has or could be attributed as having material, non-public information regarding such business entity. As a result, our ability to vary our portfolio in response to changes in economic and other conditions may be relatively limited, which could adversely affect our results of operations and financial condition.
Our portfolio is concentrated in a limited number of loans, which subjects us to a risk of significant loss if any of these loans default.
As of December 31,
2018
and
2017
, our portfolio totaled
44
and 42 loans held for investment, respectively. The number of loans in which we are invested may be higher or lower depending on the amount of our assets under management at any given time, market conditions and the extent to which we employ leverage, and will likely fluctuate over time. A consequence of this limited number of investments is that the aggregate returns we realize may be significantly adversely affected if a small number of investments perform poorly, if we need to write down the value of any one investment or if an investment is repaid prior to maturity and we are not able to promptly redeploy the proceeds. We do not have fixed guidelines for diversification, and our investments could be concentrated in relatively few loans.
While we intend to continue to diversify our portfolio of investments in the manner described in our filings with the SEC, we do not have fixed guidelines for diversification. As a result, our investments could be concentrated in relatively few loans and/or relatively few property types. If our portfolio of target investments is concentrated in certain property types that are subject to higher risk of foreclosure, or secured by properties concentrated in a limited number of geographic locations, downturns relating generally to such region or type of asset may result in defaults on a number of our investments within a short time period, which may reduce our net income and the value of our common stock and accordingly reduce our ability to pay dividends to our stockholders.
We may invest in multiple secured loans that share a common sponsor. We do not have a limit on the amount of total gross offering proceeds that can be held by multiple borrowers that share the same sponsor. We may face greater credit risk to the extent a large portion of our portfolio is concentrated in loans to multiple borrowers that share the same sponsor.
A prolonged economic slowdown, a lengthy or severe recession or further declines in real estate values could impair our investments and harm our operations.
We believe the risks associated with our business will be more severe during periods of economic slowdown or recession if these periods are accompanied by declining real estate values. For example, the severe economic downturn that occurred from 2008 through 2009 limited the availability of debt financing in the overall marketplace and generally made leveraged acquisitions and refinancing more difficult. Consequently, our investment model may be adversely affected by prolonged economic downturns or recessions where declining real estate values would likely reduce the level of new mortgage and other real estate-related loan originations, since borrowers often use appreciation in the value of their existing properties to support the purchase or investment in additional properties. Borrowers may also be less able to pay principal and interest on our loans if the value of real estate weakens. Further, declining real estate values significantly increase the likelihood that we will incur losses on our loans in the event of default because the value of our collateral may be insufficient to cover our cost on the loan. Any sustained period of increased payment delinquencies, foreclosures or losses could adversely affect our Manager’s ability to invest in, sell and securitize loans, which would materially and adversely affect our results of operations, financial condition, liquidity and business and our ability to pay dividends to stockholders.
Our real estate investments are subject to risks particular to real property. These risks may result in a reduction or elimination of, or return from, a loan secured by a particular property.
We may own CRE directly in the future as a result of a default of mortgage or other real estate related loans. Real estate investments are subject to various risks, including:
|
•
|
acts of God, including earthquakes, floods and other natural disasters, which may result in uninsured losses;
|
|
•
|
political events, acts of war or terrorism, including the consequences of terrorist attacks;
|
|
•
|
adverse changes in national and local economic and market conditions, including local markets with a significant exposure to the energy sector, which may be affected by the current low prices of oil and related gas that could adversely affect the success of tenants in that industry;
|
25
|
•
|
changes in governmental laws and regulations (including their interpretations), fiscal policies and zoning ordinances and the related costs of compliance with laws and regulations, fiscal policies and ordinances;
|
|
•
|
costs of remediation and liabilities associated with environmental conditions such as indoor mold; and
|
|
•
|
the potential for uninsured or under-insured property losses.
|
If any of these or similar events occurs, it may reduce our return from an affected property or investment and services and reduce or eliminate our ability to pay dividends to our stockholders.
The CRE loans we originate and the mortgage loans underlying any commercial mortgage-backed securities investments that we may make will be subject to the ability of the commercial property owner to generate net income from operating the property, as well as the risks of delinquency and foreclosure.
Our CRE loans are secured by commercial and multifamily properties and are subject to risks of delinquency and foreclosure, and risks of loss that may be greater than similar risks associated with loans made on the security of single-family residential property. The ability of a borrower to repay a loan secured by an income-producing property typically is dependent primarily upon the successful operation of such property rather than upon the existence of independent income or assets of the borrower. If the net operating income of the property is reduced, the borrower’s ability to repay the loan may be impaired. Net operating income of an income-producing property can be adversely affected by, among other things, the following:
|
•
|
tenant mix;
|
|
•
|
success of tenant businesses;
|
|
•
|
property management decisions;
|
|
•
|
property location, condition and design;
|
|
•
|
competition from comparable types of properties;
|
|
•
|
changes in laws that increase operating expenses or limit rents that may be charged;
|
|
•
|
changes in national, regional or local economic conditions and/or specific industry segments, including the credit and securitization markets;
|
|
•
|
declines in regional or local real estate values;
|
|
•
|
changes in local markets in which our tenants operate, including changes in oil and gas prices;
|
|
•
|
declines in regional or local rental or occupancy rates;
|
|
•
|
increases in interest rates, real estate tax rates and other operating expenses;
|
|
•
|
costs of remediation and liabilities associated with environmental conditions;
|
|
•
|
the potential for uninsured or underinsured property losses;
|
|
•
|
the potential for casualty or condemnation loss;
|
|
•
|
changes in governmental laws and regulations, including fiscal policies, zoning ordinances and environmental legislation and the related costs of compliance;
|
|
•
|
changes in supply (resulting from the recent growth in CRE debt funds or otherwise) and demand; and
|
|
•
|
acts of God, terrorist attacks, social unrest and civil disturbances.
|
26
In the event of any default under a mortgage loan held directly by us, we will bear a risk of loss of principal to the extent of any deficiency between the value of the collateral and the principal and accrued interest of the mortgage loan, which could have a material adverse effect on our cash flow from operations and limit amounts available for distribution to our stockholders. In the event of the bankruptcy of a mortgage loan borrower, the mortgage loan to such borrower will be deemed to be secured only to the extent of the value of the underlying collateral at the time of bankruptcy (as determined by the bankruptcy court), and the lien securing the mortgage loan will be subject to the avoidance powers of the bankruptcy trustee or debtor-in-possession to the extent the lien is unenforceable under state law. Foreclosure of a mortgage loan can be an expensive and lengthy process, which could have a substantial negative effect on our anticipated return on the foreclosed mortgage loan.
Prepayment rates may adversely affect the value of our portfolio of assets.
Our net income and earnings may be affected by prepayment rates on our existing CRE loans. In periods of declining interest rates and/or credit spreads, prepayment rates on loans generally increase. If general interest rates or credit spreads decline at the same time, the proceeds of such prepayments received during such periods are likely to be reinvested by us in assets yielding less than the yields on the assets that were prepaid. In addition, the value of our assets may be affected by prepayment rates on loans. If we originate CRE loans, we expect borrowers will prepay at a projected rate generating an expected yield. When borrowers prepay their loans faster than expected, the corresponding prepayments on the CRE loans may reduce the expected yield on such loans.
Prepayment rates on loans may be affected by a number of factors including, but not limited to, the then-current level of interest rates and credit spreads, the availability of mortgage credit, the relative economic vitality of the area in which the related properties are located, the servicing of the loans, possible changes in tax laws, other opportunities for investment, and other economic, social, geographic, demographic and legal factors and other factors beyond our control. Consequently, such prepayment rates cannot be predicted with certainty and no strategy can completely insulate us from prepayment or other such risks.
In addition, principal repayments from mortgage loans in commercial mortgage-backed securities and collateralized loan obligations are applied sequentially, first going to pay down the senior commercial mortgage-backed securities and collateralized loan obligations. Accordingly, we will not receive any proceeds from repayment of loans in commercial mortgage-backed securities or collateralized loan obligations until all senior notes are repaid in full, which could materially and adversely impact our liquidity, capital resources and financial condition.
If we are unable to successfully integrate new assets and manage our growth, our results of operations and financial condition may suffer
.
We have in the past and may in the future significantly increase the size and/or change the mix of our portfolio of assets. We may be unable to successfully and efficiently integrate newly acquired assets into our existing portfolio or otherwise effectively manage our assets or our growth effectively. In addition, increases in our portfolio of assets and/or changes in the mix of our assets may place significant demands on our Manager’s administrative, operational, asset management, financial and other resources. Any failure to manage increases in size effectively could adversely affect our results of operations and financial condition.
We operate in a competitive market for investment opportunities and loan originations and competition may limit our ability to originate or acquire our target investments on attractive terms.
A number of entities compete with us to make the types of investments that we seek to make and originate the types of loans that we seek to originate. Our profitability depends, in large part, on our ability to originate or acquire our target investments on attractive terms. In originating or acquiring our target investments, we compete with a variety of institutional investors, including other REITs, specialty finance companies, public and private funds (including other funds managed by Ares Management), commercial and investment banks, CRE service providers, commercial finance and insurance companies and other financial institutions. Several other REITs have raised, or are expected to raise, significant amounts of capital, and may have investment objectives that overlap with ours, which may create additional competition for investment opportunities. Many of our anticipated competitors are significantly larger than we are and may have considerably greater financial, technical, marketing and other resources than we do. Some competitors may have a lower cost of funds and access to funding sources that are not available to us, such as the U.S. Government. Many of our competitors are not subject to the operating constraints associated with REIT tax compliance or maintenance of an exemption from the 1940 Act. In addition, some of our competitors may have higher risk tolerances or different risk assessments, which could allow them to consider a wider variety of investments, deploy more aggressive pricing and establish more relationships than us. Furthermore, competition for originations of and investments in our target investments may lead to the price of such assets increasing, which may further limit our ability to generate desired returns. We cannot assure you that the competitive pressures we face will not have a
27
material adverse effect on our business, financial condition and results of operations. Also, as a result of this competition, desirable investments in our target investments may be limited in the future and we may not be able to take advantage of attractive investment opportunities from time to time, as we can provide no assurance that we will be able to identify and make investments that are consistent with our investment objectives.
If our Manager overestimates the yields or incorrectly prices the risks of our investments, we may experience losses.
Our Manager values our potential investments based on yields and risks, taking into account estimated future losses on the mortgage loans and the collateral underlying our mortgage loans and included in securitization pools, and the estimated impact of these losses on expected future cash flows and returns. Our Manager’s loss estimates may not prove accurate, as actual results may vary from estimates. If our Manager underestimates the asset-level losses relative to the price we pay for a particular investment, we may experience losses with respect to such investment.
Loans on properties in transition will involve a greater risk of loss than traditional investment-grade mortgage loans with fully insured borrowers.
We may originate transitional loans secured by first lien mortgages on a property to borrowers who are typically seeking short-term capital to be used in an acquisition or rehabilitation of a property. The typical borrower under a transitional loan has usually identified an undervalued asset that has been under-managed and/or is located in a recovering market. If the market in which the asset is located fails to improve according to the borrower’s projections, or if the borrower fails to improve the quality of the asset’s management and/or the value of the asset, the borrower may not receive a sufficient return on the asset to satisfy the transitional loan, and we bear the risk that we may not recover some or all of our investment.
In addition, borrowers usually use the proceeds of a conventional mortgage to repay a transitional loan. Transitional loans therefore are subject to risks of a borrower’s inability to obtain permanent financing to repay the transitional loan. Transitional loans are also subject to risks of borrower defaults, bankruptcies, fraud, losses and special hazard losses that are not covered by standard hazard insurance. In the event of any default under transitional loans that may be held by us, we bear the risk of loss of principal and non-payment of interest and fees to the extent of any deficiency between the value of the mortgage collateral and the principal amount and unpaid interest of the transitional loan. To the extent we suffer such losses with respect to these transitional loans, our net income and the value of our common stock may be adversely affected.
Risks of cost overruns and noncompletion of renovation of the properties underlying short term senior loans on properties in transition may result in significant losses.
The renovation, refurbishment or expansion by a borrower under a mortgaged property involves risks of cost overruns and noncompletion. Estimates of the costs of improvements to bring an acquired property up to standards established for the market position intended for that property may prove inaccurate. Other risks may include rehabilitation costs exceeding original estimates, possibly making a project uneconomical, environmental risks and rehabilitation and subsequent leasing of the property not being completed on schedule. If such renovation is not completed in a timely manner, or if it costs more than expected, the borrower may experience a prolonged impairment of net operating income and may not be able to make payments on our investment, which could result in significant losses.
Investments in non-investment grade rated CRE loans or securities involve increased risk of loss.
Many of our investments will not be rated or will be rated as non-investment grade by the rating agencies. The non-investment grade ratings for these assets typically result from the overall leverage of the loans, the lack of a strong operating history for the properties underlying the loans, the borrowers’ credit history, the underlying properties’ cash flow or other factors. As a result, these investments should be expected to have a higher risk of default and loss than investment grade rated assets. Any loss we incur may be significant and may reduce distributions to our stockholders and adversely affect the market value of our common stock. There are no limits on the percentage of unrated or non-investment grade rated assets we may hold in our investment portfolio.
The B-Notes that we have originated or may originate or acquire in the future may be subject to additional risks related to the privately negotiated structure and terms of the transaction, which may result in losses to us.
We have originated and may continue to originate or acquire B-Notes. A B-Note is a mortgage loan typically (a) secured by a first mortgage on a single large commercial property or group of related properties and (b) subordinated to an A-Note secured by the same first mortgage on the same collateral. As a result, if a borrower defaults, there may not be sufficient funds remaining for B-Note holders after payment to the A-Note holders. Because each transaction is privately
28
negotiated, B-Notes can vary in their structural characteristics and risks. For example, the rights of holders of B-Notes to control the process following a borrower default may vary from transaction to transaction. Further, B-Notes typically are secured by a single property and accordingly reflect the risks associated with significant concentration. Significant losses related to our B-Notes would result in operating losses for us and may limit our ability to make distributions to our stockholders.
Our mezzanine loan assets involve greater risks of loss than senior loans secured by real properties.
We have originated and may continue to originate or acquire mezzanine loans, which take the form of subordinated loans secured by second mortgages on the underlying property or loans secured by a pledge of the ownership interests of either the entity owning the property or a pledge of the ownership interests of the entity that owns the interest in the entity owning the property. These types of assets involve a higher degree of risk than senior mortgage loans secured by real property because the loan may become unsecured as a result of foreclosure by the senior lender. In the event of a bankruptcy of the entity providing the pledge of its ownership interests as security, we may not have full recourse to the assets of such entity or the assets of the entity may not be sufficient to satisfy our mezzanine loan.
In addition, lenders can be subject to lender liability claims for actions taken by them where they become too involved in the borrower's business or exercise control over the borrower. For example, we could become subject to a lender's liability claim, if, among other things, we actually render significant managerial assistance.
If a borrower defaults on our mezzanine loan or debt senior to our loan, or in the event of a borrower bankruptcy, our mezzanine loan will be satisfied only after the senior debt. As a result, we may not recover some or all of our initial expenditure. In addition, mezzanine loans may have higher loan-to-value ratios than conventional mortgage loans, resulting in less equity in the property and increasing the risk of loss of principal. Significant losses related to our mezzanine loans would result in operating losses for us and may limit our ability to make distributions to our stockholders.
Investments in preferred equity involve a greater risk of loss than traditional debt financing.
We invest in and may continue to invest in real estate preferred equity, which involves a higher degree of risk than first mortgage loans due to a variety of factors, including the risk that, similar to mezzanine loans, such investments are subordinate to first mortgage loans and are not collateralized by property underlying the investment. Unlike mezzanine loans, preferred equity
investments generally do not have
a pledge of the ownership interests of the entity that owns the interest in the entity owning the property. Although as a holder of preferred equity we may enhance our position with covenants that limit the activities of the entity in which we hold an interest and protect our equity by obtaining an exclusive right to control the underlying property after an event of default, should such a default occur on our investment, we would only be able to proceed against the entity in which we hold an interest, and not the property owned by such entity and underlying our investment. As a result, we may not recover some or all of our investment.
Any credit ratings assigned to our investments will be subject to ongoing evaluations and revisions and we cannot assure you that those ratings will not be downgraded.
Some of our investments, including the notes issued in our securitization transactions for which we are required to retain a portion of the credit risk, may be rated by rating agencies such as Moody’s Investors Service, Fitch Ratings, Standard & Poor’s, DBRS, Inc. or Realpoint LLC. Any credit ratings on our investments are subject to ongoing evaluation by credit rating agencies, and we cannot assure you that any such ratings will not be changed or withdrawn by a rating agency in the future if, in its judgment, circumstances warrant. If rating agencies assign a lower-than-expected rating or reduce or withdraw, or indicate that they may reduce or withdraw, their ratings of our investments in the future, the value of our investments could significantly decline, which would adversely affect the value of our investment portfolio and could result in losses upon disposition or the failure of borrowers to satisfy their debt service obligations to us.
We may experience a decline in the fair value of our assets.
A decline in the fair market value of our assets may require us to recognize an “other-than-temporary” impairment against such assets under GAAP, if we were to determine that, with respect to any assets in unrealized loss positions, we do not have the ability and intent to hold such assets to maturity or for a period of time sufficient to allow for recovery to the original acquisition cost of such assets. If such a determination were to be made, we will record an allowance to reduce the carrying value of the loan to the present value of expected future cash flows discounted at the loan’s contractual effective rate or the fair value of the collateral, if repayment is expected solely from the collateral. Such impairment charges reflect non-cash losses at the time of recognition; subsequent disposition or sale of such assets could further affect our future losses or gains, as they are based on the difference between the sale price received and adjusted amortized cost of such assets at the time of sale. If we
29
experience a decline in the fair value of our assets, our results of operations, financial condition and our ability to make distributions to our stockholders could be materially and adversely affected.
Some of our portfolio investments may be recorded at fair value and, as a result, there will be uncertainty as to the value of these investments.
Some of our portfolio investments may be in the form of positions or securities that are not publicly traded. The fair value of securities and other investments that are not publicly traded may not be readily determinable. Currently, we do not have any financial instruments recorded at fair value on a recurring basis in our consolidated financial statements. We have not elected the fair value option for the remaining financial instruments, including loans held for investment, the Financing Agreements and securitization debt. Such financial instruments are carried at cost. For loans held for investment that are evaluated for impairment at least quarterly, we estimate the fair value of the instrument, which may include unobservable inputs. Because such valuations are subjective, the fair value of certain of our assets may fluctuate over short periods of time and our determinations of fair value may differ materially from the values that would have been used if a ready market for these securities existed. The value of our common stock could be adversely affected if our determinations regarding the fair value of these investments were materially higher than the values that we ultimately realize upon their disposal.
Additionally, our results of operations for a given period could be adversely affected if our determinations regarding the fair value of these investments were materially higher than the values that we ultimately realize upon their disposal.
In addition, in June 2016, the FASB issued ASU No. 2016-13,
Financial Instruments - Credit Losses (Topic 326): Measurement of Credit Losses on Financial Instruments
. The standard will replace the incurred loss impairment methodology pursuant to GAAP with a methodology that reflects expected credit losses and requires consideration of a broader range of reasonable and supportable information to inform credit loss estimates. Under the CECL model, which will become effective for us for fiscal years beginning after December 15, 2019 and for interim periods within those fiscal years, we will be required to present certain financial assets carried at amortized cost, such as loans held for investment, at the net amount expected to be collected. The measurement of expected credit losses is to be based on information about past events, including historical experience, current conditions, and reasonable and supportable forecasts that affect the collectability of the reported amount. This measurement will take place at the time the financial asset is first added to the balance sheet and updated quarterly thereafter. This differs from the “incurred loss” model required under current GAAP, which delays recognition until it is probable a loss has been incurred. Accordingly, the adoption of the CECL model may affect how we determine our allowance for loan losses and could require us to increase our allowance and recognize provisions for loan losses earlier in the lending cycle. Moreover, the CECL model may create more volatility in the level of our allowance for loan losses. If we are required to increase our level of allowance for loan losses for any reason, such increase may affect our business, financial condition and results of operations.
If we invest in commercial mortgage-backed securities, such investments would pose additional risks, including the risks of the securitization process and the risk that the special servicer may take actions that could adversely affect our interests.
We may acquire existing commercial mortgage-backed securities (“CMBS”), including in the most subordinated classes of such commercial mortgage-backed securities and collateralized loan obligations (“CLO”). In general, losses on a mortgaged property securing a mortgage loan included in a securitization will be borne first by the equity holder of the property, then by a cash reserve fund or letter of credit, if any, then by the holder of a mezzanine loan or B-Note, if any, then by the “first loss” subordinated stockholder and then by the holder of a higher-rated security. In the event of default and the exhaustion of any equity support, reserve fund, letter of credit, mezzanine loans or B-Notes, and any classes of securities junior to those in which we invest, we will not be able to recover all of our investment in the securities we purchase. In addition, if the underlying mortgage portfolio has been overvalued by the originator, or if the values subsequently decline and, as a result, less collateral value is available to satisfy interest and principal payments due on the related mortgage-backed securities. The prices of lower credit quality securities are generally less sensitive to interest rate changes than more highly rated investments, but more sensitive to adverse economic downturns or individual issuer developments. A projection of an economic downturn, for example, could cause a decline in the price of lower credit quality CMBS and CLOs because the ability of borrowers to make principal and interest payments on the mortgages or loans underlying such securities may be impaired, as had occurred throughout the global financial crisis.
Subordinate interests such as CLOs and similar structured finance investments generally are not actively traded and are relatively illiquid investments and volatility in CLO trading markets may cause the value of these investments to decline. In addition, if the underlying mortgage portfolio has been overvalued by the originator, or if the values subsequently decline and, as a result, less collateral value is available to satisfy interest and principal payments and any other fees in connection with the
30
trust or other conduit arrangement for such securities, amounts that would otherwise be used to make payments on the subordinate securities will be used to repay principal on the more senior securities to the extent necessary to satisfy any senior note overcollateralization ratio and we may incur significant losses.
With respect to the CMBS and CLOs in which we may invest, overall control over the special servicing of the related underlying mortgage loans will be held by a “directing certificateholder” or a “controlling class representative,” which is appointed by the holders of the most subordinated class of commercial mortgage-backed securities in such series. Unless we acquire the subordinate classes of existing series of CMBS and CLOs, we will not have the right to appoint the directing certificateholder. In connection with the servicing of the specially serviced mortgage loans, the related special servicer may, at the direction of the directing certificateholder, take actions with respect to the specially serviced mortgage loans that could adversely affect our interests.
Real estate valuation is inherently subjective and uncertain.
The valuation of real estate and, therefore, the valuation of collateral underlying CRE loans made by us, is inherently subjective due to, among other factors, the individual nature of each property, its location, its expected future rental revenues and the valuation methodology adopted. The valuations of our real estate assets may not be precise and may be based on assumptions and methodologies that are inaccurate. Our valuations of our collateral properties may be wrong and we may incur losses.
We may invest in non-performing real estate loans and participations.
During an economic downturn or recession, securities of financially troubled or operationally troubled issuers are more likely to go into default than securities of other issuers. Securities of financially troubled issuers and operationally troubled issuers are less liquid and more volatile than securities of companies not experiencing these difficulties. The market prices of such securities are subject to erratic and abrupt market movements and the spread between bid and ask prices may be greater than normally expected. Investment in the securities of financially troubled issuers and operationally troubled issuers involves a high degree of credit and market risk.
In certain limited cases (e.g., in connection with a workout, restructuring and/or foreclosing proceedings involving one or more of our debt investments), the success of our investment strategy with respect thereto will depend, in part, on our ability to effectuate loan modifications and/or restructures. The activity of identifying and implementing any such restructuring programs entails a high degree of uncertainty. There can be no assurance that we will be able to successfully identify and implement such restructuring programs. Further, such modifications and/or restructuring may entail, among other things, a substantial reduction in the interest rate and a substantial writedown of the principal of such loan, debt securities or other interests. However, even if a restructuring were successfully accomplished, a risk exists that, upon maturity of such real estate loan, debt securities or other interests replacement “takeout” financing will not be available.
These financial difficulties may never be overcome and may cause borrowers to become subject to bankruptcy or other similar administrative and operating proceedings. There is a possibility that we may incur substantial or total losses on our investments and in certain circumstances, become subject to certain additional potential liabilities that may exceed the value of our original investment therein. For example, under certain circumstances, a lender who has inappropriately exercised control over the management and policies of a debtor may have its claims subordinated or disallowed or may be found liable for damages suffered by parties as a result of such actions. In any reorganization or liquidation proceeding relating to our investments, we may lose our entire investment, may be required to accept cash or securities with a value less than our original investment and/or may be required to accept payment over an extended period of time. In addition, under certain circumstances, payments to us and distributions by us to the stockholders may be reclaimed if any such payment or distribution is later determined to have been a fraudulent conveyance, preferential payment or similar transaction under applicable bankruptcy and insolvency laws. Furthermore, bankruptcy laws and similar laws applicable to administrative proceedings may delay our ability to realize value on collateral for loan positions held by us or may adversely affect the priority of such loans through doctrines such as equitable subordination or may result in a restructure of the debt through principles such as the “cramdown” provisions of the bankruptcy laws.
Insurance on mortgage loans and real estate securities collateral may not cover all losses.
There are certain types of losses, generally of a catastrophic nature, such as earthquakes, floods, hurricanes, terrorism or acts of war, which may be uninsurable or not economically insurable. Inflation, changes in building codes and ordinances, environmental considerations and other factors, including terrorism or acts of war, also might result in insurance proceeds insufficient to repair or replace a property if it is damaged or destroyed. Under these circumstances, the insurance proceeds
31
received with respect to a property relating one of our investments might not be adequate to restore our economic position with respect to our investment. Any uninsured loss could result in the loss of cash flow from, and the asset value of, the affected property and the value of our investment related to such property.
Liability relating to environmental matters may impact the value of properties that we may acquire upon foreclosure of the properties underlying our investments.
To the extent we foreclose on properties with respect to which we have extended mortgage loans, we may be subject to environmental liabilities arising from such foreclosed properties. Under various U.S. federal, state and local laws, an owner or operator of real property may become liable for the costs of removal of certain hazardous substances released on its property. These laws often impose liability without regard to whether the owner or operator knew of, or was responsible for, the release of such hazardous substances.
The presence of hazardous substances may adversely affect an owner’s ability to sell real estate or borrow using real estate as collateral. To the extent that an owner of a property underlying one of our debt investments becomes liable for removal costs, the ability of the owner to make payments to us may be reduced, which in turn may adversely affect the value of the relevant mortgage asset held by us and our ability to make distributions to our stockholders.
If we foreclose on any properties underlying our investments, the presence of hazardous substances on a property may adversely affect our ability to sell the property and we may incur substantial remediation costs, thus harming our financial condition. The discovery of material environmental liabilities attached to such properties could have a material adverse effect on our results of operations and financial condition and our ability to make distributions to our stockholders.
The properties underlying our CRE loans may be subject to other unknown liabilities that could adversely affect the value of these properties, and as a result, our investments.
Properties underlying our CRE loans may be subject to other unknown or unquantifiable liabilities that may adversely affect the value of our investments. Such defects or deficiencies may include title defects, title disputes, liens or other encumbrances on the mortgaged properties. The discovery of such unknown defects, deficiencies and liabilities could affect the ability of our borrowers to make payments to us or could affect our ability to foreclose and sell the underlying properties, which could adversely affect our results of operations and financial condition. Further, we, our executive officers, directors and our Manager may, in the ordinary course of business, be named as defendants in litigation arising from our investments.
Construction loans involve an increased risk of loss.
We invest in and may continue to invest in construction loans. If we fail to fund our entire commitment on a construction loan or if a borrower otherwise fails to complete the construction of a project, there could be adverse consequences associated with the loan, including, but not limited to: a loss of the value of the property securing the loan, especially if the borrower is unable to raise funds to complete it from other sources; a borrower claim against us for failure to perform under the loan documents; increased costs to the borrower that the borrower is unable to pay; a bankruptcy filing by the borrower; and abandonment by the borrower of the collateral for the loan.
Our investments in construction loans require us to make estimates about the fair value of land improvements that may be challenged by the IRS.
We may invest in construction loans, the interest from which would be qualifying income for purposes of the gross income tests applicable to REITs, provided that the loan value of the real property securing the construction loan was equal to or greater than the highest outstanding principal amount of the construction loan during any taxable year. For purposes of construction loans, the loan value of the real property is generally the fair value of the land plus the reasonably estimated cost of the improvements or developments (other than personal property) that secure the loan and that are to be constructed from the proceeds of the loan. There can be no assurance that the IRS would not challenge our estimates of the loan values of the real property.
Our investments may be concentrated and could be subject to risk of default.
We are not required to observe specific diversification criteria, except as may be set forth in the investment guidelines adopted by our board of directors. Therefore, our investments in our target assets may at times be concentrated in certain property types that are subject to higher risk of foreclosure, or secured by properties concentrated in a limited number of geographic locations. To the extent that our investment portfolio is concentrated in any one region, sponsor or type of asset,
32
economic and business downturns relating generally to such region, sponsor or type of asset may result in defaults on a number of our investments within a short time period, which may reduce our net income and the value of our common stock and accordingly reduce our ability to pay dividends to our stockholders.
We may need to foreclose on loans that are in default, which could result in losses.
We may find it necessary to foreclose on loans that are in default. Foreclosure processes are often lengthy and expensive. Results of foreclosure processes may be uncertain, as claims may be asserted by borrowers or by other lenders or investors in the borrowers that interfere with enforcement of our rights, such as claims that challenge the validity or enforceability of our loan or the priority or perfection of our mortgage or other security interests. Borrowers may resist foreclosure actions by asserting numerous claims, counterclaims and defenses against us, including, without limitation, lender liability claims and defenses, even when the assertions may have no merit, in an effort to prolong the foreclosure action and seek to force us into a modification of the loan or a buy-out of the loan for less than we are owed. At any time prior to or during the foreclosure proceedings, the borrower may file for bankruptcy, which would have the effect of staying the foreclosure actions and delaying the foreclosure processes and potentially result in reductions or discharges of borrower's debt. Foreclosure may create a negative public perception of the collateral property, resulting in a diminution of its value. Even if we are successful in foreclosing on a mortgage loan, the liquidation proceeds upon sale of the underlying real estate may not be sufficient to recover our investment. Any costs or delays involved in the foreclosure of the loan or a liquidation of the underlying property will reduce the net proceeds realized and, thus, increase the potential for loss.
RISKS RELATED TO OUR COMMON STOCK
The market price of our common stock may fluctuate significantly.
Our common stock is listed on the New York Stock Exchange (“NYSE”) under the trading symbol “ACRE.” Recently, the global capital and credit markets have been in an extended period of volatility and disruption. The market price and liquidity of the market for shares of our common stock may be significantly affected by numerous factors, some of which are beyond our control and may not be directly related to our operating performance.
Some of the factors that could negatively affect the market price of our common stock include:
|
•
|
our actual or projected operating results, financial condition, cash flows and liquidity, or changes in business strategy or prospects;
|
|
•
|
actual or perceived conflicts of interest with our Manager or Ares Management and individuals, including our executives;
|
|
•
|
equity issuances by us, or share resales by our stockholders, or the perception that such issuances or resales may occur;
|
|
•
|
loss of a major funding source;
|
|
•
|
actual or anticipated accounting problems;
|
|
•
|
publication of research reports about us or the real estate industry;
|
|
•
|
changes in market valuations of similar companies;
|
|
•
|
adverse market reaction to any increased indebtedness we incur in the future;
|
|
•
|
additions to or departures of our Manager’s or Ares Management’s key personnel;
|
|
•
|
speculation in the press or investment community;
|
|
•
|
increases in market interest rates and widening of market credit spreads, which may lead investors to demand a higher distribution yield for our common stock and would result in increased interest expenses on our debt;
|
|
•
|
failure to maintain our REIT qualification or exemption from the 1940 Act;
|
33
|
•
|
price and volume fluctuations in the overall stock market from time to time;
|
|
•
|
general market and economic conditions, and trends including inflationary concerns, the current state of the credit and capital markets;
|
|
•
|
significant volatility in the market price and trading volume of securities of publicly traded REITs or other companies in our sector, which are not necessarily related to the operating performance of these companies;
|
|
•
|
changes in law, regulatory policies or tax guidelines, or interpretations thereof, particularly with respect to REITs;
|
|
•
|
changes in the value of our portfolio;
|
|
•
|
any shortfall in revenue or net income or any increase in losses from levels expected by investors or securities analysts;
|
|
•
|
operating performance of companies comparable to us;
|
|
•
|
short-selling pressure with respect to shares of our common stock or REITs generally;
|
|
•
|
uncertainty surrounding the continued strength of the U.S. economy; and
|
|
•
|
concerns regarding volatility in the U.S. and global financial markets.
|
As noted above, market factors unrelated to our performance could also negatively impact the market price of our common stock. One of the factors that investors may consider in deciding whether to buy or sell our common stock is our distribution rate as a percentage of our stock price relative to market interest rates. If market interest rates increase, prospective investors may demand a higher distribution rate or seek alternative investments paying higher dividends or interest. As a result, interest rate fluctuations and conditions in the capital markets can affect the market value of our common stock. For instance, if interest rates rise, it is likely that the market price of our common stock will decrease as market rates on interest-bearing securities increase.
In the past, following periods of volatility in the market prices of a company’s securities, securities class action litigation has often been brought against that company. If our stock price fluctuates significantly, we may be the target of securities litigation in the future. Securities litigation could result in substantial costs and divert management’s attention and resources from our business.
Common stock eligible for future sale may have adverse effects on our share price.
As of December 31,
2018
and
2017
, we had
28,755,665
and
28,598,916
shares of common stock outstanding, respectively, on a fully diluted basis.
We cannot predict the effect, if any, of future sales of our common stock, or the availability of shares for future sales, on the market price of our common stock. Sales of substantial amounts of common stock or the perception that such sales could occur may adversely affect the prevailing market price for our common stock.
We may issue additional restricted common stock and other equity-based awards under our Amended and Restated 2012 Equity Incentive Plan. We may continue to issue additional shares in subsequent public offerings or private placements to make new investments or for other purposes. We are not required to offer any such shares to existing stockholders on a preemptive basis. Therefore, it may not be possible for existing stockholders to participate in such future share issuances, which may dilute the existing stockholders’ interests in us.
We have not established a minimum distribution payment level and we may be unable to generate sufficient cash flows from our operations to make distributions to our stockholders at any time in the future.
We are generally required to annually distribute to our stockholders at least 90% of our REIT taxable income (which does not equal net income, as calculated in accordance with GAAP), determined without regard to the deduction for dividends paid and excluding net capital gains, for us to qualify as a REIT, which requirement we currently intend to satisfy through quarterly distributions of all or substantially all of our REIT taxable income in such year, subject to certain adjustments. We
34
have not established a minimum distribution payment level and our ability to pay distributions may be adversely affected by a number of factors, including the risk factors described in this annual report. All distributions will be made at the discretion of our board of directors and will depend on our earnings, our financial condition, debt covenants, maintenance of our REIT qualification and other factors as our board of directors may deem relevant from time to time. We believe that a change in any one of the following factors could adversely affect our results of operations and impair our ability to pay distributions to our stockholders:
|
•
|
our ability to make profitable investments;
|
|
•
|
margin calls or other expenses that reduce our cash flow;
|
|
•
|
defaults in our asset portfolio or decreases in the value of our portfolio; and
|
|
•
|
the fact that anticipated operating expense levels may not prove accurate, as actual results may vary from estimates.
|
As a result, no assurance can be given that we will be able to make distributions to our stockholders at any time in the future or that the level of any distributions we do make to our stockholders will achieve a market yield or increase or even be maintained over time, any of which could materially and adversely affect us.
In addition, distributions that we make to our stockholders out of current or accumulated earnings and profits (as determined for U.S. federal income tax purposes), and not designated by us as capital gain dividends or qualified dividend income, generally will be taxable to our stockholders as ordinary income. However, a portion of our distributions may be designated by us as capital gain dividends and generally will be taxable to our stockholders as long-term capital gain to the extent that such distributions do not exceed our actual net capital gain for the taxable year, without regard to the period for which the stockholder that receives such distribution has held its stock. Distributions in excess of our current and accumulated earnings and profits, as determined for U.S. federal income tax purposes, and not designated by us as capital gain dividends or qualified dividend income, may constitute a return of capital. A return of capital is not taxable, but has the effect of reducing the basis of a stockholder’s investment in our common stock, but not below zero.
Our distributions may exceed our cash flow from our operations and our net income.
We intend to make regular quarterly distributions to holders of our common stock. The regular quarterly cash distributions we pay are expected to be principally sourced by cash flow from operating activities. However, there can be no assurance that our net income or cash flow from operating activities will be sufficient to cover our future distributions, and we may use other sources of funds, such as from offering proceeds, borrowings and asset sales, to fund portions of our future distributions. Our distributions for the
years ended December 31, 2018 and 2017
did not exceed our cash flow from operating activities but our distributions did exceed our net income for the year ended December 31, 2017. Our distributions for the year ended December 31, 2016 did not exceed our cash flow from operating activities (excluding amounts related to discontinued operations) or net income.
Investing in our common stock may involve a high degree of risk.
The investments that we make in accordance with our investment objectives may result in a high amount of risk when compared to alternative investment options and volatility or loss of principal. Our investments may be highly speculative and aggressive, and therefore an investment in our common stock may not be suitable for someone with lower risk tolerance.
Future offerings of securities may adversely affect the market price of our common stock.
If we decide to issue securities that are senior to, convertible into or exchangeable for our common stock, such securities may have rights, preferences and privileges more favorable than those of our common stock and may result in dilution to holders of our common stock. We and, indirectly, our stockholders, will bear the cost of issuing and servicing such securities. Because our decision to issue such securities in any future offering will depend on market conditions and other factors beyond our control, we cannot predict or estimate the amount, timing or nature of our future offerings. Thus holders of our common stock will bear the risk of our future offerings reducing the market price of our common stock and diluting the value of their stock holdings in us.
35
RISKS RELATED TO OUR ORGANIZATION AND STRUCTURE
The Maryland General Corporation Law, or the “MGCL,” prohibits certain business combinations, which may make it more difficult for us to be acquired.
Under the MGCL, “business combinations” between a Maryland corporation and an “interested stockholder” or an affiliate of an interested stockholder are prohibited for five years after the most recent date on which the interested stockholder becomes an interested stockholder. These business combinations include a merger, consolidation, share exchange or, in circumstances specified in the statute, an asset transfer or issuance or reclassification of equity securities. An interested stockholder is defined as: (a) any person who beneficially owns, directly or indirectly, 10% or more of the voting power of the then-outstanding voting stock of the corporation; or (b) an affiliate or associate of the corporation who, at any time within the two-year period prior to the date in question, was the beneficial owner, directly or indirectly, of 10% or more of the voting power of the then-outstanding stock of the corporation.
A person is not an interested stockholder under the statute if the board of directors approved in advance the transaction by which the person otherwise would have become an interested stockholder. However, in approving a transaction, the board of directors may provide that its approval is subject to compliance, at or after the time of approval, with any terms and conditions determined by the board of directors.
After the expiration of the five-year period described above, any business combination between the Maryland corporation and an interested stockholder must generally be recommended by the board of directors of the corporation and approved by the affirmative vote of at least:
|
•
|
80% of the votes entitled to be cast by holders of the then-outstanding shares of voting stock of the corporation; and
|
|
•
|
two-thirds of the votes entitled to be cast by holders of voting stock of the corporation, other than shares held by the interested stockholder with whom or with whose affiliate the business combination is to be effected, or held by an affiliate or associate of the interested stockholder.
|
These supermajority vote requirements do not apply if the corporation’s common stockholders receive a minimum price, as defined under the MGCL, for their shares in the form of cash or other consideration in the same form as previously paid by the interested stockholder for its shares. The MGCL also permits various exemptions from these provisions, including business combinations that are exempted by the board of directors before the time that the interested stockholder becomes an interested stockholder. Pursuant to the statute, our board of directors has adopted a resolution exempting any business combination with Ares Investments or any of its affiliates. Consequently, the five-year prohibition and the supermajority vote requirements will not apply to business combinations between us and Ares Investments or any of its affiliates. As a result, Ares Investments or any of its affiliates may be able to enter into business combinations with us that may not be in the best interest of our stockholders, without compliance with the supermajority vote requirements and the other provisions of the statute. The business combination statute may discourage others from trying to acquire control of us and increase the difficulty of consummating any offer.
Stockholders have limited control over changes in our policies and operations.
Our board of directors determines our major policies, including with regard to financing, growth, debt capitalization, REIT qualification and distributions. Our board of directors may amend or revise these and other policies without a vote of the stockholders. Under our charter and the MGCL, our stockholders generally have a right to vote only on the following matters:
|
•
|
the election or removal of directors;
|
|
•
|
the amendment of our charter, except that our board of directors may amend our charter without stockholder approval to:
|
|
•
|
change our name;
|
|
•
|
change the name or other designation or the par value of any class or series of stock and the aggregate par value of our stock;
|
|
•
|
increase or decrease the aggregate number of shares of stock that we have the authority to issue;
|
36
|
•
|
increase or decrease the number of shares of any class or series of stock that we have the authority to issue; and
|
|
•
|
effect certain reverse stock splits;
|
|
•
|
our dissolution; and
|
|
•
|
our being a party to a merger, consolidation, conversion, sale or other disposition of all or substantially all of our assets or statutory share exchange.
|
All other matters are subject to the discretion of our board of directors.
Our authorized but unissued shares of common and preferred stock may prevent a change in control.
Our charter authorizes us to issue up to 450,000,000 shares of common stock and 50,000,000 shares of preferred stock without stockholder approval. In addition, our board of directors may, without stockholder approval, amend our charter from time to time to increase or decrease the aggregate number of shares of our stock or the number of shares of stock of any class or series that we have authority to issue and classify or reclassify any unissued shares of common or preferred stock into other classes or series of stock and set the preferences, rights and other terms of the classified or reclassified shares. As a result, our board of directors may establish a class or series of shares of common or preferred stock that could delay or prevent a merger, third party tender offer or similar transaction or a change in incumbent management that might involve a premium price for shares of our common stock or otherwise be in the best interest of our stockholders.
Maintenance of our exemption from registration under the 1940 Act imposes significant limits on our operations. Your investment return may be reduced if we are required to register as an investment company under the 1940 Act.
We conduct our operations so that neither we nor any of our subsidiaries are required to register as an investment company under the 1940 Act. In order to maintain our exemption from registration under the 1940 Act, the assets in our portfolio are subject to certain restrictions that meaningfully limit our operations.
In relevant part, Section 3(a)(1)(A) of the 1940 Act defines an investment company as any issuer that is or holds itself out as being engaged primarily, or proposes to engage primarily, in the business of investing, reinvesting or trading in securities. Section 3(a)(1)(C) of the 1940 Act defines an investment company as any issuer that is engaged or proposes to engage in the business of investing, reinvesting, owning, holding or trading in securities and owns or proposes to acquire investment securities having a value exceeding 40% of the value of the issuer’s total assets (exclusive of U.S. Government securities and cash items) on an unconsolidated basis, or the “40% test.” The term “investment securities” generally includes all securities except U.S. Government securities and securities of majority-owned subsidiaries that are not themselves investment companies and are not relying on the exemption from the definition of “investment company” under Sections 3(c)(1) or 3(c)(7) of the 1940 Act.
We are organized as a holding company that conducts its businesses primarily through wholly-owned and other majority-owned subsidiaries. We conduct our operations in a manner designed so that we do not come within the definition of an investment company because less than 40% of the value of our adjusted total assets on an unconsolidated basis consist of “investment securities.” As such, the securities issued by our wholly-owned or other majority-owned subsidiaries that are exempted from the definition of “investment company” based on Section 3(c)(1) or 3(c)(7) of the 1940 Act, together with any other investment securities we may own, may not have a value in excess of 40% of the value of our adjusted total assets on an unconsolidated basis. This requirement limits the types of businesses in which we may engage through such subsidiaries. In addition, the assets we and our subsidiaries may originate or acquire are limited by the provisions of the 1940 Act and the rules and regulations promulgated under the 1940 Act, which may adversely affect our business. We monitor our holdings to ensure continuing and ongoing compliance with this test. In addition, we believe we are not considered an investment company under Section 3(a)(1)(A) of the 1940 Act because we do not engage primarily or hold ourselves out as being engaged primarily in the business of investing, reinvesting or trading in securities. Rather, through our wholly-owned and other majority-owned subsidiaries, we are primarily engaged in the non-investment company businesses of these subsidiaries.
We determine whether an entity is one of our majority-owned subsidiaries. The 1940 Act defines a majority-owned subsidiary of a person as a company 50% or more of the outstanding voting securities of which are owned by such person, or by another company that is a majority-owned subsidiary of such person. The 1940 Act further defines voting securities as any security presently entitling the owner or holder thereof to vote for the election of directors of a company. We treat entities in
37
which we own at least a majority of the outstanding voting securities as majority-owned subsidiaries for purposes of the 40% test. We have not requested the SEC to approve our treatment of any entity as a majority-owned subsidiary and the SEC has not done so. If the SEC were to disagree with our treatment of one or more subsidiary entities as majority-owned subsidiaries, we would need to adjust our strategy and our assets in order to continue to pass the 40% test. Any such adjustment in our strategy could have a material adverse effect on us.
In addition, we and our subsidiaries may rely upon the exemption from registration as an investment company pursuant to Section 3(c)(5)(C) of the 1940 Act, which is available for entities “primarily engaged” in the business of “purchasing or otherwise acquiring mortgages and other liens on and interests in real estate.” As reflected in no-action letters, the SEC staff's position on Section 3(c)(5)(C) generally requires that at least 55% of an entity’s assets comprise qualifying real estate assets and that at least 80% of its assets must comprise qualifying real estate assets and real estate-related assets under the 1940 Act. Specifically, we expect each of our subsidiaries relying on Section 3(c)(5)(C) to invest at least 55% of its assets in mortgage loans, certain mezzanine loans and B-Notes and other interests in real estate that constitute qualifying real estate assets in accordance with SEC staff guidance, and approximately an additional 25% of its assets in other types of mortgages, securities of REITs and other real estate-related assets such as debt and equity securities of companies primarily engaged in real estate businesses and securities issued by pass-through entities of which substantially all of the assets consist of qualifying real estate assets and/or real estate-related assets.
We expect each of our subsidiaries relying on Section 3(c)(5)(C) to rely on guidance published by the SEC staff or on our analyses of guidance published with respect to other types of assets to determine which assets are qualifying real estate assets and real estate-related assets. However, the SEC’s guidance was issued in accordance with factual situations that may be substantially different from the factual situations we may encounter. No assurance can be given that the SEC will concur with how we classify the assets of our subsidiaries.
The SEC staff, according to published guidance, takes the view that certain mezzanine loans and B-Notes are qualifying real estate assets. Thus, we intend to treat certain mezzanine loans and B-Notes as qualifying real estate assets. The SEC has not published guidance with respect to the treatment of some of our other current and target assets, including commercial mortgage-backed securities, for purposes of the Section 3(c)(5)(C) exemption. For assets for which the SEC has not published guidance, we intend to rely on our own analysis. For example, unless we receive further guidance from the SEC or its staff with respect to CMBS or CLOs, we intend to treat CMBS or CLOs in which we hold 100% of the “controlling class” of securities as qualifying real estate assets, and our other holdings in CMBS or CLOs as real estate-related assets. We also intend to treat debt and equity securities of companies primarily engaged in real estate businesses as real estate-related assets. The SEC may in the future take a view different than or contrary to our analysis with respect to the types of assets we have determined to be qualifying real estate assets or real estate-related assets. To the extent that the SEC staff publishes new or different guidance with respect to these matters, we may be required to adjust our strategy accordingly. If we are required to re-classify our assets, we may no longer be in compliance with the exclusion from the definition of an “investment company” provided by Section 3(c)(5)(C) of the 1940 Act.
Certain of our subsidiaries may rely on the exemption provided by Section 3(c)(6) to the extent that they hold mortgage assets through majority-owned subsidiaries that rely on the exemption provided by Section 3(c)(5)(C). The SEC staff has issued little interpretive guidance with respect to Section 3(c)(6) and any guidance published by the SEC staff could require us to adjust our strategy accordingly.
On August 31, 2011, the SEC issued a concept release titled “Companies Engaged in the Business of Acquiring Mortgages and Mortgage-Related Instruments” (SEC Release No. IC-29778). Under the concept release, the SEC stated that it was reviewing interpretive issues relating to Section 3(c)(5)(C) of the 1940 Act, including the nature of the assets that qualify for purposes of the exemption and whether mortgage REITs should be regulated in a manner similar to investment companies, and solicited public comment. To the extent that the SEC or its staff provides more specific guidance regarding any of the matters bearing upon the definition of investment company and the exemptions to that definition, we may be required to adjust our strategy accordingly. Although any additional guidance from the SEC or its staff could provide additional flexibility to us, it also could further inhibit our ability to pursue the strategies we have chosen. There can be no assurance that the laws and regulations governing the 1940 Act status of REITs, including the SEC or its staff providing more specific or different guidance regarding these exemptions, will not change in a manner that adversely affects our operations.
Although we monitor our portfolio periodically and prior to each investment origination or acquisition, there can be no assurance that we will be able to maintain our exemptive status. If the value of securities issued by our subsidiaries that are exempted from the definition of “investment company” by Sections 3(c)(1) or 3(c)(7) of the 1940 Act, together with any other investment securities we own, exceeds 40% of our adjusted total assets on an unconsolidated basis, or if one or more of such subsidiaries fail to maintain an exemption from registration under the 1940 Act, we could, among other things, be required to
38
(a) substantially change the manner in which we conduct our operations to avoid being required to register as an investment company, (b) effect sales of our assets in a manner that, or at a time when, we would not otherwise choose to do so, or (c) register as an investment company, any of which could negatively affect the value of our common stock, the sustainability of our business model, and our ability to make distributions which could have an adverse effect on our business and the market price for our shares of common stock.
To maintain our exemptive status, we may be unable to sell assets we would otherwise want to sell and may need to sell assets we would otherwise wish to retain. In addition, we may have to acquire additional assets that we might not otherwise have acquired or may have to forego opportunities to acquire assets that we would otherwise want to acquire and would be important to our investment strategy. If we were to lose our exemptive status and were required to register as an investment company but failed to do so, we would be prohibited from engaging in our business, and criminal and civil actions could be brought against us. In addition, our contracts would be unenforceable unless a court required enforcement, and a court could appoint a receiver to take control of us and liquidate our business. Alternatively, if we were to register as an investment company under the 1940 Act, we would become subject to substantial regulation with respect to our capital structure (including our ability to use borrowings), management, operations, transactions with affiliated persons (as defined in the 1940 Act), and portfolio composition, including disclosure requirements and restrictions with respect to diversification and industry concentration, and other matters. Compliance with the 1940 Act would, accordingly, limit our ability to make certain investments and require us to significantly restructure our business model. This could have a material adverse effect on our net asset value, the market price for our shares of common stock and our ability to pay distributions to our stockholders.
Rapid and steep declines in the values of our real estate-related investments may make it more difficult for us to maintain our qualification as a REIT or exemption from the 1940 Act.
If the market value or income potential of real estate-related investments declines as a result of increased interest rates or other factors, we may need to increase our real estate investments and income and/or liquidate our non-qualifying assets in order to maintain our REIT qualification or exemption from the 1940 Act. If the decline in real estate asset values and/or income occurs quickly, this may be especially difficult to accomplish. This difficulty may be exacerbated by the illiquid nature of any non-qualifying assets that we may own. We may have to make investment decisions that we otherwise would not make absent the REIT and 1940 Act considerations.
Our rights and the rights of our stockholders to recover on claims against our directors and officers are limited, which could reduce our stockholders and our recovery against them if they negligently cause us to incur losses.
The MGCL provides that a director has no liability in such capacity if he performs his duties in good faith, in a manner he reasonably believes to be in our best interests and with the care that an ordinarily prudent person in a like position would use under similar circumstances. A director who performs his or her duties in accordance with the foregoing standards should not be liable to us or any other person for failure to discharge his or her obligations as a director.
In addition, our charter provides that our directors and officers will not be liable to us or our stockholders for monetary damages unless the director or officer actually received an improper benefit or profit in money, property or services, or is adjudged to be liable to us or our stockholders based on a finding that his or her action, or failure to act, was the result of active and deliberate dishonesty and was material to the cause of action adjudicated in the proceeding. Our bylaws require us, to the maximum extent permitted by Maryland law, to indemnify and, without requiring a preliminary determination of the ultimate entitlement to indemnification, pay or reimburse reasonable expenses in advance of final disposition of a proceeding to any individual who is a present or former director or officer and who is made or threatened to be made a party to the proceeding by reason of his or her service in that capacity or any individual who, while a director or officer and at our request, serves or has served as a director, officer, partner, trustee, member or manager of another corporation, REIT, limited liability company, partnership, joint venture, trust, employee benefit plan or other enterprise and who is made or threatened to be made a party to the proceeding by reason of his or her service in that capacity. With the approval of our board of directors, we may provide such indemnification and advance for expenses to any individual who served a predecessor of ours in any of the capacities described above and any employee or agent of ours or a predecessor of ours, including our Manager and its affiliates.
We also are permitted to purchase and maintain insurance or provide similar protection on behalf of any directors, officers, employees and agents, including our Manager and its affiliates, against any liability asserted which was incurred in any such capacity with us or arising out of such status. This may result in us having to expend significant funds, which will reduce the available cash for distribution to our stockholders.
39
Our charter contains provisions that make removal of our directors difficult, which could make it difficult for our stockholders to effect changes to our management.
Our charter provides that a director may only be removed for cause upon the affirmative vote of stockholders entitled to cast two-thirds of the votes entitled to be cast generally in the election of directors. Vacancies may be filled only by a majority of the remaining directors in office, even if less than a quorum, and any director elected to fill a vacancy will hold office for the remainder of the full term of the class of directors in which the vacancy occurred and until a successor is elected and qualifies. These requirements make it more difficult to change our management by removing and replacing directors and may prevent a change in control that is in the best interests of our stockholders. Pursuant to our charter, our board of directors is divided into three classes of directors serving staggered three year terms. The staggered terms of our directors may reduce the possibility of a tender offer or an attempt at a change in control, even though a tender offer or change in control might be in the best interest of our stockholders.
Ownership limitations may restrict change of control or business combination opportunities in which our stockholders might receive a premium for their shares.
In order for us to maintain our qualification as a REIT, commencing with our taxable year ended December 31, 2012, no more than 50% in value of our outstanding capital stock may be owned, directly or indirectly, by five or fewer individuals during the last half of each taxable year after 2012. “Individuals” for this purpose include natural persons, private foundations, some employee benefit plans and trusts, and some charitable trusts. To preserve our REIT qualification, among other purposes, our charter generally prohibits any person (except Ares Investments which is subject to a 22% excepted holder limit) from directly or indirectly owning more than 9.8% in value of the outstanding shares of our capital stock or more than 9.8% in value or in number of shares, whichever is more restrictive, of the outstanding shares of any class or series of our stock. This ownership limitation could have the effect of discouraging a takeover or other transaction in which holders of our common stock might receive a premium for their shares over the then-prevailing market price or which holders might believe to be otherwise in their best interests.
U.S. FEDERAL INCOME TAX RISKS
Our failure to remain qualified as a REIT would subject us to U.S. federal income tax and potentially state and local tax, and would adversely affect our operations and the market price of our common stock.
We have elected to be taxed as a REIT commencing with our taxable year ended December 31, 2012. However, we may terminate our REIT election if our board of directors determines that not qualifying as a REIT is in the best interests of our stockholders. We may also inadvertently terminate our REIT election, as our qualification as a REIT depends upon our satisfaction of certain asset, income, organizational, distribution, stockholder ownership and other requirements on a continuing basis. We have structured and intend to continue structuring our activities in a manner designed to satisfy all the requirements for qualification as a REIT and believe that we have qualified as a REIT since the year of our initial election. The REIT qualification requirements are extremely complex and interpretation of the U.S. federal income tax laws governing qualification as a REIT is limited. Accordingly, we cannot be certain that we will be successful in operating so we can remain qualified as a REIT. Our ability to satisfy the asset tests depends on our analysis of the characterization and fair market values of our assets, some of which are not susceptible to a precise determination, and for which we will not obtain independent appraisals. Our compliance with the REIT income or quarterly asset requirements also depends on our ability to successfully manage the composition of our income and assets on an ongoing basis. Accordingly, if certain of our operations were to be re-characterized by the IRS such re-characterization could jeopardize our ability to satisfy all the requirements for qualification as a REIT. Furthermore, future legislative, judicial or administrative changes to the U.S. federal income tax laws could be applied retroactively, which could result in our disqualification as a REIT.
If we fail to maintain our qualification as a REIT for any taxable year, and we do not qualify for certain statutory relief provisions, we will be subject to U.S. federal income tax on our taxable income at the corporate tax rate. In addition, we would generally be disqualified from treatment as a REIT for the four taxable years following the year of losing our REIT qualification. Losing our REIT qualification would reduce our net earnings available for investment or distribution to stockholders because of the additional tax liability. In addition, distributions to stockholders would no longer qualify for the dividends paid deduction, and we would no longer be required to make distributions. If this occurs, we might be required to borrow funds or liquidate some investments in order to pay the applicable tax.
Furthermore, any REIT in which we invest directly or indirectly, including the REIT through which we own our interest in the CLO Securitization, ACRE 2017-FL3 Holder REIT LLC, is independently subject to, and must comply with, the same REIT requirements that we must satisfy in order to qualify as a REIT, together with all other rules applicable to REITs. If
40
the subsidiary REIT fails to qualify as a REIT and certain statutory relief provisions do not apply, then (a) the subsidiary REIT would become subject to U.S. federal income tax, (b) the subsidiary REIT will be disqualified from treatment as a REIT for the four taxable years following the year during which qualification was lost, (c) our investment in the subsidiary REIT could cease to be a qualifying asset for purposes of the asset tests applicable to REITs and any dividend income or gains derived by us from such subsidiary REIT may cease to be treated as income that qualifies for purposes of the 75% gross income test, and (d) we may fail certain of the asset or income tests applicable to REITs, in which event we will fail to qualify as a REIT unless we are able to avail ourselves of certain statutory relief provisions.
REITs, in certain circumstances, may incur tax liabilities that would reduce the cash available for distribution to our stockholders.
Even if we maintain our status as a REIT, we may be subject to U.S. federal income taxes and related state and local taxes. For example, net income from the sale of properties that are considered inventory or property held primarily for sale to customers by a REIT in the ordinary course of its trade or business (a “prohibited transaction” under the Code) will be subject to a 100% tax. Also, if we were to fail an income test (and did not lose our REIT status because such failure was due to reasonable cause and not willful neglect) we would be subject to tax on the portion of our income that does not meet the income test requirements. We also may decide to retain net capital gains we earn from the sale or other disposition of our property and pay U.S. federal income tax directly on such income. In that event, our stockholders would be treated as if they earned that income and paid the tax on it directly. However, stockholders that are tax-exempt, such as charities or qualified pension plans, would have no benefit from their deemed payment of such tax liability unless they file U.S. federal income tax returns and thereon seek a refund of such tax. We also will be subject to corporate tax on any undistributed REIT taxable income. We also may be subject to state and local taxes on our income or property, including franchise, payroll, mortgage recording and transfer taxes, either directly or at the level of the other companies through which we indirectly own our assets, such as our TRSs, which are subject to full U.S. federal, state, and local corporate-level income taxes. Finally, we may incur an excise tax applicable to REITs if we fail to make sufficient distributions to our stockholders during the course of a taxable year, along with any distributions declared in the fourth quarter of a year and paid in January of the following year. Any taxes we pay directly or indirectly will reduce our cash available for distribution to stockholders.
To qualify as a REIT, we must meet annual distribution requirements, which may force us to forgo otherwise attractive opportunities or borrow funds during unfavorable market conditions. This could delay or hinder our ability to meet our investment objectives and reduce your overall return.
In order to maintain our status as a REIT, we must annually distribute to our stockholders at least 90% of our REIT taxable income (which does not equal net income, as calculated in accordance with GAAP), determined without regard to the deduction for dividends paid and excluding net capital gain. We will be subject to U.S. federal income tax on our undistributed REIT taxable income and net capital gain at corporate rates and to a 4% nondeductible excise tax on any amount by which distributions we pay with respect to any calendar year are less than the sum of (a) 85% of our ordinary income, (b) 95% of our capital gain net income and (c) 100% of our undistributed income from prior years. These requirements could inhibit our ability to finance our growth and cause us to distribute amounts that otherwise would be spent on investments in real estate assets and it is possible that we might be required to borrow funds, possibly at unfavorable rates, or sell assets to fund these distributions. Although we intend to make distributions sufficient to meet the annual distribution requirements and to avoid U.S. federal income and excise taxes on our earnings while we qualify as a REIT, it is possible that we might not always be able to do so.
Certain of our business activities are potentially subject to the prohibited transaction tax, which could reduce the return on your investment.
For so long as we qualify as a REIT, our ability to dispose of property during the first few years following acquisition may be restricted to a substantial extent as a result of our REIT qualification. Under applicable provisions of the Code regarding prohibited transactions by REITs, we will be subject to a 100% penalty tax on any gain recognized on the sale or other disposition of any property (other than foreclosure property) that we own, directly or through any subsidiary entity, but generally excluding TRSs, that is deemed to be inventory or property held primarily for sale to customers in the ordinary course of a trade or business. Whether property is inventory or otherwise held primarily for sale to customers in the ordinary course of a trade or business depends on the particular facts and circumstances surrounding each property. While we qualify as a REIT, we will seek to avoid the 100% prohibited transaction tax by (a) conducting activities that may otherwise be considered prohibited transactions through a TRS (such TRS will incur income tax at corporate tax rates with respect to any income or gain recognized by it), (b) conducting our operations in such a manner so that no sale or other disposition of an asset we own, directly or through any subsidiary (other than a TRS), will be treated as a prohibited transaction, or (c) structuring certain dispositions of our properties to comply with a prohibited transaction safe harbor available under the Code for properties that have been held for at least two years. However, no assurance can be given that any particular property we own, directly or
41
through any subsidiary entity, but generally excluding TRSs, will not be treated as inventory or property held primarily for sale to customers in the ordinary course of a trade or business.
The tax on prohibited transactions will limit our ability to engage in transactions, including certain methods of securitizing mortgage loans that would be treated as sales for U.S. federal income tax purposes.
A REIT’s net income from prohibited transactions is subject to a 100% tax. In general, prohibited transactions are sales or other dispositions of property, other than foreclosure property, but including mortgage loans, held as inventory or primarily for sale to customers in the ordinary course of business. We might be subject to this tax if we were to sell or securitize loans in a manner that was treated as a sale of the loans as inventory for U.S. federal income tax purposes. Therefore, in order to avoid the prohibited transactions tax, we may choose not to engage in certain sales of loans, other than through a TRS, and we may be required to limit the structures we use for our securitization transactions, even though such sales or structures might otherwise be beneficial for us.
TRSs are subject to corporate-level taxes and dealings with TRSs may be subject to 100% excise tax.
A REIT may own up to 100% of the stock of one or more TRS. Both the subsidiary and the REIT must jointly elect to treat the subsidiary as a TRS. A corporation of which a TRS directly or indirectly owns more than 35% of the voting power or value of the stock will automatically be treated as a TRS. Overall, no more than 20% (25% for our taxable years beginning prior to January 1, 2018) of the gross value of a REIT’s assets may consist of stock or securities of one or more TRSs, and the aggregate value of debt instruments issued by public REITs held by us that are not otherwise secured by real property may not exceed 25% of the value of our total assets. In addition, the TRS rules limit the deductibility of interest paid or accrued by a TRS to its parent REIT to assure that the TRS is subject to an appropriate level of corporate taxation. The rules also impose a 100% excise tax on certain transactions between a TRS and its parent REIT that are not conducted on an arm’s-length basis.
ACRC W TRS, FL3 TRS and other TRSs that we may form will pay U.S. federal, state and local income tax on their taxable income, and their after-tax net income will be available for distribution to us but will not be required to be distributed to us, unless necessary to maintain our REIT qualification. While we will be monitoring the aggregate value of the securities of our TRSs and intend to conduct our affairs so that such securities will represent less than 20% of the value of our total assets, there can be no assurance that we will be able to comply with the TRS limitation in all market conditions.
Our investments in certain debt instruments may cause us to recognize income for U.S. federal income tax purposes even though no cash payments have been received on the debt instruments, and certain modifications of such debt by us could cause the modified debt to not qualify as a good REIT asset, thereby jeopardizing our REIT qualification.
Our taxable income may substantially exceed our net income as determined based on GAAP, or differences in timing between the recognition of taxable income and the actual receipt of cash may occur. For example, we may acquire assets, including debt securities requiring us to accrue OID or recognize market discount income, that generate taxable income in excess of economic income or in advance of the corresponding cash flow from the assets. In addition, if a borrower with respect to a particular debt instrument encounters financial difficulty rendering it unable to pay stated interest as due, we may nonetheless be required to continue to accrue and recognize the unpaid interest as taxable income with the effect that we will recognize income but will not have a corresponding amount of cash available for distribution to our stockholders.
As a result of the foregoing, we may generate less cash flow than taxable income in a particular year and find it difficult or impossible to meet the REIT distribution requirements in certain circumstances. In such circumstances, we may be required to (a) sell assets in adverse market conditions, (b) borrow on unfavorable terms, (c) distribute amounts that would otherwise be used for future acquisitions or used to repay debt, or (d) make a taxable distribution of our shares of common stock as part of a distribution in which stockholders may elect to receive shares of common stock or (subject to a limit measured as a percentage of the total distribution) cash, in order to comply with the REIT distribution requirements.
Moreover, we may acquire distressed debt investments that require subsequent modification by agreement with the borrower. If the amendments to the outstanding debt are “significant modifications” under the applicable Treasury Regulations, the modified debt may be considered to have been reissued to us in a debt-for-debt taxable exchange with the borrower. This deemed reissuance may prevent the modified debt from qualifying as a good REIT asset if the underlying security has declined in value and would cause us to recognize income to the extent the principal amount of the modified debt exceeds our adjusted tax basis in the unmodified debt.
42
The failure of mortgage loans subject to a repurchase agreement to qualify as a real estate asset would adversely affect our ability to qualify as a REIT.
We have entered into repurchase agreements under which we will nominally sell certain of our assets to a counterparty and simultaneously enter into an agreement to repurchase the sold assets. We believe that we will be treated for U.S. federal income tax purposes as the owner of the assets that are the subject of any such agreements notwithstanding that such agreements may transfer record ownership of the assets to the counterparty during the term of the agreement. It is possible, however, that the IRS could assert that we did not own the assets during the term of the repurchase agreement, in which case we could fail to qualify as a REIT if our remaining assets do not satisfy the asset tests or if our income does not satisfy the gross income tests.
The failure of mezzanine loans to qualify as a real estate asset would adversely affect our ability to qualify as a REIT.
In order for a loan to be treated as a qualifying real estate asset producing qualifying income for purposes of the REIT asset and income tests, generally the loan must be secured by real property or an interest in real property. We may originate or acquire mezzanine loans that are not directly secured by real property or an interest in real property but instead are secured by equity interests in a partnership or limited liability company that directly or indirectly owns real property or an interest in real property. In Revenue Procedure 2003-65, the IRS provided a safe harbor pursuant to which a mezzanine loan that is not secured by real estate would, if it meets each of the requirements contained in the Revenue Procedure, be treated by the IRS as a qualifying real estate asset. Although the Revenue Procedure provides a safe harbor on which taxpayers may rely, it does not prescribe rules of substantive tax law and in many cases it may not be possible for us to meet all the requirements of the safe harbor. We cannot provide assurance that any mezzanine loan in which we invest would be treated as a qualifying asset producing qualifying income for REIT qualification purposes. If any such loan fails either the REIT income or asset tests, we may be disqualified as a REIT.
Our qualification as a REIT and exemption from U.S. federal income tax with respect to certain assets may be dependent on the accuracy of legal opinions or advice rendered or given or statements by the issuers of assets that we acquire, and the inaccuracy of any such opinions, advice or statements may adversely affect our REIT qualification and result in corporate-level tax.
When purchasing securities, we may rely on opinions or advice of counsel for the issuer of such securities, or statements made in related offering documents, for purposes of determining whether such securities represent debt or equity securities for U.S. federal income tax purposes, and also to what extent those securities constitute real estate assets for purposes of the asset tests and produce qualifying income for purposes of the 75% gross income test. In addition, when purchasing the equity tranche of a securitization, we may rely on opinions or advice of counsel regarding the qualification of the securitization for exemption from U.S. corporate income tax and the qualification of interests in such securitization as debt for U.S. federal income tax purposes. The inaccuracy of any such opinions, advice or statements may adversely affect our REIT qualification and result in significant corporate level tax.
The taxable mortgage pool, or “TMP,” rules may increase the taxes that we or our stockholders may incur, and may limit the manner in which we effect future securitizations.
Our CLO securitization resulted in the creation of a TMP for federal income tax purposes. Future securitizations by us or our subsidiaries could result in the creation of additional TMPs for U.S. federal income tax purposes. As a result, we could have “excess inclusion income.” Certain categories of stockholders, such as non-U.S. stockholders eligible for treaty or other benefits, stockholders with net operating losses, and certain tax-exempt stockholders that are subject to unrelated business income tax, could be subject to increased taxes on a portion of their dividend income from us that is attributable to any such excess inclusion income. In the case of a stockholder that is a REIT, regulated investment company (“RIC”), common trust fund or other pass-through entity, our allocable share of our excess inclusion income could be considered excess inclusion income of such entity. In addition, to the extent that our common stock is owned by tax-exempt “disqualified organizations,” such as certain government-related entities and charitable remainder trusts that are not subject to tax on unrelated business income, we may incur a corporate level tax on a portion of any excess inclusion income. Because this tax generally would be imposed on us, all of our stockholders, including stockholders that are not disqualified organizations, generally will bear a portion of the tax cost associated with the classification of us or a portion of our assets as a TMP. A RIC or other pass through entity owning our common stock in record name will be subject to tax at the highest U.S. federal corporate tax rate on any excess inclusion income allocated to their owners that are disqualified organizations. The manner in which excess inclusion income is calculated is not clear under current law. As required by IRS guidance, we intend to make such determinations based on what we believe to be a reasonable method. However, there can be no assurance that the IRS will not challenge our method of making any such determinations. If the IRS were to disagree with any such determinations made or with the method used by
43
us, the amount of any excess inclusion income required to be taken into account by one or more stockholders, including tax-exempt stockholders, non-U.S. stockholders and stockholders with net operating losses, could be significantly increased. Moreover, we could face limitations in selling equity interests in these securitizations to outside investors, or selling any debt securities issued in connection with these securitizations that might be considered to be equity interests for tax purposes. Finally, if we were to fail to qualify as a REIT, any TMP securitizations would be treated as separate taxable corporations for U.S. federal income tax purposes that could not be included in any consolidated U.S. federal corporate income tax return. These limitations may prevent us from using certain techniques to maximize our returns from securitization transactions.
We may choose to make distributions in our own stock, in which case you may be required to pay income taxes in excess of the cash dividends you receive.
In connection with our qualification as a REIT, we are required to annually distribute to our stockholders at least 90% of our REIT taxable income (which does not equal net income, as calculated in accordance with GAAP), determined without regard to the deduction for dividends paid and excluding net capital gain. In order to satisfy this requirement, we may make distributions that are payable in cash and/or shares of our common stock (which could account for up to 80% of the aggregate amount of such distributions) at the election of each stockholder. Taxable stockholders receiving such distributions will be required to include the full amount of such distributions as ordinary dividend income to the extent of our current or accumulated earnings and profits, as determined for U.S. federal income tax purposes. As a result, U.S. stockholders may be required to pay income taxes with respect to such distributions in excess of the cash portion of the distribution received. Accordingly, U.S. stockholders receiving a distribution of our shares may be required to sell shares received in such distribution or may be required to sell other stock or assets owned by them, at a time that may be disadvantageous, in order to satisfy any tax imposed on such distribution. If a U.S. stockholder sells the stock that it receives as part of the distribution in order to pay this tax, the sales proceeds may be less than the amount it must include in income with respect to the distribution, depending on the market price of our stock at the time of the sale. Furthermore, with respect to certain non-U.S. stockholders, we may be required to withhold U.S. tax with respect to such distribution, including in respect of all or a portion of such distribution that is payable in stock, by withholding or disposing of part of the shares included in such distribution and using the proceeds of such disposition to satisfy the withholding tax imposed. In addition, if a significant number of our stockholders determine to sell shares of our common stock in order to pay taxes owed on dividend income, such sale may put downward pressure on the market price of our common stock.
Various tax aspects of such a taxable cash/stock distribution are uncertain and have not yet been addressed by the IRS. No assurance can be given that the IRS will not impose requirements in the future with respect to taxable cash/stock distributions, including on a retroactive basis, or assert that the requirements for such taxable cash/stock distributions have not been met.
Dividends payable by REITs generally do not qualify for the reduced tax rates available for some dividends.
Currently, the maximum tax rate applicable to qualified dividend income payable to U.S. stockholders that are individuals, trusts and estates is 20%. Dividends payable by REITs, however, generally are not eligible for this reduced rate. Although this does not adversely affect the taxation of REITs or dividends payable by REITs, the more favorable rates applicable to regular corporate qualified dividends could cause investors who are individuals, trusts and estates to perceive investments in REITs to be relatively less attractive than investments in the stocks of non-REIT corporations that pay dividends, which could adversely affect the value of the shares of REITs, including our common stock. Tax rates could be changed in future legislation.
Complying with REIT requirements may limit our ability to hedge our liabilities effectively and may cause us to incur tax liabilities.
The REIT provisions of the Code may limit our ability to hedge our liabilities. Any income from a hedging transaction we enter into to manage risk of interest rate changes, price changes or currency fluctuations with respect to borrowings made or to be made to acquire or carry real estate assets or in certain cases to hedge previously acquired hedges entered into to manage risks associated with property that has been disposed of or liabilities that have been extinguished, if properly identified under applicable Treasury Regulations, does not constitute “gross income” for purposes of the 75% or 95% gross income tests. To the extent that we enter into other types of hedging transactions, the income from those transactions will likely be treated as non-qualifying income for purposes of both of the gross income tests. As a result of these rules, we may need to limit our use of advantageous hedging techniques or implement those hedges through a TRS. This could increase the cost of our hedging activities because our TRSs are subject to tax on gains and may expose us to greater risks associated with changes in interest rates than we would otherwise want to bear. In addition, losses in a TRS generally will not provide any tax benefit, except for being carried forward against future taxable income of such TRS.
44
Complying with REIT requirements may force us to forgo and/or liquidate otherwise attractive investment opportunities.
To maintain our qualification as a REIT, we must ensure that we meet the REIT gross income tests annually and that at the end of each calendar quarter, at least 75% of the value of our assets consists of cash, cash items, government securities and qualified REIT real estate assets, including certain mortgage loans and certain kinds of mortgage-related securities. The remainder of our investment in securities (other than government securities and qualified real estate assets) generally cannot include more than 10% of the outstanding voting securities of any one issuer or more than 10% of the total value of the outstanding securities of any one issuer. In addition, in general, no more than 5% of the value of our assets (other than government securities and qualified real estate assets) can consist of the securities of any one issuer, and no more than 20% of the value of our total assets can be represented by securities of one or more TRSs. If we fail to comply with these requirements at the end of any calendar quarter, we must correct the failure within 30 days after the end of the calendar quarter or qualify for certain statutory relief provisions to avoid losing our REIT qualification and suffering adverse tax consequences. As a result, we may be required to liquidate assets from our portfolio or not make otherwise attractive investments in order to maintain our qualification as a REIT. These actions could have the effect of reducing our income and amounts available for distribution to our stockholders.
We may be subject to adverse legislative or regulatory tax changes that could increase our tax liability, reduce our operating flexibility and reduce the price of our common stock.
In recent years, numerous legislative, judicial and administrative changes have been made in the provisions of U.S. federal income tax laws applicable to investments similar to an investment in shares of our common stock. Additional changes to the tax laws are likely to continue to occur, and we cannot assure you that any such changes will not adversely affect the taxation of a stockholder. Any such changes could have an adverse effect on an investment in our shares or on the market value or the resale potential of our assets. You are urged to consult with your tax advisor with respect to the impact of recent legislation on your investment in our shares and the status of legislative, regulatory or administrative developments and proposals and their potential effect on an investment in our shares. You also should note that our counsel’s tax opinion is based upon existing law, applicable as of the date of its opinion, all of which will be subject to change, either prospectively or retroactively.
Although REITs generally receive better tax treatment than entities taxed as regular corporations, it is possible that future legislation would result in a REIT having fewer tax advantages, and it could become more advantageous for a company that invests in real estate to elect to be treated for U.S. federal income tax purposes as a corporation. As a result, our charter provides our board of directors with the power, under certain circumstances, to revoke or otherwise terminate our REIT election and cause us to be taxed as a regular corporation, without the vote of our stockholders. Our board of directors has fiduciary duties to us and our stockholders and could only cause such changes in our tax treatment if it determines in good faith that such changes are in the best interest of our stockholders.
Potential characterization of distributions or gain on sale may be treated as unrelated business taxable income to tax-exempt investors.
If (a) we are a “pension-held REIT,” (b) a tax-exempt stockholder has incurred (or is deemed to have incurred) debt to purchase or hold our common stock or (c) a holder of common stock is a certain type of tax-exempt stockholder, dividends on, and gains recognized on the sale of, common stock by such tax-exempt stockholder may be subject to U.S. federal income tax as unrelated business taxable income under the Code.
Item 1B. Unresolved Staff Comments
None.
Item 2. Properties
We do not own any real estate or other physical properties materially important to our operation. Our principal executive offices are located at 245 Park Avenue, 42nd Floor, New York, NY 10167. Our principal executive and certain of our other offices are leased by our Manager or one of its affiliates from third parties and pursuant to the terms of our Management Agreement, we reimburse our Manager (or its affiliate, as applicable) for expenses (including our pro-rata portion of rent, telephone, printing, mailing, utilities, office furniture, equipment, machinery and other office, internal and overhead expenses)
45
relating to such offices, including disaster backup recovery sites and facilities maintained for us, our affiliates, our investments or our Manager or its affiliates required for our operation.
Item 3. Legal Proceedings
In the normal course of business, we may be subject to various legal proceedings from time to time. Furthermore, third parties may try to seek to impose liability on us in connection with our loans. As of December 31,
2018
, we were not subject to any material pending legal proceedings.
Item 4. Mine Safety Disclosures
Not applicable.
46
PART II
Item 5. Market For Registrant’s Common Equity, Related Stockholder Matters And Issuer Purchases Of Equity Securities
COMMON STOCK
Our common stock is listed for trading on the NYSE under the symbol “ACRE.” On
February 19, 2019
, the closing price of our common stock, as reported on the NYSE, was $14.11 per share.
HOLDERS
As of
February 19, 2019
, there were 41 holders of record of our common stock, including Cede & Co, which holds shares as nominee for the Depository Trust Company, which itself holds shares on behalf of the beneficial owners of shares of our common stock. This number does not include beneficial owners who hold shares of our common stock in nominee name. Such information was obtained through our registrar and transfer agent, based on the results of a broker search.
DISTRIBUTION POLICY
We elected to be taxed as a REIT for U.S. federal income tax purposes and, as such, anticipate annually distributing to our stockholders at least 90% of our REIT taxable income, determined without regard to the deduction for dividends paid and excluding net capital gains. To the extent that we distribute less than 100% of our REIT taxable income in any tax year (taking into account any distributions made in a subsequent tax year under Sections 857(b)(9) or 858 of the Code), we will pay tax at regular corporate rates on that undistributed portion. This 90% distribution requirement does not require the distribution of net capital gains. However, if a REIT elects to retain any of its net capital gain for any tax year, it must notify its stockholders and pay tax at regular corporate rates on the retained net capital gain.
For the year ended December 31, 2018
, we plan to satisfy the REIT distribution requirement in part with dividends paid in
2019
. For the year ended
December 31, 2017
, we elected to satisfy the REIT distribution requirement in part with a dividend paid in
2018
. Furthermore, if a REIT distributes less than the sum of 85% of its ordinary income for the calendar year, 95% of its capital gain net income for the calendar year plus any undistributed shortfall from its prior calendar year (the “Required Distribution”) to its stockholders during any calendar year (including any distributions declared by the last day of the calendar year but paid in January of the subsequent year), then it is required to pay non-deductible excise tax equal to 4% of any shortfall between the Required Distribution and the amount that was actually distributed. Any of these taxes would decrease cash available for distribution to our stockholders. For the
years ended December 31, 2018, 2017 and 2016
, we accrued an excise tax of
$362 thousand
,
$153 thousand
and
$209 thousand
, respectively. Excise tax payable is included in the line item “Other liabilities” in the consolidated balance sheets included in this annual report on Form 10-K. Excise tax expense is included in the line item “Income tax expense (benefit), including excise tax” in the consolidated statements of operations included in this annual report on Form 10-K.
We cannot assure our stockholders, however, that the current level of distributions will be sustained, as any distributions that we pay in the future will depend upon our actual results of operations, economic conditions and other factors that could materially alter our expectations. Before we make any distributions, whether for U.S. federal income tax purposes or otherwise, we must first meet both our operating requirements and debt service on the Financing Agreements and other debt payable. If our cash available for distribution is less than our REIT taxable income, we could be required to sell assets or borrow funds to make cash distributions or we may make a portion of the Required Distribution in the form of a taxable stock distribution or distribution of debt securities.
Any distributions we make to our stockholders will be at the discretion of our board of directors and will depend upon our earnings, financial condition, liquidity, debt covenants, funding or margin requirements under securitizations, warehouse facilities or other secured and unsecured borrowing agreements, maintenance of our REIT qualification, applicable provisions of the Maryland General Corporation Law, and such other factors as our board of directors deems relevant. The Financing Agreements provide that in an event of default, we may make distributions only to the extent necessary to maintain our status as a REIT. Our earnings, financial condition and liquidity will be affected by various factors, including the net interest and other income from our portfolio, our operating expenses and any other expenditures. See “Risk Factors” included in this annual report on Form 10-K.
Distributions that stockholders receive (not designated as capital gain dividends or qualified dividend income) will be taxed as ordinary income to the extent they are paid from our earnings and profits (as determined for U.S. federal income tax purposes). However, distributions that we designate as capital gain dividends generally will be taxable as long-term capital gain to our stockholders to the extent that they do not exceed our actual net capital gain for the taxable year. Some portion of these
47
distributions may not be subject to tax in the year in which they are received because depreciation expense reduces the amount of taxable income, but does not reduce cash available for distribution. The portion of our stockholders distribution that is not designated as a capital gain dividend and is in excess of our current and accumulated earnings and profits is considered a return of capital for U.S. federal income tax purposes and will reduce the adjusted tax basis of their investment, but not below zero, deferring such portion of their tax until their investment is sold or our company is liquidated, at which time they will be taxed at capital gain rates (subject to certain exceptions for corporate stockholders). To the extent such portion of our stockholders distribution exceeds the adjusted tax basis of their investment, such excess will be treated as capital gain if they hold their shares of common stock as a capital asset for U.S. federal income tax purposes. Depending on the level of taxable income earned in a tax year, we may choose to carry forward taxable income for distribution in the following year, and pay any applicable excise tax. We will furnish annually to each of our stockholders a statement setting forth distributions paid during the preceding year and their characterization as ordinary income, return of capital, qualified dividend income or capital gain. Please note that each stockholder’s tax considerations are different, therefore, our stockholders should consult with their own tax advisors and financial planners prior to making an investment in our shares.
RECENT SALES OF UNREGISTERED EQUITY SECURITIES
Stock Buyback Program
In May 2015, we announced that our board of directors authorized us to repurchase up to
$20.0 million
of our outstanding common stock over a period of
one
year (the “Stock Buyback Program”). In February 2016, the board of directors increased the size of the existing
$20.0 million
Stock Buyback Program to
$30.0 million
and extended the Stock Buyback Program through March 31, 2017. The Stock Buyback Program was not extended after March 31, 2017. Purchases made pursuant to the Stock Buyback Program could have been made in either the open market or in privately negotiated transactions, from time to time and as permitted by federal securities laws and other legal requirements. In connection with this Stock Buyback Program, in March 2016, we entered into a Rule 10b5-1 plan to repurchase shares of our common stock in accordance with certain parameters set forth in the Stock Buyback Program. For the years ended December 31, 2018 and 2017, we did not repurchase any shares of our common stock under our Stock Buyback Program.
48
STOCK PERFORMANCE GRAPH
Comparison of Cumulative Total Return
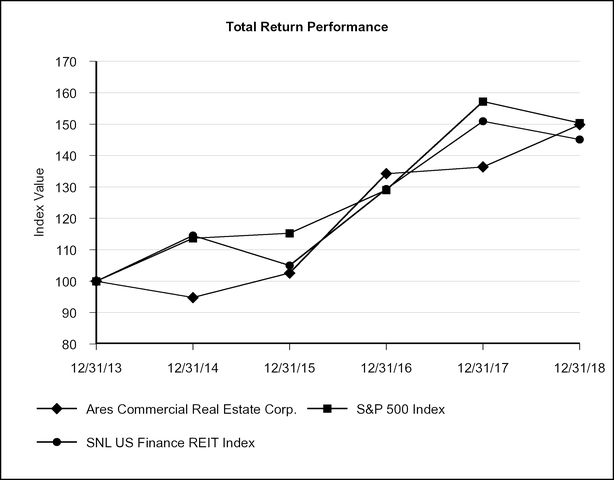
_______________________________________________________________________________
|
SOURCE:
|
S&P Global Market Intelligence
|
|
NOTES:
|
Assumes $100 invested on December 31, 2013 in ACRE, the S&P 500 Index and the SNL US Finance REIT Index. Assumes all dividends are reinvested on the respective dividend payment dates without commissions.
|
|
12/31/13
|
12/31/14
|
12/31/15
|
12/31/16
|
12/31/17
|
12/31/18
|
||||||||||||
|
ACRE
|
100.00
|
|
94.78
|
|
102.59
|
|
134.23
|
|
136.37
|
|
149.84
|
|
|||||
|
S&P 500 Index
|
100.00
|
|
113.69
|
|
115.26
|
|
129.05
|
|
157.22
|
|
150.33
|
|
|||||
|
SNL US Finance REIT Index
|
100.00
|
|
114.52
|
|
105.02
|
|
129.36
|
|
150.94
|
|
145.09
|
|
|||||
The stock performance graph and the table furnished above shall not be deemed to be “soliciting material” or to be “filed” with the SEC or subject to Regulation 14A or 14C, or to the liabilities of Section 18 of the Exchange Act.
SECURITIES AUTHORIZED FOR ISSUANCE UNDER EQUITY COMPENSATION PLANS
On April 23, 2012, we adopted an equity incentive plan. In April 2018, our board of directors authorized, and in June 2018, our stockholders approved, an amended and restated equity incentive plan (the “Amended and Restated 2012 Equity Incentive Plan”). Pursuant to our Amended and Restated 2012 Equity Incentive Plan, we may grant awards consisting of restricted shares of our common stock, restricted stock units and/or other equity-based awards to our directors, our Manager and its personnel and other eligible awardees under the plan, subject to an aggregate limitation of
1,390,000
shares of common stock. As of December 31,
2018
,
35.7%
of the shares reserved under our Amended and Restated 2012 Equity Incentive Plan, or a total of
495,756
restricted shares of our common stock, had been granted and
64.3%
of the shares reserved, or
894,244
shares
49
remained available for future issuance under our Amended and Restated 2012 Equity Incentive Plan. Aside from our Amended and Restated 2012 Equity Incentive Plan, we have no other compensation plans or arrangements under which our securities may be issued (whether or not approved by our stockholders). For further discussion of our Amended and Restated 2012 Equity Incentive Plan, see Note
6
to our consolidated financial statements included in this annual report on Form 10-K.
The following table presents certain information about our equity compensation plans as of December 31,
2018
:
|
Plan Category
|
Number of
securities to be issued upon exercise of outstanding options, warrants and rights |
Weighted-
average exercise price of outstanding options, warrants and rights |
Number of
securities remaining available for future issuance under equity compensation plans (excluding securities reflected in the first column of this table)(1) |
|||||||
|
Equity compensation plans approved by stockholders
|
—
|
|
$
|
—
|
|
894,244
|
|
|||
|
Equity compensation plans not approved by stockholders
|
—
|
|
—
|
|
—
|
|
||||
|
Total
|
—
|
|
$
|
—
|
|
894,244
|
|
|||
_____________________________________________________________________________
|
(1)
|
The securities shown in this column may be issued as restricted stock, restricted stock units and/or other equity-based awards to eligible awardees under our Amended and Restated 2012 Equity Incentive Plan.
|
Item 6. Selected Financial Data
The following selected financial and other data for the years ended December 31,
2018
,
2017
,
2016
, 2015 and 2014 is derived from our consolidated financial statements and related notes, which have been audited by Ernst & Young LLP, an independent registered public accounting firm whose report thereon is included elsewhere in this annual report on Form 10-K. The data should be read in conjunction with our consolidated financial statements and notes thereto and “Management’s Discussion and Analysis of Financial Condition and Results of Operations” included in this annual report on Form 10-K.
50
ARES COMMERCIAL REAL ESTATE CORPORATION AND SUBSIDIARIES
SELECTED FINANCIAL DATA
(in thousands, except share and per share data)
|
|
For the years ended December 31,
|
||||||||||||||||||
|
|
2018
|
2017
|
2016
|
|
2015
|
2014
|
|||||||||||||
|
Operating Data:
|
|||||||||||||||||||
|
Net interest margin, excluding non-controlling interests held by third parties
|
$
|
55,282
|
|
$
|
46,313
|
|
$
|
40,568
|
|
$
|
40,936
|
|
$
|
36,551
|
|
||||
|
Gain on sale of loans
|
—
|
|
—
|
|
—
|
|
—
|
|
680
|
|
|||||||||
|
Total expenses
|
16,240
|
|
14,970
|
|
14,426
|
|
13,671
|
|
14,549
|
|
|||||||||
|
Early extinguishment of debt costs
|
—
|
|
(768
|
)
|
—
|
|
—
|
|
—
|
|
|||||||||
|
Net income from continuing operations
|
38,596
|
|
30,432
|
|
30,451
|
|
36,335
|
|
22,749
|
|
|||||||||
|
Net income from operations of discontinued operations, net of income taxes
|
—
|
|
—
|
|
4,221
|
|
6,985
|
|
1,867
|
|
|||||||||
|
Gain on sale of discontinued operations
|
—
|
|
—
|
|
10,196
|
|
—
|
|
—
|
|
|||||||||
|
Net income attributable to common stockholders
|
$
|
38,596
|
|
$
|
30,407
|
|
$
|
40,336
|
|
$
|
34,285
|
|
$
|
24,396
|
|
||||
|
Basic weighted average shares of common stock outstanding
|
28,529,439
|
|
28,478,237
|
|
28,461,853
|
|
28,501,897
|
|
28,459,309
|
|
|||||||||
|
Diluted weighted average shares of common stock outstanding
|
28,656,660
|
|
28,550,945
|
|
28,523,306
|
|
28,597,568
|
|
28,585,022
|
|
|||||||||
|
Basic earnings per common share:
|
|||||||||||||||||||
|
Continuing operations
|
$
|
1.35
|
|
$
|
1.07
|
|
$
|
0.91
|
|
$
|
0.96
|
|
$
|
0.79
|
|
||||
|
Discontinued operations
|
—
|
|
—
|
|
0.51
|
|
0.25
|
|
0.07
|
|
|||||||||
|
Net income
|
$
|
1.35
|
|
$
|
1.07
|
|
$
|
1.42
|
|
$
|
1.20
|
|
$
|
0.86
|
|
||||
|
Diluted earnings per common share:
|
|||||||||||||||||||
|
Continuing operations
|
$
|
1.35
|
|
$
|
1.07
|
|
$
|
0.91
|
|
$
|
0.95
|
|
$
|
0.79
|
|
||||
|
Discontinued operations
|
—
|
|
—
|
|
0.51
|
|
0.24
|
|
0.07
|
|
|||||||||
|
Net income
|
$
|
1.35
|
|
$
|
1.07
|
|
$
|
1.41
|
|
$
|
1.20
|
|
$
|
0.85
|
|
||||
|
Dividends declared per share of common stock
|
$
|
1.16
|
|
$
|
1.08
|
|
$
|
1.04
|
|
$
|
1.00
|
|
$
|
1.00
|
|
||||
|
Balance Sheet Data:
|
|||||||||||||||||||
|
Loans held for investment
|
$
|
1,524,873
|
|
$
|
1,726,283
|
|
$
|
1,313,937
|
|
$
|
1,174,391
|
|
$
|
1,462,584
|
|
||||
|
Total assets
|
1,603,324
|
|
1,770,219
|
|
1,373,703
|
|
1,378,982
|
|
1,862,155
|
|
|||||||||
|
Secured funding agreements
|
777,974
|
|
957,960
|
|
780,713
|
|
522,775
|
|
552,799
|
|
|||||||||
|
Secured term loan
|
108,345
|
|
107,595
|
|
149,878
|
|
69,762
|
|
—
|
|
|||||||||
|
Total unsecured debt
|
—
|
|
—
|
|
—
|
|
—
|
|
67,414
|
|
|||||||||
|
Total securitizations debt
|
270,737
|
|
271,211
|
|
—
|
|
254,343
|
|
523,229
|
|
|||||||||
|
Total liabilities
|
1,177,737
|
|
1,351,049
|
|
944,030
|
|
922,494
|
|
1,381,269
|
|
|||||||||
|
Total stockholders' equity
|
425,587
|
|
419,170
|
|
419,029
|
|
409,471
|
|
402,954
|
|
|||||||||
|
Total equity
|
425,587
|
|
419,170
|
|
429,673
|
|
456,488
|
|
480,886
|
|
|||||||||
Item 7. Management’s Discussion And Analysis Of Financial Condition And Results Of Operations
We are a specialty finance company primarily engaged in originating and investing in commercial real estate (“CRE”) loans and related investments. We are externally managed by Ares Commercial Real Estate Management LLC (“ACREM” or our “Manager”), a subsidiary of Ares Management Corporation (NYSE: ARES) (“Ares Management”), a publicly traded, leading global alternative asset manager, pursuant to the terms of the management agreement dated April 25, 2012, as amended, between us and our Manager (the “Management Agreement”). From the commencement of our operations in late 2011, we have been primarily focused on directly originating and managing a diversified portfolio of CRE debt-related investments for our own account.
51
We were formed and commenced operations in late 2011. We are a Maryland corporation and completed our initial public offering in May 2012. We have elected and qualified to be taxed as a real estate investment trust (“REIT”) for U.S. federal income tax purposes under the Internal Revenue Code of 1986, as amended, commencing with our taxable year ended December 31, 2012. We generally will not be subject to U.S. federal income taxes on our REIT taxable income, determined without regard to the deduction for dividends paid and excluding net capital gains, to the extent that we annually distribute all of our REIT taxable income to stockholders and comply with various other requirements as a REIT. We also operate our business in a manner that is intended to permit us to maintain our exemption from registration under the Investment Company Act of 1940, as amended (the “1940 Act”).
Sale of Mortgage Banking Subsidiary
On June 28, 2016, we entered into a Purchase and Sale Agreement (as amended, the “Agreement”) with Barings Real Estate Advisers LLC (formerly known as Cornerstone Real Estate Advisers LLC), a Delaware limited liability company (the “Buyer”), to sell ACRE Capital Holdings LLC (“TRS Holdings”), the holding company that owned our mortgage banking subsidiary, ACRE Capital LLC (“ACRE Capital”). Under the terms and subject to the conditions set forth in the Agreement, on September 30, 2016, the Buyer purchased from us all of the outstanding common units of TRS Holdings (the “ACRE Capital Sale”). ACRE Capital primarily originated, sold and serviced multifamily and senior-living related loans under programs offered by government-sponsored enterprises and by government agencies.
Under the terms of the Agreement, the Buyer paid approximately $93 million in cash as consideration for the ACRE Capital Sale. We recognized a net gain on the sale of TRS Holdings of approximately $10.2 million.
As a result of the sale of TRS Holdings, the operations of the mortgage banking segment have been reclassified as discontinued operations in all periods presented. After giving effect to the ACRE Capital Sale, we now conduct and manage our business as one operating segment, rather than multiple operating segments; therefore, we no longer provide segment reporting.
Below are significant developments during the
year ended December 31, 2018
presented by quarter:
Developments During the First Quarter of
2018
:
|
•
|
ACRE originated a $16.7 million senior mortgage loan on the construction of a residential property located in California.
|
|
•
|
ACRE originated a $21.7 million senior mortgage loan on a multifamily property located in California.
|
|
•
|
ACRE originated a $56.1 million senior mortgage loan on a mixed-use property located in California.
|
|
•
|
ACRE exercised a 12-month extension option on the CNB Facility (as defined below) to extend the initial maturity date to March 10, 2019. ACRE has one additional 12-month extension option, which, if exercised, would extend the maturity date of the CNB Facility to March 10, 2020.
|
Developments During the Second Quarter of
2018
:
|
•
|
ACRE originated a $39.2 million senior mortgage loan on a multifamily property located in South Carolina.
|
|
•
|
ACRE originated a $32.9 million senior mortgage loan on a hotel property located in Illinois.
|
|
•
|
ACRE originated a $68.1 million senior mortgage loan on a portfolio of hotel properties located in Oregon and Washington.
|
|
•
|
ACRE originated a $15.3 million mezzanine loan on the construction of a mixed-use property located in Illinois.
|
|
•
|
ACRE originated a $59.6 million senior mortgage loan on an office property located in Illinois.
|
|
•
|
ACRE amended the BAML Facility (as defined below), which has a commitment amount of $125.0 million, to extend the period during which we may request individual loans under the facility to May 23, 2019. In addition, the final maturity date of individual loans under the BAML Facility was extended to May 23, 2022.
|
Developments During the Third Quarter of
2018
:
|
•
|
ACRE originated a $31.5 million senior mortgage loan on a hotel property located in Minnesota.
|
|
•
|
ACRE originated an $8.0 million pre-construction mezzanine loan on a property with in-place development rights for a residential condominium project located in Hawaii.
|
|
•
|
ACRE originated a $78.0 million senior mortgage loan on a hotel portfolio located across multiple states.
|
52
Developments During the Fourth Quarter of
2018
:
|
•
|
ACRE originated a $17.5 million pre-construction senior mortgage loan on a property with in-place development rights for a residential condominium project located in Florida.
|
|
•
|
ACRE originated a $14.0 million mezzanine construction loan on a property with in-place development rights for a residential condominium conversion project located in New York.
|
|
•
|
ACRE originated a $13.5 million senior mortgage loan on an office property located in North Carolina.
|
|
•
|
ACRE originated a $22.9 million senior mortgage loan on an office property located in California.
|
|
•
|
ACRE originated a $40.0 million senior mortgage loan on a multifamily property located in Illinois.
|
|
•
|
ACRE originated a $30.3 million senior mortgage loan on a multifamily property located in Pennsylvania.
|
|
•
|
ACRE originated a $43.5 million senior mortgage loan on a multifamily property located in Florida.
|
|
•
|
ACRE amended the Wells Fargo Facility (as defined below), which has a commitment amount of $500.0 million, to extend the initial maturity date to December 14, 2020 and decrease the interest rate on advances from a per annum rate equal to the sum of one-month LIBOR plus a pricing margin range of 1.75% to 2.35% to a per annum rate equal to the sum of one-month LIBOR plus a pricing margin range of 1.50% to 2.25%. The initial maturity date of the Wells Fargo Facility is subject to three 12-month extensions, each of which may be exercised at ACRE’s option, subject to the satisfaction of certain conditions, including payment of an extension fee, which, if all three were exercised, would extend the maturity date of the Wells Fargo Facility to December 14, 2023.
|
|
•
|
ACRE amended the Citibank Facility (as defined below) to increase the facility’s commitment amount from $250.0 million to $325.0 million and extend the initial maturity date to December 13, 2021. The initial maturity date of the Citibank Facility is subject to two 12-month extensions, each of which may be exercised at ACRE’s option assuming no existing defaults under the Citibank Facility and applicable extension fees being paid, which, if both were exercised, would extend the maturity date of the Citibank Facility to December 13, 2023. In addition, ACRE amended the Citibank Facility to decrease the interest rate on advances from a per annum rate equal to the sum of one-month LIBOR plus an indicative pricing margin range of 2.25% to 2.50%, subject to certain exceptions, to a per annum rate equal to the sum of one-month LIBOR plus an indicative pricing margin range of 1.50% to 2.25%, subject to certain exceptions.
|
Factors Impacting Our Operating Results
The results of our operations are affected by a number of factors and primarily depend on, among other things, the level of our net interest income, the market value of our assets and the supply of, and demand for, commercial mortgage loans, CRE debt and other financial assets in the marketplace. Our net interest income, which reflects the amortization of origination fees and direct costs, is recognized based on the contractual rate and the outstanding principal balance of the loans we originate. Interest rates will vary according to the type of investment, conditions in the financial markets, creditworthiness of our borrowers, competition and other factors, none of which can be predicted with any certainty. Our operating results may also be impacted by credit losses in excess of initial anticipations or unanticipated credit events experienced by borrowers.
Changes in Fair Value of Our Assets.
We originate CRE debt and related instruments generally to be held for investment. Loans that are held for investment are carried at cost, net of unamortized loan fees and origination costs, unless the loans are deemed impaired. Impairment occurs when it is deemed probable that we will not be able to collect all amounts due according to the contractual terms of the loan. If a loan is considered to be impaired, we will record an allowance to reduce the carrying value of the loan to the present value of expected future cash flows discounted at the loan’s contractual effective rate. Significant judgment is required when evaluating loans for impairment, therefore, actual results over time could be materially different.
Loans are generally collateralized by real estate and as a result, the extent and impact of any credit deterioration associated with the performance and/or value of the underlying collateral property, as well as the financial and operating capability of the borrower, are regularly evaluated. We monitor performance of our investment portfolio under the following methodology: (1) borrower review, which analyzes the borrower’s ability to execute on its original business plan, reviews its financial condition, assesses pending litigation and considers its general level of responsiveness and cooperation; (2) economic review, which considers underlying collateral (i.e., leasing performance, unit sales and cash flow of the collateral and its ability to cover debt service as well as the residual loan balance at maturity); (3) property review, which considers current environmental risks, changes in insurance costs or coverage, current site visibility, capital expenditures and market perception; and (4) market review, which analyzes the collateral from a supply and demand perspective of similar property types, as well as from a capital markets perspective. Such impairment analyses are completed and reviewed by asset management and finance personnel who utilize various data sources, including periodic financial data such as property occupancy, tenant profile, rental rates, operating expenses, and the borrower’s exit plan, among other factors. Other than as set forth in Note 3 to our
53
consolidated financial statements included in this annual report on Form 10-K,
as of December 31, 2018 and 2017
, all loans were paying in accordance with their contractual terms. There were no impairments during the
years ended December 31, 2018, 2017 and 2016
.
Although we generally hold our target investments as long-term investments, we may occasionally classify some of our investments as held for sale. Investments held for sale will be carried at fair value within loans held for sale in our consolidated balance sheets, with changes in fair value recorded through earnings. The fees received are deferred and recognized as part of the gain or loss on sale. At this time, we do not expect to hold any of our investments for trading purposes.
Changes in Market Interest Rates.
With respect to our business operations, increases in interest rates, in general, may over time cause:
|
•
|
the interest expense associated with our borrowings to increase, subject to any applicable ceilings;
|
|
•
|
the value of our mortgage loans to decline;
|
|
•
|
coupons on our floating rate mortgage loans to reset to higher interest rates; and
|
|
•
|
to the extent we enter into interest rate swap agreements as part of our hedging strategy where we pay fixed and receive floating interest rates, the value of these agreements to increase.
|
Conversely, decreases in interest rates, in general, may over time cause:
|
•
|
the interest expense associated with our borrowings to decrease, subject to any applicable floors;
|
|
•
|
the value of our mortgage loan portfolio to increase, for such mortgages with applicable floors;
|
|
•
|
coupons on our floating rate mortgage loans to reset to lower interest rates, subject to any applicable floors; and
|
|
•
|
to the extent we enter into interest rate swap agreements as part of our hedging strategy where we pay fixed and receive floating interest rates, the value of these agreements to decrease.
|
Credit Risk.
We are subject to varying degrees of credit risk in connection with our target investments. Our Manager seeks to mitigate this risk by seeking to originate or acquire investments of higher quality at appropriate prices with appropriate risk adjusted returns given anticipated and unanticipated losses, by employing a comprehensive review and selection process and by proactively monitoring originated or acquired investments (see the performance monitoring methodology above in Changes in Fair Value of Our Assets). Nevertheless, unanticipated credit losses could occur that could adversely impact our operating results and stockholders’ equity.
Market Conditions.
We believe that our target investments currently present attractive risk-adjusted return profiles, given the underlying property fundamentals and the competitive landscape for the type of capital we provide. We believe that growth in commercial real estate valuations has been supported by a lower supply of new properties, which broadly have remained below the long-term average since the onset of the global financial crisis. New additions to inventory have been limited given that new construction financing has been constrained by post-recession financial regulations. While the availability of debt capital for high quality assets has increased and led to more competitive pricing and terms, we continue to anticipate rising demand for the type of customized debt financing we provide from borrowers or sponsors. We also envision that demand for financing will be strong for situations in which a property is being acquired with plans to improve the net operating income through capital improvements, leasing, cost savings or other key initiatives and realize the improved value through a subsequent sale or refinancing. We believe market conditions continue to be favorable for disciplined and scaled direct lending with broad and flexible product offerings. However, we are mindful that rising interest rates and the removal of certain central banking monetary policies may impact asset values and could lead to periods of volatility. Ultimately, during periods of sustained volatility, increased lending opportunities may arise for flexible capital providers like us.
Performance of Commercial Real Estate Related Markets.
Our business is dependent on the general demand for, and value of, commercial real estate and related services, which are sensitive to economic conditions. Demand for multifamily and other commercial real estate generally increases during periods of stronger economic conditions, resulting in increased property values, transaction volumes and loan origination volumes. During periods of weaker economic conditions, multifamily and
54
other commercial real estate may experience higher property vacancies, lower demand and reduced values. These conditions can result in lower property transaction volumes and loan originations.
Availability of Leverage and Equity.
We expect to use leverage to make additional investments that may increase our potential returns. We may not be able to obtain the amount of leverage we desire and, consequently, the returns generated from our investments may be less than we currently expect. To grow our portfolio of investments, we also may determine to raise additional equity. Our access to additional equity will depend on many factors, and our ability to raise equity in the future cannot be predicted at this time.
Size of Portfolio.
The size of our portfolio of investments, as measured both by the aggregate principal balance and the number of our CRE loans and our other investments, will also be an important factor in determining our operating results. Generally, as the size of our portfolio grows, the amount of interest income we receive will increase and we may achieve certain economies of scale and diversify risk within our portfolio investments. A larger portfolio, however, may result in increased expenses; for example, we may incur additional interest expense or other costs to finance our investments. Also, if the aggregate principal balance of our portfolio grows but the number of our loans or the number of our borrowers does not grow, we could face increased risk by reason of the concentration of our investments.
Investment Portfolio
As of
December 31, 2018
, our portfolio included
44
loans held for investment, excluding
76
loans that were repaid or sold since inception. Such investments are referred to herein as our investment portfolio. As of
December 31, 2018
, the aggregate originated commitment under these loans at closing was approximately $
1.7 billion
and outstanding principal was $
1.5 billion
. During the
year ended December 31, 2018
, we funded approximately $
544.2 million
of outstanding principal and received repayments of $
746.8 million
of outstanding principal. As of
December 31, 2018
,
89.8%
of our loans have London Interbank Offered Rate (“LIBOR”) floors, with a weighted average floor of
1.38%
, calculated based on loans with LIBOR floors. References to LIBOR or “L” are to 30-day LIBOR (unless otherwise specifically stated).
Other than as set forth in Note 3 to our consolidated financial statements included in this annual report on Form 10-K, as of
December 31, 2018
, all loans were paying in accordance with their contractual terms. During the
year ended December 31, 2018
, there were no impairments with respect to our loans held for investment.
Our loans held for investment are accounted for at amortized cost. The following table summarizes our loans held for investment as of
December 31, 2018
($ in thousands):
|
|
As of December 31, 2018
|
||||||||||||||
|
Carrying Amount (1)
|
Outstanding Principal (1)
|
Weighted Average Minimum Loan Borrowing Spread (2)
|
Weighted Average Unleveraged Effective Yield (3)
|
Weighted Average Remaining Life (Years)
|
|||||||||||
|
Senior mortgage loans
|
$
|
1,489,708
|
|
$
|
1,498,530
|
|
5.2
|
%
|
7.0
|
%
|
1.7
|
||||
|
Subordinated debt and preferred equity investments
|
35,165
|
|
36,213
|
|
12.7
|
%
|
14.9
|
%
|
4.3
|
||||||
|
Total loans held for investment portfolio
|
$
|
1,524,873
|
|
$
|
1,534,743
|
|
5.4
|
%
|
7.1
|
%
|
1.8
|
||||
_____________________________________________________________________________
|
(1)
|
The difference between the Carrying Amount and the Outstanding Principal amount of the loans held for investment consists of unamortized purchase discount, deferred loan fees and loan origination costs.
|
|
(2)
|
Minimum Loan Borrowing Spread is equal to (a) for floating rate loans, the margin above the applicable index rate (e.g., LIBOR) plus floors, if any, on such applicable index rates, and (b) for fixed rate loans, the applicable interest rate.
|
|
(3)
|
Unleveraged Effective Yield is the compounded effective rate of return that would be earned over the life of the investment based on the contractual interest rate (adjusted for any deferred loan fees, costs, premiums or discounts) and assumes
no
dispositions, early prepayments or defaults. The total Weighted Average Unleveraged Effective Yield is calculated based on the average of Unleveraged Effective Yield of all loans held by us as of
December 31, 2018
as weighted by the outstanding principal balance of each loan.
|
55
Non-Controlling Interests
The non-controlling interests held by third parties in our consolidated financial statements represent the equity interests in ACRC KA Investor LLC (“ACRC KA”) that are not owned by us. In January 2017, our investment in ACRC KA was repaid in full. Accordingly, as of December 31, 2017, our investment was no longer outstanding. See Notes 6 and 12 to our consolidated financial statements included in this annual report on Form 10-K for more information about ACRC KA.
Critical Accounting Policies
Our consolidated financial statements have been prepared in accordance with generally accepted accounting principles (“GAAP”), which require management to make estimates and assumptions that affect reported amounts. The estimates and assumptions are based on historical experience and other factors management believes to be reasonable. Actual results may differ from those estimates and assumptions. We believe the following critical accounting policy represents an area where more significant judgments and estimates are used in the preparation of our consolidated financial statements.
Impairment of Loans Held for Investment.
We originate CRE debt and related instruments generally to be held for investment. Loans that are held for investment are carried at cost, net of unamortized loan fees and origination costs, unless the loans are deemed impaired. Impairment occurs when it is deemed probable that we will not be able to collect all amounts due according to the contractual terms of the loan. If a loan is considered to be impaired, we will record an allowance to reduce the carrying value of the loan to the present value of expected future cash flows discounted at the loan’s contractual effective rate. Significant judgment is required when evaluating loans for impairment, therefore, actual results over time could be materially different.
Each loan classified as held for investment is evaluated for impairment on a quarterly basis. Loans are generally collateralized by real estate or the equity of the real estate owner. The extent of any credit deterioration associated with the performance and/or value of the underlying collateral property and the financial and operating capability of the borrower could impact the expected amounts received.
Recent Accounting Pronouncements
See Note
2
to our consolidated financial statements included in this annual report on Form 10-K, which describes recent accounting pronouncements that we have adopted or are currently evaluating.
RECENT DEVELOPMENTS
On January 11, 2019, ACRE Commercial Mortgage 2017-FL3 Ltd. (the “Issuer”) and ACRE Commercial Mortgage
2017-FL3 LLC (the “Co-Issuer”), both wholly-owned indirect subsidiaries of ours, entered into an Amended and Restated Indenture (the “Amended Indenture”) with Wells Fargo Bank, National Association, as advancing agent and note administrator, and Wilmington Trust, National Association, as trustee, which governs the approximately $504.1 million principal balance of secured floating rate notes issued by the Issuer and $52.9 million of preferred equity in the Issuer (the “2019 FL3 CLO Securitization”). The Amended Indenture amends and restates, and replaces in its entirety, the indenture for the CLO Securitization issued in March 2017, which governed the issuance of approximately $308.8 million principal balance of secured floating rate notes and $32.4 million of preferred equity in the Issuer. After giving effect to the 2019 FL3 CLO Securitization, we retained (through one of our wholly-owned subsidiaries) approximately $58.5 million of the non-investment grade notes and all of the $52.9 million of preferred equity in the Issuer, which notes and preferred equity were not offered to investors. The secured floating rate notes are collateralized by interests in a pool of 17 mortgage assets having an aggregate principal balance of $557.0 million.
On February 6, 2019, we originated and fully funded a
$30.0 million
senior mortgage loan on a student housing property located in North Carolina. The loan has a per annum interest rate of LIBOR plus a spread of
3.15%
(plus fees) and an initial term of
three
years.
On February 14, 2019, we originated a $100.6 million senior mortgage loan on a mixed-use property located in Florida. At closing, the outstanding principal balance was approximately $37.0 million. The loan has a per annum interest rate of LIBOR plus 4.25% (plus fees) and an initial term of two years.
On
February 21, 2019
, we declared a cash dividend of $
0.33
per common share for the first quarter of
2019
. The first quarter
2019
dividend is payable on
April 16, 2019
to common stockholders of record on
March 29, 2019
.
56
RESULTS OF OPERATIONS
The following table sets forth a summary of our consolidated results of operations for the
years ended December 31, 2018, 2017 and 2016
($ in thousands):
|
|
For the years ended December 31,
|
||||||||||
|
|
2018
|
2017
|
2016
|
||||||||
|
Net interest margin
|
$
|
55,282
|
|
$
|
46,348
|
|
$
|
45,107
|
|
||
|
Total expenses
|
16,240
|
|
14,970
|
|
14,426
|
|
|||||
|
Early extinguishment of debt costs
|
—
|
|
(768
|
)
|
—
|
|
|||||
|
Income from continuing operations before income taxes
|
39,042
|
|
30,610
|
|
30,681
|
|
|||||
|
Income tax expense, including excise tax
|
446
|
|
178
|
|
230
|
|
|||||
|
Net income from continuing operations
|
38,596
|
|
30,432
|
|
30,451
|
|
|||||
|
Net income from operations of discontinued operations, net of income taxes
|
—
|
|
—
|
|
4,221
|
|
|||||
|
Gain on sale of discontinued operations
|
—
|
|
—
|
|
10,196
|
|
|||||
|
Net income attributable to ACRE
|
38,596
|
|
30,432
|
|
44,868
|
|
|||||
|
Less: Net income attributable to non-controlling interests
|
—
|
|
(25
|
)
|
(4,532
|
)
|
|||||
|
Net income attributable to common stockholders
|
$
|
38,596
|
|
$
|
30,407
|
|
$
|
40,336
|
|
||
The following tables set forth select details of our consolidated results of operations from continuing operations for the
years ended December 31, 2018, 2017 and 2016
($ in thousands):
Net Interest Margin
|
|
For the years ended December 31,
|
||||||||||
|
|
2018
|
2017
|
2016
|
||||||||
|
Interest income from loans held for investment
|
$
|
118,284
|
|
$
|
97,541
|
|
$
|
81,963
|
|
||
|
Interest expense
|
(63,002
|
)
|
(51,193
|
)
|
(36,856
|
)
|
|||||
|
Net interest margin
|
$
|
55,282
|
|
$
|
46,348
|
|
$
|
45,107
|
|
||
F
or the
years ended December 31, 2018 and 2017
, net interest margin wa
s approximately $
55.3
million and $46.3 million, respectively. For the
years ended December 31, 2018 and 2017
, interest income from loans held for investment of $
118.3
million and $97.5 million, respectively, was generated by weighted average earning assets of $
1.7
billion and $1.5 billion, respectively, offset by $
63.0
million and $51.2 million, respectively, of interest expense, unused fees and amortization of deferred loan costs. The weighted average borrowings under the Wells Fargo Facility, the Citibank Facility, the BAML Facility, the CNB Facility, the MetLife Facility, the UBS Facility and the U.S. Bank Facility (individually defined below and collectively, the “Secured Funding Agreements”) and securitization debt and the Secured Term Loan (as defined below) were $
1.3
billion and $1.1 billion for the
years ended December 31, 2018 and 2017
, respectively. The increase in interest income from loans held for investment and interest expense for the
year ended December 31, 2018
compared to the
year ended December 31, 2017
primarily relates to an increase in our weighted average earnings assets and weighted average borrowings as well as an increase in 30-day LIBOR for the
year ended December 31, 2018
.
For the years ended December 31, 2017 and 2016, net interest margin was approximately $46.3 million and $45.1 million, respectively. For the years ended December 31, 2017 and 2016, interest income from loans held for investment of $97.5 million and $82.0 million, respectively, was generated by weighted average earning assets of $1.5 billion and $1.3 billion, respectively, offset by $51.2 million and $36.9 million, respectively, of interest expense, unused fees and amortization of deferred loan costs. The weighted average borrowings under the Secured Funding Agreements and securitization debt and the Secured Term Loan were $1.1 billion and $889.5 million for the years ended December 31, 2017 and 2016, respectively. The increase in interest income from loans held for investment and interest expense for the year ended December 31, 2017 compared to the year ended December 31, 2016 primarily relates to an increase in our weighted average earnings assets and weighted average borrowings for the year ended December 31, 2017.
57
Operating Expenses
The operating expenses below do not include expenses of ACRE Capital
.
See Note
13
to our consolidated financial statements included in this annual report on Form 10-K for more information about the operating expenses of ACRE Capital.
|
|
For the years ended December 31,
|
||||||||||
|
|
2018
|
2017
|
2016
|
||||||||
|
Management and incentive fees to affiliate
|
$
|
7,418
|
|
$
|
6,569
|
|
$
|
5,956
|
|
||
|
Professional fees
|
1,945
|
|
1,674
|
|
2,228
|
|
|||||
|
General and administrative expenses
|
3,307
|
|
2,828
|
|
2,801
|
|
|||||
|
General and administrative expenses reimbursed to affiliate
|
3,570
|
|
3,899
|
|
3,441
|
|
|||||
|
Total expenses
|
$
|
16,240
|
|
$
|
14,970
|
|
$
|
14,426
|
|
||
For the
years ended December 31, 2018 and 2017
, we incurred operating expenses of
$
16.2
million an
d $15.0 million, respectively. As discussed below, the in
crease
in operating expens
es for the
year ended December 31, 2018
compared to the
year ended December 31, 2017
primarily relates to an increase in incentive fees due to our Manager, an increase in stock-based compensation expense and an increase in our use of third party professionals due to changes in transaction activity year over year.
For the years ended December 31, 2017 and 2016, we incurred operating expenses of $15.0 million and $14.4 million, respectively. As discussed below, the increase in operating expenses for the year ended December 31, 2017 compared to the year ended December 31, 2016 primarily relates to an increase in management fees and general and administrative expenses due to our Manager that were allocated to continuing operations for the year ended December 31, 2017 and partially offset by a decrease in our use of third party professionals due to changes in transaction activity year over year.
Related Party Expenses
For the
year ended December 31, 2018
, related party expenses included
$7.4 million
in management and incentive fees due to our Manager pursuant to the Management Agreement, which consisted of $
6.3
million in management fees and
$1.2
million in incentive fees. For the
year ended December 31, 2018
, related party expenses also included $
3.6
million for our share of allocable general and administrative expenses for which we were required to reimburse our Manager pursuant to the Management Agreement.
For the year ended
December 31, 2017
, related party expenses inc
luded $6.6 million in management and incentive fees due to our Manager pursuant to the Management Agreement, which consisted of $6.2 million in management fees and $0.4 million in incentive fees.
For the year ended
December 31, 2017
, related party expenses also included $3.9 million for our share of allocable general and administrative expenses for which we were required to reimburse our Manager pursuant to the Management Agreement. The management fees due to our Manager were relatively consistent for both periods. The increase in incentive fees due to our Manager for the
year ended December 31, 2018
compared to the
year ended December 31, 2017
primarily relates to an increase in our Core Earnings (as defined below) for the
year ended December 31, 2018
. “Core Earnings” is a non-GAAP measure and is defined as GAAP net income (loss) computed in accordance with GAAP, excluding non-cash equity compensation expense, the incentive fee, depreciation and amortization (to the extent that any of our target investments are structured as debt and we foreclose on any properties underlying such debt), any unrealized gains, losses or other non-cash items recorded in net income (loss) for the period, regardless of whether such items are included in other comprehensive income or loss, or in net income (loss), and one-time events pursuant to changes in GAAP and certain non-cash charges after discussions between our Manager and our independent directors and after approval by a majority of our independent directors. The decrease in general and administrative expenses due to our Manager for the
year ended December 31, 2018
compared to the
year ended December 31, 2017
primarily relates to a decrease in the percentage of time allocated to us by employees of our Manager due to changes in transaction activity year over year.
For the year ended
December 31, 2017
, related party expenses inc
luded $6.6 million in management and incentive fees due to our Manager pursuant to the Management Agreement, which consisted of $6.2 million in management fees and $0.4 million in incentive fees.
For the year ended
December 31, 2017
, related party expenses also included $3.9 million for our share of allocable general and administrative expenses for which we were required to reimburse our Manager pursuant to the Management Agreement. For the year ended December 31, 2016, related party expenses included $6.0 million in management and incentive fees due to our Manager pursuant to the Management Agreement, which consisted of $5.6 million in management fees and $0.3 million in incentive fees. For the year ended December 31, 2016, related party expenses also included $3.4 million for our share of allocable general and administrative expenses for which we were required to reimburse our Manager
58
pursuant to the Management Agreement. The increase in management fees due to our Manager for the year ended December 31, 2017 compared to the year ended December 31, 2016 primarily relates to an increase in management fees that were allocated to continuing operations subsequent to the closing of the ACRE Capital Sale on September 30, 2016. The incentive fees due to our Manager were relatively consistent for both periods. The increase in general and administrative expenses due to our Manager for the year ended December 31, 2017 compared to the year ended December 31, 2016 primarily relates to an increase in general and administrative expenses that were allocated to continuing operations as employees of our Manager allocated a significant percentage of their time during the year ended December 31, 2016 to discontinued operations for due diligence work associated with the closing of the ACRE Capital Sale.
Other Expenses
For the
years ended December 31, 2018 and 2017
, professional fees
were $
1.9
million an
d
$1.7 million, respectively. The increase in professional fees for the
year ended December 31, 2018
compared to the
year ended December 31, 2017
primarily relates to an increase in our use of third party professionals due to changes in transaction activity year over year. For the
years ended December 31, 2018 and 2017
, general and administrative expenses were $
3.3
million and $2.8 million, respectively. The increase in general and administrative expenses for the
year ended December 31, 2018
compared to the
year ended December 31, 2017
primarily relates to an increase in stock-based compensation expense due to new restricted stock grants awarded after December 31, 2017.
For the years ended December 31, 2017 and 2016, professional fees were $1.7 million and $2.2 million, respectively. The decrease in professional fees for the year ended December 31, 2017 compared to the year ended December 31, 2016 primarily relates to a decrease in our use of third party professionals due to changes in transaction activity year over year. For both the years ended December 31, 2017 and 2016, general and administrative expenses were $2.8 million.
Early Extinguishment of Debt Costs
In December 2017, we voluntarily elected to repay $45.0 million of outstanding principal on our Secured Term Loan (as defined below) prior to the scheduled maturity as permitted by the contractual terms of the Secured Term Loan. For the year ended December 31, 2017, we incurred early extinguishment of debt costs of $0.8 million, which was a non-cash charge incurred in connection with the $45.0 million repayment of outstanding principal on the Secured Term Loan. The early extinguishment of debt costs was comprised of the pro-rata share of the unamortized deferred debt issuance costs and original issue discounts being allocated to the outstanding principal that was repaid.
LIQUIDITY AND CAPITAL RESOURCES
Liquidity is a measure of our ability to meet potential cash requirements, including ongoing commitments to repay
borrowings, fund and maintain our assets and operations, make distributions to our stockholders and other general business needs. We use significant cash to purchase our target investments, make principal and interest payments on our borrowings, make distributions to our stockholders and fund our operations. Our primary sources of cash generally consist of unused borrowing capacity under our Secured Funding Agreements, the net proceeds of future offerings, payments of principal and interest we receive on our portfolio of assets and cash generated from our operating activities. However, principal repayments from mortgage loans in securitizations where we retain the subordinate securities are applied sequentially, first used to pay down the senior notes, and accordingly, we will not receive any proceeds from repayment of loans in the securitizations until all senior notes are repaid in full. Subject to maintaining our qualification as a REIT and our exemption from the 1940 Act, we expect that our primary sources of financing will be, to the extent available to us, through (a) credit, secured funding and other lending facilities, (b) securitizations, (c) other sources of private financing, including warehouse and repurchase facilities, and (d) public or private offerings of our equity or debt securities. We may seek to sell certain of our investments in order to manage liquidity needs, interest rate risk, meet other operating objectives and adapt to market conditions. In instances where we do not have sufficient available liquidity to originate mortgage loans, Ares Management or one of its investment vehicles may originate such mortgage loans and we may have the opportunity to purchase such loans that are determined by our Manager in good faith to be appropriate for us, once we have sufficient available liquidity.
Equity Offerings
There were no shares issued in public offerings of our equity securities for the
years ended December 31, 2018, 2017 and 2016
.
59
Cash Flows
The following table sets forth changes in cash, cash equivalents and restricted cash for the
years ended December 31, 2018, 2017 and 2016
, which are inclusive of amounts related to discontinued operations ($ in thousands):
|
|
For the years ended December 31,
|
||||||||||
|
2018
|
2017
|
2016
|
|||||||||
|
Net income
|
$
|
38,596
|
|
$
|
30,432
|
|
$
|
44,868
|
|
||
|
Adjustments to reconcile net income to net cash provided by (used in) operating activities:
|
622
|
|
844
|
|
(49,358
|
)
|
|||||
|
Net cash provided by (used in) operating activities
|
39,218
|
|
31,276
|
|
(4,490
|
)
|
|||||
|
Net cash provided by (used in) investing activities
|
157,924
|
|
(405,768
|
)
|
(60,297
|
)
|
|||||
|
Net cash provided by (used in) financing activities
|
(214,396
|
)
|
355,569
|
|
73,057
|
|
|||||
|
Change in cash, cash equivalents and restricted cash
|
$
|
(17,254
|
)
|
$
|
(18,923
|
)
|
$
|
8,270
|
|
||
During the
years ended December 31, 2018, 2017 and 2016
, cash, cash equivalents and restricted cash increased (decreased) by $
(17.3)
million, $(18.9) million and $8.3 million, respectively.
Operating Activities
For the
years ended December 31, 2018 and 2017
, net cash provided by operating activities totaled $
39.2
million and $31.3 million, respectively. For the
year ended December 31, 2018
, adjustments to net income related to operating activities primarily included accretion of deferred loan origination fees and costs of $
6.9
million and amortization of deferred financing costs of $
5.7
million. For the
year ended December 31, 2017
, adjustments to net income related to operating activities primarily included accretion of deferred loan origination fees and costs of $6.6 million, amortization of deferred financing costs of $7.6 million and change in other assets of $2.5 million.
For the years ended December 31, 2017 and 2016, net cash provided by (used in) operating activities totaled $31.3 million and $(4.5) million, respectively. This change in net cash provided by (used in) operating activities was primarily related to the cash used to originate and fund mortgage loans held for sale exceeding the proceeds received from the sale of mortgage loans held for sale to third parties for the year ended December 31, 2016. For the year ended December 31, 2017, adjustments to net income related to operating activities primarily included accretion of deferred loan origination fees and costs of $6.6 million, amortization of deferred financing costs of $7.6 million and change in other assets of $2.5 million. For the year ended December 31, 2016, adjustments to net income related to operating activities primarily included originations of mortgage loans held for sale of $639.4 million, sale of mortgage loans held for sale to third parties of $571.7 million, change in the fair value of mortgage servicing rights (“MSRs”) of $6.5 million, gain on sale of discontinued operations of $10.2 million, change in other assets of $40.0 million and change in other liabilities of $10.1 million.
Investing Activities
For the
years ended December 31, 2018 and 2017
, net cash provided by (used in) investing activities totaled $
157.9
million and $(405.8) million, respectively. This change in net cash provided by (used in) investing activities was primarily as a result of the cash received from principal repayment of loans held for investment exceeding the cash used for the origination of new loans held for investment for the
year ended December 31, 2018
.
For the years ended December 31, 2017 and 2016, net cash used in investing activities totaled $405.8 million and $60.3 million, respectively. This change in net cash used in investing activities was primarily as a result of the cash used for the origination of new loans held for investment exceeding the cash received from principal repayment of loans held for investment and proceeds from the sale of mortgage loans held for sale for the year ended December 31, 2017.
Financing Activities
For the
year ended December 31, 2018
, net cash used in financing activities totaled $
214.4
million and primarily related to repayments of our Secured Funding Agreements of $
822.2
million and dividends paid of
$32.1 million
, partially offset by proceeds from our Secured Funding Agreements of $
642.2
million.
60
For the year ended December 31, 2017, net cash provided by financing activities totaled $355.6 million and primarily related to proceeds from our Secured Funding Agreements of $923.9 million and proceeds from the issuance of debt of consolidated VIEs of $272.9 million, partially offset by repayments of our Secured Funding Agreements of $746.6 million, repayments of our Secured Term Loan (as defined below) of $45.0 million and dividends paid of $30.5 million.
For the year ended December 31, 2016, net cash provided by financing activities totaled $73.1 million and primarily related to proceeds from our Secured Funding Agreements of $1.3 billion, proceeds from our Warehouse Lines of Credit (as defined below) of $863.4 million and proceeds from our Secured Term Loan (as defined below) of $80.0 million, partially offset by repayments of our Secured Funding Agreements of $1.0 billion, repayments of debt of consolidated VIEs of $255.3 million, repayments of our Warehouse Lines of Credit of $795.7 million and dividends paid of $29.4 million.
We, through our previously owned subsidiary, ACRE Capital, borrowed funds under the ASAP Line of Credit and the BAML Line of Credit (individually defined below and together, the “Warehouse Lines of Credit”). ACRE Capital was party to an $80.0 million multifamily as soon as pooled sale agreement (the “ASAP Line of Credit”) with the Federal National Mortgage Association (“Fannie Mae”) to finance installments received from Fannie Mae. ACRE Capital was party to a $135.0 million line of credit agreement with Bank of America, N.A. (as amended and restated, the “BAML Line of Credit”), which was used to finance mortgage loans originated by ACRE Capital.
Summary of Financing Agreements
The sources of financing, as applicable in a given period, under our Secured Funding Agreements and the Secured Term Loan (collectively, the “Financing Agreements”) are described in the following table ($ in thousands):
|
As of December 31,
|
|||||||||||||||||||||||||
|
2018
|
2017
|
||||||||||||||||||||||||
|
Total
Commitment |
Outstanding Balance
|
Interest Rate
|
Maturity Date
|
Total
Commitment |
Outstanding Balance
|
Interest Rate
|
Maturity Date
|
||||||||||||||||||
|
Secured Funding Agreements:
|
|||||||||||||||||||||||||
|
Wells Fargo Facility
|
$
|
500,000
|
|
|
$
|
274,071
|
|
LIBOR+1.50 to 2.25%
|
|
December 14, 2020
|
(1)
|
$
|
500,000
|
|
$
|
407,853
|
|
LIBOR+1.75 to 2.35%
|
December 14, 2018
|
(1)
|
|||||
|
Citibank Facility
|
325,000
|
|
|
184,003
|
|
LIBOR+1.50 to 2.50%
|
|
December 13, 2021
|
(2)
|
250,000
|
|
(2)
|
175,651
|
|
LIBOR+2.25 to 2.50%
|
December 10, 2018
|
(2)
|
||||||||
|
BAML Facility
|
125,000
|
|
|
36,280
|
|
LIBOR+2.00%
|
|
May 23, 2019
|
(3)
|
125,000
|
|
78,320
|
|
LIBOR+2.00%
|
May 24, 2018
|
(3)
|
|||||||||
|
CNB Facility
|
50,000
|
|
|
—
|
|
LIBOR+3.00%
|
|
March 10, 2019
|
(4)
|
50,000
|
|
—
|
|
LIBOR+3.00%
|
March 11, 2018
|
(4)
|
|||||||||
|
MetLife Facility
|
180,000
|
|
|
135,145
|
|
LIBOR+2.30%
|
|
August 12, 2020
|
(5)
|
180,000
|
|
101,131
|
|
LIBOR+2.30%
|
August 12, 2020
|
(5)
|
|||||||||
|
UBS Facility
|
—
|
|
|
—
|
|
—
|
—
|
(6)
|
140,000
|
|
34,000
|
|
LIBOR+1.88 to 2.28%
|
(6)
|
October 21, 2018
|
||||||||||
|
U.S. Bank Facility
|
185,989
|
|
|
148,475
|
|
LIBOR+1.75 to 2.25%
|
|
July 31, 2020
|
(7)
|
185,989
|
|
161,005
|
|
LIBOR+1.85 to 2.25%
|
July 31, 2020
|
(7)
|
|||||||||
|
Subtotal
|
$
|
1,365,989
|
|
$
|
777,974
|
|
$
|
1,430,989
|
|
$
|
957,960
|
|
|||||||||||||
|
Secured Term Loan
|
$
|
110,000
|
|
|
$
|
110,000
|
|
LIBOR+5.00%
|
|
December 22, 2020
|
(8)
|
$
|
110,000
|
|
$
|
110,000
|
|
LIBOR+5.00%
|
December 22, 2020
|
(8)
|
|||||
|
Total
|
$
|
1,475,989
|
|
$
|
887,974
|
|
$
|
1,540,989
|
|
$
|
1,067,960
|
|
|||||||||||||
______________________________________________________________________________
|
(1)
|
The maturity date of the master repurchase funding facility with Wells Fargo Bank, National Association (the “Wells Fargo Facility”) is subject to three 12-month extensions at our option provided that certain conditions are met and applicable extension fees are paid. In December 2018, we amended the Wells Fargo Facility to extend the initial maturity date to December 14, 2020 and decrease the interest rate on advances to a per annum rate equal to the sum of one-month LIBOR plus a pricing margin range of 1.50% to 2.25%.
|
|
(2)
|
The maturity date of the master repurchase facility with Citibank, N.A. (the “Citibank Facility”) is subject to two 12-month extensions at our option provided that certain conditions are met and applicable extension fees are paid. As of December 31, 2017, the Citibank Facility had an accordion feature that provided for an increase in the $250.0 million commitment amount with respect to approved assets, as determined by Citibank, N.A. in its sole discretion. In December 2018, we amended the Citibank Facility to increase the facility’s commitment amount from $250.0 million to $325.0 million, extend the initial maturity date to December 13, 2021, decrease the interest rate on advances to a per
|
61
annum rate equal to the sum of one-month LIBOR plus an indicative pricing margin range of 1.50% to 2.25% and remove the accordion feature.
|
(3)
|
Individual advances on loans under the Bridge Loan Warehousing Credit and Security Agreement with Bank of America, N.A. (the “BAML Facility”) generally have a two-year maturity, subject to a 12-month extension at our option provided that certain conditions are met and applicable extension fees are paid. In May 2018, we amended the BAML Facility to extend the period during which we may request individual loans under the facility to May 23, 2019. In addition, the final maturity date of individual loans under the BAML Facility was extended to May 23, 2022.
|
|
(4)
|
The maturity date of the secured revolving funding facility with City National Bank (the “CNB Facility”) is subject to one 12-month extension at our option provided that certain conditions are met and applicable extension fees are paid. In February 2018, we exercised a 12-month extension option on the CNB Facility to extend the maturity date to March 10, 2019.
|
|
(5)
|
The maturity date of the revolving master repurchase facility with Metropolitan Life Insurance Company (the “MetLife Facility”) is subject to two 12-month extensions at our option provided that certain conditions are met and applicable extension fees are paid.
|
|
(6)
|
The interest rate on advances under the revolving master repurchase facility with UBS Real Estate Securities Inc. (the “UBS Facility”) was the sum of one-month LIBOR plus (i) 1.88% per annum, for assets that were subject to an advance for one year or less, (ii) 2.08% per annum, for assets that were subject to an advance in excess of one year but less than two years, and (iii) 2.28% per annum, for assets that were subject to an advance for more than two years. In October 2018, the UBS Facility matured. The UBS Facility had been repaid in full and its term was not extended.
|
|
(7)
|
The maturity date of the master repurchase and securities contract with U.S. Bank National Association (the “U.S. Bank Facility”) is subject to two 12-month extensions at our option provided that certain conditions are met and applicable extension fees are paid.
|
|
(8)
|
The maturity date of the Credit and Guaranty Agreement with the lenders referred to therein and Cortland Capital Market Services LLC, as administrative agent and collateral agent for the lenders (the “Secured Term Loan”), is subject to one 12-month extension at our option provided that certain conditions are met.
|
Our Financing Agreements contain various affirmative and negative covenants, including negative pledges, and provisions related to events of default that are normal and customary for similar financing agreements. As of
December 31, 2018
, we were in compliance with all financial covenants of each respective Financing Agreement. See Note
4
to our consolidated financial statements included in this annual report on Form 10-K for more information on our Financing Agreements.
Securitizations
We may seek to enhance the returns on our senior mortgage loan investments through securitizations, if available. To the extent available, we intend to securitize the senior portion of some of our loans, while retaining the subordinate securities in our investment portfolio. The securitization of this senior portion will be accounted for as either a “sale” and the loans will be removed from our balance sheet or as a “financing” and will be classified as “loans held for investment” in our consolidated balance sheets, depending upon the structure of the securitization. As of
December 31, 2018
, the carrying amount and outstanding principal of our CLO Securitization was
$270.7 million
and
$272.9 million
, respectively. See Note 12 to our consolidated financial statements included in this annual report on Form 10-K for additional terms and details of our CLO Securitization. See “Recent Developments” and Note 15 to our consolidated financial statements included in this annual report on Form 10-K for a subsequent event related to the CLO Securitization.
Capital Markets
We may periodically raise additional capital through public offerings of debt and equity securities to fund new investments. On June 6, 2016, we filed a registration statement on Form S-3 with the Securities and Exchange Commission (“SEC”), which became effective on August 29, 2016, in order to permit us to offer, from time to time, in one or more offerings or series of offerings up to $1.25 billion of our common stock, preferred stock, debt securities, subscription rights to purchase shares of our common stock, warrants representing rights to purchase shares of our common stock, preferred stock or debt securities, or units.
Other Sources of Financing
In addition to the sources of liquidity described above, in the future, we may also use other sources of financing to fund the origination or acquisition of our target investments or to refinance expiring Financing Agreements and securitizations, including other credit facilities, warehouse facilities, repurchase facilities, non-convertible or convertible debt, securitized
62
financings and other public and private forms of borrowing. These financings may be issued by us or our subsidiaries, be collateralized or non-collateralized, accrue interest at either fixed or floating rates and may involve one or more lenders.
Leverage Policies
We intend to use prudent amounts of leverage to increase potential returns to our stockholders. To that end, subject to maintaining our qualification as a REIT and our exemption from registration under the 1940 Act, we intend to continue to use borrowings to fund the origination or acquisition of our target investments. Given current market conditions and our focus on first or senior mortgages, we currently expect that such leverage would not exceed, on a debt-to-equity basis, a 4-to-1 ratio. Our charter and bylaws do not restrict the amount of leverage that we may use. The amount of leverage we will deploy for particular investments in our target investments will depend upon our Manager’s assessment of a variety of factors, which may include, among others, the anticipated liquidity and price volatility of the assets in our investment portfolio, the potential for losses and extension risk in our portfolio, the gap between the duration of our assets and liabilities, including hedges, the availability and cost of financing the assets, our opinion of the creditworthiness of our financing counterparties, the health of the U.S. economy generally or in specific geographic regions and commercial mortgage markets, our outlook for the level and volatility of interest rates, the slope of the yield curve, the credit quality of our assets, the collateral underlying our assets, and our outlook for asset spreads relative to the LIBOR curve.
CONTRACTUAL OBLIGATIONS AND COMMITMENTS
Our contractual obligations as of
December 31, 2018
are described in the following table ($ in thousands):
|
Total
|
Less than
1 year |
1 to 3 years
|
3 to 5 years
|
More than
5 years |
|||||||||||||||
|
Wells Fargo Facility
|
$
|
274,071
|
|
$
|
—
|
|
$
|
274,071
|
|
$
|
—
|
|
$
|
—
|
|
||||
|
Citibank Facility
|
184,003
|
|
—
|
|
184,003
|
|
—
|
|
—
|
|
|||||||||
|
BAML Facility
|
36,280
|
|
36,280
|
|
—
|
|
—
|
|
—
|
|
|||||||||
|
CNB Facility
|
—
|
|
—
|
|
—
|
|
—
|
|
—
|
|
|||||||||
|
MetLife Facility
|
135,145
|
|
—
|
|
135,145
|
|
—
|
|
—
|
|
|||||||||
|
U.S. Bank Facility
|
148,475
|
|
—
|
|
148,475
|
|
—
|
|
—
|
|
|||||||||
|
Secured Term Loan
|
110,000
|
|
—
|
|
110,000
|
|
—
|
|
—
|
|
|||||||||
|
Future Loan Funding Commitments
|
142,872
|
|
13,055
|
|
122,052
|
|
7,765
|
|
—
|
|
|||||||||
|
Total
|
$
|
1,030,846
|
|
$
|
49,335
|
|
$
|
973,746
|
|
$
|
7,765
|
|
$
|
—
|
|
||||
The table above does not include the related interest expense under the Secured Funding Agreements and the Secured Term Loan, as all our interest is variable. Additionally, the table above does not include extension options, as applicable, under the Secured Funding Agreements.
We may enter into certain contracts that may contain a variety of indemnification obligations, principally with underwriters and counterparties to repurchase agreements. The maximum potential future payment amount we could be required to pay under these indemnification obligations may be unlimited.
Management Agreement
We are also required to pay our Manager a base management fee of 1.5% of our stockholders' equity per year, an incentive fee and expense reimbursements pursuant to our Management Agreement. The table above does not include the amounts payable to our Manager under our Management Agreement as they are not fixed and determinable. See Note
10
to our consolidated financial statements included in this annual report on Form 10-K for additional terms and details of the fees payable under our Management Agreement.
DIVIDENDS
We elected to be taxed as a REIT for U.S. federal income tax purposes and, as such, anticipate annually distributing to our stockholders at least 90% of our REIT taxable income, determined without regard to the deduction for dividends paid and excluding net capital gains. To the extent that we distribute less than 100% of our REIT taxable income in any tax year (taking into account any distributions made in a subsequent tax year under Sections 857(b)(9) or 858 of the Code), we will pay tax at
63
regular corporate rates on that undistributed portion. Furthermore, if a REIT distributes less than the sum of 85% of its ordinary income for the calendar year, 95% of its capital gain net income for the calendar year plus any undistributed shortfall from its prior calendar year (the “Required Distribution”) to its stockholders during any calendar year (including any distributions declared by the last day of the calendar year but paid in the subsequent year), then it is required to pay non-deductible excise tax equal to 4% of any shortfall between the Required Distribution and the amount that was actually distributed. Any of these taxes would decrease cash available for distribution to our stockholders. The 90% distribution requirement does not require the distribution of net capital gains. However, if a REIT elects to retain any of its net capital gain for any tax year, it must notify its stockholders and pay tax at regular corporate rates on the retained net capital gain. The stockholders must include their proportionate share of the retained net capital gain in their taxable income for the tax year, and they are deemed to have paid the REIT’s tax on their proportionate share of the retained capital gain. Furthermore, such retained capital gain may be subject to the nondeductible 4% excise tax. If we determine that our estimated current year taxable income (including net capital gain) will be in excess of estimated dividend distributions (including capital gains dividends) for the current year from such income, we accrue excise tax on a portion of the estimated excess taxable income as such taxable income is earned.
Before we make any distributions, whether for U.S. federal income tax purposes or otherwise, we must first meet both our operating requirements and debt service on our Financing Agreements and other debt payable. If our cash available for distribution is less than our REIT taxable income, we could be required to sell assets or borrow funds to make cash distributions or we may make a portion of the Required Distribution in the form of a taxable stock distribution or distribution of debt securities.
OFF-BALANCE SHEET ARRANGEMENTS
We have commitments to fund various senior mortgage loans, as well as subordinated debt and preferred equity investments in our portfolio.
Other than as set forth in this annual report on Form 10-K, we do not have any relationships with unconsolidated entities or financial partnerships, such as entities often referred to as structured investment vehicles, special purpose entities or VIEs, established to facilitate off-balance sheet arrangements or other contractually narrow or limited purposes. Further, we have not guaranteed any obligations of unconsolidated entities or entered into any commitment or intend to provide additional funding to any such entities.
Item 7A. Quantitative and Qualitative Disclosures About Market Risk
As part of our risk management strategy, our Manager closely monitors our portfolio and actively manages the credit, interest rate, market, prepayment, real estate inflation and financing risks associated with holding a portfolio of our target investments. We manage our portfolio through an interactive process with our Manager and Ares Management. Our Manager has an Investment Committee that oversees compliance with our investment strategy and guidelines, investment portfolio holdings and financing strategy. We seek to manage our risks related to the credit quality of our assets, interest rates, liquidity, prepayment speeds and market value while, at the same time, seeking to provide an opportunity to stockholders to realize attractive risk-adjusted returns through ownership of our capital stock. While we do not seek to avoid risk completely, we believe the risks can be quantified from historical experience and seek to actively manage those risks, to earn sufficient compensation to justify taking those risks and to maintain capital levels consistent with the risks we undertake.
Credit Risk
We are subject to varying degrees of credit risk in connection with holding our target investments. We have exposure to credit risk on our CRE loans and other target investments in our business. Our Manager seeks to manage credit risk by performing our due diligence process prior to origination or acquisition and through the use of non-recourse financing, when and where available and appropriate. Credit risk is also addressed through our Manager’s ongoing review of our investment portfolio. In addition, with respect to any particular target investment, our Manager’s investment team evaluates, among other things, relative valuation, comparable analysis, supply and demand trends, shape of yield curves, delinquency and default rates, recovery of various sectors and vintage of collateral. See “Management’s Discussion And Analysis Of Financial Condition And Results Of Operations - Factors Impacting Our Operating Results” regarding our performance monitoring methodology.
Interest Rate Risk
Interest rates are highly sensitive to many factors, including fiscal and monetary policies and domestic and international economic and political considerations, as well as other factors beyond our control. We are subject to interest rate risk in connection with our assets and our related financing obligations, including our borrowings under the Financing
64
Agreements. We primarily originate or acquire floating rate mortgage assets and finance those assets with index-matched floating rate liabilities. As a result, we significantly reduce our exposure to changes in portfolio value and cash flow variability related to changes in interest rates. However, we regularly measure our exposure to interest rate risk and assess interest rate risk and manage our interest rate exposure on an ongoing basis by comparing our interest rate sensitive assets to our interest rate sensitive liabilities. Based on that review, we determine whether or not we should enter into hedging transactions and derivative financial instruments, such as forward sale commitments and interest rate floors in order to mitigate our exposure to changes in interest rates.
While hedging activities may mitigate our exposure to adverse fluctuations in interest rates, certain hedging transactions that we may enter into in the future, such as interest rate swap agreements, may also limit our ability to participate in the benefits of lower interest rates with respect to our investments. In addition, there can be no assurance that we will be able to effectively hedge our interest rate risk.
In addition to the risks related to fluctuations in asset values and cash flows associated with movements in interest rates, there is also the risk of non-performance on floating rate assets. In the case of a significant increase in interest rates, the additional debt service payments due from our borrowers may strain the operating cash flows of the real estate assets underlying our mortgages and, potentially, contribute to non-performance or, in severe cases, default.
Interest Rate Effect on Net Interest Margin
Our operating results depend in large part on differences between the income earned on our assets and our cost of borrowing. The cost of our borrowings generally is based on prevailing market interest rates. During a period of rising interest rates, our borrowing costs generally increase while the yields earned on our leveraged fixed-rate mortgage assets remain static, which could result in a decline in our net interest spread and net interest margin.
For the
year ended December 31, 2018
, the following fluctuations in the average 30-day LIBOR would have resulted in the following increases in net interest margin on our loans held for investment ($ in millions):
|
Change in Average 30-Day LIBOR
|
For the year ended December 31, 2018
|
|||
|
Up 300 basis points
|
$
|
11.4
|
|
|
|
Up 200 basis points
|
$
|
7.6
|
|
|
|
Up 100 basis points
|
$
|
3.8
|
|
|
|
Down to 0 basis points
|
$
|
8.2
|
|
|
The severity of any such impact depends on our asset/liability composition at the time as well as the magnitude and duration of the interest rate increase and any applicable floors and caps. Further, an increase in short-term interest rates could also have a negative impact on the market value of our target investments. If any of these events happen, we could experience a decrease in net income or incur a net loss during these periods, which could adversely affect our liquidity and results of operations.
Interest Rate Cap and Floor Risk
We primarily originate or acquire floating rate mortgage assets. These are assets in which the mortgages may be subject to periodic and lifetime interest rate caps and floors, which limit the amount by which the asset’s interest yield changes during any given period. However, our borrowing costs pursuant to our Financing Agreements sometimes are not subject to similar restrictions or have different floors and caps. As a result, in a period of increasing interest rates, interest rate costs on our borrowings could increase without limitation by caps, while the interest rate yields on our floating rate mortgage assets could be limited if we do not implement effective caps. In addition, floating rate mortgage assets may be subject to periodic payment caps that result in some portion of the interest being deferred and added to the principal outstanding. This could result in our receipt of less cash income on such assets than we would need to pay the interest cost on our related borrowings. In addition, in a period of decreasing interest rates, the interest rate yields on our floating rate mortgage assets could decrease, while the interest rate costs on certain of our borrowings could be fixed at a higher floor. These factors could lower our net interest income or cause a net loss during periods of decreasing interest rates, which would harm our financial condition, cash flows and results of operations.
65
Market Risk
The estimated fair values of our investments fluctuate primarily due to changes in interest rates and other factors. Generally, in a rising interest rate environment, the estimated fair value of the fixed-rate securities would be expected to decrease; conversely, in a decreasing interest rate environment, the estimated fair value of the fixed-rate securities would be expected to increase. As market volatility increases or liquidity decreases, the fair value of our investments may be adversely impacted.
Prepayment and Securitizations Repayment Risk
Our net income and earnings may be affected by prepayment rates on our existing CRE loans. When we originate our CRE loans, we anticipate that we will generate an expected yield. When borrowers prepay their CRE loans faster than we expect, we may be unable to replace these CRE loans with new CRE loans that will generate yields which are as high as the prepaid CRE loans. Additionally, principal repayment proceeds from mortgage loans in the CLO Securitization are applied sequentially, first used to pay down the senior CLO Securitization notes. We will not receive any proceeds from the repayment of loans in the CLO Securitization until all senior notes are repaid in full.
Financing Risk
We borrow funds under our Financing Agreements to finance our target assets. Over time, as market conditions change, in addition to these financings, we may use other forms of leverage. Weakness or volatility in the financial markets, the commercial real estate and mortgage markets and the economy generally could adversely affect one or more of our potential lenders and could cause one or more of our potential lenders to be unwilling or unable to provide us with financing or to increase the costs of that financing.
Real Estate Risk
Our real estate investments are subject to volatility and may be affected adversely by a number of factors, including, but not limited to, national, regional and local economic conditions (which may be adversely affected by industry slowdowns and other factors); local real estate conditions; changes or continued weakness in specific industry segments; local markets with a significant exposure to the energy sector; construction quality, age and design; demographic factors; and retroactive changes to building or similar codes. In addition, decreases in property values reduce the value of the collateral and the potential proceeds available to a borrower to repay the underlying loan or loans, as the case may be, which could also cause us to suffer losses. We seek to manage these risks through our underwriting and asset management processes.
Inflation Risk
Virtually all of our assets and liabilities are sensitive to interest rates. As a result, interest rates and other factors influence our performance far more so than does inflation. Changes in interest rates do not necessarily correlate with inflation rates or changes in inflation rates. In each case, in general, our activities and balance sheet are measured with reference to historical cost and/or fair market value without considering inflation.
Item 8. Financial Statements and Supplementary Data
See the Index to Consolidated Financial Statements included in this annual report on Form 10-K.
Item 9. Changes In and Disagreements With Accountants on Accounting and Financial Disclosure
None.
Item 9A. Controls and Procedures
(a)
Evaluation of Disclosure Controls and Procedures.
We maintain disclosure controls and procedures (as that term is defined in Rules 13a‑15(e) and 15d‑15(e) under the Exchange Act) that are designed to ensure that information required to be disclosed in our reports under the Exchange Act is recorded, processed, summarized and reported within the time periods specified in the SEC’s rules and forms, and that such information is accumulated and communicated to our management, including our principal executive officer and principal financial officer, as appropriate, to allow timely decisions regarding required disclosures. Any controls and procedures, no matter how well designed and operated, can provide only reasonable assurance of achieving the desired control objectives. Our management, with the participation of our principal executive officer
66
and principal financial officer, has evaluated the effectiveness of the design and operation of our disclosure controls and procedures
as of December 31, 2018
. Based upon that evaluation and subject to the foregoing, our principal executive officer and principal financial officer concluded that,
as of December 31, 2018
, the design and operation of our disclosure controls and procedures were effective to accomplish their objectives at the reasonable assurance level.
(b)
Management’s Report on Internal Control over Financial Reporting.
Our management is responsible for establishing and maintaining adequate internal control over financial reporting for the Company. Internal control over financial reporting is a process to provide reasonable assurance regarding the reliability of our financial reporting for external purposes in accordance with accounting principles generally accepted in the United States of America. Internal control over financial reporting includes maintaining records that in reasonable detail accurately and fairly reflect our transactions; providing reasonable assurance that transactions are recorded as necessary for preparation of our consolidated financial statements; providing reasonable assurance that receipts and expenditures of company assets are made in accordance with management authorization; and providing reasonable assurance that unauthorized acquisition, use or disposition of company assets that could have a material effect on our consolidated financial statements would be prevented or detected on a timely basis. Because of its inherent limitations, internal control over financial reporting is not intended to provide absolute assurance that a material misstatement of our consolidated financial statements would be prevented or detected.
Management conducted an evaluation of the effectiveness of our internal control over financial reporting based on the framework in Internal Control — Integrated Framework (2013) issued by the Committee of Sponsoring Organizations of the Treadway Commission. Based on this evaluation, management concluded that the Company's internal control over financial reporting was effective
as of December 31, 2018
. The Company's independent registered public accounting firm, Ernst & Young LLP, has issued an audit report on the effectiveness of the Company's internal control over financial reporting.
(c)
Attestation Report of the Registered Public Accounting Firm.
Our independent registered public accounting firm, Ernst & Young LLP, has issued an attestation report on the effectiveness of our internal control over financial reporting which is set forth under the heading “Report of Independent Registered Public Accounting Firm” on page F-2.
(d)
Changes in Internal Control over Financial Reporting.
There have been no changes in our internal control over financial reporting (as defined in Rules 13a-15(f) and 15d-15(f) under the Exchange Act) during the quarter ended
December 31, 2018
that have materially affected, or that are reasonably likely to materially affect, our internal control over financial reporting.
Item 9B. Other Information
None.
67
PART III
Item 10. Directors, Executive Officers and Corporate Governance
The information required by this item will be contained in the Company’s definitive Proxy Statement for its
2019
Annual Stockholder Meeting, to be filed with the SEC within 120 days after December 31,
2018
, and is incorporated herein by reference.
Item 11. Executive Compensation
The information required by this item will be contained in the Company’s definitive Proxy Statement for its
2019
Annual Stockholder Meeting, to be filed with the SEC within 120 days after December 31,
2018
, and is incorporated herein by reference.
Item 12. Security Ownership of Certain Beneficial Owners and Management and Related Stockholder Matters
The information required by this item will be contained in the Company’s definitive Proxy Statement for its
2019
Annual Stockholder Meeting, to be filed with the SEC within 120 days after December 31,
2018
, and is incorporated herein by reference.
Item 13. Certain Relationships and Related Party Transactions, and Director Independence
The information required by this item will be contained in the Company’s definitive Proxy Statement for its
2019
Annual Stockholder Meeting, to be filed with the SEC within 120 days after December 31,
2018
, and is incorporated herein by reference.
Item 14. Principal Accountant Fees and Services
The information required by this item will be contained in the Company’s definitive Proxy Statement for its
2019
Annual Stockholder Meeting, to be filed with the SEC within 120 days after December 31,
2018
, and is incorporated herein by reference.
68
PART IV
Item 15. Exhibits and Financial Statement Schedules
The following documents are filed as part of this annual report:
|
1.
|
Financial Statements—See the Index to Consolidated Financial Statements on Page F-1.
|
|
2.
|
Financial Statement Schedules—None. We have omitted financial statement schedules because they are not required or are not applicable, or the required information is shown in the consolidated financial statements or notes to the consolidated financial statements.
|
|
3.
|
Exhibits.
|
|
Exhibit
Number
|
|
Exhibit Description
|
|
*
|
Purchase and Sale Agreement, among Ares Commercial Real Estate Corporation and Cornerstone Real Estate Advisers LLC.(1)
|
|
|
*
|
Waiver and Amendment to Purchase and Sale Agreement, dates as of September 29, 2016, among Ares Commercial Real Estate Corporation and Barings Real Estate Advisers LLC (formerly known as Cornerstone Real Estate Advisers LLC).(24)
|
|
|
*
|
Articles of Amendment and Restatement of Ares Commercial Real Estate Corporation.(2)
|
|
|
*
|
Amended and Restated Bylaws of Ares Commercial Real Estate Corporation.(3)
|
|
|
*
|
Registration Rights Agreement, dated April 25, 2012, between Ares Commercial Real Estate Corporation and Ares Investments Holdings LLC.(4)
|
|
|
*
|
Management Agreement, dated April 25, 2012, between Ares Commercial Real Estate Management LLC and Ares Commercial Real Estate Corporation.(5)
|
|
|
*
|
Trademark License Agreement, dated April 25, 2012, between Ares Commercial Real Estate Corporation and Ares Management LLC.(4)
|
|
|
*
|
Amended and Restated 2012 Equity Incentive Plan.(34)#
|
|
|
*
|
Form of Restricted Stock Agreement.(6)#
|
|
|
*
|
Form of Restricted Stock Agreement with officers.(34)#
|
|
|
*
|
Form of Indemnification Agreement with directors and certain officers.(4)#
|
|
|
*
|
Form of Indemnification Agreement with members of the Investment Committee and/or Underwriting Committee of Ares Commercial Real Estate Management LLC.(4)#
|
|
|
*
|
Registration Rights Agreement, dated as of August 30, 2013, among Ares Commercial Real Estate Corporation, Alliant Inc. and The Alliant Company, LLC.(7)
|
|
|
*
|
Credit Agreement, dated as of March 12, 2014, by and among ACRC Lender LLC, as borrower, City National Bank, a national banking association, as arranger and administrative agent, and the lenders party thereto.(8)
|
|
|
*
|
General Continuing Guaranty, dated as of March 12, 2014, by Ares Commercial Real Estate Corporation, as guarantor, in favor of City National Bank, a national banking association, as arranger and administrative agent.(8)
|
|
|
*
|
Security Agreement, dated as of March 12, 2014, by ACRC Lender LLC, as borrower, in favor of City National Bank, a national banking association, as arranger and administrative agent.(8)
|
|
|
*
|
Intercompany Subordination Agreement, dated as of March 12, 2014, by and among ACRC Lender LLC, as borrower, and Ares Commercial Real Estate Corporation, as guarantor, in favor of City National Bank, a national banking association, as arranger and administrative agent.(8)
|
|
|
*
|
Master Repurchase Agreement, dated as of April 9, 2014, among ACRC Lender U LLC and ACRC Lender U TRS LLC, as sellers, ACRC Lender U Mezz LLC, as mezzanine subsidiary, Ares Commercial Real Estate Corporation, as guarantor, and UBS Real Estate Securities Inc., as buyer.(9)
|
|
|
*
|
Guaranty Agreement, dated as of April 9, 2014, by Ares Commercial Real Estate Corporation in favor of UBS Real Estate Securities Inc.(9)
|
|
|
*
|
Master Repurchase Agreement, dated as of August 13, 2014, between ACRC Lender ML LLC, as seller, and Metropolitan Life Insurance Company, as buyer.(10)
|
|
|
*
|
Guaranty, dated as of August 13, 2014, by Ares Commercial Real Estate Corporation in favor of Metropolitan Life Insurance Company.(10)
|
|
69
|
Exhibit
Number
|
|
Exhibit Description
|
|
*
|
Master Repurchase Agreement, dated as of December 8, 2014, by and between ACRC Lender C LLC, as seller, and Citibank, N.A., as buyer.(11)
|
|
|
*
|
Omnibus Amendment To Other Transaction Documents and Reaffirmation of Guaranty, dated as of December 8, 2014, by and among ACRC Lender C LLC, ACRC Lender LLC, Ares Commercial Real Estate Corporation and Citibank, N.A.(11)
|
|
|
*
|
Amendment Number One to Credit Agreement and Consent, dated as of July 30, 2014, by and among ACRC Lender LLC, as borrower, City National Bank, a national banking association, as arranger and administrative agent, and the lenders party thereto.(12)
|
|
|
*
|
Bridge Loan Warehousing Credit and Security Agreement, dated as of May 27, 2015, by and among ACRC Lender B LLC, Bank of America, N.A., as Administrative Agent and Lender and the other Lenders.(13)
|
|
|
*
|
Guaranty Agreement, dated as of May 27, 2015, by Ares Commercial Real Estate Corporation, in favor of Bank of America, N.A., as Administrative Agent and Lender and for the benefit of the other Lenders.(13)
|
|
|
*
|
Pledge and Security Agreement, dated as of May 27, 2015, by and between ACRC Lender LLC and Bank of America, N.A., as Administrative Agent and Lender and for the benefit of the other Lenders.(13)
|
|
|
*
|
Amendment No. 2 to Master Repurchase Agreement dated as of October 21, 2015, among ACRC Lender U LLC and ACRC Lender U TRS LLC, as sellers, ACRC Lender U Mezz LLC, as mezzanine subsidiary, Ares Commercial Real Estate Corporation, as guarantor and UBS Real Estate Securities, Inc., as buyer.(14)
|
|
|
*
|
Credit and Guaranty Agreement, dated as of December 9, 2015 by and among Ares Commercial Real Estate Corporation, as borrower and ACRC Holdings LLC, ACRC Mezz Holdings LLC, ACRC CP Investor LLC and ACRC Warehouse Holdings LLC, as guarantors, the lenders party thereto, Highbridge Principal Strategies, LLC, as administrative agent and DBD Credit Funding LLC, as collateral agent.(15)
|
|
|
*
|
Pledge and Security Agreement, dated as of December 9, 2015 among Ares Commercial Real Estate Corporation, ACRC Holdings LLC, ACRC Mezz Holdings LLC, ACRC CP Investor LLC, ACRC Warehouse Holdings LLC and ACRC Lender and DBD Credit Funding LLC, as collateral agent for the lenders.(15)
|
|
|
*
|
Negative Pledge Agreement, dated as of December 9, 2015 by Ares Commercial Real Estate Corporation, ACRC KA JV Investor LLC, ACRC Lender LLC, ACRC Champions Investor LLC and ACRE Capital Holdings LLC in favor of DBD Credit Funding LLC, as collateral agent for the lenders.(15)
|
|
|
*
|
Amendment No. 2 to Bridge Loan Warehousing Credit and Security Agreement dated as of February 26, 2016, among ACRC Lender B LLC and Bank Of America, N.A.(16)
|
|
|
*
|
Amendment No. 3 to Credit Agreement dated as of February 26, 2016, by and among ACRC Lender LLC, as borrower, City National Bank, a national banking association, as arranger and administrative agent, and the lenders party thereto.(16)
|
|
|
*
|
Amendment No. 3 to Bridge Loan Warehousing Credit and Security Agreement dated as of May 26, 2016, among ACRC Lender B LLC and Bank of America, N.A.(17)
|
|
|
*
|
First Amendment to Master Repurchase Agreement and Guaranty dated as of July 13, 2016, among ACRC Lender C LLC, as borrower, Ares Commercial Real Estate Corporation, as guarantor, and Citibank, N.A., as lender.(18)
|
|
|
*
|
Second Amendment to Master Repurchase Agreement and Guaranty dated as of July 13, 2016, among ACRC Lender C LLC, as borrower, Ares Commercial Real Estate Corporation, as guarantor, and Citibank, N.A., as lender.(19)
|
|
|
*
|
Amendment No. 2 to Credit Agreement dated as of July 29, 2016, by and among ACRC Lender LLC, City National Bank, a national banking association, as arranger and administrative agent, and the lenders party thereto.(18)
|
|
|
*
|
Master Repurchase and Securities Contract dated as of August 1, 2016, between ACRC Lender US LLC and U.S. Bank National Association.(18)
|
|
|
*
|
Payment Guaranty, dated as of August 1, 2016, by Ares Commercial Real Estate Corporation in favor of U.S. Bank National Association.(18)
|
|
|
*
|
Amended and Restated Bridge Loan Warehousing Credit and Security Agreement, dated as of August 8, 2016, by and among ACRC Lender B LLC, Bank of America, N.A., as Administrative Agent and Lender and the other Lenders.(20)
|
|
|
*
|
Amendment to Guaranty, dated as of September 22, 2016, by Ares Commercial Real Estate Corporation, as guarantor, and Metropolitan Life Insurance Company, as buyer.(21)
|
|
|
*
|
Assignment and Amendment No. 1 to Custodial Agreement, dated November 2, 2016, among ACRC Lender U LLC and ACRC Lender U TRS LLC, as sellers, ACRC Lender U Mezz LLC, as mezzanine subsidiary, UBS Real Estate Securities Inc., as assignor, UBS AG, as assignee, and Wells Fargo Bank, N.A., as Custodian.(31)
|
|
70
|
Exhibit
Number
|
|
Exhibit Description
|
|
*
|
Assignment and Amendment No. 3 to Master Repurchase Agreement, dated November 2, 2016, among ACRC Lender U LLC and ACRC Lender U TRS LLC, as sellers, ACRC Lender U Mezz LLC, as mezzanine subsidiary, UBS Real Estate Securities, Inc., as assignor, UBS AG, as assignee, and Ares Commercial Real Estate Corporation, as guarantor.(31)
|
|
|
*
|
Assignment and Reaffirmation of Guaranty, dated November 2, 2016, among UBS Real Estate Securities Inc., as assignor, UBS AG, as assignee, and Ares Commercial Real Estate Corporation, as guarantor.(31)
|
|
|
*
|
Amendment No. 3 to Master Repurchase Agreement dated as of December 8, 2016, by and among, ACRC Lender C LLC, Ares Commercial Real Estate Corporation, as Guarantor, and Citibank, N.A., a national banking association, as Buyer.(22)
|
|
|
*
|
Amendment No. 4 to Credit Agreement and Amendment No. 1 to General Continuing Guaranty dated as of December 27, 2016, by and among, by and among ACRC Lender LLC, as borrower, Ares Commercial Real Estate Corporation, as Guarantor and City National Bank, a national banking association, as administrative agent, and the lenders party thereto.(31)
|
|
|
*
|
Reaffirmation and Consent to Amendment No. 4 to Credit Agreement and Amendment No. 1 to General Continuing Guaranty dated as of December 27, 2016, by and among, by and among ACRC Lender LLC, as borrower, Ares Commercial Real Estate Corporation, as Guarantor and City National Bank, a national banking association, as administrative agent, and the lenders party thereto.(31)
|
|
|
*
|
Amendment No. 5 to Credit Agreement dated as of March 2, 2017, by and among ACRC Lender LLC, as borrower, Ares Commercial Real Estate Corporation, as Guarantor and City National Bank, a national banking association, as administrative agent, and the lenders party thereto.(23)
|
|
|
*
|
Indenture dated as of March 2, 2017 among ACRE Commercial Mortgage 2017-FL3 Ltd, as issuer, ACRE Commercial Mortgage 2017-FL3 LLC as co-issuer, Wilmington Trust, National Association, as trustee, Wells Fargo Bank, National Association, as note administrator, paying agent, calculation agent, transfer agent, authentication agent and custodian, and Wells Fargo Bank, National Association, as advancing agent.(23)
|
|
|
*
|
Mortgage Asset Purchase Agreement dated as of March 2, 2017 between ACRC Lender LLC, as seller and ACRE Commercial Mortgage 2017-FL3 Ltd., as issuer.(23)
|
|
|
*
|
Amendment No. 6 to the Credit Agreement dated as of April 19, 2017, by and among, the several banks and other financial institutions and lenders from time to time party hereto, each individually as a lender and, collectively, as the lenders, and City National Bank, as administrative agent to the lenders, and ACRC Lender LLC, as the borrower.(24)
|
|
|
*
|
Second Amended and Restated Master Repurchase and Securities Contract dated as of May 1, 2017, by and among, ACRC Lender W LLC, as existing seller, ACRC Lender W TRS LLC, as new seller, and Wells Fargo Bank, National Association, as buyer.(24)
|
|
|
*
|
Reaffirmation Agreement dated as of May 1, 2017, by Ares Commercial Real Estate Corporation in favor of Wells Fargo Bank, National Association.(24)
|
|
|
*
|
Amendment No. 1 to Amended and Restated Bridge Loan Warehousing Credit and Security Agreement dated as of May 25, 2017, by and among ACRC Lender B LLC, as borrower, the Persons party to the Credit Agreement from time to time as lenders, and Bank of America, N.A., as lender and in its capacity as administrative agent for the Lenders under the Credit Agreement, as administrative agent.(25)
|
|
|
*
|
First Amendment to Master Repurchase and Securities Contract dated as of June 23, 2017, by and among ACRC Lender US LLC, as seller, and U.S. Bank National Association, as buyer, and acknowledged and agreed to by Ares Commercial Real Estate Corporation.(26)
|
|
|
*
|
First Amendment to Master Repurchase Agreement, dated as of August 4, 2017, by and between ACRC Lender ML LLC, as seller, and Metropolitan Life Insurance Company, as buyer.(27)
|
|
|
*
|
Reaffirmation of Guarantor, dated as of August 4, 2017, by Ares Commercial Real Estate Corporation in favor of Metropolitan Life Insurance Company.(27)
|
|
|
*
|
First Supplemental Indenture dated as of August 16, 2017, to the Indenture, dated as of March 2, 2017 among ACRE Commercial Mortgage 2017-FL3 Ltd, as issuer, ACRE Commercial Mortgage 2017-FL3 LLC as co-issuer, Wilmington Trust, National Association, as trustee, Wells Fargo Bank, National Association, as note administrator, paying agent, calculation agent, transfer agent, authentication agent and custodian, and Wells Fargo Bank, National Association, as advancing agent.(28)
|
|
|
*
|
Amendment No. 2 to Amended and Restated Bridge Loan Warehousing Credit and Security Agreement, dated as of October 2, 2017, by and among ACRC Lender B LLC, Bank of America, N.A., as Administrative Agent and Lender and the other Lenders.(29)
|
|
|
*
|
First Amendment to Credit and Guaranty Agreement dated as of December 22, 2017 and is entered into by and among, Wilmington Trust, National Association, as grantor trust trustee, as lender, Cortland Capital Market Services LLC, as the administrative agent and the collateral agent for the lenders, and Ares Commercial Real Estate Corporation, as borrower and ACRC Holdings LLC, ACRC Mezz Holdings LLC, ACRC CP Investor LLC and ACRC Warehouse Holdings LLC, as guarantors.(30)
|
|
71
|
Exhibit
Number
|
|
Exhibit Description
|
|
*
|
Second Amendment to Master Repurchase and Securities Contract, dated as of March 15, 2018, by and between ACRC Lender US LLC, as seller, and U.S. Bank National Association, as buyer, and acknowledged and agreed to by Ares Commercial Real Estate Corporation.(32)
|
|
|
*
|
Amendment No. 3 to Bridge Loan Warehousing Credit and Security Agreement, dated as of May 24, 2018, by and among ACRC Lender B LLC, Bank of America, N.A., as Administrative Agent and Lender and the other Lenders.(33)
|
|
|
*
|
Amended and Restated Fourth Amendment to Master Repurchase Agreement dated as of December 13, 2018, among ACRC Lender C LLC, as seller, Ares Commercial Real Estate Corporation, as guarantor, and Citibank, N.A., as buyer.(35)
|
|
|
*
|
Second Amended and Restated Substitute Guaranty Agreement, dated as of December 13, 2018, by Ares Commercial Real Estate Corporation in favor of Citibank, N.A.(35)
|
|
|
*
|
Amendment Number One to the Second Amended and Restated Master Repurchase and Securities Contract dated as of December 14, 2018, by and among, ACRC Lender W LLC, as seller, ACRC Lender W TRS LLC, as seller, and Wells Fargo Bank, National Association, as buyer.(36)
|
|
|
Subsidiaries of Ares Commercial Real Estate Corporation
|
||
|
Consent of Ernst & Young LLP
|
||
|
Certification of Chief Executive Officer pursuant to Rule 13a‑14(a) and Rule 15d‑14(a), as adopted pursuant to Section 302 of the Sarbanes‑Oxley Act of 2002
|
||
|
Certification of Chief Financial Officer pursuant to Rule 13a‑14(a) and Rule 15d‑14(a), as adopted pursuant to Section 302 of the Sarbanes‑Oxley Act of 2002
|
||
|
Certification of Chief Executive Officer and Chief Financial Officer pursuant to 18 U.S.C. Section 1350, as adopted pursuant to Section 906 of the Sarbanes‑Oxley Act of 2002
|
||
|
101.INS
|
XBRL Instance Document
|
|
|
101.SCH
|
XBRL Taxonomy Extension Schema Document
|
|
|
101.CAL
|
XBRL Taxonomy Extension Calculation Linkbase Document
|
|
|
101.LAB
|
XBRL Taxonomy Extension Label Linkbase Document
|
|
|
101.PRE
|
XBRL Taxonomy Extension Presentation Linkbase Document
|
|
|
101.DEF
|
XBRL Taxonomy Extension Definition Linkbase Document
|
|
_______________________________________________________________________________
|
*
|
Previously filed
|
|
#
|
Denotes a management contract or compensatory plan or arrangement
|
|
(1)
|
Incorporated by reference to Exhibit 2.1 to the Company’s Form 8-K (File No. 001-35517), filed on June 29, 2016.
|
|
(2)
|
Incorporated by reference to Exhibit 3.1 to the Company’s Form 10-K (File No. 001-35517), filed on March 1, 2016.
|
|
(3)
|
Incorporated by reference to Exhibit 3.2 to the Company’s Form S‑8 (File No. 333‑181077), filed on May 1, 2012
|
|
(4)
|
Incorporated by reference to Exhibits 10.1, 10.3, 10.4 and 10.5, as applicable, to the Company’s Form 8‑K (File No. 001‑35517), filed on May 4, 2012.
|
|
(5)
|
Incorporated by reference to Exhibit 10.17 to the Company’s Form 10‑K (File No. 001‑35517), filed on March 17, 2014.
|
|
(6)
|
Incorporated by reference to Exhibit 10.4 to the Company’s Registration Statement on Amendment No. 3 to Form S‑11/A (File No. 333‑176841), filed on April 12, 2012.
|
|
(7)
|
Incorporated by reference to Exhibit 10.7 to the Company’s Form 10‑Q (File No. 001‑35517), filed on November 13, 2013.
|
|
(8)
|
Incorporated by reference to Exhibits 10.1, 10.2, 10.3 and 10.4, as applicable, to the Company’s Form 8‑K (File No. 001‑35517), filed on March 14, 2014.
|
|
(9)
|
Incorporated by reference to Exhibits 10.1 and 10.2, as applicable, to the Company’s Form 8‑K (File No. 001‑35517), filed on April 15, 2014.
|
|
(10)
|
Incorporated by reference to Exhibits 10.1 and 10.2, as applicable, to the Company’s Form 8‑K (File No. 001‑35517), filed on August 18, 2014.
|
|
(11)
|
Incorporated by reference to Exhibits 10.1 and 10.2, as applicable, to the Company’s Form 8‑K (File No. 001‑35517), filed on December 12, 2014.
|
72
|
(12)
|
Incorporated by reference to Exhibits 10.6, as applicable, to the Company’s Form 8‑K (File No. 001‑35517), filed on July 31, 2014.
|
|
(13)
|
Incorporated by reference to Exhibits 10.1, 10.2 and 10.3, as applicable, to the Company’s Form 8‑K (File No. 001‑35517), filed on June 2, 2015.
|
|
(14)
|
Incorporated by reference to Exhibit 10.1 to the Company’s Form 8‑K (File No. 001‑35517), filed on October 26, 2015.
|
|
(15)
|
Incorporated by reference to Exhibits 10.1, 10.2 and 10.3, as applicable, to the Company’s Form 8‑K (File No. 001‑35517), filed on December 14, 2015.
|
|
(16)
|
Incorporated by reference to Exhibits 10.52 and 10.53, as applicable, to the Company’s Form 10-K (File No. 001-35517), filed on March 1, 2016.
|
|
(17)
|
Incorporated by reference to Exhibit 10.1 to the Company’s Form 8-K (file No. 001-35517), filed on June 1, 2016.
|
|
(18)
|
Incorporated by reference to Exhibits 10.4, 10.6, 10.8 and 10.9, as applicable, to the Company’s Form 10-Q (File No. 001-35517), filed on August 4, 2016.
|
|
(19)
|
Incorporated by reference to Exhibit 10.1 to the Company’s Form 8-K (File No. 001-35517), filed on July 19, 2016
|
|
(20)
|
Incorporated by reference to Exhibit 10.1 to the Company’s Form 8-K (File No. 001-35517), filed on August 11, 2016.
|
|
(21)
|
Incorporated by reference to Exhibit 10.11 to the Company’s Form 10-Q (File No. 001-35517), filed on November 3, 2016.
|
|
(22)
|
Incorporated by reference to Exhibit 10.1 to the Company’s Form 8-K (File No. 001-35517), filed on December 12, 2016.
|
|
(23)
|
Incorporated by reference to Exhibits 10.1, 10.2 and 10.3, as applicable, to the Company’s Form 10-Q (File No. 001-35517), filed on May 2, 2017.
|
|
(24)
|
Incorporated by reference to Exhibits 2.2, 10.1, 10.2 and 10.3, as applicable, to the Company’s Form 10-Q (File No. 001-35517), filed on August 3, 2017.
|
|
(25)
|
Incorporated by reference to Exhibit 10.1 to the Company’s Form 8-K (File No. 001-35517), filed on May 30, 2017.
|
|
(26)
|
Incorporated by reference to Exhibit 10.1 to the Company’s Form 8-K (File No. 001-35517), filed on June 28, 2017.
|
|
(27)
|
Incorporated by reference to Exhibits 10.1 and 10.2, as applicable, to the Company’s Form 8-K (File No. 001-35517), filed on August 9, 2017.
|
|
(28)
|
Incorporated by reference to Exhibit 10.3 to the Company’s Form 10-Q (File No. 001-35517), filed on November 1, 2017.
|
|
(29)
|
Incorporated by reference to Exhibit 10.1 to the Company’s Form 8-K (File No. 001-35517), filed on October 3, 2017.
|
|
(30)
|
Incorporated by reference to Exhibit 10.1 to the Company’s Form 8-K (File No. 001-35517), filed on December 29, 2017.
|
|
(31)
|
Incorporated by reference to Exhibits 10.38, 10.39, 10.40, 10.42 and 10.43, as applicable, to the Company’s Form 10-K (File No. 001-35517), filed on March 1, 2018.
|
|
(32)
|
Incorporated by reference to Exhibit 10.1 to the Company’s Form 10-Q (File No. 001-35517), filed on May 1, 2018.
|
|
(33)
|
Incorporated by reference to Exhibit 10.1 to the Company’s Form 8-K (File No. 001-35517), filed on May 30, 2018.
|
|
(34)
|
Incorporated by reference to Exhibits 10.1 and 10.3, as applicable, to the Company’s Form S-8 (File No. 333-225891), filed on June 26, 2018.
|
|
(35)
|
Incorporated by reference to Exhibits 10.1 and 10.2, as applicable, to the Company’s Form 8-K (File No. 001-35517), filed on December 14, 2018.
|
|
(36)
|
Incorporated by reference to Exhibit 10.1 to the Company’s Form 8-K (File No. 001-35517), filed on December 20, 2018.
|
Item 16. Form 10-K Summary
None.
73
INDEX TO CONSOLIDATED FINANCIAL STATEMENTS
F-1
Report of Independent Registered Public Accounting Firm
To the Shareholders and the Board of Directors of Ares Commercial Real Estate Corporation
Opinion on Internal Control over Financial Reporting
We have audited Ares Commercial Real Estate Corporation and subsidiaries’ internal control over financial reporting as of
December 31, 2018
, based on criteria established in Internal Control-Integrated Framework issued by the Committee of Sponsoring Organizations of the Treadway Commission (2013 framework) (the COSO criteria). In our opinion, Ares Commercial Real Estate Corporation and subsidiaries (the Company) maintained, in all material respects, effective internal control over financial reporting as of
December 31, 2018
, based on the COSO criteria.
We also have audited, in accordance with the standards of the Public Company Accounting Oversight Board (United States) (PCAOB), the consolidated balance sheets of the Company as of
December 31, 2018 and 2017
, and the related consolidated statements of operations, equity and cash flows for each of the three years in the period ended
December 31, 2018
and the related notes and our report dated
February 21, 2019
expressed an unqualified opinion thereon.
Basis for Opinion
The Company’s management is responsible for maintaining effective internal control over financial reporting and for its assessment of the effectiveness of internal control over financial reporting included in the accompanying Management's Report on Internal Control over Financial Reporting. Our responsibility is to express an opinion on the Company’s internal control over financial reporting based on our audit. We are a public accounting firm registered with the PCAOB and are required to be independent with respect to the Company in accordance with the U.S. federal securities laws and the applicable rules and regulations of the Securities and Exchange Commission and the PCAOB.
We conducted our audit in accordance with the standards of the PCAOB. Those standards require that we plan and perform the audit to obtain reasonable assurance about whether effective internal control over financial reporting was maintained in all material respects.
Our audit included obtaining an understanding of internal control over financial reporting, assessing the risk that a material weakness exists, testing and evaluating the design and operating effectiveness of internal control based on the assessed risk, and performing such other procedures as we considered necessary in the circumstances. We believe that our audit provides a reasonable basis for our opinion.
Definition and Limitations of Internal Control Over Financial Reporting
A company’s internal control over financial reporting is a process designed to provide reasonable assurance regarding the reliability of financial reporting and the preparation of financial statements for external purposes in accordance with generally accepted accounting principles. A company’s internal control over financial reporting includes those policies and procedures that (1) pertain to the maintenance of records that, in reasonable detail, accurately and fairly reflect the transactions and dispositions of the assets of the company; (2) provide reasonable assurance that transactions are recorded as necessary to permit preparation of financial statements in accordance with generally accepted accounting principles, and that receipts and expenditures of the company are being made only in accordance with authorizations of management and directors of the company; and (3) provide reasonable assurance regarding prevention or timely detection of unauthorized acquisition, use, or disposition of the company’s assets that could have a material effect on the financial statements.
Because of its inherent limitations, internal control over financial reporting may not prevent or detect misstatements. Also, projections of any evaluation of effectiveness to future periods are subject to the risk that controls may become inadequate because of changes in conditions, or that the degree of compliance with the policies or procedures may deteriorate.
/s/ Ernst & Young LLP
Los Angeles, CA
February 21, 2019
F-2
Report of Independent Registered Public Accounting Firm
To the Shareholders and the Board of Directors of Ares Commercial Real Estate Corporation
Opinion on the Financial Statements
We have audited the accompanying consolidated balance sheets of Ares Commercial Real Estate Corporation and subsidiaries (the Company)
as of December 31, 2018 and 2017
, and the related consolidated statements of operations, equity and cash flows for each of the three years in the period ended
December 31, 2018
, and the related notes (collectively referred to as the “consolidated financial statements”). In our opinion, the consolidated financial statements present fairly, in all material respects, the financial position of the Company at
December 31, 2018 and 2017
, and the results of its operations and its cash flows for each of the three years in the period ended
December 31, 2018
, in conformity with U.S. generally accepted accounting principles.
We also have audited, in accordance with the standards of the Public Company Accounting Oversight Board (United States) (PCAOB), the Company's internal control over financial reporting as of
December 31, 2018
, based on criteria established in Internal Control-Integrated Framework issued by the Committee of Sponsoring Organizations of the Treadway Commission (2013 framework) and our report dated
February 21, 2019
expressed an unqualified opinion thereon.
Basis for Opinion
These financial statements are the responsibility of the Company's management. Our responsibility is to express an opinion on the Company’s financial statements based on our audits. We are a public accounting firm registered with the PCAOB and are required to be independent with respect to the Company in accordance with the U.S. federal securities laws and the applicable rules and regulations of the Securities and Exchange Commission and the PCAOB.
We conducted our audits in accordance with the standards of the PCAOB. Those standards require that we plan and perform the audit to obtain reasonable assurance about whether the financial statements are free of material misstatement, whether due to error or fraud. Our audits included performing procedures to assess the risks of material misstatement of the financial statements, whether due to error or fraud, and performing procedures that respond to those risks. Such procedures included examining, on a test basis, evidence regarding the amounts and disclosures in the financial statements. Our audits also included evaluating the accounting principles used and significant estimates made by management, as well as evaluating the overall presentation of the financial statements. We believe that our audits provide a reasonable basis for our opinion.
/s/ Ernst & Young LLP
We have served as the Company’s auditor since 2012.
Los Angeles, CA
February 21, 2019
F-3
ARES COMMERCIAL REAL ESTATE CORPORATION AND SUBSIDIARIES
CONSOLIDATED BALANCE SHEETS
(in thousands, except share and per share data)
|
|
As of December 31,
|
||||||
|
|
2018
|
2017
|
|||||
|
ASSETS
|
|||||||
|
Cash and cash equivalents
|
$
|
11,089
|
|
$
|
28,343
|
|
|
|
Restricted cash
|
379
|
|
379
|
|
|||
|
Loans held for investment ($289,576 and $341,158 related to consolidated VIEs, respectively)
|
1,524,873
|
|
1,726,283
|
|
|||
|
Other assets ($843 and $945 of interest receivable related to consolidated VIEs, respectively; $51,582 of other receivables related to consolidated VIEs as of December 31, 2018)
|
66,983
|
|
15,214
|
|
|||
|
Total assets
|
$
|
1,603,324
|
|
$
|
1,770,219
|
|
|
|
LIABILITIES AND STOCKHOLDERS' EQUITY
|
|||||||
|
LIABILITIES
|
|||||||
|
Secured funding agreements
|
$
|
777,974
|
|
$
|
957,960
|
|
|
|
Secured term loan
|
108,345
|
|
107,595
|
|
|||
|
Collateralized loan obligation securitization debt (consolidated VIE)
|
270,737
|
|
271,211
|
|
|||
|
Due to affiliate
|
3,163
|
|
2,628
|
|
|||
|
Dividends payable
|
8,914
|
|
7,722
|
|
|||
|
Other liabilities ($541 and $414 of interest payable related to consolidated VIEs, respectively)
|
8,604
|
|
3,933
|
|
|||
|
Total liabilities
|
1,177,737
|
|
1,351,049
|
|
|||
|
Commitments and contingencies (Note 5)
|
|
|
|
|
|||
|
STOCKHOLDERS' EQUITY
|
|||||||
|
Common stock, par value $0.01 per share, 450,000,000 shares authorized at December 31, 2018 and 2017, and 28,755,665 and 28,598,916 shares issued and outstanding at December 31, 2018 and 2017, respectively
|
283
|
|
283
|
|
|||
|
Additional paid-in capital
|
421,739
|
|
420,637
|
|
|||
|
Accumulated earnings (deficit)
|
3,565
|
|
(1,750
|
)
|
|||
|
Total stockholders' equity
|
425,587
|
|
419,170
|
|
|||
|
Total liabilities and stockholders' equity
|
$
|
1,603,324
|
|
$
|
1,770,219
|
|
|
See accompanying notes to consolidated financial statements.
F-4
ARES COMMERCIAL REAL ESTATE CORPORATION AND SUBSIDIARIES
CONSOLIDATED STATEMENTS OF OPERATIONS
(in thousands, except share and per share data)
|
|
For the years ended December 31,
|
||||||||||
|
|
2018
|
2017
|
2016
|
||||||||
|
Net interest margin:
|
|||||||||||
|
Interest income from loans held for investment
|
$
|
118,284
|
|
$
|
97,541
|
|
$
|
81,963
|
|
||
|
Interest expense
|
(63,002
|
)
|
(51,193
|
)
|
(36,856
|
)
|
|||||
|
Net interest margin
|
55,282
|
|
46,348
|
|
45,107
|
|
|||||
|
Expenses:
|
|
|
|||||||||
|
Management and incentive fees to affiliate
|
7,418
|
|
6,569
|
|
5,956
|
|
|||||
|
Professional fees
|
1,945
|
|
1,674
|
|
2,228
|
|
|||||
|
General and administrative expenses
|
3,307
|
|
2,828
|
|
2,801
|
|
|||||
|
General and administrative expenses reimbursed to affiliate
|
3,570
|
|
3,899
|
|
3,441
|
|
|||||
|
Total expenses
|
16,240
|
|
14,970
|
|
14,426
|
|
|||||
|
Early extinguishment of debt costs
|
—
|
|
(768
|
)
|
—
|
|
|||||
|
Income from continuing operations before income taxes
|
39,042
|
|
30,610
|
|
30,681
|
|
|||||
|
Income tax expense, including excise tax
|
446
|
|
178
|
|
230
|
|
|||||
|
Net income from continuing operations
|
38,596
|
|
30,432
|
|
30,451
|
|
|||||
|
Net income from operations of discontinued operations, net of income taxes
|
—
|
|
—
|
|
4,221
|
|
|||||
|
Gain on sale of discontinued operations
|
—
|
|
—
|
|
10,196
|
|
|||||
|
Net income attributable to ACRE
|
38,596
|
|
30,432
|
|
44,868
|
|
|||||
|
Less: Net income attributable to non-controlling interests
|
—
|
|
(25
|
)
|
(4,532
|
)
|
|||||
|
Net income attributable to common stockholders
|
$
|
38,596
|
|
$
|
30,407
|
|
$
|
40,336
|
|
||
|
Basic earnings per common share:
|
|
||||||||||
|
Continuing operations
|
$
|
1.35
|
|
$
|
1.07
|
|
$
|
0.91
|
|
||
|
Discontinued operations
|
—
|
|
—
|
|
0.51
|
|
|||||
|
Net income
|
$
|
1.35
|
|
$
|
1.07
|
|
$
|
1.42
|
|
||
|
Diluted earnings per common share:
|
|
||||||||||
|
Continuing operations
|
$
|
1.35
|
|
$
|
1.07
|
|
$
|
0.91
|
|
||
|
Discontinued operations
|
—
|
|
—
|
|
0.51
|
|
|||||
|
Net income
|
$
|
1.35
|
|
$
|
1.07
|
|
$
|
1.41
|
|
||
|
Weighted average number of common shares outstanding:
|
|||||||||||
|
Basic weighted average shares of common stock outstanding
|
28,529,439
|
|
28,478,237
|
|
28,461,853
|
|
|||||
|
Diluted weighted average shares of common stock outstanding
|
28,656,660
|
|
28,550,945
|
|
28,523,306
|
|
|||||
See accompanying notes to consolidated financial statements.
F-5
ARES COMMERCIAL REAL ESTATE CORPORATION AND SUBSIDIARIES
CONSOLIDATED STATEMENTS OF EQUITY
(in thousands, except share and per share data)
|
|
Common Stock
|
Additional
Paid-in
Capital
|
Accumulated
Earnings (Deficit)
|
Total Stockholders’ Equity
|
Non-Controlling
Interests
|
Total
Equity
|
||||||||||||||||||||
|
|
Shares
|
Amount
|
||||||||||||||||||||||||
|
Balance at December 31, 2015
|
28,609,650
|
|
$
|
284
|
|
$
|
421,179
|
|
$
|
(11,992
|
)
|
$
|
409,471
|
|
$
|
47,017
|
|
$
|
456,488
|
|
||||||
|
Stock‑based compensation
|
3,022
|
|
—
|
|
312
|
|
—
|
|
312
|
|
—
|
|
312
|
|
||||||||||||
|
Repurchase and retirement of common stock
|
(129,916
|
)
|
(1
|
)
|
(1,435
|
)
|
—
|
|
(1,436
|
)
|
—
|
|
(1,436
|
)
|
||||||||||||
|
Net income
|
—
|
|
—
|
|
—
|
|
40,336
|
|
40,336
|
|
4,532
|
|
44,868
|
|
||||||||||||
|
Dividends declared
|
—
|
|
—
|
|
—
|
|
(29,654
|
)
|
(29,654
|
)
|
—
|
|
(29,654
|
)
|
||||||||||||
|
Contributions from non‑controlling interests
|
—
|
|
—
|
|
—
|
|
—
|
|
—
|
|
11
|
|
11
|
|
||||||||||||
|
Distributions to non-controlling interests
|
—
|
|
—
|
|
—
|
|
—
|
|
—
|
|
(40,916
|
)
|
(40,916
|
)
|
||||||||||||
|
Balance at December 31, 2016
|
28,482,756
|
|
$
|
283
|
|
$
|
420,056
|
|
$
|
(1,310
|
)
|
$
|
419,029
|
|
$
|
10,644
|
|
$
|
429,673
|
|
||||||
|
Stock‑based compensation
|
116,160
|
|
—
|
|
581
|
|
—
|
|
581
|
|
—
|
|
581
|
|
||||||||||||
|
Net income
|
—
|
|
—
|
|
—
|
|
30,407
|
|
30,407
|
|
25
|
|
30,432
|
|
||||||||||||
|
Dividends declared
|
—
|
|
—
|
|
—
|
|
(30,847
|
)
|
(30,847
|
)
|
—
|
|
(30,847
|
)
|
||||||||||||
|
Contributions from non-controlling interests
|
—
|
|
—
|
|
—
|
|
—
|
|
—
|
|
12
|
|
12
|
|
||||||||||||
|
Distributions to non-controlling interests
|
—
|
|
—
|
|
—
|
|
—
|
|
—
|
|
(10,681
|
)
|
(10,681
|
)
|
||||||||||||
|
Balance at December 31, 2017
|
28,598,916
|
|
$
|
283
|
|
$
|
420,637
|
|
$
|
(1,750
|
)
|
$
|
419,170
|
|
$
|
—
|
|
$
|
419,170
|
|
||||||
|
Stock-based compensation
|
156,749
|
|
—
|
|
1,102
|
|
—
|
|
1,102
|
|
—
|
|
1,102
|
|
||||||||||||
|
Net income
|
—
|
|
—
|
|
—
|
|
38,596
|
|
38,596
|
|
—
|
|
38,596
|
|
||||||||||||
|
Dividends declared
|
—
|
|
—
|
|
—
|
|
(33,281
|
)
|
(33,281
|
)
|
—
|
|
(33,281
|
)
|
||||||||||||
|
Balance at December 31, 2018
|
28,755,665
|
|
$
|
283
|
|
$
|
421,739
|
|
$
|
3,565
|
|
$
|
425,587
|
|
$
|
—
|
|
$
|
425,587
|
|
||||||
See accompanying notes to consolidated financial statements.
F-6
ARES COMMERCIAL REAL ESTATE CORPORATION AND SUBSIDIARIES
CONSOLIDATED STATEMENTS OF CASH FLOWS
(in thousands)
|
|
For the years ended December 31,
|
||||||||||
|
|
2018
|
2017
|
2016
|
||||||||
|
Operating activities:
|
|||||||||||
|
Net income
|
$
|
38,596
|
|
$
|
30,432
|
|
$
|
44,868
|
|
||
|
Adjustments to reconcile net income to net cash provided by (used in) operating activities (inclusive of amounts related to discontinued operations):
|
|||||||||||
|
Amortization of deferred financing costs
|
5,720
|
|
7,608
|
|
6,439
|
|
|||||
|
Change in mortgage banking activities
|
—
|
|
—
|
|
(10,386
|
)
|
|||||
|
Change in fair value of mortgage servicing rights
|
—
|
|
—
|
|
6,457
|
|
|||||
|
Accretion of deferred loan origination fees and costs
|
(6,949
|
)
|
(6,578
|
)
|
(5,924
|
)
|
|||||
|
Provision for loss sharing
|
—
|
|
—
|
|
(146
|
)
|
|||||
|
Cash paid to settle loss sharing obligations
|
—
|
|
—
|
|
(681
|
)
|
|||||
|
Originations of mortgage loans held for sale
|
—
|
|
—
|
|
(639,413
|
)
|
|||||
|
Sale of mortgage loans held for sale to third parties
|
—
|
|
—
|
|
571,714
|
|
|||||
|
Stock-based compensation
|
1,102
|
|
581
|
|
312
|
|
|||||
|
Early extinguishment of debt costs
|
—
|
|
768
|
|
—
|
|
|||||
|
Gain on sale of discontinued operations
|
—
|
|
—
|
|
(10,196
|
)
|
|||||
|
Depreciation expense
|
—
|
|
—
|
|
167
|
|
|||||
|
Deferred tax expense
|
—
|
|
—
|
|
2,049
|
|
|||||
|
Changes in operating assets and liabilities:
|
|||||||||||
|
Other assets
|
198
|
|
(2,530
|
)
|
40,016
|
|
|||||
|
Due to affiliate
|
535
|
|
(71
|
)
|
380
|
|
|||||
|
Other liabilities
|
16
|
|
1,066
|
|
(10,146
|
)
|
|||||
|
Net cash provided by (used in) operating activities
|
39,218
|
|
31,276
|
|
(4,490
|
)
|
|||||
|
Investing activities:
|
|
|
|||||||||
|
Issuance of and fundings on loans held for investment
|
(543,077
|
)
|
(900,289
|
)
|
(861,444
|
)
|
|||||
|
Principal repayment of loans held for investment
|
695,183
|
|
411,298
|
|
721,684
|
|
|||||
|
Proceeds from sale of mortgage loans held for sale
|
—
|
|
73,900
|
|
—
|
|
|||||
|
Receipt of origination fees
|
5,818
|
|
9,323
|
|
6,813
|
|
|||||
|
Proceeds from sale of discontinued operations, net of cash and restricted cash sold
|
—
|
|
—
|
|
73,004
|
|
|||||
|
Purchases of other assets
|
—
|
|
—
|
|
(354
|
)
|
|||||
|
Net cash provided by (used in) investing activities
|
157,924
|
|
(405,768
|
)
|
(60,297
|
)
|
|||||
|
Financing activities:
|
|||||||||||
|
Proceeds from secured funding agreements
|
642,241
|
|
923,882
|
|
1,288,698
|
|
|||||
|
Repayments of secured funding agreements
|
(822,227
|
)
|
(746,635
|
)
|
(1,030,760
|
)
|
|||||
|
Payment of secured funding costs
|
(2,322
|
)
|
(8,405
|
)
|
(5,563
|
)
|
|||||
|
Proceeds from issuance of debt of consolidated VIEs
|
—
|
|
272,927
|
|
—
|
|
|||||
|
Repayments of debt of consolidated VIEs
|
—
|
|
—
|
|
(255,275
|
)
|
|||||
|
Proceeds from warehouse lines of credit
|
—
|
|
—
|
|
863,382
|
|
|||||
|
Repayments of warehouse lines of credit
|
—
|
|
—
|
|
(795,684
|
)
|
|||||
|
Proceeds from secured term loan
|
—
|
|
—
|
|
80,000
|
|
|||||
|
Repayments of secured term loan
|
—
|
|
(45,000
|
)
|
—
|
|
|||||
|
Repurchase of common stock
|
—
|
|
—
|
|
(1,436
|
)
|
|||||
|
Dividends paid
|
(32,088
|
)
|
(30,531
|
)
|
(29,400
|
)
|
|||||
|
Contributions from non-controlling interests
|
—
|
|
12
|
|
11
|
|
|||||
|
Distributions to non-controlling interests
|
—
|
|
(10,681
|
)
|
(40,916
|
)
|
|||||
|
Net cash provided by (used in) financing activities
|
(214,396
|
)
|
355,569
|
|
73,057
|
|
|||||
|
Change in cash, cash equivalents and restricted cash
|
(17,254
|
)
|
(18,923
|
)
|
8,270
|
|
|||||
|
Cash, cash equivalents and restricted cash of continuing operations, beginning of period
|
28,722
|
|
47,645
|
|
18,149
|
|
|||||
|
Cash, cash equivalents and restricted cash of discontinued operations, beginning of period
|
—
|
|
—
|
|
21,226
|
|
|||||
|
Cash, cash equivalents and restricted cash, end of period
|
$
|
11,468
|
|
$
|
28,722
|
|
$
|
47,645
|
|
||
|
Cash, cash equivalents and restricted cash of continuing operations, end of period
|
$
|
11,468
|
|
$
|
28,722
|
|
$
|
47,645
|
|
||
|
Cash, cash equivalents and restricted cash of discontinued operations, end of period
|
$
|
—
|
|
$
|
—
|
|
$
|
—
|
|
||
|
Supplemental Information:
|
|||||||||||
|
Interest paid during the period
|
$
|
56,719
|
|
$
|
41,891
|
|
$
|
30,066
|
|
||
|
Income taxes paid during the period
|
$
|
360
|
|
$
|
240
|
|
$
|
—
|
|
||
|
Supplemental disclosure of noncash investing and financing activities:
|
|||||||||||
|
Dividends declared, but not yet paid
|
$
|
8,914
|
|
$
|
7,722
|
|
$
|
7,406
|
|
||
|
Other receivables related to consolidated VIEs
|
$
|
51,582
|
|
$
|
—
|
|
$
|
—
|
|
||
See accompanying notes to consolidated financial statements.
F-7
ARES COMMERCIAL REAL ESTATE CORPORATION AND SUBSIDIARIES
NOTES TO CONSOLIDATED FINANCIAL STATEMENTS
As of
December 31, 2018
(in thousands, except share and per share data, percentages and as otherwise indicated)
1. ORGANIZATION
Ares Commercial Real Estate Corporation (together with its consolidated subsidiaries, the “Company” or “ACRE”) is a specialty finance company primarily engaged in originating and investing in commercial real estate loans and related investments. Through Ares Commercial Real Estate Management LLC (“ACREM” or the Company’s “Manager”), a Securities and Exchange Commission (“SEC”) registered investment adviser and a subsidiary of Ares Management Corporation (NYSE: ARES) (“Ares Management” or “Ares”), a publicly traded, leading global alternative asset manager, it has investment professionals strategically located across the United States and Europe who directly source new loan opportunities for the Company with owners, operators and sponsors of commercial real estate (“CRE”) properties. The Company was formed and commenced operations in late 2011. The Company is a Maryland corporation and completed its initial public offering (the “IPO”) in May 2012. The Company is externally managed by its Manager, pursuant to the terms of a management agreement (the “Management Agreement”).
The Company is primarily focused on directly originating and managing a diversified portfolio of CRE debt-related investments for the Company’s own account. The Company’s target investments include senior mortgage loans, subordinated debt, preferred equity, mezzanine loans and other CRE investments, including commercial mortgage backed securities. These investments are generally held for investment and are secured, directly or indirectly, by office, multifamily, retail, industrial, lodging, senior-living, self storage, student housing, residential and other commercial real estate properties, or by ownership interests therein.
The Company has elected and qualified to be taxed as a real estate investment trust (“REIT”) for U.S. federal income tax purposes under the Internal Revenue Code of 1986, as amended (the “Code”), commencing with its taxable year ended December 31, 2012. The Company generally will not be subject to U.S. federal income taxes on its REIT taxable income, determined without regard to the deduction for dividends paid and excluding net capital gains, to the extent that it annually distributes all of its REIT taxable income to stockholders and complies with various other requirements as a REIT.
2. SIGNIFICANT ACCOUNTING POLICIES
Basis of Presentation
The accompanying consolidated financial statements have been prepared on the accrual basis of accounting in conformity with United States generally accepted accounting principles (“GAAP”) and include the accounts of the Company, the consolidated variable interest entities (“VIEs”) that the Company controls and of which the Company is the primary beneficiary, and the Company’s wholly-owned subsidiaries. The consolidated financial statements reflect all adjustments and reclassifications that, in the opinion of management, are necessary for the fair presentation of the Company’s results of operations and financial condition as of and for the periods presented. All intercompany balances and transactions have been eliminated.
Discontinued Operations
On June 28, 2016, the Company entered into a Purchase and Sale Agreement (as amended, the “Agreement”) with Barings Real Estate Advisers LLC (formerly known as Cornerstone Real Estate Advisers LLC), a Delaware limited liability company (the “Buyer”), to sell ACRE Capital Holdings LLC (“TRS Holdings”), the holding company that owned the Company’s mortgage banking subsidiary, ACRE Capital LLC (“ACRE Capital”). Under the terms and subject to the conditions set forth in the Agreement, on September 30, 2016, the Buyer purchased from the Company all of the outstanding common units of TRS Holdings (the “ACRE Capital Sale”). ACRE Capital primarily originated, sold and serviced multifamily and senior-living related loans under programs offered by government-sponsored enterprises and by government agencies. Under the terms of the Agreement, the Buyer paid approximately
$93 million
in cash as consideration for the ACRE Capital Sale.
Financial Accounting Standards Board (“FASB”) Accounting Standards Codification (“ASC”) Topic 205-20,
Presentation of Financial Statements - Discontinued Operations
, defines the criteria required for a disposal transaction to qualify for reporting as a discontinued operation. The Company determined that the ACRE Capital Sale met the criteria for discontinued operations. As a result, the operating results of ACRE Capital, which formerly comprised the mortgage banking segment, are presented separately in the Company’s consolidated financial statements as discontinued operations for the year
F-8
ended December 31, 2016. The operating results of discontinued operations are included in the line item “Net income from operations of discontinued operations, net of income taxes” in the consolidated statement of operations for the year ended December 31, 2016. Summarized financial information for the discontinued mortgage banking segment is shown in Note
13
included in these consolidated financial statements.
Variable Interest Entities
The Company evaluates all of its interests in VIEs for consolidation. When the Company’s interests are determined to be variable interests, the Company assesses whether it is deemed to be the primary beneficiary of the VIE. The primary beneficiary of a VIE is required to consolidate the VIE. FASB ASC Topic 810,
Consolidation
, defines the primary beneficiary as the party that has both (i) the power to direct the activities of the VIE that most significantly impact its economic performance, and (ii) the obligation to absorb losses and the right to receive benefits from the VIE which could be potentially significant. The Company considers its variable interests, as well as any variable interests of its related parties in making this determination. Where both of these factors are present, the Company is deemed to be the primary beneficiary and it consolidates the VIE. Where either one of these factors is not present, the Company is not the primary beneficiary and it does not consolidate the VIE.
To assess whether the Company has the power to direct the activities of a VIE that most significantly impact the VIE’s economic performance, the Company considers all facts and circumstances, including its role in establishing the VIE and its ongoing rights and responsibilities. This assessment includes first, identifying the activities that most significantly impact the VIE’s economic performance; and second, identifying which party, if any, has power over those activities. In general, the parties that make the most significant decisions affecting the VIE or have the right to unilaterally remove those decision makers are deemed to have the power to direct the activities of a VIE.
To assess whether the Company has the obligation to absorb losses of the VIE or the right to receive benefits from the VIE that could potentially be significant to the VIE, the Company considers all of its economic interests, including debt and equity investments, servicing fees, and other arrangements deemed to be variable interests in the VIE. This assessment requires that the Company applies judgment in determining whether these interests, in the aggregate, are considered potentially significant to the VIE. Factors considered in assessing significance include: the design of the VIE, including its capitalization structure; subordination of interests; payment priority; relative share of interests held across various classes within the VIE’s capital structure; and the reasons why the interests are held by the Company.
For VIEs of which the Company is determined to be the primary beneficiary, all of the underlying assets, liabilities, equity, revenue and expenses of the structures are consolidated into the Company’s consolidated financial statements.
The Company performs an ongoing reassessment of: (1) whether any entities previously evaluated under the majority voting interest framework have become VIEs, based on certain events, and therefore are subject to the VIE consolidation framework, and (2) whether changes in the facts and circumstances regarding its involvement with a VIE cause the Company’s consolidation conclusion regarding the VIE to change. See Note
12
included in these consolidated financial statements for further discussion of the Company’s VIEs.
Segment Reporting
The Company previously had
two
reportable business segments: principal lending and mortgage banking. As a result of the ACRE Capital Sale, the operations of the mortgage banking segment have been reclassified as discontinued operations in all periods presented. The Company now conducts and manages its business as one operating segment, rather than multiple operating segments; therefore, the Company no longer provides segment reporting. See Note
13
included in these consolidated financial statements for further discussion of the sale of the mortgage banking segment.
Cash, Cash Equivalents and Restricted Cash
Cash and cash equivalents include funds on deposit with financial institutions, including demand deposits with financial institutions. Cash and short‑term investments with an original maturity of three months or less when acquired are considered cash and cash equivalents for the purpose of the consolidated balance sheets and statements of cash flows.
Restricted cash includes deposits required under certain Secured Funding Agreements (each individually defined in Note
4
included in these consolidated financial statements).
F-9
The following table provides a reconciliation of cash, cash equivalents and restricted cash in the consolidated balance sheets to the total amount shown in the consolidated statements of cash flows ($ in thousands):
|
For the years ended December 31,
|
|||||||||||
|
2018
|
2017
|
2016
|
|||||||||
|
Cash and cash equivalents
|
$
|
11,089
|
|
$
|
28,343
|
|
$
|
47,270
|
|
||
|
Restricted cash
|
379
|
|
379
|
|
375
|
|
|||||
|
Total cash, cash equivalents and restricted cash shown in the Company's consolidated statements of cash flows
|
$
|
11,468
|
|
$
|
28,722
|
|
$
|
47,645
|
|
||
Concentration of Credit Risk
Financial instruments that potentially subject the Company to concentrations of credit risk consist primarily of cash and cash equivalents and restricted cash, loans held for investment and interest receivable. The Company places its cash and cash equivalents with financial institutions and, at times, cash held may exceed the FDIC‑insured limit. The Company has exposure to credit risk on its loans held for investment. The Company and the Company’s Manager seek to manage credit risk by performing due diligence prior to origination or acquisition and through the use of non‑recourse financing, when and where available and appropriate.
Loans Held for Investment
The Company originates CRE debt and related instruments generally to be held for investment. Loans that are held for investment are carried at cost, net of unamortized loan fees and origination costs, unless the loans are deemed impaired. Impairment occurs when it is deemed probable that the Company will not be able to collect all amounts due according to the contractual terms of the loan. If a loan is considered to be impaired, the Company will record an allowance to reduce the carrying value of the loan to the present value of expected future cash flows discounted at the loan’s contractual effective rate.
Each loan classified as held for investment is evaluated for impairment on a quarterly basis. Loans are generally collateralized by real estate. The extent of any credit deterioration associated with the performance and/or value of the underlying collateral property and the financial and operating capability of the borrower could impact the expected amounts received. The Company monitors performance of its investment portfolio under the following methodology: (1) borrower review, which analyzes the borrower’s ability to execute on its original business plan, reviews its financial condition, assesses pending litigation and considers its general level of responsiveness and cooperation; (2) economic review, which considers underlying collateral (i.e. leasing performance, unit sales and cash flow of the collateral and its ability to cover debt service, as well as the residual loan balance at maturity); (3) property review, which considers current environmental risks, changes in insurance costs or coverage, current site visibility, capital expenditures and market perception; and (4) market review, which analyzes the collateral from a supply and demand perspective of similar property types, as well as from a capital markets perspective. Such impairment analyses are completed and reviewed by asset management and finance personnel who utilize various data sources, including periodic financial data such as property occupancy, tenant profile, rental rates, operating expenses, and the borrower’s exit plan, among other factors.
In addition, the Company evaluates the entire portfolio to determine whether the portfolio has any impairment that requires a valuation allowance on the remainder of the loan portfolio. For the
years ended December 31, 2018, 2017 and 2016
, the Company did not recognize any impairment charges with respect to its loans held for investment.
Loans are generally placed on non-accrual status when principal or interest payments are past due 30 days or more or when there is reasonable doubt that principal or interest will be collected in full. Accrued and unpaid interest is generally reversed against interest income in the period the loan is placed on non-accrual status. Interest payments received on non-accrual loans may be recognized as income or applied to principal depending upon management’s judgment regarding the borrower’s ability to make pending principal and interest payments. Non-accrual loans are restored to accrual status when past due principal and interest are paid and, in management’s judgment, are likely to remain current. The Company may make exceptions to placing a loan on non-accrual status if the loan has sufficient collateral value and is in the process of collection.
Preferred equity investments, which are subordinate to any loans but senior to common equity, are accounted for as loans held for investment and are carried at cost, net of unamortized loan fees and origination costs, unless the loans are deemed impaired, and are included within loans held for investment in the Company’s consolidated balance sheets. The
F-10
Company accretes or amortizes any discounts or premiums over the life of the related loan held for investment utilizing the effective interest method.
Debt Issuance Costs
Debt issuance costs under the Company’s indebtedness are capitalized and amortized over the term of the respective debt instrument. Unamortized debt issuance costs are expensed when the associated debt is repaid prior to maturity. Debt issuance costs related to debt securitizations are capitalized and amortized over the term of the underlying loans using the effective interest method. When an underlying loan is prepaid in a debt securitization and the outstanding principal balance of the securitization debt is reduced, the related unamortized debt issuance costs are charged to expense based on a pro‑rata share of the debt issuance costs being allocated to the specific loans that were prepaid. Amortization of debt issuance costs is included within interest expense in the Company’s consolidated statements of operations while the unamortized balance on (i) Secured Funding Agreements (each individually defined in Note
4
included in these consolidated financial statements) is included within other assets and (ii) the Secured Term Loan (defined in Note
4
included in these consolidated financial statements) and debt securitizations are both included as a reduction to the carrying amount of the liability, in the Company’s consolidated balance sheets.
The original issue discount (“OID”) on amounts drawn under the Company’s Secured Term Loan represents a discount to the face amount of the drawn debt obligations. The OID is amortized over the term of the Secured Term Loan using the effective interest method and is included within interest expense in the Company’s consolidated statements of operations while the unamortized balance is included as a reduction to the carrying amount of the Secured Term Loan in the Company’s consolidated balance sheets.
Revenue Recognition
Interest income from loans held for investment
is accrued based on the outstanding principal amount and the contractual terms of each loan. For loans held for investment, origination fees, contractual exit fees and direct loan origination costs are also recognized in interest income from loans held for investment over the initial loan term as a yield adjustment using the effective interest method.
A reconciliation of the Company’s interest income from loans held for investment, excluding non-controlling interests, to the Company’s interest income from loans held for investment as included within its consolidated statements of operations for the
years ended December 31, 2018, 2017 and 2016
is as follows ($ in thousands):
|
For the years ended December 31,
|
||||||||||||
|
2018
|
2017
|
2016
|
||||||||||
|
Interest income from loans held for investment, excluding non-controlling interests
|
$
|
118,284
|
|
$
|
97,506
|
|
$
|
77,424
|
|
|||
|
Interest income from non-controlling interest investment held by third parties
|
—
|
|
35
|
|
4,539
|
|
||||||
|
Interest income from loans held for investment
|
$
|
118,284
|
|
$
|
97,541
|
|
$
|
81,963
|
|
|||
Net Interest Margin and Interest Expense
Net interest margin in the Company’s consolidated statements of operations serves to measure the performance of the Company’s loans held for investment as compared to its use of debt leverage. The Company includes interest income from its loans held for investment and interest expense related to its Secured Funding Agreements, securitizations debt and the Secured Term Loan (individually defined in Note
4
included in these consolidated financial statements) in net interest margin. For the
years ended December 31, 2018, 2017 and 2016
, interest expense is comprised of the following ($ in thousands):
|
For the years ended December 31,
|
|||||||||||
|
|
2018
|
2017
|
2016
|
||||||||
|
Secured funding agreements and securitizations debt
|
$
|
54,473
|
|
$
|
37,602
|
|
$
|
27,856
|
|
||
|
Secured term loan
|
8,529
|
|
13,591
|
|
9,000
|
|
|||||
|
Interest expense
|
$
|
63,002
|
|
$
|
51,193
|
|
$
|
36,856
|
|
||
F-11
Income Taxes
The Company has elected and qualified for taxation as a REIT commencing with its taxable year ended December 31, 2012. As a result of the Company’s REIT qualification and its distribution policy, the Company does not generally pay U.S. federal corporate level income taxes. Many of the REIT requirements, however, are highly technical and complex. To continue to qualify as a REIT, the Company must meet a number of organizational and operational requirements, including a requirement that the Company distributes annually to its stockholders at least 90% of the Company’s REIT taxable income, determined without regard to the deduction for dividends paid and excluding net capital gains. To the extent that the Company distributes less than 100% of its REIT taxable income in any tax year (taking into account any distributions made in a subsequent tax year under Sections 857(b)(9) or 858 of the Code), the Company will pay tax at regular corporate rates on that undistributed portion. Furthermore, if a REIT distributes less than the sum of 85% of its ordinary income for the calendar year, 95% of its capital gain net income for the calendar year plus any undistributed shortfall from its prior calendar year (the “Required Distribution”) to its stockholders during any calendar year (including any distributions declared by the last day of the calendar year but paid in the subsequent year), then it is required to pay a non-deductible excise tax equal to
4%
of any shortfall between the Required Distribution and the amount that was actually distributed. The 90% distribution requirement does not require the distribution of net capital gains. However, if a REIT elects to retain any of its net capital gain for any tax year, it must notify its stockholders and pay tax at regular corporate rates on the retained net capital gain. The stockholders must include their proportionate share of the retained net capital gain in their taxable income for the tax year, and they are deemed to have paid the REIT’s tax on their proportionate share of the retained capital gain. Furthermore, such retained capital gain may be subject to the nondeductible
4%
excise tax. If it is determined that the Company’s estimated current year taxable income will be in excess of estimated dividend distributions (including capital gain dividend) for the current year from such income, the Company accrues excise tax on estimated excess taxable income as such taxable income is earned. The annual expense is calculated in accordance with applicable tax regulations. Excise tax expense is included in the line item income tax expense (benefit), including excise tax in the consolidated statements of operations included in this annual report on Form 10-K.
The Company formed a wholly-owned subsidiary, ACRC Lender W TRS LLC (“ACRC W TRS”), in December 2013 in order to issue and hold certain loans intended for sale. The Company also formed a wholly-owned subsidiary, ACRC 2017-FL3 TRS LLC (“FL3 TRS”), in March 2017 in order to hold a portion of the CLO Securitization (as defined below) to the extent it generates excess inclusion income. Entity classification elections to be taxed as a corporation and taxable REIT subsidiary (“TRS”) elections were made with respect to ACRC W TRS and FL3 TRS. A TRS is an entity taxed as a corporation that has not elected to be taxed as a REIT, in which a REIT directly or indirectly holds equity, and that has made a joint election with such REIT to be treated as a TRS. A TRS generally may engage in any business, including investing in assets and engaging in activities that could not be held or conducted directly by the Company without jeopardizing its qualification as a REIT. A TRS is subject to applicable U.S. federal, state and local income tax on its taxable income. In addition, as a REIT, the Company also may be subject to a 100% excise tax on certain transactions between it and its TRS that are not conducted on an arm’s-length basis. For financial reporting purposes, a provision for current and deferred taxes has been established for the portion of the Company’s GAAP consolidated earnings recognized by ACRC W TRS and FL3 TRS. The income tax provision is included in the line item income tax expense (benefit), including excise tax in the consolidated statements of operations included in this annual report on Form 10-K.
FASB ASC Topic 740,
Income Taxes
(“ASC 740”), prescribes a recognition threshold and measurement attribute for the financial statement recognition and measurement of a tax position taken or expected to be taken in a tax return. ASC 740 also provides guidance on derecognition, classification, interest and penalties, accounting in interim periods, disclosure and transition. The Company has analyzed its various federal and state filing positions and believes that its income tax filing positions and deductions are well documented and supported.
As of December 31, 2018 and 2017
, based on the Company’s evaluation, there is no reserve for any uncertain income tax positions. ACRC W TRS and FL3 TRS recognize interest and penalties, if any, related to unrecognized tax benefits within income tax expense in the consolidated statements of operations. Accrued interest and penalties, if any, are included within other liabilities in the consolidated balance sheets.
Comprehensive Income
For the
years ended December 31, 2018, 2017 and 2016
, comprehensive income equaled net income; therefore, a separate consolidated statement of comprehensive income is not included in the accompanying consolidated financial statements.
F-12
Stock‑Based Compensation
The Company recognizes the cost of stock‑based compensation, which is included within general and administrative expenses in the Company’s consolidated statements of operations. The fair value of the time vested restricted stock or restricted stock units granted is recorded to expense on a straight‑line basis over the vesting period for the award, with an offsetting increase in stockholders’ equity. For grants to directors and officers and employees of the Manager, the fair value is determined based upon the market price of the stock on the grant date.
Earnings per Share
The Company calculates basic earnings (loss) per share by dividing net income (loss) allocable to common stockholders for the period by the weighted average shares of common stock outstanding for that period after consideration of the earnings (loss) allocated to the Company’s restricted stock, which are participating securities as defined in GAAP. Diluted earnings (loss) per share takes into effect any dilutive instruments, such as restricted stock and convertible debt, except when doing so would be anti‑dilutive. The Company presents both basic and diluted earnings per share amounts for continuing operations and discontinued operations. See Note
7
included in these consolidated financial statements for the earnings per share calculations.
Use of Estimates in the Preparation of Financial Statements
The preparation of financial statements in conformity with GAAP requires management to make estimates and assumptions that affect certain reported amounts and disclosures. Actual results could differ from those estimates.
Recent Accounting Pronouncements
In May 2014, the FASB issued Accounting Standards Update (“ASU”) No. 2014-09,
Revenue from Contracts with Customers (Topic 606)
. The guidance in this ASU supersedes the revenue recognition requirements in
Revenue Recognition (Topic 605)
. Under the new guidance, an entity should recognize revenue to depict the transfer of promised goods or services to customers in an amount that reflects the consideration to which the entity expects to be entitled in exchange for those goods or services. The amendments in ASU No. 2014-09 are effective for annual reporting periods beginning after December 15, 2017, including interim periods within that reporting period. The Company has assessed and determined that the application of this guidance does not have a material impact on the Company’s consolidated financial statements, primarily because the majority of the Company’s revenue is accounted for under FASB ASC Topic 310,
Receivables
, which is scoped out of this standard.
In June 2016, the FASB issued ASU No. 2016-13,
Financial Instruments - Credit Losses (Topic 326): Measurement of Credit Losses on Financial Instruments
. The standard will replace the incurred loss impairment methodology pursuant to GAAP with a methodology that reflects expected credit losses and requires consideration of a broader range of reasonable and supportable information to inform credit loss estimates. ASU No. 2016-13 is effective for annual reporting periods beginning after December 15, 2019, including interim periods within that reporting period, with early adoption permitted after December 15, 2018, including interim periods within that reporting period. The Company is currently evaluating the impact of adopting this ASU on its consolidated financial statements.
In August 2016, the FASB issued ASU No. 2016-15,
Statement of Cash Flows (Topic 230): Classification of Certain Cash Receipts and Cash Payments
, which intends to reduce diversity in practice in how certain transactions are classified in the statement of cash flows. ASU No. 2016-15 provides guidance on eight specific cash flow issues and clarifies that in the absence of specific guidance, an entity should classify each separately identifiable cash source and use on the basis of the nature of the underlying cash flows. For cash flows with aspects of more than one class that cannot be separated, the classification should be based on the activity that is likely to be the predominant source or use of cash flow. ASU No. 2016-15 is effective for annual reporting periods beginning after December 15, 2017, including interim periods within that reporting period, with early adoption permitted. The Company has assessed and determined that the application of this guidance does not have a material impact on the Company’s consolidated financial statements.
In November 2016, the FASB issued ASU No. 2016-18,
Statement of Cash Flows (Topic 230): Restricted Cash (a Consensus of the FASB Emerging Issues Task Force)
.The amendments in this update require that a statement of cash flows explain the change during the period in the total of cash, cash equivalents and amounts generally described as restricted cash or restricted cash equivalents. Therefore, amounts generally described as restricted cash and restricted cash equivalents should be included with cash and cash equivalents when reconciling the beginning-of-period and end-of-period total amounts shown on the statement of cash flows. ASU No. 2016-18 is effective for annual reporting periods beginning after December 15, 2017,
F-13
including interim periods within that reporting period, with early adoption permitted. The Company adopted ASU No. 2016-18 and applied the guidance retrospectively to the prior period consolidated statements of cash flows.
SEC Disclosure Update and Simplification
In August 2018, the SEC adopted the final rule under SEC Release No. 33-10532,
Disclosure Update and Simplification
, amending certain disclosure requirements that were redundant, duplicative, overlapping, outdated or superseded. In addition, the amendments expanded the disclosure requirements on the analysis of stockholders' equity for interim financial statements. Under the amendments, an analysis of changes in each caption of stockholders' equity and noncontrolling interests presented in the balance sheet must be provided in a note or separate statement. The analysis should present a reconciliation of the beginning balance to the ending balance of each period for which a statement of comprehensive income is required to be filed. The Company plans to use the new presentation of consolidated statement of stockholders' equity beginning in 2019. The final rule became effective on November 5, 2018.
3. LOANS HELD FOR INVESTMENT
As of
December 31, 2018
, the Company’s portfolio included
44
loans held for investment, excluding
76
loans that were repaid or sold since inception. The aggregate originated commitment under these loans at closing was approximately
$1.7 billion
and outstanding principal was
$1.5 billion
as of
December 31, 2018
. During the
year ended December 31, 2018
, the Company funded approximately
$544.2 million
of outstanding principal and received repayments of
$746.8 million
of outstanding principal, as described in more detail in the tables below. Such investments are referred to herein as the Company’s “investment portfolio.” As of
December 31, 2018
,
89.8%
of the Company’s loans have London Interbank Offered Rate (“LIBOR”) floors, with a weighted average floor of
1.38%
, calculated based on loans with LIBOR floors. References to LIBOR or “L” are to 30-day LIBOR (unless otherwise specifically stated).
The Company’s investments in loans held for investment are accounted for at amortized cost. The following tables summarize the Company’s loans held for investment
as of December 31, 2018 and 2017
($ in thousands):
|
|
As of December 31, 2018
|
||||||||||||||
|
Carrying Amount (1)
|
Outstanding Principal (1)
|
Weighted Average Minimum Loan Borrowing Spread (2)
|
Weighted Average Unleveraged Effective Yield (3)
|
Weighted Average Remaining Life (Years)
|
|||||||||||
|
Senior mortgage loans
|
$
|
1,489,708
|
|
$
|
1,498,530
|
|
5.2
|
%
|
7.0
|
%
|
1.7
|
||||
|
Subordinated debt and preferred equity investments
|
35,165
|
|
36,213
|
|
12.7
|
%
|
14.9
|
%
|
4.3
|
||||||
|
Total loans held for investment portfolio
|
$
|
1,524,873
|
|
$
|
1,534,743
|
|
5.4
|
%
|
7.1
|
%
|
1.8
|
||||
|
|
As of December 31, 2017
|
||||||||||||||
|
Carrying Amount (1)
|
Outstanding Principal (1)
|
Weighted Average Minimum Loan Borrowing Spread (2)
|
Weighted Average Unleveraged Effective Yield (3)
|
Weighted Average Remaining Life (Years)
|
|||||||||||
|
Senior mortgage loans
|
$
|
1,674,169
|
|
$
|
1,684,439
|
|
4.8
|
%
|
6.2
|
%
|
1.9
|
||||
|
Subordinated debt and preferred equity investments
|
52,114
|
|
52,847
|
|
9.5
|
%
|
10.8
|
%
|
3.4
|
||||||
|
Total loans held for investment portfolio
|
$
|
1,726,283
|
|
$
|
1,737,286
|
|
5.0
|
%
|
6.3
|
%
|
2.0
|
||||
_______________________________________________________________________________
|
(1)
|
The difference between the Carrying Amount and the Outstanding Principal amount of the loans held for investment consists of unamortized purchase discount, deferred loan fees and loan origination costs.
|
|
(2)
|
Minimum Loan Borrowing Spread is equal to (a) for floating rate loans, the margin above the applicable index rate (e.g., LIBOR) plus floors, if any, on such applicable index rates, and (b) for fixed rate loans, the applicable interest rate.
|
|
(3)
|
Unleveraged Effective Yield is the compounded effective rate of return that would be earned over the life of the investment based on the contractual interest rate (adjusted for any deferred loan fees, costs, premiums or discounts) and assumes
no
dispositions, early prepayments or defaults. The total Weighted Average Unleveraged Effective Yield
|
F-14
is calculated based on the average of Unleveraged Effective Yield of all loans held by the Company
as of December 31, 2018 and 2017
as weighted by the outstanding principal balance of each loan.
A more detailed listing of the Company’s investment portfolio based on information available as of
December 31, 2018
is as follows ($ in millions, except percentages):
|
Loan Type
|
Location
|
Outstanding Principal (1)
|
Carrying Amount (1)
|
Interest Rate
|
Unleveraged Effective Yield (2)
|
Maturity Date (3)
|
Payment Terms (4)
|
||||||||
|
Senior Mortgage Loans:
|
|||||||||||||||
|
Multifamily
|
|
FL
|
|
$89.7
|
|
$89.5
|
|
L+4.75%
|
|
7.8%
|
|
Sep 2019
|
|
I/O
|
|
|
Hotel
|
|
Diversified
|
|
68.0
|
|
67.4
|
|
L+3.60%
|
|
6.6%
|
|
Sep 2021
|
|
I/O
|
|
|
Office
|
|
TX
|
|
67.2
|
|
66.8
|
|
L+3.60%
|
|
6.6%
|
|
July 2020
|
|
I/O
|
|
|
Hotel
|
|
OR/WA
|
|
64.1
|
|
63.6
|
|
L+3.45%
|
|
6.5%
|
|
May 2021
|
|
I/O
|
|
|
Multifamily
|
|
UT
|
|
63.5
|
|
63.2
|
|
L+3.25%
|
|
6.0%
|
|
Dec 2020
|
|
I/O
|
|
|
Office
|
|
IL
|
|
63.2
|
|
63.1
|
|
L+3.99%
|
|
6.9%
|
|
Aug 2019
|
|
I/O
|
|
|
Office
|
|
IL
|
|
61.2
|
|
60.8
|
|
L+3.75%
|
|
6.8%
|
|
Dec 2020
|
|
I/O
|
|
|
Office
|
|
NJ
|
|
54.5
|
|
54.2
|
|
L+4.65%
|
|
7.7%
|
|
July 2020
|
|
I/O
|
|
|
Office
|
|
IL
|
|
54.1
|
|
53.8
|
|
L+3.95%
|
|
6.8%
|
|
June 2021
|
|
I/O
|
|
|
Industrial
|
|
MN
|
|
52.0
|
|
51.7
|
|
L+3.15%
|
|
6.1%
|
|
Dec 2020
|
|
I/O
|
|
|
Mixed-use
|
|
CA
|
|
49.0
|
|
48.7
|
|
L+4.00%
|
|
6.9%
|
|
Apr 2021
|
|
I/O
|
|
|
Multifamily
|
|
FL
|
|
45.4
|
|
45.3
|
|
L+4.75%
|
|
7.8%
|
|
Sep 2019
|
|
I/O
|
|
|
Multifamily
|
|
TX
|
|
42.7
|
|
42.5
|
|
L+3.30%
|
|
6.2%
|
|
Dec 2020
|
|
I/O
|
|
|
Student Housing
|
|
CA
|
|
41.8
|
|
41.5
|
|
L+3.95%
|
|
7.0%
|
|
July 2020
|
|
I/O
|
|
|
Multifamily
|
|
FL
|
|
41.2
|
|
40.8
|
|
L+2.60%
|
|
5.7%
|
|
Jan 2022
|
|
I/O
|
|
|
Student Housing
|
|
TX
|
|
41.0
|
|
40.7
|
|
L+4.75%
|
|
7.8%
|
|
Jan 2021
|
|
I/O
|
|
|
Hotel
|
|
CA
|
|
40.0
|
|
39.7
|
|
L+4.12%
|
|
7.0%
|
|
Jan 2021
|
|
I/O
|
|
|
Multifamily
|
|
SC
|
|
38.9
|
|
38.7
|
|
L+3.36%
|
|
6.3%
|
|
May 2021
|
|
I/O
|
|
|
Student Housing
|
|
NC
|
|
38.7
|
|
38.7
|
|
L+4.00%
|
|
7.5%
|
|
Feb 2019
|
|
I/O
|
|
|
Hotel
|
|
NY
|
|
38.6
|
|
38.6
|
|
L+4.75%
|
|
7.3%
|
|
Dec 2018
|
(5)
|
I/O
|
|
|
Multifamily
|
|
IL
|
|
37.0
|
|
36.6
|
|
L+3.50%
|
|
6.7%
|
|
Nov 2020
|
|
I/O
|
|
|
Hotel
|
|
MI
|
|
35.2
|
|
35.2
|
|
L+4.15%
|
|
6.7%
|
|
July 2019
|
(6)
|
I/O
|
|
|
Hotel
|
|
MN
|
|
31.5
|
|
31.2
|
|
L+3.55%
|
|
6.4%
|
|
Aug 2021
|
|
I/O
|
|
|
Multifamily
|
|
NY
|
|
30.1
|
|
30.0
|
|
L+3.20%
|
|
6.1%
|
|
Dec 2020
|
|
I/O
|
|
|
Multifamily
|
|
PA
|
|
29.4
|
|
29.1
|
|
L+3.00%
|
|
6.1%
|
|
Dec 2021
|
|
I/O
|
|
|
Office
|
|
CO
|
|
27.6
|
|
27.3
|
|
L+4.15%
|
|
7.1%
|
|
June 2021
|
|
I/O
|
|
|
Multifamily
|
|
TX
|
|
27.5
|
|
27.4
|
|
L+3.20%
|
|
6.2%
|
|
Oct 2020
|
|
I/O
|
|
|
Multifamily
|
|
CA
|
|
26.8
|
|
26.7
|
|
L+3.85%
|
|
6.8%
|
|
July 2020
|
|
I/O
|
|
|
Student Housing
|
|
AL
|
|
24.1
|
|
24.0
|
|
L+4.45%
|
|
7.5%
|
|
Feb 2020
|
|
I/O
|
|
|
Student Housing
|
|
TX
|
|
24.0
|
|
23.8
|
|
L+4.10%
|
|
7.1%
|
|
Jan 2021
|
|
I/O
|
|
|
Hotel
|
|
IL
|
|
21.4
|
|
21.2
|
|
L+4.40%
|
|
7.5%
|
|
May 2021
|
|
I/O
|
|
|
Multifamily
|
|
CA
|
|
19.8
|
|
19.6
|
|
L+3.30%
|
|
6.2%
|
|
Feb 2021
|
|
I/O
|
|
|
Office
|
|
PA
|
|
19.6
|
|
19.5
|
|
L+4.70%
|
|
7.7%
|
|
Mar 2020
|
|
I/O
|
|
|
Multifamily
|
|
FL
|
|
19.2
|
|
19.1
|
|
L+4.00%
|
|
6.9%
|
|
Nov 2020
|
|
I/O
|
|
|
Office
|
|
FL
|
|
18.4
|
|
18.3
|
|
L+4.30%
|
|
7.4%
|
|
Apr 2020
|
|
I/O
|
|
|
Residential Condominium
|
|
FL
|
|
17.5
|
|
17.4
|
|
L+8.00%
|
|
11.9%
|
|
Apr 2020
|
|
I/O
|
|
|
Office
|
|
CA
|
|
17.5
|
|
17.3
|
|
L+3.40%
|
|
6.5%
|
|
Nov 2021
|
|
I/O
|
|
|
Residential
|
|
CA
|
|
9.1
|
|
8.8
|
|
12.00%
|
|
14.8%
|
|
Feb 2020
|
|
I/O
|
|
|
Office
|
|
NC
|
|
8.0
|
|
7.9
|
|
L+4.00%
|
|
7.1%
|
|
Nov 2022
|
|
I/O
|
|
|
Subordinated Debt and Preferred Equity Investments:
|
|||||||||||||||
|
Office
|
|
NJ
|
|
17.0
|
|
16.4
|
|
12.00%
|
|
12.8%
|
|
Jan 2026
|
|
I/O
|
(7)
|
|
Residential Condominium
|
|
NY
|
|
10.8
|
|
10.6
|
|
L+14.00%
|
|
17.5%
|
|
May 2021
|
|
I/O
|
|
|
Residential Condominium
|
|
HI
|
|
4.7
|
|
4.7
|
|
14.00%
|
|
19.1%
|
|
Apr 2019
|
|
I/O
|
|
|
Office
|
|
CA
|
|
2.7
|
|
2.7
|
|
L+8.25%
|
|
10.9%
|
|
Nov 2021
|
|
I/O
|
|
|
Mixed-use
|
|
IL
|
|
1.0
|
|
0.8
|
|
L+12.25%
|
|
15.7%
|
|
Nov 2021
|
|
I/O
|
|
|
Total/Weighted Average
|
$1,534.7
|
$1,524.9
|
7.1%
|
||||||||||||
_______________________________________________________________________________
|
(1)
|
The difference between the Carrying Amount and the Outstanding Principal amount of the loans held for investment consists of unamortized purchase discount, deferred loan fees and loan origination costs. For the loans held for investment that represent co-investments with other investment vehicles managed by Ares Management (see Note 10 included in these consolidated financial statements for additional information on co-investments), only the portion of Carrying Amount and Outstanding Principal held by the Company is reflected.
|
F-15
|
(2)
|
Unleveraged Effective Yield is the compounded effective rate of return that would be earned over the life of the investment based on the contractual interest rate (adjusted for any deferred loan fees, costs, premiums or discounts) and assumes no dispositions, early prepayments or defaults. Unleveraged Effective Yield for each loan is calculated based on LIBOR as of
December 31, 2018
or the LIBOR floor, as applicable. The total Weighted Average Unleveraged Effective Yield is calculated based on the average of Unleveraged Effective Yield of all loans held by the Company as of
December 31, 2018
as weighted by the outstanding principal balance of each loan.
|
|
(3)
|
Certain loans are subject to contractual extension options that generally vary between
one
and
two
12
-month extensions and may be subject to performance based or other conditions as stipulated in the loan agreement. Actual maturities may differ from contractual maturities stated herein as certain borrowers may have the right to prepay with or without paying a prepayment penalty. The Company may also extend contractual maturities and amend other terms of the loans in connection with loan modifications.
|
|
(4)
|
I/O = interest only, P/I = principal and interest.
|
|
(5)
|
As of December 31, 2018, the
$38.6 million
senior mortgage loan, which is collateralized by a hotel property located in New York, is in maturity default. See below in this Note 3 included in these consolidated financial statements for further discussion of this loan.
|
|
(6)
|
In June 2018, the borrower exercised a one-year extension option in accordance with the loan agreement, which extended the maturity date on the senior Michigan loan to July 2019.
|
|
(7)
|
In February 2021, amortization will begin on the subordinated New Jersey loan, which had an outstanding principal balance of
$17.0
million as of
December 31, 2018
. The remainder of the loans in the Company’s portfolio are non-amortizing through their primary terms.
|
The Company has made, and may continue to make, modifications to loans, including loans that are in default. Loan terms that may be modified include interest rates, required prepayments, asset release prices, maturity dates, covenants, principal amounts and other loan terms. The terms and conditions of each modification vary based on individual circumstances and will be determined on a case by case basis.
For the
years ended December 31, 2018 and 2017
, the activity in the Company’s loan portfolio was as follows ($ in thousands):
|
Balance at December 31, 2016
|
$
|
1,313,937
|
|
|
Initial funding
|
878,834
|
|
|
|
Origination fees and discounts, net of costs
|
(9,323
|
)
|
|
|
Additional funding
|
21,455
|
|
|
|
Amortizing payments
|
(509
|
)
|
|
|
Loan payoffs
|
(410,789
|
)
|
|
|
Loans sold to third parties (1)
|
(73,900
|
)
|
|
|
Origination fee accretion
|
6,578
|
|
|
|
Balance at December 31, 2017
|
$
|
1,726,283
|
|
|
Initial funding
|
510,529
|
|
|
|
Origination fees and discounts, net of costs
|
(5,816
|
)
|
|
|
Additional funding
|
33,693
|
|
|
|
Amortizing payments
|
(645
|
)
|
|
|
Loan payoffs
|
(746,120
|
)
|
|
|
Origination fee accretion
|
6,949
|
|
|
|
Balance at December 31, 2018
|
$
|
1,524,873
|
|
_______________________________________________________________________________
|
(1)
|
In December 2017, the Company sold a senior mortgage loan and a B-Note mortgage loan with outstanding principal of
$63.9 million
and
$10.0 million
, respectively, which were both collateralized by an office property located in Texas, to a third party. Both loans were previously classified as held for investment and were sold in order to rebalance and optimize the Company’s loan portfolio. No gain or loss was recognized on the sale.
|
As of December 31, 2018, the
$38.6 million
senior mortgage loan, which is collateralized by a hotel property located in New York, was in maturity default due to the failure of the borrower to repay the outstanding principal balance of the loan by
F-16
the December 2018 maturity date. The Company evaluated this loan for impairment and concluded that no impairment charge should be recognized as of December 31, 2018 and that this loan should not be placed on non-accrual status as of December 31, 2018. This conclusion was based in part on (1) the current estimated fair market value of the underlying collateral property and applicable reserves and (2) cash flows from operations of the underlying collateral property. The estimated fair market value of the underlying collateral property was determined using the income and market approach. As of December 31, 2018, the loan is current on its regular interest payments.
Except as described above, as of
December 31, 2018
, all loans were paying in accordance with their contractual terms.
No
imp
airment charges have been recognized during the
years ended December 31, 2018, 2017 and 2016
.
4. DEBT
Financing Agreements
The Company borrows funds, as applicable in a given period, under the Wells Fargo Facility, the Citibank Facility, the BAML Facility, the CNB Facility, the MetLife Facility, the UBS Facility and the U.S. Bank Facility (individually defined below and collectively, the “Secured Funding Agreements”) and the Secured Term Loan (as defined below). The Company refers to the Secured Funding Agreements and the Secured Term Loan as the “Financing Agreements.” The outstanding balance of the Financing Agreements in the table below are presented gross of debt issuance costs.
As of December 31, 2018 and 2017
, the outstanding balances and total commitments under the Financing Agreements consisted of the following ($ in thousands):
|
As of December 31,
|
||||||||||||||||
|
2018
|
2017
|
|||||||||||||||
|
Outstanding Balance
|
Total
Commitment |
Outstanding Balance
|
Total
Commitment |
|||||||||||||
|
Wells Fargo Facility
|
$
|
274,071
|
|
$
|
500,000
|
|
$
|
407,853
|
|
$
|
500,000
|
|
||||
|
Citibank Facility
|
184,003
|
|
325,000
|
|
(1)
|
175,651
|
|
250,000
|
|
(1)
|
||||||
|
BAML Facility
|
36,280
|
|
125,000
|
|
78,320
|
|
125,000
|
|
||||||||
|
CNB Facility
|
—
|
|
50,000
|
|
—
|
|
50,000
|
|
||||||||
|
MetLife Facility
|
135,145
|
|
180,000
|
|
101,131
|
|
180,000
|
|
||||||||
|
UBS Facility
|
—
|
|
—
|
|
(2)
|
34,000
|
|
140,000
|
|
|||||||
|
U.S. Bank Facility
|
148,475
|
|
185,989
|
|
161,005
|
|
185,989
|
|
||||||||
|
Secured Term Loan
|
110,000
|
|
110,000
|
|
110,000
|
|
110,000
|
|
||||||||
|
Total
|
$
|
887,974
|
|
$
|
1,475,989
|
|
$
|
1,067,960
|
|
$
|
1,540,989
|
|
||||
______________________________________________________________________________
|
(1)
|
As of December 31, 2017, the Citibank Facility (as defined below) had an accordion feature that provided for an increase in the
$250.0 million
commitment amount with respect to approved assets, as determined by Citibank, N.A. in its sole discretion. In December 2018, the Company amended the Citibank Facility to, among other things, increase the facility’s commitment amount from
$250.0 million
to
$325.0 million
and remove the accordion feature.
|
|
(2)
|
In October 2018, the UBS Facility (as defined below) matured. The UBS Facility had been repaid in full and its term was not extended.
|
Some of the Company’s Financing Agreements are collateralized by (i) assignments of specific loans, preferred equity or a pool of loans held for investment or loans held for sale owned by the Company, (ii) interests in the subordinated portion of the Company’s securitization debt, or (iii) interests in wholly-owned entity subsidiaries that hold the Company’s loans held for investment. The Company is the borrower or guarantor under each of the Financing Agreements. Generally, the Company partially offsets interest rate risk by matching the interest index of loans held for investment with the Secured Funding Agreements used to fund them. The Company’s Financing Agreements contain various affirmative and negative covenants, including negative pledges, and provisions regarding events of default that are normal and customary for similar financing arrangements.
Wells Fargo Facility
The Company is party to a master repurchase funding facility with Wells Fargo Bank, National Association (“Wells Fargo”) (the “Wells Fargo Facility”), which allows the Company to borrow up to
$500.0 million
. Under the Wells Fargo
F-17
Facility, the Company is permitted to sell, and later repurchase, certain qualifying senior commercial mortgage loans, A-Notes, pari-passu participations in commercial mortgage loans and mezzanine loans under certain circumstances, subject to available collateral approved by Wells Fargo in its sole discretion. In December 2018, the Company amended the Wells Fargo Facility to extend the initial maturity date to December 14, 2020. The initial maturity date of the Wells Fargo Facility is subject to
three
12
-month extensions, each of which may be exercised at the Company’s option, subject to the satisfaction of certain conditions, including payment of an extension fee, which, if all three were exercised, would extend the maturity date of the Wells Fargo Facility to December 14, 2023. In addition, in December 2018, the Company amended the Wells Fargo Facility to decrease the interest rate on advances from a per annum rate equal to the sum of one-month LIBOR plus a pricing margin range of
1.75%
to
2.35%
to a per annum rate equal to the sum of one-month LIBOR plus a pricing margin range of
1.50%
to
2.25%
. The Company incurs a non-utilization fee of
25
basis points per annum on the average daily available balance of the Wells Fargo Facility to the extent less than
75%
of the Wells Fargo Facility is utilized. For the
years ended December 31, 2018, 2017 and 2016
, the Company incurred a non-utilization fee of
$149 thousand
,
$362 thousand
and
$340 thousand
, respectively. The non-utilization fee is included within interest expense in the Company’s consolidated statements of operations.
The Wells Fargo Facility contains various affirmative and negative covenants and provisions regarding events of default that are applicable to the Company and certain of the Company’s subsidiaries, which are normal and customary for similar repurchase facilities, including the following: (a) limitations on the incurrence of additional indebtedness or liens, (b) limitations on how borrowed funds may be used, (c) limitations on certain distributions and dividend payments in excess of the minimum amount necessary to continue to qualify as a REIT and avoid the payment of income and excise taxes, (d) maintenance of adequate capital, (e) limitations on change of control, (f) maintaining a ratio of total debt to tangible net worth of not more than
4.00
to
1.00
, (g) maintaining a ratio of recourse debt to tangible net worth of not more than
3.00
to
1.00
, (h) maintaining a fixed charge coverage ratio (expressed as the ratio of EBITDA (net income before net interest expense, income tax expense, depreciation and amortization), as defined, to fixed charges) for the immediately preceding
12
-month period ending on the last date of the applicable reporting period to be at least
1.25
to
1.00
, (i) maintaining a tangible net worth of at least the sum of (1) approximately
$135.5 million
, plus (2)
80%
of the net proceeds raised in all future equity issuances by the Company and (j) if certain specific debt yield, loan to value or other credit based tests are not met with respect to assets on the Wells Fargo Facility, the Company may be required to repay certain amounts under the Wells Fargo Facility. As of
December 31, 2018
, the Company was in compliance with all financial covenants of the Wells Fargo Facility.
Citibank Facility
The Company is party to a
$325.0 million
master repurchase facility with Citibank, N.A. (“Citibank”) (the “Citibank Facility”). Under the Citibank Facility, the Company is permitted to sell and later repurchase certain qualifying senior commercial mortgage loans and A-Notes approved by Citibank in its sole discretion. In December 2018, the Company amended the Citibank Facility to increase the facility’s commitment amount from
$250.0 million
to
$325.0 million
and extend the initial maturity date to December 13, 2021. The initial maturity date of the Citibank Facility is subject to
two
12
-month extensions, each of which may be exercised at the Company’s option assuming no existing defaults under the Citibank Facility and applicable extension fees being paid, which, if both were exercised, would extend the maturity date of the Citibank Facility to December 13, 2023. In addition, in December 2018, the Company amended the Citibank Facility to decrease the interest rate on advances from a per annum rate equal to the sum of one-month LIBOR plus an indicative pricing margin range of
2.25%
to
2.50%
, subject to certain exceptions, to a per annum rate equal to the sum of one-month LIBOR plus an indicative pricing margin range of
1.50%
to
2.25%
, subject to certain exceptions. Subsequent to the December 2018 amendment to the Citibank Facility, the Company incurs a non-utilization fee of 25 basis points per annum on the average daily available balance of the Citibank Facility to the extent less than 75% of the Citibank Facility is utilized. Prior to December 2018, the Company incurred a non-utilization fee of 25 basis points per annum on the average daily available balance of the Citibank Facility. For the
years ended December 31, 2018, 2017 and 2016
, the Company incurred a non-utilization fee of
$143 thousand
,
$165 thousand
and
$93 thousand
, respectively. The non-utilization fee is included within interest expense in the Company’s consolidated statements of operations.
The Citibank Facility contains various affirmative and negative covenants and provisions regarding events of default that are applicable to the Company and certain of the Company’s subsidiaries, which are normal and customary for similar repurchase facilities, including the following: (a) maintaining tangible net worth of at least the sum of (1)
80%
of the Company’s tangible net worth as of September 30, 2013, plus (2)
80%
of the total net capital raised in all future equity issuances by the Company, (b) maintaining liquidity in an amount not less than the greater of (1)
$5.0 million
or (2)
5%
of the Company’s recourse indebtedness, not to exceed
$10.0 million
(provided that in the event the Company’s total liquidity equals or exceeds
$5.0 million
, the Company may satisfy the difference between the minimum total liquidity requirement and the Company’s total liquidity with available borrowing capacity), (c) maintaining a fixed charge coverage ratio (expressed as the ratio of EBITDA (net income before net interest expense, income tax expense, depreciation and amortization), as defined, to fixed charges) for the immediately preceding
12
-month period ending on the last date of the applicable reporting period to be at
F-18
least
1.25
to
1.00
, (d) maintaining a ratio of total debt to tangible net worth of not more than
4.00
to
1.00
, (e) maintaining a ratio of recourse debt to tangible net worth of not more than
3.00
to
1.00
and (f) if certain specific debt yield and loan to value tests are not met with respect to assets on the Citibank Facility, the Company may be required to repay certain amounts under the Citibank Facility. The Citibank Facility also prohibits the Company from amending the management agreement with its Manager in a material respect without the prior consent of the lender. As of
December 31, 2018
, the Company was in compliance with all financial covenants of the Citibank Facility.
BAML Facility
The Company is party to a
$125.0 million
Bridge Loan Warehousing Credit and Security Agreement with Bank of America, N.A. (“Bank of America”) (the “BAML Facility”). Under the BAML Facility, the Company may obtain advances secured by eligible commercial mortgage loans collateralized by multifamily properties. Bank of America may approve the loans on which advances are made under the BAML Facility in its sole discretion. In May 2018, the Company amended the BAML Facility to extend the period during which the Company may request individual loans under the facility to May 23, 2019. Individual advances under the BAML Facility generally have a
two
-year maturity, subject to
one
12
-month extension at the Company’s option upon the satisfaction of certain conditions and applicable extension fees being paid. In addition, in May 2018, the final maturity date of individual loans under the BAML Facility was extended to May 23, 2022. Since October 2, 2017, advances under the BAML Facility accrue interest at a per annum rate equal to the sum of one-month LIBOR plus a spread of
2.00%
, subject to certain exceptions. Prior to and including October 1, 2017, advances under the BAML Facility accrued interest at a per annum rate equal to the sum of one-month LIBOR plus a spread ranging from
2.25%
to
2.75%
depending upon the type of asset securing such advance. The Company incurs a non-utilization fee of
12.5
basis points per annum on the average daily available balance of the BAML Facility to the extent less than
50%
of the BAML Facility is utilized. For the
years ended December 31, 2018, 2017 and 2016
, the Company incurred a non-utilization fee of
$21 thousand
,
$52 thousand
and
$52 thousand
, respectively. The non-utilization fee is included within interest expense in the Company’s consolidated statements of operations.
The BAML Facility contains various affirmative and negative covenants and provisions regarding events of default that are applicable to the Company and certain of the Company’s subsidiaries, which are normal and customary for similar financing facilities, including the following: (a) limitations on the incurrence of additional indebtedness or liens, (b) limitations on how borrowed funds may be used, (c) limitations on certain distributions and dividend payments following a default or event of default, (d) limitations on dispositions of assets and (e) prohibitions of certain change of control events. The agreements governing the BAML Facility also impose certain covenants on the Company, including the following: (i) maintaining a ratio of total debt to tangible net worth of not more than
4.00
to
1.00
, (ii) maintaining a ratio of recourse debt to tangible net worth of not more than
3.00
to
1.00
, (iii) maintaining a tangible net worth of at least
80%
of the Company’s net worth as of September 30, 2013, plus
80%
of the net cash proceeds raised in equity issuances by the Company after September 30, 2013, (iv) maintaining a fixed charge coverage ratio (expressed as the ratio of EBITDA (net income before net interest expense, income tax expense, depreciation and amortization), as defined, to fixed charges) for the immediately preceding
12
-month period ending on the last date of the applicable reporting period of at least
1.25
to
1.00
, (v) limitations on mergers, consolidations, transfers of assets and similar transactions and (vi) maintaining its status as a REIT. As of
December 31, 2018
, the Company was in compliance with all financial covenants of the BAML Facility.
CNB Facility
The Company is party to a
$50.0 million
secured revolving funding facility with City National Bank (the “CNB Facility”). The Company is permitted to borrow funds under the CNB Facility to finance investments and for other working capital and general corporate needs. In February 2018, the Company exercised a 12-month extension option on the CNB Facility to extend the initial maturity date to March 10, 2019. The Company has
one
additional
12
-month extension, which may be exercised at the Company’s option, subject to the satisfaction of certain conditions, including payment of an extension fee, which, if exercised, would extend the maturity date of the CNB Facility to March 10, 2020. Advances under the CNB Facility accrue interest at a per annum rate equal to the sum of, at the Company’s option, either (a) LIBOR for a one, two, three, six or, if available to all lenders,
12
-month interest period plus
3.00%
or (b) a
base rate
(which is the highest of a prime rate, the
federal funds rate
plus
0.50%
, or the sum of
one-month LIBOR
plus
1.00%
) plus
1.25%
; provided that in no event shall the interest rate be less than
3.00%
. Unless at least
75%
of the CNB Facility is used on average, unused commitments under the CNB Facility accrue non-utilization fees at the rate of
0.375%
per annum. For the
years ended December 31, 2018, 2017 and 2016
, the Company incurred a non-utilization fee of
$166 thousand
,
$184 thousand
and
$122 thousand
, respectively. The non-utilization fee is included within interest expense in the Company’s consolidated statements of operations.
The CNB Facility contains various affirmative and negative covenants and provisions regarding events of default that are applicable to the Company and certain of the Company’s subsidiaries, which are normal and customary for similar
F-19
financing facilities, including the following: (a) limitations on the incurrence of additional indebtedness or liens, (b) limitations on how borrowed funds may be used, (c) limitations on certain distributions and dividend payments following a default or event of default, (d) limitations on dispositions of assets, (e) maintenance of minimum total asset value by the borrower under the CNB Facility and its subsidiaries and (f) prohibitions of certain change of control events. The agreements governing the CNB Facility also impose certain covenants on the Company, including the following: (i) maintaining a ratio of total debt to tangible net worth of not more than
4.00
to
1.00
, (ii) maintaining a ratio of recourse debt to tangible net worth of not more than
3.00
to
1.00
, (iii) maintaining a tangible net worth of at least
80%
of the Company’s net worth as of September 30, 2013, plus
80%
of the net cash proceeds raised in equity issuances by the Company after March 12, 2014, (iv) maintaining a fixed charge coverage ratio (expressed as the ratio of EBITDA (net income before net interest expense, income tax expense, depreciation and amortization), as defined, to fixed charges) for the immediately preceding
12
-month period ending on the last date of the applicable reporting period of at least
1.25
to
1.00
, (v) limitations on mergers, consolidations, transfers of assets and similar transactions and (vi) maintaining its status as a REIT. As of
December 31, 2018
, the Company was in compliance with all financial covenants of the CNB Facility.
MetLife Facility
The Company and certain of its subsidiaries are party to a
$180.0 million
revolving master repurchase facility with Metropolitan Life Insurance Company (“MetLife”) (the “MetLife Facility”), pursuant to which the Company may sell, and later repurchase, commercial mortgage loans meeting defined eligibility criteria which are approved by MetLife in its sole discretion. The initial maturity date of the MetLife Facility is August 12, 2020, subject to
two
12
-month extensions, each of which may be exercised at the Company’s option, subject to the satisfaction of certain conditions, including payment of an extension fee, which, if both were exercised, would extend the maturity date of the MetLife Facility to August 12, 2022. Since August 4, 2017, advances under the MetLife Facility accrue interest at a per annum rate equal to the sum of
one-month LIBOR
plus a spread of
2.30%
. Prior to and including August 3, 2017, advances under the MetLife Facility accrued interest at a per annum rate equal to the sum of one-month LIBOR plus a spread of
2.35%
. Effective in February 2018, the Company began incurring a non-utilization fee of
25
basis points per annum on the average daily available balance of the MetLife Facility to the extent less than
65%
of the MetLife Facility is utilized. For the
year ended December 31, 2018
, the Company incurred a non-utilization fee of
$7 thousand
. The non-utilization fee is included within interest expense in the Company’s consolidated statements of operations.
The MetLife Facility contains various affirmative and negative covenants and provisions regarding events of default that are applicable to the Company and certain of the Company’s subsidiaries, which are normal and customary for similar repurchase facilities, including the following: (a) limitations on the incurrence of additional indebtedness or liens, (b) limitations on how borrowed funds may be used, (c) limitations on certain distributions and dividend payments following a default or event of default and (d) limitations on dispositions of assets. The agreements governing the MetLife Facility also impose certain covenants on the Company, including the following: (i) maintaining a ratio of total debt to tangible net worth of not more than
4.00
to
1.00
, (ii) maintaining a ratio of recourse debt to tangible net worth of not more than
3.00
to
1.00
, (iii) maintaining a tangible net worth of at least
80%
of the Company’s net worth as of September 30, 2013, plus
80%
of the net cash proceeds raised in equity issuances by the Company after August 13, 2014, (iv) maintaining a fixed charge coverage ratio (expressed as the ratio of EBITDA (net income before net interest expense, income tax expense, depreciation and amortization), as defined, to fixed charges) for the immediately preceding
12
-month period ending on the last date of the applicable reporting period of at least
1.25
to
1.00
, and (v) if certain specific debt yield, loan to value or other credit based tests are not met with respect to assets on the MetLife Facility, the Company may be required to repay certain amounts under the MetLife Facility. As of
December 31, 2018
, the Company was in compliance with all financial covenants of the MetLife Facility.
UBS Facility
The Company and certain of its subsidiaries were party to a
$140.0 million
revolving master repurchase facility with UBS Real Estate Securities Inc. (“UBS”) (the “UBS Facility”), pursuant to which the Company could have sold, and later repurchased, commercial mortgage loans and, under certain circumstances, other assets meeting defined eligibility criteria that were approved by UBS in its sole discretion. In October 2018, the UBS Facility matured. The UBS Facility had been repaid in full and its term was not extended. The interest rate on advances under the UBS Facility was the sum of
one-month LIBOR
plus (a)
1.88%
per annum, for assets that were subject to an advance for one year or less, (b)
2.08%
per annum, for assets that were subject to an advance in excess of one year but less than two years and (c)
2.28%
per annum, for assets that were subject to an advance for greater than two years.
The UBS Facility contained margin call provisions that provided UBS with certain rights if the applicable percentage of the aggregate asset value of the purchased assets under the UBS Facility was less than the aggregate purchase price for such assets. The UBS Facility was fully guaranteed by the Company and required the Company to maintain certain financial and
F-20
other covenants including the following: (a) maintain a ratio of (i) total debt to tangible net worth of not more than
4.00
to
1.00
and (ii) recourse debt to tangible net worth of not more than
3.00
to
1.00
, (b) maintain a tangible net worth of at least
80%
of the Company’s net worth as of September 30, 2013, plus
80%
of net cash proceeds received from all subsequent equity issuances by the Company and (c) maintain a fixed charge coverage ratio (expressed as the ratio of adjusted-EBITDA (net income before net interest expense, income tax expense, depreciation and amortization) to fixed charges) for the immediately preceding
12
-month period ending on the last day of the applicable reporting period of at least
1.25
to
1.00
. In addition, the UBS Facility contained certain affirmative and negative covenants and provisions regarding events of default that were normal and customary for similar repurchase facilities.
U.S. Bank Facility
The Company and certain of its subsidiaries are party to a
$186.0 million
master repurchase and securities contract with U.S. Bank National Association (“U.S. Bank”) (the “U.S. Bank Facility”). Pursuant to the U.S. Bank Facility, the Company is permitted to sell, and later repurchase, eligible commercial mortgage loans collateralized by retail, office, mixed-use, multifamily, industrial, hospitality, student housing, manufactured housing or self storage properties. U.S. Bank may approve the mortgage loans that are subject to the U.S. Bank Facility in its sole discretion. The initial maturity date of the U.S. Bank Facility is July 31, 2020, subject to
two
12
-month extensions, each of which may be exercised at the Company’s option, subject to the satisfaction of certain conditions, including payment of an extension fee, which, if both were exercised, would extend the maturity date of the U.S. Bank Facility to July 31, 2022. Advances under the U.S. Bank Facility generally accrue interest at a per annum rate equal to the sum of
one-month LIBOR
plus a spread of
2.25%
, unless otherwise agreed between U.S. Bank and the Company, depending upon the mortgage loan sold to U.S. Bank in the applicable transaction. The Company incurs a non-utilization fee of
25
basis points per annum on the average daily available balance of the U.S. Bank Facility to the extent less than
50%
of the U.S. Bank Facility is utilized. For the year ended
December 31, 2018
, the Company did not incur a non-utilization fee. For the years ended December 31, 2017 and 2016, the Company incurred a non-utilization fee of
$83 thousand
and
$77 thousand
, respectively. The non-utilization fee is included within interest expense in the Company’s consolidated statements of operations.
The U.S. Bank Facility contains various affirmative and negative covenants and provisions regarding events of default that are applicable to the Company and certain of the Company’s subsidiaries, which are normal and customary for similar repurchase facilities, including the following: (a) limitations on the incurrence of additional indebtedness or liens, (b) limitations on how borrowed funds may be used, (c) limitations on certain distributions and dividend payments in excess of the minimum amount necessary to continue to qualify as a REIT and avoid the payment of income and excise taxes, (d) maintenance of adequate capital, (e) limitations on change of control, (f) maintaining a ratio of total debt to tangible net worth of not more than
4.00
to
1.00
, (g) maintaining a ratio of recourse debt to tangible net worth of not more than
3.00
to
1.00
, (h) maintaining a fixed charge coverage ratio (expressed as the ratio of EBITDA (net income before net interest expense, income tax expense, depreciation and amortization), as defined, to fixed charges) for the immediately preceding
12
-month period ending on the last date of the applicable reporting period to be at least
1.25
to
1.00
, (i) maintaining a tangible net worth of at least
80%
of the Company’s net worth as of September 30, 2013, plus
80%
of the net cash proceeds raised in equity issuances by the Company after September 30, 2013, (j) if certain specific debt yield, loan to value or other credit based tests are not met with respect to assets on the U.S. Bank Facility, the Company may be required to repay certain amounts under the U.S. Bank Facility and (k) maintaining liquidity in an amount not less than the greater of (1)
$5.0 million
or (2)
5%
of the Company’s recourse indebtedness, not to exceed
$10.0 million
(provided that in the event the Company’s total liquidity equals or exceeds
$5.0 million
, the Company may satisfy the difference between the minimum total liquidity requirement and the Company’s total liquidity with available borrowing capacity). As of
December 31, 2018
, the Company was in compliance with all financial covenants of the U.S. Bank Facility.
Secured Term Loan
The Company and certain of its subsidiaries are party to a
$110.0 million
Credit and Guaranty Agreement with the lenders referred to therein and Cortland Capital Market Services LLC, as administrative agent and collateral agent for the lenders (the “Secured Term Loan”). The initial maturity date of the Secured Term Loan is December 22, 2020, subject to
one
12
-month extension, which may be exercised at the Company’s option, provided there are no existing events of default under the Secured Term Loan, which, if exercised, would extend the maturity date of the Secured Term Loan to December 22, 2021. During the extension period, the spread on advances under the Secured Term Loan increases every three months by
0.125%
,
0.375%
and
0.750%
per annum, respectively, beginning after the third-month of the extension period. Since December 22, 2017, advances under the Secured Term Loan accrue interest at a per annum rate equal to the sum of, at the Company’s option, one, two, three or six-month LIBOR plus a spread of
5.00%
. Prior to and including December 21, 2017, advances under the Secured Term Loan accrued interest at a per annum rate equal to the sum of one-month LIBOR plus a spread of
6.00%
(with a
1.00%
LIBOR floor). In December 2017, the Company voluntarily elected to repay
$45.0 million
of outstanding principal on
F-21
the Secured Term Loan prior to the scheduled maturity as permitted by the contractual terms of the Secured Term Loan. For the year ended December 31, 2017, the Company incurred early extinguishment of debt costs of
$768 thousand
in connection with the
$45.0 million
repayment of outstanding principal on the Secured Term Loan, which was comprised of the pro-rata share of the unamortized deferred debt issuance costs and original issue discounts being allocated to the outstanding principal that was repaid. The costs are included within early extinguishment of debt costs in the Company’s consolidated statements of operations.
The Company made an initial draw of
$75.0 million
on December 9, 2015, the closing date. The Company drew the remaining
$80.0 million
of the Secured Term Loan on September 9, 2016. The Company was subject to a monthly non-utilization fee equal to
1.0%
per annum on the unused commitment amount during the nine-month commitment period following the closing date for which the
$80.0 million
of the Secured Term Loan was not utilized. For the years ended December 31, 2018 and 2017, the Company did not incur a non-utilization fee. For the year ended December 31, 2016, the Company incurred a non-utilization fee of
$560 thousand
. The non-utilization fee is included within interest expense in the Company’s consolidated statements of operations. The total original issue discount on the Secured Term Loan draws was
$2.6 million
, which represents a discount to the debt cost to be amortized into interest expense using the effective interest method over the term of the Secured Term Loan. For the year ended
December 31, 2018
, the estimated per annum effective interest rate of the Secured Term Loan, which is equal to LIBOR plus the spread plus the accretion of the original issue discount and associated costs, was
7.6%
. For the year ended December 31, 2017, the estimated per annum effective interest rate of the Secured Term Loan was
8.7%
prior to and including December 21, 2017 and
7.2%
subsequent to December 21, 2017. For the year ended December 31, 2016, the estimated per annum effective interest rate was
8.5%
.
The Company's obligations under the Secured Term Loan are guaranteed by certain subsidiaries of the Company. Certain subsidiaries of the Company entered into a Pledge and Security Agreement with the collateral agent under the Secured Term Loan, pursuant to which the obligations of the Company and the subsidiary guarantors under the Secured Term Loan are each secured by equity interests in certain of the Company's indirect subsidiaries and other assets. In addition, the Company and certain of its subsidiaries entered into a Negative Pledge Agreement with the collateral agent under the Secured Term Loan, which prohibits pledging or otherwise encumbering, subject to permitted encumbrances, certain of the assets which were not subject to the Pledge and Security Agreement.
The Secured Term Loan contains various affirmative and negative covenants and provisions regarding events of default that are applicable to the Company and certain of the Company’s subsidiaries, which are normal and customary for similar financing agreements, including the following: (a) limitations on the incurrence of additional indebtedness or liens, (b) limitations on how borrowed funds may be used, (c) limitations on certain distributions and dividend payments following a default or event of default, (d) limitations on dispositions of assets and (e) prohibitions of certain change of control events. The agreements governing the Secured Term Loan also impose certain covenants on the Company, including the following: (i) maintaining a ratio of total debt to tangible net worth of not more than
4.00
to
1.00
, (ii) maintaining a tangible net worth of at least
80%
of the Company’s net worth as of September 30, 2015, plus
80%
of the net cash proceeds raised in subsequent equity issuances by the Company, (iii) maintaining an asset coverage ratio greater than
110%
, (iv) maintaining an unencumbered asset ratio greater than
120%
, (v) limitations on mergers, consolidations, transfers of assets and similar transactions, (vi) maintaining its status as a REIT and (vii) maintaining at least
65%
of loans held for investment as senior commercial real estate loans, as measured by the average daily outstanding principal balance of all loans held for investment during a fiscal quarter and as adjusted for non-controlling interests. As of
December 31, 2018
, the Company was in compliance with all financial covenants of the Secured Term Loan.
F-22
Financing Agreements Maturities
At December 31,
2018
, approximate principal maturities of the Company’s Financing Agreements are as follows ($ in thousands):
|
|
Wells Fargo
Facility |
Citibank
Facility |
BAML Facility
|
CNB
Facility
|
MetLife Facility
|
U.S. Bank Facility
|
Secured Term Loan
|
Total
|
|||||||||||||||||||||||
|
2019
|
$
|
—
|
|
$
|
—
|
|
$
|
36,280
|
|
$
|
—
|
|
$
|
—
|
|
$
|
—
|
|
$
|
—
|
|
$
|
36,280
|
|
|||||||
|
2020
|
274,071
|
|
—
|
|
—
|
|
—
|
|
135,145
|
|
148,475
|
|
110,000
|
|
667,691
|
|
|||||||||||||||
|
2021
|
—
|
|
184,003
|
|
—
|
|
—
|
|
—
|
|
—
|
|
—
|
|
184,003
|
|
|||||||||||||||
|
2022
|
—
|
|
—
|
|
—
|
|
—
|
|
—
|
|
—
|
|
—
|
|
—
|
|
|||||||||||||||
|
2023
|
—
|
|
—
|
|
—
|
|
—
|
|
—
|
|
—
|
|
—
|
|
—
|
|
|||||||||||||||
|
Thereafter
|
—
|
|
—
|
|
—
|
|
—
|
|
—
|
|
—
|
|
—
|
|
—
|
|
|||||||||||||||
|
|
$
|
274,071
|
|
$
|
184,003
|
|
$
|
36,280
|
|
$
|
—
|
|
$
|
135,145
|
|
$
|
148,475
|
|
$
|
110,000
|
|
$
|
887,974
|
|
|||||||
5. COMMITMENTS AND CONTINGENCIES
As of December 31, 2018 and 2017
, the Company had the following commitments to fund various senior mortgage loans, subordinated debt investments, as well as preferred equity investments accounted for as loans held for investment ($ in thousands):
|
|
As of December 31,
|
||||||
|
2018
|
2017
|
||||||
|
Total commitments
|
$
|
1,677,615
|
|
$
|
1,847,534
|
|
|
|
Less: funded commitments
|
(1,534,743
|
)
|
(1,737,286
|
)
|
|||
|
Total unfunded commitments
|
$
|
142,872
|
|
$
|
110,248
|
|
|
The Company from time to time may be party to litigation relating to claims arising in the normal course of business. As of
December 31, 2018
, the Company is not aware of any legal claims that could materially impact its business, financial condition or results of operations.
6. EQUITY
Stock Buyback Program
In May 2015, the Company announced that the Company’s board of directors authorized the Company to repurchase up to
$20.0 million
of the Company’s outstanding common stock over a period of
one
year (the “Stock Buyback Program”). In February 2016, the Company’s board of directors increased the size of the existing
$20.0 million
Stock Buyback Program to
$30.0 million
and extended the Stock Buyback Program through March 31, 2017. The Stock Buyback Program was not extended after March 31, 2017. Purchases made pursuant to the Stock Buyback Program could have been made in either the open market or in privately negotiated transactions, from time to time and as permitted by federal securities laws and other legal requirements. In connection with this Stock Buyback Program, in March 2016, the Company entered into a Rule 10b5-1 plan to repurchase shares of the Company’s common stock in accordance with certain parameters set forth in the Stock Buyback Program. During the years ended December 31, 2018 and 2017,
no
shares of the Company’s common stock were repurchased. During the year ended December 31, 2016, the Company repurchased a total of
129,916
shares of the Company’s common stock in the open market for an aggregate purchase price of approximately
$1.4 million
, including expenses paid. The shares were repurchased at an average price of $
11.06
per share, including expenses paid.
Common Stock
There were
no
shares issued in public or private offerings for the
years ended December 31, 2018, 2017 and 2016
. See “Equity Incentive Plan” below for shares issued under the plan.
F-23
Equity Incentive Plan
On April 23, 2012, the Company adopted an equity incentive plan. In April 2018, the Company’s board of directors authorized, and in June 2018, the Company’s stockholders approved, an amended and restated equity incentive plan that increased the total amount of shares of common stock the Company may grant thereunder to
1,390,000
shares (the “Amended and Restated 2012 Equity Incentive Plan”). Pursuant to the Amended and Restated 2012 Equity Incentive Plan, the Company may grant awards consisting of restricted shares of the Company’s common stock, restricted stock units and/or other equity-based awards to the Company’s outside directors, employees of the Manager, officers, ACREM and other eligible awardees under the plan. Any restricted shares of the Company’s common stock and restricted stock units will be accounted for under FASB ASC Topic 718,
Compensation—Stock Compensation
, resulting in stock-based compensation expense equal to the grant date fair value of the underlying restricted shares of common stock or restricted stock units.
Restricted stock grants generally vest ratably over a
one
to
four
year period from the vesting start date. The grantee receives additional compensation for each outstanding restricted stock grant, classified as dividends paid, equal to the per-share dividends received by common stockholders.
The following table details the restricted stock grants awarded as of
December 31, 2018
:
|
Grant Date
|
Vesting Start Date
|
Shares Granted
|
||
|
May 1, 2012
|
July 1, 2012
|
35,135
|
||
|
June 18, 2012
|
July 1, 2012
|
7,027
|
||
|
July 9, 2012
|
October 1, 2012
|
25,000
|
||
|
June 26, 2013
|
July 1, 2013
|
22,526
|
||
|
November 25, 2013
|
November 25, 2016
|
30,381
|
||
|
January 31, 2014
|
August 31, 2015
|
48,273
|
||
|
February 26, 2014
|
February 26, 2014
|
12,030
|
||
|
February 27, 2014
|
August 27, 2014
|
22,354
|
||
|
June 24, 2014
|
June 24, 2014
|
17,658
|
||
|
June 24, 2015
|
July 1, 2015
|
25,555
|
||
|
April 25, 2016
|
July 1, 2016
|
10,000
|
||
|
June 27, 2016
|
July 1, 2016
|
24,680
|
||
|
April 25, 2017
|
April 25, 2018
|
81,710
|
||
|
June 7, 2017
|
July 1, 2017
|
18,224
|
||
|
October 17, 2017
|
January 2, 2018
|
7,278
|
||
|
December 15, 2017
|
January 2, 2018
|
8,948
|
||
|
May 14, 2018
|
July 2, 2018
|
31,766
|
||
|
June 26, 2018
|
July 1, 2019
|
67,918
|
||
|
December 14, 2018
|
March 31, 2019
|
57,065
|
||
|
Total
|
553,528
|
|||
The following tables summarize the (i) non-vested shares of restricted stock and (ii) the vesting schedule of shares of restricted stock for the Company’s directors and officers and employees of the Manager as of
December 31, 2018
:
F-24
Schedule of Non-Vested Share and Share Equivalents
|
Restricted Stock Grants—Directors
|
Restricted Stock Grants—Officers and Employees of the Manager
|
Total
|
||||||
|
Balance at December 31, 2017
|
21,394
|
|
90,658
|
|
112,052
|
|
||
|
Granted
|
31,766
|
|
124,983
|
|
156,749
|
|
||
|
Vested
|
(30,606
|
)
|
(36,185
|
)
|
(66,791
|
)
|
||
|
Forfeited
|
—
|
|
—
|
|
—
|
|
||
|
Balance at December 31, 2018
|
22,554
|
|
179,456
|
|
202,010
|
|
||
Future Anticipated Vesting Schedule
|
Restricted Stock Grants—Directors
|
Restricted Stock Grants—Officers and Employees of the Manager
|
Total
|
||||||
|
2019
|
18,384
|
|
62,303
|
|
80,687
|
|
||
|
2020
|
3,336
|
|
65,313
|
|
68,649
|
|
||
|
2021
|
834
|
|
38,072
|
|
38,906
|
|
||
|
2022
|
—
|
|
13,768
|
|
13,768
|
|
||
|
2023
|
—
|
|
—
|
|
—
|
|
||
|
Total
|
22,554
|
|
179,456
|
|
202,010
|
|
||
The following table summarizes the restricted stock compensation expense included within general and administrative expenses for ACRE and compensation and benefits for ACRE Capital (which is included within net income from operations of discontinued operations, net of income taxes, in the Company’s consolidated statements of operations), the total fair value of shares vested and the weighted average grant date fair value of the restricted stock granted to the Company’s directors and officers, employees of the Manager and employees of ACRE Capital for the
years ended December 31, 2018, 2017 and 2016
($ in thousands):
|
|
For the years ended December 31,
|
||||||||||||||||||||||||||||||||||||||||||||||
|
|
2018
|
2017
|
2016
|
||||||||||||||||||||||||||||||||||||||||||||
|
Restricted Stock Grants
|
Restricted Stock Grants
|
Restricted Stock Grants
|
|||||||||||||||||||||||||||||||||||||||||||||
|
Directors
|
Officers and Employees of the Manager
|
Employees
|
Total
|
Directors
|
Officers and Employees of the Manager
|
Employees
|
Total
|
Directors
|
Officers and Employees of the Manager
|
Employees
|
Total
|
||||||||||||||||||||||||||||||||||||
|
Compensation expense (1)
|
$
|
427
|
|
$
|
675
|
|
$
|
—
|
|
$
|
1,102
|
|
$
|
317
|
|
$
|
264
|
|
$
|
—
|
|
$
|
581
|
|
$
|
355
|
|
$
|
53
|
|
$
|
(96
|
)
|
$
|
312
|
|
|||||||||||
|
Total fair value of shares vested (2)
|
405
|
|
449
|
|
—
|
|
854
|
|
347
|
|
—
|
|
—
|
|
347
|
|
342
|
|
54
|
|
383
|
|
779
|
|
|||||||||||||||||||||||
|
Weighted average grant date fair value
|
427
|
|
1,759
|
|
—
|
|
2,186
|
|
338
|
|
1,254
|
|
—
|
|
1,592
|
|
412
|
|
—
|
|
—
|
|
412
|
|
|||||||||||||||||||||||
______________________________________________________________________________
|
(1)
|
Compensation expense for ACRE Capital employees is included within compensation and benefits expense for the year ended December 31, 2016 in the reconciliation of net income from operations of discontinued operations, net of income taxes. See Note
13
included in these consolidated financial statements for more information.
|
|
(2)
|
Based on the closing price of the Company’s common stock on the NYSE on each vesting date.
|
As of December 31, 2018, 2017 and 2016
, the total compensation cost related to non-vested awards not yet recognized totaled
$2.3 million
,
$1.2 million
and
$180 thousand
, respectively, and the weighted average period over which the non-vested awards are expected to be recognized is
2.10
years,
1.95
years and
1.02
years, respectively.
F-25
Non-Controlling Interests
The non-controlling interests held by third parties in the Company's consolidated balance sheets represented the equity interests in a limited liability company, ACRC KA Investor LLC (“ACRC KA”) that were not owned by the Company. A portion of ACRC KA's consolidated equity and net income were allocated to these non-controlling interests held by third parties based on their pro-rata ownership of ACRC KA. As of December 31, 2017, the equity interests in ACRC KA held by the Company and third parties had been repaid in full and as such, there was no equity outstanding that was allocated to non-controlling interests held by third parties. As of December 31, 2016, ACRC KA’s total equity was
$21.7 million
, of which
$11.1 million
was owned by the Company and
$10.6 million
was allocated to non-controlling interests held by third parties. See Note
12
included in these consolidated financial statements for more information on ACRC KA.
7. EARNINGS PER SHARE
The following information sets forth the computations of basic and diluted earnings per common share from continuing operations and discontinued operations for the
years ended December 31, 2018, 2017 and 2016
($ in thousands, except share and per share data):
|
For the years ended December 31,
|
|||||||||||
|
2018
|
2017
|
2016
|
|||||||||
|
Net income from continuing operations, less non-controlling interests
|
$
|
38,596
|
|
$
|
30,407
|
|
$
|
25,919
|
|
||
|
Net income from discontinued operations, including gain on sale of discontinued operations
|
$
|
—
|
|
$
|
—
|
|
$
|
14,417
|
|
||
|
Divided by:
|
|
|
|||||||||
|
Basic weighted average shares of common stock outstanding:
|
28,529,439
|
|
28,478,237
|
|
28,461,853
|
|
|||||
|
Weighted average non-vested restricted stock
|
127,221
|
|
72,708
|
|
61,453
|
|
|||||
|
Diluted weighted average shares of common stock outstanding:
|
28,656,660
|
|
28,550,945
|
|
28,523,306
|
|
|||||
|
Basic earnings per common share:
|
|
|
|||||||||
|
Continuing operations
|
$
|
1.35
|
|
$
|
1.07
|
|
$
|
0.91
|
|
||
|
Discontinued operations
|
—
|
|
—
|
|
0.51
|
|
|||||
|
Net income
|
$
|
1.35
|
|
$
|
1.07
|
|
$
|
1.42
|
|
||
|
Diluted earnings per common share:
|
|
|
|||||||||
|
Continuing operations
|
$
|
1.35
|
|
$
|
1.07
|
|
$
|
0.91
|
|
||
|
Discontinued operations
|
—
|
|
—
|
|
0.51
|
|
|||||
|
Net income
|
$
|
1.35
|
|
$
|
1.07
|
|
$
|
1.41
|
|
||
8. INCOME TAX
The Company wholly-owns ACRC Lender W TRS LLC, which is a TRS formed in order to issue and hold certain loans intended for sale. The Company also wholly-owns ACRC 2017-FL3 TRS LLC, which is a TRS formed in order to hold a portion of the CLO Securitization (as defined below) to the extent it generates excess inclusion income.
The income tax provision for the Company and the TRSs consisted of the following for the
years ended December 31, 2018, 2017 and 2016
($ in thousands):
|
For the years ended December 31,
|
|||||||||||
|
|
2018
|
2017
|
2016
|
||||||||
|
Current
|
$
|
84
|
|
$
|
25
|
|
$
|
21
|
|
||
|
Deferred
|
—
|
|
—
|
|
—
|
|
|||||
|
Excise tax
|
362
|
|
153
|
|
209
|
|
|||||
|
Total income tax expense, including excise tax
|
$
|
446
|
|
$
|
178
|
|
$
|
230
|
|
||
F-26
For the
years ended December 31, 2018, 2017 and 2016
, the Company incurred an expense of $
362 thousand
,
$153 thousand
and
$209 thousand
, respectively, for U.S. federal excise tax. Excise tax represents a
4%
tax on the sum of a portion of the Company’s ordinary income and net capital gains not distributed during the calendar year (including any distribution declared in the fourth quarter and paid following January) plus any prior year shortfall. If it is determined that an excise tax liability exists for the current year, the Company will accrue excise tax on estimated excess taxable income as such taxable income is earned. The annual expense is calculated in accordance with applicable tax regulations.
The TRSs recognize interest and penalties related to unrecognized tax benefits within income tax expense in the Company’s consolidated statements of operations. Accrued interest and penalties, if any, are included within other liabilities in the Company’s consolidated balance sheets.
As of December 31, 2018
, tax years 2015 through 2018 remain subject to examination by taxing authorities. The Company does not have any unrecognized tax benefits and the Company does not expect that to change in the next 12 months.
9. FAIR VALUE OF FINANCIAL INSTRUMENTS
The Company follows FASB ASC Topic 820-10,
Fair Value Measurement
(“ASC 820-10”), which expands the application of fair value accounting. ASC 820-10 defines fair value, establishes a framework for measuring fair value in accordance with GAAP and expands disclosure requirements for fair value measurements. ASC 820-10 determines fair value to be the price that would be received for a financial instrument in a current sale, which assumes an orderly transaction between market participants on the measurement date. ASC 820-10 specifies a hierarchy of valuation techniques based on the inputs used in measuring fair value.
In accordance with ASC 820-10, the inputs used to measure fair value are summarized in the three broad levels listed below:
•
Level 1-Quoted prices in active markets for identical assets or liabilities.
|
•
|
Level 2-Prices are determined using other significant observable inputs. Observable inputs are inputs that other market participants would use in pricing a security. These may include quoted prices for similar securities, interest rates, prepayment speeds, credit risk and others.
|
|
•
|
Level 3-Prices are determined using significant unobservable inputs. In situations where quoted prices or observable inputs are unavailable (for example, when there is little or no market activity for an investment at the end of the period), unobservable inputs may be used.
|
GAAP requires disclosure of fair value information about financial instruments, whether or not recognized in the financial statements, for which it is practical to estimate the value. In cases where quoted market prices are not available, fair values are based upon the application of discount rates to estimated future cash flows using market yields, or other valuation methodologies. Any changes to the valuation methodology will be reviewed by the Company’s management to ensure the changes are appropriate. The methods used may produce a fair value calculation that is not indicative of net realizable value or reflective of future fair values. Furthermore, while the Company anticipates that the valuation methods are appropriate and consistent with other market participants, the use of different methodologies, or assumptions, to determine the fair value of certain financial instruments could result in a different estimate of fair value at the reporting date. The Company uses inputs that are current as of the measurement date, which may fall within periods of market dislocation, during which price transparency may be reduced.
As of December 31, 2018 and 2017
, the Company did not have any assets or liabilities required to be recorded at fair value on a recurring or nonrecurring basis.
As of December 31, 2018 and 2017
, the carrying values and fair values of the Company’s financial assets and liabilities recorded at cost are as follows ($ in thousands):
F-27
|
As of December 31,
|
|||||||||||||||||
|
2018
|
2017
|
||||||||||||||||
|
Level in Fair Value Hierarchy
|
Carrying Value
|
Fair
Value
|
Carrying Value
|
Fair
Value |
|||||||||||||
|
Financial assets:
|
|||||||||||||||||
|
Loans held for investment
|
3
|
$
|
1,524,873
|
|
$
|
1,534,743
|
|
$
|
1,726,283
|
|
$
|
1,737,286
|
|
||||
|
Financial liabilities:
|
|||||||||||||||||
|
Secured funding agreements
|
2
|
$
|
777,974
|
|
$
|
777,974
|
|
$
|
957,960
|
|
$
|
957,960
|
|
||||
|
Secured term loan
|
2
|
108,345
|
|
110,000
|
|
107,595
|
|
110,000
|
|
||||||||
|
Collateralized loan obligation securitization debt (consolidated VIE)
|
3
|
270,737
|
|
272,927
|
|
271,211
|
|
272,927
|
|
||||||||
The carrying values of cash and cash equivalents, restricted cash, interest receivable, due to affiliate liability and accrued expenses, which are all categorized as Level 2 within the fair value hierarchy, approximate their fair values due to their short-term nature.
Loans held for investment are recorded at cost, net of unamortized loan fees and origination costs and net of an allowance for loan losses. The Company may record fair value adjustments on a nonrecurring basis when it has determined that it is necessary to record a specific reserve against a loan and the Company measures such specific reserve using the fair value of the loan’s collateral. To determine the fair value of the collateral, the Company may employ different approaches depending on the type of collateral. The Financing Agreements and collateralized loan obligation (“CLO”) securitization debt are recorded at outstanding principal, which is the Company’s best estimate of the fair value.
10. RELATED PARTY TRANSACTIONS
Management Agreement
The Company is party to a Management Agreement under which ACREM, subject to the supervision and oversight of the Company’s board of directors, is responsible for, among other duties, (a) performing all of the Company’s day-to-day functions, (b) determining the Company’s investment strategy and guidelines in conjunction with the Company’s board of directors, (c) sourcing, analyzing and executing investments, asset sales and financing, and (d) performing portfolio management duties. In addition, ACREM has an Investment Committee that oversees compliance with the Company’s investment strategy and guidelines, investment portfolio holdings and financing strategy.
In exchange for its services, ACREM is entitled to receive a base management fee, an incentive fee, expense reimbursements, grants of equity-based awards pursuant to the Company’s Amended and Restated 2012 Equity Incentive Plan and a termination fee, if applicable.
The base management fee is equal to
1.5%
of the Company’s stockholders’ equity per annum, which is calculated and payable quarterly in arrears in cash. For purposes of calculating the base management fee, stockholders’ equity means: (a) the sum of (i) the net proceeds from all issuances of the Company’s equity securities since inception (allocated on a pro-rata daily basis for such issuances during the fiscal quarter of any such issuance), plus (ii) the Company’s retained earnings at the end of the most recently completed fiscal quarter determined in accordance with GAAP (without taking into account any non-cash equity compensation expense incurred in current or prior periods); less (b) (x) any amount that the Company has paid to repurchase the Company’s common stock since inception, (y) any unrealized gains and losses and other non-cash items that have impacted stockholders’ equity as reported in the Company’s consolidated financial statements prepared in accordance with GAAP, and (z) one-time events pursuant to changes in GAAP, and certain non-cash items not otherwise described above, in each case after discussions between ACREM and the Company’s independent directors and approval by a majority of the Company’s independent directors. As a result, the Company’s stockholders’ equity, for purposes of calculating the management fee, could be greater or less than the amount of stockholders’ equity shown in the Company’s consolidated financial statements.
The incentive fee is an amount, not less than
zero
, equal to the difference between: (a) the product of (i)
20%
and (ii) the difference between (A) the Company’s Core Earnings (as defined below) for the previous
12
-month period, and (B) the product of (1) the weighted average of the issue price per share of the Company’s common stock of all of the Company’s public offerings of common stock multiplied by the weighted average number of all shares of common stock outstanding including any restricted shares of the Company’s common stock, restricted stock units or any shares of the Company’s common stock not yet issued, but underlying other awards granted under the Company’s Amended and Restated 2012 Equity Incentive Plan (see Note
6
included in these consolidated financial statements) in the previous
12
-month period, and (2)
8%
; and (b) the sum of
F-28
any incentive fees earned by ACREM with respect to the first
three
fiscal quarters of such previous
12
-month period; provided, however, that
no
incentive fee is payable with respect to any fiscal quarter unless cumulative Core Earnings for the
12
most recently completed fiscal quarters is greater than
zero
. “Core Earnings” is a non-GAAP measure and is defined as GAAP net income (loss) computed in accordance with GAAP, excluding non-cash equity compensation expense, the incentive fee, depreciation and amortization (to the extent that any of the Company’s target investments are structured as debt and the Company forecloses on any properties underlying such debt), any unrealized gains, losses or other non-cash items recorded in net income (loss) for the period, regardless of whether such items are included in other comprehensive income or loss, or in net income (loss), and one-time events pursuant to changes in GAAP and certain non-cash charges after discussions between ACREM and the Company’s independent directors and after approval by a majority of the Company’s independent directors. For the
years ended December 31, 2018, 2017 and 2016
, $
1.2 million
,
$381 thousand
and
$348 thousand
of incentive fees were incurred, respectively.
The Company reimburses ACREM at cost for operating expenses that ACREM incurs on the Company’s behalf, including expenses relating to legal, financial, accounting, servicing, due diligence and other services.
The Company will not reimburse ACREM for the salaries and other compensation of its personnel, except for the allocable share of the salaries and other compensation of the Company’s (a) Chief Financial Officer, based on the percentage of his time spent on the Company’s affairs and (b) other corporate finance, tax, accounting, internal audit, legal, risk management, operations, compliance and other non-investment professional personnel of ACREM or its affiliates who spend all or a portion of their time managing the Company’s affairs based on the percentage of their time spent on the Company’s affairs. The Company is also required to pay its pro-rata portion of rent, telephone, utilities, office furniture, equipment, machinery and other office, internal and overhead expenses of ACREM and its affiliates that are required for the Company’s operations. The term of the Management Agreement ends on May 1,
2019
, with automatic
one
-year renewal terms thereafter. Except under limited circumstances, upon a termination of the Management Agreement, the Company will pay ACREM a termination fee equal to
three
times the average annual base management fee and incentive fee received by ACREM during the
24
-month period immediately preceding the most recently completed fiscal quarter prior to the date of termination, each as described above.
Certain of the Company’s subsidiaries, along with the Company’s lenders under certain of the Company’s Secured Funding Agreements, as well as under the CLO transaction have entered into various servicing agreements with ACREM’s subsidiary servicer, Ares Commercial Real Estate Servicer LLC (“ACRES”). The Company’s Manager will specially service, as needed, certain of the Company’s investments. Effective May 1, 2012, ACRES agreed that no servicing fees pursuant to these servicing agreements would be charged to the Company or its subsidiaries by ACRES or the Manager for so long as the Management Agreement remains in effect, but that ACRES will continue to receive reimbursement for overhead related to servicing and operational activities pursuant to the terms of the Management Agreement.
The following table summarizes the related party costs incurred by the Company related to continuing operations for the
years ended December 31, 2018, 2017 and 2016
and amounts payable to the Company’s Manager
as of December 31, 2018 and 2017
($ in thousands):
|
Incurred
|
Payable
|
||||||||||||||||||
|
For the years ended December 31,
|
As of December 31,
|
||||||||||||||||||
|
2018
|
2017
|
2016
|
2018
|
2017
|
|||||||||||||||
|
Affiliate Payments
|
|||||||||||||||||||
|
Management fees
|
$
|
6,268
|
|
$
|
6,188
|
|
$
|
5,608
|
|
$
|
1,576
|
|
$
|
1,549
|
|
||||
|
Incentive fees
|
1,150
|
|
381
|
|
348
|
|
540
|
|
—
|
|
|||||||||
|
General and administrative expenses
|
3,570
|
|
3,899
|
|
3,441
|
|
996
|
|
1,016
|
|
|||||||||
|
Direct costs
|
224
|
|
(1)
|
304
|
|
(1)
|
848
|
|
(2)
|
51
|
|
63
|
|
||||||
|
Total
|
$
|
11,212
|
|
$
|
10,772
|
|
$
|
10,245
|
|
$
|
3,163
|
|
$
|
2,628
|
|
||||
______________________________________________________________________________
|
(1)
|
For the
years ended December 31, 2018 and 2017
, direct costs incurred are included within general and administrative expenses in the Company’s consolidated statements of operations.
|
F-29
|
(2)
|
For the year ended
December 31, 2016
, direct costs incurred are included within (i) general and administrative expenses of
$486 thousand
and (ii) interest expense of
$362 thousand
in the Company’s consolidated statements of operations.
|
Investments in Loans
From time to time, the Company may co-invest with other investment vehicles managed by Ares Management or its affiliates, including the Manager, and their portfolio companies, including by means of splitting investments, participating in investments or other means of syndication of investments. For such co-investments, the Company expects to act as the administrative agent for the holders of such investments provided that the Company maintains a majority of the aggregate investment. No fees will be received by the Company for performing such service. The Company will be responsible for its pro-rata share of costs and expenses for such co-investments, including due diligence costs for transactions which fail to close. The Company’s investment in such co-investments are made on a pari-passu basis with the other Ares managed investment vehicles and the Company is not obligated to provide, nor has it provided, any financial support to the other Ares managed investment vehicles. As such, the Company’s risk is limited to the carrying value of its investment and the Company recognizes only the carrying value of its investment in its consolidated balance sheets.
In May 2018, the Company participated in originating a
$25.0 million
mezzanine loan commitment on a property with in-place development rights for the construction of a mixed-use property located in Illinois, with a participation interest of
$15.3 million
held by the Company and
$9.7 million
held by other Ares managed investment vehicles. As of
December 31, 2018
, the total outstanding principal balance on the participation interest held by the Company was
$974 thousand
.
In August 2018, the Company participated in originating a
$12.0 million
pre-construction mezzanine loan commitment on a property with in-place development rights for a residential condominium project located in Hawaii. The mezzanine loan was split into separate notes with an
$8.0 million
note held by the Company and
$4.0 million
of notes held by other Ares managed investment vehicles. As of
December 31, 2018
, the total outstanding principal balance on the note held by the Company was
$4.7 million
.
In October 2018, the Company participated in originating a
$22.0 million
pre-construction senior mortgage loan commitment on a property with in-place development rights for a residential condominium project located in Florida. The senior mortgage loan was split into separate notes with a
$17.5 million
note held by the Company and
$4.5 million
of notes held by other Ares managed investment vehicles. As of December 31, 2018, the total outstanding principal balance on the note held by the Company was
$17.5 million
.
In October 2018, the Company participated in originating a
$23.3 million
mezzanine loan commitment on a property with in-place development rights for a residential condominium conversion project located in New York. The mezzanine loan was split into separate notes with a
$14.0 million
note held by the Company and
$9.3 million
of notes held by other Ares managed investment vehicles. As of December 31, 2018, the total outstanding principal balance on the note held by the Company was
$10.8 million
.
Credit Support Fee Agreement
In July 2014, the Company and certain of its subsidiaries entered into a Credit Support Fee Agreement with Ares Management under which the Company agreed to pay Ares Management a credit support fee in an amount equal to
1.50%
per annum times the average amount of the loans outstanding under the
$75.0 million
revolving funding facility (the “July 2014 CNB Facility”) with City National Bank and to reimburse Ares Management for its out-of-pocket costs and expenses in connection with the transaction. For the year ended December 31, 2016, the Company incurred a credit support fee of
$362 thousand
under the July 2014 CNB Facility which is included within interest expense in the Company’s consolidated statements of operations. On September 30, 2016, the July 2014 CNB Facility was repaid in full and its terms were not extended. In conjunction with the repayment in full of the July 2014 CNB Facility, the Credit Support Fee Agreement was terminated.
F-30
11. DIVIDENDS AND DISTRIBUTIONS
The following table summarizes the Company’s dividends declared during the
years ended December 31, 2018, 2017 and 2016
($ in thousands, except per share data):
|
Date Declared
|
Record Date
|
Payment Date
|
Per Share Amount
|
Total Amount
|
||||||||
|
October 30, 2018
|
December 28, 2018
|
January 15, 2019
|
$
|
0.31
|
|
$
|
8,914
|
|
||||
|
July 26, 2018
|
September 28, 2018
|
October 16, 2018
|
0.29
|
|
8,323
|
|
||||||
|
May 1, 2018
|
June 29, 2018
|
July 17, 2018
|
0.28
|
|
8,036
|
|
||||||
|
March 1, 2018
|
March 29, 2018
|
April 17, 2018
|
0.28
|
|
8,008
|
|
||||||
|
Total cash dividends declared for the year ended December 31, 2018
|
$
|
1.16
|
|
$
|
33,281
|
|
||||||
|
November 1, 2017
|
December 29, 2017
|
January 16, 2018
|
$
|
0.27
|
|
$
|
7,722
|
|
||||
|
August 3, 2017
|
September 29, 2017
|
October 16, 2017
|
0.27
|
|
7,717
|
|
||||||
|
May 2, 2017
|
June 30, 2017
|
July 17, 2017
|
0.27
|
|
7,718
|
|
||||||
|
March 7, 2017
|
March 31, 2017
|
April 17, 2017
|
0.27
|
|
7,690
|
|
||||||
|
Total cash dividends declared for the year ended December 31, 2017
|
$
|
1.08
|
|
$
|
30,847
|
|
||||||
|
November 3, 2016
|
December 30, 2016
|
January 17, 2017
|
$
|
0.26
|
|
$
|
7,406
|
|
||||
|
August 4, 2016
|
September 30, 2016
|
October 17, 2016
|
0.26
|
|
7,406
|
|
||||||
|
May 5, 2016
|
June 30, 2016
|
July 15, 2016
|
0.26
|
|
7,413
|
|
||||||
|
March 1, 2016
|
March 31, 2016
|
April 15, 2016
|
0.26
|
|
7,429
|
|
||||||
|
Total cash dividends declared for the year ended December 31, 2016
|
$
|
1.04
|
|
$
|
29,654
|
|
||||||
12. VARIABLE INTEREST ENTITIES
Consolidated VIEs
As discussed in Note
2
, the Company evaluates all of its investments and other interests in entities for consolidation, including its investments in: (a) the CLO Securitization (as defined below) and (b) a preferred equity investment in a LLC entity (discussed below), all of which are generally considered to be variable interests in a VIE.
CLO Securitization
On March 2, 2017, ACRE Commercial Mortgage 2017-FL3 Ltd. (the “Issuer”) and ACRE Commercial Mortgage 2017-FL3 LLC (the “Co-Issuer”), both wholly-owned indirect subsidiaries of the Company, entered into an indenture (the “Indenture”) with Wells Fargo Bank, National Association, as advancing agent and note administrator, and Wilmington Trust, National Association as trustee, which governs the issuance of approximately
$308.8 million
principal balance secured floating rate notes (the “Notes”) and
$32.4 million
of preferred equity in the Issuer (the “CLO Securitization”).
As of
December 31, 2018
, the Notes were collateralized by interests in a pool of
eleven
mortgage assets having a total principal balance of approximately
$289.6 million
(the “Mortgage Assets”) that were originated by a wholly-owned subsidiary of the Company and approximately
$51.6 million
of receivables related to repayments of outstanding principal on previous mortgage assets. As of December 31, 2017, the Notes were collateralized by interests in a pool of
thirteen
mortgage assets having a total principal balance of approximately
$341.2 million
that were originated by a wholly-owned subsidiary of the Company. During the reinvestment period ending on March 15, 2019, the Company may direct the Issuer to acquire additional mortgage assets meeting applicable reinvestment criteria using the principal repayments from the Mortgage Assets, subject to the satisfaction of certain conditions, including receipt of a Rating Agency Confirmation and investor approval of the new mortgage assets.
The contribution of the Mortgage Assets to the Issuer is governed by a Mortgage Asset Purchase Agreement between ACRC Lender LLC (the “Seller”), a wholly-owned subsidiary of the Company, and the Issuer, and acknowledged by the
F-31
Company solely for purposes of confirming its status as a REIT, in which the Seller made certain customary representations, warranties and covenants.
In connection with the securitization, the Issuer and Co-Issuer offered and issued the following classes of Notes: Class A, Class A-S, Class B, Class C and Class D Notes (collectively, the “Offered Notes”) to a third party. A wholly-owned subsidiary of the Company retained approximately
$35.8 million
of the Notes and all of the
$32.4 million
of preferred equity in the Issuer, which totaled
$68.2 million
. The Company, as the holder of the subordinated Notes and all of the preferred equity in the Issuer, has the obligation to absorb losses of the CLO, since the Company has a first loss position in the capital structure of the CLO.
After March 15, 2021, the Issuer may redeem the Offered Notes subject to paying a make whole prepayment fee of
1.0%
of the then outstanding balance of the Offered Notes. In addition, once the Class A Notes, Class A-S Notes, Class B Notes and Class C Notes have been repaid in full, the Issuer has the right to redeem the Class D Notes, subject to paying a make whole prepayment fee of
1.0%
on the Class D Notes.
As the directing holder of the CLO Securitization, the Company has the ability to direct activities that could significantly impact the CLO Securitization’s economic performance. ACRES is designated as special servicer of the CLO Securitization and has the power to direct activities during the loan workout process on defaulted and delinquent loans, which is the activity that most significantly impacts the CLO Securitization’s economic performance. ACRES did not waive the special servicing fee, and the Company pays its overhead costs. If an unrelated third party had the right to unilaterally remove the special servicer, then the Company would not have the power to direct activities that most significantly impact the CLO Securitization’s economic performance. In addition, there were no substantive kick-out rights of any unrelated third party to remove the special servicer without cause. The Company’s subsidiaries, as directing holders, have the ability to remove the special servicer without cause. Based on these factors, the Company is determined to be the primary beneficiary of the CLO Securitization; thus, the CLO Securitization is consolidated into the Company’s consolidated financial statements.
The CLO Securitization is consolidated in accordance with FASB ASC Topic 810 and is structured as a pass through entity that receives principal and interest on the underlying collateral and distributes those payments to the note holders, as applicable. The assets and other instruments held by the CLO Securitization are restricted and can only be used to fulfill the obligations of the CLO Securitization. Additionally, the obligations of the CLO Securitization do not have any recourse to the general credit of any other consolidated entities, nor to the Company as the primary beneficiary.
The inclusion of the assets and liabilities of the CLO Securitization of which the Company is deemed the primary beneficiary has no economic effect on the Company. The Company’s exposure to the obligations of the CLO Securitization is generally limited to its investment in the entity. The Company is not obligated to provide, nor has it provided, any financial support for the consolidated structure. As such, the risk associated with the Company’s involvement in the CLO Securitization is limited to the carrying value of its investment in the entity.
As of December 31, 2018
, the Company’s maximum risk of loss was
$68.2 million
, which represents the carrying value of its investment in the CLO Securitization. For the
years ended December 31, 2018, 2017 and 2016
, the Company incurred interest expense related to the CLO Securitization of
$10.5 million
,
$6.8 million
and
$3.2 million
, respectively. Interest expense related to the CLO Securitization is included within interest expense in the Company’s consolidated statements of operations. See Note 15 included in these consolidated financial statements for a subsequent event related to the CLO Securitization.
Investment in VIE
On December 19, 2014, the Company and third party institutional investors formed a limited liability company, ACRC KA, which acquired
$170.0 million
of preferred equity in a REIT whose assets were comprised of a portfolio of
22
multifamily, student housing, medical office and self storage properties managed by its sponsor. The Company’s investment in ACRC KA was considered to be an investment in a VIE. As of December 31, 2016, the Company owned a controlling financial interest of
51.0%
of the equity shares in the VIE and the third party institutional investors owned the remaining
49.0%
minority financial interest. The preferred equity shares were entitled to a preferred monthly return over the term of the investment at a fixed rate of
10.95%
per annum. In January 2017, the Company’s investment in ACRC KA was repaid in full. Accordingly, as of December 31, 2017, the Company’s investment was no longer outstanding.
ACREM was the non-member manager of the VIE. Based on the terms of the ACRC KA LLC agreement, ACREM had the ability to direct activities that could significantly impact the VIE’s economic performance. There were no substantive kick-out rights held by the third party institutional investors to remove ACREM as the non-member manager without cause. As ACREM served as the manager of the Company, the Company had the right to receive benefits from the VIE that could potentially be significant. As such, the Company was deemed to be the primary beneficiary of the VIE and the party that was
F-32
most closely associated with the VIE. Thus, the VIE was consolidated into the Company’s consolidated financial statements and the preferred equity interests owned by the third party institutional investors were reflected as a non-controlling interest held by third parties in the Company’s consolidated balance sheets.
13. DISCONTINUED OPERATIONS
ACRE Capital primarily originated, sold and serviced multifamily and senior-living related loans under programs offered by government-sponsored enterprises, such as the Federal National Mortgage Association (“Fannie Mae”) and the Federal Home Loan Mortgage Corporation (“Freddie Mac”) and by government agencies, such as the Government National Mortgage Association (“Ginnie Mae”) and the Federal Housing Administration, a division of the U.S. Department of Housing and Urban Development (together with Ginnie Mae, “HUD”). ACRE Capital was approved as a Fannie Mae Delegated Underwriting and Servicing lender, a Freddie Mac Program Plus® Seller/Servicer, a Multifamily Accelerated Processing and Section 232 LEAN lender for HUD, and a Ginnie Mae issuer. While ACRE Capital earned little interest income from these activities because it generally only held loans for short periods, ACRE Capital received origination fees when it closed loans and sale premiums when it sold loans. ACRE Capital also retained the rights to service the loans, which were known as mortgage servicing rights (“MSRs”), and received fees for such servicing during the life of the loans, which generally lasted
10 years
or more.
On September 30, 2016, the Company closed the ACRE Capital Sale for a purchase price of approximately
$93 million
in accordance with the Agreement dated June 28, 2016.
Discontinued Operations - Financial Summary
The following information reconciles the net income from operations of discontinued operations, net of income taxes, that is presented separately in the consolidated statement of operations for the year ended December 31, 2016 ($ in thousands):
|
Mortgage banking revenue:
|
|||
|
Servicing fees, net
|
$
|
11,081
|
|
|
Gains from mortgage banking activities
|
24,034
|
|
|
|
Provision for loss sharing
|
146
|
|
|
|
Change in fair value of mortgage servicing rights
|
(6,457
|
)
|
|
|
Mortgage banking revenue
|
28,804
|
|
|
|
Expenses:
|
|||
|
Management fees to affiliate
|
446
|
|
|
|
Professional fees
|
718
|
|
|
|
Compensation and benefits
|
18,108
|
|
|
|
Transaction costs
|
797
|
|
|
|
General and administrative expenses
|
3,049
|
|
|
|
General and administrative expenses reimbursed to affiliate
|
622
|
|
|
|
Total expenses
|
23,740
|
|
|
|
Income from operations before income taxes
|
5,064
|
|
|
|
Income tax expense
|
843
|
|
|
|
Net income from operations of discontinued operations, net of income taxes
|
$
|
4,221
|
|
Revenue Recognition
Servicing fees
were earned for servicing mortgage loans, including all activities related to servicing the loans, and were recognized as services were provided over the life of the related mortgage loan. Also included in servicing fees were the net fees earned on borrower prepayment penalties and interest earned on borrowers’ escrow payments and interim cash balances, along with other ancillary fees and reduced by write-offs of MSRs for loans that were prepaid, changes in the fair value of the servicing fee payable (as defined below) and interest expense related to escrow accounts. ACRE Capital provided additional payments to certain personnel by providing them with a percentage of the servicing fee revenue that was earned by ACRE Capital, which was initially recorded as a liability when ACRE Capital committed to make a loan to a borrower (the
F-33
“servicing fee payable”). Servicing fees, net are included within net income from operations of discontinued operations, net of income taxes, in the Company’s consolidated statements of operations.
Gains from mortgage banking activities
included the initial fair value of MSRs, loan origination fees, gain on the sale of loans originated, interest income and fees earned on loans held for sale, changes to the fair value of derivative financial instruments attributable to the loan commitments and forward sale commitments and reduced by the expense related to the initial fair value of the servicing fee payable and the interest expense related to the Warehouse Lines of Credit (as defined below). The initial fair value of MSRs, loan origination fees, gain on the sale of loans originated, certain direct loan origination costs for loans held for sale and the expenses related to the initial fair value of the servicing fee payable were recognized when ACRE Capital committed to make a loan to a borrower. When ACRE Capital settled a sale agreement and transferred the mortgage loan to the buyer, ACRE Capital recognized a MSR asset equal to the present value of the expected net cash flows associated with the servicing of loans sold. Gains from mortgage banking activities are included within net income from operations of discontinued operations, net of income taxes, in the Company’s consolidated statements of operations.
Derivatives
Non-designated Hedges
Derivatives not designated as hedges were derivatives that did not meet the criteria for hedge accounting under GAAP or for which ACRE Capital had not elected to designate as hedges.
Loan commitments and forward sale commitments
ACRE Capital entered into loan commitments with borrowers on loan originations whereby the interest rate on the prospective loan was determined prior to funding. In general, ACRE Capital simultaneously entered into forward sale commitments with investors in order to hedge against the interest rate exposure on loan commitments. The forward sale commitment with the investor locked in an interest rate and price for the sale of the loan. The terms of the loan commitment with the borrower and the forward sale commitment with the investor were matched with the objective of hedging interest rate risk. Loan commitments and forward sale commitments were considered undesignated derivative instruments. Accordingly, such commitments, along with any related fees received from potential borrowers, were recorded at fair value, with changes in fair value recorded in earnings. For the year ended December 31, 2016, ACRE Capital entered into
49
loan commitments and
49
forward sale commitments.
Income Tax
The Company established a TRS, TRS Holdings, in connection with the acquisition of ACRE Capital. TRS Holdings’ income tax provision consisted of the following for the year ended December 31, 2016 ($ in thousands):
|
Current
|
$
|
(1,206
|
)
|
|
Deferred
|
2,049
|
|
|
|
Total income tax expense
|
$
|
843
|
|
Deferred income taxes reflected the net tax effects of temporary differences between the carrying amounts of the assets and liabilities for financial reporting purposes and the amounts used for income tax purposes. TRS Holdings was not subject to tax in any foreign tax jurisdiction.
TRS Holdings recognized interest and penalties related to unrecognized tax benefits within net income from operations of discontinued operations, net of income taxes, in the Company’s consolidated statements of operations.
The following table is a reconciliation of TRS Holdings’ statutory U.S. federal income tax rate to TRS Holdings’ effective tax rate for the year ended December 31, 2016:
F-34
|
Federal statutory rate
|
35.0
|
%
|
|
State income taxes
|
4.4
|
%
|
|
Federal benefit of state tax deduction
|
(1.5
|
)%
|
|
Effective tax rate
|
37.9
|
%
|
As of December 31, 2018
, tax years 2015 and 2016 remained subject to examination by taxing authorities. TRS Holdings did not have any unrecognized tax benefits.
Intercompany Notes
In connection with the acquisition of ACRE Capital, the Company partially capitalized TRS Holdings with a
$44.0 million
note. In October 2014, the Company entered into an
$8.0 million
revolving promissory note with TRS Holdings (collectively, the
two
intercompany notes described above are referred to as the “Intercompany Notes”). In connection with the ACRE Capital Sale, the Intercompany Notes were repaid in full with the proceeds from the sale on September 30, 2016. At the time of the closing of the ACRE Capital Sale, the outstanding principal balance of the Intercompany Notes was
$51.9 million
. The income statement effects of the Intercompany Notes were eliminated in consolidation for financial reporting purposes, but the interest income and expense from the Intercompany Notes affected the taxable income of the Company and TRS Holdings.
Related Party Transactions
The following table summarizes the related party costs incurred by the Company related to discontinued operations for the year ended December 31, 2016 ($ in thousands):
|
Affiliate Payments
|
|||
|
Management fees (1)
|
$
|
446
|
|
|
General and administrative expenses (1)
|
622
|
|
|
|
Direct costs (1)
|
68
|
|
|
|
Total
|
$
|
1,136
|
|
|
(1)
|
Management fees incurred are included within management fees to affiliate, general and administrative expenses incurred are included within general and administrative expenses reimbursed to affiliate and direct costs incurred are included within general and administrative expenses for the year ended December 31, 2016 in the reconciliation of net income from operations of discontinued operations, net of income taxes.
|
14. QUARTERLY FINANCIAL DATA (UNAUDITED)
The following table summarizes the Company’s quarterly financial results for each quarter for the
years ended December 31, 2018 and 2017
($ in thousands, except per share data):
|
For the three month period ended,
|
|||||||||||||||
|
March 31
|
June 30
|
September 30
|
December 31
|
||||||||||||
|
2018:
|
|||||||||||||||
|
Net interest margin
|
$
|
13,137
|
|
$
|
13,636
|
|
$
|
13,984
|
|
$
|
14,525
|
|
|||
|
Net income attributable to common stockholders
|
$
|
9,318
|
|
$
|
9,303
|
|
$
|
9,957
|
|
$
|
10,018
|
|
|||
|
Net income per common share-Basic and Diluted
|
$
|
0.33
|
|
$
|
0.33
|
|
$
|
0.35
|
|
$
|
0.35
|
|
|||
|
2017:
|
|||||||||||||||
|
Net interest margin
|
$
|
10,339
|
|
$
|
10,411
|
|
$
|
14,726
|
|
$
|
10,872
|
|
|||
|
Net income attributable to common stockholders
|
$
|
6,453
|
|
$
|
6,713
|
|
$
|
11,058
|
|
$
|
6,183
|
|
|||
|
Net income per common share-Basic and Diluted
|
$
|
0.23
|
|
$
|
0.24
|
|
$
|
0.39
|
|
$
|
0.22
|
|
|||
F-35
15. SUBSEQUENT EVENTS
The Company’s management has evaluated subsequent events through the date of issuance of the consolidated financial statements included herein. There have been no subsequent events that occurred during such period that would require disclosure in this Form 10-K or would be required to be recognized in the consolidated financial statements as of and for the
year ended December 31, 2018
, except as disclosed below.
On January 11, 2019, the Issuer and Co-Issuer entered into an Amended and Restated Indenture (the “Amended Indenture”) with Wells Fargo Bank, National Association, as advancing agent and note administrator, and Wilmington Trust, National Association, as trustee, which governs the approximately
$504.1 million
principal balance of secured floating rate notes issued by the Issuer and
$52.9 million
of preferred equity in the Issuer (the “2019 FL3 CLO Securitization”). The Amended Indenture amends and restates, and replaces in its entirety, the indenture for the CLO Securitization issued in March 2017, which governed the issuance of approximately
$308.8 million
principal balance of secured floating rate notes and
$32.4 million
of preferred equity in the Issuer. After giving effect to the 2019 FL3 CLO Securitization, the Company retained (through one of its wholly-owned subsidiaries) approximately
$58.5 million
of the non-investment grade notes and all of the
$52.9 million
of preferred equity in the Issuer, which notes and preferred equity were not offered to investors. The secured floating rate notes are collateralized by interests in a pool of 17 mortgage assets having an aggregate principal balance of
$557.0 million
.
On February 6, 2019, the Company originated and fully funded a
$30.0 million
senior mortgage loan on a student housing property located in North Carolina. The loan has a per annum interest rate of LIBOR plus a spread of
3.15%
(plus fees) and an initial term of
three
years.
On February 14, 2019, the Company originated a
$100.6 million
senior mortgage loan on a mixed-use property located in Florida. At closing, the outstanding principal balance was approximately
$37.0 million
. The loan has a per annum interest rate of LIBOR plus
4.25%
(plus fees) and an initial term of
two
years.
On
February 21, 2019
, the Company declared a cash dividend of $
0.33
per common share for the first quarter of
2019
. The first quarter
2019
dividend is payable on
April 16, 2019
to common stockholders of record as of
March 29, 2019
.
F-36
SIGNATURES
Pursuant to the requirements of Section 13 or 15(d) of the Securities Exchange Act of 1934, the registrant has duly caused this report to be signed on its behalf by the undersigned, thereunto duly authorized.
|
ARES COMMERCIAL REAL ESTATE CORPORATION
|
|||
|
Dated:
|
February 21, 2019
|
By:
|
/s/ James A. Henderson
|
|
James A. Henderson
|
|||
|
Chief Executive Officer, Chief Investment Officer and President
(Principal Executive Officer)
|
|||
|
Dated:
|
February 21, 2019
|
By:
|
/s/ Tae-Sik Yoon
|
|
Tae-Sik Yoon
|
|||
|
Chief Financial Officer and Treasurer
(Principal Financial and Accounting Officer)
|
|||
Pursuant to the requirements of the Securities Exchange Act of 1934, this report has been signed below by the following persons on behalf of the registrant and in the capacities and on the dates indicated.
|
Dated:
|
February 21, 2019
|
By:
|
/s/ James A. Henderson
|
|
James A. Henderson
Chief Executive Officer, Director, Chief Investment Officer and President
(Principal Executive Officer)
|
|||
|
Dated:
|
February 21, 2019
|
By:
|
/s/ Tae-Sik Yoon
|
|
Tae-Sik Yoon
Chief Financial Officer and Treasurer (Principal Financial and Accounting Officer) |
|||
|
Dated:
|
February 21, 2019
|
By:
|
/s/ William S. Benjamin
|
|
William S. Benjamin
Chairman, Director |
|||
|
Dated:
|
February 21, 2019
|
By:
|
/s/ Rand S. April
|
|
Rand S. April
Director
|
|||
|
Dated:
|
February 21, 2019
|
By:
|
/s/ Michael J Arougheti
|
|
Michael J Arougheti
Director
|
|||
|
Dated:
|
February 21, 2019
|
By:
|
/s/ Caroline E. Blakely
|
|
Caroline E. Blakely
Director
|
|||
|
Dated:
|
February 21, 2019
|
By:
|
/s/ William L. Browning
|
|
William L. Browning
Director
|
|||
|
Dated:
|
February 21, 2019
|
By:
|
/s/ James E. Skinner
|
|
James E. Skinner
Director
|
|||
|
Dated:
|
February 21, 2019
|
By:
|
/s/ Kirk A. Sykes
|
|
Kirk A. Sykes
Director
|
|||
|
Dated:
|
February 21, 2019
|
By:
|
/s/ Edmond N. Moriarty, III
|
|
Edmond N. Moriarty, III
Director
|
|||
TABLE OF CONTENTS
Part IItem 1. BusinessItem 1A. Risk FactorsItem 1B. Unresolved Staff CommentsItem 2. PropertiesItem 3. Legal ProceedingsItem 4. Mine Safety DisclosuresPart IIItem 5. Market For Registrant S Common Equity, Related Stockholder Matters and Issuer Purchases Of Equity SecuritiesItem 6. Selected Financial DataItem 7. Management S Discussion and Analysis Of Financial Condition and Results Of OperationsItem 7A. Quantitative and Qualitative Disclosures About Market RiskItem 8. Financial Statements and Supplementary DataItem 9. Changes in and Disagreements with Accountants on Accounting and Financial DisclosureItem 9A. Controls and ProceduresItem 9B. Other InformationPart IIIItem 10. Directors, Executive Officers and Corporate GovernanceItem 11. Executive CompensationItem 12. Security Ownership Of Certain Beneficial Owners and Management and Related Stockholder MattersItem 13. Certain Relationships and Related Party Transactions, and Director IndependenceItem 14. Principal Accountant Fees and ServicesPart IVItem 15. Exhibits and Financial Statement SchedulesItem 16. Form 10-k Summary