ACACIA RESEARCH CORP
10-Ks and 10-Qs
|
|
|
|
|
|
|
|
|
|
|
|
|
|
|
|
|
|
|
|
|
|
|
|
|
|
|
|
|
|
|
|
|
|
|
|
|
|
|
|
|
|
|
|
|
|
|
|
|
|
|
|
|
|
|
|
|
|
|
|
|
|
UNITED STATES
SECURITIES AND EXCHANGE COMMISSION
WASHINGTON, D.C. 20549
____________________
FORM 10-K
x
ANNUAL REPORT PURSUANT TO SECTION 13 OR 15(d) OF THE SECURITIES EXCHANGE ACT OF 1934
FOR THE FISCAL YEAR ENDED DECEMBER 31,
2017
OR
o
TRANSACTION REPORT PURSUANT TO SECTION 13 OR 15(d) OF THE SECURITIES EXCHANGE ACT OF 1934
FOR THE TRANSITION PERIOD FROM TO .
Commission File Number 0-26068
____________________

(Exact name of registrant as specified in its charter)
|
DELAWARE
|
95-4405754
|
|
(State or other jurisdiction of
|
(I.R.S. Employer
|
|
incorporation organization)
|
Identification No.)
|
|
|
|
|
520 NEWPORT CENTER DRIVE, 12TH FLOOR
|
|
|
NEWPORT BEACH, CA
|
92660
|
|
(Address of principal executive offices)
|
(Zip Code)
|
Registrant’s telephone number, including area code:
(949) 480-8300
Securities registered pursuant to Section 12(b) of the Act:
|
Title of Each Class
|
Name of Each Exchange on Which Registered
|
|
Common Stock, $0.001 par value
|
The NASDAQ Stock Market, LLC
|
Securities registered pursuant to Section 12(g) of the Act: None
____________________
Indicate by check mark if the registrant is a well-known seasoned issuer, as defined in Rule 405 of the Securities
Act. Yes
£
No
R
Indicate by check mark if the registrant is not required to file reports pursuant to Section 13 or Section 15(d) of the Act. Yes
£
No
R
Indicate by check mark whether the registrant (1) has filed all reports required to be filed by Section 13 or 15(d) of the Securities Exchange Act of 1934 during the preceding 12 months (or for such shorter period that the registrant was required to file such reports), and (2) has been subject to filing requirements for the past 90 days. Yes
R
No
£
Indicate by check mark whether the registrant has submitted electronically and posted on its corporate Web site, if any, every Interactive Data File required to be submitted and posted pursuant to Rule 405 of Regulation S-T(§232.405 of this chapter) during the preceding 12 months (or for such shorter period that the registrant was required to submit and post such files). Yes
R
No
£
Indicate by check mark if disclosure of delinquent filers pursuant to Item 405 of Regulation S-K (§229.405 of this chapter) is not contained herein, and will not be contained, to the best of registrant’s knowledge, in definitive proxy or information statements incorporated by reference in Part III of this Form 10-K or any amendment to this Form 10-K.
R
Indicate by check mark whether the registrant is a large accelerated filer, an accelerated filer, a non-accelerated filer, a smaller reporting company, or an emerging growth company. See the definitions of “large accelerated filer,” “accelerated filer,” “smaller reporting company” and “emerging growth company” in Rule 12b-2 of the Exchange Act:
|
Large accelerated filer
o
|
Accelerated filer
x
|
||
|
Non-accelerated filer
o
(Do not check if a smaller reporting company)
|
Smaller reporting company
o
|
||
|
Emerging growth company
o
|
|||
|
If an emerging growth company, indicate by check mark if the registrant has elected not to use the extended transition period for complying with any new or revised financial accounting standards provided pursuant to Section 13(a) of the Exchange Act.
o
|
|||
Indicate by check mark whether the registrant is a shell company (as defined in Rule 12b-2 of the Act). Yes
£
No
R
The aggregate market value of the registrant’s voting and non-voting common stock held by non-affiliates of the registrant on June 30,
2017
, the last business day of the registrant’s most recently completed second fiscal quarter, computed by reference to the last sale price of the registrant’s common stock as reported by The Nasdaq Global Select Market on such date, was approximately
$202,307,000
. This computation assumes that all executive officers and directors are affiliates of the registrant. Such assumption should not be deemed conclusive for any other purpose.
As of
March 1, 2018
,
50,637,882
shares of common stock were issued and outstanding.
DOCUMENTS INCORPORATED BY REFERENCE
In accordance with General Instruction G(3) to Form 10-K, portions of the registrant’s Definitive Proxy Statement on Schedule 14A for its Annual Meeting of Stockholders to be filed with the Commission within 120 days after the close of the fiscal year covered by this Annual Report on Form 10-K are incorporated by reference into Part III of this Annual Report on Form 10-K.
Only those portions of the proxy statement that are specifically incorporated by reference herein shall constitute a part of this Annual Report on Form 10-K.
ACACIA RESEARCH CORPORATION
ANNUAL REPORT ON FORM 10-K
FISCAL YEAR ENDED DECEMBER 31,
2017
TABLE OF CONTENTS
|
|
Page
|
|
|
PART I
|
||
|
|
|
|
|
Item 1.
|
||
|
Item 1A.
|
||
|
Item 1B.
|
||
|
Item 2.
|
||
|
Item 3.
|
||
|
Item 4.
|
||
|
|
|
|
|
|
|
|
|
PART II
|
||
|
|
|
|
|
Item 5.
|
||
|
Item 6.
|
||
|
Item 7.
|
||
|
Item 7A.
|
||
|
Item 8.
|
||
|
Item 9.
|
||
|
Item 9A.
|
||
|
Item 9B.
|
||
|
|
|
|
|
|
|
|
|
PART III
|
||
|
|
|
|
|
Item 10.
|
||
|
Item 11.
|
||
|
Item 12.
|
||
|
Item 13.
|
||
|
Item 14.
|
||
|
|
|
|
|
|
|
|
|
PART IV
|
||
|
|
|
|
|
Item 15.
|
||
2
CAUTIONARY NOTE REGARDING FORWARD-LOOKING STATEMENTS
As used in this Annual Report on Form 10-K, “we,” “us” and “our” refer to Acacia Research Corporation and/or its wholly and majority-owned operating subsidiaries. All patent portfolio investments, development, licensing and enforcement activities are conducted solely by certain of our wholly owned operating subsidiaries.
This Annual Report on Form 10-K, or the annual report, contains forward-looking statements within the meaning of Section 27A of the Securities Act of 1933, as amended, or the Securities Act, and Section 21E of the Securities Exchange Act of 1934, as amended, or the Exchange Act, which include, without limitation, statements about our future business operations and results, our strategies and competition, and other forward-looking statements included in this annual report. Such statements may be identified by the use of forward-looking terminology such as “may,” “will,” “expect,” “believe,” “estimate,” “anticipate,” “intend,” “continue,” or similar terms, variations of such terms or the negative of such terms. Such statements are based on management’s current expectations and are subject to a number of risks and uncertainties, which could cause actual results to differ materially from those described in the forward-looking statements. Such statements address future events and conditions concerning earnings, capital expenditures, litigation, competition, regulatory matters, stock price volatility, liquidity and capital resources, accounting matters and investments. Actual results in each case could differ materially from those anticipated in such statements by reason of factors such as future economic conditions, legislative, regulatory and competitive developments in markets in which we and our subsidiaries operate, and other circumstances affecting anticipated revenues and costs, as more fully disclosed in our discussion of “Risk Factors” in Item 1A of Part I of this annual report. We expressly disclaim any obligation or undertaking to release publicly any updates or revisions to any forward-looking statements contained herein to reflect any change in our expectations with regard thereto or any change in events, conditions or circumstances on which any such statement is based. Additional factors that could cause such results to differ materially from those described in the forward-looking statements are set forth in connection with the forward-looking statements.
General
We partner with inventors and patent owners, applying our legal and technology expertise to patent assets to unlock the financial value in their patented inventions. We are an intermediary in the patent marketplace, bridging the gap between invention and application, and facilitating efficiency in connection with the monetization of patent assets. We also identify opportunities to partner with high-growth and potentially disruptive technology companies. These partnerships usually involve an equity or debt investment by us, along with entering into intellectual property, or IP, related agreements where we provide IP and other patent related services to these companies. We leverage our experience, expertise, data and relationships developed as a leader in the IP industry to pursue these opportunities. In some cases, these opportunities will complement, and/or supplement our primary licensing and enforcement business.
We generate revenues and related cash flows from the granting of intellectual property rights for the use of patented technologies that our operating subsidiaries control or own. We assist patent owners with the prosecution and development of their patent portfolios, the protection of their patented inventions from unauthorized use, the generation of licensing revenue from users of their patented technologies and, where necessary, with the enforcement against unauthorized users of their patented technologies through the filing of patent infringement litigation. Currently, on a consolidated basis, our operating subsidiaries own or control the rights to multiple patent portfolios, which include U.S. patents and certain foreign counterparts, covering technologies used in a variety of industries.
We have established a proven track record of licensing and enforcement success with over
1,550
license agreements executed to date, across
193
patent portfolio licensing and enforcement programs. To date, we have generated gross licensing revenue of approximately
$1.4 billion
, and have returned more than
$731 million
to our patent partners.
Corporate Information
We were originally incorporated in California in January 1993 and reincorporated in Delaware in December 1999. Our website address is
www.acaciaresearch.com
. Reference in this annual report to this website address does not constitute incorporation by reference of the information contained on or accessed through our website and references to our website address in this annual report are inactive textual references only. We make our filings with the Securities and Exchange Commission, or the SEC, including our annual reports on Form 10-K, quarterly reports on Form 10-Q, current reports on Form
3
8-K, other reports filed or furnished pursuant to Section 13(a) or 15(d) of the Exchange Act, and amendments to the foregoing reports, available free of charge on or through our website as soon as reasonably practicable after we file these reports with, or furnish such reports to, the SEC. In addition, we post the following information on our website:
|
•
|
our corporate code of conduct, our code of conduct for our board of directors and our fraud policy;
|
|
•
|
our insider trading policy;
|
|
•
|
charters for our audit committee, nominating and corporate governance committee, disclosure committee and compensation committee; and
|
|
•
|
applicable dividend related tax forms.
|
The public may read and copy any materials that we file with the SEC at the SEC’s Public Reference Room at 100 F Street, NE, Washington, D.C. 20549. The public may obtain information on the operation of the Public Reference Room by calling the SEC at 1-800-SEC-0330.
Also, the SEC maintains an Internet website that contains reports, proxy and information statements, and other information regarding issuers, including us, that file electronically with the SEC. The public can obtain any documents that we file with the SEC at
http://www.sec.gov
.
Patent Licensing and Enforcement Business
We invest in, license and enforce patented technologies. We partner with inventors and patent owners, applying our legal and technology expertise to patent assets to unlock the financial value in their patented inventions. We are an intermediary in the patent marketplace, bridging the gap between invention and application, and facilitating efficiency in connection with the monetization of patent assets.
We generate revenues and related cash flows from the granting of intellectual property rights for the use of patented technologies that our operating subsidiaries control or own. We assist patent owners with the prosecution and development of their patent portfolios, the protection of their patented inventions from unauthorized use, the generation of licensing revenue from users of their patented technologies and, where necessary, with the enforcement against unauthorized users of their patented technologies through the filing of patent infringement litigation.
Refer to the section entitled “Management’s Discussion and Analysis of Financial Condition and Results of Operations” below for a partial summary of patent portfolios owned or controlled by certain of our operating subsidiaries.
Patents are an important asset class worldwide. Due to legislative and regulatory changes, licensing and enforcing patents has become increasingly difficult for patent holders, necessitating an experienced, well-capitalized, licensing partner. We have partnered with patent owners, including individual inventors, universities, and large multi-national corporations in a variety of technology sectors. These patent owners may have possessed limited internal resources and/or expertise to effectively address the unauthorized use of their patented technologies, or may seek to effectively and efficiently monetize their portfolio of patented technologies on an outsourced basis.
Under U.S. law, a patent owner has the right to exclude others from making, selling or using their patented invention. A third-party infringes a patent by making, offering for sale, selling, or using a patented invention without a license from the patent owner. Unfortunately, in the majority of cases, infringers are generally unwilling, at least initially, to negotiate or pay reasonable license fees for their unauthorized use of third-party patents and will typically indiscriminately challenge any allegations of patent infringement. Inventors and/or patent holders without sufficient legal, financial and/or expert technical resources to bring and continue the pursuit of costly and complex patent infringement actions are often effectively ignored.
As a result of the common reluctance of patent infringers to negotiate and ultimately take a patent license for the use of patented technologies without at least the threat of legal action, patent licensing and enforcement often begins with the filing of patent infringement litigation. However, most patent infringement litigation settles out of court at amounts that are related to the strength of the patent portfolio and the value of the invention or inventions in the infringer’s products or services. We execute agreements that grant rights in our patents to users of our patented technologies. Our agreements can be negotiated without the filing of patent litigation, or negotiated within the context of ongoing patent litigation, depending on the specific facts and circumstances.
We are a principal in the licensing and enforcement effort, with our operating subsidiaries obtaining control of the rights in the patent portfolio, or control of the patent portfolio outright. Our relationship with patent owners is the cornerstone of our corporate strategy. We assume all responsibility for advancing operational expenses while pursuing a patent licensing
4
and enforcement program, and then, when applicable, share net licensing revenue with our patent partners as that program matures, on a pre-arranged and negotiated basis. We may also provide upfront capital to patent owners as an advance against future licensing revenue.
Patent Licensing Business Model and Strategy - Overview
We have the flexibility to structure arrangements in a number of ways to address the needs and specific sets of circumstances presented by each of our unique patent partners, examples of which include the following:
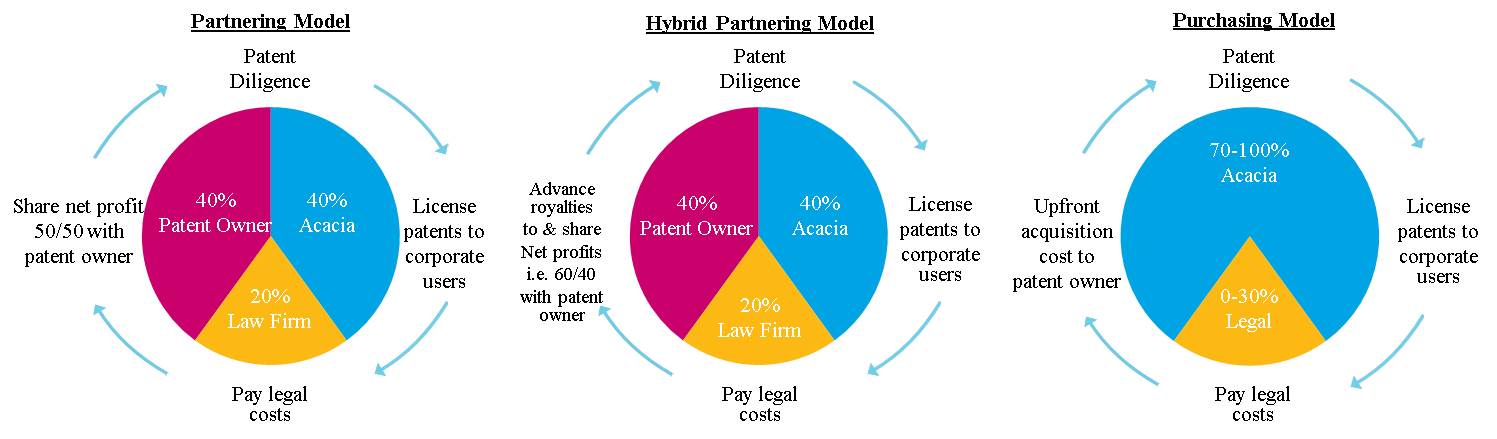
Generally, we maintain a 100% preferred rate of return until all deployed capital and advanced operational costs are recovered by us. After recovery of these costs, the net profit revenue share with patent partner commences, if applicable.
Key Elements of Business Strategy
Patent licensing and enforcement can be an effective and efficient way to maximize the profit potential of a patent, or patents, that are being practiced by third-parties without authorization. A patent license agreement grants a third-party user of an invention specific patent rights to the patented invention in exchange for patent license fees. Our patent licensing business provides patent holders with an opportunity to generate income from their patented inventions being practiced by third-parties without authorization and from third-parties that desire to practice their patented inventions with authorization. Our patent licensing and enforcement business strategy includes three fundamental elements, as follows:
|
•
|
Patent Discovery
- Discover potentially valuable patents or patent portfolios.
|
|
•
|
Assessment of Economic Value -
Work internally and with external experts to evaluate the use of the patented invention(s) in the relevant marketplace and assess a patents or patent portfolios’ expected economic value.
|
|
•
|
Licensing and Enforcement
-
License those users wanting to utilize the patented invention with authorization. For unauthorized users of the patented invention, enter into license negotiations and, if necessary, litigation to monetize the patent based on its assessed value.
|
Patent Discovery.
The patent process breeds, encourages and sustains innovation and invention by granting a limited monopoly to the inventor in exchange for sharing the invention with the public. Certain technologies, become core technologies in the way products and services are manufactured, sold or delivered by companies across a wide array of industries. Patent discovery involves identifying core, patented technologies that have been or are anticipated to be widely adopted by third-parties in connection with the manufacture, sale or use of products and services.
Assessment of Economic Value.
Subsequent to the patent discovery process, our executives work internally and/or with external industry experts in the specific technology field, to evaluate the patented invention and its adoption and implementation in the marketplace. There are a number of factors to consider when analyzing a patent and determining a patent’s value including, (i) infringement, (ii) validity and (iii) enforceability.
To determine infringement, we must first identify third-parties that are practicing the invention(s) covered by the patent without obtaining permission from the patent owner to do so. A key tool in determining whether or not a company is infringing a patent is a claim chart, which demonstrates how the manufacture, sale, or use of an existing product compares against the claims of the patent.
5
The three main factors analyzed to determine validity are: (1) anticipation, which occurs when the claims of the patent are entirely revealed within a single piece of prior art, (2) obviousness which considers whether the differences between prior art and the patented invention are so slight that they would have been obvious at the time of invention to one who is skilled in the subject matter being patented, and (3) the existence of non-patentable subject matter, which considers whether the subject matter includes naturally occurring things, abstract concepts, or algorithms that perform an ordinary function.
To determine enforceability, a number of factors are analyzed, including whether or not there has been patent misuse, or whether or not there are antitrust violations associated with the patent. Due to the inherently complex nature of patent law, only a court or specific administrative body, such as the International Trade Commission, can make a decision whether a patent is infringed, valid and enforceable; however, we employ our wealth of expertise to make the best assessment possible given a specific fact pattern and set of circumstances.
We estimate a patent’s economic value by evaluating the expected value of the license revenue stream based on past, present and future revenue of infringing products or services, and the risk that a court will disagree with our infringement, validity or enforcement assessments of the patent. The processes and procedures employed in connection with the evaluation of a specific patent portfolio for future investment, licensing and enforcement are tailored and unique to each specific situation and can vary widely based on the specific facts and circumstances of a specific patent portfolio, such as the related technology, related industry and other factors.
Neither we nor our operating subsidiaries invent new technologies or products; rather, we depend upon the identification and investment in patents, inventions and companies that own intellectual property through our relationships with inventors, universities, research institutions, technology companies and others. If our operating subsidiaries are unable to maintain those relationships and identify and grow new relationships, then we may not be able to identify new technology-based patent opportunities for sustainable revenue and /or revenue growth.
Our current or future relationships may not provide the volume or quality of technologies necessary to sustain our licensing, enforcement and overall business. In some cases, universities and other technology sources compete against us as they seek to develop and commercialize technologies. Universities may receive financing for basic research in exchange for the exclusive right to commercialize resulting inventions. These and other strategies employed by potential partners may reduce the number of technology sources and potential clients to whom we can market our solutions. If we are unable to maintain current relationships and sources of technology or to secure new relationships and sources of technology, such inability may have a material adverse effect on our revenues, operating results, financial condition and ability to maintain our licensing and enforcement business.
For example, we obtained control of only one, two and three new patent portfolios during fiscal years 2017, 2016 and 2015, respectively, compared to 6 new patent portfolios and 25 new patent portfolios in fiscal years 2014 and 2013, respectively. This decrease in our patent portfolio intake reflects in part our strategic decision in 2013 to shift the focus of our operating business to serving a smaller number of customers, each having higher quality patent portfolios. As a result, our gross number of patent portfolio acquisitions has decreased significantly. This decrease in our patent portfolio intake also reflects in part industry trends impacting our ability to acquire patent portfolios. For example, legislative and legal changes have increased the complexity of patent enforcement actions and may significantly affect the market availability of suitable patent portfolios for acquisition. As a result of these continuing industry trends, our recent and future patent portfolio intake has been and may continue to be negatively impacted, resulting in further decreases in future revenue generating opportunities, and continued negative adverse impacts on the sustainability of our licensing and enforcement business. We continue to experience significant adverse challenges with respect to our patent intake efforts, and if these adverse challenges continue, our licensing and enforcement revenues will continue to decline and we will be unable to profitably sustain our licensing and enforcement business going forward.
As a result of the foregoing, we continue to evaluate other business opportunities which compliment, or supplement, our primary licensing and enforcement business and leverage our intellectual property expertise, as described below, including our continued efforts to identify and partner with potentially high-growth and disruptive technology companies.
Licensing and Enforcement
. The final step in the patent licensing and enforcement process is to seek to monetize the patent portfolio by securing license agreements based on the patents use in the marketplace and estimated value. While we prefer to convince unauthorized users of our patented inventions of the value of the patented invention and secure a license agreement in a non-litigious manner, many infringers refuse to take such licenses even when confronted with substantial and persuasive evidence of infringement, validity, enforceability and significant economic value. As a result, often we must resort to litigation to demonstrate and prove infringement and ultimately induce infringers to take a license from us. We have found it
6
effective to negotiate licenses concurrently with litigation due to the fact that litigation necessitates and facilitates an information exchange that helps both sides assess the value of a patent and make informed decisions. Also, litigation eventually leads to a court’s judgment. When a court agrees with our assessment of a patent, this judgment stops recalcitrant infringers from utilizing our patented technology indefinitely, without appropriate authorization.
We engage highly competent and experienced patent lawyers to prosecute our patent portfolio litigation. It is imperative for us to be persistent and patient throughout the litigation process as it typically takes 18-36 months from the filing date of a lawsuit to yield a license agreement from a potential licensee. Often, it takes longer to secure a final court judgment.
Patent license negotiations and litigation initiated by our operating subsidiaries usually lead to serious and thoughtful discussions with the unauthorized users of the patented inventions. The result can be quite favorable with the user being granted rights under the patents for the patented invention in its products and services in exchange for financial remuneration.
Partnership Opportunities
Our team’s expertise in identifying and evaluating complex IP, and in developing and cultivating long-term business relationships, provides us a unique window into innovation and technological advancement. We have increased our efforts to leverage our expertise and experience to create new avenues which we believe will lead to increased shareholder value.
In this regard, we leverage our experience, expertise, data and relationships developed as a leader in the IP industry to pursue opportunities to partner with high-growth companies in potentially disruptive technology areas. Examples of some of these technology areas include Artificial Intelligence, or AI, and machine learning, machine vision, robotics and blockchain technologies. Examples of our initial execution of this strategy are our partnerships with Veritone, Inc., or Veritone (Nasdaq: VERI), and Miso Robotics, Inc., or Miso Robotics.
In June 2017, we partnered with Miso Robotics, an innovative leader in robotics and AI solutions, which included an equity investment totaling $2.25 million, as part of Miso Robotics’ closing of $3.1 million in Series A funding. In addition, in February 2018, we made an additional strategic equity investment totaling $6.0 million in the Series B financing round for Miso Robotics. Miso Robotics will use the capital to expand its suite of collaborative, adaptable robotic kitchen assistants and to broaden applications for Miso AI, the company’s machine learning cloud platform. In addition, we also entered into an IP services agreement with Miso Robotics to help the company drive AI-based solutions for the restaurant industry. Our partnership with Miso Robotics represents our second partnership with companies seeking to transform the marketplace through Artificial Intelligence.
In August 2016, we announced the formation of a partnership with Veritone, a leading cloud-based Artificial Intelligence technology company that is pioneering next generation search and analytics through their proprietary Cognitive Media Platform™. Under the partnership, we have the ability to leverage our intellectual property expertise to assist Veritone with building its patent portfolio and executing upon its overall intellectual property strategy. In order to enhance Veritone’s leadership position in the field of machine learning and AI, we provided a total of
$53.3
million in funding to Veritone pursuant to an investment agreement executed in August 2016, as amended. Upon Veritone’s consummation of its initial public offering on May 17, 2017, or IPO, our loans and accrued interest were automatically converted into shares of Veritone common stock, and we were issued an additional warrant to purchase additional shares of Veritone common stock as described elsewhere herein.
Subsequent to the year ended December 31, 2017, in January 2018, we entered into a Joint Venture and Services Agreement, or Joint Venture Agreement, with Bitzumi, a company developing macro opportunities in the cryptocurrency and blockchain industries, including a next generation decentralized exchange. Bitzumi recently filed a Regulation A Offering Statement with the Securities and Exchange Commission and a listing application with NASDAQ. We made an initial $1.0 million equity investment in Bitzumi in January 2018. Under the Joint Venture Agreement, we will provide various patent-related services to Bitzumi and have the option to invest up to an additional $9.0 million to acquire Bitzumi common stock. In connection with our initial investment, we received a short-term warrant to purchase $4.0 million of Bitzumi common shares. Under the Joint Venture Agreement, we have a right to acquire up to an aggregate of $10.0 million of Bitzumi common shares (inclusive of our initial $1.0 million equity investment and exercise of our short-term warrant) at a price, except as paid by us for the initial investment and the exercise price of our short-term warrant, of $2.50 per share. Upon meeting certain conditions set forth in the Joint Venture Agreement, Bitzumi will also issue us a warrant for 30,000,000 shares of Bitzumi’s common stock. Our Joint Venture Agreement with Bitzumi represents our first venture in the cryptocurrency and blockchain marketplaces.
7
Patented Technologies
Currently, on a consolidated basis, our operating subsidiaries own or control the rights to patent portfolios with future patent expiration dates ranging from 2018 to approximately 2033, covering technologies used in a number of industries, including: transportation and automotive, telecommunications / smartphones, communications, memory, consumer electronics, energy efficiency, wireless and imaging and diagnostics.
Refer to Item 7. “Management’s Discussion and Analysis of Financial Condition and Results of Operations - Overview” for a summary of patent portfolios generating revenues for the applicable periods presented.
Competition
We encounter competition in the area of patent portfolio investment opportunities and enforcement. This includes an increase in the number of competitors seeking to invest in the same or similar patents and technologies that we may seek to invest in. Existing non-practicing entities compete in acquiring rights to intellectual property assets, and more entities may enter the market in future periods.
We also compete with financial firms, corporate buyers and others acquiring IP and investing in other technology opportunities. Many of these competitors may have more financial and human resources than us. We may find more companies entering the market for similar technology opportunities, which may reduce our market share in one or more technology industries that we currently or in the future may rely upon to generate future revenue.
Companies or other entities may develop competing technologies that offer better or less expensive alternatives to our patented technologies or technology partnerships. Many potential competitors may have significantly greater resources than the resources that we or our operating subsidiaries possess. Such technological advances or entirely different approaches developed by one or more of our competitors could render certain of the technologies owned or controlled by us obsolete and/or uneconomical.
Employees
As of
December 31, 2017
, on a consolidated basis, we had 13 full-time employees. Neither we, nor any of our subsidiaries, are a party to any collective bargaining agreement. We believe we have good relations with our employees.
An investment in our common stock involves risks. You should carefully consider the risks described below, together with all of the other information included in this annual report, as well as in our other filings with the SEC, in evaluating our business. The risks described below are not the only risks we face. Additional risks that we do not yet know of or that we currently believe are immaterial may also impair our business operations. If any of the following risks actually occur, our business, financial condition and results of operations could be materially adversely affected, and the trading price of our common stock could decline significantly. Certain statements below may be considered forward-looking statements. For additional information, see “Cautionary Note Regarding Forward-Looking Statements.”
Risks Related to Our Business
We have a history of losses and may incur additional losses in the future
.
We reported net income of
$22.2 million
(includes $42.2 million of unrealized equity investment gains), a net loss of
$54.1 million
(includes $42.3 million of noncash patent impairment charges) and a net loss of
$160.0 million
(includes $104.9 million of noncash goodwill and patent impairment charges) for the years ended December 31,
2017, 2016 and 2015
, respectively, and on a cumulative basis, we have sustained substantial losses since our inception. As of
December 31, 2017
, our accumulated deficit was
$320.0 million
. As of
December 31, 2017
, we had approximately
$136.6 million
in cash and cash equivalents and short-term investments and working capital of
$130.1 million
. Although we believe that our current cash and cash equivalents and investments will be sufficient to finance our anticipated capital and operating requirements for at least the next twelve months, we expect to continue incurring significant legal, general and administrative expenses in connection with our operations. As a result, we anticipate that we may incur losses in the future. Additional increases in our expenses without commensurate increases in revenues could significantly increase our operating losses. Any additional operating losses may have a material adverse effect on our stockholders’ equity and overall financial condition.
8
Our ability to use net operating losses and certain other tax attributes is uncertain and may be limited.
Our ability to use our federal and state net operating losses to offset potential future taxable income and related income taxes that would otherwise be due is dependent upon our generation of future taxable income before the expiration dates of the net operating losses, and we cannot predict with certainty when, or whether, we will generate sufficient taxable income to use all or any portion of our net operating losses. In addition, utilization of net operating losses to offset potential future taxable income and related income taxes that would otherwise be due is subject to annual limitations under the “ownership change” provisions of Sections 382 and 383 of the Internal Revenue Code of 1986, as amended, or the Code, and similar state provisions, which may result in the expiration of net operating losses before future utilization. In general, under the Code, if a corporation undergoes an “ownership change,” generally defined as a greater than 50% change (by value) in its equity ownership over a three-year period, the corporation’s ability to use its pre-change net operating losses and other pre-change tax attributes (such as research and development credit carryforwards) to offset its post-change taxable income or taxes may be limited. Changes in our stock ownership, some of which may be outside of our control, could in the future result in an ownership change. Although we have completed studies to provide reasonable assurance that an ownership change limitation would not apply, we cannot be certain that a taxing authority would reach the same conclusion. If, after a review or audit, an ownership change limitation were to apply, utilization of our domestic net operating losses and tax credit carryforwards could be limited in future periods and a portion of the carryforwards could expire before being available to reduce future income tax liabilities.
On December 22, 2017, new tax legislation was signed into law. Among other things, it will reduce the maximum federal corporate income tax rate to 21% in future periods. It has also limited or eliminated certain deductions to which the Company has been entitled in past years and has reduced the value of the Company’s deferred tax assets as described elsewhere herein. Given the full valuation allowance provided for net deferred tax assets as of December 31, 2017, we do not expect the change in tax law to have a material impact on our consolidated financial statements provided herein. However, in the absence of guidance on various uncertainties and ambiguities in the application of certain provisions of the new legislation, we will use what we believe are reasonable interpretations and assumptions in applying the new legislation, but it is possible that the IRS could issue subsequent guidance or take positions on audit that differ from our prior interpretations and assumptions, which could have a material adverse effect on our cash tax liabilities, results of operations, and financial condition.
If we encounter unforeseen difficulties with our business or operations in the future that require us to obtain additional working capital, and we cannot obtain additional working capital on favorable terms, or at all, our business may suffer
.
Our consolidated cash and cash equivalents and short-term investments totaled
$136.6 million
and
$158.5 million
at
December 31, 2017 and 2016
, respectively. To date, we have relied primarily upon net cash flows from our operations and from the public and private sale of equity securities to generate the working capital needed to finance our operations. We may encounter unforeseen difficulties with our business or operations in the future that may deplete our capital resources more rapidly than anticipated. As a result, we may be required to obtain additional working capital in the future through bank credit facilities, public or private debt or equity financings, or otherwise. If we are required to raise additional working capital in the future, such financing may be unavailable to us on favorable terms, if at all, or may be dilutive to our existing stockholders. If we fail to obtain additional working capital, as and when needed, such failure could have a material adverse impact on our business, results of operations and financial condition.
Failure to effectively manage our operational changes could strain our managerial, operational and financial resources and could adversely affect our business and operating results.
Our recent operational changes have placed, and are expected to continue to place, a strain on our managerial, operational and financial resources and systems. Operational changes primarily relate to the reductions in employee headcount across our licensing, business development and engineering functions during the three year period ended December 31, 2017. Reductions in headcount in these functions may impact our ability to effectively and efficiently allocate resources in a timely manner in connection with the licensing and enforcement of our existing patent portfolios. In addition, we have increased our focus on opportunities to partner with high-growth and potentially disruptive technology companies. As our businesses evolve, we will be required to continue to manage multiple relationships. Any further change by us, or increases in the number of our strategic relationships, may place additional strain on our managerial, operational and financial resources and systems. If we fail to manage our operational changes effectively or to develop, expand or otherwise modify our managerial, operational and financial resources and systems, our business and financial results will be materially harmed.
9
Patent portfolio investments may present risks, and we may be unable to achieve the financial or other goals intended at the time of any potential investment.
Our licensing and enforcement business has depended, in part, on our ability to invest in patented technologies, patent portfolios, or companies holding such patented technologies and patent portfolios. Accordingly, historically we have engaged in patent portfolio investments in an effort to expand our patent portfolio assets. Such investments and potential investments are subject to numerous risks, including the following:
|
•
|
our inability to enter into a definitive agreement with respect to any potential patent portfolio investment, or if we are able to enter into such agreement, our inability to consummate the potential investment transaction;
|
|
•
|
difficulty integrating the operations, technology and personnel of the acquired entity;
|
|
•
|
our inability to achieve the anticipated financial and other benefits of the specific patent portfolio investment;
|
|
•
|
our inability to retain key personnel from the acquired company, if necessary;
|
|
•
|
difficulty in maintaining controls, procedures and policies during the transition and integration process;
|
|
•
|
diversion of our management’s attention from other business concerns; and
|
|
•
|
failure of our due diligence process to identify significant issues, including issues with respect to patented technologies and patent portfolios, and other legal and financial contingencies.
|
If we are unable to manage these risks effectively as part of any patent portfolio investment, our business could be adversely affected.
Our revenues are unpredictable, and this may harm our financial condition
.
Due to the nature of our licensing business and uncertainties regarding the amount and timing of the receipt of license and other fees from potential infringers, stemming primarily from uncertainties regarding the outcome of enforcement actions, rates of adoption of our patented technologies, the growth rates of our existing licensees and certain other factors, our revenues may vary significantly from quarter to quarter and period to period, which could make our business difficult to manage, adversely affect our business and operating results, cause our quarterly and periodic results to fall below market expectations and adversely affect the market price of our common stock.
Our operating subsidiaries depend upon relationships with others to provide technology-based opportunities that can develop into profitable royalty-bearing licenses, and if they are unable to maintain and generate new relationships, then they may not be able to sustain existing levels of revenue or increase revenue
.
Neither we nor our operating subsidiaries invent new technologies or products; rather, we depend upon the identification and investment in patents, inventions and companies that own intellectual property through our relationships with inventors, universities, research institutions, technology companies and others. If our operating subsidiaries are unable to maintain those relationships and identify and grow new relationships, then we may not be able to identify new technology-based patent opportunities for sustainable revenue and /or revenue growth.
Our current or future relationships may not provide the volume or quality of technologies necessary to sustain our licensing, enforcement and overall business. In some cases, universities and other technology sources compete against us as they seek to develop and commercialize technologies. Universities may receive financing for basic research in exchange for the exclusive right to commercialize resulting inventions. These and other strategies employed by potential partners may reduce the number of technology sources and potential clients to whom we can market our solutions. If we are unable to maintain current relationships and sources of technology or to secure new relationships and sources of technology, such inability may have a material adverse effect on our revenues, operating results, financial condition and ability to maintain our licensing and enforcement business.
For example, we obtained control of only one, two and three new patent portfolios during fiscal years 2017, 2016 and 2015, respectively, compared to 6 new patent portfolios and 25 new patent portfolios in fiscal years 2014 and 2013, respectively. This decrease in our patent portfolio intake reflects in part our strategic decision in 2013 to shift the focus of our operating business to serving a smaller number of customers, each having higher quality patent portfolios. As a result, our gross
10
number of patent portfolio acquisitions has decreased significantly. This decrease in our patent portfolio intake also reflects in part industry trends impacting our ability to acquire patent portfolios. For example, legislative and legal changes have increased the complexity of patent enforcement actions and may significantly affect the market availability of suitable patent portfolios for acquisition. As a result of these continuing industry trends, our recent and future patent portfolio intake has been and may continue to be negatively impacted, resulting in further decreases in future revenue generating opportunities, and continued negative adverse impacts on the sustainability of our licensing and enforcement business. We continue to experience significant adverse challenges with respect to our patent intake efforts, and if these adverse challenges continue, our licensing and enforcement revenues will continue to decline and we will be unable to profitably sustain our licensing and enforcement business going forward.
The success of our operating subsidiaries depends in part upon their ability to retain the best legal counsel to represent them in patent enforcement litigation in order to achieve favorable outcomes from such litigation. The outcome of such litigation is uncertain.
The success of our licensing business depends upon our operating subsidiaries’ ability to retain the best legal counsel to prosecute patent infringement litigation. As our operations evolve and industry conditions increase in complexity, it will become more difficult to find the best legal counsel to handle all of our cases. This is due in part to many of the best law firms having conflicts of interest that prevents their representation of our subsidiaries.
We spend a significant amount of our financial and management resources to pursue our current litigation matters. We believe that these litigation matters and others that we may in the future determine to pursue could continue for years and continue to consume significant financial and management resources. The counterparties to our litigation are sometimes large, well-financed companies with substantially greater resources than us. We cannot assure you that any of our current or future litigation matters will result in a favorable outcome for us. In addition, in part due to the appeals process and other legal processes, even if we obtain favorable interim rulings or verdicts in particular litigation matters, they may not be predictive of the ultimate resolution of the dispute. Also, we cannot assure you that we will not be exposed to claims or sanctions against us which may be costly or impossible for us to defend. The inability to retain the best legal counsel to represent our operating subsidiaries in infringement actions may result in unfavorable or adverse outcomes, which may result in losses, exhaustion of financial resources or other adverse effects which could encumber our ability to effectively operate our business or execute our business strategy.
Our operating subsidiaries, in certain circumstances, rely on representations, warranties and opinions made by third-parties that, if determined to be false or inaccurate, may expose us and our operating subsidiaries to certain material liabilities
.
From time to time, our operating subsidiaries may rely upon representations and warranties made by third-parties from whom our operating subsidiaries acquired patents or the exclusive rights to license and enforce patents. We also may rely upon the opinions of purported experts. In certain instances, we may not have the opportunity to independently investigate and verify the facts upon which such representations, warranties, and opinions are made. By relying on these representations, warranties and opinions, our operating subsidiaries may be exposed to liabilities in connection with the licensing and enforcement of certain patents and patent rights which could have a material adverse effect on our operating results and financial condition.
In connection with patent enforcement actions conducted by certain of our subsidiaries, a court may rule that we or our subsidiaries have violated certain statutory, regulatory, federal, local or governing rules or standards, which may expose us and our operating subsidiaries to certain material liabilities
.
In connection with any of our patent enforcement actions, it is possible that a defendant may request and/or a court may rule that we have violated statutory authority, regulatory authority, federal rules, local court rules, or governing standards relating to the substantive or procedural aspects of such enforcement actions. In such event, a court may issue monetary sanctions against us or our operating subsidiaries or award attorney’s fees and/or expenses to a defendant(s), which could be material, and if we or our operating subsidiaries are required to pay such monetary sanctions, attorneys’ fees and/or expenses, such payment could materially harm our operating results and our financial position.
In connection with patent enforcement actions conducted by certain of our subsidiaries, a court may find the patents invalid, not infringed or unenforceable and/or the U.S. Patent and Trademark Office, or the USPTO, or other relevant patent office, may either invalidate the patents or materially narrow the scope of their claims during the course of a reexamination, opposition or other such proceeding.
Patent litigation is inherently risky and the outcome is uncertain. Some of the parties that we believe infringe on our patents are large and well-financed companies with substantially greater resources than ours. We believe that these parties
11
would devote a substantial amount of resources in an attempt to avoid or limit a finding that they are liable for infringing on our patents or, in the event liability is found, to avoid or limit the amount of associated damages. In addition, there is a risk that these parties may file reexaminations or other proceedings with the USPTO or other government agencies in the United States or abroad in an attempt to invalidate, narrow the scope or render unenforceable the patents we own or control. If this were to occur, it may have a material adverse effect on our operations.
In addition, it is difficult to predict the outcome of patent enforcement litigation at any level. In the United States, there is a higher rate of appeals in patent enforcement litigation than standard business litigation. The defendant to any case we bring, may file as many appeals as allowed by right, including to the first, second and/or final courts of appeal (in the United States those courts would be the Federal Circuit and Supreme Court, respectively). Such appeals are expensive and time-consuming, and the outcomes of such appeals are sometimes unpredictable, resulting in increased costs and reduced or delayed revenue which could have a material adverse effect on our operating results and financial condition.
Our licensing cycle is lengthy and costly, and our legal and sales efforts may be unsuccessful.
We expect our operating subsidiaries to incur significant general and administrative and legal expenses prior to entering into license agreements and generating license revenues. We also spend considerable resources educating prospective licensees on the benefits of a license arrangement with us. As such, we may incur significant losses in any particular period before any associated revenue stream begins.
If our efforts to educate prospective licensees on the benefits of a license arrangement are unsuccessful, we may need to pursue litigation or other enforcement action to protect our patent rights. We may also need to litigate to enforce the terms of our existing license agreements, protect our trade secrets, or determine the validity and scope of the proprietary rights of others. Enforcement proceedings are typically protracted and complex. The costs are typically substantial, and the outcomes are unpredictable. Enforcement actions will divert our managerial, technical, legal and financial resources from business operations and there are no assurances that such enforcement actions will result in favorable results for us.
Failure to maintain effective internal control over our financial reporting in accordance with Section 404 of the Sarbanes-Oxley Act could cause our financial reports to be inaccurate.
We are required pursuant to Section 404 of the Sarbanes-Oxley Act of 2002, or Section 404, to maintain internal control over financial reporting and to assess and report on the effectiveness of those controls. This assessment includes disclosure of any material weaknesses identified by our management in our internal control over financial reporting.
Our management concluded that our internal control over financial reporting was effective as of December 31, 2017. However, there are inherent limitations on effectiveness of controls. Our management, including our chief executive officer and chief financial officer, does not expect that our disclosure controls or our internal control over financial reporting will prevent or detect all errors and all fraud. A control system, no matter how well designed and operated, can provide only reasonable, not absolute, assurance that the control system’s objectives will be met. The design of a control system must reflect the fact that there are resource constraints, and the benefits of controls must be considered relative to their costs. Further, because of the inherent limitations in all control systems, no evaluation of controls can provide absolute assurance that misstatements due to error or fraud will not occur or that all control issues and instances of fraud, if any, have been detected. The design of any system of controls is based in part on certain assumptions about the likelihood of future events, and there can be no assurance that any design will succeed in achieving its stated goals under all potential future conditions. Projections of any evaluation of the effectiveness of controls to future periods are subject to risks. Over time, controls may become inadequate because of changes in conditions or deterioration in the degree of compliance with policies or procedures.
If we are not able to maintain effective internal control over financial reporting, our financial statements, including related disclosures, may be inaccurate, which could have a material adverse effect on our business. Refer to Item 9A. “Controls and Procedures” for additional information related to the current period.
Our partnerships are subject to risks and we may experience significant financial losses on our related existing equity investments.
As described herein, in August 2016, we formed a partnership with Veritone pursuant to which we have the ability to leverage our expertise in intellectual property licensing and enforcement to assist Veritone with building its patent portfolio and execute upon its overall intellectual property strategy. As a part of this partnership, we entered into an investment agreement and bridge financing with Veritone, investing approximately
$53.3
million in Veritone, comprised of common stock and warrants as of December 31, 2017.
12
In addition, in June 2017, we partnered with Miso Robotics, an innovative leader in robotics and AI solutions, which included an equity investment totaling $2.25 million, as part of Miso Robotics’ closing of $3.1 million in Series A funding. In addition, in February 2018, we made an additional strategic equity investment totaling $6.0 million in the Series B financing round for Miso Robotics. Miso Robotics will use the new capital to expand its suite of collaborative, adaptable robotic kitchen assistants and to broaden applications for Miso AI, the company’s machine learning cloud platform. In addition, we also entered into an intellectual property services agreement with Miso Robotics to help Miso Robotics drive AI-based solutions for the restaurant industry.
Our current partnerships and related equity investments are subject to a high degree of risk and could diminish our financial condition. Currently, none of our investees are profitable and have limited financial resources. The overall sustained economic uncertainty, as well as financial, operational and other difficulties encountered by certain companies in which we have equity investments increases the risk that the actual amounts realized in the future on our debt and equity investments will differ significantly from the fair values currently assigned to them. In addition, the companies in which we have equity investments or with whom we partner may not be able to compete effectively or there may be insufficient demand for the services and products offered by these companies. These partnerships could also expose us to significant financial losses and may restrict our ability to execute other partnerships or limit alternative uses of our capital resources. If our partnerships suffer losses, our financial condition could be materially adversely affected. In addition, applicable securities law restrictions and other factors may result in an inability to liquidate any equity components of our equity investments. Our Veritone common shares are subject to a lock-up agreement that expired on February 15, 2018, subsequent to which the shares may be sold pursuant to Rule 144, subject to volume limitations and Rule 144 filing requirements, as well as other restrictions under applicable securities laws.
Our initiative to identify partnerships may not be successfully implemented.
We intend to continue to selectively explore opportunities to partner with potentially high-growth and disruptive technology companies that we believe will allow us to leverage our experience, expertise, data and relationships to increase shareholder value. We may allocate significant resources for long-term initiatives that may not have a short or medium-term or any positive impact on our revenue, results of operations, or cash flow.
The successful implementation of our initiative to identify partnerships requires an investment of time, talent and money and is dependent upon a number of factors, some of which are not within our control. Those factors include the ability to effectively execute such initiatives in new and existing markets and market conditions in the various technology industries we pursue. We may allocate significant resources for long-term initiatives that may not have a short or medium-term or any positive impact on our revenue, results of operations, or cash flow. If we fail to properly identify successful companies to partner with and invest in, it may have an adverse effect on our financial condition. There can be no assurance that we will successfully implement this strategic initiative or that, if successfully pursued, this initiative will have the desired effect on our business or results of operations. Additionally, these new partnerships could expose us to significant financial losses and may restrict our ability to enter future partnerships or limit alternative uses of our capital resources. If our partnership related equity investments suffer losses, our financial condition could be materially adversely affected.
Recent U.S. tax legislation may materially adversely affect our financial condition, results of operations and cash flows.
Recently-enacted U.S. tax legislation has significantly changed the U.S. federal income taxation of U.S. corporations, including the reduction of the U.S. corporate income tax rate, the limiting of interest deductions, adopting elements of a territorial tax system, imposing a one-time transition tax (or “repatriation tax”) on all undistributed earnings and profits of certain U.S.-owned foreign corporations, revising the rules governing net operating losses and the rules governing foreign tax credits, and introducing new anti-base erosion provisions. Many of these changes are effective immediately, without any transition periods or grandfathering for existing transactions. The legislation is unclear in many respects and could be subject to potential amendments and technical corrections, as well as interpretations and implementing regulations by the Treasury and Internal Revenue Service, or IRS, any of which could lessen or increase certain adverse impacts of the legislation. In addition, it is unclear how these U.S. federal income tax changes will affect state and local taxation, which often uses federal taxable income as a starting point for computing state and local tax liabilities.
While our analysis and interpretation of this legislation is ongoing, based on our current evaluation, we have reflected a write-down of our deferred income tax assets (including the value of our net operating loss carryforwards and our tax credit carryforwards for financial statement purposes) due to the reduction of the U.S. corporate income tax rate. Based on currently available information, we recorded a reduction of approximately
$25.3
million in the fourth quarter of 2017 related to the revaluation of our deferred tax assets, which will not result in additional tax expense in the quarter as our deferred tax assets are
13
fully valued. This amount may be subject to further adjustment in subsequent periods throughout 2018 in accordance with subsequent interpretive guidance issued by the SEC or the IRS. Further, there may be other material adverse effects resulting from the legislation that we have not yet identified.
While some of the changes made by the tax legislation may adversely affect the Company in one or more reporting periods and prospectively, other changes may be beneficial on a going forward basis. We continue to work with our tax advisors to determine the full impact that the recent tax legislation as a whole will have on us. We urge our investors to consult with their legal and tax advisors with respect to such legislation.
Risks Related to Our Industry
Our exposure to uncontrollable outside influences, including new legislation, court rulings or actions by the USPTO, could adversely affect our licensing and enforcement business and results of operations
.
Our licensing and enforcement business is subject to numerous risks from outside influences, including the following:
New legislation, regulations or rules related to obtaining patents or enforcing patents could significantly increase our operating costs and decrease our revenue.
Our operating subsidiaries invest in patents with enforcement opportunities and spend a significant amount of resources to enforce those patents. If new legislation, regulations or rules are implemented by Congress, the USPTO or the courts that impact the patent application process, the patent enforcement process or the rights of patent holders, such changes could negatively affect our business. United States patent laws were amended with the enactment of the Leahy-Smith America Invents Act, or the America Invents Act, which took effect on March 16, 2013. The America Invents Act includes a number of significant changes to U.S. patent law. In general, the legislation attempts to address issues surrounding the enforceability of patents and the increase in patent litigation by, among other things, establishing new procedures for patent litigation. For example, the America Invents Act changes the way that parties may be joined in patent infringement actions, increasing the likelihood that such actions will need to be brought against individual allegedly-infringing parties by their respective individual actions or activities. In addition, the America Invents Act enacted a new inter-partes review process, or IPR process, at the USPTO which can be, and often is, used by defendants, and other individuals and entities, to separately challenge the validity of any patent. The IPR process of the America Invents Act has in many instances increased costs for licensing and litigation and has resulted in the loss of certain portfolio patents which, in some cases, may have negatively impacted the value of those portfolios. The America Invents Act and its implementation has increased the uncertainties and costs surrounding the enforcement of our patented technologies, which in certain circumstances could have a material adverse effect on our business and financial condition.
The U.S. Department of Justice, or the DOJ, has conducted reviews of the patent system to evaluate the impact of patent assertion entities on industries in which those patents relate. It is possible that the findings and recommendations of the DOJ could impact the ability to effectively license and enforce standards-essential patents and could increase the uncertainties and costs surrounding the enforcement of any such patented technologies. Also, in 2014, the Federal Trade Commission, or FTC, initiated a study under Section 6(b) of the Federal Trade Commission Act to evaluate the patent assertion practice and market impact of Patent Assertion Entities, or PAEs. The FTC’s initial notice and request for public comment relating to the PAE study appeared in the Federal Register on October 3, 2013. We received and responded to a request for information as part of this FTC study. The FTC study entitled, “Patent Assertion Entity Activity” was released in October 2016.
Finally, new rules regarding the burden of proof in patent enforcement actions could significantly increase the cost of our enforcement actions, and new standards or limitations on liability for patent infringement could negatively impact our revenue derived from such enforcement actions. In addition, recent federal court decisions have lowered the threshold for obtaining attorneys’ fees in patent infringement cases and increased the level of deference given to a district court’s fee-shifting determination. These decisions may make it easier for district courts to shift a prevailing party’s attorneys’ fees to a non-prevailing party if the district court believes that the case was weak or conducted in an abusive manner. As a result, defendants in patent infringement actions brought by non-practicing entities may elect not to settle because these decisions make it much easier for defendants to get attorneys’ fees.
Changes in patent law could adversely impact our business.
Patent laws may continue to change, and may alter the historically consistent protections afforded to owners of patent rights. Such changes may not be advantageous for us and may make it more difficult to obtain adequate patent protection to
14
enforce our patents against infringing parties. Increased focus on the growing number of patent-related lawsuits may result in legislative changes which increase our costs and related risks of asserting patent enforcement actions. For instance, the United States Congress has considered a bill that would require, among other things, non-practicing entities that bring patent infringement lawsuits to pay legal costs of the defendants, if the lawsuits are unsuccessful and certain standards are not met.
Trial judges and juries often find it difficult to understand complex patent enforcement litigation, and as a result, we may need to appeal adverse decisions by lower courts in order to successfully enforce our patents.
It is difficult to predict the outcome of patent enforcement litigation at the trial level. It is often difficult for juries and trial judges to understand complex, patented technologies, and as a result, there is a higher rate of successful appeals in patent enforcement litigation than more standard business litigation. Such appeals are expensive and time consuming, resulting in increased costs and delayed revenue. Although we diligently pursue enforcement litigation, we cannot predict with significant reliability the decisions made by juries and trial courts.
More patent applications are filed each year resulting in longer delays in getting patents issued by the USPTO.
Certain of our operating subsidiaries hold and continue to invest in pending patents. We have identified a trend of increasing patent applications each year, which we believe is resulting in longer delays in obtaining approval of pending patent applications. The application delays could cause delays in recognizing revenue from these patents and could cause us to miss opportunities to license patents before other competing technologies are developed or introduced into the market.
Federal courts are becoming more crowded, and as a result, patent enforcement litigation is taking longer.
Our patent enforcement actions are almost exclusively prosecuted in federal court. Federal trial courts that hear our patent enforcement actions also hear criminal cases. Criminal cases always take priority over our actions. As a result, it is difficult to predict the length of time it will take to complete an enforcement action. Moreover, we believe there is a trend in increasing numbers of civil lawsuits and criminal proceedings before federal judges and, as a result, we believe that the risk of delays in our patent enforcement actions will have a greater negative effect on our business in the future unless this trend changes.
Any reductions in the funding of the USPTO could have an adverse impact on the cost of processing pending patent applications and the value of those pending patent applications.
The assets of our operating subsidiaries consist of patent portfolios, including pending patent applications before the USPTO. The value of our patent portfolios is dependent upon the issuance of patents in a timely manner, and any reductions in the funding of the USPTO could negatively impact the value of our assets. Further, reductions in funding from Congress could result in higher patent application filing and maintenance fees charged by the USPTO, causing an increase in our expenses.
Competition is intense in the industries in which our subsidiaries do business and as a result, we may not be able to grow or maintain our market share for our technologies and patents.
We expect to encounter competition in the area of patent portfolio investments and enforcement. This includes competitors seeking to invest in the same or similar patents and technologies that we may seek to invest in. As new technological advances occur, many of our patented technologies may become obsolete before they are completely monetized. If we are unable to replace obsolete technologies with more technologically advanced patented technologies, then this obsolescence could have a negative effect on our ability to generate future revenues.
Our licensing business also competes with venture capital firms and various industry leaders for patent licensing opportunities. Many of these competitors may have more financial and human resources than we do. As we become more successful, we may find more companies entering the market for similar technology opportunities, which may reduce our market share in one or more technology industries that we currently rely upon to generate future revenue.
Our patented technologies face uncertain market value.
Our operating subsidiaries have invested in patents and technologies that may be in the early stages of adoption in the commercial and consumer markets. Demand for some of these technologies is untested and is subject to fluctuation based upon the rate at which our licensees will adopt our patents and technologies in their products and services.
15
Further, significant judgment is required in connection with estimates of the recoverability of the carrying value of our intangible patent assets, including estimates of market values, estimates of the amount and timing of future cash flows, and estimates of other factors that are used to determine the fair value and recoverability of the respective patent asset values. Developments with respect to ongoing patent litigation, patent challenges and re-exams, legislative and judicial decisions and other factors outside of our control, may unfavorably impact the validity, applicability, and enforceability of our patent assets, and therefore, negatively impact the future value of our patent portfolios. If certain of these unfavorable events occur, our estimates or related projections may change materially in future periods, and future intangible asset impairment tests may result in material charges to earnings.
As patent enforcement litigation becomes more prevalent, it may become more difficult for us to voluntarily license our patents.
We believe that the more prevalent patent enforcement actions become, the more difficult it will be for us to voluntarily license our patents. As a result, we may need to increase the number of our patent enforcement actions to cause infringing companies to license the patent or pay damages for lost royalties. This may increase the risks associated with an investment in our company.
Patent litigation trials and scheduled trial dates are subject to routine delay, and any such delays could adversely impact our business, results of operations and financial condition.
Patent infringement trials are components of our overall patent licensing process and are one of many factors that contribute to the existence of possible future revenue opportunities for us. Patent litigation schedules in general, and in particular trial dates, are subject to routine adjustment, and in most cases delay, as courts adjust their calendars or respond to requests from one or more parties. Trial dates often are rescheduled by the court for various reasons that are often unrelated to the underlying patent assets and typically for reasons that are beyond our control. As a result, to the extent such events are an indicator of possible future revenue opportunities for us, or other outcome determinative events, they may and often do change which can result in delay of the expected scheduled event. Any such delay could be significant and could affect the corresponding future revenue opportunities, thus adversely impacting our business, results of operations and financial condition.
The markets served by our operating subsidiaries are subject to rapid technological change, and if our operating subsidiaries are unable to develop and invest in new technologies and patents, our ability to generate revenues could be substantially impaired
.
The markets served by our operating subsidiaries and their licensees frequently undergo transitions in which products rapidly incorporate new features and performance standards on an industry-wide basis. Products for communications applications and high-speed computing applications, as well as other applications covered by our operating subsidiaries’ intellectual property, are based on continually evolving industry standards. In addition, the communications industry is intensely competitive and has been impacted by price erosion, rapid technological change, short product life cycles, cyclical market patterns and increasing foreign and domestic competition. Our ability to compete in the future will depend on our ability to identify and ensure compliance with evolving industry standards. This will require our continued efforts and success in acquiring new patent portfolios with licensing and enforcement opportunities. If we are unable to invest in new patented technologies and patent portfolios, or to identify and ensure compliance with evolving industry standards, our ability to generate revenues could be substantially impaired and our business and financial condition could be materially harmed.
Uncertainty in global economic conditions could negatively affect our business, results of operations and financial condition
.
Our revenue-generating opportunities depend on the use of our patented technologies by existing and prospective licensees, the overall demand for the products and services of our licensees, and on the overall economic and financial health of our licensees. If economic conditions do not continue to improve, or if they deteriorate, many of our licensees’ customers, which may rely on credit financing, may delay or reduce their purchases of our licensees’ products and services. In addition, the use or adoption of our patented technologies is often based on current and forecasted demand for our licensees’ products and services in the marketplace and may require companies to make significant initial commitments of capital and other resources. If negative conditions in the global credit markets delay or prevent our licensees’ and their customers’ access to credit, overall consumer spending on the products and services of our licensees may decrease and the adoption or use of our patented technologies may slow, respectively. Further, if the markets in which our licensees’ participate do not continue to improve, or deteriorate further, this could negatively impact our licensees’ long-term sales and revenue generation, margins and operating expenses, which could in turn have an adverse effect on our business, results of operations and financial condition.
16
In addition, we have significant patent-related intangible assets recorded on our consolidated balance sheets. We will continue to evaluate the recoverability of the carrying amount of our patent-related intangible assets on an ongoing basis, and we may incur substantial impairment charges, which would adversely affect our consolidated financial results. There can be no assurance that the outcome of such reviews in the future will not result in substantial impairment charges. Impairment assessment inherently involves judgment as to assumptions about expected future cash flows and the impact of market conditions on those assumptions. Reductions in internal resources may result in decisions to no longer allocate resources to certain licensing and enforcement programs which may result in significant impairment charges. Future events and changing market conditions may impact our assumptions as to prices, costs, holding periods or other factors that may result in changes in our estimates of future cash flows. Although we believe the assumptions we used in testing for impairment are reasonable, significant changes in any one of our assumptions could produce a significantly different result.
Risks Related to Our Common Stock
The availability of shares for sale in the future could reduce the market price of our common stock
.
In the future, we may issue securities to raise cash for operations and patent portfolio investments. We may also pay for interests in additional subsidiary companies by using shares of our common stock or a combination of cash and shares of our common stock. We may also issue securities convertible into our common stock. Any of these events may dilute stockholders’ ownership interests in our company and have an adverse impact on the price of our common stock.
In addition, sales of a substantial amount of our common stock in the public market, or the perception that these sales may occur, could reduce the market price of our common stock. This could also impair our ability to raise additional capital through the sale of our securities.
Delaware law and our charter documents contain provisions that could discourage or prevent a potential takeover of our company that might otherwise result in our stockholders receiving a premium over the market price of their shares
.
Provisions of Delaware law and our certificate of incorporation and bylaws could make the acquisition of our company by means of a tender offer, proxy contest or otherwise, and the removal of incumbent officers and directors, more difficult. These provisions include:
|
•
|
Section 203 of the Delaware General Corporation Law, which prohibits a merger with a 15%-or-greater stockholder, such as a party that has completed a successful tender offer, until three years after that party became a 15%-or-greater stockholder;
|
|
•
|
amendment of our bylaws by the stockholders requires a two-thirds approval of the outstanding shares;
|
|
•
|
the authorization in our certificate of incorporation of undesignated preferred stock, which could be issued without stockholder approval in a manner designed to prevent or discourage a takeover;
|
|
•
|
provisions in our bylaws eliminating stockholders’ rights to call a special meeting of stockholders, which could make it more difficult for stockholders to wage a proxy contest for control of our board of directors or to vote to repeal any of the anti-takeover provisions contained in our certificate of incorporation and bylaws; and
|
|
•
|
the division of our board of directors into three classes with staggered terms for each class, which could make it more difficult for an outsider to gain control of our board of directors.
|
Together, these provisions may make the removal of management more difficult and may discourage transactions that could otherwise involve payment of a premium over prevailing market prices for our common stock.
We may fail to meet market expectations because of fluctuations in quarterly operating results, which could cause the price of our common stock to decline
.
Our reported revenues and operating results have fluctuated in the past and may continue to fluctuate significantly from quarter to quarter in the future. It is possible that in future periods, revenues could fall below the expectations of securities analysts or investors, which could cause the market price of our common stock to decline. The following are among the factors that could cause our operating results to fluctuate significantly from period to period:
17
|
•
|
the dollar amount of agreements executed in each period, which is primarily driven by the nature and characteristics of the technology being licensed and the magnitude of infringement associated with a specific licensee;
|
|
•
|
the specific terms and conditions of agreements executed in each period and the periods of infringement contemplated by the respective payments;
|
|
•
|
fluctuations in the total number of agreements executed;
|
|
•
|
fluctuations in the sales results or other royalty-per-unit activities of our licensees that impact the calculation of license fees due;
|
|
•
|
the timing of the receipt of periodic license fee payments and/or reports from licensees;
|
|
•
|
fluctuations in the net number of active licensees period to period;
|
|
•
|
costs related to investments, alliances, licenses and other efforts to expand our operations;
|
|
•
|
the timing of payments under the terms of any customer or license agreements into which our operating subsidiaries may enter;
|
|
•
|
we may elect to account for equity investments in companies where our investment gives us the ability to exercise significant influence over the operating and financial policies of the investee at fair value, which may result in significant fluctuations in operating results (unrealized gains and losses) each period based on fluctuations in the stock price of our investments and the requirement to mark such investments to market at each balance sheet date;
|
|
•
|
expenses related to, and the timing and results of, patent filings and other enforcement proceedings relating to intellectual property rights, as more fully described in this section; and
|
|
•
|
new litigation or developments in current litigation and the unpredictability of litigation results or settlements or appeals.
|
Technology company stock prices are especially volatile, and this volatility may depress the price of our common stock
.
The stock market has experienced significant price and volume fluctuations, and the market prices of technology companies have been highly volatile. We believe that various factors may cause the market price of our common stock to fluctuate, perhaps substantially, including, among others, the following:
|
•
|
announcements of developments in our patent enforcement actions;
|
|
•
|
developments or disputes concerning our patents;
|
|
•
|
our or our competitors’ technological innovations;
|
|
•
|
developments in relationships with licensees;
|
|
•
|
variations in our quarterly operating results;
|
|
•
|
our failure to meet or exceed securities analysts’ expectations of our financial results;
|
|
•
|
a change in financial estimates or securities analysts’ recommendations;
|
|
•
|
changes in management’s or securities analysts’ estimates of our financial performance;
|
|
•
|
changes in market valuations of similar companies;
|
|
•
|
concerns about sovereign debt of the United States and the European Union;
|
18
|
•
|
announcements by us or our competitors of significant contracts, investments, partnerships, joint ventures, capital commitments, new technologies, or patents; and
|
|
•
|
failure to complete significant transactions.
|
For example, the NASDAQ-100 Technology Sector Index (NDXT) had a range of $2,873.11 - $4,095.06 during the 52-weeks ended
December 31, 2017
and the NASDAQ Composite Index (IXIC) had a range of $5,397.99 - $7,003.89 over the same period. Over the same period, our common stock fluctuated within a range of $2.90 - $7.20.
As noted above, our stock price, like many others, has fluctuated significantly in recent periods and if investors have concerns that our business, operating results and financial condition will be negatively impacted by industry, global economic or other negative conditions, our stock price could continue to fluctuate significantly in future periods.
In addition, we believe that fluctuations in our stock price during applicable periods can also be impacted by court rulings and/or other developments in our patent licensing and enforcement actions. Court rulings in patent enforcement actions are often difficult to understand, even when favorable or neutral to the value of our patents and our overall business, and we believe that investors in the market may overreact, causing fluctuations in our stock prices that may not accurately reflect the impact of court rulings on our business operations and assets.
In the past, companies that have experienced volatility in the market price of their stock have been the objects of securities class action litigation. If our common stock was the object of securities class action litigation, it could result in substantial costs and a diversion of management’s attention and resources, which could materially harm our business and financial results.
We do not currently intend to pay dividends on our common stock in the foreseeable future, and consequently, your ability to achieve a return on your investment will depend on appreciation in the price of our common stock.
On February 23, 2016, our board of directors eliminated our dividend policy that provided for the discretionary payment of a total annual cash dividend of $0.50 per common share, payable in the amount of $0.125 per share per quarter, effective as of February 23, 2016. As a result, we do not anticipate paying any cash dividends to holders of our common stock in the foreseeable future. Consequently, investors must rely on sales of their common stock after price appreciation, which may never occur, as the only way to realize any future gains on their investments. There is no guarantee that shares of our common stock will appreciate in value or even maintain the price at which our stockholders have purchased their shares.
None.
Our principal executive, corporate and administrative offices are located in Newport Beach, California, where we lease approximately 17,758 square feet of office space, under a lease agreement that expires in December 2019, a portion of which is currently subleased. Our primary operating subsidiary, Acacia Research Group, LLC, and its subsidiaries, are headquartered in Frisco, Texas, where we lease office space under a lease agreement that expires in April 2019. Certain of our operating subsidiaries also maintain additional leased office space in Munich, Germany. We believe that our facilities are adequate, suitable and of sufficient capacity to support our immediate needs.
In the ordinary course of business, we are the subject of, or party to, various pending or threatened legal actions, including various counterclaims in connection with our patent enforcement activities. We believe that any liability arising from these actions will not have a material adverse effect on our consolidated financial position, results of operations or cash flows.
Our operating subsidiaries are often required to engage in litigation to enforce their patents and patent rights. Certain of our operating subsidiaries are parties to ongoing patent enforcement related litigation, alleging infringement by third-parties of certain of the patented technologies owned or controlled by our operating subsidiaries.
19
In connection with any of our patent enforcement actions, it is possible that a defendant may claim and/or a court may rule that we have violated statutory authority, regulatory authority, federal rules, local court rules, or governing standards relating to the substantive or procedural aspects of such enforcement actions. In such event, a court may issue monetary sanctions against us or our operating subsidiaries or award attorney’s fees and/or expenses to a defendant(s), which could be material, and if required to be paid by us or our operating subsidiaries, could materially harm our operating results and our financial position.
We spend a significant amount of our financial and management resources to pursue our current litigation matters. We believe that these litigation matters and others that we may in the future determine to pursue could continue for years and continue to consume significant financial and management resources. The counterparties to our litigation are sometimes large, well-financed companies with substantially greater resources than us. We cannot assure you that any of our current or future litigation matters will result in a favorable outcome for us. In addition, in part due to the appeals process and other legal processes, even if we obtain favorable interim rulings or verdicts in particular litigation matters, they may not be predictive of the ultimate resolution of the dispute. Also, we cannot assure you that we will not be exposed to claims or sanctions against us which may be costly or impossible for us to defend. Unfavorable or adverse outcomes may result in losses, exhaustion of financial resources or other adverse effects which could encumber our ability to effectively and efficiently monetize our assets.
None.
20
General
Our common stock trades on The NASDAQ Global Select Market under the symbol “ACTG.”
Price Range of Common Stock
The high and low sales prices for our common stock as reported by The NASDAQ Global Select Market for the periods indicated are shown in the table below. Such prices are inter-dealer prices without retail markups, markdowns or commissions and may not necessarily represent actual transactions.
|
|
2017
|
2016
|
||||||||||||||
|
|
Fourth
Quarter
|
Third
Quarter
|
Second
Quarter
|
First
Quarter
|
Fourth
Quarter
|
Third
Quarter
|
Second
Quarter
|
First
Quarter
|
||||||||
|
High
|
$4.75
|
$5.50
|
$5.75
|
$7.20
|
$7.68
|
$7.25
|
$5.64
|
$4.30
|
||||||||
|
Low
|
$3.80
|
$2.90
|
$3.70
|
$5.00
|
$5.55
|
$4.20
|
$3.75
|
$2.82
|
||||||||
Dividend Policy
On April 23, 2013, we announced that our Board of Directors approved the adoption of a cash dividend policy that called for the payment of an expected total annual cash dividend of $0.50 per common share, payable in the amount of
$0.125
per share per quarter. Under the policy, we paid quarterly cash dividends totaling
$25.4 million
during 2015. On February 23, 2016, our Board of Directors terminated the company’s dividend policy. Our Board of Directors terminated the dividend policy due to a number of factors, including our financial performance, our available cash resources, our cash requirements and alternative uses of capital that our Board of Directors concluded would represent an opportunity to generate a greater return on investment for us and our stockholders.
The current policy of our Board of Directors is to retain earnings, if any, to provide for our growth. Consequently, we do not expect to pay any cash dividends in the foreseeable future. Further, there can be no assurance that our proposed operations will generate revenues and cash flow needed to declare any future cash dividends or that we will have legally available funds to pay future dividends.
Stock Repurchase Program
In February 2018, our Board of Directors authorized a stock repurchase program, or the Program, to repurchase up to $20 million of our outstanding common stock in open market purchases or private purchases, from time to time, in amounts and at prices to be determined by the Board of Directors at its discretion. In determining whether or not to repurchase any shares of our common stock, our Board of Directors will consider such factors as the impact of the repurchase on our cash position, as well as our capital needs and whether there is a better alternative use of our capital. We have no obligation to repurchase any amount of our common stock under the Program. The Program is set to expire on February 28, 2019.
Holders of Common Stock
On
March 1, 2018
, there were approximately
49
owners of record of our common stock. The majority of the outstanding shares of our common stock are held by a nominee holder on behalf of an indeterminable number of ultimate beneficial owners.
Stock Price Performance Graph
The following stock price performance graph shall not be deemed “filed” for purposes of Section 18 of the Exchange Act, or otherwise subject to the liabilities under that Section and shall not be deemed to be incorporated by reference into any of our filings under the Securities Act.
21
The Stock Performance Graph depicted below compares the yearly change in our cumulative total stockholder return for the last five fiscal years with the cumulative total return of The NASDAQ Stock Market (U.S.) Composite Index and the NASDAQ-100 Technology Sector Index.
|
|
2013
|
2014
|
2015
|
2016
|
2017
|
|||||
|
Acacia Research Corporation common stock
|
$57
|
$66
|
$17
|
$25
|
$16
|
|||||
|
Nasdaq Composite Index (IXIC)
|
$138
|
$157
|
$166
|
$178
|
$229
|
|||||
|
NASDAQ-100 Technology Sector Index (NDXT)
|
$137
|
$170
|
$166
|
$206
|
$281
|
|||||
The graph covers the period from December 31, 2012 to
December 31, 2017
. Cumulative total returns are calculated assuming that $100 was invested on December 31, 2012, in our common stock, in the NASDAQ Composite Index, and in the NASDAQ-100 Technology Sector Index, and that all dividends, if any, were reinvested. Stockholder returns over the indicated period should not be considered indicative of future stock prices or stockholder returns.
22
The consolidated selected balance sheet data as of
December 31, 2017 and 2016
and the consolidated selected statements of operations data for the years ended
December 31, 2017, 2016 and 2015
set forth below have been derived from our audited consolidated financial statements included elsewhere herein, and should be read in conjunction with those financial statements (including notes thereto). The consolidated selected balance sheet data as of December 31, 2015, 2014 and 2013 and the consolidated selected statements of operations data for the years ended December 31, 2014 and 2013 have been derived from audited consolidated financial statements not included herein, but which were previously filed with the SEC.
(In thousands, except share and per share data)
|
|
For the Years Ended December 31,
|
|||||||||||||||||||
|
|
2017
|
2016
|
2015
|
2014
|
2013
|
|||||||||||||||
|
Revenues
|
$
|
65,402
|
|
$
|
152,699
|
|
$
|
125,037
|
|
$
|
130,876
|
|
$
|
130,556
|
|
|||||
|
Inventor royalties and contingent legal fees expense
|
21,634
|
|
49,204
|
|
34,631
|
|
44,233
|
|
54,508
|
|
||||||||||
|
Litigation and licensing expenses - patents
|
18,219
|
|
27,858
|
|
39,373
|
|
37,614
|
|
39,335
|
|
||||||||||
|
Amortization of patents
|
22,154
|
|
34,208
|
|
53,067
|
|
53,745
|
|
49,039
|
|
||||||||||
|
General and administrative expenses (excluding non-cash stock compensation expense)
|
17,145
|
|
23,857
|
|
27,128
|
|
30,439
|
|
31,335
|
|
||||||||||
|
Non-cash stock compensation expense (included in G&A in the statements of operations)
|
8,885
|
|
9,062
|
|
11,048
|
|
18,115
|
|
27,894
|
|
||||||||||
|
Other expenses - business development
|
1,189
|
|
3,079
|
|
3,391
|
|
3,840
|
|
3,251
|
|
||||||||||
|
Impairment of patent-related intangible assets
|
2,248
|
|
42,340
|
|
74,731
|
|
3,497
|
|
4,619
|
|
||||||||||
|
Impairment of goodwill
|
—
|
|
—
|
|
30,149
|
|
—
|
|
—
|
|
||||||||||
|
Other
|
1,200
|
|
500
|
|
4,141
|
|
1,548
|
|
3,506
|
|
||||||||||
|
Operating loss
|
(27,272
|
)
|
(37,409
|
)
|
(152,622
|
)
|
(62,155
|
)
|
(82,931
|
)
|
||||||||||
|
Other income (expense)
|
51,911
|
|
798
|
|
(56
|
)
|
(595
|
)
|
2,131
|
|
||||||||||
|
Income (loss) before (provision for) benefit from income taxes
|
24,639
|
|
(36,611
|
)
|
(152,678
|
)
|
(62,750
|
)
|
(80,800
|
)
|
||||||||||
|
(Provision for) benefit from income taxes
|
(2,955
|
)
|
(18,188
|
)
|
(4,800
|
)
|
(3,912
|
)
|
21,958
|
|
||||||||||
|
Net income (loss) including noncontrolling interests in subsidiaries
|
$
|
21,684
|
|
$
|
(54,799
|
)
|
$
|
(157,478
|
)
|
$
|
(66,662
|
)
|
$
|
(58,842
|
)
|
|||||
|
Net income (loss) attributable to Acacia Research Corporation
|
$
|
22,180
|
|
$
|
(54,067
|
)
|
$
|
(160,036
|
)
|
$
|
(66,029
|
)
|
$
|
(56,434
|
)
|
|||||
|
Diluted income (loss) per common share
|
$
|
0.44
|
|
$
|
(1.08
|
)
|
$
|
(3.25
|
)
|
$
|
(1.37
|
)
|
$
|
(1.18
|
)
|
|||||
|
Cash dividends declared per common share
|
$
|
—
|
|
$
|
—
|
|
$
|
0.50
|
|
$
|
0.50
|
|
$
|
0.375
|
|
|||||
|
|
At December 31,
|
|||||||||||||||||||
|
|
2017
|
2016
|
2015
|
2014
|
2013
|
|||||||||||||||
|
Cash and cash equivalents, restricted cash and investments
|
$
|
136,604
|
|
$
|
158,495
|
|
$
|
145,948
|
|
$
|
193,024
|
|
$
|
256,702
|
|
|||||
|
Investment at fair value
|
104,754
|
|
—
|
|
—
|
|
—
|
|
—
|
|
||||||||||
|
Patents, net of accumulated amortization
|
61,917
|
|
86,319
|
|
162,642
|
|
286,636
|
|
288,432
|
|
||||||||||
|
Goodwill
|
—
|
|
—
|
|
—
|
|
30,149
|
|
30,149
|
|
||||||||||
|
Total assets
|
308,768
|
|
296,003
|
|
347,901
|
|
536,348
|
|
593,393
|
|
||||||||||
|
Total liabilities
|
13,109
|
|
28,560
|
|
33,746
|
|
47,300
|
|
31,195
|
|
||||||||||
|
Noncontrolling interests in operating subsidiaries
|
1,358
|
|
1,854
|
|
3,944
|
|
5,491
|
|
6,488
|
|
||||||||||
|
Acacia Research Corporation stockholders’ equity
|
294,301
|
|
265,589
|
|
310,211
|
|
483,557
|
|
555,710
|
|
||||||||||
23
Factors Affecting Comparability:
|
•
|
Investments at fair value.
Our equity investment in Veritone is recorded at fair value at each balance sheet date, with changes in fair value reflected in the statements of operations. Results for the year ended
December 31, 2017
included a net unrealized gain (included in other income (expense) in our consolidated statements of operations and in the table above) on our equity investment in Veritone totaling
$49.5 million
, comprised of an unrealized gain on conversion of our Veritone loans to equity of
$2.7 million
and an unrealized gain on the exercise of our Primary Warrant of
$4.6 million
, both as of May 2017, and an unrealized gain related to the change in fair value of our equity investment in Veritone through
December 31, 2017
of
$42.2 million
. Refer to Note
7
to the consolidated financial statements elsewhere herein for additional information regarding the impact of our equity investment in Veritone.
|
|
•
|
Litigation and licensing expenses - patents
. Litigation and licensing expenses-patents fluctuate from period to period based on patent enforcement and prosecution activity associated with ongoing licensing and enforcement programs and the timing of the commencement of new licensing and enforcement programs in each period. The trend of declining litigation and licensing expenses-patents reflects an overall decrease in portfolio related enforcement activities over the applicable periods.
Refer to “
Investments in Patent Portfolios” below for additional information regarding the impact of portfolio acquisition trends on licensing and enforcement activities and current and future licensing and enforcement related revenues.
|
|
•
|
Non-cash stock compensation expense.
In February 2017, AIP Operation LLC, or AIP, an indirect subsidiary of ours, adopted a Profits Interests Plan, or the Profits Interests Plan, that provides for the grant of AIP membership interests to certain members of management and the Board of Directors of Acacia Research Corporation as compensation for services rendered. The membership interests are represented by units, or the Units, reserved for the issuance of awards under the Profits Interests Plan. As of
December 31, 2017
, AIP holds the Veritone 10% Warrant described at Note
10
. The fair value of the Units totaled
$3.0 million
as of
December 31, 2017
and is classified as a liability in our consolidated balance sheet, with the corresponding compensation charge included in non-cash general and administrative expenses in the statement of operations for the year ended December 31, 2017.
|
|
•
|
Impairment of patent related intangible assets.
The impairment charges for the periods presented reflect the impact of reductions in expected estimated future net cash flows for certain portfolios due to adverse legal outcomes, conclusion of the related licensing and enforcement programs and /or certain patent portfolios that management determined it would no longer allocate resources to in future periods. The impairment charges consisted of the excess of the asset’s carrying value over its estimated fair value as of the applicable measurement date.
|
|
•
|
Goodwill.
We conducted an annual goodwill impairment test as of December 31, 2015. Based upon the difference between the implied fair value of goodwill and the historical carrying value of goodwill, due primarily to the sustained decline in the Company’s stock price and adverse litigation outcomes in the fourth quarter of 2015, we recognized a goodwill impairment charge totaling $30.1 million. Refer to “Critical Accounting Policies” below for additional information.
|
24
The following discussion should be read in conjunction with our consolidated financial statements included elsewhere in this Annual Report on Form 10-K. This discussion contains forward-looking statements that involve risks and uncertainties. Our actual results could differ materially from those anticipated in these forward-looking statements as a result of various factors including the risks we discuss in Item 1A, “Risk Factors,” and elsewhere herein.
General
We invest in, license and enforce patented technologies. We partner with inventors and patent owners, applying our legal and technology expertise to patent assets to unlock the financial value in their patented inventions. We generate revenues and related cash flows from the granting of patent rights for the use of patented technologies that our operating subsidiaries control or own. We assist patent owners with the prosecution and development of their patent portfolios, the protection of their patented inventions from unauthorized use, the generation of licensing revenue from users of their patented technologies and, where necessary, with the enforcement against unauthorized users of their patented technologies through the filing of patent infringement litigation. We are principals in the licensing and enforcement effort, obtaining control of the rights in the patent portfolio, or control of the patent portfolio outright.
We have a proven track record of licensing and enforcement success with over
1,550
license agreements executed to date, across
193
patent portfolio licensing and enforcement programs. Currently, on a consolidated basis, our operating subsidiaries own or control the rights to multiple patent portfolios, which include U.S. patents and certain foreign counterparts, covering technologies used in a variety of industries. To date, we have generated gross licensing revenue of approximately
$1.4 billion
, and have returned more than
$731 million
to our patent partners.
We also identify opportunities to partner with high-growth and potentially disruptive technology companies. We leverage our experience, expertise, data and relationships developed as a leader in the IP industry to pursue these opportunities. In some cases, these opportunities will complement, and/or supplement our primary licensing and enforcement business.
Our business is described more fully in Item 1. “Business,” of this annual report.
Executive Overview
For the years ended December 31, 2017, 2016 and 2015 we reported revenues of
$65.4 million
,
$152.7 million
and
$125.0 million
, respectively. Cash and short-term investments totaled
$136.6 million
as of
December 31, 2017
, as compared to
$158.5 million
as of
December 31, 2016
. Our operating activities during the periods presented were focused on the continued operation of our patent licensing and enforcement business, including the continued pursuit of our ongoing patent licensing and enforcement programs. During 2017 and 2016, we also focused on cost reduction and optimization efforts, including reductions in headcount, renegotiation of certain existing arrangements, termination of certain patent licensing programs to maximize resource allocation, and reducing facilities costs.
We continue to experience challenges in the existing patent and licensing environment, including challenges in identifying and acquiring new high-quality patent assets as discussed below. Despite these challenges, we will continue to invest in and monetize our existing quality patent assets.
Our team’s expertise in identifying and evaluating complex IP, and in developing and cultivating long-term business relationships, provides us a unique window into innovation and technological advancement. We are increasing our efforts to leverage our expertise and experience to create new avenues which we believe will lead to increased shareholder value. In this regard, and in addition to monetizing our existing IP assets, we will increase our focus on opportunities to partner with high-growth and potentially disruptive technology companies. We will leverage our experience, expertise, data and relationships developed as a leader in the IP industry to pursue these opportunities. Examples of some of these technology areas include Artificial Intelligence, or AI, and machine learning, machine vision, robotics and blockchain technologies. Examples of our initial execution of this strategy are our partnerships with Veritone, Inc., or Veritone (Nasdaq: VERI), and Miso Robotics, Inc., or Miso Robotics, described below.
Enforcement Activities.
In March 2017, our subsidiary, Saint Lawrence Communications, LLC, or Saint Lawrence, received a jury verdict in its case against Motorola, Inc. in the United States District Court for the Eastern District of Texas, or District Court. The jury returned a verdict that five U.S. patents were valid and infringed. The jury found that the infringement
25
was willful and returned a damages award of nearly $9.2 million for past infringement. The District Court is currently considering Saint Lawrence’s post-trial motion for and attorneys’ fees as well as post-trial motions from Motorola. We are awaiting issue of the final judgment by the District Court in this matter, after which appeals may be filed. In addition, our German subsidiary, Saint Lawrence Communications GmbH, was granted injunctions by the German court in enforcement proceedings against Motorola, Inc., which injunctions have been appealed by Motorola. The Motorola actions have not yet concluded, and hence, no revenues have been recognized in the statements of operations related to these specific Motorola actions.
During the second quarter of 2017, Saint Lawrence resolved its enforcement actions against ZTE including the U.S. lawsuit. In February 2018, Saint Lawrence and Saint Lawrence Communications GmbH entered into an agreement with Apple Inc. to resolve all outstanding litigation.
As previously reported, in September 2016, our subsidiary Cellular Communications Equipment LLC, or CCE, received a jury verdict of infringement by Apple, Inc. In the third quarter of 2017, CCE entered into an agreement with Apple Inc. to resolve the patent litigation.
Partnerships.
We may from time to time evaluate other business opportunities which complement, or supplement, our primary licensing and enforcement business and leverage our intellectual property expertise. For example, in June 2017, we partnered with Miso Robotics, an innovative leader in robotics and AI solutions, which included an equity investment totaling $2.25 million, as part of Miso Robotics’ closing of $3.1 million in Series A funding. In addition, in February 2018, we made an additional strategic equity investment totaling $6.0 million in the Series B financing round for Miso Robotics. Miso Robotics will use the capital to expand its suite of collaborative, adaptable robotic kitchen assistants and to broaden applications for Miso AI, the company’s machine learning cloud platform. In addition, we also entered into an IP services agreement with Miso Robotics to help the company drive AI-based solutions for the entire restaurant industry. Our partnership with Miso Robotics represents our second partnership with companies seeking to transform the marketplace through Artificial Intelligence.
In August 2016, we announced the formation of a partnership with Veritone, a leading cloud-based Artificial Intelligence technology company that is pioneering next generation search and analytics through their proprietary Cognitive Media Platform™. Under the partnership, we have the ability to leverage our intellectual property expertise to assist Veritone with building its patent portfolio and executing upon its overall intellectual property strategy. In order to enhance Veritone’s leadership position in the field of machine learning and AI, we provided a total of
$53.3 million
in funding to Veritone pursuant to an investment agreement executed in August 2016, as amended.
Upon Veritone’s consummation of its IPO, our loans and accrued interest were automatically converted into 1,969,186 shares of Veritone common stock. In addition, Acacia exercised its Primary Warrant, acquiring 2,150,335 shares of Veritone common stock. Following the automatic exercise of our Primary Warrant, Veritone issued to us an additional warrant, or the 10% Warrant, that provides for the issuance of additional shares of common stock of Veritone at an exercise price per share of $13.6088 per share, with 50% of the shares underlying the 10% Warrant vesting as of the issuance date and the remaining 50% of the shares vesting on the first anniversary of the issuance date. Results for the year ended December 31, 2017 included a net unrealized investment gain on our equity investment in Veritone totaling
$49.5 million
, primarily related to the increase in Veritone’s stock price since the IPO and our related requirement to mark our Veritone investment to market at each balance sheet date. Our Veritone common shares were subject to a lock-up agreement that expired on February 15, 2018, subsequent to which the shares may be sold pursuant to Rule 144, subject to volume limitations and Rule 144 filing requirements, as well as other restrictions under applicable securities laws. Refer to Note
7
to the consolidated financial statements elsewhere herein for additional information regarding our partnership with Veritone.
We believe these partnerships will be synergistic with our overall business strategies.
Patent Portfolio Intake.
One of the significant challenges in our industry continues to be quality patent intake due to the challenges and complexity of the current patent environment. We acquired one portfolio during fiscal year 2017 from our partnership with Renesas Electronics of Japan.
With respect to our licensing, enforcement and overall business, neither we nor our operating subsidiaries invent new technologies or products; rather, we depend upon the identification and investment in patents, inventions and companies that own intellectual property through our relationships with inventors, universities, research institutions, technology companies and others. If our operating subsidiaries are unable to maintain those relationships and identify and grow new relationships, then we may not be able to identify new technology-based patent opportunities for sustainable revenue and /or revenue growth.
26
Our current or future relationships may not provide the volume or quality of technologies necessary to sustain our licensing, enforcement and overall business. In some cases, universities and other technology sources compete against us as they seek to develop and commercialize technologies. Universities may receive financing for basic research in exchange for the exclusive right to commercialize resulting inventions. These and other strategies employed by potential partners may reduce the number of technology sources and potential clients to whom we can market our solutions. If we are unable to maintain current relationships and sources of technology or to secure new relationships and sources of technology, such inability may have a material adverse effect on our revenues, operating results, financial condition and ability to maintain our licensing and enforcement business.
For example, we obtained control of only one, two and three new patent portfolios during fiscal years 2017, 2016 and 2015, respectively, compared to 6 new patent portfolios and 25 new patent portfolios in fiscal years 2014 and 2013, respectively. This decrease in our patent portfolio intake reflects in part our strategic decision in 2013 to shift the focus of our operating business to serving a smaller number of customers, each having higher quality patent portfolios. As a result, our gross number of patent portfolio acquisitions has decreased significantly. This decrease in our patent portfolio intake also reflects in part industry trends impacting our ability to acquire patent portfolios. For example, legislative and legal changes have increased the complexity of patent enforcement actions and may significantly affect the market availability of suitable patent portfolios for acquisition. As a result of these continuing industry trends, our recent and future patent portfolio intake has been and may continue to be negatively impacted, resulting in further decreases in future revenue generating opportunities, and continued negative adverse impacts on the sustainability of our licensing and enforcement business. We continue to experience significant adverse challenges with respect to our patent intake efforts, and if these adverse challenges continue, our licensing and enforcement revenues will continue to decline and we will be unable to profitably sustain our licensing and enforcement business going forward.
Operating activities during the periods presented included the following:
|
|
2017
|
|
2016
|
|
2015
|
||||||
|
|
|
|
|||||||||
|
Revenues (in thousands)
|
$
|
65,402
|
|
|
$
|
152,699
|
|
$
|
125,037
|
|
|
|
New agreements executed
|
20
|
|
|
39
|
|
63
|
|
||||
|
Licensing and enforcement programs generating revenues - during the respective period
|
13
|
|
|
28
|
|
30
|
|
||||
|
Licensing and enforcement programs with initial revenues
|
1
|
|
|
7
|
|
4
|
|
||||
|
New patent portfolios
|
1
|
|
|
2
|
|
3
|
|
||||
|
Year end cash, cash equivalents and short-term investments*
|
$
|
136,604
|
|
$
|
158,495
|
|
$
|
145,948
|
|
||
___________________________________
* Includes restricted cash (2016 and 2015 balances only)
Our revenues historically have fluctuated period to period, and can vary significantly, based on a number of factors including the following:
|
•
|
the dollar amount of agreements executed each period, which can be driven by the nature and characteristics of the technology or technologies being licensed and the magnitude of infringement associated with a specific licensee;
|
|
•
|
the specific terms and conditions of agreements executed each period including the nature and characteristics of rights granted, and the periods of infringement or term of use contemplated by the respective payments;
|
|
•
|
fluctuations in the total number of agreements executed each period;
|
|
•
|
the number of, timing, results and uncertainties associated with patent licensing negotiations, mediations, patent infringement actions, trial dates and other enforcement proceedings relating to our patent licensing and enforcement programs;
|
|
•
|
the relative maturity of licensing programs during the applicable periods;
|
|
•
|
other external factors, including the periodic status or results of ongoing negotiations, the status or results of ongoing litigations and appeals, actual or perceived shifts in the regulatory environment, impact of unrelated patent related judicial proceedings and other macroeconomic factors;
|
|
•
|
historically, based on the merits and strength of our operating subsidiary’s patent infringement claims and other factors, many prospective licensees have elected to settle significant patent infringement cases and pay reasonable license fees for the use of our patented technology, as those patent infringement cases approached a court determined trial date; and
|
27
|
•
|
fluctuations in overall patent portfolio related enforcement activities which are impacted by the portfolio intake challenges discussed above.
|
Our management does not attempt to manage for smooth sequential periodic growth in revenues period to period, and therefore, periodic results can be uneven. Unlike most operating businesses and industries, licensing revenues not generated in a current period are not necessarily foregone but, depending on whether negotiations, litigation or both continue into subsequent periods, and depending on a number of other factors, such potential revenues may be pushed into subsequent fiscal periods.
Summary of Results of Operations - For Fiscal Years
2017, 2016 and 2015
(In thousands, except percentage change values)
|
Fiscal Year
|
% Change
|
||||||||||||||||
|
|
2017
|
|
2016
|
2015
|
|
2017 vs. 2016
|
|
2016 vs. 2015
|
|||||||||
|
|
|
|
|
|
|||||||||||||
|
Revenues
|
$
|
65,402
|
|
|
$
|
152,699
|
|
$
|
125,037
|
|
|
(57
|
)%
|
|
22
|
%
|
|
|
Inventor royalties and contingent legal fees
|
21,634
|
|
49,204
|
|
34,631
|
|
(56
|
)%
|
|
42
|
%
|
||||||
|
Litigation and licensing expenses - patents
|
18,219
|
|
27,858
|
|
39,373
|
|
(35
|
)%
|
(29
|
)%
|
|||||||
|
Amortization expense
|
22,154
|
|
34,208
|
|
53,067
|
|
(35
|
)%
|
|
(36
|
)%
|
||||||
|
Impairment of patent-related intangible assets
|
2,248
|
|
42,340
|
|
74,731
|
|
(95
|
)%
|
|
(43
|
)%
|
||||||
|
Impairment of goodwill
|
—
|
|
—
|
|
30,149
|
|
—
|
%
|
|
(100
|
)%
|
||||||
|
Other operating costs and expenses
(1)
|
28,419
|
|
36,498
|
|
45,708
|
|
|
(22
|
)%
|
|
(20
|
)%
|
|||||
|
Operating loss
|
(27,272
|
)
|
(37,409
|
)
|
(152,622
|
)
|
(27
|
)%
|
|
(75
|
)%
|
||||||
|
Total other income (expense)
|
51,911
|
|
798
|
|
(56
|
)
|
*
|
|
|
*
|
|
||||||
|
Provision for income taxes
|
(2,955
|
)
|
(18,188
|
)
|
(4,800
|
)
|
(84
|
)%
|
279
|
%
|
|||||||
|
Net (income) loss attributable to noncontrolling interests in subsidiaries
|
496
|
|
|
732
|
|
(2,558
|
)
|
|
(32
|
)%
|
|
(129
|
)%
|
||||
|
Net income (loss) attributable to Acacia Research Corporation
|
22,180
|
|
|
(54,067
|
)
|
(160,036
|
)
|
|
(141
|
)%
|
|
(66
|
)%
|
||||
____________________________________
* Percentage change in excess of 300%
(1)
Includes non-cash stock compensation charges of
$8.9 million
,
$9.1 million
and
$11.0 million
in fiscal years
2017, 2016 and 2015
, respectively, included in General and administrative expense in the consolidated statements of operations.
Overview - Fiscal Year
2017
compared with Fiscal Year
2016
|
•
|
Revenues decreased
$87.3 million
, or
57%
to
$65.4 million
,
due primarily to a decrease in the number of agreements executed and a decrease in average revenue per
agreement. Refer to “
Investments in Patent Portfolios”
below for additional information regarding the impact of portfolio acquisition trends on current and future licensing and enforcement related revenues.
|
|
•
|
Income before provision for income taxes was
$24.6 million
for fiscal year 2017, as compared to a loss before provision for income taxes of
$36.6 million
for fiscal year 2016. The net change was primarily comprised of the change in revenues described above, a net
$49.5 million
unrealized gain on our equity investment in Veritone, a
$3.0 million
non-cash stock compensation charge for our Veritone related profits interest units and a net decrease in operating expenses, as follows:
|
|
•
|
Inventor royalties and contingent legal fees, on a combined basis, decreased
$27.6 million
, or
56%
, relatively consistent with the
57%
decrease in revenues in fiscal year 2017. Contingent legal fees decreased
$9.8 million
, or
37%
, due to an increase in average contingent legal fee rates for the portfolios generating revenues in fiscal year 2017. Inventor royalties decreased
$17.8 million
, or
78%
, primarily due to lower average inventor royalty rates for the portfolios generating revenues during fiscal year 2017.
|
|
•
|
Litigation and licensing expenses-patents decreased
$9.6 million
, or
35%
, to
$18.2 million
,
due primarily to a net decrease in litigation support and third-party technical consulting expenses associated with ongoing licensing and enforcement programs and an overall decrease in portfolio related enforcement activities.
Refer to “
Investments in
|
28
Patent Portfolios”
below for additional information regarding the impact of portfolio acquisition trends on licensing and enforcement activities and current and future licensing and enforcement related revenues.
|
•
|
Amortization expense decreased
$12.1 million
, or
35%
, to
$22.2 million
, due to a decrease in scheduled amortization resulting from patent portfolio impairment charges previously recorded in the second and fourth quarters of 2016, and no new patent portfolio acquisition costs incurred during fiscal year 2017.
|
|
•
|
Impairment of patent-related intangible asset charges decreased
$40.1 million
, or
95%
, to
$2.2 million
. Impairment charges reflect the impact of reductions in expected estimated future net cash flows for certain patent portfolios and/or the impairment of certain portfolios that management determined it would no longer allocate resources to in future periods.
|
|
•
|
General and administrative expenses decreased
$6.9 million
, or
21%
, to
$26.0 million
,
due primarily to a reduction in personnel costs in connection with headcount reductions in 2016 and 2017, a decrease in variable performance based compensation costs consistent with the decrease in revenues for the periods and a decrease in corporate, general and administrative costs.
|
Excluding profits interests related non-cash stock compensation, non-cash stock compensation expense decreased
$3.2 million
, or
36%
due primarily to the reduction in head count. Profits interests related non-cash stock compensation expense totaled
$3.0 million
, reflecting the December 31, 2017 fair value of our Veritone related profits interest units granted in February 2017.
|
•
|
Results for fiscal year 2017 included a net unrealized gain on our investment in Veritone totaling
$49.5 million
(included in other income (expense)), comprised of an unrealized gain on conversion of our Veritone loans to equity of
$2.7 million
and an unrealized gain on the exercise of our Primary Warrant of
$4.6 million
, both as of May 2017, and an unrealized gain related to the change in fair value of our equity investment in Veritone through
December 31, 2017
of
$42.2 million
.
|
|
•
|
Tax expense for fiscal years 2017 and 2016 primarily reflects the impact of state taxes and foreign withholding taxes incurred on revenue agreements executed with third-party licensees domiciled in foreign jurisdictions. Results for fiscal year 2017 included a significant unrealized gain on our investment in Veritone, which created a related deferred tax liability. The future anticipated reversal of this deferred tax liability provides for a source of taxable income that allows for the realizability of existing deferred tax assets that have been reduced by a valuation allowance for the periods presented. The effective tax rate reflects both the recognition of the deferred tax liability and the reversal of valuation allowance. See below for additional information.
|
Overview - Fiscal Year 2016 compared with Fiscal Year 2015
|
•
|
Revenues increased $27.7 million, or 22% to $152.7 million for fiscal year
2016, due to an increase in average revenue per agreement, which was partially offset by a decrease in the number of agreements executed.
|
|
•
|
Inventor royalties and contingent legal fees, on a combined basis, increased $14.6 million, or 42%, due primarily to the
22%
increase in revenues in fiscal year 2016, and a 4% increase in average contingent legal fee rates for the portfolios generating revenues in fiscal year 2016, as compared to the portfolios generating revenues in fiscal year 2015.
|
|
•
|
Litigation and licensing expenses-patents decreased $11.5 million, or 29%, to $27.9 million,
due primarily to a net decrease in litigation support and third-party technical consulting expenses associated with patent trials and ongoing licensing and enforcement programs.
|
|
•
|
Amortization expense decreased $18.9 million, or 36%, to $34.2 million, due to a decrease in scheduled amortization on existing patent portfolios resulting from various patent portfolio impairment charges previously recorded in the fourth quarter of 2015 and second quarter of 2016.
|
|
•
|
Impairment of patent-related intangible asset charges decreased $32.4 million, or 43%, to $42.3 million. Impairment charges reflect the impact of reductions in expected estimated future net cash flows for certain patent portfolios and certain patent portfolios that management determined it would no longer allocate resources to in future periods. The impairment charges consisted of the excess of the asset’s carrying value over its estimated fair value as of the applicable measurement date.
|
29
|
•
|
In the fourth quarter of fiscal 2015, we performed an impairment analysis of goodwill. Based upon the difference between the implied fair value of goodwill and the historical carrying value of goodwill, due primarily to the sustained decline in the Company’s stock price and adverse litigation outcomes occurring in the fourth quarter of 2015, we recognized a goodwill impairment charge totaling $30.1 million in the fourth quarter of 2015.
|
|
•
|
General and administrative expenses decreased $5.3 million, or 14%, to $32.9 million,
due primarily to a net decrease in personnel costs in connection with the net reduction in headcount during 2016 and 2015 and a net decrease in non-cash stock compensation expense.
|
|
•
|
Fiscal year 2016 and 2015 operating expenses included expenses for court ordered attorney fees totaling $500,000 and $4.1 million, respectively.
|
|
•
|
Tax expense for the periods presented reflects foreign taxes withheld on revenue agreements with licensees in foreign jurisdictions and other state taxes, and the impact of full valuation allowances recorded for net operating loss (2015 only) and foreign tax credit related tax assets generated during the periods. As such, no tax benefit was recognized for net operating loss and foreign tax credit related tax benefits generated during the applicable periods presented.
|
Revenues for the periods presented included fees from the following licensing and enforcement programs:
|
•
|
360 Degree View Technology
(3)
|
•
|
Oil and Gas Drilling technology
(2)
|
|
|
•
|
3G & 4G Cellular Air Interface and Infrastructure technology
(3)
|
•
|
Oil and Gas Production technology
(3)
|
|
|
•
|
4G Wireless technology
(2)(3)
|
•
|
Online Auction Guarantee technology
(1)(2)(3)
|
|
|
•
|
Audio Communications Fraud Detection technology
(2)(3)
|
•
|
Optical Networking technology
(1)(2)(3)
|
|
|
•
|
Automotive Safety, Navigation and Diagnostics technology
(3)
|
•
|
Optimized Microprocessor Operation technology
(3)
|
|
|
•
|
Bone Wedge technology
(1)(2)(3)
|
•
|
Reflective and Radiant Barrier Insulation technology
(2)(3)
|
|
|
•
|
Broadband Communications technology
(2)(3)
|
•
|
Semiconductor 3D Die Stacking technology
(2)
|
|
|
•
|
Cardiology and Vascular Device technology
(1)(2)(3)
|
•
|
Semiconductor Memory Circuit and Manufacturing Processes technology
(2)
|
|
|
•
|
Diamond and Gemstone Grading technology
(2)
|
•
|
Semiconductor and Memory-Related technology
(1)
|
|
|
•
|
DisplayPort and MIPI DSI technology
(1)(2)(3)
|
•
|
Semiconductor Testing technology
(3)
|
|
|
•
|
DRAM and Flash Memory technology
(2)
|
•
|
Shared Memory for Multimedia Processing
(1)(2)(3)
|
|
|
•
|
Electronic Access Control technology
(1)(3)
|
•
|
Speech codes used in wireless and wireline systems technology
(1)(2)(3)
|
|
|
•
|
Electronic spreadsheet, data analysis and software development technology
(2)
|
•
|
Spinning and Jousting Toy Game technology
(3)
|
|
|
•
|
Enhanced Mobile Communications technology
(3)
|
•
|
Super Resolutions Microscopy technology
(1)(2)(3)
|
|
|
•
|
Flash Memory technology
(2)
|
•
|
Surgical Access technology
(3)
|
|
|
•
|
Gas Modulation Control Systems technology
(2)(3)
|
•
|
Suture Anchors technology
(3)
|
|
|
•
|
High Speed Circuit Interconnect and Display Control technology
(2) (3)
|
•
|
Telematics technology
(2)(3)
|
|
|
•
|
Improved Lighting technology
(3)
|
•
|
Unicondylar Knee Replacement technology
(3)
|
|
|
•
|
Innovative Display technology
(1)(3)
|
•
|
Variable Data Printing technology
(2)
|
|
|
•
|
Intercarrier SMS technology
(3)
|
•
|
Video Analytics for Security technology
(3)
|
|
|
•
|
Interstitial and Pop-Up Internet Advertising technology
(2)(3)
|
•
|
Video Conferencing technology
(1)
|
|
|
•
|
Knee Replacement technology
(2)
|
•
|
Voice-Over-IP technology
(3)
|
|
|
•
|
Lighting Ballast technology
(2)
|
•
|
Wireless Data Synchronization & Data Transfer technology
(3)
|
|
|
•
|
Location Based Services technology
(3)
|
•
|
Wireless Infrastructure and User Equipment technology
(1)(2)(3)
|
|
|
•
|
Messaging technology
(3)
|
•
|
Wireless Location Based Services technology
(3)
|
|
|
•
|
Microprocessor and Memory technology
(2)(3)
|
•
|
Wireless Monitoring technology
(3)
|
|
|
•
|
Mobile Computer Synchronization technology
(3)
|
|||
______________________________________
|
(1)
|
Licensing and enforcement program generating revenue in 2017.
|
|
(2)
|
Licensing and enforcement program generating revenue in 2016.
|
|
(3)
|
Licensing and enforcement program generating revenue in 2015.
|
Revenues from one or more of our patents or patent portfolios may be significant in a specific reporting period, and may be significant to our licensing and enforcement business as a whole.
30
Patent Licensing and Enforcement
Patent Litigation Trial Dates and Related Trials
. As of the date of this report, our operating subsidiaries have approximately seven pending patent infringement cases with a scheduled trial date in the next twelve months. Patent infringement trials are components of our overall patent licensing process and are one of many factors that contribute to possible future revenue generating opportunities for us. Scheduled trial dates, as promulgated by the respective court, merely provide an indication of when, in future periods, the trials may occur according to the court’s scheduling calendar at a specific point in time. A court may change previously scheduled trial dates. In fact, courts often reschedule trial dates for various reasons that are unrelated to the underlying patent assets and typically for reasons that are beyond our control. While scheduled trial dates provide an indication of the timing of possible future revenue generating opportunities for us, the trials themselves and the immediately preceding periods represent the possible future revenue generating opportunities. These future opportunities can result in varying outcomes. In fact, it is difficult to predict the outcome of patent enforcement litigation at the trial level and outcomes can be unfavorable. It can be difficult to understand complex patented technologies, and as a result, this may lead to a higher rate of unfavorable litigation outcomes. Moreover, in the event of a favorable outcome, there is a higher rate of successful appeals in patent enforcement litigation than more standard business litigation. Such appeals are expensive and time consuming, resulting in increased costs and a potential for delayed or foregone revenue opportunities in the event of modification or reversal of favorable outcomes. Although we diligently pursue enforcement litigation, we cannot predict with reliability the decisions made by juries and trial courts. Please refer to Item 1A. “Risk Factors” for additional information regarding trials, patent litigation and related risks.
Litigation and Licensing Expense
. We expect patent-related legal expenses to continue to fluctuate from period to period based on the factors summarized herein, in connection with future trial dates, international enforcement, strategic patent portfolio prosecution and our current and future patent portfolio investment, prosecution, licensing and enforcement activities. The pursuit of enforcement actions in connection with our licensing and enforcement programs can involve certain risks and uncertainties, including the following:
|
•
|
Increases in patent-related legal expenses associated with patent infringement litigation, including, but not limited to, increases in costs billed by outside legal counsel for discovery, depositions, economic analyses, damages assessments, expert witnesses and other consultants, re-exam and i
nter partes review costs,
case-related audio/video presentations and other litigation support and administrative costs could increase our operating costs and decrease our profit generating opportunities;
|
|
•
|
Our patented technologies and enforcement actions are complex and, as a result, we may be required to appeal adverse decisions by trial courts in order to successfully enforce our patents. Moreover, such appeals may not be successful;
|
|
•
|
New legislation, regulations or rules related to enforcement actions, including any fee or cost shifting provisions, could significantly increase our operating costs and decrease our profit generating opportunities.
Increased focus on the growing number of patent-related lawsuits may result in legislative changes which increase our costs and related risks of asserting patent enforcement actions. For instance, the United States House of Representatives passed a bill that would require non-practicing entities that bring patent infringement lawsuits to pay legal costs of the defendants, if the lawsuits are unsuccessful and certain standards are not met;
|
|
•
|
Courts may rule that our subsidiaries have violated certain statutory, regulatory, federal, local or governing rules or standards by pursuing such enforcement actions, which may expose us and our operating subsidiaries to material liabilities, which could harm our operating results and our financial position;
|
|
•
|
The complexity of negotiations and potential magnitude of exposure for potential infringers associated with higher quality patent portfolios may lead to increased intervals of time between the filing of litigation and potential revenue events (i.e. markman dates, trial dates), which may lead to increased legal expenses, consistent with the higher revenue potential of such portfolios; and
|
|
•
|
Fluctuations in overall patent portfolio related enforcement activities which are impacted by the portfolio intake challenges discussed above could harm our operating results and our financial position.
|
Investments in Patent Portfolios
One of the significant challenges in our industry continues to be quality patent intake due to the challenges and complexity associated with the current patent environment. We acquired one portfolio during fiscal year 2017 from our
31
partnership with Renesas Electronics of Japan, compared to two new patent portfolios and
three
new patent portfolios in fiscal years 2016 and
2015
, respectively. There were no patent portfolio investment costs paid in fiscal year
2017
, compared to
$1.2 million
and
$19.5 million
in fiscal years
2016
and
2015
, respectively.
With respect to our licensing, enforcement and overall business, neither we nor our operating subsidiaries invent new technologies or products; rather, we depend upon the identification and investment in patents, inventions and companies that own intellectual property through our relationships with inventors, universities, research institutions, technology companies and others. If our operating subsidiaries are unable to maintain those relationships and identify and grow new relationships, then we may not be able to identify new technology-based patent opportunities for sustainable revenue and /or revenue growth.
Our current or future relationships may not provide the volume or quality of technologies necessary to sustain our licensing, enforcement and overall business. In some cases, universities and other technology sources compete against us as they seek to develop and commercialize technologies. Universities may receive financing for basic research in exchange for the exclusive right to commercialize resulting inventions. These and other strategies employed by potential partners may reduce the number of technology sources and potential clients to whom we can market our solutions. If we are unable to maintain current relationships and sources of technology or to secure new relationships and sources of technology, such inability may have a material adverse effect on our revenues, operating results, financial condition and ability to maintain our licensing and enforcement business.
For example, we obtained control of only one, two and three new patent portfolios during fiscal years 2017, 2016 and 2015, respectively, compared to 6 new patent portfolios and 25 new patent portfolios in fiscal years 2014 and 2013, respectively. This decrease in our patent portfolio intake reflects in part our strategic decision in 2013 to shift the focus of our operating business to serving a smaller number of customers, each having higher quality patent portfolios. As a result, our gross number of patent portfolio acquisitions has decreased significantly. This decrease in our patent portfolio intake also reflects in part industry trends impacting our ability to acquire patent portfolios. For example, legislative and legal changes have increased the complexity of patent enforcement actions and may significantly affect the market availability of suitable patent portfolios for acquisition. As a result of these continuing industry trends, our recent and future patent portfolio intake has been and may continue to be negatively impacted, resulting in further decreases in future revenue generating opportunities, and continued negative adverse impacts on the sustainability of our licensing and enforcement business. We continue to experience significant adverse challenges with respect to our patent intake efforts, and if these adverse challenges continue, our licensing and enforcement revenues will continue to decline and we will be unable to profitably sustain our licensing and enforcement business going forward.
Critical Accounting Policies
Our consolidated financial statements are prepared in conformity with accounting principles generally accepted in the United States of America. In preparing these financial statements, we make assumptions, judgments and estimates that can have a significant impact on amounts reported in our consolidated financial statements. We base our assumptions, judgments and estimates on historical experience and various other factors that we believe to be reasonable under the circumstances. Actual results could differ materially from these estimates under different assumptions or conditions. On a regular basis, we evaluate our assumptions, judgments and estimates and make changes accordingly.
We believe that, of the significant accounting policies discussed in Note
2
to our notes to consolidated financial statements, the following accounting policies require our most difficult, subjective or complex judgments:
|
•
|
revenue recognition;
|
|
•
|
stock-based compensation expense, including valuation of profits interests;
|
|
•
|
valuation of long-lived and intangible assets including goodwill;
|
|
•
|
valuation of investments; and
|
|
•
|
accounting for income taxes.
|
We discuss below the critical accounting assumptions, judgments and estimates associated with these policies. Historically, our assumptions, judgments and estimates relative to our critical accounting policies have not differed materially from actual results. For further information on our critical accounting policies, refer to Note
2
to the notes to consolidated financial statements included herein.
32
Revenue Recognition
As described below, significant management judgment must be made and used in connection with the revenue recognized in any accounting period. Material differences may result in the amount and timing of revenue recognized or deferred for any period, if management made different judgments.
Revenue is recognized when (i) persuasive evidence of an arrangement exists, (ii) all obligations have been performed pursuant to the terms of the agreement, (iii) amounts are fixed or determinable and (iv) collectibility of amounts is reasonably assured.
We make estimates and judgments when determining whether the collectibility of fees receivable from licensees is reasonably assured. We assess the collectibility of fees receivable based on a number of factors, including past transaction history and the credit-worthiness of licensees. If it is determined that collection is not reasonably assured, the fee is recognized when collectibility becomes reasonably assured, assuming all other revenue recognition criteria have been met, which is generally upon receipt of cash for transactions where collectibility may have been an issue. Management’s estimates regarding collectibility impact the actual revenues recognized each period and the timing of the recognition of revenues. Our assumptions and judgments regarding future collectibility could differ from actual events and thus materially impact our financial position and results of operations.
Generally, our agreements provide for the grant of the licenses, covenants-not-to-sue, releases, and other significant deliverables upon execution of the agreement, or upon receipt of the minimum upfront payment for term agreement renewals. As such, the earnings process is complete and revenue is recognized upon the execution of the agreement, when collectibility is reasonably assured, or upon receipt of the minimum upfront fee for term agreement renewals, and when all other revenue recognition criteria have been met.
Depending on the complexity of the underlying revenue arrangement and related terms and conditions, significant judgments, assumptions and estimates may be required to determine when substantial delivery of contract elements has occurred, whether any significant ongoing obligations exist subsequent to contract execution, whether amounts due are collectible and the appropriate period or periods in which, or during which, the completion of the earnings process occurs. Depending on the magnitude of specific revenue arrangements, if different judgments, assumptions and estimates are made regarding contracts executed in any specific period, our periodic financial results may be materially affected.
Our operating subsidiaries are responsible for the licensing and enforcement of their respective patented technologies and pursue third-parties that are utilizing their intellectual property without a license or who have under-reported the amount of royalties owed under a license agreement. As a result of these activities, from time to time, our operating subsidiaries may recognize revenues in a current period that relate to infringements by licensees that occurred in prior periods. These recoveries may cause revenues to be higher than expected during a particular reporting period and may not occur in subsequent periods. Differences between amounts initially recognized and amounts subsequently audited or reported as an adjustment to those amounts, are recognized in the period such adjustment is determined as a change in accounting estimate.
The economic terms of the inventor agreements, operating agreements and contingent legal fee arrangements associated with the patent portfolios owned or controlled by our operating subsidiaries, if any, including royalty rates, contingent fee rates and other terms, vary across the patent portfolios owned or controlled by our operating subsidiaries. Inventor royalties, noncontrolling interests and contingent legal fees expenses fluctuate period to period, based on the amount of revenues recognized each period, the terms and conditions of revenue agreements executed each period and the mix of specific patent portfolios with varying economic terms and obligations generating revenues each period. Inventor royalties, noncontrolling interests and contingent legal fees expenses will continue to fluctuate and may continue to vary significantly period to period, based primarily on these factors.
For fiscal years
2017, 2016 and 2015
, the majority of our revenue agreements provided for the payment to us of one-time, paid-up license fees in consideration for the grant of certain intellectual property rights for patented technology rights owned by our operating subsidiaries. These rights were primarily granted on a perpetual basis, extending until the expiration of the underlying patents. Pursuant to the terms of these agreements, our operating subsidiaries have no further obligation with respect to the grant of the non-exclusive licenses, covenants-not-to-sue, releases, and other deliverables, including no express or implied obligation on our operating subsidiaries’ part to maintain or upgrade the technology, or provide future support or services. The agreements provided for the grant of the licenses, covenants-not-to-sue, releases, and other significant deliverables upon execution of the agreement. As such, the earnings process was determined to be complete and revenue was recognized upon the execution of the agreements, when all other revenue recognition criteria were met. Historically, term
33
license agreements have not been a material component of our operating revenues, with the majority of license agreements being paid-up, perpetual license agreements.
Stock-based Compensation Expense
Equity Based Awards.
Stock-based compensation payments to employees and non-employee directors are recognized as expense in the statements of operations. The compensation cost for all stock-based awards is measured at the grant date, based on the fair value of the award (determined using a Black-Scholes option pricing model for stock options and intrinsic value on the date of grant for nonvested restricted stock), and is recognized as an expense over the employee’s requisite service period (generally the vesting period of the equity award). Determining the fair value of stock-based awards at the grant date requires significant estimates and judgments, including estimating the market price volatility of our common stock, future employee stock option exercise behavior and requisite service periods.
The FASB issued a new standard, effective January 1, 2017, that changes the accounting for certain aspects of share-based payments to employees, including allowing an employer to make an entity-wide accounting policy election to either estimate the number of awards that are expected to vest (current GAAP) or account for forfeitures when they occur. Effective January 1, 2017, we elected to account for forfeitures of awards as they occur. The prior standard required us to estimate the number of awards for which the requisite service period is expected to be rendered and base the accruals of compensation cost on the estimated number of awards that will vest. The adoption of this standard did not have a material impact on our consolidated financial statements.
During the year ended December 31, 2016, the Company granted stock options with market-based vesting conditions. The options with market-based vesting conditions vest based upon the Company achieving specified stock price targets over a four-year period. The effect of a market-based vesting condition is reflected in the estimate of the grant-date fair value of the options utilizing a Monte Carlo valuation technique. Compensation cost is recognized for an option with a market-based vesting condition provided that the requisite service is rendered, regardless of when, if ever, the market condition is satisfied. The service period for options with a market-based vesting condition is inferred from the application of the Monte Carlo valuation technique. The derived service period represents the duration of the median of the distribution of share price paths on which the market condition is satisfied. The duration is the period of time from the service inception date to the expected date of satisfaction, as determined from the valuation technique. Assumptions utilized in connection with the Monte Carlo valuation technique included: estimated risk-free interest rate of
.92%
; expected volatility of
55%
; and expected dividend yield of
0%
. The risk-free interest rate was determined based on the yields available on U.S. Treasury zero-coupon issues. The expected stock price volatility was determined using historical volatility. The expected dividend yield was based on expectations regarding dividend payments.
Profits Interests Units.
The fair value of the Units issued under our Veritone related Profits Interests Plan is estimated utilizing a Geometric Brownian Motion model, or GBM, which considers probable vesting dates and values for the applicable instruments (i.e. common stock and warrants related to Acacia’s Veritone investment described at Note
7
) underlying or associated with the Units. At the estimated end of the term of the underlying warrant, the model estimates the total proceeds from the hypothetical exercise of the warrant and estimates the value of the Units by allocating the proceeds based on the waterfall described in the terms of the underlying agreement. The value of the Units on a marketable basis is the average allocation across all GBM simulation paths discounted to the applicable valuation date using the risk-free rate. This estimated value is adjusted for an estimate of a discount for lack of marketability, or DLOM, using the Finnerty model, based on a security specific volatility calculated by changing Veritone’s common stock price by 1% and measuring the corresponding change in the value of the Units. For the year ended
December 31, 2017
, assumptions utilized in the GBM included a term of 4.4 years, stock price of $23.20, volatility of 50%, and risk free interest rates ranging from 1.76% to 2.40% for terms ranging from one to 10 years. The estimated DLOM utilized was 30%, based on assumptions including a term of approximately 4.4 years and a volatility of 85% for Veritone’s common stock. Volatility was estimated based on the historical volatilities of a set of comparable public companies, adjusted for leverage, over a term matching the term of the underlying warrant asset, which was approximately 4.4 years. A hypothetical 5% change in the estimated DLOM would result in a $217,000 change in the estimated fair value of the profits interest liability.
Valuation of Long-lived and Intangible Assets Including Goodwill
Patent Portfolio Impairment Testing.
We review long-lived assets and intangible assets for potential impairment annually (quarterly for patents) and when events or changes in circumstances indicate the carrying amount of an asset may not be recoverable. In the event the expected undiscounted future cash flows resulting from the use of the asset is less than the carrying amount of the asset, an impairment loss is recorded equal to the excess of the asset’s carrying value over its fair value. If an asset is determined to be impaired, the loss is measured based on quoted market prices in active markets, if available. If
34
quoted market prices are not available, the estimate of fair value is based on various valuation techniques, including a discounted value of estimated future cash flows.
For the fiscal year ended December 31, 2017, we recorded $2.2 million of patent portfolio impairment charges. For the fiscal year ended December 31, 2016, we recorded $42.3 million of patent portfolio impairment charges, primarily comprised of the write-off of the remaining carrying value of our Adaptix portfolio. The impairment charges were recorded in the periods due to adverse litigation outcomes, a reduction in expected estimated future net cash flows and certain patent portfolios that management determined it would no longer allocate future resources to in connection with the licensing and enforcement of such portfolios. The impairment charges consisted of the excess of the asset’s carrying value over its estimated fair value as of the applicable measurement date. Estimated fair value was determined based on estimates of future cash flows and estimates of probabilities of realization given adverse litigation outcomes and resource allocation decisions.
We performed an impairment analysis for our patents as of December 31, 2015, utilizing the assistance of a third-party valuation specialist, resulting in $74.7 million of patent portfolio impairment charges, for the following reasons:
|
•
|
In December 2015, we announced that our subsidiary Adaptix, Inc. received a jury verdict in its case against Alcatel Lucent USA, Inc., and others. The jury returned a verdict that the asserted claims of the applicable patent at issue were invalid and non-infringed. The Adaptix trial loss resulted in a reduction in estimated cash flows for the Adaptix portfolio expected to be realized from future licensing and enforcement activities, leading to impairment charges on the portfolio in the fourth quarter of 2015.
|
|
•
|
Management considered the impact of the fourth quarter 2015 adverse trial outcomes on our estimates of future cash flows that could be realized from future licensing and enforcement activities for other patent portfolios. Estimates of future cash flows for certain portfolios were reduced in part, in connection with our assessment of probabilities of realization given the recent adverse trial outcomes.
|
|
•
|
Patent impairment charges include the carrying value of other patent portfolios for which, in the fourth quarter of 2015, we experienced adverse litigation or trial outcomes, leading to a reduction in or elimination of expected future cash flows. In addition, headcount reductions and internal staff optimization efforts led to changes with respect to which patent portfolios we intend to allocate licensing and enforcement resources to in future periods. As such, certain portfolio programs were selected for termination due to a decision to no longer pursue or allocate resources, resulting in a write-off of any remaining carrying value in the fourth quarter of 2015.
|
Goodwill Impairment Testing - December 31, 2015
. At December 31, 2015, prior to the completion of the annual goodwill impairment test, the goodwill balance totaled $30.1 million. Goodwill is tested for impairment at our single reporting unit level on an annual basis and between annual tests if an event occurs or circumstances change that would more likely than not reduce the fair value of a reporting unit below its carrying value. Factors considered important, which could trigger an impairment review, include the following:
|
•
|
significant consistent gradual decline in the our stock price for a sustained period;
|
|
•
|
significant underperformance relative to expected historical or projected future operating results;
|
|
•
|
significant changes in the manner of use of assets or the strategy for our overall business;
|
|
•
|
significant negative industry or economic trends; and
|
|
•
|
significant adverse changes in legal factors or in the business climate, including adverse regulatory actions or assessments.
|
We consider our market capitalization and other valuation techniques, as applicable, when estimating fair value for goodwill impairment testing purposes. When conducting annual and interim goodwill impairment assessments, we initially perform a qualitative evaluation (considering factors described above as applicable) of whether it is more likely than not that goodwill is impaired. If it is determined by a qualitative evaluation that it is more likely than not that goodwill is impaired, we apply a two-step impairment. The two-step impairment test first compares the estimated fair value of our single reporting unit to its carrying or book value. If the estimated fair value of the reporting unit exceeds its carrying value, goodwill is not impaired and there is no requirement to perform further testing. If the carrying value of the reporting unit exceeds its estimated fair value, we are required to perform step-two of the impairment analysis to determine the estimated implied fair value of the reporting unit’s goodwill, and if the carrying value of the reporting unit’s goodwill exceeds its estimated implied fair value, then an impairment loss equal to the difference is recorded in the consolidated statements of operations.
In connection with our annual goodwill impairment testing for 2015, we identified several qualitative factors triggering an impairment test at December 31, 2015, as follows;
35
|
•
|
Adverse legal outcomes and changes in legal factors
. In December 2015, we announced that our subsidiary Adaptix, Inc. received a jury verdict in its case against Alcatel Lucent USA, et al., deciding that the claims of the applicable patent in suit were invalid and non-infringed. This adverse legal outcome and others in the fourth quarter of 2015 resulted in changes in estimates of realization related to litigation outcomes in future periods for certain patent portfolios.
|
|
•
|
Consistent gradual decline in the Company’s stock price
: Historically, our stock price has been volatile, and the volatility continued during fiscal 2015, declining from $16.72 as of January 2, 2015, to $4.29 as of December 31, 2015, a 74% decline. In addition, subsequent to December 31, 2015, our stock price volatility has continued, trending downward to $3.16 as of February 29, 2016. In the fourth quarter of 2015, given the continued decline in stock price up through December 31, 2015, and the impact of the December 2015 adverse trial outcomes noted above, the gradual consistent decline in our stock price was deemed to be sustained, and hence indicative of a reduction in the estimated fair value of our company, as reflected in our lower overall market capitalization.
|
|
•
|
Changes in Company Management and Resource Allocations
. In connection with certain resource allocation changes within the organization due to changes in our management in the fourth quarter of 2015, headcount reductions and internal staff optimization efforts occurred, which led to changes with respect to estimates of which patent portfolios we intend to continue to allocate licensing and enforcement resources to in future periods. As such, certain patent portfolio programs were selected for termination due to our decision to no longer allocate resources to those programs. In addition, we made changes in estimates regarding the best and highest use of certain patent portfolios, resulting in reductions in estimated future cash flows.
|
At December 31, 2015, we utilized the following methods and assumptions in our annual goodwill impairment testing, which was prepared with the assistance of a third-party valuation specialist:
|
•
|
At December 31, 2015, the initial qualitative assessment included consideration of the factors described above, resulting in a conclusion that as of December 31, 2015, the consistent gradual decline in our stock price was sustained. We also considered the impact of the December 2015 adverse trial outcomes on our stock price and related estimates of fair value for remaining portfolio opportunities. Based on our assessment of these factors, we determined that it was more likely than not that goodwill was impaired, constituting a triggering event requiring a goodwill impairment test as of December 31, 2015.
|
|
•
|
We conducted the first step of the goodwill impairment test for our single reporting unit as of December 31, 2015. We utilized the market capitalization plus cost synergies approach to estimate the fair value of the Company. The estimated market capitalization was determined by multiplying our stock price and the common shares outstanding as of December 31, 2015. Management also considered a control premium in its estimate of fair value for our single reporting unit. The cost synergies were estimated based on the cost savings which could be achieved if the Company was acquired by a competitor in the same operating business.
|
|
•
|
Based on the analysis utilizing the market capitalization plus cost synergies approach, the estimated fair value of the reporting unit of $252 million was below its carrying value of $344.3 million as of December 31, 2015, and therefore, goodwill was determined to be more likely than not, impaired.
|
|
•
|
The purpose of step 2 of the analysis was to determine the estimated fair value of the assets and liabilities of our reporting unit, in order to determine the implied fair value of goodwill for the reporting unit. The excess, if any, of the fair value of a reporting unit over the amounts assigned to its assets and liabilities is the implied fair value of goodwill. Based upon the analysis performed, the fair value of our reporting unit did not exceed the amounts assigned to our reporting unit assets and liabilities, resulting in a difference between the implied fair value of goodwill of zero and the historical carrying value of goodwill. As a result, we recognized a goodwill impairment charge totaling $30.1 million in the fourth quarter of 2015.
|
Valuation of Investments
Equity investments without readily determinable fair values, in companies over which we have the ability to exercise significant influence, are accounted for using the equity method of accounting and classified within “Investments - equity method” in the consolidated balance sheet. We include our proportionate share of earnings and/or losses of our equity method investees in “Equity in earnings (losses) of investee” in our consolidated statements of operations.
36
We may elect to account for equity investments in companies with readily determinable fair values, where our investment gives us the ability to exercise significant influence over the operating and financial policies of the investee, at fair value. If the fair value option is applied to an investment that would otherwise be accounted for under the equity method of accounting, it is applied to all of the financial interests in the same entity that are eligible items (i.e. common stock and warrants). Refer to Note
7
for information regarding our investment in Veritone.
Determination of whether we possess the ability to exercise significant influence requires significant judgment, including consideration of the extent to which our voting interests, board representation, financial arrangements and other factors provide us with the ability to exercise significant influence with respect to an investee. A change in facts or judgments resulting in the determination that control exists would result in consolidation of the investment and recognition of related revenues and expenses with a corresponding non-controlling interest.
U.S. GAAP defines fair value as the price that would be received for an asset or the exit price that would be paid to transfer a liability in the principal or most advantageous market in an orderly transaction between market participants on the measurement date, and also establishes a fair value hierarchy which requires an entity to maximize the use of observable inputs, where available. The three-level hierarchy of valuation techniques established to measure fair value includes: Level 1 - Observable Inputs; Level 2 - Pricing Models with Significant Observable Inputs; and Level 3 - Unobservable Inputs. Refer to Note 2 to the consolidated financial statements elsewhere herein for additional information.
Whenever possible, we are required to use observable market inputs (Level 1 - quoted market prices) when measuring fair value. Our Veritone common stock is reported at fair value, based on the applicable NASDAQ Global Select Market stock price as of the applicable valuation date, as adjusted for an estimated DLOM associated with the restricted nature of the common shares acquired (Level 3 input). Our Veritone warrants are recorded at fair value, as adjusted for an estimated DLOM, based on the Black-Scholes option-pricing model, utilizing the following assumptions: risk-free interest rates ranging from 1.94% to 2.37%; expected terms ranging from 3 to 9 years; volatilities ranging from 45% to 55%; and a dividend yield of zero.
The DLOM for our Veritone common stock and warrants was estimated utilizing a Finnerty model with the following results and assumptions:
|
Veritone Common Stock
|
Veritone Warrants
|
|||||||
|
IPO Date
|
December 31, 2017
|
IPO Date
|
December 31, 2017
|
|||||
|
Estimated DLOM applied
|
5.7%
|
5%
|
5.7%
|
10%
|
||||
|
Volatility assumptions
|
35%
|
37%
|
35%
|
72% - 87%
|
||||
|
Term assumptions
|
6 months
|
2 months
|
6 months
|
5 months
|
||||
A one percent increase in the DLOM assumptions utilized at all applicable valuation dates would result in a $1.1million decrease in the fair value of our investment in Veritone at
December 31, 2017
, and a corresponding decrease in the net unrealized investment gain reflected in the consolidated statements of operations for the year ended
December 31, 2017
.
We review investments quarterly for indicators of other-than-temporary impairment. This determination requires significant judgment. In making this judgment, we consider available quantitative and qualitative evidence in evaluating potential impairment of our investments. If the cost of an investment exceeds its fair value, we evaluate, among other factors, general market conditions and the duration and extent to which the fair value is less than cost. We also consider specific adverse conditions related to the financial health of and business outlook for the investee, including industry and sector performance, changes in technology, and operational and financing cash flow factors. Once a decline in fair value is determined to be other-than-temporary, an impairment charge is recorded to other income (expense) and a new cost basis in the investment is established. If market, industry, and/or investee conditions deteriorate, we may incur future impairments.
Accounting for Income Taxes
As part of the process of preparing our consolidated financial statements, we are required to estimate our income taxes in each of the jurisdictions in which we operate. This process involves the estimating of our actual current tax exposure together with assessing temporary differences resulting from differing treatment of items. These differences result in deferred tax assets and liabilities, which are included within our consolidated balance sheets. We must then assess the likelihood that our deferred tax assets will be recovered from future taxable income and to the extent we believe that recovery is not likely, we must establish a valuation allowance. To the extent we establish a valuation allowance or increase this allowance in a period, we must include an expense within the tax provision in the consolidated statements of operations.
37
Significant management judgment is required in determining our provision for income taxes, our deferred tax assets and liabilities and our valuation allowance. Due to uncertainties related to our ability to utilize certain deferred tax assets in future periods, we have recorded a full valuation allowance against our net deferred tax assets as of December 31, 2017, 2016 and 2015. These assets primarily consist of foreign tax credits, capital loss carryforwards and net operating loss carryforwards.
In assessing the need for a valuation allowance, management has considered both the positive and negative evidence available, including but not limited to, estimates of future taxable income and related probabilities, estimates surrounding the character of future income and the timing of realization, consideration of the period over which our deferred tax assets may be recoverable, our recent history of net income and prior history of losses, projected future outcomes, industry and market trends and the nature of existing deferred tax assets. In management’s estimate, any positive indicators, including forecasts of potential future profitability of our businesses, are outweighed by the uncertainties surrounding our estimates and judgments of potential future taxable income, primarily due to uncertainties surrounding the timing of realization of future taxable income and the character of such income in particular future periods (i.e. foreign or domestic). In the event that actual results differ from these estimates or we adjust these estimates should we believe we would be able to realize these deferred tax assets in the future, an adjustment to the valuation allowance would increase income in the period such determination was made.
In 2017, 2016 and 2015, based on management’s assessment, a full valuation allowance was recorded against the company’s net deferred tax assets generated during the periods and the balances as of the end of each of the periods, due to uncertainty regarding future realization of such tax assets pursuant to guidance set forth in ASC 740, “Income Taxes.” In future periods, if we determine that the company will more likely than not be able to realize certain of these amounts, the applicable portion of the benefit from the release of the valuation allowance will generally be recognized in the statements of operations in the period the determination is recorded.
Any changes in the judgments, assumptions and estimates associated with our analysis of the need for a valuation allowance in any future periods could materially impact our financial position and results of operations in the periods in which those determinations are made.
Consolidated Results of Operations
Comparison of the Results of Operations for Fiscal Years
2017, 2016 and 2015
Revenues
|
2017 vs. 2016
|
2016 vs. 2015
|
|||||||||||||||||||||||||
|
|
2017
|
|
2016
|
|
2015
|
$ Change
|
% Change
|
$ Change
|
% Change
|
|||||||||||||||||
|
(in thousands, except percentage change values and number of agreements)
|
||||||||||||||||||||||||||
|
Revenues
|
$
|
65,402
|
|
|
$
|
152,699
|
|
$
|
125,037
|
|
$
|
(87,297
|
)
|
(57
|
)%
|
$
|
27,662
|
|
22
|
%
|
||||||
|
New revenue agreements executed
|
20
|
|
|
39
|
|
63
|
|
|||||||||||||||||||
|
Average revenue per agreement
|
$
|
3,270
|
|
$
|
3,915
|
|
$
|
1,985
|
|
|||||||||||||||||
A reconciliation of the change in revenues (based on average revenue per agreement) for the periods presented, in relation to the revenues reported for the comparable prior year period, is as follows:
|
2017 vs. 2016
|
2016 vs. 2015
|
|||||||
|
(in thousands)
|
||||||||
|
Decrease in number of agreements executed
|
$
|
(74,392
|
)
|
$
|
(47,633
|
)
|
||
|
Increase (decrease) in average revenue per agreement executed
|
(12,905
|
)
|
75,295
|
|
||||
|
Total
|
$
|
(87,297
|
)
|
$
|
27,662
|
|
||
Three licensees individually accounted for
54%
,
21%
and
10%
, respectively, of revenues recognized during the year ended
December 31, 2017
. Three licensees individually accounted for
26%
,
23%
and
11%
, respectively, of revenues recognized during the year ended
December 31, 2016
. Three licensees individually accounted for
24%
,
20%
and
16%
, respectively, of revenues recognized during the year ended
December 31, 2015
.
38
For the periods presented herein, the majority of the revenue agreements executed provided for the payment of one-time, paid-up license fees in consideration for the grant of certain intellectual property rights for patented technology rights owned by our operating subsidiaries. These rights were primarily granted on a perpetual basis, extending until the expiration of the underlying patents.
Refer to “
Investments in Patent Portfolios”
above for information regarding the impact of portfolio acquisition trends on current and future licensing and enforcement related revenues. We continue to experience significant adverse challenges with respect to our patent intake efforts, and if these adverse challenges continue, our licensing and enforcement revenues will continue to decline and we will be unable to profitably sustain our licensing and enforcement business going forward.
Net Income (Loss)
|
2017 vs. 2016
|
2016 vs. 2015
|
|||||||||||||||||||||||||
|
|
2017
|
|
2016
|
|
2015
|
$ Change
|
% Change
|
$ Change
|
% Change
|
|||||||||||||||||
|
(in thousands, except percentages)
|
||||||||||||||||||||||||||
|
Net income (loss) attributable to Acacia Research Corporation
|
$
|
22,180
|
|
$
|
(54,067
|
)
|
$
|
(160,036
|
)
|
$
|
76,247
|
|
(141
|
)%
|
$
|
105,969
|
|
(66
|
)%
|
|||||||
A reconciliation of the change in net income (loss) for the periods presented is as follows:
|
2017 vs. 2016
|
%
|
2016 vs. 2015
|
%
|
||||||||||
|
(in thousands, except percentage values)
|
|||||||||||||
|
Increase (decrease) in revenues
|
$
|
(87,297
|
)
|
(114
|
)%
|
$
|
27,662
|
|
26
|
%
|
|||
|
(Increase) decrease in inventor royalties and contingent legal fees combined
|
27,570
|
|
36
|
%
|
(14,573
|
)
|
(14
|
)%
|
|||||
|
Decrease in general and administrative expenses
|
6,889
|
|
9
|
%
|
5,257
|
|
5
|
%
|
|||||
|
Decrease in litigation and licensing expenses
|
9,639
|
|
13
|
%
|
11,515
|
|
11
|
%
|
|||||
|
Decrease in patent amortization expenses
|
12,054
|
|
16
|
%
|
18,859
|
|
18
|
%
|
|||||
|
Decrease in impairment of patent-related intangible assets
|
40,092
|
|
53
|
%
|
32,391
|
|
31
|
%
|
|||||
|
Decrease in impairment for goodwill
|
—
|
|
—
|
%
|
30,149
|
|
28
|
%
|
|||||
|
Change in provision for income taxes
|
15,233
|
|
20
|
%
|
(13,388
|
)
|
(13
|
)%
|
|||||
|
Unrealized gain and change in fair value of investment
|
49,526
|
|
65
|
%
|
—
|
|
—
|
%
|
|||||
|
Other
|
2,541
|
|
2
|
%
|
8,097
|
|
8
|
%
|
|||||
|
Net change in net income (loss)
|
$
|
76,247
|
|
100
|
%
|
$
|
105,969
|
|
100
|
%
|
|||
Cost of Revenues
|
2017 vs. 2016
|
2016 vs. 2015
|
||||||||||||||||||||||||
|
|
2017
|
2016
|
|
2015
|
$ Change
|
% Change
|
$ Change
|
% Change
|
|||||||||||||||||
|
(in thousands, except percentages)
|
|||||||||||||||||||||||||
|
Inventor royalties
|
$
|
4,952
|
|
$
|
22,730
|
|
$
|
18,462
|
|
$
|
(17,778
|
)
|
(78
|
)%
|
$
|
4,268
|
|
23
|
%
|
||||||
|
Contingent legal fees
|
16,682
|
|
26,474
|
|
16,169
|
|
(9,792
|
)
|
(37
|
)%
|
10,305
|
|
64
|
%
|
|||||||||||
|
Litigation and licensing expenses - patents
|
18,219
|
|
27,858
|
|
39,373
|
|
(9,639
|
)
|
(35
|
)%
|
(11,515
|
)
|
(29
|
)%
|
|||||||||||
|
Amortization of patents
|
22,154
|
|
34,208
|
|
53,067
|
|
(12,054
|
)
|
(35
|
)%
|
(18,859
|
)
|
(36
|
)%
|
|||||||||||
Inventor Royalties and Contingent Legal Fees Expense.
The economic terms of patent portfolio related partnering agreements and contingent legal fee arrangements, if any, including royalty obligations, if any, royalty rates, contingent fee rates and other terms and conditions, vary across the patent portfolios owned or controlled by our operating subsidiaries. In certain instances, we have invested in certain patent portfolios without future inventor royalty obligations. These costs fluctuate period to period, based on the amount of revenues recognized each period, the terms and conditions of revenue agreements executed each period and the mix of specific patent portfolios with varying economic terms, conditions and obligations generating revenues each period.
39
A summary of the main drivers of the change in inventor royalties expense and contingent legal fees expense, in relation to the change in total revenues, for the comparable periods presented, is as follows:
|
2017 vs. 2016
|
% of Prior Period Balance
|
2016 vs. 2015
|
% of Prior Period Balance
|
||||||||||
|
Inventor Royalties:
|
(in thousands, except percentage change values)
|
||||||||||||
|
Increase (decrease) in inventor royalty rates
|
$
|
(4,345
|
)
|
(19
|
)%
|
$
|
11,518
|
|
62
|
%
|
|||
|
Increase (decrease) in total revenues
|
(30,254
|
)
|
(133
|
)%
|
4,729
|
|
26
|
%
|
|||||
|
Decrease (increase) in revenues without inventor royalty obligations
|
16,821
|
|
74
|
%
|
(11,979
|
)
|
(65
|
)%
|
|||||
|
Total change - inventor royalties expense
|
$
|
(17,778
|
)
|
(78
|
)%
|
$
|
4,268
|
|
23
|
%
|
|||
|
2017 vs. 2016
|
% of Prior Period Balance
|
2016 vs. 2015
|
% of Prior Period Balance
|
||||||||||
|
Contingent Legal Fees:
|
(in thousands, except percentage change values)
|
||||||||||||
|
Increase in contingent legal fee rates
|
$
|
5,359
|
|
20
|
%
|
$
|
6,850
|
|
43
|
%
|
|||
|
Increase (decrease) in total revenues
|
(15,832
|
)
|
(60
|
)%
|
3,719
|
|
23
|
%
|
|||||
|
Decrease (increase) in revenues without contingent legal fee obligations
|
681
|
|
3
|
%
|
(264
|
)
|
(2
|
)%
|
|||||
|
Total change - contingent legal fees
|
$
|
(9,792
|
)
|
(37
|
)%
|
$
|
10,305
|
|
64
|
%
|
|||
Litigation and Licensing Expenses - Patents.
Litigation and licensing expenses-patents include patent-related litigation, enforcement and prosecution costs incurred by external patent attorneys engaged on an hourly basis and the out-of-pocket expenses incurred by law firms engaged on a contingent fee basis. Litigation and licensing expenses-patents also includes third-party patent research, development, prosecution,
re-exam and i
nter partes reviews, consulting, and other costs incurred in connection with the licensing and enforcement of patent portfolios.
Litigation and licensing expenses-patents decreased for the periods presented due to a net decrease in litigation support, patent prosecution and litigation expenses associated with ongoing licensing and enforcement programs and an overall decrease in portfolio related enforcement activities. We expect patent-related legal expenses to continue to decrease based upon the overall decrease in portfolio related enforcement activities as we continue monetizing our existing patent assets.
Refer to “
Investments in Patent Portfolios”
above for additional information regarding the impact of portfolio acquisition trends on licensing and enforcement activities and current and future licensing and enforcement related revenues.
Amortization of Patents
. The change in amortization expense for the comparable periods presented was due to the following:
|
2017 vs. 2016
|
2016 vs. 2015
|
||||||
|
(in thousands)
|
|||||||
|
Scheduled amortization related to patent portfolios owned or controlled as of the end of the prior year
|
$
|
(11,829
|
)
|
$
|
(18,704
|
)
|
|
|
Accelerated amortization related to recovery of upfront advances
|
(225
|
)
|
225
|
|
|||
|
Patent portfolio dispositions
|
—
|
|
(380
|
)
|
|||
|
Total change in patent amortization expense
|
$
|
(12,054
|
)
|
$
|
(18,859
|
)
|
|
Impairment Charges
|
2017 vs. 2016
|
2016 vs. 2015
|
||||||||||||||||||||||||
|
|
2017
|
2016
|
|
2015
|
$ Change
|
% Change
|
$ Change
|
% Change
|
|||||||||||||||||
|
(in thousands, except percentages)
|
|||||||||||||||||||||||||
|
Impairment of patent-related intangible assets
|
$
|
2,248
|
|
$
|
42,340
|
|
$
|
74,731
|
|
$
|
(40,092
|
)
|
(95
|
)%
|
$
|
(32,391
|
)
|
(43
|
)%
|
||||||
|
Impairment of goodwill
|
—
|
|
—
|
|
30,149
|
|
—
|
|
—
|
%
|
(30,149
|
)
|
(100
|
)%
|
|||||||||||
40
Patent Impairment Charges
Impairment charges for fiscal year 2017 primarily reflect reductions in expected estimated future net cash flows for certain patent portfolios that management determined it would no longer allocate resources to in future periods. Impairment charges for 2016 and 2015 reflect the impact of reductions in expected estimated future net cash flows for certain portfolios due to adverse litigation outcomes and certain patent portfolios that management determined it would no longer allocate licensing and enforcement resources to in future periods. Impairment charges for 2016 were primarily comprised of the write-off of the remaining carrying value of our Adaptix portfolio. Impairment charges consisted of the excess of the asset’s carrying value over its estimated fair value as of the applicable measurement date.
Impairment of Goodwill
We conducted an annual goodwill impairment test as of December 31, 2015. Based upon the difference between the implied fair value of goodwill and the historical carrying value of goodwill, due primarily to the sustained decline in our stock price and adverse litigation outcomes in the fourth quarter of 2015, we recognized a goodwill impairment charge totaling $30.1 million in the fourth quarter of 2015. Refer to “
Critical Accounting Policies”
elsewhere herein for additional information.
Operating Expenses
|
2017 vs. 2016
|
2016 vs. 2015
|
|||||||||||||||||||||||||
|
|
2017
|
|
2016
|
|
2015
|
$ Change
|
% Change
|
$ Change
|
% Change
|
|||||||||||||||||
|
(in thousands, except percentages)
|
||||||||||||||||||||||||||
|
General and administrative
|
$
|
17,145
|
|
$
|
23,857
|
|
$
|
27,128
|
|
$
|
(6,712
|
)
|
(28
|
)%
|
$
|
(3,271
|
)
|
(12
|
)%
|
|||||||
|
Non-cash stock compensation expense - G&A
|
5,844
|
|
9,062
|
|
11,048
|
|
(3,218
|
)
|
(36
|
)%
|
(1,986
|
)
|
(18
|
)%
|
||||||||||||
|
Non-cash stock compensation expense - Veritone Profits Interests
|
3,041
|
|
—
|
|
—
|
|
3,041
|
|
100
|
%
|
—
|
|
—
|
%
|
||||||||||||
|
Total general and administrative expenses
|
$
|
26,030
|
|
$
|
32,919
|
|
$
|
38,176
|
|
$
|
(6,889
|
)
|
(21
|
)%
|
$
|
(5,257
|
)
|
(14
|
)%
|
|||||||
|
Other expenses - business development
|
$
|
1,189
|
|
$
|
3,079
|
|
$
|
3,391
|
|
$
|
(1,890
|
)
|
(61
|
)%
|
$
|
(312
|
)
|
(9
|
)%
|
|||||||
General and Administrative Expenses.
General and administrative expenses include employee compensation and related personnel costs, including variable performance based compensation and non-cash stock compensation expenses, office and facilities costs, legal and accounting professional fees, public relations, marketing, stock administration, state taxes based on gross receipts and other corporate costs. A summary of the main drivers of the change in general and administrative expenses for the periods presented is as follows (in thousands):
|
2017 vs. 2016
|
2016 vs. 2015
|
||||||
|
(in thousands)
|
|||||||
|
Net change in personnel costs due to reductions in headcount
|
$
|
(3,162
|
)
|
$
|
(5,841
|
)
|
|
|
Variable performance-based compensation costs
|
(2,580
|
)
|
1,839
|
|
|||
|
Corporate, general and administrative costs
|
(1,821
|
)
|
1,594
|
|
|||
|
Non-cash stock compensation expense - general and administrative
(1)
|
(3,218
|
)
|
(1,986
|
)
|
|||
|
Non-cash stock compensation expense - Veritone related profits interests
(1)
|
3,041
|
|
—
|
|
|||
|
Employee severance costs
|
851
|
|
(863
|
)
|
|||
|
Total change in general and administrative expenses
|
$
|
(6,889
|
)
|
|
$
|
(5,257
|
)
|
_________________________________________________________________
(1) - Refer to Note
10
in the accompany consolidated financial statements
General and administrative non-cash stock compensation expense for fiscal year 2017, excluding profits interests related non-cash compensation, decreased due to reductions in headcount and a reduction in scheduled non-cash stock compensation expense related to options with market-based performance conditions with graded vesting features that resulted in higher non-cash stock compensation expense in 2016, as compared to 2017.
41
Profits interests are classified as liability awards, which are measured at fair value on the grant date and re-measured each reporting period at fair value until the award is settled. Compensation expense (included in “non-cash stock compensation expense - Veritone related profits interests” above) is adjusted each reporting period for increases or decreases in the estimated fair value, which is primarily impacted by changes in the fair value of the underlying Veritone common stock and warrants related to the liability. Upon vesting of the units, which occurred in September 2017, any previously unrecognized compensation expense was immediately recognized for any changes in fair value. The fair value of the Veritone related profits interests Units totaled
$3.0 million
as of
December 31, 2017
. Refer to Note
10
in the condensed consolidated financial statements elsewhere herein for additional information.
General and administrative non-cash stock compensation expense for fiscal year 2016 decreased due primarily to a decrease in the average grant date fair value for the shares expensed in the respective periods. The decrease was partially offset by an increase in fiscal year 2016 for non-cash stock compensation expense related to the grant of options with market-based vesting conditions with graded vesting features, resulting in higher non-cash stock compensation expense during the earlier stages of the applicable service period.
Research, Consulting and Other Expenses - Business Development
. Research, consulting and other expenses include third-party business development related research, consulting, and other costs incurred in connection with business development activities. These costs fluctuate period to period based on business development related activities in each period.
Other Operating Income (Expense)
Change in Fair Value of Investment, net.
Our equity investment in Veritone is recorded at fair value, and therefore, is marked to market at each balance sheet date. Results for fiscal year 2017 included a net unrealized gain on our equity investment in Veritone totaling
$49.5 million
, comprised of an unrealized gain on conversion of our Veritone loans to equity of
$2.7 million
and an unrealized gain on the exercise of our Primary Warrant of
$4.6 million
, both as of May 2017, and an unrealized gain related to the change in fair value of our equity investment in Veritone through
December 31, 2017
of
$42.2 million
.
Other.
Fiscal year 2017, 2016 and 2015 operating expenses included expenses for court ordered attorney fees and settlement and contingency accruals totaling
$1.2 million
,
$500,000
and
$4.1 million
, respectively.
Income Taxes
|
|
2017
|
|
2016
|
|
2015
|
||||||
|
Provision for income taxes (in thousands)
|
$
|
(2,955
|
)
|
|
$
|
(18,188
|
)
|
$
|
(4,800
|
)
|
|
|
Effective tax rate
|
(12
|
)%
|
50
|
%
|
3
|
%
|
|||||
Our effective tax rates for fiscal year
2017
, 2016 and 2015, were primarily comprised of foreign taxes withheld on revenue agreements with licensees in foreign jurisdictions, state taxes, and the impact of full valuation allowances recorded for net operating loss (2017 and 2015) and foreign tax credit related tax assets generated in those periods due to uncertainty regarding future realization. Foreign taxes withheld related to revenue agreements executed with third-party licensees domiciled in certain foreign jurisdictions for fiscal year
2017
, 2016 and 2015 totaled $2.9 million, $17.9 million, and $4.4 million, respectively. Results for fiscal year 2017 included an unrealized gain on our equity investment in Veritone which created a deferred tax liability totaling approximately $10.6 million. The future anticipated reversal of this deferred tax liability provides for a source of taxable income that allows for the realizability of existing deferred tax assets that have been reduced by a valuation allowance for the periods presented. The effective tax rate reflects both the recognition of the deferred tax liability and the reversal of valuation allowance.
Inflation
Inflation has not had a significant impact on us or any of our subsidiaries in the current or prior periods.
Liquidity and Capital Resources
General
Our primary sources of liquidity are cash and cash equivalents on hand generated from our operating activities. Our management believes that our cash and cash equivalent balances and anticipated cash flows from operations will be sufficient
42
to meet our cash requirements through at least March 2019 and for the foreseeable future. We may, however, encounter unforeseen difficulties that may deplete our capital resources more rapidly than anticipated, including those set forth under Item 1A, “Risk Factors”, above. Any efforts to seek additional funding could be made through issuances of equity or debt, or other external financing. However, additional funding may not be available on favorable terms, or at all. The capital and credit markets have experienced extreme volatility and disruption in recent years, and the volatility and impact of the disruption may continue. At times during this period, the volatility and disruption has reached unprecedented levels. In several cases, the markets have exerted downward pressure on stock prices and credit capacity for certain issuers, and the commercial paper markets may not be a reliable source of short-term financing for us. If we fail to obtain additional financing when needed, we may not be able to execute our business plans and our business, conducted by our operating subsidiaries, may suffer.
Certain of our operating subsidiaries are often required to engage in litigation to enforce their patents and patent rights. In connection with any of our operating subsidiaries’ patent enforcement actions, it is possible that a defendant may request and/or a court may rule that an operating subsidiary has violated statutory authority, regulatory authority, federal rules, local court rules, or governing standards relating to the substantive or procedural aspects of such enforcement actions. In such event, a court may issue monetary sanctions against us or our operating subsidiaries or award attorney’s fees and/or expenses to a defendant(s), which could be material.
Cash, Cash Equivalents and Investments
Our consolidated cash and cash equivalents and short-term investments, excluding restricted cash balances, if any, totaled
$136.6 million
at
December 31, 2017
, compared to
$147.0 million
at
December 31, 2016
. The net change in cash and cash equivalents for the periods presented was comprised of the following (in thousands):
|
|
2017
|
2016
|
2015
|
|||||||||
|
Net cash provided by (used in):
|
|
|
|
|||||||||
|
Operating activities
|
$
|
24,478
|
|
$
|
34,061
|
|
$
|
(9,949
|
)
|
|||
|
Investing activities
|
(16,114
|
)
|
(40,630
|
)
|
39,307
|
|
||||||
|
Financing activities
|
700
|
|
(1,114
|
)
|
(28,601
|
)
|
||||||
|
$
|
9,064
|
|
$
|
(7,683
|
)
|
$
|
757
|
|
||||
Cash Flows from Operating Activities.
Cash receipts from licensees totaled
$91.2 million
, $160.2 million and $111.0 million in fiscal years
2017, 2016 and 2015
, respectively. The fluctuations in cash receipts for the periods presented primarily reflects the corresponding fluctuations in revenues recognized during the same periods, as described above, and the related timing of payments received from licensees. Cash outflows from operations totaled
$66.8 million
, $126.1 million and $120.9 million in fiscal years
2017, 2016 and 2015
, respectively. The fluctuations in cash outflows for the periods presented reflects the fluctuations in revenue-related inventor royalties and contingent legal fees and other operating costs and expenses during the same periods, as discussed above, and the impact of the timing of payments to inventors, attorneys and other vendors.
Restricted Cash.
In March 2015, an operating subsidiary of ours entered into a Guarantee with a bank in connection with enforcing a ruling in a German patent court granting an injunction against the defendants in the related patent infringement case. The Guarantee was secured by a cash deposit (classified as restricted cash in the accompanying balances sheets) totaling $11.5 million at December 31, 2016. Upon resolution of all related matters in June 2017, the Guarantee was extinguished resulting in release of the cash collateral (and related restrictions on the cash balance) by the contracting bank. As of December 31, 2017, no amounts of Acacia’s cash and investments are restricted as to use.
Cash Flows from Investing Activities.
Cash flows from investing activities and related changes were comprised of the following for the periods presented (in thousands):
|
|
2017
|
2016
|
2015
|
|||||||||
|
Investment in Investees
(1)
|
$
|
(31,514
|
)
|
$
|
—
|
|
$
|
—
|
|
|||
|
Advances to Investee
(1)
|
(4,000
|
)
|
(20,000
|
)
|
—
|
|
||||||
|
Purchases of property and equipment
|
(2
|
)
|
(4
|
)
|
(8
|
)
|
||||||
|
Net sale (purchase) of available-for-sale investments
|
19,402
|
|
(19,401
|
)
|
58,819
|
|
||||||
|
Patent portfolio investment costs
|
—
|
|
(1,225
|
)
|
(19,504
|
)
|
||||||
|
Net cash provided by (used in) investing activities
|
$
|
(16,114
|
)
|
$
|
(40,630
|
)
|
$
|
39,307
|
|
|||
|
(1) - Refer to Note 7 in the accompany consolidated financial statements
|
||||||||||||
43
Equity Investment in Veritone, Inc.
On August 15, 2016, we entered into an Investment Agreement with Veritone, which provided for us to invest up to $50 million in Veritone, consisting of both debt and equity components. Pursuant to the Investment Agreement, on August 15, 2016, we entered into a secured convertible promissory note with Veritone, or the Veritone Loans, which permitted Veritone to borrow up to $20 million through two $10 million advances, each bearing interest at the rate of 6.0% per annum (included in Other Income (Expense) in the consolidated statements of operations). On August 15, 2016, we funded the initial $10 million loan, or the First Loan. On November 25, 2016, we funded the second $10 million loan, or the Second Loan. The First Loan and the Second Loan were due and payable on November 25, 2017. In conjunction with the First Loan and Second Loan, Veritone issued us a total of three four-year $700,000 warrants to purchase shares of Veritone’s common stock at an exercise price of $13.6088 per share. Veritone’s initial public offering date was May 12, 2017. Upon Veritone’s consummation of its IPO, all outstanding principal and accrued interest under the Veritone Loans, totaling $20.7 million, automatically converted into 1,523,746 shares of Veritone’s common stock based on a conversion price of $13.6088 per share.
In addition, in August 2016, Veritone issued us a five-year Primary Warrant to purchase up to $50 million, less all converted amounts or amounts repaid under the Veritone Loans, worth of shares of Veritone’s common stock at an exercise price of $13.6088 per share. Pursuant to an amendment to the Primary Warrant effective March 15, 2017, the Primary Warrant was exercised automatically upon Veritone’s consummation of its IPO, resulting in the purchase by us of an additional 2,150,335 shares of Veritone common stock, with an aggregate purchase price totaling $29.3 million. Immediately following our exercise of the Primary Warrant in full, Veritone issued us an additional 10% Warrant that provides for the issuance of an additional 809,400 shares of Veritone common stock at an exercise price of $13.6088 per share, with 50% of the shares underlying the 10% Warrant vesting as of the issuance date of the 10% Warrant, and the remaining 50% of shares vesting on the anniversary of the issuance date of the 10% Warrant.
On March 14, 2017, we entered into an additional secured convertible promissory note with Veritone, or the Veritone Bridge Loan, which permitted Veritone to borrow up to an additional $4.0 million, bearing interest at the rate of 8.0% per annum. On March 17, 2017, we funded the initial $1.0 million advance, or the First Bridge Loan. On April 14, 2017, we funded the second $1.0 million advance, or the Second Bridge Loan. All advances and accrued interest under the Veritone Bridge Loan were due and payable on November 25, 2017. In May 2017, pursuant to the terms of the Veritone Bridge Loan, we elected to make an additional advance to Veritone totaling $2.0 million, representing all principal amounts not advanced upon Veritone’s consummation of its IPO. Upon consummation of Veritone’s IPO, the outstanding principal balance and accrued interest under the Veritone Bridge Loan, totaling $4.0 million, automatically converted into 295,440 shares of Veritone’s common stock based on a conversion price of $13.6088 per share.
In conjunction with the Veritone Bridge Loan, Veritone issued us (i) 60,000 shares of Veritone common stock, (ii) 90,000 shares of Veritone common stock and (iii) 10-year warrants to purchase up to 157,000 shares of Veritone common stock, with other terms and conditions similar to the warrants described above.
Our Veritone common shares were subject to a lock-up agreement that expired on February 15, 2018, subsequent to which the shares may be sold pursuant to Rule 144, subject to volume limitations and Rule 144 filing requirements, as well as other restrictions under applicable securities laws. All share amounts above have been adjusted to reflect a 0.6-for-1 reverse stock split of Veritone’s common stock, which was effected by Veritone in April 2017.
Partnership with Miso Robotics, Inc.
In June 2017, we partnered with Miso Robotics, an innovative leader in robotics and AI solutions, which included an equity investment totaling $2.25 million, as part of Miso Robotics’ closing of $3.1 million in Series A funding.
Cash Flows from Financing Activities
. Cash flows from financing activities and related changes included the following for the periods presented (in thousands):
|
|
2017
|
2016
|
2015
|
|||||||||
|
Dividends paid to stockholders
|
$
|
—
|
|
$
|
—
|
|
$
|
(25,434
|
)
|
|||
|
Distributions to noncontrolling interests - Acacia IP Fund
|
—
|
|
(1,358
|
)
|
(4,105
|
)
|
||||||
|
Proceeds from the exercise of stock options
|
745
|
|
326
|
|
938
|
|
||||||
|
Repurchases of common stock
|
(45
|
)
|
(82
|
)
|
—
|
|
||||||
|
Net cash provided by financing activities
|
$
|
700
|
|
$
|
(1,114
|
)
|
$
|
(28,601
|
)
|
|||
Dividends to Stockholders.
In April 2013, our Board of Directors approved the adoption of a cash dividend policy that called for the payment of an expected total annual cash dividend of $0.50 per common share, payable in the amount of
$0.125
44
per share per quarter. On February 23, 2016, we announced that our Board of Directors terminated the dividend policy. Our Board of Directors terminated the dividend policy due to a number of factors, including our financial performance, our available cash resources, our cash requirements and alternative uses of capital that our Board of Directors concluded would represent an opportunity to generate a greater return on investment for us and our stockholders.
Stock Repurchase Program.
In February 2018, our Board of Directors authorized the Program to repurchase up to $20 million of our outstanding common stock in open market purchases or private purchases, from time to time, in amounts and at prices to be determined by the Board of Directors at its discretion. In determining whether or not to repurchase any shares of our common stock, our Board of Directors will consider such factors as the impact of the repurchase on our cash position, as well as our capital needs and whether there is a better alternative use of our capital. We have no obligation to repurchase any amount of our common stock under the Program. The Program is set to expire on February 28, 2019.
Working Capital
The primary components of working capital are cash and cash equivalents, restricted cash, short-term investments, accounts receivable, prepaid expenses, accounts payable, accrued expenses, and royalties and contingent legal fees payable. Working capital at
December 31, 2017
was
$130.1 million
, compared to
$160.3 million
at
December 31, 2016
.
Consolidated accounts receivable from licensees decreased to
$153,000
at
December 31, 2017
, compared to
$26.8 million
at
December 31, 2016
. Accounts receivable balances fluctuate based on the timing, magnitude and payment terms associated with revenue agreements executed during the year, and the timing of cash receipts on accounts receivable balances recorded in previous periods. One licensee accounted for
100%
of accounts receivable at
December 31, 2017
. Four licensees individually represented approximately
39%
,
22%
,
16%
and
15%
, respectively, of accounts receivable at
December 31, 2016
.
Accounts payable and accrued expenses decreased to
$8.0 million
at
December 31, 2017
, from
$14.3 million
at
December 31, 2016
, due primarily to a decrease in payroll and other employee benefits and a decrease in foreign taxes payable.
Consolidated royalties and contingent legal fees payable decreased to
$1.6 million
at
December 31, 2017
, compared to
$13.9 million
at
December 31, 2016
. Royalties and contingent legal fees payable balances fluctuate based on the magnitude and timing of the execution of related license agreements, the timing of cash receipts for the related license agreements, and the timing of payment of current and prior period royalties and contingent legal fees payable to inventor and outside attorneys, respectively.
All of accounts receivable from licensees at
December 31, 2017
were collected in the first quarter of 2018, in accordance with the terms of the related underlying license agreements. The majority of royalties and contingent legal fees payable are scheduled to be paid in the first and second quarter of 2018 in accordance with the underlying contractual arrangements.
Off-Balance Sheet Arrangements
We have not entered into off-balance sheet financing arrangements, other than operating leases.
Contractual Obligations
We have no significant commitments for capital expenditures in 2018. We have no committed lines of credit or other committed funding or long-term debt. The following table lists our material known future cash commitments as of
December 31, 2017
, and any material known commitments arising from events subsequent to year end:
|
|
Payments Due by Period (In thousands)
|
||||||||||||||||||
|
Contractual Obligations
|
Total
|
|
Less than 1 year
|
|
1-3 years
|
|
3-5 years
|
More than 5 years
|
|||||||||||
|
Operating leases, net of guaranteed sublease income
|
$
|
2,598
|
|
|
$
|
1,213
|
|
|
$
|
1,385
|
|
|
$
|
—
|
|
$
|
—
|
|
|
|
Total contractual obligations
|
$
|
2,598
|
|
|
$
|
1,213
|
|
|
$
|
1,385
|
|
|
$
|
—
|
|
$
|
—
|
|
|
Uncertain Tax Positions
. At
December 31, 2017
, we had total unrecognized tax benefits of approximately $1.4 million, including a recorded noncurrent liability of $85,000 related to unrecognized tax benefits primarily associated with state
45
taxes. No interest and penalties have been recorded for the unrecognized tax benefits as of
December 31, 2017
. If recognized, approximately $1.4 million would impact our effective tax rate. We do not expect that the liability for unrecognized tax benefits will change significantly within the next 12 months.
Recent Accounting Pronouncements
Refer to Note
2
to our notes to consolidated financial statements included elsewhere herein.
The primary objective of our short-term investment activities is to preserve principal while concurrently maximizing the income we receive from our short-term investments without significantly increasing risk. Some of the securities that we invest in may be subject to interest rate risk and/or market risk. This means that a change in prevailing interest rates, with respect to interest rate risk, or a change in the value of the United States equity markets, with respect to market risk, may cause the principal amount or market value of the short-term investments to fluctuate. For example, if we hold a security that was issued with a fixed interest rate at the then-prevailing rate and the prevailing interest rate later rises, the current value of the principal amount of our investment may decline. To minimize these risks in the future, we intend to maintain our portfolio of cash equivalents and short-term investments in a variety of securities, including commercial paper, money market funds, high-grade corporate bonds, government and non-government debt securities and certificates of deposit.
Short-term investment balances were zero at December 31, 2017. At December 31, 2016, our short-term investments were comprised of AAA rated money market funds that invest in first-tier only securities, which primarily include domestic commercial paper, securities issued or guaranteed by the U.S. government or its agencies, U.S. bank obligations, and fully collateralized repurchase agreements (included in cash and cash equivalents in the accompanying consolidated balance sheets), and direct investments in highly liquid, AAA, U.S. government securities (included in short-term investments in the accompanying consolidated balance sheets).
In general, money market funds are not subject to market risk because the interest paid on such funds fluctuates with the prevailing interest rate. Accordingly, a 100 basis point increase in interest rates or a 10% decline in the value of the United States equity markets would not be expected to have a material impact on the value of such money market funds. Investments in U.S. government fixed income securities are subject to interest rate risk and will decline in value if interest rates increase. However, due to the relatively short duration of our short-term investment portfolio, an immediate 10% change in interest rates would have no material impact on our financial condition, results of operations or cash flows. Declines in interest rates over time will, however, reduce our interest income.
Investment Risk
. We are exposed to investment risks related to changes in the underlying financial condition of certain of our partnerships with high-growth and potentially disruptive technology companies, and our related equity investments in these companies. The fair value of these investments can be significantly impacted by the risk of adverse changes in securities markets generally, as well as risks related to the performance of the companies whose securities we have invested in, risks associated with specific industries, and other factors. These investments are subject to significant fluctuations in fair value due to the volatility of the securities markets and of the underlying businesses. As of December 31, 2017, the carrying value of our common stock and warrants in public and private companies was $107.0 million. We record our common stock and warrant investments in publicly traded companies at fair value, which is subject to market price volatility, and represents $104.8 million of our non-current investments as of December 31, 2017. A hypothetical 10% adverse change in the market price of Veritone's publicly traded common stock would have resulted in a decrease of approximately $11.1 million in the fair value of our equity and equity warrant investments in Veritone. We evaluate our equity and equity warrant investments in private companies for impairment when events and circumstances indicate that the decline in fair value of such assets below the carrying value is other-than temporary. Our analysis includes a review of recent operating results and trends, recent sales/acquisitions of the investee securities, and other publicly available data. The current global economic climate provides additional uncertainty. Valuations of private companies are inherently more complex due to the lack of readily available market data. As such, we believe that market sensitivities are not practicable for our private company equity investments.
The financial statements and related financial information required to be filed hereunder are indexed under Item 15 of this report and are incorporated herein by reference.
46
None.
(a) Conclusion Regarding the Effectiveness of Disclosure Controls and Procedures
Under the supervision and with the participation of our management, including our Chief Executive Officer and Chief Financial Officer, we conducted an evaluation of our disclosure controls and procedures, as defined in Rules 13a-15(e) and 15d-15(e) under the Exchange Act. Based on this evaluation, our Chief Executive Officer and Chief Financial Officer concluded that, as of
December 31, 2017
, our disclosure controls and procedures were effective to ensure that the information required to be disclosed by us in the reports that we file or submit under the Exchange Act is accumulated and communicated to our management, including our Chief Executive Officer and Chief Financial Officer, as appropriate to allow timely decisions regarding required disclosure, and that such information is recorded, processed, summarized and reported within the time periods prescribed by the SEC.
(b) Management’s Report on Internal Control Over Financial Reporting
Our management is responsible for establishing and maintaining adequate internal control over financial reporting, as defined in Rules 13a-15(f) and 15d-15(f) under the Exchange Act. Under the supervision and with the participation of our management, including our Chief Executive Officer and Chief Financial Officer, we conducted an evaluation of the effectiveness of our internal control over financial reporting based on the 2013 framework in
Internal Control - Integrated Framework
issued by the Committee of Sponsoring Organizations of the Treadway Commission. Based on our evaluation under the framework in
Internal Control - Integrated Framework
, our management concluded that our internal control over financial reporting was effective as of
December 31, 2017
.
Grant Thornton LLP, the independent registered public accounting firm who audited our consolidated financial statements included in this Annual Report on Form 10-K, has issued an attestation report on the effectiveness of our internal control over financial reporting as of
December 31, 2017
, which is included herein.
Changes in Internal Controls
. There were no changes in our internal control over financial reporting during the fourth fiscal quarter that have materially affected, or are reasonably likely to materially affect, our internal control over financial reporting.
Inherent Limitations on Effectiveness of Controls.
Our management, including our Chief Executive Officer and Chief Financial Officer, does not expect that our disclosure controls or our internal control over financial reporting will prevent or detect all errors and all fraud. A control system, no matter how well designed and operated, can provide only reasonable, not absolute, assurance that the control system’s objectives will be met. The design of a control system must reflect the fact that there are resource constraints, and the benefits of controls must be considered relative to their costs. Further, because of the inherent limitations in all control systems, no evaluation of controls can provide absolute assurance that misstatements due to error or fraud will not occur or that all control issues and instances of fraud, if any, have been detected. The design of any system of controls is based in part on certain assumptions about the likelihood of future events, and there can be no assurance that any design will succeed in achieving its stated goals under all potential future conditions. Projections of any evaluation of the effectiveness of controls to future periods are subject to risks. Over time, controls may become inadequate because of changes in conditions or deterioration in the degree of compliance with policies or procedures.
None
47
Except as provided below, in accordance with General Instruction G(3) to Form 10-K, certain information required by this Item is incorporated herein by reference to our definitive proxy statement for our 2018 annual meeting of stockholders to be filed with the SEC no later than
April 30, 2018
.
Code of Conduct.
We have adopted a Code of Conduct that applies to all employees, including our chief executive officer, chief financial and accounting officer, president and any persons performing similar functions. Our Code of Conduct is provided on our internet website at
www.acaciaresearch.com
.
In accordance with General Instruction G(3) to Form 10-K, the information required by this Item is incorporated herein by reference to our definitive proxy statement for our 2018 annual meeting of stockholders to be filed with the SEC no later than
April 30, 2018
.
In accordance with General Instruction G(3) to Form 10-K, certain information required by this Item is incorporated herein by reference to our definitive proxy statement for our 2018 annual meeting of stockholders to be filed with the SEC no later than
April 30, 2018
.
In accordance with General Instruction G(3) to Form 10-K, the information required by this Item is incorporated herein by reference to our definitive proxy statement for our 2018 annual meeting of stockholders to be filed with the SEC no later than
April 30, 2018
.
In accordance with General Instruction G(3) to Form 10-K, the information required by this Item is incorporated herein by reference to our definitive proxy statement for our 2018 annual meeting of stockholders to be filed with the SEC no later than
April 30, 2018
.
48
|
(a)
|
The following documents are filed as part of this report.
|
|
(1) Financial Statements
|
Page
|
|
|
|
|
|
|
Acacia Research Corporation Consolidated Financial Statements
|
|
|
|
|
|
|
|
(2) Financial Statement Schedules
|
|
|
|
|
|
|
|
Financial statement schedules are omitted because they are not applicable or the required information is shown in the Financial Statements or the Notes thereto.
|
||
|
|
|
|
|
(3) Exhibits
|
|
|
|
|
|
|
|
Refer to Item 15(b) below.
|
|
|
|
(b)
|
Exhibits. The following exhibits are either filed herewith or incorporated herein by reference:
|
|
Exhibit
Number
|
Description
|
|
|
|
|
2.1
|
|
|
3.1
|
|
|
3.2
|
|
|
4.1
|
|
|
10.1*
|
|
|
10.2*
|
|
|
10.3*
|
|
|
10.4*
|
|
|
10.5*
|
|
|
10.6*
|
|
|
10.7*
|
|
49
|
10.8
|
|
|
10.9
|
|
|
10.10
|
|
|
10.11*
|
|
|
10.12
|
|
|
10.13
|
|
|
10.15*
|
|
|
10.16*
|
|
|
10.17*
|
|
|
10.18
|
|
|
10.19
|
|
|
10.20*
|
|
|
10.21*
|
|
|
10.22*
|
|
|
10.23*
|
|
|
10.24*
|
|
|
10.25*
|
|
|
10.26*
|
|
|
10.27*
|
|
|
10.28*
|
|
|
10.29
|
|
|
10.30
|
|
|
10.31
|
|
|
10.32
|
|
|
10.33
|
|
|
10.34
|
|
|
21.1
|
|
|
23.1
|
|
|
24.1
|
|
|
31.1†
|
|
|
31.2†
|
|
|
32.1
|
|
|
32.2
|
|
|
101
|
Interactive Date Files Pursuant to Rule 405 of Regulation S-T.
|
50
___________________________
|
*
|
The referenced exhibit is a management contract, compensatory plan or arrangement required to be filed as an exhibit to this Annual Report on Form 10-K pursuant to Item 15(c) of Form 10-K.
|
|
†
|
The certifications attached as Exhibits 32.1 and 32.2 that accompany this Annual Report on Form 10-K are not deemed filed with the SEC and are not to be incorporated by reference into any filing of Acacia Research Corporation under the Securities Act of 1933, as amended, or the Securities Exchange Act of 1934, as amended, whether made before or after the date of this Annual Report on Form 10-K, regardless of any general incorporation language contained in any filing.
|
|
(1)
|
Incorporated by reference to Acacia Research Corporation’s Current Report on Form 8-K filed on June 5, 2008 (File No. 000-26068).
|
|
(2)
|
Incorporated by reference to Appendix A to Acacia Research Corporation’s Definitive Proxy Statement on Schedule 14A filed on April 20, 2000 (File No. 000-26068).
|
|
(3)
|
Incorporated by reference to Appendix A to Acacia Research Corporation’s Definitive Proxy Statement on Schedule 14A filed on April 26, 1996 (File No. 000-26068).
|
|
(4)
|
Incorporated by reference to Annex E to the Proxy Statement/Prospectus which formed part of Acacia Research Corporation’s Registration Statement on Form S-4 (File No. 333-87654) which became effective on November 8, 2002.
|
|
(5)
|
Incorporated by reference to Acacia Research Corporation’s Registration Statement on Form S-8 (File No. 333-144754) which became effective on July 20, 2007.
|
|
(6)
|
Incorporated by reference to Acacia Research Corporation’s Quarterly Report on Form 10-Q for the period ended September 30, 2007, filed on November 2, 2007 (File No. 000-26068).
|
|
(7)
|
Incorporated by reference to Acacia Research Corporation’s Annual Report on Form 10‑K for the year ended December 31, 2001, filed on March 27, 2002 (File No. 000‑26068).
|
|
(8)
|
Incorporated by reference to Acacia Research Corporation’s Quarterly Report on Form 10-Q for the period ended June 30, 2012, filed on July 30, 2012 (File No. 000-26068).
|
|
(9)
|
Incorporated by reference to Acacia Research Corporation’s Quarterly Report on Form 10-Q for the period ended March 31, 2006, filed on May 10, 2006 (File No. 000‑26068).
|
|
(10)
|
Incorporated by reference to Acacia Research Corporation’s Annual Report on Form 10-K for the year ended December 31, 2007, filed on March 14, 2008 (File No. 000-26068).
|
|
(11)
|
Incorporated by reference to Acacia Research Corporation’s Current Report on Form 8-K filed on April 2, 2008 (File No. 000-26068).
|
|
(12)
|
Incorporated by reference to Acacia Research Corporation’s Annual Report on Form 10-K for the year ended December 31, 2008, filed on February 26, 2009 (File No. 000-26068).
|
|
(13)
|
Incorporated by reference to Acacia Research Corporation’s Annual Report on Form 10-K for the year ended December 31, 2009, filed on February 26, 2010, as amended on March 1, 2010 (File No. 000-26068).
|
|
(14)
|
Incorporated by reference to Acacia Research Corporation’s Annual Report on Form 10-K for the year ended December 31, 2010, filed on February 28, 2011, as amended on March 24, 2011 (File No. 000-26068).
|
|
(15)
|
Incorporated by reference to Acacia Research Corporation’s Current Report on Form 8-K/A filed on January 19, 2012 (File No. 000-26068). Portions of this exhibit have been omitted pursuant to a request for confidential treatment under Rule 24-b-2 of the Securities Exchange Act of 1934, as amended. The omitted material has been separately filed with the Securities and Exchange Commission.
|
51
|
(16)
|
Incorporated by reference to Acacia Research Corporation’s Current Report on Form 8-K filed on February 16, 2012 (File No. 000-26068).
|
|
(17)
|
Incorporated by reference to Appendix A to Acacia Research Corporation’s Definitive Proxy Statement on Schedule 14A filed on April 24, 2013 (File No. 000-26068).
|
|
(18)
|
Incorporated by reference to Acacia Research Corporation’s Current Report on Form 8-K filed on May 22, 2013 (File No. 000-26068).
|
|
(19)
|
Incorporated by reference to Acacia Research Corporation’s Quarterly Report on Form 10-Q for the period ended September 30, 2015, filed on November 9, 2015 (File No. 000-26068).
|
|
(20)
|
Incorporated by reference to Acacia Research Corporation’s Current Report on Form 8-K filed on March 28, 2016 (File No. 001-37721).
|
|
(21)
|
Incorporated by reference to Acacia Research Corporation’s Quarterly Report on Form 10-Q for the period ended June 30, 2016, filed on August 9, 2016 (File No. 001-37721).
|
|
(22)
|
Incorporated by reference to Acacia Research Corporation’s Current Report on Form 8-K filed on March 4, 2016 (File No. 000-26068).
|
|
(23)
|
Incorporated by reference to Acacia Research Corporation’s Current Report on Form 8-K filed on March 21, 2016 (File No. 000-26068).
|
|
(24)
|
Incorporated by reference to Acacia Research Corporation’s Annual Report on Form 10-K for the year ended December 31, 2016, filed on March 10, 2017 (File No. 001-37721).
|
|
(25)
|
Incorporated by reference to Acacia Research Corporation’s Quarterly Report on Form 10-Q for the period ended September 30, 2017, filed on November 7, 2017 (File No. 001-37721).
|
|
(26)
|
Incorporated by reference to Acacia Research Corporation’s Quarterly Report on Form 10-Q for the period ended March 31, 2017, filed on May 10, 2017 (File No. 001-37721).
|
|
(27)
|
Incorporated by reference to Acacia Research Corporation’s Current Report on Form 8-K filed on March 16, 2017 (File No. 001-37721).
|
52
SIGNATURES
Pursuant to the requirements of Section 13 or 15(d) of the Securities Exchange Act of 1934, the registrant has duly caused this report to be signed on its behalf by the undersigned, thereunto duly authorized.
|
|
ACACIA RESEARCH CORPORATION
|
|
||
|
|
|
|
|
|
|
Dated:
|
March 7, 2018
|
By:
|
/s/ Robert Stewart
|
|
|
|
|
Robert Stewart
|
|
|
|
|
|
President
(Authorized Signatory)
|
|
|
POWER OF ATTORNEY
We, the undersigned directors and officers of Acacia Research Corporation, do hereby constitute and appoint Robert Stewart and Clayton J. Haynes, and each of them, as our true and lawful attorneys-in-fact and agents with power of substitution, to do any and all acts and things in our name and behalf in our capacities as directors and officers and to execute any and all instruments for us and in our names in the capacities indicated below, which said attorney-in-fact and agent may deem necessary or advisable to enable said corporation to comply with the Securities Exchange Act of 1934, as amended, and any rules, regulations and requirements of the Securities and Exchange Commission, in connection with this Annual Report on Form 10-K, including specifically but without limitation, power and authority to sign for us or any of us in our names in the capacities indicated below, any and all amendments hereto; and we do hereby ratify and confirm all that said attorney-in-fact and agent, shall do or cause to be done by virtue hereof.
Pursuant to the requirements of the Securities Exchange Act of 1934, this report has been signed below by the following persons on behalf of the registrant and the capacities and on the dates indicated.
|
Signature
|
|
Title
|
|
Date
|
|
|
|
|
|
|
|
|
|
/s/
|
Robert Stewart
|
|
President
|
|
March 7, 2018
|
|
|
Robert Stewart
|
|
(Principal Executive Officer)
|
|
|
|
|
|
|
|
|
|
|
/s/
|
Clayton J. Haynes
|
|
Chief Financial Officer and Treasurer
|
|
March 7, 2018
|
|
|
Clayton J. Haynes
|
|
(Principal Financial and Accounting Officer)
|
|
|
|
/s/
|
Fred A. de Boom
|
|
Director
|
|
March 7, 2018
|
|
|
Fred A. de Boom
|
|
|
|
|
|
|
|
|
|
|
|
|
/s/
|
Edward W. Frykman
|
|
Director
|
|
March 7, 2018
|
|
|
Edward W. Frykman
|
|
|
|
|
|
|
|
|
|
|
|
|
/s/
|
G. Louis Graziadio, III
|
|
Executive Chairman and Director
|
|
March 7, 2018
|
|
|
G. Louis Graziadio, III
|
|
|
|
|
|
|
|
|
|
|
|
|
/s/
|
William S. Anderson
|
|
Director
|
|
March 7, 2018
|
|
|
William S. Anderson
|
|
|
|
|
|
/s/
|
Frank E. Walsh, III
|
|
Director
|
|
March 7, 2018
|
|
|
Frank E. Walsh, III
|
|
|
|
|
|
/s/
|
James F. Sanders
|
|
Director
|
|
March 7, 2018
|
|
|
James F. Sanders
|
|
|
|
|
53
REPORT OF INDEPENDENT REGISTERED PUBLIC ACCOUNTING FIRM
Board of Directors and Stockholders
Acacia Research Corporation
Opinion on the financial statements
We have audited the accompanying consolidated balance sheets of Acacia Research Corporation (the “Company”) as of December 31, 2017 and 2016, the related consolidated statements of operations, comprehensive income (loss), stockholders’ equity, and cash flows for each of the three years in the period ended December 31, 2017, and the related notes (collectively referred to as the “financial statements”). In our opinion, the financial statements present fairly, in all material respects, the financial position of the Company as of December 31, 2017 and 2016, and the results of its operations and its cash flows for each of the three years in the period ended December 31, 2017, in conformity with accounting principles generally accepted in the United States of America.
We also have audited, in accordance with the standards of the Public Company Accounting Oversight Board (United States) (“PCAOB”), the Company’s internal control over financial reporting as of December 31, 2017, based on criteria established in the 2013 Internal Control-Integrated Framework issued by the Committee of Sponsoring Organizations of the Treadway Commission (“COSO”), and our report dated
March 7, 2018
expressed an unqualified opinion.
Basis for opinion
These financial statements are the responsibility of the Company’s management. Our responsibility is to express an opinion on the Company’s financial statements based on our audits. We are a public accounting firm registered with the PCAOB and are required to be independent with respect to the Company in accordance with the U.S. federal securities laws and the applicable rules and regulations of the Securities and Exchange Commission and the PCAOB.
We conducted our audits in accordance with the standards of the PCAOB. Those standards require that we plan and perform the audit to obtain reasonable assurance about whether the financial statements are free of material misstatement, whether due to error or fraud. Our audits included performing procedures to assess the risks of material misstatement of the financial statements, whether due to error or fraud, and performing procedures that respond to those risks. Such procedures included examining, on a test basis, evidence supporting the amounts and disclosures in the financial statements. Our audits also included evaluating the accounting principles used and significant estimates made by management, as well as evaluating the overall presentation of the financial statements. We believe that our audits provide a reasonable basis for our opinion.
/s/ GRANT THORNTON LLP
We have served as the Company’s auditor since 2007.
Newport Beach, California
March 7, 2018
F- 1
REPORT OF INDEPENDENT REGISTERED PUBLIC ACCOUNTING FIRM
Board of Directors and Stockholders
Acacia Research Corporation
Opinion on internal control over financial reporting
We have audited the internal control over financial reporting of Acacia Research Corporation (the “Company”) as of December 31, 2017, based on criteria established in the 2013 Internal Control-Integrated Framework issued by the Committee of Sponsoring Organizations of the Treadway Commission (“COSO”). In our opinion, the Company maintained, in all material respects, effective internal control over financial reporting as of December 31, 2017, based on criteria established in the 2013 Internal Control-Integrated Framework issued by COSO.
We also have audited, in accordance with the standards of the Public Company Accounting Oversight Board (United States) (“PCAOB”), the consolidated financial statements of the Company as of and for the year ended December 31, 2017, and our report dated
March 7, 2018
expressed an unqualified opinion on those financial statements.
Basis for opinion
The Company’s management is responsible for maintaining effective internal control over financial reporting and for its assessment of the effectiveness of internal control over financial reporting, included in the accompanying Management’s Report on Internal Control Over Financial Reporting (“Management’s Report”). Our responsibility is to express an opinion on the Company’s internal control over financial reporting based on our audit. We are a public accounting firm registered with the PCAOB and are required to be independent with respect to the Company in accordance with the U.S. federal securities laws and the applicable rules and regulations of the Securities and Exchange Commission and the PCAOB.
We conducted our audit in accordance with the standards of the PCAOB. Those standards require that we plan and perform the audit to obtain reasonable assurance about whether effective internal control over financial reporting was maintained in all material respects. Our audit included obtaining an understanding of internal control over financial reporting, assessing the risk that a material weakness exists, testing and evaluating the design and operating effectiveness of internal control based on the assessed risk, and performing such other procedures as we considered necessary in the circumstances. We believe that our audit provides a reasonable basis for our opinion.
Definition and limitations of internal control over financial reporting
A company’s internal control over financial reporting is a process designed to provide reasonable assurance regarding the reliability of financial reporting and the preparation of financial statements for external purposes in accordance with generally accepted accounting principles. A company’s internal control over financial reporting includes those policies and procedures that (1) pertain to the maintenance of records that, in reasonable detail, accurately and fairly reflect the transactions and dispositions of the assets of the company; (2) provide reasonable assurance that transactions are recorded as necessary to permit preparation of financial statements in accordance with generally accepted accounting principles, and that receipts and expenditures of the company are being made only in accordance with authorizations of management and directors of the company; and (3) provide reasonable assurance regarding prevention or timely detection of unauthorized acquisition, use, or disposition of the company’s assets that could have a material effect on the financial statements.
Because of its inherent limitations, internal control over financial reporting may not prevent or detect misstatements. Also, projections of any evaluation of effectiveness to future periods are subject to the risk that controls may become inadequate because of changes in conditions, or that the degree of compliance with the policies or procedures may deteriorate.
/s/ GRANT THORNTON LLP
Newport Beach, California
March 7, 2018
F- 2
ACACIA RESEARCH CORPORATION
CONSOLIDATED BALANCE SHEETS
As of
December 31, 2017
and
2016
(In thousands, except share and per share information)
|
|
2017
|
2016
|
||||||
|
ASSETS
|
|
|
||||||
|
Current assets:
|
|
|
||||||
|
Cash and cash equivalents
|
$
|
136,604
|
|
$
|
127,540
|
|
||
|
Restricted cash
|
—
|
|
11,512
|
|
||||
|
Short-term investments
|
—
|
|
19,443
|
|
||||
|
Accounts receivable
|
153
|
|
26,750
|
|
||||
|
Prepaid expenses and other current assets
|
2,938
|
|
3,245
|
|
||||
|
Total current assets
|
139,695
|
|
188,490
|
|
||||
|
Investment at fair value
(1)
|
104,754
|
|
—
|
|
||||
|
Investment - equity method
(1)
|
2,195
|
|
—
|
|
||||
|
Loan receivable and accrued interest
(1)
|
—
|
|
18,616
|
|
||||
|
Investment in warrants and shares
(1)
|
—
|
|
1,960
|
|
||||
|
Patents, net of accumulated amortization
|
61,917
|
|
86,319
|
|
||||
|
Other non-current assets
|
207
|
|
618
|
|
||||
|
|
$
|
308,768
|
|
$
|
296,003
|
|
||
|
LIABILITIES AND STOCKHOLDERS’ EQUITY
|
|
|
|
|
||||
|
Current liabilities:
|
|
|
|
|
||||
|
Accounts payable and accrued expenses
|
$
|
7,956
|
|
$
|
14,283
|
|
||
|
Royalties and contingent legal fees payable
|
1,601
|
|
13,908
|
|
||||
|
Total current liabilities
|
9,557
|
|
28,191
|
|
||||
|
Other liabilities
|
3,552
|
|
369
|
|
||||
|
Total liabilities
|
13,109
|
|
28,560
|
|
||||
|
Commitments and contingencies (Note 11)
|
|
|
|
|
||||
|
Stockholders’ equity:
|
|
|
|
|
||||
|
Preferred stock, par value $0.001 per share; 10,000,000 shares authorized; no shares issued or outstanding
|
—
|
|
—
|
|
||||
|
Common stock, par value $0.001 per share; 100,000,000 shares authorized; 50,639,926 shares issued and outstanding as of December 31, 2017 and 50,476,042 shares issued and outstanding as of December 31, 2016
|
51
|
|
50
|
|
||||
|
Treasury stock, at cost, 1,729,408 shares as of December 31, 2017 and 2016
|
(34,640
|
)
|
(34,640
|
)
|
||||
|
Additional paid-in capital
|
648,996
|
|
642,453
|
|
||||
|
Accumulated comprehensive loss
|
(88
|
)
|
(76
|
)
|
||||
|
Accumulated deficit
|
(320,018
|
)
|
(342,198
|
)
|
||||
|
Total Acacia Research Corporation stockholders’ equity
|
294,301
|
|
265,589
|
|
||||
|
Noncontrolling interests in operating subsidiaries
|
1,358
|
|
1,854
|
|
||||
|
Total stockholders’ equity
|
295,659
|
|
267,443
|
|
||||
|
|
$
|
308,768
|
|
$
|
296,003
|
|
||
(1)
Refer to Note
7
for additional information.
The accompanying notes are an integral part of these consolidated financial statements.
F- 3
ACACIA RESEARCH CORPORATION
CONSOLIDATED STATEMENTS OF OPERATIONS
For the Years Ended
December 31, 2017, 2016 and 2015
(In thousands, except share and per share information)
|
|
2017
|
2016
|
2015
|
|||||||||
|
Revenues
|
$
|
65,402
|
|
$
|
152,699
|
|
$
|
125,037
|
|
|||
|
Operating costs and expenses:
|
|
|
|
|
|
|
||||||
|
Cost of revenues:
|
|
|
|
|
|
|
||||||
|
Inventor royalties
|
4,952
|
|
22,730
|
|
18,462
|
|
||||||
|
Contingent legal fees
|
16,682
|
|
26,474
|
|
16,169
|
|
||||||
|
Litigation and licensing expenses - patents
|
18,219
|
|
27,858
|
|
39,373
|
|
||||||
|
Amortization of patents
|
22,154
|
|
34,208
|
|
53,067
|
|
||||||
|
General and administrative expenses (including non-cash stock compensation expense of $8,885 in 2017, $9,062 in 2016 and $11,048 in 2015)
|
26,030
|
|
32,919
|
|
38,176
|
|
||||||
|
Other expenses - business development
|
1,189
|
|
3,079
|
|
3,391
|
|
||||||
|
Impairment of patent-related intangible assets
|
2,248
|
|
42,340
|
|
74,731
|
|
||||||
|
Impairment of goodwill
|
—
|
|
—
|
|
30,149
|
|
||||||
|
Other
|
1,200
|
|
500
|
|
4,141
|
|
||||||
|
Total operating costs and expenses
|
92,674
|
|
190,108
|
|
277,659
|
|
||||||
|
Operating loss
|
(27,272
|
)
|
(37,409
|
)
|
(152,622
|
)
|
||||||
|
Other income (expense):
|
||||||||||||
|
Gain on conversion of loans and accrued interest
(1)
|
2,671
|
|
—
|
|
—
|
|
||||||
|
Gain on exercise of Primary Warrant
(1)
|
4,616
|
|
—
|
|
—
|
|
||||||
|
Change in fair value of investment, net
(1)
|
42,239
|
|
—
|
|
—
|
|
||||||
|
Equity in losses of investee
(1)
|
(220
|
)
|
—
|
|
—
|
|
||||||
|
Other income
|
1,000
|
|
—
|
|
—
|
|
||||||
|
Interest income
|
1,605
|
|
798
|
|
(56
|
)
|
||||||
|
Total other income (expense)
|
51,911
|
|
798
|
|
(56
|
)
|
||||||
|
Income (loss) from operations before provision for income taxes
|
24,639
|
|
(36,611
|
)
|
(152,678
|
)
|
||||||
|
Provision for income taxes
|
(2,955
|
)
|
(18,188
|
)
|
(4,800
|
)
|
||||||
|
Net income (loss) including noncontrolling interests in subsidiaries
|
21,684
|
|
(54,799
|
)
|
(157,478
|
)
|
||||||
|
Net (income) loss attributable to noncontrolling interests in subsidiaries
|
496
|
|
732
|
|
(2,558
|
)
|
||||||
|
Net income (loss) attributable to Acacia Research Corporation
|
$
|
22,180
|
|
$
|
(54,067
|
)
|
$
|
(160,036
|
)
|
|||
|
Net income (loss) attributable to common stockholders - basic and diluted
|
$
|
22,147
|
|
$
|
(54,067
|
)
|
$
|
(160,730
|
)
|
|||
|
Basic and diluted income (loss) per common share
|
$
|
0.44
|
|
$
|
(1.08
|
)
|
$
|
(3.25
|
)
|
|||
|
Weighted-average number of shares outstanding, basic
|
50,495,119
|
|
50,075,847
|
|
49,505,817
|
|
||||||
|
Weighted-average number of shares outstanding, diluted
|
50,692,012
|
|
50,075,847
|
|
49,505,817
|
|
||||||
|
Cash dividends declared per common share
|
$
|
—
|
|
$
|
—
|
|
$
|
0.50
|
|
|||
(1)
Refer to Note
7
for additional information.
The accompanying notes are an integral part of these consolidated financial statements.
F- 4
ACACIA RESEARCH CORPORATION
CONSOLIDATED STATEMENTS OF COMPREHENSIVE INCOME (LOSS)
For the Years Ended
December 31, 2017, 2016 and 2015
(In thousands)
|
2017
|
2016
|
2015
|
|||||||||
|
Net income (loss) including noncontrolling interests in subsidiaries
|
$
|
21,684
|
|
$
|
(54,799
|
)
|
$
|
(157,478
|
)
|
||
|
Other comprehensive income (loss):
|
|||||||||||
|
Unrealized gain (loss) on short-term investments, net of tax of $0
|
(40
|
)
|
40
|
|
(356
|
)
|
|||||
|
Unrealized gain (loss) on foreign currency translation, net of tax of $0
|
58
|
|
77
|
|
(123
|
)
|
|||||
|
Add: reclassification adjustment for (gains) losses included in net income (loss)
|
(30
|
)
|
22
|
|
617
|
|
|||||
|
Total other comprehensive income (loss)
|
21,672
|
|
(54,660
|
)
|
(157,340
|
)
|
|||||
|
Comprehensive income (loss) attributable to noncontrolling interests
|
496
|
|
732
|
|
(2,558
|
)
|
|||||
|
Comprehensive income (loss) attributable to Acacia Research Corporation
|
$
|
22,168
|
|
|
$
|
(53,928
|
)
|
$
|
(159,898
|
)
|
|
The accompanying notes are an integral part of these consolidated financial statements.
F- 5
ACACIA RESEARCH CORPORATION
CONSOLIDATED STATEMENTS OF STOCKHOLDERS’ EQUITY
For the Years Ended
December 31, 2017, 2016 and 2015
(In thousands, except share information)
|
|
|||||||||||||||||||||||||||||||
|
|
Common Shares
|
Common Stock
|
Treasury Stock
|
Additional Paid-in Capital
|
Accumulated Comprehensive Income (Loss)
|
Accumulated Deficit
|
Noncontrolling Interests in Operating Subsidiaries
|
Total
|
|||||||||||||||||||||||
|
Balance at December 31, 2014
|
50,065,382
|
|
$
|
50
|
|
$
|
(34,640
|
)
|
$
|
646,595
|
|
$
|
(353
|
)
|
$
|
(128,095
|
)
|
$
|
5,491
|
|
$
|
489,048
|
|
||||||||
|
Net loss attributable to Acacia Research Corporation
|
—
|
|
—
|
|
—
|
|
—
|
|
—
|
|
(160,036
|
)
|
—
|
|
(160,036
|
)
|
|||||||||||||||
|
Dividends paid to stockholders
|
—
|
|
—
|
|
—
|
|
(25,434
|
)
|
—
|
|
—
|
|
—
|
|
(25,434
|
)
|
|||||||||||||||
|
Stock options exercised
|
135,000
|
|
—
|
|
—
|
|
938
|
|
—
|
|
—
|
|
—
|
|
938
|
|
|||||||||||||||
|
Compensation expense for share-based awards, net of forfeitures
|
450,857
|
|
1
|
|
—
|
|
11,047
|
|
—
|
|
—
|
|
—
|
|
11,048
|
|
|||||||||||||||
|
Net income attributable to noncontrolling interests in subsidiaries
|
—
|
|
—
|
|
—
|
|
—
|
|
—
|
|
—
|
|
2,558
|
|
2,558
|
|
|||||||||||||||
|
Distributions to noncontrolling interests in operating subsidiary
|
—
|
|
—
|
|
—
|
|
—
|
|
—
|
|
—
|
|
(4,105
|
)
|
(4,105
|
)
|
|||||||||||||||
|
Unrealized loss on foreign currency translation
|
—
|
|
—
|
|
—
|
|
—
|
|
(123
|
)
|
—
|
|
—
|
|
(123
|
)
|
|||||||||||||||
|
Unrealized gain on short-term investments
|
—
|
|
—
|
|
—
|
|
—
|
|
261
|
|
—
|
|
—
|
|
261
|
|
|||||||||||||||
|
Balance at December 31, 2015
|
50,651,239
|
|
51
|
|
(34,640
|
)
|
633,146
|
|
(215
|
)
|
(288,131
|
)
|
3,944
|
|
314,155
|
|
|||||||||||||||
|
Net loss attributable to Acacia Research Corporation
|
—
|
|
—
|
|
—
|
|
—
|
|
—
|
|
(54,067
|
)
|
—
|
|
(54,067
|
)
|
|||||||||||||||
|
Stock options exercised
|
100,992
|
|
—
|
|
—
|
|
326
|
|
—
|
|
—
|
|
—
|
|
326
|
|
|||||||||||||||
|
Compensation expense for share-based awards, net of forfeitures
|
(262,660
|
)
|
(1
|
)
|
—
|
|
9,063
|
|
—
|
|
—
|
|
—
|
|
9,062
|
|
|||||||||||||||
|
Repurchase of restricted common stock
|
(13,529
|
)
|
—
|
|
—
|
|
(82
|
)
|
—
|
|
—
|
|
—
|
|
(82
|
)
|
|||||||||||||||
|
Net loss attributable to noncontrolling interests in subsidiaries
|
—
|
|
—
|
|
—
|
|
—
|
|
—
|
|
—
|
|
(732
|
)
|
(732
|
)
|
|||||||||||||||
|
Distributions to noncontrolling interests in operating subsidiary
|
—
|
|
—
|
|
—
|
|
—
|
|
—
|
|
—
|
|
(1,358
|
)
|
(1,358
|
)
|
|||||||||||||||
|
Unrealized gain on short-term investments
|
—
|
|
—
|
|
—
|
|
—
|
|
40
|
|
—
|
|
—
|
|
40
|
|
|||||||||||||||
|
Unrealized gain on foreign currency translation
|
—
|
|
—
|
|
—
|
|
—
|
|
99
|
|
—
|
|
—
|
|
99
|
|
|||||||||||||||
|
Balance at December 31, 2016
|
50,476,042
|
|
50
|
|
(34,640
|
)
|
642,453
|
|
(76
|
)
|
(342,198
|
)
|
1,854
|
|
267,443
|
|
|||||||||||||||
|
Net income attributable to Acacia Research Corporation
|
—
|
|
—
|
|
—
|
|
—
|
|
—
|
|
22,180
|
|
—
|
|
22,180
|
|
|||||||||||||||
|
Stock options exercised
|
207,863
|
|
1
|
|
—
|
|
744
|
|
—
|
|
—
|
|
—
|
|
745
|
|
|||||||||||||||
|
Compensation expense for share-based awards, net of forfeitures
|
(35,310
|
)
|
—
|
|
—
|
|
5,844
|
|
—
|
|
—
|
|
—
|
|
5,844
|
|
|||||||||||||||
|
Repurchase of restricted common stock
|
(8,669
|
)
|
—
|
|
—
|
|
(45
|
)
|
—
|
|
—
|
|
—
|
|
(45
|
)
|
|||||||||||||||
|
Net loss attributable to noncontrolling interests in subsidiaries
|
—
|
|
—
|
|
—
|
|
—
|
|
—
|
|
—
|
|
(496
|
)
|
(496
|
)
|
|||||||||||||||
|
Unrealized gain on foreign currency translation
|
—
|
|
—
|
|
—
|
|
—
|
|
28
|
|
—
|
|
—
|
|
28
|
|
|||||||||||||||
|
Unrealized loss on short-term investments
|
—
|
|
—
|
|
—
|
|
—
|
|
(40
|
)
|
—
|
|
—
|
|
(40
|
)
|
|||||||||||||||
|
Balance at December 31, 2017
|
50,639,926
|
|
$
|
51
|
|
$
|
(34,640
|
)
|
$
|
648,996
|
|
$
|
(88
|
)
|
$
|
(320,018
|
)
|
$
|
1,358
|
|
$
|
295,659
|
|
||||||||
The accompanying notes are an integral part of these consolidated financial statements.
F- 6
ACACIA RESEARCH CORPORATION
For the Years Ended
December 31, 2017, 2016 and 2015
(In thousands)
|
|
2017
|
2016
|
2015
|
|||||||||
|
Cash flows from operating activities:
|
|
|
|
|||||||||
|
Net income (loss) including noncontrolling interests in subsidiaries
|
$
|
21,684
|
|
$
|
(54,799
|
)
|
$
|
(157,478
|
)
|
|||
|
Adjustments to reconcile net income (loss) including noncontrolling interests in subsidiaries to net cash provided by (used in) operating activities:
|
|
|
|
|
|
|
||||||
|
Gain on conversion of loans and accrued interest
|
(2,671
|
)
|
—
|
|
—
|
|
||||||
|
Gain on exercise of Primary Warrant
|
(4,616
|
)
|
—
|
|
—
|
|
||||||
|
Change in fair value of investment, net
|
(42,239
|
)
|
—
|
|
—
|
|
||||||
|
Depreciation and amortization
|
22,243
|
|
34,355
|
|
53,289
|
|
||||||
|
Non-cash stock compensation
|
8,885
|
|
9,062
|
|
11,048
|
|
||||||
|
Impairment of patent-related intangible assets
|
2,248
|
|
42,340
|
|
74,731
|
|
||||||
|
Impairment of goodwill
|
—
|
|
—
|
|
30,149
|
|
||||||
|
Other
|
(374
|
)
|
(477
|
)
|
(109
|
)
|
||||||
|
Changes in assets and liabilities:
|
|
|
|
|
|
|
||||||
|
Restricted cash
|
11,512
|
|
(787
|
)
|
(10,725
|
)
|
||||||
|
Accounts receivable
|
26,597
|
|
6,750
|
|
(13,332
|
)
|
||||||
|
Prepaid expenses and other assets
|
(135
|
)
|
1,593
|
|
(619
|
)
|
||||||
|
Accounts payable and accrued expenses / patent costs
|
(6,349
|
)
|
(3,006
|
)
|
2,570
|
|
||||||
|
Royalties and contingent legal fees payable
|
(12,307
|
)
|
(970
|
)
|
527
|
|
||||||
|
Net cash provided by (used in) operating activities
|
24,478
|
|
34,061
|
|
(9,949
|
)
|
||||||
|
Cash flows from investing activities:
|
|
|
|
|
|
|
||||||
|
Investment in Investees
|
(31,514
|
)
|
—
|
|
—
|
|
||||||
|
Advances to Investee (Note 7)
|
(4,000
|
)
|
(20,000
|
)
|
—
|
|
||||||
|
Purchases of property and equipment
|
|
(2
|
)
|
|
(4
|
)
|
|
(8
|
)
|
|||
|
Purchases of short-term investments
|
|
(448,388
|
)
|
|
(62,633
|
)
|
|
(23,296
|
)
|
|||
|
Sales and maturities of short-term investments
|
|
467,790
|
|
|
43,232
|
|
|
82,115
|
|
|||
|
Patent portfolio investment costs
|
|
—
|
|
(1,225
|
)
|
(19,504
|
)
|
|||||
|
Net cash provided by (used in) investing activities
|
|
(16,114
|
)
|
|
(40,630
|
)
|
|
39,307
|
|
|||
|
Cash flows from financing activities:
|
|
|
|
|
|
|
||||||
|
Dividends paid to stockholders
|
—
|
|
—
|
|
(25,434
|
)
|
||||||
|
Distributions to noncontrolling interests in operating subsidiary
|
—
|
|
|
(1,358
|
)
|
|
(4,105
|
)
|
||||
|
Proceeds from the exercise of stock options
|
745
|
|
|
326
|
|
|
938
|
|
||||
|
Repurchases of restricted common stock
|
(45
|
)
|
|
(82
|
)
|
|
—
|
|
||||
|
Net cash provided by (used in) financing activities
|
700
|
|
(1,114
|
)
|
(28,601
|
)
|
||||||
|
Increase (decrease) in cash and cash equivalents
|
9,064
|
|
(7,683
|
)
|
757
|
|
||||||
|
Cash and cash equivalents, beginning
|
127,540
|
|
135,223
|
|
134,466
|
|
||||||
|
Cash and cash equivalents, ending
|
$
|
136,604
|
|
$
|
127,540
|
|
$
|
135,223
|
|
|||
|
Supplemental schedule of noncash investing activities:
|
||||||||||||
|
Patent portfolio investment costs included in accrued expenses / costs
|
$
|
—
|
|
$
|
—
|
|
$
|
1,000
|
|
|||
The accompanying notes are an integral part of these consolidated financial statements.
F- 7
ACACIA RESEARCH CORPORATION
NOTES TO CONSOLIDATED FINANCIAL STATEMENTS
1. DESCRIPTION OF BUSINESS
Description of Business.
As used herein, “Acacia” and the “Company” refer to Acacia Research Corporation and/or its wholly and majority-owned and controlled operating subsidiaries, and/or where applicable, its management.
Acacia’s operating subsidiaries invest in, license and enforce patented technologies. Acacia’s operating subsidiaries partner with inventors and patent owners, applying their legal and technology expertise to patent assets to unlock the financial value in their patented inventions. Acacia also identifies opportunities to partner with high-growth and potentially disruptive technology companies. These partnerships usually involve an equity or debt investment by Acacia, along with entering into IP related agreements where Acacia provides IP and other patent related services to these companies. Acacia leverages its experience, expertise, data and relationships developed as a leader in the intellectual property (“IP”) industry to pursue these opportunities. In some cases, these opportunities will complement, and/or supplement Acacia’s primary licensing and enforcement business.
Acacia’s operating subsidiaries generate revenues and related cash flows from the granting of intellectual property rights for the use of patented technologies that its operating subsidiaries control or own. Acacia’s operating subsidiaries assist patent owners with the prosecution and development of their patent portfolios, the protection of their patented inventions from unauthorized use, the generation of licensing revenue from users of their patented technologies and, where necessary, with the enforcement against unauthorized users of their patented technologies through the filing of patent infringement litigation.
Acacia’s operating subsidiaries are principals in the licensing and enforcement effort, obtaining control of the rights in the patent portfolio, or control of the patent portfolio outright. Acacia’s operating subsidiaries own or control the rights to multiple patent portfolios, which include U.S. patents and certain foreign counterparts, covering technologies used in a wide variety of industries.
Neither Acacia nor its operating subsidiaries invent new technologies or products; rather, Acacia depends upon the identification and investment in new patents, inventions and companies that own intellectual property through its relationships with inventors, universities, research institutions, technology companies and others. If Acacia’s operating subsidiaries are unable to maintain those relationships and identify and grow new relationships, then they may not be able to identify new technology-based opportunities for sustainable revenue and/or revenue growth.
During fiscal year 2017 Acacia obtained control of
one
new patent portfolio. In fiscal year 2016, Acacia obtained control of
two
new patent portfolios, compared to
three
new patent portfolios, and
six
new patent portfolios in fiscal years 2015 and 2014, respectively.
Acacia was incorporated on January 25, 1993 under the laws of the State of California. In December 1999, Acacia changed its state of incorporation from California to Delaware.
2
. SUMMARY OF SIGNIFICANT ACCOUNTING POLICIES
Accounting Principles and Fiscal Year End.
The consolidated financial statements and accompanying notes are prepared on the accrual basis of accounting in accordance with generally accepted accounting principles in the United States of America (U.S. GAAP).
Principles of Consolidation.
The accompanying consolidated financial statements include the accounts of Acacia and its wholly and majority-owned and controlled subsidiaries. Material intercompany transactions and balances have been eliminated in consolidation.
Noncontrolling interests in Acacia’s majority-owned and controlled operating subsidiaries (“noncontrolling interests”) are separately presented as a component of stockholders’ equity. Consolidated net income or (loss) is adjusted to include the net (income) or loss attributed to noncontrolling interests in the consolidated statements of operations. Refer to the accompanying consolidated statements of stockholders’ equity for total noncontrolling interests.
A wholly owned subsidiary of Acacia is the general partner of the Acacia Intellectual Property Fund, L.P. (the “Acacia IP Fund”), which was formed in August 2010. The Acacia IP Fund is included in the Company’s consolidated financial statements since 2010, as Acacia’s wholly owned subsidiary, as the general partner, has the ability to control the operations and activities of the Acacia IP Fund.
F- 8
ACACIA RESEARCH CORPORATION
NOTES TO CONSOLIDATED FINANCIAL STATEMENTS
Revenue Recognition.
Revenue is recognized when (i) persuasive evidence of an arrangement exists, (ii) all obligations have been substantially performed pursuant to the terms of the arrangement, (iii) amounts are fixed or determinable, and (iv) the collectibility of amounts is reasonably assured.
In general, revenue arrangements provide for the payment of contractually determined fees in consideration for the grant of certain intellectual property rights for patented technologies owned or controlled by Acacia’s operating subsidiaries. These rights typically include some combination of the following: (i) the grant of a non-exclusive, retroactive and future license to manufacture and/or sell products covered by patented technologies owned or controlled by Acacia’s operating subsidiaries, (ii) a covenant-not-to-sue, (iii) the release of the licensee from certain claims, and (iv) the dismissal of any pending litigation. The intellectual property rights granted may be perpetual in nature, extending until the expiration of the related patents, or can be granted for a defined, relatively short period of time, with the licensee possessing the right to renew the agreement at the end of each contractual term for an additional minimum upfront payment. Pursuant to the terms of these agreements, Acacia’s operating subsidiaries have no further obligation with respect to the grant of the non-exclusive retroactive and future licenses, covenants-not-to-sue, releases, and other deliverables, including no express or implied obligation on Acacia’s operating subsidiaries’ part to maintain or upgrade the technology, or provide future support or services. Generally, the agreements provide for the grant of the licenses, covenants-not-to-sue, releases, and other significant deliverables upon execution of the agreement, or upon receipt of the minimum upfront payment for term agreement renewals. As such, the earnings process is complete and revenue is recognized upon the execution of the agreement, when collectibility is reasonably assured, or upon receipt of the minimum upfront fee for term agreement renewals, and when all other revenue recognition criteria have been met.
For the periods presented herein, the majority of the revenue agreements executed by the Company provided for the payment of one-time, paid-up license fees in consideration for the grant of certain intellectual property rights for patented technology owned by Acacia’s operating subsidiaries. These rights were primarily granted on a perpetual basis, extending until the expiration of the underlying patents.
Certain of the Company’s revenue arrangements provide for future royalties or additional required payments based on future licensee activities. Additional royalties are recognized in revenue upon resolution of the related contingency provided that all revenue recognition criteria, as described above, have been met. Amounts of additional royalties due under these license agreements, if any, cannot be reasonably estimated by management.
Certain of the Company’s revenue arrangements provide for the calculation of fees based on a licensee’s actual quarterly sales or actual per unit activity, applied to a contractual royalty rate. Licensees that pay fees on a quarterly basis generally report actual quarterly sales or actual per unit activity information and related quarterly fees due within
30 days
to
45 days
after the end of the quarter in which such sales or activity takes place. The amount of fees due under these revenue arrangements each quarter cannot be reasonably estimated by management. Consequently, Acacia’s operating subsidiaries recognize revenue from these revenue arrangements on a
three
-month lag basis, in the quarter following the quarter of sales or per unit activity, provided amounts are fixed or determinable and collectibility is reasonably assured. The lag method described above allows for the receipt of licensee royalty reports prior to the recognition of revenue.
Amounts related to revenue arrangements that do not meet the revenue recognition criteria described above are deferred until the revenue recognition criteria are met.
Acacia assesses the collectibility of fees receivable based on a number of factors, including past transaction history and credit-worthiness of licensees. If it is determined that collection is not reasonably assured, the fee is recognized when collectibility becomes reasonably assured, assuming all other revenue recognition criteria have been met, which is generally upon receipt of cash.
Cost of Revenues
. Cost of revenues include the costs and expenses incurred in connection with Acacia’s patent licensing and enforcement activities, including inventor royalties paid to original patent owners, contingent legal fees paid to external patent counsel, other patent-related legal expenses paid to external patent counsel, licensing and enforcement related research, consulting and other expenses paid to third-parties and the amortization of patent-related investment costs. These costs are included under the caption “Cost of revenues” in the accompanying consolidated statements of operations.
Inventor Royalties and Contingent Legal Expenses.
Inventor royalties are expensed in the consolidated statements of operations in the period that the related revenues are recognized. In certain instances, pursuant to the terms of the underlying inventor agreements, upfront advances paid to patent owners by Acacia’s operating subsidiaries are recoverable from future net revenues. Patent costs that are recoverable from future net revenues are amortized over the estimated economic useful life of
F- 9
ACACIA RESEARCH CORPORATION
NOTES TO CONSOLIDATED FINANCIAL STATEMENTS
the related patents, or as the prepaid royalties are earned by the inventor, as appropriate, and the related expense is included in amortization expense in the consolidated statements of operations. Any unamortized upfront advances recovered from net revenues are expensed in the period recovered, and included in amortization expense in the consolidated statements of operations.
Contingent legal fees are expensed in the consolidated statements of operations in the period that the related revenues are recognized. In instances where there are no recoveries from potential infringers, no contingent legal fees are paid; however, Acacia’s operating subsidiaries may be liable for certain out of pocket legal costs incurred pursuant to the underlying legal services agreement.
Fair Value Measurements.
U.S. GAAP defines fair value as the price that would be received for an asset or the exit price that would be paid to transfer a liability in the principal or most advantageous market in an orderly transaction between market participants on the measurement date, and also establishes a fair value hierarchy which requires an entity to maximize the use of observable inputs, where available. The three-level hierarchy of valuation techniques established to measure fair value is defined as follows:
|
(i)
|
Level 1
-
Observable Inputs
: Quoted prices in active markets for identical investments;
|
|
(ii)
|
Level 2
-
Pricing Models with Significant Observable Inputs
: Other significant observable inputs, including quoted prices for similar investments, interest rates, credit risk, etc.; and
|
|
(iii)
|
Level 3
-
Unobservable Inputs
: Significant unobservable inputs, including the entity’s own assumptions in determining the fair value of investments.
|
Whenever possible, the Company is required to use observable market inputs (Level 1 - quoted market prices) when measuring fair value. In such cases, the level at which the fair value measurement falls is determined based on the lowest level input that is significant to the fair value measurement. The assessment of the significance of a particular input requires judgment and considers factors specific to the asset or liability being measured. At
December 31, 2017
, all of the Company’s investments recorded at fair value were valued utilizing Level 3 - unobservable inputs. In certain cases, inputs used to measure fair value fall into different levels of the fair value hierarchy. Financial assets and liabilities measured at fair value on a recurring basis were as follows (in thousands):
|
Level 1
|
Level 2
|
Level 3
|
|||||||||
|
Assets as of December 31, 2017:
|
|
||||||||||
|
Investment at fair value (Note 7)
(1)
|
$
|
—
|
|
$
|
—
|
|
$
|
104,754
|
|
||
|
Assets as of December 31, 2016:
|
|||||||||||
|
Short-term investments
(1)
|
$
|
19,443
|
|
$
|
—
|
|
$
|
—
|
|
||
____________________
(1)
There were no transfers between fair value hierarchy categories for the period presented.
A reconciliation of the activity for fair value measurements categorized within Level 3 for the year ended
December 31, 2017
is as follows (in thousands):
|
Investment at Fair Value
|
|||||||||||
|
Common Stock
|
Warrants
|
Total
|
|||||||||
|
Opening balance as of January 1, 2017
|
$
|
—
|
|
$
|
—
|
|
$
|
—
|
|
||
|
Total gains and losses included in earnings for the period
(1)
|
|||||||||||
|
Gain on conversion of loans and accrued interest
|
2,671
|
|
—
|
|
2,671
|
|
|||||
|
Gain on exercise of Primary Warrant
|
—
|
|
4,616
|
|
4,616
|
|
|||||
|
Change in fair value of investment, net
|
33,922
|
|
8,317
|
|
42,239
|
|
|||||
|
Purchases, issues, sales and settlements
|
|
|
|
|
|||||||
|
Purchases and issues
(2)
|
54,202
|
|
1,026
|
|
55,228
|
|
|||||
|
Total recurring fair value measurements
(1)
|
$
|
90,795
|
|
$
|
13,959
|
|
$
|
104,754
|
|
||
____________________
(1)
All gains and losses included in earnings for the period presented relate to assets and liabilities held as of December 31, 2017.
(2)
Refer to Note 7 for information regarding purchase and issues activity for the years ended December 31, 2017 and 2016.
Cash and Cash Equivalents
. Acacia considers all highly liquid, short-term investments with original maturities of three months or less when purchased to be cash equivalents. For the periods presented, Acacia’s cash equivalents are comprised
F- 10
ACACIA RESEARCH CORPORATION
NOTES TO CONSOLIDATED FINANCIAL STATEMENTS
of investments in AAA rated money market funds that invest in first-tier only securities, which primarily includes: domestic commercial paper, securities issued or guaranteed by the U.S. government or its agencies, U.S. bank obligations, and fully collateralized repurchase agreements. Acacia’s cash equivalents are measured at fair value using quoted prices that represent Level 1 inputs.
Short-term Investments.
Investments in securities with original maturities of greater than three months and less than one year and other investments representing amounts that are available for current operations are classified as short-term investments, unless there are indications that such investments may not be readily sold in the short-term. The fair values of these investments approximate their carrying values. For the applicable periods presented, all of Acacia’s short-term investments were classified as available-for-sale, which are reported at fair value on a recurring basis using significant observable inputs (Level 1), with related unrealized gains and losses in the value of such securities recorded as a separate component of other comprehensive income (loss) in stockholders’ equity until realized. Realized gains and losses are recorded in the statements of operations in other income (expense). Realized and unrealized gains and losses are recorded based on the specific identification method. Interest is included in other income (expense).
Impairment of Short-term Investments.
Acacia evaluates its investments in marketable securities for potential impairment, employing a methodology on a quarterly basis that considers available quantitative and qualitative evidence. If the cost or carrying value of an investment exceeds its estimated fair value, the Company evaluates, among other factors, general market conditions, credit quality of instrument issuers, the duration and extent to which the fair value is less than cost, and the Company’s intent and ability to hold, or plans or ability to sell. Fair value is estimated based on publicly available market information or other estimates determined by management. Investments are considered to be impaired when a decline in fair value is estimated to be other-than-temporary. Acacia reviews impairments associated with its investments in marketable securities and determines the classification of any impairment as temporary or other-than-temporary. An impairment is deemed other-than-temporary unless (a) Acacia has the ability and intent to hold an investment for a period of time sufficient for recovery of its carrying amount and (b) positive evidence indicating that the investment’s carrying amount is recoverable within a reasonable period of time outweighs any evidence to the contrary. All available evidence, both positive and negative, is considered to determine whether, based on the weight of such evidence, the carrying amount of the investment is recoverable within a reasonable period of time. For investments classified as available-for-sale, unrealized losses that are other-than-temporary are recognized in the consolidated statements of operations.
Concentration of Credit Risks.
Financial instruments that potentially subject Acacia to concentrations of credit risk are cash equivalents, short-term investments and accounts receivable. Acacia places its cash equivalents and short-term investments primarily in highly rated money market funds and investment grade marketable securities. Cash and cash equivalents are also invested in deposits with certain financial institutions and may, at times, exceed federally insured limits. Acacia has not experienced any significant losses on its deposits of cash and cash equivalents.
Three licensees individually accounted for
54%
,
21%
and
10%
, respectively, of revenues recognized during the year ended
December 31, 2017
. Three licensees individually accounted for
26%
,
23%
and
11%
, respectively, of revenues recognized during the year ended
December 31, 2016
. Three licensees individually accounted for
24%
,
20%
and
16%
, respectively, of revenues recognized during the year ended
December 31, 2015
. One licensee individually represented
100%
of accounts receivable at
December 31, 2017
. Four licensees individually represented approximately
39%
,
22%
,
16%
and
15%
, respectively, of accounts receivable at
December 31, 2016
.
For
2017, 2016 and 2015
,
39%
,
79%
and
49%
, respectively, of revenues were attributable to licensees domiciled in foreign jurisdictions, based on the jurisdiction of the entity obligated to satisfy payment obligations pursuant to the applicable revenue arrangement. The Company does not have any material foreign operations.
Acacia performs credit evaluations of its licensees with significant receivable balances, if any, and has not experienced any significant credit losses. Accounts receivable are recorded at the executed contract amount and generally do not bear interest. Collateral is not required. An allowance for doubtful accounts may be established to reflect the Company’s best estimate of probable losses inherent in the accounts receivable balance, and is reflected as a contra-asset account on the balance sheet and a charge to operating expenses in the statements of operations for the applicable period. The allowance is determined based on known troubled accounts, historical experience, and other currently available evidence. There was no allowance for doubtful accounts established for the periods presented.
Fair Value of Financial Instruments.
The carrying value of cash and cash equivalents, accounts receivables, and current liabilities approximates their fair values due to their short-term maturities.
F- 11
ACACIA RESEARCH CORPORATION
NOTES TO CONSOLIDATED FINANCIAL STATEMENTS
Property and Equipment.
Property and equipment are recorded at cost. Major additions and improvements that materially extend useful lives of property and equipment are capitalized. Maintenance and repairs are charged against the results of operations as incurred. When these assets are sold or otherwise disposed of, the asset and related depreciation are relieved, and any gain or loss is included in the consolidated statements of operations for the period of sale or disposal. Depreciation and amortization is computed on a straight-line basis over the following estimated useful lives of the assets:
|
Furniture and fixtures
|
3 to 5 years
|
|
Computer hardware and software
|
3 to 5 years
|
|
Leasehold improvements
|
2 to 5 years (Lesser of lease term or useful life of improvement)
|
Rental payments on operating leases are charged to expense in the consolidated statements of operations on a straight-line basis over the lease term.
Patents.
Patents include the cost of patents or patent rights (hereinafter, collectively “patents”) acquired from third-parties or obtained in connection with business combinations. Patent costs are amortized utilizing the straight-line method over their remaining economic useful lives, ranging from
one
to
six
years.
Investments at Fair Value
. On an individual investment basis, Acacia may elect to account for investments in companies where the Company has the ability to exercise significant influence over operating and financial policies of the investee, at fair value. If the fair value option is applied to an investment that would otherwise be accounted for under the equity method of accounting, it is applied to all of the financial interests in the same entity that are eligible items (i.e. common stock and warrants).
Equity Method Investments
. Equity investments without readily determinable fair values in companies over which the Company has the ability to exercise significant influence, are accounted for using the equity method of accounting, and classified within “Equity Method Investments” in the consolidated balance sheet. Acacia includes its proportionate share of earnings and/or losses of its equity method investees in equity in earnings (losses) of investee in the consolidated statements of operations.
Impairment of Investments.
Acacia reviews its equity method investments quarterly for indicators of other-than-temporary impairment. This determination requires significant judgment. In making this judgment, Acacia considers available quantitative and qualitative evidence in evaluating potential impairment of its investments. If the cost of an investment exceeds its fair value, Acacia evaluates, among other factors, general market conditions and the duration and extent to which the fair value is less than cost. Acacia also considers specific adverse conditions related to the financial health of and business outlook for the investee, including industry and sector performance, changes in technology, and operational and financing cash flow factors. Once a decline in fair value is determined to be other-than-temporary, an impairment charge is recorded in the consolidated statements of operations and a new cost basis in the investment is established.
Impairment of Long-lived Assets.
Acacia reviews long-lived assets and intangible assets for potential impairment annually (quarterly for patents) and when events or changes in circumstances indicate the carrying amount of an asset may not be recoverable. In the event the expected undiscounted future cash flows resulting from the use of the asset is less than the carrying amount of the asset, an impairment loss is recorded equal to the excess of the asset’s carrying value over its fair value. If an asset is determined to be impaired, the loss is measured based on quoted market prices in active markets, if available. If quoted market prices are not available, the estimate of fair value is based on various valuation techniques, including a discounted value of estimated future cash flows. In the event that management decides to no longer allocate resources to a patent portfolio, an impairment loss equal to the remaining carrying value of the asset is recorded. Refer to Note
5
for additional information.
Fair value is generally estimated using the “Income Approach,” focusing on the estimated future net income-producing capability of the patent portfolios over the estimated remaining economic useful life. Estimates of future after-tax cash flows are converted to present value through “discounting,” including an estimated rate of return that accounts for both the time value of money and investment risk factors. Estimated cash inflows are typically based on estimates of reasonable royalty rates for the applicable technology, applied to estimated market data. Estimated cash outflows are based on existing contractual obligations, such as contingent legal fee and inventor royalty obligations, applied to estimated license fee revenues, in addition to other estimates of out-of-pocket expenses associated with a specific patent portfolio’s licensing and enforcement program. The analysis also contemplates consideration of current information about the patent portfolio including, status and stage of
F- 12
ACACIA RESEARCH CORPORATION
NOTES TO CONSOLIDATED FINANCIAL STATEMENTS
litigation, periodic results of the litigation process, strength of the patent portfolio, technology coverage and other pertinent information that could impact future net cash flows.
Contingent Liabilities.
The Company, from time to time, is involved in certain legal proceedings. Based upon consultation with outside counsel handling its defense in these matters and the Company’s analysis of potential outcomes, if the Company determines that a loss arising from such matters is probable and can be reasonably estimated, an estimate of the contingent liability is recorded in its consolidated financial statements. If only a range of estimated loss can be determined, an amount within the range that, based on estimates, assumptions and judgments, reflects the most likely outcome, is recorded as a contingent liability in the consolidated financial statements. In situations where none of the estimates within the estimated range is a better estimate of probable loss than any other amount, the Company records the low end of the range. Any such accrual would be charged to expense in the appropriate period. Litigation expenses for these types of contingencies are recognized in the period in which the litigation services were provided.
Certain of Acacia’s operating subsidiaries are often required to engage in litigation to enforce their patents and patent rights. In connection with any of Acacia’s operating subsidiaries’ patent enforcement actions, it is possible that a defendant may request and/or a court may rule that an operating subsidiary has violated statutory authority, regulatory authority, federal rules, local court rules, or governing standards relating to the substantive or procedural aspects of such enforcement actions. In such event, a court may issue monetary sanctions against Acacia or its operating subsidiaries or award attorney’s fees and/or expenses to a defendant(s), which could be material, and if required to be paid by Acacia or its operating subsidiaries, could materially harm the Company’s operating results and financial position.
Stock-Based Compensation.
The compensation cost for all stock-based awards is measured at the grant date, based on the fair value of the award, and is recognized as an expense on a straight-line basis over the employee’s requisite service period (generally the vesting period of the equity award) which is generally two to four years. The fair value of restricted stock and restricted stock unit awards is determined by the product of the number of shares or units granted and the grant date market price of the underlying common stock. The fair value of each option award is estimated on the date of grant using a Black-Scholes option-pricing model. Stock-based compensation expense for awards with service and/or performance conditions that affect vesting is recorded only for those awards expected to vest using an estimated forfeiture rate.
The FASB issued a new standard, effective January 1, 2017, that allows entities to make a policy election to either estimate the number of awards that are expected to vest or account for forfeitures when they occur. Effective January 1, 2017, the Company elected to account for forfeitures of awards as they occur. The prior standard required the Company to estimate the number of awards for which the requisite service period is expected to be rendered and base the accruals of compensation cost on the estimated number of awards that will vest.
The fair values of stock options granted during the periods presented were estimated using the Black-Scholes option-pricing model, based on the following weighted-average assumptions:
|
For the Years Ended
|
|||
|
December 31, 2017
|
December 31, 2016
|
||
|
Risk-free interest rate
|
1.77%
|
1.1%
|
|
|
Term
|
4.37
|
3.06
|
|
|
Volatility
|
51%
|
53%
|
|
|
Dividend yield
|
—%
|
—%
|
|
Due to a lack of sufficient historical stock option exercise experience, the Company utilized the simplified method for estimating the expected term for stock options granted during the periods presented. Expected volatility is based on the historical volatility of the Company’s stock for the length of time corresponding to the expected term of the option. The risk-free interest rate is based on the U.S. treasury yield curve on the grant date for the expected term of the option.
Restricted stock awards and stock option awards with performance-based vesting conditions generally vest based upon the Company achieving specified cash flow performance targets over a one and two-year period from the date of grant.
Performance-based stock options awards with market-based vesting conditions vest based upon the Company achieving specified stock price targets over a four-year period. The effect of a market condition is reflected in the estimate of the grant-date fair value of the options utilizing a Monte Carlo valuation technique. Compensation cost is recognized for an option with a market-based vesting condition provided that the requisite service is rendered, regardless of when, if ever, the market condition is satisfied. The service period for options with a market-based vesting condition is inferred from the
F- 13
ACACIA RESEARCH CORPORATION
NOTES TO CONSOLIDATED FINANCIAL STATEMENTS
application of the Monte Carlo valuation technique. The derived service period represents the duration of the median of the distribution of share price paths on which the market condition is satisfied. The duration is the period of time from the service inception date to the expected date of satisfaction, as determined from the valuation technique. Assumptions utilized in connection with the Monte Carlo valuation technique included: estimated risk-free interest rate; expected volatility; and expected dividend yield. The risk-free interest rate was determined based on the yields available on U.S. Treasury zero-coupon issues. The expected stock price volatility was determined using historical volatility. The expected dividend yield was based on expectations regarding dividend payments.
Profits Interest Units (“Units”) are accounted for in accordance with Accounting Standards Codification (“ASC”) 718-10, “Compensation - Stock Compensation.” The Units vest as described at Note
10
, and therefore, the vesting conditions do not meet the definition of service, market or performance conditions, as defined in ASC 718. As such, the Units are classified as liability awards. Liability classified awards are measured at fair value on the grant date and re-measured each reporting period at fair value until the award is settled. Compensation expense is adjusted each reporting period for changes in fair value prorated for the portion of the requisite service period rendered. Initially, compensation expense was recognized on a straight-line basis over the employee’s requisite service period (generally the vesting period of the equity award) which was five years. Upon full vesting of the award, which occurred during the three months ended September 30, 2017, previously unrecognized compensation expense was immediately recognized in the period, and will continue to be fully recognized for any changes in fair value, until the Units are settled. Non-cash stock compensation expense related to the Units is reflected in general and administrative expense in the accompanying consolidated statements of operations.
Income Taxes.
Income taxes are accounted for using an asset and liability approach that requires the recognition of deferred tax assets and liabilities for the expected future tax consequences of events that have been recognized in Acacia’s consolidated financial statements or consolidated income tax returns. A valuation allowance is established to reduce deferred tax assets if all, or some portion, of such assets will more than likely not be realized, or if it is determined that there is uncertainty regarding future realization of such assets.
Under U.S. generally accepted accounting principles, a tax position is a position in a previously filed tax return or a position expected to be taken in a future tax filing that is reflected in measuring current or deferred income tax assets and liabilities. Tax positions are recognized only when it is more likely than not (likelihood of greater than 50%), based on technical merits, that the position will be sustained upon examination. Tax positions that meet the more likely than not threshold are measured using a probability weighted approach as the largest amount of tax benefit that is greater than 50% likely of being realized upon settlement.
Segment Reporting.
Acacia uses the management approach, which designates the internal organization that is used by management for making operating decisions and assessing performance as the basis of Acacia’s reportable segments. Acacia’s patent licensing and enforcement business constitutes its single reportable segment.
Use of Estimates
. The preparation of financial statements in conformity with generally accepted accounting principles in the United States of America requires management to make estimates and assumptions that affect the reported amount of assets and liabilities and disclosure of contingent assets and liabilities at the date of the consolidated financial statements and the reported amounts of revenues and expenses during the reporting period. Actual results could differ from these estimates. Acacia believes that, of the significant accounting policies described herein, the accounting policies associated with revenue recognition, the valuation of the loan and equity instruments discussed at Note
7
, stock-based compensation expense including the valuation of profits interests, impairment of patent-related intangible assets, the determination of the economic useful life of amortizable intangible assets, income taxes and valuation allowances against net deferred tax assets, require its most difficult, subjective or complex judgments.
Income (Loss) Per Share.
The Company computes net income (loss) attributable to common stockholders using the two-class method required for capital structures that include participating securities. Under the two-class method, securities that participate in non-forfeitable dividends, such as the Company’s outstanding unvested restricted stock, are considered “participating securities.”
In applying the two-class method, (i) basic net income (loss) per share is computed by dividing net income (loss) (less any dividends paid on participating securities) by the weighted average number of shares of common stock and participating securities outstanding for the period and (ii) diluted earnings per share may include the additional effect of other securities, if dilutive, in which case the dilutive effect of such securities is calculated by applying the two-class method and the treasury stock method to the assumed exercise or vesting of potentially dilutive common shares. The method yielding the more dilutive result is ultimately reported for the applicable period. Potentially dilutive common stock equivalents primarily consist of
F- 14
ACACIA RESEARCH CORPORATION
NOTES TO CONSOLIDATED FINANCIAL STATEMENTS
employee stock options, and restricted stock units for calculations utilizing the two-class method, and also include unvested restricted stock, when utilizing the treasury method.
The following table presents the weighted-average number of common shares outstanding used in the calculation of basic and diluted income per share:
|
|
2017
|
|
2016
|
2015
|
||||||||
|
Numerator (in thousands):
|
||||||||||||
|
Basic and Diluted
|
||||||||||||
|
Net income (loss) attributable to Acacia Research Corporation
|
$
|
22,180
|
|
$
|
(54,067
|
)
|
$
|
(160,036
|
)
|
|||
|
Undistributed earnings allocated to participating securities
|
(33
|
)
|
—
|
|
—
|
|
||||||
|
Total dividends declared / paid
|
—
|
|
—
|
|
(25,434
|
)
|
||||||
|
Dividends attributable to common stockholders
|
—
|
|
—
|
|
24,740
|
|
||||||
|
Net income (loss) attributable to common stockholders – basic and diluted
|
$
|
22,147
|
|
$
|
(54,067
|
)
|
$
|
(160,730
|
)
|
|||
|
Denominator:
|
||||||||||||
|
Weighted-average shares used in computing net loss per share attributable to common stockholders – basic
|
50,495,119
|
|
50,075,847
|
|
49,505,817
|
|
||||||
|
Effect of potentially dilutive securities:
|
||||||||||||
|
Common stock options and restricted stock units
|
196,893
|
|
—
|
|
—
|
|
||||||
|
Weighted-average shares used in computing net income (loss) per share attributable to common stockholders – diluted
|
50,692,012
|
|
50,075,847
|
|
49,505,817
|
|
||||||
|
Basic and diluted net loss per common share
|
$
|
0.44
|
|
$
|
(1.08
|
)
|
$
|
(3.25
|
)
|
|||
|
Anti-dilutive equity-based incentive awards excluded from the computation of diluted loss per share
|
4,425,187
|
|
3,682,532
|
|
71,468
|
|
||||||
Treasury Stock
. Repurchases of the Company’s outstanding common stock are accounted for using the cost method. The applicable par value is deducted from the appropriate capital stock account on the formal or constructive retirement of treasury stock. Any excess of the cost of treasury stock over its par value is charged to additional paid-in capital, and reflected as Treasury Stock on the consolidated balance sheets.
Recent Accounting Pronouncements - Not Yet Adopted.
In May 2014, the FASB issued a new accounting standards update addressing revenue from contracts with customers, which clarifies existing accounting literature relating to how and when a company recognizes revenue. Under the standard, a company will recognize revenue when it transfers promised goods or services to customers in an amount that reflects the consideration to which the company expects to be entitled in exchange for those goods and services. In doing so, the Company may be required to use more judgment and make more estimates in connection with the accounting for revenue contracts with customers than under existing guidance. Such areas may include identifying performance obligations in the contract, estimating the timing of satisfaction of performance obligations, determining whether a promise to grant a license is distinct from other promised goods or services, evaluating whether a license transfers to a customer at a point in time or over time, allocating the transaction price to separate performance obligations, determining whether contracts contain a significant financing component, and estimating revenues recognized at a point in time for sales or usage based royalties. Under the standard, (i) an entity should account for a promise to provide a customer with a right to access the entity’s intellectual property as a performance obligation satisfied over time because the customer will simultaneously receive and consume the benefit from the entity’s performance of providing access to its intellectual property as the performance occurs, and (ii) an entity’s promise to provide a customer with the right to use its intellectual property is satisfied at a point in time. In addition, revenues from contracts with significant financing components should be recognized at an amount that reflects the price that a customer would have paid if the customer had paid cash for the goods or services when they transfer to the customer (i.e. adjustment for the time value of money). For sales and usage based royalties, the new standard requires that the Company include in the transaction price some or all of an amount of estimated variable consideration to the extent that it is probable that a significant reversal in the amount of cumulative revenue recognized will not occur when the uncertainty associated with the variable consideration is subsequently resolved.
The amendments for this new accounting standard update are effective for interim and annual reporting periods beginning after December 15, 2017, and are to be applied retrospectively or via the cumulative effect as of the date of adoption,
F- 15
ACACIA RESEARCH CORPORATION
NOTES TO CONSOLIDATED FINANCIAL STATEMENTS
with early application not permitted. The Company expects to use the modified retrospective method of adoption and will recognize the cumulative effect of initially applying the new revenue standard as an adjustment to the opening balance of retained earnings in the period of initial application (first quarter of 2018 for Acacia). Comparative prior year periods would not be adjusted. The preliminary estimate of the cumulative effect of initially applying the new revenue standard is an decrease to beginning accumulated deficit of
$3.0 million
, primarily relating to financing components of contracts executed in prior periods and estimates of variable consideration for sales and usage based royalty agreements executed in prior periods. Management continues to assess the impact of this new standard on the Company’s consolidated financial statements and related disclosures, including ongoing contract reviews. Preliminary estimates of the adjustment upon initial adoption may change in connection with completion of the Company’s adoption procedures in the first quarter of 2018.
In February 2016, the FASB issued an accounting standard update which requires lessees to recognize most leases on the balance sheet. This is expected to increase both reported assets and liabilities. The new lease standard does not substantially change lessor accounting. For public companies, the standard will be effective for the first interim reporting period within annual periods beginning after December 15, 2018, although early adoption is permitted. Lessees and lessors will be required to apply the new standard at the beginning of the earliest period presented in the financial statements in which they first apply the new guidance, using a modified retrospective transition method. The requirements of this standard include a significant increase in required disclosures. Management is currently assessing the impact that adopting this new accounting guidance will have on its financial statements and footnote disclosures.
In May 2017, the FASB issued amended guidance to clarify when to account for a change to the terms or conditions of a share-based payment award as a modification. Under the new guidance, modification accounting is required only if the fair value, the vesting conditions or the classification of the award changes as a result of the change in terms or conditions. This amendment is effective prospectively for annual periods beginning on or after December 15, 2017, with early adoption
permitted. Management is currently assessing the impact that adopting this new accounting guidance will have on its financial statements and footnote disclosures.
Recently Adopted Accounting Pronouncements - Recently Adopted.
In March 2016, the FASB issued a new standard that changes the accounting for certain aspects of share-based payments to employees. The new guidance requires all income tax effects of awards to be recognized in the income statement when the awards vest or are settled. It also allows an employer to repurchase more of an employee’s shares than previously allowed for tax withholding purposes without triggering liability accounting and to make a policy election for forfeitures as they occur. The guidance is effective for public business entities for fiscal years beginning after December 15, 2016, and interim periods within those years. The adoption of this standard did not have a material impact on the Company’s consolidated financial statements.
3. SHORT-TERM INVESTMENTS
Short-term investments for the periods presented were comprised of the following (in thousands):
|
December 31, 2016
|
|||||||||||||||
|
Security Type
|
Cost
|
Gross Unrealized Gains
|
Gross Unrealized Losses
|
Fair Value
|
|||||||||||
|
U.S. government fixed income securities
|
$
|
19,403
|
|
$
|
40
|
|
$
|
—
|
|
$
|
19,443
|
|
|||
There were no short-term investments at December 31, 2017. Short-term investments at December 31, 2016 were comprised of investments in highly liquid, AAA, U.S. government fixed income securities with maturity dates in
2017
.
For the years ended
December 31, 2017
and 2016, proceeds from the sale of short-term investments classified as available-for-sale were
$467,790,000
and
$43,232,000
, respectively. Gross unrealized gains and losses were not material for the years ended
December 31, 2017
and 2016. For the year ended
December 31, 2015
, proceeds from the sale of short-term investments were
$82,115,000
and gross realized losses were
$617,000
.
F- 16
ACACIA RESEARCH CORPORATION
NOTES TO CONSOLIDATED FINANCIAL STATEMENTS
4
. ACCOUNTS PAYABLE AND ACCRUED EXPENSES
Accounts payable and accrued expenses consist of the following at
December 31, 2017 and 2016
(in thousands):
|
|
2017
|
2016
|
||||||
|
Payroll and other employee benefits
|
$
|
465
|
|
$
|
1,593
|
|
||
|
Accrued vacation
|
294
|
|
533
|
|
||||
|
Accrued legal expenses - patent
|
5,479
|
|
6,564
|
|
||||
|
Foreign taxes payable
|
15
|
|
3,150
|
|
||||
|
Accrued consulting and other professional fees
|
1,364
|
|
1,967
|
|
||||
|
Other accrued liabilities
|
339
|
|
476
|
|
||||
|
|
$
|
7,956
|
|
$
|
14,283
|
|
||
5
. PATENTS
Acacia’s only identifiable intangible assets are patents and patent rights, with estimated remaining economic useful lives ranging from
one
to
six years
. For all periods presented, all of Acacia’s identifiable intangible assets were subject to amortization. The gross carrying amounts and accumulated amortization related to investments in intangible assets as of
December 31, 2017 and 2016
are as follows (in thousands):
|
|
2017
|
2016
|
||||||
|
Gross carrying amount - patents
|
$
|
444,137
|
|
$
|
444,362
|
|
||
|
Accumulated amortization - patents
(1)
|
(382,220
|
)
|
(358,043
|
)
|
||||
|
Patents, net
|
$
|
61,917
|
|
$
|
86,319
|
|
||
(1)
Includes patent impairment charges for the applicable periods.
The weighted-average remaining estimated economic useful life of Acacia’s patents and patent rights is
4 years
. Scheduled annual aggregate amortization expense is estimated to be
$20,542,000
in 2018,
$18,527,000
in 2019,
$6,134,000
in 2020,
$5,261,000
in 2021,
$5,256,000
in 2022 and
$6,197,000
thereafter.
For the years ended
December 31, 2017, 2016 and 2015
, Acacia paid patent investment costs totaling
$0
,
$1,225,000
and
$19,504,000
, respectively. The patents have initial estimated economic useful lives ranging from
two
to
seven years
.
Acacia recorded impairment of patent-related intangible asset charges totaling $
2,248,000
,
$42,340,000
and
$74,731,000
for the years ended
December 31, 2017, 2016 and 2015
, respectively. The impairment charges related to impairments of patent portfolios due to a reduction in expected estimated future net cash flows and certain patent portfolios that management determined it would no longer allocate future resources to in connection with the licensing and enforcement of such portfolios, due primarily to adverse litigation outcomes, potential prior art related complexities and/or the overall determination that future resources would be allocated to other licensing and enforcement programs with higher potential return profiles. The impairment charges for the periods presented consisted of the excess of the asset’s carrying value over its estimated fair value.
In December 2015, Acacia’s subsidiary Adaptix, Inc. received a jury verdict in its case against Alcatel Lucent USA, Inc., and others. The jury returned a verdict that the asserted claims of the patent at issue were invalid and non-infringed. The Adaptix trial loss resulted in a reduction in estimated cash flows for the Adaptix portfolio expected to be realized from future licensing and enforcement activities, leading to partial impairment charges on the portfolio in the fourth quarter of 2015. Fiscal year 2016 patent impairment charges included the impairment of the remaining carrying value for the Adapitx portfolio. In addition, for the year ended December 31, 2015 analysis, management considered the impact of the fourth quarter 2015 adverse trial outcomes on its estimates of future cash flows that could be realized from future licensing and enforcement activities for other patent portfolios. Estimates of future cash flows for these portfolios were reduced in part in connection with the Company’s assessment of probabilities of realization given the recent adverse trial outcomes. Additionally, patent impairment charges include the carrying value of other patent portfolios for which, in 2015, the Company experienced adverse litigation or trial outcomes, leading to a reduction in or elimination of expected future cash flows. In addition, headcount reductions and internal staff optimization efforts led to changes with respect to which patent portfolios the Company intends to allocate
F- 17
ACACIA RESEARCH CORPORATION
NOTES TO CONSOLIDATED FINANCIAL STATEMENTS
licensing and enforcement resources to in future periods. As such, certain portfolio programs were selected for termination due to a decision to no longer pursue or allocate resources, resulting in a write-off any remaining carrying value in the fourth quarter of 2015.
6
. GOODWILL IMPAIRMENT CHARGE (Fiscal Year 2015)
Goodwill Impairment Testing - December 31, 2015.
At December 31, 2015, prior to the completion of the annual goodwill impairment test, the goodwill balance totaled
$30.1 million
. Goodwill is tested for impairment at the Company’s single reporting unit level on an annual basis and between annual tests if an event occurs or circumstances change that would more likely than not reduce the fair value of a reporting unit below its carrying value. Factors considered important, which could trigger an impairment review, include the following:
|
•
|
significant consistent gradual decline in the Company’s stock price for a sustained period;
|
|
•
|
significant underperformance relative to expected historical or projected future operating results;
|
|
•
|
significant changes in the manner of use of assets or the strategy for the Company’s overall business;
|
|
•
|
significant negative industry or economic trends; and
|
|
•
|
significant adverse changes in legal factors or in the business climate, including adverse regulatory actions or assessments.
|
In connection with Acacia’s annual goodwill impairment testing for 2015, the Company identified several qualitative factors triggering an impairment test at December 31, 2015, as follows:
|
•
|
Adverse legal outcomes and changes in legal factors.
In December 2015, Acacia announced that its subsidiary Adaptix, Inc. received a jury verdict in its case against Alcatel Lucent USA, et al., deciding that the claims of the applicable patents in suit were invalid and non-infringed. This adverse legal outcome and others in the fourth quarter of 2015 resulted in changes in estimates of realization related to litigation outcomes in future periods for certain patent portfolios.
|
|
•
|
Significant consistent gradual decline in the Company’s stock price.
Historically, the Company’s stock price had been volatile, and the volatility continued during fiscal 2015, declining from
$16.72
as of January 2, 2015, to
$4.29
as of December 31, 2015, a 74% decline. In addition, subsequent to December 31, 2015, the Company’s stock price volatility has continued, trending downward. In the fourth quarter of 2015, given the continued decline in stock price up through December 31, 2015, and the impact of the December 2015 adverse trial outcomes noted above, the gradual consistent decline in the Company’s stock price was deemed to be sustained, and hence indicative of a reduction in the estimated fair value of the Company, as reflected in its lower overall market capitalization.
|
|
•
|
Changes in Company Management and Resource Allocations.
In connection with certain resource allocation changes within the organization given a change in management in the fourth quarter of 2015, headcount reductions and internal staff optimization efforts occurred, which led to changes with respect to estimates of which patent portfolios the Company intends to continue to allocate licensing and enforcement resources to in future periods. As such, certain patent portfolio programs were selected for termination due to a decision to no longer allocate resources. In addition, changes in estimates regarding the best and highest use of certain patent portfolios were made, resulting in reductions in estimated future cash flows.
|
At December 31, 2015, the Company utilized the following methods and assumptions in its annual goodwill impairment testing, which was prepared with the assistance of a third-party valuation specialist:
|
•
|
At December 31, 2015, the initial qualitative assessment included consideration of the factors described above, resulting in a conclusion that as of December 31, 2015, the consistent gradual decline in the Company’s stock price was sustained. The Company also considered the impact of the December 2015 adverse trial outcomes on the Company’s stock price and related estimates of fair value for remaining portfolio opportunities. Based on the Company’s assessment of these factors, the Company determined that it was more likely than not that goodwill was impaired, constituting a triggering event requiring a goodwill impairment test as of December 31, 2015.
|
|
•
|
The Company conducted the first step of the goodwill impairment test for its single reporting unit as of December 31, 2015. The Company utilized the market capitalization plus cost synergies approach to estimate the fair value of the Company. The estimated market capitalization was determined by multiplying the Company’s stock price and the common shares outstanding as of December 31, 2015. Management also considered a control premium in its
|
F- 18
ACACIA RESEARCH CORPORATION
NOTES TO CONSOLIDATED FINANCIAL STATEMENTS
estimate of fair value for the Company’s single reporting unit. The cost synergies were estimated based on the cost savings which could be achieved if the Company was acquired by a competitor in the same operating business.
|
•
|
Based on the analysis utilizing the market capitalization plus cost synergies approach, the estimated fair value of the reporting unit of
$252 million
was below its carrying value of
$344.3 million
as of December 31, 2015, and therefore, goodwill was determined to be more likely than not, impaired.
|
|
•
|
The purpose of step 2 of the analysis was to determine the estimated fair value of the assets and liabilities of the Company’s reporting unit, in order to determine the implied fair value of goodwill for the reporting unit. The excess, if any, of the fair value of a reporting unit over the amounts assigned to its assets and liabilities is the implied fair value of goodwill. Based upon the analysis performed, the fair value of the Company’s single reporting unit did not exceed the amounts assigned to its reporting unit assets and liabilities, resulting in a difference between the implied fair value of goodwill of zero and the historical carrying value of goodwill. As a result, the Company recognized a goodwill impairment charge totaling
$30.1 million
in the fourth quarter of 2015.
|
7
. INVESTMENTS
Investment at Fair Value
Veritone Investment Agreement.
On August 15, 2016, Acacia entered into an Investment Agreement with Veritone, Inc. (“Veritone”), which provided for Acacia to invest up to
$50 million
in Veritone, consisting of both debt and equity components. Pursuant to the Investment Agreement, on August 15, 2016, Acacia entered into a secured convertible promissory note with Veritone (the “Veritone Loans”), which permitted Veritone to borrow up to
$20 million
through two
$10 million
advances, each bearing interest at the rate of
6.0%
per annum (included in Other Income (Expense) in the consolidated statements of operations). On August 15, 2016, Acacia funded the initial
$10 million
loan (the “First Loan”). On November 25, 2016, Acacia funded the second
$10 million
loan (the “Second Loan”). The First Loan and the Second Loan were due and payable on November 25, 2017. In conjunction with the First Loan and Second Loan, Veritone issued Acacia a total of three four-year
$700,000
warrants to purchase shares of Veritone’s common stock at an exercise price of
$13.6088
per share. Veritone’s initial public offering date was May 12, 2017. Upon Veritone’s consummation of its public offering of its common stock on May 17, 2017 (“IPO”), all outstanding principal and accrued interest under the Veritone Loans, totaling
$20.7 million
, automatically converted into
1,523,746
shares of Veritone’s common stock based on a conversion price of
$13.6088
per share.
In addition, in August 2016, Veritone issued Acacia a five-year Primary Warrant to purchase up to
$50 million
, less all converted amounts or amounts repaid under the Veritone Loans, worth of shares of Veritone’s common stock at an exercise price of
$13.6088
per share. Pursuant to an amendment to the Primary Warrant effective March 15, 2017, the Primary Warrant was exercised automatically upon the consummation of Veritone’s IPO, resulting in the purchase by Acacia of an additional
2,150,335
shares of Veritone common stock, at an aggregate purchase price of
$29.3 million
. Immediately following Acacia’s exercise of the Primary Warrant in full, Veritone issued to Acacia an additional 10% Warrant that provides for the issuance of an additional
809,400
shares of Veritone common stock at an exercise price of
$13.6088
per share, with 50% of the shares underlying the 10% Warrant vesting as of the issuance date of the 10% Warrant, and the remaining 50% of the shares underlying the 10% warrant vesting on the first anniversary of the issuance date of the 10% Warrant.
Veritone Bridge Loan
. On March 14, 2017, Acacia entered into an additional secured convertible promissory note with Veritone (the “Veritone Bridge Loan”), which permitted Veritone to borrow up to an additional
$4.0 million
, bearing interest at the rate of
8.0%
per annum. On March 17, 2017, Acacia funded the initial
$1.0 million
advance (the “First Bridge Loan”). On April 14, 2017, Acacia funded the second
$1.0 million
advance (the “Second Bridge Loan”). All advances and accrued interest under the Veritone Bridge Loan were due and payable on November 25, 2017. In May 2017, pursuant to the terms of the Veritone Bridge Loan, Acacia elected to make an additional advance to Veritone totaling
$2.0 million
, representing all principal amounts not advanced upon Veritone’s consummation of its IPO. Upon consummation of Veritone’s IPO, the outstanding principal and accrued interest under the Veritone Bridge Loan of
$4.0 million
and
$21,000
, respectively, automatically converted into
295,440
shares of Veritone’s common stock at a conversion price of
$13.6088
per share.
In conjunction with the Veritone Bridge Loan, Veritone issued to Acacia (i)
60,000
shares of Veritone common stock (“Upfront Shares”), (ii)
90,000
shares of Veritone common stock (the “Bridge Installment Shares”), and (iii) 10-year warrants to purchase up to
157,000
shares of Veritone common stock with other terms and conditions similar to the warrants described above.
F- 19
ACACIA RESEARCH CORPORATION
NOTES TO CONSOLIDATED FINANCIAL STATEMENTS
All share amounts above have been adjusted to reflect a 0.6-for-1 reverse stock split of Veritone’s common stock, which was effected by Veritone in April 2017. The Veritone common shares are subject to a lock-up agreement that expires on February 15, 2018, subsequent to which the shares may be sold pursuant to Rule 144, subject to volume limitations and Rule 144 filing requirements, as well as other restrictions under applicable securities laws. All of the Veritone common stock held by Acacia was unregistered as of the issue date and are unregistered as of December 31, 2017.
Accounting Prior to Veritone IPO
. Prior to conversion, Acacia’s Investment Agreement and the Veritone Bridge Loan represented variable interests in Veritone for which Acacia was not the primary beneficiary, primarily due to a lack of a controlling interest in Veritone. In addition, the Veritone Loans and Veritone Bridge Loan (the “Loans”) were not considered in-substance common stock, the common stock purchase warrants were unexercised, and the right to receive the Upfront Shares and the Bridge Installment shares (“Veritone Shares”) were considered in-substance common stock, however, application of the equity method was not material, therefore, the equity method of accounting was not applied prior to the IPO.
Prior to conversion, the Loans and the related common stock purchase warrants and Veritone Shares were accounted for as separate units of account based on the relative estimated fair values of the separate units as of the effective date of the respective transactions, with the face amount of the loans allocated to (1) the Loans, which were accounted for as long-term loan receivables and (2) the common stock purchase warrants and Veritone Shares. The estimated relative fair value allocation was determined using a Monte Carlo simulation model. Key inputs to the model included the estimated value of Veritone’s equity on the effective date of the transactions, related volatility of equity assumptions, discounts for lack of marketability, assumptions related to liquidity scenarios, and assumptions related to recovery scenarios on the Loans. Assumptions used in connection with estimating the relative fair values included: (1) volatility ranging from
40%
to
50%
, (2) financing probabilities ranging from
25%
to
75%
, (3) marketability discount of
7%
and (4)
100%
investment recovery assumption. The loan discount, representing the difference between the face amount of the Loans and the relative fair value allocated to the Loans, was accreted over the expected life of the Loans, using the effective interest method, with the related interest amounts reflected in other income (expense) in the consolidated statements of operations. As of May 2017, the unamortized loan discount totaled
$1.7 million
. Interest income for the year ended
December 31, 2017
was
$1.1 million
, including accretion of the loan discount of
$630,000
. The effective yield on the Loans for the year ended
December 31, 2017
ranged from
9%
to
53%
.
Accounting Subsequent to Veritone IPO
. Upon Veritone’s consummation of its IPO on May 17, 2017, the Loans were converted into shares of Veritone common stock and the Primary Warrant was automatically exercised in full, as described above, resulting in a
20%
ownership interest in Veritone (excluding warrants). Based on Acacia’s representation on the Veritone board of directors and Acacia’s
20%
ownership interest in Veritone, Acacia management determined that the equity method of accounting was applicable. Upon becoming eligible for the equity method of accounting, Acacia elected to apply the fair value option to account for its equity investment in Veritone, including all of its investments in Veritone common stock and warrants, due to the availability of quoted prices in an active market for the Veritone common stock. As of
December 31, 2017
, Acacia’s ownership interest in Veritone, on a fully-diluted basis, was approximately
23%
.
Acacia’s equity investment in Veritone common shares is recorded at fair value based on the quoted market price of Veritone’s common stock on The NASDAQ Global Market (the “NASDAQ”) on the applicable valuation date, as adjusted for an estimated discount for lack of marketability (“DLOM”) associated with the restricted nature of the common shares acquired (Level 3 input). Acacia’s investment in Veritone warrants is recorded at fair value, as adjusted for an estimated DLOM, based on the Black-Scholes option-pricing model, utilizing the following assumptions at
December 31, 2017
: risk-free interest rates ranging from
1.94%
to
2.37%
; expected terms ranging from
three
to
nine years
; volatilities ranging from
45%
to
55%
; and a dividend yield of
zero
. The DLOM for the Veritone common stock and warrants was estimated utilizing a Finnerty model with the following results and assumptions:
|
Veritone Common Stock
|
Veritone Warrants
|
||||||||||
|
IPO Date
|
December 31, 2017
|
IPO Date
|
December 31, 2017
|
||||||||
|
Estimated DLOM applied
|
5.7%
|
5%
|
5.7%
|
10%
|
|||||||
|
Volatility assumptions
|
35%
|
37%
|
35%
|
72
|
%
|
-
|
87%
|
||||
|
Term assumptions
|
6 months
|
2 months
|
6 months
|
5 months
|
|||||||
At
December 31, 2017
, the fair value of the
4,119,521
shares of Veritone common stock owned by Acacia totaled
$90,795,000
. At
December 31, 2017
, the fair value of the
1,120,432
common stock purchase warrants held by Acacia totaled
$13,959,000
. A 10% increase in the DLOM assumptions utilized at all applicable valuation dates would result in an approximate 10% decrease in the fair value of our investment in Veritone at
December 31, 2017
, and a corresponding decrease in the net investment gain reflected in the consolidated statements of operations for the year ended
December 31, 2017
.
F- 20
ACACIA RESEARCH CORPORATION
NOTES TO CONSOLIDATED FINANCIAL STATEMENTS
Changes in the fair value of Acacia’s investment in Veritone are recorded as unrealized gains or losses in the consolidated statements of operations. For the period from the IPO on May 17, 2017 to
December 31, 2017
, the accompanying consolidated statements of operations reflected the following (in thousands):
__________________________
|
2017
|
||||
|
Gain on conversion of loans and accrued interest
(1)
|
$
|
2,671
|
|
|
|
Gain on exercise of warrant
(2)
|
4,616
|
|
||
|
Change in fair value of investment, warrants
|
8,317
|
|
||
|
Change in fair value of investment, common stock
|
33,922
|
|
||
|
Net unrealized gain on investment at fair value
|
$
|
49,526
|
|
|
(1)
Pre-conversion difference between carrying value of Loan and accrued interest and the estimated fair value of common stock discounted for lack of marketability.
(2)
Pre-conversion difference between carrying value of Primary Warrant and the estimated fair value of common stock and 10% Warrant discounted for lack of marketability.
Summarized financial information for Veritone, presented on a three month lag basis, is as follows (in thousands, except per share amounts):
|
|
Nine Months Ended
September 30, 2017
|
|||
|
(Unaudited)
|
||||
|
Revenues
|
$
|
10,914
|
|
|
|
Gross profit
|
10,090
|
|
||
|
Operating expenses
|
44,024
|
|
||
|
Other income (expense), net
|
(12,872
|
)
|
||
|
Net loss attributable to common stockholders
|
(51,281
|
)
|
||
|
Net loss per share attributable to common stockholders - basic and diluted
|
$
|
(5.94
|
)
|
|
|
|
September 30,
2017 |
|||
|
Current assets
|
$
|
78,509
|
|
|
|
Noncurrent assets
|
1,173
|
|
||
|
Total Assets
|
$
|
79,682
|
|
|
|
Current liabilities
|
$
|
31,836
|
|
|
|
Noncurrent liabilities
|
14
|
|
||
|
Total liabilities
|
31,850
|
|
||
|
Preferred stock
|
—
|
|
||
|
Total stockholders’ equity (deficit)
|
47,832
|
|
||
|
Total liabilities, preferred stock and stockholders’ equity
|
$
|
79,682
|
|
|
Equity Method Investment
In June 2017, Acacia made an investment in Miso Robotics, Inc. (“Miso Robotics”), an innovative leader in robotics and artificial intelligence solutions, totaling
$2,250,000
, acquiring a
22.6%
ownership interest in Miso Robotics, and one board seat. Miso Robotics will use the funding to deliver an adaptable AI-driven robotic kitchen assistant that will work alongside kitchen staff to improve operational efficiency for the restaurant industry. In addition, Acacia also entered into an intellectual property services agreement with Miso Robotics to help Miso Robotics drive AI-based solutions for the entire restaurant industry. Based on Acacia’s representation on the Miso Robotics board of directors, and greater than 20% ownership interest in Miso Robotics, the equity method of accounting was applied. The fair value option was not elected for Acacia’s investment in
F- 21
ACACIA RESEARCH CORPORATION
NOTES TO CONSOLIDATED FINANCIAL STATEMENTS
Miso Robotics due to the lack of a readily determinable fair market value. For the year ended
December 31, 2017
, equity in losses of investee related to Miso Robotics totaled
$220,000
.
8. STOCKHOLDERS’ EQUITY
Cash Dividends.
On April 23, 2013, Acacia announced that its Board of Directors approved the adoption of a cash dividend policy that calls for the payment of an expected total annual cash dividend of
$0.50
per common share, payable in the amount of
$0.125
per share per quarter. Under the policy, the Company paid four quarterly cash dividends totaling
$25,434,000
in 2015. On February 25, 2016, Acacia announced that its Board of Directors terminated the company’s dividend policy effective February 23, 2016. The Board of Directors terminated the dividend policy due to a number of factors, including the Company’s financial performance and its available cash resources, the Company’s cash requirements and alternative uses of capital that the Board of Directors concluded would represent an opportunity to generate a greater return on investment for the Company and its stockholders.
Tax Benefits Preservation Plan
. On March 15, 2016, Acacia’s Board of Directors announced that it unanimously approved the adoption of a Tax Benefits Preservation Plan (the “Plan”). The purpose of the Plan is to protect the Company’s ability to utilize potential tax assets, such as net operating loss carryforwards (“NOLs”) and tax credits to offset potential future taxable income.
The Plan is designed to reduce the likelihood that the Company will experience an ownership change by discouraging any (i) person or group from acquiring beneficial ownership of
4.9%
or more of the Company’s outstanding common stock and (ii) any existing shareholders who, as of the time of the first public announcement of the adoption of the Plan, beneficially own more than
4.9%
of the Company’s then-outstanding shares of the Company’s common stock from acquiring additional shares of the Company’s common stock (subject to certain exceptions). There is no guarantee, however, that the Plan will prevent the Company from experiencing an ownership change.
In connection with the adoption of the Plan, Acacia’s Board of Directors authorized and declared a dividend distribution of one right for each outstanding share of the Company’s common stock to shareholders of record at the close of business on March 16, 2016. On or after the distribution date, each right would initially entitle the holder to purchase one one-thousandth of a share of the Company’s Series A Junior Participating Preferred Stock,
$0.001
par value for a purchase price of
$15.00
.
9
. INCOME TAXES
Acacia’s provision for income taxes for the fiscal periods presented consisted of the following (in thousands):
|
|
2017
|
2016
|
2015
|
|||||||||
|
Current:
|
|
|
|
|||||||||
|
Federal
|
$
|
—
|
|
$
|
—
|
|
$
|
—
|
|
|||
|
State
|
90
|
|
262
|
|
379
|
|
||||||
|
Foreign
|
2,865
|
|
17,926
|
|
4,421
|
|
||||||
|
Total current
|
2,955
|
|
18,188
|
|
4,800
|
|
||||||
|
Deferred:
|
||||||||||||
|
Federal
|
—
|
|
—
|
|
—
|
|
||||||
|
State
|
—
|
|
—
|
|
—
|
|
||||||
|
Total deferred
|
—
|
|
—
|
|
—
|
|
||||||
|
Provision for income taxes
|
$
|
2,955
|
|
$
|
18,188
|
|
$
|
4,800
|
|
|||
F- 22
ACACIA RESEARCH CORPORATION
NOTES TO CONSOLIDATED FINANCIAL STATEMENTS
The tax effects of temporary differences and carryforwards that give rise to significant portions of deferred tax assets and liabilities consist of the following at
December 31, 2017 and 2016
(in thousands):
|
|
2017
|
2016
|
||||||
|
Deferred tax assets:
|
|
|
||||||
|
Net operating loss and capital loss carryforwards and credits
|
$
|
90,871
|
|
$
|
83,323
|
|
||
|
Stock compensation
|
2,635
|
|
2,416
|
|
||||
|
Fixed assets and intangibles
|
6,197
|
|
14,343
|
|
||||
|
Basis of investments in affiliates
|
984
|
|
2,195
|
|
||||
|
Accrued liabilities and other
|
167
|
|
422
|
|
||||
|
State taxes
|
35
|
|
90
|
|
||||
|
Total deferred tax assets
|
100,889
|
|
102,789
|
|
||||
|
Valuation allowance
|
(90,278
|
)
|
(102,627
|
)
|
||||
|
Total deferred tax assets, net of valuation allowance
|
10,611
|
|
162
|
|
||||
|
Deferred tax liabilities:
|
||||||||
|
Unrealized gain on investments held at fair value
|
(10,587
|
)
|
—
|
|
||||
|
Other
|
(24
|
)
|
(162
|
)
|
||||
|
Total deferred tax liabilities
|
(10,611
|
)
|
(162
|
)
|
||||
|
Net deferred tax assets (liabilities)
|
$
|
—
|
|
$
|
—
|
|
||
A reconciliation of the federal statutory income tax rate and the effective income tax rate is as follows:
|
|
2017
|
2016
|
2015
|
||||||
|
Statutory federal tax rate - (benefit) expense
|
35
|
%
|
(35
|
)%
|
(35
|
)%
|
|||
|
State income and foreign taxes, net of federal tax effect
|
8
|
%
|
50
|
%
|
3
|
%
|
|||
|
Foreign tax credit
|
—
|
%
|
(49
|
)%
|
(3
|
)%
|
|||
|
Noncontrolling interests in operating subsidiaries
|
1
|
%
|
1
|
%
|
(1
|
)%
|
|||
|
Goodwill
|
—
|
%
|
—
|
%
|
7
|
%
|
|||
|
Nondeductible permanent items
|
3
|
%
|
—
|
%
|
—
|
%
|
|||
|
Expired capital loss carryforwards
|
—
|
%
|
—
|
%
|
1
|
%
|
|||
|
Change in tax rate
|
102
|
%
|
—
|
%
|
—
|
%
|
|||
|
Valuation allowance
|
(137
|
)%
|
83
|
%
|
31
|
%
|
|||
|
|
12
|
%
|
50
|
%
|
3
|
%
|
|||
For the periods presented, the Company recorded full valuation allowances against its net deferred tax assets due to uncertainty regarding future realization pursuant to guidance set forth in ASC 740, “Income Taxes.” In future periods, if the Company determines it will more likely than not be able to realize certain of these amounts, the applicable portion of the benefit from the release of the valuation allowance will generally be recognized in the statements of operations in the period the determination is made.
At
December 31, 2017
, Acacia had U.S. federal and state income tax net operating loss carryforwards (“NOLs”) totaling approximately
$180,621,000
and
$17,850,000
, expiring between 2026 and 2037, and 2028 and 2037, respectively. Capital loss carryovers totaled
$2,804,000
at December 31, 2017, expiring in 2019 and 2020.
At
December 31, 2017
, approximately
$26,326,000
of the U.S. federal NOLs, acquired in connection with the acquisition of ADAPTIX, Inc. in 2012, are subject to an annual utilization limitation of approximately
$14,100,000
, pursuant to the “change in ownership” provisions under Section 382 of the Internal Revenue Code of 1986, as amended (the “Code”).
As of
December 31, 2017
, Acacia had approximately
$51,126,000
of foreign tax credits, expiring between 2018 and 2026. In general, foreign taxes withheld may be claimed as a deduction on future U.S. corporate income tax returns, or as a credit against future U.S. income tax liabilities, subject to certain limitations.
F- 23
ACACIA RESEARCH CORPORATION
NOTES TO CONSOLIDATED FINANCIAL STATEMENTS
Tax expense for the periods presented primarily reflects foreign taxes withheld on revenue agreements executed with licensees in foreign jurisdictions and other state taxes. Excluding the impact of the change in valuation allowance and the impact of the federal tax rate change under the change in tax law described below, annual effective tax rates were
47%
,
(33)%
and
(28)%
, for fiscal years 2017, 2016 and 2015, respectively. Results for fiscal year 2017 included an unrealized gain on Acacia’s investment in Veritone which created a deferred tax liability totaling approximately
$10,587,000
. The future anticipated reversal of this deferred tax liability provides for a source of taxable income that allows for the realizability of existing deferred tax assets that have been reduced by a valuation allowance for the periods presented. The effective tax rate reflects both the recognition of the deferred tax liability and the reversal of valuation allowance
Effective January 1, 2017, the Company adopted a new standard that requires all income tax effects of awards to be recognized in the income statement when the awards vest or are settled. The adoption of this standard resulted in the Company recognizing gross federal and state deferred tax assets of
$21,350,000
and
$1,559,000
, respectively, related to the impact of share-based payments to employees in prior periods. These deferred tax assets are fully offset by a valuation allowance and were impacted by the change in tax rate described below.
Acacia is subject to taxation in the U.S. and in various state jurisdictions and incurs foreign tax withholdings on revenue agreements with licensees in certain foreign jurisdictions. With no material exceptions, Acacia is no longer subject to U.S. federal or state examinations by tax authorities for years before 2011. The California Franchise Tax Board is auditing the 2011 and 2012 California combined income tax returns. The audit is in process and no findings or adjustments have been proposed.
At
December 31, 2017
and 2016, the Company had total unrecognized tax benefits of approximately
$808,000
. No interest and penalties have been recorded for the unrecognized tax benefits for the periods presented. At December 31, 2017, if recognized, approximately
$808,000
of tax benefits, net of valuation allowance, would impact the Company’s effective tax rate. The Company does not expect that the liability for unrecognized tax benefits will change significantly within the next 12 months. The change in total unrecognized tax benefits as of December 31, 2017 was due to a lapse of the applicable statute of limitations related to an unrecognized benefit originating in a prior period.
Acacia recognizes interest and penalties with respect to unrecognized tax benefits in income tax expense. Acacia has identified no uncertain tax position for which it is reasonably possible that the total amount of unrecognized tax benefits will significantly increase or decrease within 12 months.
On December 22, 2017, new U.S. tax legislation was enacted that has significantly changed the U.S. federal income taxation of U.S. corporations, including by reducing the U.S. corporate income tax rate to
21%
, revising the rules governing net operating losses and foreign tax credits, and introducing new anti-base erosion provisions. Many of these changes are effective immediately, without any transition periods or grandfathering for existing transactions. The legislation is unclear in many respects and could be subject to potential amendments and technical corrections, as well as interpretations and implementing regulations by the Treasury and Internal Revenue Service (“IRS”), any of which could lessen or increase certain adverse impacts of the legislation. In addition, it is unclear how these U.S. federal income tax changes will affect state and local taxation, which often uses federal taxable income as a starting point for computing state and local tax liabilities.
While our analysis and interpretation of this legislation is ongoing, based on our current evaluation, we have reflected a write-down of our deferred income tax assets (including the value of our net operating loss carryforwards and our tax credit carryforwards) due the reduction of the U.S. corporate income tax rate. Based on currently available information, we recorded a reduction of approximately
$25,261,000
in the fourth quarter of 2017 related to the revaluation of our deferred tax assets. Given the full valuation allowance provided for net deferred tax assets as of December 31, 2017, the change in tax law did not have a material impact on our consolidated financial statements provided herein. There may be additional tax impacts identified in subsequent periods throughout 2018 in accordance with subsequent interpretive guidance issued by the SEC or the IRS. Further, there may be other material adverse effects resulting from the legislation that we have not yet identified. No estimated tax provision has been recorded for tax attributes that are incomplete or subject to change.
F- 24
ACACIA RESEARCH CORPORATION
NOTES TO CONSOLIDATED FINANCIAL STATEMENTS
10
. EQUITY-BASED INCENTIVE PLANS
Stock-Based Incentive Plans
The 2013 Acacia Research Corporation Stock Incentive Plan (“2013 Plan”) and the 2016 Acacia Research Corporation Stock Incentive Plan (“2016 Plan”) (collectively, the “Plans”) were approved by the stockholders of Acacia in May 2013 and June 2016, respectively. All Plans allow grants of stock options, stock awards and performance shares with respect to Acacia common stock to eligible individuals, which generally includes directors, officers, employees and consultants. Except as noted below, the terms and provisions of the Plans are identical in all material respects.
Acacia’s compensation committee administers the discretionary option grant and stock issuance programs. The compensation committee determines which eligible individuals are to receive option grants or stock issuances under those programs, the time or times when the grants or issuances are to be made, the number of shares subject to each grant or issuance, the status of any granted option as either an incentive stock option or a non-statutory stock option under the federal tax laws, the vesting schedule to be in effect for the option grant or stock issuance and the maximum term for which any granted option is to remain outstanding. The exercise price of options is generally equal to the fair market value of Acacia’s common stock on the date of grant. Options generally begin to be exercisable six months to one year after grant and generally expire seven to ten years after grant. Stock options with time-based vesting generally vest over two to three years and restricted shares with time based vesting generally vest in full after two to three years (generally representing the requisite service period). The Plans terminate no later than the tenth anniversary of the approval of the incentive plans by Acacia’s stockholders.
The Plans provide for the following separate programs:
|
•
|
Discretionary Option Grant Program
. Under the discretionary option grant program, Acacia’s compensation committee may grant (1) non-statutory options to purchase shares of common stock to eligible individuals in the employ or service of Acacia or its subsidiaries (including employees, non-employee board members and consultants) at an exercise price not less than
85%
of the fair market value of those shares on the grant date, and (2) incentive stock options to purchase shares of common stock to eligible employees at an exercise price not less than
100%
of the fair market value of those shares on the grant date (not less than
110%
of fair market value if such employee actually or constructively owns more than
10%
of Acacia’s voting stock or the voting stock of any of its subsidiaries).
|
|
•
|
Stock Issuance Program
. Under the stock issuance program, eligible individuals may be issued shares of common stock directly, upon the attainment of performance milestones or the completion of a specified period of service or as a bonus for past services. Under this program, the purchase price for the shares shall not be less than
100%
of the fair market value of the shares on the date of issuance, and payment may be in the form of cash or past services rendered. The eligible individuals shall have full stockholder rights with respect to any shares of Common Stock issued to them under the Stock Issuance Program, whether or not their interest in those shares is vested. Accordingly, the eligible individuals shall have the right to vote such shares and to receive any regular cash dividends paid on such shares.
|
|
•
|
Automatic Option Grant Program
. Each non-employee director will receive restricted stock units or stock options for the number of shares determined by dividing the annual retainer by the grant date fair value of Acacia’s common stock on the grant date. In addition, each new non-employee director will receive restricted stock units or stock options for the number of shares determined by dividing the annual board of directors retainer by the grant date fair value of Acacia’s common stock on the commencement date. Restricted stock units and stock options vest in a series of twelve quarterly installments over the three year period following the grant date, subject to immediate acceleration upon a change in control. Acacia will deliver the unrestricted shares corresponding to the vested restricted stock units within thirty (30) days after the first to occur of the following events: (i) the fifth (5th) anniversary of the grant date; or (ii) termination of the non-employee director’s service as a member of the Company’s Board of Directors. The non-employee directors do not have any rights, benefits or entitlements with respect to any shares unless and until the shares have been delivered.
|
The number of shares of Common Stock initially reserved for issuance under the 2013 Plan was
4,750,000
shares. No new additional shares will be added to the 2013 Plan without security holder approval (except for shares subject to outstanding awards that are forfeited or otherwise returned to the 2013 Plan). The stock issuable under the 2013 Plan shall be shares of authorized but unissued or reacquired Common Stock, including shares repurchased by the Company on the open market. In June 2016,
625,390
shares of common stock available for issuance under the 2013 Plan were transferred into the 2016 Plan. At
December 31, 2017
, there were
660,000
shares available for grant under the 2013 Plan.
F- 25
ACACIA RESEARCH CORPORATION
NOTES TO CONSOLIDATED FINANCIAL STATEMENTS
The number of shares of Common Stock initially reserved for issuance under the 2016 Plan was
4,500,000
shares plus
625,390
shares of common stock available for issuance under the 2013 Plan, as of the effective date of the Plan. At
December 31, 2017
, there were
727,000
shares available for grant under the 2016 Plan.
Upon the exercise of stock options, the granting of restricted stock, or the delivery of shares pursuant to vested restricted stock units, it is Acacia’s policy to issue new shares of common stock. Acacia’s board of directors may amend or modify the Plans at any time, subject to any required stockholder approval. As of
December 31, 2017
, there are
7,279,000
shares of common stock reserved for issuance under the Plans.
Stock-based award grant activity for the periods presented was as follows:
|
2017
|
2016
|
|||||||||||||
|
Shares
|
Aggregate fair value (in thousands)
|
Shares
|
Aggregate fair value (in thousands)
|
|||||||||||
|
Restricted stock awards with performance-based vesting conditions
|
—
|
|
$
|
—
|
|
138,000
|
|
$
|
431
|
|
||||
|
Stock options with time-based service vesting conditions
|
1,368,000
|
|
2,930
|
|
3,434,000
|
|
5,704
|
|
||||||
|
Stock options with market-based vesting conditions
|
—
|
|
—
|
|
2,250,000
|
|
5,530
|
|
||||||
|
Stock options with performance-based vesting conditions
|
—
|
|
—
|
|
200,000
|
|
487
|
|
||||||
|
Total incentive awards granted
|
1,368,000
|
|
$
|
2,930
|
|
6,022,000
|
|
$
|
12,152
|
|
||||
During the year ended
December 31, 2016
the Company granted restricted stock awards and stock options (with weighted-average exercise price of
$5.75
per share) with performance-based vesting conditions. The awards vest based upon the Company achieving specified cash flow performance targets over a one and two-year period from the date of grant. Under the terms of the awards, the number of restricted shares or stock options that will actually vest is based on the extent to which the Company achieves the specified performance targets during the performance period. As of
December 31, 2017
,
102,000
(net of forfeitures) shares of restricted stock with performance-based vesting conditions were outstanding and unvested. During the year ended
December 31, 2017
, all stock options with performance-based vesting conditions expired unvested. As of
December 31, 2017
, there was
no
unrecognized expense for awards with performance-based vesting conditions.
During the year ended
December 31, 2016
, the Company granted stock options with market-based vesting conditions, with a weighted-average exercise price of
$5.75
per share. The options with market-based vesting conditions vest based upon the Company achieving specified stock price targets over a four-year period. Under the terms of the awards, the number of stock options that will actually vest is based on the extent to which the Company achieves the specified market conditions during the four-year performance period. The stock options vest in equal installments of
25%
upon the Company’s achievement of 30-day average share prices ranging from
$7.00
to
$10.00
. As of
December 31, 2017
,
1,687,500
options with market-based vesting conditions remain unvested. As of
December 31, 2017
, there was
no
unrecognized expense for options with market-based vesting conditions.
The following table summarizes stock option activity for the Plans for the year ended
December 31, 2017
:
|
|
|
Weighted-Average
|
|
||||||||||
|
|
Options
|
Exercise
Price
|
Remaining
Contractual Term
|
Aggregate
Intrinsic Value
|
|||||||||
|
Outstanding at December 31, 2016
|
5,596,000
|
|
$
|
4.93
|
|
|
|
||||||
|
Granted
|
1,368,000
|
|
$
|
5.52
|
|
||||||||
|
Exercised
|
(208,000
|
)
|
$
|
3.57
|
|
|
|
||||||
|
Expired/forfeited
|
(926,000
|
)
|
$
|
4.90
|
|
||||||||
|
Outstanding at December 31, 2017
|
5,830,000
|
|
$
|
5.13
|
|
5.8 years
|
$
|
856,000
|
|
||||
|
Vested
|
1,959,000
|
|
$
|
4.84
|
|
5.8 years
|
$
|
434,000
|
|
||||
|
Exercisable at December 31, 2017
|
1,959,000
|
|
$
|
4.84
|
|
5.8 years
|
$
|
434,000
|
|
||||
F- 26
ACACIA RESEARCH CORPORATION
NOTES TO CONSOLIDATED FINANCIAL STATEMENTS
The aggregate intrinsic value of options exercised during the years ended
December 31, 2017, 2016 and 2015
was
$296,000
,
$344,000
, and
$751,000
, respectively. The aggregate intrinsic value of options vested during the year ended December 31, 2017 was
$351,000
. The aggregate fair value of options granted during the year ended December 31, 2017 was
$2,930,000
. The aggregate fair value of options vested during the year ended December 31, 2017 and 2016 was
$2,009,000
and
$2,342,000
, respectively. No options were granted or vested during the year ended December 31, 2015. As of December 31, 2017, the total unrecognized compensation expense related to nonvested stock option awards was
$3,654,000
, which is expected to be recognized over a weighted-average term of approximately
2 years
.
The following table summarizes nonvested restricted share activity for the year ended
December 31, 2017
:
|
|
Nonvested
Restricted Shares
|
Weighted
Average Grant Date Fair Value
|
|||||
|
Nonvested restricted stock at December 31, 2016
|
333,000
|
|
$
|
8.9
|
|
||
|
Granted
|
—
|
|
$
|
—
|
|
||
|
Vested
|
(120,000
|
)
|
$
|
12.95
|
|
||
|
Canceled
|
(90,000
|
)
|
$
|
9.10
|
|
||
|
Nonvested restricted stock at December 31, 2017
|
123,000
|
|
$
|
4.77
|
|
||
The weighted-average grant date fair value of nonvested restricted stock granted during the years ended December 31, 2016 and 2015 was
$3.12
and
$12.83
, respectively. The aggregate fair value of restricted stock that vested during the years ended
December 31, 2017, 2016 and 2015
was
$1,560,000
,
$5,243,000
and
$11,494,000
, respectively. As of
December 31, 2017
, the total unrecognized compensation expense related to nonvested restricted stock awards was
$53,000
, which is expected to be recognized over a weighted-average period of approximately
2 months
.
The following table summarizes restricted stock unit activity for the year ended
December 31, 2017
:
|
|
Restricted
Stock Units
|
Weighted
Average Grant Date Fair Value
|
|||||
|
Nonvested restricted stock units outstanding at December 31, 2016
|
14,000
|
|
$
|
16.27
|
|
||
|
Vested
|
(12,000
|
)
|
$
|
16.18
|
|
||
|
Nonvested restricted stock units outstanding at December 31, 2017
|
2,000
|
|
$
|
16.72
|
|
||
|
Vested restricted stock units outstanding at December 31, 2017
|
60,000
|
|
$
|
15.38
|
|
||
The weighted-average grant date fair value of restricted stock units granted during the year ended December 31, 2015 was
$16.72
. There were
no
restricted units granted during the years ended December 31, 2017 and 2016. The aggregate fair value of restricted stock units that vested during the years ended
December 31, 2017, 2016 and 2015
was
$200,000
,
$324,000
and
$480,000
, respectively. As of
December 31, 2017
, the total unrecognized compensation expense related to restricted stock unit awards was
$1,000
, which is expected to be recognized over a weighted-average period of approximately
1 month
.
Profits Interest Plan
On February 16, 2017, AIP Operation LLC, a Delaware limited liability company (“AIP”), and an indirect subsidiary of Acacia, adopted a Profits Interest Plan (the “Plan”) that provides for the grant of membership interests in AIP to certain members of management and the Board of Directors of Acacia as compensation for services rendered for or on behalf of AIP. Each profits interest unit granted pursuant to the Plan is intended to qualify as a “profits interest” for U.S. federal income tax purposes and will only have value to the extent the fair value of AIP increases beyond the fair value at the issuance date of the membership interests. The membership interests are represented by units (the “Units”) reserved for the issuance of awards under the Plan. The Units entitle the holders to share in or be allocated certain AIP profits and losses and to receive or share in AIP distributions pursuant to the AIP Limited Liability Company Operating Agreement entered into as of February 16, 2017 (the “LLC Agreement”). In connection with the adoption of the Plan, a form of Profits Interest Agreement was approved pursuant to which Units may be granted from time to time. Units vest upon AIP’s achievement of certain performance milestones (one-third upon 150% appreciation, and the remaining two-thirds upon 300% appreciation in value of Acacia’s aggregate investment in Veritone), subject to the continued service of the recipient, and are subject to the terms and conditions of the Plan, the Profits Interest Agreement and the LLC Agreement. The Units were fully vested as of
December 31, 2017
.
F- 27
ACACIA RESEARCH CORPORATION
NOTES TO CONSOLIDATED FINANCIAL STATEMENTS
Acacia owns
60%
of the membership interests in AIP and at all times will control AIP. Acacia from time to time may contribute to AIP certain assets or securities related to portfolio companies in which Acacia holds an interest. Units may be awarded as one-time, discretionary grants to recipients. As of
December 31, 2017
, AIP holds the Veritone 10% Warrant described at Note
7
.
Profits interests totaling 400 Units, or 40% of the membership interests in AIP, were granted in February 2017, with an aggregate grant date fair value of
$722,000
. The fair value of the Units totaled
$3,041,000
as of
December 31, 2017
. Upon full vesting of the units in September 2017, all previously unrecognized compensation expense was immediately recognized.
The fair value of the Units is estimated utilizing a Geometric Brownian Motion model (“GBM”) which considers probable vesting dates and values for the applicable instruments (i.e. common stock and warrants related to Acacia’s Veritone investment described at Note
7
) underlying or associated with the Units. At the estimated end of the term of the underlying warrant (May 2022), the model estimates the total proceeds from the hypothetical exercise of the warrant and estimates the value of the Units by allocating the proceeds based on the waterfall described in the terms of the underlying agreement. The value of the Units on a marketable basis is the average allocation across all GBM simulation paths discounted to the applicable valuation date using the risk-free rate. This estimated value is adjusted for an estimate of a DLOM using the Finnerty model, based on a security specific volatility calculated by changing Veritone’s common stock price by 1% and measuring the corresponding change in the value of the Units. For the year ended
December 31, 2017
, assumptions utilized in the GBM included a term of
4.4 years
, stock price of
$23.20
, volatility of
50%
, and risk free interest rates ranging from
1.76%
to
2.40%
for terms ranging from
one
to
10 years
. The estimated DLOM utilized was
30%
, based on assumptions including a term of approximately
4.4 years
and a volatility of
85%
for Veritone’s common stock. Volatility was estimated based on the historical volatilities of a set of comparable public companies, adjusted for leverage, over a term matching the term of the underlying warrant asset, which was approximately
4.4 years
.
Compensation expense for the periods presented was comprised of the following:
|
2017
|
2016
|
2015
|
||||||||||
|
Restricted stock awards with time-based service conditions
|
$
|
1,025
|
|
$
|
4,071
|
|
$
|
10,575
|
|
|||
|
Restricted stock unit awards with time-based service conditions
|
161
|
|
320
|
|
473
|
|
||||||
|
Restricted stock awards with performance-based vesting conditions
|
121
|
|
197
|
|
—
|
|
||||||
|
Stock options with time-based service vesting conditions
|
2,165
|
|
1,316
|
|
—
|
|
||||||
|
Stock options with market-based vesting conditions
|
2,372
|
|
3,158
|
|
—
|
|
||||||
|
Stock options with performance-based vesting conditions
|
—
|
|
—
|
|
—
|
|
||||||
|
Profits interests units
|
3,041
|
|
—
|
|
—
|
|
||||||
|
Total compensation expense
|
$
|
8,885
|
|
$
|
9,062
|
|
$
|
11,048
|
|
|||
11
. COMMITMENTS AND CONTINGENCIES
Operating Leases
Acacia leases certain office space under various operating lease agreements expiring at various dates from 2019 through 2020. Minimum annual rental commitments for operating leases of continuing operations having initial or remaining noncancellable lease terms in excess of one year are as follows (in thousands):
|
Years ending December 31,
|
|
||
|
2018
|
$
|
1,213
|
|
|
2019
|
1,369
|
|
|
|
2020
|
16
|
|
|
|
Total minimum lease payments
|
$
|
2,598
|
|
Rent expense for the years ended
December 31, 2017, 2016 and 2015
approximated
$1,392,000
,
$1,795,000
and
$1,926,000
, respectively. Rental payments are expensed in the statements of operations in the period to which they relate. Scheduled rent increases are amortized on a straight-line basis over the lease term.
F- 28
ACACIA RESEARCH CORPORATION
NOTES TO CONSOLIDATED FINANCIAL STATEMENTS
Inventor Royalties and Contingent Legal Expenses
In connection with the investment in certain patents and patent rights, certain of Acacia’s operating subsidiaries executed related agreements which grant to the former owners of the respective patents or patent rights, the right to receive inventor royalties based on future net revenues (as defined in the respective agreements) generated as a result of licensing and otherwise enforcing the respective patents or patent portfolios.
Acacia’s operating subsidiaries may retain the services of law firms that specialize in patent licensing and enforcement and patent law in connection with their licensing and enforcement activities. These law firms may be retained on a contingent fee basis whereby such law firms are paid on a scaled percentage of any negotiated fees, settlements or judgments awarded based on how and when the fees, settlements or judgments are obtained.
Patent Enforcement and Other Litigation
Acacia is subject to claims, counterclaims and legal actions that arise in the ordinary course of business. Management believes that the ultimate liability with respect to these claims and legal actions, if any, will not have a material effect on Acacia’s consolidated financial position, results of operations or cash flows. Fiscal year 2017 includes estimated contingency accruals totaling
$1,200,000
. The estimated range of potential expenses related to these matters is
$1,200,000
to
$3,000,000
. Fiscal year 2016 and 2015 operating expenses included expenses for court ordered attorney fees and settlement and contingency accruals totaling
$500,000
and
$4,141,000
, respectively.
Guarantees and Indemnifications
Certain of Acacia’s operating subsidiaries have made guarantees and indemnities under which they may be required to make payments to a guaranteed or indemnified party, in relation to certain transactions, including revenue transactions in the ordinary course of business. In connection with certain facility leases, Acacia and certain of its operating subsidiaries have indemnified lessors for certain claims arising from the facilities or the leases. Acacia indemnifies its directors and officers to the maximum extent permitted under the laws of the State of Delaware. However, Acacia has a directors and officers insurance policy that may reduce its exposure in certain circumstances and may enable it to recover a portion of future amounts that may be payable, if any. The duration of the guarantees and indemnities varies and, in many cases is indefinite but subject to statute of limitations. The majority of guarantees and indemnities do not provide any limitations of the maximum potential future payments that Acacia could be obligated to make. To date, Acacia has made no payments related to these guarantees and indemnities. Acacia estimates the fair value of its indemnification obligations to be insignificant based on this history and therefore, have not recorded any liability for these guarantees and indemnities in the accompanying consolidated balance sheets. Additionally, no events or transactions have occurred that would result in a material liability at
December 31, 2017
.
Bank Guarantee
In March 2015, an operating subsidiary of Acacia entered into a standby letter of credit and guarantee arrangement (“Guarantee”) with a bank for purposes of enforcing a court ruling in a German patent court granting an injunction against the defendants in the related patent infringement case. The Guarantee was secured by a cash deposit at the contracting bank, which was classified as restricted cash in the accompanying December 31, 2016 consolidated balance sheets, totaling
$11,512,000
. Upon resolution of all related matters in June 2017, the Guarantee was extinguished resulting in release of the cash collateral (and related restrictions on the cash balance) by the contracting bank. As a result, currently
no
amounts of Acacia’s cash and investments are restricted as to use.
Other
In August 2010, a wholly owned subsidiary of Acacia became the general partner of the Acacia IP Fund, which was formed in August 2010. The Acacia IP Fund invests in, licenses and enforces intellectual property consisting primarily of patents, patent rights, and patented technologies. The Acacia IP Fund was terminated as of December 31, 2017. At
December 31, 2017 and 2016
, the Acacia IP Fund net assets and net income (loss) were primarily comprised of the following (in thousands):
F- 29
ACACIA RESEARCH CORPORATION
NOTES TO CONSOLIDATED FINANCIAL STATEMENTS
|
|
2017
|
2016
|
||||||
|
Cash and other assets
|
$
|
986
|
|
$
|
1,118
|
|
||
|
Investments - noncurrent
|
1,905
|
|
2,933
|
|
||||
|
Total assets
|
$
|
2,891
|
|
$
|
4,051
|
|
||
|
Accrued expenses and contributions
|
$
|
2,567
|
|
$
|
2,394
|
|
||
|
Net assets
|
$
|
324
|
|
$
|
1,657
|
|
||
|
|
2017
|
2016
|
||||||
|
Revenues
|
$
|
—
|
|
$
|
16
|
|
||
|
Operating expenses
|
390
|
|
572
|
|
||||
|
Loss from operations
|
(390
|
)
|
(556
|
)
|
||||
|
Net loss in equity method investments
|
(943
|
)
|
(1,013
|
)
|
||||
|
Net loss
|
$
|
(1,333
|
)
|
$
|
(1,569
|
)
|
||
12. RETIREMENT SAVINGS PLAN AND EXECUTIVE SEVERANCE POLICY
Retirement Savings Plan.
Acacia has an employee savings and retirement plan under section 401(k) of the Code (the “Plan”). The Plan is a defined contribution plan in which eligible employees may elect to have a percentage of their compensation contributed to the Plan, subject to certain guidelines issued by the Internal Revenue Service. Acacia may contribute to the Plan at the discretion of the board of directors. There were no contributions made by Acacia during the periods presented.
Executive Severance Policy.
Under Acacia’s Amended Executive Severance Policy, full-time employees as of July 2017 and prior with the title of Senior Vice President and higher (“SVP and higher”) are entitled to receive certain benefits upon termination of employment. If employment of an SVP and higher employee is terminated for other than cause or other than on account of death or disability, Acacia will (i) promptly pay to the SVP and higher employee a lump sum amount equal to the aggregate of (a) accrued obligations (i.e., annual base salary through the date of termination to the extent not theretofore paid and any compensation previously deferred (together with any accrued interest or earnings thereon) and any accrued vacation pay, and reimbursable expenses, in each case to the extent not theretofore paid) and (b) three (3) months of base salary for each full year that the SVP and higher employee was employed by the Company (the “Severance Period”), up to a maximum of twelve (12) months (eighteen (18) months for executive officers of Acacia Research Corporation) of base salary, and (ii) provide to the SVP and higher employee, Acacia paid COBRA coverage for the medical and dental benefits selected in the year in which the termination occurs, for the duration of the Severance Period.
13. SUPPLEMENTAL CASH FLOW INFORMATION
Cash paid for state income taxes totaled
$181,000
,
$223,000
and
$211,000
for the years ended
December 31, 2017, 2016 and 2015
, respectively. Foreign taxes withheld totaled
$2,865,000
,
$14,776,000
and
$4,421,000
for the years ended
December 31, 2017, 2016 and 2015
, respectively. Refer to Note
4
for accrued foreign taxes payable.
Refer to Note
5
for information regarding noncash investing activity related to the investment in patent portfolios for the periods presented. Refer to Note
7
for information regarding noncash investing activity related to the investment in Veritone for the periods presented.
F- 30
ACACIA RESEARCH CORPORATION
NOTES TO CONSOLIDATED FINANCIAL STATEMENTS
14. QUARTERLY FINANCIAL DATA (unaudited)
The following table sets forth unaudited consolidated statements of operations data for the eight quarters in the period ended
December 31, 2017
. This information has been derived from Acacia’s unaudited condensed consolidated financial statements that have been prepared on the same basis as the audited consolidated financial statements and, in the opinion of management, include all adjustments, consisting of normal recurring adjustments, necessary for a fair statement of the information when read in conjunction with the audited consolidated financial statements and related notes thereto. Acacia’s quarterly results have been, and may in the future be, subject to significant fluctuations. As a result, Acacia believes that results of operations for interim periods should not be relied upon as any indication of the results to be expected in any future periods.
|
|
Quarter Ended
|
|||||||||||||||||||||||||||||||
|
|
Mar. 31,
|
Jun. 30,
|
Sept. 30,
|
Dec. 31,
|
Mar. 31,
|
Jun. 30,
|
Sept. 30,
|
Dec. 31,
|
||||||||||||||||||||||||
|
|
2017
|
2017
|
2017
|
2017
|
2016
|
2016
|
2016
|
2016
|
||||||||||||||||||||||||
|
|
(Unaudited, in thousands, except share and per share information)
|
|||||||||||||||||||||||||||||||
|
Revenues
|
$
|
8,854
|
|
$
|
16,457
|
|
$
|
36,633
|
|
$
|
3,458
|
|
$
|
24,721
|
|
$
|
41,351
|
|
$
|
64,658
|
|
$
|
21,969
|
|
||||||||
|
Operating costs and expenses:
|
|
|
|
|
|
|
|
|
|
|
||||||||||||||||||||||
|
Cost of revenues:
|
|
|
|
|
|
|
|
|
|
|
||||||||||||||||||||||
|
Inventor royalties
|
666
|
|
4,273
|
|
—
|
|
13
|
|
1,573
|
|
—
|
|
17,844
|
|
3,313
|
|
||||||||||||||||
|
Contingent legal fees
|
627
|
|
3,236
|
|
12,173
|
|
646
|
|
4,109
|
|
10,418
|
|
7,709
|
|
4,238
|
|
||||||||||||||||
|
Litigation and licensing expenses - patents
|
6,386
|
|
4,134
|
|
4,073
|
|
3,626
|
|
7,723
|
|
7,324
|
|
7,348
|
|
5,463
|
|
||||||||||||||||
|
Amortization of patents
|
5,515
|
|
5,571
|
|
5,625
|
|
5,443
|
|
10,760
|
|
10,759
|
|
6,467
|
|
6,222
|
|
||||||||||||||||
|
General and administrative expenses (including non-cash stock compensation expense)
|
6,916
|
|
6,734
|
|
12,715
|
|
(335
|
)
|
7,994
|
|
7,535
|
|
8,334
|
|
9,056
|
|
||||||||||||||||
|
Other expenses - business development
|
320
|
|
433
|
|
241
|
|
195
|
|
522
|
|
1,334
|
|
666
|
|
557
|
|
||||||||||||||||
|
Impairment of patent-related intangible assets
|
—
|
|
—
|
|
2,248
|
|
—
|
|
—
|
|
40,165
|
|
—
|
|
2,175
|
|
||||||||||||||||
|
Other
|
—
|
|
—
|
|
—
|
|
1,200
|
|
1,742
|
|
(1,242
|
)
|
—
|
|
—
|
|
||||||||||||||||
|
Total operating costs and expenses
|
20,430
|
|
24,381
|
|
37,075
|
|
10,788
|
|
34,423
|
|
76,293
|
|
48,368
|
|
31,024
|
|
||||||||||||||||
|
Operating income (loss)
|
(11,576
|
)
|
(7,924
|
)
|
(442
|
)
|
(7,330
|
)
|
(9,702
|
)
|
(34,942
|
)
|
16,290
|
|
(9,055
|
)
|
||||||||||||||||
|
Total other income (expense)
|
696
|
|
(4,862
|
)
|
159,027
|
|
(102,950
|
)
|
(3
|
)
|
(52
|
)
|
261
|
|
592
|
|
||||||||||||||||
|
Income (loss) before (provision for) benefit from income taxes
|
(10,880
|
)
|
(12,786
|
)
|
158,585
|
|
(110,280
|
)
|
(9,705
|
)
|
(34,994
|
)
|
16,551
|
|
(8,463
|
)
|
||||||||||||||||
|
Provision for income taxes
|
(1,241
|
)
|
(1,478
|
)
|
(216
|
)
|
(20
|
)
|
(192
|
)
|
(5,927
|
)
|
(9,655
|
)
|
(2,414
|
)
|
||||||||||||||||
|
Net income (loss) including noncontrolling interests
|
(12,121
|
)
|
(14,264
|
)
|
158,369
|
|
(110,300
|
)
|
(9,897
|
)
|
(40,921
|
)
|
6,896
|
|
(10,877
|
)
|
||||||||||||||||
|
Net (income) loss attributable to noncontrolling interests in subsidiaries
|
291
|
|
12
|
|
96
|
|
97
|
|
(68
|
)
|
348
|
|
186
|
|
266
|
|
||||||||||||||||
|
Net income (loss) attributable to Acacia Research Corporation
|
$
|
(11,830
|
)
|
$
|
(14,252
|
)
|
$
|
158,465
|
|
$
|
(110,203
|
)
|
$
|
(9,965
|
)
|
$
|
(40,573
|
)
|
$
|
7,082
|
|
$
|
(10,611
|
)
|
||||||||
|
Net income (loss) per common share attributable to Acacia Research Corporation:
|
|
|
|
|
|
|
|
|
|
|
|
|
|
|
|
|
||||||||||||||||
|
Basic and diluted income (loss) per share
|
$
|
(0.24
|
)
|
$
|
(0.28
|
)
|
$
|
3.13
|
|
$
|
(2.18
|
)
|
$
|
(0.20
|
)
|
$
|
(0.81
|
)
|
$
|
0.14
|
|
$
|
(0.21
|
)
|
||||||||
|
Weighted-average number of shares outstanding, basic
|
50,333,056
|
|
50,499,948
|
|
50,554,234
|
|
50,590,460
|
|
49,925,550
|
|
50,015,869
|
|
50,124,302
|
|
50,237,784
|
|
||||||||||||||||
|
Weighted-average number of shares outstanding, diluted
|
50,333,056
|
|
50,499,948
|
|
50,599,974
|
|
50,590,460
|
|
49,925,550
|
|
50,015,869
|
|
50,618,757
|
|
50,237,784
|
|
||||||||||||||||
F- 31
ACACIA RESEARCH CORPORATION
NOTES TO CONSOLIDATED FINANCIAL STATEMENTS
15. SUBSEQUENT EVENTS
Investments
In January 2018, Acacia entered into a Joint Venture and Services Agreement (“Joint Venture Agreement”) with Bitzumi, Inc., a company developing macro opportunities in the cryptocurrency and blockchain industries, including a next generation decentralized exchange. Bitzumi recently filed a Regulation A Offering Statement with the Securities and Exchange Commission and a listing application with NASDAQ. Acacia made an initial
$1,000,000
equity investment in Bitzumi in January 2018. Under the Joint Venture Agreement, Acacia will provide various patent-related services to Bitzumi and has the option to invest up to an additional
$9,000,000
to acquire Bitzumi common stock. In connection with Acacia’s initial investment, Acacia received a short-term warrant to purchase
$4,000,000
of Bitzumi common shares. Under the Joint Venture Agreement, Acacia has a right to acquire up to an aggregate of
$10.0 million
of Bitzumi common shares (inclusive of Acacia’s initial
$1,000,000
equity investment and exercise of Acacia’s short-term warrant) at a price, except as paid by Acacia for the initial investment and the exercise price of Acacia’s short-term warrant, of
$2.50
per share. Upon meeting certain conditions set forth in the Joint Venture Agreement, Bitzumi will also issue Acacia a warrant for
30,000,000
shares of Bitzumi’s common stock. Acacia’s investment in Bitzumi represents its first venture in the cryptocurrency and blockchain marketplaces.
In February 2018, Acacia made an additional equity investment in Miso Robotics totaling
$6,000,000
, increasing its ownership interest in Miso Robotics to approximately
30%
. In addition, Acacia acquired an additional board seat.
Stock Repurchase Program.
In February 2018, Acacia’s Board of Directors authorized the repurchase of up to
$20,000,000
of the Company’s outstanding common stock in open market purchases or private purchases, from time to time, in amounts and at prices to be determined by the Board of Directors at its discretion (the “Stock Repurchase Program”). In determining whether or not to repurchase any shares of Acacia’s common stock, Acacia’s Board of Directors will consider such factors as the impact of the repurchase on Acacia’s cash position, as well as Acacia’s capital needs and whether there is a better alternative use of Acacia’s capital. Acacia has no obligation to repurchase any amount of its common stock under the Stock Repurchase Program. The Stock Repurchase Program is set to expire on February 28, 2019.
F- 32
TABLE OF CONTENTS
Part IItem 1. BusinessItem 1A. Risk FactorsItem 1B. Unresolved Staff CommentsItem 2. PropertiesItem 3. Legal ProceedingsItem 4. Mine Safety DisclosuresPart IIItem 5. Market For Registrant S Common Equity, Related Stockholder Matters and Issuer Purchases Of Equity SecuritiesItem 6. Selected Financial DataItem 7. Management S Discussion and Analysis Of Financial Condition and Results Of OperationsItem 7A. Quantitative and Qualitative Disclosures About Market RiskItem 8. Financial Statements and Supplementary DataItem 9. Changes in and Disagreements with Accountants on Accounting and Financial DisclosureItem 9A. Controls and ProceduresItem 9B. Other InformationPart IIIItem 10. Directors, Executive Officers and Corporate GovernanceItem 11. Executive CompensationItem 12. Security Ownership Of Certain Beneficial Owners and Management and Related Stockholder MattersItem 13. Certain Relationships and Related Transactions, and Director IndependenceItem 14. Principal Accounting Fees and ServicesPart IVItem 15. Exhibits, Financial Statement Schedules