ARCHER-DANIELS-MIDLAND CO
10-Ks and 10-Qs
|
|
|
|
|
|
|
|
|
|
|
|
|
|
|
|
|
|
|
|
|
|
|
|
|
|
|
|
|
|
|
|
|
|
|
|
|
|
|
|
|
|
|
|
|
|
|
|
|
|
|
|
|
|
|
|
UNITED STATES
SECURITIES AND EXCHANGE COMMISSION
WASHINGTON, D. C. 20549
FORM 10-K
|
x
|
ANNUAL REPORT PURSUANT TO SECTION 13 OR 15(d) OF THE SECURITIES EXCHANGE ACT OF 1934
|
For the fiscal year ended June 30, 2010
OR
|
o
|
TRANSITION REPORT PURSUANT TO SECTION 13 OR 15(d) OF THE SECURITIES EXCHANGE ACT OF 1934
|
For the transition period from________ to _________
Commission file number 1-44
ARCHER-DANIELS-MIDLAND COMPANY
(Exact name of registrant as specified in its charter)
|
Delaware
|
41-0129150
|
|
(State or other jurisdiction of
|
(I. R. S. Employer
|
|
incorporation or organization)
|
Identification No.)
|
|
4666 Faries Parkway Box 1470
Decatur, Illinois
|
62525
|
|
(Address of principal executive offices)
|
(Zip Code
)
|
|
217-424-5200
|
|
|
(Registrant's telephone number, including area code)
|
|
|
Securities registered pursuant to Section 12(b) of the Act:
|
|
|
Title of each class
|
Name of each exchange on which registered
|
|
Common Stock, no par value
|
New York Stock Exchange
|
|
Frankfurt Stock Exchange
|
|
Securities registered pursuant to Section 12(g) of the Act: None
Indicate by check mark if the registrant is a well-known seasoned issuer, as defined in Rule 405 of the Securities Act. Yes
x
No
¨
Indicate by check mark if the registrant is not required to file reports pursuant to Section 13 or 15(d) of the Act. Yes
¨
No
x
Indicate by check mark whether the registrant (1) has filed all reports required to be filed by Section 13 or 15(d) of the Securities Exchange Act of 1934 during the preceding 12 months (or for such shorter period that the registrant was required to file such reports), and (2) has been subject to such filing requirements for the past 90 days. Yes
x
No
¨
Indicate by check mark whether the registrant has submitted electronically and posted on its corporate web site, if any, every Interactive Data File required to be submitted and posted pursuant to Rule 405 of Regulation S-T during the preceding 12 months (or for such shorter period that the registrant was required to submit and post such files).
Yes
x
No
¨
Indicate by check mark if disclosure of delinquent filers pursuant to Item 405 of Regulation S-K is not contained herein, and will not be contained, to the best of registrant’s knowledge, in definitive proxy or information statements incorporated by reference in Part III of this Form 10-K or any amendment to this Form 10-K.
x
Indicate by check mark whether the registrant is a large accelerated filer, an accelerated filer, a non-accelerated filer, or a smaller reporting company. See definition of “large accelerated filer”, “accelerated filer” and “smaller reporting company” in Rule 12b-2 of the Exchange Act.
Large Accelerated Filer
x
Accelerated Filer
o
Non-accelerated Filer
o
Smaller Reporting Company
o
Indicate by check mark whether the registrant is a shell company (as defined in Rule 12b-2 of the Exchange Act). Yes
o
No
x
State the aggregate market value of the voting and non-voting common equity held by non-affiliates computed by reference to the price at which the common equity was last sold, or the average bid and asked price of such common equity, as of the last business day of the registrant’s most recently completed second fiscal quarter.
Common Stock, no par value--$19.7 billion
(Based on the closing sale price of Common Stock as reported on the New York Stock Exchange
as of December 31, 2009)
Indicate the number of shares outstanding of each of the registrant’s classes of common stock, as of the latest practicable date.
Common Stock, no par value—639,324,639 shares
(July 31, 2010)
DOCUMENTS INCORPORATED BY REFERENCE
Portions of the proxy statement for the annual meeting of stockholders to be held November 4, 2010, are incorporated by reference into Part III.
SAFE HARBOR STATEMENT
This Form 10-K contains forward-looking information that is subject to certain risks and uncertainties that could cause actual results to differ materially from those projected, expressed, or implied by such forward-looking information. In some cases, you can identify forward-looking statements by our use of words such as “may, will, should, anticipates, believes, expects, plans, future, intends, could, estimate, predict, potential or contingent,” the negative of these terms or other similar expressions. The Company’s actual results could differ materially from those discussed or implied herein. Factors that could cause or contribute to such differences include, but are not limited to, those discussed in this Form 10-K for the fiscal year ended June 30, 2010. Among these risks are legislative acts; changes in the prices of food, feed, and other commodities, including gasoline; and macroeconomic conditions in various parts of the world. To the extent permitted under applicable law, the Company assumes no obligation to update any forward-looking statements as a result of new information or future events.
Table of Contents
|
Item No
.
|
Description
|
Page No
.
|
|
Part I
|
||
|
1.
|
Business
|
4
|
|
1A.
|
Risk Factors
|
11
|
|
1B.
|
Unresolved Staff Comments
|
14
|
|
2.
|
Properties
|
15
|
|
3.
|
Legal Proceedings
|
17
|
|
4.
|
Reserved
|
17
|
|
Part II
|
||
|
5.
|
Market for Registrant’s Common Equity, Related Stockholder Matters,
and Issuer Purchases of Equity Securities
|
18
|
|
6.
|
Selected Financial Data
|
21
|
|
7.
|
Management’s Discussion and Analysis of Financial Condition and
Results of Operations
|
22
|
|
7A.
|
Quantitative and Qualitative Disclosures About Market Risk
|
35
|
|
8.
|
Financial Statements and Supplementary Data
|
37
|
|
9.
|
Changes in and Disagreements With Accountants on Accounting
and Financial Disclosure
|
86
|
|
9A.
|
Controls and Procedures
|
86
|
|
9B.
|
Other Information
|
86
|
|
Part III
|
||
|
10.
|
Directors, Executive Officers and Corporate Governance
|
87
|
|
11.
|
Executive Compensation
|
90
|
|
12.
|
Security Ownership of Certain Beneficial Owners and Management
and Related Stockholder Matters
|
90
|
|
13.
|
Certain Relationships and Related Transactions, and Director Independence
|
90
|
|
14.
|
Principal Accounting Fees and Services
|
91
|
|
Part IV
|
||
|
15.
|
Exhibits and Financial Statement Schedules
|
91
|
|
Signatures
|
95
|
|
|
Item 1.
|
BUSINESS
|
Company Overview
Archer Daniels Midland Company (the Company) was incorporated in Delaware in 1923, successor to the Daniels Linseed Co. founded in 1902. The Company is one of the world’s largest processors of oilseeds, corn, wheat, cocoa, and other agricultural commodities and is a leading manufacturer of vegetable oil and protein meal, corn sweeteners, flour, biodiesel, ethanol, and other value-added food and feed ingredients. The Company also has an extensive grain elevator and transportation network to procure, store, clean, and transport agricultural commodities, such as oilseeds, corn, wheat, milo, oats, and barley, as well as processed agricultural commodities.
During the past five years, the Company has experienced significant growth, spending approximately $7.9 billion for construction of new plants, maintenance and expansions of existing plants, and the acquisitions of plants and transportation equipment. The Company has recently completed construction of a coal cogeneration facility and two corn dry milling plants which will increase the Company’s annual ethanol production capacity by 600 million gallons to 1.8 billion gallons. In addition, the Company has completed the initial phase of its polyhydroxy alkanoate (PHA) bioplastic production facility, and continues to work through start up at its propylene/ethylene glycol production facility and a new cocoa processing facility. The Company currently expects to spend approximately $1.5 billion to complete the facilities under construction and other approved capital projects through calendar year 2013. There have been no significant dispositions during the last five years.
Segment Descriptions
The Company’s operations are classified into three reportable business segments: Oilseeds Processing, Corn Processing, and Agricultural Services. Each of these segments is organized based upon the nature of products and services offered. The Company’s remaining operations, which include wheat processing, cocoa processing, and its financial business units are not reportable business segments, as defined by the applicable accounting standard, and are classified as Other. Financial information with respect to the Company’s reportable business segments is set forth in “Note 15 of Notes to Consolidated Financial Statements” included in Item 8 herein, “Financial Statements and Supplementary Data.”
Oilseeds Processing
The Oilseeds Processing segment includes activities related to the origination, merchandising, crushing, and further processing of oilseeds such as soybeans, cottonseed, sunflower seeds, canola, rapeseed, peanuts, flaxseed, and palm into vegetable oils and protein meals. The Oilseeds Processing segment principally produces and markets processed oilseed products as ingredients for the food, feed, energy, and other industrial products industries. Crude vegetable oil is sold "as is" or is further processed by refining, blending, bleaching, and deodorizing into salad oils. Salad oils are sold “as is” or are further processed by hydrogenating and/or interesterifying into margarine, shortening, and other food products. Partially refined oil is used to produce biodiesel or is sold to other manufacturers for use in chemicals, paints, and other industrial products. Oilseed protein meals are principally sold to third parties to be used as ingredients in commercial livestock and poultry feeds. The Oilseeds Processing segment also produces natural health and nutrition products and other specialty food and feed ingredients. In North America, cottonseed flour is produced and sold primarily to the pharmaceutical industry and cotton cellulose pulp is manufactured and sold to the chemical, paper, and filter markets. In South America, the Oilseeds Processing segment utilizes a network of grain elevators, port facilities and transportation assets to buy, store, clean, and transport agricultural commodities and operates fertilizer blending facilities.
The Company produces a wide range of edible soy protein products including soy flour, soy grits, soy protein concentrates and soy isolates that are used in processed meats, baked foods, nutritional products, snacks, and dairy and meat analogs.
From co-products of oilseeds, the Company produces natural source vitamin E, tocopherol antioxidants and phytosterols which are marketed to the dietary supplement and food industry. The Company produces soy isoflavones, a dietary supplement, from a co-product of edible soy processing.
|
Item 1.
|
BUSINESS (Continued)
|
Golden Peanut Company LLC, a joint venture between the Company and Alimenta (U.S.A.), Inc., is a major supplier of peanuts and peanut derived ingredients to both the domestic and export markets. The Company has a 50% ownership interest in this joint venture.
The Company has a 50% interest in Edible Oils Limited, a joint venture between the Company and Princes Foods to procure, package, and sell edible oils in the United Kingdom. The Company recently announced the formation of a new edible oils joint venture with Princes Foods in Poland.
Stratas Foods LLC, a joint venture between the Company and ACH Jupiter, LLC, a subsidiary of Associated British Foods, procures, packages, and sells edible oils in North America. The Company has a 50% ownership interest in this joint venture.
The Company has a 16.4% ownership interest in Wilmar International Limited (Wilmar), a Singapore publicly listed company. Wilmar, a leading agribusiness group in Asia, is the largest global processor and merchandiser of palm and lauric oils, and a major oil palm plantation owner. In China, Wilmar is a leading consumer edible oils producer, oilseeds crusher, edible oils refiner, and specialty fats and oleochemicals manufacturer. In India, Wilmar is one of the largest edible oils refiners and a leading producer of consumer edible oils.
The Company is a major supplier of agricultural commodity raw materials to Edible Oils Limited, Stratas Foods LLC, and Wilmar.
Corn Processing
The Company’s Corn Processing segment is engaged in corn wet milling and dry milling activities, primarily in the United States, related to its production of ingredients used in the food and beverage industry including syrup, starch, glucose, dextrose, and sweeteners. Dextrose is also used by the Company as a feedstock for its bioproducts operations. Corn gluten feed and meal, as well as distillers grains, is produced for use as animal feed ingredients. Corn germ, a by-product of the wet milling process, is further processed as an oilseed into vegetable oil and protein meal.
By fermentation of dextrose, the Corn Processing segment produces alcohol, amino acids, and other specialty food and animal feed ingredients. Ethyl alcohol is produced by the Company to beverage grade or for industrial use as ethanol. In gasoline, ethanol increases octane and is used as an extender and oxygenate. Amino acids, such as lysine and threonine, are vital compounds used in swine feeds to produce leaner animals and in poultry feeds to enhance the speed and efficiency of poultry production. The Corn Processing segment also produces, by fermentation, astaxanthin, a product used in aquaculture to enhance flesh coloration. The Corn Processing segment produces citric and lactic acids, lactates, sorbitol, xanthan gum and glycols which are used in various food and industrial products.
Almidones Mexicanos S.A., in which the Company has a 50% interest, operates a wet corn milling plant in Mexico.
Eaststarch C.V. (Netherlands), in which the Company has a 50% interest, owns interests in companies that operate wet corn milling plants in Bulgaria, Hungary, Slovakia, and Turkey.
The Company has a 50% interest in Telles, LLC (Telles), a joint venture between the Company and Metabolix to market and sell PHA, which is being produced in a facility owned by the Company. The first phase of plant construction was completed and operations began in December 2009.
The Company has entered into Brazilian joint ventures for the purposes of growing sugarcane and the production of sugar and ethanol from sugarcane. Construction of the first joint venture ethanol production facility was completed and operations began in December 2009.
Red Star Yeast Company, LLC produces and sells fresh and dry yeast in the United States and Canada. The Company has a 40% ownership interest in this joint venture.
|
Item 1.
|
BUSINESS (Continued)
|
Agricultural Services
The Agricultural Services segment utilizes the Company’s extensive grain elevator and transportation network to buy, store, clean, and transport agricultural commodities, such as oilseeds, corn, wheat, milo, oats, rice, and barley, and resells these commodities primarily as food and feed ingredients and as raw materials for the agricultural processing industry. Agricultural Services’ grain sourcing and transportation network provides reliable and efficient services to the Company’s agricultural processing operations and customers. Agricultural Services’ transportation network capabilities include ground, rail, river, and ocean freight services.
The Company processes and distributes edible beans in the United States for use as a food ingredient. The Company produces and distributes formula feeds and animal health and nutrition products to the livestock, dairy, poultry, and pet food industries.
Alfred C. Toepfer International (Toepfer), in which the Company has an 80% interest, is a global merchandiser of agricultural commodities and processed products. Toepfer has 36 sales offices worldwide and operates inland, river, and export facilities in Argentina, Romania, Ukraine, and the United States.
The Company has a 45% interest in Kalama Export Company, a grain export elevator in Washington.
Other
The Company is engaged in milling wheat, corn, and milo into flour in the United States, Canada, the Caribbean, and the United Kingdom. Wheat flour is sold primarily to commercial bakeries, food manufacturing companies, food service companies, and retailers. Bulgur, a gelatinized wheat food, is sold to both the export and the domestic food markets. Corn meal and flour is sold primarily to the cereal, snack, and bakery mix markets. The Company produces bakery products and mixes, wheat starch, and gluten, which are sold to the baking industry. The Company also mills milo to produce industrial flour used in the manufacturing of wallboard for the building industry.
Gruma S.A.B. de C.V. (Gruma), in which the Company has a 23.2% interest, is the world’s largest producer and marketer of corn flour and tortillas with operations in Mexico, the United States, Central America, South America, and Europe. Additionally, the Company has a 20% share, through a joint venture with Gruma, in six U.S. corn flour mills and one in Italy. The Company also has a 40% share, through a joint venture with Gruma, in nine Mexican wheat flour mills.
The Company procures, transports, and processes cocoa beans and produces cocoa liquor, cocoa butter, cocoa powder, chocolate, and various compounds in North America, South America, Europe, Asia, and Africa for the food processing industry.
Hickory Point Bank and Trust Company, fsb, a wholly owned subsidiary of the Company, furnishes public banking and trust services, as well as cash management, transfer agency, and securities safekeeping services, for the Company.
ADM Investor Services, Inc., a wholly owned subsidiary of the Company, is a registered futures commission merchant and a clearing member of all principal commodities exchanges. ADM Investor Services International, Ltd. and ADMIS Hong Kong Limited are wholly owned subsidiaries of the Company offering broker services in Europe and Asia.
Agrinational Insurance Company, a wholly owned subsidiary of the Company, provides insurance coverage for certain property, casualty, marine, and other miscellaneous risks of the Company and participates in certain third-party reinsurance arrangements.
The Company is a limited partner in various private equity funds which invest primarily in emerging markets.
|
Item 1.
|
BUSINESS (Continued)
|
Corporate
Compagnie Industrielle et Financiere des Produits Amylaces SA (Luxembourg) and affiliates, of which the Company has a 41.5% interest, is a joint venture which targets investments in food, feed ingredients and bioenergy businesses.
In July 2010, the Company made a $100 million cornerstone investment in Agricultural Bank of China, to help advance its strategic growth plans in China.
Methods of Distribution
Since the Company’s customers are principally other manufacturers and processors, the Company’s products are distributed mainly in bulk from processing plants or storage facilities directly to customers’ facilities. The Company has developed a comprehensive transportation system to efficiently move both commodities and processed products virtually anywhere in the world. The Company owns or leases large numbers of the trucks, trailers, railroad tank and hopper cars, river barges, towboats, and ocean-going vessels used in this transportation system.
Concentration of Sales by Product
The following products account for 10% or more of net sales and other operating income for the last three fiscal years:
|
% of Net Sales and Other Operating Income
|
||||||||||||
|
2010
|
2009
|
2008
|
||||||||||
|
Soybeans
|
22% | 19% | 16% | |||||||||
|
Soybean Meal
|
12% | 11% | 11% | |||||||||
|
Corn
|
10% | 12% | 14% | |||||||||
|
Wheat
|
6% | 9% | 10% | |||||||||
Status of New Products
The Company continues to expand the size and global reach of its business through the development of new products.
For retail and foodservice markets, the Company’s researchers continue to develop custom fats and oils with low levels of trans fats. In addition, the Company is working to develop vegetable oil products with reduced saturated fats. During the first quarter of fiscal year 2010, the Company successfully introduced oils with lower levels of naturally occurring trace compounds in Europe.
The Company continues to develop the market for its cooked, dried edible bean products of the Vegefull™ line to meet customer demands for increased protein and fiber in food.
In 2007, the Company entered into a development agreement with ConocoPhillips to develop affordable, renewable transportation biofuels from biomass. A technology platform has been developed following extensive evaluation of potential options for the production of bio-crude materials. The Company is piloting the technology and has produced quantities of biocrude that can be upgraded to gasoline components by ConocoPhillips.
In December 2009, the Company started production of Mirel
®
, a renewable plastic in our Clinton, Iowa facility. This new bioplastic is being marketed by Telles, a joint venture of the Company and Metabolix.
|
Item 1.
|
BUSINESS (Continued)
|
The Company has completed modifications to its sorghum mill in Plainview, Texas to produce food-grade sorghum flour to be used in the growing market for gluten-free, multigrain and whole-grain bakery and snack products. The Company has introduced a new chocolate that contains fiber for use in nutrition bars.
The Company is moving toward the completion of its propylene glycol plant in Decatur, Illinois. The Company expects this plant to be fully operational in the fourth quarter of this calendar year.
The Company has begun offering isosorbide under its Evolution Chemicals™ line. Isosorbide is an industrial ingredient made from corn that is a potential alternative to the petroleum-based chemical Bisphenol A in plastics and other applications.
Source and Availability of Raw Materials
Substantially all of the Company’s raw materials are agricultural commodities. In any single year, the availability and price of these commodities are subject to factors such as weather, plantings, government programs and policies, changes in global demand created by population growth and changes in standards of living, and global production of similar and competitive crops. The Company’s raw materials are procured from thousands of growers, grain elevators, and wholesale merchants, in North America, South America, Europe, Asia, and Africa, pursuant to short-term (less than one year) agreements or on a spot basis. The Company is not dependent upon any particular grower, elevator, or merchant as a source for its raw materials.
Patents, Trademarks, and Licenses
The Company owns valuable patents, trademarks, and licenses but does not consider any segment of its business dependent upon any single or group of patents, trademarks or licenses.
Seasonality, Working Capital Needs, and Significant Customers
Since the Company is widely diversified in global agribusiness markets, there are no material seasonal fluctuations in the manufacture, sale, and distribution of its products and services. There is a degree of seasonality in the growing cycles, procurement, and transportation of the Company’s principal raw materials: oilseeds, corn, wheat, cocoa beans, sugarcane, and other grains. However, the physical movement of the millions of metric tons of these crops through the Company’s global processing facilities is reasonably constant throughout the year.
Price variations and availability of raw agricultural commodities may cause fluctuations in the Company’s working capital levels. No material part of the Company’s business is dependent upon a single customer or very few customers.
Competition
The Company has significant competition in the markets in which it operates based principally on price, quality, products and alternative products, some of which are made from different raw materials than those utilized by the Company. Given the commodity-based nature of many of its businesses, the Company, on an ongoing basis, focuses on managing unit costs and improving efficiency through technology improvements, productivity enhancements, and regular evaluation of the Company’s asset portfolio.
Research and Development Expenditures
The Company’s research and development expenditures are focused on improving processing efficiency and developing food, feed, fuel, and industrial products from renewable agricultural crops.
|
Item 1.
|
BUSINESS (Continued)
|
The Company maintains a research laboratory in Decatur, Illinois, where product and process development activities are conducted. Activities at Decatur include the development of new bioproducts and the improvement of existing bioproducts by utilizing new microbial strains that are developed using classical mutation and genetic engineering. Protein and vegetable oil research is also conducted in Decatur where bakery, meat and dairy pilot plants support food ingredient research. Vegetable oil research is also conducted in Hamburg, Germany; Erith, UK; and Arras, France. Research to support sales and development for flour and bakery products is performed in Overland Park, Kansas. Sales and development support for cocoa and chocolate products is performed in Milwaukee, Wisconsin, and Koog aan de Zaan, the Netherlands. Research and technical support for industrial and food wheat starch applications is conducted in Ontario, Canada. The Company recently opened its Advantage Centre in Singapore which supports customers with de Zaan cocoa product solutions through seminars, demonstrations and collaborative product development.
The Company uses technical service representatives to interact with customers to understand the customers’ product needs. These technical service representatives then interact with researchers who are familiar with the Company’s wide range of food, feed, fuel, and industrial products as well as applications technology. These individuals form quick-acting teams to develop solutions to customer needs.
As part of the Company’s partnership with ConocoPhillips, the Company is continuing its development of advanced biofuels. Piloting work has been undertaken for the conversion of biomass into bio-crude which can be utilized within an existing petroleum refinery to produce gasoline components. In addition, the Company is developing a technology for the conversion of vegetable oils into green diesel.
The Company is continuing to work on a grant awarded by the Department of Energy to build and operate a pilot plant for the production of ethanol and ethyl acrylate from corn stover and other cellulosic materials.
The Company’s biodiesel research is focused on cost, product quality, and alternative feed stocks. Several new technologies have been developed to minimize the chemical input costs for biodiesel production while simultaneously reducing waste streams and improving yield. Selected technologies are being deployed in the Company’s current biodiesel production facilities to reduce costs and improve quality.
The Company has entered into a joint development agreement with John Deere and Monsanto to evaluate the sustainable collection, storage and transportation of corn stover – the stalks, cobs and leaves of the corn plant left in the field after combine harvesting. The insights from this research will continue to help the Company understand the volume potential and economics of corn stover as a biomass feedstock for advanced biofuels.
The Company is working with the U.S. Department of Energy’s National Energy Technology Laboratory and other key academic and corporate partners on projects to demonstrate carbon capture and sequestration as a viable option for reducing carbon dioxide emissions from manufacturing operations. The first project will demonstrate the viability of sequestering carbon dioxide in the Mt. Simon Sandstone, an underground saline-bearing rock formation. A second project, announced in June 2010, is currently investigating the feasibility to sequester up to one million tons of carbon dioxide annually.
The Company is continuing to invest in research to develop a broad range of industrial chemicals. The approach is to build key chemical-building blocks that serve as a platform for producing a variety of commodity chemicals. The key chemical-building blocks are derived from the Company’s starch and oilseed- based feedstocks. Conversion technologies include utilizing expertise in both fermentation and catalysis. The chemicals pipeline includes the development of chemicals and intermediates that are currently produced from petrochemical resources as well as new to the market bio-based products. The Company’s current portfolio includes products that are in the early development phase and those that are close to pilot plant demonstration.
The expense during the three years ended June 30, 2010, 2009 and 2008 for such technical efforts, including expenditures subsequently reimbursed by grants, was approximately $56 million, $50 million, and $49 million, respectively.
|
Item 1.
|
BUSINESS (Continued)
|
Environmental Compliance
During the year ended June 30, 2010, $90 million was spent specifically to improve equipment, facilities, and programs for pollution control and compliance with the requirements of various environmental agencies.
On July 31, 2009, the United States Environmental Protection Agency (U.S. EPA) issued a Notice of Violation indicating that one of the Company’s facilities in Memphis, Tennessee, may have violated section 311(j) of the Clean Water Act relating to a release of product that occurred on January 2, 2008. The Company and the U.S. EPA have reached a tentative agreement to resolve this matter which includes a penalty of approximately $120,000.
There have been no material effects upon the earnings and competitive position of the Company resulting from compliance with federal, state, and local laws or regulations enacted or adopted relating to the protection of the environment.
The Company’s business could be affected in the future by national and global regulation or taxation of greenhouse gas emissions. In the United States, the U.S. Environmental Protection Agency (Agency) has recently adopted regulations requiring the owners of certain facilities to measure and report their greenhouse gas emissions, and the Agency has begun a process to regulate these emissions under the Clean Air Act. The U.S. Congress is currently considering climate change-related legislation which may include cap and trade provisions or a carbon tax. Globally, a number of countries that are parties to the Kyoto Protocol have instituted or are considering climate change legislation and regulations. Most notable is the European Union Greenhouse Gas Emission Trading System (EU-ETS). The Company has several facilities in Europe that participate in this system. It is difficult at this time to estimate the likelihood of passage, or predict the potential impact, of any additional legislation. Potential consequences could include increased energy, transportation and raw material costs and may require the Company to make additional investments in its facilities and equipment.
Number of Employees
The number of full-time employees of the Company was approximately 29,300 at June 30, 2010.
Financial Information About Foreign and Domestic Operations
Item 1A, “Risk Factors,” and Item 2, “Properties,” includes information relating to the Company’s foreign and domestic operations. Geographic financial information is set forth in “Note 15 of Notes to Consolidated Financial Statements” included in Item 8 herein, “Financial Statements and Supplementary Data”.
Available Information
The Company’s internet address is
http://www.adm.com
. The Company makes available, free of charge, through its internet site, the Company’s annual reports on Form 10-K; quarterly reports on Form 10-Q; current reports on Form 8-K; Directors and Officers Forms 3, 4, and 5; and amendments to those reports, as soon as reasonably practicable after electronically filing such materials with, or furnishing them to, the Securities and Exchange Commission (SEC).
In addition, the Company makes available, through its Internet site, the Company’s Business Code of Conduct and Ethics, Corporate Governance Guidelines, and the written charters of the Audit, Compensation/Succession, Nominating/Corporate Governance, and Executive Committees.
References to our website addressed in this report are provided as a convenience and do not constitute, or should not be viewed as, an incorporation by reference of the information contained on, or available through, the website. Therefore, such information should not be considered part of this report.
|
Item 1.
|
BUSINESS (Continued)
|
The public may read and copy any materials filed by the Company with the SEC at the SEC’s Public Reference Room at 100 F Street, N.E., Washington, D.C. 20549. The public may obtain information on the operation of the Public Reference Room by calling the SEC at 1-800-SEC-0330. The SEC maintains an Internet site which contains reports, proxy and information statements, and other information regarding issuers that file information electronically with the SEC. The SEC’s Internet address is http://www.sec.gov.
|
Item 1A.
|
RISK FACTORS
|
The availability and prices of the agricultural commodities and agricultural commodity products the Company procures, transports, stores, processes, and merchandises can be affected by weather conditions, disease, government programs, competition, and various other factors beyond the Company’s control and could adversely affect the Company’s operating results.
The availability and prices of agricultural commodities are subject to wide fluctuations due to factors such as changes in weather conditions, disease, plantings, government programs and policies, competition, changes in global demand resulting from population growth and changes in standards of living, and global production of similar and competitive crops. These factors have historically caused volatility in agricultural commodity prices and, consequently, in the Company’s operating results. Reduced supply of agricultural commodities due to weather-related factors or other reasons could adversely affect the Company’s profitability by increasing the cost of raw materials and/or limit the Company’s ability to procure, transport, store, process, and merchandise agricultural commodities in an efficient manner.
The Company has significant competition in the markets in which it operates.
The Company faces significant competition in each of its businesses and has numerous competitors. Pricing of the Company’s products is partly dependent upon industry processing capacity, which is impacted by competitor actions to bring on-line idled capacity or build new production capacity. Many of the products bought and sold by the Company are global commodities or are derived from global commodities. The markets for global commodities are highly price competitive and in many cases the commodities are subject to substitution. To compete effectively, the Company focuses on improving efficiency in its production and distribution operations, developing and maintaining appropriate market share, and providing high levels of customer service. Competition could increase the Company’s costs to purchase raw materials, lower selling prices of its products, or reduce the Company’s market share, which may result in lower and more inefficient operating rates. If the Company is unable to compete on price, service, or other factors, it could have an adverse effect on its operating results.
Fluctuations in energy prices could adversely affect the Company’s operating results.
The Company’s operating costs and the selling prices of certain finished products are sensitive to changes in energy prices. The Company’s processing plants are powered principally by electricity, natural gas, and coal. The Company’s transportation operations are dependent upon diesel fuel and other petroleum-based products. Significant increases in the cost of these items, including any consequences of regulation or taxation of greenhouse gases, could adversely affect the Company’s production costs and operating results.
The Company has certain finished products, such as ethanol and biodiesel, which are closely related to, or may be substituted for, petroleum products. Therefore, the selling prices of ethanol and biodiesel can be impacted by the selling prices of gasoline and diesel fuel. A significant decrease in the price of gasoline or diesel fuel could result in a significant decrease in the selling price of the Company’s ethanol and biodiesel and could adversely affect the Company’s revenues and operating results.
|
Item 1A.
|
RISK FACTORS (Continued)
|
The Company is subject to economic downturns, political instability and other risks of doing business globally which could adversely affect the Company’s operating results.
The Company conducts its business and has substantial assets located in many countries and geographic areas. The Company’s operations are principally in the United States and developed countries in Western Europe and South America, but the Company also operates in, or plans to expand or develop its business in, emerging market areas such as Asia, Eastern Europe, the Middle East, and Africa. Both developed and emerging market areas are subject to impacts of economic downturns, including decreased demand for the Company’s products, reduced availability of credit, or declining credit quality of the Company’s suppliers, customers, and other counterparties. In addition, emerging market areas could be subject to more volatile economic, political and market conditions. Economic downturns and volatile conditions may have a negative impact on the Company’s operating results and ability to execute its business strategies.
The Company’s operating results could be affected by changes in trade, monetary, fiscal and environmental policies, laws and regulations, and other activities of governments, agencies, and similar organizations. These conditions include but are not limited to changes in a country’s or region’s economic or political conditions, trade regulations affecting production, pricing and marketing of products, local labor conditions and regulations, reduced protection of intellectual property rights, changes in the regulatory or legal environment, restrictions on currency exchange activities, currency exchange fluctuations, burdensome taxes and tariffs, enforceability of legal agreements and judgments, other trade barriers, and regulation or taxation of greenhouse gases. International risks and uncertainties, including changing social and economic conditions as well as terrorism, political hostilities, and war, could limit the Company’s ability to transact business in these markets and could adversely affect the Company’s revenues and operating results.
Government policies and regulations, in general, and specifically affecting the agricultural sector and related industries, could adversely affect the Company’s operating results.
Agricultural production and trade flows are subject to government policies and regulations. Governmental policies affecting the agricultural industry, such as taxes, tariffs, duties, subsidies, incentives, and import and export restrictions on agricultural commodities and commodity products, including policies related to genetically modified organisms, renewable fuel, and low carbon fuel mandates, can influence the planting of certain crops, the location and size of crop production, whether unprocessed or processed commodity products are traded, the volume and types of imports and exports, the availability and competitiveness of feedstocks as raw materials, the viability and volume of production of certain of the Company’s products, and industry profitability. In addition, international trade disputes can adversely affect agricultural commodity trade flows by limiting or disrupting trade between countries or regions. Future government policies may adversely affect the supply of, demand for, and prices of the Company’s products, restrict the Company’s ability to do business in its existing and target markets, and could negatively impact the Company’s revenues and operating results.
The Company is subject to industry-specific risks which could adversely affect the Company’s operating results.
The Company is subject to risks which include, but are not limited to, product quality or contamination; shifting consumer preferences; federal, state, and local food processing regulations; socially unacceptable farming practices; environmental, health and safety regulations; and customer product liability claims. The liability which could result from certain of these risks may not always be covered by, or could exceed liability insurance related to product liability and food safety matters maintained by the Company. The occurrence of any of the matters described above could adversely affect the Company’s revenues and operating results.
Certain of the Company’s merchandised commodities and finished products are used as ingredients in livestock and poultry feed. The Company is subject to risks associated with the outbreak of disease in livestock and poultry, including, but not limited to, mad-cow disease and avian influenza. The outbreak of disease could adversely affect demand for the Company’s products used as ingredients in livestock and poultry feed. A decrease in demand for these products could adversely affect the Company’s revenues and operating results.
|
Item 1A.
|
RISK FACTORS (Continued)
|
The Company is subject to numerous laws and regulations globally which could adversely affect the Company’s operating results.
The Company does business globally, operating facilities in over 60 countries. In addition, the Company distributes product to countries in which we do not operate facilities. The Company is required to comply with the numerous and broad reaching laws and regulations administered by United States federal, state and local, and foreign governmental authorities. The Company must comply with other general business regulations such as those directed toward accounting and income taxes, anti-corruption, anti-bribery, global trade, handling of regulated substances, and other commercial activities, conducted by the Company’s employees and third party representatives globally. Any failure to comply with applicable laws and regulations could subject the Company to administrative penalties and injunctive relief, and civil remedies including fines, injunctions, and recalls of its products.
The production of the Company’s products requires the use of materials which can create emissions of certain regulated substances including greenhouse gas emissions. Although the Company has programs in place throughout the organization globally to guard against non-compliance, failure to comply with these regulations can have serious consequences, including civil and administrative penalties as well as a negative impact on the Company’s reputation, business, cash flows, and results of operations.
In addition, changes to regulations or implementation of additional regulations, for example the imposition of regulatory restrictions on greenhouse gases, may require the Company to modify existing processing facilities and/or processes which could significantly increase operating costs and negatively impact operating results.
The Company is exposed to potential business disruption, including but not limited to disruption of transportation services, supply of non-commodity raw materials used in its processing operations, and other impacts resulting from acts of terrorism or war, natural disasters, severe weather conditions, and accidents which could adversely affect the Company’s operating results.
The Company’s operations rely on dependable and efficient transportation services. A disruption in transportation services could result in difficulties supplying materials to the Company’s facilities and impair the Company’s ability to deliver products to its customers in a timely manner. In addition, if certain non-agricultural commodity raw materials, such as certain chemicals used in the Company’s processing operations, are not available, the Company’s business could be disrupted. Certain factors which may impact the availability of non-agricultural commodity raw materials are out of the Company’s control including but not limited to disruptions resulting from economic conditions, manufacturing delays or disruptions at suppliers, shortage of materials, and unavailable or poor supplier credit conditions.
The assets and operations of the Company could be subject to extensive property damage and business disruption from various events which include, but are not limited to, acts of terrorism or war, natural disasters and severe weather conditions, accidents, explosions, and fires. The potential effects of these conditions could impact the Company’s revenues and operating results.
The Company’s business is capital intensive in nature and the Company relies on cash generated from its operations and external financing to fund its growth and ongoing capital needs. Limitations on access to external financing could adversely affect the Company’s operating results.
The Company requires significant capital to operate its current business and fund its growth strategy. The Company’s working capital requirements are directly affected by the price of agricultural commodities, which may fluctuate significantly and change quickly. The Company also requires substantial capital to maintain and upgrade its extensive network of storage facilities, processing plants, refineries, mills, ports, transportation assets and other facilities to keep pace with competitive developments, technological advances, regulations and changing safety standards in the industry. Moreover, the expansion of the Company’s business and pursuit of acquisitions or other business opportunities may require significant amounts of capital. If the Company is unable to generate sufficient cash flows or raise adequate external financing, it may restrict the Company’s current operations and its growth opportunities which could adversely affect the Company’s operating results.
|
Item 1A.
|
RISK FACTORS (Continued)
|
The Company’s risk management strategies may not be effective.
The Company’s business is affected by fluctuations in agricultural commodity prices, transportation costs, energy prices, interest rates, and foreign currency exchange rates. The Company engages in hedging strategies to manage these risks. However, these hedging strategies may not be successful in mitigating the Company’s exposure to these fluctuations. See “Item 7A. Quantitative and Qualitative Disclosures About Market Risk.”
The Company has limited control over and may not realize the expected benefits of its equity investments and joint ventures.
The Company has many joint ventures and investments of which the Company has limited control as to the governance and management activities of these investments. The Company expects to benefit from these investments, which typically aim to expand or enhance the Company’s market for its products or offer other benefits including but not limited to geographic or product line expansion. The Company may encounter unanticipated operating issues or financial results related to these investments that may impact the Company’s revenues and operating results.
The Company’s information technology systems, processes, and sites may suffer interruptions or failures which may affect the Company’s ability to conduct its business.
The Company’s information technology systems, some of which are dependent on services provided by third-parties, provide critical data connectivity, information and services for internal and external users. These interactions include, but are not limited to, ordering and managing materials from suppliers, converting raw materials to finished products, inventory management, shipping products to customers, processing transactions, summarizing and reporting results of operations, complying with regulatory, legal or tax requirements, and other processes necessary to manage the business. The Company has put in place business continuity plans for its critical systems. However, if the Company’s information technology systems are damaged, or cease to function properly due to any number of causes, such as catastrophic events, power outages, security breaches, and the Company’s business continuity plans do not effectively compensate on a timely basis, the Company may suffer interruptions in the ability to manage its operations, which may adversely impact the Company’s revenues and operating results.
|
Item 1B.
|
UNRESOLVED STAFF COMMENTS
|
The Company has no unresolved staff comments.
|
Item 2.
|
PROPERTIES
|
The Company owns or leases, under operating leases, the following processing plants and procurement facilities:
|
Processing Plants
|
Procurement Facilities
|
|||||||||||||||||||||||
|
United
|
International
|
Total
|
United
|
International
|
Total
|
|||||||||||||||||||
|
States
|
States
|
|||||||||||||||||||||||
|
Owned
|
132 | 112 | 244 | 178 | 114 | 292 | ||||||||||||||||||
|
Leased
|
1 | 2 | 3 | 13 | 27 | 40 | ||||||||||||||||||
| 133 | 114 | 247 | 191 | 141 | 332 | |||||||||||||||||||
The Company’s operations are such that most products are efficiently processed near the source of raw materials. Consequently, the Company has many plants strategically located in agricultural commodity producing areas. The annual volume of commodities processed will vary depending upon availability of raw materials and demand for finished products.
To enhance the efficiency of transporting large quantities of raw materials and finished products between the Company’s procurement facilities and processing plants and also the final delivery of products to our customers around the world, the Company owns approximately 1,500 barges, 14,100 rail cars, 700 trucks, 1,600 trailers, and 7 ocean going vessels; and leases, under operating leases, approximately 200 barges and 10,600 railcars.
Oilseeds Processing
|
Processing Plants
|
Procurement Facilities
|
|||||||||||||||||||||||
|
United States
|
International
|
Total
|
United States
|
International
|
Total
|
|||||||||||||||||||
|
Owned
|
47 | 67 | 114 | 13 | 90 | 103 | ||||||||||||||||||
|
Leased
|
– | – | – | – | 15 | 15 | ||||||||||||||||||
| 47 | 67 | 114 | 13 | 105 | 118 | |||||||||||||||||||
The Company operates twenty-three domestic and twenty-two international oilseed crushing plants with a daily processing capacity of approximately 95,000 metric tons (3.5 million bushels). The domestic plants are located in Georgia, Illinois, Indiana, Iowa, Kansas, Minnesota, Missouri, Nebraska, North Dakota, Ohio, South Carolina, Tennessee, and Texas. The international plants are located in Bolivia, Brazil, Canada, Czech Republic, England, Germany, India, Mexico, the Netherlands, Poland, and Ukraine.
The Company operates thirteen domestic oilseed refineries in Georgia, Illinois, Indiana, Iowa, Minnesota, Missouri, Nebraska, North Dakota, and Tennessee, as well as nineteen international refineries in Bolivia, Brazil, Canada, Czech Republic, England, Germany, India, the Netherlands, and Poland. The Company packages oils at ten international plants located in Bolivia, Brazil, England, Germany, India, Peru, and Poland. The Company operates one domestic and six international biodiesel plants located in North Dakota, Brazil, Germany, and India. In addition, the Company operates four fertilizer blending plants in Brazil.
The Oilseeds Processing segment operates thirteen domestic country grain elevators as adjuncts to its processing plants. These elevators, with an aggregate storage capacity of approximately 8 million bushels, are located in Illinois, Missouri, North Carolina, and Ohio.
This segment also operates 105 international elevators, including port facilities, in Bolivia, Brazil, Canada, India, Germany, the Netherlands, Paraguay, and Poland. These facilities have a storage capacity of approximately 133 million bushels.
|
Item 2.
|
PROPERTIES (Continued)
|
The Company operates two soy protein specialty plants in Illinois and one plant in the Netherlands. Lecithin products are produced at six domestic and four international plants in Illinois, Iowa, Nebraska, Canada, Germany, and the Netherlands. The Company produces vitamin E, sterols, and isoflavones at two plants in Illinois. The Company also operates a specialty oils and fats plant in France that produces various value-added products for the pharmaceutical, cosmetic and food industries.
Corn Processing
|
Processing Plants
|
Procurement Facilities
|
|||||||||||||||||||||||
|
United States
|
International
|
Total
|
United States
|
International
|
Total
|
|||||||||||||||||||
|
Owned
|
17 | 1 | 18 | 5 | – | 5 | ||||||||||||||||||
The Company operates five wet corn milling plants and four dry corn milling plants with a daily grind capacity of approximately 66,000 metric tons (2.6 million bushels). The Company also operates corn germ extraction plants, sweeteners and starches production facilities, a glycols production facility, a polymer production facility and bioproducts production facilities in Illinois, Iowa, Minnesota, Nebraska, North Carolina, and North Dakota and a sugarcane processing plant in Brazil. The Corn Processing segment also operates five domestic grain terminal elevators as adjuncts to its processing plants. These elevators, with an aggregate storage capacity of approximately 13 million bushels, are located in Minnesota.
Agricultural Services
|
Processing Plants
|
Procurement Facilities
|
|||||||||||||||||||||||
|
United States
|
International
|
Total
|
United States
|
International
|
Total
|
|||||||||||||||||||
|
Owned
|
29 | 6 | 35 | 160 | 18 | 178 | ||||||||||||||||||
|
Leased
|
1 | 1 | 2 | 13 | 9 | 22 | ||||||||||||||||||
| 30 | 7 | 37 | 173 | 27 | 200 | |||||||||||||||||||
The Company operates 142 domestic terminal, sub-terminal, country, and river elevators covering the major grain producing states, and also operates eight grain export elevators in Florida, Louisiana, Ohio, and Texas. Elevators are located in Arkansas, Illinois, Indiana, Iowa, Kansas, Kentucky, Michigan, Minnesota, Missouri, Montana, Nebraska, North Dakota, Ohio, Oklahoma, Tennessee, and Texas. These elevators have an aggregate storage capacity of approximately 400 million bushels. The Company has five grain export elevators in Argentina, Mexico, and Ukraine that have an aggregate storage capacity of approximately 29 million bushels. The Company has thirteen country elevators located in the Dominican Republic, Ireland, Romania, and Ukraine. In addition, the Company has nine leased river elevators located in Romania and Ukraine.
The Company operates twenty-three domestic edible bean procurement facilities located in Colorado, Idaho, Michigan, Minnesota, North Dakota, and Wyoming.
The Company operates a rice mill located in California, an animal feed facility in Illinois, and an edible bean plant in North Dakota. The Company also operates twenty-seven domestic and seven international formula feed and animal health and nutrition plants. The domestic plants are located in Georgia, Illinois, Indiana, Iowa, Kansas, Kentucky, Michigan, Minnesota, Missouri, Nebraska, Ohio, Pennsylvania, Texas, Washington, and Wisconsin. The international plants are located in Canada, China, Puerto Rico, and Trinidad & Tobago.
|
Item 2.
|
PROPERTIES (Continued)
|
Other
|
Processing Plants
|
Procurement Facilities
|
|||||||||||||||||||||||
|
United States
|
International
|
Total
|
United States
|
International
|
Total
|
|||||||||||||||||||
|
Owned
|
39 | 38 | 77 | – | 6 | 6 | ||||||||||||||||||
|
Leased
|
– | 1 | 1 | – | 3 | 3 | ||||||||||||||||||
| 39 | 39 | 78 | – | 9 | 9 | |||||||||||||||||||
The Company operates twenty-three domestic wheat flour mills, a domestic bulgur plant, two domestic corn flour mills, two domestic milo mills, and twenty international flour mills with a total daily milling capacity of approximately 28,000 metric tons (1.0 million bushels). The Company also operates six bakery mix plants. These plants and related properties are located in California, Illinois, Indiana, Kansas, Minnesota, Missouri, Nebraska, New York, North Carolina, Oklahoma, Pennsylvania, Tennessee, Texas, Washington, Barbados, Belize, Canada, England, Grenada, and Jamaica. The Company operates two formula feed plants as adjuncts to the wheat flour mills in Belize and Grenada, a rice milling plant in Jamaica, and a starch and gluten plant in Iowa and one in Canada. The Company also operates a honey drying operation in Wisconsin.
The Company operates six domestic and twelve international chocolate and cocoa bean processing plants with a total daily production capacity of approximately 3,000 metric tons. The domestic plants are located in Massachusetts, New Jersey, Pennsylvania, and Wisconsin, and the international plants are located in Belgium, Brazil, Canada, England, Germany, Ghana, Ivory Coast, the Netherlands, and Singapore. The Company operates nine cocoa bean procurement and handling facilities/port sites in Brazil, Indonesia, and Ivory Coast.
|
Item 3.
|
LEGAL PROCEEDINGS
|
The Company is a party to routine legal proceedings that arise in the course of its business. The Company is not currently a party to any legal proceeding or environmental claim that it believes would have a material adverse effect on its financial position, results of operations, or liquidity.
|
Item 4.
|
RESERVED
|
|
Item 5.
|
MARKET FOR REGISTRANT’S COMMON EQUITY, RELATED STOCKHOLDER MATTERS, AND ISSUER PURCHASES OF EQUITY SECURITIES
|
Common Stock Market Prices and Dividends
The Company’s common stock is listed and traded on the New York Stock Exchange and the Frankfurt Stock Exchange. The following table sets forth, for the periods indicated, the high and low market prices of the common stock as reported on the New York Stock Exchange and common stock cash dividends declared per share.
|
Cash
|
||||||||||||
|
Market Price
|
Dividends
|
|||||||||||
|
High
|
Low
|
Per Share
|
||||||||||
|
Fiscal 2010-Quarter Ended
|
||||||||||||
|
June 30
|
$ | 29.26 | $ | 24.22 | $ | 0.15 | ||||||
|
March 31
|
31.89 | 28.06 | 0.15 | |||||||||
|
December 31
|
33.00 | 27.66 | 0.14 | |||||||||
|
September 30
|
32.13 | 26.00 | 0.14 | |||||||||
|
Fiscal 2009-Quarter Ended
|
||||||||||||
|
June 30
|
$ | 29.40 | $ | 23.13 | $ | 0.14 | ||||||
|
March 31
|
29.50 | 24.08 | 0.14 | |||||||||
|
December 31
|
29.08 | 13.53 | 0.13 | |||||||||
|
September 30
|
33.91 | 19.70 | 0.13 | |||||||||
The number of registered shareholders of the Company’s common stock at June 30, 2010, was 15,384. The Company expects to continue its policy of paying regular cash dividends, although there is no assurance as to future dividends because they are dependent on future earnings, capital requirements, and financial condition.
|
Item 5.
|
MARKET FOR REGISTRANT’S COMMON EQUITY, RELATED STOCKHOLDER MATTERS, AND ISSUER PURCHASES OF EQUITY SECURITIES (Continued)
|
Issuer Purchases of Equity Securities
|
Total Number of
|
Number of Shares
|
|||||||||||||||
|
Total Number
|
Average
|
Shares Purchased as
|
Remaining to be
|
|||||||||||||
|
of Shares
|
Price Paid
|
Part of Publicly
|
Purchased Under the
|
|||||||||||||
|
Period
|
Purchased (1)
|
per Share
|
Announced Program (2)
|
Program (2)
|
||||||||||||
|
April 1, 2010 to
April 30, 2010
|
33,035 | $ | 28.600 | 220 | 99,999,376 | |||||||||||
|
May 1, 2010 to
May 31, 2010
|
3,776,252 | 26.482 | 3,776,252 | 96,223,124 | ||||||||||||
|
June 1, 2010 to
June 30, 2010
|
196 | 26.792 | – | 96,223,124 | ||||||||||||
|
Total
|
3,809,483 | $ | 26.500 | 3,776,472 | 96,223,124 | |||||||||||
|
(1) Total shares purchased represents those shares purchased as part of the Company’s publicly announced share repurchase program described below and shares received as payment of the exercise price for stock option exercises. During the three-month period ended June 30, 2010, the Company received 33,011 shares as payment of the exercise price for stock option exercises.
(2) On November 5, 2009, the Company’s Board of Directors approved a stock repurchase program authorizing the Company to repurchase up to 100,000,000 shares of the Company’s common stock during the period commencing January 1, 2010 and ending December 31, 2014.
|
|
Item 5.
|
MARKET FOR REGISTRANT’S COMMON EQUITY, RELATED STOCKHOLDER MATTERS, AND ISSUER PURCHASES OF EQUITY SECURITIES (Continued)
|
Performance Graph
The graph below compares five-year returns of the Company’s common stock with those of the S&P 500 Index and the S&P Consumer Staples Index. The graph assumes all dividends have been reinvested and assumes an initial investment of $100 on June 30, 2005. Information in the graph is presented on a June 30 fiscal year basis.
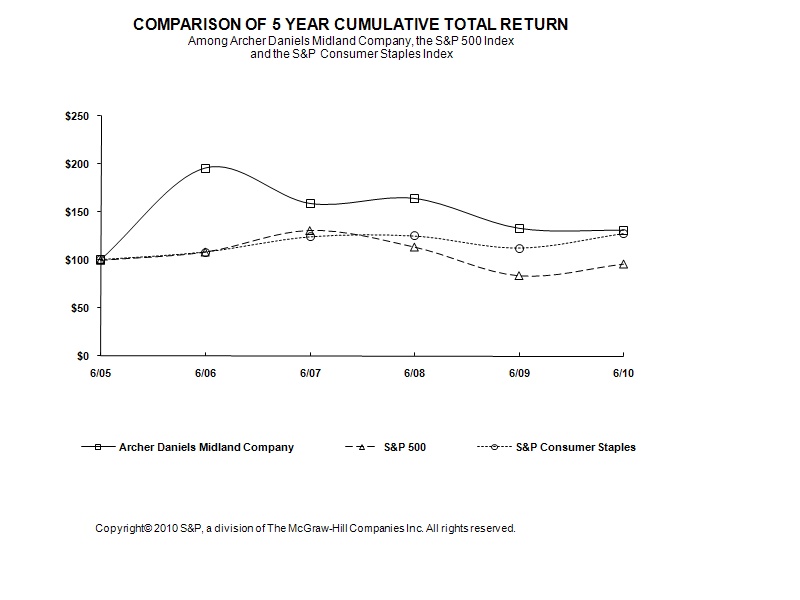
Graph produced by Research Data Group, Inc.
|
Item 6.
|
SELECTED FINANCIAL DATA
|
Selected Financial Data
(In millions, except ratio and per share data)
|
2010
|
2009
|
2008
|
2007
|
2006
|
||||||||||||||||
|
Net sales and other operating income
|
$ | 61,682 | $ | 69,207 | $ | 69,816 | $ | 44,018 | $ | 36,596 | ||||||||||
|
Depreciation
|
857 | 730 | 721 | 701 | 657 | |||||||||||||||
|
Net earnings attributable to controlling interests
|
1,930 | 1,684 | 1,780 | 2,154 | 1,312 | |||||||||||||||
|
Basic earnings per common share
|
3.00 | 2.62 | 2.76 | 3.31 | 2.01 | |||||||||||||||
|
Diluted earnings per common share
|
3.00 | 2.62 | 2.75 | 3.28 | 2.00 | |||||||||||||||
|
Cash dividends
|
372 | 347 | 316 | 281 | 242 | |||||||||||||||
|
Per common share
|
0.58 | 0.54 | 0.49 | 0.43 | 0.37 | |||||||||||||||
|
Working capital
|
$ | 9,561 | $ | 10,523 | $ | 10,833 | $ | 7,254 | $ | 5,661 | ||||||||||
|
Current ratio
|
2.1 | 2.2 | 1.7 | 1.9 | 1.9 | |||||||||||||||
|
Inventories
|
7,611 | 7,782 | 10,160 | 6,060 | 4,677 | |||||||||||||||
|
Net property, plant, and equipment
|
8,712 | 7,950 | 7,125 | 6,010 | 5,293 | |||||||||||||||
|
Gross additions to property, plant, and
equipment
|
1,788 | 2,059 | 1,789 | 1,404 | 841 | |||||||||||||||
|
Total assets
|
31,548 | 31,582 | 37,052 | 25,114 | 21,269 | |||||||||||||||
|
Long-term debt, excluding current maturities
|
6,830 | 7,592 | 7,443 | 4,468 | 4,050 | |||||||||||||||
|
Shareholders’ equity
|
14,631 | 13,653 | 13,666 | 11,446 | 9,838 | |||||||||||||||
|
Per common share
|
22.89 | 21.27 | 21.22 | 17.80 | 15.00 | |||||||||||||||
|
Weighted average shares outstanding-basic
|
643 | 643 | 644 | 651 | 654 | |||||||||||||||
|
Weighted average shares outstanding-diluted
|
644 | 644 | 646 | 656 | 656 | |||||||||||||||
Significant items affecting the comparability of the financial data shown above are as follows:
|
·
|
Net earnings attributable to controlling interests for 2010 include a charge of $75 million ($47 million after tax, equal to $0.07 per share) related to loss on extinguishment of debt resulting from the repurchase of $500 million in aggregate principal amount of the Company’s outstanding debentures, and start up costs for the Company’s significant new greenfield plants of $110 million ($68 million after tax, equal to $0.11 per share).
|
|
·
|
Net earnings attributable to controlling interests for 2009 include a non-cash charge of $275 million ($171 million after tax, equal to $0.27 per share) related to currency derivative losses of the Company’s equity investee, Gruma S.A.B. de C.V., and a $158 million income tax charge (equal to $0.24 per share) related to the reorganization of the holding company structure in which the Company holds a portion of its equity investment in Wilmar. For further information concerning Wilmar-related tax matters see Note 12 in Item 8, Financial Statements and Supplementary Data (Item 8).
|
|
·
|
Net earnings attributable to controlling interests for 2007 include a gain of $440 million ($286 million after tax, equal to $0.44 per share) related to the exchange of the Company’s interests in certain Asian joint ventures for shares of Wilmar, realized securities gains of $357 million ($225 million after tax, equal to $0.34 per share) related to the Company’s sale of equity securities of Tyson Foods Inc. and Overseas Shipholding Group Inc. and a $209 million gain ($132 million after tax, equal to $0.20 per share) related to the sale of businesses.
|
|
Item 7.
|
MANAGEMENT’S DISCUSSION AND ANALYSIS OF FINANCIAL CONDITION AND RESULTS OF OPERATIONS
|
Company Overview
The Company is principally engaged in procuring, transporting, storing, processing, and merchandising agricultural commodities and products. The Company’s operations are classified into three reportable business segments: Oilseeds Processing, Corn Processing and Agricultural Services. Each of these segments is organized based upon the nature of products and services offered. The Company’s remaining operations, which include wheat processing, cocoa processing, and its financial business units, are not reportable segments, as defined by the applicable accounting standard, and are classified as Other.
The Oilseeds Processing segment includes activities related to the origination, merchandising, crushing, and further processing of oilseeds such as soybeans, cottonseed, sunflower seeds, canola, rapeseed, peanuts, flaxseed, and palm into vegetable oils and protein meals. The Oilseeds Processing segment principally produces and markets processed oilseed products as ingredients for the food, feed, energy, and other industrial products industries. Crude vegetable oil is sold "as is" or is further processed by refining, blending, bleaching, and deodorizing into salad oils. Salad oils are sold “as is” or are further processed by hydrogenating and/or interesterifying into margarine, shortening, and other food products. Partially refined oil is used to produce biodiesel or is sold to other manufacturers for use in chemicals, paints, and other industrial products. Oilseed protein meals are principally sold to third parties to be used as ingredients in commercial livestock and poultry feeds. The Oilseeds Processing segment also produces natural health and nutrition products and other specialty food and feed ingredients. In North America, cottonseed flour is produced and sold primarily to the pharmaceutical industry and cotton cellulose pulp is manufactured and sold to the chemical, paper, and filter markets. In South America, the Oilseeds Processing segment utilizes a network of grain elevators, port facilities and transportation assets to buy, store, clean, and transport agricultural commodities and operates fertilizer blending facilities. This segment also includes the Company’s share of the results of its equity method investment in Wilmar and its Golden Peanut Company LLC, Edible Oils Limited, and Stratas Foods LLC joint ventures.
The Company’s Corn Processing segment is engaged in corn wet milling and dry milling activities, primarily in the United States, related to its production of ingredients used in the food and beverage industry including syrup, starch, glucose, dextrose, and sweeteners. Dextrose is also used by the Company as a feedstock for its bioproducts operations. Corn gluten feed and meal, as well as distillers grains, is produced for use as animal feed ingredients. Corn germ, a by-product of the wet milling process, is further processed as an oilseed into vegetable oil and protein meal.
By fermentation of dextrose, the Corn Processing segment produces alcohol, amino acids, and other specialty food and animal feed ingredients. Ethyl alcohol is produced by the Company to beverage grade or for industrial use as ethanol. In gasoline, ethanol increases octane and is used as an extender and oxygenate. Amino acids, such as lysine and threonine, are vital compounds used in swine feeds to produce leaner animals and in poultry feeds to enhance the speed and efficiency of poultry production. The Corn Processing segment also produces, by fermentation, astaxanthin, a product used in aquaculture to enhance flesh coloration. The Corn Processing segment produces citric and lactic acids, lactates, sorbitol, xanthan gum and glycols which are used in various food and industrial products. The Corn Processing segment includes the activities of the Company’s Brazilian sugarcane operations, propylene and ethylene glycol facility, and investments in renewable plastics. This segment also includes the Company’s share of the results of its equity method investments in Almidones Mexicanos S.A., Eaststarch C.V., and Red Star Yeast Company LLC.
The Agricultural Services segment utilizes the Company’s extensive grain elevator and transportation network to buy, store, clean, and transport agricultural commodities, such as oilseeds, corn, wheat, milo, oats, rice, and barley, and resells these commodities primarily as food and feed ingredients and as raw materials for the agricultural processing industry. Agricultural Services’ grain sourcing and transportation network provides reliable and
efficient services to the Company’s agricultural processing operations and customers. Agricultural Services’ transportation network capabilities include ground, rail, river, and ocean freight services. The Agricultural Services segment also includes activities related to procuring, processing, and distributing edible beans, and the processing and distributing of formula feeds and animal health and nutrition products. In addition, the Agricultural Services segment includes the activities of Alfred C. Toepfer International, a global merchant of agricultural commodities and processed products, and the Company’s share of the results of its Kalama Export Company joint venture.
|
Item 7.
|
MANAGEMENT’S DISCUSSION AND ANALYSIS OF FINANCIAL CONDITION AND RESULTS OF OPERATIONS (Continued)
|
Other includes the Company’s remaining processing operations, consisting of activities related to processing agricultural commodities into food ingredient products such as wheat into wheat flour and cocoa into chocolate and cocoa products. Other also includes financial activities related to banking, captive insurance, private equity fund investments, futures commission merchant activities, and the Company’s share of the results of its equity method investment in Gruma S.A.B. de C.V.
Certain Corporate items are not allocated to the Company’s reportable business segments. Corporate results include the impact of LIFO-related adjustments, the after-tax elimination of income attributable to mandatorily redeemable interests in consolidated subsidiaries, unallocated corporate expenses, and unallocated net interest costs.
Operating Performance Indicators
The Company’s Oilseeds Processing, Agricultural Services, and wheat processing operations are principally agricultural commodity-based businesses where changes in selling prices move in relationship to changes in prices of the commodity-based agricultural raw materials. Thus, changes in agricultural commodity prices have relatively equal impacts on both sales revenue and cost of products sold. Therefore, changes in gross profit of these businesses do not necessarily correspond to the changes in net sales and other operating income amounts.
The Company’s Corn Processing operations and certain other food and animal feed processing operations also utilize agricultural commodities (or products derived from agricultural commodities) as raw materials. In these operations, agricultural commodity market price changes can result in significant fluctuations in cost of products sold, and such price changes cannot necessarily be passed directly through to the selling price of the finished products.
The Company conducts its business in over 60 countries. For the majority of the Company’s subsidiaries located outside the United States the local currency is the functional currency. Revenues and expenses denominated in foreign currencies are translated into U.S. dollars at the weighted average exchange rates for the applicable periods. For the majority of the Company’s business activities in Brazil, the functional currency is the U.S. dollar, however certain transactions, including taxes, occur in local currency and require conversion to the functional currency. The impact of these currency exchange rate changes, where significant, is discussed in Item 7A. Fluctuations in the exchange rates of foreign currencies, primarily the Euro, British pound, Canadian dollar and Brazilian real, as compared to the U.S. dollar will result in corresponding fluctuations in the U.S. dollar value of revenues and expenses reported by the Company.
The Company measures the performance of its business segments using key operating statistics such as segment operating profit, return on fixed capital investment, return on invested capital, and return on equity. The Company’s operating results can vary significantly due to changes in factors such as fluctuations in energy prices, weather conditions, crop plantings, government programs and policies, changes in global demand resulting from population growth, general global economic conditions, changes in standards of living, and global production of similar and competitive crops. Due to these unpredictable factors, the Company does not provide forward-looking information in “Management’s Discussion and Analysis of Financial Condition and Results of Operations.”
|
Item 7.
|
MANAGEMENT’S DISCUSSION AND ANALYSIS OF FINANCIAL CONDITION AND RESULTS OF OPERATIONS (Continued)
|
2010 Compared to 2009
As an agricultural commodity-based business, the Company is subject to a variety of market factors which affect the Company’s operating results. Market expectations throughout most of fiscal 2010 for fewer global crop supply and demand imbalances, coupled with continuing uncertainty about short-term demand, led to generally lower and less volatile agricultural commodity market prices and conditions. In addition, the late, extended U.S. harvest reduced profit opportunities. North American oilseed exports and domestic crushing volumes were enhanced by the poor supply of 2009 crop year soybeans in South America. Increased government mandates for the use of biodiesel in South America and Europe resulted in increased biodiesel demand and helped keep overall demand for refined and crude vegetable oil steady in these regions. However, in North America, demand for vegetable oils remained weak due to low consumption of oils in the food service and biodiesel industries, in part due to the expiration of the biodiesel blending credit in the U.S. on January 1, 2010. Soybean protein meal demand improved, particularly in Asia. Market prices for corn decreased resulting in lower raw material costs for Corn Processing and decreased average selling prices for sweeteners and starches. Lower energy, fuel and chemical costs per unit positively impacted the Company’s manufacturing costs. More favorable ethanol blending economics together with increased ethanol merchandising activity resulted in increased demand, higher ethanol sales volumes, and improved margins.
Earnings before income taxes for 2010 include a credit of $42 million from the effect of changing commodity prices on LIFO inventory valuations, compared to a credit of $517 million in 2009.
Income taxes decreased $146 million due to a lower effective income tax rate, partially offset by higher pretax earnings. Income taxes for 2009 included a $158 million charge resulting from the restructuring of a holding company in which the Company holds a portion of its equity investment in Wilmar.
Analysis of Statements of Earnings
Net sales and other operating income by segment are as follows:
| 2010 | 2009 | Change | ||||||||||
| (In millions) | ||||||||||||
|
Oilseeds Processing
|
||||||||||||
|
Crushing & Origination
|
$ | 15,732 | $ | 15,579 | $ | 153 | ||||||
|
Refining, Packaging, Biodiesel & Other
|
7,136 | 8,760 | (1,624 | ) | ||||||||
|
Asia
|
190 | 179 | 11 | |||||||||
|
Total Oilseeds Processing
|
23,058 | 24,518 | (1,460 | ) | ||||||||
|
Corn Processing
|
||||||||||||
|
Sweeteners & Starches
|
3,333 | 3,785 | (452 | ) | ||||||||
|
Bioproducts
|
4,609 | 3,938 | 671 | |||||||||
|
Total Corn Processing
|
7,942 | 7,723 | 219 | |||||||||
|
Agricultural Services
|
||||||||||||
|
Merchandising & Handling
|
25,273 | 31,342 | (6,069 | ) | ||||||||
|
Transportation
|
167 | 242 | (75 | ) | ||||||||
|
Total Agricultural Services
|
25,440 | 31,584 | (6,144 | ) | ||||||||
|
Other
|
||||||||||||
|
Wheat, Cocoa & Malt
|
5,147 | 5,272 | (125 | ) | ||||||||
|
Financial
|
95 | 110 | (15 | ) | ||||||||
|
Total Other
|
5,242 | 5,382 | (140 | ) | ||||||||
|
Total
|
$ | 61,682 | $ | 69,207 | $ | (7,525 | ) | |||||
|
Item 7.
|
MANAGEMENT’S DISCUSSION AND ANALYSIS OF FINANCIAL CONDITION AND RESULTS OF OPERATIONS (Continued)
|
Net sales and other operating income decreased 11% to $61.7 billion due principally to lower average selling prices in line with year-over-year declines in underlying commodity costs. Oilseeds Processing sales decreased 6% to $23.1 billion, due principally to lower average selling prices for soybeans, protein meal, refined oil, and biodiesel partially offset by increased sales volumes of soybeans and fertilizer. Corn Processing sales increased 3% to $7.9 billion primarily as a result of increased sales volumes of ethanol and lysine partially offset by lower average selling prices of ethanol, sweeteners, and starches. Agricultural Services sales decreased 19% to $25.4 billion, due to lower average selling prices, in line with year-over-year declines in underlying commodity prices, and lower sales volumes. Other sales decreased 3% to $5.2 billion, primarily due to lower average selling prices of wheat flour partially offset by increased wheat flour sales volumes and higher average selling prices and sales volumes for cocoa products.
Cost of products sold decreased 11% to $57.8 billion, due principally to decreased agricultural commodity costs including the impact of changes in LIFO inventory valuations which reduced cost of products sold by $42 million in 2010 compared to $517 million in 2009. Manufacturing expenses decreased 1% or $60 million, primarily due to lower energy, chemical and fuel costs partially offset by higher employee-related costs and a $124 million increase in depreciation and amortization expense. In 2010, manufacturing expenses included additional costs associated with the Company’s new greenfield plants.
Selling, general and administrative expenses decreased 1% to $1.4 billion, due principally to decreased provisions for doubtful accounts partially offset by increased expenses for legal, professional, and commercial services.
Other (income) expense - net improved $317 million primarily due to increased equity earnings of unconsolidated affiliates of $416 million, and decreased expense for the elimination of after-tax mandatorily redeemable interests in consolidated subsidiaries. These increases were partially offset by pre-tax charges of $75 million related to the early extinguishment of debt and $59 million for unrealized losses on interest rate swaps (for more information see Note 8 in Item 8, Financial Statements and Supplementary Data). Equity earnings of unconsolidated affiliates in 2009 included a non-cash charge of $275 million related to currency derivative losses of the Company’s equity investee, Gruma S.A.B. de C.V.
Income taxes decreased $146 million due to a lower effective income tax rate partially offset by higher pretax earnings. The Company’s effective income tax rate during 2010 was 25.8%. In 2009, the effective income tax rate was 32.5% which included $158 million of income tax charges related to the partial restructuring of the holding company structure through which the Company holds a portion of its equity investment in Wilmar. Excluding these Wilmar charges, the Company’s effective income tax rate for 2009 was 26.2%. For more information concerning Wilmar tax matters see Note 12 in Item 8.
|
Item 7.
|
MANAGEMENT’S DISCUSSION AND ANALYSIS OF FINANCIAL CONDITION AND RESULTS OF OPERATIONS (Continued)
|
Operating profit by segment is as follows:
| 2010 | 2009 | Change | ||||||||||
| (In millions) | ||||||||||||
|
Oilseeds Processing
|
||||||||||||
|
Crushing & Origination
|
$ | 818 | $ | 767 | $ | 51 | ||||||
|
Refining, Packaging, Biodiesel & Other
|
291 | 265 | 26 | |||||||||
|
Asia
|
291 | 248 | 43 | |||||||||
|
Total Oilseeds Processing
|
1,400 | 1,280 | 120 | |||||||||
|
Corn Processing
|
||||||||||||
|
Sweeteners & Starches
|
529 | 500 | 29 | |||||||||
|
Bioproducts
|
193 | (315 | ) | 508 | ||||||||
|
Total Corn Processing
|
722 | 185 | 537 | |||||||||
|
Agricultural Services
|
||||||||||||
|
Merchandising & Handling
|
583 | 832 | (249 | ) | ||||||||
|
Transportation
|
85 | 162 | (77 | ) | ||||||||
|
Total Agricultural Services
|
668 | 994 | (326 | ) | ||||||||
|
Other
|
||||||||||||
|
Wheat, Cocoa & Malt
|
403 | 51 | 352 | |||||||||
|
Financial
|
46 | (57 | ) | 103 | ||||||||
|
Total Other
|
449 | (6 | ) | 455 | ||||||||
|
Total Segment Operating Profit
|
3,239 | 2,453 | 786 | |||||||||
|
Corporate (see below)
|
(654 | ) | 47 | (701 | ) | |||||||
|
Earnings Before Income Taxes
|
$ | 2,585 | $ | 2,500 | $ | 85 | ||||||
Corporate results are as follows:
|
2010
|
2009
|
Change
|
||||||||||
|
(In millions)
|
||||||||||||
|
LIFO credit
|
$ | 42 | $ | 517 | $ | (475 | ) | |||||
|
Unallocated interest expense - net
|
(283 | ) | (192 | ) | (91 | ) | ||||||
|
Unallocated corporate costs
|
(266 | ) | (252 | ) | (14 | ) | ||||||
|
Charges on early extinguishment of debt
|
(75 | ) | – | (75 | ) | |||||||
|
Unrealized losses on interest rate swaps
|
(59 | ) | – | (59 | ) | |||||||
|
Other
|
(13 | ) | (26 | ) | 13 | |||||||
|
Total Corporate
|
$ | (654 | ) | $ | 47 | $ | (701 | ) | ||||
Oilseeds Processing operating profit increased 9% to $1.4 billion. Crushing and origination results increased $51 million due to higher North American soybean crushing margins and favorable soft seed commodity positioning partially offset by lower soybean crushing margins in Europe and South America. Refining, packaging, biodiesel and other operating profit increased $26 million due primarily to higher South American biodiesel results and improved margins in Europe. Oilseeds processing results in Asia increased $43 million to $291 million due principally to improved equity earnings of Wilmar.
|
Item 7.
|
MANAGEMENT’S DISCUSSION AND ANALYSIS OF FINANCIAL CONDITION AND RESULTS OF OPERATIONS (Continued)
|
Corn Processing operating profit increased $537 million to $722 million. Bioproducts operating profit increased $508 million due to improved ethanol and lysine sales volumes and improved ethanol margins resulting from lower net corn costs and decreased manufacturing costs. Ethanol sales volumes increased due to favorable gasoline blending economics and increased merchandising activity. Sweeteners and starches operating profit increased $29 million due to lower net corn and manufacturing costs due principally to lower energy and chemical prices. These lower manufacturing costs were partially offset by lower average selling prices.
Agricultural Services operating profit decreased $326 million to $668 million. Merchandising and handling results decreased $249 million. Enhanced volume and margin opportunities created by last year’s volatile commodity markets and tight credit markets did not recur. Volumes and margins in 2010 benefited from strong demand for U.S. soybean exports following the short South American 2009 crop. Transportation results decreased $77 million due to lower barge freight rates and decreased barge utilization levels resulting from weaker U.S. economic conditions and the late, extended North American harvest.
Other operating profit increased $455 million to $449 million. Wheat, cocoa and malt operating profit increased $352 million due to improved equity earnings from the Company’s investment in Gruma, improved wheat milling margins, and improved cocoa processing results. Financial operating profit increased $103 million due primarily to the absence of losses experienced last year from managed fund investments and captive insurance operations.
Corporate results decreased $701 million. The effects of changing commodity prices on LIFO inventory valuations resulted in a credit of $42 million for the year ended June 30, 2010, compared to a credit of $517 million for the year ended June 30, 2009. Unallocated interest expense – net increased $91 million reflecting a reduction in corporate interest income caused by lower short-term interest rates and lower working capital requirements of the operating segments. In January 2010, the Company repurchased $500 million of long-term debt which generated a $75 million pretax charge on early extinguishment of debt. In connection with a debt remarketing planned for 2011, the Company entered into interest rate swaps to fix the interest rate on a portion of the planned remarketing which resulted in $59 million of unrealized losses on interest rate swaps.
2009 Compared to 2008
As an agricultural commodity-based business, the Company is subject to a variety of market factors which affect the Company’s operating results. Net corn costs increased significantly in 2009 compared to 2008, negatively impacting ethanol margins, and, to a lesser extent, sweeteners and starches margins as the higher net corn costs were only partially offset by increased selling prices for sweeteners and starches. Additionally, lower demand for gasoline, decreased gasoline prices and excess ethanol industry capacity negatively impacted ethanol margins. Demand for agricultural commodities, freight, and other products was weaker during 2009 in line with the downturn in the global economy. Results were negatively impacted by decreased equity earnings in unconsolidated affiliates including significant non-cash charges related to currency derivative losses incurred by the Company’s equity investee, Gruma S.A.B. de C.V., and losses from the Company’s managed fund investments.
Earnings before income taxes for 2009 include a credit of $517 million from the effect of changing commodity prices on LIFO inventory valuation reserves, compared to a charge of $569 million in 2008.
|
Item 7.
|
MANAGEMENT’S DISCUSSION AND ANALYSIS OF FINANCIAL CONDITION AND RESULTS OF OPERATIONS (Continued)
|
Income taxes for 2009 include charges of $158 million resulting from the restructuring of a holding company in which the Company holds a portion of its equity investment in Wilmar.
Analysis of Statements of Earnings
Net sales and other operating income decreased 1% to $69.2 billion due to foreign exchange translation impacts and decreased sales volumes partially offset by higher average selling prices. Net sales and other operating income increased $3.0 billion due to higher average selling prices primarily related to higher underlying commodity costs, decreased $2.0 billion due to foreign exchange translation impacts, and decreased $1.6 billion due to lower sales volumes and other.
Net sales and other operating income by segment are as follows:
| 2009 | 2008 | Change | ||||||||||
| (In millions) | ||||||||||||
|
Oilseeds Processing
|
||||||||||||
|
Crushing & Origination
|
$ | 15,579 | $ | 14,477 | $ | 1,102 | ||||||
|
Refining, Packaging, Biodiesel & Other
|
8,760 | 8,588 | 172 | |||||||||
|
Asia
|
179 | 214 | (35 | ) | ||||||||
|
Total Oilseeds Processing
|
24,518 | 23,279 | 1,239 | |||||||||
|
Corn Processing
|
||||||||||||
|
Sweeteners & Starches
|
3,785 | 3,546 | 239 | |||||||||
|
Bioproducts
|
3,938 | 3,591 | 347 | |||||||||
|
Total Corn Processing
|
7,723 | 7,137 | 586 | |||||||||
|
Agricultural Services
|
||||||||||||
|
Merchandising & Handling
|
31,342 | 33,749 | (2,407 | ) | ||||||||
|
Transportation
|
242 | 219 | 23 | |||||||||
|
Total Agricultural Services
|
31,584 | 33,968 | (2,384 | ) | ||||||||
|
Other
|
||||||||||||
|
Wheat, Cocoa & Malt
|
5,272 | 5,335 | (63 | ) | ||||||||
|
Financial
|
110 | 97 | 13 | |||||||||
|
Total Other
|
5,382 | 5,432 | (50 | ) | ||||||||
|
Total
|
$ | 69,207 | $ | 69,816 | $ | (609 | ) | |||||
Oilseeds Processing sales increased 5% to $24.5 billion due principally to increased sales volumes of merchandised oilseeds and biodiesel partially offset by lower sales volumes of vegetable oil and protein meal. Corn Processing sales increased 8% to $7.7 billion due principally to higher sales volumes of ethanol and higher average selling prices of sweeteners and starches, partially offset by lower average selling prices of ethanol. Agricultural Services sales decreased 7% to $31.6 billion due principally to lower sales volumes of grain. Other sales decreased 1% to $5.4 billion primarily due to the sale of the Company’s malting business during the first quarter of fiscal year 2009 and lower average selling prices of wheat flour. Partially offsetting these decreases were higher average selling prices of cocoa products and increased chocolate sales volumes.
Cost of products sold decreased 1% to $65.1 billion, in line with the decrease in net sales and other operating income. Cost of products sold decreased $856 million due principally to decreased sales volumes, decreased LIFO inventory valuations and approximately $1.9 billion from the impact of foreign currency translation, partially offset by increased agricultural commodity costs. Manufacturing expenses decreased $215 million primarily due to decreased energy and fuel costs.
|
Item 7.
|
MANAGEMENT’S DISCUSSION AND ANALYSIS OF FINANCIAL CONDITION AND RESULTS OF OPERATIONS (Continued)
|
Selling, general and administrative expenses of $1.4 billion were comparable to 2008. Decreased employee-related costs and favorable impacts from foreign currency translation were offset by increases in provisions for doubtful accounts.
Other (income) expense – net decreased $348 million primarily due to decreased results from equity earnings of unconsolidated affiliates of $270 million, and decreased investment income. Equity earnings in unconsolidated affiliates included a non-cash charge of $275 million of foreign exchange derivative losses incurred by the Company’s equity investee, Gruma S.A.B. de C.V.
Operating profit by segment is as follows:
| 2009 | 2008 | Change | ||||||||||
| (In millions) | ||||||||||||
|
Oilseeds Processing
|
||||||||||||
|
Crushing & Origination
|
$ | 767 | $ | 727 | $ | 40 | ||||||
|
Refining, Packaging, Biodiesel & Other
|
265 | 181 | 84 | |||||||||
|
Asia
|
248 | 132 | 116 | |||||||||
|
Total Oilseeds Processing
|
1,280 | 1,040 | 240 | |||||||||
|
Corn Processing
|
||||||||||||
|
Sweeteners & Starches
|
500 | 557 | (57 | ) | ||||||||
|
Bioproducts
|
(315 | ) | 404 | (719 | ) | |||||||
|
Total Corn Processing
|
185 | 961 | (776 | ) | ||||||||
|
Agricultural Services
|
||||||||||||
|
Merchandising & Handling
|
832 | 873 | (41 | ) | ||||||||
|
Transportation
|
162 | 144 | 18 | |||||||||
|
Total Agricultural Services
|
994 | 1,017 | (23 | ) | ||||||||
|
Other
|
||||||||||||
|
Wheat, Cocoa & Malt
|
51 | 217 | (166 | ) | ||||||||
|
Financial
|
(57 | ) | 206 | (263 | ) | |||||||
|
Total Other
|
(6 | ) | 423 | (429 | ) | |||||||
|
Total Segment Operating Profit
|
2,453 | 3,441 | (988 | ) | ||||||||
|
Corporate (see below)
|
47 | (847 | ) | 894 | ||||||||
|
Earnings Before Income Taxes
|
$ | 2,500 | $ | 2,594 | $ | (94 | ) | |||||
Corporate results are as follows:
|
2009
|
2008
|
Change
|
||||||||||
|
(In millions)
|
||||||||||||
|
LIFO credit (charge)
|
$ | 517 | $ | (569 | ) | $ | 1,086 | |||||
|
Interest expense (income) - net
|
(192 | ) | 49 | (241 | ) | |||||||
|
Corporate costs
|
(252 | ) | (262 | ) | 10 | |||||||
|
Other
|
(26 | ) | (65 | ) | 39 | |||||||
|
Total Corporate
|
$ | 47 | $ | (847 | ) | $ | 894 | |||||
|
Item 7.
|
MANAGEMENT’S DISCUSSION AND ANALYSIS OF FINANCIAL CONDITION AND RESULTS OF OPERATIONS (Continued)
|
Oilseeds Processing operating profit increased 23% to $1.3 billion. Crushing and origination results increased $40 million. Improved global crushing margins were partially offset by lower fertilizer sales volumes and margins and lower North American crushing volumes due to decreased demand for vegetable oil and protein meal. Refining, packaging, biodiesel and other results increased $84 million due principally to higher biodiesel sales volumes in South America and increased average margins for value-added products. 2008 results for refining, packaging, biodiesel and other included asset abandonment charges of $27 million. Asia results increased $116 million due principally to the Company’s share in improved operating results of Wilmar.
Corn Processing operating profits decreased 81% to $185 million. Sweeteners and starches decreased $57 million due to the impact of higher net corn costs partially offset by higher average sweetener and starches selling prices. Bioproducts operating profit decreased $719 million for the year as ethanol and lysine margins declined significantly due to higher corn costs and lower average selling prices. Ethanol margins were also impacted by lower demand for gasoline, decreased gasoline prices, and excess ethanol industry capacity.
Agricultural Services operating profits decreased 2% to $994 million. Merchandising and handling profit decreased $41 million. Merchandising margins moderated as demand for commodities slowed following the downturn in the global economy. Transportation results increased $18 million due to higher barge freight rates.
Other operating profits decreased 101% to a loss of $6 million. Wheat, cocoa, and malt processing operating profit decreased $166 million for the year primarily due to equity losses from the Company’s investment in Gruma, partially offset by improved cocoa and wheat processing margins. Financial operating profit decreased $263 million due to losses on managed fund investments compared to gains for the year ended June 30, 2008, increased captive insurance loss provisions and decreased interest income and lower marketable security gains of the Company’s brokerage service business.
Corporate results increased $894 million to $47 million, primarily due to the effects of changing commodity prices on LIFO inventory valuations which resulted in credits of $517 million for the year ended June 30, 2009, compared to $569 million of LIFO charges for the year ended June 30, 2008. Unallocated interest expense increased $241 million primarily due to higher long-term debt interest expense and decreased interest income. Corporate interest income decreased due to lower short-term interest rates and lower working capital requirements of the operating segments.
The Company’s effective tax rate during 2009 was 32.5% compared to 31.1% during 2008. Income taxes increased $4 million. Lower pre-tax earnings and positive impacts from favorable changes in geographic mix of earnings, currency translation impacts in South America, lower tax rates in certain foreign jurisdictions, and return to provision adjustments, were offset by charges of $158 million resulting from the restructuring of a holding company in which the Company holds a portion of its equity investment in Wilmar.
|
Item 7.
|
MANAGEMENT’S DISCUSSION AND ANALYSIS OF FINANCIAL CONDITION AND RESULTS OF OPERATIONS (Continued)
|
Liquidity and Capital Resources
A Company objective is to have sufficient liquidity, balance sheet strength, and financial flexibility to fund the operating and capital requirements of a capital intensive agricultural commodity-based business. The primary source of funds to finance the Company’s operations and capital expenditures is cash generated by operations. In addition, the Company maintains a commercial paper borrowing facility and has access to equity and debt capital from public and private sources in both domestic and international markets.
At June 30, 2010, the Company had $1.4 billion of cash, cash equivalents, and short-term marketable securities and a current ratio, defined as current assets divided by current liabilities, of 2.1 to 1. Included in working capital is $4.9 billion of readily marketable commodity inventories. Cash generated by operating activities decreased to $2.7 billion for the year compared to $5.3 billion last year due primarily to a $3.1 billion decrease in 2009 working capital requirements related to lower agricultural commodity market prices. Cash used in investing activities was $1.7 billion compared to $1.9 billion last year. Cash used in financing activities was $1.0 billion for the year compared to $3.2 billion last year due principally to a decrease in repayments of commercial paper borrowings partially offset by the repurchase of $500 million of long-term debt.
At June 30, 2010, the Company’s capital resources included net worth of $14.6 billion and lines of credit totaling $6.0 billion, of which $5.7 billion was unused. The Company’s ratio of long-term debt to total capital (the sum of the Company’s long-term debt and shareholders’ equity) was 32% at June 30, 2010 and 36% at June 30, 2009. This ratio is a measure of the Company’s long-term liquidity and is an indicator of financial flexibility. Of the Company’s total lines of credit, $4.2 billion support a commercial paper borrowing facility, against which there were no borrowings at June 30, 2010.
The Company has outstanding $1.15 billion principal amount of convertible senior notes. As of June 30, 2010, none of the conditions permitting conversion of these notes had been satisfied. The Company has purchased call options and warrants intended to reduce the potential shareholder dilution upon future conversion of the notes. As of June 30, 2010, the market price of the Company’s common stock was not greater than the exercise price of the purchased call options or warrants related to the convertible senior notes.
In June 2008, the Company issued $1.75 billion of debentures as a component of Equity Units (see Note 8 in Item 8). The debentures will be remarketed in 2011. The Equity Units are a combination of debt and forward contracts for the holder to purchase the Company’s common stock. Each purchase contract obligates the holder to purchase from the Company, no later than June 1, 2011, for a price of $50 in cash, a certain number of shares, ranging from 1.0453 shares to 1.2544 shares, of the Company’s common stock, based on a formula established in the contract.
The Company’s credit facilities and certain debentures require the Company to comply with specified financial and non-financial covenants including maintenance of minimum tangible net worth as well as limitations related to incurring liens, secured debt, and certain other financing arrangements. The Company is in compliance with these covenants as of June 30, 2010.
|
Item 7.
|
MANAGEMENT’S DISCUSSION AND ANALYSIS OF FINANCIAL CONDITION AND RESULTS OF OPERATIONS (Continued)
|
Contractual Obligations and Off-Balance Sheet Arrangements
In the normal course of business, the Company enters into contracts and commitments which obligate the Company to make payments in the future. The following table sets forth the Company’s significant future obligations by time period. Purchases include commodity-based contracts entered into in the normal course of business, which are further described in Item 7A, “Quantitative and Qualitative Disclosures About Market Risk,” energy-related purchase contracts entered into in the normal course of business, and other purchase obligations related to the Company’s normal business activities. The following table does not include unrecognized income tax benefits of $84 million as at June 30, 2010, due to uncertainty of the timing of deductibility. Where applicable, information included in the Company’s consolidated financial statements and notes is cross-referenced in this table.
|
Payments Due by Period
|
|||||||||||||||||||||
|
Contractual
|
Item 8
Note
|
Less
than
|
1 - 3 | 3 – 5 |
More than
|
||||||||||||||||
|
Obligations
|
Reference
|
Total
|
1 Year
|
Years
|
Years
|
5 Years
|
|||||||||||||||
|
(In millions)
|
|||||||||||||||||||||
|
Purchases
|
|||||||||||||||||||||
|
Inventories
|
$ | 9,949 | $ | 9,508 | $ | 417 | $ | 6 | $ | 18 | |||||||||||
|
Energy
|
498 | 284 | 137 | 31 | 46 | ||||||||||||||||
|
Other
|
409 | 143 | 208 | 56 | 2 | ||||||||||||||||
|
Total purchases
|
10,856 | 9,935 | 762 | 93 | 66 | ||||||||||||||||
|
Short-term debt
|
374 | 374 | – | – | – | ||||||||||||||||
|
Long-term debt
|
Note 8
|
7,174 | 344 | 428 | 1,076 | 5,326 | |||||||||||||||
|
Estimated interest payments
|
7,928 | 381 | 700 | 636 | 6,211 | ||||||||||||||||
|
Operating leases
|
Note 13
|
1,381 | 235 | 371 | 333 | 442 | |||||||||||||||
|
Estimated pension and other
postretirement plan
contributions
(1)
|
Note 14
|
150 | 45 | 17 | 21 | 67 | |||||||||||||||
|
Total
|
$ | 27,863 | $ | 11,314 | $ | 2,278 | $ | 2,159 | $ | 12,112 | |||||||||||
(1)
The Company is unable to estimate the amount of pension contributions beyond fiscal year 2011. For more information concerning the Company’s pension and other postretirement plans, see Note 14 in Item 8.
At June 30, 2010, the Company estimates it will spend approximately $1.5 billion through calendar year 2013 to complete currently approved capital projects which are not included in the table above. The Company also has outstanding letters of credit and surety bonds of $459 million at June 30, 2010.
In addition, the Company has entered into agreements, primarily debt guarantee agreements related to equity-method investees, which could obligate the Company to make future payments. The Company’s liability under these agreements arises only if the primary entity fails to perform its contractual obligation. The Company has collateral for a portion of these contingent obligations. At June 30, 2010, these contingent obligations totaled approximately $131 million. Amounts outstanding for the primary entity under these contingent obligations were $74 million at June 30, 2010.
|
Item 7.
|
MANAGEMENT’S DISCUSSION AND ANALYSIS OF FINANCIAL CONDITION AND RESULTS OF OPERATIONS (Continued)
|
Critical Accounting Policies
The process of preparing financial statements requires management to make estimates and judgments that affect the carrying values of the Company’s assets and liabilities as well as the recognition of revenues and expenses. These estimates and judgments are based on the Company’s historical experience and management’s knowledge and understanding of current facts and circumstances. Certain of the Company’s accounting policies are considered critical, as these policies are important to the depiction of the Company’s financial statements and require significant or complex judgment by management. Management has discussed with the Company’s Audit Committee the development, selection, disclosure, and application of these critical accounting policies. Following are the accounting policies management considers critical to the Company’s financial statements.
Inventories and Derivatives
Certain of the Company’s merchandisable agricultural commodity inventories, forward fixed-price purchase and sale contracts, and exchange-traded futures and exchange-traded and over-the-counter options contracts are valued at estimated market values. These merchandisable agricultural commodities are freely traded, have quoted market prices, and may be sold without significant additional processing. Management estimates market value based on exchange-quoted prices, adjusted for differences in local markets. Changes in the market values of these inventories and contracts are recognized in the statement of earnings as a component of cost of products sold. If management used different methods or factors to estimate market value, amounts reported as inventories and cost of products sold could differ materially. Additionally, if market conditions change subsequent to year-end, amounts reported in future periods as inventories and cost of products sold could differ materially.
The Company, from time to time, uses derivative contracts designated as cash flow hedges to fix the purchase price of anticipated volumes of commodities to be purchased and processed in a future month, to fix the purchase price of the Company’s anticipated natural gas requirements for certain production facilities, and to fix the sales price of anticipated volumes of ethanol. The change in the market value of such derivative contracts has historically been, and is expected to continue to be, highly effective at offsetting changes in price movements of the hedged item. Gains and losses arising from open and closed hedging transactions are deferred in other comprehensive income, net of applicable income taxes, and recognized as a component of cost of products sold and net sales and other operating income in the statement of earnings when the hedged item is recognized. If it is determined that the derivative instruments used are no longer effective at offsetting changes in the price of the hedged item, then the changes in the market value of these exchange-traded futures and exchange-traded and over-the-counter option contracts would be recorded in the statement of earnings as a component of cost of products sold.
Employee Benefit Plans
The Company provides substantially all domestic employees and employees at certain international subsidiaries with pension benefits.
Eligible domestic employees with five or more years of service prior to January 1, 2009 participate in a defined benefit pension plan. Eligible domestic employees hired on or after January 1, 2009 (and eligible salaried employees with less than five years of service prior to January 1, 2009) participate in a “cash balance” pension formula.
The Company provides eligible domestic employees who retire under qualifying conditions with access to postretirement health care, at full cost to the retiree (certain employees are “grandfathered” into subsidized coverage).
In order to measure the expense and funded status of these employee benefit plans, management makes several estimates and assumptions, including interest rates used to discount certain liabilities, rates of return on assets set aside to fund these plans, rates of compensation increases, employee turnover rates, anticipated mortality rates, and anticipated future health care costs. These estimates and assumptions are based on the Company’s historical experience combined with management’s knowledge and understanding of current facts and circumstances. Management also uses third-party actuaries to assist in measuring the expense and funded status of these employee benefit plans. If management used different estimates and assumptions regarding these plans, the funded status of the plans could vary significantly, and the Company could recognize different amounts of expense over future periods.
|
Item 7.
|
MANAGEMENT’S DISCUSSION AND ANALYSIS OF FINANCIAL CONDITION AND RESULTS OF OPERATIONS (Continued)
|
Income Taxes
The Company frequently faces challenges from domestic and foreign tax authorities regarding the amount of taxes due. These challenges include questions regarding the timing and amount of deductions and the allocation of income among various tax jurisdictions. In evaluating the exposure associated with various tax filing positions, the Company records reserves for estimates of potential additional tax owed by the Company. As an example, a subsidiary of the Company received a tax assessment in the amount of $456 million (subject to variation in currency exchange rates) consisting of tax, penalty, and interest from the Brazilian Federal Revenue Service challenging the deductibility of commodity hedging losses incurred by the Company in 2004. The Company evaluated its tax position regarding these hedging transactions and concluded, based in part upon advice from Brazilian legal counsel, that it was appropriate to recognize the tax benefits of these deductions (See Note 12 in Item 8 for additional information). Deferred tax assets represent items to be used as tax deductions or credits in future tax returns, and the related tax benefit has already been recognized in the Company’s income statement. The realization of the Company’s deferred tax assets is dependent upon future taxable income in specific tax jurisdictions, the timing and amount of which are uncertain. The Company evaluates all available positive and negative evidence including estimated future reversals of existing temporary differences, projected future taxable income, tax planning strategies, and recent financial results. Valuation allowances related to these deferred tax assets have been established to the extent the realization of the tax benefit is not likely. To the extent the Company were to favorably resolve matters for which accruals have been established or be required to pay amounts in excess of the aforementioned reserves, the Company’s effective tax rate in a given financial statement period may be impacted.
Undistributed earnings of the Company’s foreign subsidiaries and affiliated corporate joint ventures accounted for on the equity method are considered to be permanently reinvested, and accordingly, no provision for U.S. income taxes has been provided thereon. If the Company were to receive distributions from any of these foreign subsidiaries or affiliates or determine the undistributed earnings of these foreign subsidiaries or affiliates to not be permanently reinvested, the Company could be subject to U.S. tax liabilities which have not been provided for in the consolidated financial statements.
Asset Abandonments and Write-Downs
The Company is principally engaged in the business of procuring, transporting, storing, processing, and merchandising agricultural commodities and products. This business is global in nature and is highly capital-intensive. Both the availability of the Company’s raw materials and the demand for the Company’s finished products are driven by factors such as weather, plantings, government programs and policies, changes in global demand resulting from population growth and changes in standards of living, and global production of similar and competitive crops. These aforementioned factors may cause a shift in the supply/demand dynamics for the Company’s raw materials and finished products. Any such shift will cause management to evaluate the efficiency and cash flows of the Company’s assets in terms of geographic location, size, and age of its factories. The Company, from time to time, will also invest in equipment, technology, and companies related to new, value-added products produced from agricultural commodities and products. These new products are not always successful from either a commercial production or marketing perspective. Management evaluates the Company’s property, plant, and equipment for impairment whenever indicators of impairment exist. The Company evaluates goodwill and other intangible assets with indefinite lives for impairment annually. Assets are written down after consideration of the ability to utilize the assets for their intended purpose or to employ the assets in alternative uses or sell the assets to recover the carrying value. If management used different estimates and assumptions in its evaluation of these assets, then the Company could recognize different amounts of expense over future periods.
|
Item 7.
|
MANAGEMENT’S DISCUSSION AND ANALYSIS OF FINANCIAL CONDITION AND RESULTS OF OPERATIONS (Continued)
|
Valuation of Marketable Securities and Investments in Affiliates
The Company classifies the majority of its marketable securities as available-for-sale and carries these securities at fair value. The Company applies the equity method for investments in investees over which the Company has the ability to exercise significant influence. These investments in affiliates are carried at cost plus equity in undistributed earnings and are adjusted, where appropriate, for amortizable basis differences between the investment balance and the underlying net assets of the investee. For publicly traded securities, the fair value of the Company’s investments is readily available based on quoted market prices. For non-publicly traded securities, management’s assessment of fair value is based on valuation methodologies including discounted cash flows and estimates of sales proceeds. In the event of a decline in fair value of an investment below carrying value, management is required to determine if the decline in fair value is other than temporary. In evaluating the nature of a decline in the fair value of an investment, management considers the market conditions, trends of earnings, discounted cash flows, trading volumes, and other key measures of the investment as well as the Company’s ability and intent to hold the investment. When such a decline in value is deemed to be other than temporary, an impairment loss is recognized in the current period operating results to the extent of the decline. See Notes 5 and 6 in Item 8 for information regarding the Company’s marketable securities and investments in affiliates. If management used different estimates and assumptions in its evaluation of these marketable securities, then the Company could recognize different amounts of expense over future periods.
|
Item 7A.
|
QUANTITATIVE AND QUALITATIVE DISCLOSURES ABOUT MARKET RISK
|
The market risk inherent in the Company’s market risk sensitive instruments and positions is the potential loss arising from adverse changes in: commodity market prices as they relate to the Company’s net commodity position, foreign currency exchange rates, and interest rates as described below.
Commodities
The availability and prices of agricultural commodities are subject to wide fluctuations due to factors such as changes in weather conditions, disease, plantings, government programs and policies, competition, changes in global demand resulting from population growth and changes in standards of living, and global production of similar and competitive crops.
To reduce price risk caused by market fluctuations, the Company generally follows a policy of using exchange-traded futures and exchange-traded and over-the-counter options contracts to minimize its net position of merchandisable agricultural commodity inventories and forward cash purchase and sales contracts. The Company will also use exchange-traded futures and exchange-traded and over-the-counter options contracts as components of merchandising strategies designed to enhance margins. The results of these strategies can be significantly impacted by factors such as the volatility of the relationship between the value of exchange-traded commodities futures contracts and the cash prices of the underlying commodities, counterparty contracts defaults, and volatility of freight markets. In addition, the Company, from time-to-time, enters into derivative contracts which are designated as hedges of specific volumes of commodities that will be purchased and processed, or sold, in a future month. The changes in the market value of such futures contracts have historically been, and are expected to continue to be, highly effective at offsetting changes in price movements of the hedged item. Gains and losses arising from open and closed hedging transactions are deferred in other comprehensive income, net of applicable taxes, and recognized as a component of cost of products sold or net sales and other operating income in the statement of earnings when the hedged item is recognized.
|
Item 7A.
|
QUANTITATIVE AND QUALITATIVE DISCLOSURES ABOUT MARKET RISK (Continued)
|
A sensitivity analysis has been prepared to estimate the Company’s exposure to market risk of its daily net commodity position. The Company’s daily net commodity position consists of merchandisable agricultural commodity inventories, related purchase and sale contracts, and exchange-traded futures and exchange-traded and over-the-counter option contracts, including those contracts used to hedge portions of production requirements. The fair value of such daily net commodity position is a summation of the fair values calculated for each commodity by valuing each net position at quoted futures prices. Market risk is estimated as the potential loss in fair value resulting from a hypothetical 10% adverse change in such prices. Actual results may differ.
|
2010
|
2009
|
|||||||||||||||
|
Long/(Short)
|
Fair Value
|
Market Risk
|
Fair Value
|
Market Risk
|
||||||||||||
|
(In millions)
|
||||||||||||||||
|
Highest position
|
$ | 429 | $ | 43 | $ | 845 | $ | 85 | ||||||||
|
Lowest position
|
(667 | ) | (67 | ) | (1,342 | ) | (134 | ) | ||||||||
|
Average position
|
(190 | ) | (19 | ) | (392 | ) | (39 | ) | ||||||||
The change in fair value of the average position for 2010 compared to 2009 was principally the result of changes in average quantities underlying the daily net commodity position.
Currencies
The Company conducts its business in over 60 countries. For the majority of the Company’s subsidiaries located outside the United States, the local currency is the functional currency. In order to reduce the risks associated with foreign currency exchange rate fluctuations, except for amounts permanently invested as described below, the Company follows a policy of entering into currency exchange contracts to mitigate its foreign currency risk related to transactions denominated in a currency other than the functional currencies applicable to each of its various entities, primarily the Euro, British pound, Canadian dollar, and Brazilian real. The instruments used are forward contracts, swaps with banks, exchange-traded futures contracts, and over-the-counter options. The changes in market value of such contracts have a high correlation to the price changes in the currency of the related transactions. The potential loss in fair value for such net currency position resulting from a hypothetical 10% adverse change in foreign currency exchange rates is not material.
The amount the Company considers permanently invested in foreign subsidiaries and affiliates and translated into dollars using the year-end exchange rates is $6.4 billion at June 30, 2010, and $6.6 billion at June 30, 2009. This decrease is due to the depreciation of foreign currencies versus the U.S. dollar partially offset by an increase in retained earnings of the foreign subsidiaries and affiliates. The potential loss in fair value, which would principally be recognized in Other Comprehensive Income, resulting from a hypothetical 10% adverse change in quoted foreign currency exchange rates is $639 million and $664 million for 2010 and 2009, respectively. Actual results may differ.
Interest
The fair value of the Company’s long-term debt is estimated using quoted market prices, where available, and discounted future cash flows based on the Company’s current incremental borrowing rates for similar types of borrowing arrangements. Such fair value exceeded the long-term debt carrying value. Market risk is estimated as the potential increase in fair value resulting from a hypothetical .5% decrease in interest rates. Actual results may differ.
|
2010
|
2009
|
|||||||
|
(In millions)
|
||||||||
|
Fair value of long-term debt
|
$ | 7,700 | $ | 8,103 | ||||
|
Excess of fair value over carrying value
|
870 | 511 | ||||||
|
Market risk
|
289 | 310 | ||||||
The decrease in fair value of long-term debt in 2010 resulted principally from the repurchase of $500 million in aggregate principal amount of the Company’s outstanding debentures.
|
Item 8.
|
FINANCIAL STATEMENTS AND SUPPLEMENTARY DATA
|
|
Financial Statements
|
Page No.
|
|
Consolidated Statements of Earnings
|
38
|
|
Consolidated Balance Sheets
|
39
|
|
Consolidated Statements of Cash Flows
|
40
|
|
Consolidated Statements of Shareholders’ Equity
|
41
|
|
Notes to Consolidated Financial Statements
|
42
|
|
Reports of Independent Registered Public Accounting Firm
|
84
|
Archer Daniels Midland Company
|
Year Ended June 30
|
||||||||||||
|
2010
|
2009
|
2008
|
||||||||||
|
(In millions, except per share amounts)
|
||||||||||||
|
Net sales and other operating income
|
$ | 61,682 | $ | 69,207 | $ | 69,816 | ||||||
|
Cost of products sold
|
57,839 | 65,118 | 65,974 | |||||||||
|
Gross Profit
|
3,843 | 4,089 | 3,842 | |||||||||
|
Selling, general and administrative expenses
|
1,398 | 1,412 | 1,419 | |||||||||
|
Other (income) expense - net
|
(140 | ) | 177 | (171 | ) | |||||||
|
Earnings Before Income Taxes
|
2,585 | 2,500 | 2,594 | |||||||||
|
Income taxes
|
666 | 812 | 808 | |||||||||
|
Net Earnings Including Noncontrolling Interests
|
1,919 | 1,688 | 1,786 | |||||||||
|
Less: Net earnings (losses) attributable to noncontrolling interests
|
(11 | ) | 4 | 6 | ||||||||
|
Net Earnings Attributable to Controlling Interests
|
$ | 1,930 | $ | 1,684 | $ | 1,780 | ||||||
|
Average number of shares outstanding – basic
|
643 | 643 | 644 | |||||||||
|
Average number of shares outstanding – diluted
|
644 | 644 | 646 | |||||||||
|
Basic earnings per common share
|
$ | 3.00 | $ | 2.62 | $ | 2.76 | ||||||
|
Diluted earnings per common share
|
$ | 3.00 | $ | 2.62 | $ | 2.75 | ||||||
See notes to consolidated financial statements.
Archer Daniels Midland Company
|
June 30
|
||||||||
|
2010
|
2009
|
|||||||
|
(In millions)
|
||||||||
|
Assets
|
||||||||
|
Current Assets
|
||||||||
|
Cash and cash equivalents
|
$ | 1,046 | $ | 1,055 | ||||
|
Short-term marketable securities
|
394 | 500 | ||||||
|
Segregated cash and investments
|
2,337 | 2,430 | ||||||
|
Receivables
|
6,122 | 7,311 | ||||||
|
Inventories
|
7,611 | 7,782 | ||||||
|
Other assets
|
624 | 330 | ||||||
|
Total Current Assets
|
18,134 | 19,408 | ||||||
|
Investments and Other Assets
|
||||||||
|
Investments in and advances to affiliates
|
2,799 | 2,459 | ||||||
|
Long-term marketable securities
|
678 | 626 | ||||||
|
Goodwill
|
523 | 532 | ||||||
|
Other assets
|
702 | 607 | ||||||
|
Total Investments and Other Assets
|
4,702 | 4,224 | ||||||
|
Property, Plant, and Equipment
|
||||||||
|
Land
|
277 | 240 | ||||||
|
Buildings
|
4,008 | 3,304 | ||||||
|
Machinery and equipment
|
15,107 | 13,052 | ||||||
|
Construction in progress
|
612 | 2,245 | ||||||
| 20,004 | 18,841 | |||||||
|
Accumulated depreciation
|
(11,292 | ) | (10,891 | ) | ||||
|
Net Property, Plant, and Equipment
|
8,712 | 7,950 | ||||||
|
Total Assets
|
$ | 31,548 | $ | 31,582 | ||||
|
Liabilities and Shareholders’ Equity
|
||||||||
|
Current Liabilities
|
||||||||
|
Short-term debt
|
$ | 374 | $ | 356 | ||||
|
Accounts payable
|
5,538 | 5,786 | ||||||
|
Accrued expenses
|
2,317 | 2,695 | ||||||
|
Current maturities of long-term debt
|
344 | 48 | ||||||
|
Total Current Liabilities
|
8,573 | 8,885 | ||||||
|
Long-Term Liabilities
|
||||||||
|
Long-term debt
|
6,830 | 7,592 | ||||||
|
Deferred income taxes
|
439 | 308 | ||||||
|
Other
|
1,075 | 1,144 | ||||||
|
Total Long-Term Liabilities
|
8,344 | 9,044 | ||||||
|
Shareholders’ Equity
|
||||||||
|
Common stock
|
5,151 | 5,204 | ||||||
|
Reinvested earnings
|
10,357 | 8,778 | ||||||
|
Accumulated other comprehensive income (loss)
|
(899 | ) | (355 | ) | ||||
|
Noncontrolling interests
|
22 | 26 | ||||||
|
Total Shareholders’ Equity
|
14,631 | 13,653 | ||||||
|
Total Liabilities and Shareholders’ Equity
|
$ | 31,548 | $ | 31,582 | ||||
See notes to consolidated financial statements.
Archer Daniels Midland Company
|
Year Ended June 30
|
||||||||||||
|
2010
|
2009
|
2008
|
||||||||||
|
(In millions)
|
||||||||||||
|
Operating Activities
|
||||||||||||
|
Net earnings including noncontrolling interests
|
$ | 1,919 | $ | 1,688 | $ | 1,786 | ||||||
|
Adjustments to reconcile net earnings to net cash provided by
(used in) operating activities
|
||||||||||||
|
Depreciation and amortization
|
912 | 780 | 767 | |||||||||
|
Asset abandonments and impairments
|
9 | 13 | 32 | |||||||||
|
Deferred income taxes
|
30 | 20 | (142 | ) | ||||||||
|
(Gain) loss on sales of marketable securities
|
6 | 4 | (38 | ) | ||||||||
|
(Gain) loss on sale or exchange of unconsolidated affiliates
|
(15 | ) | 11 | (8 | ) | |||||||
|
Gain on sale of businesses
|
– | (24 | ) | (8 | ) | |||||||
|
Equity in (earnings) losses of affiliates, net of dividends
|
(326 | ) | 54 | (283 | ) | |||||||
|
Stock compensation expense
|
45 | 65 | 70 | |||||||||
|
Stock contributed to employee benefit plans
|
– | 18 | 29 | |||||||||
|
Pension and postretirement accruals (contributions), net
|
(110 | ) | (161 | ) | 36 | |||||||
|
Charges on early extinguishment of debt
|
75 | – | – | |||||||||
|
Deferred cash flow hedges
|
49 | (235 | ) | 161 | ||||||||
|
Other – net
|
84 | 26 | 164 | |||||||||
|
Changes in operating assets and liabilities
|
||||||||||||
|
Segregated cash and investments
|
74 | (426 | ) | (614 | ) | |||||||
|
Receivables
|
740 | 3,680 | (4,781 | ) | ||||||||
|
Inventories
|
(144 | ) | 1,899 | (3,736 | ) | |||||||
|
Other assets
|
(211 | ) | 152 | (174 | ) | |||||||
|
Accounts payable and accrued expenses
|
(453 | ) | (2,223 | ) | 3,535 | |||||||
|
Total Operating Activities
|
2,684 | 5,341 | (3,204 | ) | ||||||||
|
Investing Activities
|
||||||||||||
|
Purchases of property, plant, and equipment
|
(1,607 | ) | (1,898 | ) | (1,779 | ) | ||||||
|
Proceeds from sales of property, plant, and equipment
|
35 | 65 | 52 | |||||||||
|
Proceeds from sale of businesses
|
– | 258 | 11 | |||||||||
|
Net assets of businesses acquired
|
(62 | ) | (198 | ) | (13 | ) | ||||||
|
Investments in and advances to affiliates
|
(146 | ) | (15 | ) | (32 | ) | ||||||
|
Distributions from affiliates, excluding dividends
|
57 | 11 | 54 | |||||||||
|
Purchases of marketable securities
|
(1,387 | ) | (2,402 | ) | (1,405 | ) | ||||||
|
Proceeds from sales of marketable securities
|
1,454 | 2,312 | 1,222 | |||||||||
|
Other – net
|
(9 | ) | (4 | ) | (5 | ) | ||||||
|
Total Investing Activities
|
(1,665 | ) | (1,871 | ) | (1,895 | ) | ||||||
|
Financing Activities
|
||||||||||||
|
Long-term debt borrowings
|
27 | 125 | 3,095 | |||||||||
|
Long-term debt payments
|
(552 | ) | (24 | ) | (69 | ) | ||||||
|
Debt repurchase premium and costs
|
(71 | ) | – | – | ||||||||
|
Net borrowings (payments) under line of credit agreements
|
29 | (2,890 | ) | 2,574 | ||||||||
|
Purchases of treasury stock
|
(100 | ) | (100 | ) | (61 | ) | ||||||
|
Cash dividends
|
(372 | ) | (347 | ) | (316 | ) | ||||||
|
Other – net
|
11 | 11 | 23 | |||||||||
|
Total Financing Activities
|
(1,028 | ) | (3,225 | ) | 5,246 | |||||||
|
Increase (decrease) in cash and cash equivalents
|
(9 | ) | 245 | 147 | ||||||||
|
Cash and cash equivalents – beginning of year
|
1,055 | 810 | 663 | |||||||||
|
Cash and cash equivalents
–
end of year
|
$ | 1,046 | $ | 1,055 | $ | 810 | ||||||
See notes to consolidated financial statements.
Archer Daniels Midland Company
Consolidated Statements of Shareholders’ Equity
| Accumulated | ||||||||||||||||||||||||
| Other | Total | |||||||||||||||||||||||
| Common Stock | Reinvested | Comprehensive | Noncontrolling | Shareholders' | ||||||||||||||||||||
| Shares | Amount | Earnings | Income (Loss) | Interests | Equity | |||||||||||||||||||
| (In Millions) | ||||||||||||||||||||||||
|
Balance June 30, 2007
|
643 | $ | 5,272 | $ | 5,974 | $ | 181 | $ | 19 | $ | 11,446 | |||||||||||||
|
Comprehensive income
|
||||||||||||||||||||||||
|
Net earnings
|
1,780 | 6 | ||||||||||||||||||||||
|
Other comprehensive income
|
776 | |||||||||||||||||||||||
|
Total comprehensive
income
|
2,562 | |||||||||||||||||||||||
|
Cash dividends paid-$.49 per
share
|
(316 | ) | (316 | ) | ||||||||||||||||||||
|
Treasury stock purchases
|
(2 | ) | (61 | ) | (61 | ) | ||||||||||||||||||
|
Forward contract component of
equity units
|
(110 | ) | (110 | ) | ||||||||||||||||||||
|
Stock compensation expense
|
70 | 70 | ||||||||||||||||||||||
|
Other
|
3 | 50 | 25 | 75 | ||||||||||||||||||||
|
Balance June 30, 2008
|
644 | 5,221 | 7,463 | 957 | 25 | 13,666 | ||||||||||||||||||
|
Comprehensive income
|
||||||||||||||||||||||||
|
Net earnings
|
1,684 | 4 | ||||||||||||||||||||||
|
Other comprehensive income
(loss)
|
(1,312 | ) | ||||||||||||||||||||||
|
Total comprehensive
income
|
376 | |||||||||||||||||||||||
|
Cash dividends paid-$.54 per
share
|
(347 | ) | (347 | ) | ||||||||||||||||||||
|
Treasury stock purchases
|
(4 | ) | (100 | ) | (100 | ) | ||||||||||||||||||
|
Pension plan measurement date
adjustment, net of tax
|
(21 | ) | (21 | ) | ||||||||||||||||||||
|
Stock compensation expense
|
65 | 65 | ||||||||||||||||||||||
|
Other
|
2 | 18 | (1 | ) | (3 | ) | 14 | |||||||||||||||||
|
Balance June 30, 2009
|
642 | 5,204 | 8,778 | (355 | ) | 26 | 13,653 | |||||||||||||||||
|
Comprehensive income
|
||||||||||||||||||||||||
|
Net earnings
|
1,930 | (11 | ) | |||||||||||||||||||||
|
Other comprehensive
income
(loss)
|
(544 | ) | ||||||||||||||||||||||
|
Total comprehensive
income
|
1,375 | |||||||||||||||||||||||
|
Cash dividends paid-$.58 per
share
|
(372 | ) | (372 | ) | ||||||||||||||||||||
|
Treasury stock purchases
|
(4 | ) | (100 | ) | (100 | ) | ||||||||||||||||||
|
Stock compensation expense
|
45 | 45 | ||||||||||||||||||||||
|
Other
|
1 | 2 | 21 | 7 | 30 | |||||||||||||||||||
|
Balance June 30, 2010
|
639 | $ | 5,151 | $ | 10,357 | $ | (899 | ) | $ | 22 | $ | 14,631 | ||||||||||||
See notes to consolidated financial statements.
Archer Daniels Midland Company
Notes to Consolidated Financial Statements
|
Note 1.
|
Summary of Significant Accounting Policies
|
Nature of Business
The Company is principally engaged in procuring, transporting, storing, processing, and merchandising agricultural commodities and products.
Principles of Consolidation
The consolidated financial statements as of June 30, 2010, and for the three years then ended include the accounts of the Company and its majority-owned subsidiaries. All significant intercompany accounts and transactions have been eliminated. Investments in affiliates are carried at cost plus equity in undistributed earnings since acquisition and are adjusted, where appropriate, for amortizable basis differences between the investment balance and the underlying net assets of the investee. The Company’s portion of the results of certain affiliates and results of certain majority-owned subsidiaries are included using the most recent available financial statements. In each case the financial statements are within 93 days of the Company’s year end and are consistent from period to period.
The Company evaluates and consolidates, where appropriate, its less than majority-owned investments pursuant to Financial Accounting Standards Board (FASB) Accounting Standards Codification (ASC) Topic 810,
Consolidation
.
Use of Estimates
The preparation of consolidated financial statements in conformity with generally accepted accounting principles requires management to make estimates and assumptions that affect amounts reported in its consolidated financial statements and accompanying notes. Actual results could differ from those estimates.
Reclassifications
Certain items in prior years’ consolidated statements of cash flows have been reclassified to conform to the current year’s presentation with no impact to total cash provided by (used in) operating, investing, or financing activities. In addition, certain items in prior years’ consolidated statements of shareholders’ equity have been reclassified to conform to the current year’s presentation.
Cash Equivalents
The Company considers all non-segregated, highly-liquid investments with a maturity of three months or less at the time of purchase to be cash equivalents.
Segregated Cash and Investments
The Company segregates certain cash and investment balances in accordance with certain regulatory requirements, commodity exchange requirements, and insurance arrangements. These segregated balances represent deposits received from customers trading in exchange-traded commodity instruments, securities pledged to commodity exchange clearinghouses, and cash and securities pledged as security under certain insurance arrangements. Segregated cash and investments primarily consist of cash, United States government securities, and money-market funds.
Archer Daniels Midland Company
Notes to Consolidated Financial Statements (Continued)
|
Note 1.
|
Summary of Significant Accounting Policies (Continued)
|
Receivables
The Company records trade accounts receivable at net realizable value. This value includes an allowance for estimated uncollectible accounts, $97 million and $103 million at June 30, 2010 and 2009, respectively, to reflect any loss anticipated on the trade accounts receivable balances. The Company calculates this allowance based on its history of write-offs, level of past-due accounts, and its relationships with, and the economic status of, its customers.
Credit risk on trade receivables is minimized as a result of the large and diversified nature of the Company’s worldwide customer base. The Company controls its exposure to counter party credit risk through credit analysis and approvals, credit limits, and monitoring procedures. Collateral is generally not required for the Company’s trade receivables. Trade accounts receivable due from unconsolidated affiliates as of June 30, 2010 and 2009 was $304 million and $301 million, respectively.
Inventories
Inventories of certain merchandisable agricultural commodities, which include inventories acquired under deferred pricing contracts, are stated at market value. In addition, the Company values certain inventories using the lower of cost, determined by either the first-in, first-out (FIFO) or last-in, first-out (LIFO) methods, or market.
Marketable Securities
The Company classifies its marketable securities as available-for-sale, except for certain designated securities which are classified as trading securities. Available-for-sale securities are carried at fair value, with the unrealized gains and losses, net of income taxes, reported as a component of other comprehensive income. The Company monitors its investments for impairment periodically, and recognizes an impairment charge when the decline in fair value of an investment is judged to be other-than-temporary. Unrealized gains and losses related to trading securities are included in income on a current basis. The Company uses the specific identification method when securities are sold or reclassified out of accumulated other comprehensive income into earnings. The Company considers marketable securities maturing in less than one year as short-term. All other marketable securities are classified as long-term.
Property, Plant, and Equipment
Property, plant, and equipment is recorded at cost. Repair and maintenance costs are expensed as incurred. The Company generally uses the straight-line method in computing depreciation for financial reporting purposes and generally uses accelerated methods for income tax purposes. The annual provisions for depreciation have been computed principally in accordance with the following ranges of asset lives: buildings - 10 to 40 years; machinery and equipment - 3 to 30 years.
Asset Abandonments and Write-Downs
The Company recorded a $9 million, a $13 million, and a $32 million charge in cost of products sold during 2010, 2009, and 2008, respectively, principally related to the abandonment and write-down to fair value of certain long-lived assets. The majority of these assets were idle or related to underperforming product lines and the decision to abandon or write-down was finalized after consideration of the ability to utilize the assets for their intended purpose, employ the assets in alternative uses, or sell the assets to recover the carrying value. After the write-downs, the carrying value of these assets is immaterial.
Archer Daniels Midland Company
Notes to Consolidated Financial Statements (Continued)
|
Note 1.
|
Summary of Significant Accounting Policies (Continued)
|
Net Sales
The Company follows a policy of recognizing sales revenue at the time of delivery of the product and when all of the following have occurred: a sales agreement is in place, pricing is fixed or determinable, and collection is reasonably assured. Freight costs and handling charges related to sales are recorded as a component of cost of products sold. Net sales to unconsolidated affiliates during 2010, 2009, and 2008 were $8.4 billion, $7.3 billion, and $8.5 billion, respectively.
Stock Compensation
The Company recognizes expense for its share-based compensation based on the fair value of the awards that are granted. The Company’s share-based compensation plans provide for the granting of restricted stock, restricted stock units, performance stock units, and stock options. The fair values of stock options and performance stock units are estimated at the date of grant using the Black-Scholes option valuation model and a lattice valuation model, respectively. These valuation models require the input of highly subjective assumptions. Measured compensation cost, net of estimated forfeitures, is recognized ratably over the vesting period of the related share-based compensation award.
Research and Development
Costs associated with research and development are expensed as incurred. Such costs incurred were $56 million, $50 million, and $49 million for the years ended June 30, 2010, 2009, and 2008, respectively.
Per Share Data
Basic earnings per common share are determined by dividing net earnings attributable to controlling interests by the weighted average number of common shares outstanding. In computing diluted earnings per share, the weighted average number of common shares outstanding is increased by common stock options outstanding with exercise prices lower than the average market price of common shares using the treasury share method. During 2010, 2009, and 2008, diluted average shares outstanding included incremental shares related to outstanding common stock options of 1 million, 1 million, and 2 million, respectively.
As further described in Note 8, certain potentially dilutive securities were excluded from the diluted average shares calculation because their impact was anti-dilutive.
New Accounting Standards
On July 1, 2009, the Company adopted FASB amended guidance in ASC Topic 805,
Business Combinations,
which changes the financial accounting and reporting of business combination transactions. The guidance was applied prospectively to business combinations completed on or after the adoption date. This amended guidance requires recognizing, with certain exceptions, 100 percent of the fair values of assets acquired, liabilities assumed, and noncontrolling interests in acquisitions of less than a 100 percent controlling interest when the acquisition constitutes a change in control of the acquired entity; measuring acquirer shares issued and contingent consideration arrangements in connection with a business combination at fair value on the acquisition date with subsequent changes in fair value reflected in earnings; and expensing as incurred acquisition-related transaction costs. The amended guidance also includes requirements relating to the accounting for assets
acquired and liabilities assumed in a business combination that arise from contingencies
and
establishes a model to account for certain pre-acquisition contingencies. Under the amended guidance, an acquirer is required to recognize at fair value an asset acquired or a liability assumed in a business combination that arises from a contingency if the acquisition-date fair value of that asset or liability can be determined during the measurement period. If the acquisition-date fair value cannot be determined, the acquirer should follow the recognition criteria in ASC Topic 450,
Contingencies
. There was no material effect on the Company’s consolidated financial statements as a result of the adoption of this amended guidance.
Archer Daniels Midland Company
Notes to Consolidated Financial Statements (Continued)
|
Note 1.
|
Summary of Significant Accounting Policies (Continued)
|
On July 1, 2009, the Company adopted the amended guidance in ASC Topic 470-20,
Debt with Conversion and Other Options
, which specifies that issuers of convertible debt instruments that may settle in cash upon conversion must bifurcate the proceeds from the debt issuance between the debt and equity components in a manner that reflects the entity’s nonconvertible debt borrowing rate when interest cost is recognized in subsequent periods. The equity component reflects the fair value of the conversion feature of the notes at adoption. The amended guidance was retrospectively applied to the Company’s $1.15 billion, 0.875% Convertible Series Notes for all periods presented as further described in Note 8.
On July 1, 2009, the Company adopted amended guidance in ASC Topic 810,
Consolidation,
pertaining to the accounting and reporting of noncontrolling interests in financial statements. The amended guidance establishes accounting and reporting standards for the noncontrolling interest in a subsidiary and for the deconsolidation of a subsidiary. As required by the amended guidance, the Company retrospectively applied the guidance to all periods presented. The net earnings attributable to noncontrolling interests is now presented as a separate line item on the consolidated statements of earnings. In addition, the Company consolidates certain subsidiaries which are associated with mandatorily redeemable instruments outside of the Company’s control. In accordance with guidance contained in SEC Accounting Series Release 268,
Redeemable Preferred Stock
and ASC Topic 480,
Distinguishing Liabilities from Equity
, noncontrolling interests which are associated with mandatorily redeemable instruments outside of the Company’s control have been classified as other long term liabilities. The income or loss attributable to the mandatorily redeemable interests in consolidated subsidiaries adjusts the redeemable value of the redeemable instruments and is included in Other (income) expense - net.
On July 1, 2009, the Company adopted the amended guidance in ASC Topic 260,
Earnings per Share,
which addresses whether instruments granted in share-based payment transactions are participating securities prior to vesting and, therefore, need to be included in the earnings allocation in computing earnings per share (EPS) under the two-class method. It also clarifies that all outstanding unvested share-based payment awards that contain rights to nonforfeitable dividends participate in undistributed earnings with common shareholders and are considered to be participating securities, thus requiring the issuing entity to apply the two-class method of computing basic and diluted EPS. There was no material effect on the Company’s consolidated financial statements as a result of the adoption of this amended guidance.
On July 1, 2009, the Company adopted the guidance in ASC Topic 820,
Fair Value Measurements and Disclosures
, for its nonfinancial assets and liabilities that are recognized at fair value on a nonrecurring basis, including goodwill, other intangible assets, and asset retirement obligations. The Company recorded no significant new or remeasured fair values during the period for its nonfinancial assets and liabilities that are recognized on a nonrecurring basis.
On October 1, 2009, the Company adopted the amended guidance in ASC Topic 820,
Fair Value Measurements and Disclosures.
The amendment permits certain entities to use Net Asset Value (NAV) as a practical expedient to estimate the fair value of investments within its scope provided the NAV is calculated as of the Company’s reporting date. The amendment also indicates how investments within its scope would be classified in the fair value hierarchy and requires enhanced disclosures about the nature and risks of investments. The disclosure requirements apply to all investments within the scope of the amendment, regardless of whether the Company elects to measure the investment using NAV as a practical expedient. The adoption of this amendment requires expanded disclosure in the notes to the Company’s consolidated financial statements but does not materially impact financial results.
Archer Daniels Midland Company
Notes to Consolidated Financial Statements (Continued)
|
Note 1.
|
Summary of Significant Accounting Policies (Continued)
|
On October 1, 2009, the Company adopted the amendment to ASC Topic 820,
Fair Value Measurements and Disclosures,
which provides guidance for the fair value measurement of liabilities. It clarifies that in circumstances in which a quoted price in an active market for the identical liability is not available, fair value must be measured using specified valuation techniques. It further clarifies that both (a) a quoted price in an active market for the identical liability at the measurement date, and (b) the quoted price for the identical liability when traded as an asset in an active market (such as bonds), when no adjustments to the quoted price of the asset are required, are Level 1 fair value measurements. There is no material effect on the Company’s consolidated financial statements as a result of the adoption of this amended guidance.
Effective March 31, 2010, the Company adopted the first phase of the amended guidance in ASC Topic 820,
Fair Value Measurements and Disclosures
, which requires the Company to disclose the amounts and reasons for significant transfers between Levels 1 and 2 in the fair value hierarchy as well as reasons for any transfers in or out of Level 3. The amended guidance also requires the Company to provide fair value measurement disclosures for each class of assets and liabilities and disclose information about both the valuation techniques and inputs used in estimating Level 2 and Level 3 fair value measurements. The adoption of this amendment requires expanded disclosure in the notes to the Company’s consolidated financial statements but does not impact financial results.
Effective June 30, 2010, the Company adopted the amended guidance in ASC Topic 715,
Compensation – Retirement Benefits,
which expands disclosure requirements and requires entities to disclose investment policies and strategies, major categories of plan assets, fair value measurements for each major category of plan assets segregated by fair value hierarchy level as defined in ASC Topic 820, the effect of fair value measurements using Level 3 inputs on changes in plan assets for the period, and significant concentrations of risk within plan assets. The adoption of this amended guidance requires expanded disclosure in the notes to the Company’s consolidated financial statements but does not impact financial results.
Effective July 1, 2010, the Company will be required to adopt the amended guidance in ASC Topic 810,
Consolidations
, which will change how a reporting entity determines when an entity that is insufficiently capitalized or is not controlled through voting or similar rights (known as variable interest entities or VIEs) should be consolidated. The determination of whether a reporting entity is required to consolidate another entity is based on, among other things, the other entity’s purpose and design and the reporting entity’s ability to direct the activities of the other entity that most significantly impact the other entity’s economic performance. This amended guidance will require a number of new disclosures including disclosures about the reporting entity’s involvement with VIEs, how its involvement with VIEs affects the reporting entity’s financial statements, and any significant changes in risk exposure due to that involvement. The Company does not expect a material effect on its consolidated financial statements as a result of the adoption of this amended guidance.
Effective July 1, 2011, the Company will be required to adopt the second phase of the amended guidance in ASC Topic 820,
Fair Value Measurements and Disclosures,
which requires the Company to disclose information in the reconciliation of recurring Level 3 measurements about purchases, sales, issuances and settlements on a gross basis, separately for assets and liabilities. The adoption of this amended guidance will require expanded disclosure in the notes to the Company’s consolidated financial statements but will not impact financial results.
Archer Daniels Midland Company
Notes to Consolidated Financial Statements (Continued)
|
Note 1.
|
Summary of Significant Accounting Policies (Continued)
|
Effective October 1, 2010 and January 1, 2011, the Company will be required to adopt the amended guidance in ASC Topic 310,
Receivables
, which requires more robust and disaggregated disclosures about the credit quality of an entity’s financing receivables (excluding trade receivables), and its allowances for credit losses. The new disclosures will require additional information for nonaccrual and past due accounts, the allowance for credit losses, impaired loans, credit quality, and account modifications. A financing receivable is defined as a contractual right to receive money on demand or on fixed or determinable dates that is recognized as an asset in the entity’s statement of financial position. The Company has not yet assessed the impact of this amended guidance on its consolidated financial statements.
|
Note 2.
|
Acquisitions
|
The Company’s 2010 acquisitions were accounted for as purchases in accordance with ASC Topic 805,
Business Combinations
as amended
.
The Company’s 2009 and 2008 acquisitions were accounted for as purchases in accordance with Statement of Financial Accounting Standards No. 141. Tangible assets and liabilities have been adjusted to fair values with the remainder of the purchase price, if any, recorded as goodwill. The identifiable intangible assets acquired as part of these acquisitions are not material. Operating results of these acquisitions are included in the Company’s financial statements from the date of acquisition and are not significant to the Company’s operating results.
2010 Acquisitions
During 2010, the Company acquired two businesses for a total cost of $62 million in cash and recorded a preliminary allocation of the purchase price related to these acquisitions. The preliminary purchase price allocations resulted in goodwill of $3 million. The purchase price of $62 million was allocated to current assets, property, plant and equipment, and other long-term assets for $2 million, $57 million, and $3 million, respectively.
2009 Acquisitions
During 2009, the Company acquired ten businesses for a total cost of $198 million in cash and recorded a preliminary allocation of the purchase price related to these acquisitions. The preliminary purchase price allocations resulted in goodwill of $31 million. The purchase price of $198 million was allocated to current assets, property, plant and equipment, other long-term assets, and liabilities for $176 million, $82 million, $111 million, and $171 million, respectively. The final valuations resulted in a $13 million reduction in the cost of one acquisition and a corresponding decrease in the amount previously allocated to current assets. The finalization of purchase price allocations related to these acquisitions resulted in a $7 million increase in goodwill and a corresponding decrease in other long-term assets.
2008 Acquisitions
During 2008, the Company acquired six businesses for a total cost of $15 million, paid for with $2 million in Company stock and $13 million in cash. The final purchase price allocations resulted in goodwill of $5 million. The purchase price of $15 million was allocated to current assets, property, plant and equipment, other long-term assets, and liabilities for $14 million, $10 million, $5 million, and $14 million, respectively.
Archer Daniels Midland Company
Notes to Consolidated Financial Statements (Continued)
|
Note 3.
|
Fair Value Measurements
|
The Company determines the fair value of certain of its inventories of agricultural commodities, derivative contracts, and marketable securities based on the fair value definition and hierarchy levels established in the guidance of ASC Topic 820,
Fair Value Measurements and Disclosures
. Three levels are established within the hierarchy that may be used to measure fair value:
Level 1: Quoted prices (unadjusted) in active markets for identical assets or liabilities. Level 1 assets and liabilities include exchange-traded derivative contracts, U.S. treasury securities and certain publicly traded equity securities.
Level 2: Observable inputs, including Level 1 prices that have been adjusted; quoted prices for similar assets or liabilities; quoted prices in markets that are less active than traded exchanges; and other inputs that are observable or can be substantially corroborated by observable market data.
Level 3: Unobservable inputs that are supported by little or no market activity and that are a significant component of the fair value of the assets or liabilities. In evaluating the significance of fair value inputs, the Company generally classifies assets or liabilities as Level 3 when their fair value is determined using unobservable inputs that individually or when aggregated with other unobservable inputs, represent more than 10% of the fair value of the assets or liabilities. Judgment is required in evaluating both quantitative and qualitative factors in the determination of significance for purposes of fair value level classification. Level 3 amounts can include assets and liabilities whose value is determined using pricing models, discounted cash flow methodologies, or similar techniques, as well as assets and liabilities for which the determination of fair value requires significant management judgment or estimation.
In many cases, a valuation technique used to measure fair value includes inputs from multiple levels of the fair value hierarchy. The lowest level of input that is a significant component of the fair value measurement determines the placement of the entire fair value measurement in the hierarchy. The Company’s assessment of the significance of a particular input to the fair value measurement requires judgment, and may affect the classification of fair value assets and liabilities within the fair value hierarchy levels.
The Company’s policy regarding the timing of transfers between levels, including both transfers into and transfers out of Level 3, is to measure and record the transfers at the end of the reporting period. For the period ended June 30, 2010, the Company had no transfers between Levels 1 and 2.
Archer Daniels Midland Company
Notes to Consolidated Financial Statements (Continued)
|
Note 3.
|
Fair Value Measurements (Continued)
|
The following tables set forth, by level, the Company’s assets and liabilities that were accounted for at fair value on a recurring basis as of June 30, 2010 and 2009.
|
Fair Value Measurements at June 30, 2010
|
||||||||||||||||
|
Quoted Prices in
Active Markets
for Identical
Assets
(Level 1)
|
Significant
Other
Observable
Inputs
(Level 2)
|
Significant
Unobservable
Inputs
(Level 3)
|
Total
|
|||||||||||||
|
(In millions)
|
||||||||||||||||
|
Assets:
|
||||||||||||||||
|
Inventories carried at market
|
$ | – | $ | 3,774 | $ | 458 | $ | 4,232 | ||||||||
|
Unrealized derivative gains
|
||||||||||||||||
|
Commodity contracts
|
777 | 1,883 | 69 | 2,729 | ||||||||||||
|
Foreign exchange contracts
|
162 | 38 | – | 200 | ||||||||||||
|
Marketable securities
|
1,067 | 543 | – | 1,610 | ||||||||||||
|
Total Assets
|
$ | 2,006 | $ | 6,238 | $ | 527 | $ | 8,771 | ||||||||
|
Liabilities:
|
||||||||||||||||
|
Unrealized derivative losses
|
||||||||||||||||
|
Commodity contracts
|
$ | 937 | $ | 2,161 | $ | 56 | $ | 3,154 | ||||||||
|
Foreign exchange contracts
|
184 | 82 | – | 266 | ||||||||||||
|
Interest rate contracts
|
– | 26 | – | 26 | ||||||||||||
|
Inventory-related payables
|
– | 207 | 31 | 238 | ||||||||||||
|
Total Liabilities
|
$ | 1,121 | $ | 2,476 | $ | 87 | $ | 3,684 | ||||||||
Archer Daniels Midland Company
Notes to Consolidated Financial Statements (Continued)
|
Note 3.
|
Fair Value Measurements (Continued)
|
|
Fair Value Measurements at June 30, 2009
|
||||||||||||||||
|
Quoted Prices in
Active Markets
for Identical
Assets
(Level 1)
|
Significant
Other
Observable
Inputs
(Level 2)
|
Significant
Unobservable
Inputs
(Level 3)
|
Total
|
|||||||||||||
|
(In millions)
|
||||||||||||||||
|
Assets:
|
||||||||||||||||
|
Inventories carried at market
|
$ | – | $ | 4,081 | $ | 488 | $ | 4,569 | ||||||||
|
Unrealized derivative gains
|
||||||||||||||||
|
Commodity contracts
|
742 | 962 | 82 | 1,786 | ||||||||||||
|
Foreign exchange contracts
|
– | 46 | – | 46 | ||||||||||||
|
Interest rate contracts
|
– | 10 | – | 10 | ||||||||||||
|
Marketable securities
|
921 | 606 | – | 1,527 | ||||||||||||
|
Total Assets
|
$ | 1,663 | $ | 5,705 | $ | 570 | $ | 7,938 | ||||||||
|
Liabilities:
|
||||||||||||||||
|
Unrealized derivative losses
|
||||||||||||||||
|
Commodity contracts
|
$ | 972 | $ | 1,084 | $ | 84 | $ | 2,140 | ||||||||
|
Foreign exchange contracts
|
– | 40 | – | 40 | ||||||||||||
|
Inventory-related payables
|
– | 245 | 20 | 265 | ||||||||||||
|
Total Liabilities
|
$ | 972 | $ | 1,369 | $ | 104 | $ | 2,445 | ||||||||
Archer Daniels Midland Company
Notes to Consolidated Financial Statements (Continued)
|
Note 3.
|
Fair Value Measurements (Continued)
|
The Company uses the market approach valuation technique to measure the majority of its assets and liabilities carried at fair value. Estimated fair values for inventories carried at market are based on exchange-quoted prices, adjusted for differences in local markets, broker or dealer quotations, or market transactions in either listed or over-the-counter (OTC) markets. In such cases, the inventory is classified in Level 2. Certain inventories may require management judgment or estimation for a significant component of the fair value amount. In such cases, the inventory is classified in Level 3. Changes in the fair value of inventories are recognized in the consolidated statements of earnings as a component of cost of products sold.
The Company’s derivative contracts that are measured at fair value include forward commodity purchase and sale contracts, exchange-traded commodity futures and option contracts, and OTC instruments related primarily to agricultural commodities, ocean freight, energy, interest rates, and foreign currencies. Exchange-traded futures and options contracts are valued based on unadjusted quoted prices in active markets and are classified in Level 1. The majority of the Company’s exchange-traded futures and options contracts are cash settled on a daily basis and, therefore, are not included in this table. Fair value for forward commodity purchase and sale contracts is estimated based on exchange-quoted prices adjusted for differences in local markets. These differences are generally determined using inputs from broker or dealer quotations or market transactions in either the listed or OTC markets. When observable inputs are available for substantially the full term of a contract, it is classified in Level 2. When unobservable inputs have a significant impact on the measurement of fair value, the contract is classified in Level 3. Based on historical experience with the Company’s suppliers and customers, the Company’s own credit risk and knowledge of current market conditions, the Company does not view nonperformance risk to be a significant input to fair value for the majority of its forward commodity purchase and sale contracts. However, in certain cases, if the Company believes the nonperformance risk to be a significant input, the Company records estimated fair value adjustments, and classifies the contract in Level 3. Except for certain derivatives designated as cash flow hedges, changes in the fair value of commodity-related derivatives are recognized in the consolidated statements of earnings as a component of cost of products sold. Changes in the fair value of foreign currency-related derivatives are recognized in the consolidated statements of earnings as a component of net sales and other operating income, cost of products sold, and other (income) expense–net. The effective portions of changes in the fair value of derivatives designated as cash flow hedges are recognized in the consolidated balance sheets as a component of accumulated other comprehensive income until the hedged items are recorded in earnings or the hedged transaction is no longer probable to occur.
The Company’s marketable securities are comprised of U.S. Treasury securities, obligations of U.S. government agencies, corporate and municipal debt securities, and equity investments. U.S. Treasury securities and certain publicly traded equity investments are valued using quoted market prices and are classified in Level 1. U.S. government agency obligations, corporate and municipal debt securities and certain equity investments are valued using third-party pricing services and substantially all are classified in Level 2. Security values that are determined using pricing models are classified in Level 3. Unrealized changes in the fair value of available-for-sale marketable securities are recognized in the consolidated balance sheets as a component of accumulated other comprehensive income (loss) unless a decline in value is deemed to be other-than-temporary at which point the decline is recorded in earnings.
Archer Daniels Midland Company
Notes to Consolidated Financial Statements (Continued)
|
Note 3.
|
Fair Value Measurements (Continued)
|
The following tables present a reconciliation of all assets and liabilities measured at fair value on a recurring basis using significant unobservable inputs (Level 3) during the twelve months ended June 30, 2010 and 2009.
|
Level 3 Fair Value Measurements at June 30, 2010
|
||||||||||||
|
Inventories
Carried at
Market, Net
|
Commodity
Derivative
Contracts,
Net
|
Total
|
||||||||||
|
(In millions)
|
||||||||||||
|
Balance, June 30, 2009
|
$ | 468 | $ | (2 | ) | $ | 466 | |||||
|
Total gains (losses), realized or
unrealized, included in earnings
before income taxes*
|
7 | 30 | 37 | |||||||||
|
Purchases, issuances and settlements
|
(29 | ) | (26 | ) | (55 | ) | ||||||
|
Transfers in and/or out of Level 3
|
(19 | ) | 11 | (8 | ) | |||||||
|
Ending balance, June 30, 2010
|
$ | 427 | $ | 13 | $ | 440 | ||||||
* Includes gains of $6 million that are attributable to the change in unrealized gains or losses relating to Level 3 assets and liabilities still held at June 30, 2010.
|
Level 3 Fair Value Measurements at June 30, 2009
|
||||||||||||||||
|
Inventories
Carried at
Market, Net
|
Derivative
Contracts,
Net
|
Marketable
Securities
|
Total
|
|||||||||||||
|
(In millions)
|
||||||||||||||||
|
Balance, June 30, 2008
|
$ | 343 | $ | (6 | ) | $ | 10 | $ | 347 | |||||||
|
Total gains (losses), realized or
unrealized, included in earnings
before income taxes*
|
(278 | ) | (74 | ) | (1 | ) | (353 | ) | ||||||||
|
Purchases, issuances and settlements
|
225 | (74 | ) | 17 | 168 | |||||||||||
|
Transfers in and/or out of Level 3
|
178 | 152 | (26 | ) | 304 | |||||||||||
|
Ending balance, June 30, 2009
|
$ | 468 | $ | (2 | ) | $ | – | $ | 466 | |||||||
*Includes unrealized losses of $35 million attributable to the change in Level 3 derivative assets still held at June 30, 2009 and unrealized losses of $76 million attributable to the change in Level 3 inventories carried at market still held at June 30, 2009.
Transfers into Level 3 previously classified in Level 2 were due to the relative value of unobservable inputs to the total fair value measurement on certain derivative contracts rising above the 10% threshold.
Transfers out of Level 3 were primarily due to the relative value of unobservable inputs to the total fair value measurement on certain products falling below the 10% threshold and thus permitting reclassification to Level 2.
Archer Daniels Midland Company
Notes to Consolidated Financial Statements (Continued)
|
Note 4.
|
Inventories, Derivative Instruments & Hedging Activities
|
The Company values certain inventories using the lower of cost, determined by either the LIFO or FIFO method, or market. Inventories of certain merchandisable agricultural commodities, which include inventories acquired under deferred pricing contracts, are stated at market value.
|
2010
|
2009
|
|||||||
|
(In millions)
|
||||||||
|
LIFO inventories
|
||||||||
|
FIFO value
|
$ | 646 | $ | 745 | ||||
|
LIFO valuation reserve
|
(225 | ) | (267 | ) | ||||
|
LIFO inventories carrying value
|
421 | 478 | ||||||
|
FIFO inventories
|
2,958 | 2,735 | ||||||
|
Market inventories
|
4,232 | 4,569 | ||||||
| $ | 7,611 | $ | 7,782 | |||||
The Company recognizes all of its derivative instruments as either assets or liabilities at fair value in its consolidated balance sheet. The accounting for changes in the fair value (i.e., gains or losses) of a derivative instrument depends on whether it has been designated and qualifies as part of a hedging relationship and further, on the type of hedging relationship. The majority of the Company’s derivatives have not been designated as hedging instruments. For those derivative instruments that are designated and qualify as hedging instruments, a reporting entity must designate the hedging instrument, based upon the exposure being hedged, as a fair value hedge, a cash flow hedge, or a hedge of a net investment in a foreign operation. The Company has certain derivatives designated as cash flow hedges. Within Note 4 tables, zeros represent minimal amounts.
Derivatives Not Designated as Hedging Instruments
The Company generally follows a policy of using exchange-traded futures and exchange-traded and OTC options contracts to minimize its net position of merchandisable agricultural commodity inventories and forward cash purchase and sales contracts to reduce price risk caused by market fluctuations in agricultural commodities and foreign currencies. The Company also uses exchange-traded futures and exchange-traded and OTC options contracts as components of merchandising strategies designed to enhance margins. The results of these strategies can be significantly impacted by factors such as the volatility of the relationship between the value of exchange-traded commodities futures contracts and the cash prices of the underlying commodities, counterparty contract defaults, and volatility of freight markets. Exchange-traded futures and exchange-traded and OTC options contracts, and forward cash purchase and sales contracts of certain merchandisable agricultural commodities accounted for as derivatives by the Company are stated at fair value. Inventories of certain merchandisable agricultural commodities, which include amounts acquired under deferred pricing contracts, are stated at market value. Inventory is not a derivative and therefore is not included in the tables below. Changes in the market value of inventories of certain merchandisable agricultural commodities, forward cash purchase and sales contracts, and exchange-traded futures and exchange-traded and OTC options contracts are recognized in earnings immediately. Unrealized gains and unrealized losses on forward cash purchase contracts, forward foreign currency exchange (FX) contracts, forward cash sales contracts, and exchange-traded and OTC options contracts represent the fair value of such instruments and are classified on the Company’s consolidated balance sheet as receivables and accrued expenses, respectively.
At March 31, 2010, the
Company de-designated and discontinued hedge accounting treatment for certain interest rate swaps. At the date of de-designation of these hedges, $21 million of after-tax gains was deferred in accumulated other comprehensive income (AOCI). These gains will remain in AOCI until the hedged transactions occur or it is probable the hedged transaction will not occur. During the fourth quarter of 2010, the Company recognized $59 million of before-tax losses in earnings from these interest rate swaps.
Archer Daniels Midland Company
Notes to Consolidated Financial Statements (Continued)
|
Note 4.
|
Inventories, Derivative Instruments & Hedging Activities (Continued)
|
The following table sets forth the fair value of derivatives not designated as hedging instruments as of June 30, 2010 and 2009.
|
2010
|
2009
|
|||||||||||||||
|
Assets
|
Liabilities
|
Assets
|
Liabilities
|
|||||||||||||
|
(In millions)
|
(In millions)
|
|||||||||||||||
|
FX Contracts
|
$ | 200 | $ | 266 | $ | 46 | $ | 39 | ||||||||
|
Interest Contracts
|
– | 26 | – | – | ||||||||||||
|
Commodity Contracts
|
2,727 | 3,152 | 1,781 | 2,139 | ||||||||||||
|
Total
|
$ | 2,927 | $ | 3,444 | $ | 1,827 | $ | 2,178 | ||||||||
The following table sets forth the pre-tax gains (losses) on derivatives not designated as hedging instruments that have been included in the consolidated statement of earnings for the indicated time periods. The amended disclosure requirements of ASC Topic 815 were first implemented for the period ended March 31, 2009. As a result, comparative year-to-date information is not available for fiscal year 2009.
|
Twelve months ended
June 30,
|
||||
|
2010
|
||||
|
(In millions)
|
||||
|
Interest Contracts
|
||||
|
Other income (expense) – net
|
$ | (57 | ) | |
|
FX Contracts
|
||||
|
Net sales and other operating income
|
$ | 0 | ||
|
Cost of products sold
|
61 | |||
|
Other income (expense) - net
|
(42 | ) | ||
|
Commodity Contracts
|
||||
|
Cost of products sold
|
$ | 242 | ||
|
Total gain (loss) recognized in earnings
|
$ | 204 | ||
Derivatives Designated as Cash Flow Hedging Strategies
For derivative instruments that are designated and qualify as cash flow hedges (i.e., hedging the exposure to variability in expected future cash flows that is attributable to a particular risk), the effective portion of the gain or loss on the derivative instrument is reported as a component of other comprehensive income (OCI) and reclassified into earnings in the same line item affected by the hedged transaction and in the same period or periods during which the hedged transaction affects earnings. The remaining gain or loss on the derivative instrument that is in excess of the cumulative change in the cash flows of the hedged item, if any (i.e., the ineffective portion), hedge components excluded from the assessment of effectiveness, and gains and losses related to discontinued hedges are recognized in the consolidated statement of earnings during the current period.
Archer-Daniels-Midland Company
Notes to Consolidated Financial Statements (Continued)
|
Note 4.
|
Inventories, Derivative Instruments & Hedging Activities (Continued)
|
For each of the commodity hedge programs described below, the derivatives are designated as cash flow hedges. The changes in the market value of such derivative contracts have historically been, and are expected to continue to be, highly effective at offsetting changes in price movements of the hedged item. Once the hedged item is recognized in earnings, the gains/losses arising from the hedge will be reclassified from AOCI to either net sales and other operating income, or cost of products sold. As of June 30, 2010, the Company has $5 million of after-tax gains in AOCI related to gains and losses from commodity cash flow hedge transactions. The Company expects to recognize all of these after-tax gains in the statement of earnings during the next 12 months.
The Company, from time to time, uses futures or options contracts to fix the purchase price of anticipated volumes of corn to be purchased and processed in a future month. The objective of this hedging program is to reduce the variability of cash flows associated with the Company’s forecasted purchases of corn. The Company’s corn processing plants currently grind approximately 75 million bushels of corn per month. During the past 12 months, the Company hedged between 21% and 100% of its monthly anticipated grind. At June 30, 2010, the Company has hedged portions of its anticipated monthly purchases of corn over the next 8 months, ranging from 1% to 13% of its anticipated monthly grind.
The Company, from time to time, also uses futures, options, and swaps to fix the purchase price of the Company’s anticipated natural gas requirements for certain production facilities. The objective of this hedging program is to reduce the variability of cash flows associated with the Company’s forecasted purchases of natural gas. These production facilities use approximately 3.5 million MMbtus of natural gas per month. During the past 12 months, the Company hedged between 47% and 77% of the quantity of its anticipated monthly natural gas purchases. At June 30, 2010, the Company has hedged portions of its anticipated monthly purchases of natural gas over the next 12 months, ranging from 37% to 58% of its anticipated monthly natural gas purchases.
To protect against fluctuations in cash flows due to foreign currency exchange rates, the Company from time to time will use forward foreign exchange contracts as cash flow hedges. Certain production facilities have manufacturing expenses and some sales contracts denominated in non-functional currency. To reduce the risk of fluctuations in cash flows due to changes in the exchange rate between functional versus non-functional currency, the Company will hedge some portion of the forecasted foreign currency expenditures and/or receipts. The fair value of foreign exchange contracts designated as cash flow hedging instruments as of June 30, 2010 was immaterial.
The Company is using treasury lock agreements and interest rate swaps in order to lock in the Company’s interest rate prior to the issuance or remarketing of debentures. Both the treasury-lock agreements and interest rate swaps were designated as cash flow hedges of the risk of changes in the future interest payments attributable to changes in the benchmark interest rate. The objective of the treasury-lock agreements and interest rate swaps was to protect the Company from changes in the benchmark rate from the date the Company decided to issue the debt to the date when the debt will actually be issued. At June 30, 2010, AOCI included $25 million of after-tax gains related to treasury-lock agreements and interest rate swaps. The Company will recognize the $25 million of gains in its consolidated statement of earnings over the terms of the hedged items or when it is probable the hedged transactions will not occur.
Archer-Daniels-Midland Company
Notes to Consolidated Financial Statements (Continued)
|
Note 4.
|
Inventories, Derivative Instruments & Hedging Activities (Continued)
|
The following table sets forth the fair value of derivatives designated as hedging instruments as of June 30, 2010 and 2009.
|
2010
|
2009
|
|||||||||||||||
|
Assets
|
Liabilities
|
Assets
|
Liabilities
|
|||||||||||||
|
(In millions)
|
(In millions)
|
|||||||||||||||
|
Interest Contracts
|
$ | 0 | $ | 0 | $ | 10 | $ | 0 | ||||||||
|
Commodity Contracts
|
2 | 2 | 5 | 2 | ||||||||||||
|
Total
|
$ | 2 | $ | 2 | $ | 15 | $ | 2 | ||||||||
The following table sets forth the pre-tax gains (losses) on derivatives designated as hedging instruments that have been included in the consolidated statement of earnings for the indicated periods. The amended disclosure requirements of ASC Topic 815 were first implemented for the quarter ended March 31, 2009. As a result, comparative year-to-date information is not available for fiscal year 2009.
|
Consolidated Statement of
Earnings Location
|
Twelve months ended
June 30, 2010
|
||||
|
(In millions)
|
|||||
|
FX Contracts
|
|||||
|
Effective amount recognized in earnings
|
Other (income) expense – net
|
$ | (1 | ) | |
|
Interest Contracts
|
|||||
|
Effective amount recognized in earnings
|
Other (income) expense – net
|
0 | |||
|
Commodity Contracts
|
|||||
|
Effective amount recognized in earnings
|
Cost of products sold
|
(85 | ) | ||
|
Net sales and other operating income
|
0 | ||||
|
Ineffective amount recognized in earnings
|
Cost of products sold
|
(55 | ) | ||
|
Total amount recognized in earnings
|
$ | (141 | ) | ||
Archer Daniels Midland Company
Notes to Consolidated Financial Statements (Continued)
|
Note 5.
|
Marketable Securities and Cash Equivalents
|
|
Unrealized
|
Unrealized
|
Fair
|
||||||||||||||
|
Cost
|
Gains
|
Losses
|
Value
|
|||||||||||||
|
(In millions)
|
||||||||||||||||
|
2010
|
||||||||||||||||
|
United States government obligations
|
||||||||||||||||
|
Maturity less than 1 year
|
$ | 395 | $ | – | $ | – | $ | 395 | ||||||||
|
Maturity 1 to 5 years
|
33 | 1 | – | 34 | ||||||||||||
|
Government–sponsored enterprise obligations
|
||||||||||||||||
|
Maturity less than 1 year
|
111 | 3 | – | 114 | ||||||||||||
|
Maturity 1 to 5 years
|
122 | 4 | – | 126 | ||||||||||||
|
Maturity 5 to 10 years
|
232 | 9 | – | 241 | ||||||||||||
|
Corporate debt securities
|
||||||||||||||||
|
Maturity less than 1 year
|
10 | – | – | 10 | ||||||||||||
|
Maturity 1 to 5 years
|
46 | 2 | – | 48 | ||||||||||||
|
Other debt securities
|
||||||||||||||||
|
Maturity less than 1 year
|
659 | – | – | 659 | ||||||||||||
|
Maturity 5 to 10 years
|
2 | – | – | 2 | ||||||||||||
|
Maturity greater than 10 years
|
6 | – | – | 6 | ||||||||||||
|
Equity securities
|
||||||||||||||||
|
Available-for-sale
|
54 | 48 | (15 | ) | 87 | |||||||||||
|
Trading
|
20 | – | – | 20 | ||||||||||||
| $ | 1,690 | $ | 67 | $ | (15 | ) | $ | 1,742 | ||||||||
|
Unrealized
|
Unrealized
|
Fair
|
||||||||||||||
|
Cost
|
Gains
|
Losses
|
Value
|
|||||||||||||
|
(In millions)
|
||||||||||||||||
|
2009
|
||||||||||||||||
|
United States government obligations
|
||||||||||||||||
|
Maturity less than 1 year
|
$ | 645 | $ | – | $ | – | $ | 645 | ||||||||
|
Maturity 1 to 5 years
|
29 | 1 | – | 30 | ||||||||||||
|
Government–sponsored enterprise obligations
|
||||||||||||||||
|
Maturity less than 1 year
|
8 | – | – | 8 | ||||||||||||
|
Maturity 1 to 5 years
|
59 | 2 | – | 61 | ||||||||||||
|
Maturity 5 to 10 years
|
104 | 1 | (1 | ) | 104 | |||||||||||
|
Maturity greater than 10 years
|
268 | 6 | – | 274 | ||||||||||||
|
Corporate debt securities
|
||||||||||||||||
|
Maturity less than 1 year
|
10 | – | – | 10 | ||||||||||||
|
Maturity 1 to 5 years
|
37 | 1 | – | 38 | ||||||||||||
|
Other debt securities
|
||||||||||||||||
|
Maturity less than 1 year
|
463 | – | – | 463 | ||||||||||||
|
Maturity 5 to 10 years
|
6 | – | – | 6 | ||||||||||||
|
Maturity greater than 10 years
|
16 | – | (3 | ) | 13 | |||||||||||
|
Equity securities
|
||||||||||||||||
|
Available-for-sale
|
69 | 33 | (29 | ) | 73 | |||||||||||
|
Trading
|
19 | – | – | 19 | ||||||||||||
| $ | 1,733 | $ | 44 | $ | (33 | ) | $ | 1,744 | ||||||||
Archer Daniels Midland Company
Notes to Consolidated Financial Statements (Continued)
|
Note 5.
|
Marketable Securities and Cash Equivalents (Continued)
|
None of the $15 million in unrealized losses at June 30, 2010 arose within the last 12 months. The market value of the investments that have been in an unrealized loss position for 12 months and longer is $15 million. The $15 million in unrealized losses is associated with available-for-sale equity securities related to the Company’s investment in one security. In June 2010, the Company recorded a $15 million other-than-temporary impairment related to an investment in an available-for-sale equity security, based on the Company’s assessment of underlying market conditions. The Company does not intend to sell its impaired equity security, and, based upon its evaluation, the Company does not believe it is likely that the Company will be required to sell the investment before recovery of its amortized cost basis.
|
Note 6.
|
Investments in and Advances to Affiliates
|
The Company applies the equity method for investments in investees over which the Company has the ability to exercise significant influence, including the Company’s 16.4% share ownership in its equity investment in Wilmar. The Company had 73 and 72 unconsolidated affiliates as of June 30, 2010 and 2009, respectively, located in North and South America, Africa, Europe, and Asia. The following table summarizes the combined balance sheets as of June 30, 2010 and 2009, and the combined statements of earnings of the Company’s unconsolidated affiliates for each of the three years ended June 30, 2010, 2009, and 2008.
|
2010
|
2009
|
2008
|
||||||||||
|
(In millions)
|
||||||||||||
|
Current assets
|
$ | 18,495 | $ | 12,766 | ||||||||
|
Non-current assets
|
16,315 | 19,403 | ||||||||||
|
Current liabilities
|
(12,967 | ) | (8,646 | ) | ||||||||
|
Non-current liabilities
|
(4,209 | ) | (3,751 | ) | ||||||||
|
Minority interests
|
(783 | ) | (681 | ) | ||||||||
|
Net assets
|
$ | 16,851 | $ | 19,091 | ||||||||
|
Net sales
|
$ | 39,524 | $ | 41,205 | $ | 37,542 | ||||||
|
Gross profit
|
5,225 | 5,682 | 4,575 | |||||||||
|
Net income
|
2,931 | 816 | 2,503 | |||||||||
Undistributed earnings of the Company’s unconsolidated affiliates as of June 30, 2010, are $1.2 billion. The Company has direct investments in two foreign equity method investees who have a carrying value of $1.5 billion as of June 30, 2010, and a market value of $3.3 billion based on active market quoted prices converted to U.S. dollars at applicable exchange rates at August 20, 2010.
Archer Daniels Midland Company
Notes to Consolidated Financial Statements (Continued)
|
Note 6.
|
Investments in and Advances to Affiliates (Continued)
|
The Company provides credit facilities totaling $336 million to nine unconsolidated affiliates. One facility matures December 31, 2011 and bears interest at the one month LIBOR rate. This facility has an outstanding balance of $110 million as of June 30, 2010 that is included in other non-current assets in the accompanying consolidated balance sheet. Two facilities have no outstanding balance while the other six credit facilities have outstanding balances of $17 million as of June 30, 2010, that are included in receivables in the accompanying consolidated balance sheet.
|
Note 7.
|
Goodwill
|
The Company accounts for its goodwill and other intangible assets in accordance with ASC Topic 350,
Intangibles - Goodwill and Other
. Under this standard, goodwill and intangible assets deemed to have indefinite lives are not amortized but are subject to annual impairment tests. The Company recorded a $6 million goodwill impairment charge during 2009. There were no goodwill impairment charges recorded during 2010 and 2008. The changes in goodwill during 2010 are related to acquisitions and foreign currency translation adjustments. The carrying value of the Company’s other intangible assets is not material.
Goodwill balances attributable to consolidated businesses and investments in affiliates, by segment, are set forth in the following table.
|
2010
|
2009
|
|||||||||||||||||||||||
|
Consolidated
|
Investments
|
Consolidated
|
Investments
|
|||||||||||||||||||||
|
Businesses
|
in Affiliates
|
Total
|
Businesses
|
In Affiliates
|
Total
|
|||||||||||||||||||
|
(In millions)
|
(In millions)
|
|||||||||||||||||||||||
|
Oilseeds Processing
|
$ | 8 | $ | 187 | $ | 195 | $ | 9 | $ | 186 | $ | 195 | ||||||||||||
|
Corn Processing
|
85 | 7 | 92 | 77 | 7 | 84 | ||||||||||||||||||
|
Agricultural Services
|
46 | 1 | 47 | 44 | 1 | 45 | ||||||||||||||||||
|
Other
|
123 | 66 | 189 | 126 | 82 | 208 | ||||||||||||||||||
|
Total
|
$ | 262 | $ | 261 | $ | 523 | $ | 256 | $ | 276 | $ | 532 | ||||||||||||
Archer Daniels Midland Company
Notes to Consolidated Financial Statements (Continued)
|
Note 8.
|
|
|
2010
|
2009
|
|||||||
|
(In millions)
|
||||||||
|
4.70% Debentures $1.75 billion face amount, due in 2041
|
$ | 1,750 | $ | 1,750 | ||||
|
0.875% Convertible Senior Notes $1.15 billion face amount, due in 2014
|
982 | 942 | ||||||
|
5.45% Notes $700 million face amount, due in 2018
|
700 | 700 | ||||||
|
5.375% Debentures $600 million face amount, due in 2035
|
587 | 586 | ||||||
|
5.935% Debentures $500 million face amount, due in 2032
|
495 | 494 | ||||||
|
6.625% Debentures $298 million face amount, due in 2029
|
296 | 296 | ||||||
|
8.375% Debentures $295 million face amount, due in 2017
|
292 | 292 | ||||||
|
7.5% Debentures $282 million face amount, due in 2027
(1)
|
281 | 341 | ||||||
|
6.95% Debentures $250 million face amount, due in 2097
|
246 | 246 | ||||||
|
7.0% Debentures $246 million face amount, due in 2031
(2)
|
244 | 398 | ||||||
|
7.125% Debentures $243 million face amount, due in 2013
|
243 | 243 | ||||||
|
6.45% Debentures $215 million face amount, due in 2038
(3)
|
215 | 498 | ||||||
|
6.75% Debentures $200 million face amount, due in 2027
|
197 | 197 | ||||||
|
5.87% Debentures $196 million face amount, due in 2010
|
191 | 177 | ||||||
|
8.125% Debentures $103 million face amount, due in 2012
|
103 | 103 | ||||||
|
8.875% Debentures $102 million face amount, due in 2011
|
102 | 102 | ||||||
|
Other
|
250 | 275 | ||||||
|
Total long-term debt including current maturities
|
7,174 | 7,640 | ||||||
|
Current maturities
|
(344 | ) | (48 | ) | ||||
|
Total long-term debt
|
$ | 6,830 | $ | 7,592 | ||||
(1)
$343 million face amount in 2009
(2)
$400 million face amount in 2009
(3)
$500 million face amount in 2009
Archer Daniels Midland Company
Notes to Consolidated Financial Statements (Continued)
|
Note 8.
|
Debt and Financing Arrangements (Continued)
|
In fiscal year 2008, the Company issued $3.10 billion of additional long-term debt, including $500 million of debentures issued in December 2007, $700 million of notes issued in March 2008, and $1.75 billion of debentures issued in June 2008 (the Debentures).
In connection with the issuance of the Debentures in June 2008, the Company issued $1.75 billion of Equity Units. Equity Units are a combination of debt and forward purchase contract for the holder to purchase the Company’s common stock. The debt and equity instruments are deemed to be separate instruments as the investor may transfer or settle the equity instrument separately from the debt instrument.
The forward purchase contract will obligate the buyer to purchase from the Company, no later than June 1, 2011, for a price of $50 in cash, the following number of shares of the Company’s common stock, subject to anti-dilution adjustments:
|
•
|
if the “Applicable Market Value” (AMV) of the Company’s common stock, which is the average closing price of the Company’s common stock over the 20-trading day period ending on the third trading day prior to June 1, 2011, equals or exceeds $47.83, 1.0453 shares of the Company’s common stock;
|
|
|
•
|
if the AMV is less than $47.83, but greater than $39.86, a number of shares of the Company’s common stock having a value, based on the AMV, equal to $50; and
|
|
|
•
|
if the AMV is less than or equal to $39.86, 1.2544 shares of the Company’s common stock.
|
The Debentures bear interest at a rate of 4.70% per year, payable quarterly and are due June 1, 2041. The Debentures will be remarketed in 2011. If this remarketing is successful, the interest rate on the Debentures will be reset, and thereafter interest will be payable semi-annually at the reset rate. In addition, following a successful remarketing, the Company may modify certain terms of the Debentures including adjusting the frequency of interest payments, adjusting the ranking of the Debentures or changing the stated maturity. If there has been no successful remarketing, the interest rate on the Debentures will not be reset, and the holder of each Equity Unit will have the right to put its interest in the Debentures to the Company on June 1, 2011 at a put price equal to 100% of its principal amount plus accrued and unpaid interest. The proceeds of the put right will be deemed to have been applied against the holder’s obligations under the forward purchase contracts.
The Company will also pay the Equity Unit holder quarterly contract adjustment payments at a rate of 1.55% per year of the stated amount of $50 per Equity Unit, or $0.775 per year. The present value of the future contract adjustment payments of $75 million, which is being paid over the three years from the date of issuance, was recorded as a reduction to shareholders’ equity. The Company also recorded a $35 million decrease in shareholders’ equity for issuance costs related to the equity portion of the Equity Units. The remaining issuance costs have been allocated to the debt and will be recognized in earnings over the life of the debt.
The forward purchase contracts issued in connection with the issuance of the debentures in June 2008, will be settled for the Company’s common stock on June 1, 2011. Until settlement of the forward purchase contract, the shares of stock underlying each forward purchase contract are not outstanding. The forward purchase contracts will only be included in the computation of diluted earnings per share to the extent they are dilutive. As of June 30, 2010, 2009 and 2008, the forward purchase contracts were not considered dilutive and therefore not included in the computation of diluted earnings per share. Basic earnings per share will not be affected until the forward purchase contracts are settled and the holders thereof become stockholders.
Archer Daniels Midland Company
Notes to Consolidated Financial Statements (Continued)
|
Note 8.
|
Debt and Financing Arrangements (Continued)
|
In February 2007, the Company issued $1.15 billion principal amount of convertible senior notes due in 2014 (the Notes) in a private placement. The Notes were issued at par and bear interest at a rate of 0.875% per year, payable semiannually. The Notes are convertible based on a conversion rate of 22.8423 shares per $1,000 principal amount of Notes (which is equal to a conversion price of approximately $43.78 per share). The Notes may be converted, subject to adjustment, only under the following circumstances: 1) during any calendar quarter beginning after March 31, 2007, if the closing price of the Company’s common stock for at least 20 trading days in the 30 consecutive trading days ending on the last trading day of the immediately preceding quarter is more than 140% of the applicable conversion price per share, which is $1,000 divided by the then applicable conversion rate, 2) during the five consecutive business day period immediately after any five consecutive trading day period (the note measurement period) in which the average of the trading price per $1,000 principal amount of Notes was equal to or less than 98% of the average of the product of the closing price of the Company’s common stock and the conversion rate at each date during the note measurement period, 3) if the Company makes specified distributions to its common stockholders or specified corporate transactions occur, or 4) at any time on or after January 15, 2014, through the business day preceding the maturity date. Upon conversion, a holder would receive an amount in cash equal to the lesser of 1) $1,000 and 2) the conversion value, as defined. If the conversion value exceeds $1,000, the Company will deliver, at the Company’s election, cash or common stock or a combination of cash and common stock for the conversion value in excess of $1,000. If the Notes are converted in connection with a change in control, as defined, the Company may be required to provide a make-whole premium in the form of an increase in the conversion rate, subject to a stated maximum amount. In addition, in the event of a change in control, the holders may require the Company to purchase all or a portion of their Notes at a purchase price equal to 100% of the principal amount of the Notes, plus accrued and unpaid interest, if any. In accordance with ASC Topic 470-20, the Company recognized the Notes proceeds received in 2007 as long-term debt of $853 million and equity of $297 million. The discount is being amortized over the life of the Notes using the effective interest method. Discount amortization expense of $40 million, $39 million, and $37 million for 2010, 2009, and 2008, respectively, were included in interest expense related to the Notes.
Concurrent with the issuance of the Notes, the Company purchased call options in private transactions at a cost of $300 million. The purchased call options allow the Company to receive shares of its common stock and/or cash from the counterparties equal to the amounts of common stock and/or cash related to the excess of the current market price of the Company’s common stock over the exercise price of the purchased call options. In addition, the Company sold warrants in private transactions to acquire, subject to customary anti-dilution adjustments, 26.3 million shares of its common stock at an exercise price of $62.56 per share and received proceeds of $170 million. If the average price of the Company’s common stock during a defined period ending on or about the respective settlement dates exceeds the exercise price of the warrants, the warrants will be settled, at the Company’s option, in cash or shares of common stock. The purchased call options and warrants are intended to reduce the potential dilution upon future conversions of the Notes by effectively increasing the initial conversion price to $62.56 per share. The net cost of the purchased call options and warrant transactions of $130 million was recorded as a reduction of shareholders’ equity.
Upon closing of the sale of the Notes, $370 million of the net proceeds from the Note issuance and the proceeds from the warrant transactions were used to repurchase 10.3 million shares of the Company’s common stock under the Company’s stock repurchase program.
As of June 30, 2010, none of the conditions permitting conversion of the Notes had been satisfied. In addition, as of June 30, 2010, the market price of the Company’s common stock was not greater than the exercise price of the purchased call options or warrants. As of June 30, 2010, no share amounts related to the conversion of the Notes or exercise of the warrants are included in diluted average shares outstanding.
Archer Daniels Midland Company
Notes to Consolidated Financial Statements (Continued)
|
Note 8.
|
Debt and Financing Arrangements (Continued)
|
In March 2010, the Company repurchased an aggregate principal amount of $500 million of its outstanding debentures in accordance with its announced tender offers, resulting in charges on early extinguishment of debt of $75 million, which consisted of $71 million in premium and other related expenses and $4 million in write-off of debt issuance costs.
At June 30, 2010, the fair value of the Company’s long-term debt exceeded the carrying value by $870 million, as estimated by using quoted market prices or discounted future cash flows based on the Company’s current incremental borrowing rates for similar types of borrowing arrangements.
The aggregate maturities of long-term debt for the five years after June 30, 2010, are $344 million, $156 million, $272 million, $1.05 billion, and $25 million, respectively.
At June 30, 2010, the Company had pledged certain property, plant, and equipment with a carrying value of $344 million as security for certain long-term debt obligations.
At June 30, 2010, the Company had lines of credit totaling $6.0 billion, of which $5.7 billion were unused. The weighted average interest rates on short-term borrowings outstanding at June 30, 2010 and 2009, were 2.29% and 2.86%, respectively. Of the Company’s total lines of credit, $4.2 billion support a commercial paper borrowing facility, against which there were no borrowings at June 30, 2010.
The Company has outstanding standby letters of credit and surety bonds at June 30, 2010 and 2009, totaling $459 million and $398 million, respectively.
|
Note 9.
|
Shareholders’ Equity
|
The Company has authorized one billion shares of common stock and 500,000 shares of preferred stock, each without par value. No preferred stock has been issued. At June 30, 2010 and 2009, the Company had approximately 32.6 million and 30.0 million shares, respectively, in treasury. Treasury stock of $838 million at June 30, 2010, and $765 million at June 30, 2009, is recorded at cost as a reduction of common stock.
The Company’s employee stock compensation plans provide for the granting of options to employees to purchase common stock of the Company pursuant to the Company’s 1999 Incentive Compensation Plan, 2002 Incentive Compensation Plan and 2009 Incentive Compensation Plan. These options are issued at market value on the date of grant, vest incrementally over five to nine years, and expire ten years after the date of grant.
The Company’s 1999, 2002 and 2009 Incentive Compensation Plans provide for the granting of restricted stock and restricted stock units (Restricted Stock Awards) at no cost to certain officers and key employees. In addition, the Company’s 2002 and 2009 Incentive Compensation Plans also provide for the granting of performance stock units (PSUs) at no cost to certain officers and key employees. Restricted Stock awards are made in common stock or stock units with equivalent rights and vest at the end of a three-year restriction period. The awards for PSUs are made in common stock and vest at the end of a three-year vesting period subject to the attainment of certain future performance criteria. During 2010, 2009, and 2008, 1.0 million, 1.1 million, and 1.3 million common stock or stock units, respectively, were granted as Restricted Stock Awards and PSUs. At June 30, 2010, there were 30.9 million shares available for future grants pursuant to the 2009 plan.
Archer Daniels Midland Company
Notes to Consolidated Financial Statements (Continued)
|
Note 9.
|
Shareholders’ Equity (Continued)
|
Compensation expense for option grants, Restricted Stock Awards and PSUs granted to employees is generally recognized on a straight-line basis during the service period of the respective grant. Certain of the Company’s option grants, Restricted Stock Awards and PSUs continue to vest upon the recipient’s retirement from the Company and compensation expense related to option grants and Restricted Stock Awards granted to retirement-eligible employees is recognized in earnings on the date of grant. Total compensation expense for option grants, Restricted Stock Awards and PSUs recognized during 2010, 2009, and 2008 was $45 million, $65 million, and $70 million, respectively.
The fair value of each option grant is estimated as of the date of grant using the Black-Scholes single option pricing model. The volatility assumption used in the Black-Scholes single option pricing model is based on the historical volatility of the Company’s stock. The volatility of the Company’s stock was calculated based upon the monthly closing price of the Company’s stock for the period immediately prior to the date of grant corresponding to the average expected life of the grant. The average expected life represents the period of time that option grants are expected to be outstanding. The risk-free rate is based on the rate of U.S. Treasury zero-coupon issues with a remaining term equal to the expected life of option grants. The assumptions used in the Black-Scholes single option pricing model are as follows.
|
2010
|
2009
|
2008
|
||||||||||
|
Dividend yield
|
2% | 2% | 1% | |||||||||
|
Risk-free interest rate
|
2% | 3% | 5% | |||||||||
|
Stock volatility
|
32% | 30% | 30% | |||||||||
|
Average expected life (years)
|
8 | 8 | 8 | |||||||||
A summary of option activity during 2010 is presented below:
|
Shares
|
Weighted-Average
Exercise Price
|
|||||||
|
(In thousands, except per share amounts)
|
||||||||
|
Shares under option at June 30, 2009
|
10,709 | $ | 26.05 | |||||
|
Granted
|
1,628 | 28.69 | ||||||
|
Exercised
|
(845 | ) | 16.90 | |||||
|
Forfeited or expired
|
(232 | ) | 25.83 | |||||
|
Shares under option at June 30, 2010
|
11,260 | $ | 27.12 | |||||
|
Exercisable at June 30, 2010
|
4,735 | $ | 25.44 | |||||
The weighted-average remaining contractual term of options outstanding and exercisable at June 30, 2010, is 7 years and 6 years, respectively. The aggregate intrinsic value of options outstanding and exercisable at June 30, 2010, is $25 million and $40 million, respectively. The weighted-average grant-date fair values of options granted during 2010, 2009, and 2008, were $8.50, $7.81, and $12.60 respectively. The total intrinsic values of options exercised during 2010, 2009, and 2008, were $11 million, $17 million, and $34 million, respectively. Cash proceeds received from options exercised during 2010, 2009, and 2008, were $11 million, $11 million, and $20 million, respectively.
At June 30, 2010, there was $24 million of total unrecognized compensation expense related to option grants. Amounts to be recognized as compensation expense during the next five fiscal years are $11 million, $7 million, $4 million, $1 million, and $1 million, respectively.
Archer Daniels Midland Company
Notes to Consolidated Financial Statements (Continued)
|
Note 9.
|
Shareholders’ Equity (Continued)
|
The fair value of Restricted Stock Awards is determined based on the market value of the Company’s shares on the grant date. The fair value of PSUs is estimated at the date of grant using a lattice valuation model. The weighted-average grant-date fair values of awards granted during 2010 and 2009, were $26.55 and $26.03, respectively.
A summary of Restricted Stock Awards and PSUs activity during 2010 is presented below:
|
Restricted
|
Weighted Average
|
|||||||
|
Stock Awards and PSUs
|
Grant-Date Fair Value
|
|||||||
|
(In thousands, except per share amounts)
|
||||||||
|
Non-vested at June 30, 2009
|
3,413 | $ | 33.81 | |||||
|
Granted
|
948 | 26.55 | ||||||
|
Vested
|
(1,028 | ) | 41.54 | |||||
|
Forfeited
|
(65 | ) | 29.06 | |||||
|
Non-vested at June 30, 2010
|
3,268 | $ | 29.36 | |||||
At June 30, 2010 there was $16 million of total unrecognized compensation expense related to Restricted Stock Awards and PSUs. Amounts to be recognized as compensation expense during the next three fiscal years are $10 million, $5 million, and $1 million, respectively. At the vesting date, the total fair value of Restricted Stock Awards vested during 2010 was $30 million.
Archer Daniels Midland Company
Notes to Consolidated Financial Statements (Continued)
|
Note 10.
|
Accumulated Other Comprehensive Income (Loss)
|
The following table sets forth information with respect to accumulated other comprehensive income:
|
Foreign
|
Deferred
|
Unrealized
|
Accumulated
|
|||||||||||||||||
|
Currency
|
Gain (Loss)
|
Pension
|
Gain (Loss)
|
Other
|
||||||||||||||||
|
Translation
|
on Hedging
|
Liability
|
On
|
Comprehensive
|
||||||||||||||||
|
Adjustment
|
Activities
|
Adjustment
|
Investments
|
Income (Loss)
|
||||||||||||||||
|
(In millions)
|
||||||||||||||||||||
|
Balance at June 30, 2007
|
$ | 402 | $ | (6 | ) | $ | (261 | ) | $ | 46 | $ | 181 | ||||||||
|
Unrealized gains (losses)
|
624 | 126 | 121 | (4 | ) | 867 | ||||||||||||||
|
(Gains) losses reclassified to
earnings
|
– | 13 | 23 | (38 | ) | (2 | ) | |||||||||||||
|
Tax effect
|
– | (43 | ) | (62 | ) | 16 | (89 | ) | ||||||||||||
|
Net of tax amount
|
624 | 96 | 82 | (26 | ) | 776 | ||||||||||||||
|
Balance at June 30, 2008
|
1,026 | 90 | (179 | ) | 20 | 957 | ||||||||||||||
|
Unrealized gains (losses)
|
(819 | ) | (24 | ) | (591 | ) | (26 | ) | (1,460 | ) | ||||||||||
|
(Gains) losses reclassified to
earnings
|
– | (126 | ) | 8 | 6 | (112 | ) | |||||||||||||
|
Tax effect
|
– | 47 | 206 | 7 | 260 | |||||||||||||||
|
Net of tax amount
|
(819 | ) | (103 | ) | (377 | ) | (13 | ) | (1,312 | ) | ||||||||||
|
Balance at June 30, 2009
|
207 | (13 | ) | (556 | ) | 7 | (355 | ) | ||||||||||||
|
Unrealized gains (losses)
|
(557 | ) | 46 | (123 | ) | 37 | (597 | ) | ||||||||||||
|
(Gains) losses reclassified to
earnings
|
– | 24 | 41 | 6 | 71 | |||||||||||||||
|
Tax effect
|
– | (27 | ) | 25 | (16 | ) | (18 | ) | ||||||||||||
|
Net of tax amount
|
(557 | ) | 43 | (57 | ) | 27 | (544 | ) | ||||||||||||
|
Balance at June 30, 2010
|
$ | (350 | ) | $ | 30 | $ | (613 | ) | $ | 34 | $ | (899 | ) | |||||||
Archer Daniels Midland Company
Notes to Consolidated Financial Statements (Continued)
|
Note 11.
|
Other (Income) Expense – Net
|
|
2010
|
2009
|
2008
|
||||||||||
|
(In millions)
|
||||||||||||
|
Interest expense
|
$ | 422 | $ | 469 | $ | 513 | ||||||
|
Investment income
|
(126 | ) | (181 | ) | (269 | ) | ||||||
|
Loss on extinguishment of debt
|
75 | – | – | |||||||||
|
Unrealized losses on interest rate swaps
|
59 | – | – | |||||||||
|
Net (gain) loss on marketable
securities transactions
|
6 | 6 | (38 | ) | ||||||||
|
Net (gain) loss on sale of
unconsolidated affiliates
|
(15 | ) | 11 | (9 | ) | |||||||
|
Net gain on sales of businesses
|
– | (24 | ) | (8 | ) | |||||||
|
Equity in earnings of
unconsolidated affiliates
|
(561 | ) | (145 | ) | (415 | ) | ||||||
|
Other – net
|
– | 41 | 55 | |||||||||
| $ | (140 | ) | $ | 177 | $ | (171 | ) | |||||
Interest expense is net of interest capitalized of $75 million, $95 million, and $52 million in 2010, 2009, and 2008, respectively. The Company made interest payments of $453 million, $522 million, and $485 million in 2010, 2009, and 2008, respectively. Realized gains on sales of available-for-sale marketable securities totaled $12 million, $17 million, and $39 million in 2010, 2009, and 2008, respectively. Annual realized losses on sales of available-for-sale marketable securities were $3 million in 2010, $1 million in 2009, and $1 million in 2008. Impairment losses on securities totaled $15 million and $22 million in 2010 and 2009, respectively.
|
Note 12.
|
Income Taxes
|
For financial reporting purposes, earnings before income taxes include the following components.
|
2010
|
2009
|
2008
|
||||||||||
| (In millions) | ||||||||||||
|
United States
|
$ | 1,453 | $ | 1,332 | $ | 1,409 | ||||||
|
Foreign
|
1,132 | 1,168 | 1,185 | |||||||||
| $ | 2,585 | $ | 2,500 | $ | 2,594 | |||||||
|
Significant components of income taxes are as follows:
|
||||||||||||
| 2010 | 2009 | 2008 | ||||||||||
| (In millions) | ||||||||||||
|
Current
|
||||||||||||
|
Federal
|
$ | 422 | $ | 626 | $ | 540 | ||||||
|
State
|
18 | 28 | 46 | |||||||||
|
Foreign
|
195 | 139 | 363 | |||||||||
|
Deferred
|
||||||||||||
|
Federal
|
107 | (4 | ) | (63 | ) | |||||||
|
State
|
(4 | ) | 10 | 11 | ||||||||
|
Foreign
|
(72 | ) | 13 | (89 | ) | |||||||
| $ | 666 | $ | 812 | $ | 808 | |||||||
Archer Daniels Midland Company
Notes to Consolidated Financial Statements (Continued)
|
Note 12.
|
Income Taxes (Continued)
|
|
Significant components of deferred tax liabilities and assets are as follows.
|
||||||||
|
2010
|
2009
|
|||||||
|
(In millions)
|
||||||||
|
Deferred tax liabilities
|
||||||||
|
Property, plant, and equipment
|
$ | 677 | $ | 599 | ||||
|
Equity in earnings of affiliates
|
187 | 142 | ||||||
|
Inventories
|
33 | 64 | ||||||
|
Other
|
143 | 80 | ||||||
| $ | 1,040 | $ | 885 | |||||
|
Deferred tax assets
|
||||||||
|
Pension and postretirement benefits
|
$ | 358 | $ | 301 | ||||
|
Stock compensation
|
59 | 59 | ||||||
|
Foreign tax credit carryforwards, net
|
34 | 27 | ||||||
|
Foreign tax loss carryforwards, net
|
97 | 4 | ||||||
|
State tax attributes, net
|
24 | 7 | ||||||
|
Other
|
120 | 170 | ||||||
| $ | 692 | $ | 568 | |||||
|
Net deferred tax liabilities
|
$ | 348 | $ | 317 | ||||
|
Current deferred tax assets (liabilities) included in other assets (accrued expenses)
|
91 | (9 | ) | |||||
|
Non-current deferred tax liabilities
|
$ | 439 | $ | 308 | ||||
Reconciliation of the statutory federal income tax rate to the Company’s effective tax rate on earnings is as follows:
|
2010
|
2009
|
2008
|
||||||||||
|
Statutory rate
|
35.0 | % | 35.0 | % | 35.0 | % | ||||||
|
State income taxes, net of
federal tax benefit
|
0.3 | 1.0 | 1.3 | |||||||||
|
Foreign earnings taxed at rates
other than the U.S. statutory rate
|
(8.9 | ) | (9.2 | ) | (4.6 | ) | ||||||
|
WIHL Liquidation
|
0.5 | 6.6 | – | |||||||||
|
Other
|
(1.1 | ) | (0.9 | ) | (0.6 | ) | ||||||
|
Effective rate
|
25.8 | % | 32.5 | % | 31.1 | % | ||||||
The Company made income tax payments of $604 million, $1.0 billion and $859 million in 2010, 2009, and 2008, respectively.
Archer Daniels Midland Company
Notes to Consolidated Financial Statements (Continued)
|
Note 12.
|
Income Taxes (Continued)
|
The Company has $135 million and $55 million of tax assets for net operating loss carry-forwards related to certain international subsidiaries at June 30, 2010 and 2009, respectively. As of June 30, 2010, approximately $132 million of these assets have no expiration date, and the remaining $3 million expire at various times through fiscal 2019. The annual usage of certain of these assets is limited to a percentage of taxable income of the respective international subsidiary for the year. The Company has recorded a valuation allowance of $38 million and $51 million against these tax assets at June 30, 2010 and 2009, respectively, due to the uncertainty of their realization.
The Company has $41 million and $38 million of tax assets related to excess foreign tax credits at June 30, 2010 and 2009, respectively, which begin to expire in fiscal 2013. The Company has $50 million and $9 million of tax assets related to state income tax attributes (incentive credits and net operating loss carryforwards) net of federal benefit at June 30, 2010 and 2009, respectively, which will expire at various times through fiscal 2016. The Company has recorded a valuation allowance of $7 million against the excess foreign tax credits at June 30, 2010, due to the uncertainty of realization. The Company has recorded a valuation allowance against the state income tax assets of $26 million net of federal benefit as of June 30, 2010. As of June 30, 2009, the Company had an $11 million valuation allowance recorded related to the excess foreign tax credits and a $2 million valuation allowance related to state income tax attributes, due to the uncertainty of realization.
The Company remains subject to examination in the U.S. for the calendar tax years 2007, 2008 and 2009.
Undistributed earnings of the Company’s foreign subsidiaries and affiliated corporate joint venture companies accounted for on the equity method amounting to approximately $6.6 billion at June 30, 2010, are considered to be permanently reinvested, and accordingly, no provision for U.S. income taxes has been provided thereon. It is not practicable to determine the deferred tax liability for temporary differences related to these undistributed earnings.
During 2009, approximately $158 million of income tax expense was incurred related to the Company’s investment in Wilmar International Holdings, Limited (WIHL), a subsidiary of ADM Asia Pacific, Limited (ADMAP), a wholly-owned subsidiary of the Company. Through WIHL, ADMAP holds an indirect ownership interest in Wilmar.
Historically, the Company considered the retained earnings of its investment in ADMAP to be permanently reinvested outside the U.S. Therefore, the Company provided no deferred tax liability associated with the undistributed earnings of this investment prior to the third quarter of 2009. On February 3, 2009, the shareholders of WIHL approved a plan of voluntary liquidation which was followed by a partial liquidating distribution on April 1, 2009. Pursuant to this distribution, ADMAP received publicly traded shares of Wilmar that represented approximately 40% of the Wilmar shares indirectly held by WIHL. The distribution caused the market value of the Wilmar shares received to be subject to U.S. income tax as a deemed distribution from ADMAP to the Company. Consequently, the Company concluded that a portion of its investment in ADMAP related to its investment in WIHL was not permanently reinvested. Accordingly, the Company recorded approximately $97 million of income tax expense and deferred income tax liability in the third quarter of 2009 to reflect the book-tax basis difference of its investment in WIHL as of March 31, 2009. On April 1, 2009, the income tax gain generated by the distribution of WIHL triggered additional U.S. income tax expense of approximately $61 million which was recorded in the Company’s fourth quarter 2009 and established a new tax basis in the U.S. for the Company’s WIHL investment.
In fiscal 2010, the liquidation process of WIHL was terminated, without any further liquidating distributions. As a result of the formal termination proceedings in 2010, the Company recognized $12 million of additional income tax expense in 2010 related to the original 2009 deemed and liquidating distributions. Previously, the Company has anticipated that the liquidation of WIHL could have resulted in additional income tax expense of approximately $590 million in the period that the liquidation would have occurred. As a result of the termination of the liquidation proceedings, we currently do not anticipate any further distributions which would result in additional income tax expense. However, in the event that such distributions occur in the future, it could result in a material expense and payment of income taxes by the Company.
Archer Daniels Midland Company
Notes to Consolidated Financial Statements (Continued)
|
Note 12.
|
Income Taxes (Continued)
|
The Company accounts for its income tax positions under the provisions of ASC Topic 740,
Income Taxes
. ASC Topic 740 prescribes a minimum threshold a tax position is required to meet before being recognized in the consolidated financial statements. This interpretation requires the Company to recognize in the consolidated financial statements tax positions determined more likely than not to be sustained upon examination, based on the technical merits of the position. The total amounts of unrecognized tax benefits at June 30, 2010 and 2009 are as follows:
|
Unrecognized Tax Benefits
|
||||||||
|
2010
|
2009
|
|||||||
|
(in millions)
|
||||||||
|
Beginning balance
|
$ | 54 | $ | 55 | ||||
|
Additions related to current years’ tax positions
|
31 | – | ||||||
|
Additions related to prior years’ tax positions
|
8 | 10 | ||||||
|
Reductions related to prior years’ tax positions
|
(7 | ) | (9 | ) | ||||
|
Settlements with tax authorities
|
(2 | ) | (2 | ) | ||||
|
Ending balance
|
$ | 84 | $ | 54 | ||||
The additions and reductions in unrecognized tax benefits shown in the table include effects related to net income and shareholders’ equity, and timing differences for which the ultimate deductibility is highly certain but for which there is uncertainty about the timing of such deductibility. The 2010 changes in unrecognized tax benefits did not have a material effect on the Company’s net income or cash flow.
The Company classifies interest on income tax related balances as interest expense or interest income and classifies tax-related penalties as selling, general and administrative expenses. At June 30, 2010 and 2009, the Company had accrued interest and penalties on unrecognized tax benefits of $27 million and $22 million, respectively.
The Company is subject to income taxation in many jurisdictions around the world. Resolution of the related tax positions through negotiations with relevant tax authorities or through litigation may take years to complete. Therefore, it is difficult to predict the timing for resolution of tax positions. However, the Company does not anticipate that the total amount of unrecognized tax benefits will increase or decrease significantly in the next twelve months. Given the long periods of time involved in resolving tax positions, the Company does not expect that the recognition of unrecognized tax benefits will have a material impact on the Company’s effective income tax rate in any given period. If the total amount of unrecognized tax benefits were required to be recognized by the Company at one time, there would be a positive impact of $53 million on the tax expense for that period.
In December 2009, the Company’s wholly-owned subsidiary, ADM do Brasil Ltda. (“ADM do Brasil”), received a tax assessment in the amount of $456 million (subject to variation in currency exchange rates) consisting of tax, penalty, and interest, from the Brazilian Federal Revenue Service (“BFRS”)
challenging the tax deductibility of commodity hedging losses incurred by ADM do Brasil in 2004. Commodity hedging transactions can result in gains, which are included in ADM do Brasil’s calculations of taxable income in Brazil, and losses, which ADM do Brasil deducts from its taxable income in Brazil. In June 2010, ADM do Brasil was notified by the BFRS that tax years 2005, 2006, and 2007 would also be audited, but as yet, no additional assessments have been received for these years. If the BFRS were to challenge commodity hedging deductions in all tax years still open to assessment (2005-2010), the Company estimates it could receive additional claims of approximately $160 million (as of June 30, 2010 and subject to variation in currency exchange rates).
Archer Daniels Midland Company
Notes to Consolidated Financial Statements (Continued)
In January 2010, ADM do Brasil filed an appeal with the BFRS. If ADM do Brasil is unsuccessful in the administrative appellate process, further appeals are available in the Brazilian federal courts. While the Company believes that its consolidated financial statements properly reflect the tax deductibility of these hedging losses, the ultimate resolution of this matter could result in the future recognition of significant additional payments of, and expense for, income tax and the associated interest and penalties.
The Company has evaluated its tax position regarding these hedging transactions and concluded, based in part upon advice from Brazilian legal counsel, that it was appropriate to recognize both gains and losses resulting from hedging transactions when determining its Brazilian income tax expense. Therefore, the Company has continued to recognize the tax benefit from hedging losses in its financial statements and has not recorded any tax liability for the amounts assessed by the BFRS. The Company intends to vigorously defend its position against the current assessment and any similar assessments that may be issued for years subsequent to 2004.
|
Note 13.
|
Leases
|
The Company leases manufacturing and warehouse facilities, real estate, transportation assets, and other equipment under non-cancelable operating leases the majority of which expire at various dates through the year 2031. Rent expense for 2010, 2009, and 2008 was $241 million, $217 million, and $201 million, respectively. Future minimum rental payments for non-cancelable operating leases with initial or remaining terms in excess of one year are as follows:
|
Minimum Rental
Payments
|
||||
|
Fiscal years
|
(In millions)
|
|||
|
2011
|
$ | 235 | ||
|
2012
|
189 | |||
|
2013
|
182 | |||
|
2014
|
156 | |||
|
2015
|
177 | |||
|
Thereafter
|
442 | |||
|
Total minimum lease payments
|
$ | 1,381 | ||
Archer Daniels Midland Company
Notes to Consolidated Financial Statements (Continued)
|
Note 14.
|
Employee Benefit Plans
|
The Company provides substantially all domestic employees and employees at certain international subsidiaries with pension benefits. Eligible domestic employees with five or more years of service prior to January 1, 2009 participate in a defined benefit pension plan. Eligible domestic employees hired on or after January 1, 2009 and eligible salaried employees with less than five years of service prior to January 1, 2009 participate in a “cash balance” pension formula. The Company provides eligible domestic employees who retire under qualifying conditions with access to postretirement health care, at full cost to the retiree (certain employees are “grandfathered” into subsidized coverage).
The Company also maintains 401(k) plans covering substantially all domestic employees. The Company contributes cash to the plans to match qualifying employee contributions, and also provides a non-matching employer contribution of 1% of pay to eligible participants. Under an employee stock ownership component of the 401(k) plans, employees may choose to invest in ADM stock as part of their own investment elections. The employer contributions are expensed when paid. Assets of the Company’s 401(k) plans consist primarily of listed common stocks and pooled funds. The Company’s 401(k) plans held 17.2 million shares of Company common stock at June 30, 2010, with a market value of $443 million. Cash dividends received on shares of Company common stock by these plans during the year ended June 30, 2010 were $10 million.
|
Pension Benefits
|
Postretirement Benefits
|
|||||||||||||||||||||||
|
2010
|
2009
|
2008
|
2010
|
2009
|
2008
|
|||||||||||||||||||
|
(In millions)
|
(In millions)
|
|||||||||||||||||||||||
|
Retirement plan expense
|
||||||||||||||||||||||||
|
Defined benefit plans:
|
||||||||||||||||||||||||
|
Service cost (benefits earned
during the
period)
|
$ | 58 | $ | 52 | $ | 68 | $ | 9 | $ | 7 | $ | 9 | ||||||||||||
|
Interest cost
|
119 | 111 | 109 | 16 | 13 | 12 | ||||||||||||||||||
|
Expected return on plan assets
|
(117 | ) | (113 | ) | (121 | ) | – | – | – | |||||||||||||||
|
Curtailment/Plan settlements
|
– | – | – | – | (15 | ) | – | |||||||||||||||||
|
Amortization of actuarial loss
|
31 | 2 | 17 | 5 | 1 | 2 | ||||||||||||||||||
|
Other amortization
|
6 | 6 | 5 | (1 | ) | (1 | ) | (1 | ) | |||||||||||||||
|
Net periodic defined benefit
plan
expense
|
97 | 58 | 78 | 29 | 5 | 22 | ||||||||||||||||||
|
Defined contribution plans
|
40 | 35 | 31 | – | – | – | ||||||||||||||||||
|
Total retirement plan expense
|
$ | 137 | $ | 93 | $ | 109 | $ | 29 | $ | 5 | $ | 22 | ||||||||||||
Archer Daniels Midland Company
Notes to Consolidated Financial Statements (Continued)
|
Note 14.
|
Employee Benefit Plans (Continued)
|
The Company uses a June 30 measurement date for all defined benefit plans. The following tables set forth changes in the defined benefit obligation and the fair value of defined benefit plan assets:
|
Pension Benefits
|
Postretirement Benefits
|
|||||||||||||||
|
2010
|
2009
|
2010
|
2009
|
|||||||||||||
|
(In millions)
|
(In millions)
|
|||||||||||||||
|
Benefit obligation, beginning
|
$ | 2,012 | $ | 1,851 | $ | 256 | $ | 206 | ||||||||
|
Service cost
|
58 | 52 | 9 | 7 | ||||||||||||
|
Interest cost
|
119 | 111 | 16 | 13 | ||||||||||||
|
Actuarial loss (gain)
|
271 | 160 | (51 | ) | 48 | |||||||||||
|
Employee contributions
|
2 | 2 | – | – | ||||||||||||
|
Settlements
|
– | (15 | ) | – | (8 | ) | ||||||||||
|
Curtailments
|
(3 | ) | – | – | – | |||||||||||
|
Business Combinations
|
2 | – | – | – | ||||||||||||
|
Plan measurement date adjustment
|
– | 39 | – | 6 | ||||||||||||
|
Benefits paid
|
(86 | ) | (94 | ) | (6 | ) | (8 | ) | ||||||||
|
Plan amendments
|
– | (2 | ) | – | (8 | ) | ||||||||||
|
Foreign currency effects
|
(76 | ) | (92 | ) | – | – | ||||||||||
|
Benefit obligation, ending
|
$ | 2,299 | $ | 2,012 | $ | 224 | $ | 256 | ||||||||
|
Fair value of plan assets, beginning
|
$ | 1,427 | $ | 1,662 | $ | – | $ | – | ||||||||
|
Actual return on plan assets
|
182 | (283 | ) | – | – | |||||||||||
|
Employer contributions
|
249 | 217 | 6 | 8 | ||||||||||||
|
Employee contributions
|
2 | 2 | – | – | ||||||||||||
|
Settlements
|
– | (15 | ) | – | – | |||||||||||
|
Business Combinations
|
2 | – | – | – | ||||||||||||
|
Plan measurement date adjustment
|
– | 27 | – | – | ||||||||||||
|
Benefits paid
|
(86 | ) | (94 | ) | (6 | ) | (8 | ) | ||||||||
|
Foreign currency effects
|
(55 | ) | (89 | ) | – | – | ||||||||||
|
Fair value of plan assets, ending
|
$ | 1,721 | $ | 1,427 | $ | – | $ | – | ||||||||
|
Funded status
|
(578 | ) | $ | (585 | ) | (224 | ) | $ | (256 | ) | ||||||
|
Prepaid benefit cost
|
$ | 17 | $ | 17 | $ | – | – | |||||||||
|
Accrued benefit liability – current
|
(13 | ) | (13 | ) | (7 | ) | (8 | ) | ||||||||
|
Accrued benefit liability – long-term
|
(582 | ) | (589 | ) | (217 | ) | (248 | ) | ||||||||
|
Net amount recognized in the balance sheet
|
$ | (578 | ) | $ | (585 | ) | $ | (224 | ) | $ | (256 | ) | ||||
Archer Daniels Midland Company
Notes to Consolidated Financial Statements (Continued)
|
Note 14.
|
Employee Benefit Plans (Continued)
|
Included in accumulated other comprehensive income for pension benefits at June 30, 2010, are the following amounts that have not yet been recognized in net periodic pension cost: unrecognized transition obligation of $3 million, unrecognized prior service costs of $26 million and unrecognized actuarial losses of $906 million. The prior service cost and actuarial loss included in accumulated other comprehensive income and expected to be recognized in net periodic pension cost during the fiscal year ended June 30, 2011, is $5 million and $58 million, respectively.
Included in accumulated other comprehensive income for postretirement benefits at June 30, 2010, are the following amounts that have not yet been recognized in net periodic pension cost: unrecognized prior service credit of $7 million and unrecognized actuarial losses of $21 million. The prior service credit included in accumulated other comprehensive income and expected to be recognized in net periodic benefit costs during the fiscal year ended June 30, 2011, is $1 million.
The following table sets forth the principal assumptions used in developing net periodic pension cost:
|
Pension Benefits
|
Postretirement Benefits
|
|||||||||||||||
|
2010
|
2009
|
2010
|
2009
|
|||||||||||||
|
Discount rate
|
6.1% | 6.5% | 6.3% | 6.8% | ||||||||||||
|
Expected return on plan assets
|
7.1% | 7.2% | N/A | N/A | ||||||||||||
|
Rate of compensation increase
|
3.8% | 3.9% | N/A | N/A | ||||||||||||
The following table sets forth the principal assumptions used in developing the year-end actuarial present value of the projected benefit obligations:
|
Pension Benefits
|
Postretirement Benefits
|
|||||||||||||||
|
2010
|
2009
|
2010
|
2009
|
|||||||||||||
|
Discount rate
|
5.2% | 6.1% | 5.4% | 6.8% | ||||||||||||
|
Rate of compensation increase
|
3.9% | 3.8% | N/A | N/A | ||||||||||||
The projected benefit obligation, accumulated benefit obligation, and fair value of plan assets for the pension plans with projected benefit obligations in excess of plan assets were $2.2 billion, $2.0 billion, and $1.6 billion, respectively, as of June 30, 2010, and $1.9 billion, $1.7 billion, and $1.3 billion, respectively, as of June 30, 2009. The projected benefit obligation, accumulated benefit obligation, and fair value of plan assets for the pension plans with accumulated benefit obligations in excess of plan assets were $2.1 billion, $1.9 billion, and $1.5 billion, respectively, as of June 30, 2010, and $1.6 billion, $1.5 billion, and $1.1 billion, respectively, as of June 30, 2009. The accumulated benefit obligation for all pension plans as of June 30, 2010 and 2009, was $2.1 billion and $ 1.8 billion, respectively.
For postretirement benefit measurement purposes, an 8.0% annual rate of increase in the per capita cost of covered health care benefits was assumed for 2010. The rate was assumed to decrease gradually to 5.0% for 2016 and remain at that level thereafter.
Assumed health care cost trend rates have a significant impact on the amounts reported for the health care plans. A 1% change in assumed health care cost trend rates would have the following effects:
|
1% Increase
|
1% Decrease
|
|||||||
|
(In millions)
|
||||||||
|
Effect on combined service and interest cost components
|
$ | 3 | $ | (3 | ) | |||
|
Effect on accumulated postretirement benefit obligations
|
$ | 33 | $ | (27 | ) | |||
Archer Daniels Midland Company
Notes to Consolidated Financial Statements (Continued)
|
Note 14.
|
Employee Benefit Plans (Continued)
|
Plan Assets
The Company’s employee benefit plan assets are principally comprised of the following types of investments:
ADM and other common stock:
Equity securities are valued based on quoted exchange prices and are classified within Level 1 of the valuation hierarchy.
Mutual funds:
Mutual funds are valued at the closing price reported on the active market on which they are traded and are classified within Level 1 of the valuation hierarchy.
Common collective trust (CCT) funds:
The fair values of the CCTs are based on the cumulative net asset value of their underlying investments. The investments in CCTs are comprised of international equity funds, a small cap U.S. equity fund, large cap U.S. equity funds, fixed income funds, and other funds. The fund units are valued at NAV based on the closing market value of the units bought or sold as of the valuation date and are classified in Level 2 of the fair value hierarchy. The CCTs seek primarily to provide investment results approximating the aggregate price, dividend performance, total return, and income stream of underlying investments of the funds. Issuances and redemptions of certain of the CCT investments may be restricted by date and/or amount.
Corporate debt instruments:
Corporate debt instruments are valued at the closing price reported on the active market on which they are traded and are classified within Level 2 of the valuation hierarchy.
U.S. Treasury instruments:
U.S. Treasury instruments are valued at the closing price reported on the active market on which they are traded and are classified within Level 1 of the valuation hierarchy.
U.S. government agency, state, and local government bonds:
U.S. government agency obligations and state and municipal debt securities are valued using third-party pricing services and are classified within Level 2 of the valuation hierarchy.
Archer Daniels Midland Company
Notes to Consolidated Financial Statements (Continued)
|
Note 14.
|
Employee Benefit Plans (Continued)
|
The methods described above may produce a fair value calculation that may not be indicative of net realizable value or reflective of future fair values. Furthermore, while the Company believes its valuation methods are appropriate and consistent with other market participants’ methods, the use of different methodologies or assumptions to determine the fair value of certain financial instruments could result in a different fair value measurement at the reporting date.
The following table sets forth, by level within the fair value hierarchy, the fair value of plan assets as of June 30, 2010.
|
Quoted Prices
in Active
Markets for
Identical
Assets
(Level 1)
|
Significant
Other
Observable
Inputs
(Level 2)
|
Significant
Unobservable
Inputs
(Level 3)
|
Total
|
|||||||||||||
|
(In millions)
|
||||||||||||||||
|
Common stock
|
||||||||||||||||
|
ADM common stock
|
$ | 19 | $ | – | $ | – | $ | 19 | ||||||||
|
U.S. companies
|
64 | – | – | 64 | ||||||||||||
|
International companies
|
3 | – | – | 3 | ||||||||||||
|
Equity mutual funds
|
||||||||||||||||
|
Emerging markets
|
53 | – | – | 53 | ||||||||||||
|
International
|
70 | – | – | 70 | ||||||||||||
|
Large cap U.S.
|
230 | – | – | 230 | ||||||||||||
|
Other
|
1 | – | – | 1 | ||||||||||||
|
Common collective trust funds
|
||||||||||||||||
|
International equity
|
– | 365 | – | 365 | ||||||||||||
|
Small cap U.S. equity
|
– | 76 | – | 76 | ||||||||||||
|
Large cap U.S. equity
|
– | 52 | – | 52 | ||||||||||||
|
Fixed income
|
252 | – | 252 | |||||||||||||
|
Other
|
32 | – | 32 | |||||||||||||
|
Debt instruments
|
||||||||||||||||
|
Corporate bonds
|
– | 383 | – | 383 | ||||||||||||
|
U.S. Treasury instruments
|
84 | – | – | 84 | ||||||||||||
|
U.S. government agency,
state and local government
bonds
|
– | 16 | – | 16 | ||||||||||||
|
Other
|
– | 21 | – | 21 | ||||||||||||
|
Total assets at fair value
|
$ | 524 | $ | 1,197 | $ | – | $ | 1,721 | ||||||||
Level 3 Gains and Losses:
There are no Plan assets classified as Level 3 in the fair value hierarchy; therefore there are no associated gains or losses.
Archer Daniels Midland Company
Notes to Consolidated Financial Statements (Continued)
|
Note 14.
|
Employee Benefit Plans (Continued)
|
The following table sets forth the actual asset allocation for the Company’s global pension plan assets as of the measurement date:
| 2010 1, 2 | 2009 | |||||||
|
Equity securities
|
48% | 48% | ||||||
|
Debt securities
|
50% | 46% | ||||||
|
Other
|
2% | 6% | ||||||
|
Total
|
100% | 100% | ||||||
|
|
1
|
The Company’s U.S. pension plans contain approximately 66% of the Company’s global pension plan assets. The target asset allocation for the Company’s U.S. pension plans consists of 60% equity securities and 40% debt securities. The actual asset allocation for the U.S. pension plans as of the measurement date consists of 55% equity securities and 45% debt securities. The actual asset allocation for the Company’s foreign pension plans as of the measurement date consists of 33% equity securities, 65% debt securities, and 2% in other investments. The target asset allocation for the Company’s foreign pension plans is approximately the same as the actual asset allocation.
|
|
|
2
|
The Company’s pension plans held 0.7 million shares of Company common stock as of the measurement date, June 30, 2010, with a market value of $19 million. Cash dividends received on shares of Company common stock by these plans during the twelve-month period ended June 30, 2010, were $0.7 million.
|
Investment objectives for the Company’s plan assets are to:
|
·
|
Optimize the long-term return on plan assets at an acceptable level of risk.
|
|
·
|
Maintain a broad diversification across asset classes and among investment managers.
|
|
·
|
Maintain careful control of the risk level within each asset class.
|
Asset allocation targets promote optimal expected return and volatility characteristics given the long-term time horizon for fulfilling the obligations of the pension plans. Selection of the targeted asset allocation for plan assets was based upon a review of the expected return and risk characteristics of each asset class, as well as the correlation of returns among asset classes. The U.S. pension plans target asset allocation is also based on an asset and liability study that is updated periodically.
Investment guidelines are established with each investment manager. These guidelines provide the parameters within which the investment managers agree to operate, including criteria that determine eligible and ineligible securities, diversification requirements, and credit quality standards, where applicable. In some countries, derivatives may be used to gain market exposure in an efficient and timely manner; however, derivatives may not be used to leverage the portfolio beyond the market value of underlying investments.
Archer Daniels Midland Company
Notes to Consolidated Financial Statements (Continued)
|
Note 14.
|
Employee Benefit Plans (Continued)
|
The Company uses external consultants to assist in monitoring the investment strategy and asset mix for the Company’s plan assets. To develop the Company’s expected long-term rate of return assumption on plan assets, the Company generally uses long-term historical return information for the targeted asset mix identified in asset and liability studies. Adjustments are made to the expected long-term rate of return assumption when deemed necessary based upon revised expectations of future investment performance of the overall investment markets.
Contributions and Expected Future Benefit Payments
The Company expects to contribute $38 million to the pension plans and $7 million to the postretirement benefit plan during 2011.
The following benefit payments, which reflect expected future service, are expected to be paid:
|
Pension
Benefits
|
Postretirement Benefits
|
|||||||
|
(In millions)
|
||||||||
|
2011
|
$ | 88 | $ | 7 | ||||
|
2012
|
94 | 8 | ||||||
|
2013
|
100 | 9 | ||||||
|
2014
|
106 | 10 | ||||||
|
2015
|
112 | 11 | ||||||
|
2016 – 2020
|
664 | 67 | ||||||
|
Note 15.
|
Segment and Geographic Information
|
The Company is principally engaged in procuring, transporting, storing, processing, and merchandising agricultural commodities and products. The Company’s operations are classified into three reportable business segments: Oilseeds Processing, Corn Processing and Agricultural Services. Each of these segments is organized based upon the nature of products and services offered. The Company’s remaining operations, which include wheat processing, cocoa processing, and its financial business units, are not reportable segments, as defined by ASC Topic 280,
Segment Reporting,
and are classified as Other.
The Oilseeds Processing segment includes activities related to the origination, merchandising, crushing, and further processing of oilseeds such as soybeans, cottonseed, sunflower seeds, canola, rapeseed, peanuts, flaxseed, and palm into vegetable oils and protein meals. The Oilseeds Processing segment principally produces and markets processed oilseed products as ingredients for the food, feed, energy, and other industrial products industries. Crude vegetable oil is sold "as is" or is further processed by refining, blending, bleaching, and deodorizing into salad oils. Salad oils are sold “as is” or are further processed by hydrogenating and/or interesterifying into margarine, shortening, and other food products. Partially refined oil is used to produce biodiesel or is sold to other manufacturers for use in chemicals, paints, and other industrial products. Oilseed protein meals are principally sold to third parties to be used as ingredients in commercial livestock and poultry feeds. The Oilseeds Processing segment also produces natural health and nutrition products and other specialty food and feed ingredients. In North America, cottonseed flour is produced and sold primarily to the pharmaceutical industry and cotton cellulose pulp is manufactured and sold to the chemical, paper, and filter markets. In South America, the Oilseeds Processing segment utilizes a network of grain elevators, port facilities and transportation assets to buy, store, clean, and transport agricultural commodities and operates fertilizer blending facilities. This segment also includes the Company’s share of the results of its equity method investment in Wilmar and its Golden Peanut Company LLC, Edible Oils Limited, and Stratas Foods, LLC joint ventures.
Archer Daniels Midland Company
Notes to Consolidated Financial Statements (Continued)
|
Note 15.
|
Segment and Geographic Information (Continued)
|
The Company‘s Corn Processing segment is engaged in corn wet milling and dry milling activities, primarily in the United States, related to its production of ingredients used for use in the food and beverage industry including syrup, starch, glucose, dextrose, and sweeteners. Dextrose is also used by the Company as a feedstock for its bioproducts operations. Corn gluten feed and meal, as well as distillers grains, is produced for use as animal feed ingredients. Corn germ, a by-product of the wet milling process, is further processed as an oilseed into vegetable oil and protein meal.
By fermentation of dextrose, the Corn Processing segment produces alcohol, amino acids, and other specialty food and animal feed ingredients. Ethyl alcohol is produced by the Company to beverage grade or for industrial use as ethanol. In gasoline, ethanol increases octane and is used as an extender and oxygenate. Amino acids, such as lysine and threonine, are vital compounds used in swine feeds to produce leaner animals and in poultry feeds to enhance the speed and efficiency of poultry production. The Corn Processing segment also produces, by fermentation, astaxanthin, a product used in aquaculture to enhance flesh coloration. The Corn Processing segment produces citric and lactic acids, lactates, sorbitol, xanthan gum and glycols which are used in various food and industrial products. The Corn Processing segment includes the activities of the Company’s Brazilian sugarcane operations, propylene and ethylene glycol facility, and investments in renewable plastics. This segment also includes the Company’s share of the results of its equity method investments in Almidones Mexicanos S.A., Eaststarch C.V., and Red Star Yeast Company LLC.
The Agricultural Services segment utilizes the Company’s extensive grain elevator and transportation network to buy, store, clean, and transport agricultural commodities, such as oilseeds, corn, wheat, milo, oats, rice, and barley, and resells these commodities primarily as food and feed ingredients and as raw materials for the agricultural processing industry. Agricultural Services’ grain sourcing and transportation network provides reliable and efficient services to the Company’s agricultural processing operations and customers. Agricultural Services’ transportation network capabilities include ground, rail, river, and ocean freight services. The Agricultural Services segment also includes activities related to procuring, processing, and distributing edible beans, and the processing and distributing of formula feeds and animal health and nutrition products. In addition, the Agricultural Services segment includes the activities of Alfred C. Toepfer International, a global merchant of agricultural commodities and processed products, and the Company’s share of the results of its Kalama Export Company joint venture.
Other includes the Company’s remaining processing operations, consisting of activities related to processing agricultural commodities into food ingredient products such as wheat into wheat flour and cocoa into chocolate and cocoa products. Other also includes financial activities related to banking, captive insurance, private equity fund investments, futures commission merchant activities, and the Company’s share of the results of its equity method investment in Gruma S.A.B. de C. V.
Intersegment sales have been recorded at amounts approximating market. Operating profit for each segment is based on net sales less identifiable operating expenses, including an interest charge related to working capital usage. Also included in segment operating profit is equity in earnings of affiliates based on the equity method of accounting.
Certain Corporate items are not allocated to the Company’s reportable business segments. Corporate results include the impact of LIFO-related adjustments, the after-tax elimination of income attributable to mandatorily redeemable interests in consolidated subsidiaries, unallocated corporate expenses, and unallocated net interest costs.
Archer Daniels Midland Company
Notes to Consolidated Financial Statements (Continued)
|
Note 15.
|
Segment and Geographic Information (Continued)
|
Segment Information
|
2010
|
2009
|
2008
|
||||||||||
|
(In millions)
|
||||||||||||
|
Sales to external customers
|
|
|||||||||||
|
Oilseeds Processing
|
$ | 23,058 | $ | 24,518 | $ | 23,279 | ||||||
|
Corn Processing
|
7,942 | 7,723 | 7,137 | |||||||||
|
Agricultural Services
|
25,440 | 31,584 | 33,968 | |||||||||
|
Other
|
5,242 | 5,382 | 5,432 | |||||||||
|
Total
|
$ | 61,682 | $ | 69,207 | $ | 69,816 | ||||||
|
Intersegment sales
|
||||||||||||
|
Oilseeds Processing
|
$ | 70 | $ | 109 | $ | 535 | ||||||
|
Corn Processing
|
34 | 80 | 99 | |||||||||
|
Agricultural Services
|
2,265 | 2,767 | 2,965 | |||||||||
|
Other
|
146 | 153 | 140 | |||||||||
|
Total
|
$ | 2,515 | $ | 3,109 | $ | 3,739 | ||||||
|
Net sales
|
||||||||||||
|
Oilseeds Processing
|
$ | 23,128 | $ | 24,627 | $ | 23,814 | ||||||
|
Corn Processing
|
7,976 | 7,803 | 7,236 | |||||||||
|
Agricultural Services
|
27,705 | 34,351 | 36,933 | |||||||||
|
Other
|
5,388 | 5,535 | 5,572 | |||||||||
|
Intersegment elimination
|
(2,515 | ) | (3,109 | ) | (3,739 | ) | ||||||
|
Total
|
$ | 61,682 | $ | 69,207 | $ | 69,816 | ||||||
|
Depreciation
|
||||||||||||
|
Oilseeds Processing
|
$ | 188 | $ | 190 | $ | 202 | ||||||
|
Corn Processing
|
412 | 319 | 293 | |||||||||
|
Agricultural Services
|
112 | 96 | 92 | |||||||||
|
Other
|
116 | 101 | 114 | |||||||||
|
Corporate
|
29 | 24 | 20 | |||||||||
|
Total
|
$ | 857 | $ | 730 | $ | 721 | ||||||
|
Asset abandonments and write-downs
|
||||||||||||
|
Oilseeds Processing
|
$ | 4 | $ | 4 | $ | 28 | ||||||
|
Corn Processing
|
– | – | 2 | |||||||||
|
Other
|
5 | 9 | 2 | |||||||||
|
Total
|
$ | 9 | $ | 13 | $ | 32 | ||||||
|
Interest expense
|
||||||||||||
|
Oilseeds Processing
|
$ | 37 | $ | 89 | $ | 186 | ||||||
|
Corn Processing
|
8 | 17 | 49 | |||||||||
|
Agricultural Services
|
31 | 80 | 170 | |||||||||
|
Other
|
50 | 86 | 119 | |||||||||
|
Corporate
|
296 | 197 | (11 | ) | ||||||||
|
Total
|
$ | 422 | $ | 469 | $ | 513 | ||||||
Archer Daniels Midland Company
Notes to Consolidated Financial Statements (Continued)
|
Note 15.
|
Segment and Geographic Information (Continued)
|
|
2010
|
2009
|
2008
|
||||||||||
|
(In millions)
|
||||||||||||
|
Investment income
|
||||||||||||
|
Oilseeds Processing
|
$ | 34 | $ | 36 | $ | 24 | ||||||
|
Corn Processing
|
1 | – | – | |||||||||
|
Agricultural Services
|
26 | 29 | 48 | |||||||||
|
Other
|
52 | 79 | 136 | |||||||||
|
Corporate
|
13 | 37 | 61 | |||||||||
|
Total
|
$ | 126 | $ | 181 | $ | 269 | ||||||
|
Equity in earnings of affiliates
|
||||||||||||
|
Oilseeds Processing
|
$ | 305 | $ | 283 | $ | 156 | ||||||
|
Corn Processing
|
78 | 44 | 53 | |||||||||
|
Agricultural Services
|
76 | 76 | 105 | |||||||||
|
Other
|
86 | (253 | ) | 113 | ||||||||
|
Corporate
|
16 | (5 | ) | (12 | ) | |||||||
|
Total
|
$ | 561 | $ | 145 | $ | 415 | ||||||
|
Operating profit
|
||||||||||||
|
Oilseeds Processing
|
$ | 1,400 | $ | 1,280 | $ | 1,040 | ||||||
|
Corn Processing
|
722 | 185 | 961 | |||||||||
|
Agricultural Services
|
668 | 994 | 1,017 | |||||||||
|
Other
|
449 | (6 | ) | 423 | ||||||||
|
Total operating profit
|
3,239 | 2,453 | 3,441 | |||||||||
|
Corporate
|
(654 | ) | 47 | (847 | ) | |||||||
|
Earnings before income taxes
|
$ | 2,585 | $ | 2,500 | $ | 2,594 | ||||||
|
Investments in and advances to affiliates
|
||||||||||||
|
Oilseeds Processing
|
$ | 1,563 | $ | 1,202 | ||||||||
|
Corn Processing
|
361 | 402 | ||||||||||
|
Agricultural Services
|
224 | 201 | ||||||||||
|
Other
|
302 | 256 | ||||||||||
|
Corporate
|
349 | 398 | ||||||||||
|
Total
|
$ | 2,799 | $ | 2,459 | ||||||||
|
Identifiable assets
|
||||||||||||
|
Oilseeds Processing
|
$ | 9,616 | $ | 10,266 | ||||||||
|
Corn Processing
|
6,822 | 6,333 | ||||||||||
|
Agricultural Services
|
5,630 | 5,657 | ||||||||||
|
Other
|
7,700 | 7,965 | ||||||||||
|
Corporate
|
1,780 | 1,361 | ||||||||||
|
Total
|
$ | 31,548 | $ | 31,582 | ||||||||
Archer Daniels Midland Company
Notes to Consolidated Financial Statements (Continued)
|
Note 15.
|
Segment and Geographic Information (Continued)
|
|
2010
|
2009
|
|||||||
|
(In millions)
|
||||||||
|
Gross additions to property, plant, and equipment
|
||||||||
|
Oilseeds Processing
|
$ | 349 | $ | 258 | ||||
|
Corn Processing
|
915 | 1,018 | ||||||
|
Agricultural Services
|
320 | 254 | ||||||
|
Other
|
149 | 471 | ||||||
|
Corporate
|
55 | 58 | ||||||
|
Total
|
$ | 1,788 | $ | 2,059 | ||||
Geographic information: The following geographic area data include net sales and other operating income attributed to the countries based on the location of the subsidiary making the sale and long-lived assets based on physical location. Long-lived assets represent the sum of the net book value of property, plant, and equipment plus goodwill related to consolidated businesses.
|
2010
|
2009
|
2008
|
||||||||||
|
(In millions)
|
||||||||||||
|
Net sales and other operating income
|
||||||||||||
|
United States
|
$ | 33,362 | $ | 35,485 | $ | 37,466 | ||||||
|
Germany
|
6,424 | 7,431 | 8,335 | |||||||||
|
Other Foreign
|
21,896 | 26,291 | 24,015 | |||||||||
| $ | 61,682 | $ | 69,207 | $ | 69,816 | |||||||
|
Long-lived assets
|
||||||||||||
|
United States
|
$ | 6,964 | $ | 6,452 | ||||||||
|
Foreign
|
2,010 | 1,754 | ||||||||||
| $ | 8,974 | $ | 8,206 | |||||||||
|
Note 16.
|
Guarantees and Commitments
|
The Company has entered into agreements, primarily debt guarantee agreements related to equity-method investees, which could obligate the Company to make future payments if the primary entity fails to perform its contractual obligations. The Company has not recorded a liability for payment of these contingent obligations, as the Company believes the fair value of these contingent obligations is immaterial. The Company has collateral for a portion of these contingent obligations. These contingent obligations totaled $131 million at June 30, 2010. Amounts outstanding for the primary entity under these contingent obligations were $74 million at June 30, 2010.
Archer Daniels Midland Company
Notes to Consolidated Financial Statements (Continued)
|
Note 17.
|
Quarterly Financial Data (Unaudited)
|
|
Quarter
|
||||||||||||||||||||
|
First
|
Second
|
Third
|
Fourth
|
Year
|
||||||||||||||||
|
(In millions, except per share amounts)
|
||||||||||||||||||||
|
Fiscal 2010
|
||||||||||||||||||||
|
Net Sales
|
$ | 14,921 | $ | 15,913 | $ | 15,145 | $ | 15,703 | $ | 61,682 | ||||||||||
|
Gross Profit
|
973 | 1,053 | 891 | 926 | 3,843 | |||||||||||||||
|
Net Earnings Attributable to
Controlling Interests
|
496 | 567 | 421 | 446 | 1,930 | |||||||||||||||
|
Basic Earnings Per
Common Share
|
0.77 | 0.88 | 0.65 | 0.70 | 3.00 | |||||||||||||||
|
Diluted Earnings Per
Common Share
|
0.77 | 0.88 | 0.65 | 0.69 | 3.00 | |||||||||||||||
|
Fiscal 2009
|
||||||||||||||||||||
|
Net Sales
|
$ | 21,160 | $ | 16,673 | $ | 14,842 | $ | 16,532 | $ | 69,207 | ||||||||||
|
Gross Profit
|
1,867 | 1,212 | 649 | 361 | 4,089 | |||||||||||||||
|
Net Earnings Attributable to
Controlling Interests
|
1,045 | 578 | 3 | 58 | 1,684 | |||||||||||||||
|
Basic Earnings Per
Common Share
|
1.62 | 0.90 | 0.00 | 0.09 | 2.62 | |||||||||||||||
|
Diluted Earnings Per
Common Share
|
1.62 | 0.90 | 0.00 | 0.09 | 2.62 | |||||||||||||||
Net earnings attributable to controlling interests for the first, second, third and fourth quarters of fiscal year 2010 includes after-tax start up costs for the Company’s new greenfield plants of $6 million, $20 million, $18 million, and $24 million (equal to $.01, $.03, $.03, and $.04 per share) respectively. Net earnings attributable to controlling interests for the third quarter ended March 31, 2010 include charges to other (income) expense - net of $75 million ($47 million after tax, equal to $0.07 per share) related to loss on extinguishment of debt resulting from the repurchase of $500 million in aggregate principal amount of the Company’s outstanding debentures. Net earnings attributable to controlling interests for the fourth quarter ended June 30, 2010 include charges to other (income) expense - net of $59 million ($37 million after tax, equal to $0.06 per share) related to losses on interest rate swaps as discussed in Note 4.
Net earnings attributable to controlling interests for the second quarter ended December 31, 2008, third quarter ended March 31, 2009, and fourth quarter and year ended June 30, 2009 include charges to other (income) expense - net of $51 million ($32 million after tax, equal to $0.05 per share), $212 million ($132 million after tax, equal to $0.21 per share), $12 million ($7 million after tax, equal to $0.01 per share) and $275 million ($171 million after tax equal to $0.27 per share), respectively, related to currency derivative losses of the Company’s equity investee, Gruma S.A.B. de C.V. Net earnings attributable to controlling interests for the third quarter ended March 31, 2009, and fourth quarter and year ended June 30, 2009 include income tax charges of $97 million or $0.15 per share, $61 million or $0.09 per share, and $158 million or $0.24 per share, respectively, resulting from the reorganization of the holding company structure in which the Company holds a portion of its equity investment in Wilmar.
Report of Independent Registered Public Accounting Firm
The Board of Directors and Shareholders
Archer Daniels Midland Company
Decatur, Illinois
We have audited the accompanying consolidated balance sheets of Archer Daniels Midland Company (the Company) as of June 30, 2010 and 2009, and the related consolidated statements of earnings, shareholders’ equity, and cash flows for each of the three years in the period ended June 30, 2010. Our audits also included the financial statement schedule listed in the Index at Item 15(a)(2). These financial statements and schedule are the responsibility of the Company’s management. Our responsibility is to express an opinion on these financial statements and schedule based on our audits.
We conducted our audits in accordance with the standards of the Public Company Accounting Oversight Board (United States). Those standards require that we plan and perform the audit to obtain reasonable assurance about whether the financial statements are free of material misstatement. An audit includes examining, on a test basis, evidence supporting the amounts and disclosures in the financial statements. An audit also includes assessing the accounting principles used and significant estimates made by management, as well as evaluating the overall financial statement presentation. We believe that our audits provide a reasonable basis for our opinion.
In our opinion, the financial statements referred to above present fairly, in all material respects, the consolidated financial position of Archer Daniels Midland Company at June 30, 2010 and 2009, and the consolidated results of its operations and its cash flows for each of the three years in the period ended June 30, 2010, in conformity with U.S. generally accepted accounting principles. Also, in our opinion, the related financial statement schedule, when considered in relation to the basic financial statements taken as a whole, presents fairly in all material respects the information set forth therein.
We also have audited, in accordance with the standards of the Public Company Accounting Oversight Board (United States), Archer Daniels Midland Company’s internal control over financial reporting as of June 30, 2010, based on criteria established in Internal Control—Integrated Framework issued by the Committee of Sponsoring Organizations of the Treadway Commission and our report dated August 27, 2010, expressed an unqualified opinion thereon.
/s/ Ernst & Young LLP
St. Louis, Missouri
August 27, 2010
Report of Independent Registered Public Accounting Firm
The Board of Directors and Shareholders
Archer Daniels Midland Company
Decatur, Illinois
We have audited Archer Daniels Midland Company’s internal control over financial reporting as of June 30, 2010, based on criteria established in Internal Control—Integrated Framework issued by the Committee of Sponsoring Organizations of the Treadway Commission (the COSO criteria). Archer Daniels Midland Company’s management is responsible for maintaining effective internal control over financial reporting, and for its assessment of the effectiveness of internal control over financial reporting included in the accompanying Management’s Report on Internal Control Over Financial Reporting. Our responsibility is to express an opinion on the company’s internal control over financial reporting based on our audit.
We conducted our audit in accordance with the standards of the Public Company Accounting Oversight Board (United States). Those standards require that we plan and perform the audit to obtain reasonable assurance about whether effective internal control over financial reporting was maintained in all material respects. Our audit included obtaining an understanding of internal control over financial reporting, assessing the risk that a material weakness exists, testing and evaluating the design and operating effectiveness of internal control based on the assessed risk, and performing such other procedures as we considered necessary in the circumstances. We believe that our audit provides a reasonable basis for our opinion.
A company’s internal control over financial reporting is a process designed to provide reasonable assurance regarding the reliability of financial reporting and the preparation of financial statements for external purposes in accordance with generally accepted accounting principles. A company’s internal control over financial reporting includes those policies and procedures that (1) pertain to the maintenance of records that, in reasonable detail, accurately and fairly reflect the transactions and dispositions of the assets of the company; (2) provide reasonable assurance that transactions are recorded as necessary to permit preparation of financial statements in accordance with generally accepted accounting principles, and that receipts and expenditures of the company are being made only in accordance with authorizations of management and directors of the company; and (3) provide reasonable assurance regarding prevention or timely detection of unauthorized acquisition, use, or disposition of the company’s assets that could have a material effect on the financial statements.
Because of its inherent limitations, internal control over financial reporting may not prevent or detect misstatements. Also, projections of any evaluation of effectiveness to future periods are subject to the risk that controls may become inadequate because of changes in conditions, or that the degree of compliance with the policies or procedures may deteriorate.
In our opinion, Archer Daniels Midland Company maintained, in all material respects, effective internal control over financial reporting as of June 30, 2010, based on the COSO criteria.
We also have audited, in accordance with the standards of the Public Company Accounting Oversight Board (United States), the consolidated balance sheets of Archer Daniels Midland Company as of June 30, 2010 and 2009, and the related consolidated statements of earnings, shareholders’ equity, and cash flows for each of the three years in the period ended June 30, 2010, of Archer Daniels Midland Company and our report dated August 27, 2010, expressed an unqualified opinion thereon.
/s/ Ernst & Young LLP
St. Louis, Missouri
August 27, 2010
|
Item 9.
|
CHANGES IN AND DISAGREEMENTS WITH ACCOUNTANTS ON ACCOUNTING AND FINANCIAL DISCLOSURE
|
None.
|
Item 9A.
|
CONTROLS AND PROCEDURES
|
As of June 30, 2010, an evaluation was performed under the supervision and with the participation of the Company’s management, including the Chief Executive Officer and Chief Financial Officer, of the effectiveness of the design and operation of the Company’s “disclosure controls and procedures” (as defined in Rules 13a-15(e) and 15d-15(e) under the Securities Exchange Act of 1934 (the Exchange Act)). Based on that evaluation, the Company’s management, including the Chief Executive Officer and Chief Financial Officer, concluded the Company’s disclosure controls and procedures were effective to ensure that information required to be disclosed by the Company in reports that it files or submits under the Exchange Act is (i) recorded, processed, summarized and reported within the time periods specified in Securities and Exchange Commission rules and forms and (ii) accumulated and communicated to the CEO and CFO to allow timely decisions regarding required disclosure. There was no change in the Company’s internal controls over financial reporting during the Company’s most recently completed fiscal quarter that has materially affected, or is reasonably likely to materially affect, the Company’s internal controls over financial reporting.
MANAGEMENT’S REPORT ON INTERNAL CONTROL OVER FINANCIAL REPORTING
Archer Daniels Midland Company’s (“ADM’s”) management is responsible for establishing and maintaining adequate internal control over financial reporting, as such term is defined in Exchange Act Rules 13a-15(f). ADM’s internal control system is designed to provide reasonable assurance regarding the reliability of financial reporting and the preparation of financial statements in accordance with generally accepted accounting principles.
Under the supervision and with the participation of management, including its principal executive officer and principal financial officer, ADM’s management assessed the design and operating effectiveness of internal control over financial reporting as of June 30, 2010 based on the framework set forth in
Internal Control-Integrated Framework
issued by the Committee of Sponsoring Organizations of the Treadway Commission.
Based on this assessment, management concluded that ADM’s internal control over financial reporting was effective as of June 30, 2010. Ernst & Young LLP, an independent registered public accounting firm, has issued an attestation report on the Company’s internal control over financial reporting as of June 30, 2010. That report is included herein.
|
/s/ Patricia A. Woertz
|
/s/ Steven R. Mills
|
|
Patricia A. Woertz
|
Steven R. Mills
|
|
Chairman, Chief Executive Officer
|
Executive Vice President &
|
|
and President
|
Chief Financial Officer
|
|
Item 9B.
|
OTHER INFORMATION
|
None.
|
Item 10.
|
DIRECTORS, EXECUTIVE OFFICERS AND CORPORATE GOVERNANCE
|
Information with respect to directors, executive officers, code of conduct, audit committee and audit committee financial experts of the Company, and Section 16(a) beneficial ownership reporting compliance is set forth in “Proposal No. 1 - Election of Directors for a One-Year Term,” “Director Experiences, Qualifications, Attributes and Skills, and Board Diversity,” “Code of Conduct,” “Information Concerning Committees and Meetings – Audit Committee,” “Report of the Audit Committee,” and “Section 16(a) Beneficial Ownership Reporting Compliance,” of the definitive proxy statement for the Company’s annual meeting of stockholders to be held on November 4, 2010 and is incorporated herein by reference.
Information with respect to executive officers and certain significant employees of the Company is set forth below. Except as otherwise indicated, all positions are with the Company.
|
Name
|
Title
|
Age
|
|
|
Ronald S. Bandler
|
Assistant Treasurer since January 1998.
|
49
|
|
|
Michael R. Baroni
|
Vice President of the Company and President Corn business unit since September 2009. President, Specialty Food Ingredients from November 2006 to September 2009. Vice President, Protein and Food Additives from September 2001 to November 2006.
|
55
|
|
|
Mark A. Bemis
|
Vice President of the Company since February 2005. President, Cocoa, Milling and Other business unit since September 2009. President of ADM Cocoa from September 2001 to September 2009.
|
49
|
|
|
Mark J. Cheviron
|
Vice President of the Company since July 1997. Vice President of Security and Corporate Services since May 1997.
|
61
|
|
|
Michael D’Ambrose
|
Senior Vice President - Human Resources since October 2006. Independent human resources consultant from 2005 to October 2006. Executive Vice President, Human Resources at First Data from 2003 to 2005.
|
53
|
|
|
Stuart E. Funderburg
|
Assistant Secretary and Assistant General Counsel since November 2008. Corporate Counsel from October 2001 to November 2008.
|
46
|
|
|
Shannon Herzfeld
|
Vice President of the Company since February 2005, with responsibility for the Company’s Government Affairs function. Senior Vice President-International Affairs with Pharmaceutical Research and Manufacturers of America (PhRMA) trade association from January 1998 to December 2004.
|
58
|
|
|
Item 10.
|
DIRECTORS, EXECUTIVE OFFICERS AND CORPORATE GOVERNANCE (Continued)
|
|
Kevin L. Hess
|
Vice President of the Company since November 2008, with responsibility for the Company’s Oilseeds Processing production operations.
Vice President and Director-Group Operations Oilseed Processing division from December 2005 to November 2008. Vice President-European Crushing and Refining Operations from March 2003 to December 2005.
|
50
|
|
|
Craig E. Huss
|
Vice President of the Company since January 2001. President, Agricultural Services business unit since September 2009. President of ADM Transportation from 1999 to September 2009.
|
58
|
|
|
Matthew J. Jansen
|
Vice President of the Company since January 2003. President, Oilseeds business unit since February 2010. President, Grain Operations from August 2006 to February 2010. President, South American Oilseed Processing Division from April 2000 to August 2006.
|
44
|
|
|
Randall Kampfe
|
Vice President of the Company since November 2008, with responsibility for the Company’s Corn
Processing production operations. Vice President-Corn
Processing
Operations from March 1999 to November 2008.
|
63
|
|
|
Domingo A. Lastra
|
Vice President of the Company since September 2009. President, South American Operations since August 2006. Director-Origination, Ports, Logistics and Fertilizer for South America from November 2003 to August 2006.
|
42
|
|
|
Michael Lusk
|
Vice President of the Company since November 1999, with responsibility for the Company’s Captive Insurance operations.
|
61
|
|
|
Vikram Luthar
|
Vice President and Treasurer of the Company since November 2004.
|
43
|
|
|
Steven R. Mills
|
Executive Vice President and Chief Financial Officer since March 2008. Senior
Vice President of the Company from December 2006 to February 2008. Group
Vice President and Controller of the Company from January 2002 to
December 2006.
|
55
|
|
|
Victoria Podesta
|
Vice President of the Company since May 2007 with responsibility for the Company’s Corporate Communications function. Corporate communications consultant for various global companies from 1989 to May 2007.
|
54
|
|
Item 10.
|
DIRECTORS, EXECUTIVE OFFICERS AND CORPORATE GOVERNANCE (Continued)
|
|
John D. Rice
|
Executive Vice President - Commercial and Production since February 2005. Senior Vice President from February 2000 to February 2005.
|
56
|
|
|
Dennis C. Riddle
|
Vice President of the Company since May 2006. President ADM Corn Processing Division since June 2005.
|
63
|
|
|
Scott A. Roberts
|
Assistant Secretary and Assistant General Counsel from July 1997.
|
50
|
|
|
Ismael Roig
|
Vice President of the Company since December 2004. Vice President and Executive Director, Asia-Pacific since July 2010. Vice President Planning & Business Development from December 2004 to July 2010.
|
43
|
|
|
Scott A. Roney
|
Vice President of the Company since April 2001, with responsibility for the Company’s Office of Compliance and Ethics.
|
46
|
|
|
Marc A. Sanner
|
Vice President and General Auditor of the Company since November 2008. Assistant Controller from January 2003 to November 2008. Finance Director – Europe from 2005 to 2006.
|
57
|
|
|
David J. Smith
|
Executive Vice President, Secretary and General Counsel since January 2003.
|
55
|
|
|
John P. Stott
|
Vice President and Controller of the Company since December 2006. Operations Controller from July 2005 to December 2006. Finance Director-Europe from January 2001 to July 2005.
|
43
|
|
|
Joseph D. Taets
|
Vice President of the Company and Vice President – ADM Grain since September 2009, Managing Director, European Oilseeds from September 2007 to September 2009. President of ADM European Oilseed Processing from February 2003 to September 2007.
|
44
|
|
|
Gary L. Towne
|
Vice President of the Company and Chairman of the Management Board of Alfred C. Toepfer International since September 2009. Manager Global Risk from August 2007 to September 2009. Vice President, Corn Processing from July 2000 to August 2007.
|
55
|
|
|
Patricia A. Woertz
|
Chairman of the Board of Directors since February 2007. Chief Executive Officer & President of the Company since May 2006. Executive Vice President Downstream at Chevron Corporation from October 2001 to March 2006.
|
57
|
|
Officers of the Company are elected by the Board of Directors for terms of one year and until their successors are duly elected and qualified.
|
|
Item 11.
|
EXECUTIVE COMPENSATION
|
Information responsive to this Item is set forth in “Compensation Discussion and Analysis,” “Compensation/Succession Committee Report,” “Compensation/Succession Committee Interlocks and Insider Participation,” “Summary Compensation Table,” “Grants of Plan-Based Awards During Fiscal 2010,” “Outstanding Equity Awards at Fiscal 2010 Year-End,” “Option Exercises and Stock Vested During Fiscal 2010,” “Pension Benefits,” “Nonqualified Deferred Compensation,” “Termination of Employment and Change-in-Control Arrangements” and “Director Compensation for Fiscal 2010” of the definitive proxy statement for the Company’s annual meeting of stockholders to be held on November 4, 2010, and is incorporated herein by reference.
|
Item 12.
|
SECURITY OWNERSHIP OF CERTAIN BENEFICIAL OWNERS AND MANAGEMENT AND RELATED STOCKHOLDER MATTERS
|
Information responsive to this Item is set forth in “Principal Holders of Voting Securities,” “Proposal No. 1 - Election of Directors for a One-year Term,” “Executive Officer Stock Ownership,” and “Equity Compensation Plan Information” of the definitive proxy statement for the Company’s annual meeting of stockholders to be held on November 4, 2010, and is incorporated herein by reference.
|
Item 13.
|
CERTAIN RELATIONSHIPS AND RELATED TRANSACTIONS, AND DIRECTOR INDEPENDENCE
|
Information responsive to this Item is set forth in “Certain Relationships and Related Transactions,” “Review and Approval of Certain Relationships and Related Transactions,” and “Independence of Directors” of the definitive proxy statement for the Company’s annual meeting of stockholders to be held on November 4, 2010, and is incorporated herein by reference.
|
Item 14.
|
PRINCIPAL ACCOUNTING FEES AND SERVICES
|
Information responsive to this Item is set forth in “Fees Paid to Independent Auditors” and “Audit Committee Pre-Approval Policies” of the definitive proxy statement for the Company’s annual meeting of stockholders to be held on November 4, 2010, and is incorporated herein by reference.
|
Item 15.
|
EXHIBITS AND FINANCIAL STATEMENT SCHEDULES
|
|
(a)(1)
|
See Item 8, “Financial Statements and Supplementary Data,” for a list of financial statements.
|
|
(a)(2)
|
Financial statement schedules
|
|
SCHEDULE II - VALUATION AND QUALIFYING ACCOUNTS AND RESERVES
|
||||||||||||||||||||
|
Balance at
|
Balance at
|
|||||||||||||||||||
|
Beginning
|
End
|
|||||||||||||||||||
|
of Year
|
Additions
|
Deductions
(1)
|
Other
(2)
|
of Year
|
||||||||||||||||
|
(In millions)
|
||||||||||||||||||||
|
Allowance for doubtful accounts
|
||||||||||||||||||||
|
2008
|
$ | 69 | 7 | (6 | ) | 19 | $ | 89 | ||||||||||||
|
2009
|
$ | 89 | 21 | (6 | ) | (1 | ) | $ | 103 | |||||||||||
|
2010
|
$ | 103 | 2 | – | (8 | ) | $ | 97 | ||||||||||||
|
(1)
Uncollectible accounts written off, net of recoveries
|
||||||||||||||||||||
|
(2)
Impact of reclassifications, business combinations, and foreign currency exchange adjustments
|
||||||||||||||||||||
|
All other schedules are either not required, not applicable, or the information is otherwise included.
|
|
(a)(3)
|
List of exhibits
|
|
(3)
|
(i)
|
Composite Certificate of Incorporation, as amended, filed on November 13, 2001, as Exhibit (3)(i) to Form 10-Q for the quarter ended September 30, 2001 (File No. 1-44), is incorporated herein by reference.
|
|
(ii)
|
Bylaws, as amended, filed on August 12, 2009, as Exhibit 3(ii) to Form 8-K (File No. 1-44), are incorporated herein by reference.
|
|
Item 15.
|
EXHIBITS AND FINANCIAL STATEMENT SCHEDULES (Continued)
|
|
(4)
|
Instruments defining the rights of security holders, including:
|
|
(i)
|
Indenture dated June 1, 1986, between the registrant and JPMorgan Chase (formerly known as, or successor to, The Chase Manhattan Bank, Chemical Bank, and Manufacturers Hanover Trust Company), as Trustee (incorporated by reference to Exhibit 4(a) to Registration Statement No. 33-6721), and Supplemental Indenture dated as of August 1, 1989 between the registrant and JPMorgan Chase (formerly known as, or successor to, The Chase Manhattan Bank, Chemical Bank and Manufacturers Hanover Trust Company), as Trustee (incorporated by reference to Exhibit 4(c) to Post-Effective Amendment No. 3 to Registration Statement No. 33-6721), relating to:
the $300,000,000 – 8 7/8% Debentures due April 15, 2011,
the $300,000,000 – 8 3/8% Debentures due April 15, 2017,
the $300,000,000 – 8 1/8% Debentures due June 1, 2012,
the $250,000,000 – 7 1/8% Debentures due March 1, 2013,
the $350,000,000 – 7 1/2% Debentures due March 15, 2027,
the $200,000,000 – 6 3/4% Debentures due December 15, 2027,
the $250,000,000 – 6 7/8% Debentures due December 15, 2097,
the $196,210,000 – 5 7/8% Debentures due November 15, 2010,
the $300,000,000 – 6 5/8% Debentures due May 1, 2029,
the $400,000,000 – 7% Debentures due February 1, 2031,
the $500,000,000 – 5.935% Debentures due October 1, 2032, and
the $600,000,000 – 5.375% Debentures due September 15, 2035.
|
|
|
(ii)
|
Indenture dated September 20, 2006, between the Company and The Bank of New York (formerly known as, or successor to, JPMorgan Chase Bank, N.A.), as Trustee (incorporated by reference to Exhibit 4 to Registration Statement on Form S-3, Registration No. 333-137541), and Supplemental Indenture dated as of June 3, 2008 between the registrant and The Bank of New York (incorporated by reference to Exhibit 4.6 to Form 8-K (File No. 1-44) filed on June 3, 2008), relating to:
the $500,000,000 – 6.45% Debentures due January 15, 2038,
the $700,000,000 – 5.45% Notes due March 15, 2015, and
the $1,750,000,000 – 4.70% Debentures due June 1, 2041.
|
|
|
(iii)
|
Indenture dated February 22, 2007, between the Company and The Bank of New York, as Trustee, including form of 0.875% Convertible Senior Notes due 2014 (incorporated by reference to Exhibit 4.1 to Form 8-K (File No. 1-44) filed on February 22, 2007).
|
|
|
(iv)
|
Registration Rights Agreement, dated February 22, 2007, among the Company, Citigroup Global Markets Inc., J.P. Morgan Securities Inc., Merrill Lynch, Pierce, Fenner & Smith Incorporated, Banc of America Securities LLC, Barclays Capital Inc., BNP Paribas Securities Corp., Deutsche Bank Securities Inc., Goldman, Sachs & Co. and HSBC Securities (USA) Inc. (incorporated by reference to Exhibit 4.2 to Form 8-K (File No. 1-44) filed on February 22, 2007).
|
|
Copies of constituent instruments defining rights of holders of long-term debt of the Company and Subsidiaries, other than the Indentures specified herein, are not filed herewith, pursuant to Instruction (b)(4)(iii)(A) to Item 601 of Regulation S-K, because the total amount of securities authorized under any such instrument does not exceed 10% of the total assets of the Company and Subsidiaries on a consolidated basis. The Registrant hereby agrees that it will, upon request by the SEC, furnish to the SEC a copy of each such instrument.
|
|
Item 15.
|
EXHIBITS AND FINANCIAL STATEMENT SCHEDULES (Continued)
|
|
(v)
|
Purchase Contract and Pledge Agreement, dated as of June 3, 2008, among ADM, The Bank of New York as Purchase Contract Agent, and the Bank of New York as Collateral Agent, Custodial Agent, and Securities Intermediary, including form of Corporate Units, form of Treasury Units and form of Remarketing Agreement (incorporated by reference to Exhibit 4.1 to Form 8-K (File No. 1-44) filed on June 3, 2008.
|
|
(10)
|
Material Contracts - Copies of the Company’s equity compensation plans and deferred compensation plans, pursuant to Instruction (b)(10)(iii)(A) to Item 601 of Regulation S-K, each of which is a management contract or compensation plan or arrangement required to be filed as an exhibit pursuant to Item 15(b) of Form 10-K, are incorporated herein by reference as follows:
|
|
(i)
|
Exhibit 4(c) to Registration Statement No. 33-49409 on Form S-8 dated March 15, 1993, relating to the Archer Daniels Midland 1991 Incentive Stock Option Plan.
|
|
(ii)
|
The Archer-Daniels-Midland 1996 Stock Option Plan (incorporated by reference to Exhibit A to the Company’s Definitive Proxy Statement filed with the Securities and Exchange Commission on September 25, 1996 (File No. 1-44)).
|
|
(iii)
|
The Archer-Daniels-Midland Company Deferred Compensation Plan for Selected Management Employees I, as amended.
|
|
(iv)
|
The Archer-Daniels-Midland Company Deferred Compensation Plan for Selected Management Employees II, as amended.
|
|
(v)
|
The Archer-Daniels-Midland Company Incentive Compensation Plan (incorporated by reference to Exhibit A to the Company’s Definitive Proxy Statement filed with the Securities and Exchange Commission on September 15, 1999 (File No. 1-44)).
|
|
(vi)
|
The Archer-Daniels-Midland Company Supplemental Retirement Plan, as amended.
|
|
(vii)
|
The Archer-Daniels-Midland Company Amended and Restated Stock Unit Plan for Nonemployee Directors, as amended.
|
|
(viii)
|
The Archer-Daniels-Midland 2002 Incentive Compensation Plan (incorporated by reference to Exhibit A to the Company’s Definitive Proxy Statement filed with the Securities and Exchange Commission on September 25, 2002 (File No. 1-44)).
|
|
(ix)
|
Management Compensation Arrangements (incorporated by reference to Exhibit 10.1 to the Company’s Quarterly Report on Form 10-Q for the quarter ended March 31, 2005 (File No. 1-44)).
|
|
(x)
|
Form of Stock Option Agreement (incorporated by reference to Exhibit 10.2 to the Company’s Quarterly Report on Form 10-Q for the quarter ended March 31, 2005 (File No. 1-44)).
|
|
(xi)
|
Form of Restricted Stock Agreement (incorporated by reference to Exhibit 10.3 to the Company’s Quarterly Report on Form 10-Q for the quarter ended March 31, 2005 (File No. 1-44)).
|
|
(xii)
|
Form of Performance Share Unit Award Agreement.
|
|
Item 15.
|
EXHIBITS AND FINANCIAL STATEMENT SCHEDULES (Continued)
|
|
(xiii)
|
Form of Restricted Stock Unit Award Agreement.
|
|
(xiv)
|
Agreement Regarding Terms of Employment dated April 27, 2006 with Patricia A. Woertz, filed on May 1, 2006, as Exhibit 10.1 to the Company’s Current Report on Form 8-K (File No. 1-44).
|
|
(xv)
|
The Archer-Daniels-Midland Company 2009 Incentive Compensation Plan (incorporated by reference to Exhibit A to the Company’s Definitive Proxy Statement (File No. 1-44) filed on September 25, 2009).
|
|
(xvi)
|
Annual Cash Incentive Program (incorporated by reference to description thereof included in Item 5.02 of the Company’s Current Report on Form 8-K (File No. 1-44) filed on July 3, 2007).
|
|
(21)
|
Subsidiaries of the registrant.
|
|
(23)
|
Consent of independent registered public accounting firm.
|
|
(24)
|
Powers of attorney.
|
|
(31.1)
|
Certification of Chief Executive Officer pursuant to Rule 13a–14(a) and Rule 15d–14(a) of the Securities Exchange Act, as amended.
|
|
(31.2)
|
Certification of Chief Financial Officer pursuant to Rule 13a–14(a) and Rule 15d–14(a) of the Securities Exchange Act, as amended.
|
|
(32.1)
|
Certification of Chief Executive Officer pursuant to 18 U.S.C. 1350, as adopted pursuant to Section 906 of the Sarbanes-Oxley Act of 2002.
|
|
(32.2)
|
Certification of Chief Financial Officer pursuant to 18 U.S.C. 1350, as adopted pursuant to Section 906 of the Sarbanes-Oxley Act of 2002.
|
|
(101)
|
Interactive Data File.
|
SIGNATURES
Pursuant to the requirements of Section 13 or 15(d) of the Securities Exchange Act of 1934, the Registrant has duly caused this report to be signed on its behalf by the undersigned, thereunto duly authorized.
Date: August 27, 2010
ARCHER-DANIELS-MIDLAND COMPANY
By: /s/ D. J. Smith
D. J. Smith
Executive Vice President, Secretary
and General Counsel
Pursuant to the requirements of the Securities Exchange Act of 1934, this report has been signed below on
August 27, 2010, by the following persons on behalf of the Registrant and in the capacities indicated.
|
/s/ P. A. Woertz
|
/s/ D. E. Felsinger
|
|
P. A. Woertz,
|
D. E. Felsinger *,
|
|
Chairman, Chief Executive Officer, President
and Director
|
Director
|
|
(Principal Executive Officer)
|
|
|
/s/ V. F. Haynes
|
|
|
/s/ S. R. Mills
|
V. F. Haynes *,
|
|
S. R. Mills
|
Director
|
|
Executive Vice President and
|
|
|
Chief Financial Officer
|
/s/ A. Maciel
|
|
(Principal Financial Officer)
|
A. Maciel*,
|
|
Director
|
|
|
/s/ J. P. Stott
|
|
|
J. P. Stott
|
/s/ P. J. Moore
|
|
Vice President and Controller
|
P. J. Moore*,
|
|
(Controller)
|
Director
|
|
/s/ G. W. Buckley
|
/s/ T. F. O’Neill
|
|
G. W. Buckley*,
|
T. F. O’Neill*,
|
|
Director
|
Director
|
|
/s/ M. H. Carter
|
/s/ K. R. Westbrook
|
|
M. H. Carter*,
|
K. R. Westbrook*,
|
|
Director
|
Director
|
|
/s/ P. Dufour
|
/s/ D. J. Smith
|
|
P. Dufour *,
|
Attorney-in-Fact
|
|
Director
|
|
*Powers of Attorney authorizing S. R. Mills, J. P. Stott, and D. J. Smith, and each of them, to sign the Form 10-K on behalf of the above-named officers and directors of the Company, copies of which are being filed with the Securities and Exchange Commission.
TABLE OF CONTENTS
Part IItem 1. BusinessItem 1. Business (continued)Item 1A. Risk FactorsItem 1A. Risk Factors (continued)Item 1B. Unresolved Staff CommentsItem 2. PropertiesItem 2. Properties (continued)Item 3. Legal ProceedingsItem 4. ReservedPart IIItem 5. Market For Registrant S Common Equity, Related Stockholder Matters, and Issuer Purchases Of Equity SecuritiesItem 5. Market For Registrant S Common Equity, Related Stockholder Matters, and Issuer Purchases Of Equity Securities (continued)Item 6. Selected Financial DataItem 7. Management S Discussion and Analysis Of Financial Condition and Results Of OperationsItem 7. Management S Discussion and Analysis Of Financial Condition and Results Of Operations (continued)Item 7A. Quantitative and Qualitative Disclosures About Market RiskItem 7A. Quantitative and Qualitative Disclosures About Market Risk (continued)Item 8. Financial Statements and Supplementary DataNote 1. Summary Of Significant Accounting PoliciesNote 1. Summary Of Significant Accounting Policies (continued)Note 2. AcquisitionsNote 3. Fair Value MeasurementsNote 3. Fair Value Measurements (continued)Note 4. Inventories, Derivative Instruments & Hedging ActivitiesNote 4. Inventories, Derivative Instruments & Hedging Activities (continued)Note 5. Marketable Securities and Cash EquivalentsNote 5. Marketable Securities and Cash Equivalents (continued)Note 6. Investments in and Advances To AffiliatesNote 6. Investments in and Advances To Affiliates (continued)Note 7. GoodwillNote 8. Debt and Financing ArrangementsNote 8. Debt and Financing Arrangements (continued)Note 9. Shareholders EquityNote 9. Shareholders Equity (continued)Note 10. Accumulated Other Comprehensive Income (loss)Note 11. Other (income) Expense NetNote 12. Income TaxesNote 12. Income Taxes (continued)Note 13. LeasesNote 14. Employee Benefit PlansNote 14. Employee Benefit Plans (continued)Note 15. Segment and Geographic InformationNote 15. Segment and Geographic Information (continued)Note 16. Guarantees and CommitmentsNote 17. Quarterly Financial Data (unaudited)Item 9. Changes in and Disagreements with Accountants on Accounting and Financial DisclosureItem 9A. Controls and ProceduresItem 9B. Other InformationPart IIIItem 10. Directors, Executive Officers and Corporate GovernanceItem 10. Directors, Executive Officers and Corporate Governance (continued)Item 11. Executive CompensationItem 12. Security Ownership Of Certain Beneficial Owners and Management and Related Stockholder MattersItem 13. Certain Relationships and Related Transactions, and Director IndependenceItem 14. Principal Accounting Fees and ServicesPart IVItem 15. Exhibits and Financial Statement SchedulesItem 15. Exhibits and Financial Statement Schedules (continued)