ARCHER-DANIELS-MIDLAND CO
10-Ks and 10-Qs
|
|
|
|
|
|
|
|
|
|
|
|
|
|
|
|
|
|
|
|
|
|
|
|
|
|
|
|
|
|
|
|
|
|
|
|
|
|
|
|
|
|
|
|
|
|
|
|
|
|
|
|
|
|
|
|
UNITED STATES
SECURITIES AND EXCHANGE COMMISSION
WASHINGTON, D. C. 20549
FORM 10-K
|
x
|
ANNUAL REPORT PURSUANT TO SECTION 13 OR 15(d) OF THE SECURITIES EXCHANGE ACT OF 1934
|
OR
|
¨
|
TRANSITION REPORT PURSUANT TO SECTION 13 OR 15(d) OF THE SECURITIES EXCHANGE ACT OF 1934
|
For the fiscal year ended
December 31, 2016
Commission file number 1-44

ARCHER-DANIELS-MIDLAND COMPANY
(Exact name of registrant as specified in its charter)
|
Delaware
|
41-0129150
|
|
(State or other jurisdiction of
|
(I. R. S. Employer
|
|
incorporation or organization)
|
Identification No.)
|
|
|
|
|
77 West Wacker Drive, Suite 4600
Chicago, Illinois
|
60601
|
|
(Address of principal executive offices)
|
(Zip Code)
|
|
|
|
|
312-634-8100
|
|
|
(Registrant’s telephone number, including area code)
|
|
|
|
|
|
Securities registered pursuant to Section 12(b) of the Act:
|
|
|
|
|
|
Title of each class
|
Name of each exchange on which registered
|
|
|
|
|
Common Stock, no par value
|
New York Stock Exchange
|
Securities registered pursuant to Section 12(g) of the Act: None
Indicate by check mark if the registrant is a well-known seasoned issuer, as defined in Rule 405 of the Securities Act. Yes
x
No
¨
Indicate by check mark if the registrant is not required to file reports pursuant to Section 13 or 15(d) of the Act. Yes
¨
No
x
Indicate by check mark whether the registrant (1) has filed all reports required to be filed by Section 13 or 15(d) of the Securities Exchange Act of 1934 during the preceding 12 months (or for such shorter period that the registrant was required to file such reports), and (2) has been subject to such filing requirements for the past 90 days. Yes
x
No
¨
1
Indicate by check mark whether the registrant has submitted electronically and posted on its corporate web site, if any, every Interactive Data File required to be submitted and posted pursuant to Rule 405 of Regulation S-T during the preceding 12 months (or for such shorter period that the registrant was required to submit and post such files). Yes
x
No
¨
Indicate by check mark if disclosure of delinquent filers pursuant to Item 405 of Regulation S-K is not contained herein, and will not be contained, to the best of registrant’s knowledge, in definitive proxy or information statements incorporated by reference in Part III of this Form 10-K or any amendment to this Form 10-K.
x
Indicate by check mark whether the registrant is a large accelerated filer, an accelerated filer, a non-accelerated filer, or a smaller reporting company. See definition of “large accelerated filer”, “accelerated filer” and “smaller reporting company” in Rule 12b-2 of the Exchange Act.
Large Accelerated Filer
x
Accelerated Filer
o
Non-accelerated Filer
o
Smaller Reporting Company
o
Indicate by check mark whether the registrant is a shell company (as defined in Rule 12b-2 of the Exchange Act). Yes
o
No
x
State the aggregate market value of the voting and non-voting common equity held by non-affiliates computed by reference to the price at which the common equity was last sold, or the average bid and asked price of such common equity, as of the last business day of the registrant’s most recently completed second fiscal quarter.
Common Stock, no par value--
$24.4 billion
(Based on the closing sale price of Common Stock as reported on the New York Stock Exchange
as of June 30, 2016)
Indicate the number of shares outstanding of each of the registrant’s classes of common stock, as of the latest practicable date.
Common Stock, no par value—
571,080,171
shares
(
February 10, 2017
)
DOCUMENTS INCORPORATED BY REFERENCE
Portions of the proxy statement for the annual meeting of stockholders to be held
May 4, 2017
, are incorporated by reference into Part III of this Form 10-K.
SAFE HARBOR STATEMENT
This Form 10-K contains forward-looking information that is subject to certain risks and uncertainties that could cause actual results to differ materially from those projected, expressed, or implied by such forward-looking information. In some cases, you can identify forward-looking statements by our use of words such as “may”, “will”, “should”, “anticipates”, “believes”, “expects”, “plans”, “future”, “intends”, “could”, “estimate”, “predict”, “potential” or “contingent”, the negative of these terms or other similar expressions. The Company’s actual results could differ materially from those discussed or implied herein. Factors that could cause or contribute to such differences include, but are not limited to, those discussed in this Form 10-K for the year ended
December 31, 2016
. Among these risks are legislative acts; changes in the prices of food, feed, and other commodities, including gasoline; and macroeconomic conditions in various parts of the world. To the extent permitted under applicable law, the Company assumes no obligation to update any forward-looking statements as a result of new information or future events.
2
Table of Contents
|
Item No.
|
Description
|
Page No
.
|
|
|
|
|
|
|
|
|
Part I
|
|
|
|
1.
|
|||
|
1A.
|
|||
|
1B.
|
|||
|
2.
|
|||
|
3.
|
|||
|
4.
|
|||
|
|
|
|
|
|
|
Part II
|
|
|
|
5.
|
|||
|
6.
|
|||
|
7.
|
|||
|
7A.
|
|||
|
8.
|
|||
|
9.
|
|||
|
9A.
|
|||
|
9B.
|
|||
|
|
|
|
|
|
|
Part III
|
|
|
|
10.
|
|||
|
11.
|
|||
|
12.
|
|||
|
13.
|
|||
|
14.
|
|||
|
|
|
|
|
|
|
Part IV
|
|
|
|
15.
|
|||
|
16.
|
Form 10-K Summary
|
||
|
|
|||
3
|
Item 1.
|
BUSINESS
|
Company Overview
Archer-Daniels-Midland Company (the Company) was incorporated in Delaware in 1923, successor to the Daniels Linseed Co. founded in 1902. The Company is one of the world’s leading processors of oilseeds, corn, wheat, and other agricultural commodities and is a leading manufacturer of protein meal, vegetable oil, corn sweeteners, flour, biodiesel, ethanol, and other value-added food and feed ingredients. The Company also has an extensive global grain elevator and transportation network to procure, store, clean, and transport agricultural commodities, such as oilseeds, corn, wheat, milo, oats, and barley, as well as processed agricultural commodities. The Company has significant investments in joint ventures. The Company expects to benefit from these investments, which typically aim to expand or enhance the Company’s market for its products or offer other benefits including, but not limited to, geographic or product line expansion.
The Company’s vision is to be the most admired global agribusiness while creating value and growing responsibly. The Company’s strategy involves expanding the volume and diversity of crops that it merchandises and processes, expanding the global reach of its core model, and expanding its value-added product portfolio. The Company desires to execute this vision and these strategies by conducting its business in accordance with its core values of operating with integrity, treating others with respect, achieving excellence, being resourceful, displaying teamwork, and being responsible.
As the world population grows, so does demand for quality foods, feed ingredients for livestock, alternative fuels, and environmentally friendly alternatives to traditional chemicals. As one of the world's leading agricultural processors, the Company plays a pivotal role in meeting all of these needs in sustainable ways. The Company produces the food ingredients, biofuels, and other products that manufacturers around the world use to provide wholesome food and a better life to millions of people around the globe.
Segment Descriptions
The Company’s operations are organized, managed, and classified into four reportable business segments: Agricultural Services, Corn Processing, Oilseeds Processing, and Wild Flavors and Specialty Ingredients. Each of these segments is organized based upon the nature of products and services offered. The Company’s remaining operations are not reportable business segments, as defined by the applicable accounting standard, and are classified as Other. Financial information with respect to the Company’s reportable business segments is set forth in Note 17 of “Notes to Consolidated Financial Statements” included in Item 8 herein, “Financial Statements and Supplementary Data.”
Agricultural Services
The Agricultural Services segment utilizes its extensive global grain elevator and transportation networks, and port operations to buy, store, clean, and transport agricultural commodities, such as oilseeds, corn, wheat, milo, oats, rice, and barley, and resells these commodities primarily as food and feed ingredients and as raw materials for the agricultural processing industry. The Agricultural Services segment includes international agricultural commodities merchandising and handling activities managed through a global trade desk based in Rolle, Switzerland. Agricultural Services’ grain sourcing, handling, and transportation network provides reliable and efficient services to the Company’s customers and agricultural processing operations. Agricultural Services’ transportation network capabilities include barge, ocean-going vessel, truck, rail, and container freight services. The Agricultural Services segment also includes the activities related to structured trade finance and the processing of wheat into wheat flour. In April 2016, the Company acquired a
50%
interest in Cairo, Egypt-based Medsofts Group, a consolidated joint venture that owns and manages merchandising and supply chain operations.
The Company has a
32.2%
interest in Pacificor (formerly Kalama Export Company LLC). Pacificor owns and operates a grain export elevator in Kalama, WA and a grain export elevator in Portland, OR.
The Company held a
19.8%
interest in GrainCorp Limited (GrainCorp), a publicly listed company on the Australian Stock Exchange, until its sale in December 2016. GrainCorp is engaged in grain receival and handling, transportation, port operations, oilseed processing, malt processing, flour processing, and grain marketing activities.
4
|
Item 1.
|
BUSINESS (Continued)
|
Corn Processing
The Company’s Corn Processing segment is engaged in corn wet milling and dry milling activities, utilizing its asset base primarily located in the central part of the United States with additional facilities in China, Bulgaria, Morocco, and Turkey. The Corn Processing segment converts corn into sweeteners, starches, and bioproducts. Its products include ingredients used in the food and beverage industry including sweeteners, starch, syrup, glucose, and dextrose. Dextrose and starch are used by the Corn Processing segment as feedstocks for its bioproducts operations. By fermentation of dextrose, the Corn Processing segment produces alcohol, amino acids, and other food and animal feed ingredients. Ethyl alcohol is produced by the Company for industrial use as ethanol or as beverage grade. Ethanol, in gasoline, increases octane and is used as an extender and oxygenate. Bioproducts also include essential amino acids such as lysine and threonine used in swine and poultry diets to optimize performance. Corn gluten feed and meal, as well as distillers’ grains, are produced for use as animal feed ingredients. Corn germ, a by-product of the wet milling process, is further processed into vegetable oil and protein meal. The Corn Processing segment also includes activities related to the processing and distribution of formula feeds and animal health and nutrition products. Other Corn Processing products include citric acids and glycols, all of which are used in various food and industrial products. The Corn Processing segment also included the activities of the Company’s Brazilian sugarcane ethanol plant and related operations until the Company completed the sale of these operations in May 2016. In June 2016, the Company acquired from Tate & Lyle a Casablanca, Morocco-based corn wet mill that produces glucose and native starch. In February 2017, the Company acquired Crosswind Industries, Inc., an industry leader in the manufacture of contract and private label pet treats and foods, as well as specialty ingredients.
Hungrana Ltd., in which the Company owns a
50%
interest, operates a wet corn milling plant in Hungary.
Almidones Mexicanos S.A., in which the Company has a
50%
interest, operates a wet corn milling plant in Mexico.
Red Star Yeast Company, LLC produces and sells fresh and dry yeast in the United States and Canada. The Company has a
40%
ownership interest in this joint venture.
Oilseeds Processing
The Oilseeds Processing segment includes global activities related to the origination, merchandising, crushing, and further processing of oilseeds such as soybeans and soft seeds (cottonseed, sunflower seed, canola, rapeseed, and flaxseed) into vegetable oils and protein meals. Oilseeds products produced and marketed by the Company include ingredients for the food, feed, energy, and industrial products industries. Crude vegetable oils produced by the segment’s crushing activities are sold “as is” or are further processed by refining, blending, bleaching, and deodorizing into salad oils. Salad oils are sold “as is” or are further processed by hydrogenating and/or interesterifying into margarine, shortening, and other food products. Partially refined oils are used to produce biodiesel or are sold to other manufacturers for use in chemicals, paints, and other industrial products. Oilseed protein meals are principally sold to third parties to be used as ingredients in commercial livestock and poultry feeds. In Europe and South America, the Oilseeds Processing segment includes origination and merchandising activities as adjuncts to its oilseeds processing assets. These activities include a network of grain elevators, port facilities, and transportation assets used to buy, store, clean, and transport grains and oilseeds. The Oilseeds Processing segment is a major supplier of peanuts, tree nuts, and peanut-derived ingredients to both the U.S. and export markets. In North America, cottonseed flour is produced and sold primarily to the pharmaceutical industry and cotton cellulose pulp is manufactured and sold to the chemical, paper, and filter markets. The Oilseeds Processing segment also included activities related to its global chocolate and cocoa businesses until the sale of these businesses in July 2015 and October 2015, respectively. In November 2016, the Company completed the expansion of Olenex, a
37.5%
joint venture with Wilmar International Limited (Wilmar). Olenex owns and operates specialty oils and fats, palm refining, and tropical oils processing plants in Europe.
The Company has an equity interest in Wilmar, a Singapore publicly listed company. The Company acquired additional shares in Wilmar increasing its ownership interest from
19.0%
to
20.0%
in March 2016,
22.0%
in June 2016,
23.2%
in September 2016, and
23.9%
in January 2017. Wilmar, a leading agribusiness group in Asia, is engaged in the businesses of oil palm cultivation, oilseeds crushing, edible oils refining, sugar milling and refining, specialty fats, oleo chemicals, biodiesel and fertilizers manufacturing, and grains processing.
Stratas Foods LLC, a joint venture between the Company and ACH Jupiter, LLC, a subsidiary of Associated British Foods, procures, packages, and sells edible oils in North America. The Company has a
50%
ownership interest in this joint venture.
5
|
Item 1.
|
BUSINESS (Continued)
|
The Company has a
50%
interest in Edible Oils Limited, a joint venture between the Company and Princes Limited to procure, package, and sell edible oils in the United Kingdom. The Company also formed a joint venture with Princes Limited in Poland to procure, package, and sell edible oils in Poland, Czech Republic, Slovakia, Hungary, and Austria.
The Company is a major supplier of agricultural commodity raw materials to Wilmar, Stratas Foods LLC, and Edible Oils Limited.
Wild Flavors and Specialty Ingredients
The Wild Flavors and Specialty Ingredients (WFSI) segment engages in the manufacturing, sales, and distribution of specialty products including natural flavor ingredients, flavor systems, natural colors, proteins, emulsifiers, soluble fiber, polyols, hydrocolloids, natural health and nutrition products, and other specialty food and feed ingredients. The WFSI segment also includes the activities related to the procurement, processing, and distribution of edible beans. The Company acquired a
90%
controlling stake in Harvest Innovations, an industry leader in minimally processed, expeller-pressed soy proteins, oils, and gluten-free ingredients in February 2016; the remaining
60%
interest in Amazon Flavors, a leading Brazilian manufacturer of natural extracts, emulsions and compounds, in May 2016; and Caterina Foods, a leading toll manufacturer of specialty gluten-free and high-protein pastas, in September 2016.
Other
Other includes the Company’s remaining operations, primarily its financial business units, related to futures commission and insurance activities.
ADM Investor Services, Inc., a wholly owned subsidiary of the Company, is a registered futures commission merchant and a clearing member of all principal commodities exchanges in the U.S. ADM Investor Services International, Limited, a member of several commodity exchanges and clearing houses in Europe, ADMIS Hong Kong Limited, and ADMIS Singapore Pte. Limited, are wholly owned subsidiaries of the Company offering broker services in Europe and Asia.
Captive insurance includes Agrinational Insurance Company (Agrinational) and its subsidiaries. Agrinational, a wholly owned subsidiary of the Company, provides insurance coverage for certain property, casualty, marine, credit, and other miscellaneous risks of the Company. Agrinational also participates in certain third-party reinsurance arrangements and retains a portion of the crop insurance risk written by ADM Crop Risk Services, a wholly owned subsidiary. ADM Crop Risk Services is a managing general agent which sells and services crop insurance policies to farmers.
Corporate
Compagnie Industrielle et Financiere des Produits Amylaces SA (Luxembourg) and affiliates (CIP), in which the Company has a
43.7%
interest, is a joint venture which targets investments in food, feed ingredients, and bioproducts businesses.
Methods of Distribution
The Company’s products are distributed mainly in bulk from processing plants or storage facilities directly to customers’ facilities. The Company has developed a comprehensive transportation capability to efficiently move both commodities and processed products virtually anywhere in the world. The Company owns or leases large numbers of the trucks, trailers, railroad tank and hopper cars, river barges, towboats, and ocean-going vessels used to transport the Company’s products to its customers.
6
|
Item 1.
|
BUSINESS (Continued)
|
Concentration of Revenues by Product
The following products account for 10% or more of revenues for the following periods:
|
|
% of Revenues
|
||||
|
|
Year Ended December 31
|
||||
|
|
2016
|
2015
|
2014
|
||
|
Soybeans
|
17%
|
16%
|
16%
|
||
|
Soybean Meal
|
13%
|
13%
|
13%
|
||
|
Corn
|
10%
|
11%
|
10%
|
||
Status of New Products
The Company continues to expand the size and global reach of its business through the development of new products. Acquisitions, especially in the Wild Flavors and Specialty Ingredients segment, expand the Company’s ability to serve the customers’ evolving needs through its offering of natural flavor and ingredient products. The Company does not expect any of its new products to have a significant impact on the Company’s revenues in 2017.
Source and Availability of Raw Materials
Substantially all of the Company’s raw materials are agricultural commodities. In any single year, the availability and price of these commodities are subject to factors such as changes in weather conditions, plantings, government programs and policies, competition, changes in global demand, changes in standards of living, and global production of similar and competitive crops. The Company’s raw materials are procured from thousands of growers, grain elevators, and wholesale merchants in North America, South America, Europe, Asia, Australia, and Africa, pursuant primarily to short-term (less than one year) agreements or on a spot basis. The Company is not dependent upon any particular grower, elevator, or merchant as a source for its raw materials.
Patents, Trademarks, and Licenses
The Company owns patents, trademarks, and licenses, principally consisting of
$205 million
of trademarks from the Wild Flavors acquisition in 2014, but does not consider any segment of its business dependent upon any single or group of patents, trademarks or licenses.
Seasonality, Working Capital Needs, and Significant Customers
Since the Company is widely diversified in global agribusiness markets, there are no material seasonal fluctuations in overall global processing volumes and the sale and distribution of its products and services. There is a degree of seasonality in the growing cycles, procurement, and transportation of the Company’s principal raw materials: oilseeds, corn, wheat, sugarcane, and other grains.
The prices of agricultural commodities, which may fluctuate significantly and change quickly, directly affect the Company’s working capital requirements. Because the Company has a higher portion of its operations in the northern hemisphere, principally North America and Europe, relative to the southern hemisphere, primarily South America, inventory levels typically peak after the northern hemisphere fall harvest and are generally lower during the northern hemisphere summer months. Working capital requirements have historically trended with inventory levels. No material part of the Company’s business is dependent upon a single customer or very few customers. The Company has seasonal financing arrangements with farmers in certain countries around the world. Typically, advances on these financing arrangements occur during the planting season and are repaid at harvest.
7
|
Item 1.
|
BUSINESS (Continued)
|
Competition
The Company has significant competition in the markets in which it operates based principally on price, foreign exchange rates, quality, global supply, and alternative products, some of which are made from different raw materials than those utilized by the Company. Given the commodity-based nature of many of its businesses, the Company, on an ongoing basis, focuses on managing unit costs and improving efficiency through technology improvements, productivity enhancements, and regular evaluation of the Company’s asset portfolio.
Research and Development Expenditures
The Company’s research and development expenditures are focused on responding to demand from customers’ product development or formulation needs, improving processing efficiency, and developing food, feed, fuel, and industrial products from renewable agricultural crops. Research and development expense during the years ended
December 31, 2016
,
2015
, and
2014
, net of reimbursements of government grants, was approximately
$123 million
,
$122 million
, and
$79 million
, respectively.
The Company’s laboratories and technical centers around the world enhance its ability to interact with customers in Europe, Asia, and South America, not only to provide flavors, but also to support the sales of other food ingredients. The acquisition of Wild Flavors in October 2014 approximately doubled the number of scientists and technicians in research and development. A number of these laboratories are being expanded with new capabilities to enhance the Company’s ability to develop custom solutions for our customers.
The Company is working with the U.S. Department of Energy’s National Energy Technology Laboratory and other key academic and corporate partners on carbon sequestration projects to reduce carbon dioxide emissions from manufacturing operations. The first project, Illinois Basin Decatur Project, successfully completed injecting one million tons of CO
2
in the fourth quarter of fiscal year ended December 31, 2014. The second project, the Illinois Industrial Carbon Capture & Sequestration, was completed in the fourth quarter of fiscal year ended December 31, 2015 and is expected to receive authorization to start injection in the first quarter of fiscal year 2017.
The Company is continuing to invest in research to develop a broad range of sustainable materials with an objective to produce key intermediate materials that serve as a platform for producing a variety of sustainable packaging products. The key materials are derived from the Company’s starch and oilseed-based feedstocks. Conversion technologies include utilizing expertise in both fermentation and catalysis. The materials pipeline includes the development of chemicals and intermediates that are currently produced from petrochemical resources as well as new-to-the-market bio-based products. The Company’s current portfolio includes products that are in the early development phase and those that are close to pilot plant demonstration. In an effort to further advance the development of bio-based chemical technologies, the Company has partnered with the Center for Environmentally Beneficial Catalysis and has added research capabilities at the University of Kansas. The Company has also engaged in a joint development agreement with DuPont to develop sustainable packaging solutions with improved barrier properties compared to current materials.
In October 2016, the Company launched ADM Ventures to oversee select, high-potential, new-product development projects from its business units; to nurture promising, early-stage start-up companies in which the Company may wish to invest; and to invest in more mature, proven start-ups with strong growth potential.
Environmental Compliance
During the year ended
December 31, 2016
,
$60 million
was spent specifically to improve equipment, facilities, and programs for pollution control and compliance with the requirements of various environmental agencies.
There have been no material effects upon the earnings and competitive position of the Company resulting from compliance with applicable laws or regulations enacted or adopted relating to the protection of the environment.
8
|
Item 1.
|
BUSINESS (Continued)
|
A number of jurisdictions where the Company has operations have implemented or are in the process of implementing carbon pricing programs or regulations to reduce greenhouse gas emissions, including, but not limited to, the U.S., Canada, Mexico, the E.U. and its member states, and China. The Company's operations located in countries with effective and applicable carbon pricing and regulatory programs currently meet their obligations in this regard with no significant impact on the earnings and competitive position of the Company. The Company’s business could be affected in the future by additional global, regional, national, and local regulation, pricing of greenhouse gas emissions or other climate change legislation, regulation or agreements. It is difficult at this time to estimate the likelihood of passage, or predict the potential impact, of any additional legislation, regulations or agreements. Potential consequences of new obligations could include increased energy, transportation, raw material, and administrative costs, and may require the Company to make additional investments in its facilities and equipment.
Number of Employees
The number of full-time employees of the Company was approximately
31,800
at
December 31, 2016
and
32,300
at
December 31, 2015
. The net decrease in the number of full-time employees is primarily related to divestitures.
Financial Information About Foreign and U.S. Operations
Item 1A, “Risk Factors,” and Item 2, “Properties,” includes information relating to the Company’s foreign and U.S. operations. Geographic financial information is set forth in Note 17 of “Notes to Consolidated Financial Statements” included in Item 8 herein, “Financial Statements and Supplementary Data”.
Available Information
The Company’s website is http://www.adm.com. The Company makes available, free of charge, through its website, the Company’s annual reports on Form 10-K; quarterly reports on Form 10-Q; current reports on Form 8-K; directors’ and officers’ Forms 3, 4, and 5; and amendments to those reports, as soon as reasonably practicable after electronically filing such materials with, or furnishing them to, the Securities and Exchange Commission (SEC).
In addition, the Company makes available, through its website, the Company’s Code of Conduct, Corporate Governance Guidelines, and the written charters of the Audit, Compensation/Succession, Nominating/Corporate Governance, and Executive Committees.
References to our website address in this report are provided as a convenience and do not constitute, or should not be viewed as, an incorporation by reference of the information contained on, or available through, the website. Therefore, such information should not be considered part of this report.
The public may read and copy any materials filed by the Company with the SEC at the SEC’s Public Reference Room at 100 F Street, N.E., Washington, D.C. 20549. The public may obtain information on the operation of the Public Reference Room by calling the SEC at 1-800-SEC-0330. The SEC maintains a website which contains reports, proxy and information statements, and other information regarding issuers that file information electronically with the SEC. The SEC’s website is http://www.sec.gov.
|
Item 1A.
|
RISK FACTORS
|
The Company faces risks in the normal course of business and through global, regional, and local events that could have an adverse impact on its reputation, operations, and financial performance.
Management directs a Company-wide Integrated Risk Management (IRM) program, with oversight from the Company’s Board of Directors. The Company’s Audit Committee has the delegated risk management oversight responsibility and receives updates on the risk management processes and key risk factors on a quarterly basis.
The risk factors that follow are the main risks that the IRM program focuses on to protect and enhance shareholder value through intentional risk mitigation plans based on management-defined risk limits.
The Company, through its business unit, functional, and corporate teams, continually updates, assesses, monitors, and mitigates these and other business and compliance risks in accordance with the IRM Program and as monitored by the IRM program and Chief Risk Officer.
9
|
Item 1A.
|
RISK FACTORS (Continued)
|
The availability and prices of the agricultural commodities and agricultural commodity products the Company procures, transports, stores, processes, and merchandises can be affected by weather conditions, disease, government programs, competition, and various other factors beyond the Company’s control and could adversely affect the Company’s operating results.
The availability and prices of agricultural commodities are subject to wide fluctuations due to changes in weather conditions, crop disease, plantings, government programs and policies, competition, changes in global demand, changes in standards of living, and global production of similar and competitive crops. The Company uses a global network of procurement, processing, and transportation assets, as well as robust communications between global commodity merchandiser teams, to continually assess price and basis opportunities. These commodity trade teams monitor commodity positions against management established limits (including a corporate wide value-at-risk metric), with robust internal reporting to ensure optimized results versus the Company’s strategic plans. Additionally, the Company depends globally on agricultural producers to ensure an adequate supply of the agricultural commodities used by the Company in its operations is maintained. These factors have historically caused volatility in the availability and prices of agricultural commodities and, consequently, in the Company’s operating results and working capital requirements. Reduced supply of agricultural commodities due to weather-related factors or other reasons could adversely affect the Company’s profitability by increasing the cost of raw materials and/or limiting the Company’s ability to procure, transport, store, process, and merchandise agricultural commodities in an efficient manner. For example, a drought in North America in 2012 reduced the availability of corn and soybean inventories while prices increased. High and volatile commodity prices can adversely affect the Company’s ability to meet its liquidity needs. Conversely, if supplies are abundant and crop production globally outpaces demand for more than one or two crop cycles, price volatility is somewhat diminished. This could result in reduced operating results due to the lack of supply chain dislocations and reduced market spread and basis opportunities.
Advances in technology, such as seed and crop protection technology, farming techniques, or speed of information flow, may reduce the significance of dislocations and arbitrage opportunities in the agricultural global markets, which may reduce the earnings potential of the Company and other agricultural merchandisers.
The Company has significant competition in the markets in which it operates.
The Company faces significant competition in each of its businesses and has numerous competitors. The company competes for the acquisition of inputs such as agricultural commodities, transportation services, and other materials and supplies, as well as for workforce and talent. Additionally, competitors offer similar products and services, as well as alternative products and services, to the Company’s customers. The Company is dependent on being able to generate revenues in excess of cost of products sold in order to obtain margins, profits, and cash flows to meet or exceed its targeted financial performance measures and provide cash for operating, working capital, dividend, or capital expenditure needs. Competition impacts the Company’s ability to generate and increase its gross profit as a result of the following factors. Pricing of the Company’s products is partly dependent upon industry processing capacity, which is impacted by competitor actions to bring on-line idled capacity, build new production capacity or execute aggressive consolidation. Many of the products bought and sold by the Company are global commodities or are derived from global commodities. The markets for global commodities are highly price competitive and in many cases the commodities are subject to substitution. Significant changes in exchange rates of foreign currencies versus the U.S. dollar, particularly the currencies of major crop growing countries, could also make goods and products of these countries more competitive than U.S. products, thereby negatively impacting the competitiveness of the Company’s significant origination, processing, and export footprint, and the Company’s operating results. Improved yields in different crop growing regions may reduce the reliance on origination territories in which the Company has a significant presence. In addition, continued merger and acquisition activities resulting in further consolidations result in greater cost competitiveness and global scale of certain players in the industry that could impact the relative competitiveness of the Company, especially when acquirers are state-owned and/or backed by public funds and have profit and return objectives that may differ from publicly traded enterprises. To compete effectively, the Company focuses on improving efficiency in its production and distribution operations, developing and maintaining appropriate market share, maintaining a high level of product safety and quality, and working with customers to develop new products and tailored solutions.
10
|
Item 1A.
|
RISK FACTORS (Continued)
|
Fluctuations in energy prices could adversely affect the Company’s operating results.
The Company’s operating costs and the selling prices of certain finished products are sensitive to changes in energy prices. The Company’s processing plants are powered principally by electricity, natural gas, and coal. The Company’s transportation operations are dependent upon diesel fuel and other petroleum-based products. Significant increases in the cost of these items, including any consequences of regulation or taxation of greenhouse gases, could adversely affect the Company’s production costs and operating results.
The Company has certain finished products, such as ethanol and biodiesel, which are closely related to, or may be substituted for, petroleum products, or in the case of ethanol, blended into gasoline to increase octane content. Therefore, the selling prices of ethanol and biodiesel can be impacted by the selling prices of gasoline, diesel fuel, and other octane enhancers. A significant decrease in the price of gasoline, diesel fuel, or other octane enhancers could result in a significant decrease in the selling price of the Company’s ethanol and biodiesel and could adversely affect the Company’s revenues and operating results. The Company uses derivative contracts as anticipatory hedges for both purchases of commodity inputs and sales of energy-based products in order to protect itself against these price trends and to protect and maximize processing margins.
The Company is subject to economic downturns and regional economic volatilities, which could adversely affect the Company’s operating results.
The Company conducts its business and has substantial assets located in many countries and geographic areas. While
56 percent
of the Company’s processing plants and
73 percent
of its procurement facilities are located in the United States, the Company also has significant operations in both developed areas (such as Western Europe, Canada, Brazil) and emerging market areas (such as Eastern Europe, Asia, portions of South and Central America, the Middle East, and Africa). One of the Company’s strategies is to expand the global reach of its core model which may include expanding or developing its business in emerging market areas such as Asia, Eastern Europe, the Middle East, and Africa. Both developed and emerging market areas are subject to impacts of economic downturns, including decreased demand for the Company’s products, and reduced availability of credit, or declining credit quality of the Company’s suppliers, customers, and other counterparties. In addition, emerging market areas could be subject to more volatile operating conditions including, but not limited to, logistics limitations or delays, labor-related challenges, limitations or regulations affecting trade flows (such as concerning genetically modified organisms), local currency concerns, and other economic and political instability. Political fiscal instability could generate intrusive regulations in emerging markets potentially creating unanticipated assessments of taxes, fees, increased risks of corruption, etc. Economic downturns and volatile market conditions could adversely affect the Company’s operating results and ability to execute its long-term business strategies, thus reducing the Company’s overall market value. The Company mitigates this risk in many ways including country risk analysis, government relations and tax compliance activities, and active ethics compliance training requirements.
The Company is subject to numerous laws, regulations, and mandates globally which could adversely affect the Company’s operating results and forward strategy.
The Company does business globally, connecting crops and markets in
163
countries. The Company is required to comply with the numerous and far-reaching laws and regulations administered by United States federal, state and local, and foreign governmental authorities. The Company must comply with other general business regulations such as accounting and income taxes, anti-corruption, anti-bribery, global trade, trade sanctions, environmental, product safety, and handling and production of regulated substances. The Company frequently faces challenges from U.S. and foreign tax authorities regarding the amount of taxes due. These challenges include questions regarding the timing and amount of deductions and the allocation of income among various tax jurisdictions. In evaluating the exposure associated with various tax filing positions, the Company records reserves for estimates of potential additional tax owed by the Company. As examples, the Company has received large tax assessments from tax authorities in Brazil and Argentina, challenging income tax positions taken by subsidiaries of the Company covering various prior periods. Any failure to comply with applicable laws and regulations or appropriately resolve these challenges could subject the Company to administrative, civil, and criminal remedies including fines, penalties, disgorgement, injunctions, and recalls of its products, and damage to its reputation.
The production of the Company’s products requires the use of materials which can create emissions of certain regulated substances, including greenhouse gas emissions. Although the Company has programs in place throughout the organization globally to ensure compliance with laws and regulations, failure to comply with these laws and regulations can have serious consequences, including civil, administrative, and criminal penalties as well as a negative impact on the Company’s reputation, business, cash flows, and results of operations.
11
|
Item 1A.
|
RISK FACTORS (Continued)
|
In addition, changes to regulations or implementation of additional regulations, for example the imposition of regulatory restrictions on greenhouse gases or regulatory modernization of food safety laws, may require the Company to modify existing processing facilities and/or processes which could significantly increase operating costs and adversely affect operating results.
Government policies, mandates, and regulations specifically affecting the agricultural sector and related industries; regulatory policies or matters that affect a variety of businesses; taxation polices; and political instability could adversely affect the Company’s operating results.
Agricultural production and trade flows are subject to government policies, mandates, and regulations. Governmental policies affecting the agricultural industry, such as taxes, tariffs, duties, subsidies, incentives, foreign exchange rates, and import and export restrictions on agricultural commodities and commodity products, including policies related to genetically modified organisms, traceability standards, product safety and labeling, renewable fuels, and low carbon fuel mandates, can influence the planting of certain crops, the location and size of crop production, whether unprocessed or processed commodity products are traded, the volume and types of imports and exports, the availability and competitiveness of feedstocks as raw materials, the viability and volume of production of certain of the Company’s products, and industry profitability. For example, changes in government policies or regulations of ethanol and biodiesel, including but not limited to changes in the Renewable Fuel Standard program under the Energy Independence and Security Act of 2007 in the United States, can have an impact on the Company’s operating results. International trade regulations can adversely affect agricultural commodity trade flows by limiting or disrupting trade between countries or regions. Regulations of financial markets and instruments, including the Dodd-Frank Act, Consumer Protection Act, and the European Market Infrastructure Regulation, create uncertainty and may lead to additional risks and costs, and could adversely affect the Company’s futures commission merchant business and its agricultural commodity risk management practices. Future government policies may adversely affect the supply of, demand for, and prices of the Company’s products; adversely affect the Company's ability to deploy adequate hedging programs; restrict the Company’s ability to do business in its existing and target markets; and adversely affect the Company’s revenues and operating results.
The Company’s operating results could be affected by political instability and by changes in other governmental policies, mandates, and regulations including monetary, fiscal and environmental policies, laws, regulations, acquisition approvals, and other activities of governments, agencies, and similar organizations. These risks include but are not limited to changes in a country’s or region’s economic or political conditions, local labor conditions and regulations, safety and environmental regulations, reduced protection of intellectual property rights, changes in the regulatory or legal environment, restrictions on currency exchange activities, currency exchange fluctuations, burdensome taxes and tariffs, enforceability of legal agreements and judgments, adverse tax, administrative agency or judicial outcomes, and regulation or taxation of greenhouse gases. International risks and uncertainties, including changing social and economic conditions as well as terrorism, political hostilities, and war, could limit the Company’s ability to transact business in these markets and could adversely affect the Company’s revenues and operating results. There has been a recent increase in populism and nationalism in various countries around the world and the concept and benefits of free trade are being challenged. The Company has benefited from the free flow of agricultural and food and feed ingredient products from the U.S. and other sources to markets around the world. Should there be an increase in tariff and restrictive trade activities around the world, the Company could be negatively impacted from its inability to enter certain markets or the price of the products being less competitive in the destination markets.
The Company’s strategy involves expanding the volume and diversity of crops it merchandises and processes, expanding the global reach of its core model, and expanding its value-added product portfolio. Government policies, including antitrust and competition law, trade restrictions, food safety regulations, sustainability requirements, traceability, and other government regulations and mandates, can impact the Company’s ability to execute this strategy successfully.
The Company is subject to industry-specific risks which could adversely affect the Company’s operating results.
The Company is subject to risks which include, but are not limited to, product safety or quality; shifting consumer preferences; federal, state, and local regulations on manufacturing or labeling; socially acceptable farming practices; environmental, health and safety regulations; and customer product liability claims. The liability which could result from certain of these risks may not always be covered by, or could exceed liability insurance related to product liability and food safety matters maintained by the Company. In addition, negative publicity caused by product liability, food safety, occupational health and safety, and environmental matters may damage the Company’s reputation. The Company has a particularly strong capability and culture around occupational health and safety and food safety. However, the occurrence of any of the matters described above could adversely affect the Company’s revenues and operating results.
12
|
Item 1A.
|
RISK FACTORS (Continued)
|
Certain of the Company’s merchandised commodities and finished products are used as ingredients in livestock and poultry feed. The Company is subject to risks associated with economic, product quality, feed safety or other factors which may adversely affect the livestock and poultry businesses, including the outbreak of disease in livestock and poultry. An outbreak of disease could adversely affect demand for the Company’s products used as ingredients in livestock and poultry feed. A decrease in demand for ingredients in livestock and poultry feed could adversely affect the Company’s revenues and operating results. In addition, as the Company increases its investment in flavors and ingredients businesses, it is exposed to increased risks related to rapidly changing consumer preferences and the impacts these changes could have on the success of certain of the Company's customers.
The Company is exposed to potential business disruption, including but not limited to disruption of transportation services, supply of non-commodity raw materials used in its processing operations, and other impacts resulting from acts of terrorism or war, natural disasters, severe weather conditions, and accidents which could adversely affect the Company’s operating results.
The Company’s operations rely on dependable and efficient transportation services. A disruption in transportation services could result in difficulties supplying materials to the Company’s facilities and impair the Company’s ability to deliver products to its customers in a timely manner. The Company relies on access to navigable rivers and waterways in order to fulfill its transportation obligations more effectively. If access to these navigable waters is interrupted, the Company’s operating results could be adversely affected. In addition, if certain non-agricultural commodity raw materials, such as water or certain chemicals used in the Company’s processing operations, are not available, the Company’s business could be disrupted. Any major lack of available water for use in certain of the Company’s processing operations could have a material adverse impact on operating results. Certain factors which may impact the availability of non-agricultural commodity raw materials are out of the Company’s control including, but not limited to, disruptions resulting from weather, economic conditions, manufacturing delays or disruptions at suppliers, shortage of materials, interruption of energy supply, and unavailable or poor supplier credit conditions.
The assets and operations of the Company could be subject to extensive property damage and business disruption from various events which include, but are not limited to, acts of terrorism, for example, economic adulteration of the Company’s products, or war, natural disasters and severe weather conditions, accidents, explosions, and fires. The potential effects of these conditions could adversely affect the Company’s revenues and operating results. The Company is continuing to enhance and deploy additional food safety and security procedures and controls to appropriately mitigate the risks of any adulteration of the Company’s products in supply chain and finished products in production and distribution networks. In addition, the Company conforms to management systems, such as International Organization for Standardization (ISO) or other recognized global standards.
The Company’s business is capital-intensive in nature and the Company relies on cash generated from its operations and external financing to fund its growth and ongoing capital needs. Limitations on access to external financing could adversely affect the Company’s operating results.
The Company requires significant capital, including continuing access to credit markets, to operate its current business and fund its growth strategy. The Company’s working capital requirements, including margin requirements on open positions on futures exchanges, are directly affected by the price of agricultural commodities, which may fluctuate significantly and change quickly. The Company also requires substantial capital to maintain and upgrade its extensive network of storage facilities, processing plants, refineries, mills, ports, transportation assets and other facilities to keep pace with competitive developments, technological advances, regulations and changing safety standards in the industry. Moreover, the expansion of the Company’s business and pursuit of acquisitions or other business opportunities may require significant amounts of capital. Access to credit markets and pricing of the Company’s capital is dependent upon maintaining sufficient credit ratings from credit rating agencies. Sufficient credit ratings allow the Company to access tier one commercial paper markets. If the Company is unable to maintain sufficiently high credit ratings, access to these commercial paper and other debt markets and costs of borrowings could be adversely affected. If the Company is unable to generate sufficient cash flow or maintain access to adequate external financing, including as a result of significant disruptions in the global credit markets, it could restrict the Company’s current operations and its growth opportunities which could adversely affect the Company’s operating results. The Company manages this risk with constant monitoring of credit/liquidity metrics, cash forecasting, and routine communications with credit rating agencies on risk management practices.
13
|
Item 1A.
|
RISK FACTORS (Continued)
|
The Company’s risk management strategies may not be effective.
The Company’s business is affected by fluctuations in agricultural commodity cash prices and derivative prices, transportation costs, energy prices, interest rates, and foreign currency exchange rates. The Company monitors position limits and engages in other strategies and controls to manage these risks. The Company has a Chief Risk Officer and an established commodity merchandising governance process to ensure proper position reporting and monitoring, limit approvals, and execute training on trade compliance, commodity regulatory reporting controls, and other policies. The Company’s monitoring efforts may not be successful at detecting a significant risk exposure. If these controls and strategies are not successful in mitigating the Company’s exposure to these fluctuations, it could adversely affect the Company’s operating results.
The Company has limited control over and may not realize the expected benefits of its equity investments and joint ventures.
The Company has
$4.5 billion
invested in or advanced to joint ventures and investments over which the Company has limited control as to the governance and management activities of these investments. Net sales to unconsolidated affiliates during the year ended
December 31, 2016
was
$4.2 billion
. The Company faces certain risks, including risks related to the financial strength of the investment partner; loss of revenues and cash flows to the investment partner and related gross profit; the inability to implement beneficial management strategies, including risk management and compliance monitoring, with respect to the investment’s activities; and the risk that the Company may not be able to resolve disputes with the investment partner. The Company may encounter unanticipated operating issues, financial results, or compliance and reputational risks related to these investments that may impact the Company’s revenues and operating results. The Company mitigates this risk using controls and policies related to joint venture formation, governance, merger and acquisition integration management, and harmonization of joint venture policies with the Company’s policies and controls.
The Company’s information technology (IT) systems, processes, and sites may suffer interruptions, security breaches, or failures which may affect the Company’s ability to conduct its business.
The Company’s operations rely on certain key IT systems, some of which are dependent on services provided by third parties, to provide critical data connectivity, information, and services for internal and external users. These interactions include, but are not limited to, ordering and managing materials from suppliers, risk management activities, converting raw materials to finished products, inventory management, shipping products to customers, processing transactions, summarizing and reporting results of operations, human resources benefits and payroll management, complying with regulatory, legal or tax requirements, and other processes necessary to manage the business. The Company is also in the process of implementing a new enterprise resource planning (ERP) system on a worldwide basis as part of its ongoing business transformation program, which is expected to improve the efficiency and effectiveness of certain financial and business transaction processes and the underlying systems environment. Increased IT security threats and more sophisticated computer crime, including advanced persistent threats, pose a potential risk to the security of the Company’s IT systems, networks, and services, as well as the confidentiality, availability, and integrity of the Company’s third party data. The Company has put in place security measures to prevent, detect, and mitigate cyber-based attacks and instituted control procedures for cyber security incident responses and disaster recovery plans for its critical systems. In addition, the Company monitors this risk on an ongoing basis to detect and correct any breaches and reports metrics to the highest level of management and to the Board of Directors on the quality of the Company’s data security efforts and control environment. However, if the Company’s IT systems are breached, damaged, or cease to function properly due to any number of causes, such as catastrophic events, power outages, security breaches, or cyber-based attacks, and the Company’s disaster recovery plans do not effectively mitigate the risks on a timely basis, the Company may suffer interruptions in its ability to manage its operations, loss of valuable data, and damage to its reputation, which may adversely impact the Company’s revenues, operating results, and financial condition.
|
Item 1B.
|
UNRESOLVED STAFF COMMENTS
|
The Company has no unresolved staff comments.
14
|
Item 2.
|
PROPERTIES (Continued)
|
|
Item 2.
|
PROPERTIES
|
The Company owns or leases, under operating leases, the following processing plants and procurement facilities:
|
|
Processing Plants
|
Procurement Facilities
|
|||||||||||||||
|
|
Owned
|
Leased
|
Total
|
Owned
|
Leased
|
Total
|
|||||||||||
|
U.S.
|
147
|
|
6
|
|
153
|
|
287
|
|
88
|
|
375
|
|
|||||
|
International
|
107
|
|
11
|
|
118
|
|
102
|
|
37
|
|
139
|
|
|||||
|
|
254
|
|
17
|
|
271
|
|
389
|
|
125
|
|
514
|
|
|||||
The Company’s operations are such that most products are efficiently processed near the source of raw materials. Consequently, the Company has many plants strategically located in agricultural commodity producing areas. The annual volume of commodities processed will vary depending upon availability of raw materials and demand for finished products. The Company also owns approximately
230
warehouses and terminals primarily used as bulk storage facilities and
38
innovation centers. Warehouses, terminals, corporate, and sales offices are not included in the tables above. Processing plants and procurement facilities owned or leased by unconsolidated joint ventures are also not included in the tables above.
To enhance the efficiency of transporting large quantities of raw materials and finished products between the Company’s procurement facilities and processing plants and also the final delivery of products to our customers around the world, the Company owns approximately
1,900
barges,
13,100
rail cars,
250
trucks,
1,200
trailers, and
10
oceangoing vessels; and leases, under operating leases, approximately
560
barges,
15,500
rail cars,
340
trucks,
120
trailers and
21
oceangoing vessels.
|
|
Agricultural Services Processing Plants
|
||||||||||
|
|
Owned
|
Leased
|
|||||||||
|
Merchandising
& Handling
|
Milling &
Other
|
Total
|
Milling &
Other
|
||||||||
|
North America
|
|
|
|
|
|||||||
|
U.S.*
|
2
|
|
28
|
|
30
|
|
—
|
|
|||
|
Barbados
|
—
|
|
1
|
|
1
|
|
—
|
|
|||
|
Belize
|
—
|
|
1
|
|
1
|
|
—
|
|
|||
|
Canada
|
—
|
|
9
|
|
9
|
|
—
|
|
|||
|
Grenada
|
—
|
|
1
|
|
1
|
|
—
|
|
|||
|
Jamaica
|
—
|
|
2
|
|
2
|
|
—
|
|
|||
|
Total
|
2
|
|
42
|
|
44
|
|
—
|
|
|||
|
Daily capacity
|
|||||||||||
|
Metric tons (in 1,000’s)
|
—
|
|
15
|
|
15
|
|
—
|
|
|||
|
Europe
|
|
|
|
|
|
|
|
|
|||
|
United Kingdom
|
—
|
|
3
|
|
3
|
|
4
|
|
|||
|
Total
|
—
|
|
3
|
|
3
|
|
4
|
|
|||
|
Daily capacity
|
|||||||||||
|
Metric tons (in 1,000’s)
|
—
|
|
1
|
|
1
|
|
1
|
|
|||
|
Grand Total
|
2
|
|
45
|
|
47
|
|
4
|
|
|||
|
Total daily capacity
|
|
|
|
|
|
|
|
|
|||
|
Metric tons (in 1,000’s)
|
—
|
|
16
|
|
16
|
|
1
|
|
|||
*The U.S. plants are located in California, Illinois, Indiana, Iowa, Kansas, Minnesota, Missouri, Nebraska, New York, North Carolina, Oklahoma, Pennsylvania, Tennessee, Texas, Washington, and Wisconsin.
15
|
Item 2.
|
PROPERTIES (Continued)
|
|
|
Agricultural Services Procurement Facilities
|
||||
|
|
Merchandising & Handling
|
||||
|
|
Owned
|
Leased
|
|||
|
North America
|
|
|
|||
|
U.S.*
|
171
|
|
24
|
|
|
|
Dominican Republic
|
1
|
|
—
|
|
|
|
Total
|
172
|
|
24
|
|
|
|
Storage capacity
|
|||||
|
Metric tons (in 1,000’s)
|
13,559
|
|
1,178
|
|
|
|
South America
|
|
|
|
|
|
|
Argentina
|
5
|
|
—
|
|
|
|
Ecuador
|
—
|
|
2
|
|
|
|
Total
|
5
|
|
2
|
|
|
|
Storage capacity
|
|
|
|
|
|
|
Metric tons (in 1,000’s)
|
502
|
|
340
|
|
|
|
Europe
|
|
|
|
|
|
|
Hungary
|
1
|
|
—
|
|
|
|
Ireland
|
2
|
|
—
|
|
|
|
Poland
|
1
|
|
—
|
|
|
|
Romania
|
11
|
|
4
|
|
|
|
Ukraine
|
7
|
|
—
|
|
|
|
United Kingdom
|
—
|
|
5
|
|
|
|
Total
|
22
|
|
9
|
|
|
|
Storage capacity
|
|||||
|
Metric tons (in 1,000’s)
|
1,155
|
|
49
|
|
|
|
Grand Total
|
199
|
|
35
|
|
|
|
Total storage capacity
|
|
|
|
|
|
|
Metric tons (in 1,000’s)
|
15,216
|
|
1,567
|
|
|
*The U.S. procurement facilities are located in Arkansas, Illinois, Indiana, Iowa, Kansas, Kentucky, Louisiana, Michigan, Minnesota, Missouri, Montana, Nebraska, New York, North Dakota, Ohio, Oklahoma, Oregon, South Dakota, Tennessee, Texas, Washington, and Wisconsin.
16
|
Item 2.
|
PROPERTIES (Continued)
|
|
|
Corn Processing
|
|||||||||||||
|
|
Processing Plants
|
Procurement
Facilities
|
||||||||||||
|
|
Owned
|
Owned
|
||||||||||||
|
Wet Milling
|
Dry Milling
|
Other
|
Total
|
Wet Milling,
Dry Milling,
& Other
|
||||||||||
|
North America
|
|
|
|
|
|
|||||||||
|
U.S.*
|
5
|
|
3
|
|
28
|
|
36
|
|
6
|
|
||||
|
Canada
|
—
|
|
—
|
|
3
|
|
3
|
|
—
|
|
||||
|
Puerto Rico
|
—
|
|
—
|
|
3
|
|
3
|
|
—
|
|
||||
|
Trinidad & Tobago
|
—
|
|
—
|
|
1
|
|
1
|
|
—
|
|
||||
|
Total
|
5
|
|
3
|
|
35
|
|
43
|
|
6
|
|
||||
|
Daily/Storage capacity
|
||||||||||||||
|
Metric tons (in 1,000’s)
|
43
|
|
22
|
|
15
|
|
80
|
|
377
|
|
||||
|
Europe
|
|
|
|
|
|
|
|
|
|
|
||||
|
Bulgaria
|
1
|
|
—
|
|
—
|
|
1
|
|
—
|
|
||||
|
Turkey
|
1
|
|
—
|
|
—
|
|
1
|
|
—
|
|
||||
|
Total
|
2
|
|
—
|
|
—
|
|
2
|
|
—
|
|
||||
|
Daily/Storage capacity
|
||||||||||||||
|
Metric tons (in 1,000’s)
|
2
|
|
—
|
|
—
|
|
2
|
|
—
|
|
||||
|
Asia
|
|
|
|
|
|
|
|
|
|
|
||||
|
China
|
—
|
|
—
|
|
4
|
|
4
|
|
—
|
|
||||
|
Total
|
—
|
|
—
|
|
4
|
|
4
|
|
—
|
|
||||
|
Daily/Storage capacity
|
||||||||||||||
|
Metric tons (in 1,000’s)
|
—
|
|
—
|
|
—
|
|
—
|
|
—
|
|
||||
|
Africa
|
|
|
|
|
|
|
|
|
|
|
||||
|
Morocco
|
1
|
|
—
|
|
—
|
|
1
|
|
—
|
|
||||
|
Total
|
1
|
|
—
|
|
—
|
|
1
|
|
—
|
|
||||
|
Daily/Storage capacity
|
||||||||||||||
|
Metric tons (in 1,000’s)
|
55
|
|
—
|
|
—
|
|
55
|
|
—
|
|
||||
|
Grand Total
|
8
|
|
3
|
|
39
|
|
50
|
|
6
|
|
||||
|
Total daily/storage capacity
|
|
|
|
|
|
|
|
|
|
|
||||
|
Metric tons (in 1,000’s)
|
100
|
|
22
|
|
15
|
|
137
|
|
377
|
|
||||
*The U.S. processing plants are located in Georgia, Illinois, Indiana, Iowa, Kansas, Kentucky, Michigan, Minnesota, Missouri, Nebraska, North Carolina, Ohio, Pennsylvania, Texas, and Washington.
* The U.S. procurement facilities are located in Illinois and Minnesota.
17
|
Item 2.
|
PROPERTIES (Continued)
|
|
|
Oilseeds Processing Plants
|
|||||||||||||||||||
|
|
Owned
|
Leased
|
||||||||||||||||||
|
Crushing &
Origination
|
Refining,
Packaging,
Biodiesel, &
Other
|
Asia
|
Total
|
Crushing & Origination
|
Asia
|
Total
|
||||||||||||||
|
North America
|
|
|
|
|
|
|||||||||||||||
|
U.S.*
|
24
|
|
37
|
|
—
|
|
61
|
|
—
|
|
—
|
|
—
|
|
||||||
|
Canada
|
3
|
|
4
|
|
—
|
|
7
|
|
—
|
|
—
|
|
—
|
|
||||||
|
Mexico
|
1
|
|
—
|
|
—
|
|
1
|
|
—
|
|
—
|
|
—
|
|
||||||
|
Total
|
28
|
|
41
|
|
—
|
|
69
|
|
—
|
|
—
|
|
—
|
|
||||||
|
Daily capacity
|
|
|
|
|
|
|
|
|
|
|
|
|
|
|
||||||
|
Metric tons (in 1,000’s)
|
59
|
|
20
|
|
—
|
|
79
|
|
—
|
|
—
|
|
—
|
|
||||||
|
South America
|
|
|
|
|
|
|
|
|
|
|
|
|
|
|
||||||
|
Argentina
|
—
|
|
1
|
|
—
|
|
1
|
|
—
|
|
—
|
|
—
|
|
||||||
|
Bolivia
|
1
|
|
2
|
|
—
|
|
3
|
|
—
|
|
—
|
|
—
|
|
||||||
|
Brazil
|
5
|
|
8
|
|
—
|
|
13
|
|
1
|
|
—
|
|
1
|
|
||||||
|
Paraguay
|
1
|
|
—
|
|
—
|
|
1
|
|
—
|
|
—
|
|
—
|
|
||||||
|
Peru
|
—
|
|
1
|
|
—
|
|
1
|
|
—
|
|
—
|
|
—
|
|
||||||
|
Total
|
7
|
|
12
|
|
—
|
|
19
|
|
1
|
|
—
|
|
1
|
|
||||||
|
Daily capacity
|
|
|
|
|
|
|
|
|
|
|
|
|
|
|
||||||
|
Metric tons (in 1,000’s)
|
17
|
|
5
|
|
—
|
|
22
|
|
1
|
|
—
|
|
1
|
|
||||||
|
Europe
|
|
|
|
|
|
|
|
|
|
|
|
|
|
|
||||||
|
Belgium
|
—
|
|
2
|
|
—
|
|
2
|
|
—
|
|
—
|
|
—
|
|
||||||
|
Czech Republic
|
1
|
|
1
|
|
—
|
|
2
|
|
—
|
|
—
|
|
—
|
|
||||||
|
France
|
—
|
|
1
|
|
—
|
|
1
|
|
—
|
|
—
|
|
—
|
|
||||||
|
Germany
|
4
|
|
8
|
|
—
|
|
12
|
|
—
|
|
—
|
|
—
|
|
||||||
|
Netherlands
|
1
|
|
1
|
|
—
|
|
2
|
|
—
|
|
—
|
|
—
|
|
||||||
|
Poland
|
2
|
|
5
|
|
—
|
|
7
|
|
—
|
|
—
|
|
—
|
|
||||||
|
Switzerland
|
—
|
|
1
|
|
—
|
|
1
|
|
—
|
|
—
|
|
—
|
|
||||||
|
Ukraine
|
1
|
|
—
|
|
—
|
|
1
|
|
—
|
|
—
|
|
—
|
|
||||||
|
United Kingdom
|
1
|
|
3
|
|
—
|
|
4
|
|
—
|
|
—
|
|
—
|
|
||||||
|
Total
|
10
|
|
22
|
|
—
|
|
32
|
|
—
|
|
—
|
|
—
|
|
||||||
|
Daily capacity
|
||||||||||||||||||||
|
Metric tons (in 1,000’s)
|
34
|
|
16
|
|
—
|
|
50
|
|
—
|
|
—
|
|
—
|
|
||||||
|
Asia
|
|
|
|
|
|
|
|
|
|
|
|
|
|
|
||||||
|
India
|
—
|
|
—
|
|
2
|
|
2
|
|
—
|
|
1
|
|
1
|
|
||||||
|
Total
|
—
|
|
—
|
|
2
|
|
2
|
|
—
|
|
1
|
|
1
|
|
||||||
|
Daily capacity
|
||||||||||||||||||||
|
Metric tons (in 1,000’s)
|
—
|
|
—
|
|
1
|
|
1
|
|
—
|
|
1
|
|
1
|
|
||||||
|
Africa
|
|
|
|
|
|
|
|
|
|
|
|
|
|
|
||||||
|
South Africa
|
—
|
|
4
|
|
—
|
|
4
|
|
—
|
|
—
|
|
—
|
|
||||||
|
Total
|
—
|
|
4
|
|
—
|
|
4
|
|
—
|
|
—
|
|
—
|
|
||||||
|
Daily capacity
|
||||||||||||||||||||
|
Metric tons (in 1,000’s)
|
—
|
|
2
|
|
—
|
|
2
|
|
—
|
|
—
|
|
—
|
|
||||||
|
Grand Total
|
45
|
|
79
|
|
2
|
|
126
|
|
1
|
|
1
|
|
2
|
|
||||||
|
Total daily capacity
|
|
|
|
|
|
|
|
|
|
|
|
|
|
|
||||||
|
Metric tons (in 1,000’s)
|
110
|
|
43
|
|
1
|
|
154
|
|
1
|
|
1
|
|
2
|
|
||||||
*The U.S. plants in the table above are located in Alabama, Florida, Georgia, Illinois, Indiana, Iowa, Kansas, Minnesota, Missouri, Nebraska, North Dakota, Ohio, South Carolina, Tennessee, and Texas.
18
|
Item 2.
|
PROPERTIES (Continued)
|
|
|
Oilseeds Processing Procurement Facilities
|
||||||||||||||||
|
|
Owned
|
Leased
|
|||||||||||||||
|
Crushing &
Origination
|
Refining, Packaging, Biodiesel, &
Other
|
Total
|
Crushing &
Origination
|
Refining, Packaging, Biodiesel, &
Other |
Total
|
||||||||||||
|
North America
|
|
|
|
|
|
|
|||||||||||
|
U.S.*
|
4
|
|
87
|
|
91
|
|
—
|
|
64
|
|
64
|
|
|||||
|
Canada
|
6
|
|
—
|
|
6
|
|
—
|
|
—
|
|
—
|
|
|||||
|
Mexico
|
—
|
|
—
|
|
—
|
|
—
|
|
1
|
|
1
|
|
|||||
|
Total
|
10
|
|
87
|
|
97
|
|
—
|
|
65
|
|
65
|
|
|||||
|
Storage capacity
|
|||||||||||||||||
|
Metric tons (in 1,000’s)
|
329
|
|
373
|
|
702
|
|
—
|
|
210
|
|
210
|
|
|||||
|
South America
|
|
|
|
|
|
|
|
|
|
|
|
|
|||||
|
Argentina
|
—
|
|
—
|
|
—
|
|
1
|
|
—
|
|
1
|
|
|||||
|
Bolivia
|
5
|
|
—
|
|
5
|
|
—
|
|
—
|
|
—
|
|
|||||
|
Brazil
|
36
|
|
—
|
|
36
|
|
—
|
|
—
|
|
—
|
|
|||||
|
Chile
|
—
|
|
—
|
|
—
|
|
2
|
|
—
|
|
2
|
|
|||||
|
Colombia
|
—
|
|
—
|
|
—
|
|
8
|
|
—
|
|
8
|
|
|||||
|
Paraguay
|
14
|
|
—
|
|
14
|
|
2
|
|
—
|
|
2
|
|
|||||
|
Peru
|
—
|
|
—
|
|
—
|
|
3
|
|
—
|
|
3
|
|
|||||
|
Uruguay
|
1
|
|
—
|
|
1
|
|
6
|
|
—
|
|
6
|
|
|||||
|
Total
|
56
|
|
—
|
|
56
|
|
22
|
|
—
|
|
22
|
|
|||||
|
Storage capacity
|
|||||||||||||||||
|
Metric tons (in 1,000’s)
|
1,963
|
|
—
|
|
1,963
|
|
375
|
|
—
|
|
375
|
|
|||||
|
Europe
|
|
|
|
|
|
|
|
|
|
|
|
|
|||||
|
Germany
|
4
|
|
—
|
|
4
|
|
—
|
|
—
|
|
—
|
|
|||||
|
Netherlands
|
1
|
|
—
|
|
1
|
|
—
|
|
—
|
|
—
|
|
|||||
|
Poland
|
4
|
|
—
|
|
4
|
|
—
|
|
—
|
|
—
|
|
|||||
|
Slovakia
|
2
|
|
—
|
|
2
|
|
—
|
|
—
|
|
—
|
|
|||||
|
United Kingdom
|
—
|
|
—
|
|
—
|
|
3
|
|
—
|
|
3
|
|
|||||
|
Total
|
11
|
|
—
|
|
11
|
|
3
|
|
—
|
|
3
|
|
|||||
|
Storage capacity
|
|||||||||||||||||
|
Metric tons (in 1,000’s)
|
800
|
|
—
|
|
800
|
|
81
|
|
—
|
|
81
|
|
|||||
|
Grand Total
|
77
|
|
87
|
|
164
|
|
25
|
|
65
|
|
90
|
|
|||||
|
Total storage capacity
|
|
|
|
|
|
|
|
|
|
|
|
|
|||||
|
Metric tons (in 1,000’s)
|
3,092
|
|
373
|
|
3,465
|
|
456
|
|
210
|
|
666
|
|
|||||
*The U.S. procurement facilities are located in Alabama, Arkansas, Florida, Georgia, Iowa, Michigan, Mississippi, North Carolina, Oklahoma, South Carolina, Texas, and Virginia.
19
|
Item 2.
|
PROPERTIES (Continued)
|
|
|
Wild Flavors and Specialty Ingredients
|
|||||||
|
|
Processing Plants
|
Procurement Facilities
|
||||||
|
|
Owned
|
Leased
|
Owned
|
|||||
|
North America
|
|
|
||||||
|
U.S.*
|
20
|
|
6
|
|
19
|
|
||
|
Canada
|
2
|
|
—
|
|
—
|
|
||
|
Total
|
22
|
|
6
|
|
19
|
|
||
|
Daily/Storage capacity
|
||||||||
|
Metric tons (in 1,000’s)
|
—
|
|
—
|
|
324
|
|
||
|
South America
|
||||||||
|
Brazil
|
2
|
|
—
|
|
1
|
|
||
|
Total
|
2
|
|
—
|
|
1
|
|
||
|
Daily/Storage capacity
|
||||||||
|
Metric tons (in 1,000’s)
|
—
|
|
—
|
|
—
|
|
||
|
Europe
|
|
|
|
|||||
|
France
|
1
|
|
—
|
|
—
|
|
||
|
Germany
|
2
|
|
1
|
|
—
|
|
||
|
Netherlands
|
—
|
|
1
|
|
—
|
|
||
|
Poland
|
2
|
|
—
|
|
—
|
|
||
|
Spain
|
1
|
|
—
|
|
—
|
|
||
|
Turkey
|
—
|
|
1
|
|
—
|
|
||
|
Total
|
6
|
|
3
|
|
—
|
|
||
|
Daily/Storage capacity
|
||||||||
|
Metric tons (in 1,000’s)
|
—
|
|
—
|
|
—
|
|
||
|
Asia
|
||||||||
|
India
|
—
|
|
1
|
|
—
|
|
||
|
Japan
|
1
|
|
—
|
|
—
|
|
||
|
Singapore
|
—
|
|
1
|
|
—
|
|
||
|
Total
|
1
|
|
2
|
|
—
|
|
||
|
Daily/Storage capacity
|
||||||||
|
Metric tons (in 1,000’s)
|
—
|
|
—
|
|
—
|
|
||
|
Grand Total
|
31
|
|
11
|
|
20
|
|
||
|
Total storage capacity
|
|
|
|
|
|
|
||
|
Metric tons (in 1,000’s)
|
—
|
|
—
|
|
324
|
|
||
*The U.S. processing plants are located in California, Illinois, Iowa, Kentucky, Michigan, Nebraska, New Jersey, North Dakota, Ohio, and Washington.
*The U.S. procurement facilities are located in Idaho, Michigan, Minnesota, North Dakota, and Wyoming.
20
|
Item 3.
|
LEGAL PROCEEDINGS
|
The Company is routinely involved in a number of actual or threatened legal actions, including those involving alleged personal injuries, employment law, product liability, intellectual property, environmental issues, alleged tax liability (see Note 13 in Item 8 for information on income tax matters), and class actions. The Company also routinely receives inquiries from regulators and other government authorities relating to various aspects of our business, and at any given time, the Company has matters at various stages of resolution with the applicable government authorities. The outcomes of these matters are not within our complete control and may not be known for prolonged periods of time. In some actions, claimants seek damages, as well as other relief, including injunctive relief, that could require significant expenditures or result in lost revenues. In accordance with applicable accounting standards, the Company records a liability in its consolidated financial statements for material loss contingencies when a loss is known or considered probable and the amount can be reasonably estimated. If the reasonable estimate of a known or probable loss is a range, and no amount within the range is a better estimate than any other, the minimum amount of the range is accrued. If a material loss contingency is reasonably possible but not known or probable, and can be reasonably estimated, the estimated loss or range of loss is disclosed in the notes to the consolidated financial statements. When determining the estimated loss or range of loss, significant judgment is required to estimate the amount and timing of a loss to be recorded. Estimates of probable losses resulting from litigation and governmental proceedings involving the Company are inherently difficult to predict, particularly when the matters are in early procedural stages, with incomplete facts or legal discovery; involve unsubstantiated or indeterminate claims for damages; potentially involve penalties, fines, disgorgement, or punitive damages; or could result in a change in business practice. See Note 20 of Item 8 for information on the Company’s legal proceedings.
|
Item 4.
|
MINE SAFETY DISCLOSURES
|
None.
21
|
Item 5.
|
MARKET FOR REGISTRANT’S COMMON EQUITY, RELATED STOCKHOLDER MATTERS, AND ISSUER PURCHASES OF EQUITY SECURITIES
|
Common Stock Market Prices and Dividends
The Company’s common stock is listed and traded on the New York Stock Exchange. The following table sets forth, for the periods indicated, the high and low market prices of the common stock as reported on the New York Stock Exchange and common stock cash dividends declared per share.
|
|
|
|
Cash
|
||||||||
|
|
Market Price
|
Dividends
|
|||||||||
|
|
High
|
Low
|
Per Share
|
||||||||
|
Fiscal Year 2016-Quarter Ended
|
|||||||||||
|
December 31
|
$
|
47.88
|
|
$
|
41.44
|
|
$
|
0.30
|
|
||
|
September 30
|
45.39
|
|
41.21
|
|
0.30
|
|
|||||
|
June 30
|
44.14
|
|
34.55
|
|
0.30
|
|
|||||
|
March 31
|
38.96
|
|
29.86
|
|
0.30
|
|
|||||
|
Fiscal Year 2015-Quarter Ended
|
|
|
|
|
|
|
|||||
|
December 31
|
$
|
47.03
|
|
$
|
33.84
|
|
$
|
0.28
|
|
||
|
September 30
|
49.50
|
|
40.66
|
|
0.28
|
|
|||||
|
June 30
|
53.31
|
|
47.23
|
|
0.28
|
|
|||||
|
March 31
|
52.60
|
|
45.15
|
|
0.28
|
|
|||||
The number of registered stockholders of the Company’s common stock at
December 31, 2016
, was
10,381
.
The Company expects to continue its policy of paying regular cash dividends, although there is no assurance as to future dividends because they are dependent on future earnings, capital requirements, and financial condition.
Issuer Purchases of Equity Securities
|
Period
|
Total Number
of Shares Purchased (1)
|
Average
Price Paid per Share
|
Total Number of
Shares Purchased as
Part of Publicly Announced Program (2)
|
Number of Shares
Remaining to be
Purchased Under the Program (2)
|
|||||||||
|
October 1, 2016 to
October 31, 2016
|
2,453,840
|
|
$
|
42.408
|
|
2,453,840
|
|
34,524,426
|
|
||||
|
November 1, 2016 to
November 30, 2016
|
1,218,734
|
|
43.498
|
|
1,218,734
|
|
33,305,692
|
|
|||||
|
December 1, 2016 to
December 31, 2016
|
1,967,783
|
|
45.173
|
|
1,967,783
|
|
31,337,909
|
|
|||||
|
Total
|
5,640,357
|
|
$
|
43.608
|
|
5,640,357
|
|
31,337,909
|
|
||||
(1) Total shares purchased represent those shares purchased in the open market as part of the Company’s publicly announced stock repurchase program described below, shares received as payment for the exercise price of stock option exercises, and shares received as payment for the withholding taxes on vested restricted stock awards. During the three-month period ended
December 31, 2016
, there were
no
shares received as payments for the minimum withholding taxes on vested restricted stock awards and for the exercise price of stock option exercises.
(2) On November 5, 2014, the Company’s Board of Directors approved a stock repurchase program authorizing the Company to repurchase up to 100,000,000 shares of the Company’s common stock during the period commencing January 1, 2015 and ending December 31, 2019.
22
|
Item 5.
|
MARKET FOR REGISTRANT’S COMMON EQUITY, RELATED STOCKHOLDER MATTERS, AND ISSUER PURCHASES OF EQUITY SECURITIES (Continued)
|
Performance Graph
The graph below compares the Company’s common stock with those of the S&P 500 Index and the S&P Consumer Staples Index. The graph assumes an initial investment of $100 on June 30, 2011 and assumes all dividends have been reinvested through
December 31, 2016
.
COMPARISON OF 66 MONTH CUMULATIVE TOTAL RETURN
Among Archer Daniels Midland Company (ADM), the S&P 500 Index, and the S&P Consumer Staples
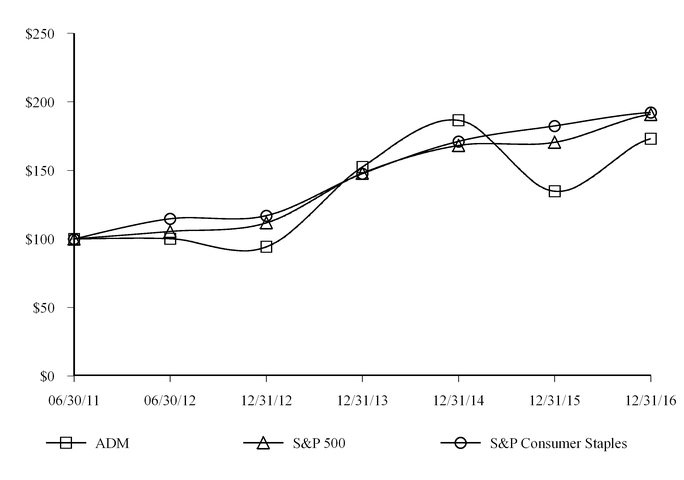
Copyright© 2013 S&P, a division of The McGraw-Hill Companies Inc. All rights reserved.
23
|
Item 6.
|
SELECTED FINANCIAL DATA
|
Selected Financial Data
(In millions, except ratio and per share data)
|
Six Months
|
Fiscal Year
|
||||||||||||||||||||||||||
|
Years Ended
|
Ended
|
Ended
|
|||||||||||||||||||||||||
|
|
December 31
|
December 31
|
June 30
|
||||||||||||||||||||||||
|
|
2016
|
2015
|
2014
|
2013
|
2012
|
2011
(1)
|
2012
|
||||||||||||||||||||
|
Revenues
|
$
|
62,346
|
|
$
|
67,702
|
|
$
|
81,201
|
|
$
|
89,804
|
|
$
|
46,729
|
|
$
|
45,208
|
|
$
|
89,038
|
|
||||||
|
Depreciation
|
787
|
|
799
|
|
850
|
|
827
|
|
396
|
|
391
|
|
793
|
|
|||||||||||||
|
Net earnings attributable to controlling interests
|
1,279
|
|
1,849
|
|
2,248
|
|
1,342
|
|
692
|
|
540
|
|
1,223
|
|
|||||||||||||
|
Basic earnings per common share
|
2.18
|
|
2.99
|
|
3.44
|
|
2.03
|
|
1.05
|
|
0.81
|
|
1.84
|
|
|||||||||||||
|
Diluted earnings per common share
|
2.16
|
|
2.98
|
|
3.43
|
|
2.02
|
|
1.05
|
|
0.81
|
|
1.84
|
|
|||||||||||||
|
Cash dividends
|
701
|
|
687
|
|
624
|
|
501
|
|
230
|
|
224
|
|
455
|
|
|||||||||||||
|
Per common share
|
1.20
|
|
1.12
|
|
0.96
|
|
0.76
|
|
0.35
|
|
0.335
|
|
0.685
|
|
|||||||||||||
|
Working capital
|
7,872
|
|
8,324
|
|
10,426
|
|
12,872
|
|
12,769
|
|
12,395
|
|
12,328
|
|
|||||||||||||
|
Current ratio
|
1.6
|
|
1.6
|
|
1.7
|
|
1.8
|
|
1.8
|
|
1.8
|
|
1.8
|
|
|||||||||||||
|
Inventories
|
8,831
|
|
8,243
|
|
9,374
|
|
11,441
|
|
13,836
|
|
12,415
|
|
12,192
|
|
|||||||||||||
|
Net property, plant, and equipment
|
9,758
|
|
9,853
|
|
9,851
|
|
10,069
|
|
10,097
|
|
9,601
|
|
9,787
|
|
|||||||||||||
|
Gross additions to property, plant, and equipment
|
882
|
|
1,350
|
|
1,357
|
|
947
|
|
641
|
|
1,058
|
|
1,719
|
|
|||||||||||||
|
Total assets
|
39,769
|
|
40,157
|
|
43,997
|
|
43,720
|
|
45,100
|
|
41,661
|
|
41,734
|
|
|||||||||||||
|
Long-term debt, excluding current maturities
|
6,504
|
|
5,779
|
|
5,528
|
|
5,315
|
|
6,420
|
|
6,722
|
|
6,498
|
|
|||||||||||||
|
Shareholders’ equity
|
17,181
|
|
17,915
|
|
19,630
|
|
20,194
|
|
19,131
|
|
18,165
|
|
18,169
|
|
|||||||||||||
|
Per common share
|
29.98
|
|
30.11
|
|
30.82
|
|
30.64
|
|
29.03
|
|
27.44
|
|
27.57
|
|
|||||||||||||
|
Weighted average shares outstanding-basic
|
588
|
|
618
|
|
653
|
|
661
|
|
660
|
|
669
|
|
665
|
|
|||||||||||||
|
Weighted average shares outstanding-diluted
|
591
|
|
621
|
|
656
|
|
663
|
|
661
|
|
670
|
|
666
|
|
|||||||||||||
(1)
Unaudited
Significant items affecting the comparability of the financial data shown above are as follows:
|
•
|
Net earnings attributable to controlling interests for the year ended December 31, 2016 include gains totaling
$119 million
(
$100 million
after tax, equal to
$0.17
per share) primarily related to recovery of loss provisions and gains related to the sale of the Company’s Brazilian sugar ethanol facilities, realized contingent consideration on the sale of the Company’s equity investment in Gruma S.A. de C.V. in December 2012, and revaluation of the remaining interest to settlement value in conjunction with the acquisition of Amazon Flavors as discussed in Note 12 in Item 8; a gain of
$38 million
(
$24 million
after tax, equal to
$0.04
per share) related to a U.S. retiree medical benefit plan curtailment; charges of
$117 million
(
$77 million
after tax, equal to
$0.13
per share) primarily related to legal fees and settlement, impairment of software, investments, and certain long-lived assets; a
$10 million
(
$8 million
after tax, equal to
$0.02
per share) loss on sale of individually immaterial assets as discussed in Note 12 in Item 8; and certain discrete tax adjustments totaling
$24 million
(equal to
$0.04
per share) related to valuation allowances, deferred tax re-rates, and changes in assertion.
|
24
|
Item 6.
|
SELECTED FINANCIAL DATA (Continued)
|
|
•
|
Net earnings attributable to controlling interests for the year ended December 31, 2015 include gains totaling $530 million ($515 million after tax, equal to $0.83 per share) related primarily to the sale of the cocoa, chocolate, and lactic businesses, revaluation of the Company’s previously held investments in North Star Shipping, Minmetal, and Eaststarch C.V. in conjunction with the acquisition of the remaining interests, and the sale of a 50% interest in the Barcarena export terminal facility in Brazil to Glencore plc as discussed in Note 12 in Item 8; long-lived asset impairment charges of $129 million ($109 million after tax, equal to $0.18 per share) related primarily to certain international Oilseeds Processing facilities, sugar ethanol facilities in Brazil, and goodwill, intangible, and property, plant, and equipment asset impairments as discussed in Note 18 in Item 8; restructuring and exit charges of $71 million ($63 million after tax, equal to $0.10 per share) related to an international pension plan settlement, sugar ethanol facilities in Brazil, and other restructuring charges as discussed in Note 18 in Item 8; loss provisions, settlements, and inventory writedown of $67 million ($58 million after tax, equal to $0.09 per share); certain discrete tax adjustments totaling $60 million (equal to $0.10 per share) related to valuation allowances and deferred tax re-rates; and loss on debt extinguishment of $189 million ($118 million after tax, equal to $0.19 per share) related to the cash tender offers and redemption of certain of the Company’s outstanding debentures as discussed in Note 12 in Item 8.
|
|
•
|
Net earnings attributable to controlling interests for the year ended December 31, 2014 include a gain on sale of assets related to the sale of the fertilizer business and other asset of $135 million ($89 million after tax, equal to $0.14 per share); gain of $156 million ($97 million after tax, equal to $0.15 per share) upon the Company’s effective dilution in the Pacificor (formerly Kalama Export Company) joint venture resulting from the contribution of additional assets by another member in exchange for new equity units; and loss of $102 million ($63 million after tax, equal to $0.10 per share) on Euro foreign currency derivative contracts entered into to economically hedge the Wild Flavors acquisition, as discussed in Note 12 in Item 8; asset impairment charges related to certain fixed assets of $41 million ($26 million after tax, equal to $0.04 per share) and $64 million ($41 million after tax, equal to $0.06 per share) of costs related to the relocation of the global headquarters to Chicago, Illinois, and restructuring charges related to the Wild Flavors acquisition and Toepfer integration following the acquisition of the minority interest and other restructuring charges, as discussed in Note 18 in Item 8; a charge of $98 million ($61 million after tax, equal to $0.09 per share) related to pension settlements; and certain discrete tax adjustments of $15 million (equal to $0.02 per share) related to deferred tax re-rates.
|
|
•
|
Net earnings attributable to controlling interests for the year ended December 31, 2013 include other-than-temporary impairment charges of $155 million ($155 million after tax, equal to $0.23 per share) on the Company’s GrainCorp investment; asset impairment charges of $51 million ($51 million after tax, equal to $0.08 per share) related to the Company’s Brazilian sugar milling business; and other impairment charges principally for certain property, plant and equipment assets totaling $53 million ($34 million after tax, equal to $0.05 per share); realized losses on Australian dollar currency hedges of $40 million ($25 million after tax, equal to $0.04 per share) related to the proposed GrainCorp acquisition; valuation allowance on certain deferred tax assets of $82 million (equal to $0.12 per share); income tax benefit recognized in the current period of $55 million (equal to $0.08 per share) related to biodiesel blending credits earned in the prior periods; charges of $54 million ($37 million after tax, equal to $0.06 per share) related to the FCPA settlement; and other charges of $18 million ($12 million after tax, equal to $0.02 per share).
|
|
•
|
Net earnings attributable to controlling interests for the six months ended December 31, 2012 include an asset impairment charge of $146 million ($107 million after tax, equal to $0.16 per share) related to the Company’s investments associated with Gruma; a gain of $62 million ($49 million after tax, equal to $0.07 per share) related to the Company’s interest in GrainCorp; a gain of $39 million ($24 million after tax, equal to $0.04 per share) related to the sale of certain of the Company’s exchange membership interests; and charges of $68 million ($44 million after tax, equal to $0.07 per share) related to pension settlements.
|
|
•
|
Net earnings attributable to controlling interests for the six months ended December 31, 2011 include exit costs and asset impairment charges of $352 million ($222 million after tax, equal to $0.33 per share) related primarily to the writedown of the Company’s Clinton, IA bioplastics facility.
|
|
•
|
Net earnings attributable to controlling interests for the year ended June 30, 2012 include exit costs and asset impairment charges of $437 million ($274 million after tax, equal to $0.41 per share) related primarily to the bioplastics facility and global workforce reduction program.
|
25
|
Item 7.
|
MANAGEMENT’S DISCUSSION AND ANALYSIS OF FINANCIAL CONDITION AND RESULTS OF OPERATIONS
|
Company Overview
This MD&A should be read in conjunction with the accompanying consolidated financial statements.
The Company is principally engaged in procuring, transporting, storing, processing, and merchandising agricultural commodities and products. The Company uses its significant global asset base to originate and transport agricultural commodities, connecting to markets in
163
countries. The Company also processes corn, oilseeds, and wheat into products for food, animal feed, chemical and energy uses. The Company uses its global asset network, business acumen, and its relationships with suppliers and customers to efficiently connect the harvest to the home thereby generating returns for our shareholders, principally from margins earned on these activities.
The Company’s operations are organized, managed, and classified into four reportable business segments: Agricultural Services, Corn Processing, Oilseeds Processing, and Wild Flavors and Specialty Ingredients. Each of these segments is organized based upon the nature of products and services offered. The Company’s remaining operations are not reportable business segments, as defined by the applicable accounting standard, and are classified as Other. See Note 17 of Item 8 for more information about the Company’s business segments.
The Company’s recent significant portfolio actions and announcements include:
|
•
|
the purchase in February 2016 of a controlling stake in Harvest Innovations, an industry leader in minimally processed, expeller-pressed soy proteins, oils, and gluten-free ingredients;
|
|
•
|
the purchase in April 2016 of a 50% interest in Cairo-based Medsofts Group, a consolidated joint venture that owns and manages merchandising and supply chain operations;
|
|
•
|
the sale in May 2016 of the sugarcane ethanol operations in Limeira do Oeste in the Brazilian state of Minas Gerais;
|
|
•
|
the purchase in May 2016 of the remaining 60% interest in Amazon Flavors, a leading Brazilian manufacturer of natural extracts, emulsions and compounds;
|
|
•
|
the acquisition in June 2016 of a Casablanca, Morocco-based corn wet mill that produces glucose and native starch;
|
|
•
|
the purchase in September 2016 of Caterina Foods, a leading toll manufacturer of specialty gluten-free and high-protein pastas;
|
|
•
|
the expansion in November 2016 of Olenex, a
37.5%
joint venture with Wilmar, from a sales and marketing venture to a full function joint venture which owns and operates specialty oils and fats, palm refining, and tropical oils processing plants in Europe;
|
|
•
|
the sale in December 2016 of the Company's
19.8%
ownership interest in GrainCorp;
|
|
•
|
the announcement in January 2017 of the sale of the Company's crop risk services businesses to Validus Holdings, a global group of insurance and reinsurance companies, which is subject to regulatory approval and expected to close in the first half of 2017; and
|
|
•
|
the acquisition in February 2017 of Crosswind Industries, Inc., an industry leader in the manufacture of contract and private label pet treats and foods, as well as specialty ingredients.
|
As part of the implementation of the Company’s strategic plan, the Company continues to evaluate the capital intensity of its operations and portfolio, seeking ways to reduce and redeploy capital in its efforts to drive long-term returns.
Operating Performance Indicators
The Company’s agricultural services and oilseeds processing operations are principally agricultural commodity-based businesses where changes in selling prices move in relationship to changes in prices of the commodity-based agricultural raw materials. Therefore, changes in agricultural commodity prices have relatively equal impacts on both revenues and cost of products sold. Thus, changes in revenues of these businesses do not necessarily correspond to the changes in margins or gross profit.
The Company’s corn processing operations and Wild Flavors and Specialty Ingredients businesses also utilize agricultural commodities (or products derived from agricultural commodities) as raw materials. However, in these operations, agricultural commodity market price changes do not necessarily equal changes in cost of products sold. Thus, changes in revenues of these businesses may correspond to changes in margins or gross profit.
26
|
Item 7.
|
MANAGEMENT’S DISCUSSION AND ANALYSIS OF FINANCIAL CONDITION AND RESULTS OF OPERATIONS (Continued)
|
The Company has consolidated subsidiaries in
76
countries. For the majority of the Company’s subsidiaries located outside the United States, the local currency is the functional currency. Revenues and expenses denominated in foreign currencies are translated into U.S. dollars at the weighted average exchange rates for the applicable periods. For the majority of the Company’s business activities in Brazil, the functional currency is the U.S. dollar; however, certain transactions, including taxes, occur in local currency and require conversion to the functional currency. Changes in revenues are expected to be correlated to changes in expenses reported by the Company caused by fluctuations in the exchange rates of foreign currencies, primarily the Euro, British pound, Canadian dollar, and Brazilian real, as compared to the U.S. dollar.
The Company measures its performance using key financial metrics including net earnings, segment operating profit, return on invested capital, EBITDA, economic value added, manufacturing expenses, and selling, general, and administrative expenses. The Company’s financial results can vary significantly due to changes in factors such as fluctuations in energy prices, weather conditions, crop plantings, government programs and policies, changes in global demand, general global economic conditions, changes in standards of living, and global production of similar and competitive crops. Due to these unpredictable factors, the Company undertakes no responsibility for updating any forward-looking information contained within “Management’s Discussion and Analysis of Financial Condition and Results of Operations.”
Year Ended December 31,
2016
Compared to Year Ended December 31,
2015
As an agricultural commodity-based business, the Company is subject to a variety of market factors which affect the Company's operating results. Agricultural Services was negatively impacted in the first half of the year by weak U.S. grain export competitiveness and decreased global merchandising opportunities. Starting in the third quarter, export volumes and margins improved due to the U.S. harvest and weather conditions in South America. In Corn Processing, global demand for sweeteners and starches and U.S. exports, principally to Mexico, continued to grow. In Europe, raw material costs improved resulting in improved margins. Corn-based ethanol remained a very competitive transportation fuel, and domestic blending was strong as U.S. gasoline demand was up compared to 2015. U.S. ethanol also continued to be the one of the cheapest oxygenates in the world, driving strong export volumes throughout 2016. Industry production levels remained high during the year limiting margins. In Oilseeds Processing, global crushing operations achieved strong capacity utilization although margins were weaker mainly due to higher supply of soybean meal from Argentina, and other protein meal substitutes. Softseed margins improved due to better seed supply and oil demand. Vegetable oils continued to maintain a steady demand from the food industry. Additionally, vegetable oil sales volumes benefited from demand driven by the U.S. 2016 biodiesel blenders credit. The Wild Flavors and Specialty Ingredients business benefited from increased demand for flavor ingredients and flavor systems, specialty proteins, natural health and nutrition products, and polyols, but was adversely impacted by soft market conditions in non-flavor food ingredient markets and a strong U.S. dollar, as well as operational issues at the specialty commodities unit.
Net earnings attributable to controlling interests decreased
$0.6 billion
to
$1.3 billion
. Segment operating profit decreased
$0.6 billion
to
$2.7 billion
, primarily due to the prior year gain on sale of the global cocoa and chocolate businesses and lower earnings in the current year due to the sale of those businesses, weaker global crushing and origination margins, and lower international merchandising results, partially offset by better ethanol results. Corporate results in the current year include a charge of
$19 million
from the effect of changes in agricultural commodity prices on LIFO inventory valuation reserves, compared to a credit of
$2 million
in the prior year and a decrease of approximately $70 million in the Company’s share of the results of Compagnie Industrielle et Financiere des Produits Amylaces SA (Luxembourg) (CIP).
Income taxes increased
$96 million
due to a higher effective tax rate partially offset by lower earnings before income taxes. The Company’s effective tax rate for 2016 increased to
29.3%
compared to
19.2%
for 2015 due primarily to low tax rates on significant gains related to portfolio actions in 2015, a
$71 million
prior year discrete tax benefit resulting mainly from the release of a $66 million valuation allowance compared to a
$49 million
discrete tax expense in the current year, and changes in the geographic mix of pretax earnings (see Note 13 in Item 8 for more information).
27
|
Item 7.
|
MANAGEMENT’S DISCUSSION AND ANALYSIS OF FINANCIAL CONDITION AND RESULTS OF OPERATIONS (Continued)
|
Analysis of Statements of Earnings
Processed volumes by product for the years ended December 31,
2016
and
2015
are as follows (in metric tons):
|
(In thousands)
|
2016
|
2015
|
Change
|
|||||
|
Oilseeds
|
33,788
|
|
33,817
|
|
(29
|
)
|
||
|
Corn
|
22,273
|
|
23,126
|
|
(853
|
)
|
||
|
Total
|
56,061
|
|
56,943
|
|
(882
|
)
|
||
The Company generally operates its production facilities, on an overall basis, at or near capacity, adjusting facilities individually, as needed, to react to the current margin environment and seasonal local supply and demand conditions. The overall decrease in corn relates to the disposal of the sugar ethanol operations in May 2016 partially offset by volumes from the acquisition of Eaststarch C.V. in November 2015.
Following the sale of the cocoa business in October 2015, the remaining results of Cocoa and Other were combined with the results of Refining, Packaging, Biodiesel, and Other within the Oilseeds Processing segment effective January 1, 2016. Prior period results have been reclassified to conform to the current presentation.
Revenues by segment for the years ended December 31,
2016
and
2015
are as follows:
|
(In millions)
|
2016
|
2015
|
Change
|
||||||||
|
Agricultural Services
|
|
|
|
|
|
|
|||||
|
Merchandising and Handling
|
$
|
24,609
|
|
$
|
25,957
|
|
$
|
(1,348
|
)
|
||
|
Milling and Other
|
3,060
|
|
3,479
|
|
(419
|
)
|
|||||
|
Transportation
|
224
|
|
246
|
|
(22
|
)
|
|||||
|
Total Agricultural Services
|
27,893
|
|
29,682
|
|
(1,789
|
)
|
|||||
|
Corn Processing
|
|
|
|
|
|
|
|||||
|
Sweeteners and Starches
|
4,028
|
|
3,713
|
|
315
|
|
|||||
|
Bioproducts
|
5,438
|
|
6,282
|
|
(844
|
)
|
|||||
|
Total Corn Processing
|
9,466
|
|
9,995
|
|
(529
|
)
|
|||||
|
Oilseeds Processing
|
|
|
|
||||||||
|
Crushing and Origination
|
13,976
|
|
15,597
|
|
(1,621
|
)
|
|||||
|
Refining, Packaging, Biodiesel, and Other
|
7,880
|
|
9,364
|
|
(1,484
|
)
|
|||||
|
Asia
|
296
|
|
256
|
|
40
|
|
|||||
|
Total Oilseeds Processing
|
22,152
|
|
25,217
|
|
(3,065
|
)
|
|||||
|
Wild Flavors and Specialty Ingredients
|
2,427
|
|
2,407
|
|
20
|
|
|||||
|
Total Wild Flavors and Specialty Ingredients
|
2,427
|
|
2,407
|
|
20
|
|
|||||
|
Other - Financial
|
408
|
|
401
|
|
7
|
|
|||||
|
Total Other
|
408
|
|
401
|
|
7
|
|
|||||
|
Total
|
$
|
62,346
|
|
$
|
67,702
|
|
$
|
(5,356
|
)
|
||
28
|
Item 7.
|
MANAGEMENT’S DISCUSSION AND ANALYSIS OF FINANCIAL CONDITION AND RESULTS OF OPERATIONS (Continued)
|
Revenues and cost of products sold in a commodity merchandising and processing business are affected by the underlying commodity prices and volumes. In periods of significant changes in commodity prices, the underlying performance of the Company is better evaluated by looking at margins since both revenues and cost of products sold, particularly in Oilseeds Processing and Agricultural Services, generally have a relatively equal impact from commodity price changes which generally result in an insignificant impact to gross profit.
Revenues decreased
$5.4 billion
, or
8%
, to
$62.3 billion
due to lower average sales prices (
$3.5 billion
), including
$0.6 billion
in foreign currency translation impacts, and lower overall sales volumes (
$1.9 billion
). The decrease in sales prices was due principally to lower underlying agricultural commodity prices, in particular prices of corn, soybeans, and soybean-related products. The decrease in sales volumes was due principally to the sale of the cocoa business and decreased sales volumes of ethanol and South American grain and oilseed origination. Agricultural Services revenues decreased
6%
to
$27.9 billion
due to lower average sales prices (
$2.5 billion
) partially offset by higher sales volumes (
$0.7 billion
). Corn Processing revenues decreased
5%
to
$9.5 billion
due to lower sales volumes (
$0.5 billion
) due principally to ethanol and the sale of the sugar ethanol business partially offset by sales volumes from the acquisition of Eaststarch C.V. Oilseeds Processing revenues decreased
12%
to
$22.2 billion
due to lower average sales prices (
$0.8 billion
) and lower sales volumes (
$2.3 billion
) principally due to South American grains and oilseeds and the sale of the cocoa business. WFSI revenues were flat due to lower average sales prices (
$0.2 billion
) which were offset by higher sales volumes (
$0.2 billion
).
Cost of products sold decreased
$5.0 billion
to
$58.7 billion
due principally to lower average commodity costs, including
$0.6 billion
in foreign currency translation impacts, and lower manufacturing costs. Included in cost of products sold is a charge of
$19 million
from the effect of changes in agricultural commodity prices on LIFO inventory valuation reserves compared to a credit of
$2 million
in the prior year. Manufacturing expenses decreased
$0.2 billion
to
$5.2 billion
primarily due to the sale of the cocoa business, lower energy usage and prices, and decreased repairs and maintenance expenses.
Gross profit decreased
$0.3 billion
, or
8%
, to
$3.7 billion
. The decrease in gross profit consists principally of lower soy crush margins (
$309 million
), reduced merchandising results (
$95 million
) primarily due to Agricultural Services global trade execution and positioning losses, lower volumes and freight rates in barge operations (
$24 million
), the sale of the cocoa business in the prior period (
$78 million
), partially offset by contribution of the recent Eaststarch C.V. acquisition (
$85 million
), and higher results in sweeteners and starches (
$169 million
). These factors are explained in the segment operating profit discussion on page 31. The effect of changes in agricultural commodity prices on LIFO inventory valuation reserves had a
$19 million
negative impact on gross profit compared to a positive impact of
$2 million
in the prior year. The decrease in underlying commodity prices did not result in a significant decrease in margins or gross profit as lower underlying commodity prices had a relatively equal impact on revenues and cost of products sold.
Selling, general, and administrative expenses of
$2.0 billion
were comparable to the prior year. Decreased expenses related to the sale of the cocoa business and a U.S. retiree medical benefit plan curtailment gain were offset by legal settlements, costs, and legal fees, increased transaction fees due to increased trading volume from the brokerage business, and expenses for the recently consolidated Eaststarch C.V.
Asset impairment, exit, and restructuring costs decreased
$145 million
to
$55 million
. Prior year charges include long-lived asset impairments of $129 million related to certain Oilseeds Processing facilities, sugar ethanol facilities in Brazil, a facility in the Corn Processing segment, and capitalized software costs and restructuring and exit costs of $71 million related principally to an international pension plan settlement, sugar ethanol facilities in Brazil, and several individually insignificant restructuring and exit costs. Current year charges include
$11 million
of software impairment in Corporate,
$6 million
of other-than-temporary impairment charges on the Company’s investment in two available for sale equity securities in Corporate, and
$17 million
and
$21 million
of individually insignificant fixed asset impairment and restructuring charges, respectively.
Interest expense declined
$15 million
to
$293 million
primarily due to lower interest rates on long-term debt and the $8 million effect of the revaluation of the mandatorily redeemable 10% interest in Harvest Innovations.
Equity in earnings of unconsolidated affiliates decreased
$98 million
to
$292 million
primarily due to lower earnings from the Company’s investments in Wilmar and CIP and a decrease in equity earnings from Eaststarch C.V. which is now fully consolidated following the acquisition of the remaining interest in November 2015, partially offset by increased earnings from other equity investees.
29
|
Item 7.
|
MANAGEMENT’S DISCUSSION AND ANALYSIS OF FINANCIAL CONDITION AND RESULTS OF OPERATIONS (Continued)
|
Other income - net decreased
$203 million
to
$147 million
. Prior year income consisted primarily of gain on sales of $256 million related primarily to the sale of the cocoa, chocolate, and lactic businesses, a gain of $212 million on the revaluation of the Company’s previously held equity investments in North Star Shipping, Minmetal, and Eaststarch C.V. in conjunction with the acquisition of the remaining interests, and a gain of $62 million on the sale of a 50% interest in the Barcarena export terminal facility in Brazil to Glencore plc, partially offset by a $189 million loss on debt extinguishment related to the repurchase of outstanding debt and loss provisions of $45 million related to sugar ethanol facilities in Brazil. Current year income includes
$48 million
of realized additional consideration related to the sale of the Company’s equity investment in Gruma S.A.B. de C.V. in December 2012, a
$59 million
gain, including recovery of loss provisions, related to the sale of the Company’s Brazilian sugar ethanol facilities, a
$12 million
gain related to the revaluation of the remaining interest to settlement value in conjunction with the acquisition of Amazon Flavors, and a
$10 million
loss on sale of other individually immaterial assets.
Operating profit by segment and earnings before income taxes for the year ended December 31,
2016
and
2015
are as follows:
|
(In millions)
|
2016
|
2015
|
Change
|
||||||||
|
Agricultural Services
|
|
|
|
|
|
|
|||||
|
Merchandising and Handling
|
$
|
216
|
|
$
|
334
|
|
$
|
(118
|
)
|
||
|
Milling and Other
|
274
|
|
244
|
|
30
|
|
|||||
|
Transportation
|
112
|
|
136
|
|
(24
|
)
|
|||||
|
Total Agricultural Services
|
602
|
|
714
|
|
(112
|
)
|
|||||
|
Corn Processing
|
|
|
|
|
|
|
|||||
|
Sweeteners and Starches
|
657
|
|
634
|
|
23
|
|
|||||
|
Bioproducts
|
154
|
|
14
|
|
140
|
|
|||||
|
Total Corn Processing
|
811
|
|
648
|
|
163
|
|
|||||
|
Oilseeds Processing
|
|
|
|
||||||||
|
Crushing and Origination
|
378
|
|
842
|
|
(464
|
)
|
|||||
|
Refining, Packaging, Biodiesel, and Other
|
343
|
|
568
|
|
(225
|
)
|
|||||
|
Asia
|
150
|
|
164
|
|
(14
|
)
|
|||||
|
Total Oilseeds Processing
|
871
|
|
1,574
|
|
(703
|
)
|
|||||
|
Wild Flavors and Specialty Ingredients
|
286
|
|
280
|
|
6
|
|
|||||
|
Total Wild Flavors and Specialty Ingredients
|
286
|
|
280
|
|
6
|
|
|||||
|
Other - Financial
|
134
|
|
56
|
|
78
|
|
|||||
|
Total Other
|
134
|
|
56
|
|
78
|
|
|||||
|
Total Segment Operating Profit
|
2,704
|
|
3,272
|
|
(568
|
)
|
|||||
|
Corporate
|
(882
|
)
|
(988
|
)
|
106
|
|
|||||
|
Earnings Before Income Taxes
|
$
|
1,822
|
|
$
|
2,284
|
|
$
|
(462
|
)
|
||
30
|
Item 7.
|
MANAGEMENT’S DISCUSSION AND ANALYSIS OF FINANCIAL CONDITION AND RESULTS OF OPERATIONS (Continued)
|
Corporate results are as follows:
|
(In millions)
|
2016
|
2015
|
Change
|
||||||||
|
LIFO credit (charge)
|
$
|
(19
|
)
|
$
|
2
|
|
$
|
(21
|
)
|
||
|
Interest expense - net
|
(282
|
)
|
(297
|
)
|
15
|
|
|||||
|
Unallocated corporate costs
|
(457
|
)
|
(433
|
)
|
(24
|
)
|
|||||
|
Other charges
|
(52
|
)
|
(242
|
)
|
190
|
|
|||||
|
Minority interest and other
|
(72
|
)
|
(18
|
)
|
(54
|
)
|
|||||
|
Total Corporate
|
$
|
(882
|
)
|
$
|
(988
|
)
|
$
|
106
|
|
||
Agricultural Services operating profit decreased
16%
. Merchandising and Handling operating results declined primarily due to compressed grain handling margins in the first half of 2016. International merchandising results were down driven by poor execution and low market volatility which limited forward merchandising opportunities. Strong origination results in Argentina and the addition of destination marketing in Egypt through the Company’s Medsofts joint venture were partially offset by the absence of a $27 million prior year gain on the revaluation of the Company’s previously held investments in North Star Shipping and Minmetal in conjunction with the acquisition of the remaining interest. Milling and Other results increased
12%
. Current period results include additional realized consideration related to the sale of the Company’s equity investment in Gruma S.A.B de C.V. in December 2012 of
$48 million
. Transportation operating profit declined due to weak barge demand and lower freight rates.
Corn Processing operating profit increased
25%
. Sweeteners and Starches operating profit increased as the business continued to perform well with higher volumes and pricing and improved margins from optimizing flex grind in the Company’s corn wet mills. The integration of the recent Eaststarch C.V. and Morocco acquisitions has progressed smoothly, significantly exceeding the Company's earnings accretion target. Bioproducts profit improved due to higher ethanol margins towards the end of the year, a
$59 million
gain, including recovery of loss provisions, related to the sale of the Company’s Brazilian sugar ethanol facilities, and the absence of prior year's restructuring and fixed asset impairment charges of $75 million related to the sugar ethanol business.
Oilseeds Processing operating profit decreased
45%
. Crushing and Origination operating profit declined driven primarily by lower global soy crush margins which were high last year, lower South American grain origination results caused by smaller soybean and corn crops in the region and year-over-year slower farmer-selling, absence of a $62 million prior year gain related to the sale of the 50% interest in the Barcarena export terminal facility in Brazil to Glencore plc, partially offset by strong softseed volumes and margins in North America. Refining, Packaging, Biodiesel, and Other results declined due to the gain of $244 million on the sale of the global cocoa and chocolate businesses in October 2015 and lower earnings in the current year due to the sale of these businesses, partially offset by good demand and improved margins for refined and packaged oils and improved European biodiesel results. Asia results declined due primarily to equity losses of $48 million from the Company’s investment in Wilmar that was recorded in the Company's results in the third quarter of 2016.
Wild Flavors and Specialty Ingredients (WFSI) operating profit increased
2%
due to strong results in flavors and systems, polyols, and natural health and nutrition products and a gain of
$12 million
related to the acquisition of the remaining interest in Amazon Flavors. These increases were partially offset by weaker sales of hydrocolloids and fibers, a short edible beans crop impacting volumes and costs, and operational issues at the specialty commodities unit.
Other - Financial operating profit increased on higher volumes from the Company’s futures commission brokerage business and improved results from its captive insurance operations.
31
|
Item 7.
|
MANAGEMENT’S DISCUSSION AND ANALYSIS OF FINANCIAL CONDITION AND RESULTS OF OPERATIONS (Continued)
|
Corporate results were a net charge of
$882 million
in the current year compared to
$988 million
in the prior year. The effect of changes in agricultural commodity prices on LIFO inventory valuation reserves resulted in a charge of
$19 million
in the current year compared to a credit of
$2 million
in the prior year. Interest expense - net declined
$15 million
due principally to lower interest rates on long-term debt and the effect of the revaluation of the mandatorily redeemable 10% interest in Harvest Innovations. Unallocated corporate costs increased
$24 million
due primarily to increased spending on the Company’s ERP program and various strategic business improvement projects. Other charges in the current year included legal settlement costs and legal fees, a software impairment charge, other-than-temporary impairment charges on the Company’s investments in two available for sale equity securities, a loss on the sale of an investment, other asset impairment and restructuring charges, partially offset by a gain related to a U.S. retiree medical benefit plan curtailment. Other charges in the prior year consisted of the $189 million loss on debt extinguishment related to the repurchase of outstanding debt, restructuring charges of $29 million related principally to an international pension plan settlement, and asset impairment and settlement charges of $24 million. The increase in minority interest and other expense is due to a decrease of approximately $70 million in the Company’s share of the results of CIP.
Non-GAAP Financial Measures
The Company uses adjusted earnings per share (EPS) and adjusted earnings before taxes, interest, and depreciation and amortization (EBITDA), non-GAAP financial measures as defined by the Securities and Exchange Commission, to evaluate the Company’s financial performance. These performance measures are not defined by accounting principles generally accepted in the United States and should be considered in addition to, and not in lieu of, GAAP financial measures.
Adjusted EPS is defined as diluted EPS adjusted for the effects on reported diluted EPS of certain specified items. Adjusted EBITDA is defined as earnings before taxes, interest, and depreciation and amortization, adjusted for specified items. The Company calculates adjusted EBITDA by removing the impact of specified items and adding back the amounts of interest expense and depreciation and amortization to earnings before income taxes.
Management believes that adjusted EPS and adjusted EBITDA are useful measures of the Company’s performance because they provide investors additional information about the Company's operations allowing better evaluation of underlying business performance and better period-to-period comparability. Adjusted EPS and adjusted EBITDA are not intended to replace or be an alternative to diluted EPS and earnings before income taxes, respectively, the most directly comparable amounts reported under GAAP.
The table below provides a reconciliation of diluted EPS to adjusted EPS for the years ended December 31,
2016
and
2015
.
|
2016
|
2015
|
||||||||||||
|
In millions
|
Per share
|
In millions
|
Per share
|
||||||||||
|
Average number of shares outstanding - diluted
|
591
|
|
621
|
|
|||||||||
|
Net earnings and reported EPS (fully diluted)
|
$
|
1,279
|
|
$
|
2.16
|
|
$
|
1,849
|
|
$
|
2.98
|
|
|
|
Adjustments:
|
|||||||||||||
|
LIFO charge (credit) (net of tax of $7 million in 2016 and $1 million in 2015)
(1)
|
12
|
|
0.02
|
|
(1
|
)
|
—
|
|
|||||
|
Gain on sale and revaluation of assets (net of tax of $17 million in 2016 and $15 million in 2015)
(2)
|
(92
|
)
|
(0.15
|
)
|
(515
|
)
|
(0.83
|
)
|
|||||
|
Asset impairment, restructuring, and settlement charges (net of tax of $40 million in 2016 and $37 million in 2015)
(2)
|
77
|
|
0.13
|
|
230
|
|
0.37
|
|
|||||
|
Post-retirement benefit curtailment (net of tax of $14 million)
(1)
|
(24
|
)
|
(0.04
|
)
|
—
|
|
—
|
|
|||||
|
Loss on debt extinguishment (net of tax of $71 million)
(1)
|
—
|
|
—
|
|
118
|
|
0.19
|
|
|||||
|
Certain discrete tax adjustments
|
24
|
|
0.04
|
|
(60
|
)
|
(0.10
|
)
|
|||||
|
Adjusted net earnings and EPS
|
$
|
1,276
|
|
$
|
2.16
|
|
$
|
1,621
|
|
$
|
2.61
|
|
|
(1)
Tax effected using the Company’s U.S. effective tax rate.
(2)
Tax effected using the applicable tax rates.
32
|
Item 7.
|
MANAGEMENT’S DISCUSSION AND ANALYSIS OF FINANCIAL CONDITION AND RESULTS OF OPERATIONS (Continued)
|
The table below provides a reconciliation of earnings before income taxes to adjusted EBITDA and adjusted EBITDA by segment for the years ended December 31,
2016
and
2015
.
|
(In millions)
|
2016
|
2015
|
Change
|
||||||||
|
Earnings before income taxes
|
$
|
1,822
|
|
$
|
2,284
|
|
$
|
(462
|
)
|
||
|
Interest expense
|
293
|
|
308
|
|
(15
|
)
|
|||||
|
Depreciation and amortization
|
900
|
|
873
|
|
27
|
|
|||||
|
LIFO
|
19
|
|
(2
|
)
|
21
|
|
|||||
|
Gain on sale and revaluation of assets
|
(109
|
)
|
(530
|
)
|
421
|
|
|||||
|
Asset impairment, restructuring, and settlement charges
|
117
|
|
267
|
|
(150
|
)
|
|||||
|
Post-retirement benefit curtailment
|
(38
|
)
|
—
|
|
(38
|
)
|
|||||
|
Loss on debt extinguishment
|
—
|
|
189
|
|
(189
|
)
|
|||||
|
Adjusted EBITDA
|
$
|
3,004
|
|
$
|
3,389
|
|
$
|
(385
|
)
|
||
|
Agricultural Services
|
|
|
|
|
|
|
|||||
|
Earnings before income taxes
|
$
|
602
|
|
$
|
714
|
|
$
|
(112
|
)
|
||
|
Depreciation and amortization
|
199
|
|
196
|
|
3
|
|
|||||
|
Gain on sale and revaluation of assets
|
(43
|
)
|
(33
|
)
|
(10
|
)
|
|||||
|
Asset impairment, restructuring, and settlement charges
|
14
|
|
3
|
|
11
|
|
|||||
|
Agricultural Services Adjusted EBITDA
|
772
|
|
880
|
|
(108
|
)
|
|||||
|
Corn Processing
|
|
|
|
|
|
|
|||||
|
Earnings before income taxes
|
811
|
|
648
|
|
163
|
|
|||||
|
Depreciation and amortization
|
354
|
|
337
|
|
17
|
|
|||||
|
Gain on sale and revaluation of assets
|
(59
|
)
|
(191
|
)
|
132
|
|
|||||
|
Asset impairment, restructuring, and settlement charges
|
8
|
|
136
|
|
(128
|
)
|
|||||
|
Corn Processing Adjusted EBITDA
|
1,114
|
|
930
|
|
184
|
|
|||||
|
Oilseeds Processing
|
|
|
|
||||||||
|
Earnings before income taxes
|
871
|
|
1,574
|
|
(703
|
)
|
|||||
|
Interest expense
|
4
|
|
3
|
|
1
|
|
|||||
|
Depreciation and amortization
|
194
|
|
195
|
|
(1
|
)
|
|||||
|
Gain on sale and revaluation of assets
|
—
|
|
(306
|
)
|
306
|
|
|||||
|
Asset impairment, restructuring, and settlement charges
|
9
|
|
66
|
|
(57
|
)
|
|||||
|
Oilseeds Processing Adjusted EBITDA
|
1,078
|
|
1,532
|
|
(454
|
)
|
|||||
|
Wild Flavors and Specialty Ingredients
|
|||||||||||
|
Earnings before income taxes
|
286
|
|
280
|
|
6
|
|
|||||
|
Interest expense
|
—
|
|
3
|
|
(3
|
)
|
|||||
|
Depreciation and amortization
|
90
|
|
89
|
|
1
|
|
|||||
|
Gain on sale and revaluation of assets
|
(12
|
)
|
—
|
|
(12
|
)
|
|||||
|
Asset impairment, restructuring, and settlement charges
|
1
|
|
9
|
|
(8
|
)
|
|||||
|
Wild Flavors and Specialty Ingredients Adjusted EBITDA
|
365
|
|
381
|
|
(16
|
)
|
|||||
|
Other - Financial
|
|||||||||||
|
Earnings before income taxes
|
134
|
|
56
|
|
78
|
|
|||||
|
Interest expense
|
3
|
|
1
|
|
2
|
|
|||||
|
Depreciation and amortization
|
7
|
|
7
|
|
—
|
|
|||||
|
Other - Financial Adjusted EBITDA
|
144
|
|
64
|
|
80
|
|
|||||
33
|
Item 7.
|
MANAGEMENT’S DISCUSSION AND ANALYSIS OF FINANCIAL CONDITION AND RESULTS OF OPERATIONS (Continued)
|
|
(In millions)
|
2016
|
2015
|
Change
|
||||||||
|
Corporate
|
|||||||||||
|
Earnings before income taxes
|
(882
|
)
|
(988
|
)
|
106
|
|
|||||
|
Interest expense
|
286
|
|
301
|
|
(15
|
)
|
|||||
|
Depreciation and amortization
|
56
|
|
49
|
|
7
|
|
|||||
|
LIFO
|
19
|
|
(2
|
)
|
21
|
|
|||||
|
Loss on sale and revaluation of assets
|
5
|
|
—
|
|
5
|
|
|||||
|
Asset impairment, restructuring, and settlement charges
|
85
|
|
53
|
|
32
|
|
|||||
|
Post-retirement benefit curtailment
|
(38
|
)
|
—
|
|
(38
|
)
|
|||||
|
Loss on debt extinguishment
|
—
|
|
189
|
|
(189
|
)
|
|||||
|
Corporate Adjusted EBITDA
|
(469
|
)
|
(398
|
)
|
(71
|
)
|
|||||
|
Total Adjusted EBITDA
|
$
|
3,004
|
|
$
|
3,389
|
|
$
|
(385
|
)
|
||
Year Ended December 31,
2015
Compared to Year Ended December 31,
2014
As an agricultural commodity-based business, the Company is subject to a variety of market factors which affect the Company’s operating results. Agricultural Services was negatively impacted by the ample global supply of agricultural commodities which limited merchandising opportunities, reduced demand for North American grain exports, and moderated commodity prices throughout the year 2015. The increase in global supply was due to several large harvests which built up world grain stocks to historically high levels. In addition, the U.S. dollar continued to be firm against weakening global currencies, particularly those in major crop growing countries such as Brazil, Argentina, and Ukraine. This resulted in margin pressure and decreased North American export volumes most of 2015, partially offset by higher domestic grain demand. Transportation was also impacted by the decreased North American export volumes as well as lower global freight rates. Demand and prices for sweeteners and starches remained solid while co-product prices weakened. Ethanol demand remained strong both in North America and export markets due to favorable gasoline blending economics and ethanol’s continuing status as a competitive octane enhancer. Despite strong demand, ethanol margins were weak due to record-high levels of U.S. industry production for most 2015, leading to excess inventory. Overall demand for global protein meal and vegetable oil remained strong, especially in North America. South American oilseeds saw significantly higher volumes and margins for grain origination and exports due to the significant depreciation of the Brazilian Real against the U.S. dollar. Lower softseed availability affected seed basis, resulting in lower softseed crushing volumes and weaker margins, particularly in Europe. Biodiesel demand resulting from international biofuel standards continued to support demand for crude and refined vegetable oil, although demand for biodiesel was softer throughout 2015 due to weaker economic conditions in certain countries. The Wild Flavors and Specialty Ingredients business continued to focus on cost synergies and new revenue opportunities amid economic uncertainty in many emerging economies and some softening in demand. Customers’ interest to develop innovative, healthy, and nutritious food products in response to macro trends in diet and demographics remained strong and continued to grow.
Net earnings attributable to controlling interests decreased $0.4 billion to $1.8 billion. Segment operating profit was down 16%, due primarily to weaker ethanol margins and lower volumes and margins of North American grain exports. Corporate results in 2015 include a charge of $189 million related to the repurchase of outstanding debt, in addition to a credit of $2 million from the effect of decreasing agricultural commodity prices on LIFO inventory valuation reserves, compared to a LIFO credit of $245 million in 2014.
Income taxes decreased from $877 million to $438 million due to lower earnings before income taxes and a decreased effective tax rate. The Company’s effective tax rate for 2015 decreased to 19% compared to 28% for 2014 due primarily to low tax rates on significant one-time gains related to portfolio actions, a $70 million favorable impact of discrete items, mainly the release of a $66 million valuation allowance, and changes in the geographic mix of pretax earnings.
34
|
Item 7.
|
MANAGEMENT’S DISCUSSION AND ANALYSIS OF FINANCIAL CONDITION AND RESULTS OF OPERATIONS (Continued)
|
Analysis of Statements of Earnings
Processed volumes by product for the years ended December 31,
2015
and
2014
are as follows (in metric tons):
|
(In thousands)
|
2015
|
2014
|
Change
|
|||||
|
Oilseeds
|
33,817
|
|
32,208
|
|
1,609
|
|
||
|
Corn
|
23,126
|
|
23,668
|
|
(542
|
)
|
||
|
Total
|
56,943
|
|
55,876
|
|
1,067
|
|
||
The Company generally operates its production facilities, on an overall basis, at or near capacity, adjusting facilities individually, as needed, to react to current and seasonal local supply and demand conditions. Record volumes of oilseeds were processed during 2015, increased from 2014 as a result of the strong demand environment for soybean meal. Processed volumes of corn decreased in response to high ethanol industry production which outpaced demand throughout the year 2015.
Following the sale of the cocoa business in October 2015, the remaining results of Cocoa and Other were combined with the results of Refining, Packaging, Biodiesel, and Other within the Oilseeds Processing segment effective January 1, 2016. Results prior to January 1, 2016 have been reclassified to conform to the current presentation.
Revenues by segment for the years ended December 31,
2015
and
2014
are as follows:
|
(In millions)
|
2015
|
2014
|
Change
|
||||||||
|
Agricultural Services
|
|
|
|
|
|
|
|||||
|
Merchandising and Handling
|
$
|
25,957
|
|
$
|
32,208
|
|
$
|
(6,251
|
)
|
||
|
Milling and Other
|
3,479
|
|
3,815
|
|
(336
|
)
|
|||||
|
Transportation
|
246
|
|
265
|
|
(19
|
)
|
|||||
|
Total Agricultural Services
|
29,682
|
|
36,288
|
|
(6,606
|
)
|
|||||
|
Corn Processing
|
|
|
|
|
|
|
|||||
|
Sweeteners and Starches
|
3,713
|
|
3,767
|
|
(54
|
)
|
|||||
|
Bioproducts
|
6,282
|
|
8,515
|
|
(2,233
|
)
|
|||||
|
Total Corn Processing
|
9,995
|
|
12,282
|
|
(2,287
|
)
|
|||||
|
Oilseeds Processing
|
|
|
|
||||||||
|
Crushing and Origination
|
15,597
|
|
18,542
|
|
(2,945
|
)
|
|||||
|
Refining, Packaging, Biodiesel, and Other
|
9,364
|
|
11,937
|
|
(2,573
|
)
|
|||||
|
Asia
|
256
|
|
454
|
|
(198
|
)
|
|||||
|
Total Oilseeds Processing
|
25,217
|
|
30,933
|
|
(5,716
|
)
|
|||||
|
Wild Flavors and Specialty Ingredients
|
2,407
|
|
1,368
|
|
1,039
|
|
|||||
|
Total Wild Flavors and Specialty Ingredients
|
2,407
|
|
1,368
|
|
1,039
|
|
|||||
|
Other - Financial
|
401
|
|
330
|
|
71
|
|
|||||
|
Total Other
|
401
|
|
330
|
|
71
|
|
|||||
|
Total
|
$
|
67,702
|
|
$
|
81,201
|
|
$
|
(13,499
|
)
|
||
35
|
Item 7.
|
MANAGEMENT’S DISCUSSION AND ANALYSIS OF FINANCIAL CONDITION AND RESULTS OF OPERATIONS (Continued)
|
Revenues and cost of products sold in a commodity merchandising and processing business are affected by the underlying commodity prices and volumes. In periods of significant changes in commodity prices, the underlying performance of the Company is better evaluated by looking at margins since both revenues and cost of products sold, particularly in Oilseeds Processing and Agricultural Services, generally have a relatively equal impact from commodity price changes which generally result in an insignificant impact to gross profit.
Revenues decreased 17% due principally to lower sales prices ($12.9 billion) and lower sales volumes ($0.6 billion). Sales prices decreased principally due to lower underlying agricultural commodity prices, in particular prices of soybeans, corn, and wheat, and $5.8 billion in foreign currency translation impacts due to the strength of the U.S. dollar. Agricultural Services revenues decreased 18% primarily due to lower sales prices ($5.3 billion) and lower sales volumes ($1.3 billion). Corn Processing revenues decreased 19% due principally to lower sales prices ($1.9 billion) and lower sales volumes ($0.4 billion). Oilseeds Processing revenues decreased 18% due principally to lower sales prices ($5.5 billion) and lower sales volumes ($0.2 billion). Wild Flavors and Specialty Ingredients revenues increased 76% due principally to higher sales volumes resulting from the inclusion of the full year results of Wild Flavors and SCI, which were acquired during the fourth quarter of fiscal 2014 ($1.2 billion), partially offset by lower prices ($0.2 billion).
Cost of products sold decreased $12.8 billion to $63.7 billion due principally to lower average commodity prices, including $5.6 billion from foreign currency translation impacts due to the strength of the U.S. dollar, and lower manufacturing costs. Included in cost of products sold is a credit of $2 million from the effect of decreasing agricultural commodity prices on LIFO inventory valuation reserves compared to a credit of $245 million in 2014. Manufacturing expenses decreased $291 million to $5.5 billion primarily due to lower fuel prices, partially offset by increased employee benefit costs due to the inclusion of the full year costs for WILD Flavors and SCI.
Gross profit decreased $0.7 billion, or 16%, to $4.0 billion due principally to lower ethanol margins ($0.6 billion) and foreign currency translation impacts ($0.2 billion). The inclusion of the full year results of Wild Flavors and SCI was partially offset by lower credit from the effect of decreasing agricultural commodity prices on LIFO valuation reserves. These factors are explained in the segment operating profit discussion on page 38. The decrease in underlying commodity prices did not result in a significant decrease in margins or gross profit as lower underlying commodity prices had a relatively equal impact on revenues and cost of products sold.
Selling, general, and administrative expenses increased $106 million to $2.0 billion due principally to increased expenses of $219 million related to the inclusion of the full year results of Wild Flavors and SCI in 2015 compared to three-month results in 2014 partially offset by decreased pension expense primarily due to a $98 million one-time pension settlement in 2014.
Asset impairment, exit, and restructuring costs recognized in 2015 of $200 million consisted of long-lived asset impairments of $129 million related to certain Oilseeds Processing facilities, sugar ethanol facilities in Brazil, a facility in the Corn Processing segment, and capitalized software costs and restructuring and exit costs of $71 million related principally to an international pension plan settlement, sugar ethanol facilities in Brazil, and several individually insignificant restructuring and exit costs. Asset impairment, exit, and restructuring costs recognized in 2014 of $105 million consisted of costs associated with the relocation of the Company’s global headquarters to Chicago, Illinois of $16 million, restructuring charges related primarily to the Wild Flavors acquisition and to the integration of a subsidiary following the acquisition of the minority interest of $48 million, other-than-temporary investment writedown of $6 million, and several individually insignificant fixed asset impairments of $35 million.
Interest expense declined $29 million to $308 million primarily due to lower interest rates resulting from the issuance of Euro-denominated debt and the repurchase of certain of the Company’s U.S. dollar-denominated outstanding debentures.
Equity in earnings of unconsolidated affiliates increased $18 million to $390 million primarily due to higher earnings from the Company’s investment in CIP.
36
|
Item 7.
|
MANAGEMENT’S DISCUSSION AND ANALYSIS OF FINANCIAL CONDITION AND RESULTS OF OPERATIONS (Continued)
|
Other income increased $77 million from $273 million to $350 million. Other income in the year ended December 31, 2015 consisted primarily of gain on sales of $256 million related primarily to the sale of the cocoa, chocolate, and lactic businesses, a gain of $212 million on the revaluation of the Company’s previously held equity investments in North Start Shipping, Minmetal, and Eaststarch C.V. in conjunction with the acquisition of the remaining interests, and a gain of $62 million on the sale of a 50% interest in the Barcarena export terminal facility in Brazil to Glencore plc, partially offset by a $189 million loss on debt extinguishment related to the repurchase of outstanding debt in 2015 and loss provisions of $45 million related to sugar ethanol facilities in Brazil. Other income in the year ended December 31, 2014 consisted primarily of gains of $156 million upon the Company’s effective dilution in the Pacificor joint venture and $126 million on the sale of the fertilizer business, partially offset by losses of $102 million on Euro foreign currency derivative contracts entered into to economically hedge the Wild Flavors acquisition.
Operating profit by segment and earnings before income taxes for the year ended December 31,
2015
and
2014
are as follows:
|
(In millions)
|
2015
|
2014
|
Change
|
||||||||
|
Agricultural Services
|
|
|
|
|
|
|
|||||
|
Merchandising and Handling
|
$
|
334
|
|
$
|
653
|
|
$
|
(319
|
)
|
||
|
Milling and Other
|
244
|
|
203
|
|
41
|
|
|||||
|
Transportation
|
136
|
|
187
|
|
(51
|
)
|
|||||
|
Total Agricultural Services
|
714
|
|
1,043
|
|
(329
|
)
|
|||||
|
Corn Processing
|
|
|
|
|
|
|
|||||
|
Sweeteners and Starches
|
634
|
|
433
|
|
201
|
|
|||||
|
Bioproducts
|
14
|
|
715
|
|
(701
|
)
|
|||||
|
Total Corn Processing
|
648
|
|
1,148
|
|
(500
|
)
|
|||||
|
Oilseeds Processing
|
|
|
|
||||||||
|
Crushing and Origination
|
842
|
|
868
|
|
(26
|
)
|
|||||
|
Refining, Packaging, Biodiesel, and Other
|
568
|
|
405
|
|
163
|
|
|||||
|
Asia
|
164
|
|
167
|
|
(3
|
)
|
|||||
|
Total Oilseeds Processing
|
1,574
|
|
1,440
|
|
134
|
|
|||||
|
Wild Flavors and Specialty Ingredients
|
280
|
|
205
|
|
75
|
|
|||||
|
Total Wild Flavors and Specialty Ingredients
|
280
|
|
205
|
|
75
|
|
|||||
|
Other - Financial
|
56
|
|
79
|
|
(23
|
)
|
|||||
|
Total Other
|
56
|
|
79
|
|
(23
|
)
|
|||||
|
Total Segment Operating Profit
|
3,272
|
|
3,915
|
|
(643
|
)
|
|||||
|
Corporate
|
(988
|
)
|
(785
|
)
|
(203
|
)
|
|||||
|
Earnings Before Income Taxes
|
$
|
2,284
|
|
$
|
3,130
|
|
$
|
(846
|
)
|
||
37
|
Item 7.
|
MANAGEMENT’S DISCUSSION AND ANALYSIS OF FINANCIAL CONDITION AND RESULTS OF OPERATIONS (Continued)
|
Corporate results are as follows:
|
(In millions)
|
2015
|
2014
|
Change
|
||||||||
|
LIFO credit (charge)
|
$
|
2
|
|
$
|
245
|
|
$
|
(243
|
)
|
||
|
Interest expense - net
|
(297
|
)
|
(318
|
)
|
21
|
|
|||||
|
Unallocated corporate costs
|
(433
|
)
|
(414
|
)
|
(19
|
)
|
|||||
|
Other charges
|
(242
|
)
|
(228
|
)
|
(14
|
)
|
|||||
|
Minority interest and other
|
(18
|
)
|
(70
|
)
|
52
|
|
|||||
|
Total Corporate
|
$
|
(988
|
)
|
$
|
(785
|
)
|
$
|
(203
|
)
|
||
Agricultural Services operating profit decreased 32%. Merchandising and Handling results decreased on fewer merchandising opportunities and lower margins due to ample global supplies of grain, reduced U.S. export competitiveness during the second half of 2015 due to the strong U.S. dollar, and a large South American harvest. Also contributing to the decrease were the absence of a 2014 gain of $17 million related to a partial recovery of a loss provision and a 2014 gain of $156 million from the Company’s effective dilution in the Pacificor joint venture, partially offset by a 2015 gain of $27 million on the revaluation of the Company’s previously held investments in North Star Shipping and Minmetal in conjunction with the acquisition of the remaining interests. Milling and Other results improved due to higher product margins and strong merchandising results. Transportation results declined due to lower freight rates and volumes driven by reduced U.S. export volumes in the second half of 2015.
Corn Processing operating profit decreased 44%. Included in the 2015 operating profit is approximately $13 million of mark-to-market losses related to hedge timing effects compared to $25 million of gains in 2014. Excluding these items, Sweeteners and Starches operating profit increased $213 million due principally to the $185 million gain from the revaluation of the Company’s previously held investment in Eaststarch C.V. in conjunction with the acquisition of the remaining interest in November 2015. Also contributing to the increase were lower raw material costs and good demand relative to supply of products. Excluding hedge timing effects, Bioproducts operating profit declined by $675 million primarily due to lower industry ethanol margins. Strong industry production levels resulted in high industry inventory levels which kept industry margins considerably lower than 2014, despite increased domestic and export demand. Also contributing to the decrease were restructuring and fixed asset impairment charges of $75 million and loss provisions of $45 million related to the sugar ethanol business in Brazil.
Oilseeds Processing operating profit increased 9%. Included in the 2015 operating profit is $45 million of mark-to-market gains related to cocoa hedge timing effects compared to $17 million of losses in 2014. Crushing and Origination operating profit includes a 2015 gain of $62 million related to the sale of assets to the new Barcarena export terminal joint venture in Brazil and a 2014 gain of $126 million related to the sale of the fertilizer business. Excluding these gains, Crushing and Origination operating profit increased $38 million primarily due to strong North American & European soybean crushing volumes and margins through the first half of 2015, driven by strong demand and an ample global bean supply. Starting in the third quarter and continuing in the fourth quarter of 2015, global soybean crush margins declined as the more competitive Argentine meal was anticipated to enter the already well-supplied global markets due to changes in Argentine policies. Softseed margins and volumes were lower, particularly in Europe, resulting from weaker global demand for vegetable oil. Large South American corn and soybean harvests also helped support a significant improvement in South America origination results. Refining, Packaging, Biodiesel, and Other operating profit declined primarily due to lower South American and European results partially offset by improved margins in North American oil refining operations. Excluding hedge timing effects, Cocoa and Other results increased $149 million. The 2015 gain of $244 million on the sale of the global cocoa and chocolate business was partially offset by lower earnings due to the sale of these businesses and lower cocoa press margins and peanut processing results. Asia results declined due principally to long-lived asset and goodwill impairments partially offset by an increase from the Company’s share of its results from its equity investee, Wilmar.
Wild Flavors and Specialty Ingredients operating profit increased due primarily to the acquisitions of Wild Flavors and SCI during the fourth quarter of fiscal 2014. Incremental earnings from these acquisitions were partially offset by lower overall results in the other specialty ingredients businesses due to weakness in many emerging economies and a strong U.S. dollar, which reduced volumes and margins across a number of product lines.
38
|
Item 7.
|
MANAGEMENT’S DISCUSSION AND ANALYSIS OF FINANCIAL CONDITION AND RESULTS OF OPERATIONS (Continued)
|
Corporate results were a net charge of $988 million in 2015 compared to $785 million in 2014. The effects of changing commodity prices on LIFO inventory valuations resulted in a credit of $2 million in 2015 compared to a credit of $245 million in 2014. Interest expense - net declined due principally to lower interest rates. Unallocated corporate costs increased $19 million due primarily to increased pension expense resulting from the adoption of a new mortality assumption, increased spending on the Company’s ERP program and various strategic business improvement projects, partially offset by lower employee compensation expense. Other charges in 2015 consisted of a $189 million loss on debt extinguishment related to the repurchase of outstanding debt, restructuring charges of $29 million related principally to an international pension plan settlement, and asset impairment and settlement charges of $24 million. Other charges in 2014 consisted of a $102 million loss on Euro foreign currency derivative contracts entered into to economically hedge the Wild Flavors acquisition, costs associated with the relocation of the Company’s global headquarters to Chicago, Illinois of $16 million, restructuring charges related to the Alfred C. Toepfer International integration and other restructuring charges of $15 million, and pension settlement of $98 million. Minority interest and other expense in 2014 consisted primarily of a $56 million loss related to the Company’s equity method investment in CIP.
Non-GAAP Financial Measures
The Company uses adjusted earnings per share (EPS) and adjusted earnings before taxes, interest, and depreciation and amortization (EBITDA), non-GAAP financial measures as defined by the Securities and Exchange Commission, to evaluate the Company’s financial performance. These performance measures are not defined by accounting principles generally accepted in the United States and should be considered in addition to, and not in lieu of, GAAP financial measures.
Adjusted EPS is defined as diluted EPS adjusted for the effects on reported diluted EPS of certain specified items. Adjusted EBITDA is defined as earnings before taxes, interest, and depreciation and amortization, adjusted for specified items. The Company calculates adjusted EBITDA by removing the impact of specified items and adding back the amounts of interest expense and depreciation and amortization to earnings before income taxes.
Management believes that adjusted EPS and adjusted EBITDA are useful measures of the Company’s performance because they provide investors additional information about the Company's operations allowing better evaluation of underlying business performance and better period-to-period comparability. Adjusted EPS and adjusted EBITDA are not intended to replace or be an alternative to diluted EPS and earnings before income taxes, respectively, the most directly comparable amounts reported under GAAP.
The table below provides a reconciliation of diluted EPS to adjusted EPS for the years ended December 31,
2015
and
2014
.
|
2015
|
2014
|
|||||||||||
|
In millions
|
Per share
|
In millions
|
Per share
|
|||||||||
|
Average number of shares outstanding - diluted
|
621
|
|
656
|
|
||||||||
|
Net earnings and reported EPS (fully diluted)
|
$
|
1,849
|
|
$
|
2.98
|
|
$
|
2,248
|
|
$
|
3.43
|
|
|
Adjustments:
|
||||||||||||
|
LIFO credit (net of tax of $1 million in 2015 and $93 million in 2014)
(1)
|
(1
|
)
|
—
|
|
(152
|
)
|
(0.23
|
)
|
||||
|
Gain on sale and revaluation of assets (net of tax of $15 million in 2015 and $105 million in 2014)
(2)
|
(515
|
)
|
(0.83
|
)
|
(186
|
)
|
(0.29
|
)
|
||||
|
Charges related to Wild Flavors (net of tax of $51 million)
(1)
|
—
|
|
—
|
|
84
|
|
0.13
|
|
||||
|
Asset impairment, restructuring, and settlement charges (net of tax of $37 million in 2015 and $62 million in 2014)
(2)
|
230
|
|
0.37
|
|
107
|
|
0.16
|
|
||||
|
Loss on debt extinguishment (net of tax of $71 million)
(1)
|
118
|
|
0.19
|
|
—
|
|
—
|
|
||||
|
Certain discrete tax adjustments
|
(60
|
)
|
(0.10
|
)
|
15
|
|
0.03
|
|
||||
|
Total adjustments
|
(228
|
)
|
(0.37
|
)
|
(132
|
)
|
(0.20
|
)
|
||||
|
Adjusted net earnings and EPS
|
$
|
1,621
|
|
$
|
2.61
|
|
$
|
2,116
|
|
$
|
3.23
|
|
(1)
Tax effected using the Company’s U.S. effective tax rate.
(2)
Tax effected using the U.S. and other applicable tax rates.
39
|
Item 7.
|
MANAGEMENT’S DISCUSSION AND ANALYSIS OF FINANCIAL CONDITION AND RESULTS OF OPERATIONS (Continued)
|
The table below provides a reconciliation of earnings before income taxes to adjusted EBITDA and adjusted EBITDA by segment for the years ended December 31,
2015
and
2014
.
|
(In millions)
|
2015
|
2014
|
Change
|
||||||||
|
Earnings before income taxes
|
$
|
2,284
|
|
$
|
3,130
|
|
$
|
(846
|
)
|
||
|
Interest expense
|
308
|
|
337
|
|
(29
|
)
|
|||||
|
Depreciation and amortization
|
873
|
|
877
|
|
(4
|
)
|
|||||
|
LIFO
|
(2
|
)
|
(245
|
)
|
243
|
|
|||||
|
Gain on sale and revaluation of assets
|
(530
|
)
|
(291
|
)
|
(239
|
)
|
|||||
|
Charges related to Wild Flavors
|
—
|
|
135
|
|
(135
|
)
|
|||||
|
Asset impairment, restructuring, and settlement charges
|
267
|
|
170
|
|
97
|
|
|||||
|
Loss on debt extinguishment
|
189
|
|
—
|
|
189
|
|
|||||
|
Adjusted EBITDA
|
$
|
3,389
|
|
$
|
4,113
|
|
$
|
(724
|
)
|
||
|
Agricultural Services
|
|
|
|
|
|
|
|||||
|
Earnings before income taxes
|
$
|
714
|
|
$
|
1,043
|
|
$
|
(329
|
)
|
||
|
Interest expense
|
—
|
|
1
|
|
(1
|
)
|
|||||
|
Depreciation and amortization
|
196
|
|
195
|
|
1
|
|
|||||
|
Gain on sale and revaluation of assets
|
(33
|
)
|
(156
|
)
|
123
|
|
|||||
|
Asset impairment, restructuring, and settlement charges
|
3
|
|
14
|
|
(11
|
)
|
|||||
|
Agricultural Services Adjusted EBITDA
|
880
|
|
1,097
|
|
(217
|
)
|
|||||
|
Corn Processing
|
|
|
|
|
|
|
|||||
|
Earnings before income taxes
|
648
|
|
1,148
|
|
(500
|
)
|
|||||
|
Depreciation and amortization
|
337
|
|
334
|
|
3
|
|
|||||
|
Gain on sale and revaluation of assets
|
(191
|
)
|
—
|
|
(191
|
)
|
|||||
|
Asset impairment, restructuring, and settlement charges
|
136
|
|
18
|
|
118
|
|
|||||
|
Corn Processing Adjusted EBITDA
|
930
|
|
1,500
|
|
(570
|
)
|
|||||
|
Oilseeds Processing
|
|
|
|
||||||||
|
Earnings before income taxes
|
1,574
|
|
1,440
|
|
134
|
|
|||||
|
Interest expense
|
3
|
|
8
|
|
(5
|
)
|
|||||
|
Depreciation and amortization
|
195
|
|
247
|
|
(52
|
)
|
|||||
|
Gain on sale and revaluation of assets
|
(306
|
)
|
(126
|
)
|
(180
|
)
|
|||||
|
Asset impairment, restructuring, and settlement charges
|
66
|
|
3
|
|
63
|
|
|||||
|
Oilseeds Processing Adjusted EBITDA
|
1,532
|
|
1,572
|
|
(40
|
)
|
|||||
|
Wild Flavors and Specialty Ingredients
|
|||||||||||
|
Earnings before income taxes
|
280
|
|
205
|
|
75
|
|
|||||
|
Interest expense
|
3
|
|
7
|
|
(4
|
)
|
|||||
|
Depreciation and amortization
|
89
|
|
41
|
|
48
|
|
|||||
|
Charges related to Wild Flavors
|
9
|
|
33
|
|
(24
|
)
|
|||||
|
Wild Flavors and Specialty Ingredients Adjusted EBITDA
|
381
|
|
286
|
|
95
|
|
|||||
|
Other - Financial
|
|||||||||||
|
Earnings before income taxes
|
56
|
|
79
|
|
(23
|
)
|
|||||
|
Interest expense
|
1
|
|
1
|
|
—
|
|
|||||
|
Depreciation and amortization
|
7
|
|
5
|
|
2
|
|
|||||
|
Other - Financial Adjusted EBITDA
|
64
|
|
85
|
|
(21
|
)
|
|||||
40
|
Item 7.
|
MANAGEMENT’S DISCUSSION AND ANALYSIS OF FINANCIAL CONDITION AND RESULTS OF OPERATIONS (Continued)
|
|
(In millions)
|
2015
|
2014
|
Change
|
||||||||
|
Corporate
|
|||||||||||
|
Earnings before income taxes
|
(988
|
)
|
(785
|
)
|
(203
|
)
|
|||||
|
Interest expense
|
301
|
|
320
|
|
(19
|
)
|
|||||
|
Depreciation and amortization
|
49
|
|
55
|
|
(6
|
)
|
|||||
|
LIFO
|
(2
|
)
|
(245
|
)
|
243
|
|
|||||
|
Gain on sale and revaluation of assets
|
—
|
|
(9
|
)
|
9
|
|
|||||
|
Asset impairment, restructuring, and settlement charges
|
53
|
|
135
|
|
(82
|
)
|
|||||
|
Charges related to Wild Flavors
|
—
|
|
102
|
|
(102
|
)
|
|||||
|
Loss on debt extinguishment
|
189
|
|
—
|
|
189
|
|
|||||
|
Corporate Adjusted EBITDA
|
(398
|
)
|
(427
|
)
|
29
|
|
|||||
|
Total Adjusted EBITDA
|
$
|
3,389
|
|
$
|
4,113
|
|
$
|
(724
|
)
|
||
Liquidity and Capital Resources
A Company objective is to have sufficient liquidity, balance sheet strength, and financial flexibility to fund the operating and capital requirements of a capital intensive agricultural commodity-based business. The Company’s strategy involves expanding the volume and diversity of crops that it merchandises and processes, expanding the global reach of its core model, and expanding its value-added product portfolio. The Company depends on access to credit markets, which can be impacted by its credit rating and factors outside of the Company’s control, to fund its working capital needs and capital expenditures. The primary source of funds to finance the Company’s operations, capital expenditures, and advancement of its growth strategy is cash generated by operations and lines of credit, including a commercial paper borrowing facility. In addition, the Company believes it has access to funds from public and private equity and debt capital markets in both U.S. and international markets.
Cash provided by operating activities was
$1.5 billion
for
2016
compared to
$2.5 billion
in
2015
. Working capital changes decreased cash by
$0.6 billion
in the current year compared to providing cash of
$0.2 billion
in the prior year. Trade receivables increased
$0.2 billion
due principally to lower receivables sold under the accounts receivable securitization programs. Inventories increased approximately
$0.7 billion
at
December 31, 2016
compared to
December 31, 2015
due to higher inventory quantities and higher prices. The Company made a
$0.2 billion
voluntary contribution to the U.S. pension plans in 2015 and 2016. Cash used in investing activities was
$1.2 billion
this year compared to
$21 million
last year. Capital expenditures and net assets of businesses acquired were
$1.0 billion
this year compared to
$1.6 billion
last year. Proceeds from the sale of businesses and assets were
$0.2 billion
this year compared to
$1.8 billion
last year. Sales of marketable securities, net of purchases, were
$0.3 billion
this year compared to
$35 million
last year. Investments in and advances to affiliates include additional investments in Wilmar of
$0.6 billion
for the year compared to $0.1 billion last year. Cash used in financing activities was
$0.6 billion
this year compared to
$2.6 billion
last year. Long-term debt borrowings in the current year related to the $1.0 billion of new notes issued on August 11, 2016 compared to $1.2 billion in the prior year which related to the €1.1 billion ($1.2 billion) of notes issued on June 24, 2015. Long-term debt payments in the prior year included the purchase of $935 million aggregate principal amount of certain of the Company’s outstanding debentures for $1.1 billion pursuant to the cash tender offers and debt redemption. Treasury stock purchases were
$1.0 billion
in the current year compared to
$2.0 billion
in last year.
At
December 31, 2016
, the Company had
$0.9 billion
of cash, cash equivalents, and short-term marketable securities and a current ratio, defined as current assets divided by current liabilities, of
1.6
to 1. Included in working capital is
$5.8 billion
of readily marketable commodity inventories. At
December 31, 2016
, the Company’s capital resources included shareholders’ equity of
$17.2 billion
and lines of credit totaling
$6.9 billion
, of which
$5.8 billion
was unused. The Company’s ratio of long-term debt to total capital (the sum of long-term debt and shareholders’ equity) was
27%
at
December 31, 2016
and
24%
at
December 31, 2015
. The Company uses this ratio as a measure of the Company’s long-term indebtedness and an indicator of financial flexibility. The Company’s ratio of net debt (the sum of short-term debt, current maturities of long-term debt, and long-term debt less the sum of cash and cash equivalents and short-term marketable securities) to capital (the sum of net debt and shareholders’ equity) was
26%
at
December 31, 2016
and
20%
at
December 31, 2015
. Of the Company’s total lines of credit,
$4.0 billion
support a commercial paper borrowing facility, against which there was no commercial paper outstanding at
December 31, 2016
.
41
|
Item 7.
|
MANAGEMENT’S DISCUSSION AND ANALYSIS OF FINANCIAL CONDITION AND RESULTS OF OPERATIONS (Continued)
|
As of
December 31, 2016
, the Company had
$0.6 billion
of cash and cash equivalents,
$0.3 billion
of which is cash held by foreign subsidiaries whose undistributed earnings are considered permanently reinvested. Based on the Company’s historical ability to generate sufficient cash flows from its U.S. operations and unused and available U.S. credit capacity of
$4.5 billion
, the Company has asserted that these funds are permanently reinvested outside the U.S.
The Company has accounts receivable securitization programs ( the “Programs”) with certain commercial paper conduit purchasers and committed purchasers. The Programs provide the Company with up to
$1.5 billion
in funding against accounts receivable transferred into the Programs and expands the Company’s access to liquidity through efficient use of its balance sheet assets (see Note 19 in Item 8 for more information and disclosures on the Programs). As of
December 31, 2016
, the Company utilized
$1.0 billion
of its facility under the Programs.
On November 5, 2014, the Company’s Board of Directors approved a stock repurchase program authorizing the Company to repurchase up to 100,000,000 shares of the Company’s common stock during the period commencing January 1, 2015 and ending December 31, 2019. The Company has acquired approximately
68.7
million shares under this program as of December 31, 2016.
The Company expects capital expenditures of
$1.3 billion
during 2017. In 2017, the Company expects additional cash outlays of approximately
$0.7 billion
in dividends and
$1.0 billion
to
$1.5 billion
in share repurchases, subject to strategic capital requirements.
The Company’s credit facilities and certain debentures require the Company to comply with specified financial and non-financial covenants including maintenance of minimum tangible net worth as well as limitations related to incurring liens, secured debt, and certain other financing arrangements. The Company was in compliance with these covenants as of
December 31, 2016
.
The three major credit rating agencies have maintained the Company’s credit ratings at solid investment grade levels with stable outlooks.
Contractual Obligations
In the normal course of business, the Company enters into contracts and commitments which obligate the Company to make payments in the future. The following table sets forth the Company’s significant future obligations by time period. Purchases include commodity-based contracts entered into in the normal course of business, which are further described in Item 7A, “Quantitative and Qualitative Disclosures About Market Risk,” energy-related purchase contracts entered into in the normal course of business, and other purchase obligations related to the Company’s normal business activities. The following table does not include unrecognized income tax benefits of
$55 million
as of
December 31, 2016
as the Company is unable to reasonably estimate the timing of settlement. Where applicable, information included in the Company’s consolidated financial statements and notes is cross-referenced in this table.
|
|
|
|
Payments Due by Period
|
|||||||||||||||||
|
|
Item 8
|
|
|
|
|
|
||||||||||||||
|
Contractual
|
Note
|
|
Less than
|
1 - 3
|
3 - 5
|
More than
|
||||||||||||||
|
Obligations
|
Reference
|
Total
|
1 Year
|
Years
|
Years
|
5 Years
|
||||||||||||||
|
|
|
(In millions)
|
||||||||||||||||||
|
Purchases
|
|
|
|
|
|
|
|
|
||||||||||||
|
Inventories
|
|
$
|
9,335
|
|
$
|
9,196
|
|
$
|
136
|
|
$
|
3
|
|
$
|
—
|
|
||||
|
Energy
|
|
529
|
|
246
|
|
194
|
|
89
|
|
—
|
|
|||||||||
|
Other
|
|
699
|
|
465
|
|
178
|
|
7
|
|
49
|
|
|||||||||
|
Total purchases
|
|
10,563
|
|
9,907
|
|
508
|
|
99
|
|
49
|
|
|||||||||
|
Short-term debt
|
|
154
|
|
154
|
|
—
|
|
—
|
|
—
|
|
|||||||||
|
Long-term debt
|
Note 10
|
6,777
|
|
273
|
|
1,116
|
|
689
|
|
4,699
|
|
|||||||||
|
Estimated interest payments
|
|
4,704
|
|
291
|
|
508
|
|
477
|
|
3,428
|
|
|||||||||
|
Operating leases
|
Note 14
|
843
|
|
220
|
|
291
|
|
145
|
|
187
|
|
|||||||||
|
Estimated pension and other postretirement plan contributions
(1)
|
Note 15
|
148
|
|
43
|
|
24
|
|
24
|
|
57
|
|
|||||||||
|
Total
|
|
$
|
23,189
|
|
$
|
10,888
|
|
$
|
2,447
|
|
$
|
1,434
|
|
$
|
8,420
|
|
||||
42
|
Item 7.
|
MANAGEMENT’S DISCUSSION AND ANALYSIS OF FINANCIAL CONDITION AND RESULTS OF OPERATIONS (Continued)
|
(1)
Includes pension contributions of
$30 million
for fiscal 2017. The Company is unable to estimate the amount of pension contributions beyond fiscal year 2017. For more information concerning the Company’s pension and other postretirement plans, see Note 15 in Item 8.
At
December 31, 2016
, the Company estimates it will spend approximately
$1.5 billion
through fiscal year 2021 to complete currently approved capital projects which are not included in the table above.
The Company also has outstanding letters of credit and surety bonds of
$1.1 billion
at
December 31, 2016
which are not included in the table above.
The Company has entered into agreements, primarily debt guarantee agreements related to equity-method investees, which could obligate the Company to make future payments. The Company’s liability under these agreements arises only if the primary entity fails to perform its contractual obligation. The Company has collateral for a portion of these contingent obligations.
Off Balance Sheet Arrangements
Accounts Receivable Securitization Programs
Since March 2012, the Company has had an accounts receivable securitization program with certain commercial paper conduit purchasers and committed purchasers. In March 2014, the Company entered into a second accounts receivable securitization program with certain commercial paper conduit purchasers and committed purchasers. See Note 19 of Item 8 for more information about these programs.
Synthetic Leasing Program
The Company is a party to lease agreements under synthetic leasing programs for certain of its U.S. barge and trucking assets for periods ranging from
5
to
7
years. As of
December 31, 2016
, outstanding lease balances, including the value of the underlying assets of
$170 million
, were off-balance sheet. These agreements provide the Company with the right to use these assets for specified periods in exchange for an obligation to make rental payments. The agreements are accounted for as operating leases, such that the rent expense is recorded in the consolidated statement of earnings. The future lease payments pertaining to these lease agreements are included in the contractual obligations table in Item 7. These leasing programs are utilized primarily to diversify funding sources and to retain flexibility. The Company recorded
$5 million
of rent expense pertaining to synthetic lease payments for each of the years ended
December 31, 2016
,
2015
, and
2014
.
Critical Accounting Policies
The process of preparing financial statements requires management to make estimates and judgments that affect the carrying values of the Company’s assets and liabilities as well as the recognition of revenues and expenses. These estimates and judgments are based on the Company’s historical experience and management’s knowledge and understanding of current facts and circumstances. Certain of the Company’s accounting policies are considered critical, as these policies are important to the depiction of the Company’s financial statements and require significant or complex judgment by management. Management has discussed with the Company’s Audit Committee the development, selection, disclosure, and application of these critical accounting policies. Following are the accounting policies management considers critical to the Company’s financial statements.
43
|
Item 7.
|
MANAGEMENT’S DISCUSSION AND ANALYSIS OF FINANCIAL CONDITION AND RESULTS OF OPERATIONS (Continued)
|
Fair Value Measurements - Inventories and Commodity Derivatives
Certain of the Company’s inventory and commodity derivative assets and liabilities as of
December 31, 2016
are valued at estimated fair values, including
$4.4 billion
of merchandisable agricultural commodity inventories,
$0.6 billion
of derivative assets,
$0.7 billion
of derivative liabilities, and
$0.5 billion
of inventory-related payables. Commodity derivative assets and liabilities include forward fixed-price purchase and sale contracts for agricultural commodities. Merchandisable agricultural commodities are freely traded, have quoted market prices, and may be sold without significant additional processing. Management estimates fair value for its commodity-related assets and liabilities based on exchange-quoted prices, adjusted for differences in local markets. The Company’s inventory and derivative commodity fair value measurements are mainly based on observable market quotations without significant adjustments and are therefore reported as Level 2 within the fair value hierarchy. Level 3 fair value measurements of approximately
$1.5 billion
of assets and
$0.2 billion
of liabilities represent fair value estimates where unobservable price components represent 10% or more of the total fair value price. For more information concerning amounts reported as Level 3, see Note 3 in Item 8. Changes in the market values of these inventories and commodity contracts are recognized in the statement of earnings as a component of cost of products sold. If management used different methods or factors to estimate market value, amounts reported as inventories and cost of products sold could differ materially. Additionally, if market conditions change subsequent to year-end, amounts reported in future periods as inventories and cost of products sold could differ materially.
Derivatives – Designated Hedging Activities
The Company, from time to time, uses derivative contracts designated as cash flow hedges to fix the purchase price of anticipated volumes of commodities to be purchased and processed in a future month, to fix the purchase price of the Company’s anticipated natural gas requirements for certain production facilities, and to fix the sales price of anticipated volumes of ethanol. These designated hedging programs principally relate to the Company’s Corn Processing operating segment. Assuming normal market conditions, the change in the market value of such derivative contracts has historically been, and is expected to continue to be, highly effective at offsetting changes in price movements of the hedged item. Gains and losses arising from open and closed hedging transactions are deferred in accumulated other comprehensive income, net of applicable income taxes, and recognized as a component of cost of products sold and revenues in the statement of earnings when the hedged item is recognized. If it is determined that the derivative instruments used are no longer effective at offsetting changes in the price of the hedged item, then the changes in the market value of these exchange-traded futures and exchange-traded and over-the-counter option contracts would be recorded immediately in the statement of earnings as a component of cost of products sold. See Note 4 in Item 8 for additional information.
Investments in Affiliates
The Company applies the equity method of accounting for investments over which the Company has the ability to exercise significant influence. These investments in affiliates are carried at cost plus equity in undistributed earnings and are adjusted, where appropriate, for amortizable basis differences between the investment balance and the underlying net assets of the investee. Generally, the minimum ownership threshold for asserting significant influence is 20% ownership of the investee. However, the Company considers all relevant factors in determining its ability to assert significant influence including but not limited to, ownership percentage, board membership, customer and vendor relationships, and other arrangements. If management used a different accounting method for these investments, then the amount of earnings from affiliates the Company recognizes may materially differ.
Income Taxes
The Company accounts for its income tax positions in accordance with the applicable accounting standards. These standards prescribe a minimum threshold a tax position is required to meet before being recognized in the consolidated financial statements. The Company recognizes in its consolidated financial statements tax positions determined more likely than not to be sustained upon examination, based on the technical merits of the position. The Company frequently faces challenges from U.S. and foreign tax authorities regarding the amount of taxes due. These challenges include questions regarding the timing and amount of deductions and the allocation of income among various tax jurisdictions. In evaluating the exposure associated with various tax filing positions, the Company records reserves for estimates of potential additional tax owed by the Company. For example, the Company has received tax assessments from tax authorities in Brazil and Argentina, challenging income tax positions taken by subsidiaries of the Company. The Company evaluated its tax positions for these matters and concluded, based in part upon advice from legal counsel, that it was appropriate to recognize the tax benefits of these positions (see Note 13 in Item 8 for additional information).
44
|
Item 7.
|
MANAGEMENT’S DISCUSSION AND ANALYSIS OF FINANCIAL CONDITION AND RESULTS OF OPERATIONS (Continued)
|
Deferred tax assets represent items to be used as tax deductions or credits in future tax returns where the related tax benefit has already been recognized in the Company’s income statement. The realization of the Company’s deferred tax assets is dependent upon future taxable income in specific tax jurisdictions, the timing and amount of which are uncertain. The Company evaluates all available positive and negative evidence including estimated future reversals of existing temporary differences, projected future taxable income, tax planning strategies, and recent financial results. Valuation allowances related to these deferred tax assets have been established to the extent the realization of the tax benefit is not likely. During
2016
, the Company decreased valuation allowances by approximately
$86 million
primarily related to the divestiture of an impaired entity. To the extent the Company were to favorably resolve matters for which valuation allowances have been established or be required to pay amounts in excess of the aforementioned valuation allowances, the Company’s effective tax rate in a given financial statement period may be impacted.
Undistributed earnings of the Company’s foreign subsidiaries and the Company’s share of the undistributed earnings of affiliated corporate joint venture companies accounted for on the equity method amounting to approximately
$9.3 billion
at
December 31, 2016
, are considered to be permanently reinvested, and accordingly, no provision for U.S. income taxes has been provided thereon. If the Company were to receive distributions from any of these foreign subsidiaries or affiliates or determine the undistributed earnings of these foreign subsidiaries or affiliates to not be permanently reinvested, the Company could be subject to U.S. tax liabilities which have not been provided for in the consolidated financial statements.
Property, Plant, and Equipment and Asset Abandonments and Write-Downs
The Company is principally engaged in the business of procuring, transporting, storing, processing, and merchandising agricultural commodities and products. This business is global in nature and is highly capital-intensive. Both the availability of the Company’s raw materials and the demand for the Company’s finished products are driven by factors such as weather, plantings, government programs and policies, changes in global demand, changes in standards of living, and global production of similar and competitive crops. These aforementioned factors may cause a shift in the supply/demand dynamics for the Company’s raw materials and finished products. Any such shift will cause management to evaluate the efficiency and cash flows of the Company’s assets in terms of geographic location, size, and age of its facilities. The Company, from time to time, will also invest in equipment, technology, and companies related to new, value-added products produced from agricultural commodities and products. These new products are not always successful from either a commercial production or marketing perspective. Management evaluates the Company’s property, plant, and equipment for impairment whenever indicators of impairment exist. Assets are written down to fair value after consideration of the ability to utilize the assets for their intended purpose or to employ the assets in alternative uses or sell the assets to recover the carrying value. If management used different estimates and assumptions in its evaluation of these assets, then the Company could recognize different amounts of expense over future periods. During the years ended
December 31, 2016
,
2015
, and
2014
, impairment charges for property, plant, and equipment were
$17 million
,
$108 million
, and
$35 million
, respectively (see Note 18 in Item 8 for additional information).
Business Combinations
The Company’s acquisitions are accounted for as purchases in accordance with ASC Topic 805,
Business Combinations,
as amended
.
Assets acquired and liabilities assumed, based on preliminary purchase price allocations, are adjusted to fair values at acquisition date with the remainder of the purchase price, if any, recorded as goodwill. When determining the fair values of assets acquired and liabilities assumed, management makes significant estimates and assumptions, especially with respect to intangible assets. Critical estimates in valuing certain intangible assets include, but are not limited to, future expected cash flows and discount rates. Although management’s estimates of fair value are based upon assumptions believed to be reasonable, actual results may differ.
Goodwill and Other Intangible Assets
Goodwill and intangible assets deemed to have indefinite lives are not amortized but are subject to annual impairment tests. The Company evaluates goodwill for impairment at the reporting unit level annually on October 1 or whenever there are indicators that the carrying value of the assets may not be fully recoverable. Critical estimates in the determination of the fair value of each reporting unit include, but are not limited to, future expected cash flows and discount rates. Definite-lived intangible assets are amortized over their estimated useful lives of
2
to
50
years and are reviewed for impairment whenever there are indicators that the carrying value of the assets may not be fully recoverable. The Company recorded an impairment charge for goodwill and intangibles of
$11 million
and
$21 million
during the years ended December 31, 2016 and 2015, respectively (see Note 18 in Item 8 for more information). There were no impairment charges recorded for goodwill and indefinite-lived intangible assets during the year ended December 31, 2014. If management used different estimates and assumptions in its impairment tests, then the Company could recognize different amounts of expense over future periods.
45
|
Item 7.
|
MANAGEMENT’S DISCUSSION AND ANALYSIS OF FINANCIAL CONDITION AND RESULTS OF OPERATIONS (Continued)
|
Employee Benefit Plans
The Company provides substantially all U.S. employees and employees at certain international subsidiaries with retirement benefits including defined benefit pension plans and defined contribution plans. The Company provides eligible U.S. employees who retire under qualifying conditions with access to postretirement health care, at full cost to the retiree (certain employees are “grandfathered” into subsidized coverage while others are provided with Health Care Reimbursement Accounts). In order to measure the expense and funded status of these employee benefit plans, management makes several estimates and assumptions, including interest rates used to discount certain liabilities, rates of return on assets set aside to fund these plans, rates of compensation increases, employee turnover rates, anticipated mortality rates, and anticipated future health care costs. These estimates and assumptions are based on the Company’s historical experience combined with management’s knowledge and understanding of current facts and circumstances. Management also uses third-party actuaries to assist in measuring the expense and funded status of these employee benefit plans. If management used different estimates and assumptions regarding these plans, the funded status of the plans could vary significantly, and the Company could recognize different amounts of expense over future periods.
|
Item 7A.
|
QUANTITATIVE AND QUALITATIVE DISCLOSURES ABOUT MARKET RISK
|
The market risk inherent in the Company’s market risk sensitive instruments and positions is the potential loss arising from adverse changes in: commodity market prices as they relate to the Company’s net commodity position, foreign currency exchange rates, and interest rates as described below.
Commodities
The availability and prices of agricultural commodities are subject to wide fluctuations due to factors such as changes in weather conditions, crop disease, plantings, government programs and policies, competition, changes in global demand, changes in customer preferences and standards of living, and global production of similar and competitive crops.
The Company manages its exposure to adverse price movements of agricultural commodities used for, and produced in, its business operations, by entering into derivative and non-derivative contracts which reduce the Company’s overall short or long commodity position. Additionally, the Company uses exchange-traded futures and exchange-traded and over-the-counter option contracts as components of merchandising strategies designed to enhance margins. The results of these strategies can be significantly impacted by factors such as the correlation between the value of exchange-traded commodities futures contracts and the cash prices of the underlying commodities, counterparty contract defaults, and volatility of freight markets. In addition, the Company, from time-to-time, enters into derivative contracts which are designated as hedges of specific volumes of commodities that will be purchased and processed, or sold, in a future month. The changes in the market value of such futures contracts have historically been, and are expected to continue to be, highly effective at offsetting changes in price movements of the hedged item. Gains and losses arising from open and closed designated hedging transactions are deferred in other comprehensive income, net of applicable taxes, and recognized as a component of cost of products sold or revenues in the statement of earnings when the hedged item is recognized.
The Company’s commodity position consists of merchandisable agricultural commodity inventories, related purchase and sales contracts, energy and freight contracts, and exchange-traded futures and exchange-traded and over-the-counter option contracts including contracts used to hedge portions of production requirements, net of sales.
The fair value of the Company’s commodity position is a summation of the fair values calculated for each commodity by valuing all of the commodity positions at quoted market prices for the period, where available, or utilizing a close proxy. The Company has established metrics to monitor the amount of market risk exposure, which consist of volumetric limits, and value-at-risk (VaR) limits. VaR measures the potential loss, at a 95% confidence level, that could be incurred over a one year period. Volumetric limits are monitored daily and VaR calculations and sensitivity analysis are monitored weekly.
In addition to measuring the hypothetical loss resulting from an adverse two standard deviation move in market prices (assuming no correlations) over a one year period using VaR, sensitivity analysis is performed measuring the potential loss in fair value resulting from a hypothetical 10% adverse change in market prices. The highest, lowest, and average weekly position for the years ended
December 31, 2016
and
2015
together with the market risk from a hypothetical 10% adverse price change is as follows:
46
|
Item 7A.
|
QUANTITATIVE AND QUALITATIVE DISCLOSURES ABOUT MARKET RISK (Continued)
|
|
|
December 31, 2016
|
December 31, 2015
|
||||||||||||||
|
Long/(Short)
|
Fair Value
|
Market Risk
|
Fair Value
|
Market Risk
|
||||||||||||
|
|
(In millions)
|
|||||||||||||||
|
Highest position
|
$
|
876
|
|
$
|
88
|
|
$
|
(49
|
)
|
$
|
(5
|
)
|
||||
|
Lowest position
|
(529
|
)
|
(53
|
)
|
(1,851
|
)
|
(185
|
)
|
||||||||
|
Average position
|
27
|
|
3
|
|
(715
|
)
|
(72
|
)
|
||||||||
The change in fair value of the average position was principally the result of a decrease in average quantities underlying the weekly commodity position.
Currencies
The Company has consolidated subsidiaries in
76
countries. For the majority of the Company’s subsidiaries located outside the United States, the local currency is the functional currency except certain significant subsidiaries in Switzerland and Brazil where the Euro and U.S. dollar are the functional currencies, respectively. To reduce the risks associated with foreign currency exchange rate fluctuations, the Company enters into currency exchange contracts to minimize its foreign currency position related to transactions denominated primarily in Euro, British pound, Canadian dollar, and Brazilian real currencies. These currencies represent the major functional or local currencies in which recurring business transactions occur. The Company does not use currency exchange contracts as hedges against amounts permanently invested in foreign subsidiaries and affiliates. The currency exchange contracts used are forward contracts, swaps with banks, exchange-traded futures contracts, and over-the-counter options. The changes in market value of such contracts have a high correlation to the price changes in the currency of the related transactions. The potential loss in fair value for such net currency position resulting from a hypothetical 10% adverse change in foreign currency exchange rates is not material.
The amount the Company considers permanently invested in foreign subsidiaries and affiliates and translated into dollars using the year-end exchange rates is
$7.3 billion
and
$8.0 billion
at
December 31, 2016
and
2015
, respectively. The decrease is due to the depreciation of foreign currencies versus the U.S. dollar of
$0.4 billion
and the decrease in retained earnings of the foreign subsidiaries and affiliates of
$0.3 billion
. The potential loss in fair value, which would principally be recognized in Other Comprehensive Income, resulting from a hypothetical 10% adverse change in quoted foreign currency exchange rates is
$728 million
and
$809 million
for
December 31, 2016
and
2015
, respectively. Actual results may differ.
Interest
The fair value of the Company’s long-term debt is estimated using quoted market prices, where available, and discounted future cash flows based on the Company’s current incremental borrowing rates for similar types of borrowing arrangements. Such fair value exceeded the long-term debt carrying value. Market risk is estimated as the potential increase in fair value resulting from a hypothetical 50 basis points decrease in interest rates. Actual results may differ.
|
December 31, 2016
|
December 31, 2015
|
||||||
|
|
(In millions)
|
||||||
|
Fair value of long-term debt
|
$
|
7,494
|
|
$
|
6,718
|
|
|
|
Excess of fair value over carrying value
|
990
|
|
938
|
|
|||
|
Market risk
|
317
|
|
307
|
|
|||
The fair value of long-term debt increased primarily due to the $1.0 billion new debt issued on August 11, 2016.
47
|
Item 8.
|
FINANCIAL STATEMENTS AND SUPPLEMENTARY DATA
|
|
|
|
|
Financial Statements
|
Page No.
|
|
|
|
|
Consolidated Statements of Earnings
|
|
|
|
|
|
Consolidated Statements of Comprehensive Income (Loss)
|
|
|
|
|
|
Consolidated Balance Sheets
|
|
|
|
|
|
Consolidated Statements of Cash Flows
|
|
|
|
|
|
Consolidated Statements of Shareholders’ Equity
|
|
|
|
|
|
Notes to Consolidated Financial Statements
|
|
|
|
|
|
Reports of Independent Registered Public Accounting Firm
|
|
48
Archer-Daniels-Midland Company
|
Year Ended
|
|||||||||||
|
(In millions, except per share amounts)
|
December 31
|
||||||||||
|
|
2016
|
2015
|
2014
|
||||||||
|
|
|
||||||||||
|
Revenues
|
$
|
62,346
|
|
$
|
67,702
|
|
$
|
81,201
|
|
||
|
Cost of products sold
|
58,662
|
|
63,682
|
|
76,433
|
|
|||||
|
Gross Profit
|
3,684
|
|
4,020
|
|
4,768
|
|
|||||
|
Selling, general and administrative expenses
|
2,045
|
|
2,039
|
|
1,933
|
|
|||||
|
Asset impairment, exit, and restructuring costs
|
55
|
|
200
|
|
105
|
|
|||||
|
Interest expense
|
293
|
|
308
|
|
337
|
|
|||||
|
Equity in earnings of unconsolidated affiliates
|
(292
|
)
|
(390
|
)
|
(372
|
)
|
|||||
|
Interest income
|
(92
|
)
|
(71
|
)
|
(92
|
)
|
|||||
|
Other (income) expense - net
|
(147
|
)
|
(350
|
)
|
(273
|
)
|
|||||
|
Earnings Before Income Taxes
|
1,822
|
|
2,284
|
|
3,130
|
|
|||||
|
Income taxes
|
534
|
|
438
|
|
877
|
|
|||||
|
Net Earnings Including Noncontrolling Interests
|
1,288
|
|
1,846
|
|
2,253
|
|
|||||
|
Less: Net earnings (losses) attributable to noncontrolling interests
|
9
|
|
(3
|
)
|
5
|
|
|||||
|
Net Earnings Attributable to Controlling Interests
|
$
|
1,279
|
|
$
|
1,849
|
|
$
|
2,248
|
|
||
|
Average number of shares outstanding – basic
|
588
|
|
618
|
|
653
|
|
|||||
|
Average number of shares outstanding – diluted
|
591
|
|
621
|
|
656
|
|
|||||
|
Basic earnings per common share
|
$
|
2.18
|
|
$
|
2.99
|
|
$
|
3.44
|
|
||
|
Diluted earnings per common share
|
$
|
2.16
|
|
$
|
2.98
|
|
$
|
3.43
|
|
||
See notes to consolidated financial statements.
49
Archer-Daniels-Midland Company
Consolidated Statements of Comprehensive Income (Loss)
|
|
Year Ended
|
||||||||||
|
(In millions)
|
December 31
|
||||||||||
|
|
2016
|
2015
|
2014
|
||||||||
|
|
|
||||||||||
|
Net earnings including noncontrolling interests
|
$
|
1,288
|
|
$
|
1,846
|
|
$
|
2,253
|
|
||
|
Other comprehensive income (loss):
|
|
|
|||||||||
|
Foreign currency translation adjustment
|
(467
|
)
|
(962
|
)
|
(954
|
)
|
|||||
|
Tax effect
|
(10
|
)
|
(11
|
)
|
30
|
|
|||||
|
Net of tax amount
|
(477
|
)
|
(973
|
)
|
(924
|
)
|
|||||
|
Pension and other postretirement benefit liabilities adjustment
|
(1
|
)
|
154
|
|
(464
|
)
|
|||||
|
Tax effect
|
3
|
|
(47
|
)
|
164
|
|
|||||
|
Net of tax amount
|
2
|
|
107
|
|
(300
|
)
|
|||||
|
Deferred gain (loss) on hedging activities
|
33
|
|
(99
|
)
|
68
|
|
|||||
|
Tax effect
|
(12
|
)
|
37
|
|
(26
|
)
|
|||||
|
Net of tax effect
|
21
|
|
(62
|
)
|
42
|
|
|||||
|
Unrealized gain (loss) on investments
|
3
|
|
20
|
|
(5
|
)
|
|||||
|
Tax effect
|
(2
|
)
|
2
|
|
2
|
|
|||||
|
Net of tax effect
|
1
|
|
22
|
|
(3
|
)
|
|||||
|
Other comprehensive income (loss)
|
(453
|
)
|
(906
|
)
|
(1,185
|
)
|
|||||
|
Comprehensive income (loss)
|
835
|
|
940
|
|
1,068
|
|
|||||
|
Less: Comprehensive income (loss) attributable to noncontrolling interests
|
8
|
|
(4
|
)
|
4
|
|
|||||
|
Comprehensive income (loss) attributable to controlling interests
|
$
|
827
|
|
$
|
944
|
|
$
|
1,064
|
|
||
See notes to consolidated financial statements.
50
Archer-Daniels-Midland Company
|
(In millions)
|
December 31, 2016
|
December 31, 2015
|
|||||
|
Assets
|
|
|
|||||
|
Current Assets
|
|
|
|||||
|
Cash and cash equivalents
|
$
|
619
|
|
$
|
910
|
|
|
|
Short-term marketable securities
|
296
|
|
438
|
|
|||
|
Segregated cash and investments
|
5,011
|
|
5,214
|
|
|||
|
Trade receivables
|
1,905
|
|
1,738
|
|
|||
|
Inventories
|
8,831
|
|
8,243
|
|
|||
|
Other current assets
|
4,383
|
|
5,286
|
|
|||
|
Total Current Assets
|
21,045
|
|
21,829
|
|
|||
|
Investments and Other Assets
|
|
|
|
|
|||
|
Investments in and advances to affiliates
|
4,497
|
|
3,901
|
|
|||
|
Long-term marketable securities
|
187
|
|
439
|
|
|||
|
Goodwill and other intangible assets
|
3,703
|
|
3,688
|
|
|||
|
Other assets
|
579
|
|
447
|
|
|||
|
Total Investments and Other Assets
|
8,966
|
|
8,475
|
|
|||
|
Property, Plant, and Equipment
|
|
|
|
|
|||
|
Land
|
445
|
|
454
|
|
|||
|
Buildings
|
4,679
|
|
4,715
|
|
|||
|
Machinery and equipment
|
17,160
|
|
17,159
|
|
|||
|
Construction in progress
|
1,213
|
|
946
|
|
|||
|
|
23,497
|
|
23,274
|
|
|||
|
Accumulated depreciation
|
(13,739
|
)
|
(13,421
|
)
|
|||
|
Net Property, Plant, and Equipment
|
9,758
|
|
9,853
|
|
|||
|
Total Assets
|
$
|
39,769
|
|
$
|
40,157
|
|
|
|
Liabilities and Shareholders’ Equity
|
|
|
|
|
|||
|
Current Liabilities
|
|
|
|
|
|||
|
Short-term debt
|
$
|
154
|
|
$
|
86
|
|
|
|
Trade payables
|
3,606
|
|
3,474
|
|
|||
|
Payables to brokerage customers
|
5,158
|
|
5,820
|
|
|||
|
Accrued expenses and other payables
|
3,982
|
|
4,113
|
|
|||
|
Current maturities of long-term debt
|
273
|
|
12
|
|
|||
|
Total Current Liabilities
|
13,173
|
|
13,505
|
|
|||
|
Long-Term Liabilities
|
|
|
|
|
|||
|
Long-term debt
|
6,504
|
|
5,779
|
|
|||
|
Deferred income taxes
|
1,669
|
|
1,563
|
|
|||
|
Other
|
1,218
|
|
1,395
|
|
|||
|
Total Long-Term Liabilities
|
9,391
|
|
8,737
|
|
|||
|
Temporary Equity - Redeemable noncontrolling interest
|
24
|
|
—
|
|
|||
|
Shareholders’ Equity
|
|
|
|
|
|||
|
Common stock
|
2,327
|
|
3,180
|
|
|||
|
Reinvested earnings
|
17,444
|
|
16,865
|
|
|||
|
Accumulated other comprehensive income (loss)
|
(2,598
|
)
|
(2,146
|
)
|
|||
|
Noncontrolling interests
|
8
|
|
16
|
|
|||
|
Total Shareholders’ Equity
|
17,181
|
|
17,915
|
|
|||
|
Total Liabilities, Temporary Equity, and Shareholders’ Equity
|
$
|
39,769
|
|
$
|
40,157
|
|
|
See notes to consolidated financial statements.
51
Archer-Daniels-Midland Company
|
(In millions)
|
Year Ended December 31
|
||||||||||
|
|
2016
|
2015
|
2014
|
||||||||
|
Operating Activities
|
|
||||||||||
|
Net earnings including noncontrolling interests
|
$
|
1,288
|
|
$
|
1,846
|
|
$
|
2,253
|
|
||
|
Adjustments to reconcile net earnings to net cash
|
|
|
|||||||||
|
provided by (used in) operating activities
|
|
|
|||||||||
|
Depreciation and amortization
|
900
|
|
882
|
|
894
|
|
|||||
|
Asset impairment charges
|
34
|
|
129
|
|
41
|
|
|||||
|
Deferred income taxes
|
56
|
|
(7
|
)
|
(59
|
)
|
|||||
|
Equity in earnings of affiliates, net of dividends
|
(61
|
)
|
(50
|
)
|
(215
|
)
|
|||||
|
Stock compensation expense
|
74
|
|
79
|
|
55
|
|
|||||
|
Pension and postretirement accruals (contributions), net
|
(135
|
)
|
(112
|
)
|
13
|
|
|||||
|
Loss on debt extinguishment
|
—
|
|
189
|
|
—
|
|
|||||
|
Gain on sale and revaluation of assets
|
(130
|
)
|
(572
|
)
|
(351
|
)
|
|||||
|
Other – net
|
34
|
|
(152
|
)
|
71
|
|
|||||
|
Changes in operating assets and liabilities
|
|
|
|||||||||
|
Segregated cash and investments
|
262
|
|
(314
|
)
|
(954
|
)
|
|||||
|
Trade receivables
|
(160
|
)
|
913
|
|
425
|
|
|||||
|
Inventories
|
(654
|
)
|
872
|
|
1,274
|
|
|||||
|
Other current assets
|
(176
|
)
|
460
|
|
220
|
|
|||||
|
Trade payables
|
161
|
|
(774
|
)
|
(94
|
)
|
|||||
|
Payables to brokerage customers
|
87
|
|
24
|
|
1,167
|
|
|||||
|
Accrued expenses and other payables
|
(105
|
)
|
(943
|
)
|
203
|
|
|||||
|
Total Operating Activities
|
1,475
|
|
2,470
|
|
4,943
|
|
|||||
|
Investing Activities
|
|
|
|||||||||
|
Purchases of property, plant, and equipment
|
(882
|
)
|
(1,125
|
)
|
(894
|
)
|
|||||
|
Net assets of businesses acquired
|
(130
|
)
|
(479
|
)
|
(2,758
|
)
|
|||||
|
Proceeds from sale of business and assets
|
195
|
|
1,765
|
|
414
|
|
|||||
|
Cash divested from deconsolidation
|
—
|
|
—
|
|
(12
|
)
|
|||||
|
Investments in and advances to affiliates
|
(662
|
)
|
(226
|
)
|
(184
|
)
|
|||||
|
Purchases of marketable securities
|
(1,401
|
)
|
(1,084
|
)
|
(1,344
|
)
|
|||||
|
Proceeds from sales of marketable securities
|
1,659
|
|
1,119
|
|
1,239
|
|
|||||
|
Other – net
|
10
|
|
9
|
|
132
|
|
|||||
|
Total Investing Activities
|
(1,211
|
)
|
(21
|
)
|
(3,407
|
)
|
|||||
|
Financing Activities
|
|
|
|||||||||
|
Long-term debt borrowings
|
1,041
|
|
1,252
|
|
1
|
|
|||||
|
Long-term debt payments
|
(14
|
)
|
(994
|
)
|
(1,251
|
)
|
|||||
|
Net borrowings (payments) under lines of credit agreements
|
61
|
|
(18
|
)
|
(458
|
)
|
|||||
|
Debt repurchase premium and costs
|
—
|
|
(189
|
)
|
—
|
|
|||||
|
Purchases of treasury stock
|
(1,000
|
)
|
(2,040
|
)
|
(1,183
|
)
|
|||||
|
Cash dividends
|
(701
|
)
|
(687
|
)
|
(624
|
)
|
|||||
|
Other – net
|
34
|
|
27
|
|
(62
|
)
|
|||||
|
Total Financing Activities
|
(579
|
)
|
(2,649
|
)
|
(3,577
|
)
|
|||||
|
Increase (decrease) in cash, cash equivalents, restricted cash, and restricted cash equivalents
|
(315
|
)
|
(200
|
)
|
(2,041
|
)
|
|||||
|
Cash, cash equivalents, restricted cash, and restricted cash equivalents – beginning of year
|
1,003
|
|
1,203
|
|
3,244
|
|
|||||
|
Cash, cash equivalents, restricted cash, and restricted cash equivalents
–
end of year
|
$
|
688
|
|
$
|
1,003
|
|
$
|
1,203
|
|
||
|
Reconciliation of cash, cash equivalents, restricted cash, and restricted cash equivalents to the consolidated balance sheets
|
|||||||||||
|
Cash and cash equivalents
|
$
|
619
|
|
$
|
910
|
|
$
|
1,099
|
|
||
|
Restricted cash and restricted cash equivalents included in segregated cash and investments
|
69
|
|
93
|
|
104
|
|
|||||
|
Total cash, cash equivalents, restricted cash, and restricted cash equivalents
|
$
|
688
|
|
$
|
1,003
|
|
$
|
1,203
|
|
||
|
Cash paid for interest and income taxes were as follows:
|
|||||||||||
|
Interest
|
$
|
283
|
|
$
|
334
|
|
$
|
338
|
|
||
|
Income taxes
|
398
|
|
602
|
|
720
|
|
|||||
52
Archer-Daniels-Midland Company
Consolidated Statements of Shareholders’ Equity
|
Accumulated
Other
|
Total
|
|||||||||||||||||||||
|
|
Common Stock
|
Reinvested
|
Comprehensive
|
Noncontrolling
|
Shareholders’
|
|||||||||||||||||
|
|
Shares
|
Amount
|
Earnings
|
Income (Loss)
|
Interests
|
Equity
|
||||||||||||||||
|
|
(In millions)
|
|||||||||||||||||||||
|
Balance, December 31, 2013
|
659
|
|
6,136
|
|
14,077
|
|
(57
|
)
|
38
|
|
20,194
|
|
||||||||||
|
Comprehensive income
|
|
|
|
|
|
|
|
|
|
|
|
|
||||||||||
|
Net earnings
|
|
|
|
|
2,248
|
|
|
|
5
|
|
|
|
||||||||||
|
Other comprehensive income
|
|
|
|
|
|
|
(1,184
|
)
|
(1
|
)
|
|
|
||||||||||
|
Total comprehensive income
|
|
|
|
|
|
|
|
|
|
|
1,068
|
|
||||||||||
|
Cash dividends paid-$0.96 per share
|
|
|
|
|
(624
|
)
|
|
|
|
|
(624
|
)
|
||||||||||
|
Treasury stock purchases
|
(25
|
)
|
(1,183
|
)
|
(1,183
|
)
|
||||||||||||||||
|
Stock compensation expense
|
|
|
55
|
|
|
|
|
|
|
|
55
|
|
||||||||||
|
Acquisition of noncontrolling interests
|
(12
|
)
|
(12
|
)
|
||||||||||||||||||
|
Noncontrolling interests from business combinations
|
19
|
|
19
|
|
||||||||||||||||||
|
Other
|
3
|
|
119
|
|
|
|
|
|
(6
|
)
|
113
|
|
||||||||||
|
Balance, December 31, 2014
|
637
|
|
$
|
5,115
|
|
$
|
15,701
|
|
$
|
(1,241
|
)
|
$
|
55
|
|
$
|
19,630
|
|
|||||
|
Comprehensive income
|
||||||||||||||||||||||
|
Net earnings
|
1,849
|
|
(3
|
)
|
||||||||||||||||||
|
Other comprehensive income
|
(905
|
)
|
(1
|
)
|
||||||||||||||||||
|
Total comprehensive income
|
940
|
|
||||||||||||||||||||
|
Cash dividends paid-$1.12 per share
|
(687
|
)
|
(687
|
)
|
||||||||||||||||||
|
Treasury stock purchases
|
(43
|
)
|
(2,040
|
)
|
(2,040
|
)
|
||||||||||||||||
|
Stock compensation expense
|
1
|
|
79
|
|
79
|
|
||||||||||||||||
|
Other
|
—
|
|
26
|
|
2
|
|
(35
|
)
|
(7
|
)
|
||||||||||||
|
Balance, December 31, 2015
|
595
|
|
$
|
3,180
|
|
$
|
16,865
|
|
$
|
(2,146
|
)
|
$
|
16
|
|
$
|
17,915
|
|
|||||
|
Comprehensive income
|
||||||||||||||||||||||
|
Net earnings
|
1,279
|
|
9
|
|
||||||||||||||||||
|
Other comprehensive income (loss)
|
(452
|
)
|
(1
|
)
|
||||||||||||||||||
|
Total comprehensive income
|
835
|
|
||||||||||||||||||||
|
Cash dividends paid-$1.20 per share
|
(701
|
)
|
(701
|
)
|
||||||||||||||||||
|
Treasury stock purchases
|
(25
|
)
|
(1,000
|
)
|
(1,000
|
)
|
||||||||||||||||
|
Stock compensation expense
|
1
|
|
74
|
|
74
|
|
||||||||||||||||
|
Other
|
2
|
|
73
|
|
1
|
|
(16
|
)
|
58
|
|
||||||||||||
|
Balance, December 31, 2016
|
573
|
|
$
|
2,327
|
|
$
|
17,444
|
|
$
|
(2,598
|
)
|
$
|
8
|
|
$
|
17,181
|
|
|||||
See notes to consolidated financial statements.
53
Archer-Daniels-Midland Company
Notes to Consolidated Financial Statements
Nature of Business
The Company is principally engaged in procuring, transporting, storing, processing, and merchandising agricultural commodities and products.
Principles of Consolidation
The consolidated financial statements include the accounts of the Company and its subsidiaries. All significant intercompany accounts and transactions have been eliminated. The Company consolidates all entities, including variable interest entities (VIEs), in which it has a controlling financial interest. For VIEs, the Company assesses whether it is the primary beneficiary as defined under the applicable accounting standard. Investments in affiliates, including VIEs through which the Company exercises significant influence but does not control the investee and is not the primary beneficiary of the investee’s activities, are carried at cost plus equity in undistributed earnings since acquisition and are adjusted, where appropriate, for basis differences between the investment balance and the underlying net assets of the investee. The Company’s portion of the results of certain affiliates and results of certain VIEs are included using the most recent available financial statements. In each case, the financial statements are within 93 days of the Company’s year end and are consistent from period to period.
Use of Estimates
The preparation of consolidated financial statements in conformity with generally accepted accounting principles requires management to make estimates and assumptions that affect amounts reported in its consolidated financial statements and accompanying notes. Actual results could differ from those estimates.
Reclassification
The Company classified
$71 million
of intangible amortization in selling, general, and administrative expenses in the year ended December 31, 2016. Prior period amounts of
$29 million
and
$26 million
in the years ended December 31, 2015 and 2014, respectively, have been reclassified from other (income) expense - net in the consolidated statements of earnings and in Note 12 to conform to the current presentation.
Cash Equivalents
The Company considers all non-segregated, highly-liquid investments with a maturity of three months or less at the time of purchase to be cash equivalents.
Segregated Cash and Investments
The Company segregates certain cash and investment balances in accordance with regulatory requirements, commodity exchange requirements, insurance arrangements, and lending arrangements. These segregated balances represent deposits received from customers of the Company’s registered futures commission merchant, securities pledged to commodity exchange clearinghouses, and cash and securities pledged as security under certain insurance or lending arrangements. Segregated cash also includes restricted cash held as collateral for various insurance programs of the Company's captive insurance business. Segregated cash and investments primarily consist of cash, United States government securities, and money-market funds.
Receivables
The Company records accounts receivable at net realizable value. This value includes an allowance for estimated uncollectible accounts of
$72 million
and
$70 million
at
December 31, 2016
and
2015
, respectively, to reflect any loss anticipated on the accounts receivable balances. The Company estimates this allowance based on its history of write-offs, level of past-due accounts, and its relationships with, and the economic status of, its customers. Portions of the allowance for uncollectible accounts are recorded in trade receivables, other current assets, and other assets.
54
Archer-Daniels-Midland Company
Notes to Consolidated Financial Statements (Continued)
Note 1. Summary of Significant Accounting Policies (Continued)
Credit risk on receivables is minimized as a result of the large and diversified nature of the Company’s worldwide customer base. The Company manages its exposure to counter-party credit risk through credit analysis and approvals, credit limits, and monitoring procedures. Collateral is generally not required for the Company’s receivables.
Accounts receivable due from unconsolidated affiliates as of
December 31, 2016
and
2015
was
$232 million
and
$35 million
, respectively.
Inventories
Inventories of certain merchandisable agricultural commodities, which include inventories acquired under deferred pricing contracts, are stated at market value. In addition, the Company values certain inventories using the lower of cost, determined by either the first-in, first-out (FIFO) or last-in, first-out (LIFO) methods, or market.
The following table sets forth the Company’s inventories as of
December 31, 2016
and
2015
.
|
December 31, 2016
|
December 31, 2015
|
||||||
|
|
(In millions)
|
||||||
|
LIFO inventories
|
|
|
|||||
|
FIFO value
|
$
|
1,390
|
|
$
|
1,077
|
|
|
|
LIFO valuation reserve
|
(75
|
)
|
(56
|
)
|
|||
|
LIFO inventories carrying value
|
1,315
|
|
1,021
|
|
|||
|
FIFO inventories
|
2,705
|
|
2,756
|
|
|||
|
Market inventories
|
4,424
|
|
4,066
|
|
|||
|
Supplies and other inventories
|
387
|
|
400
|
|
|||
|
Total inventories
|
$
|
8,831
|
|
$
|
8,243
|
|
|
Fair Value Measurements
The Company determines fair value based on the price that would be received to sell an asset or paid to transfer a liability in an orderly transaction between market participants at the measurement date. The Company uses the market approach valuation technique to measure the majority of its assets and liabilities carried at fair value. Three levels are established within the fair value hierarchy that may be used to report fair value: Level 1: Quoted prices (unadjusted) in active markets for identical assets or liabilities. Level 2: Observable inputs, including Level 1 prices that have been adjusted; quoted prices for similar assets or liabilities; quoted prices in markets that are less active than traded exchanges; and other inputs that are observable or can be substantially corroborated by observable market data. Level 3: Unobservable inputs that are supported by little or no market activity and that are a significant component of the fair value of the assets or liabilities. In evaluating the significance of fair value inputs, the Company generally classifies assets or liabilities as Level 3 when their fair value is determined using unobservable inputs that individually or when aggregated with other unobservable inputs, represent more than 10% of the fair value of the assets or liabilities. Judgment is required in evaluating both quantitative and qualitative factors in the determination of significance for purposes of fair value level classification. Level 3 amounts can include assets and liabilities whose value is determined using pricing models, discounted cash flow methodologies, or similar techniques, as well as assets and liabilities for which the determination of fair value requires significant management judgment or estimation.
Based on historical experience with the Company’s suppliers and customers, the Company’s own credit risk and knowledge of current market conditions, the Company does not view nonperformance risk to be a significant input to fair value for the majority of its forward commodity purchase and sale contracts. However, in certain cases, if the Company believes the nonperformance risk to be a significant input, the Company records estimated fair value adjustments, and classifies the contract in Level 3.
55
Archer-Daniels-Midland Company
Notes to Consolidated Financial Statements (Continued)
Note 1. Summary of Significant Accounting Policies (Continued)
In many cases, a valuation technique used to measure fair value includes inputs from multiple levels of the fair value hierarchy. The lowest level of input that is a significant component of the fair value measurement determines the placement of the entire fair value measurement in the hierarchy. The Company’s assessment of the significance of a particular input to the fair value measurement requires judgment, and may affect the classification of fair value assets and liabilities within the fair value hierarchy levels.
The Company’s policy regarding the timing of transfers between levels, including both transfers into and transfers out of Level 3, is to measure and record the transfers at the end of the reporting period.
Derivatives
The Company recognizes all of its derivative instruments as either assets or liabilities at fair value in its consolidated balance sheet. Unrealized gains are reported as other current assets and unrealized losses are reported as accrued expenses and other payables. The accounting for changes in the fair value (i.e., gains or losses) of a derivative instrument depends on whether it has been designated and qualifies as part of a hedging relationship and on the type of hedging relationship. The majority of the Company’s derivatives have not been designated as hedging instruments, and as such, changes in fair value of these derivatives are recognized in earnings immediately. For those derivative instruments that are designated and qualify as hedging instruments, the Company designates the hedging instrument, based upon the exposure being hedged, as a fair value hedge or a cash flow hedge.
For derivative instruments that are designated and qualify as cash flow hedges (i.e., hedging the exposure to variability in expected future cash flows that is attributable to a particular risk), the effective portion of the gain or loss on the derivative instrument is reported as a component of accumulated other comprehensive income (AOCI) and reclassified into earnings in the same line item affected by the hedged transaction and in the same period or periods during which the hedged transaction affects earnings. The remaining gain or loss on the derivative instrument that is in excess of the cumulative change in the cash flows of the hedged item, if any (i.e., the ineffective portion), hedge components excluded from the assessment of effectiveness, and gains and losses related to discontinued hedges are recognized in the consolidated statement of earnings during the current period.
For derivative instruments that are designated and qualify as fair value hedges, changes in the fair value of the hedging instrument and changes in the fair value of the hedged item are recognized in the consolidated statement of earnings during the current period.
Marketable Securities
The Company classifies its marketable securities as available-for-sale. Available-for-sale securities are carried at fair value, with the unrealized gains and losses, net of income taxes, reported as a component of AOCI. The Company monitors its investments for impairment periodically, and recognizes an impairment charge when the decline in fair value of an investment is judged to be other-than-temporary. The Company uses the specific identification method when securities are sold or reclassified out of AOCI into earnings. The Company considers marketable securities maturing in less than one year as short-term. All other marketable securities are classified as long-term.
Property, Plant, and Equipment
Property, plant, and equipment is recorded at cost. Repair and maintenance costs are expensed as incurred. The Company generally uses the straight-line method in computing depreciation for financial reporting purposes and generally uses accelerated methods for income tax purposes. The annual provisions for depreciation have been computed principally in accordance with the following ranges of asset lives: buildings -
15
to
40
years; machinery and equipment -
3
to
40
years. The Company capitalized interest on major construction projects in progress of
$20 million
,
$11 million
, and
$18 million
for the years ended
December 31, 2016
,
2015
, and
2014
, respectively.
56
Archer-Daniels-Midland Company
Notes to Consolidated Financial Statements (Continued)
Note 1. Summary of Significant Accounting Policies (Continued)
Income Taxes
The Company accounts for its income tax positions in accordance with the applicable accounting standards. The liability method is used in accounting for income taxes. Deferred tax assets and liabilities are recorded for temporary differences between the tax basis of assets and liabilities and reported amounts in the consolidated financial statements using statutory rates in effect for the year in which the differences are expected to reverse. The effect on deferred tax assets and liabilities of a change in tax rates is recorded in the results of operations in the period that includes the enactment date under the law. Applicable accounting standards prescribe a minimum threshold a tax position is required to meet before being recognized in the consolidated financial statements. The Company recognizes in its consolidated financial statements tax positions determined more likely than not to be sustained upon examination, based on the technical merits of the position.
The Company classifies interest on income tax-related balances as interest expense and classifies tax-related penalties as selling, general and administrative expenses.
Goodwill and other intangible assets
Goodwill and other intangible assets deemed to have indefinite lives are not amortized but are subject to annual impairment tests. Definite-lived intangible assets are amortized over their estimated useful lives of
2
to
50
years and are reviewed for impairment whenever there are indicators that the carrying value of the assets may not be fully recoverable. The Company’s accounting policy is to evaluate goodwill and other intangible assets with indefinite lives for impairment on October 1 of each fiscal year or whenever there are indicators that the carrying value of the assets may not be fully recoverable. The Company recorded impairment charges for goodwill and intangibles totaling
$11 million
related to computer software and
$21 million
related to computer software, certain of the Company’s international Oilseeds Processing facilities, and a facility in its Corn Processing segment during the years ended December 31, 2016 and 2015, respectively. There were
no
impairment charges recorded for goodwill and intangible assets during the year ended December 31, 2014.
Asset Abandonments and Write-Downs
The Company evaluates long-lived assets for impairment whenever indicators of impairment exist. Assets are written down to fair value after consideration of the Company’s ability to utilize the assets for their intended purpose, employ the assets in alternative uses, or sell the assets to recover the carrying value. Fair value is generally based on discounted cash flow analysis which relies on management’s estimate of market participant assumptions (a Level 3 measurement under applicable accounting standards). During the years ended
December 31, 2016
,
2015
, and
2014
, impairment charges were
$17 million
,
$108 million
, and
$35 million
, respectively (see Note 18 for additional information).
Payables to Brokerage Customers
Payables to brokerage customers represent the total of customer accounts at the Company’s futures commission merchant with credit or positive balances. Customer accounts are used primarily in connection with commodity transactions and include gains and losses on open commodity trades as well as securities and other deposits made for margins or other purpose as required by the Company or the exchange-clearing organizations or counterparties. Payables to brokerage customers have a corresponding balance in segregated cash and investments and customer omnibus receivable in other current assets.
Revenues
The Company follows a policy of recognizing sales revenue at the time of delivery of the product and when all of the following have occurred: a sales agreement is in place, pricing is fixed or determinable, and collection is reasonably assured. The Company has sales contracts that allow for pricing to occur after title of the goods has passed to the customer. In these cases, the Company continues to report the goods in inventory until it recognizes the sales revenue once the price has been determined. Freight costs and handling charges related to sales are recorded as a component of cost of products sold.
Net sales to unconsolidated affiliates during the years ended
December 31, 2016
,
2015
, and
2014
were
$4.2 billion
,
$5.0 billion
, and
$5.8 billion
, respectively.
57
Archer-Daniels-Midland Company
Notes to Consolidated Financial Statements (Continued)
Note 1. Summary of Significant Accounting Policies (Continued)
Stock Compensation
The Company recognizes expense for its stock compensation based on the fair value of the awards that are granted. The Company’s stock compensation plans provide for the granting of restricted stock, restricted stock units, performance stock units, and stock options. The fair values of stock options and performance stock units are estimated at the date of grant using the Black-Scholes option valuation model and a lattice valuation model, respectively. These valuation models require the input of highly subjective assumptions. Measured compensation cost, net of estimated forfeitures, is recognized ratably over the vesting period of the related stock compensation award.
Research and Development
Costs associated with research and development are expensed as incurred. Such costs incurred, net of expenditures subsequently reimbursed by government grants, were
$123 million
,
$122 million
, and
$79 million
for the years ended
December 31, 2016
,
2015
, and
2014
, respectively.
Per Share Data
Basic earnings per common share are determined by dividing net earnings attributable to controlling interests by the weighted average number of common shares outstanding. In computing diluted earnings per share, average number of common shares outstanding is increased by common stock options outstanding with exercise prices lower than the average market price of common shares using the treasury share method.
Business Combinations
The Company’s acquisitions are accounted for as purchases in accordance with ASC Topic 805,
Business Combinations,
as amended
.
Assets acquired and liabilities assumed, based on preliminary purchase price allocations, are adjusted to fair values at acquisition date with the remainder of the purchase price, if any, recorded as goodwill. During the measurement period, which may take up to one year from the acquisition date, adjustments to the assets acquired and liabilities assumed may be recorded. Upon the conclusion of the measurement period or the final determination of the values of assets acquired and liabilities assumed, whichever comes first, any subsequent adjustments are charged to the consolidated statements of earnings.
Adoption of New Accounting Standards
Effective January 1, 2016, the Company adopted the amended guidance of Accounting Standards Codification (ASC) Topic 805,
Business Combinations
, which simplifies the accounting for adjustments made to provisional amounts recognized in a business combination. The amended guidance requires an acquirer to recognize adjustments to provisional amounts identified during the measurement period in the reporting period in which the adjustment amounts are determined. The effect on earnings of changes in depreciation, amortization, or other income effects, if any, as a result of the change to the provisional amounts, calculated as if the accounting had been completed at the acquisition date, shall be recorded in the same period’s financial statements. The amended guidance also requires an entity to present separately on the face of the income statement or disclose in the notes the portion of the amount recorded in current-period earnings by line item that would have been recorded in previous reporting periods if the adjustment to the provisional amounts had been recognized as of the acquisition date. The adoption of this amended guidance did not have a significant impact on the Company’s financial results.
Effective January 1, 2016, the Company adopted Accounting Standards Update 2016-09, which amended the guidance of ASC Topic 718,
Compensation - Stock Compensation
, to simplify the accounting for share-based payment award transactions. The areas of simplification include the income tax consequences, classification of awards as either equity or liabilities, and classification on the statement of cash flows. The adoption of this amended guidance did not have a significant impact on the Company’s financial results.
58
Archer-Daniels-Midland Company
Notes to Consolidated Financial Statements (Continued)
Note 1. Summary of Significant Accounting Policies (Continued)
Effective October 1, 2016, the Company adopted the amended guidance of ASC 230,
Statement of Cash Flows
(Topic 230), which is intended to clarify how entities should present restricted cash and restricted cash equivalents in the statement of cash flows and to address diversity in how certain cash receipts and cash payments are presented and classified in the statement of cash flows. The amended guidance requires entities to show the changes in the total of cash, cash equivalents, restricted cash, and restricted cash equivalents in the statement of cash flows and a reconciliation of the totals in the statement of cash flows to the related captions in the balance sheet either on the face of the statement of cash flows or in the notes to the financial statements. The amendments also provide guidance on the application of the predominance principle and the presentation and classification of debt prepayments or debt extinguishment costs, settlement of zero-coupon debt instruments or other debt instruments with coupon interest rates that are insignificant in relation to the effective interest rate of the borrowing, contingent consideration payments made after a business combination, proceeds from the settlement of insurance claims, proceeds from the settlement of corporate-owned life insurance policies, distributions received from equity method investees, beneficial interests in securitization transactions, and separately identifiable cash flows. The adoption of the amended guidance pertaining to restricted cash and restricted cash equivalents resulted in expanded disclosures, a decrease of
$11 million
and
$19 million
in total cash provided by operating activities for the years ended December 31, 2015 and 2014, respectively, an increase of
$93 million
and
$104 million
in the ending balances in cash, cash equivalents, restricted cash, and restricted cash equivalents as of December 31, 2015 and 2014, respectively, and a change in the cash flow presentation. The adoption of the other amendments did not have a significant impact on the Company's consolidated statement of cash flows.
Pending Accounting Standards
Effective January 1, 2017, the Company will be required to adopt the amended guidance of ASC Topic 330,
Inventory
, which simplifies the measurement of inventory. The amended guidance requires an entity to measure its cost-based inventory at the lower of cost or net realizable value, where net realizable value is the estimated selling price in the ordinary course of business, less reasonably predictable costs of completion, disposal, and transportation. The Company does not expect the adoption of this amended guidance to have a significant impact on the Company’s financial results.
Effective January 1, 2017, the Company will be required to adopt the amended guidance of ASC Topic 323,
Investments - Equity Method and Joint Ventures
, which simplifies the transition to the equity method of accounting. The amended guidance eliminates the requirement of an investor to adjust the investment, results of operations, and retained earnings retroactively when an investment qualifies for equity method accounting as a result of an increase in the level of ownership interest or degree of influence. The amendments require that the investor add the cost of acquiring the additional interest in the investee to the current basis of the investors’ previously held interest and adopt the equity method of accounting as of the date the investment becomes qualified for equity method accounting. The Company does not expect the adoption of this amended guidance to have a significant impact on the Company’s financial results.
Effective January 1, 2017, the Company will be required to adopt the amended guidance of ASC Topic 810,
Consolidatio
n, which affects reporting entities that are required to evaluate whether they should consolidate a variable interest entity in certain situations involving entities under common control. The amended guidance changes the evaluation of whether a reporting entity is the primary beneficiary of a variable interest entity by changing how a reporting entity that is a single decision maker of a variable interest entity treats indirect interests in the entity held through related parties that are under common control with the reporting entity. The Company will be required to adopt the amended guidance using a retrospective transition approach to all periods presented. The Company does not expect the adoption of this amended guidance to result in the deconsolidation of any of its variable interest entities.
Effective January 1, 2018, the Company will be required to adopt the amended guidance of ASC Subtopic 825-10,
Financial Instruments - Overall
, which is intended to improve the recognition and measurement of financial instruments. The amended guidance requires an entity to measure equity investments, except those accounted for under the equity method of accounting or those that result in consolidation of the investee, at fair value with changes in fair value recognized in net income and simplify the impairment assessment of equity investments without readily determinable fair values by using a qualitative assessment to identify impairment. The Company does not expect the adoption of this amended guidance to have a significant impact on the Company’s financial results.
59
Archer-Daniels-Midland Company
Notes to Consolidated Financial Statements (Continued)
Effective January 1, 2018, the Company will be required to adopt the new guidance of ASC Topic 606,
Revenue from Contracts with Customers
(Topic 606), which will supersede the revenue recognition requirements in ASC Topic 605,
Revenue Recognition
. Topic 606 requires the Company to recognize revenue to depict the transfer of promised goods or services to customers in an amount that reflects the consideration to which the entity expects to be entitled in exchange for those goods or services. The new guidance requires the Company to apply the following steps: (1) identify the contract with a customer; (2) identify the performance obligations in the contract; (3) determine the transaction price; (4) allocate the transaction price to the performance obligations in the contract; and (5) recognize revenue when, or as, the Company satisfies a performance obligation. The Company will be required to adopt Topic 606 either on a full retrospective basis to each prior reporting period presented or on a modified retrospective basis with the cumulative effect of initially applying the new guidance recognized at the date of initial application. The Company will adopt Topic 606 on a modified retrospective basis and will be required to provide additional disclosures of the amount by which each financial statement line item is affected in the current reporting period, as compared to the guidance that was in effect before the change, and an explanation of the reasons for significant changes. The adoption of this new guidance will require expanded disclosures in the Company’s consolidated financial statements. The Company has established a cross-functional implementation team consisting of representatives from all of its business segments. The Company utilized surveys to gather information and identify areas of its business where potential differences could result in applying the requirements of the new standard to its revenue contracts. The results of the surveys indicate potential differences in the area of control transfer. Initial impact assessment also indicates that the majority of the Company's contracts will continue to be recognized at a point in time and that the number of performance obligations and the accounting for variable consideration are not expected to be significantly different from current practice. Many of the Company's sales contracts are considered derivatives under ASC Topic 815, Derivatives and Hedging, and are therefore excluded from the scope of Topic 606. The Company is scheduled to conduct workshops to gather more information about the nature, magnitude, and frequency of the underlying transactions that drove the survey responses resulting in the identification of potential issues. These workshops are expected to be completed by the end of first quarter of 2017. The Company expects to further its assessment of the financial impact of the new guidance on its consolidated financial statements by mid 2017.
Effective January 1, 2018, the Company will be required to adopt the amended guidance of ASC Topic 740,
Income Taxes
, which requires entities to recognize the income tax consequences of an intra-entity transfer, other than inventory, when the transfer occurs. Under current accounting rules, entities are prohibited from recognizing current and deferred income taxes for an intra-entity asset transfer until the asset has been sold to an outside party. The amended guidance does not change the accounting for the pre-tax effects of an intra-entity asset transfer or for an intra-entity transfer of inventory. The Company will be required to adopt the amended guidance on a modified retrospective approach basis through a cumulative effect adjustment to retained earnings as of the beginning of the period of adoption. Early adoption is permitted as of the beginning of an annual period. The Company does not expect the adoption of this amended guidance to have a significant impact on the Company's financial results.
Effective January 1, 2019, the Company will be required to adopt the new guidance of ASC Topic 842,
Leases
(Topic 842), which will supersede ASC Topic 840,
Leases
. Topic 842 requires lessees to recognize assets and liabilities for all leases with lease terms of more than 12 months. The Company expects to adopt Topic 842 using a modified retrospective transition approach for leases existing at, or entered into after, the beginning of the earliest comparative period presented in the financial statements. The Company has not yet completed the assessment of the impact of the new guidance on its consolidated financial statements.
Effective January 1, 2020, the Company will be required to adopt the amended guidance of ASC Topic 326,
Financial Instruments - Credit Losses
, which is intended to improve financial reporting by requiring more timely recording of credit losses on loans and other financial instruments held by financial institutions and other organizations. The amended guidance requires the measurement of all expected credit losses for financial assets held at the reporting date based on historical experience, current conditions, and reasonable and supportable forecasts. Early adoption will be permitted for fiscal years, and interim periods within those fiscal years, beginning after December 15, 2018. The Company does not expect the adoption of this amended guidance to have a significant impact on the Company’s financial results.
60
Archer-Daniels-Midland Company
Notes to Consolidated Financial Statements (Continued)
Operating results of acquisitions are included in the Company’s financial statements from the date of acquisition.
Fiscal Year 2016 acquisitions
During the year ended December 31, 2016, the Company acquired a
90%
interest in Harvest Innovations, an industry leader in minimally processed, expeller-pressed soy proteins, oils, and gluten-free ingredients; a
50%
interest in Cairo-based Medsofts Group, a joint venture that owns and manages merchandising and supply chain operations; Caterina Foods, a leading toll manufacturer of specialty gluten-free and high-protein pastas; and a Casablanca, Morocco-based corn wet mill that produces glucose and native starch for an aggregate cost of
$141 million
in cash. The aggregate purchase price of these acquisitions, net of cash acquired of
$11 million
, was preliminarily allocated to working capital, property, plant, and equipment, goodwill, other intangible assets, other long-term assets, other long-term liabilities, and redeemable noncontrolling interest for
$15 million
,
$23 million
,
$72 million
,
$41 million
,
$34 million
,
$17 million
, and
$38 million
, respectively.
The remaining
10%
interest in Harvest Innovations is recorded in other long-term liabilities and accounted for as a mandatorily redeemable interest which the Company has agreed to acquire following
two years
of operations.
The Company has an option
three years
from the date of acquisition to acquire the remaining
50%
interest in Medsofts Group based on a fixed multiple of earnings before taxes, interest, and depreciation and amortization for the last
twelve months
of this
three
-year period. If the Company does not elect to exercise its option, the noncontrolling interest holder has the option to put the
50%
interest to the Company on similar, though discounted, terms. The Company records the
50%
remaining interest in temporary equity - redeemable noncontrolling interest.
Fiscal Year 2015 acquisitions
On November 2, 2015, the Company completed the acquisition of the remaining
50 percent
interest in Eaststarch C.V. The acquisition includes corn wet mills in Bulgaria and Turkey and a
50 percent
stake in a wet mill in Hungary enhancing the Company’s capabilities to serve customers around the world. The 2015 post acquisition financial results of Eaststarch C.V. are reported in the Corn Processing segment.
During the year ended December 31, 2015, the Company acquired
four
businesses, including the remaining interest in Eaststarch C.V. described above, for a total cost of
$508 million
. The purchase price, net of cash acquired of
$29 million
, plus the acquisition-date fair values of the Company’s previously held equity interests of
$385 million
in Eaststarch C.V. and
$64 million
in North Star Shipping and Minmetal included in Others below, were preliminarily allocated as follows:
61
Archer-Daniels-Midland Company
Notes to Consolidated Financial Statements (Continued)
Note 2. Acquisitions (Continued)
|
(In millions)
|
Eaststarch C.V.
|
Others
|
Total
|
||||||
|
Trade receivables
|
$
|
27
|
|
$
|
25
|
|
$
|
52
|
|
|
Inventories
|
47
|
|
15
|
|
62
|
|
|||
|
Other current assets
|
24
|
|
6
|
|
30
|
|
|||
|
Investments in and advances to affiliates
|
193
|
|
—
|
|
193
|
|
|||
|
Goodwill
|
132
|
|
119
|
|
251
|
|
|||
|
Other intangible assets
|
166
|
|
161
|
|
327
|
|
|||
|
Property, plant, and equipment
|
126
|
|
73
|
|
199
|
|
|||
|
Other assets
|
—
|
|
15
|
|
15
|
|
|||
|
Trade payables
|
(16
|
)
|
(13
|
)
|
(29
|
)
|
|||
|
Accrued expense and other payables
|
(24
|
)
|
(13
|
)
|
(37
|
)
|
|||
|
Long-term debt
|
—
|
|
(43
|
)
|
(43
|
)
|
|||
|
Deferred income taxes
|
(32
|
)
|
(38
|
)
|
(70
|
)
|
|||
|
Other liabilities
|
(22
|
)
|
—
|
|
(22
|
)
|
|||
|
Total purchase price, net of cash acquired, plus acquisition date fair values of previously held equity interests
|
$
|
621
|
|
$
|
307
|
|
$
|
928
|
|
In the year ended December 31, 2015, the Company recognized pre-tax gains of
$185 million
on the Eaststarch C.V. transaction and
$27 million
on the North Star Shipping and Minmetal transaction included in Others above, representing the difference between the carrying values and acquisition-date fair values of the Company’s previously held equity interests. The acquisition date fair value was determined based on a discounted cash flow analysis using market participant assumptions (a Level 3 measurement under applicable accounting standards).
Goodwill recorded in connection with the acquisitions is primarily attributable to the synergies expected to arise after the Company’s acquisition of the businesses.
The following table sets forth the preliminary fair values and weighted average useful lives of the other intangible assets acquired.
|
Weighted Average
|
||||||||||
|
Useful Life
|
Eaststarch C.V.
|
Others
|
Total
|
|||||||
|
(In years)
|
(In millions)
|
|||||||||
|
Intangible assets with indefinite lives:
|
||||||||||
|
Trademarks/brands
|
$
|
—
|
|
$
|
5
|
|
$
|
5
|
|
|
|
Intangible assets with finite lives:
|
||||||||||
|
Land rights
|
33
|
—
|
|
122
|
|
122
|
|
|||
|
Customer lists
|
15
|
166
|
|
31
|
|
197
|
|
|||
|
Recipes and other
|
5
|
—
|
|
3
|
|
3
|
|
|||
|
Total other intangible assets acquired
|
$
|
166
|
|
$
|
161
|
|
$
|
327
|
|
|
The Company’s consolidated statement of earnings for the year ended December 31, 2015 includes the post acquisition results of the acquired businesses which were immaterial.
The 2016 finalization of the purchase price allocation related to the acquisition of Eaststarch C.V. resulted in increases in goodwill and other intangibles of
$38 million
and
$4 million
, respectively, with a corresponding decrease in other long-term liabilities. The finalization of the purchase price allocations related to the other acquisitions did not result in material adjustments in 2016.
62
Archer-Daniels-Midland Company
Notes to Consolidated Financial Statements (Continued)
Note 2. Acquisitions (Continued)
Fiscal Year 2014 acquisitions
On October 1, 2014 and November 18, 2014, the Company completed the acquisitions of the WILD Flavors businesses (Wild Flavors) and Specialty Commodities Inc. (SCI), respectively. Both acquisitions are in line with the Company’s strategy to increase returns and reduce earnings volatility through the growth of its specialty ingredient offerings. The 2014 post acquisition financial results of Wild Flavors and SCI are reported in the Wild Flavors and Specialty Ingredients segment.
During the year ended December 31, 2014, the Company acquired
six
businesses, including Wild Flavors and SCI, for a total cost of
$3.0 billion
. The purchase price net of cash acquired of
$280 million
was preliminarily allocated as follows:
|
(In millions)
|
Wild Flavors
|
SCI
|
Others
|
Total
|
||||||||
|
Trade receivables
|
$
|
176
|
|
$
|
48
|
|
$
|
8
|
|
$
|
232
|
|
|
Inventories
|
286
|
|
72
|
|
25
|
|
383
|
|
||||
|
Other current assets
|
64
|
|
2
|
|
—
|
|
66
|
|
||||
|
Goodwill
|
1,698
|
|
59
|
|
15
|
|
1,772
|
|
||||
|
Other intangible assets
|
1,103
|
|
46
|
|
35
|
|
1,184
|
|
||||
|
Property, plant, and equipment
|
423
|
|
10
|
|
30
|
|
463
|
|
||||
|
Other assets
|
68
|
|
6
|
|
—
|
|
74
|
|
||||
|
Short-term debt
|
(215
|
)
|
—
|
|
(1
|
)
|
(216
|
)
|
||||
|
Trade payables
|
(128
|
)
|
(25
|
)
|
(1
|
)
|
(154
|
)
|
||||
|
Accrued expenses and other payables
|
(214
|
)
|
(14
|
)
|
(10
|
)
|
(238
|
)
|
||||
|
Long-term debt
|
(238
|
)
|
—
|
|
(3
|
)
|
(241
|
)
|
||||
|
Deferred income taxes
|
(378
|
)
|
(16
|
)
|
—
|
|
(394
|
)
|
||||
|
Other liabilities
|
(173
|
)
|
—
|
|
—
|
|
(173
|
)
|
||||
|
Total purchase price, net of cash acquired
|
$
|
2,472
|
|
$
|
188
|
|
$
|
98
|
|
$
|
2,758
|
|
Goodwill recorded in connection with the acquisitions is primarily attributable to the synergies expected to arise after the Company’s acquisition of the businesses. Of the
$1.8 billion
preliminarily allocated to goodwill,
$15 million
is expected to be deductible for tax purposes.
The following table sets forth the preliminary fair values and weighted average useful lives of the other intangible assets acquired.
|
Weighted Average
|
|||||||||||||
|
Useful Life
|
Wild Flavors
|
SCI
|
Others
|
Total
|
|||||||||
|
(In years)
|
(In millions)
|
||||||||||||
|
Intangible assets with indefinite lives:
|
|||||||||||||
|
Trademarks/brands
|
$
|
238
|
|
$
|
—
|
|
$
|
12
|
|
$
|
250
|
|
|
|
Intangible assets with finite lives:
|
|||||||||||||
|
Patents
|
15
|
—
|
|
3
|
|
—
|
|
3
|
|
||||
|
Customer lists
|
15
|
552
|
|
36
|
|
21
|
|
609
|
|
||||
|
Recipes and other
|
15
|
313
|
|
7
|
|
2
|
|
322
|
|
||||
|
Total other intangible assets acquired
|
$
|
1,103
|
|
$
|
46
|
|
$
|
35
|
|
$
|
1,184
|
|
|
The Company’s consolidated statement of earnings for the year ended December 31, 2014 includes the post acquisition results of Wild Flavors which were immaterial.
63
Archer-Daniels-Midland Company
Notes to Consolidated Financial Statements (Continued)
The 2015 finalization of the purchase price allocation related to the acquisition of Wild Flavors resulted in an increase in goodwill of
$123 million
with corresponding decreases in other intangibles and other long-term liabilities. The finalization of the purchase price allocations related to the other acquisitions did not result in material adjustments in 2015.
The following tables set forth, by level, the Company’s assets and liabilities that were accounted for at fair value on a recurring basis as of
December 31, 2016
and
2015
.
|
|
Fair Value Measurements at December 31, 2016
|
||||||||||||||
|
Quoted Prices in
Active Markets
for Identical
Assets
(Level 1)
|
Significant
Other
Observable
Inputs
(Level 2)
|
Significant
Unobservable
Inputs
(Level 3)
|
Total
|
||||||||||||
|
|
|
(In millions)
|
|
||||||||||||
|
Assets:
|
|
|
|
|
|||||||||||
|
Inventories carried at market
|
$
|
—
|
|
$
|
3,102
|
|
$
|
1,322
|
|
$
|
4,424
|
|
|||
|
Unrealized derivative gains:
|
|
|
|
|
|
|
|
|
|||||||
|
Commodity contracts
|
—
|
|
371
|
|
140
|
|
511
|
|
|||||||
|
Foreign exchange contracts
|
—
|
|
102
|
|
—
|
|
102
|
|
|||||||
|
Interest rate contracts
|
—
|
|
11
|
|
—
|
|
11
|
|
|||||||
|
Cash equivalents
|
286
|
|
—
|
|
—
|
|
286
|
|
|||||||
|
Marketable securities
|
408
|
|
69
|
|
—
|
|
477
|
|
|||||||
|
Segregated investments
|
1,613
|
|
—
|
|
—
|
|
1,613
|
|
|||||||
|
Deferred consideration
|
—
|
|
540
|
|
—
|
|
540
|
|
|||||||
|
Total Assets
|
$
|
2,307
|
|
$
|
4,195
|
|
$
|
1,462
|
|
$
|
7,964
|
|
|||
|
Liabilities:
|
|
|
|
|
|
|
|
|
|||||||
|
Unrealized derivative losses:
|
|
|
|
|
|
|
|
|
|||||||
|
Commodity contracts
|
$
|
—
|
|
$
|
419
|
|
$
|
142
|
|
$
|
561
|
|
|||
|
Foreign exchange contracts
|
—
|
|
90
|
|
—
|
|
90
|
|
|||||||
|
Inventory-related payables
|
—
|
|
491
|
|
30
|
|
521
|
|
|||||||
|
Total Liabilities
|
$
|
—
|
|
$
|
1,000
|
|
$
|
172
|
|
$
|
1,172
|
|
|||
64
Archer-Daniels-Midland Company
Notes to Consolidated Financial Statements (Continued)
Note 3. Fair Value Measurements (Continued)
|
|
Fair Value Measurements at December 31, 2015
|
||||||||||||||
|
Quoted Prices in
Active Markets
for Identical
Assets
(Level 1)
|
Significant
Other
Observable
Inputs
(Level 2)
|
Significant
Unobservable
Inputs
(Level 3)
|
Total
|
||||||||||||
|
|
|
(In millions)
|
|
||||||||||||
|
Assets:
|
|
|
|
|
|||||||||||
|
Inventories carried at market
|
$
|
—
|
|
$
|
3,062
|
|
$
|
1,004
|
|
$
|
4,066
|
|
|||
|
Unrealized derivative gains:
|
|
|
|
|
|
|
|
|
|||||||
|
Commodity contracts
|
—
|
|
403
|
|
243
|
|
646
|
|
|||||||
|
Foreign exchange contracts
|
1
|
|
92
|
|
—
|
|
93
|
|
|||||||
|
Interest rate contracts
|
—
|
|
19
|
|
—
|
|
19
|
|
|||||||
|
Cash equivalents
|
328
|
|
—
|
|
—
|
|
328
|
|
|||||||
|
Marketable securities
|
698
|
|
175
|
|
—
|
|
873
|
|
|||||||
|
Segregated investments
|
1,938
|
|
—
|
|
—
|
|
1,938
|
|
|||||||
|
Deferred consideration
|
—
|
|
513
|
|
—
|
|
513
|
|
|||||||
|
Total Assets
|
$
|
2,965
|
|
$
|
4,264
|
|
$
|
1,247
|
|
$
|
8,476
|
|
|||
|
Liabilities:
|
|
|
|
|
|
|
|
|
|||||||
|
Unrealized derivative losses:
|
|
|
|
|
|
|
|
|
|||||||
|
Commodity contracts
|
$
|
—
|
|
$
|
306
|
|
$
|
113
|
|
$
|
419
|
|
|||
|
Foreign exchange contracts
|
—
|
|
186
|
|
—
|
|
186
|
|
|||||||
|
Inventory-related payables
|
—
|
|
705
|
|
16
|
|
721
|
|
|||||||
|
Total Liabilities
|
$
|
—
|
|
$
|
1,197
|
|
$
|
129
|
|
$
|
1,326
|
|
|||
Estimated fair values for inventories carried at market are based on exchange-quoted prices, adjusted for differences in local markets, broker or dealer quotations or market transactions in either listed or over-the-counter (OTC) markets. Market valuations for the Company’s inventories are adjusted for location and quality because the exchange-quoted prices represent contracts that have standardized terms for commodity, quantity, future delivery period, delivery location, and commodity quality or grade. When unobservable inputs have a significant impact on the measurement of fair value, the inventory is classified in Level 3. Changes in the fair value of inventories are recognized in the consolidated statements of earnings as a component of cost of products sold.
Derivative contracts include exchange-traded commodity futures and option contracts, forward commodity purchase and sale contracts, and OTC instruments related primarily to agricultural commodities, energy, interest rates, and foreign currencies. Exchange-traded futures and options contracts are valued based on unadjusted quoted prices in active markets and are classified in Level 1. The majority of the Company’s exchange-traded futures and options contracts are cash-settled on a daily basis and, therefore, are not included in these tables. Fair value for forward commodity purchase and sale contracts is estimated based on exchange-quoted prices adjusted for differences in local markets. These differences are generally determined using inputs from broker or dealer quotations or market transactions in either the listed or OTC markets. When observable inputs are available for substantially the full term of the contract, it is classified in Level 2. When unobservable inputs have a significant impact (more than 10%) on the measurement of fair value, the contract is classified in Level 3. Except for certain derivatives designated as cash flow hedges, changes in the fair value of commodity-related derivatives are recognized in the consolidated statements of earnings as a component of cost of products sold. Changes in the fair value of foreign currency-related derivatives are recognized in the consolidated statements of earnings as a component of revenues, cost of products sold, and other (income) expense–net. The effective portions of changes in the fair value of derivatives designated as cash flow hedges are recognized in the consolidated balance sheets as a component of accumulated other comprehensive income (loss) until the hedged items are recorded in earnings or it is probable the hedged transaction will no longer occur.
65
Archer-Daniels-Midland Company
Notes to Consolidated Financial Statements (Continued)
Note 3. Fair Value Measurements (Continued)
The Company’s cash equivalents are comprised of money market funds valued using quoted market prices and are classified as Level 1.
The Company’s marketable securities are comprised of equity investments, U.S. Treasury securities, obligations of U.S. government agencies, and other debt securities. Publicly traded equity investments and U.S. Treasury securities are valued using quoted market prices and are classified in Level 1. U.S. government agency obligations and corporate and municipal debt securities are valued using third-party pricing services and substantially all are classified in Level 2. Unrealized changes in the fair value of available-for-sale marketable securities are recognized in the consolidated balance sheets as a component of accumulated other comprehensive income (loss) unless a decline in value is deemed to be other-than-temporary at which point the decline is recorded in earnings.
The Company’s segregated investments are comprised of U.S. Treasury securities. U.S. Treasury securities are valued using quoted market prices and are classified in Level 1.
The Company has deferred consideration under its accounts receivable securitization programs (the “Programs”) which represents a note receivable from the purchasers under the Programs. This amount is reflected in other current assets on the consolidated balance sheet (see Notes 6 and 19). The Company carries the deferred consideration at fair value determined by calculating the expected amount of cash to be received. The fair value is principally based on observable inputs (a Level 2 measurement) consisting mainly of the face amount of the receivables adjusted for anticipated credit losses and discounted at the appropriate market rate. Payment of deferred consideration is not subject to significant risks other than delinquencies and credit losses on accounts receivable transferred under the program which have historically been insignificant.
The following tables present a rollforward of the activity of all assets and liabilities measured at fair value on a recurring basis using significant unobservable inputs (Level 3) during the years ended
December 31, 2016
and
2015
.
|
|
Level 3 Fair Value Assets Measurements at December 31, 2016
|
||||||||||
|
Inventories
Carried at
Market
|
Commodity
Derivative
Contracts
Gains
|
Total
|
|||||||||
|
|
(In millions)
|
||||||||||
|
Balance, December 31, 2015
|
$
|
1,004
|
|
$
|
243
|
|
$
|
1,247
|
|
||
|
Total increase (decrease) in net realized/unrealized gains included in cost of products sold
(1)
|
44
|
|
192
|
|
236
|
|
|||||
|
Purchases
|
9,900
|
|
—
|
|
9,900
|
|
|||||
|
Sales
|
(9,567
|
)
|
—
|
|
(9,567
|
)
|
|||||
|
Settlements
|
—
|
|
(420
|
)
|
(420
|
)
|
|||||
|
Transfers into Level 3
|
70
|
|
168
|
|
238
|
|
|||||
|
Transfers out of Level 3
|
(129
|
)
|
(43
|
)
|
(172
|
)
|
|||||
|
Ending balance, December 31, 2016
|
$
|
1,322
|
|
$
|
140
|
|
$
|
1,462
|
|
||
(1)
Includes gains of
$138 million
that are attributable to the change in unrealized gains relating to Level 3 assets still held at
December 31, 2016
.
66
Archer-Daniels-Midland Company
Notes to Consolidated Financial Statements (Continued)
Note 3. Fair Value Measurements (Continued)
|
|
Fair Value Liabilities Measurements at December 31, 2016
|
||||||||||
|
Inventory-
related
Payables
|
Commodity
Derivative
Contracts
Losses
|
Total
|
|||||||||
|
|
(In millions)
|
||||||||||
|
Balance, December 31, 2015
|
$
|
16
|
|
$
|
113
|
|
$
|
129
|
|
||
|
Total increase (decrease) in net realized/unrealized losses included in cost of products sold
(1)
|
13
|
|
566
|
|
579
|
|
|||||
|
Purchases
|
16
|
|
—
|
|
16
|
|
|||||
|
Sales
|
(15
|
)
|
—
|
|
(15
|
)
|
|||||
|
Settlements
|
—
|
|
(476
|
)
|
(476
|
)
|
|||||
|
Transfers into Level 3
|
—
|
|
158
|
|
158
|
|
|||||
|
Transfers out of Level 3
|
—
|
|
(219
|
)
|
(219
|
)
|
|||||
|
Ending balance, December 31, 2016
|
$
|
30
|
|
$
|
142
|
|
$
|
172
|
|
||
(1)
Includes losses of
$578 million
that are attributable to the change in unrealized losses relating to Level 3 liabilities still held at
December 31, 2016
.
|
|
Fair Value Assets Measurements at December 31, 2015
|
||||||||||
|
Inventories
Carried at
Market
|
Commodity
Derivative
Contracts
Gains
|
Total
|
|||||||||
|
|
(In millions)
|
||||||||||
|
Balance, December 31, 2014
|
$
|
1,491
|
|
$
|
203
|
|
$
|
1,694
|
|
||
|
Total increase (decrease) in net realized/unrealized gains included in cost of products sold
(1)
|
(320
|
)
|
265
|
|
(55
|
)
|
|||||
|
Purchases
|
10,459
|
|
—
|
|
10,459
|
|
|||||
|
Sales
|
(10,534
|
)
|
—
|
|
(10,534
|
)
|
|||||
|
Settlements
|
—
|
|
(378
|
)
|
(378
|
)
|
|||||
|
Transfers into Level 3
|
146
|
|
195
|
|
341
|
|
|||||
|
Transfers out of Level 3
|
(238
|
)
|
(42
|
)
|
(280
|
)
|
|||||
|
Ending balance, December 31, 2015
|
$
|
1,004
|
|
$
|
243
|
|
$
|
1,247
|
|
||
(1)
Includes gains of
$297 million
that are attributable to the change in unrealized gains relating to Level 3 assets still held at
December 31, 2015
.
67
Archer-Daniels-Midland Company
Notes to Consolidated Financial Statements (Continued)
Note 3. Fair Value Measurements (Continued)
|
|
Fair Value Liabilities Measurements at December 31, 2015
|
||||||||||
|
Inventory-
related
Payables
|
Commodity
Derivative
Contracts
Losses
|
Total
|
|||||||||
|
|
(In millions)
|
||||||||||
|
Balance, December 31, 2014
|
$
|
40
|
|
$
|
212
|
|
$
|
252
|
|
||
|
Total increase (decrease) in net realized/unrealized losses included in cost of products sold
(1)
|
(10
|
)
|
315
|
|
305
|
|
|||||
|
Purchases
|
17
|
|
—
|
|
17
|
|
|||||
|
Sales
|
(31
|
)
|
—
|
|
(31
|
)
|
|||||
|
Settlements
|
—
|
|
(566
|
)
|
(566
|
)
|
|||||
|
Transfers into Level 3
|
—
|
|
177
|
|
177
|
|
|||||
|
Transfers out of Level 3
|
—
|
|
(25
|
)
|
(25
|
)
|
|||||
|
Ending balance, December 31, 2015
|
$
|
16
|
|
$
|
113
|
|
$
|
129
|
|
||
(1)
Includes losses of
$328 million
that are attributable to the change in unrealized losses relating to Level 3 liabilities still held at
December 31, 2015
.
For all periods presented, the Company had no transfers between Levels 1 and 2. Transfers into Level 3 of assets and liabilities previously classified in Level 2 were due to the relative value of unobservable inputs to the total fair value measurement of certain products and derivative contracts rising above the 10% threshold. Transfers out of Level 3 were primarily due to the relative value of unobservable inputs to the total fair value measurement of certain products and derivative contracts falling below the 10% threshold and thus permitting reclassification to Level 2.
In some cases, the price components of inventories and commodity purchase and sale contracts are observable based upon available quotations for these pricing components, and in some cases, the differences are unobservable. These price components primarily include transportation costs and other adjustments required due to location, quality, or other contract terms. In the table below, these other adjustments are referred to as Basis. The changes in unobservable price components are determined by specific local supply and demand characteristics at each facility and the overall market. Factors such as substitute products, weather, fuel costs, contract terms, and futures prices also impact the movement of these unobservable price components.
The following table sets forth the weighted average percentage of the unobservable price components included in the Company’s Level 3 valuations as of
December 31, 2016
and
2015
. The Company’s Level 3 measurements may include Basis only, transportation cost only, or both price components. As an example, for Level 3 inventories with Basis, the unobservable component is a weighted average
16.5%
of the total price for assets and
67.1%
for liabilities.
|
Weighted Average
% of Total Price
|
||||||||
|
|
December 31, 2016
|
December 31, 2015
|
||||||
|
Component Type
|
Assets
|
Liabilities
|
Assets
|
Liabilities
|
||||
|
Inventories
|
|
|
|
|
||||
|
Basis
|
16.5%
|
67.1%
|
10.0%
|
53.5%
|
||||
|
Transportation cost
|
8.3%
|
—%
|
1.8%
|
—%
|
||||
|
Commodity Derivative Contracts
|
|
|
|
|
||||
|
Basis
|
16.9%
|
27.0%
|
17.7%
|
17.9%
|
||||
|
Transportation cost
|
11.6%
|
13.4%
|
6.6%
|
10.4%
|
||||
68
Archer-Daniels-Midland Company
Notes to Consolidated Financial Statements (Continued)
In certain of the Company’s principal markets, the Company relies on price quotes from third parties to value its inventories and physical commodity purchase and sale contracts. These price quotes are generally not further adjusted by the Company in determining the applicable market price. In some cases, availability of third-party quotes is limited to only one or two independent sources. In these situations, absent other corroborating evidence, the Company considers these price quotes as 100 percent unobservable and, therefore, the fair value of these items is reported in Level 3.
Derivatives Not Designated as Hedging Instruments
The majority of the Company’s derivative instruments have not been designated as hedging instruments. The Company uses exchange-traded futures and exchange-traded and OTC options contracts to manage its net position of merchandisable agricultural commodity inventories and forward cash purchase and sales contracts to reduce price risk caused by market fluctuations in agricultural commodities and foreign currencies. The Company also uses exchange-traded futures and exchange-traded and OTC options contracts as components of merchandising strategies designed to enhance margins. The results of these strategies can be significantly impacted by factors such as the correlation between the value of exchange-traded commodities futures contracts and the value of the underlying commodities, counterparty contract defaults, and volatility of freight markets. Derivatives, including exchange traded contracts and physical purchase or sale contracts, and inventories of certain merchandisable agricultural commodities, which include amounts acquired under deferred pricing contracts, are stated at market value. Inventory is not a derivative and therefore fair values of and changes in fair values of inventories are not included in the tables below.
The following table sets forth the fair value of derivatives not designated as hedging instruments as of
December 31, 2016
and
2015
.
|
|
December 31, 2016
|
December 31, 2015
|
|||||||||||||
|
|
Assets
|
Liabilities
|
Assets
|
Liabilities
|
|||||||||||
|
|
(In millions)
|
||||||||||||||
|
Foreign Currency Contracts
|
$
|
102
|
|
$
|
90
|
|
$
|
93
|
|
$
|
186
|
|
|||
|
Commodity Contracts
|
511
|
|
561
|
|
646
|
|
419
|
|
|||||||
|
Total
|
$
|
613
|
|
$
|
651
|
|
$
|
739
|
|
$
|
605
|
|
|||
The following table sets forth the pre-tax gains (losses) on derivatives not designated as hedging instruments that have been included in the consolidated statements of earnings for the years ended
December 31, 2016
,
2015
, and
2014
.
|
|
Year Ended
|
||||||||||
|
(In millions)
|
December 31
|
||||||||||
|
|
2016
|
2015
|
2014
|
||||||||
|
Foreign Currency Contracts
|
|
|
|||||||||
|
Revenues
|
$
|
(35
|
)
|
$
|
16
|
|
$
|
(1
|
)
|
||
|
Cost of products sold
|
291
|
|
(185
|
)
|
131
|
|
|||||
|
Other income (expense) - net
|
(225
|
)
|
8
|
|
(171
|
)
|
|||||
|
Commodity Contracts
|
|
|
|||||||||
|
Cost of products sold
|
(383
|
)
|
777
|
|
(263
|
)
|
|||||
|
Total gain (loss) recognized in earnings
|
$
|
(352
|
)
|
$
|
616
|
|
$
|
(304
|
)
|
||
During 2014, the Company recognized
$102 million
of pre-tax foreign exchange hedging losses on Euro foreign currency derivative contracts entered into to economically hedge the Wild Flavors acquisition.
69
Archer-Daniels-Midland Company
Notes to Consolidated Financial Statements (Continued)
Note 4. Derivative Instruments & Hedging Activities (Continued)
Changes in the market value of inventories of certain merchandisable agricultural commodities, forward cash purchase and sales contracts, exchange-traded futures and exchange-traded and OTC options contracts are recognized in earnings immediately as a component of cost of products sold.
Derivatives Designated as Cash Flow or Fair Value Hedging Strategies
As of
December 31, 2016
and
2015
, the Company had certain derivatives designated as cash flow hedges and fair value hedges.
The Company uses interest rate swaps designated as fair value hedges to protect the fair value of fixed-rate debt due to changes in interest rates. The changes in the fair value of the interest rate swaps and the underlying fixed-rate debt are recorded in other (income) expense - net. The terms of the interest rate swaps match the terms of the underlying debt resulting in no ineffectiveness. At
December 31, 2016
, the Company had
$11 million
in other current assets representing the fair value of the interest rate swaps and a corresponding increase in the underlying debt for the same amount with no impact to earnings.
For each of the commodity hedge programs described below, the derivatives are designated as cash flow hedges. Assuming normal market conditions, the changes in the market value of such derivative contracts have historically been, and are expected to continue to be, highly effective at offsetting changes in price movements of the hedged item. Once the hedged item is recognized in earnings, the gains/losses arising from the hedge are reclassified from AOCI to either revenues, cost of products sold, interest expense or other (income) expense – net, as applicable. As of
December 31, 2016
, the Company had
$10 million
of after-tax losses in AOCI related to gains and losses from commodity cash flow hedge transactions. The Company expects to recognize
$10 million
of losses in its consolidated statement of earnings during the next 12 months.
The Company uses futures or options contracts to fix the purchase price of anticipated volumes of corn to be purchased and processed in a future month. The objective of this hedging program is to reduce the variability of cash flows associated with the Company’s forecasted purchases of corn. The Company’s corn processing plants currently grind approximately
76 million
bushels of corn per month. During the past
12 months
, the Company hedged between
17%
and
62%
of its monthly anticipated grind. At
December 31, 2016
, the Company had designated hedges representing between
15%
to
39%
of its anticipated monthly grind of corn for the next
12 months
.
The Company, from time to time, also uses futures, options, and swaps to fix the sales price of certain ethanol sales contracts. The Company has established hedging programs for ethanol sales contracts that are indexed to unleaded gasoline prices and to various exchange-traded ethanol contracts. The objective of these hedging programs is to reduce the variability of cash flows associated with the Company’s sales of ethanol. During the past
12 months
, the Company hedged between
0
and
66 million
gallons of ethanol sales per month under these programs. At
December 31, 2016
, the Company had designated hedges representing between
0
to
21 million
gallons of ethanol sales per month over the next
12 months
.
The following tables set forth the fair value of derivatives designated as hedging instruments as of
December 31, 2016
and
2015
.
|
|
December 31, 2016
|
December 31, 2015
|
|||||||||||||
|
|
Assets
|
Liabilities
|
Assets
|
Liabilities
|
|||||||||||
|
|
(In millions)
|
||||||||||||||
|
Interest Contracts
|
$
|
11
|
|
$
|
—
|
|
$
|
19
|
|
$
|
—
|
|
|||
|
Total
|
$
|
11
|
|
$
|
—
|
|
$
|
19
|
|
$
|
—
|
|
|||
70
Archer-Daniels-Midland Company
Notes to Consolidated Financial Statements (Continued)
The following table sets forth the pre-tax gains (losses) on derivatives designated as hedging instruments that have been included in the consolidated statement of earnings for the years ended
December 31, 2016
,
2015
, and
2014
, respectively.
|
Year Ended
|
||||||||||||
|
Consolidated Statement of
|
December 31
|
|||||||||||
|
(In millions)
|
Earnings Locations
|
2016
|
2015
|
2014
|
||||||||
|
|
|
|
||||||||||
|
Effective amounts recognized in earnings
|
|
|||||||||||
|
FX Contracts
|
Other income/expense -net
|
$
|
(18
|
)
|
$
|
29
|
|
$
|
5
|
|
||
|
Interest Contracts
|
Interest expense
|
(2
|
)
|
1
|
|
1
|
|
|||||
|
Commodity Contracts
|
Cost of products sold
|
(82
|
)
|
(25
|
)
|
(124
|
)
|
|||||
|
|
Revenues
|
(35
|
)
|
41
|
|
(69
|
)
|
|||||
|
Ineffective amount recognized in earnings
|
|
|
||||||||||
|
Interest contracts
|
Other income/expense -net
|
—
|
|
1
|
|
—
|
|
|||||
|
Commodity contracts
|
Cost of products sold
|
6
|
|
(12
|
)
|
(4
|
)
|
|||||
|
Revenues
|
(5
|
)
|
6
|
|
(34
|
)
|
||||||
|
Total amount recognized in earnings
|
$
|
(136
|
)
|
$
|
41
|
|
$
|
(225
|
)
|
|||
Hedge ineffectiveness for commodity contracts results when the change in the price of the underlying commodity in a specific cash market differs from the change in the price of the derivative financial instrument used to establish the hedging relationship. As an example, if the change in the price of a corn futures contract is strongly correlated to the change in the cash price paid for corn, the gain or loss on the derivative instrument is deferred and recognized at the time the corn grind occurs. If the change in price of the derivative does not strongly correlate to the change in the cash price of corn, in the same example, some portion or all of the derivative gains or losses may be required to be recognized in earnings prior to the corn grind occurring.
Net Investment Hedging Strategies
On June 24, 2015, the Company issued
€500 million
aggregate principal amount of Floating Rate Notes and
€600 million
aggregate principal amount of
1.75%
Notes (collectively, the “Notes”) (see Note 10 for more information about the Notes). The Company has designated
€1.1 billion
of the Notes as a hedge of its net investment in a foreign subsidiary. As of
December 31, 2016
, the Company had
$40 million
of after-tax gains in AOCI related to gains and losses from the net investment hedge transaction. The amount is deferred in AOCI until the underlying investment is divested.
71
Archer-Daniels-Midland Company
Notes to Consolidated Financial Statements (Continued)
The following table sets forth items in short-term and long-term investments.
|
Cost
|
Unrealized
Gains |
Unrealized
Losses |
Fair
Value |
||||||||||||
|
|
(In millions)
|
||||||||||||||
|
December 31, 2016
|
|||||||||||||||
|
United States government obligations
|
|||||||||||||||
|
Maturity less than 1 year
|
$
|
287
|
|
$
|
—
|
|
$
|
—
|
|
$
|
287
|
|
|||
|
Maturity 1 to 5 years
|
121
|
|
—
|
|
(1
|
)
|
120
|
|
|||||||
|
Corporate debt securities
|
|
|
|
|
|||||||||||
|
Maturity less than 1 year
|
1
|
|
—
|
|
—
|
|
1
|
|
|||||||
|
Maturity 1 to 5 years
|
66
|
|
—
|
|
—
|
|
66
|
|
|||||||
|
Other debt securities
|
|
|
|
|
|||||||||||
|
Maturity less than 1 year
|
8
|
|
—
|
|
—
|
|
8
|
|
|||||||
|
Equity securities
|
|
|
|
||||||||||||
|
Available-for-sale
|
1
|
|
—
|
|
—
|
|
1
|
|
|||||||
|
$
|
484
|
|
$
|
—
|
|
$
|
(1
|
)
|
$
|
483
|
|
||||
|
Cost
|
Unrealized
Gains
|
Unrealized
Losses
|
Fair
Value
|
||||||||||||
|
|
(In millions)
|
||||||||||||||
|
December 31, 2015
|
|
|
|
|
|||||||||||
|
United States government obligations
|
|
|
|
|
|||||||||||
|
Maturity less than 1 year
|
$
|
256
|
|
$
|
—
|
|
$
|
—
|
|
$
|
256
|
|
|||
|
Maturity 1 to 5 years
|
116
|
|
—
|
|
—
|
|
116
|
|
|||||||
|
Corporate debt securities
|
|
|
|
|
|
|
|
|
|||||||
|
Maturity 1 to 5 years
|
26
|
|
—
|
|
—
|
|
26
|
|
|||||||
|
Other debt securities
|
|
|
|
|
|
|
|
|
|||||||
|
Maturity less than 1 year
|
182
|
|
—
|
|
—
|
|
182
|
|
|||||||
|
Maturity 1 to 5 years
|
3
|
|
—
|
|
—
|
|
3
|
|
|||||||
|
Equity securities
|
|
|
|
|
|
|
|
|
|||||||
|
Available-for-sale
|
296
|
|
4
|
|
(6
|
)
|
294
|
|
|||||||
|
|
$
|
879
|
|
$
|
4
|
|
$
|
(6
|
)
|
$
|
877
|
|
|||
The
$1 million
in unrealized losses at
December 31, 2016
arose within the last 12 months and is related to the Company’s investment in
one
available-for-sale debt security with a fair value of
$42 million
. The contractual terms of this investment do not permit the issuer to settle the securities at a price less than the amortized cost basis of the investment. Because the Company does not intend to sell the investment and it is not more likely than not that it will be required to sell the investment before recovery of its amortized cost basis, which may be maturity, the Company does not consider this investment to be other-than-temporarily impaired at
December 31, 2016
. For information on other-than temporary impairment charges, see Note 18.
In December 2016, the Company sold its
19.8%
ownership interest in GrainCorp for
A$387 million
(
US$288 million
). This investment was classified as an available-for-sale equity security in the December 31, 2015 table above.
72
Archer-Daniels-Midland Company
Notes to Consolidated Financial Statements (Continued)
The following table sets forth the items in other current assets:
|
December 31, 2016
|
December 31, 2015
|
||||||
|
|
(In millions)
|
||||||
|
Unrealized gains on derivative contracts
|
$
|
624
|
|
$
|
758
|
|
|
|
Deferred receivables consideration
|
540
|
|
513
|
|
|||
|
Customer omnibus receivable
|
521
|
|
1,148
|
|
|||
|
Financing receivables - net
(1)
|
373
|
|
352
|
|
|||
|
Insurance premiums receivable
|
648
|
|
584
|
|
|||
|
Prepaid expenses
|
268
|
|
406
|
|
|||
|
Tax receivables
|
480
|
|
550
|
|
|||
|
Non-trade receivables
(2)
|
478
|
|
288
|
|
|||
|
Other current assets
|
451
|
|
687
|
|
|||
|
|
$
|
4,383
|
|
$
|
5,286
|
|
|
(1)
The Company provides financing to suppliers, primarily Brazilian farmers, to finance a portion of the suppliers’ production costs. The amounts are reported net of allowances of
$7 million
and
$8 million
at
December 31, 2016
and
2015
, respectively. Interest earned on financing receivables of
$22 million
,
$23 million
, and
$23 million
for the years ended
December 31, 2016
,
2015
, and
2014
, respectively, is included in interest income in the consolidated statements of earnings.
(2)
Non-trade receivables include
$223 million
and
$272 million
of reinsurance recoverables as of
December 31, 2016
and
2015
, respectively.
The following table sets forth the items in accrued expenses and other payables:
|
December 31, 2016
|
December 31, 2015
|
||||||
|
|
(In millions)
|
||||||
|
Unrealized losses on derivative contracts
|
$
|
651
|
|
$
|
605
|
|
|
|
Reinsurance premiums payable
|
479
|
|
425
|
|
|||
|
Insurance claims payable
|
373
|
|
459
|
|
|||
|
Deferred income
|
1,065
|
|
1,152
|
|
|||
|
Other accruals and payables
|
1,414
|
|
1,472
|
|
|||
|
|
$
|
3,982
|
|
$
|
4,113
|
|
|
73
Archer-Daniels-Midland Company
Notes to Consolidated Financial Statements (Continued)
The Company applies the equity method of accounting for investments in investees over which the Company has the ability to exercise significant influence, including the Company’s
23.2%
and
19.0%
share ownership in Wilmar as of
December 31, 2016
and
2015
, respectively. The Company had
59
and
58
unconsolidated domestic and foreign affiliates as of
December 31, 2016
and
2015
, respectively. The following table summarizes the combined balance sheets as of
December 31, 2016
and
2015
, and the combined statements of earnings of the Company’s unconsolidated affiliates for the years ended
December 31, 2016
,
2015
, and
2014
.
|
December 31
|
|||||||
|
(In millions)
|
2016
|
2015
|
|||||
|
Current assets
|
$
|
25,145
|
|
$
|
25,475
|
|
|
|
Non-current assets
|
21,347
|
|
21,077
|
|
|||
|
Current liabilities
|
(20,587
|
)
|
(20,362
|
)
|
|||
|
Non-current liabilities
|
(5,830
|
)
|
(8,449
|
)
|
|||
|
Noncontrolling interests
|
(943
|
)
|
(947
|
)
|
|||
|
Net assets
|
$
|
19,132
|
|
$
|
16,794
|
|
|
|
Year Ended
|
|||||||||||
|
December 31
|
|||||||||||
|
(In millions)
|
2016
|
2015
|
2014
|
||||||||
|
|
|
|
|||||||||
|
Net Sales
|
$
|
45,296
|
|
$
|
47,980
|
|
$
|
50,591
|
|
||
|
Gross profit
|
4,375
|
|
4,530
|
|
4,558
|
|
|||||
|
Net income
|
1,119
|
|
1,428
|
|
1,561
|
|
|||||
The Company’s share of the undistributed earnings of its unconsolidated affiliates as of
December 31, 2016
, is
$1.9 billion
. The Company has a direct investment in a foreign equity method investee with a carrying value of
$3.2 billion
as of
December 31, 2016
, and a market value of
$3.6 billion
based on active market quoted prices converted to U.S. dollars at applicable exchange rates at
December 31, 2016
.
The Company provides credit facilities totaling
$90 million
to
four
unconsolidated affiliates.
Three
facilities that are due on demand and bear interest between
3.25%
and
3.75%
have a total outstanding balance of
$32 million
. The other
one
facility has
no
outstanding balance as of
December 31, 2016
. The outstanding balance is included in other current assets in the accompanying consolidated balance sheet.
74
Archer-Daniels-Midland Company
Notes to Consolidated Financial Statements (Continued)
Goodwill balances attributable to consolidated businesses, by segment, are set forth in the following table.
|
|
December 31, 2016
|
December 31, 2015
|
|||||
|
|
(In millions)
|
||||||
|
Agricultural Services
|
$
|
63
|
|
$
|
48
|
|
|
|
Corn Processing
|
260
|
|
225
|
|
|||
|
Oilseeds Processing
|
92
|
|
94
|
|
|||
|
Wild Flavors and Specialty Ingredients
|
1,822
|
|
1,808
|
|
|||
|
Other
|
9
|
|
10
|
|
|||
|
Total
|
$
|
2,246
|
|
$
|
2,185
|
|
|
The changes in goodwill during the year ended
December 31, 2016
are primarily related to acquisitions and purchase price allocation adjustments as discussed in Note 2 partially offset by foreign currency translation adjustments of
$41 million
.
The following table sets forth the other intangible assets:
|
December 31, 2016
|
December 31, 2015
|
||||||||||||||||||||||||
|
Useful
|
Gross
|
Accumulated
|
Gross
|
Accumulated
|
|||||||||||||||||||||
|
Life
|
Amount
|
Amortization
|
Net
|
Amount
|
Amortization
|
Net
|
|||||||||||||||||||
|
(In years)
|
(In millions)
|
||||||||||||||||||||||||
|
Intangible assets with indefinite lives:
|
|||||||||||||||||||||||||
|
Trademarks/brands
|
$
|
218
|
|
$
|
—
|
|
$
|
218
|
|
$
|
227
|
|
$
|
—
|
|
$
|
227
|
|
|||||||
|
Other
|
1
|
|
—
|
|
1
|
|
1
|
|
—
|
|
1
|
|
|||||||||||||
|
Intangible assets with definite lives:
|
|||||||||||||||||||||||||
|
Trademarks/brands
|
20
|
25
|
|
(8
|
)
|
17
|
|
25
|
|
(6
|
)
|
19
|
|
||||||||||||
|
Customer lists
|
3 to 20
|
793
|
|
(128
|
)
|
665
|
|
826
|
|
(83
|
)
|
743
|
|
||||||||||||
|
Patents
|
15 to 20
|
44
|
|
(31
|
)
|
13
|
|
44
|
|
(30
|
)
|
14
|
|
||||||||||||
|
Computer software
|
2 to 8
|
298
|
|
(199
|
)
|
99
|
|
230
|
|
(128
|
)
|
102
|
|
||||||||||||
|
Land rights
|
2 to 50
|
132
|
|
(12
|
)
|
120
|
|
137
|
|
(8
|
)
|
129
|
|
||||||||||||
|
Recipes and other
|
3 to 15
|
467
|
|
(143
|
)
|
324
|
|
459
|
|
(191
|
)
|
268
|
|
||||||||||||
|
Total
|
$
|
1,978
|
|
$
|
(521
|
)
|
$
|
1,457
|
|
$
|
1,949
|
|
$
|
(446
|
)
|
$
|
1,503
|
|
|||||||
The changes in the gross carrying amounts of other intangible assets during the year ended
December 31, 2016
are primarily related to acquisitions and purchase price allocation adjustments as discussed in Note 2 and reclassifications, partially offset by an impairment as discussed in Note 18 and foreign currency translation adjustments of
$40 million
.
Aggregate amortization expense was
$113 million
,
$75 million
, and
$27 million
for the years ended
December 31, 2016
,
2015
, and
2014
, respectively. The estimated future aggregate amortization expense for the next five years are
$106 million
,
$99 million
,
$96 million
,
$93 million
, and
$85 million
.
75
Archer-Daniels-Midland Company
Notes to Consolidated Financial Statements (Continued)
|
December 31, 2016
|
December 31, 2015
|
||||||
|
|
(In millions)
|
||||||
|
2.5% Notes $1 billion, due in 2026
|
$
|
991
|
|
$
|
—
|
|
|
|
1.75% Notes €600 million, due in 2023
|
627
|
|
644
|
|
|||
|
5.45% Notes $562 million face amount, due in 2018
|
560
|
|
561
|
|
|||
|
Floating Rate Notes €500 million, due in 2019
|
526
|
|
541
|
|
|||
|
4.479% Debentures $516 million face amount, due in 2021
|
510
|
|
516
|
|
|||
|
5.375% Debentures $470 million face amount, due in 2035
|
459
|
|
459
|
|
|||
|
5.765% Debentures $378 million face amount, due in 2041
|
378
|
|
378
|
|
|||
|
5.935% Debentures $383 million face amount, due in 2032
|
378
|
|
377
|
|
|||
|
4.016% Debentures $570 million face amount, due in 2043
|
380
|
|
377
|
|
|||
|
4.535% Debentures $528 million face amount due in 2042
|
377
|
|
374
|
|
|||
|
8.375% Debentures $261 million face amount, due in 2017
|
260
|
|
260
|
|
|||
|
7.0% Debentures $164 million face amount, due in 2031
|
163
|
|
163
|
|
|||
|
6.625% Debentures $160 million face amount, due in 2029
|
159
|
|
159
|
|
|||
|
6.95% Debentures $159 million face amount, due in 2097
|
155
|
|
155
|
|
|||
|
7.5% Debentures $150 million face amount, due in 2027
|
149
|
|
149
|
|
|||
|
6.45% Debentures $127 million face amount, due in 2038
|
125
|
|
125
|
|
|||
|
6.75% Debentures $118 million face amount, due in 2027
|
117
|
|
117
|
|
|||
|
Other
|
463
|
|
436
|
|
|||
|
Total long-term debt including current maturities
|
6,777
|
|
5,791
|
|
|||
|
Current maturities
|
(273
|
)
|
(12
|
)
|
|||
|
Total long-term debt
|
$
|
6,504
|
|
$
|
5,779
|
|
|
On
August 11, 2016
, the Company issued
$1.0 billion
aggregate principal amount of
2.5%
Notes due in
2026
. Proceeds before expenses were
$993 million
.
On
June 24, 2015
, the Company issued
€500 million
(
$563 million
) aggregate principal amount of Floating Rate Notes due in
2019
and
€600 million
(
$675 million
) aggregate principal amount of
1.75%
Notes due in
2023
. Proceeds before expenses were
€499 million
(
$562 million
) and
€594 million
(
$669 million
) from the Floating Rate Notes and the
1.75%
Notes, respectively. At
December 31, 2016
, the Company designated
€1.1 billion
of these Notes as a hedge of its net investment in a foreign subsidiary.
On July 1, 2015, the Company accepted for repurchase
$794 million
aggregate principal amount of certain of its outstanding debentures (the “Debentures”) validly tendered and not withdrawn. Pursuant to the terms of its previously announced cash tender offers, the Company paid aggregate total consideration of
$961 million
for the Debentures accepted for repurchase. In September 2015, the Company redeemed
$141 million
of its
5.45%
outstanding debentures for
$156 million
. These cash tender offers and the debt redemption were financed by the Euro-denominated debt issued on June 24, 2015. The Company recognized a debt extinguishment charge of
$189 million
, including transaction expenses of
$7 million
, in the quarter ended September 30, 2015 pertaining to these transactions.
76
Archer-Daniels-Midland Company
Notes to Consolidated Financial Statements (Continued)
The debt issuance and the debt repurchase transactions in 2015 as discussed above resulted in a net increase in long-term debt of
$0.3 billion
.
Discount amortization expense, net of premium amortization, of
$9 million
,
$8 million
, and
$11 million
for the years ended
December 31, 2016
,
2015
, and
2014
, respectively, were included in interest expense related to the Company’s long-term debt.
At
December 31, 2016
, the fair value of the Company’s long-term debt exceeded the carrying value by
$1.0 billion
, as estimated using quoted market prices (a Level 2 measurement under applicable accounting standards).
The aggregate maturities of long-term debt for the five years after
December 31, 2016
, are
$273 million
,
$574 million
,
$542 million
,
$12 million
, and
$677 million
, respectively.
At
December 31, 2016
, the Company had lines of credit, including the accounts receivable securitization programs described below, totaling
$6.9 billion
, of which
$5.8 billion
was unused. The weighted average interest rates on short-term borrowings outstanding at
December 31, 2016
and
2015
, were
5.66%
and
5.50%
, respectively. Of the Company’s total lines of credit,
$4.0 billion
support a commercial paper borrowing facility, against which there was no commercial paper outstanding at
December 31, 2016
.
The Company’s credit facilities and certain debentures require the Company to comply with specified financial and non-financial covenants including maintenance of minimum tangible net worth as well as limitations related to incurring liens, secured debt, and certain other financing arrangements. The Company is in compliance with these covenants as of
December 31, 2016
.
The Company had outstanding standby letters of credit and surety bonds at
December 31, 2016
and
2015
, totaling
$1.1 billion
and
$0.8 billion
, respectively.
The Company has accounts receivable securitization programs (the “Programs”). The Programs provide the Company with up to
$1.5 billion
in funding resulting from the sale of accounts receivable. As of
December 31, 2016
, the Company utilized
$1.0 billion
of its facility under the Programs (see Note 19 for more information on the Programs).
The Company’s employee stock compensation plans provide for the granting of options to employees to purchase common stock of the Company pursuant to the Company’s 2002 and 2009 Incentive Compensation Plans. These options are issued at market value on the date of grant, vest incrementally over
one
to
five
years, and expire
ten
years after the date of grant.
The fair value of each option grant is estimated as of the date of grant using the Black-Scholes single option pricing model. The volatility assumption used in the Black-Scholes single option pricing model is based on the historical volatility of the Company’s stock. The volatility of the Company’s stock was calculated based upon the monthly closing price of the Company’s stock for the period immediately prior to the date of grant corresponding to the average expected life of the grant. The average expected life represents the period of time that option grants are expected to be outstanding. The risk-free rate is based on the rate of U.S. Treasury zero-coupon issues with a remaining term equal to the expected life of option grants. The assumptions used in the Black-Scholes single option pricing model are as follows.
|
|
Year Ended December 31
|
||||
|
|
2016
|
2015
|
2014
|
||
|
Dividend yield
|
3%
|
2%
|
2%
|
||
|
Risk-free interest rate
|
1%
|
2%
|
2%
|
||
|
Stock volatility
|
25%
|
28%
|
37%
|
||
|
Average expected life (years)
|
6
|
6
|
6
|
||
77
Archer-Daniels-Midland Company
Notes to Consolidated Financial Statements (Continued)
Note 11. Stock Compensation (Continued)
A summary of option activity during
2016
is presented below:
|
Shares
|
Weighted-Average
Exercise Price
|
||||
|
|
(In thousands, except per share amounts)
|
||||
|
Shares under option at December 31, 2015
|
11,653
|
|
$32.52
|
||
|
Granted
|
2,336
|
|
33.18
|
|
|
|
Exercised
|
(2,031
|
)
|
30.37
|
|
|
|
Forfeited or expired
|
(35
|
)
|
28.89
|
|
|
|
Shares under option at December 31, 2016
|
11,923
|
|
$33.03
|
||
|
Exercisable at December 31, 2016
|
6,784
|
|
$29.92
|
||
The weighted-average remaining contractual term of options outstanding and exercisable at
December 31, 2016
, is
6
years and
4
years, respectively. The aggregate intrinsic value of options outstanding and exercisable at
December 31, 2016
, is
$149 million
and
$106 million
, respectively. The weighted-average grant-date fair values of options granted during the years ended
December 31, 2016
,
2015
, and
2014
, were
$5.67
,
$10.29
, and
$12.80
, respectively. The total intrinsic values of options exercised during the years ended
December 31, 2016
,
2015
, and
2014
, were
$28 million
,
$20 million
, and
$66 million
, respectively. Cash proceeds received from options exercised during the years ended
December 31, 2016
,
2015
, and
2014
, were
$62 million
,
$28 million
, and
$93 million
, respectively.
At
December 31, 2016
, there was
$19 million
of total unrecognized compensation expense related to option grants. Amounts to be recognized as compensation expense during the next
four
years are
$7 million
,
$6 million
,
$4 million
, and
$2 million
, respectively.
The Company’s 2002 and 2009 Incentive Compensation Plans provide for the granting of restricted stock and restricted stock units (Restricted Stock Awards) at no cost to certain officers and key employees. In addition, the Company’s 2002 and 2009 Incentive Compensation Plans also provide for the granting of performance stock units (PSUs) at no cost to certain officers and key employees. Restricted Stock Awards are made in common stock or stock units with equivalent rights and vest at the end of a
three
-year restriction period. The awards for PSUs are made in common stock units and vest at the end of a
three
-year vesting period subject to the attainment of certain future performance criteria based on the Company’s adjusted return on invested capital compared to the weighted average cost of capital. During the years ended
December 31, 2016
,
2015
, and
2014
,
1.8 million
,
1.8 million
, and
1.4 million
common stock or stock units, respectively, were granted as Restricted Stock Awards and PSUs. At
December 31, 2016
, there were
9.9 million
shares available for future grants pursuant to the 2009 plan.
The fair value of Restricted Stock Awards and PSUs is determined based on the market value of the Company’s shares on the grant date. The weighted-average grant-date fair values of awards granted during the years ended
December 31, 2016
,
2015
, and
2014
were
$33.31
,
$46.73
, and
$40.78
, respectively.
A summary of Restricted Stock Awards and PSUs activity during
2016
is presented below:
|
Restricted
Stock Awards and PSUs
|
Weighted Average
Grant-Date Fair Value
|
||||
|
|
(In thousands, except per share amounts)
|
||||
|
Non-vested at December 31, 2015
|
4,020
|
|
$40.99
|
||
|
Granted
|
1,818
|
|
33.31
|
|
|
|
Vested
|
(1,010
|
)
|
31.89
|
|
|
|
Forfeited
|
(175
|
)
|
39.00
|
|
|
|
Non-vested at December 31, 2016
|
4,653
|
|
$40.03
|
||
78
Archer-Daniels-Midland Company
Notes to Consolidated Financial Statements (Continued)
At
December 31, 2016
, there was
$53 million
of total unrecognized compensation expense related to Restricted Stock Awards and PSUs. Amounts to be recognized as compensation expense during the next
three
years are
$33 million
,
$18 million
, and
$2 million
, respectively. The total grant-date fair value of Restricted Stock Awards that vested during the year ended
December 31, 2016
was
$32 million
.
Compensation expense for option grants, Restricted Stock Awards and PSUs granted to employees is generally recognized on a straight-line basis during the service period of the respective grant. Certain of the Company’s option grants, Restricted Stock Awards and PSUs continue to vest upon the recipient’s retirement from the Company and compensation expense related to option grants and Restricted Stock Awards granted to retirement-eligible employees is recognized in earnings on the date of grant. Compensation expense for PSUs is based on the probability of meeting the performance criteria.
Total compensation expense for option grants, Restricted Stock Awards and PSUs recognized during the years ended
December 31, 2016
,
2015
, and
2014
was
$72 million
,
$70 million
, and
$55 million
, respectively.
The following table sets forth the items in other (income) expense:
|
(In millions)
|
Year Ended December 31
|
||||||||||
|
|
2016
|
2015
|
2014
|
||||||||
|
Gains on sales and revaluation of assets
|
$
|
(130
|
)
|
$
|
(572
|
)
|
$
|
(351
|
)
|
||
|
Loss on debt extinguishment
|
—
|
|
189
|
|
—
|
|
|||||
|
Loss on derivatives
|
—
|
|
—
|
|
102
|
|
|||||
|
Other – net
|
(17
|
)
|
33
|
|
(24
|
)
|
|||||
|
|
$
|
(147
|
)
|
$
|
(350
|
)
|
$
|
(273
|
)
|
||
Individually significant items included in the table above are:
Gains on sales of assets and revaluation of assets for the year ended
December 31, 2016
include realized additional consideration of
$48 million
related to the sale of the Company’s equity investment in Gruma S.A.B de C.V., a
$59 million
gain, including recovery of loss provisions, related to the sale of the Company’s Brazilian sugar ethanol facilities, a gain related to the revaluation of the remaining interest to settlement value in conjunction with the acquisition of Amazon Flavors of
$12 million
,
partially offset by a
$10 million
loss on sale of other individually immaterial assets. Gains on sales and revaluation of assets for the year ended December 31, 2015 includes a gain of
$256 million
related primarily to the sale of the cocoa, chocolate, and lactic businesses, a gain of
$212 million
on the revaluation of the Company’s previously held equity investments in North Star Shipping, Minmetal, and Eaststarch C.V. in conjunction with the acquisition of the remaining interests, and a gain of
$62 million
on the sale of a
50%
interest in the Barcarena export terminal facility in Brazil to Glencore plc. Gains on sales and revaluation of assets for the year ended December 31, 2014 includes a gain of
$156 million
upon the Company’s effective dilution in the Pacificor (formerly Kalama Export Company) resulting from the contribution of additional assets by another member in exchange for new equity units and a gain of
$126 million
on the sale of the fertilizer business.
Loss on debt extinguishment, including transaction expenses of
$7 million
, for the year ended December 31, 2015 was related to the cash tender offers and redemption of certain of the Company’s outstanding debentures.
Loss on derivatives for the year ended December 31, 2014 was due to losses on Euro foreign currency derivative contracts entered into to economically hedge the Wild Flavors acquisition.
79
Archer-Daniels-Midland Company
Notes to Consolidated Financial Statements (Continued)
Realized gains and losses on sales of available-for-sale marketable securities were immaterial for all periods presented. Impairment losses on securities of
$6 million
for the years ended December 31, 2016 and 2014 were classified as asset impairment, exit, and restructuring charges in the consolidated statements of earnings (see Note 18 for more information). There were no impairment losses on securities for the year ended December 31, 2015.
Other - net for the year ended December 31, 2015 includes
$45 million
of loss provisions related to the Company’s Brazilian sugar ethanol facilities.
The following table sets forth the geographic split of earnings before income taxes:
|
|
Year Ended
|
||||||||||
|
(In millions)
|
December 31
|
||||||||||
|
|
2016
|
2015
|
2014
|
||||||||
|
|
|
||||||||||
|
United States
|
$
|
1,215
|
|
$
|
1,155
|
|
$
|
2,224
|
|
||
|
Foreign
|
607
|
|
1,129
|
|
906
|
|
|||||
|
|
$
|
1,822
|
|
$
|
2,284
|
|
$
|
3,130
|
|
||
Significant components of income taxes are as follows:
|
|
Year Ended
|
||||||||||
|
(In millions)
|
December 31
|
||||||||||
|
|
2016
|
2015
|
2014
|
||||||||
|
|
|
||||||||||
|
Current
|
|
||||||||||
|
Federal
|
$
|
327
|
|
$
|
270
|
|
$
|
641
|
|
||
|
State
|
5
|
|
17
|
|
57
|
|
|||||
|
Foreign
|
146
|
|
158
|
|
235
|
|
|||||
|
Deferred
|
|
|
|||||||||
|
Federal
|
18
|
|
17
|
|
(29
|
)
|
|||||
|
State
|
28
|
|
9
|
|
28
|
|
|||||
|
Foreign
|
10
|
|
(33
|
)
|
(55
|
)
|
|||||
|
|
$
|
534
|
|
$
|
438
|
|
$
|
877
|
|
||
80
Archer-Daniels-Midland Company
Notes to Consolidated Financial Statements (Continued)
Note 13. Income Taxes (Continued)
Significant components of deferred tax liabilities and assets are as follows:
|
December 31, 2016
|
December 31, 2015
|
||||||
|
|
(In millions)
|
||||||
|
Deferred tax liabilities
|
|
||||||
|
Property, plant, and equipment
|
$
|
1,612
|
|
$
|
1,651
|
|
|
|
Equity in earnings of affiliates
|
361
|
|
306
|
|
|||
|
Debt exchange
|
132
|
|
133
|
|
|||
|
Inventories
|
41
|
|
18
|
|
|||
|
Other
|
105
|
|
109
|
|
|||
|
|
$
|
2,251
|
|
$
|
2,217
|
|
|
|
Deferred tax assets
|
|
|
|||||
|
Pension and postretirement benefits
|
$
|
307
|
|
$
|
374
|
|
|
|
Stock compensation
|
81
|
|
70
|
|
|||
|
Foreign tax credit carryforwards
|
95
|
|
90
|
|
|||
|
Foreign tax loss carryforwards
|
278
|
|
301
|
|
|||
|
Capital loss carryforwards
|
57
|
|
22
|
|
|||
|
State tax attributes
|
62
|
|
62
|
|
|||
|
Unrealized foreign currency losses
|
58
|
|
71
|
|
|||
|
Reserves and other accruals
|
—
|
|
26
|
|
|||
|
Other
|
18
|
|
125
|
|
|||
|
Gross deferred tax assets
|
956
|
|
1,141
|
|
|||
|
Valuation allowances
|
(216
|
)
|
(302
|
)
|
|||
|
Net deferred tax assets
|
$
|
740
|
|
$
|
839
|
|
|
|
Net deferred tax liabilities
|
$
|
1,511
|
|
$
|
1,378
|
|
|
|
The net deferred tax liabilities are classified as follows:
|
|
|
|||||
|
Noncurrent assets (foreign)
|
$
|
158
|
|
$
|
185
|
|
|
|
Noncurrent liabilities
|
(1,472
|
)
|
(1,394
|
)
|
|||
|
Noncurrent liabilities (foreign)
|
(197
|
)
|
(169
|
)
|
|||
|
|
$
|
(1,511
|
)
|
$
|
(1,378
|
)
|
|
81
Archer-Daniels-Midland Company
Notes to Consolidated Financial Statements (Continued)
Note 13. Income Taxes (Continued)
Reconciliation of the statutory federal income tax rate to the Company’s effective income tax rate on earnings is as follows:
|
Year Ended
|
||||||||
|
December 31
|
||||||||
|
|
2016
|
2015
|
2014
|
|||||
|
Statutory rate
|
35.0
|
%
|
35.0
|
%
|
35.0
|
%
|
||
|
State income taxes, net of federal tax benefit
|
1.4
|
|
0.8
|
|
2.1
|
|
||
|
Foreign earnings taxed at rates other than the U.S. statutory rate
|
(4.4
|
)
|
(9.9
|
)
|
(4.8
|
)
|
||
|
Foreign currency effects/remeasurement
|
2.2
|
|
(1.8
|
)
|
0.1
|
|
||
|
Income tax adjustment to filed returns
|
0.8
|
|
1.9
|
|
(2.5
|
)
|
||
|
Tax benefit on U.S. biodiesel credits
|
(3.3
|
)
|
(1.6
|
)
|
(1.1
|
)
|
||
|
Tax benefit on U.S. qualified production activity deduction
|
(1.4
|
)
|
(1.8
|
)
|
(1.8
|
)
|
||
|
Valuation allowances
|
0.6
|
|
(3.1
|
)
|
—
|
|
||
|
Other
|
(1.6
|
)
|
(0.3
|
)
|
1.0
|
|
||
|
Effective income tax rate
|
29.3
|
%
|
19.2
|
%
|
28.0
|
%
|
||
The reduction from the federal statutory rate related to foreign earnings taxed at lower rates resulted mostly from the Company’s foreign operations in Switzerland, Asia, and the Caribbean. The Company’s foreign earnings, which were taxed at rates lower than the U.S. rate and were generated from these jurisdictions, were
47%
,
51%
, and
47%
of its foreign earnings before taxes in fiscal years 2016, 2015, and 2014, respectively.
The Company had
$278 million
and
$301 million
of tax assets related to net operating loss carry-forwards of certain international subsidiaries at
December 31, 2016
and
2015
, respectively. As of
December 31, 2016
, approximately
$200 million
of these assets have no expiration date, and the remaining
$78 million
expire at various times through fiscal 2035. The annual usage of certain of these assets is limited to a percentage of taxable income of the respective foreign subsidiary for the year. The Company has recorded a valuation allowance of
$126 million
and
$127 million
against these tax assets at
December 31, 2016
and
2015
, respectively, due to the uncertainty of their realization.
The Company had
$57 million
and
$22 million
of tax assets related to foreign and domestic capital loss carryforwards at
December 31, 2016
and
2015
, respectively. The Company has recorded a valuation allowance of
$41 million
and
$22 million
against these tax assets at
December 31, 2016
and
2015
, respectively.
The Company had
$95 million
and
$90 million
of tax assets related to excess foreign tax credits at
December 31, 2016
and
2015
, respectively, which begin to expire in 2017. Due to the uncertainty of realization, the Company recorded a valuation allowance of
$8 million
against these assets at
December 31, 2015
. There was
no
valuation allowance recorded against these assets at
December 31, 2016
. The Company had
$62 million
of tax assets related to state income tax attributes (incentive credits and net operating loss carryforwards), net of federal tax benefit, at
December 31, 2016
and
2015
, which will expire at various times through fiscal 2036. Due to the uncertainty of realization, the Company recorded a valuation allowance of
$49 million
and
$47 million
related to state income tax assets net of federal tax benefit as of
December 31, 2016
and
2015
, respectively.
The Company remains subject to federal examination in the U.S. for the calendar tax years 2014, 2015 and 2016.
Undistributed earnings of the Company’s foreign subsidiaries and the Company’s share of the undistributed earnings of affiliated corporate joint venture companies accounted for on the equity method aggregating to approximately
$9.3 billion
at
December 31, 2016
, are considered to be permanently reinvested, and accordingly, no provision for U.S. income taxes has been provided thereon. It is not practicable to determine the deferred tax liability for temporary differences related to these undistributed earnings.
82
Archer-Daniels-Midland Company
Notes to Consolidated Financial Statements (Continued)
Note 13. Income Taxes (Continued)
The following table sets forth a rollforward of activity of unrecognized tax benefits for the year ended
December 31, 2016
and
2015
as follows:
|
|
Unrecognized Tax Benefits
|
||||||
|
|
December 31, 2016
|
December 31, 2015
|
|||||
|
|
(In millions)
|
||||||
|
Beginning balance
|
$
|
49
|
|
$
|
72
|
|
|
|
Additions related to current year’s tax positions
|
1
|
|
1
|
|
|||
|
Additions related to prior years’ tax positions
|
16
|
|
17
|
|
|||
|
Additions related to acquisitions
|
—
|
|
7
|
|
|||
|
Reductions related to prior years’ tax positions
|
—
|
|
(19
|
)
|
|||
|
Reductions related to lapse of statute of limitations
|
(1
|
)
|
(6
|
)
|
|||
|
Settlements with tax authorities
|
(10
|
)
|
(23
|
)
|
|||
|
Ending balance
|
$
|
55
|
|
$
|
49
|
|
|
The additions and reductions in unrecognized tax benefits shown in the table include effects related to net income and shareholders’ equity. The changes in unrecognized tax benefits did not have a material effect on the Company’s net income or cash flow.
At
December 31, 2016
and
2015
, the Company had accrued interest and penalties on unrecognized tax benefits of
$26 million
and
$20 million
, respectively.
The Company is subject to income taxation in many jurisdictions around the world. Resolution of the related tax positions, through negotiations with relevant tax authorities or through litigation, may take years to complete. Therefore, it is difficult to predict the timing for resolution of tax positions. However, the Company does not anticipate that the total amount of unrecognized tax benefits will increase or decrease significantly in the next twelve months. Given the long periods of time involved in resolving tax positions, the Company does not expect that the recognition of unrecognized tax benefits will have a material impact on the Company’s effective income tax rate in any given period. If the total amount of unrecognized tax benefits were recognized by the Company at one time, there would be a reduction of
$51 million
on the tax expense for that period.
The Company is subject to routine examination by domestic and foreign tax authorities and frequently faces challenges regarding the amount of taxes due. These challenges include positions taken by the Company related to the timing, nature and amount of deductions and the allocation of income among various tax jurisdictions. Resolution of the related tax positions, through negotiation with relevant tax authorities or through litigation, may take years to complete. Therefore, it is difficult to predict the timing for resolution of tax positions. In its routine evaluations of the exposure associated with various tax filing positions, the Company recognizes a liability, when necessary, for estimated potential additional tax owed by the Company in accordance with the applicable accounting standard. However, the Company cannot predict or provide assurance as to the ultimate outcome of these ongoing or future examinations.
The Company’s wholly-owned subsidiary, ADM do Brasil Ltda. (ADM do Brasil), has received
three
separate tax assessments from the Brazilian Federal Revenue Service
(BFRS)
challenging the tax deductibility of commodity hedging losses and related expenses for the tax years 2004, 2006 and 2007. As of
December 31, 2016
, these assessments, updated for estimated penalties, interest, and variation in currency exchange rates, totaled approximately
$463 million
. The statute of limitations for 2005 and 2008 to 2011 has expired. The Company does not expect to receive any additional tax assessments.
83
Archer-Daniels-Midland Company
Notes to Consolidated Financial Statements (Continued)
ADM do Brasil enters into commodity hedging transactions that can result in gains, which are included in ADM do Brasil’s calculation of taxable income in Brazil, and losses, which ADM do Brasil deducts from its taxable income in Brazil. The Company has evaluated its tax position regarding these hedging transactions and concluded, based upon advice from Brazilian legal counsel, that it was appropriate to recognize both gains and losses resulting from hedging transactions when determining its Brazilian income tax expense. Therefore, the Company has continued to recognize the tax benefit from hedging losses in its financial statements and has not recorded any tax liability for the amounts assessed by the BFRS.
ADM do Brasil filed an administrative appeal for each of the assessments. The appeal panel found in favor of the BFRS on these assessments and ADM do Brasil filed a second level administrative appeal. The second administrative appeal panel continues to conduct customary procedural activities, including ongoing dialogue with the BFRS auditor. If ADM do Brasil continues to be unsuccessful in the administrative appellate process, the Company intends to file appeals in the Brazilian federal courts. While the Company believes its consolidated financial statements properly reflect the tax deductibility of these hedging losses, the ultimate resolution of this matter could result in the future recognition of additional payments of, and expense for, income tax and the associated interest and penalties.
The Company intends to vigorously defend its position against the current assessments and any similar assessments that may be issued for years subsequent to 2011.
The Company’s subsidiaries in Argentina have received tax assessments challenging transfer prices used to price grain exports totaling
$126 million
(inclusive of interest and adjusted for variation in currency exchange rates) for the tax years 2004 through 2010. The Argentine tax authorities have been conducting a review of income and other taxes paid by large exporters and processors of cereals and other agricultural commodities resulting in allegations of income tax evasion. While the Company believes that it has complied with all Argentine tax laws, it cannot rule out receiving additional assessments challenging transfer prices used to price grain exports for years subsequent to 2010, and estimates that these potential assessments would be approximately
$204 million
(as of
December 31, 2016
and subject to variation in currency exchange rates). The Company believes that it has appropriately evaluated the transactions underlying these assessments, and has concluded, based on Argentine tax law, that its tax position would be sustained, and accordingly, has not recorded a tax liability for these assessments. The Company intends to vigorously defend its position against the current assessments and any similar assessments that may be issued for years subsequent to 2010.
In accordance with the accounting requirements for uncertain tax positions, the Company has not recorded an uncertain tax liability for these assessments because it has concluded that it is more likely than not to prevail on the Brazil and Argentina matters based upon their technical merits and because the taxing jurisdictions’ processes do not provide a mechanism for settling at less than the full amount of the assessment. The Company’s consideration of these tax assessments requires judgments about the application of income tax regulations to specific facts and circumstances. The final outcome of these matters cannot reliably be predicted, may take many years to resolve, and could result in financial impacts of up to the entire amount of these assessments.
The Company’s wholly-owned subsidiary in the Netherlands, ADM Europe B.V., has received a tax assessment totaling
$95 million
from the Netherlands tax authority challenging the transfer pricing aspects of a 2009 business reorganization which involved two of its subsidiary companies in the Netherlands. The Company has appealed the assessment and carefully evaluated the underlying transactions and has concluded that the amount of the gain recognized on the reorganization for tax purposes was appropriate. While the Company plans to vigorously defend its position against the assessment, it has accrued an amount it believes would be the likely outcome of the litigation. The Company’s defense of the judicial appeal may take an extended period of time, and could result in additional financial impacts of up to the entire amount of this assessment.
84
Archer-Daniels-Midland Company
Notes to Consolidated Financial Statements (Continued)
The Company leases manufacturing and warehouse facilities, real estate, transportation assets, and other equipment under non-cancelable operating leases, the majority of which expire at various dates through the year 2025. Rent expense for the years ended
December 31, 2016
,
2015
, and
2014
was
$253 million
,
$241 million
, and
$224 million
, respectively. Additional amounts incurred for charges pertaining to time charters of ocean going vessels accounted for as leases for the years ended
December 31, 2016
,
2015
, and
2014
were
$82 million
,
$110 million
, and
$136 million
, respectively. Future minimum rental payments for non-cancelable operating leases with initial or remaining terms in excess of one year are as follows:
|
|
Minimum
|
||
|
|
Rental Payments
|
||
|
|
(In millions)
|
||
|
2017
|
$
|
220
|
|
|
2018
|
170
|
|
|
|
2019
|
121
|
|
|
|
2020
|
83
|
|
|
|
2021
|
62
|
|
|
|
Thereafter
|
187
|
|
|
|
Total minimum lease payments
|
$
|
843
|
|
85
Archer-Daniels-Midland Company
Notes to Consolidated Financial Statements (Continued)
The Company provides substantially all U.S. employees and employees at certain foreign subsidiaries with retirement benefits including defined benefit pension plans and defined contribution plans. The Company provides eligible U.S. employees who retire under qualifying conditions with access to postretirement health care, at full cost to the retiree (certain employees are “grandfathered” into subsidized coverage while others are provided with Health Care Reimbursement Accounts). In December 2016, the Company announced a change to the U.S. retiree medical program which affected employees with less than
30
years of service at January 1, 2017. The change resulted in a curtailment gain of
$38 million
for the year ended December 31, 2016.
The Company maintains 401(k) plans covering substantially all U.S. employees. The Company contributes cash to the plans to match qualifying employee contributions, and also provides a non-matching employer contribution of
1%
of pay to eligible participants. Under an employee stock ownership component of the 401(k) plans, employees may choose to invest in in the Company's stock as part of their own investment elections. The employer contributions are expensed when paid. Assets of the Company’s 401(k) plans consist primarily of listed common stocks and pooled funds. The Company’s 401(k) plans held
11 million
shares of Company common stock at
December 31, 2016
, with a market value of
$503 million
. Cash dividends received on shares of Company common stock by these plans during the year ended
December 31, 2016
were
$14 million
.
|
|
Pension Benefits
|
Postretirement Benefits
|
|||||||||||||||||
|
(In millions)
|
Year Ended December 31
|
Year Ended December 31
|
|||||||||||||||||
|
2016
|
2015
|
2014
|
2016
|
2015
|
2014
|
||||||||||||||
|
Retirement plan expense
|
|||||||||||||||||||
|
Defined benefit plans:
|
|||||||||||||||||||
|
Service cost (benefits earned during the period)
|
$
|
82
|
|
$
|
92
|
|
$
|
71
|
|
$
|
3
|
|
$
|
5
|
|
$
|
4
|
|
|
|
Interest cost
|
113
|
|
112
|
|
126
|
|
8
|
|
8
|
|
8
|
|
|||||||
|
Expected return on plan assets
|
(137
|
)
|
(129
|
)
|
(155
|
)
|
—
|
|
—
|
|
—
|
|
|||||||
|
Settlement charges
|
(5
|
)
|
60
|
|
95
|
|
—
|
|
—
|
|
—
|
|
|||||||
|
Curtailments
|
—
|
|
—
|
|
—
|
|
(38
|
)
|
—
|
|
—
|
|
|||||||
|
Amortization of actuarial loss
|
56
|
|
69
|
|
36
|
|
3
|
|
7
|
|
2
|
|
|||||||
|
Amortization of prior service cost (credit)
|
2
|
|
2
|
|
3
|
|
(17
|
)
|
(17
|
)
|
(18
|
)
|
|||||||
|
Net periodic defined benefit plan expense
|
111
|
|
206
|
|
176
|
|
(41
|
)
|
3
|
|
(4
|
)
|
|||||||
|
Defined contribution plans
|
57
|
|
52
|
|
50
|
|
—
|
|
—
|
|
—
|
|
|||||||
|
Total retirement plan expense
|
$
|
168
|
|
$
|
258
|
|
$
|
226
|
|
$
|
(41
|
)
|
$
|
3
|
|
$
|
(4
|
)
|
|
86
Archer-Daniels-Midland Company
Notes to Consolidated Financial Statements (Continued)
Note 15. Employee Benefit Plans (Continued)
The following tables set forth changes in the defined benefit obligation and the fair value of defined benefit plan assets for the years ended
December 31, 2016
and
2015
:
|
|
Pension Benefits
|
Postretirement Benefits
|
|||||||||||||
|
December 31
2016 |
December 31
2015 |
December 31
2016 |
December 31
2015 |
||||||||||||
|
|
(In millions)
|
(In millions)
|
|||||||||||||
|
Benefit obligation, beginning
|
$
|
2,880
|
|
$
|
3,305
|
|
$
|
199
|
|
$
|
231
|
|
|||
|
Service cost
|
82
|
|
92
|
|
3
|
|
5
|
|
|||||||
|
Interest cost
|
113
|
|
112
|
|
8
|
|
8
|
|
|||||||
|
Actuarial loss (gain)
|
132
|
|
(117
|
)
|
5
|
|
(32
|
)
|
|||||||
|
Employee contributions
|
1
|
|
2
|
|
—
|
|
—
|
|
|||||||
|
Curtailments
|
—
|
|
(2
|
)
|
(38
|
)
|
—
|
|
|||||||
|
Settlements
|
(10
|
)
|
(323
|
)
|
—
|
|
—
|
|
|||||||
|
Divestitures
|
(8
|
)
|
(1
|
)
|
—
|
|
(1
|
)
|
|||||||
|
Benefits paid
|
(142
|
)
|
(91
|
)
|
(9
|
)
|
(11
|
)
|
|||||||
|
Plan amendments
|
—
|
|
(1
|
)
|
3
|
|
—
|
|
|||||||
|
Actual expenses
|
(2
|
)
|
(2
|
)
|
—
|
|
—
|
|
|||||||
|
Foreign currency effects
|
(54
|
)
|
(94
|
)
|
—
|
|
(1
|
)
|
|||||||
|
Benefit obligation, ending
|
$
|
2,992
|
|
$
|
2,880
|
|
$
|
171
|
|
$
|
199
|
|
|||
|
Fair value of plan assets, beginning
|
$
|
1,922
|
|
$
|
2,194
|
|
$
|
—
|
|
$
|
—
|
|
|||
|
Actual return on plan assets
|
232
|
|
(7
|
)
|
—
|
|
—
|
|
|||||||
|
Employer contributions
|
183
|
|
222
|
|
9
|
|
11
|
|
|||||||
|
Employee contributions
|
1
|
|
2
|
|
—
|
|
—
|
|
|||||||
|
Settlements
|
(10
|
)
|
(328
|
)
|
—
|
|
—
|
|
|||||||
|
Divestitures
|
(2
|
)
|
(1
|
)
|
—
|
|
—
|
|
|||||||
|
Benefits paid
|
(142
|
)
|
(91
|
)
|
(9
|
)
|
(11
|
)
|
|||||||
|
Actual expenses
|
(2
|
)
|
(2
|
)
|
—
|
|
—
|
|
|||||||
|
Foreign currency effects
|
(51
|
)
|
(67
|
)
|
—
|
|
—
|
|
|||||||
|
Fair value of plan assets, ending
|
$
|
2,131
|
|
$
|
1,922
|
|
$
|
—
|
|
$
|
—
|
|
|||
|
Funded status
|
$
|
(861
|
)
|
$
|
(958
|
)
|
$
|
(171
|
)
|
$
|
(199
|
)
|
|||
|
Prepaid benefit cost
|
$
|
30
|
|
$
|
32
|
|
$
|
—
|
|
$
|
—
|
|
|||
|
Accrued benefit liability – current
|
(16
|
)
|
(16
|
)
|
(13
|
)
|
(13
|
)
|
|||||||
|
Accrued benefit liability – long-term
|
(875
|
)
|
(974
|
)
|
(158
|
)
|
(186
|
)
|
|||||||
|
Net amount recognized in the balance sheet
|
$
|
(861
|
)
|
$
|
(958
|
)
|
$
|
(171
|
)
|
$
|
(199
|
)
|
|||
Included in AOCI for pension benefits at
December 31, 2016
, are the following amounts that have not yet been recognized in net periodic pension cost: unrecognized prior service cost of
$2 million
and unrecognized actuarial loss of
$824 million
. The prior service cost and actuarial loss included in AOCI expected to be recognized in net periodic pension cost during 2017 is
$1 million
and
$62 million
, respectively.
Included in AOCI for postretirement benefits at
December 31, 2016
, are the following amounts that have not yet been recognized in net periodic postretirement benefit cost: unrecognized prior service credit of
$48 million
and unrecognized actuarial loss of
$42 million
. Prior service credit of
$13 million
and actuarial loss of
$4 million
included in AOCI are expected to be recognized in net periodic benefit cost during 2017.
87
Archer-Daniels-Midland Company
Notes to Consolidated Financial Statements (Continued)
Note 15. Employee Benefit Plans (Continued)
The following table sets forth the principal assumptions used in developing net periodic pension cost:
|
|
Pension Benefits
|
Postretirement Benefits
|
|||||
|
December 31
2016 |
December 31
2015 |
December 31
2016 |
December 31
2015 |
||||
|
Discount rate
|
4.0%
|
3.5%
|
4.0%
|
3.8%
|
|||
|
Expected return on plan assets
|
7.1%
|
6.3%
|
N/A
|
N/A
|
|||
|
Rate of compensation increase
|
4.7%
|
3.8%
|
N/A
|
N/A
|
|||
The following table sets forth the principal assumptions used in developing the year-end actuarial present value of the projected benefit obligations:
|
|
Pension Benefits
|
Postretirement Benefits
|
|||||||
|
December 31
2016 |
December 31
2015 |
December 31
2016 |
December 31
2015 |
||||||
|
Discount rate
|
3.7
|
%
|
4.0
|
%
|
3.9%
|
4.0%
|
|||
|
Rate of compensation increase
|
4.6
|
%
|
4.7
|
%
|
N/A
|
N/A
|
|||
The projected benefit obligation, accumulated benefit obligation, and fair value of plan assets for the pension plans with projected benefit obligations in excess of plan assets were
$2.7 billion
,
$2.3 billion
, and
$1.8 billion
, respectively as of
December 31, 2016
, and
$2.5 billion
,
$2.2 billion
, and
$1.5 billion
, respectively, as of
December 31, 2015
. The projected benefit obligation, accumulated benefit obligation, and fair value of plan assets for the pension plans with accumulated benefit obligations in excess of plan assets were
$2.6 billion
,
$2.3 billion
, and
$1.7 billion
, respectively, as of
December 31, 2016
and
$2.5 billion
,
$2.2 billion
, and
$1.5 billion
, respectively, as of
December 31, 2015
. The accumulated benefit obligation for all pension plans as of
December 31, 2016
and
2015
, was
$2.7 billion
and
$2.6 billion
, respectively.
For postretirement benefit measurement purposes, a
7.05%
annual rate of increase in the per capita cost of covered health care benefits was assumed for the year ended
December 31, 2016
. The rate was assumed to decrease gradually to
4.6%
by
2025
and remain at that level thereafter. The credits used to fund certain retirees with Health Reimbursement Accounts are indexed up to a maximum of
2%
per year.
A 1% change in assumed health care cost trend rates would have the following effects:
|
|
1% Increase
|
1% Decrease
|
|||||
|
|
(In millions)
|
||||||
|
Effect on accumulated postretirement benefit obligations
|
$
|
5
|
|
$
|
(4
|
)
|
|
The effect on combined service and interest cost components is immaterial.
88
Archer-Daniels-Midland Company
Notes to Consolidated Financial Statements (Continued)
Note 15. Employee Benefit Plans (Continued)
Plan Assets
The Company’s employee benefit plan assets are principally comprised of the following types of investments:
Common stock:
Equity securities are valued based on quoted exchange prices and are classified within Level 1 of the valuation hierarchy.
Mutual funds:
Mutual funds are valued at the closing price reported on the active market on which they are traded and are classified within Level 1 of the valuation hierarchy.
Common collective trust (CCT) funds:
The fair values of the CCTs are based on the cumulative net asset value (NAV) of their underlying investments. The investments in CCTs are comprised of international equity funds, a small cap U.S. equity fund, large cap U.S. equity funds, fixed income funds, and other funds. The fund units are valued at NAV based on the closing market value of the units bought or sold as of the valuation date and are classified in Level 2 of the fair value hierarchy. The CCTs seek primarily to provide investment results approximating the aggregate price, dividend performance, total return, and income stream of underlying investments of the funds. Issuances and redemptions of certain of the CCT investments may be restricted by date and/or amount.
Corporate debt instruments:
Corporate debt instruments are valued using third-party pricing services and are classified within Level 2 of the valuation hierarchy.
U.S. Treasury instruments:
U.S. Treasury instruments are valued at the closing price reported on the active market on which they are traded and are classified within Level 1 of the valuation hierarchy.
U.S. government agency, state, and local government bonds:
U.S. government agency obligations and state and municipal debt securities are valued using third-party pricing services and are classified within Level 2 of the valuation hierarchy.
The methods described above may produce a fair value calculation that may not be indicative of net realizable value or reflective of future fair values. Furthermore, while the Company believes its valuation methods are appropriate and consistent with other market participants’ methods, the use of different methodologies or assumptions to determine the fair value of certain financial instruments could result in a different fair value measurement at the reporting date.
89
Archer-Daniels-Midland Company
Notes to Consolidated Financial Statements (Continued)
Note 15. Employee Benefit Plans (Continued)
The following tables set forth, by level within the fair value hierarchy, the fair value of plan assets as of
December 31, 2016
and
2015
.
|
|
Fair Value Measurements at December 31, 2016
|
||||||||||||||
|
Quoted Prices in
Active Markets
for Identical
Assets
(Level 1)
|
Significant
Other
Observable
Inputs
(Level 2)
|
Significant
Unobservable
Inputs
(Level 3)
|
Total
|
||||||||||||
|
|
(In millions)
|
||||||||||||||
|
Common stock
|
|
|
|
|
|||||||||||
|
U.S. companies
|
$
|
222
|
|
$
|
—
|
|
$
|
—
|
|
$
|
222
|
|
|||
|
International companies
|
2
|
|
—
|
|
—
|
|
2
|
|
|||||||
|
Equity mutual funds
|
|
|
|
|
|
|
|
|
|||||||
|
Emerging markets
|
82
|
|
—
|
|
—
|
|
82
|
|
|||||||
|
International
|
117
|
|
—
|
|
—
|
|
117
|
|
|||||||
|
Large cap U.S.
|
447
|
|
—
|
|
—
|
|
447
|
|
|||||||
|
Common collective trust funds
|
|
|
|
|
|
|
|
|
|||||||
|
International equity
|
—
|
|
306
|
|
—
|
|
306
|
|
|||||||
|
Large cap U.S. equity
|
—
|
|
47
|
|
—
|
|
47
|
|
|||||||
|
Fixed income
|
—
|
|
190
|
|
—
|
|
190
|
|
|||||||
|
Other
|
—
|
|
50
|
|
—
|
|
50
|
|
|||||||
|
Debt instruments
|
|
|
|
|
|
|
|
|
|||||||
|
Corporate bonds
|
—
|
|
492
|
|
—
|
|
492
|
|
|||||||
|
U.S. Treasury instruments
|
150
|
|
—
|
|
—
|
|
150
|
|
|||||||
|
U.S. government agency, state and local government bonds
|
—
|
|
22
|
|
—
|
|
22
|
|
|||||||
|
Other
|
—
|
|
4
|
|
—
|
|
4
|
|
|||||||
|
Total assets at fair value
|
$
|
1,020
|
|
$
|
1,111
|
|
$
|
—
|
|
$
|
2,131
|
|
|||
90
Archer-Daniels-Midland Company
Notes to Consolidated Financial Statements (Continued)
Note 15. Employee Benefit Plans (Continued)
|
|
Fair Value Measurements at December 31, 2015
|
||||||||||||||
|
Quoted Prices in
Active Markets
for Identical
Assets
(Level 1)
|
Significant
Other
Observable
Inputs
(Level 2)
|
Significant
Unobservable
Inputs
(Level 3)
|
Total
|
||||||||||||
|
|
(In millions)
|
||||||||||||||
|
Common stock
|
|
|
|
|
|||||||||||
|
U.S. companies
|
$
|
196
|
|
$
|
—
|
|
$
|
—
|
|
$
|
196
|
|
|||
|
International companies
|
8
|
|
—
|
|
—
|
|
8
|
|
|||||||
|
Equity mutual funds
|
|
|
|
|
|
|
|
|
|||||||
|
Emerging markets
|
58
|
|
—
|
|
—
|
|
58
|
|
|||||||
|
International
|
105
|
|
—
|
|
—
|
|
105
|
|
|||||||
|
Large cap U.S.
|
409
|
|
—
|
|
—
|
|
409
|
|
|||||||
|
Common collective trust funds
|
|
|
|
|
|
|
|
|
|||||||
|
International equity
|
—
|
|
278
|
|
—
|
|
278
|
|
|||||||
|
Large cap U.S. equity
|
—
|
|
45
|
|
—
|
|
45
|
|
|||||||
|
Fixed income
|
—
|
|
193
|
|
—
|
|
193
|
|
|||||||
|
Other
|
—
|
|
47
|
|
—
|
|
47
|
|
|||||||
|
Debt instruments
|
|
|
|
|
|
|
|
|
|||||||
|
Corporate bonds
|
—
|
|
457
|
|
—
|
|
457
|
|
|||||||
|
U.S. Treasury instruments
|
99
|
|
—
|
|
—
|
|
99
|
|
|||||||
|
U.S. government agency, state and local government bonds
|
—
|
|
24
|
|
—
|
|
24
|
|
|||||||
|
Other
|
—
|
|
3
|
|
—
|
|
3
|
|
|||||||
|
Total assets at fair value
|
$
|
875
|
|
$
|
1,047
|
|
$
|
—
|
|
$
|
1,922
|
|
|||
Level 3 Gains and Losses:
There are no Plan assets classified as Level 3 in the fair value hierarchy; therefore there are no gains or losses associated with Level 3 assets.
91
Archer-Daniels-Midland Company
Notes to Consolidated Financial Statements (Continued)
Note 15. Employee Benefit Plans (Continued)
The following table sets forth the actual asset allocation for the Company’s global pension plan assets as of the measurement date:
|
December 31 2016
(1)(2)
|
December 31
2015
(2)
|
||
|
Equity securities
|
59%
|
58%
|
|
|
Debt securities
|
40%
|
40%
|
|
|
Other
|
1%
|
2%
|
|
|
Total
|
100%
|
100%
|
|
|
(1)
|
The Company’s U.S. pension plans contain approximately
79%
of the Company’s global pension plan assets. The actual asset allocation for the Company’s U.S. pension plans as of the measurement date consists of
60%
equity securities and
40%
debt securities. The target asset allocation for the Company’s U.S. pension plans is approximately the same as the actual asset allocation. The actual asset allocation for the Company’s foreign pension plans as of the measurement date consists of
54%
equity securities,
41%
debt securities, and
5%
in other investments. The target asset allocation for the Company’s foreign pension plans is approximately the same as the actual asset allocation.
|
|
(2)
|
The Company’s pension plans did not directly hold any shares of Company common stock as of the
December 31, 2016
and
2015
measurement dates.
|
Investment objectives for the Company’s plan assets are to:
|
•
|
Optimize the long-term return on plan assets at an acceptable level of risk.
|
|
•
|
Maintain a broad diversification across asset classes and among investment managers.
|
|
•
|
Maintain careful control of the risk level within each asset class.
|
Asset allocation targets promote optimal expected return and volatility characteristics given the long-term time horizon for fulfilling the obligations of the pension plans. Selection of the targeted asset allocation for plan assets was based upon a review of the expected return and risk characteristics of each asset class, as well as the correlation of returns among asset classes. The U.S. pension plans target asset allocation is also based on an asset and liability study that is updated periodically.
Investment guidelines are established with each investment manager. These guidelines provide the parameters within which the investment managers agree to operate, including criteria that determine eligible and ineligible securities, diversification requirements, and credit quality standards, where applicable. In some countries, derivatives may be used to gain market exposure in an efficient and timely manner; however, derivatives may not be used to leverage the portfolio beyond the market value of underlying investments.
The Company uses external consultants to assist in monitoring the investment strategy and asset mix for the Company’s plan assets. To develop the Company’s expected long-term rate of return assumption on plan assets, the Company generally uses long-term historical return information for the targeted asset mix identified in asset and liability studies. Adjustments are made to the expected long-term rate of return assumption when deemed necessary based upon revised expectations of future investment performance of the overall investment markets.
Contributions and Expected Future Benefit Payments
Based on actuarial calculations, the Company expects to contribute
$30 million
to the pension plans and
$13 million
to the postretirement benefit plan during 2017. The Company may elect to make additional discretionary contributions during this period.
92
Archer-Daniels-Midland Company
Notes to Consolidated Financial Statements (Continued)
The following benefit payments, which reflect expected future service, are expected to be paid by the benefit plans:
|
Pension
Benefits
|
Postretirement
Benefits
|
||||||
|
|
(In millions)
|
||||||
|
2017
|
$
|
94
|
|
$
|
13
|
|
|
|
2018
|
100
|
|
12
|
|
|||
|
2019
|
107
|
|
12
|
|
|||
|
2020
|
113
|
|
12
|
|
|||
|
2021
|
121
|
|
12
|
|
|||
|
2022 – 2026
|
709
|
|
57
|
|
|||
The Company has authorized
one billion
shares of common stock and
500,000
shares of preferred stock, each with
zero
par value.
No
preferred stock has been issued. At
December 31, 2016
and
2015
, the Company had approximately
143.2 million
shares and
120.8 million
shares, respectively, of its common shares in treasury. Treasury stock of
$5.5 billion
and
$4.7 billion
at
December 31, 2016
and
2015
, respectively, is recorded at cost as a reduction of common stock.
At
December 31, 2016
and
2015
, the foreign currency translation adjustment component of AOCI included income, net of tax, of
$40 million
and
$19 million
pertaining to foreign currency-denominated debt designated as a net investment hedge, respectively (see Note 4 for more information).
The following tables set forth the changes in AOCI by component and the reclassifications out of AOCI for the years ended
December 31, 2016
and
2015
:
|
Foreign
Currency
Translation
Adjustment
|
Deferred
Gain (Loss)
on Hedging
Activities
|
Pension and
Other
Postretirement
Benefit
Liabilities
Adjustment
|
Unrealized
Gain (Loss)
on
Investments
|
Accumulated
Other
Comprehensive
Income (Loss)
|
|||||||||||||||
|
(In millions)
|
|||||||||||||||||||
|
Balance at December 31, 2014
|
$
|
(654
|
)
|
$
|
47
|
|
$
|
(630
|
)
|
$
|
(4
|
)
|
$
|
(1,241
|
)
|
||||
|
Other comprehensive income before reclassifications
|
(984
|
)
|
(53
|
)
|
87
|
|
20
|
|
(930
|
)
|
|||||||||
|
Amounts reclassified from AOCI
|
23
|
|
(46
|
)
|
67
|
|
—
|
|
44
|
|
|||||||||
|
Tax effect
|
(11
|
)
|
37
|
|
(47
|
)
|
2
|
|
(19
|
)
|
|||||||||
|
Net of tax amount
|
(972
|
)
|
(62
|
)
|
107
|
|
22
|
|
(905
|
)
|
|||||||||
|
Balance at December 31, 2015
|
$
|
(1,626
|
)
|
$
|
(15
|
)
|
$
|
(523
|
)
|
$
|
18
|
|
$
|
(2,146
|
)
|
||||
|
Other comprehensive income before reclassifications
|
(391
|
)
|
(104
|
)
|
(28
|
)
|
(3
|
)
|
(526
|
)
|
|||||||||
|
Amounts reclassified from AOCI
|
(75
|
)
|
137
|
|
27
|
|
6
|
|
95
|
|
|||||||||
|
Tax effect
|
(10
|
)
|
(12
|
)
|
3
|
|
(2
|
)
|
(21
|
)
|
|||||||||
|
Net of tax amount
|
(476
|
)
|
21
|
|
2
|
|
1
|
|
(452
|
)
|
|||||||||
|
Balance at December 31, 2016
|
$
|
(2,102
|
)
|
$
|
6
|
|
$
|
(521
|
)
|
$
|
19
|
|
$
|
(2,598
|
)
|
||||
93
Archer-Daniels-Midland Company
Notes to Consolidated Financial Statements (Continued)
The change in foreign currency translation adjustment in 2016 is primarily due to the U.S. dollar appreciation, impacting the Euro and British Pound-denominated equities of the Company’s foreign subsidiaries while the change in 2015 is primarily due to the U.S. dollar appreciation, mainly impacting the Euro-denominated equity of the Company’s foreign subsidiaries.
|
Amounts reclassified from AOCI Year Ended December 31
|
Affected line item in the consolidated statement of earnings
|
|||||||||
|
Details about AOCI components
|
2016
|
2015
|
2014
|
|||||||
|
(In millions)
|
||||||||||
|
Foreign currency translation adjustment
|
||||||||||
|
$
|
(75
|
)
|
$
|
23
|
|
$
|
—
|
|
Other income/expense
|
|
|
—
|
|
—
|
|
—
|
|
Tax
|
||||
|
$
|
(75
|
)
|
$
|
23
|
|
$
|
—
|
|
Net of tax
|
|
|
Deferred loss (gain) on hedging activities
|
||||||||||
|
$
|
82
|
|
$
|
25
|
|
$
|
124
|
|
Cost of products sold
|
|
|
18
|
|
(29
|
)
|
(5
|
)
|
Other income/expense
|
||||
|
2
|
|
(1
|
)
|
(1
|
)
|
Interest expense
|
||||
|
35
|
|
(41
|
)
|
69
|
|
Revenues
|
||||
|
137
|
|
(46
|
)
|
187
|
|
Total before tax
|
||||
|
(52
|
)
|
17
|
|
(70
|
)
|
Tax on reclassifications
|
||||
|
$
|
85
|
|
$
|
(29
|
)
|
$
|
117
|
|
Net of tax
|
|
|
Pension liability adjustment
|
||||||||||
|
Amortization of defined benefit pension items:
|
||||||||||
|
Prior service losses (credit)
|
$
|
(17
|
)
|
$
|
37
|
|
$
|
(15
|
)
|
|
|
Actuarial losses
|
44
|
|
30
|
|
36
|
|
||||
|
27
|
|
67
|
|
21
|
|
Total before tax
|
||||
|
(5
|
)
|
(44
|
)
|
(7
|
)
|
Tax on reclassifications
|
||||
|
$
|
22
|
|
$
|
23
|
|
$
|
14
|
|
Net of tax
|
|
|
Unrealized loss on investments
|
||||||||||
|
6
|
|
—
|
|
6
|
|
Asset impairment, exit, and restructuring costs
|
||||
|
—
|
|
—
|
|
(2
|
)
|
Tax on reclassifications
|
||||
|
$
|
6
|
|
$
|
—
|
|
$
|
4
|
|
Net of tax
|
|
94
Archer-Daniels-Midland Company
Notes to Consolidated Financial Statements (Continued)
The Company is principally engaged in procuring, transporting, storing, processing, and merchandising agricultural commodities and products. The Company’s operations are organized, managed and classified into
four
reportable business segments: Agricultural Services, Corn Processing, Oilseeds Processing, and Wild Flavors and Specialty Ingredients. Each of these segments is organized based upon the nature of products and services offered. The Company’s remaining operations are not reportable segments, as defined by the applicable accounting standard
,
and are classified as Other.
The Agricultural Services segment utilizes its extensive global grain elevator and transportation networks, and port operations to buy, store, clean, and transport agricultural commodities, such as oilseeds, corn, wheat, milo, oats, rice, and barley, and resells these commodities primarily as food and feed ingredients and as raw materials for the agricultural processing industry. The Agricultural Services segment includes international agricultural commodities merchandising and handling activities managed through a global trade desk based in Rolle, Switzerland. Agricultural Services’ grain sourcing, handling, and transportation network provides reliable and efficient services to the Company’s customers and agricultural processing operations. Agricultural Services’ transportation network capabilities include barge, ocean-going vessel, truck, rail, and container freight services. The Agricultural Services segment also includes the activities related to structured trade finance, the processing of wheat into wheat flour, and the Company’s
32.2%
share of the results of its Pacificor (formerly Kalama Export Company LLC) joint venture. The Agricultural Services segment also included returns associated with the Company’s
19.8%
investment in GrainCorp until its sale in December 2016. In April 2016, the Company acquired a
50%
interest in Cairo, Egypt-based Medsofts Group, a consolidated joint venture that owns and manages merchandising and supply chain operations.
The Company’s Corn Processing segment is engaged in corn wet milling and dry milling activities, utilizing its asset base primarily located in the central part of the United States with additional facilities in China, Bulgaria, Morocco, and Turkey. The Corn Processing segment converts corn into sweeteners, starches, and bioproducts. Its products include ingredients used in the food and beverage industry including sweeteners, starch, syrup, glucose, and dextrose. Dextrose and starch are used by the Corn Processing segment as feedstocks for its bioproducts operations. By fermentation of dextrose, the Corn Processing segment produces alcohol, amino acids, and other food and animal feed ingredients. Ethyl alcohol is produced by the Company for industrial use as ethanol or as beverage grade. Ethanol, in gasoline, increases octane and is used as an extender and oxygenate. Bioproducts also include essential amino acids such as lysine and threonine used in swine and poultry diets to optimize performance. Corn gluten feed and meal, as well as distillers’ grains, are produced for use as animal feed ingredients. Corn germ, a by-product of the wet milling process, is further processed into vegetable oil and protein meal. The Corn Processing segment also includes activities related to the processing and distribution of formula feeds and animal health and nutrition products. Other Corn Processing products include citric acids and glycols, all of which are used in various food and industrial products. The Corn Processing segment also included the activities of the Company’s Brazilian sugarcane ethanol plant and related operations until the Company completed the sale of these operations in May 2016. This segment also includes the Company’s share of the results of its equity investments in Almidones Mexicanos S.A., and Red Star Yeast Company LLC. In June 2016, the Company acquired from Tate & Lyle a Casablanca, Morocco-based corn wet mill that produces glucose and native starch.
95
Archer-Daniels-Midland Company
Notes to Consolidated Financial Statements (Continued)
Note 17. Segment and Geographic Information (Continued)
The Oilseeds Processing segment includes global activities related to the origination, merchandising, crushing, and further processing of oilseeds such as soybeans and soft seeds (cottonseed, sunflower seed, canola, rapeseed, and flaxseed) into vegetable oils and protein meals. Oilseeds products produced and marketed by the Company include ingredients for the food, feed, energy, and industrial products industries. Crude vegetable oils produced by the segment’s crushing activities are sold “as is” or are further processed by refining, blending, bleaching, and deodorizing into salad oils. Salad oils are sold “as is” or are further processed by hydrogenating and/or interesterifying into margarine, shortening, and other food products. Partially refined oils are used to produce biodiesel or are sold to other manufacturers for use in chemicals, paints, and other industrial products. Oilseed protein meals are principally sold to third parties to be used as ingredients in commercial livestock and poultry feeds. In Europe and South America, the Oilseeds Processing segment includes origination and merchandising activities as adjuncts to its oilseeds processing assets. These activities include a network of grain elevators, port facilities, and transportation assets used to buy, store, clean, and transport grains and oilseeds. The Oilseeds Processing segment is a major supplier of peanuts, tree nuts, and peanut-derived ingredients to both the U.S. and export markets. In North America, cottonseed flour is produced and sold primarily to the pharmaceutical industry and cotton cellulose pulp is manufactured and sold to the chemical, paper, and filter markets. The Oilseeds Processing segment also included activities related to its global chocolate and cocoa businesses until the sale of these businesses in July 2015 and October 2015, respectively. The Oilseeds Processing segment also includes the Company’s share of the results of its equity investment in Wilmar International Limited (Wilmar) and its share of results for its Stratas Foods LLC and Edible Oils Limited joint ventures. The Company acquired additional shares in Wilmar increasing its ownership interest from
19%
to
20%
in March 2016,
22%
in June 2016, and
23.2%
in September 2016. In November 2016, the Company completed the expansion of Olenex, a
37.5%
joint venture with Wilmar. Olenex owns and operates specialty oils and fats, palm refining, and tropical oils processing plants in Europe.
The Wild Flavors and Specialty Ingredients (WFSI) segment engages in the manufacturing, sales, and distribution of specialty products including natural flavor ingredients, flavor systems, natural colors, proteins, emulsifiers, soluble fiber, polyols, hydrocolloids, natural health and nutrition products, and other specialty food and feed ingredients. The WFSI segment also includes the activities related to the procurement, processing, and distribution of edible beans. The Company acquired a
90%
controlling stake in Harvest Innovations, an industry leader in minimally processed, expeller-pressed soy proteins, oils, and gluten-free ingredients in February 2016; the remaining
60%
interest in Amazon Flavors, a leading Brazilian manufacturer of natural extracts, emulsions and compounds, in May 2016; and Caterina Foods, a leading toll manufacturer of specialty gluten-free and high-protein pastas, in September 2016.
Other includes the Company’s remaining operations, primarily its financial business units, related to futures commission and insurance activities.
Intersegment sales have been recorded at amounts approximating market. Operating profit for each segment is based on net sales less identifiable operating expenses. Also included in segment operating profit is equity in earnings of affiliates based on the equity method of accounting. Certain Corporate items are not allocated to the Company’s reportable business segments. Corporate results principally include the impact of LIFO-related adjustments, unallocated corporate expenses, other charges including legal settlements, costs, and legal fees, interest cost net of investment income, and the Company’s share of the results of an equity investment.
Following the sale of the cocoa business in October 2015, the remaining results of Cocoa and Other were combined with the results of Refining, Packaging, Biodiesel, and Other within the Oilseeds Processing segment effective January 1, 2016. Prior period results have been reclassified to conform to the current presentation.
96
Archer-Daniels-Midland Company
Notes to Consolidated Financial Statements (Continued)
Note 17. Segment and Geographic Information (Continued)
Segment Information
|
|
Year Ended
|
||||||||||
|
(In millions)
|
December 31
|
||||||||||
|
|
2016
|
2015
|
2014
|
||||||||
|
Gross revenues
|
|||||||||||
|
Agricultural Services
|
$
|
30,241
|
|
$
|
33,658
|
|
$
|
40,120
|
|
||
|
Corn Processing
|
9,512
|
|
10,051
|
|
12,377
|
|
|||||
|
Oilseeds Processing
|
27,305
|
|
29,393
|
|
33,591
|
|
|||||
|
Wild Flavors and Specialty Ingredients
|
2,447
|
|
2,423
|
|
1,380
|
|
|||||
|
Other
|
585
|
|
634
|
|
573
|
|
|||||
|
Intersegment elimination
|
(7,744
|
)
|
(8,457
|
)
|
(6,840
|
)
|
|||||
|
Total
|
$
|
62,346
|
|
$
|
67,702
|
|
$
|
81,201
|
|
||
|
Intersegment revenues
|
|
|
|||||||||
|
Agricultural Services
|
$
|
2,348
|
|
$
|
3,976
|
|
$
|
3,832
|
|
||
|
Corn Processing
|
46
|
|
56
|
|
95
|
|
|||||
|
Oilseeds Processing
|
5,153
|
|
4,176
|
|
2,658
|
|
|||||
|
Wild Flavors and Specialty Ingredients
|
20
|
|
16
|
|
12
|
|
|||||
|
Other
|
177
|
|
233
|
|
243
|
|
|||||
|
Total
|
$
|
7,744
|
|
$
|
8,457
|
|
$
|
6,840
|
|
||
|
Revenues from external customers
|
|||||||||||
|
Agricultural Services
|
|||||||||||
|
Merchandising and Handling
|
$
|
24,609
|
|
$
|
25,957
|
|
$
|
32,208
|
|
||
|
Milling and Other
|
3,060
|
|
3,479
|
|
3,815
|
|
|||||
|
Transportation
|
224
|
|
246
|
|
265
|
|
|||||
|
Total Agricultural Services
|
27,893
|
|
29,682
|
|
36,288
|
|
|||||
|
Corn Processing
|
|||||||||||
|
Sweeteners and Starches
|
4,028
|
|
3,713
|
|
3,767
|
|
|||||
|
Bioproducts
|
5,438
|
|
6,282
|
|
8,515
|
|
|||||
|
Total Corn Processing
|
9,466
|
|
9,995
|
|
12,282
|
|
|||||
|
Oilseeds Processing
|
|||||||||||
|
Crushing and Origination
|
13,976
|
|
15,597
|
|
18,542
|
|
|||||
|
Refining, Packaging, Biodiesel, and Other
|
7,880
|
|
9,364
|
|
11,937
|
|
|||||
|
Asia
|
296
|
|
256
|
|
454
|
|
|||||
|
Total Oilseeds Processing
|
22,152
|
|
25,217
|
|
30,933
|
|
|||||
|
Wild Flavors and Specialty Ingredients
|
2,427
|
|
2,407
|
|
1,368
|
|
|||||
|
Total Wild Flavors and Specialty Ingredients
|
2,427
|
|
2,407
|
|
1,368
|
|
|||||
|
Other
|
|||||||||||
|
Financial
|
408
|
|
401
|
|
330
|
|
|||||
|
Total Other
|
408
|
|
401
|
|
330
|
|
|||||
|
Total
|
$
|
62,346
|
|
$
|
67,702
|
|
$
|
81,201
|
|
||
97
Archer-Daniels-Midland Company
Notes to Consolidated Financial Statements (Continued)
Note 17. Segment and Geographic Information (Continued)
|
|
Year Ended
|
||||||||||
|
(In millions)
|
December 31
|
||||||||||
|
|
2016
|
2015
|
2014
|
||||||||
|
Depreciation
|
|
|
|||||||||
|
Agricultural Services
|
$
|
191
|
|
$
|
188
|
|
$
|
189
|
|
||
|
Corn Processing
|
342
|
|
335
|
|
332
|
|
|||||
|
Oilseeds Processing
|
185
|
|
187
|
|
235
|
|
|||||
|
Wild Flavors and Specialty Ingredients
|
37
|
|
36
|
|
37
|
|
|||||
|
Other
|
5
|
|
5
|
|
3
|
|
|||||
|
Corporate
|
27
|
|
48
|
|
54
|
|
|||||
|
Total
|
$
|
787
|
|
$
|
799
|
|
$
|
850
|
|
||
|
Long-lived asset abandonments and write-downs
(1)
|
|||||||||||
|
Agricultural Services
|
$
|
3
|
|
$
|
—
|
|
$
|
17
|
|
||
|
Corn Processing
|
6
|
|
66
|
|
15
|
|
|||||
|
Oilseeds Processing
|
6
|
|
40
|
|
3
|
|
|||||
|
Wild Flavors and Specialty Ingredients
|
—
|
|
1
|
|
—
|
|
|||||
|
Corporate
|
2
|
|
1
|
|
—
|
|
|||||
|
Total
|
$
|
17
|
|
$
|
108
|
|
$
|
35
|
|
||
|
Interest income
|
|||||||||||
|
Agricultural Services
|
$
|
21
|
|
$
|
16
|
|
$
|
31
|
|
||
|
Corn Processing
|
3
|
|
2
|
|
10
|
|
|||||
|
Oilseeds Processing
|
27
|
|
29
|
|
30
|
|
|||||
|
Wild Flavors and Specialty Ingredients
|
2
|
|
1
|
|
1
|
|
|||||
|
Other
|
35
|
|
19
|
|
13
|
|
|||||
|
Corporate
|
4
|
|
4
|
|
7
|
|
|||||
|
Total
|
$
|
92
|
|
$
|
71
|
|
$
|
92
|
|
||
|
Equity in earnings of affiliates
|
|||||||||||
|
Agricultural Services
|
$
|
16
|
|
$
|
24
|
|
$
|
41
|
|
||
|
Corn Processing
|
91
|
|
85
|
|
113
|
|
|||||
|
Oilseeds Processing
|
211
|
|
251
|
|
236
|
|
|||||
|
Wild Flavors and Specialty Ingredients
|
4
|
|
—
|
|
—
|
|
|||||
|
Other
|
10
|
|
(3
|
)
|
10
|
|
|||||
|
Corporate
|
(40
|
)
|
33
|
|
(28
|
)
|
|||||
|
Total
|
$
|
292
|
|
$
|
390
|
|
$
|
372
|
|
||
|
(1)
See Note 18 for total asset impairment, exit, and restructuring costs.
|
|||||||||||
98
Archer-Daniels-Midland Company
Notes to Consolidated Financial Statements (Continued)
Note 17. Segment and Geographic Information (Continued)
|
|
Year Ended
|
||||||||||
|
(In millions)
|
December 31
|
||||||||||
|
|
2016
|
2015
|
2014
|
||||||||
|
Operating Profit
|
|||||||||||
|
Agricultural Services
|
$
|
602
|
|
$
|
714
|
|
$
|
1,043
|
|
||
|
Corn Processing
|
811
|
|
648
|
|
1,148
|
|
|||||
|
Oilseeds Processing
|
871
|
|
1,574
|
|
1,440
|
|
|||||
|
Wild Flavors and Specialty Ingredients
|
286
|
|
280
|
|
205
|
|
|||||
|
Other
|
134
|
|
56
|
|
79
|
|
|||||
|
Total operating profit
|
2,704
|
|
3,272
|
|
3,915
|
|
|||||
|
Corporate
|
(882
|
)
|
(988
|
)
|
(785
|
)
|
|||||
|
Earnings before income taxes
|
$
|
1,822
|
|
$
|
2,284
|
|
$
|
3,130
|
|
||
|
(In millions)
|
December 31
|
||||||
|
2016
|
2015
|
||||||
|
Investments in and advances to affiliates
|
|||||||
|
Agricultural Services
|
$
|
367
|
|
$
|
384
|
|
|
|
Corn Processing
|
395
|
|
368
|
|
|||
|
Oilseeds Processing
|
3,413
|
|
2,743
|
|
|||
|
Wild Flavors and Specialty Ingredients
|
3
|
|
—
|
|
|||
|
Other
|
4
|
|
39
|
|
|||
|
Corporate
|
315
|
|
367
|
|
|||
|
Total
|
$
|
4,497
|
|
$
|
3,901
|
|
|
|
Identifiable assets
|
|||||||
|
Agricultural Services
|
$
|
8,380
|
|
$
|
8,715
|
|
|
|
Corn Processing
|
6,418
|
|
6,450
|
|
|||
|
Oilseeds Processing
|
11,228
|
|
10,794
|
|
|||
|
Wild Flavors and Specialty Ingredients
|
4,610
|
|
4,570
|
|
|||
|
Other
|
7,211
|
|
7,902
|
|
|||
|
Corporate
|
1,922
|
|
1,726
|
|
|||
|
Total
|
$
|
39,769
|
|
$
|
40,157
|
|
|
|
(In millions)
|
December 31
|
||||||
|
|
2016
|
2015
|
|||||
|
Gross additions to property, plant, and equipment
|
|
||||||
|
Agricultural Services
|
$
|
156
|
|
$
|
229
|
|
|
|
Corn Processing
|
240
|
|
427
|
|
|||
|
Oilseeds Processing
|
266
|
|
404
|
|
|||
|
Wild Flavors and Specialty Ingredients
|
139
|
|
167
|
|
|||
|
Other
|
20
|
|
15
|
|
|||
|
Corporate
|
61
|
|
108
|
|
|||
|
Total
|
$
|
882
|
|
$
|
1,350
|
|
|
99
Archer-Daniels-Midland Company
Notes to Consolidated Financial Statements (Continued)
Geographic information: The following geographic data include revenues attributed to the countries based on the location of the subsidiary making the sale and long-lived assets based on physical location. Long-lived assets represent the net book value of property, plant, and equipment.
|
Year Ended
|
|||||||||||
|
(In millions)
|
December 31
|
||||||||||
|
|
2016
|
2015
|
2014
|
||||||||
|
|
|
||||||||||
|
Revenues
|
|
||||||||||
|
United States
|
$
|
29,419
|
|
$
|
31,828
|
|
$
|
39,609
|
|
||
|
Switzerland
|
13,413
|
|
11,681
|
|
10,118
|
|
|||||
|
Cayman Islands
|
3,617
|
|
4,456
|
|
5,213
|
|
|||||
|
Germany
|
2,341
|
|
3,436
|
|
7,174
|
|
|||||
|
Other Foreign
|
13,556
|
|
16,301
|
|
19,087
|
|
|||||
|
|
$
|
62,346
|
|
$
|
67,702
|
|
$
|
81,201
|
|
||
|
(In millions)
|
December 31
|
||||||
|
2016
|
2015
|
||||||
|
Long-lived assets
|
|||||||
|
United States
|
$
|
6,763
|
|
$
|
6,877
|
|
|
|
Foreign
|
2,995
|
|
2,976
|
|
|||
|
|
$
|
9,758
|
|
$
|
9,853
|
|
|
100
Archer-Daniels-Midland Company
Notes to Consolidated Financial Statements (Continued)
The following table sets forth the charges included in asset impairment, exit, and restructuring costs.
|
(In millions)
|
Year Ended December 31
|
||||||||||
|
2016
|
2015
|
2014
|
|||||||||
|
|
|
||||||||||
|
Restructuring and exit costs
(1)
|
$
|
21
|
|
$
|
71
|
|
$
|
64
|
|
||
|
Impairment charge - equity securities
(2)
|
6
|
|
—
|
|
6
|
|
|||||
|
Impairment charge - goodwill and intangible assets
(3)
|
11
|
|
21
|
|
—
|
|
|||||
|
Impairment charge - fixed assets
(4)
|
17
|
|
108
|
|
35
|
|
|||||
|
Total asset impairment, exit, and restructuring costs
|
$
|
55
|
|
$
|
200
|
|
$
|
105
|
|
||
|
(1)
|
Restructuring and exit costs recognized in the year ended December 31, 2016 consisted of several individually insignificant charges. Restructuring and exit costs recognized in the year ended December 31, 2015 consisted primarily of restructuring charges of
$29 million
related principally to an international pension plan settlement, exit costs of
$22 million
related to Brazilian sugar ethanol facilities in the Corn Processing segment, and several individually insignificant restructuring and exit costs totaling
$20 million
. Restructuring and exit costs recognized in the year ended December 31, 2014 consisted of costs associated with the relocation of the Company’s global headquarters to Chicago, Illinois, of
$16 million
and restructuring charges related to the Wild Flavors acquisition and Toepfer integration following the acquisition of the minority interest and other restructuring charges of
$48 million
.
|
|
(2)
|
Impairment charge - equity securities for the fiscal year ended December 31, 2016 consisted of other-than-temporary impairment charges on the Company’s investment in
two
available for sale equity securities in Corporate. Impairment charge - equity securities for the fiscal year ended December 31, 2014 consisted of other-than-temporary investment writedowns of available for sale securities in Corporate.
|
|
(3)
|
Impairment charge - goodwill and intangible assets in the year ended December 31, 2016 consisted of software impairment in Corporate. Impairment charge - goodwill and intangible assets in the year ended December 31, 2015 consisted of software impairment of
$8 million
in Corporate and goodwill impairment charges of
$13 million
related to a Corn Processing facility and certain of its international Oilseeds Processing facilities.
|
|
(4)
|
Impairment charge - fixed assets for the fiscal year ended December 31, 2016 consisted of several individually insignificant fixed asset impairments. Impairment charge - fixed assets for the fiscal year ended December 31, 2015 consisted of property, plant, and equipment asset impairments of
$66 million
related principally to the Brazilian sugar ethanol business in the Corn Processing segment based on the uncertain outlook of this business at year-end,
$40 million
of several individually insignificant charges in the Oilseeds Processing segment,
$1 million
in the Wild Flavors and Specialty Ingredients segment, and
$1 million
in Corporate. Impairment charge - fixed assets for the fiscal year ended December 31, 2014 consisted of property, plant, and equipment asset impairments of
$17 million
in the Agricultural Services segment,
$15 million
in the Corn Processing segment, and
$3 million
in the Oilseeds Processing segment.
|
Since March 2012, the Company has had an accounts receivable securitization program (the “Program”) with certain commercial paper conduit purchasers and committed purchasers (collectively, the “Purchasers”). Under the Program, certain U.S.-originated trade accounts receivable are sold to a wholly-owned bankruptcy-remote entity, ADM Receivables, LLC (“ADM Receivables”). ADM Receivables in turn transfers such purchased accounts receivable in their entirety to the Purchasers pursuant to a receivables purchase agreement. In exchange for the transfer of the accounts receivable, ADM Receivables receives a cash payment of up to
$1.2 billion
, as amended, and an additional amount upon the collection of the accounts receivable (deferred consideration). The Program terminates on June 23, 2017, unless extended.
101
Archer-Daniels-Midland Company
Notes to Consolidated Financial Statements (Continued)
In March 2014, the Company entered into a second accounts receivable securitization program (the “Second Program”) with certain commercial paper conduit purchasers and committed purchasers (collectively, the “Second Purchasers”). Under the Second Program, certain non-U.S.-originated trade accounts receivable are sold to a wholly-owned bankruptcy-remote entity, ADM Ireland Receivables Company (“ADM Ireland Receivables”). ADM Ireland Receivables in turn transfers such purchased accounts receivable in their entirety to the Second Purchasers pursuant to a receivables purchase agreement. In exchange for the transfer of the accounts receivable, ADM Ireland Receivables receives a cash payment of up to
$0.3 billion
and an additional amount upon the collection of the accounts receivable (deferred consideration). The Second Program terminates on March 17, 2017, unless extended.
Under the Program and Second Program (collectively, the “Programs”), ADM Receivables and ADM Ireland Receivables use the cash proceeds from the transfer of receivables to the Purchasers and Second Purchasers and other consideration to finance the purchase of receivables from the Company and the ADM subsidiaries originating the receivables.
The Company accounts for these transfers as sales. The Company has no retained interests in the transferred receivables, other than collection and administrative responsibilities and its right to the deferred consideration. At
December 31, 2016
and
2015
, the Company did not record a servicing asset or liability related to its retained responsibility, based on its assessment of the servicing fee, market values for similar transactions, and its cost of servicing the receivables sold.
As of
December 31, 2016
and
2015
, the fair value of trade receivables transferred to the Purchasers under the Programs and derecognized from the Company’s consolidated balance sheet was
$1.6 billion
and
$1.7 billion
, respectively. In exchange for the transfer as of
December 31, 2016
and
2015
, the Company received cash of
$1.0 billion
and
$1.2 billion
and recorded a receivable for deferred consideration included in other current assets
$540 million
and
$513 million
, respectively. Cash collections from customers on receivables sold were
$34.3 billion
,
$40.7 billion
, and
$36.4 billion
for the years ended
December 31, 2016
,
2015
, and
2014
, respectively. Of this amount,
$33.8 billion
,
$40.3 billion
, and
$35.1 billion
pertain to cash collections on the deferred consideration for the years ended
December 31, 2016
,
2015
, and
2014
, respectively. Deferred consideration is paid to the Company in cash on behalf of the Purchasers as receivables are collected; however, as this is a revolving facility, cash collected from the Company’s customers is reinvested by the Purchasers daily in new receivable purchases under the Program.
The Company’s risk of loss following the transfer of accounts receivable under the Program is limited to the deferred consideration outstanding. The Company carries the deferred consideration at fair value determined by calculating the expected amount of cash to be received and is principally based on observable inputs (a Level 2 measurement under the applicable accounting standards) consisting mainly of the face amount of the receivables adjusted for anticipated credit losses and discounted at the appropriate market rate. Payment of deferred consideration is not subject to significant risks other than delinquencies and credit losses on accounts receivable transferred under the program which have historically been insignificant.
Transfers of receivables under the Program during the years ended
December 31, 2016
,
2015
, and
2014
resulted in an expense for the loss on sale of
$6 million
,
$5 million
, and
$5 million
, respectively, which is classified as selling, general, and administrative expenses in the consolidated statements of earnings.
The Company reflects all cash flows related to the Program as operating activities in its consolidated statements of cash flows because the cash received from the Purchasers upon both the sale and collection of the receivables is not subject to significant interest rate risk given the short-term nature of the Company’s trade receivables.
102
Archer-Daniels-Midland Company
Notes to Consolidated Financial Statements (Continued)
The Company is routinely involved in a number of actual or threatened legal actions, including those involving alleged personal injuries, employment law, product liability, intellectual property, environmental issues, alleged tax liability (see Note 13 for information on income tax matters), and class actions. The Company also routinely receives inquiries from regulators and other government authorities relating to various aspects of our business, and at any given time, the Company has matters at various stages of resolution with the applicable government authorities. The outcomes of these matters are not within our complete control and may not be known for prolonged periods of time. In some actions, claimants seek damages, as well as other relief, including injunctive relief, that could require significant expenditures or result in lost revenues. In accordance with applicable accounting standards, the Company records a liability in its consolidated financial statements for material loss contingencies when a loss is known or considered probable and the amount can be reasonably estimated. If the reasonable estimate of a known or probable loss is a range, and no amount within the range is a better estimate than any other, the minimum amount of the range is accrued. If a material loss contingency is reasonably possible but not known or probable, and can be reasonably estimated, the estimated loss or range of loss is disclosed in the notes to the consolidated financial statements. When determining the estimated loss or range of loss, significant judgment is required to estimate the amount and timing of a loss to be recorded. Estimates of probable losses resulting from litigation and governmental proceedings involving the Company are inherently difficult to predict, particularly when the matters are in early procedural stages, with incomplete facts or legal discovery; involve unsubstantiated or indeterminate claims for damages; potentially involve penalties, fines, disgorgement, or punitive damages; or could result in a change in business practice.
Beginning in 2011, approximately
45
farmers in the U.S. brought suit in a Missouri state court against the Company and one of its employees to recover alleged losses from a Ponzi scheme orchestrated by a third-party grain handler, Cathy Gieseker, who was convicted in 2010 of felony fraud charges and is currently serving time in federal prison. The farmers alleged that the Company knew or should have known of Ms. Gieseker’s Ponzi scheme but did not stop it, that Ms. Gieseker was effectively acting as the Company’s agent, and that the Company defrauded or otherwise wronged them. Attorneys for these farmers claimed to represent more than
100
additional farmers with similar claims. Collectively, all of the farmers sought more than
$250 million
in alleged economic losses, an unspecified amount for alleged mental pain and suffering, and an unspecified amount of punitive damages. On August 24, 2016, the Company and the farmers entered into a comprehensive confidential settlement of the matter, in which the Company did not admit wrongdoing, and this matter is now at an end. The Company recorded the settlement and related costs and fees pertaining to this matter during 2016.
The Company is a party to numerous lawsuits pending in various U.S. state and federal courts arising out of Syngenta Corporation’s (Syngenta) marketing and distribution of genetically modified corn products, Agrisure Viptera and Agrisure Duracade, in the U.S. First, the Company brought a state court action in Louisiana against Syngenta in 2014, alleging that Syngenta was negligent in commercializing its products before the products were approved in China. Second, the Company is a putative class member in a number of purported class actions filed beginning in 2013 by farmers and other parties against Syngenta in federal courts and consolidated for pretrial proceedings in a multidistrict litigation (MDL) proceeding in federal court in Kansas City, Kansas, again alleging that Syngenta was negligent in commercializing its products. In the fourth quarter of 2015, Syngenta filed third-party claims against the Company and other grain companies seeking contribution in the event that Syngenta is held liable in these lawsuits; the courts dismissed these third-party claims on April 4, 2016, and the Company is therefore no longer a third-party defendant in the MDL. Third, the Company and other grain companies have been named as a defendant in numerous individual and purported class action suits filed by farmers and other parties in state and federal courts beginning in the fourth quarter of 2015, alleging that the Company and other grain companies were negligent in failing to screen for genetically modified corn. On September 6, 2016, the court in the Minnesota state MDL proceedings granted the Company’s motion to dismiss the complaints against the Company in those actions, and on January 4, 2017, a federal court in the Southern District of Illinois similarly dismissed all of the pending complaints against the Company there. The Company denies liability in all of the actions in which it has been named as a third-party defendant or defendant and is vigorously defending itself in these cases. All of these actions are in pretrial proceedings. At this time, the Company is unable to predict the final outcome of this matter with any reasonable degree of certainty, but believes it will not have a material adverse effect on its financial condition, results of operations, or cash flows.
103
Archer-Daniels-Midland Company
Notes to Consolidated Financial Statements (Continued)
The Company has entered into agreements, primarily debt guarantee agreements related to equity-method investees, which could obligate the Company to make future payments if the primary entity fails to perform its contractual obligations. The Company has not recorded a liability for payment of these contingent obligations, as the Company believes the fair value of these contingent obligations is immaterial. The Company has collateral for a portion of these contingent obligations.
|
Quarter Ended
|
|||||||||||||||||||
|
March 31
|
June 30
|
September 30
|
December 31
|
Year
|
|||||||||||||||
|
(In millions, except per share amounts)
|
|||||||||||||||||||
|
Fiscal Year Ended December 31, 2016
|
|||||||||||||||||||
|
Revenues
|
$
|
14,384
|
|
$
|
15,629
|
|
$
|
15,832
|
|
$
|
16,501
|
|
$
|
62,346
|
|
||||
|
Gross Profit
|
796
|
|
757
|
|
1,105
|
|
1,026
|
|
3,684
|
|
|||||||||
|
Net Earnings Attributable to Controlling Interests
|
230
|
|
284
|
|
341
|
|
424
|
|
1,279
|
|
|||||||||
|
Basic Earnings Per Common Share
|
0.39
|
|
0.48
|
|
0.58
|
|
0.73
|
|
2.18
|
|
|||||||||
|
Diluted Earnings Per Common Share
|
0.39
|
|
0.48
|
|
0.58
|
|
0.73
|
|
2.16
|
|
|||||||||
|
|
Quarter Ended
|
|
|||||||||||||||||
|
|
March 31
|
June 30
|
September 30
|
December 31
|
Year
|
||||||||||||||
|
|
(In millions, except per share amounts)
|
||||||||||||||||||
|
Fiscal Year Ended December 31, 2015
|
|
|
|
|
|
||||||||||||||
|
Revenues
|
$
|
17,506
|
|
$
|
17,186
|
|
$
|
16,565
|
|
$
|
16,445
|
|
$
|
67,702
|
|
||||
|
Gross Profit
|
1,102
|
|
964
|
|
1,089
|
|
865
|
|
4,020
|
|
|||||||||
|
Net Earnings Attributable to Controlling Interests
|
493
|
|
386
|
|
252
|
|
718
|
|
1,849
|
|
|||||||||
|
Basic Earnings Per Common Share
|
0.78
|
|
0.62
|
|
0.41
|
|
1.20
|
|
2.99
|
|
|||||||||
|
Diluted Earnings Per Common Share
|
0.77
|
|
0.62
|
|
0.41
|
|
1.19
|
|
2.98
|
|
|||||||||
Net earnings attributable to controlling interests for the first quarter of the fiscal year ended December 31, 2016 include after-tax charges of
$8 million
(equal to
$0.01
per share), primarily related to software impairment and restructuring charges.
Net earnings attributable to controlling interests for the second quarter of the fiscal year ended December 31, 2016 include after-tax gains of
$101 million
(equal to
$0.17
per share), primarily related to a gain, including the recovery of loss provisions, on the sale of the Company’s Brazilian sugar ethanol facilities, realized contingent consideration on the sale of the Company’s equity investment in Gruma S.A. de C.V. in December 2012, and revaluation of the remaining interest to settlement value in conjunction with the acquisition of Amazon Flavors, partially offset by a loss on sale of asset; after-tax charges of
$8 million
(equal to
$0.01
per share) primarily related to impairment of certain long-lived assets and restructuring charges; certain discrete tax adjustments of
$6 million
(equal to
$0.01
per share) related to valuation allowances.
Net earnings attributable to controlling interests for the third quarter of the fiscal year ended December 31, 2016 include after-tax losses totalling
$9 million
(equal to
$0.02
per share), primarily related to a loss on sale of an equity investment; and after-tax charges of
$48 million
(equal to
$0.08
per share) primarily related to legal fees and settlement, impairment of certain long-lived assets and investments, and restructuring charges.
104
Archer-Daniels-Midland Company
Notes to Consolidated Financial Statements (Continued)
Net earnings attributable to controlling interests for the fourth quarter of the fiscal year ended December 31, 2016 include after-tax charges of
$13 million
(equal to
$0.03
per share) related to impairment of certain long-lived assets and restructuring charges; an after-tax gain of
$24 million
(equal to
$0.04
per share) related to a U.S. retiree medical benefit plan curtailment; and certain discrete tax adjustments totaling
$21 million
(equal to
$0.03
per share) related to valuation allowances, deferred tax re-rates, and changes in assertion.
Net earnings attributable to controlling interests for the second quarter of the fiscal year ended December 31, 2015 include after-tax gains totaling
$71 million
(equal to
$0.11
per share) related to the revaluation of the Company’s previously held investments in North Star Shipping and Minmetal in conjunction with the acquisition of the remaining interests, the sale of a
50%
interest in the Barcarena export terminal facility in Brazil to Glencore plc, and sale of the lactic business as discussed in Note 12; after-tax charges of
$28 million
(equal to
$0.04
per share) primarily related to impairment of certain long-lived assets as discussed in Note 18; and certain discrete tax adjustments of
$13 million
(equal to
$0.02
per share) related to valuation allowances.
Net earnings attributable to controlling interests for the third quarter of the fiscal year ended December 31, 2015 include a gain on the sale of the global chocolate business of
$23 million
after tax (equal to
$0.04
per share) as discussed in Note 12; fixed asset impairment charges related primarily to sugar ethanol facilities in Brazil in the Corn Processing segment of
$35 million
after tax (equal to
$0.06
per share) as discussed in Note 18; restructuring charges related to an international pension plan settlement of
$26 million
after tax (equal to
$0.04
per share) as discussed on Note 18; and an after-tax loss on debt extinguishment of
$118 million
(equal to
$0.19
per share) related to the cash tender offers and redemption of certain of the Company’s outstanding debentures as discussed in Note 12.
Net earnings attributable to controlling interests for the fourth quarter of the fiscal year ended December 31, 2015 include after-tax gains totaling
$421 million
(equal to
$0.70
per share) related primarily to the sale of the chocolate and cocoa businesses, and the revaluation of the Company’s previously held investment in Eaststarch C.V. in conjunction with the acquisition of the remaining interest as discussed in Note 12; after-tax restructuring and exit costs totaling
$33 million
(equal to
$0.06
per share) related to sugar ethanol facilities in Brazil, and other restructuring charges as discussed in Note 18; after-tax loss provisions, settlement charges, and inventory writedown totaling
$58 million
(equal to
$0.10
per share); after-tax goodwill, intangible and property, plant, and equipment asset impairments totaling
$50 million
(equal to
$0.08
per share) as discussed in Note 18; and certain discrete tax adjustments totaling
$73 million
(equal to
$0.12
per share) related to valuation allowances and deferred tax re-rates.
On January 16, 2017, the Company acquired additional shares in Wilmar, increasing its ownership interest from
23.2%
to
23.9%
.
On January 30, 2017, the Company announced the sale of its crop risk services businesses to Validus Holdings, a global group of insurance and reinsurance companies. The sale, which is subject to regulatory approval, is expected to close in the first half of 2017.
On February 1, 2017, the Company completed the acquisition of Crosswind Industries, Inc., an industry leader in the manufacture of contract and private label pet treats and foods, as well as specialty ingredients, for
$81 million
, subject to working capital adjustments.
105
Report of Independent Registered Public Accounting Firm
The Board of Directors and Shareholders
Archer-Daniels-Midland Company
Chicago, Illinois
We have audited the accompanying consolidated balance sheets of Archer-Daniels-Midland Company (the Company) as of
December 31, 2016
and
2015
, and the related consolidated statements of earnings, comprehensive income (loss), shareholders’ equity, and cash flows for each of the three years in the period ended
December 31, 2016
. Our audits also included the financial statement schedule listed in the Index at Item 15(a)(2). These financial statements and schedule are the responsibility of the Company’s management. Our responsibility is to express an opinion on these financial statements and schedule based on our audits.
We conducted our audits in accordance with the standards of the Public Company Accounting Oversight Board (United States). Those standards require that we plan and perform the audit to obtain reasonable assurance about whether the financial statements are free of material misstatement. An audit includes examining, on a test basis, evidence supporting the amounts and disclosures in the financial statements. An audit also includes assessing the accounting principles used and significant estimates made by management, as well as evaluating the overall financial statement presentation. We believe that our audits provide a reasonable basis for our opinion.
In our opinion, the financial statements referred to above present fairly, in all material respects, the consolidated financial position of Archer-Daniels-Midland Company at
December 31, 2016
and
2015
, and the consolidated results of its operations and its cash flows for each of the three years in the period ended
December 31, 2016
, in conformity with U.S. generally accepted accounting principles. Also, in our opinion, the related financial statement schedule, when considered in relation to the basic financial statements taken as a whole, presents fairly, in all material respects, the information set forth therein.
We also have audited, in accordance with the standards of the Public Company Accounting Oversight Board (United States), Archer-Daniels-Midland Company’s internal control over financial reporting as of
December 31, 2016
, based on criteria established in
Internal Control - Integrated Framework
issued by the Committee of Sponsoring Organizations of the Treadway Commission (2013 Framework), and our report dated
February 17, 2017
, expressed an unqualified opinion thereon.
/s/ Ernst & Young LLP
St. Louis, Missouri
February 17, 2017
106
Report of Independent Registered Public Accounting Firm
The Board of Directors and Shareholders
Archer-Daniels-Midland Company
Chicago, Illinois
We have audited Archer-Daniels-Midland Company’s (the Company) internal control over financial reporting as of
December 31, 2016
, based on criteria established in
Internal Control - Integrated Framework
issued by the Committee of Sponsoring Organizations of the Treadway Commission (2013 Framework) (the COSO criteria). Archer-Daniels-Midland Company’s management is responsible for maintaining effective internal control over financial reporting, and for its assessment of the effectiveness of internal control over financial reporting included in the accompanying Management’s Report on Internal Control Over Financial Reporting. Our responsibility is to express an opinion on the Company’s internal control over financial reporting based on our audit.
We conducted our audit in accordance with the standards of the Public Company Accounting Oversight Board (United States). Those standards require that we plan and perform the audit to obtain reasonable assurance about whether effective internal control over financial reporting was maintained in all material respects. Our audit included obtaining an understanding of internal control over financial reporting, assessing the risk that a material weakness exists, testing and evaluating the design and operating effectiveness of internal control based on the assessed risk, and performing such other procedures as we considered necessary in the circumstances. We believe that our audit provides a reasonable basis for our opinion.
A company’s internal control over financial reporting is a process designed to provide reasonable assurance regarding the reliability of financial reporting and the preparation of financial statements for external purposes in accordance with generally accepted accounting principles. A company’s internal control over financial reporting includes those policies and procedures that (1) pertain to the maintenance of records that, in reasonable detail, accurately and fairly reflect the transactions and dispositions of the assets of the company; (2) provide reasonable assurance that transactions are recorded as necessary to permit preparation of financial statements in accordance with generally accepted accounting principles, and that receipts and expenditures of the company are being made only in accordance with authorizations of management and directors of the company; and (3) provide reasonable assurance regarding prevention or timely detection of unauthorized acquisition, use, or disposition of the company’s assets that could have a material effect on the financial statements.
Because of its inherent limitations, internal control over financial reporting may not prevent or detect misstatements. Also, projections of any evaluation of effectiveness to future periods are subject to the risk that controls may become inadequate because of changes in conditions, or that the degree of compliance with the policies or procedures may deteriorate.
In our opinion, Archer-Daniels-Midland Company maintained, in all material respects, effective internal control over financial reporting as of
December 31, 2016
, based on the COSO criteria.
We also have audited, in accordance with the standards of the Public Company Accounting Oversight Board (United States), the consolidated balance sheets of Archer-Daniels-Midland Company as of
December 31, 2016
and
2015
, and the related consolidated statements of earnings, comprehensive income (loss), shareholders’ equity, and cash flows for each of the three years in the period ended
December 31, 2016
, of Archer-Daniels-Midland Company, and our report dated
February 17, 2017
, expressed an unqualified opinion thereon.
/s/ Ernst & Young LLP
St. Louis, Missouri
February 17, 2017
107
|
Item 9.
|
CHANGES IN AND DISAGREEMENTS WITH ACCOUNTANTS ON ACCOUNTING AND FINANCIAL DISCLOSURE
|
None.
|
Item 9A.
|
CONTROLS AND PROCEDURES
|
As of
December 31, 2016
, an evaluation was performed under the supervision and with the participation of the Company’s management, including the Chief Executive Officer and Chief Financial Officer, of the effectiveness of the design and operation of the Company’s “disclosure controls and procedures” (as defined in Rules 13a-15(e) and 15d-15(e) under the Securities Exchange Act of 1934 (the Exchange Act)). Based on that evaluation, the Company’s management, including the Chief Executive Officer and Chief Financial Officer, concluded the Company’s disclosure controls and procedures were effective to ensure that information required to be disclosed by the Company in reports that it files or submits under the Exchange Act is (i) recorded, processed, summarized and reported within the time periods specified in Securities and Exchange Commission rules and forms and (ii) accumulated and communicated to the Chief Executive Officer and Chief Financial Officer to allow timely decisions regarding required disclosure.
The Company is implementing a new enterprise resource planning (ERP) system on a worldwide basis as part of its ongoing business transformation program, which is expected to improve the efficiency and effectiveness of certain financial and business transaction processes. The implementation is expected to occur in phases over the next several years. The Company has currently implemented changes to certain processes in over
200
locations and will continue to roll-out the ERP system over the next several years. The Company has appropriately considered these changes in its design of and testing for the effectiveness of internal controls over financial reporting and concluded, as part of the evaluation described in the above paragraph, that the implementation of the new ERP in these circumstances has not materially affected its internal control over financial reporting.
MANAGEMENT’S REPORT ON INTERNAL CONTROL OVER FINANCIAL REPORTING
Archer-Daniels-Midland Company’s (ADM’s) management is responsible for establishing and maintaining adequate internal control over financial reporting, as such term is defined in Exchange Act Rules 13a-15(f). ADM’s internal control system is designed to provide reasonable assurance regarding the reliability of financial reporting and the preparation of financial statements in accordance with generally accepted accounting principles.
Under the supervision and with the participation of management, including its Chief Executive Officer and Chief Financial Officer, ADM’s management assessed the design and operating effectiveness of internal control over financial reporting as of
December 31, 2016
based on the framework set forth in
Internal Control-Integrated Framework
issued by the Committee of Sponsoring Organizations of the Treadway Commission (2013 Framework). Based on this assessment, management concluded that ADM’s internal control over financial reporting was effective as of
December 31, 2016
.
Ernst & Young LLP, an independent registered public accounting firm, has issued an attestation report on the Company’s internal control over financial reporting as of
December 31, 2016
. That report is included herein.
|
/s/ Juan R. Luciano
Juan R. Luciano
Chairman, Chief Executive Officer, and President
|
/s/ Ray G. Young
Ray G. Young
Executive Vice President and Chief Financial Officer
|
|
Item 9B.
|
OTHER INFORMATION
|
None.
108
|
Item 10.
|
DIRECTORS, EXECUTIVE OFFICERS AND CORPORATE GOVERNANCE
|
Information with respect to directors, code of conduct, audit committee and audit committee financial experts of the Company, and Section 16(a) beneficial ownership reporting compliance is set forth in “Proposal No. 1 - Election of Directors,” “Director Experiences, Qualifications, Attributes and Skills, and Board Diversity,” “Code of Conduct,” “Information Concerning Committees and Meetings – Audit Committee,” “Report of the Audit Committee,” and “Section 16(a) Beneficial Ownership Reporting Compliance,” of the definitive proxy statement for the Company’s annual meeting of stockholders to be held on
May 4, 2017
and is incorporated herein by reference.
Officers of the Company are elected by the Board of Directors for terms of one year and until their successors are duly elected and qualified.
Information with respect to executive officers and certain significant employees of the Company is set forth below. Except as otherwise indicated, all positions are with the Company.
|
Name
|
Titles
|
Age
|
||||
|
Ben I. Bard
|
Global Chief Compliance Officer since January 2014. Ethics and Compliance Counsel, Coca-Cola Company from 2006 to January 2014.
|
43
|
|
|||
|
Mark A. Bemis
|
Senior Vice President of the Company since December 2010. Chief Risk Officer since May 2015. President, North America since March 2015. President, Corn Processing business unit from December 2010 to March 2015.
|
56
|
|
|||
|
Donald Chen
|
President, North Asia since January 2016. Vice President, Sadara Chemical Company from February 2012 to December 2015. Regional Business Director of Asia Pacific, Dow Chemical Company from February 2006 to February 2012.
|
54
|
|
|||
|
Christopher M. Cuddy
|
Senior Vice President of the Company since May 2015. President, Corn Processing business unit since March 2015. President, Corn Sweeteners and Starches from December 2012 to February 2015. Vice President and General Manager, Corn Processing business unit from February 2011 to November 2012.
|
43
|
|
|||
|
Michael D’Ambrose
|
Senior Vice President, Human Resources since October 2006.
|
59
|
|
|||
|
Pierre Duprat
|
President, ADM Europe, Middle East, and Africa (EMEA) since June 2016. President, ADM Corn EMEA and Asia since November 2015. Director, International Business Development - Corn from February 2014 to November 2015. CEO of Cereal Transformation Division, Tereos from September 2007 to February 2013.
|
49
|
|
|||
|
D. Cameron Findlay
|
Senior Vice President, General Counsel, and Secretary since July 2013. Senior Vice President, General Counsel, and Secretary of Medtronic, Inc. from 2009 to June 2013.
|
57
|
|
|||
|
Scott Fredericksen
|
President, South America since February 2016. President, Transportation from March 2012 to March 2016. President, Transportation - Rail, Container, and Supply Chain from September 2007 to March 2012.
|
54
|
|
|||
|
Stuart E. Funderburg
|
Assistant Secretary and Chief Corporate and Securities Counsel since August 2014. Assistant Secretary and Associate General Counsel from November 2012 to August 2014. Assistant Secretary and Assistant General Counsel from November 2008 to November 2012.
|
53
|
|
|||
|
Shannon Herzfeld
|
Vice President of the Company since February 2005, with responsibility for the Company’s Government Affairs function.
|
64
|
|
|||
|
Patricia L. Logan
|
Chief Audit Executive since August 2014. Director, Internal Audit from September 2005 to August 2014.
|
57
|
|
|||
|
Juan R. Luciano
|
Chairman of the Board of Directors since January 2016. Chief Executive Officer and President since January 2015. President and Chief Operating Officer from February 2014 to December 2014. Executive Vice President and Chief Operating Officer from April 2011 to February 2014.
|
55
|
|
|||
109
|
Item 10.
|
DIRECTORS, EXECUTIVE OFFICERS AND CORPORATE GOVERNANCE (Continued)
|
|
Vikram Luthar
|
President, Enzymes since December 2015. CFO, Corn Processing business unit since March 2014. Senior Vice President, Strategy from March 2015 to December 2015. Group Vice President, Finance from January 2012 to March 2015. Vice President, Finance and Treasurer of the Company from August 2010 to January 2012.
|
50
|
|
|||
|
Vincent F. Macciocchi
|
Senior Vice President of the Company and President, WILD Flavors and Specialty Ingredients business unit since May 2015. Global President, WILD Flavors from October 2014 until May 2015. Chief Operating Officer for North American entity at WILD Flavors and Specialty Ingredients from June 2012 until October 2014. Senior Vice President of Sales, Givaudan Flavors North America from September 2001 until June 2012.
|
51
|
|
|||
|
Gregory A. Morris
|
Senior Vice President of the Company since November 2014. President, Global Oilseeds Processing business unit since May 2015. President, WILD Flavors and Specialty Ingredients business unit from October 2014 to May 2015. President, North American Oilseeds Processing business unit from 2008 to December 2014.
|
45
|
|
|||
|
Ian Pinner
|
President, Southeast Asia and Global Destination Marketing since December 2015. President, Global Cocoa from June 2014 to December 2015. Vice President, Corporate Strategic and Financial Planning from February 2014 to June 2014. President, Global Grain Division from January 2012 to February 2014. General Manager, European Softseed Division from January 2008 to January 2014.
|
44
|
|
|||
|
Ismael Roig
|
Senior Vice President of the Company and Chief Strategy Officer since December 2015. Chief Sustainability Officer since May 2015. Vice President of the Company from December 2004 until December 2015. President, Asia Pacific from August 2011 to December 2015. Vice President and Executive Director, Asia-Pacific from July 2010 to August 2011.
|
49
|
|
|||
|
John P. Stott
|
Group Vice President, Finance and Corporate Controller since August 2014. Vice President and Controller of the Company from December 2006 to August 2014.
|
49
|
|
|||
|
Joseph D. Taets
|
Senior Vice President of the Company and President, Agricultural Services business unit since August 2011. President, ADM Europe, Middle East, and Africa (EMEA) from August 2013 to June 2016. Vice President of the Company from September 2009 to August 2011. President, ADM Grain from December 2010 to August 2011.
|
51
|
|
|||
|
Thuy-Nga T. Vo
|
Chief Counsel, Corporate, Securities, and Mergers and Acquisitions and Assistant Secretary since January 2017. Chief Counsel, Mergers and Acquisitions from May 2013 to January 2017. Professor of Law at William Mitchell College of Law from June 2006 to May 2013.
|
52
|
|
|||
|
Todd Werpy
|
Senior Vice President and Chief Technology Officer since March 2015. Senior Vice President, Research and Development from August 2012 to October 2013. Vice President, Biofuels and Biochemical Research from June 2007 to August 2012.
|
54
|
|
|||
|
Ray G. Young
|
Executive Vice President of the Company since March 2015. Senior Vice President of the Company from November 2010 to March 2015. Chief Financial Officer since December 2010.
|
55
|
|
|||
110
|
Item 11.
|
EXECUTIVE COMPENSATION
|
Information responsive to this Item is set forth in “Compensation Discussion and Analysis,” “Compensation/Succession Committee Report,” “Compensation/Succession Committee Interlocks and Insider Participation,” “Summary Compensation Table,” “Grants of Plan-Based Awards During Fiscal
2016
,” “Outstanding Equity Awards at Fiscal
2016
Year-End,” “Option Exercises and Stock Vested During Fiscal
2016
,” “Pension Benefits,” “Nonqualified Deferred Compensation,” “Termination of Employment and Change-in-Control Arrangements” and “Director Compensation for Fiscal
2016
” of the definitive proxy statement for the Company’s annual meeting of stockholders to be held on
May 4, 2017
, and is incorporated herein by reference.
|
Item 12.
|
SECURITY OWNERSHIP OF CERTAIN BENEFICIAL OWNERS AND MANAGEMENT AND RELATED STOCKHOLDER MATTERS
|
Information responsive to this Item is set forth in “Principal Holders of Voting Securities,” “Proposal No. 1 - Election of Directors for a One-year Term,” “Executive Officer Stock Ownership,” and “Equity Compensation Plan Information” of the definitive proxy statement for the Company’s annual meeting of stockholders to be held on
May 4, 2017
, and is incorporated herein by reference.
|
Item 13.
|
CERTAIN RELATIONSHIPS AND RELATED TRANSACTIONS, AND DIRECTOR INDEPENDENCE
|
Information responsive to this Item is set forth in “Certain Relationships and Related Transactions,” “Review and Approval of Certain Relationships and Related Transactions,” and “Independence of Directors” of the definitive proxy statement for the Company’s annual meeting of stockholders to be held on
May 4, 2017
, and is incorporated herein by reference.
|
Item 14.
|
PRINCIPAL ACCOUNTING FEES AND SERVICES
|
Information responsive to this Item is set forth in “Fees Paid to Independent Auditors” and “Audit Committee Pre-Approval Policies” of the definitive proxy statement for the Company’s annual meeting of stockholders to be held on
May 4, 2017
, and is incorporated herein by reference.
111
|
Item 15.
|
EXHIBITS AND FINANCIAL STATEMENT SCHEDULES
|
|
(a)(1)
|
See Item 8, “Financial Statements and Supplementary Data,” for a list of financial statements.
|
|
(a)(2)
|
Financial statement schedules
|
|
SCHEDULE II - VALUATION AND QUALIFYING ACCOUNTS AND RESERVES
|
||||||||||||||||
|
|
Balance at
|
|
|
|
Balance at
|
|||||||||||
|
|
Beginning
|
|
|
|
End
|
|||||||||||
|
|
of Year
|
Additions
|
Deductions
(1)
|
Other
(2)
|
of Year
|
|||||||||||
|
|
(In millions)
|
|||||||||||||||
|
Allowance for doubtful accounts
|
|
|
|
|
|
|||||||||||
|
December 31, 2014
|
$
|
81
|
|
37
|
|
(32
|
)
|
(5
|
)
|
$
|
81
|
|
||||
|
December 31, 2015
|
$
|
81
|
|
24
|
|
(32
|
)
|
(3
|
)
|
$
|
70
|
|
||||
|
December 31, 2016
|
$
|
70
|
|
16
|
|
(16
|
)
|
2
|
|
$
|
72
|
|
||||
|
(1)
Uncollectible accounts written off
|
||||||||||||||||
|
(2)
Impact of reclassifications, foreign exchange translation, and other adjustments
|
||||||||||||||||
All other schedules are either not required, not applicable, or the information is otherwise included.
|
(a)(3)
|
List of exhibits
|
|
(3)
|
(i) Composite Certificate of Incorporation, as amended (incorporated by reference to Exhibit (3)(i) to the Company's Form 10-Q for the quarter ended September 30, 2001 (File No. 1-44)).
|
|
(ii)
|
Bylaws, as amended through February 9, 2017 (incorporated by reference to Exhibit 3 to the Company's Form 8-K filed on February 13, 2017 (File No. 1-44)).
|
|
(4)
|
Instruments defining the rights of security holders, including:
|
|
(i)
|
Indenture dated June 1, 1986, between the Company and The Bank of New York Mellon (successor to JPMorgan Chase, The Chase Manhattan Bank, Chemical Bank, and Manufacturers Hanover Trust Company), as Trustee (incorporated by reference to Exhibit 4(a) to Registration Statement No. 336721), and Supplemental Indenture dated as of August 1, 1989 between the registrant and The Bank of New York Mellon (successor to JPMorgan Chase, The Chase Manhattan Bank, Chemical Bank and Manufacturers Hanover Trust Company), as Trustee (incorporated by reference to Exhibit 4(c) to Post Effective Amendment No. 3 to Registration Statement No. 33-6721), relating to:
|
the $300,000,000 – 8 3/8% Debentures due April 15, 2017,
the $350,000,000 – 7 1/2% Debentures due March 15, 2027,
the $200,000,000 – 6 3/4% Debentures due December 15, 2027,
the $300,000,000 – 6 5/8% Debentures due May 1, 2029,
the $400,000,000 – 7% Debentures due February 1, 2031,
the $500,000,000 – 5.935% Debentures due October 1, 2032,
the $600,000,000 – 5.375% Debentures due September 15, 2035, and
the $250,000,000 – 6.95% Debentures due December 15, 2097.
112
|
Item 15.
|
EXHIBITS AND FINANCIAL STATEMENT SCHEDULES (Continued)
|
|
(ii)
|
Indenture dated September 20, 2006, between the Company and The Bank of New York Mellon (successor to JPMorgan Chase Bank, N.A.), as Trustee (incorporated by reference to Exhibit 4 to Registration Statement on Form S-3, Registration No. 333-137541), First Supplemental Indenture dated as of June 3, 2008 between the registrant and The Bank of New York Mellon (formerly known as The Bank of New York) (incorporated by reference to Exhibit 4.6 to Form 8-K (File No. 1-44) filed on June 3, 2008), Second Supplemental Indenture, dated as of November 29, 2010 between the registrant and The Bank of New York Mellon (incorporated by reference to Exhibit 4.3 to Form 8-K (File No. 1-44) filed on November 30, 2010), and Third Supplemental Indenture, dated as of April 4, 2011, between the registrant and The Bank of New York Mellon (incorporated by reference to Exhibit 4.4 to Form 8-K filed on April 8, 2011 (File No. 1-44)) relating to:
|
the $500,000,000 – 6.45% Debentures due January 15, 2038,
the $700,000,000 – 5.45% Notes due March 15, 2018,
the $750,000,000 – 4.479% Notes due March 1, 2021,
the $1,000,000,000 – 5.765% Debentures due March 1, 2041, and
the $527,688,000 – 4.535% Debentures due March 26, 2042.
|
(iii)
|
Indenture dated October 16, 2012, between the Company and The Bank of New York Mellon, as Trustee (incorporated by reference to Exhibit 4.1 to Form 8-K filed on October 17, 2012 (File No. 1-44)) relating to:
|
the $570,425,000 4.016% Debentures due April 16, 2043,
the €600,000,000 1.750% Note due June 23, 2023,
the €500,000,000 Floating Rate Note due June 24, 2019, and
the $1,000,000,000 2.500% Notes due August 11, 2026.
|
(iv)
|
Copies of constituent instruments defining rights of holders of long-term debt of the Company and Subsidiaries, other than the Indentures specified herein, are not filed herewith, pursuant to Instruction (b)(4)(iii)(A) to Item 601 of Regulation S-K, because the total amount of securities authorized under any such instrument does not exceed 10% of the total assets of the Company and Subsidiaries on a consolidated basis. The Registrant hereby agrees that it will, upon request by the SEC, furnish to the SEC a copy of each such instrument.
|
|
(10)
|
Material Contracts - Copies of the Company’s equity compensation plans, deferred compensation plans and agreements with executive officers, pursuant to Instruction (b)(10)(iii)(A) to Item 601 of Regulation S-K, each of which is a management contract or compensation plan or arrangement required to be filed as an exhibit pursuant to Item 15(b) of Form 10-K, are incorporated herein by reference as follows:
|
|
(i)
|
The Archer-Daniels-Midland Company Deferred Compensation Plan for Selected Management Employees I, as amended (incorporated by reference to Exhibit 10(iii) to the Company’s Annual Report on Form 10-K for the year ended June 30, 2010 (File No. 1-44)).
|
|
(ii)
|
The Archer-Daniels-Midland Company Deferred Compensation Plan for Selected Management Employees II, as amended and restated (incorporated by reference to Exhibit 10(ii) to the Company’s Annual Report on Form 10-K for the year ended December 31, 2013 (File No. 1-44)).
|
|
(iii)
|
The Archer-Daniels-Midland Company Supplemental Retirement Plan, as amended (incorporated by reference to Exhibit 10(vi) to the Company’s Annual Report on Form 10-K for the year ended June 30, 2010 (File No. 1-44)).
|
|
(iv)
|
Second Amendment to ADM Supplemental Retirement Plan (incorporated by reference to Exhibit 10.1 to the Company’s Quarterly Report on Form 10-Q for the quarter ended December 31, 2010 (File No. 1-44)).
|
|
(v)
|
The Archer-Daniels-Midland Company Amended and Restated Stock Unit Plan for Nonemployee Directors, as amended.
|
113
|
Item 15.
|
EXHIBITS AND FINANCIAL STATEMENT SCHEDULES (Continued)
|
|
(vi)
|
The Archer-Daniels-Midland 2002 Incentive Compensation Plan (incorporated by reference to Exhibit A to the Company’s Definitive Proxy Statement filed on September 25, 2002 (File No. 1-44)).
|
|
(vii)
|
The Archer-Daniels-Midland Company 2009 Incentive Compensation Plan (incorporated by reference to Exhibit A to the Company’s Definitive Proxy Statement filed on September 25, 2009 (File No. 1-44)).
|
|
(viii)
|
Form of Stock Option Agreement for non-NEO employees (U.S.) (incorporated by reference to Exhibit 10(i) to the Company’s Quarterly Report on Form 10-Q for the quarter ended March 31, 2013 (File No. 1-44)).
|
|
(ix)
|
Form of Restricted Stock Unit Award Agreement for non-NEO employees (U.S.) (incorporated by reference to Exhibit 10(ii) to the Company’s Quarterly Report on Form 10-Q for the quarter ended March 31, 2013 (File No. 1-44)).
|
|
(x)
|
Form of Stock Option Agreement for NEOs (incorporated by reference to Exhibit 10(iii) to the Company’s Quarterly Report on Form 10-Q for the quarter ended March 31, 2013 (File No. 1-44)).
|
|
(xi)
|
Form of Restricted Stock Unit Award Agreement for NEOs (incorporated by reference to Exhibit 10(iv) to the Company’s Quarterly Report on Form 10-Q for the quarter ended March 31, 2013 (File No. 1-44)).
|
|
(xii)
|
Form of Stock Option Agreement for international employees (incorporated by reference to Exhibit 10(v) to the Company’s Quarterly Report on Form 10-Q for the quarter ended March 31, 2013 (File No. 1-44)).
|
|
(xiii)
|
Form of Restricted Stock Unit Award Agreement for international employees (incorporated by reference to Exhibit 10(vi) to the Company’s Quarterly Report on Form 10-Q for the quarter ended March 31, 2013 (File 1-44)).
|
|
(xiv)
|
Form of Performance Share Unit Award Agreement (incorporated by reference to Exhibit 10(vii) to the Company’s Quarterly Report on Form 10-Q for the quarter ended March 31, 2013 (File No. 1-44)).
|
|
(xv)
|
Form of Performance Share Unit Award Agreement for grant to J. Luciano (incorporated by reference to Exhibit 10.1 to the Company’s Current Report on Form 8-K filed on March 25, 2011 (File No. 1-44)).
|
|
(xvi)
|
Form of Nonqualified Stock Option Award for Executive Officers (incorporated by reference to Exhibit 10.1 to the Company's Quarterly Report on Form 10-Q for the quarter ended September 30, 2016 (File No. 1-44)).
|
|
(xvii)
|
Form of Nonqualified Stock Option Award for U.S. Employees (incorporated by reference to Exhibit 10.2 to the Company's Quarterly Report on Form 10-Q for the quarter ended September 30, 2016 (File No. 1-44)).
|
|
(xviii)
|
Form of Restricted Stock Unit Award for Executive Officers (incorporated by reference to Exhibit 10.3 to the Company's Quarterly Report on Form 10-Q for the quarter ended September 30, 2016 (File No. 1-44)).
|
|
(xix)
|
Form of Restricted Stock Unit Award for U.S. Employees (incorporated by reference to Exhibit 10.4 to the Company's Quarterly Report on Form 10-Q for the quarter ended September 30, 2016 (File No. 1-44)).
|
|
(12)
|
Calculation of Ratio of Earnings to Fixed Charges.
|
|
(21)
|
Subsidiaries of the Company.
|
|
(23)
|
Consent of independent registered public accounting firm.
|
|
(24)
|
Powers of attorney.
|
114
|
Item 15.
|
EXHIBITS AND FINANCIAL STATEMENT SCHEDULES (Continued)
|
|
(31.1)
|
Certification of Chief Executive Officer pursuant to Rule 13a–14(a) and Rule 15d–14(a) of the Securities Exchange Act, as amended.
|
|
(31.2)
|
Certification of Chief Financial Officer pursuant to Rule 13a–14(a) and Rule 15d–14(a) of the Securities Exchange Act, as amended.
|
|
(32.1)
|
Certification of Chief Executive Officer pursuant to 18 U.S.C. 1350, as adopted pursuant to Section 906 of the Sarbanes-Oxley Act of 2002.
|
|
(32.2)
|
Certification of Chief Financial Officer pursuant to 18 U.S.C. 1350, as adopted pursuant to Section 906 of the Sarbanes-Oxley Act of 2002.
|
|
(101)
|
Interactive Data File.
|
|
Item 16.
|
Form 10-K Summary
|
Not Applicable.
115
SIGNATURES
Pursuant to the requirements of Section 13 of the Securities Exchange Act of 1934, the Registrant has duly caused this report to be signed on its behalf by the undersigned, thereunto duly authorized.
Date:
February 17, 2017
ARCHER-DANIELS-MIDLAND COMPANY
By: /s/ D. C. Findlay
D. C. Findlay
Senior Vice President, General Counsel
and Secretary
Pursuant to the requirements of the Securities Exchange Act of 1934, this report has been signed below on February 17, 2017, by the following persons on behalf of the Registrant and in the capacities indicated.
|
/s/ J. R. Luciano
|
/s/ P. Dufour
|
/s/ D. C. Findlay
|
|
J. R. Luciano*,
|
P. Dufour*,
|
D. C. Findlay
|
|
Chairman, Chief Executive Officer,
|
Director
|
Attorney-in-Fact
|
|
President, and Director
|
||
|
(Principal Executive Officer)
|
/s/ D. E. Felsinger
|
|
|
D. E. Felsinger*,
|
||
|
/s/ R. G. Young
|
Director
|
|
|
R. G. Young
|
|
|
|
Executive Vice President and
|
/s/ A. Maciel
|
|
|
Chief Financial Officer
|
A. Maciel*,
|
|
|
(Principal Financial Officer)
|
Director
|
|
|
|
|
|
|
/s/ J. P. Stott
|
/s/ P. J. Moore
|
|
|
J. P. Stott
|
P. J. Moore*,
|
|
|
Group Vice President, Finance and
|
Director
|
|
|
Corporate Controller
|
|
|
|
(Principal Accounting Officer)
|
/s/ F. Sanchez
|
|
|
F. Sanchez*,
|
||
|
/s/ A. L. Boeckmann
|
Director
|
|
|
A. L. Boeckmann*,
|
|
|
|
Director
|
/s/ D. A. Sandler
|
|
|
|
D. A. Sandler*,
|
|
|
/s/ M. H. Carter
|
Director
|
|
|
M. H. Carter*,
|
||
|
Director
|
/s/ D. Shih
|
|
|
D. Shih*,
|
||
|
/s/ T. K. Crews
|
Director
|
|
|
T. K. Crews*,
|
||
|
Director
|
/s/ K. R. Westbrook
|
|
|
K. R. Westbrook*,
|
||
|
Director
|
||
*Powers of Attorney authorizing R. G. Young, J. P. Stott, and D. C. Findlay, and each of them, to sign the Form 10-K on behalf of the above-named officers and directors of the Company, copies of which are being filed with the Securities and Exchange Commission.
116
TABLE OF CONTENTS
Part IItem 1. BusinessItem 1. Business (continued)Item 1A. Risk FactorsItem 1A. Risk Factors (continued)Item 1B. Unresolved Staff CommentsItem 2. Properties (continued)Item 2. PropertiesItem 3. Legal ProceedingsItem 4. Mine Safety DisclosuresPart IIItem 5. Market For Registrant S Common Equity, Related Stockholder Matters, and Issuer Purchases Of Equity SecuritiesItem 5. Market For Registrant S Common Equity, Related Stockholder Matters, and Issuer Purchases Of Equity Securities (continued)Item 6. Selected Financial DataItem 6. Selected Financial Data (continued)Item 7. Management S Discussion and Analysis Of Financial Condition and Results Of OperationsItem 7. Management S Discussion and Analysis Of Financial Condition and Results Of Operations (continued)Item 7A. Quantitative and Qualitative Disclosures About Market RiskItem 7A. Quantitative and Qualitative Disclosures About Market Risk (continued)Item 8. Financial Statements and Supplementary DataNote 1. Summary Of Significant Accounting PoliciesNote 1. Summary Of Significant Accounting Policies (continued)Note 2. AcquisitionsNote 2. Acquisitions (continued)Note 3. Fair Value MeasurementsNote 3. Fair Value Measurements (continued)Note 4. Derivative Instruments & Hedging ActivitiesNote 4. Derivative Instruments & Hedging Activities (continued)Note 5. Marketable SecuritiesNote 6. Other Current AssetsNote 7. Accrued Expenses and Other PayablesNote 8. Investments in and Advances To AffiliatesNote 9. Goodwill and Other Intangible AssetsNote 10. Debt Financing ArrangementsNote 10. Debt Financing Arrangements (continued)Note 11. Stock CompensationNote 11. Stock Compensation (continued)Note 12. Other (income) Expense NetNote 12. Other (income) Expense Net (continued)Note 13. Income TaxesNote 13. Income Taxes (continued)Note 14. LeasesNote 15. Employee Benefit PlansNote 15. Employee Benefit Plans (continued)Note 16. Shareholders EquityNote 16. Shareholders Equity (continued)Note 17. Segment and Geographic InformationNote 17. Segment and Geographic Information (continued)Note 18. Asset Impairment, Exit, and Restructuring CostsNote 19. Sale Of Accounts ReceivableNote 19. Sale Of Accounts Receivable (continued)Note 20. Legal Proceedings, Guarantees, and CommitmentsNote 20. Legal Proceedings, Guarantees, and Commitments (continued)Note 21. Quarterly Financial Data (unaudited)Note 21. Quarterly Financial Data (unaudited) (continued)Note 22. Subsequent EventsItem 9. Changes in and Disagreements with Accountants on Accounting and Financial DisclosureItem 9A. Controls and ProceduresItem 9B. Other InformationPart IIIItem 10. Directors, Executive Officers and Corporate GovernanceItem 10. Directors, Executive Officers and Corporate Governance (continued)Item 11. Executive CompensationItem 12. Security Ownership Of Certain Beneficial Owners and Management and Related Stockholder MattersItem 13. Certain Relationships and Related Transactions, and Director IndependenceItem 14. Principal Accounting Fees and ServicesPart IVItem 15. Exhibits and Financial Statement SchedulesItem 15. Exhibits and Financial Statement Schedules (continued)Item 16. Form 10-k Summary