AUTOMATIC DATA PROCESSING INC
10-Ks and 10-Qs
|
|
|
|
|
|
|
|
|
|
|
|
|
|
|
|
|
|
|
|
|
|
|
|
|
|
|
|
|
|
|
|
|
|
|
|
|
|
|
|
|
|
|
|
|
|
|
|
|
|
|
|
|
|
|
|
|
|
|
|
|
|
UNITED STATES
SECURITIES AND EXCHANGE COMMISSION
Washington, D.C. 20549
FORM 10-K
|
[X]
|
ANNUAL REPORT PURSUANT TO SECTION 13 OR 15(d) OF THE
|
|
|
SECURITIES EXCHANGE ACT OF 1934
|
||
|
For the fiscal year ended June 30, 2014
|
||
|
OR
|
||
|
[ ]
|
TRANSITION REPORT PURSUANT TO SECTION 13 OR 15(d) OF THE
|
|
|
SECURITIES EXCHANGE ACT OF 1934
|
||
|
Commission File Number 1-5397
|
||
AUTOMATIC DATA PROCESSING, INC.
(Exact name of registrant as specified in its charter)
|
Delaware
|
22-1467904
|
|
(State or other jurisdiction of incorporation or organization)
|
(IRS Employer Identification No.)
|
|
One ADP Boulevard, Roseland, New Jersey
|
07068
|
|
(Address of principal executive offices)
|
(Zip Code)
|
|
Registrant's telephone number, including area code:
973-974-5000
|
|
|
Securities registered pursuant to Section 12(b) of the Act:
|
|
|
Title of each class
|
Name of each exchange on which registered
|
|
Common Stock, $0.10 Par Value
(voting)
|
NASDAQ Global Select Market
|
Securities registered pursuant to Section 12(g) of the Act:
None
Indicate by check mark if the Registrant is a well-known seasoned issuer, as defined in Rule 405 of the Securities Act. Yes [
x
] No [ ]
Indicate by check mark if the Registrant is not required to file reports pursuant to Section 13 or 15(d) of the Act. Yes [ ] No [
x
]
Indicate by check mark whether the Registrant (1) has filed all reports required to be filed by Section 13 or 15(d) of the Securities Exchange Act of 1934 during the preceding 12 months (or for such shorter period that the Registrant was required to file such reports), and (2) has been subject to the filing requirements for the past 90 days. Yes [
x
] No [ ]
Indicate by check mark whether the registrant has submitted electronically and posted on its corporate Web site, if any, every Interactive Data File required to be submitted and posted pursuant to Rule 405 of Regulation S-T (§232.405 of this chapter) during the preceding 12 months (or for such shorter period that the registrant was required to submit and post such files). Yes [
x
] No [ ]
Indicate by check mark if disclosure of delinquent filers pursuant to Item 405 of Regulation S-K (§229.405) is not contained herein and will not be contained, to the best of Registrant's knowledge, in definitive proxy or information statements incorporated by reference in Part III of this Form 10-K or any amendment to this Form 10-K. [
]
Indicate by check mark whether the Registrant is a large accelerated filer, an accelerated filer, a non-accelerated filer or a smaller reporting company. See the definitions of “large accelerated filer,” “accelerated filer” and “smaller reporting company” in Rule 12b-2 of the Exchange Act.
|
Large accelerated filer [
x
]
|
Accelerated filer [ ]
|
Non-accelerated filer [ ]
|
Smaller reporting company [ ]
|
Indicate by check mark whether the Registrant is a shell company (as defined in Rule 12b-2 of the Act). [ ] Yes [
x
] No
The aggregate market value of the voting and non-voting common equity held by non-affiliates of the Registrant as of the last business day of the Registrant's most recently completed second fiscal quarter was approximately
$38,838,719,941
. On
July 31, 2014
there were
480,912,107
shares of Common Stock outstanding.
DOCUMENTS INCORPORATED BY REFERENCE
|
Portions of the Registrant's Proxy Statement for its 2014 Annual Meeting of Stockholders.
|
Part III
|
Table of Contents
|
|
|
|
|
|
|
Page
|
|
Part I
|
||
|
Item 1.
|
Business
|
|
|
Item 1A.
|
Risk Factors
|
|
|
Item 1B.
|
Unresolved Staff Comments
|
|
|
Item 2.
|
Properties
|
|
|
Item 3.
|
Legal Proceedings
|
|
|
Part II
|
|
|
|
Item 5.
|
Market for Registrant's Common Equity, Related Stockholder Matters, and Issuer Purchases of Equity Securities
|
|
|
Item 6.
|
Selected Financial Data
|
|
|
Item 7.
|
Management's Discussion and Analysis of Financial Condition and Results of Operations
|
|
|
Item 7A.
|
Quantitative and Qualitative Disclosures About Market Risk
|
|
|
Item 8.
|
Financial Statements and Supplementary Data
|
|
|
Item 9.
|
Changes in and Disagreements with Accountants on Accounting and Financial Disclosure
|
|
|
Item 9A.
|
Controls and Procedures
|
|
|
Item 9B.
|
Other Information
|
|
|
Part III
|
||
|
Item 10.
|
Directors, Executive Officers and Corporate Governance
|
|
|
Item 11.
|
Executive Compensation
|
|
|
Item 12.
|
Security Ownership of Certain Beneficial Owners and Management and Related Stockholder Matters
|
|
|
Item 13.
|
Certain Relationships and Related Transactions, and Director Independence
|
|
|
Item 14.
|
Principal Accounting Fees and Services
|
|
|
Part IV.
|
||
|
Item 15.
|
Exhibits, Financial Statement Schedules
|
|
|
Signatures
|
||
2
CORPORATE BACKGROUND
General
ADP
®
was founded in 1949 on an innovative idea to help business owners focus on core business activities by relieving them from certain administrative tasks such as payroll. Automatic Data Processing, Inc. was incorporated in the State of Delaware in June 1961 and completed its initial public offering in September 1961. Today we are one of the world's leading providers of human capital management solutions to employers, as well as integrated computing solutions to vehicle dealers around the world. We offer solutions to businesses of all sizes, whether they have simple or complex needs, and serve approximately 637,000 clients in more than 125 countries. Our common stock is listed on the NASDAQ Global Select Market® under the symbol “ADP”.
When we refer to “we”, “us”, “our”, “ADP”, or the “Company” in this Annual Report on Form 10-K, we mean Automatic Data Processing, Inc. and its consolidated subsidiaries.
Available Information
Our corporate website,
www.adp.com
, provides materials for investors and information about our services. ADP's Annual Reports on Form 10-K, Quarterly Reports on Form 10-Q, Current Reports on Form 8-K, all amendments to those reports, and the Proxy Statement for our Annual Meeting of Stockholders are made available, free of charge, on our corporate website as soon as reasonably practicable after such reports have been filed with or furnished to the Securities and Exchange Commission (SEC) and are also available at the SEC's website at
www.sec.gov
. The content on any website referenced in this filing is not incorporated by reference into this filing unless expressly noted otherwise.
BUSINESS OVERVIEW
ADP's Mission and Strategy
For 65 years, ADP’s mission has been to help organizations unlock their business potential with our insightful solutions. Our commitment to service excellence lies at the core of our relationship with each of our clients, whether a small, midsized or large organization, in one or multiple countries. We innovate to deliver new products and services that anticipate client needs in all of our markets. We help businesses focus on and optimize the most important investment they make - their investment in their people. From recruitment to talent management to retirement, our unique combination of expertise and technology offers insights that help our clients leverage human capital management (HCM) to drive better business results. Our future success also depends on our recruiting, hiring, developing and retaining highly qualified, motivated and diverse talent. Predicated on these priorities, our business strategy is based upon the following three strategic pillars, which are designed to position ADP as the global market leader in HCM services:
|
•
|
grow our integrated suite of cloud-based HCM, benefits, and payroll solutions to serve the U.S. market;
|
|
•
|
invest to grow and scale our HR Business Process Outsourcing (BPO) solutions by leveraging our platforms and processes; and
|
|
•
|
leverage our global presence to offer clients HCM, benefits, and payroll solutions where they do business.
|
Reportable Segments
ADP's three reportable business segments are: Employer Services; Professional Employer Organization (PEO) Services; and Dealer Services. For financial data by segment and by geographic area, see Note 15 to the “Consolidated Financial Statements” contained in this Annual Report on Form 10-K.
On April 10, 2014, we announced that our Board of Directors approved a plan to separate our Dealer Services business into an independent publicly traded company through a tax-free spin-off of 100% of our Dealer Services business to ADP shareholders. The spin-off is subject to required regulatory approvals and reviews and we expect to complete the separation by October 2014. For more information on the spin-off of our Dealer Services business, see Note 2 to the “Consolidated Financial Statements” contained in this Annual Report on Form 10-K.
3
Employer Services
. Employer Services is our largest segment, with 36,000 associates in 35 countries. Employer Services offers a comprehensive range of business outsourcing and HCM solutions, including:
|
•
|
Payroll Services
|
|
•
|
Benefits Administration
|
|
•
|
Talent Management
|
|
•
|
Human Resources Management
|
|
•
|
Time and Attendance Management
|
|
•
|
Insurance Services
|
|
•
|
Retirement Services
|
|
•
|
Tax, Compliance and Payment Solutions
|
Employer Services’ approach to the market is to deliver solutions and services that best meet clients’ requirements. Employer Services serves clients ranging from small businesses with fewer than 50 employees to large enterprises with multinational operations.
Professional Employer Organization (PEO) Services
. ADP's PEO business, called ADP TotalSource®, provides approximately 7,800 clients with comprehensive employment administration outsourcing solutions through a co-employment relationship in which employees who work at a client's location (referred to as “worksite employees”) are co-employed by us and the client. ADP TotalSource is the largest PEO in the United States based on the number of worksite employees, serving approximately 340,000 worksite employees in all 50 states.
Dealer Services
. Dealer Services provides integrated dealer management systems, digital marketing/advertising solutions and other business management solutions to retailers, distributors and manufacturers of automobiles, minivans, sport utility vehicles, light and heavy trucks, construction equipment, agricultural equipment, motorcycles, boats and other marine vehicles and recreational vehicles. Dealer Services provides solutions to a diverse client base throughout the United States and in approximately 100 additional countries internationally, serving more than 26,000 automotive retailers and original equipment manufacturers.
PRODUCTS AND SERVICES
Employer Services
Human Capital Management (HCM).
In order to serve the unique needs of diverse types of businesses, ADP provides a range of solutions, via a software and service-based delivery model, which businesses of all sizes can use to recruit, staff, pay, manage, and retain employees. We serve more than 430,000 clients via ADP's software as a service (SaaS) offerings, commonly referred to as "the cloud." As a leader in the growing HR Business Process Outsourcing (BPO) market, we also offer fully integrated outsourcing solutions that enable our clients to outsource their HR, time and attendance management, payroll, and benefits administration functions to ADP. In addition, our mobile applications enable businesses to process their payroll, and gives more than 2.5 million of our clients' employees convenient access to their benefits, payroll, time and attendance and HR information, via multiple mobile device platforms.
Integrated HCM Solutions
.
Our premier suite of human capital management products offers integrated solutions to assist employers of all sizes in all stages of the employment cycle from recruitment to retirement:
|
•
|
RUN Powered by ADP® is used by more than 380,000 small businesses. It combines a software platform for managing small business payroll, human resources management and tax compliance administration, with 24/7 service and support from our team of small business experts. RUN Powered by ADP also integrates with other available ADP services, such as time and attendance tracking, workers compensation insurance premium payment plans, and certain retirement plans.
|
|
•
|
ADP Resource® is a comprehensive human resources management outsourcing solution for small businesses that offers payroll and tax administration, recruitment and selection, employee assistance, employee training programs, and risk management and safety programs. ADP Resource also integrates with other available ADP services, such as 401(k) plan administration services and workers compensation insurance premium payment plans.
|
|
•
|
ADP Workforce Now® is a flexible HCM solution used by more than 50,000 midsized businesses to manage their employees across more than 30 countries. In addition, ADP Workforce Now puts powerful mobile HR solutions
|
4
in the hands of client employees, and opens access to developers and system integrators through the platform’s Application Programming Interface (API) Library. More businesses use ADP Workforce Now than any other HCM solution designed for the midmarket today.
|
•
|
ADP Vantage HCM® is a solution for large enterprises with more than 1,000 employees. It offers a comprehensive set of human capital management capabilities within a single solution that unifies the five major areas of HCM: human resources management, benefits administration, payroll, time and attendance management, and talent management.
|
|
•
|
ADP GlobalView® and ADP Streamline® offer HCM solutions to multinational companies. GlobalView allows the largest multinational clients to standardize their HCM strategies across geographical regions, including multi-country payroll and human resources management, talent management, and time and attendance management. ADP Streamline® offers global payroll processing and human resources administration services to businesses with small and midsized operations in multiple countries. ADP GlobalView Select combines GlobalView and Streamline offerings into one integrated solution that allows a large multinational client to cover its multi-country payroll and other HCM needs across multiple countries covering the full range of its large, midsized and small operations.
|
Payroll Services.
ADP provides flexible payroll services to employers of all sizes, including the preparation of employee paychecks, pay statements, supporting journals, summaries, and management reports. ADP provides employers with a wide range of payroll options ranging from manually calling in their payroll to our specialists; entering their payroll data online with an internet-based solution or via a mobile device; or outsourcing their entire payroll process to ADP. ADP also enables its largest clients to interface their major enterprise resource planning (ERP) applications with ADP's outsourced payroll services. Employers can choose a variety of payroll payment options ranging from professionally printed checks to ADP's electronic wage payment and payroll card solutions. ADP also prepares and files federal, state and local payroll tax returns and quarterly and annual Social Security, Medicare, and federal, state and local income tax withholding reports on our clients' behalf. In addition, as part of our W-2 management services, ADP supplies year-end tax statements to our clients' employees. For those clients who choose to process payroll in-house, ADP also delivers our Tax, Compliance and Payment Solutions described below.
Benefits Administration
. ADP provides flexible solutions for outsourced employee benefits administration. Employee benefits administration options include health and welfare administration, spending account management (health care spending accounts, dependent care spending accounts, health reimbursement arrangements, health savings accounts, commuter benefits, and employee reimbursement services), COBRA administration, direct bill services, leave administration services, carrier enrollment services, employee communication services, and dependent verification services. In addition, ADP benefits administration solutions offer employers an efficient cloud-based eligibility and enrollment system. It provides their employees with tools, communications, and other resources they need to understand their benefits options and make informed choices. In addition, ADP provides tools and solutions to assist employers in meeting the demands of health care reform and their related employer responsibilities, as well as strategic insight into employer trends.
Talent Management
. ADP's Talent Management Solutions simplify the talent acquisition and performance management process from recruitment to ongoing employee development. ADP's proprietary recruiting automation platform helps employers find, recruit, and hire talent quickly and cost effectively. Employers can also meet their hiring needs by outsourcing their internal recruitment function to ADP. ADP's pre-employment services enable employers to track candidates, screen candidate backgrounds, and integrate data to facilitate the onboarding process for new hires. ADP's performance and compensation management applications provide tools to automate the entire performance management process from goal planning to employee evaluations and help employers align compensation with employee performance within budgetary constraints. Integrated with ADP's performance management applications, ADP's career development and succession management solutions offer tools that allow employees to build and update their employee profiles, search for potential positions within the organization, and create-forward looking career paths, while enabling managers to identify and mitigate potential retention risks. In addition, ADP's learning management solutions provide a single point of access to learning and knowledge management capabilities via multiple online delivery methods.
Human Resources Management
. Commonly referred to as Human Resource Information Systems (HRIS), ADP's Human Resources Management Solutions provide employers with a single source of record to support the entry, validation, maintenance, and reporting of data required for effective HR management, such as employee names, addresses, job types, salary grades, employment history, and educational background. ADP's Human Resources Management Solutions can also be integrated with ADP's Talent Management Solutions and other HCM offerings.
5
Time and Attendance Management
. ADP offers multiple options for employers of all sizes to collect employee time and attendance information, including electronic timesheets, badge cards, biometric and touch screen time clocks, telephone/interactive voice response, and mobile smartphones and tablets. ADP's time and attendance tracking tools simplify employee scheduling and automate the calculation and reporting of hours worked, helping employers enforce leave and attendance policies more consistently, control overtime, and manage compliance with wage and hour regulations.
Insurance Services
. ADP Insurance Services, in conjunction with our licensed insurance agency, Automatic Data Processing Insurance Agency, Inc., facilitates access to workers compensation and group health insurance for small and midsized clients through a variety of insurance carriers. ADP's automated Pay-by-Pay
®
premium payment program calculates and collects workers' compensation premium payments each pay period.
Retirement Services
. ADP Retirement Services helps employers administer various types of retirement plans, such as 401(k) (including “safe harbor” 401(k) and Roth 401(k)), profit sharing (including new comparability), SIMPLE IRA, and executive deferred compensation plans. ADP Retirement Services offers a full service 401(k) plan program, which provides recordkeeping and administrative services, combined with an investment platform offered through ADP Broker-Dealer, Inc. that gives our clients' employees access to a wide range of non-proprietary investment options and online tools to monitor the performance of their investments. ADP Retirement Services also offers trustee services through a third party.
Tax, Compliance and Payment Solutions
Employment Tax Services
. As part of ADP's employment tax services, ADP prepares and files employment tax returns on our clients' behalf with federal, state, and local tax agencies. In connection with these services, ADP collects federal, state, and local employment taxes from clients and remits these taxes to the appropriate taxing agencies via an electronic interface with over 7,000 federal, state, and local tax agencies in the United States. ADP also responds to inquiries from tax agencies and assists with filing tax protests on the clients' behalf. In addition to our full service payroll tax solution, ADP offers a software solution for do-it-yourself employment tax management that can complement a client's in-house payroll system. In our fiscal year ended
June 30, 2014
(“fiscal
2014
”), ADP in the United States processed and delivered approximately 53 million employee year-end tax statements and approximately 44 million employer payroll tax returns and deposits, and moved approximately $1.5 trillion in client funds to taxing agencies and our clients' employees via electronic transfer, direct deposit, and ADPCheck
TM
.
Tax Credits Services
. ADP Tax Credits Services helps clients take advantage of tax credit opportunities as they hire new employees, including federal, state, and local tax credits based on geography, demographics, and other criteria such as work opportunity tax credits, federal empowerment zone employment credits, economic development incentives, training grants, and many other incentives. Integrating the entire process with clients' existing hiring programs, ADP Tax Credits Services helps clients screen job applicants and process eligibility forms, monitor and manage screening and form compliance, submit forms to state agencies for tax credit certification, calculate credits, and produce a detailed audit trail.
Wage Garnishment Services
. ADP offers an integrated solution to help our clients manage the wage garnishment process through integration with the client's payroll system. As part of this comprehensive service, ADP also helps process required correspondence to payee agencies, lien processing and order evaluation, and notices. ADP's wage garnishment services also includes a call center to field garnishment-related inquiries from employees, payees, and other third parties.
Unemployment Claims Management
. ADP offers a single-source solution to help manage the entire unemployment claims process, including pre-separation planning, claim protests and administration, appeal processing, hearing representation, and audits of benefit charges.
Wage Payment and Pay Card Solutions
. In addition to ADPCheck, ADP's traditional payroll check offering, ADP offers electronic payroll disbursement options that can be integrated with the client's payroll systems and ERP applications. With ALINE Pay by ADP®, payroll can be disbursed via ALINE Check by ADP®, direct deposit, or the ALINE Card by ADP®, a network-branded payroll card. ALINE Check provides employees with an independent and convenient self-issued means to receive wages that includes the standard features available with a traditionally-issued payroll check. Using the ALINE Card, employees can access their payroll funds immediately in several ways, including via a network member bank or an ATM or point of sale terminal. The ALINE Card can also be used to make purchases or pay bills. Additional features of the ALINE Card include the ability to load additional funds onto the card, receive electronic payments such as government benefits or tax refunds, and transfer funds from the card to a U.S. bank account.
6
Professional Employer Organization (PEO) Services' Products and Services
ADP TotalSource®, ADP's PEO business, offers small and midsized businesses a comprehensive human resources outsourcing solution through a co-employment model. As a PEO, ADP TotalSource provides integrated human resources management services while the client continues to direct the day-to-day job-related duties of the employees. ADP TotalSource integrates key HR management and employee benefits functions, including HR administration, employee benefits, and employer liability management, into a single-source solution:
HR Administration.
ADP TotalSource offers a variety of comprehensive, integrated HR administration services, such as:
|
•
|
employee recruitment and selection
|
|
•
|
payroll and tax administration
|
|
•
|
time and attendance management
|
|
•
|
benefits administration
|
|
•
|
employee training and development
|
|
•
|
online HR management tools
|
|
•
|
employee leave administration
|
Employee Benefits
. Through the co-employment model, ADP TotalSource provides eligible worksite employees with access to:
|
•
|
group health, dental and vision coverage
|
|
•
|
a 401(k) retirement savings plan
|
|
•
|
health savings accounts
|
|
•
|
flexible spending accounts
|
|
•
|
group term life and disability coverage
|
|
•
|
an employee assistance program
|
Employer Liability Management.
ADP TotalSource helps clients manage and limit employment related risks and related costs by providing:
|
•
|
a workers' compensation program
|
|
•
|
unemployment claims management
|
|
•
|
safety compliance guidance and access to safety training
|
|
•
|
access to employment practices liability insurance
|
|
•
|
guidance on compliance with federal, state and local employment laws and regulations
|
ADP TotalSource's scale allows us to deliver a variety of benefits and services with efficiency and value typically out of reach to small and midsized businesses. ADP TotalSource is the largest PEO in the United States based on the number of worksite employees. ADP TotalSource has 59 offices located in 29 states and serves approximately 7,800 clients and an aggregate of approximately 340,000 worksite employees in all 50 states.
Dealer Services
Dealer Management Systems and Other Retail Solutions
. Dealer Services' Dealer Management Systems (DMS) offer enterprise technology solutions that provide an integrated suite of features and services that enable our clients to manage their information systems and process workflows involved in running automotive retail operations. DMS solutions are available as “on-site” applications installed at the retail location or as managed services solutions in which clients access ADP's DMS solutions through a cloud-based IT environment managed by ADP. The DMS accounting modules help clients manage all standard accounting procedures, including general ledger, receivables and balance sheet maintenance. The DMS service and parts modules enable automation of client operations such as service and repair order processing, purchase orders and parts ordering. The DMS sales and finance and insurance (F&I) modules facilitate clients' ability to manage customer inquiries, develop, analyze, present, and consummate transactions with customers, manage and print the forms needed to consummate such transactions, and track funds. Dealer Services also offers a full range of additional solutions that address every department and functional area of the dealership, including customer relationship management (CRM) applications, vehicle inventory and lot management solutions, and telephone systems. These additional solutions are typically fully integrated with the DMS.
7
Digital Marketing Solutions
. Dealer Services provides digital marketing solutions under the Cobalt® brand, which ADP acquired in 2010. Cobalt digital marketing/advertising solutions and services include dealership websites, sales leads, email marketing, search and display advertising, and social media marketing and management services. These solutions are sold both as retail network marketing programs in conjunction with the manufacturers of ten leading automotive brands, as well as directly to automobile dealerships and regional dealer associations. Dealer Services' digital marketing solutions allow dealerships and original equipment manufacturers to connect with customers and manage their brands.
Network Management Solutions
. Dealer Services designs, establishes, and maintains communications network solutions for its dealership clients that allow interactive communications among multiple site dealerships and connect franchised dealers with their vehicle manufacturer franchisors. These networks are used for activities such as new vehicle ordering and status inquiry, warranty submission and validation, parts and vehicle location, dealership customer credit application submission and decision-making, vehicle repair estimation, and acquisition of vehicle registration and lien holder information. Dealer Services' network solutions also include integrated IP telephony systems, wired and wireless network access solutions, and security management applications.
Training Services
. Dealer Services offers comprehensive training and business process consulting services for many of its business solutions via multiple delivery methods. Task-specific internet-based courses are fully automated and available 24 hours a day. Dealer Services also provides interactive instructor-led training via internet-based sessions or live classroom courses that are customized to meet our clients' specific needs.
MARKETS AND MARKETING METHODS
Employer Services offers its products and services in the United States and other countries. In fiscal
2014
, 79% of Employer Services' revenues were from the United States, 14% were from Europe, 4% were from Canada, and 3% were from South America, Australia, and Asia. ADP GlobalView is available to the largest multinational clients in 41 different countries and ADP Streamline is available to clients with small and midsized operations in 100 different countries. In addition, Employer Services offers in-country payroll and human resources outsourcing solutions to both small and large clients in 33 countries. In Canada, we are a leading provider of payroll processing (including full departmental outsourcing) and human resource administration services. Within Europe, we have business operations supporting our in-country solutions in France, Germany, Italy, the Netherlands, Poland, Spain, Switzerland, and the United Kingdom. We also offer payroll outsourcing services as well as HCM solutions in South America (in Brazil, Chile, Argentina, and Peru), China, India, and Australia. We offer wage and tax collection and remittance services in Canada, the United Kingdom, the Netherlands, and France. PEO Services offers services exclusively in the United States.
Dealer Services primarily serves automobile dealerships, which in turn may be dependent on a relatively small number of automobile manufacturers, but also serves truck, powersports (i.e., motorcycle, marine, and RV) and heavy equipment dealers, auto repair shops, used car lots, state departments of motor vehicles, vehicle manufacturers, and vehicle distributors. Dealer Services has offerings in 100 countries across North America, Europe, Africa, the Middle East, and the Asia Pacific region.
We market our products and services primarily through our direct sales force. Employer Services also markets its solutions through indirect sales channels, such as marketing relationships with banks and accountants, among others. In addition, Dealer Services uses distributors to sell, implement and support its solutions in select emerging markets. None of ADP's major business groups has a single homogenous client base or market. While concentrations of clients exist in specific industries, no one client or industry group is material to ADP's overall revenues. ADP enjoys a leadership position in each of its major service offerings and does not believe any major service or major business unit of ADP is subject to unique market risk.
COMPETITION
The industries in which ADP operates are highly competitive. ADP knows of no reliable statistics by which it can determine the number of its competitors, but it believes that it is one of the largest providers of business outsourcing solutions in the world. Employer Services and PEO Services compete with other independent business outsourcing companies, companies providing enterprise resource planning services, software companies and financial institutions. In addition, another competitive factor in the industries in which Employer Services and PEO Services operate is a company's use of third party software applications or a captive in-house function, whereby a company installs and operates its own business processing systems. Dealer Services' competitors include full service DMS providers, such as The Reynolds & Reynolds Company (Dealer Services' largest DMS competitor in the United States and Canada), Dealertrack Technologies, Inc., and companies providing applications and services that compete with Dealer Services' non-DMS applications and services, such as Auto Trader Group, Inc. and Dealer.com, Inc.
8
INDUSTRY REGULATION
Our business is subject to a wide range of complex laws and regulations. In addition, many of our products and services are designed to assist clients with their compliance with certain laws and regulations to which they are subject. We have developed and continue to enhance compliance programs and policies to monitor and address the legal and regulatory requirements applicable to our products, services, and operations, including dedicated compliance personnel and training programs.
As one of the world's largest providers of business outsourcing solutions, our systems contain a significant amount of both sensitive client data and data related to employees of our clients. We are, therefore, subject to compliance obligations under both federal and state privacy and data security-related laws, including, with respect to some of our businesses such as our COBRA, flexible spending account and insurance services businesses, ADP AdvancedMD® and ADP TotalSource®, the Health Insurance Portability and Accountability Act of 1996. We are also subject to federal and state security breach notification laws with respect to both our own employee data and client employee data. Additionally, the changing nature of privacy laws in the United States, the European Union and elsewhere could impact our processing of personal information of our employees and on behalf of our clients.
As part of our payroll and payroll tax management services, we move client funds to taxing authorities and our clients' employees via electronic transfer, direct deposit, and ADPCheck. Certain elements of our U.S. money transmission activities, including our electronic payment and prepaid access (payroll pay card) offerings, are subject to certain licensing requirements. Elements of our money transmission activities outside of the United States are subject to similar laws and requirements in the countries in which we offer such services. In addition, our U.S. prepaid access (payroll card) offering is subject to the anti-money laundering and reporting provisions of the Bank Secrecy Act. Our employee screening and selection services business offers background checking services that are subject to the Fair Credit Reporting Act. Our PEO business (ADP TotalSource) is subject to various state licensing requirements. In addition, because ADP TotalSource is a co-employer with respect to its clients' worksite employees, we may assume certain obligations and responsibilities of an employer under federal and state tax, insurance and employment laws.
In addition, many of our businesses offer products and services that assist our clients in complying with certain laws and regulations to which they are subject; although the laws and regulations apply to our clients and not to ADP, changes in such laws or regulations may affect our operations, products and services. For example, our HCM solutions help clients manage their compliance with certain requirements of the Patient Protection and Affordable Care Act. Our COBRA administration services and flexible spending account services are designed to comply with relevant federal guidelines relating to, respectively, employers' benefits continuation obligations and the requirements of Section 125 of the Internal Revenue Code. Similarly, our Tax Credits Services business, which helps clients take advantage of tax credit opportunities as they hire new employees, is based on federal, state, or local tax laws and regulations allowing for tax credits.
The foregoing description does not include an exhaustive list of the laws and regulations governing and impacting our business. See the discussion contained in the "Risk Factors" section in Part I, Item 1A of this Annual Report on Form 10-K for information regarding changes in laws and regulations that may decrease our revenues and earnings.
CLIENTS AND CLIENT CONTRACTS
ADP provides its services to approximately 637,000 clients. In fiscal
2014
, no single client or group of affiliated clients accounted for revenues in excess of 2% of annual consolidated revenues.
ADP is continuously in the process of performing implementation services for new clients. Depending on the service agreement and/or the size of the client, the installation or conversion period for new clients could vary from a short period of time for a small Employer Services client (as little as 24 hours) to a longer period for a large Employer Services client or a Dealer Services client with multiple deliverables (generally six to twelve months), and in some cases may exceed two years for a large GlobalView client or other large, complicated implementation. Although we monitor sales that have not yet been billed or installed, we do not view this metric as material in light of the recurring nature of our business. This is not a reported number, but it is used by management as a planning tool relating to resources needed to install services, and a means of assessing our performance against the installation timing expectations of our clients.
Our business is typically characterized by long-term client relationships that result in recurring revenue. Our services are provided under written price quotations or service agreements having varying terms and conditions. No one price quotation or service agreement is material to ADP. ADP's client retention is estimated at approximately 12 years in Employer Services, approximately 7 years in PEO Services, and approximately 12 years in Dealer Services, and has not varied significantly from period to period.
9
SYSTEMS DEVELOPMENT AND PROGRAMMING
During the fiscal years ended June 30,
2014
,
2013
, and
2012
, ADP invested approximately $834 million, $757 million, and $699 million, respectively, from continuing operations, in systems development and programming, migration to new computing technologies and the development of new products and maintenance of our existing technologies, including purchases of new software and software licenses.
PRODUCT DEVELOPMENT
ADP continually upgrades, enhances, and expands its existing solutions and services. Generally, no new solution or service has a significant effect on ADP's revenues or negatively impacts its existing solutions and services, and ADP's solutions and services have significant remaining life cycles.
LICENSES
ADP is the licensee under a number of agreements for computer programs and databases. ADP's business is not dependent upon a single license or group of licenses. Third-party licenses, patents, trademarks, and franchises are not material to ADP's business as a whole.
NUMBER OF EMPLOYEES
ADP employed approximately 61,000 persons as of
June 30, 2014
.
10
Our businesses routinely encounter and address risks, some of which may cause our future results to be different than we currently anticipate. Risk factors described below represent our current view of some of the most important risks facing our businesses and are important to understanding our business. The following information should be read in conjunction with Management's Discussion and Analysis of Financial Condition and Results of Operations, Quantitative and Qualitative Disclosures About Market Risk and the consolidated financial statements and related notes included in this Annual Report on Form 10-K. This discussion includes a number of forward-looking statements. You should refer to the description of the qualifications and limitations on forward-looking statements in the first paragraph under Management's Discussion and Analysis of Financial Condition and Results of Operations included in this Annual Report on Form 10-K. The level of importance of each of the following risks may vary from time to time, and any of these risks may have a material effect on our business.
Changes in laws and regulations may decrease our revenues and earnings
Our business is subject to a wide range of complex laws and regulations. Changes in laws or governmental regulations, or changes in the interpretation of existing laws or regulations by a regulatory authority, may decrease our revenues and earnings and may require us to change the manner in which we conduct some aspects of our business. For example, a change in regulations either decreasing the amount of taxes to be withheld or allowing less time to remit taxes to government authorities would adversely impact interest income from investing client funds before such funds are remitted to the applicable taxing authorities or client employees. Changes in taxation requirements in the United States or in other countries could adversely affect our effective tax rate and our net income. Changes in laws that govern the co-employment arrangement between a professional employer organization and its worksite employees may require us to change the manner in which we conduct some aspects of our PEO business. Health care reform under the Affordable Care Act, as amended, related state laws, and the regulations adopted or to be adopted thereunder, have the potential to impact substantially the way that employers provide health insurance to employees and the health insurance market for the small and midsized businesses that comprise ADP TotalSource's clients and prospects. We are unable to determine the ultimate impact that health care reform will have on our PEO business and our ability to attract and retain PEO clients. Amendments to money transmitter statutes have required us to receive licenses in some jurisdictions, and the adoption of new money transmitter statutes in other jurisdictions, as well as changes in the interpretation of existing statutes, in the future could require additional registration or licensing, as well as possible changes to the manner in which we conduct some aspects of our money movement business or our client funds investment strategy.
Our businesses host, collect, use and store personal information about our clients and employees of our clients, and a security or privacy breach may damage or disrupt our businesses, result in the disclosure of confidential information, damage our reputation, increase our costs and cause losses
A number of our businesses host, collect, use and store large amounts of personal information about our clients and employees of our clients, including payroll information, healthcare information, personal and business financial data, social security numbers, bank account numbers, tax information and other sensitive personal and business information. In addition, we collect and maintain personal information of our employees in the ordinary course of our business. We are focused on ensuring our operating environments safeguard and protect personal and business information, and although we believe that we maintain a robust program of information security and controls and none of the threats that we have encountered to date have materially impacted us, the impact of a breach could have a material adverse effect on our business, results of operations and financial condition.
We are also subject to various laws, rules and regulations relating to the collection, use and security of personal and business information. The future enactment of more restrictive laws, rules or regulations could have an adverse impact on us through increased costs or restrictions on our businesses. In addition, the possession and use of personal information and data in conducting our business subjects us to laws that may require notification to clients or employees of a privacy breach.
Globally, attacks on information technology systems continue to grow in frequency, complexity and sophistication. Although this is a global problem, it may affect our businesses more than other businesses because malevolent third parties may focus on the amount and type of personal and business information that our businesses host, collect, use and store. Any cyber attack, unauthorized intrusion, malicious software infiltration, network disruption, denial of service, corruption of data, or theft of non-public or other sensitive information, or similar act by a malevolent party could create financial liability, regulatory sanction, or a loss of confidence in our ability to serve clients or cause current or potential clients to choose another service provider. As these threats continue to evolve, we may be required to invest significant additional resources to modify and enhance our information security and controls or to investigate and remediate any security vulnerabilities. In addition, while our operating environment is designed to safeguard and protect personal and business information, we do not have the ability to
11
monitor the implementation of similar safeguards by our clients, vendors or their respective employees, and, in any event, third parties may be able to circumvent those security measures.
Our systems may be subject to disruptions that could adversely affect our business and reputation
Many of our businesses are highly dependent on our ability to process, on a daily basis, a large number of complicated transactions. We rely heavily on our payroll, financial, accounting, and other data processing systems. If any of these systems fails to operate properly or becomes disabled even for a brief period of time, we could suffer financial loss, a disruption of our businesses, liability to clients, regulatory intervention, or damage to our reputation. We have disaster recovery, business continuity, and crisis management plans and procedures designed to protect our businesses against a multitude of events including natural disasters, military or terrorist actions, power or communication failures, or similar events. Despite our preparations, our plans may not be successful in preventing the loss of client data, service interruptions, disruptions to our operations, or damage to our important facilities.
If we fail to adapt our technology to meet client needs and preferences, the demand for our services may diminish
Our businesses operate in industries that are subject to rapid technological advances and changing client needs and preferences. In order to remain competitive and responsive to client demands, we continually upgrade, enhance, and expand our existing solutions and services. If we fail to respond successfully to technology challenges, the demand for our services may diminish.
Political and economic factors may adversely affect our business and financial results
Trade, monetary and fiscal policies, and political and economic conditions may substantially change, and credit markets may experience periods of constriction and volatility. When there is a slowdown in the economy, employment levels and interest rates may decrease with a corresponding impact on our businesses. Clients may react to worsening conditions by reducing their spending on payroll and other outsourcing services or renegotiating their contracts with us. In addition, a reduction in availability of financing during such conditions, even to borrowers with the highest credit ratings, may limit our access to short-term debt markets to meet liquidity needs required by our Employer Services business.
We invest our client funds in liquid, investment-grade marketable securities, money market securities, and other cash equivalents. Nevertheless, our client fund assets are subject to general market, interest rate, credit, and liquidity risks. These risks may be exacerbated, individually or in unison, during periods of unusual financial market volatility.
We are dependent upon various large banks to execute Automated Clearing House and wire transfers as part of our client payroll and tax services. While we have contingency plans in place for bank failures, a systemic shutdown of the banking industry would impede our ability to process funds on behalf of our payroll and tax services clients and could have an adverse impact on our financial results and liquidity.
We derive a significant portion of our revenues and operating income outside of the United States and, as a result, we are exposed to market risk from changes in foreign currency exchange rates that could impact our consolidated results of operations, financial position or cash flows.
Change in our credit ratings could adversely impact our operations and lower our profitability
The major credit rating agencies periodically evaluate our creditworthiness and have given us very strong long-term debt and the highest commercial paper ratings. Failure to maintain high credit ratings on long-term and short-term debt could increase our cost of borrowing, reduce our ability to obtain intra-day borrowing required by our Employer Services business, and ultimately reduce our client interest revenue.
Our proposed spin-off of our Dealer Services business is subject to inherent risks
The proposed spin-off of our Dealer Services business is subject to inherent risks and uncertainties including, among others: risks that the spin-off will not be consummated; increased demands on our management team to accomplish the spin-off; and significant transaction costs and risks from changes in the results of operations of our reportable segments.
We may be unable to attract and retain qualified personnel
Our ability to grow and provide our clients with competitive services is partially dependent on our ability to attract and retain highly motivated people with the skills to serve our clients. Competition for skilled employees in the outsourcing and other markets in which we operate is intense and, if we are unable to attract and retain highly skilled and motivated personnel, results of our operations may suffer.
None.
12
ADP owns 12 of its processing/print centers, and 24 other operational offices, sales offices, and its corporate headquarters in Roseland, New Jersey, which aggregate approximately 3,705,397 square feet. None of ADP's owned facilities is subject to any material encumbrances. ADP leases space for some of its processing centers, other operational offices, and sales offices. All of these leases, which aggregate approximately 6,062,311 square feet in North America, Europe, South America, Asia, Australia and Africa, expire at various times up to the year 2024. ADP believes its facilities are currently adequate for their intended purposes and are adequately maintained.
In the normal course of business, ADP is subject to various claims and litigation. While the outcome of any litigation is inherently unpredictable, ADP believes that it has valid defenses with respect to the legal matters pending against it and that the ultimate resolution of these matters will not have a material adverse impact on its financial condition, results of operations, or cash flows.
13
Market for Registrant's Common Equity
The principal market for the Company's common stock is the NASDAQ Global Select Market under the symbol ADP. The following table sets forth the reported high and low sales prices of the Company's common stock reported on the NASDAQ Global Select Market and the cash dividends per share of common stock declared during each quarter for the two most recent fiscal years. As of
June 30, 2014
, there were 45,497 holders of record of the Company's common stock. As of such date, 509,052 additional holders held their common stock in “street name.”
|
Price Per Share
|
Dividends
|
||||
|
High
|
|
Low
|
|
Per Share
|
|
|
Fiscal 2014 quarter ended
|
|||||
|
|
|||||
|
June 30
|
$80.37
|
$73.38
|
$0.480
|
||
|
March 31
|
$83.00
|
$71.91
|
$0.480
|
||
|
December 31
|
$83.82
|
$69.91
|
$0.480
|
||
|
September 30
|
$74.95
|
$68.75
|
$0.435
|
||
|
|
|||||
|
Fiscal 2013 quarter ended
|
|||||
|
|
|||||
|
June 30
|
$72.00
|
$63.30
|
$0.435
|
||
|
March 31
|
$65.12
|
$57.75
|
$0.435
|
||
|
December 31
|
$59.96
|
$54.02
|
$0.435
|
||
|
September 30
|
$59.50
|
$54.85
|
$0.395
|
||
Issuer Purchases of Equity Securities
|
Period
|
Total Number of Shares Purchased (1)
|
Average Price Paid per Share
|
Total Number of Shares Purchased as Part of the Publicly Announced Common Stock Repurchase Plan (2)
|
Maximum Number of Shares that may yet be Purchased under the Common Stock Repurchase Plan (2) (3)
|
|
April 1, 2014 to
April 30, 2014
|
180
|
$77.37
|
—
|
18,351,660
|
|
May 1, 2014 to
May 31, 2014
|
1,402,889
|
$78.19
|
1,400,000
|
16,951,660
|
|
June 1, 2014 to
June 30, 2014
|
1,462,568
|
$79.00
|
1,462,052
|
15,489,608
|
|
Total
|
2,865,637
|
2,862,052
|
||
|
(1)
|
|
Pursuant to the terms of the Company's restricted stock program, the Company purchased 3,585 shares at the then market value of the shares in connection with the exercise by employees of their option under such program to satisfy certain tax withholding requirements through the delivery of shares to the Company instead of cash.
|
|
|
||
|
(2)
|
The Company received the Board of Directors' approval to repurchase shares of the Company's common stock as follows:
|
|
14
|
Date of Approval
|
Shares
|
|
|
March 2001
|
50 million
|
|
|
November 2002
|
35 million
|
|
|
November 2005
|
50 million
|
|
|
August 2006
|
50 million
|
|
|
August 2008
|
50 million
|
|
|
June 2011
|
35 million
|
|
|
August 2014
|
30 million
|
|
There is no expiration date for the common stock repurchase plan.
|
(3)
|
In August 2014, the Company received the Board of Directors' approval to repurchase an additional 30 million shares of the Company common stock. This additional authorization is not reflected in the table as it occurred subsequent to June 30, 2014.
|
|
Performance Graph
The following graph compares the cumulative return on the Company's common stock for the most recent five years with the cumulative return on the S&P 500 Index and a Peer Group Index, assuming an initial investment of $100 on June 30, 2009, with all dividends reinvested.
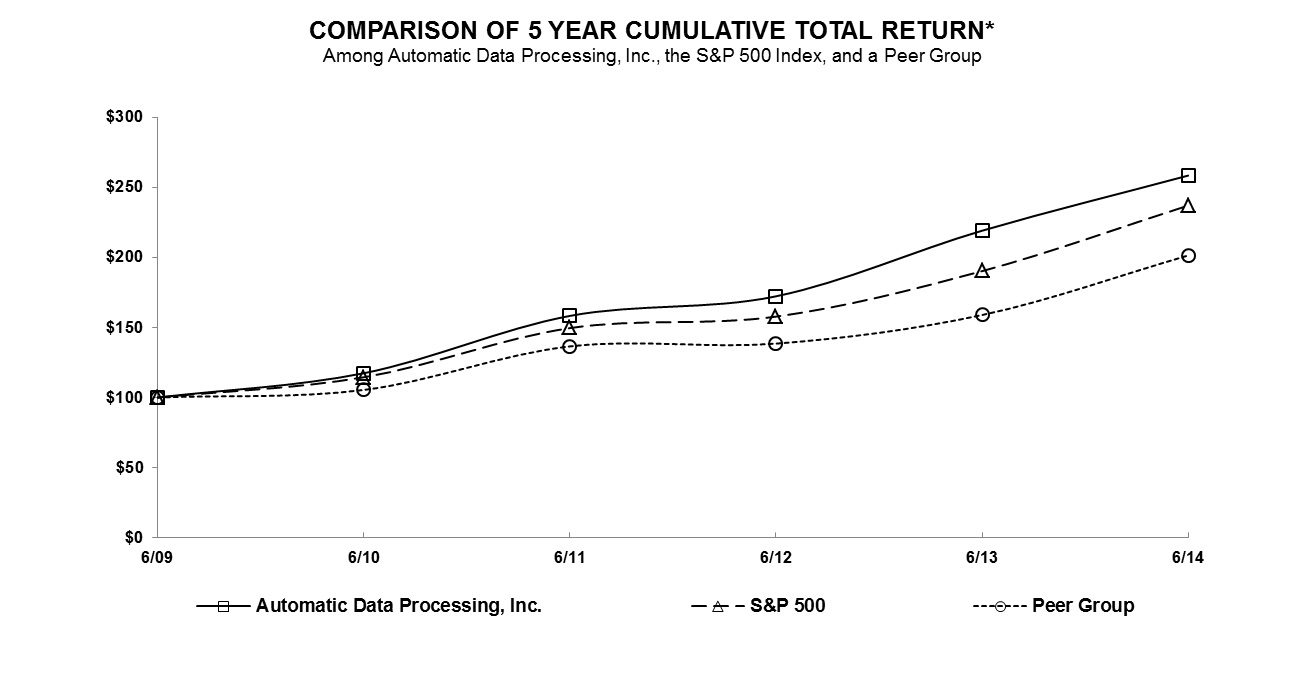
* The Peer Group Index is comprised of the following companies:
|
Insperity, Inc.
|
|
Paychex, Inc.
|
|
Computer Sciences Corporation
|
The Ultimate Software Group, Inc.
|
|
|
Global Payments Inc.
|
Total System Services, Inc.
|
|
|
Intuit Inc.
|
The Western Union Company
|
|
15
The following selected financial data is derived from our consolidated financial statements and should be read in conjunction with the consolidated financial statements and related notes, Management's Discussion and Analysis of Financial Condition and Results of Operations, and Quantitative and Qualitative Disclosures About Market Risk included in this Annual Report on Form 10-K. Prior period amounts have been adjusted to exclude discontinued operations.
|
(Dollars and shares in millions, except per share amounts)
|
||||||||||||||||||||
|
Years ended June 30,
|
2014
|
2013
|
2012
|
2011
|
2010
|
|||||||||||||||
|
Total revenues
|
$
|
12,206.5
|
|
$
|
11,287.6
|
|
$
|
10,595.4
|
|
$
|
9,813.9
|
|
$
|
8,863.8
|
|
|||||
|
Total costs of revenues
|
$
|
7,221.4
|
|
$
|
6,638.5
|
|
$
|
6,203.9
|
|
$
|
5,698.6
|
|
$
|
4,991.0
|
|
|||||
|
Gross profit
|
$
|
4,985.1
|
|
$
|
4,649.1
|
|
$
|
4,391.5
|
|
$
|
4,115.3
|
|
$
|
3,872.8
|
|
|||||
|
Earnings from continuing operations before income taxes
|
$
|
2,274.6
|
|
$
|
2,076.1
|
|
$
|
2,101.7
|
|
$
|
1,912.1
|
|
$
|
1,850.2
|
|
|||||
|
Adjusted earnings from continuing operations before income taxes (Note 1)
|
$
|
2,289.5
|
|
$
|
2,118.8
|
|
$
|
2,035.7
|
|
$
|
1,912.1
|
|
$
|
1,850.2
|
|
|||||
|
Net earnings from continuing operations
|
$
|
1,502.6
|
|
$
|
1,358.1
|
|
$
|
1,375.2
|
|
$
|
1,241.0
|
|
$
|
1,198.6
|
|
|||||
|
Adjusted net earnings from continuing operations (Note 1)
|
$
|
1,517.5
|
|
$
|
1,400.8
|
|
$
|
1,334.0
|
|
$
|
1,241.0
|
|
$
|
1,186.4
|
|
|||||
|
Basic earnings per share from continuing operations
|
$
|
3.14
|
|
$
|
2.81
|
|
$
|
2.82
|
|
$
|
2.51
|
|
$
|
2.39
|
|
|||||
|
Diluted earnings per share from continuing operations
|
$
|
3.11
|
|
$
|
2.79
|
|
$
|
2.79
|
|
$
|
2.49
|
|
$
|
2.38
|
|
|||||
|
Adjusted diluted earnings per share from continuing operations (Note 1)
|
$
|
3.14
|
|
$
|
2.88
|
|
$
|
2.71
|
|
$
|
2.49
|
|
$
|
2.36
|
|
|||||
|
Basic weighted average shares outstanding
|
478.9
|
|
482.7
|
|
487.3
|
|
493.5
|
|
500.5
|
|
||||||||||
|
Diluted weighted average shares outstanding
|
483.1
|
|
487.1
|
|
492.2
|
|
498.3
|
|
503.7
|
|
||||||||||
|
Cash dividends declared per share
|
$
|
1.88
|
|
$
|
1.70
|
|
$
|
1.55
|
|
$
|
1.42
|
|
$
|
1.35
|
|
|||||
|
Return on equity ("ROE") from continuing operations (Note 2)
|
23.4
|
%
|
22.1
|
%
|
22.7
|
%
|
21.6
|
%
|
22.2
|
%
|
||||||||||
|
At year end:
|
||||||||||||||||||||
|
Cash, cash equivalents and marketable securities
|
$
|
4,069.9
|
|
$
|
2,041.1
|
|
$
|
1,665.4
|
|
$
|
1,523.7
|
|
$
|
1,775.5
|
|
|||||
|
Total assets of continuing operations
|
$
|
32,051.7
|
|
$
|
32,251.4
|
|
$
|
30,673.6
|
|
$
|
34,088.4
|
|
$
|
26,709.5
|
|
|||||
|
Obligations under reverse repurchase agreements
|
$
|
—
|
|
$
|
245.9
|
|
$
|
—
|
|
$
|
—
|
|
$
|
—
|
|
|||||
|
Obligation under commercial paper borrowings
|
$
|
2,173.0
|
|
$
|
—
|
|
$
|
—
|
|
$
|
—
|
|
$
|
—
|
|
|||||
|
Long-term debt
|
$
|
11.5
|
|
$
|
14.7
|
|
$
|
16.8
|
|
$
|
34.2
|
|
$
|
39.8
|
|
|||||
|
Stockholders’ equity
|
$
|
6,670.2
|
|
$
|
6,189.9
|
|
$
|
6,114.0
|
|
$
|
6,010.4
|
|
$
|
5,478.9
|
|
|||||
The following table reconciles results within our Selected Financial Data to adjusted results that exclude incremental costs incurred during the fiscal year ended June 30, 2014 ("fiscal 2014") that are directly attributable to the planned separation of our Dealer Services business, a goodwill impairment charge related to our ADP AdvancedMD business for the fiscal year ended June 30, 2013 ("fiscal 2013"), a gain on the sale of assets related to rights and obligations to resell a third-party expense management platform for the fiscal year ended June 30, 2012 ("fiscal 2012"), and certain favorable tax items for the fiscal year ended June 30, 2010. We use certain adjusted results, among other measures, to evaluate our operating performance in the absence of certain items and for planning and forecasting of future periods. We believe that the adjusted results provide relevant and useful information for investors because it allows investors to view performance in a manner similar to the method used by us and improves our ability to understand our operating performance. Since adjusted earnings from continuing operations before income taxes, adjusted net earnings from continuing operations, and adjusted diluted earnings per share (“EPS”) from continuing operations are not measures of performance calculated in accordance with accounting principles generally accepted in the United States of America (“U.S. GAAP”), they should not be considered in isolation from, or as a substitute for, earnings from continuing operations before income taxes, net earnings from continuing operations, and diluted EPS from continuing operations, and they may not be comparable to similarly titled measures employed by other companies.
16
|
(Dollars in millions, except per share amounts)
|
||||||||||||||||||||
|
Years ended June 30,
|
2014
|
2013
|
2012
|
2011
|
2010
|
|||||||||||||||
|
Earnings from continuing operations
before income taxes
|
$
|
2,274.6
|
|
$
|
2,076.1
|
|
$
|
2,101.7
|
|
$
|
1,912.1
|
|
$
|
1,850.2
|
|
|||||
|
Adjustments:
|
||||||||||||||||||||
|
Separation costs
|
14.9
|
|
—
|
|
—
|
|
—
|
|
—
|
|
||||||||||
|
Goodwill impairment
|
—
|
|
42.7
|
|
—
|
|
—
|
|
—
|
|
||||||||||
|
Gain on sale of assets
|
—
|
|
—
|
|
(66.0
|
)
|
—
|
|
—
|
|
||||||||||
|
Adjusted earnings from continuing operations before income taxes
|
$
|
2,289.5
|
|
$
|
2,118.8
|
|
$
|
2,035.7
|
|
$
|
1,912.1
|
|
$
|
1,850.2
|
|
|||||
|
Net earnings from continuing operations
|
$
|
1,502.6
|
|
$
|
1,358.1
|
|
$
|
1,375.2
|
|
$
|
1,241.0
|
|
$
|
1,198.6
|
|
|||||
|
Adjustments:
|
||||||||||||||||||||
|
Separation costs
|
14.9
|
|
—
|
|
—
|
|
—
|
|
—
|
|
||||||||||
|
Goodwill impairment
|
—
|
|
42.7
|
|
—
|
|
—
|
|
—
|
|
||||||||||
|
Gain on sale of assets
|
—
|
|
—
|
|
(41.2
|
)
|
—
|
|
—
|
|
||||||||||
|
Favorable tax items
|
—
|
|
—
|
|
—
|
|
—
|
|
(12.2
|
)
|
||||||||||
|
Adjusted net earnings from continuing operations
|
$
|
1,517.5
|
|
$
|
1,400.8
|
|
$
|
1,334.0
|
|
$
|
1,241.0
|
|
$
|
1,186.4
|
|
|||||
|
Diluted earnings per share from continuing operations
|
$
|
3.11
|
|
$
|
2.79
|
|
$
|
2.79
|
|
$
|
2.49
|
|
$
|
2.38
|
|
|||||
|
Adjustments:
|
||||||||||||||||||||
|
Separation costs
|
0.03
|
|
—
|
|
—
|
|
—
|
|
—
|
|
||||||||||
|
Goodwill impairment
|
—
|
|
0.09
|
|
—
|
|
—
|
|
—
|
|
||||||||||
|
Gain on sale of assets
|
—
|
|
—
|
|
(0.08
|
)
|
—
|
|
—
|
|
||||||||||
|
Favorable tax items
|
—
|
|
—
|
|
—
|
|
—
|
|
(0.02
|
)
|
||||||||||
|
Adjusted diluted earnings per share from continuing operations
|
$
|
3.14
|
|
$
|
2.88
|
|
$
|
2.71
|
|
$
|
2.49
|
|
$
|
2.36
|
|
|||||
Note 2
. Return on equity from continuing operations has been calculated as net earnings from continuing operations divided by average total stockholders' equity. Our ROE for fiscal 2014 includes incremental costs incurred that are directly attributable to the planned separation of our Dealer Services business which decreased ROE by 0.2%. Our ROE for fiscal 2013 includes the impact of a goodwill impairment charge which decreased ROE by 0.6%. Our ROE for fiscal 2012 includes the impact from the sale of assets related to rights and obligations to resell a third-party expense management platform which increased ROE by 0.6%. Our ROE for fiscal 2010 includes the impact from favorable tax items which increased ROE by 0.2%.
FORWARD-LOOKING STATEMENTS
This report and other written or oral statements made from time to time by Automatic Data Processing, Inc. (“ADP”) may contain “forward-looking statements” within the meaning of the Private Securities Litigation Reform Act of 1995. Statements that are not historical in nature, and which may be identified by the use of words like “expects,” “assumes,” “projects,” “anticipates,” “estimates,” “we believe,” “could” and other words of similar meaning, are forward-looking statements. These statements are based on management's expectations and assumptions and are subject to risks and uncertainties that may cause actual results to differ materially from those expressed. Factors that could cause actual results to differ materially from those contemplated by the forward-looking statements include: ADP's success in obtaining, retaining and selling additional services to clients; the pricing of services and products; changes in laws regulating payroll taxes, professional employer organizations and employee benefits; overall market and economic conditions, including interest rate and foreign currency trends; competitive conditions; auto sales and related industry changes; employment and wage levels; changes in technology; availability of skilled technical associates; and the impact of new acquisitions and divestitures. In addition, the proposed spin-off of the Dealer Services business is subject to inherent risks and uncertainties, including: risks that the spin-off will not be consummated; increased demands on our management team to accomplish the spin-off; significant transaction costs and risks from changes in results of operations of our reportable segments. ADP disclaims any obligation to update any forward-looking statements, whether as a result of new information, future events or otherwise. These risks and uncertainties, along with the risk factors discussed under "Item 1A. Risk Factors," should be considered in evaluating any forward-looking statements contained herein.
17
EXECUTIVE OVERVIEW
On April 10, 2014, we announced that our Board of Directors approved a plan to separate our Dealer Services business into an independent publicly traded company through a tax-free spin-off of 100% of Dealer Services to ADP shareholders. We expect to receive at least $700 million in connection with the spin-off, which we plan to return to our shareholders after the spin-off through share repurchases, depending upon market conditions. Following the spin-off, we intend to increase the dividend annually, subject to Board of Director approval, keeping intact our 39-year track record of consecutive dividend increases. However, we expect to grow the dividend at a slower rate than earnings to allow us to return to our pre-separation target dividend payout ratio of 55% to 60% in about two years. We believe that the separation of the Dealer Services business will allow both companies to focus on their respective businesses, industries, and strategic opportunities and we will further direct our attention and resources to our mission and three strategic pillars discussed below. We expect to complete the separation by October 2014.
ADP's mission is to help organizations unlock their business potential with our insightful solutions. We seek to embrace new technology and innovation to deliver market leading products and services that meet the needs of our clients across all of our markets. Our commitment to service excellence lies at the core of our relationship with each of our clients, whether a small, midsized or large organization in one or multiple countries. Our business strategy is based on strategic pillars, which are predicated on our ability to drive innovation and service excellence, and attract, build, and retain the right talent to position ADP as the global market leader in human capital management (HCM) services. Our strategic pillars are to:
|
•
|
grow our integrated suite of cloud-based HCM, benefits, and payroll solutions to serve the U.S. market;
|
|
•
|
invest to grow and scale our HR Business Process Outsourcing solutions by leveraging our platforms and processes; and
|
|
•
|
leverage our global presence to offer clients HCM, benefits, and payroll solutions where they do business.
|
Our results during fiscal
2014
continue to reflect the strength of our underlying business model, including the diversity of our client base and products. Our focus on product innovation and improvements in salesforce productivity led to growth in new business bookings. We are pleased with the performance of our business segments, which have continued to drive good revenue growth and pretax margin expansion. Revenue retention improved across our business segments and we continue to benefit from the strength of our pays per control metric, which represents the number of employees on our clients' payrolls as measured on a same-store-sales basis utilizing a representative subset of payrolls ranging from small to large businesses that are reflective of a broad range of U.S. geographic regions. During fiscal 2014, we were impacted by the decline in high-margin client interest revenues as a result of lower interest rates, partially offset by an increase in our average client funds balance. We expect this high-margin client interest revenue to increase in the fiscal year ending June 30, 2015, but at a slower rate than our underlying processing revenue.
Consolidated revenues in fiscal
2014
increased
8%
, to
$12,206.5 million
, as compared to fiscal
2013
. Earnings from continuing operations before income taxes
increased
10%
, to
$2,274.6 million
, as compared to fiscal
2013
and net earnings from continuing operations
increased
11%
, to
$1,502.6 million
, as compared to fiscal
2013
. Our diluted earnings per share from continuing operations
increased
11%
to
$3.11
in fiscal
2014
, as compared to
$2.79
in fiscal
2013
.
Our fiscal 2014 results include
$14.9 million
of incremental costs directly attributable to our planned separation of our Dealer Service business and our fiscal
2013
results include a
$42.7 million
non tax-deductible goodwill impairment charge related to our ADP AdvancedMD business. Excluding these items, our earnings from continuing operations before income taxes
increase
d
8%
, to
$2,289.5 million
, as compared to
$2,118.8 million
for fiscal
2013
, and net earnings from continuing operations
increase
d
8%
, to
$1,517.5 million
, compared to
$1,400.8 million
for fiscal
2013
. Our adjusted diluted earnings per share from continuing operations
increase
d
9%
, to
$3.14
for fiscal
2014
from
$2.88
, as adjusted, for fiscal
2013
, due to increased adjusted net earnings from continuing operations and fewer shares outstanding.
Our business segment results were solid with Employer Services' revenues increasing
8%
to
$8,535.2 million
and earnings from continuing operations before income taxes increasing
14%
to
$2,517.8 million
, PEO Services' revenues increasing
15%
to
$2,270.9 million
and earnings from continuing operations before income taxes increasing
17%
to
$234.3 million
, and Dealer Services' revenues increasing
7%
to
$1,951.4 million
and earnings from continuing operations before income taxes increasing
14%
to
$428.1 million
in fiscal
2014
. Employer Services' and PEO Services' new business bookings, which represent annualized recurring revenues anticipated from sales orders to new and existing clients, grew 7% worldwide, to over $1.4 billion in fiscal
2014
. Dealer Services' new business bookings showed strength as we continued to experience the effects of a stronger automotive industry and increased penetration of applications within our base. Our key business metrics continue to reflect the core strength of our business model, with our Employer Services' worldwide client revenue retention rate increasing to an all-time high of 91.4% and our pays per control metric increased 2.8% for the twelve months ended
June 30, 2014
from the twelve months ended June 30, 2013.
18
Interest on funds held for clients decreased approximately
11%
, or
$47.2 million
, to
$373.7 million
from
$420.9 million
in fiscal
2013
. The decrease in the consolidated interest on funds held for clients resulted from the
decrease
in the average interest rate earned to
1.8%
in fiscal
2014
, as compared to
2.2%
in fiscal
2013
, partially offset by growth in average client funds balance of
8%
resulting from the continued strength and growth of our Employer Services segment.
We invest our funds held for clients in accordance with ADP's prudent and conservative investment guidelines, where the safety of principal, liquidity, and diversification are the foremost objectives of our investment strategy. The portfolio is predominantly invested in AAA/AA rated fixed-income securities. Our client funds investment strategy is structured to allow us to average our way through an interest rate cycle by laddering the maturities of our investments out to five years (in the case of the extended portfolio) and out to ten years (in the case of the long portfolio). This investment strategy is supported by our short-term financing arrangements necessary to satisfy short-term funding requirements relating to client funds obligations.
Our financial condition and balance sheet remain solid at
June 30, 2014
, with cash and cash equivalents and marketable securities of
$4.1 billion
, of which
$2.2 billion
related to outstanding commercial paper borrowings. These borrowings were a normal part of our client funds extended investment strategy. Our net cash flows
provided by
operating activities were
$1,821.4 million
in fiscal
2014
, as compared to
$1,577.2 million
in fiscal
2013
. This
increase
in cash flows
provided by
operating activities from fiscal
2013
to fiscal
2014
was due to higher net earnings in fiscal
2014
, favorable changes in timing differences on the net components of working capital, and lower pension contributions. The increase in cash
provided by
investing activities of
$2,391.7 million
is due to the timing of receipts and disbursements of restricted cash and cash equivalents held to satisfy client funds obligations, partially offset by the timing of purchases and sales of corporate and client fund marketable securities. The
increase
in cash
used in
financing activities of
$2,509.2 million
is primarily due to the timing of cash received from items such as proceeds from reverse repurchase agreements, proceeds from the issuance of commercial paper, and payments made related to client funds as compared to the prior year.
We have a strong business model with a high percentage of recurring revenues, excellent margins, the ability to generate consistent, healthy cash flows, strong client retention, and low capital expenditure requirements. We continue to enhance value to our shareholders, and in fiscal
2014
returned excess cash of
$883.1 million
through dividends and
$667.3 million
through our share buyback program. In the last five fiscal years, we have reduced the Company's common stock outstanding by approximately
4%
through share buybacks, net of the effect of common stock issued under employee stock-based compensation programs. We have also raised the dividend payout per share for 39 consecutive years.
19
RESULTS OF OPERATIONS
ANALYSIS OF CONSOLIDATED OPERATIONS
Prior period amounts have been adjusted to exclude discontinued operations.
(Dollars in millions, except per share amounts)
|
Years ended June 30,
|
$ Change
|
% Change
|
|||||||||||||||||||||||
|
|
2014
|
2013
|
2012
|
2014
|
2013
|
2014
|
2013
|
||||||||||||||||||
|
Total revenues
|
$
|
12,206.5
|
|
$
|
11,287.6
|
|
$
|
10,595.4
|
|
$
|
918.9
|
|
$
|
692.2
|
|
8
|
%
|
7
|
%
|
||||||
|
Costs of revenues:
|
|
|
|
|
|
|
|
|
|
|
|
|
|||||||||||||
|
Operating expenses
|
6,248.6
|
|
5,731.5
|
|
5,355.2
|
|
517.1
|
|
376.3
|
|
9
|
%
|
7
|
%
|
|||||||||||
|
Systems development and
programming costs
|
718.0
|
|
654.3
|
|
592.7
|
|
63.7
|
|
61.6
|
|
10
|
%
|
10
|
%
|
|||||||||||
|
Depreciation and amortization
|
254.8
|
|
252.7
|
|
256.0
|
|
2.1
|
|
(3.3
|
)
|
1
|
%
|
(1
|
)%
|
|||||||||||
|
Total costs of revenues
|
7,221.4
|
|
6,638.5
|
|
6,203.9
|
|
582.9
|
|
434.6
|
|
9
|
%
|
7
|
%
|
|||||||||||
|
Selling, general and
administrative costs
|
2,762.4
|
|
2,617.4
|
|
2,452.9
|
|
145.0
|
|
164.5
|
|
6
|
%
|
7
|
%
|
|||||||||||
|
Separation costs
|
14.9
|
|
—
|
|
—
|
|
14.9
|
|
—
|
|
100
|
%
|
—
|
%
|
|||||||||||
|
Goodwill impairment
|
—
|
|
42.7
|
|
—
|
|
(42.7
|
)
|
42.7
|
|
(100
|
)%
|
100
|
%
|
|||||||||||
|
Interest expense
|
6.1
|
|
9.1
|
|
7.7
|
|
(3.0
|
)
|
1.4
|
|
(33
|
)%
|
18
|
%
|
|||||||||||
|
Total expenses
|
10,004.8
|
|
9,307.7
|
|
8,664.5
|
|
697.1
|
|
643.2
|
|
7
|
%
|
7
|
%
|
|||||||||||
|
Other income, net
|
(72.9
|
)
|
(96.2
|
)
|
(170.8
|
)
|
(23.3
|
)
|
(74.6
|
)
|
(24
|
)%
|
44
|
%
|
|||||||||||
|
Earnings from continuing
operations before income taxes
|
$
|
2,274.6
|
|
$
|
2,076.1
|
|
$
|
2,101.7
|
|
$
|
198.5
|
|
$
|
(25.6
|
)
|
10
|
%
|
(1
|
)%
|
||||||
|
Margin
|
18.6
|
%
|
18.4
|
%
|
19.8
|
%
|
|
|
|
|
|||||||||||||||
|
Provision for income taxes
|
$
|
772.0
|
|
$
|
718.0
|
|
$
|
726.5
|
|
$
|
54.0
|
|
$
|
(8.5
|
)
|
8
|
%
|
(1
|
)%
|
||||||
|
Effective tax rate
|
33.9
|
%
|
34.6
|
%
|
34.6
|
%
|
|
|
|
|
|
|
|
|
|||||||||||
|
Net earnings from continuing
operations
|
$
|
1,502.6
|
|
$
|
1,358.1
|
|
$
|
1,375.2
|
|
$
|
144.5
|
|
$
|
(17.1
|
)
|
11
|
%
|
(1
|
)%
|
||||||
|
Diluted earnings per share from
continuing operations
|
$
|
3.11
|
|
$
|
2.79
|
|
$
|
2.79
|
|
$
|
0.32
|
|
$
|
—
|
|
11
|
%
|
—
|
%
|
||||||
20
The following table reconciles our results to adjusted results that exclude incremental costs incurred in fiscal 2014 directly attributable to our planned separation of our Dealer Services business, the fiscal 2013 non tax-deductible goodwill impairment charge, and the fiscal 2012 sale of assets related to rights and obligations to resell a third-party expense management platform.
|
Years ended June 30,
|
$ Change
|
% Change
|
||||||||||||||||||||||||
|
(Dollars in millions, except per share amounts)
|
2014
|
2013
|
2012
|
2014
|
2013
|
2014
|
2013
|
|||||||||||||||||||
|
Earnings from continuing operations
before income taxes
|
$
|
2,274.6
|
|
$
|
2,076.1
|
|
$
|
2,101.7
|
|
$
|
198.5
|
|
$
|
(25.6
|
)
|
10
|
%
|
(1
|
)%
|
|||||||
|
Adjustments:
|
||||||||||||||||||||||||||
|
Separation costs
|
14.9
|
|
—
|
|
—
|
|
||||||||||||||||||||
|
Goodwill impairment
|
—
|
|
42.7
|
|
—
|
|
||||||||||||||||||||
|
Gain on sale of assets
|
—
|
|
—
|
|
(66.0
|
)
|
||||||||||||||||||||
|
Adjusted earnings from continuing operations
before income taxes
|
$
|
2,289.5
|
|
$
|
2,118.8
|
|
$
|
2,035.7
|
|
$
|
170.7
|
|
$
|
83.1
|
|
8
|
%
|
4
|
%
|
|||||||
|
Provision for income taxes from continuing operations
|
$
|
772.0
|
|
$
|
718.0
|
|
$
|
726.5
|
|
$
|
54.0
|
|
$
|
(8.5
|
)
|
8
|
%
|
(1
|
)%
|
|||||||
|
Effective tax rate
|
33.9
|
%
|
34.6
|
%
|
34.6
|
%
|
||||||||||||||||||||
|
Adjustments:
|
||||||||||||||||||||||||||
|
Separation costs
|
—
|
|
—
|
|
—
|
|
||||||||||||||||||||
|
Goodwill impairment
|
—
|
|
—
|
|
—
|
|
||||||||||||||||||||
|
Gain on sale of assets
|
—
|
|
—
|
|
(24.8
|
)
|
||||||||||||||||||||
|
Adjusted provision for income taxes
from continuing operations
|
$
|
772.0
|
|
$
|
718.0
|
|
$
|
701.7
|
|
$
|
54.0
|
|
$
|
16.3
|
|
8
|
%
|
2
|
%
|
|||||||
|
Adjusted effective tax rate
|
33.7
|
%
|
33.9
|
%
|
34.5
|
%
|
||||||||||||||||||||
|
Net earnings from continuing operations
|
$
|
1,502.6
|
|
$
|
1,358.1
|
|
$
|
1,375.2
|
|
$
|
144.5
|
|
$
|
(17.1
|
)
|
11
|
%
|
(1
|
)%
|
|||||||
|
Adjustments:
|
||||||||||||||||||||||||||
|
Separation costs
|
14.9
|
|
—
|
|
—
|
|
||||||||||||||||||||
|
Goodwill impairment
|
—
|
|
42.7
|
|
—
|
|
||||||||||||||||||||
|
Gain on sale of assets
|
—
|
|
—
|
|
(41.2
|
)
|
||||||||||||||||||||
|
Adjusted net earnings from continuing operations
|
$
|
1,517.5
|
|
$
|
1,400.8
|
|
$
|
1,334.0
|
|
$
|
116.7
|
|
$
|
66.8
|
|
8
|
%
|
5
|
%
|
|||||||
|
Diluted earnings per share from continuing operations
|
$
|
3.11
|
|
$
|
2.79
|
|
$
|
2.79
|
|
$
|
0.32
|
|
$
|
—
|
|
11
|
%
|
—
|
%
|
|||||||
|
Adjustments:
|
||||||||||||||||||||||||||
|
Separation costs
|
0.03
|
|
—
|
|
—
|
|
||||||||||||||||||||
|
Goodwill impairment
|
—
|
|
0.09
|
|
—
|
|
||||||||||||||||||||
|
Gain on sale of assets
|
—
|
|
—
|
|
(0.08
|
)
|
||||||||||||||||||||
|
Adjusted diluted earnings per share
from continuing operations
|
$
|
3.14
|
|
$
|
2.88
|
|
$
|
2.71
|
|
$
|
0.26
|
|
$
|
0.17
|
|
9
|
%
|
6
|
%
|
|||||||
Fiscal
2014
Compared to Fiscal
2013
Total Revenues
Total revenues
increased
$918.9 million
, or
8%
, to
$12,206.5 million
in fiscal
2014
, as compared to fiscal
2013
, due to
an
increase
in revenues in Employer Services of
8%
, or
$610.3 million
, to
$8,535.2 million
,
an
increase
in revenues in PEO Services of
15%
, or
$297.7 million
, to
$2,270.9 million
, and
an
increase
in revenues in Dealer Services of
7%
, or
$131.2 million
, to
$1,951.4 million
.
21
Total revenues in fiscal
2014
include interest on funds held for clients of
$373.7 million
, as compared to
$420.9 million
in fiscal
2013
. The
decrease
in the consolidated interest earned on funds held for clients resulted from the
decrease
in the average interest rate earned to
1.8%
in fiscal
2014
, as compared to
2.2%
in fiscal
2013
, partially offset by
an
increase
in our average client funds balance of
8%
, to
$20.7 billion
, in fiscal
2014
.
Total Expenses
Our total expenses
increased
$697.1 million
, or
7%
, to
$10,004.8 million
in fiscal
2014
, as compared to fiscal
2013
. The
increase
in our total expenses was due to
an
increase
in operating expenses of
$517.1 million
,
an
increase
in selling, general and administrative expenses of
$145.0 million
,
an
increase
in systems development and programming costs of $
63.7 million
and separation costs related to the planned separation of our Dealer Services business of
$14.9 million
in fiscal 2014, partially offset by the goodwill impairment charge of
$42.7 million
in fiscal 2013. Total expenses would have increased approximately
8%
without the impact of the 2014 separation costs related to the Dealer Services separation and the fiscal 2013 goodwill impairment charge.
Our total costs of revenues
increased
$582.9 million
, or
9%
, to
$7,221.4 million
in fiscal
2014
, as compared to fiscal
2013
, primarily due to
an
increase
in operating expenses of
$517.1 million
and
an
increase
in systems development and programming costs of
$63.7 million
.
Operating expenses
increased
$517.1 million
, or
9%
in fiscal
2014
, as compared to fiscal
2013
, due to the
increase
in revenues described above, including the
increase
s in PEO Services, which has pass-through costs that are re-billable and which include costs for benefits coverage, workers’ compensation coverage and state unemployment taxes for worksite employees. These pass-through costs were
$1,736.0 million
for fiscal
2014
, which included costs for benefits coverage of
$1,383.3 million
and costs for workers’ compensation and payment of state unemployment taxes of
$352.7 million
. These pass-through costs were
$1,513.5 million
for fiscal
2013
, which included costs for benefits coverage of
$1,193.2 million
and costs for workers’ compensation and payment of state unemployment taxes of
$320.3 million
. The
increase
in operating expenses is also due to higher labor-related expenses in Employer Services of
$65.9 million
.
Systems development and programming costs
increased
$63.7 million
, or
10%
, in fiscal
2014
, as compared to fiscal
2013
, due to increased costs to develop, support, and maintain our products, partially offset by a higher proportion of capitalized costs of our strategic projects.
Selling, general and administrative expenses
increased
$145.0 million
, or
6%
, in fiscal
2014
, as compared to fiscal
2013
. The
increase
in expenses was related to an increase in selling expenses of
$81.8
million resulting from investments in our salesforce and an increase in stock-based compensation expense of
$29.7
million, and $17.9 million higher severance expenses in fiscal
2014
, as compared to fiscal
2013
.
Separation costs
represent the incremental costs associated with our planned separation of Dealer Services and totaled
$14.9 million
for fiscal
2014
. We expect to incur separation costs of between
$40 million
and
$50 million
during the fiscal year ending
June 30, 2015
("fiscal 2015").
Other Income, net
|
Years ended June 30,
|
||||||||||||
|
(Dollars in millions)
|
2014
|
2013
|
$ Change
|
|||||||||
|
Interest income on corporate funds
|
$
|
(56.2
|
)
|
$
|
(64.5
|
)
|
$
|
(8.3
|
)
|
|||
|
Realized gains on available-for-sale securities
|
(20.4
|
)
|
(32.1
|
)
|
(11.7
|
)
|
||||||
|
Realized losses on available-for-sale securities
|
3.9
|
|
3.5
|
|
(0.4
|
)
|
||||||
|
Gains on sales of buildings
|
—
|
|
(2.2
|
)
|
(2.2
|
)
|
||||||
|
Other, net
|
(0.2
|
)
|
(0.9
|
)
|
(0.7
|
)
|
||||||
|
Other income, net
|
$
|
(72.9
|
)
|
$
|
(96.2
|
)
|
$
|
(23.3
|
)
|
|||
Other income, net,
decrease
d
$23.3 million
in fiscal
2014
, as compared to fiscal
2013
. The
decrease
was due to a
decrease
in realized gains on available-for-sale securities of
$11.7 million
and a decrease in interest income on corporate funds of
$8.3 million
in the fiscal
2014
, as compared to the fiscal
2013
. The
decrease
in interest income on corporate funds resulted
22
from lower average interest rates of
1.5%
in fiscal
2013
to
1.4%
in fiscal
2014
and lower average daily corporate funds, which decreased from
$4.2 billion
in fiscal
2013
to
$4.1 billion
in fiscal
2014
. In addition, we recognized gains of
$2.2 million
pertaining to the sale of
two
buildings during fiscal
2013
.
Earnings from Continuing Operations before Income Taxes
Earnings from continuing operations before income taxes
increased
$198.5 million
, or
10%
, to
$2,274.6 million
in fiscal
2014
, which includes the effect of the $14.9 million of separation costs directly attributable to the proposed separation of our Dealer Services business, compared to
$2,076.1 million
in fiscal
2013
, which includes the effect of the
$42.7 million
goodwill impairment charge. Overall margin
increased
approximately 20 basis points from
18.4%
in fiscal 2013 to
18.6%
in fiscal
2014
. This increase was due to margin improvements in our business segments, partially offset by approximately 70 basis points of margin decline related to the continued decline in interest on funds held for clients discussed above and 30 basis points of margin decline due to increased stock-based compensation costs. Overall margin also benefited 20 basis points from the lower costs related to the incremental separation costs of $14.9 million included in fiscal 2014 compared to the $42.7 million charge related to the goodwill impairment in fiscal
2013
.
Adjusted Earnings from Continuing Operations before Income Taxes
Adjusted earnings from continuing operations before income taxes
increase
d
$170.7 million
, or
8%
, to
$2,289.5 million
, in fiscal
2014
, compared to
$2,118.8 million
for fiscal
2013
, due to increased revenue and margin improvement in our business segments, partially offset by the continued decline in interest on funds held for clients. Margin, adjusted for the fiscal 2014 separation costs directly attributable to the proposed separation of our Dealer Services business and the fiscal 2013 goodwill impairment charge related to our ADP AdvancedMD business, remained flat at
18.8%
. Margin improvements in our business segments were offset, primarily by approximately 70 basis points of margin decrease related to the continued decline in interest on fund held for clients discussed above and 30 basis of margin decline due to increased stock-based compensation costs.
Provision for Income Taxes
The effective tax rate in fiscal 2014 and 2013 was
33.9%
and
34.6%
, respectively. The effective tax rate in fiscal 2014 includes a
0.2
percentage point increase due to the non tax-deductible separation costs related to our planned separation of our Dealer Services business and the effective tax rate for fiscal 2013 includes a
0.7
percentage point increase due to the fiscal 2013 non tax-deductible goodwill impairment charge. The remaining decrease of
0
basis points is due to the resolution of certain tax matters and the reversal of a valuation allowance, partially offset by an increase in foreign taxes and reduced foreign tax credits available.
Net Earnings from Continuing Operations and Diluted Earnings per Share from Continuing Operations
Net earnings from continuing operations
increased
$144.5 million
, or
11%
, to
$1,502.6 million
in fiscal
2014
, compared to
$1,358.1 million
in fiscal
2013
, which includes the effect of the
$42.7 million
goodwill impairment charge. Diluted earnings per share from continuing operations increased
11%
to
$3.11
in fiscal
2014
, as compared to
$2.79
in fiscal
2013
.
In fiscal
2014
, our diluted earnings per share from continuing operations reflects the
increase
in net earnings from continuing operations and the impact of fewer shares outstanding resulting from the net impact of cumulative share repurchases, offset by the issuances of shares under our stock-based compensation programs.
Adjusted Net Earnings from Continuing Operations and Adjusted Diluted Earnings per Share from Continuing Operations
Adjusted net earnings from continuing operations
increase
d
$116.7 million
, or
8%
, to
$1,517.5 million
, in fiscal
2014
, as compared to
$1,400.8 million
for fiscal
2013
, and the adjusted diluted earnings per share from continuing operations
increase
d
9%
, to
$3.14
for fiscal
2014
, compared to
$2.88
, for fiscal
2013
. The
increase
in adjusted diluted earnings per share from continuing operations for fiscal
2014
reflects the increase in adjusted net earnings from continuing operations and the impact of fewer shares outstanding resulting from the net impact of cumulative share repurchases, offset by the issuances of shares under our stock-based compensation programs.
23
Fiscal
2013
Compared to Fiscal
2012
Total Revenues
Our total revenues increased
$692.2 million
, or
7%
, to
$11,287.6 million
in fiscal
2013
, as compared to fiscal
2012
, due to an increase in revenues in Employer Services of
6%
, or
$475.5 million
, to
$7,924.9 million
, PEO Services of
11%
, or
$201.8 million
, to
$1,973.2 million
, and Dealer Services of
9%
, or
$144.0 million
, to
$1,820.2 million
. Total revenues would have increased approximately 6% without the impact of recently completed acquisitions and the impact to revenues pertaining to the sale in fiscal 2012 of assets related to rights and obligations to resell a third-party expense management platform. In addition, revenues decreased $61.3 million due to changes in foreign currency exchange rates.
Total revenues for fiscal
2013
include interest on funds held for clients of
$420.9 million
, as compared to
$493.3 million
in fiscal
2012
. The decrease in the consolidated interest earned on funds held for clients resulted from the decrease in the average interest rate earned to
2.2%
during fiscal
2013
, as compared to
2.8%
for fiscal
2012
, partially offset by an increase in our average client funds balance of
7%
, to
$19.2 billion
in fiscal
2013
.
Total Expenses
Our total expenses increased
$643.2 million
, or
7%
, to
$9,307.7 million
in fiscal
2013
, as compared to fiscal
2012
. The increase in our total expenses was due to an increase in operating expenses of
$376.3 million
, an increase in selling, general and administrative expenses of
$164.5 million
, and an increase in systems development and programming costs of
$61.6 million
. Total expenses would have increased approximately 6% without the impact of recently completed acquisitions.
Our total costs of revenues increased
7%
, to
$6,638.5 million
in fiscal
2013
, as compared to fiscal
2012
due to an increase in operating expenses of
$376.3 million
and an increase in systems development and programming costs of
$61.6 million
.
Operating expenses increased
$376.3 million
, or
7%
, in fiscal
2013
, as compared to fiscal
2012
due to the increase in revenues described above, including the increases in PEO Services, which has pass-through costs that are re-billable and which includes costs for benefits coverage, workers’ compensation coverage and state unemployment taxes for worksite employees. These pass-through costs were
$1,513.5 million
for fiscal
2013
, which included costs for benefits coverage of
$1,193.2 million
and costs for workers’ compensation and payment of state unemployment taxes of
$320.3 million
. These pass-through costs were $1,363.6 million for fiscal 2012, which included costs for benefits coverage of $1,060.3 million and costs for workers’ compensation and payment of state unemployment taxes of $303.3 million. The increase in operating expenses is also due to expenses related to businesses acquired of $84.4 million and higher labor-related expenses in Employer Services of $69.4 million, partially offset by a decrease of $34.0 million due to changes in foreign currency exchange rates.
Systems development and programming costs increased
$61.6 million
, or
10%
, in fiscal
2013
, as compared to fiscal
2012
, due to increased costs to develop, support, and maintain our products and increased costs related to businesses acquired of $6.6 million, partially offset by a decrease of $6.7 million due to changes in foreign currency exchange rates.
Selling, general and administrative expenses increased
$164.5 million
, or
7%
, in fiscal
2013
, as compared to fiscal
2012
. The
increase
in expenses was related to an increase in selling expenses of $72.9 million resulting from investments in our salesforce and an increase in expenses of businesses acquired of $16.3 million, partially offset by a decrease of $24.6 million due to changes in foreign currency exchange rates. Additionally, selling, general, and administrative expenses decreased $24.1 million due to lower severance expenses in fiscal
2013
, as compared to fiscal
2012
.
24
Other Income, net
|
Years ended June 30,
|
||||||||||||
|
(Dollars in millions)
|
2013
|
2012
|
$ Change
|
|||||||||
|
Interest income on corporate funds
|
$
|
(64.5
|
)
|
$
|
(85.2
|
)
|
$
|
(20.7
|
)
|
|||
|
Realized gains on available-for-sale securities
|
(32.1
|
)
|
(32.1
|
)
|
—
|
|
||||||
|
Realized losses on available-for-sale securities
|
3.5
|
|
7.7
|
|
4.2
|
|
||||||
|
Impairment losses on available-for-sale securities
|
—
|
|
5.8
|
|
5.8
|
|
||||||
|
Impairment losses on assets held for sale
|
—
|
|
2.2
|
|
2.2
|
|
||||||
|
Gains on sales of buildings
|
(2.2
|
)
|
—
|
|
2.2
|
|
||||||
|
Gain on sale of assets
|
—
|
|
(66.0
|
)
|
(66.0
|
)
|
||||||
|
Other, net
|
(0.9
|
)
|
(3.2
|
)
|
(2.3
|
)
|
||||||
|
Other income, net
|
$
|
(96.2
|
)
|
$
|
(170.8
|
)
|
$
|
(74.6
|
)
|
|||
Other income, net,
decrease
d
$74.6 million
in fiscal
2013
, as compared to fiscal
2012
. The decrease was due to a $66.0 million gain on the sale of assets related to rights and obligations to resell a third-party expense management platform in fiscal 2012 and a decrease in interest income on corporate funds of $20.7 million in fiscal 2013, as compared to fiscal 2012. The decrease in interest income on corporate funds resulted from lower average interest rates from 2.1% in fiscal 2012 to 1.5% in fiscal 2013, partially offset by increasing average daily corporate funds, which increased from $4.0 billion in fiscal 2012 to $4.2 billion in fiscal 2013. Such decreases were partially offset by gains of $2.2 million pertaining to the sale of two buildings in fiscal 2013, a $5.8 million impairment loss on available-for-sale securities in fiscal 2012, and an impairment loss of $2.2 million related to assets previously classified as assets held for sale in fiscal 2012.
Earnings from Continuing Operations before Income Taxes
Earnings from continuing operations before income taxes
decrease
d
$25.6 million
, or
1%
, to
$2,076.1 million
in fiscal
2013
, which includes the effect of the $42.7 million goodwill impairment charge, compared to
$2,101.7 million
in fiscal
2012
, which includes the effect of a $66.0 million gain on the sale of assets related to the rights and obligations to resell a third-party expense management platform. Overall margin
decrease
d approximately 140 basis points from
19.8%
in fiscal
2012
to
18.4%
in fiscal
2013
with approximately 40 basis points of margin decrease attributable to the goodwill impairment charge, 20 basis points of margin decrease attributable to acquisitions completed in fiscal 2012, and 90 basis points related to the continued decline in interest on funds held for clients discussed above. In addition, overall margin decreased approximately 60 basis points due to the fiscal 2012 gain on the sale of assets related to the rights and obligations to resell a third-party management platform. These decreases were partially offset by margin improvements in our business segments.
Adjusted Earnings from Continuing Operations before Income Taxes
Adjusted earnings from continuing operations before income taxes
increase
d
$83.1 million
, or
4%
, to
$2,118.8 million
in fiscal
2013
, as compared to
$2,035.7 million
for fiscal
2012
due to increased revenue and margin improvement in our business segments, partially offset by the continued decline in interest on funds held for clients. Margin, adjusted for the 2013 goodwill impairment charge related to our ADP AdvancedMD business and a gain on the sale of assets related to rights and obligations to resell a third-party expense management platform in fiscal
2012
, decreased approximately 40 basis points from
19.2%
in fiscal
2012
to
18.8%
in fiscal
2013
due to approximately 90 basis points of margin decline related to the continued decline in interest on funds held for clients discussed above, partially offset by margin improvements in our business segments.
Provision for Income Taxes
The effective tax rates in both fiscal
2013
and
2012
were
34.6%
. Our effective tax rate for fiscal
2013
includes the effect of a non tax-deductible goodwill impairment charge of $42.7 million that increased our effective tax rate by
0.7
percentage points in the period. The
0.7
percentage point increase was offset by a reduction in foreign taxes and the availability of higher foreign tax credits in fiscal
2013
, as compared to
2012
.
25
Net Earnings from Continuing Operations and Diluted Earnings per Share from Continuing Operations
Net earnings from continuing operations
decrease
d
$17.1 million
, or
1%
, to
$1,358.1 million
in fiscal
2013
, which includes the effect of the
$42.7 million
goodwill impairment charge, compared to
$1,375.2 million
in fiscal
2012
, which included the effect of an after tax gain on the sale of assets of $41.2 million. Diluted earnings per share from continuing operations was flat in fiscal
2013
, as compared to
$2.79
in fiscal
2012
.
In fiscal
2013
, our diluted earnings per share from continuing operations reflects the
decrease
in net earnings from continuing operations and the impact of fewer shares outstanding resulting from the net impact of cumulative share repurchases, offset by the issuances of shares under our stock-based compensation programs.
Adjusted Net Earnings from Continuing Operations and Adjusted Diluted Earnings per Share from Continuing Operations
Adjusted net earnings from continuing operations
increase
d
$66.8 million
, or
5%
, to
$1,400.8 million
, in fiscal
2013
, as compared to
$1,334.0 million
for fiscal
2012
, and the adjusted diluted earnings per share from continuing operations
increase
d
6%
, to
$2.88
for fiscal
2013
, compared to
$2.71
for fiscal
2012
. The
increase
in adjusted diluted earnings per share from continuing operations for fiscal
2013
reflects the increase in adjusted net earnings from continuing operations and the impact of fewer shares outstanding resulting from the net impact of cumulative share repurchases, offset by the issuances of shares under our stock-based compensation programs.
ANALYSIS OF REPORTABLE SEGMENTS
Revenues from Continuing Operations
(Dollars in millions)
|
Years ended June 30,
|
$ Change
|
% Change
|
||||||||||||||||||||||||
|
|
2014
|
2013
|
2012
|
2014
|
2013
|
2014
|
2013
|
|||||||||||||||||||
|
Employer Services
|
$
|
8,535.2
|
|
$
|
7,924.9
|
|
|
$
|
7,449.4
|
|
$
|
610.3
|
|
$
|
475.5
|
|
8
|
%
|
6
|
%
|
||||||
|
PEO Services
|
2,270.9
|
|
1,973.2
|
|
1,771.4
|
|
297.7
|
|
201.8
|
|
15
|
%
|
11
|
%
|
||||||||||||
|
Dealer Services
|
1,951.4
|
|
1,820.2
|
|
1,676.2
|
|
131.2
|
|
144.0
|
|
7
|
%
|
9
|
%
|
||||||||||||
|
Other
|
(0.9
|
)
|
1.7
|
|
5.5
|
|
||||||||||||||||||||
|
Reconciling items:
|
|
|
|
|
||||||||||||||||||||||
|
Client fund interest
|
(550.1
|
)
|
(432.4
|
)
|
(307.1
|
)
|
||||||||||||||||||||
|
$
|
12,206.5
|
|
$
|
11,287.6
|
|
$
|
10,595.4
|
|
$
|
918.9
|
|
$
|
692.2
|
|
8
|
%
|
7
|
%
|
||||||||
26
Earnings from Continuing Operations before Income Taxes
(Dollars in millions)
|
Years ended June 30,
|
$ Change
|
% Change
|
||||||||||||||||||||||||
|
|
2014
|
2013
|
2012
|
2014
|
2013
|
2014
|
2013
|
|||||||||||||||||||
|
Employer Services
|
$
|
2,517.8
|
|
$
|
2,216.8
|
|
$
|
2,054.6
|
|
$
|
301.0
|
|
$
|
162.2
|
|
14
|
%
|
8
|
%
|
|||||||
|
PEO Services
|
234.3
|
|
199.7
|
|
171.1
|
|
34.6
|
|
28.6
|
|
17
|
%
|
17
|
%
|
||||||||||||
|
Dealer Services
|
428.1
|
|
375.3
|
|
322.1
|
|
52.8
|
|
53.2
|
|
14
|
%
|
17
|
%
|
||||||||||||
|
Other
|
(355.5
|
)
|
(283.3
|
)
|
(139.0
|
)
|
||||||||||||||||||||
|
Reconciling items:
|
|
|
|
|
||||||||||||||||||||||
|
Client fund interest
|
(550.1
|
)
|
(432.4
|
)
|
(307.1
|
)
|
||||||||||||||||||||
|
$
|
2,274.6
|
|
$
|
2,076.1
|
|
$
|
2,101.7
|
|
$
|
198.5
|
|
$
|
(25.6
|
)
|
10
|
%
|
(1
|
)%
|
||||||||
Certain revenues and expenses are charged to the reportable segments at a standard rate for management reasons. Other costs are charged to the reportable segments based on management’s responsibility for the applicable costs. The primary components of the “Other” segment are the results of operations of ADP Indemnity (a wholly-owned captive insurance company that provides workers’ compensation and employer’s liability deductible reimbursement insurance protection for PEO Services worksite employees), non-recurring gains and losses, miscellaneous processing services, such as customer financing transactions, and certain charges and expenses that have not been allocated to the reportable segments, such as stock-based compensation expense and the fiscal 2013 goodwill impairment charge.
In addition, there is a reconciling item for the difference between actual interest income earned on invested funds held for clients and interest credited to Employer Services and PEO Services at a standard rate of 4.5%. This allocation is made for management reasons so that the reportable segments’ results are presented on a consistent basis without the impact of fluctuations in interest rates. This allocation is a reconciling item to our reportable segments’ revenues from continuing operations and earnings from continuing operations before income taxes and is eliminated in consolidation.
Employer Services
Fiscal
2014
Compared to Fiscal
2013
Revenues from continuing operations
Employer Services' revenues from continuing operations
increased
$610.3 million
, or
8%
, to
$8,535.2 million
in fiscal
2014
, as compared to fiscal
2013
. Revenues from continuing operations
increased
due to new business started during the year from new business bookings growth, an increase in the number of employees on our clients’ payrolls, and the impact of price increases. Our worldwide client revenue retention rate in fiscal
2014
increased approximately 10 basis points to 91.4% as compared to our rate in fiscal
2013
and our U.S. pays per control increased 2.8% in fiscal
2014
.
Earnings from Continuing Operations before Income Taxes
Employer Services’ earnings from continuing operations before income taxes
increased
$301.0 million
, or
14%
, to
$2,517.8 million
in fiscal
2014
, as compared to fiscal
2013
. The
increase
was due to the
increase
in revenues from continuing operations of
$610.3 million
discussed above, which was partially offset by
an increase
in expenses of
$309.3 million
. Expenses increased in fiscal
2014
due to investments in our salesforce and labor-related costs as compared to 2013, both of which grew slower than Employer Services' revenues. Overall margin
increase
d approximately 150 basis points from
28.0%
to
29.5%
for fiscal
2014
, as compared to fiscal
2013
, due to increased operating scale.
27
Fiscal
2013
Compared to Fiscal
2012
Revenues from continuing operations
Employer Services' revenues from continuing operations
increase
d
$475.5 million
, or
6%
, to
$7,924.9 million
in fiscal
2013
, as compared to fiscal
2012
. Revenues from continuing operations for our Employer Services business would have increased approximately 5% without the impact of acquisitions and revenues pertaining to the sale in fiscal 2012 of assets related to rights and obligations to resell a third-party expense management platform. Revenues from continuing operations increased due to new business started during the year from new business bookings growth, an increase in the number of employees on our clients’ payrolls, and the impact of price increases. Our worldwide client revenue retention rate in fiscal 2013 increased 40 basis points to 91.3% as compared to our rate in fiscal 2012 and U.S. our pays per control increased 2.8% in fiscal 2013.
Earnings from Continuing Operations before Income Taxes
Employer Services' earnings from continuing operations before income taxes
increase
d
$162.2 million
, or
8%
, to
$2,216.8 million
in fiscal
2013
, as compared to fiscal
2012
. The
increase
was due to the
increase
in revenues of
$475.5 million
discussed above, which was partially offset by
an increase
in expenses of
$313.3 million
. In addition to
an increase
in expenses related to
increase
d revenues, expenses increased in fiscal
2013
due to investments in our salesforce and labor-related costs over the same period prior year levels coupled with the effects of acquisitions. Overall margin
increase
d approximately
40
basis points from
27.6%
to
28.0%
for fiscal
2013
, as compared to fiscal
2012
, and included the benefit of increased operating scale, offset by approximately 50 basis points of margin decline attributable to acquisitions.
PEO Services
Fiscal
2014
Compared to Fiscal
2013
Revenues
PEO Services' revenues
increased
$297.7 million
, or
15%
, to
$2,270.9 million
for fiscal
2014
, as compared to fiscal
2013
. Such revenues include pass-through costs of
$1,736.0 million
for fiscal
2014
and
$1,513.5 million
for fiscal
2013
associated with benefits coverage, workers' compensation coverage, and state unemployment taxes for worksite employees. The
increase
in revenues was due to a 15% increase in the average number of worksite employees, resulting from an increase in the number of new clients and growth in our existing clients.
Earnings from Continuing Operations before Income Taxes
PEO Services’ earnings from continuing operations before income taxes
increased
$34.6 million
, or
17%
, to
$234.3 million
for fiscal
2014
, as compared to fiscal
2013
. Earnings from continuing operations before income taxes
increased
due to growth in earnings related to the increase in the average number of worksite employees. Overall margin increased approximately
20
basis points from
10.1%
to
10.3%
for fiscal
2014
, as compared to fiscal
2013
, due to lower direct product cost and operational efficiency, partially offset by higher selling expenses related to strong new business bookings.
Fiscal
2013
Compared to Fiscal
2012
Revenues
PEO Services' revenues
increase
d
$201.8 million
, or
11%
, to
$1,973.2 million
in fiscal
2013
, as compared to fiscal
2012
. Such revenues include pass-through costs of $1,513.5 million for fiscal 2013 and $1,363.6 million for fiscal 2012 associated with benefits coverage, workers' compensation coverage, and state unemployment taxes for worksite employees. The
increase
in revenues was due to a 9% increase in the average number of worksite employees, resulting from an increase in the number of new clients and growth in our existing clients.
28
Earnings from Continuing Operations before Income Taxes
PEO Services' earnings from continuing operations before income taxes
increase
d
$28.6 million
, or
17%
, to
$199.7 million
for fiscal
2013
, as compared to fiscal
2012
. Earnings from continuing operations before income taxes
increase
d due to growth in earnings related to the increase in the average number of worksite employees. Overall margin increased approximately 40 basis points from
9.7%
to
10.1%
for fiscal
2013
, as compared to fiscal
2012
, resulting from slower growth in pass-through costs.
Dealer Services
Fiscal
2014
Compared to Fiscal
2013
Revenues
Dealer Services' revenues
increased
$131.2 million
, or
7%
, to
$1,951.4 million
for fiscal
2014
, as compared to fiscal
2013
. This increase is driven by new business installed, improved client retention, and digital advertising revenues.
Earnings from Continuing Operations before Income Taxes
Dealer Services' earnings from continuing operations before income taxes
increased
$
52.8 million
, or
14%
, to
$428.1 million
for fiscal
2014
, as compared to fiscal
2013
. This
increase
was due to the
increase
in revenues of
$131.2 million
discussed above and was partially offset by higher operating expenses related to implementing and servicing new clients and products. Overall margin increased approximately
130
basis points from
20.6%
to
21.9%
for fiscal
2014
, as compared to fiscal
2013
, due to increased operating efficiencies and the benefits of non-recurring items.
Fiscal
2013
Compared to Fiscal
2012
Revenues
Dealer Services' revenues increased
$144.0 million
, or
9%
, to
$1,820.2 million
for fiscal
2013
, as compared to fiscal
2012
. Revenues for our Dealer Services business would have increased approximately 8% without the impact of acquisitions due to new clients, improved client retention, and growth in our key products during fiscal 2013, as compared to fiscal 2012. Revenues increased due to new business started during the year from growth in new business bookings and increased users of our digital marketing solutions. We continue to see increased utilization of our credit report and vehicle registration transactions, consistent with the steady improvement of the North American new car market.
Earnings from Continuing Operations before Income Taxes
Dealer Services' earnings from continuing operations before income taxes increased
$53.2 million
, or
17%
, to
$375.3 million
for fiscal
2013
, as compared to fiscal
2012
. This increase was due to the increase in revenues of
$144.0 million
discussed above and was partially offset by higher operating expenses related to implementing and servicing new clients and products. Overall margin increased approximately
140
basis points from
19.2%
to
20.6%
for fiscal 2013, as compared to fiscal 2012, due to increased operating scale and included approximately 10 basis points of margin improvement related to acquisitions completed in fiscal 2012.
Other
The primary components of the “Other” segment are the results of operations of ADP Indemnity, non-recurring gains and losses, miscellaneous processing services, such as customer financing transactions, and certain charges and expenses that have not been allocated to the reportable segments, such as stock-based compensation expense, the fiscal 2014 separation costs related to the planned separation of our Dealer Services business, and the fiscal 2013 goodwill impairment charge.
Stock-based compensation expense was
$138.4 million
,
$96.4 million
, and
$94.1 million
in fiscal
2014
,
2013
, and
2012
, respectively.
ADP Indemnity provides workers' compensation and employer's liability deductible reimbursement insurance protection for PEO Services worksite employees up to a $1 million per occurrence. PEO Services has secured specific per occurrence and aggregate stop loss insurance from a wholly-owned and regulated insurance carrier of AIG that covers all losses
29
in excess of the $1 million per occurrence and also any aggregate losses within the $1 million retention that collectively exceed a certain level in each policy year. We utilize historical loss experience and actuarial judgment to determine the estimated claim liability for the PEO Services business. Premiums are charged to PEO Services to cover the claims expected to be incurred by the PEO Services' worksite employees. Changes in estimated ultimate incurred losses are recognized by ADP Indemnity. During fiscal
2014
, ADP Indemnity paid a premium of
$142.4 million
to enter into a reinsurance arrangement with ACE American Insurance Company to cover substantially all losses incurred by ADP Indemnity for the fiscal
2014
policy year up to the $1 million per occurrence related to the workers' compensation and employer's liability deductible reimbursement insurance protection for PEO Services worksite employees. ADP Indemnity paid a premium of
$167.9 million
in July
2014
to enter into a reinsurance agreement with ACE American Insurance Company to cover substantially all losses for the year ended fiscal
2015
policy year on terms substantially similar to the fiscal
2014
reinsurance policy to cover losses up to the $1 million per occurrence related to the workers' compensation and employer's liability deductible reimbursement insurance protection for PEO Services worksite employees.
Our net realized gains on the sale of available-for-sale securities, including impairment losses, were
$16.5 million
,
$28.6 million
, and
$18.6 million
in each of fiscal
2014
,
2013
, and
2012
, respectively.
In fiscal 2013 we recorded a goodwill impairment charge of
$42.7 million
related to our ADP AdvancedMD business which is part of the Employer Services segment. There were no goodwill impairment charges in fiscal
2014
or
2012
. In fiscal 2014, we incurred $14.9 million of costs related to our planned separation of our Dealer Services business.
FINANCIAL CONDITION, LIQUIDITY AND CAPITAL RESOURCES
At
June 30, 2014
, cash and marketable securities were
$4,069.9 million
, stockholders' equity was
$6,670.2 million
, and the ratio of long-term debt-to-equity was
0.2%
. Working capital before funds held for clients and client funds obligations at
June 30, 2014
was
$1,630.8 million
, as compared to
$1,209.2 million
at
June 30, 2013
. The
increase
in working capital was primarily due to a decrease in our obligations under reverse repurchase agreements, an
increase
in accounts receivables, net, and an increase in cash and cash equivalents. As a result of short-term commercial paper obligations outstanding as of
June 30, 2014
, we reclassified funds held for clients to short-term marketable securities and cash and cash equivalents, which did not impact our working capital before clients fund obligations at June 30, 2014.
In fiscal 2015, as a result of the planned separation of our Dealer Services business, we expect to receive a dividend of at least $700 million, which we plan to return to our shareholders after the spin-off through share repurchases, depending upon market conditions.
Additionally, in the first quarter of fiscal 2015, we expect to monetize notes receivables related to our Dealer Services financing arrangements, which is expected to generate between $195 million and $205 million of cash.
Our principal sources of liquidity for operations are derived from cash generated through operations and through corporate cash and marketable securities on hand. We continued to generate positive cash flows from operations during fiscal
2014
, and we held approximately
$4.1 billion
of cash and marketable securities at
June 30, 2014
, which included $2.2 billion of cash and cash equivalents related to our commercial paper borrowings. We have the ability to borrow through our financing arrangements under our U.S. short-term commercial paper program and our U.S. and Canadian short-term reverse repurchase agreements to meet short-term funding requirements related to client funds obligations. Included in our cash and cash equivalents as of June 30, 2014 is
$0.8 billion
held by our foreign subsidiaries. Amounts held by foreign subsidiaries, if repatriated to the U.S., would generally be subject to foreign withholding and U.S. income taxes, adjusted for foreign tax credits. Our intent is to permanently reinvest these funds outside of the U.S. and our current plans do not demonstrate a need to repatriate them to fund our U.S. operations.
Our cash flows from operating, investing, and financing activities, as reflected in the Statements of Consolidated Cash Flows for the years ended
2014
,
2013
, and
2012
, are summarized as follows:
30
|
Years ended June 30,
|
$ Change
|
|||||||||||||||||||
|
2014
|
2013
|
2012
|
2014
|
2013
|
||||||||||||||||
|
Cash provided by (used in):
|
||||||||||||||||||||
|
Operating activities
|
$
|
1,821.4
|
|
$
|
1,577.2
|
|
$
|
1,910.2
|
|
$
|
244.2
|
|
$
|
(333.0
|
)
|
|||||
|
Investing activities
|
813.3
|
|
(1,578.4
|
)
|
3,243.6
|
|
2,391.7
|
|
(4,822.0
|
)
|
||||||||||
|
Financing activities
|
(2,358.2
|
)
|
151.0
|
|
(4,953.9
|
)
|
(2,509.2
|
)
|
5,104.9
|
|
||||||||||
|
Effect of exchange rate changes on cash and cash equivalents
|
8.0
|
|
1.2
|
|
(41.2
|
)
|
6.8
|
|
42.4
|
|
||||||||||
|
Net change in cash and cash equivalents
|
$
|
284.5
|
|
$
|
151.0
|
|
$
|
158.7
|
|
$
|
133.5
|
|
$
|
(7.7
|
)
|
|||||
Net cash flows
provided by
operating activities were
$1,821.4 million
for fiscal
2014
, as compared to $
1,577.2 million
for fiscal
2013
. The increase in net cash flows provided by operating activities was due to
$110.1 million
higher net earnings in fiscal
2014
, a lower pension contribution of $50.6 million, and a favorable change in the remaining components of net working capital. For the year ended June 30, 2014, Other operating activities include a $49.9 million use of funds and financing activities include a $49.9 million source of funds for excess tax benefits related to stock-based compensation. For the year ended June 30, 2013, Other operating activities include a $16.2 million use of funds and financing activities include a $16.2 million source of funds for excess tax benefits related to stock-based compensation.
Net cash flows
provided by
investing activities were $
813.3 million
for fiscal
2014
, as compared to net cash flows
used in
investing activities of $
1,578.4 million
for fiscal
2013
. The net change in cash
provided by
investing activities is due to the timing of receipts and disbursements of restricted cash and cash equivalents held to satisfy client funds obligations of
$2,698.8 million
and
a decrease
in the purchases of corporate and client funds marketable securities of
$1,487.7 million
, partially offset by the
a decrease
in proceeds from sales and maturities of corporate and clients funds marketable securities of
$1,579.1 million
.
Net cash flows
used in
financing activities were $
2,358.2 million
for fiscal
2014
as compared to net cash flows
provided by
financing activities of $
151.0 million
for fiscal
2013
. The net change in cash provided by financing activities is due to the net decrease in client funds obligations of
$4,128.0 million
as a result of the timing of cash received and payments made related to client funds and the timing of our borrowings and repayments of our reverse repurchase obligations, partially offset by the net increase in proceeds from commercial paper borrowings of
$2,173.0 million
.
We purchased approximately
9.0 million
shares of our common stock at an average price per share of
$75.06
during fiscal
2014
compared to purchases of
10.4 million
shares at an average price per share of
$61.89
during fiscal
2013
. From time to time, the Company may repurchase shares of its common stock under its authorized share repurchase programs. The Company considers several factors in determining when to execute share repurchases, including, among other things, actual and potential acquisition activity, cash balances and cash flows, issuances due to employee benefit plan activity, and market conditions.
Our U.S. short-term funding requirements related to client funds are sometimes obtained through a short-term commercial paper program, which provides for the issuance of up to
$7.25 billion
in aggregate maturity value of commercial paper, rather than liquidating previously-collected client funds that have already been invested in available-for-sale securities. In July 2014, we increased our U.S. short-term commercial paper program to provide for the issuance of up to $7.5 billion in aggregate maturity value. Our commercial paper program is rated A-1+ by Standard and Poor’s and Prime-1 by Moody’s. These ratings denote the highest quality commercial paper securities. Maturities of commercial paper can range from overnight to up to 364 days. For fiscal
2014
and
2013
, our average borrowings were
$2.3 billion
and
$2.4 billion
, respectively, at weighted average interest rate of
0.1%
and
0.2%
, respectively. The weighted average maturity of the Company’s commercial paper during fiscal
2014
approximated
two days
. We have successfully borrowed through the use of our commercial paper program on an as needed basis to meet short-term funding requirements related to client funds obligations. At
June 30, 2014
, we had
$2.2 billion
of commercial paper outstanding, which was subsequently repaid on
July 1, 2014
. At
June 30, 2013
, we had
no
outstanding obligations under our short-term commercial paper program.
Our U.S. and Canadian short-term funding requirements related to client funds obligations are sometimes obtained on a secured basis through the use of reverse repurchase agreements, which are collateralized principally by government and government agency securities, rather than liquidating previously-collected client funds that have already been invested in available-for-sale securities. These agreements generally have terms ranging from overnight to up to five business days. We have successfully borrowed through the use of reverse repurchase agreements on an as needed basis to meet short-term funding
31
requirements related to client funds obligations. At
June 30, 2014
, there were no outstanding obligations related to the reverse repurchase agreements. At
June 30, 2013
, we had
$245.9 million
of obligations outstanding related to reverse repurchase agreements, which were repaid on
July 2, 2013
. For fiscal
2014
and
2013
, we had average outstanding balances under reverse repurchase agreements of
$361.7 million
and
$362.0 million
, respectively, at weighted average interest rates of
0.5%
and
0.7%
, respectively. In addition, we have
$3.25 billion
available to us on a committed basis under these reverse repurchase agreements. We believe that we currently meet all conditions set forth in the committed reverse repurchase agreements to borrow thereunder, and we are not aware of any conditions that would prevent us from borrowing part or all of the
$3.25 billion
available to us under the committed reverse repurchase agreements.
We have a
$2.25 billion
, 364-day credit agreement with a group of lenders that matures in
June 2015
. In addition, we have a five-year
$2.0 billion
credit facility and a five-year
$3.25 billion
credit facility maturing in
June 2018
and
June 2019
, respectively, each with an accordion feature under which the aggregate commitment can be increased by $
500.0 million
, subject to the availability of additional commitments. The interest rate applicable to committed borrowings is tied to LIBOR, the effective federal funds rate, or the prime rate depending on the notification provided by the Company to the syndicated financial institutions prior to borrowing. The Company is also required to pay facility fees on the credit agreements. The primary uses of the credit facilities are to provide liquidity to the commercial paper program and funding for general corporate purposes, if necessary. We had no borrowings through
June 30, 2014
under the credit agreements. We believe that we currently meet all conditions set forth in the revolving credit agreements to borrow thereunder, and we are not aware of any conditions that would prevent us from borrowing part or all of the $7.5 billion available to us under the revolving credit agreements.
Our investment portfolio does not contain any asset-backed securities with underlying collateral of subprime mortgages, alternative-A mortgages, sub-prime auto loans or sub-prime home equity loans, collateralized debt obligations, collateralized loan obligations, credit default swaps, asset-backed commercial paper, derivatives, auction rate securities, structured investment vehicles or non-investment grade fixed-income securities. We own AAA rated senior tranches of fixed rate credit card, auto loan, rate reduction, and other asset-backed securities, secured predominately by prime collateral. All collateral on asset-backed securities is performing as expected. In addition, we own senior debt directly issued by Federal Home Loan Banks and Federal Farm Credit Banks. We do own mortgage-backed securities, which represent an undivided beneficial ownership interest in a group or pool of one or more residential mortgages. These securities are collateralized by the cash flows of 15-year and 30-year residential mortgages and are guaranteed by Federal National Mortgage Association and Federal Home Loan Mortgage Corporation as to the timely payment of principal and interest. Our client funds investment strategy is structured to allow us to average our way through an interest rate cycle by laddering the maturities of our investments out to five years (in the case of the extended portfolio) and out to ten years (in the case of the long portfolio). This investment strategy is supported by our short-term financing arrangements necessary to satisfy short-term funding requirements relating to client funds obligations.
Capital expenditures for continuing operations in fiscal
2014
were
$218.7 million
, as compared to
$174.8 million
in fiscal
2013
and
$146.2 million
in fiscal
2012
. The capital expenditures in fiscal
2014
related to our data center and other facility improvements made to support our operations. We expect capital expenditures in fiscal
2015
to be between $250 million and $275 million.
The following table provides a summary of our contractual obligations as of June 30,
2014
:
|
(In millions)
|
Payments due by period
|
|||||||||||||||||||||||
|
Contractual Obligations
|
Less than
1 year
|
1-3
years
|
3-5
years
|
More than
5 years
|
Unknown
|
Total
|
||||||||||||||||||
|
Debt Obligations (1)
|
$
|
2.3
|
|
$
|
5.1
|
|
$
|
6.9
|
|
$
|
—
|
|
$
|
—
|
|
$
|
14.3
|
|
||||||
|
Operating Lease and Software
License Obligations (2)
|
$
|
209.9
|
|
$
|
235.2
|
|
$
|
83.0
|
|
$
|
32.6
|
|
$
|
—
|
|
$
|
560.7
|
|
||||||
|
Purchase Obligations (3)
|
$
|
379.7
|
|
$
|
268.4
|
|
$
|
132.3
|
|
$
|
—
|
|
$
|
—
|
|
$
|
780.4
|
|
||||||
|
Obligations related to Unrecognized
Tax Benefits (4)
|
$
|
1.0
|
|
$
|
—
|
|
$
|
—
|
|
$
|
—
|
|
$
|
55.7
|
|
$
|
56.7
|
|
||||||
|
Other long-term liabilities reflected
on our Consolidated Balance Sheets:
|
||||||||||||||||||||||||
|
Compensation and Benefits (5)
|
$
|
5.4
|
|
$
|
191.6
|
|
$
|
100.4
|
|
$
|
265.0
|
|
$
|
80.0
|
|
$
|
642.4
|
|
||||||
|
Acquisition-related obligations (6)
|
$
|
0.3
|
|
$
|
—
|
|
$
|
—
|
|
$
|
—
|
|
$
|
—
|
|
$
|
0.3
|
|
||||||
|
Total
|
$
|
598.6
|
|
$
|
700.3
|
|
$
|
322.6
|
|
$
|
297.6
|
|
$
|
135.7
|
|
$
|
2,054.8
|
|
||||||
32
|
(1)
|
These amounts represent the principal repayments of our debt and
are included on our Consolidated Balance Sheets. The estimated interest payments due by the corresponding period above are $0.5 million, $0.6 million, $0.1 million, and $0.0 million, respectively, which have been excluded.
|
|
(2)
|
Included in these amounts are various facilities and equipment leases and software license agreements. We enter into operating leases in the normal course of business relating to facilities and equipment, as well as the licensing of software. The majority of our lease agreements have fixed payment terms based on the passage of time. Certain facility and equipment leases require payment of maintenance and real estate taxes and contain escalation provisions based on future adjustments in price indices. Our future operating lease obligations could change if we exit certain contracts or if we enter into additional operating lease agreements.
|
|
(3)
|
Purchase obligations are comprised of a
$167.9 million
reinsurance premium with ACE American Insurance Company for the fiscal
2015
policy year, as well as obligations related to purchase and maintenance agreements on our software, equipment, and other assets.
|
|
(4)
|
We made the determination that net cash payments expected to be paid within the next 12 months, related to unrecognized tax benefits of
$56.7 million
at June 30, 2014, are expected to be up to $1 million. We are unable to make reasonably reliable estimates as to the period beyond the next 12 months in which cash payments related to unrecognized tax benefits are expected to be paid.
|
|
(5)
|
Compensation and benefits primarily relates to amounts associated with our employee benefit plans and other compensation arrangements. These amounts exclude the estimated contributions to our defined benefit plans, which are expected to be
$9.5 million
in fiscal
2015
.
|
|
(6)
|
Acquisition-related obligations relate to deferred purchase consideration payments at future dates. A liability is established at the time of the acquisition for these fixed payments.
|
In addition to the obligations quantified in the table above, we had obligations for the remittance of funds relating to our payroll and payroll tax filing services. As of
June 30, 2014
, the obligations relating to these matters, which are expected to be paid in fiscal
2015
, total
$18,963.4 million
and were recorded in client funds obligations on our Consolidated Balance Sheets. We had
$19,258.0 million
of cash and marketable securities that have been impounded from our clients to satisfy such obligations recorded in funds held for clients on our Consolidated Balance Sheets as of
June 30, 2014
.
ADP Indemnity provides workers' compensation and employer's liability deductible reimbursement insurance protection for PEO Services worksite employees up to a $1 million per occurrence. PEO Services has secured specific per occurrence and aggregate stop loss insurance from a wholly-owned and regulated insurance carrier of AIG that covers all losses in excess of the $1 million per occurrence and also any aggregate losses within the $1 million retention that collectively exceed a certain level in certain policy years. Should AIG and its wholly-owned insurance company be unable to satisfy their contractual obligations, ADP would also become responsible for satisfying these worksite employee workers' compensation obligations for these claims in excess of the $1 million per occurrence. We utilize historical loss experience and actuarial judgment to determine the estimated claim liability for the PEO Services business. Premiums are charged to PEO Services to cover the claims expected to be incurred by the PEO Services' worksite employees. Changes in estimated ultimate incurred losses are recognized by ADP Indemnity. During fiscal 2014, ADP Indemnity paid a premium of $142.4 million to enter into a reinsurance agreement with ACE American Insurance Company to cover substantially all losses incurred by ADP Indemnity for the fiscal 2014 policy year up to the $1 million per occurrence related to the workers' compensation and employers' liability deductible reimbursement insurance protection for PEO Services worksite employees. ADP Indemnity paid a premium of
$167.9 million
in July
2014
to enter into a reinsurance agreement with ACE American Insurance Company to cover substantially all losses for the fiscal
2015
policy year on terms substantially similar to the fiscal
2014
reinsurance policy. At
June 30, 2014
, ADP Indemnity's total assets were $378.4 million to satisfy the actuarially estimated unpaid losses of $318.8 million for the policy years since July 1, 2003. ADP Indemnity paid claims of $45.3 million and $59.5 million, net of insurance recoveries, in fiscal
2014
and
2013
, respectively.
In the normal course of business, we also enter into contracts in which we make representations and warranties that relate to the performance of our services and products. We do not expect any material losses related to such representations and warranties.
Quantitative and Qualitative Disclosures about Market Risk
Our overall investment portfolio is comprised of corporate investments (cash and cash equivalents, short-term marketable securities, and long-term marketable securities) and client funds assets (funds that have been collected from clients but not yet remitted to the applicable tax authorities or client employees).
33
Our corporate investments are invested in cash and cash equivalents and highly liquid, investment-grade marketable securities. These assets are available for repurchases of common stock for treasury and/or acquisitions, as well as other corporate operating purposes. All of our short-term and long-term fixed-income securities are classified as available-for-sale securities.
Our client funds assets are invested with safety of principal, liquidity, and diversification as the primary objectives. Consistent with those objectives, we also seek to maximize interest income and to minimize the volatility of interest income. Client funds assets are invested in highly liquid, investment-grade marketable securities, with a maximum maturity of 10 years at the time of purchase and money market securities and other cash equivalents. At
June 30, 2014
, approximately 92% of the available-for-sale securities categorized as U.S. Treasury and direct obligations of U.S. government agencies were invested in senior, unsecured, non-callable debt directly issued by the Federal Home Loan Banks and Federal Farm Credit Banks.
We utilize a strategy by which we extend the maturities of our investment portfolio for funds held for clients and employ short-term financing arrangements to satisfy our short-term funding requirements related to client funds obligations. Our client funds investment strategy is structured to allow us to average our way through an interest rate cycle by laddering the maturities of our investments out to five years (in the case of the extended portfolio) and out to ten years (in the case of the long portfolio). As part of our client funds investment strategy, we use the daily collection of funds from our clients to satisfy other unrelated client funds obligations, rather than liquidating previously-collected client funds that have already been invested in available-for-sale securities. We minimize the risk of not having funds collected from a client available at the time such client’s obligation becomes due by impounding, in virtually all instances, the client’s funds in advance of the timing of payment of such client’s obligation. As a result of this practice, we have consistently maintained the required level of client funds assets to satisfy all of our obligations.
There are inherent risks and uncertainties involving our investment strategy relating to our client funds assets. Such risks include liquidity risk, including the risk associated with our ability to liquidate, if necessary, our available-for-sale securities in a timely manner in order to satisfy our client funds obligations. However, our investments are made with the safety of principal, liquidity, and diversification as the primary goals to minimize the risk of not having sufficient funds to satisfy all of our client funds obligations. We also believe we have significantly reduced the risk of not having sufficient funds to satisfy our client funds obligations by consistently maintaining access to other sources of liquidity, including our corporate cash balances, available borrowings under our
$7.5 billion
commercial paper program (rated A-1+ by Standard and Poor’s and Prime-1 (P1) by Moody’s, the highest possible credit ratings), our ability to execute reverse repurchase transactions ($
3.25 billion
of which is available on a committed basis), and available borrowings under our $7.5 billion committed revolving credit facilities. The reduced availability of financing during periods of economic turmoil, even to borrowers with the highest credit ratings, may limit our ability to access short-term debt markets to meet the liquidity needs of our business. In addition to liquidity risk, our investments are subject to interest rate risk and credit risk, as discussed below.
We have established credit quality, maturity, and exposure limits for our investments. The minimum allowed credit rating at time of purchase for corporate and Canadian provincial bonds is BBB, for asset-backed securities is AAA, and for municipal bonds is A. The maximum maturity at time of purchase for BBB rated securities is 5 years, for single A rated securities is 7 years, and for AA rated and AAA rated securities is 10 years. Time deposits and commercial paper must be rated A-1 and/or P-1. Money market funds must be rated AAA/Aaa-mf.
34
Details regarding our overall investment portfolio are as follows:
|
(Dollars in millions)
|
||||||||||||
|
Years ended June 30,
|
2014
|
2013
|
2012
|
|||||||||
|
Average investment balances at cost:
|
|
|
||||||||||
|
Corporate investments
|
$
|
4,072.4
|
|
$
|
4,200.3
|
|
$
|
4,024.6
|
|
|||
|
Funds held for clients
|
20,726.5
|
|
19,156.3
|
|
17,898.2
|
|
||||||
|
Total
|
$
|
24,798.9
|
|
$
|
23,356.6
|
|
$
|
21,922.8
|
|
|||
|
|
|
|
|
|||||||||
|
Average interest rates earned exclusive of realized
gains/(losses) on:
|
|
|
|
|
||||||||
|
Corporate investments
|
1.4
|
%
|
1.5
|
%
|
2.1
|
%
|
||||||
|
Funds held for clients
|
1.8
|
%
|
2.2
|
%
|
2.8
|
%
|
||||||
|
Total
|
1.7
|
%
|
2.1
|
%
|
2.6
|
%
|
||||||
|
Realized gains on available-for-sale securities
|
$
|
20.4
|
|
$
|
32.1
|
|
$
|
32.1
|
|
|||
|
Realized losses on available-for-sale securities
|
(3.9
|
)
|
(3.5
|
)
|
(7.7
|
)
|
||||||
|
Net realized gains on available-for-sale securities
|
$
|
16.5
|
|
$
|
28.6
|
|
$
|
24.4
|
|
|||
|
Impairment losses on available-for-sale securities
|
$
|
—
|
|
$
|
—
|
|
$
|
(5.8
|
)
|
|||
|
As of June 30:
|
||||||||||||
|
|
|
|
|
|||||||||
|
Net unrealized pre-tax gains on
available-for-sale securities
|
$
|
324.4
|
|
$
|
287.4
|
|
$
|
710.5
|
|
|||
|
Total available-for-sale securities at fair value
|
$
|
20,156.5
|
|
$
|
18,838.7
|
|
$
|
18,093.4
|
|
|||
We are exposed to interest rate risk in relation to securities that mature, as the proceeds from maturing securities are reinvested. Factors that influence the earnings impact of interest rate changes include, among others, the amount of invested funds and the overall portfolio mix between short-term and long-term investments. This mix varies during the fiscal year and is impacted by daily interest rate changes. The annualized interest rate earned on our entire portfolio
decrease
d from
2.1%
for fiscal
2013
to
1.7%
for fiscal
2014
. A hypothetical change in both short-term interest rates (e.g., overnight interest rates or the federal funds rate) and intermediate-term interest rates of 25 basis points applied to the estimated average investment balances and any related short-term borrowings would result in approximately a $10 million impact to earnings from continuing operations before income taxes over the ensuing twelve-month period ending
June 30,
2015
. A hypothetical change in only short-term interest rates of 25 basis points applied to the estimated average short-term investment balances and any related short-term borrowings would result in approximately a $5 million impact to earnings from continuing operations before income taxes over the ensuing twelve-month period ending
June 30,
2015
.
We are exposed to credit risk in connection with our available-for-sale securities through the possible inability of the borrowers to meet the terms of the securities. We limit credit risk by investing in investment-grade securities, primarily AAA and AA rated securities, as rated by Moody’s, Standard & Poor’s, and for Canadian securities, Dominion Bond Rating Service. Approximately
82%
of our available-for-sale securities held a AAA or AA rating at
June 30, 2014
. In addition, we limit amounts that can be invested in any security other than U.S. and Canadian government or government agency securities.
We operate and transact business in various foreign jurisdictions and are therefore exposed to market risk from changes in foreign currency exchange rates that could impact our consolidated results of operations, financial position, or cash flows. We manage our exposure to these market risks through our regular operating and financing activities and, when deemed appropriate, through the use of derivative financial instruments. We may use derivative financial instruments as risk management tools and not for trading purposes.
35
RECENTLY ISSUED ACCOUNTING PRONOUNCEMENTS
In May 2014, the Financial Accounting Standards Board ("FASB") issued Accounting Standards Update ("ASU") 2014-09, "Revenue from Contracts with Customers," which outlines a single comprehensive model for entities to use in accounting for revenue arising from contracts with customers and supersedes most current revenue recognition guidance, including industry-specific guidance. ASU 2014-09 requires an entity to recognize revenue depicting the transfer of goods or services to customers in an amount that reflects the consideration to which the entity expects to be entitled in exchange for those goods or services. ASU 2014-09 will also result in enhanced revenue related disclosures. ASU 2014-09 is effective for fiscal years, and interim reporting periods within those years, beginning after December 15, 2016. We have not yet determined the impact of ASU 2014-09 on our consolidated results of operations, financial condition, or cash flows.
In April 2014, the FASB issued ASU 2014-08, "Reporting Discontinued Operations and Disclosures of Disposals of Components of an Entity." ASU 2014-08 requires that a disposal representing a strategic shift that has (or will have) a major effect on an entity’s financial results or a business activity classified as held for sale should be reported as discontinued operations. ASU 2014-08 also expands the disclosure requirements for discontinued operations and adds new disclosures for individually significant dispositions that do not qualify as discontinued operations. ASU 2014-08 is effective prospectively for fiscal years, and interim reporting periods within those years, beginning after December 15, 2014. The impact of ASU 2014-08 is dependent upon the nature of dispositions, if any, after adoption.
In July 2013, the FASB issued ASU 2013-11, “Presentation of an Unrecognized Tax Benefit When a Net Operating Loss Carryforward, a Similar Tax Loss, or a Tax Credit Carryforward Exists.” ASU 2013-11 requires netting of unrecognized tax benefits against a deferred tax asset for a loss or other carryforward that would apply in settlement of the uncertain tax position. ASU 2013-11 is effective for fiscal years, and interim periods within those years, beginning after December 15, 2013. Retrospective adoption is permitted. The adoption of ASU 2013-11 will not have a material impact on our consolidated results of operations, financial condition, or cash flows.
In July 2013, we adopted ASU 2013-02, “Comprehensive Income (Topic 220): Reporting of Amounts Reclassified Out of Accumulated Other Comprehensive Income.” ASU 2013-02 requires entities to disclose the amount of income (loss) reclassified out of accumulated other comprehensive income to each respective line item on the income statement. The guidance allows companies to elect whether to disclose the reclassification either on the face of the income statement or in the notes to the financial statements, including cross-referencing other disclosures which provide additional details about these amounts. We have elected to disclose the reclassification in the notes to the financial statements with cross-references to other disclosures which provide additional details about the amounts. The adoption of ASU 2013-02 did not have an impact on our consolidated results of operations, financial condition, or cash flows.
CRITICAL ACCOUNTING POLICIES
Our consolidated financial statements and accompanying notes have been prepared in accordance with accounting principles generally accepted in the United States of America. The preparation of these financial statements requires management to make estimates, judgments, and assumptions that affect reported amounts of assets, liabilities, revenues, and expenses. We continually evaluate the accounting policies and estimates used to prepare the consolidated financial statements. The estimates are based on historical experience and assumptions believed to be reasonable under current facts and circumstances. Actual amounts and results could differ from these estimates made by management. Certain accounting policies that require significant management estimates and are deemed critical to our results of operations or financial position are discussed below.
Revenue Recognition
. Our revenues are primarily attributable to fees for providing services (
e.g.
, Employer Services' and PEO Services' payroll processing fees) as well as investment income on payroll funds, payroll tax filing funds and other Employer Services' client-related funds. PEO revenues are reported net of direct pass-through costs, which are costs billed and incurred for PEO Services' worksite employees, primarily consisting of payroll wages and payroll taxes. Benefits, workers' compensation and state unemployment tax fees for worksite employees are included in PEO revenues and the associated costs are included in operating expenses. We enter into agreements for a fixed fee per transaction (
e.g.
, number of payees or number of payrolls processed). Fees associated with services are recognized in the period services are rendered and earned under service arrangements with clients where service fees are fixed or determinable and collectability is reasonably assured. Our service fees are determined based on written price quotations or service agreements having stipulated terms and conditions that do not require management to make any significant judgments or assumptions regarding any potential uncertainties. Interest income on collected but not yet remitted funds held for clients is recognized in revenues as earned, as the collection, holding, and remittance of these funds are critical components of providing these services.
36
We also recognize revenues associated with the sale of software systems and associated software licenses (
e.g
., Dealer Services' dealer management systems). For a majority of our software sales arrangements, which provide hardware, software licenses, installation, and post-contract customer support, revenues are recognized ratably over the software license term, as vendor-specific objective evidence of the fair values of the individual elements in the sales arrangement does not exist. Changes to the elements in an arrangement and the ability to establish vendor-specific objective evidence for those elements could affect the timing of the revenue recognition.
We assess collectability of our revenues based primarily on the creditworthiness of the customer as determined by credit checks and analysis, as well as the customer's payment history. We do not believe that a change in our assumptions utilized in the collectability determination would result in a material change to revenues as no single customer accounts for a significant portion of our revenues.
Goodwill
. We account for goodwill in accordance with ASC 350-10, which states that goodwill should not be amortized, but instead tested for impairment annually and whenever events or changes in circumstances indicate the carrying value may not be recoverable. We perform this impairment test by first comparing the fair value of each reporting unit to its carrying amount. If the carrying value for a reporting unit exceeds its fair value, we then compare the implied fair value of our goodwill to the carrying amount in order to determine the amount of the impairment, if any. We determine the fair value of our reporting units using an equal weighted blended approach, which combines the income approach, which is the present value of expected cash flows, discounted at a risk-adjusted weighted-average cost of capital; and the market approach, which is based on using market multiples of companies in similar lines of business. Significant assumptions used in determining the fair value of our reporting units include projected revenue growth rates, profitability projections, working capital assumptions, the weighted-average cost of capital, the determination of appropriate market comparison companies, and terminal growth rates. We had
$3,113.8 million
of goodwill as of
June 30, 2014
. Based on the fair value analysis completed in the fourth quarter of
2014
, management concluded that fair value exceeded carrying value for all reporting units and that no reporting units were at risk of goodwill impairment. In completing the annual impairment test for fiscal
2014
, we evaluated the reasonableness of differences noted between the fair value and carrying value of each reporting unit. Given the significance of our goodwill, an adverse change to the fair value of goodwill and intangible assets could result in an impairment charge which could be material to our consolidated earnings if we are unable to generate the anticipated revenue growth, synergies and/or cost savings associated with our acquisitions. During the fourth quarter of fiscal 2013, there was an impairment charge of $42.7 million for the ADP AdvancedMD reporting unit.
Income Taxes.
The objectives of accounting for income taxes are to recognize the amount of taxes payable or refundable for the current year and deferred tax liabilities and assets for the future tax consequences of events that have been recognized in an entity's financial statements or tax returns. Judgment is required in addressing the future tax consequences of events that have been recognized in our consolidated financial statements or tax returns (
e.g.
, realization of deferred tax assets, changes in tax laws or interpretations thereof). In addition, we are subject to the continuous examination of our income tax returns by the IRS and other tax authorities. A change in the assessment of the outcomes of such matters could materially impact our consolidated financial statements.
There is a financial statement recognition threshold and measurement attribute for tax positions taken or expected to be taken in a tax return. Specifically, the likelihood of an entity's tax benefits being sustained must be “more likely than not” assuming that those positions will be examined by taxing authorities with full knowledge of all relevant information prior to recording the related tax benefit in the financial statements. If a tax position drops below the “more likely than not” standard, the benefit can no longer be recognized. Assumptions, judgment and the use of estimates are required in determining if the “more likely than not” standard has been met when developing the provision for income taxes. A change in the assessment of the “more likely than not” standard could materially impact our consolidated financial statements. As of
June 30, 2014
and
2013
, the Company's liabilities for unrecognized tax benefits, which include interest and penalties, were
$56.7 million
and
$70.7 million
, respectively.
If certain pending tax matters settle within the next twelve months, the total amount of unrecognized tax benefits may increase or decrease for all open tax years and jurisdictions. Based on current estimates, favorable settlements related to various jurisdictions and tax periods could increase earnings up to $10 million in the next twelve months. Audit outcomes and the timing of audit settlements are subject to significant uncertainty. We continually assess the likelihood and amount of potential adjustments and adjust the income tax provision, the current tax liability and deferred taxes in the period in which the facts that give rise to a revision become known.
Stock-Based Compensation.
We measure stock-based compensation expense based on the fair value of the award on the date of grant. We determine the fair value of stock options issued by using a binomial option-pricing model. The binomial option-pricing model considers a range of assumptions related to volatility, dividend yield, risk-free interest rate and employee
37
exercise behavior. Expected volatilities utilized in the binomial option-pricing model are based on a combination of implied market volatilities, historical volatility of our stock price and other factors. Similarly, the dividend yield is based on historical experience and expected future changes. The risk-free rate is derived from the U.S. Treasury yield curve in effect at the time of grant. The binomial option-pricing model also incorporates exercise and forfeiture assumptions based on an analysis of historical data. The expected life of the stock option grants is derived from the output of the binomial model and represents the period of time that options granted are expected to be outstanding. Determining these assumptions is subjective and complex, and therefore, a change in the assumptions utilized could impact the calculation of the fair value of our stock options.
The information called by this item is provided under the caption "Quantitative and Qualitative Disclosures About Market Risk" under "Item 7 - Management's Discussion and Analysis of Financial Condition and Results of Operation.
38
REPORT OF INDEPENDENT REGISTERED PUBLIC ACCOUNTING FIRM
To the Board of Directors and Stockholders of
Automatic Data Processing, Inc.
Roseland, New Jersey
We have audited the accompanying consolidated balance sheets of Automatic Data Processing, Inc. and subsidiaries (the "Company") as of
June 30, 2014
and
2013
, and the related statements of consolidated earnings, comprehensive income, stockholders' equity, and cash flows for each of the three years in the period ended
June 30, 2014
. Our audits also included the consolidated financial statement schedule listed in the Index at Item 15(a) 2. These financial statements and financial statement schedule are the responsibility of the Company's management. Our responsibility is to express an opinion on the consolidated financial statements and consolidated financial statement schedule based on our audits.
We conducted our audits in accordance with the standards of the Public Company Accounting Oversight Board (United States). Those standards require that we plan and perform the audit to obtain reasonable assurance about whether the financial statements are free of material misstatement. An audit includes examining, on a test basis, evidence supporting the amounts and disclosures in the financial statements. An audit also includes assessing the accounting principles used and significant estimates made by management, as well as evaluating the overall financial statement presentation. We believe that our audits provide a reasonable basis for our opinion.
In our opinion, such consolidated financial statements present fairly, in all material respects, the financial position of Automatic Data Processing, Inc. and subsidiaries as of
June 30, 2014
and
2013
, and the results of their operations and their cash flows for each of the three years in the period ended
June 30, 2014
, in conformity with accounting principles generally accepted in the United States of America. Also, in our opinion, the consolidated financial statement schedule, when considered in relation to the basic consolidated financial statements taken as a whole, presents fairly, in all material respects, the information set forth therein.
We have also audited, in accordance with the standards of the Public Company Accounting Oversight Board (United States), the Company's internal control over financial reporting as of
June 30, 2014
, based on the criteria established in Internal Control-Integrated Framework (1992) issued by the Committee of Sponsoring Organizations of the Treadway Commission and our report dated
August 8, 2014
expressed an unqualified opinion on the Company's internal control over financial reporting.
|
/s/ Deloitte & Touche LLP
|
Parsippany, New Jersey
August 8, 2014
39
(In millions, except per share amounts)
|
Years ended June 30,
|
2014
|
2013
|
2012
|
|||||||||
|
REVENUES:
|
|
|
||||||||||
|
Revenues, other than interest on funds held
for clients and PEO revenues
|
$
|
9,575.2
|
|
$
|
8,906.0
|
|
$
|
8,341.9
|
|
|||
|
Interest on funds held for clients
|
373.7
|
|
420.9
|
|
493.3
|
|
||||||
|
PEO revenues (A)
|
2,257.6
|
|
1,960.7
|
|
1,760.2
|
|
||||||
|
TOTAL REVENUES
|
12,206.5
|
|
11,287.6
|
|
10,595.4
|
|
||||||
|
EXPENSES:
|
|
|
|
|
||||||||
|
Costs of revenues:
|
|
|
|
|
||||||||
|
Operating expenses
|
6,248.6
|
|
5,731.5
|
|
5,355.2
|
|
||||||
|
Systems development and programming costs
|
718.0
|
|
654.3
|
|
592.7
|
|
||||||
|
Depreciation and amortization
|
254.8
|
|
252.7
|
|
256.0
|
|
||||||
|
TOTAL COSTS OF REVENUES
|
7,221.4
|
|
6,638.5
|
|
6,203.9
|
|
||||||
|
Selling, general, and administrative expenses
|
2,762.4
|
|
2,617.4
|
|
2,452.9
|
|
||||||
|
Separation costs
|
14.9
|
|
—
|
|
—
|
|
||||||
|
Goodwill impairment
|
—
|
|
42.7
|
|
—
|
|
||||||
|
Interest expense
|
6.1
|
|
9.1
|
|
7.7
|
|
||||||
|
TOTAL EXPENSES
|
10,004.8
|
|
9,307.7
|
|
8,664.5
|
|
||||||
|
Other income, net
|
(72.9
|
)
|
(96.2
|
)
|
(170.8
|
)
|
||||||
|
EARNINGS FROM CONTINUING OPERATIONS
BEFORE INCOME TAXES
|
2,274.6
|
|
2,076.1
|
|
2,101.7
|
|
||||||
|
Provision for income taxes
|
772.0
|
|
718.0
|
|
726.5
|
|
||||||
|
NET EARNINGS FROM CONTINUING OPERATIONS
|
$
|
1,502.6
|
|
$
|
1,358.1
|
|
$
|
1,375.2
|
|
|||
|
EARNINGS FROM DISCONTINUED OPERATIONS BEFORE INCOME TAXES
|
19.5
|
|
75.0
|
|
20.4
|
|
||||||
|
Provision for income taxes
|
6.2
|
|
27.3
|
|
7.1
|
|
||||||
|
NET EARNINGS FROM DISCONTINUED OPERATIONS
|
$
|
13.3
|
|
$
|
47.7
|
|
$
|
13.3
|
|
|||
|
NET EARNINGS
|
$
|
1,515.9
|
|
$
|
1,405.8
|
|
$
|
1,388.5
|
|
|||
|
Basic Earnings Per Share from Continuing Operations
|
$
|
3.14
|
|
$
|
2.81
|
|
$
|
2.82
|
|
|||
|
Basic Earnings Per Share from Discontinued Operations
|
0.03
|
|
0.10
|
|
0.03
|
|
||||||
|
BASIC EARNINGS PER SHARE
|
$
|
3.17
|
|
$
|
2.91
|
|
$
|
2.85
|
|
|||
|
Diluted Earnings Per Share from Continuing Operations
|
$
|
3.11
|
|
$
|
2.79
|
|
$
|
2.79
|
|
|||
|
Diluted Earnings Per Share from Discontinued Operations
|
0.03
|
|
0.10
|
|
0.03
|
|
||||||
|
DILUTED EARNINGS PER SHARE
|
$
|
3.14
|
|
$
|
2.89
|
|
$
|
2.82
|
|
|||
|
Basic weighted average shares outstanding
|
478.9
|
|
482.7
|
|
487.3
|
|
||||||
|
Diluted weighted average shares outstanding
|
483.1
|
|
487.1
|
|
492.2
|
|
||||||
(A) Professional Employer Organization (“PEO”) revenues are net of direct pass-through costs, primarily consisting of payroll wages and payroll taxes, of
$23,192.2 million
,
$19,956.2 million
, and
$17,792.2 million
, respectively.
See notes to the consolidated financial statements.
40
Statements of Consolidated Comprehensive Income
(In millions)
|
Years ended June 30,
|
2014
|
2013
|
2012
|
|||||||||
|
Net earnings
|
$
|
1,515.9
|
|
$
|
1,405.8
|
|
$
|
1,388.5
|
|
|||
|
Other comprehensive income:
|
||||||||||||
|
Currency translation adjustments
|
59.9
|
|
(2.4
|
)
|
(141.1
|
)
|
||||||
|
Unrealized net gains/(losses) on available-for-sale securities
|
53.5
|
|
(394.6
|
)
|
158.1
|
|
||||||
|
Tax effect
|
(18.2
|
)
|
138.5
|
|
(54.4
|
)
|
||||||
|
Reclassification of net gains on available-for-sale securities to net earnings
|
(16.5
|
)
|
(28.6
|
)
|
(18.6
|
)
|
||||||
|
Tax effect
|
6.1
|
|
10.1
|
|
6.4
|
|
||||||
|
Pension net gains/(losses) arising during the period
|
102.8
|
|
68.2
|
|
(149.7
|
)
|
||||||
|
Tax effect
|
(39.7
|
)
|
(25.7
|
)
|
52.3
|
|
||||||
|
Reclassification of pension liability adjustment to net earnings
|
20.7
|
|
31.7
|
|
15.5
|
|
||||||
|
Tax effect
|
(5.8
|
)
|
(12.0
|
)
|
(5.4
|
)
|
||||||
|
Other comprehensive income/(loss), net of tax
|
162.8
|
|
(214.8
|
)
|
(136.9
|
)
|
||||||
|
Comprehensive income
|
$
|
1,678.7
|
|
$
|
1,191.0
|
|
$
|
1,251.6
|
|
|||
See notes to the consolidated financial statements.
41
(In millions, except per share amounts)
|
June 30,
|
2014
|
2013
|
||||||
|
Assets
|
||||||||
|
Current assets:
|
|
|
||||||
|
Cash and cash equivalents (A) (B)
|
$
|
1,983.6
|
|
$
|
1,699.1
|
|
||
|
Short-term marketable securities (B)
|
2,032.2
|
|
28.0
|
|
||||
|
Accounts receivable, net
|
1,800.4
|
|
1,595.3
|
|
||||
|
Other current assets
|
759.2
|
|
646.6
|
|
||||
|
Assets of discontinued operations
|
—
|
|
16.7
|
|
||||
|
Total current assets before funds held for clients
|
6,575.4
|
|
3,985.7
|
|
||||
|
Funds held for clients
|
19,258.0
|
|
22,228.8
|
|
||||
|
Total current assets
|
25,833.4
|
|
26,214.5
|
|
||||
|
Long-term marketable securities (A)
|
54.1
|
|
314.0
|
|
||||
|
Long-term receivables, net
|
155.4
|
|
138.7
|
|
||||
|
Property, plant and equipment, net
|
777.4
|
|
728.6
|
|
||||
|
Other assets
|
1,485.3
|
|
1,189.9
|
|
||||
|
Goodwill
|
3,113.8
|
|
3,039.2
|
|
||||
|
Intangible assets, net
|
632.3
|
|
643.2
|
|
||||
|
Total assets
|
$
|
32,051.7
|
|
$
|
32,268.1
|
|
||
|
Liabilities and Stockholders' Equity
|
|
|
|
|
||||
|
Current liabilities:
|
|
|
|
|
||||
|
Accounts payable
|
$
|
169.7
|
|
$
|
156.5
|
|
||
|
Accrued expenses and other current liabilities
|
1,314.9
|
|
1,178.3
|
|
||||
|
Accrued payroll and payroll-related expenses
|
707.1
|
|
631.3
|
|
||||
|
Dividends payable
|
226.9
|
|
206.7
|
|
||||
|
Short-term deferred revenues
|
332.6
|
|
314.6
|
|
||||
|
Obligations under reverse repurchase agreements (A)
|
—
|
|
245.9
|
|
||||
|
Obligations under commercial paper borrowings (B)
|
2,173.0
|
|
—
|
|
||||
|
Income taxes payable
|
20.4
|
|
39.0
|
|
||||
|
Liabilities of discontinued operations
|
—
|
|
4.2
|
|
||||
|
Total current liabilities before client funds obligations
|
4,944.6
|
|
2,776.5
|
|
||||
|
Client funds obligations
|
18,963.4
|
|
21,956.3
|
|
||||
|
Total current liabilities
|
23,908.0
|
|
24,732.8
|
|
||||
|
Long-term debt
|
11.5
|
|
14.7
|
|
||||
|
Other liabilities
|
660.0
|
|
603.1
|
|
||||
|
Deferred income taxes
|
288.8
|
|
234.4
|
|
||||
|
Long-term deferred revenues
|
513.2
|
|
493.2
|
|
||||
|
Total liabilities
|
25,381.5
|
|
26,078.2
|
|
||||
|
Stockholders' equity:
|
|
|
|
|
||||
|
Preferred stock, $1.00 par value:
Authorized, 0.3 shares; issued, none
|
—
|
|
—
|
|
||||
|
Common stock, $0.10 par value: Authorized, 1,000.0 shares; issued 638.7 shares at June 30, 2014
and 2013; outstanding, 480.2 and 482.6 shares at June 30, 2014 and June 30, 2013, respectively
|
63.9
|
|
63.9
|
|
||||
|
Capital in excess of par value
|
545.2
|
|
456.9
|
|
||||
|
Retained earnings
|
13,632.9
|
|
13,020.3
|
|
||||
|
Treasury stock - at cost: 158.5 and 156.1 shares
at June 30, 2014 and June 30, 2013, respectively
|
(7,750.0
|
)
|
(7,366.6
|
)
|
||||
|
Accumulated other comprehensive income
|
178.2
|
|
15.4
|
|
||||
|
Total stockholders’ equity
|
6,670.2
|
|
6,189.9
|
|
||||
|
Total liabilities and stockholders’ equity
|
$
|
32,051.7
|
|
$
|
32,268.1
|
|
||
(A) As of
June 30, 2013
,
$245.2 million
of long-term marketable securities and
$0.7 million
of cash and cash equivalents have been pledged as collateral under the Company's reverse repurchase agreements (see Note 10).
(B) As of
June 30, 2014
,
$2,015.8 million
of short-term marketable securities and
$183.8 million
of cash and cash equivalents are related to the Company's outstanding commercial paper borrowings (see Note 10).
See notes to the consolidated financial statements.
42
Statements of Consolidated Stockholders' Equity
(In millions, except per share amounts)
|
Common Stock
|
Capital in Excess of Par Value
|
Retained Earnings
|
Treasury Stock
|
Accumulated Other Comprehensive Income
|
|||||||||||||||||||
|
Shares
|
Amount
|
||||||||||||||||||||||
|
Balance at June 30, 2011
|
638.7
|
|
$
|
63.9
|
|
$
|
489.5
|
|
$
|
11,803.9
|
|
$
|
(6,714.0
|
)
|
$
|
367.1
|
|
||||||
|
Net earnings
|
—
|
|
—
|
|
—
|
|
1,388.5
|
|
—
|
|
—
|
|
|||||||||||
|
Other comprehensive loss
|
—
|
|
—
|
|
—
|
|
—
|
|
—
|
|
(136.9
|
)
|
|||||||||||
|
Stock-based compensation expense
|
—
|
|
—
|
|
78.7
|
|
—
|
|
—
|
|
—
|
|
|||||||||||
|
Issuances relating to stock
compensation plans
|
—
|
|
—
|
|
(106.0
|
)
|
—
|
|
356.5
|
|
—
|
|
|||||||||||
|
Tax benefits from stock compensation plans
|
—
|
|
—
|
|
24.2
|
|
—
|
|
—
|
|
—
|
|
|||||||||||
|
Treasury stock acquired (14.6 shares)
|
—
|
|
—
|
|
—
|
|
—
|
|
(747.3
|
)
|
—
|
|
|||||||||||
|
Dividends ($1.55 per share)
|
—
|
|
—
|
|
—
|
|
(754.1
|
)
|
—
|
|
—
|
|
|||||||||||
|
Balance at June 30, 2012
|
638.7
|
|
$
|
63.9
|
|
$
|
486.4
|
|
$
|
12,438.3
|
|
$
|
(7,104.8
|
)
|
$
|
230.2
|
|
||||||
|
Net earnings
|
—
|
|
—
|
|
—
|
|
1,405.8
|
|
—
|
|
—
|
|
|||||||||||
|
Other comprehensive loss
|
—
|
|
—
|
|
—
|
|
—
|
|
—
|
|
(214.8
|
)
|
|||||||||||
|
Stock-based compensation expense
|
—
|
|
—
|
|
79.2
|
|
—
|
|
—
|
|
—
|
|
|||||||||||
|
Issuances relating to stock
compensation plans
|
—
|
|
—
|
|
(148.3
|
)
|
—
|
|
384.7
|
|
—
|
|
|||||||||||
|
Tax benefits from stock compensation plans
|
—
|
|
—
|
|
39.6
|
|
—
|
|
—
|
|
—
|
|
|||||||||||
|
Treasury stock acquired (10.4 shares)
|
—
|
|
—
|
|
—
|
|
—
|
|
(646.5
|
)
|
—
|
|
|||||||||||
|
Dividends ($1.70 per share)
|
—
|
|
—
|
|
—
|
|
(823.8
|
)
|
—
|
|
—
|
|
|||||||||||
|
Balance at June 30, 2013
|
638.7
|
|
$
|
63.9
|
|
$
|
456.9
|
|
$
|
13,020.3
|
|
$
|
(7,366.6
|
)
|
$
|
15.4
|
|
||||||
|
Net earnings
|
—
|
|
—
|
|
—
|
|
1,515.9
|
|
—
|
|
—
|
|
|||||||||||
|
Other comprehensive income
|
—
|
|
—
|
|
—
|
|
—
|
|
—
|
|
162.8
|
|
|||||||||||
|
Stock-based compensation expense
|
—
|
|
—
|
|
110.3
|
|
—
|
|
—
|
|
—
|
|
|||||||||||
|
Issuances relating to stock
compensation plans
|
—
|
|
—
|
|
(78.6
|
)
|
—
|
|
314.5
|
|
—
|
|
|||||||||||
|
Tax benefits from stock compensation plans
|
—
|
|
—
|
|
56.6
|
|
—
|
|
—
|
|
—
|
|
|||||||||||
|
Treasury stock acquired (9.0 shares)
|
—
|
|
—
|
|
—
|
|
—
|
|
(697.9
|
)
|
—
|
|
|||||||||||
|
Dividends ($1.88 per share)
|
—
|
|
—
|
|
—
|
|
(903.3
|
)
|
—
|
|
—
|
|
|||||||||||
|
Balance at June 30, 2014
|
638.7
|
|
$
|
63.9
|
|
$
|
545.2
|
|
$
|
13,632.9
|
|
$
|
(7,750.0
|
)
|
$
|
178.2
|
|
||||||
See notes to the consolidated financial statements.
43
(In millions)
|
Years ended June 30,
|
2014
|
2013
|
2012
|
|||||||||
|
Cash Flows from Operating Activities:
|
|
|
||||||||||
|
Net earnings
|
$
|
1,515.9
|
|
$
|
1,405.8
|
|
$
|
1,388.5
|
|
|||
|
Adjustments to reconcile net earnings to cash flows provided by operating activities:
|
|
|
|
|
||||||||
|
Depreciation and amortization
|
336.2
|
|
316.7
|
|
319.3
|
|
||||||
|
Deferred income taxes
|
(50.3
|
)
|
24.7
|
|
36.1
|
|
||||||
|
Stock-based compensation expense
|
138.4
|
|
96.4
|
|
94.1
|
|
||||||
|
Net pension expense
|
29.7
|
|
43.7
|
|
36.7
|
|
||||||
|
Net realized gain from the sales of marketable securities
|
(16.5
|
)
|
(28.6
|
)
|
(24.4
|
)
|
||||||
|
Net amortization of premiums and accretion of discounts on available-for-sale securities
|
94.4
|
|
79.3
|
|
60.0
|
|
||||||
|
Impairment losses on available-for-sale securities
|
—
|
|
—
|
|
5.8
|
|
||||||
|
Impairment losses on assets held for sale
|
—
|
|
—
|
|
2.2
|
|
||||||
|
Goodwill impairment
|
—
|
|
42.7
|
|
—
|
|
||||||
|
Gain on sale of assets
|
—
|
|
—
|
|
(66.0
|
)
|
||||||
|
Gains on sales of buildings
|
—
|
|
(2.2
|
)
|
—
|
|
||||||
|
Gain on sale of discontinued businesses, net of tax
|
(10.5
|
)
|
(36.7
|
)
|
—
|
|
||||||
|
Other
|
(21.6
|
)
|
8.4
|
|
14.6
|
|
||||||
|
Changes in operating assets and liabilities, net of effects from acquisitions
|
|
|
|
|
||||||||
|
and divestitures of businesses:
|
|
|
|
|
||||||||
|
Increase in accounts receivable
|
(204.0
|
)
|
(218.2
|
)
|
(41.7
|
)
|
||||||
|
Increase in other assets
|
(253.2
|
)
|
(283.5
|
)
|
(71.7
|
)
|
||||||
|
Increase / (decrease) in accounts payable
|
9.7
|
|
(10.1
|
)
|
10.3
|
|
||||||
|
Increase in accrued expenses and other liabilities
|
253.0
|
|
135.4
|
|
134.5
|
|
||||||
|
Operating activities of discontinued operations
|
0.2
|
|
3.4
|
|
11.9
|
|
||||||
|
Net cash flows provided by operating activities
|
1,821.4
|
|
1,577.2
|
|
1,910.2
|
|
||||||
|
Cash Flows from Investing Activities:
|
|
|
|
|
||||||||
|
Purchases of corporate and client funds marketable securities
|
(3,414.9
|
)
|
(4,902.6
|
)
|
(5,113.5
|
)
|
||||||
|
Proceeds from the sales and maturities of corporate and client funds marketable securities
|
2,059.5
|
|
3,638.6
|
|
3,962.2
|
|
||||||
|
Net decrease / (increase) in restricted cash and cash equivalents held to satisfy client funds obligations
|
2,537.8
|
|
(161.0
|
)
|
4,855.0
|
|
||||||
|
Capital expenditures
|
(216.6
|
)
|
(174.6
|
)
|
(140.1
|
)
|
||||||
|
Additions to intangibles
|
(151.1
|
)
|
(108.3
|
)
|
(109.5
|
)
|
||||||
|
Acquisitions of businesses, net of cash acquired
|
(25.7
|
)
|
(42.0
|
)
|
(265.7
|
)
|
||||||
|
Proceeds from the sale of property, plant, and equipment and other assets
|
0.4
|
|
10.0
|
|
71.6
|
|
||||||
|
Investing activities of discontinued operations
|
(0.5
|
)
|
(0.6
|
)
|
—
|
|
||||||
|
Proceeds from the sale of businesses included in discontinued operations
|
24.4
|
|
161.4
|
|
—
|
|
||||||
|
Other
|
—
|
|
0.7
|
|
(16.4
|
)
|
||||||
|
Net cash flows provided by (used in) investing activities
|
813.3
|
|
(1,578.4
|
)
|
3,243.6
|
|
||||||
|
Cash Flows from Financing Activities:
|
|
|
|
|
||||||||
|
Net (decrease) / increase in client funds obligations
|
(2,989.5
|
)
|
1,138.5
|
|
(3,726.6
|
)
|
||||||
|
Payments of debt
|
(3.3
|
)
|
(17.5
|
)
|
(2.0
|
)
|
||||||
|
Repurchases of common stock
|
(667.3
|
)
|
(647.3
|
)
|
(741.3
|
)
|
||||||
|
Proceeds from stock purchase plan and exercises of stock options
|
219.1
|
|
235.3
|
|
250.0
|
|
||||||
|
Dividends paid
|
(883.1
|
)
|
(805.5
|
)
|
(739.7
|
)
|
||||||
|
Net (repayments of) / proceeds from reverse repurchase agreements
|
(245.9
|
)
|
245.9
|
|
—
|
|
||||||
|
Net proceeds from issuance of commercial paper
|
2,173.0
|
|
—
|
|
—
|
|
||||||
|
Other
|
38.8
|
|
1.6
|
|
5.7
|
|
||||||
|
Net cash flows (used in) / provided by financing activities
|
(2,358.2
|
)
|
151.0
|
|
(4,953.9
|
)
|
||||||
|
Effect of exchange rate changes on cash and cash equivalents
|
8.0
|
|
1.2
|
|
(41.2
|
)
|
||||||
|
Net change in cash and cash equivalents
|
284.5
|
|
151.0
|
|
158.7
|
|
||||||
|
Cash and cash equivalents of continuing operations, beginning of period
|
1,699.1
|
|
1,548.1
|
|
1,389.4
|
|
||||||
|
Cash and cash equivalents of continuing operations, end of period
|
$
|
1,983.6
|
|
$
|
1,699.1
|
|
$
|
1,548.1
|
|
|||
See notes to the consolidated financial statements.
44
Notes to Consolidated Financial Statements
(Tabular dollars in millions, except per share amounts)
A. Basis of Preparation.
The accompanying Consolidated Financial Statements and footnotes thereto of Automatic Data Processing, Inc. and its subsidiaries (“ADP” or the “Company”) have been prepared in accordance with accounting principles generally accepted in the United States of America (“U.S. GAAP”). Intercompany balances and transactions have been eliminated in consolidation.
The preparation of financial statements in conformity with U.S. GAAP requires management to make estimates and assumptions that affect the assets, liabilities, revenue, costs, expenses, and accumulated other comprehensive income that are reported in the Consolidated Financial Statements and footnotes thereto. Actual results may differ from those estimates.
B. Description of Business.
The Company is a provider of technology-based outsourcing solutions to employers and vehicle retailers and manufacturers. The Company classifies its operations into the following reportable segments: Employer Services; Professional Employer Organization (“PEO”) Services; and Dealer Services. The primary components of the “Other” segment are the results of operations of ADP Indemnity (a wholly-owned captive insurance company that provides workers' compensation and employer's liability deductible reimbursement insurance protection for PEO Services worksite employees), non-recurring gains and losses, miscellaneous processing services, such as customer financing transactions, and certain charges and expenses that have not been allocated to the reportable segments, such as stock-based compensation expense, the goodwill impairment charge for the year ended June 30, 2013 ("fiscal 2013"), and direct and incremental costs incurred to consummate the planned separation of the Dealer Services business.
C. Revenue Recognition.
Revenues are primarily attributable to fees for providing services (
e.g.,
Employer Services' payroll processing fees) as well as investment income on payroll funds, payroll tax filing funds and other Employer Services' client-related funds. The Company enters into agreements for a fixed fee per transaction (
e.g.,
number of payees or number of payrolls processed). Fees associated with services are recognized in the period services are rendered and earned under service arrangements with clients where service fees are fixed or determinable and collectability is reasonably assured. Service fees are determined based on written price quotations or service agreements having stipulated terms and conditions that do not require management to make any significant judgments or assumptions regarding any potential uncertainties.
PEO revenues are reported net of direct pass-through costs, which are costs billed and incurred for PEO Services worksite employees, primarily consisting of payroll wages and payroll taxes. Benefits, workers' compensation, and state unemployment tax fees for worksite employees are included in PEO revenues and the associated costs are included in operating expenses.
Interest income on collected but not yet remitted funds held for clients is recognized in revenues as earned, as the collection, holding and remittance of these funds are critical components of providing these services.
The Company also recognizes revenues associated with the sale of software systems and associated software licenses (
e.g.
, Dealer Services' dealer management systems). For a majority of our software sales arrangements, which provide hardware, software licenses, installation, and post-contract customer support, revenues are recognized ratably over the software license term, as vendor-specific objective evidence of the fair values of the individual elements in the sales arrangement does not exist.
The Company assesses the collectability of revenues based primarily on the creditworthiness of the customer as determined by credit checks and analysis, as well as the customer's payment history.
D. Cash and Cash Equivalents.
Investment securities with a maturity of ninety days or less at the time of purchase are considered cash equivalents. The fair value of our cash and cash equivalents approximates carrying value.
E. Corporate Investments and Funds Held for Clients.
All of the Company's marketable securities are considered to be “available-for-sale” and, accordingly, are carried on the Consolidated Balance Sheets at fair value. Unrealized gains and losses, net of the related tax effect, are excluded from earnings and are reported as a separate component of accumulated other comprehensive income on the Consolidated Balance Sheets until realized. Realized gains and losses from the sale of available-for-sale securities are determined on a specific-identification basis and are included in other income, net on the Statements of Consolidated Earnings.
If the fair value of an available-for-sale debt security is below its amortized cost, the Company assesses whether it intends to
45
sell the security or if it is more likely than not the Company will be required to sell the security before recovery. If either of those two conditions are met, the Company would recognize a charge in earnings equal to the entire difference between the security's amortized cost basis and its fair value. If the Company does not intend to sell a security or it is not more likely than not that it will be required to sell the security before recovery, the unrealized loss is separated into an amount representing the credit loss, which is recognized in earnings, and the amount related to all other factors, which is recognized in accumulated other comprehensive income.
Premiums and discounts are amortized or accreted over the life of the related available-for-sale security as an adjustment to yield using the effective-interest method. Dividend and interest income are recognized when earned.
F. Fair Value Measurements.
Fair value is defined as the price that would be received to sell an asset or paid to transfer a liability (an exit price) in an orderly transaction between market participants at the measurement date and is based upon the Company’s principal or most advantageous market for a specific asset or liability.
U.S. GAAP provides for a three-level hierarchy of inputs to valuation techniques used to measure fair value, defined as follows:
Level 1 Fair value is determined based upon quoted prices for identical assets or liabilities that are traded in active markets.
Level 2 Fair value is determined based upon inputs other than quoted prices included in Level 1 that are observable for the asset or liability, either directly or indirectly, for substantially the full term of the asset or liability, including:
· quoted prices for similar assets or liabilities in active markets;
· quoted prices for identical or similar assets or liabilities in markets that are not active;
· inputs other than quoted prices that are observable for the asset or liability; or
· inputs that are derived principally from or corroborated by observable market data by correlation or other means.
Level 3 Fair value is determined based upon inputs that are unobservable and reflect the Company’s own assumptions about the assumptions that market participants would use in pricing the asset or liability based upon the best information available in the circumstances (e.g., internally derived assumptions surrounding the timing and amount of expected cash flows).
Available-for-sale securities included in Level 1 are valued using closing prices for identical instruments that are traded on active exchanges. Over
99%
of the Company's available-for-sale securities included in Level 2 are valued utilizing inputs obtained from an independent pricing service. To determine the fair value of the Company's Level 2 investments, a variety of inputs are utilized, including benchmark yields, reported trades, non-binding broker/dealer quotes, issuer spreads, two-sided markets, benchmark securities, bids, offers, reference data, new issue data, and monthly payment information. The Company reviews the values generated by the independent pricing service for reasonableness by comparing the valuations received from the independent pricing service to valuations from at least one other observable source. The Company has not adjusted the prices obtained from the independent pricing service. The Company has no available-for-sale securities included in Level 3.
The Company's assessment of the significance of a particular input to the fair value measurement requires judgment and may affect the classification of assets and liabilities within the fair value hierarchy. In certain instances, the inputs used to measure fair value may meet the definition of more than one level of the fair value hierarchy. The significant input with the lowest level priority is used to determine the applicable level in the fair value hierarchy.
G. Long-term Receivables.
Long-term receivables primarily relate to notes receivable from the sale of computer systems to auto, truck, motorcycle, marine, recreational vehicle, and heavy equipment retailers and manufacturers. Unearned income from finance receivables represents the excess of gross receivables over the sales price of the computer systems financed. Unearned income is amortized using the effective-interest method to maintain a constant rate of return over the term of each contract.
Notes receivable aged over
30
days past due are considered delinquent and notes receivable aged over
60
days past due with known collection issues are placed on non-accrual status. Interest revenue is not recognized on notes receivable while on non-accrual status. Cash payments received on non-accrual receivables are applied towards the principal. When notes receivable on non-accrual status are again less than
60
days past due, recognition of interest revenue for notes receivable is resumed.
The allowance for doubtful accounts on long-term receivables is the Company's best estimate of the amount of probable credit losses related to the Company's existing note receivables.
46
H. Property, Plant and Equipment.
Property, plant and equipment is stated at cost and depreciated over the estimated useful lives of the assets using the straight-line method. Leasehold improvements are amortized over the shorter of the term of the lease or the estimated useful lives of the improvements. The estimated useful lives of assets are primarily as follows:
|
Data processing equipment
|
2 to 5 years
|
|
Buildings
|
20 to 40 years
|
|
Furniture and fixtures
|
3 to 7 years
|
I. Goodwill.
Goodwill is not amortized, but is instead tested for impairment annually and whenever events or changes in circumstances indicate the carrying value may not be recoverable. The Company performs this impairment test by first comparing the fair value of each reporting units to its carrying amount. If the carrying value for a reporting unit exceeds its fair value, the Company would then compare the implied fair value of goodwill to the carrying amount in order to determine the amount of the impairment, if any. The Company determines the estimated fair value of its reporting units using an equal weighted blended approach, which combines the income approach, which is the present value of expected cash flows, discounted at a risk-adjusted weighted-average cost of capital; and the market approach, which is based on using market multiples of companies in similar lines of business. Significant assumptions used in determining the fair value of our reporting units include projected revenue growth rates, profitability projections, working capital assumptions, the weighted average cost of capital, the determination of appropriate market comparison companies, and terminal growth rates. The Company had
$3,113.8 million
of goodwill as of
June 30, 2014
. Based on the fair value analysis completed in the fourth quarter of
2014
, the Company concluded that goodwill fair value exceeded the carrying value for all reporting units. In fiscal 2013, the Company recognized a
$42.7 million
impairment on its AdvancedMD reporting unit.
J. Impairment of Long-Lived Assets.
Long-lived assets are reviewed for impairment whenever events or changes in circumstances indicate that the carrying amount of an asset may not be recoverable. Recoverability of assets to be held and used is measured by a comparison of the carrying amount of an asset to estimated undiscounted future cash flows expected to be generated by the asset. If the carrying amount of an asset exceeds its estimated future cash flows, an impairment charge is recognized for the amount by which the carrying amount of the asset exceeds the fair value of the asset.
K. Foreign Currency Translation.
The net assets of the Company's foreign subsidiaries are translated into U.S. dollars based on exchange rates in effect for each period, and revenues and expenses are translated at average exchange rates in the periods. Gains or losses from balance sheet translation are included in accumulated other comprehensive income on the Consolidated Balance Sheets. Currency transaction gains or losses, which are included in the results of operations, are immaterial for all periods presented.
L. Foreign Currency Risk Management Programs and Derivative Financial Instruments.
The Company transacts business in various foreign jurisdictions and is therefore exposed to market risk from changes in foreign currency exchange rates that could impact its consolidated results of operations, financial position, or cash flows. The Company manages its exposure to these market risks through its regular operating and financing activities and, when deemed appropriate, through the use of derivative financial instruments. The Company does not use derivative financial instruments for trading purposes.
Derivative financial instruments are measured at fair value and are recognized as assets or liabilities on the Consolidated Balance Sheets with changes in the fair value of the derivatives recognized in either net earnings from continuing operations or accumulated other comprehensive income, depending on the timing and designated purpose of the derivative.
There were no derivative financial instruments outstanding at
June 30, 2014
or
June 30, 2013
.
47
M. Earnings per Share (“EPS”).
The calculations of basic and diluted EPS are as follows:
|
Years ended June 30,
|
Basic
|
Effect of Employee Stock Option Shares
|
Effect of
Employee
Restricted
Stock
Shares
|
Diluted
|
||||||||||
|
2014
|
|
|
|
|
|
|
|
|
||||||
|
Net earnings from continuing operations
|
$
|
1,502.6
|
|
|
|
|
|
$
|
1,502.6
|
|
||||
|
Weighted average shares (in millions)
|
478.9
|
|
2.7
|
|
1.5
|
|
483.1
|
|
||||||
|
EPS from continuing operations
|
$
|
3.14
|
|
|
|
|
|
$
|
3.11
|
|
||||
|
2013
|
|
|
|
|
|
|
|
|
||||||
|
Net earnings from continuing operations
|
$
|
1,358.1
|
|
|
|
|
|
$
|
1,358.1
|
|
||||
|
Weighted average shares (in millions)
|
482.7
|
|
3.3
|
|
1.1
|
|
487.1
|
|
||||||
|
EPS from continuing operations
|
$
|
2.81
|
|
|
|
|
|
$
|
2.79
|
|
||||
|
2012
|
|
|
|
|
|
|
|
|
||||||
|
Net earnings from continuing operations
|
$
|
1,375.2
|
|
|
|
|
|
$
|
1,375.2
|
|
||||
|
Weighted average shares (in millions)
|
487.3
|
|
3.8
|
|
1.1
|
|
492.2
|
|
||||||
|
EPS from continuing operations
|
$
|
2.82
|
|
|
|
|
|
$
|
2.79
|
|
||||
Options to purchase
1.5 million
,
1.2 million
, and
0.9 million
shares of common stock for the year ended
June 30, 2014
("fiscal
2014
"), fiscal
2013
, and the year ended June 30,
2012
("fiscal
2012
"), respectively, were excluded from the calculation of diluted earnings per share because their exercise prices exceeded the average market price of outstanding common shares for the respective periods.
N. Stock-Based Compensation.
The Company recognizes stock-based compensation expense in net earnings based on the fair value of the award on the date of the grant. The Company determines the fair value of stock options issued using a binomial option-pricing model. The binomial option-pricing model considers a range of assumptions related to volatility, dividend yield, risk-free interest rate, and employee exercise behavior. Expected volatilities utilized in the binomial option-pricing model are based on a combination of implied market volatilities, historical volatility of the Company's stock price, and other factors. Similarly, the dividend yield is based on historical experience and expected future changes. The risk-free rate is derived from the U.S. Treasury yield curve in effect at the time of grant. The binomial option-pricing model also incorporates exercise and forfeiture assumptions based on an analysis of historical data. The expected life of a stock option grant is derived from the output of the binomial model and represents the period of time that options granted are expected to be outstanding.
O. Internal Use Software.
Expenditures for major software purchases and software developed or obtained for internal use are capitalized and amortized over a three to five-year period on a straight-line basis. The Company's policy provides for the capitalization of external direct costs of materials and services associated with developing or obtaining internal use computer software. In addition, the Company also capitalizes certain payroll and payroll-related costs for employees who are directly associated with internal use computer software projects. The amount of capitalizable payroll costs with respect to these employees is limited to the time directly spent on such projects. Costs associated with preliminary project stage activities, training, maintenance, and all other post-implementation stage activities are expensed as incurred. The Company also expenses internal costs related to minor upgrades and enhancements, as it is impractical to separate these costs from normal maintenance activities.
P. Computer Software to be Sold, Leased, or Otherwise Marketed.
The Company capitalizes certain costs of computer software to be sold, leased, or otherwise marketed. The Company's policy provides for the capitalization of all software production costs upon reaching technological feasibility for a specific product. Technological feasibility is attained when software products have a completed working model whose consistency with the overall product design has been confirmed by testing. Costs incurred prior to the establishment of technological feasibility are expensed as incurred. The establishment of technological feasibility requires judgment by management and in many instances is only attained a short time prior to the general release of the software. Upon the general release of the software product to customers, capitalization ceases and such costs are amortized over a three-year period on a straight-line basis. Maintenance-related costs are expensed as incurred.
48
Q. Income Taxes.
The objectives of accounting for income taxes are to recognize the amount of taxes payable or refundable for the current year and deferred tax liabilities and assets for the future tax consequences of events that have been recognized in an entity's financial statements or tax returns. The Company is subject to the continuous examination of our income tax returns by the Internal Revenue Service (“IRS”) and other tax authorities.
There is a financial statement recognition threshold and measurement attribute for tax positions taken or expected to be taken in a tax return. Specifically, the likelihood of an entity's tax benefits being sustained must be “more likely than not,” assuming that these positions will be examined by taxing authorities with full knowledge of all relevant information prior to recording the related tax benefit in the financial statements. If a tax position drops below the “more likely than not” standard, the benefit can no longer be recognized. Assumptions, judgment, and the use of estimates are required in determining if the “more likely than not” standard has been met when developing the provision for income taxes. As of
June 30, 2014
and
2013
, the Company's liabilities for unrecognized tax benefits, which include interest and penalties, were
$56.7 million
and
$70.7 million
, respectively.
If certain pending tax matters settle within the next twelve months, the total amount of unrecognized tax benefits may increase or decrease for all open tax years and jurisdictions. Based on current estimates, favorable settlements related to various jurisdictions and tax periods could increase earnings by up to
$10 million
. Audit outcomes and the timing of audit settlements are subject to significant uncertainty. We continually assess the likelihood and amount of potential adjustments and adjust the income tax provision, the current tax liability, and deferred taxes in the period in which the facts that give rise to a revision become known.
R. Workers' Compensation Costs.
The Company employs a third-party actuary to assist in determining the estimated claim liability related to workers' compensation and employer's liability coverage for PEO Services worksite employees. In estimating ultimate loss rates, we utilize historical loss experience, exposure data, and actuarial judgment, together with a range of inputs which are primarily based upon the worksite employee's job responsibilities, their location, the historical frequency and severity of workers' compensation claims, and an estimate of future cost trends. For each reporting period, changes in the actuarial assumptions resulting from changes in actual claims experience and other trends are incorporated into our workers' compensation claims cost estimates. The Company has secured specific per occurrence insurance that caps the exposure for each claim at
$1 million
per occurrence, and has also secured aggregate stop loss insurance that caps aggregate losses at a certain level in each policy year. Additionally, for fiscal 2013 and 2014, the Company entered into reinsurance arrangements to cover substantially all losses incurred by the Company for the fiscal 2013 and 2014 policy years up to the
$1 million
per occurrence related to workers' compensation and employer's liability deductible reimbursement insurance protection for PEO services worksite employees.
S. Recently Issued Accounting Pronouncements.
In May 2014, the Financial Accounting Standards Board ("FASB") issued Accounting Standards Update ("ASU") 2014-09, "Revenue from Contracts with Customers," which outlines a single comprehensive model for entities to use in accounting for revenue arising from contracts with customers and supersedes most current revenue recognition guidance, including industry-specific guidance. ASU 2014-09 requires an entity to recognize revenue depicting the transfer of goods or services to customers in an amount that reflects the consideration to which the entity expects to be entitled in exchange for those goods or services. ASU 2014-09 will also result in enhanced revenue related disclosures. ASU 2014-09 is effective for fiscal years, and interim reporting periods within those years, beginning after December 15, 2016. The Company has not yet determined the impact of ASU 2014-09 on its consolidated results of operations, financial condition, or cash flows.
In April 2014, the FASB issued ASU 2014-08, "Reporting Discontinued Operations and Disclosures of Disposals of Components of an Entity." ASU 2014-08 requires that a disposal representing a strategic shift that has (or will have) a major effect on an entity’s financial results or a business activity classified as held for sale should be reported as discontinued operations. ASU 2014-08 also expands the disclosure requirements for discontinued operations and adds new disclosures for individually significant dispositions that do not qualify as discontinued operations. ASU 2014-08 is effective prospectively for fiscal years, and interim reporting periods within those years, beginning after December 15, 2014. The impact of ASU 2014-08 is dependent upon the nature of dispositions, if any, after adoption.
In July 2013, the FASB issued ASU 2013-11, “Presentation of an Unrecognized Tax Benefit When a Net Operating Loss Carryforward, a Similar Tax Loss, or a Tax Credit Carryforward Exists.” ASU 2013-11 requires netting of unrecognized tax benefits against a deferred tax asset for a loss or other carryforward that would apply in settlement of the uncertain tax position. ASU 2013-11 is effective for fiscal years, and interim periods within those years, beginning after December 15, 2013. Retrospective adoption is permitted. The adoption of ASU 2013-11 will not have a material impact on the Company's consolidated results of operations, financial condition, or cash flows.
49
In July 2013, the Company adopted ASU 2013-02, “Comprehensive Income (Topic 220): Reporting of Amounts Reclassified Out of Accumulated Other Comprehensive Income.” ASU 2013-02 requires entities to disclose the amount of income (loss) reclassified out of accumulated other comprehensive income to each respective line item on the income statement. The guidance allows companies to elect whether to disclose the reclassification either on the face of the income statement or in the notes to the financial statements, including cross-referencing other disclosures which provide additional details about these amounts. The Company has elected to disclose the reclassification in the notes to the financial statements with cross-references to other disclosures which provide additional details about the amounts. The adoption of ASU 2013-02 did not have an impact on the Company's consolidated results of operations, financial condition, or cash flows.
On
April 10, 2014
, the Company announced that its Board of Directors approved a plan to spin-off the Company’s Dealer Services business into an independently publicly-traded company through a tax-free spin-off of 100% of Dealer Services to ADP shareholders. The Company has requested an opinion from Paul, Weiss, Rifkind, Wharton & Garrison LLP, its counsel, to the effect that, based on certain facts, assumptions, representations and undertakings set forth in the request, the distribution will qualify as a transaction that is tax-free under Section 355 and other related provisions of the Internal Revenue Code. The distribution is conditioned upon, among other things, the receipt by the Company of such a favorable opinion of counsel confirming the distribution’s tax-free status. The separation is subject to other conditions, including necessary regulatory approvals. ADP has also requested rulings from the IRS and other jurisdictions with respect to certain discrete and significant issues arising in connection with the transactions being effected in connection with the separation and distribution.
On
June 10, 2014
, Dealer Services (under the name of “Dealer Services Holdings LLC”) filed a registration statement on Form 10 with the Securities and Exchange Commission. Additionally, Dealer Services Holdings LLC filed an amendment to its Form 10 on July 25, 2014. The financial presentation of Dealer Services in the Form 10 differs from the financial presentation of the Dealer Services segment in ADP’s financial statements due to adjustments made in the Form 10 to reflect the additional corporate expenses and other operating costs of Dealer Services as if it were a stand-alone company.
Upon completion of the spin-off, ADP shareholders will have separate ownership interests in ADP and Dealer Services. ADP and Dealer Services will be two distinct businesses with separate ownership and management. To facilitate Dealer Services’ separation from ADP, ADP will provide certain services to Dealer Services during a transition period following completion of the spin-off. ADP expects to incur approximately
$40.0 million
to
$50.0 million
of incremental separation costs during the fiscal year ended June 30, 2015 ("fiscal 2015") related to the spin-off. Incremental costs associated with the spin-off of
$14.9 million
for fiscal
2014
are included in separation costs on the Statements of Consolidated Earnings and are principally related to professional services.
Other income, net consists of the following:
|
Years ended June 30,
|
2014
|
2013
|
2012
|
|||||||||
|
Interest income on corporate funds
|
$
|
(56.2
|
)
|
$
|
(64.5
|
)
|
$
|
(85.2
|
)
|
|||
|
Realized gains on available-for-sale securities
|
(20.4
|
)
|
(32.1
|
)
|
(32.1
|
)
|
||||||
|
Realized losses on available-for-sale securities
|
3.9
|
|
3.5
|
|
7.7
|
|
||||||
|
Impairment losses on available-for-sale securities
|
—
|
|
—
|
|
5.8
|
|
||||||
|
Impairment losses on assets held for sale
|
—
|
|
—
|
|
2.2
|
|
||||||
|
Gains on sales of buildings
|
—
|
|
(2.2
|
)
|
—
|
|
||||||
|
Gain on sale of assets
|
—
|
|
—
|
|
(66.0
|
)
|
||||||
|
Other, net
|
(0.2
|
)
|
(0.9
|
)
|
(3.2
|
)
|
||||||
|
Other income, net
|
$
|
(72.9
|
)
|
$
|
(96.2
|
)
|
$
|
(170.8
|
)
|
|||
During fiscal 2013, the Company completed the sale of
two
buildings that were previously classified as assets held for sale on the Consolidated Balance Sheets and, as a result, recorded gains of
$2.2 million
in other income, net, on the Statements of Consolidated Earnings.
During fiscal 2012, the Company sold assets related to rights and obligations to resell a third-party expense management platform, and, as a result, recorded a gain of
$66.0 million
in other income, net, on the Statements of Consolidated Earnings.
50
During fiscal 2012, the Company completed the sale of
two
buildings for their combined carrying value of
$6.9 million
, net of selling costs. The Company had previously classified these assets as assets held for sale on the Consolidated Balance Sheets and recognized impairment losses within other income, net on the Statements of Consolidated Earnings of
$2.2 million
in fiscal 2012.
During fiscal 2012, the Company concluded that it had the intent to sell certain available-for-sale securities with unrealized losses of
$5.8 million
. As such, the Company recorded an impairment charge of
$5.8 million
in other income, net, on the Statements of Consolidated Earnings.
Assets acquired and liabilities assumed in business combinations were recorded on the Company’s Consolidated Balance Sheets as of the respective acquisition dates based upon their estimated fair values at such dates. The results of operations of businesses acquired by the Company have been included in the Statements of Consolidated Earnings since their respective dates of acquisition. The excess of the purchase price over the estimated fair values of the underlying assets acquired and liabilities assumed was allocated to goodwill. In certain circumstances, the allocations of the excess purchase price are based upon preliminary estimates and assumptions and subject to revision when the Company receives final information, including appraisals and other analysis. Accordingly, the measurement period for such purchase price allocations will end when the information, or the facts and circumstances, becomes available, but will not exceed twelve months.
The Company acquired
two
businesses during fiscal
2014
for approximately
$28.5 million
, net of cash acquired. As of
June 30, 2014
, the Company had not yet finalized the purchase price allocations for these
two
acquisitions.
The Company acquired
two
businesses during fiscal
2013
for approximately
$40.4 million
, net of cash acquired. The Company finalized the purchase price allocation for these
two
acquisitions during fiscal
2014
and adjusted the preliminary values allocated to certain assets and liabilities in order to reflect final information received.
The Company acquired
seven
businesses in fiscal
2012
for an aggregate purchase price of approximately
$292.3 million
, net of cash acquired. These acquisitions resulted in approximately
$182.6 million
of goodwill. Intangible assets acquired, which total approximately
$90.0 million
for these
seven
acquisitions, included customer contracts and lists, software, and trademarks that are being amortized over a weighted average life of approximately
11 years
.
The Company reviews estimates of the fair value of contingent consideration ("earn-out") expected to be paid in the event that certain performance metrics are achieved over an earn-out period and makes adjustments when facts and circumstances warrant. The Company made contingent payments relating to previously consummated acquisitions of
$3.5 million
,
$14.5 million
, and
$2.8 million
during fiscal
2014
,
2013
, and
2012
.
The acquisitions discussed above for fiscal
2014
,
2013
, and
2012
were not material, either individually or in the aggregate, to the Company's operations, financial position, or cash flows.
On
February 28, 2014
, the Company completed the sale of its Occupational Health and Safety services business ("OHS") for a pre-tax gain of
$15.6 million
, less costs to sell, and recorded such gain within earnings from discontinued operations on the Statements of Consolidated Earnings. In connection with the disposal of OHS, the Company classified the results of this business as discontinued operations for all periods presented. OHS was previously reported in the Employer Services segment.
On
December 17, 2012
, the Company completed the sale of its Taxware Enterprise Service business ("Taxware") for a pre-tax gain of
$58.8 million
, less costs to sell, and recorded such gain within earnings from discontinued operations on the Statements of Consolidated Earnings. In connection with the disposal of Taxware, the Company has classified the results of this business as discontinued operations for all periods presented. Taxware was previously reported in the Employer Services segment.
51
Operating results for discontinued operations were as follows:
|
Years ended June 30,
|
2014
|
2013
|
2012
|
|||||||||
|
Revenues
|
$
|
13.0
|
|
$
|
46.3
|
|
$
|
69.8
|
|
|||
|
Earnings from discontinued operations before income taxes
|
3.9
|
|
16.2
|
|
20.4
|
|
||||||
|
Provision for income taxes
|
1.1
|
|
5.2
|
|
7.1
|
|
||||||
|
Net earnings from discontinued operations before gain on disposal of
discontinued operations
|
2.8
|
|
11.0
|
|
13.3
|
|
||||||
|
Gain on disposal of discontinued operations, less costs to sell
|
15.6
|
|
58.8
|
|
—
|
|
||||||
|
Provision for income taxes
|
5.1
|
|
22.1
|
|
—
|
|
||||||
|
Net gain on disposal of discontinued operations
|
10.5
|
|
36.7
|
|
—
|
|
||||||
|
Net earnings from discontinued operations
|
$
|
13.3
|
|
$
|
47.7
|
|
$
|
13.3
|
|
|||
There were no assets or liabilities of discontinued operations as of
June 30, 2014
. The following are the major classes of assets and liabilities related to the discontinued operations as of
June 30, 2013
.
|
|
June 30, 2013
|
||
|
Assets:
|
|
||
|
Accounts receivable, net
|
$
|
3.0
|
|
|
Goodwill
|
13.4
|
|
|
|
Other assets
|
0.3
|
|
|
|
Total assets
|
$
|
16.7
|
|
|
|
|||
|
Liabilities:
|
|||
|
Accounts payable
|
$
|
0.8
|
|
|
Accrued expenses and other current liabilities
|
0.3
|
|
|
|
Accrued payroll and payroll related expenses
|
0.8
|
|
|
|
Deferred revenues
|
1.8
|
|
|
|
Income taxes payable
|
0.5
|
|
|
|
Total liabilities
|
$
|
4.2
|
|
52
Corporate investments and funds held for clients at
June 30, 2014
and
2013
were as follows:
|
|
June 30, 2014
|
||||||||||||||
|
Amortized
Cost
|
Gross
Unrealized
Gains
|
Gross
Unrealized
Losses
|
Fair Value (A)
|
||||||||||||
|
Type of issue:
|
|
|
|
||||||||||||
|
Money market securities and other cash equivalents
|
$
|
3,171.4
|
|
$
|
—
|
|
$
|
—
|
|
$
|
3,171.4
|
|
|||
|
Available-for-sale securities:
|
|
|
|
|
|
|
|
|
|||||||
|
Corporate bonds
|
8,720.1
|
|
171.1
|
|
(15.0
|
)
|
8,876.2
|
|
|||||||
|
U.S. Treasury and direct obligations of
U.S. government agencies
|
6,051.4
|
|
107.3
|
|
(11.7
|
)
|
6,147.0
|
|
|||||||
|
Asset-backed securities
|
1,822.6
|
|
6.1
|
|
(6.9
|
)
|
1,821.8
|
|
|||||||
|
Canadian government obligations and
Canadian government agency obligations |
1,031.4
|
|
7.6
|
|
(0.8
|
)
|
1,038.2
|
|
|||||||
|
Canadian provincial bonds
|
747.7
|
|
25.3
|
|
(2.5
|
)
|
770.5
|
|
|||||||
|
Municipal bonds
|
543.3
|
|
19.4
|
|
(0.5
|
)
|
562.2
|
|
|||||||
|
Other securities
|
915.6
|
|
25.7
|
|
(0.7
|
)
|
940.6
|
|
|||||||
|
Total available-for-sale securities
|
19,832.1
|
|
362.5
|
|
(38.1
|
)
|
20,156.5
|
|
|||||||
|
Total corporate investments and funds held for clients
|
$
|
23,003.5
|
|
$
|
362.5
|
|
$
|
(38.1
|
)
|
$
|
23,327.9
|
|
|||
(A) Included within available-for-sale securities are corporate investments with fair values of
$2,086.3 million
and funds held for clients with fair values of
$18,070.2 million
. All available-for-sale securities were included in Level 2.
|
|
June 30, 2013
|
||||||||||||||
|
Amortized
Cost
|
Gross
Unrealized
Gains
|
Gross
Unrealized
Losses
|
Fair Value (B)
|
||||||||||||
|
Type of issue:
|
|
|
|
|
|
|
|
|
|||||||
|
Money market securities and other cash equivalents
|
$
|
5,431.2
|
|
$
|
—
|
|
$
|
—
|
|
$
|
5,431.2
|
|
|||
|
Available-for-sale securities:
|
|
|
|
|
|
|
|
|
|||||||
|
Corporate bonds
|
7,868.3
|
|
166.2
|
|
(56.7
|
)
|
7,977.8
|
|
|||||||
|
U.S. Treasury and direct obligations of
U.S. government agencies
|
5,983.7
|
|
152.6
|
|
(37.4
|
)
|
6,098.9
|
|
|||||||
|
Asset-backed securities
|
1,374.1
|
|
5.3
|
|
(19.7
|
)
|
1,359.7
|
|
|||||||
|
Canadian government obligations and
Canadian government agency obligations |
998.2
|
|
10.7
|
|
(4.5
|
)
|
1,004.4
|
|
|||||||
|
Canadian provincial bonds
|
695.7
|
|
20.7
|
|
(5.6
|
)
|
710.8
|
|
|||||||
|
Municipal bonds
|
536.9
|
|
16.7
|
|
(4.4
|
)
|
549.2
|
|
|||||||
|
Other securities
|
1,094.4
|
|
46.3
|
|
(2.8
|
)
|
1,137.9
|
|
|||||||
|
Total available-for-sale securities
|
18,551.3
|
|
418.5
|
|
(131.1
|
)
|
18,838.7
|
|
|||||||
|
Total corporate investments and funds held for clients
|
$
|
23,982.5
|
|
$
|
418.5
|
|
$
|
(131.1
|
)
|
$
|
24,269.9
|
|
|||
(B) Included within available-for-sale securities are corporate investments with fair values of
$342.0 million
and funds held for clients with fair values of
$18,496.7 million
. At
June 30, 2013
Level 1 securities included
$9.5 million
of corporate investments classified within "Other securities," all remaining available-for-sale securities were included in Level 2.
For a description of the fair value hierarchy and the Company's fair value methodologies, including the use of an independent third-party pricing service, see Note 1 "Summary of Significant Accounting Policies". The Company did not transfer any assets
53
between Levels during the years ended
June 30, 2014
or
2013
. In addition, the Company did not adjust the prices obtained from the independent pricing service. The Company has no available-for-sale securities included in Level 1 or Level 3 as of June 30, 2014.
The unrealized losses and fair values of available-for-sale securities that have been in an unrealized loss position for a period of less than and greater than 12 months as of
June 30, 2014
, are as follows:
|
June 30, 2014
|
|||||||||||||||||||||||
|
Securities in unrealized loss position less than 12 months
|
Securities in unrealized loss position greater than 12 months
|
Total
|
|||||||||||||||||||||
|
Unrealized
losses |
Fair market
value |
Unrealized
losses |
Fair market
value |
Gross
unrealized losses |
Fair
market value |
||||||||||||||||||
|
Corporate bonds
|
$
|
(0.9
|
)
|
$
|
313.8
|
|
$
|
(14.1
|
)
|
$
|
1,026.0
|
|
$
|
(15.0
|
)
|
$
|
1,339.8
|
|
|||||
|
U.S. Treasury and direct obligations of
U.S. government agencies
|
(0.3
|
)
|
84.6
|
|
(11.4
|
)
|
944.8
|
|
(11.7
|
)
|
1,029.4
|
|
|||||||||||
|
Asset-backed securities
|
(0.7
|
)
|
325.4
|
|
(6.2
|
)
|
555.5
|
|
(6.9
|
)
|
880.9
|
|
|||||||||||
|
Canadian government obligations and
Canadian government agency obligations |
(0.8
|
)
|
127.2
|
|
—
|
|
—
|
|
(0.8
|
)
|
127.2
|
|
|||||||||||
|
Canadian provincial bonds
|
(0.9
|
)
|
75.2
|
|
(1.6
|
)
|
118.6
|
|
(2.5
|
)
|
193.8
|
|
|||||||||||
|
Municipal bonds
|
(0.1
|
)
|
42.0
|
|
(0.4
|
)
|
22.6
|
|
(0.5
|
)
|
64.6
|
|
|||||||||||
|
Other securities
|
—
|
|
13.9
|
|
(0.7
|
)
|
45.7
|
|
(0.7
|
)
|
59.6
|
|
|||||||||||
|
|
$
|
(3.7
|
)
|
$
|
982.1
|
|
$
|
(34.4
|
)
|
$
|
2,713.2
|
|
$
|
(38.1
|
)
|
$
|
3,695.3
|
|
|||||
The unrealized losses and fair values of available-for-sale securities that have been in an unrealized loss position for a period of less than and greater than 12 months as of
June 30, 2013
are as follows:
|
June 30, 2013
|
|||||||||||||||||||||||
|
Securities in unrealized loss position less than 12 months
|
Securities in unrealized loss position greater than 12 months
|
Total
|
|||||||||||||||||||||
|
Unrealized
losses |
Fair market
value |
Unrealized
losses |
Fair market
value |
Gross
unrealized losses |
Fair
market value |
||||||||||||||||||
|
Corporate bonds
|
$
|
(56.7
|
)
|
$
|
2,724.9
|
|
$
|
—
|
|
$
|
—
|
|
$
|
(56.7
|
)
|
$
|
2,724.9
|
|
|||||
|
U.S. Treasury and direct obligations of U.S. government agencies
|
(37.4
|
)
|
1,374.6
|
|
—
|
|
—
|
|
(37.4
|
)
|
1,374.6
|
|
|||||||||||
|
Asset-backed securities
|
(19.7
|
)
|
1,060.1
|
|
—
|
|
—
|
|
(19.7
|
)
|
1,060.1
|
|
|||||||||||
|
Canadian government obligations and
Canadian government agency obligations |
(4.5
|
)
|
444.7
|
|
—
|
|
—
|
|
(4.5
|
)
|
444.7
|
|
|||||||||||
|
Canadian provincial bonds
|
(5.6
|
)
|
239.7
|
|
—
|
|
—
|
|
(5.6
|
)
|
239.7
|
|
|||||||||||
|
Municipal bonds
|
(4.4
|
)
|
188.7
|
|
—
|
|
—
|
|
(4.4
|
)
|
188.7
|
|
|||||||||||
|
Other securities
|
(2.8
|
)
|
109.3
|
|
—
|
|
—
|
|
(2.8
|
)
|
109.3
|
|
|||||||||||
|
|
$
|
(131.1
|
)
|
$
|
6,142.0
|
|
$
|
—
|
|
$
|
—
|
|
$
|
(131.1
|
)
|
$
|
6,142.0
|
|
|||||
At
June 30, 2014
, Corporate bonds include investment-grade debt securities, which include a wide variety of issuers, industries, and sectors, primarily carry credit ratings of A and above, and have maturities ranging from
July 2014
to
June 2023
. U.S. Treasury and direct obligations of U.S. government agencies primarily include debt directly issued by Federal Home Loan Banks and Federal Farm Credit Banks with fair values of
$4,456.0 million
and
$1,223.7 million
, respectively. U.S. Treasury and direct obligations of U.S. government agencies represent senior, unsecured, non-callable debt that primarily carry ratings of Aaa by Moody's and AA+ by Standard & Poor's with maturities ranging from
July 2014
through
February 2024
.
54
At
June 30, 2014
, asset-backed securities include AAA rated senior tranches of securities with predominately prime collateral of fixed rate credit card, auto loan, and rate reduction receivables with fair values of
$1,229.7 million
,
$364.9 million
, and
$157.7 million
, respectively. These securities are collateralized by the cash flows of the underlying pools of receivables. The primary risk associated with these securities is the collection risk of the underlying receivables. All collateral on such asset-backed securities has performed as expected through
June 30, 2014
.
At
June 30, 2014
, other securities and their fair value primarily represent: AA and AAA rated sovereign bonds of
$412.1 million
, AA and AAA rated supranational bonds of
$375.5 million
, AA rated mortgage-backed securities of
$97.2 million
, and AAA rated commercial mortgage-backed securities of
$48.3 million
that are guaranteed by Federal National Mortgage Association ("Fannie Mae") and Federal Home Loan Mortgage Corporation ("Freddie Mac"). The Company's mortgage-backed securities represent an undivided beneficial ownership interest in a group or pool of one or more residential mortgages. These securities are collateralized by the cash flows of
15
-year and
30
-year residential mortgages and are guaranteed by Fannie Mae and Freddie Mac as to the timely payment of principal and interest.
Classification of corporate investments on the Consolidated Balance Sheets is as follows:
|
June 30,
|
2014
|
2013
|
||||||
|
Corporate investments:
|
|
|
||||||
|
Cash and cash equivalents
|
$
|
1,983.6
|
|
$
|
1,699.1
|
|
||
|
Short-term marketable securities
|
2,032.2
|
|
28.0
|
|
||||
|
Long-term marketable securities
|
54.1
|
|
314.0
|
|
||||
|
Total corporate investments
|
$
|
4,069.9
|
|
$
|
2,041.1
|
|
||
Funds held for clients represent assets that, based upon the Company's intent, are restricted for use solely for the purposes of satisfying the obligations to remit funds relating to the Company’s payroll and payroll tax filing services, which are classified as client funds obligations on our Consolidated Balance Sheets.
Funds held for clients have been invested in the following categories:
|
June 30,
|
2014
|
2013
|
||||||
|
Funds held for clients:
|
|
|
||||||
|
Restricted cash and cash equivalents held to satisfy client funds obligations
|
$
|
1,187.8
|
|
$
|
3,732.1
|
|
||
|
Restricted short-term marketable securities held to satisfy client funds obligations
|
1,312.5
|
|
1,407.7
|
|
||||
|
Restricted long-term marketable securities held to satisfy client funds obligations
|
16,757.7
|
|
17,089.0
|
|
||||
|
Total funds held for clients
|
$
|
19,258.0
|
|
$
|
22,228.8
|
|
||
Client funds obligations represent the Company's contractual obligations to remit funds to satisfy clients' payroll and tax payment obligations and are recorded on the Consolidated Balance Sheets at the time that the Company impounds funds from clients. The client funds obligations represent liabilities that will be repaid within
one year
of the balance sheet date. The Company has reported client funds obligations as a current liability on the Consolidated Balance Sheets totaling
$18,963.4 million
and
$21,956.3 million
as of
June 30, 2014
and
June 30, 2013
, respectively. The Company has classified funds held for clients as a current asset since these funds are held solely for the purposes of satisfying the client funds obligations. The Company has reported the cash flows related to the purchases of corporate and client funds marketable securities and related to the proceeds from the sales and maturities of corporate and client funds marketable securities on a gross basis in the investing section of the Statements of Consolidated Cash Flows. The Company has reported the cash inflows and outflows related to client funds investments with original maturities of
90 days or less
on a net basis within net increase in restricted cash and cash equivalents and other restricted assets held to satisfy client funds obligations in the investing section of the Statements of Consolidated Cash Flows. The Company has reported the cash flows related to the cash received from and paid on behalf of clients on a net basis within net increase in client funds obligations in the financing section of the Statements of Consolidated Cash Flows.
Approximately
82%
of the available-for-sale securities held a AAA or AA rating at
June 30, 2014
, as rated by Moody's, Standard & Poor's and, for Canadian securities, Dominion Bond Rating Service. All available-for-sale securities were rated as investment grade at
June 30, 2014
.
55
Expected maturities of available-for-sale securities at
June 30, 2014
are as follows:
|
Due in one year or less
|
$
|
3,344.6
|
|
|
Due after one year to two years
|
4,600.0
|
|
|
|
Due after two years to three years
|
3,282.1
|
|
|
|
Due after three years to four years
|
2,942.1
|
|
|
|
Due after four years
|
5,987.7
|
|
|
|
|
|
|
|
|
Total available-for-sale securities
|
$
|
20,156.5
|
|
Accounts receivable, net, includes the Company's trade receivables, which are recorded based upon the amount the Company expects to receive from its clients, net of an allowance for doubtful accounts. The Company's receivables also include notes receivable for the financing of the sale of computer systems, primarily from auto, truck, motorcycle, marine, recreational vehicle, and heavy equipment retailers and manufacturers. Notes receivable are recorded based upon the amount the Company expects to receive from its clients, net of an allowance for doubtful accounts and unearned income. The allowance for doubtful accounts is the Company's best estimate of probable credit losses related to trade receivables and notes receivable based upon the aging of the receivables, historical collection data, internal assessments of credit quality and the economic conditions in the automobile industry, as well as in the economy as a whole. The Company charges off uncollectable amounts against the reserve in the period in which it determines they are uncollectable. Unearned income on notes receivable is amortized using the effective interest method.
The Company’s receivables, whose carrying value approximates fair value, are as follows:
|
|
June 30, 2014
|
June 30, 2013
|
|||||||||||||
|
|
Current
|
Long-term
|
Current
|
Long-term
|
|||||||||||
|
Trade receivables
|
$
|
1,767.3
|
|
$
|
—
|
|
$
|
1,561.1
|
|
$
|
—
|
|
|||
|
Notes receivable
|
94.8
|
|
169.9
|
|
91.0
|
|
154.7
|
|
|||||||
|
Less:
|
|
|
|
|
|
|
|
|
|||||||
|
Allowance for doubtful accounts - trade receivables
|
(51.0
|
)
|
—
|
|
(44.9
|
)
|
—
|
|
|||||||
|
Allowance for doubtful accounts - notes receivable
|
(4.7
|
)
|
(8.3
|
)
|
(5.3
|
)
|
(9.0
|
)
|
|||||||
|
Unearned income - notes receivable
|
(6.0
|
)
|
(6.2
|
)
|
(6.6
|
)
|
(7.0
|
)
|
|||||||
|
$
|
1,800.4
|
|
$
|
155.4
|
|
$
|
1,595.3
|
|
$
|
138.7
|
|
||||
Long-term receivables at
June 30, 2014
mature as follows:
|
2016
|
$
|
73.3
|
|
|
|
2017
|
$
|
52.6
|
|
|
|
2018
|
$
|
31.3
|
|
|
|
2019
|
$
|
12.7
|
|
|
|
Total
|
$
|
169.9
|
|
|
As of
June 30, 2014
, there are no notes receivable that are specifically reserved; the entire notes receivable reserve balance is comprised of non-specific reserves. As of
June 30, 2013
, the notes receivable balances with specific and non-specific reserves and the specific and non-specific reserves associated with those balances are as follows:
|
|
June 30, 2013
|
||||||||||||||
|
|
Notes Receivable
|
Reserve
|
|||||||||||||
|
|
Current
|
Long-term
|
Current
|
Long-term
|
|||||||||||
|
Specifically reserved
|
$
|
0.3
|
|
$
|
0.5
|
|
$
|
0.3
|
|
$
|
0.5
|
|
|||
|
Non-specifically reserved
|
90.7
|
|
154.2
|
|
5.0
|
|
8.5
|
|
|||||||
|
$
|
91.0
|
|
$
|
154.7
|
|
$
|
5.3
|
|
$
|
9.0
|
|
||||
56
The rollforward of the allowance for doubtful accounts related to notes receivable is as follows:
|
|
Current
|
Long-term
|
|||||
|
Balance at June 30, 2012
|
$
|
5.4
|
|
$
|
8.8
|
|
|
|
Net incremental provision
|
0.8
|
|
1.2
|
|
|||
|
Recoveries
|
—
|
|
0.2
|
|
|||
|
Chargeoffs
|
(0.9
|
)
|
(1.2
|
)
|
|||
|
Balance at June 30, 2013
|
$
|
5.3
|
|
$
|
9.0
|
|
|
|
Net incremental provision
|
(0.1
|
)
|
(0.1
|
)
|
|||
|
Recoveries
|
0.2
|
|
0.2
|
|
|||
|
Chargeoffs
|
(0.7
|
)
|
(0.8
|
)
|
|||
|
Balance at June 30, 2014
|
$
|
4.7
|
|
$
|
8.3
|
|
|
The allowance for doubtful accounts as a percentage of notes receivable was approximately
5%
as of
June 30, 2014
and
6%
as of
June 30, 2013
.
On an ongoing basis, the Company evaluates the credit quality of its financing receivables, utilizing aging of receivables, collection experience and charge-offs. In addition, the Company evaluates economic conditions in the auto industry and specific dealership matters, such as bankruptcy. As events related to a specific client dictate, the credit quality of a client is reevaluated. Approximately
100%
of notes receivable were current at
June 30, 2014
and
2013
.
Property, plant and equipment at cost and accumulated depreciation at June 30,
2014
and
2013
are as follows:
|
June 30,
|
2014
|
2013
|
||||||
|
Property, plant, and equipment:
|
||||||||
|
Land and buildings
|
$
|
749.2
|
|
$
|
731.7
|
|
||
|
Data processing equipment
|
863.8
|
|
849.5
|
|
||||
|
Furniture, leaseholds, and other
|
512.7
|
|
459.5
|
|
||||
|
2,125.7
|
|
2,040.7
|
|
|||||
|
Less: accumulated depreciation
|
(1,348.3
|
)
|
(1,312.1
|
)
|
||||
|
Property, plant, and equipment, net
|
$
|
777.4
|
|
$
|
728.6
|
|
||
Depreciation of property, plant and equipment was
$163.2 million
,
$149.9 million
, and
$146.8 million
for fiscal
2014
,
2013
, and
2012
, respectively.
Changes in goodwill for the fiscal year ended
June 30, 2014
and
2013
are as follows:
|
Employer
Services
|
PEO
Services
|
Dealer
Services
|
Total
|
||||||||||||
|
Balance at June 30, 2012
|
$
|
1,874.2
|
|
$
|
4.8
|
|
$
|
1,169.6
|
|
$
|
3,048.6
|
|
|||
|
Additions and other adjustments, net
|
29.4
|
|
—
|
|
0.8
|
|
30.2
|
|
|||||||
|
Currency translation adjustments
|
4.5
|
|
—
|
|
(1.4
|
)
|
3.1
|
|
|||||||
|
Goodwill impairment
|
(42.7
|
)
|
—
|
|
—
|
|
(42.7
|
)
|
|||||||
|
Balance at June 30, 2013
|
$
|
1,865.4
|
|
$
|
4.8
|
|
$
|
1,169.0
|
|
$
|
3,039.2
|
|
|||
|
Additions and other adjustments, net
|
0.3
|
|
—
|
|
23.8
|
|
24.1
|
|
|||||||
|
Currency translation adjustments
|
16.7
|
|
—
|
|
33.8
|
|
50.5
|
|
|||||||
|
Balance at June 30, 2014
|
$
|
1,882.4
|
|
$
|
4.8
|
|
$
|
1,226.6
|
|
$
|
3,113.8
|
|
|||
57
In fiscal 2014, the Company performed the required annual impairment tests of goodwill and determined that there was no impairment.
During the fourth quarter of fiscal 2013, the Company recorded an impairment charge of
$42.7 million
related to the ADP AdvancedMD reporting unit. The goodwill impairment was due to a decrease in the estimated fair value of the business resulting from a decline in the new business bookings growth and profitability projections of the business.
The remeasurement of goodwill is classified as a Level 3 fair value assessment due to the significance of unobservable inputs developed using Company-specific information. The Company determined the fair value utilizing the income approach and the market approach. Under the income approach, the Company calculated the fair value based on the present value of the estimated cash flows. Cash flow projections were based on management's estimates of revenue growth rates and net operating income margins, taking into consideration market and industry conditions. The discount rate used is based on the weighted-average cost of capital adjusted for the risk, size premium, and business specific characteristics related to the business's ability to execute on the projected cash flows. Under the market approach, the Company evaluated the fair value based on market multiples of revenue and earnings derived from comparable publicly-traded companies with similar operating and investment characteristics as the reporting unit. The unobservable inputs used to measure the fair value included projected revenue growth rates, profitability projections, working capital assumptions, the weighted average cost of capital, the determination of appropriate market comparison companies, and terminal growth rates.
In fiscal 2013, since the annual impairment test indicated that ADP AdvancedMD's carrying value exceeded its estimated fair value, a second phase of the goodwill impairment test ("Step 2") was performed specific to this business. Under Step 2, the fair values of all assets and liabilities were estimated, including tangible assets, existing technology, customer lists, and trademarks for the purpose of deriving an estimate of the implied fair value of goodwill. The implied fair value of goodwill was then compared to the recorded goodwill to determine the amount of impairment. Assumptions used in measuring the value of these assets and liabilities included the discount rates, royalty rates, and attrition rates used in valuing the intangible assets. Upon completion of the annual test, the ADP AdvancedMD reporting unit was determined to be impaired. ADP AdvancedMD is currently reported in our Employer Services segment.
There were no accumulated goodwill impairments as of June 30, 2012.
Components of intangible assets, net, are as follows:
|
June 30,
|
2014
|
2013
|
||||||
|
Intangible assets:
|
|
|
||||||
|
Software and software licenses
|
$
|
1,626.9
|
|
$
|
1,511.1
|
|
||
|
Customer contracts and lists
|
870.1
|
|
848.9
|
|
||||
|
Other intangibles
|
241.4
|
|
241.7
|
|
||||
|
|
2,738.4
|
|
2,601.7
|
|
||||
|
Less accumulated amortization:
|
|
|
|
|
||||
|
Software and software licenses
|
(1,318.4
|
)
|
(1,239.5
|
)
|
||||
|
Customer contracts and lists
|
(591.2
|
)
|
(534.3
|
)
|
||||
|
Other intangibles
|
(196.5
|
)
|
(184.7
|
)
|
||||
|
|
(2,106.1
|
)
|
(1,958.5
|
)
|
||||
|
Intangible assets, net
|
$
|
632.3
|
|
$
|
643.2
|
|
||
Other intangibles consist primarily of purchased rights, covenants, patents, and trademarks (acquired directly or through acquisitions). All of the intangible assets have finite lives and, as such, are subject to amortization. The weighted average remaining useful life of the intangible assets is
7 years
(
4 years
for software and software licenses,
9 years
for customer contracts and lists, and
7 years
for other intangibles). Amortization of intangible assets was
$173.0 million
,
$166.8 million
, and
$172.5 million
for fiscal
2014
,
2013
, and
2012
, respectively.
58
Estimated future amortization expenses of the Company's existing intangible assets are as follows:
|
|
Amount
|
||
|
Twelve months ending June 30, 2015
|
$
|
162.9
|
|
|
Twelve months ending June 30, 2016
|
$
|
132.4
|
|
|
Twelve months ending June 30, 2017
|
$
|
96.6
|
|
|
Twelve months ending June 30, 2018
|
$
|
56.8
|
|
|
Twelve months ending June 30, 2019
|
$
|
45.1
|
|
The Company has a
$2.25 billion
,
364
-day credit agreement with a group of lenders that matures in
June 2015
. In addition, the Company has a
five
-year
$3.25 billion
credit facility maturing in
June 2019
that contains an accordion feature under which the aggregate commitment can be increased by
$500.0 million
, subject to the availability of additional commitments. The Company also has an existing
$2.0 billion
five
-year credit facility that matures in
June 2018
that also contains an accordion feature under which the aggregate commitment can be increased by
$500.0 million
, subject to the availability of additional commitments. The interest rate applicable to committed borrowings is tied to LIBOR, the effective federal funds rate, or the prime rate depending on the notification provided by the Company to the syndicated financial institutions prior to borrowing. The Company is also required to pay facility fees on the credit agreements. The primary uses of the credit facilities are to provide liquidity to the commercial paper program and funding for general corporate purposes, if necessary. The Company had
no
borrowings through
June 30, 2014
under the credit agreements.
The Company’s U.S. short-term funding requirements related to client funds are sometimes obtained through a commercial paper program, which provides for the issuance of up to
$7.25 billion
in aggregate maturity value of commercial paper, rather than liquidating previously-collected client funds that have already been invested in available-for-sale securities. In July 2014, the Company increased the U.S. short-term commercial paper program to provide for the issuance of up to
$7.5 billion
in aggregate maturity value. The Company’s commercial paper program is rated A-1+ by Standard & Poor’s and Prime-1 by Moody’s. These ratings denote the highest quality commercial paper securities. Maturities of commercial paper can range from
overnight to up to 364 days
. At
June 30, 2014
, the Company had
$2,173.0 million
of commercial paper outstanding, which was subsequently repaid on
July 1, 2014
. At
June 30, 2013
, the Company had
no
commercial paper outstanding. In fiscal
2014
and
2013
, the Company's average borrowings were
$2.3 billion
and
$2.4 billion
, respectively, at weighted average interest rates of
0.1%
and
0.2%
, respectively. The weighted average maturity of the Company’s commercial paper in fiscal
2014
and
2013
approximated
2 days
.
The Company’s U.S. and Canadian short-term funding requirements related to client funds obligations are sometimes obtained on a secured basis through the use of reverse repurchase agreements, which are collateralized principally by government and government agency securities, rather than liquidating previously-collected client funds that have already been invested in available-for-sale securities. These agreements generally have terms ranging from
overnight to up to five business days
. At
June 30, 2014
, there were no outstanding obligations related to the reverse repurchase agreements. At
June 30, 2013
, the Company had
$245.9 million
of obligations outstanding related to reverse repurchase agreements, which were subsequently repaid on
July 2, 2013
. In fiscal
2014
and
2013
, the Company had average outstanding balances under reverse repurchase agreements of
$361.7 million
and
$362.0 million
, respectively, at weighted average interest rates of
0.5%
and
0.7%
, respectively. In addition, the Company has
$3.25 billion
available on a committed basis under the U.S. reverse repurchase agreements.
A. Stock-based Compensation Plans.
Stock-based compensation consists of the following:
|
•
|
Stock Options.
Stock options are granted to employees at exercise prices equal to the fair market value of the Company's common stock on the dates of grant. Stock options are issued under a graded vesting schedule and have a term of
10 years
. Options granted prior to July 1, 2008 generally vest ratably over
five years
and options granted after July 1, 2008 generally vest ratably over
four years
. Compensation expense is measured based on the fair value of the stock option on the grant date and recognized over the requisite service period for each separately vesting portion of the stock option award. Stock options are forfeited if the employee ceases to be employed by the Company prior to vesting.
|
59
|
•
|
Restricted Stock.
|
|
•
|
Time-Based Restricted Stock and Time-Based Restricted Stock Units.
Time-based restricted stock and time-based restricted stock units granted prior to fiscal 2013 are subject to vesting periods of up to
five years
and awards granted in fiscal 2013 and later are subject to a vesting period of
two years
. Awards are forfeited if the employee ceases to be employed by the Company prior to vesting.
|
Time-based restricted stock cannot be transferred during the vesting period. Compensation expense relating to the issuance of time-based restricted stock is measured based on the fair value of the award on the grant date and recognized on a straight-line basis over the vesting period. Employees are eligible to receive dividends on shares awarded under the time-based restricted stock program.
Time-based restricted stock units are settled in cash and cannot be transferred during the vesting period. Compensation expense relating to the issuance of time-based restricted stock units is recorded over the vesting period and is initially based on the fair value of the award on the grant date; and is subsequently remeasured at each reporting date during the vesting period. No dividend equivalents are paid on units awarded under the time-based restricted stock unit program.
|
•
|
Performance-Based Restricted Stock and Performance-Based Restricted Stock Units.
Performance-based restricted stock and performance-based restricted stock units generally vest over a
one
to
three
year performance period and a subsequent service period of up to
26 months
. Under these programs, the Company communicates "target awards" at the beginning of the performance period with possible payouts at the end of the performance period ranging from
0%
to
150%
of the "target awards." Awards are forfeited if the employee ceases to be employed by the Company prior to vesting.
|
Performance-based restricted stock cannot be transferred during the vesting period. Compensation expense relating to the issuance of performance-based restricted stock is measured based upon the fair value of the award on the grant date and recognized on a straight-line basis over the vesting period, based upon the probability that the performance target will be met. After the performance period, if the performance targets are achieved, employees are eligible to receive dividends on shares awarded under the performance-based restricted stock program.
Performance-based restricted stock units are settled in either cash or stock, depending on the employee's home country, and cannot be transferred during the vesting period. Compensation expense relating to the issuance of performance-based restricted stock units settled in cash is recorded over the vesting period and is initially based on the fair value of the award on the grant date and is subsequently remeasured at each reporting date during the one-year performance period, based upon the probability that the performance target will be met. Compensation expense relating to the issuance of performance-based restricted stock units settled in stock is recorded over the vesting period based on the fair value of the award on the grant date. Dividend equivalents are paid on awards settled in stock under the performance-based restricted stock unit program.
|
•
|
Employee Stock Purchase Plan.
The Company offers an employee stock purchase plan that allows eligible employees to purchase shares of common stock at a price equal to
95%
of the market value for the Company's common stock on the last day of the offering period. This plan has been deemed non-compensatory and therefore, no compensation expense has been recorded.
|
The Company currently utilizes treasury stock to satisfy stock option exercises, issuances under the Company's employee stock purchase plan, and restricted stock awards. From time to time, the Company may repurchase shares of its common stock under its authorized share repurchase programs. The Company repurchased
9.0 million
shares in fiscal
2014
as compared to
10.4 million
shares repurchased in fiscal
2013
. The Company considers several factors in determining when to execute share repurchases, including, among other things, actual and potential acquisition activity, cash balances and cash flows, issuances due to employee benefit plan activity, and market conditions. Cash payments related to the settlement of vested time-based restricted stock units and performance-based restricted stock units were approximately
$1.2 million
,
$17.8 million
, and
$15.4 million
during fiscal years
2014
,
2013
, and
2012
.
60
The following table represents stock-based compensation expense and related income tax benefits in each of fiscal
2014
,
2013
, and
2012
, respectively:
|
Years ended June 30,
|
2014
|
2013
|
2012
|
|||||||||
|
Operating expenses
|
$
|
25.7
|
|
$
|
17.9
|
|
$
|
17.2
|
|
|||
|
Selling, general and administrative expenses
|
93.7
|
|
64.0
|
|
62.6
|
|
||||||
|
System development and programming costs
|
19.0
|
|
14.5
|
|
14.3
|
|
||||||
|
Total pretax stock-based compensation expense
|
$
|
138.4
|
|
$
|
96.4
|
|
$
|
94.1
|
|
|||
|
Income tax benefit
|
$
|
49.5
|
|
$
|
34.3
|
|
$
|
33.5
|
|
|||
As of
June 30, 2014
, the total remaining unrecognized compensation cost related to non-vested stock options, restricted stock units, and restricted stock awards amounted to
$16.8 million
,
$26.7 million
, and
$89.9 million
, respectively, which will be amortized over the weighted-average remaining requisite service periods of
2.1 years
,
1.3 years
, and
1.3 years
, respectively.
In fiscal
2014
, the following activity occurred under the Company’s existing plans:
Stock Options:
|
Year ended June 30, 2014
|
Number
of Options
(in thousands)
|
Weighted
Average Price
(in dollars)
|
|||||
|
Options outstanding, beginning of year
|
11,110
|
|
$
|
44
|
|
||
|
Options granted
|
1,489
|
|
$
|
79
|
|
||
|
Options exercised
|
(4,485
|
)
|
$
|
41
|
|
||
|
Options canceled
|
(183
|
)
|
$
|
48
|
|
||
|
Options outstanding, end of year
|
7,931
|
|
$
|
52
|
|
||
|
Options exercisable, end of year
|
5,005
|
|
$
|
42
|
|
||
|
Shares available for future grants, end of year
|
27,153
|
|
|||||
|
Shares reserved for issuance under stock option plans, end of year
|
35,084
|
|
|||||
Time-Based Restricted Stock and Time-Based Restricted Stock Units:
|
Year ended June 30, 2014
|
Number of Shares
(in thousands)
|
Number of Units
(in thousands)
|
||||
|
Restricted shares/units outstanding at July 1, 2013
|
1,313
|
|
280
|
|
||
|
Restricted shares/units granted
|
1,290
|
|
308
|
|
||
|
Restricted shares/units vested
|
(167
|
)
|
—
|
|
||
|
Restricted shares/units forfeited
|
(95
|
)
|
(17
|
)
|
||
|
Restricted shares/units outstanding at June 30, 2014
|
2,341
|
|
571
|
|
||
Performance-Based Restricted Stock and Performance-Based Restricted Stock Units:
|
Year ended June 30, 2014
|
Number of Shares
(in thousands)
|
Number of Units
(in thousands)
|
||||
|
Restricted shares/units outstanding at July 1, 2013
|
521
|
|
38
|
|
||
|
Restricted shares/units granted
|
599
|
|
307
|
|
||
|
Restricted shares/units vested
|
(264
|
)
|
(22
|
)
|
||
|
Restricted shares/units forfeited
|
(53
|
)
|
(5
|
)
|
||
|
Restricted shares/units outstanding at June 30, 2014
|
803
|
|
318
|
|
||
61
The aggregate intrinsic value of stock options outstanding and exercisable as of
June 30, 2014
was
$216.9 million
and
$185.1 million
, respectively, which has a remaining life of
5.4 years
and
3.4 years
, respectively. The aggregate intrinsic value for stock options exercised in fiscal
2014
,
2013
, and
2012
was
$156.3 million
,
$135.1 million
, and
$83.8 million
, respectively.
The fair value of each stock option issued is estimated on the date of grant using a binomial option pricing model. The binomial model considers a range of assumptions related to volatility, risk-free interest rate, and employee exercise behavior. Expected volatilities utilized in the binomial model are based on a combination of implied market volatilities, historical volatility of the Company’s stock price, and other factors. Similarly, the dividend yield is based on historical experience and expected future changes. The risk-free rate is derived from the U.S. Treasury yield curve in effect at the time of grant. The binomial model also incorporates exercise and forfeiture assumptions based on an analysis of historical data. The expected life of the stock option grant is derived from the output of the binomial model and represents the period of time that options granted are expected to be outstanding.
The fair value for stock options granted was estimated at the date of grant using the following assumptions:
|
|
2014
|
2013
|
2012
|
||||||||
|
Risk-free interest rate
|
1.5% - 1.7%
|
|
0.8% - 1.0%
|
|
0.8% - 1.0%
|
|
|||||
|
Dividend yield
|
2.3% - 2.4%
|
|
2.7% - 2.9%
|
|
2.8% - 3.1%
|
|
|||||
|
Weighted average volatility factor
|
23.8
|
%
|
23.5% - 24.4%
|
|
24.9% - 25.9%
|
|
|||||
|
Weighted average expected life (in years)
|
5.4
|
|
5.3 - 5.4
|
|
5.2 - 5.3
|
|
|||||
|
Weighted average fair value (in dollars)
|
$
|
13.53
|
|
$
|
8.63
|
|
$
|
8.46
|
|
||
The weighted average fair values of shares granted were as follows:
|
Year ended June 30,
|
2014
|
2013
|
2012
|
||||||||
|
Performance-based restricted stock
|
$
|
60.38
|
|
$
|
55.13
|
|
$
|
44.33
|
|
||
|
Time-based restricted stock
|
$
|
71.50
|
|
$
|
58.72
|
|
$
|
54.40
|
|
||
B. Pension Plans
The Company has a defined benefit cash balance pension plan covering substantially all U.S. employees, under which employees are credited with a percentage of base pay plus interest. The plan interest credit rate varies from year-to-year based on the
ten
-year U.S. Treasury rate. Employees are fully vested upon completion of
three years
of service. The Company's policy is to make contributions within the range determined by generally accepted actuarial principles. In addition, the Company has various retirement plans for its non-U.S. employees and maintains a Supplemental Officers Retirement Plan (“SORP”). The SORP is a defined benefit plan pursuant to which the Company pays supplemental pension benefits to certain key officers upon retirement based upon the officers' years of service and compensation.
A
June 30
measurement date was used in determining the Company's benefit obligations and fair value of plan assets.
The Company is required to (a) recognize in its Consolidated Balance Sheets an asset for a plan's net overfunded status or a liability for a plan's net underfunded status, (b) measure a plan's assets and its obligations that determine its funded status as of the end of the employer's fiscal year, and (c) recognize changes in the funded status of a defined benefit plan in the year in which the changes occur in accumulated other comprehensive income (loss).
62
The Company's pension plans' funded status as of
June 30, 2014
and
2013
is as follows:
|
June 30,
|
2014
|
2013
|
||||||
|
Change in plan assets:
|
||||||||
|
Fair value of plan assets at beginning of year
|
$
|
1,676.1
|
|
$
|
1,469.5
|
|
||
|
Actual return on plan assets
|
311.1
|
|
121.0
|
|
||||
|
Employer contributions
|
84.7
|
|
135.3
|
|
||||
|
Currency translation adjustments
|
4.2
|
|
(1.5
|
)
|
||||
|
Benefits paid
|
(52.0
|
)
|
(48.2
|
)
|
||||
|
Fair value of plan assets at end of year
|
$
|
2,024.1
|
|
$
|
1,676.1
|
|
||
|
Change in benefit obligation:
|
||||||||
|
Benefit obligation at beginning of year
|
$
|
1,427.8
|
|
$
|
1,412.1
|
|
||
|
Service cost
|
66.4
|
|
67.2
|
|
||||
|
Interest cost
|
62.6
|
|
55.1
|
|
||||
|
Actuarial losses/(gains)
|
87.2
|
|
(58.6
|
)
|
||||
|
Currency translation adjustments
|
6.7
|
|
0.2
|
|
||||
|
Benefits paid
|
(52.0
|
)
|
(48.2
|
)
|
||||
|
Projected benefit obligation at end of year
|
$
|
1,598.7
|
|
$
|
1,427.8
|
|
||
|
Funded status - plan assets less benefit obligations
|
$
|
425.4
|
|
$
|
248.3
|
|
||
The amounts recognized on the Consolidated Balance Sheets as of
June 30, 2014
and
2013
consisted of:
|
June 30,
|
2014
|
2013
|
||||||
|
Noncurrent assets
|
$
|
551.4
|
|
$
|
362.6
|
|
||
|
Current liabilities
|
(5.6
|
)
|
(4.7
|
)
|
||||
|
Noncurrent liabilities
|
(120.4
|
)
|
(109.6
|
)
|
||||
|
Net amount recognized
|
$
|
425.4
|
|
$
|
248.3
|
|
||
The accumulated benefit obligation for all defined benefit pension plans was
$1,581.9 million
and
$1,412.8 million
at
June 30, 2014
and
2013
, respectively.
The Company's pension plans with accumulated benefit obligations in excess of plan assets as of
June 30, 2014
and
2013
had the following projected benefit obligation, accumulated benefit obligation and fair value of plan assets:
|
June 30,
|
2014
|
2013
|
||||||
|
Projected benefit obligation
|
$
|
142.6
|
|
$
|
127.7
|
|
||
|
Accumulated benefit obligation
|
$
|
127.8
|
|
$
|
115.3
|
|
||
|
Fair value of plan assets
|
$
|
16.7
|
|
$
|
14.2
|
|
||
63
The components of net pension expense were as follows:
|
|
2014
|
2013
|
2012
|
|||||||||
|
Service cost – benefits earned during the period
|
$
|
66.4
|
|
$
|
67.2
|
|
$
|
57.2
|
|
|||
|
Interest cost on projected benefits
|
62.6
|
|
55.1
|
|
62.1
|
|
||||||
|
Expected return on plan assets
|
(119.4
|
)
|
(109.5
|
)
|
(97.6
|
)
|
||||||
|
Net amortization and deferral
|
20.1
|
|
30.9
|
|
15.0
|
|
||||||
|
Net pension expense
|
$
|
29.7
|
|
$
|
43.7
|
|
$
|
36.7
|
|
|||
The net actuarial loss, prior service cost, and transition obligation for the defined benefit pension plans that are included in accumulated other comprehensive income that have not yet been recognized as components of net periodic benefit cost are
$189.4 million
,
$4.2 million
, and
$0.3 million
, respectively, at
June 30, 2014
. The estimated net actuarial loss, prior service cost, and transition obligation for the defined benefit pension plans that will be amortized from accumulated other comprehensive income into net periodic pension cost over the next fiscal year are
$16.3 million
,
$0.9 million
, and
$0.2 million
, respectively, at
June 30, 2014
.
Assumptions used to determine the actuarial present value of benefit obligations were:
|
Years ended June 30,
|
2014
|
2013
|
||||
|
Discount rate
|
4.05
|
%
|
4.50
|
%
|
||
|
Increase in compensation levels
|
4.00
|
%
|
4.00
|
%
|
||
Assumptions used to determine the net pension expense generally were:
|
Years ended June 30,
|
2014
|
2013
|
2012
|
||||||
|
Discount rate
|
4.50
|
%
|
3.90
|
%
|
5.40
|
%
|
|||
|
Expected long-term rate of return on assets
|
7.25
|
%
|
7.25
|
%
|
7.25
|
%
|
|||
|
Increase in compensation levels
|
4.00
|
%
|
4.00
|
%
|
4.00
|
%
|
|||
The discount rate is based upon published rates for high-quality fixed-income investments that produce cash flows that approximate the timing and amount of expected future benefit payments.
The expected long-term rate of return on assets is determined based on historical and expected future rates of return on plan assets considering the target asset mix and the long-term investment strategy.
Plan Assets
The Company's pension plans' asset allocations at
June 30, 2014
and
2013
by asset category were as follows:
|
2014
|
2013
|
|||||
|
U.S. fixed income securities
|
33
|
%
|
31
|
%
|
||
|
U.S. equity securities
|
20
|
%
|
21
|
%
|
||
|
International equity securities
|
21
|
%
|
21
|
%
|
||
|
Global equity securities
|
26
|
%
|
27
|
%
|
||
|
100
|
%
|
100
|
%
|
|||
The Company's pension plans' asset investment strategy is designed to ensure prudent management of assets, consistent with long-term return objectives and the prompt fulfillment of all pension plan obligations. The investment strategy and asset mix were developed in coordination with an asset liability study conducted by external consultants to maximize the funded ratio
64
with the least amount of volatility. In fiscal 2013, the Company revised the target asset allocation of the U.S. pension plan to include global equities as a separate asset class to enhance the diversification of overall pension plan investments.
The pension plans' assets are currently invested in various asset classes with differing expected rates of return, correlations and volatilities, including large capitalization and small capitalization U.S. equities, international equities, U.S. fixed income securities and cash.
The target asset allocation ranges for the U.S. plan are generally as follows:
|
U.S. fixed income securities
|
35% - 45%
|
|
U.S. equity securities
|
14% - 24%
|
|
International equity securities
|
11% - 21%
|
|
Global equity securities
|
20% - 30%
|
The pension plans' fixed income portfolio is designed to match the duration and liquidity characteristics of the pension plans' liabilities. In addition, the pension plans invest only in investment-grade debt securities to ensure preservation of capital. The pension plans' equity portfolios are subject to diversification guidelines to reduce the impact of losses in single investments. Investment managers are prohibited from buying or selling commodities and from the short selling of securities.
None of the pension plans' assets are directly invested in the Company's stock, although the pension plans may hold a minimal amount of Company stock to the extent of the Company's participation in the S&P 500 Index.
The pension plans' investments included in Level 1 are valued using closing prices for identical instruments that are traded on active exchanges. The pension plans' investments included in Level 2 are valued utilizing inputs obtained from an independent pricing service, which are reviewed by the Company for reasonableness. To determine the fair value of our Level 2 plan assets, a variety of inputs are utilized, including benchmark yields, reported trades, non-binding broker/dealer quotes, issuer spreads, two-sided markets, benchmark securities, bids, offers, reference data, new issue data, and monthly payment information. The pension plans have no Level 3 investments at
June 30, 2014
.
The following table presents the investments of the pension plans measured at fair value at
June 30, 2014
:
|
Level 1
|
Level 2
|
Level 3
|
Total
|
|||||||||||||
|
Commingled trusts
|
$
|
—
|
|
$
|
1,261.1
|
|
$
|
—
|
|
$
|
1,261.1
|
|
||||
|
U.S. government securities
|
—
|
|
271.9
|
|
—
|
|
271.9
|
|
||||||||
|
Mutual funds
|
88.2
|
|
—
|
|
—
|
|
88.2
|
|
||||||||
|
Corporate and municipal bonds
|
—
|
|
368.3
|
|
—
|
|
368.3
|
|
||||||||
|
Mortgage-backed security bonds
|
—
|
|
22.9
|
|
—
|
|
22.9
|
|
||||||||
|
Total pension assets
|
$
|
88.2
|
|
$
|
1,924.2
|
|
$
|
—
|
|
$
|
2,012.4
|
|
||||
In addition to the investments in the above table, the pension plans also held cash and cash equivalents of
$11.7 million
as of
June 30, 2014
, which have been classified as Level 2 in the fair value hierarchy.
The following table presents the investments of the pension plans measured at fair value at
June 30, 2013
:
|
Level 1
|
Level 2
|
Level 3
|
Total
|
|||||||||||||
|
Commingled trusts
|
$
|
—
|
|
$
|
1,050.7
|
|
$
|
—
|
|
$
|
1,050.7
|
|
||||
|
U.S. government securities
|
—
|
|
228.3
|
|
—
|
|
228.3
|
|
||||||||
|
Mutual funds
|
79.2
|
|
—
|
|
—
|
|
79.2
|
|
||||||||
|
Corporate and municipal bonds
|
—
|
|
252.5
|
|
—
|
|
252.5
|
|
||||||||
|
Mortgage-backed security bonds
|
—
|
|
22.7
|
|
—
|
|
22.7
|
|
||||||||
|
Total pension assets
|
$
|
79.2
|
|
$
|
1,554.2
|
|
$
|
—
|
|
$
|
1,633.4
|
|
||||
65
In addition to the investments in the above table, the pension plans also held cash and cash equivalents of
$42.7 million
as of
June 30, 2013
, which have been classified as Level 2 in the fair value hierarchy.
Contributions
During fiscal
2014
, the Company contributed
$84.7 million
to the pension plans. The Company expects to contribute
$9.5 million
to the pension plans during fiscal
2015
.
Estimated Future Benefit Payments
The benefits expected to be paid in each year from fiscal
2015
to
2019
are
$61.3 million
,
$66.9 million
,
$76.5 million
,
$85.6 million
and
$93.8 million
, respectively. The aggregate benefits expected to be paid in the five fiscal years from
2020
to
2024
are
$609.4 million
. The expected benefits to be paid are based on the same assumptions used to measure the Company's pension plans' benefit obligations at
June 30, 2014
and includes estimated future employee service.
C. Retirement and Savings Plan.
The Company has a 401(k) retirement and savings plan, which allows eligible employees to contribute up to
50%
of their compensation annually and allows highly compensated employees to contribute up to
12%
of their compensation annually. The Company matches a portion of employee contributions, which amounted to approximately
$77.6 million
,
$72.0 million
, and
$65.9 million
for the calendar years ended December 31,
2013
,
2012
, and
2011
, respectively.
Earnings from continuing operations before income taxes shown below are based on the geographic location to which such earnings are attributable.
|
Years ended June 30,
|
2014
|
2013
|
2012
|
|||||||||
|
Earnings from continuing operations before income taxes:
|
||||||||||||
|
United States
|
$
|
1,960.3
|
|
$
|
1,757.6
|
|
$
|
1,874.4
|
|
|||
|
Foreign
|
314.3
|
|
318.5
|
|
227.3
|
|
||||||
|
$
|
2,274.6
|
|
$
|
2,076.1
|
|
$
|
2,101.7
|
|
||||
The provision (benefit) for income taxes consists of the following components:
|
Years ended June 30,
|
2014
|
2013
|
2012
|
|||||||||
|
Current:
|
||||||||||||
|
Federal
|
$
|
666.6
|
|
$
|
539.2
|
|
$
|
537.6
|
|
|||
|
Foreign
|
92.2
|
|
103.6
|
|
85.4
|
|
||||||
|
State
|
63.5
|
|
50.5
|
|
67.4
|
|
||||||
|
Total current
|
822.3
|
|
693.3
|
|
690.4
|
|
||||||
|
Deferred:
|
||||||||||||
|
Federal
|
(35.4
|
)
|
35.2
|
|
48.4
|
|
||||||
|
Foreign
|
(19.2
|
)
|
(14.9
|
)
|
(9.1
|
)
|
||||||
|
State
|
4.3
|
|
4.4
|
|
(3.2
|
)
|
||||||
|
Total deferred
|
(50.3
|
)
|
24.7
|
|
36.1
|
|
||||||
|
Total provision for income taxes
|
$
|
772.0
|
|
$
|
718.0
|
|
$
|
726.5
|
|
|||
66
A reconciliation between the Company's effective tax rate and the U.S. federal statutory rate is as follows:
|
Years ended June 30,
|
2014
|
%
|
2013
|
%
|
2012
|
%
|
|||||||||||||||
|
Provision for taxes at U.S. statutory rate
|
$
|
796.1
|
|
35.0
|
|
$
|
726.7
|
|
35.0
|
|
$
|
735.7
|
|
35.0
|
|
||||||
|
Increase (decrease) in provision from:
|
|||||||||||||||||||||
|
State taxes, net of federal tax benefit
|
44.2
|
|
1.9
|
|
35.3
|
|
1.7
|
|
37.6
|
|
1.8
|
|
|||||||||
|
U.S. tax on foreign income
|
26.8
|
|
1.2
|
|
85.3
|
|
4.2
|
|
51.4
|
|
2.5
|
|
|||||||||
|
Utilization of foreign tax credits
|
(27.5
|
)
|
(1.2
|
)
|
(94.4
|
)
|
(4.6
|
)
|
(51.7
|
)
|
(2.5
|
)
|
|||||||||
|
Section 199 - Qualified production activities
|
(23.0
|
)
|
(1.0
|
)
|
(22.3
|
)
|
(1.1
|
)
|
(22.4
|
)
|
(1.1
|
)
|
|||||||||
|
Other (A)
|
(44.6
|
)
|
(2.0
|
)
|
(12.6
|
)
|
(0.6
|
)
|
(24.1
|
)
|
(1.1
|
)
|
|||||||||
|
$
|
772.0
|
|
33.9
|
|
$
|
718.0
|
|
34.6
|
|
$
|
726.5
|
|
34.6
|
|
|||||||
(A) Fiscal 2014 includes
$5.6 million
for the tax impact of non tax-deductible separation cost related to the Company's planned separation of the Dealer Services business which increased our fiscal 2014 effective tax rate
0.2 percentage points
. Fiscal
2013
includes
$16.0
million for the tax impact of the non tax-deductible goodwill impairment related to ADP AdvancedMD which increased our fiscal
2013
effective tax rate
0.7 percentage points
.
The significant components of deferred income tax assets and liabilities and their balance sheet classifications are as follows:
|
Years ended June 30,
|
2014
|
2013
|
||||||
|
Deferred tax assets:
|
||||||||
|
Accrued expenses not currently deductible
|
$
|
248.0
|
|
$
|
223.4
|
|
||
|
Stock-based compensation expense
|
87.3
|
|
84.1
|
|
||||
|
Net operating losses
|
79.7
|
|
97.6
|
|
||||
|
Other
|
36.4
|
|
39.5
|
|
||||
|
451.4
|
|
444.6
|
|
|||||
|
Less: valuation allowances
|
(44.0
|
)
|
(48.8
|
)
|
||||
|
Deferred tax assets, net
|
$
|
407.4
|
|
$
|
395.8
|
|
||
|
Deferred tax liabilities:
|
||||||||
|
Prepaid retirement benefits
|
$
|
183.7
|
|
$
|
146.2
|
|
||
|
Deferred revenue
|
71.9
|
|
62.9
|
|
||||
|
Fixed and intangible assets
|
203.1
|
|
235.3
|
|
||||
|
Prepaid expenses
|
100.7
|
|
88.9
|
|
||||
|
Unrealized investment gains, net
|
112.3
|
|
99.8
|
|
||||
|
Tax on unrepatriated earnings
|
14.1
|
|
12.3
|
|
||||
|
Other
|
1.9
|
|
7.3
|
|
||||
|
Deferred tax liabilities
|
$
|
687.7
|
|
$
|
652.7
|
|
||
|
Net deferred tax liabilities
|
$
|
280.3
|
|
$
|
256.9
|
|
||
There are
$29.4 million
and
$26.1 million
of current deferred tax assets included in other current assets on the Consolidated Balance Sheets at
June 30, 2014
and
2013
, respectively. There are
$76.6 million
and
$89.4 million
of long-term deferred tax assets included in other assets on the Consolidated Balance Sheets at
June 30, 2014
and
2013
, respectively. There are
$97.5 million
and
$138.0 million
of current deferred tax liabilities included in accrued expenses and other current liabilities on the Consolidated Balance Sheets at
June 30, 2014
and
2013
, respectively.
Income taxes have not been provided on undistributed earnings of certain foreign subsidiaries in an aggregate amount of approximately
$1,031.6 million
as of
June 30, 2014
, as the Company considers such earnings to be permanently reinvested
67
outside of the United States. The additional U.S. income tax that would arise on repatriation of the remaining undistributed earnings could be offset, in part, by foreign tax credits on such repatriation. However, it is impracticable to estimate the amount of net income tax that might be payable.
The Company has estimated foreign net operating loss carry-forwards of approximately
$105.5 million
as of
June 30, 2014
, of which
$47.3 million
expire through
2034
and
$58.2 million
has an indefinite utilization period. As of
June 30, 2014
, the Company has approximately
$77.8 million
of federal net operating loss carry-forwards from acquired companies. The net operating losses have an annual utilization limitation pursuant to section 382 of the Internal Revenue Code and expire through
2030
.
The Company has state net operating loss carry-forwards of approximately
$193.6 million
as of
June 30, 2014
, which expire through
2033
.
The Company has recorded valuation allowances of
$44.0 million
and
$48.8 million
at
June 30, 2014
and
2013
, respectively, to reflect the estimated amount of domestic and foreign deferred tax assets that may not be realized.
Income tax payments were approximately
$821.5 million
,
$691.0 million
, and
$658.7 million
for fiscal
2014
,
2013
, and
2012
, respectively.
As of June 30,
2014
,
2013
, and
2012
the Company's liabilities for unrecognized tax benefits, which include interest and penalties, were
$56.7 million
,
$70.7 million
, and
$84.7 million
respectively. The amount that, if recognized, would impact the effective tax rate is
$31.2 million
,
$38.8 million
, and
$43.7 million
, respectively. The remainder, if recognized, would principally impact deferred taxes.
A reconciliation of the beginning and ending amounts of unrecognized tax benefits is as follows:
|
Fiscal 2014
|
Fiscal 2013
|
Fiscal 2012
|
||||||||||
|
Unrecognized tax benefits at beginning of the year
|
$
|
70.7
|
|
$
|
84.7
|
|
$
|
105.7
|
|
|||
|
Additions for tax positions
|
3.6
|
|
5.0
|
|
8.0
|
|
||||||
|
Reductions for tax positions
|
—
|
|
—
|
|
(0.8
|
)
|
||||||
|
Additions for tax positions of prior periods
|
7.0
|
|
5.3
|
|
13.0
|
|
||||||
|
Reductions for tax positions of prior periods
|
(7.4
|
)
|
(3.7
|
)
|
(21.6
|
)
|
||||||
|
Settlement with tax authorities
|
(4.4
|
)
|
(12.0
|
)
|
(4.2
|
)
|
||||||
|
Expiration of the statute of limitations
|
(13.7
|
)
|
(9.7
|
)
|
(9.8
|
)
|
||||||
|
Impact of foreign exchange rate fluctuations
|
0.9
|
|
1.1
|
|
(5.6
|
)
|
||||||
|
Unrecognized tax benefit at end of year
|
$
|
56.7
|
|
$
|
70.7
|
|
$
|
84.7
|
|
|||
Interest expense and penalties associated with uncertain tax positions have been recorded in the provision for income taxes on the Statements of Consolidated Earnings. During the fiscal years ended June 30,
2014
,
2013
, and
2012
, the Company recorded interest (benefit) expense of
$(3.4) million
,
$0.4 million
, and
$1.2 million
, respectively. Penalties incurred during fiscal years ended June 30,
2014
,
2013
, and
2012
were
no
t material.
At
June 30, 2014
, the Company had accrued interest of
$10.7 million
recorded on the Consolidated Balance Sheets, of which
$0.1 million
was recorded within income taxes payable, and the remainder was recorded within other liabilities. At
June 30, 2013
, the Company had accrued interest of
$12.2 million
recorded on the Consolidated Balance Sheets, of which
$1.2 million
was recorded within income taxes payable, and the remainder was recorded within other liabilities. At
June 30, 2014
, the Company had accrued penalties of
$0.6 million
recorded on the Consolidated Balance Sheets, of which
$0.1 million
was recorded within income taxes payable, and the remainder was recorded within other liabilities. At
June 30, 2013
, the Company had accrued penalties of
$1.0 million
recorded on the Consolidated Balance Sheets, of which
$0.1 million
was recorded within income taxes payable, and the remainder was recorded within other liabilities.
The Company is routinely examined by the IRS and tax authorities in foreign countries in which it conducts business, as well as tax authorities in states in which it has significant business operations. The tax years currently under examination vary by jurisdiction. Examinations in progress in which the Company has significant business operations are as follows:
68
|
Taxing Jurisdiction
|
Fiscal Years under Examination
|
|
|
U.S. (IRS)
|
2013-2014
|
|
|
Arizona
|
1998-2007
|
|
|
Illinois
|
2004-2011
|
|
|
Minnesota
|
2005-2012
|
|
|
New York
|
2007-2009
|
|
|
New Jersey
|
2002-2009
|
|
The Company regularly considers the likelihood of assessments resulting from examinations in each of the jurisdictions. The resolution of tax matters is not expected to have a material effect on the consolidated financial condition of the Company, although a resolution could have a material impact on the Company's Statements of Consolidated Earnings for a particular future period and on the Company's effective tax rate.
If certain pending tax matters settle within the next twelve months, the total amount of unrecognized tax benefits may increase or decrease for all open tax years and jurisdictions. Based on current estimates, settlements related to various jurisdictions and tax periods could increase earnings up to
$10 million
in the next twelve months. Audit outcomes and the timing of audit settlements are subject to significant uncertainty. We continually assess the likelihood and amount of potential adjustments and adjust the income tax provision, the current tax liability and deferred taxes in the period in which the facts that give rise to a revision become known.
In fiscal
2014
, the Company reached agreements with the IRS regarding all outstanding tax audit issues in dispute for the tax years through and including June 30,
2012
, which did not have a material impact to the consolidated financial statements of the Company.
The Company has obligations under various facilities and equipment leases and software license agreements. Total expense under these agreements was approximately
$306.0 million
,
$270.1 million
, and
$252.6 million
in fiscal
2014
,
2013
, and
2012
, respectively, with minimum commitments at
June 30, 2014
as follows:
|
Years ending June 30,
|
|||
|
2015
|
$
|
209.9
|
|
|
2016
|
147.3
|
|
|
|
2017
|
87.9
|
|
|
|
2018
|
53.2
|
|
|
|
2019
|
29.8
|
|
|
|
Thereafter
|
32.6
|
|
|
|
$
|
560.7
|
|
|
In addition to fixed rentals, certain leases require payment of maintenance and real estate taxes and contain escalation provisions based on future adjustments in price indices.
As of
June 30, 2014
, the Company has purchase commitments of approximately
$780.4 million
, including a reinsurance premium with ACE American Insurance Company for the fiscal 2015 policy year, as well as obligations related to purchase and maintenance agreements on our software, equipment, and other assets, of which
$379.7 million
relates to fiscal
2015
,
$157.2 million
relates to the fiscal year ending June 30,
2016
and the remaining
$243.5 million
relates to fiscal years ending June 30,
2017
through fiscal
2019
.
On July 18, 2011, athenahealth, Inc. filed a patent infringement lawsuit against ADP AdvancedMD, Inc. ("ADP AdvancedMD"), a subsidiary of the Company, seeking monetary damages, injunctive relief, and costs. The allegations include a claim that ADP AdvancedMD's activities in providing medical practice management and billing and revenue management
69
software and associated services to physicians and medical practice managers infringe a patent owned by athenahealth, Inc. The parties are currently engaged in the discovery process and the court has not yet set a trial date. The Company believes that it has meritorious defenses to this lawsuit and continues to vigorously defend itself against the allegations.
In June 2011, the Company received a Commissioner’s Charge from the U.S. Equal Employment Opportunity Commission (“EEOC”) alleging that the Company has violated Title VII of the Civil Rights Act of 1964 by refusing to recruit, hire, transfer and promote certain persons on the basis of their race, in the State of Illinois from at least the period of January 1, 2007 to the present. The Company continues to investigate the allegations set forth in the Commissioner’s Charge and is cooperating with the EEOC’s investigation.
The Company is subject to various claims and litigation in the normal course of business. When a loss is considered probable and reasonably estimable, the Company records a liability in the amount of its best estimate for the ultimate loss. At this time, the Company is unable to estimate any reasonably possible loss, or range of reasonably possible loss, with respect to the matters described above. This is primarily because these matters involve complex issues subject to inherent uncertainty. There can be no assurance that these matters will be resolved in a manner that is not adverse to the Company.
It is not the Company’s business practice to enter into off-balance sheet arrangements. In the normal course of business, the Company may enter into contracts in which it makes representations and warranties that relate to the performance of the Company’s services and products. The Company does not expect any material losses related to such representations and warranties.
Comprehensive income is a measure of income that includes both net earnings and other comprehensive income (loss). Other comprehensive income (loss) results from items deferred on the Consolidated Balance Sheets in stockholders' equity. Other comprehensive income (loss) was
$162.8 million
,
$(214.8) million
, and
$(136.9) million
in fiscal
2014
,
2013
, and
2012
, respectively. Changes in Accumulated Other Comprehensive Income ("AOCI") by component are as follows:
|
Currency Translation Adjustment
|
Net Gains on Available-for-sale Securities
|
Pension Liability
|
Accumulated Other Comprehensive Income
|
|||||||||||||||
|
Balance at June 30, 2012
|
42.0
|
|
461.3
|
|
(273.1
|
)
|
230.2
|
|
||||||||||
|
Other comprehensive (loss) income before
reclassification adjustments |
(2.4
|
)
|
(394.6
|
)
|
68.2
|
|
(328.8
|
)
|
||||||||||
|
Tax effect
|
—
|
|
138.5
|
|
(25.7
|
)
|
112.8
|
|
||||||||||
|
Reclassification adjustments to net earnings
|
—
|
|
(28.6
|
)
|
(B)
|
31.7
|
|
(C)
|
3.1
|
|
||||||||
|
Tax effect
|
—
|
|
10.1
|
|
(12.0
|
)
|
(1.9
|
)
|
||||||||||
|
Balance at June 30, 2013
|
$
|
39.6
|
|
$
|
186.7
|
|
$
|
(210.9
|
)
|
$
|
15.4
|
|
||||||
|
Other comprehensive income before
reclassification adjustments
|
58.4
|
|
53.5
|
|
102.8
|
|
214.7
|
|
||||||||||
|
Tax effect
|
—
|
|
(18.2
|
)
|
(39.7
|
)
|
(57.9
|
)
|
||||||||||
|
Reclassification adjustments to
net earnings
|
1.5
|
|
(A)
|
(16.5
|
)
|
(B)
|
20.7
|
|
(C)
|
5.7
|
|
|||||||
|
Tax effect
|
—
|
|
6.1
|
|
(5.8
|
)
|
0.3
|
|
||||||||||
|
Balance at June 30, 2014
|
$
|
99.5
|
|
$
|
211.6
|
|
$
|
(132.9
|
)
|
$
|
178.2
|
|
||||||
(A) Reclassification adjustments out of AOCI are included within Net Earnings from Discontinued Operations, on the Statements of Consolidated Earnings.
(B) Reclassification adjustments out of AOCI are included within Other income, net, on the Statements of Consolidated Earnings.
(C) Reclassification adjustments out of AOCI are included in net pension expense (see Note 11).
70
Based upon similar economic and operational characteristics, the Company’s strategic business units have been aggregated into the following
three
reportable segments: Employer Services, PEO Services, and Dealer Services. The primary components of the “Other” segment are the results of operations of ADP Indemnity (a wholly-owned captive insurance company that provides workers’ compensation and employer’s liability deductible reimbursement insurance protection for PEO Services worksite employees), non-recurring gains and losses, miscellaneous processing services, such as customer financing transactions, and certain charges and expenses that have not been allocated to the reportable segments, such as stock-based compensation expense, the fiscal 2014 separation costs related to the planned separation of Dealer Services, and the fiscal 2013 goodwill impairment charge.
Certain revenues and expenses are charged to the reportable segments at a standard rate for management reasons. Other costs are recorded based on management responsibility. There is a reconciling item for the difference between actual interest income earned on invested funds held for clients and interest credited to Employer Services and PEO Services at a standard rate of
4.5%
. This allocation is made for management reasons so that the reportable segments' results are presented on a consistent basis without the impact of fluctuations in interest rates. This reconciling adjustment to the reportable segments' revenues and earnings from continuing operations before income taxes is eliminated in consolidation.
To align financial reporting with the manner in which the Company's chief operating decision maker assesses performance and makes decisions about resources to be allocated to the reportable segments, effective July 1, 2013, the Company no longer allocates a cost of capital charge to its reportable segments and no longer adjusts the operating results of its reportable segments on a constant exchange rate basis. As a result of these changes, all prior period amounts have been reclassified to conform to the current period presentation. These changes did not significantly affect reportable segment results.
71
|
Employer Services
|
PEO Services
|
Dealer Services
|
Other
|
Client Fund Interest
|
Total
|
|||||||||||||||||||
|
Year ended June 30, 2014
|
||||||||||||||||||||||||
|
Revenues from continuing
operations
|
$
|
8,535.2
|
|
$
|
2,270.9
|
|
$
|
1,951.4
|
|
$
|
(0.9
|
)
|
$
|
(550.1
|
)
|
$
|
12,206.5
|
|
||||||
|
Earnings from continuing
operations before income taxes
|
2,517.8
|
|
234.3
|
|
428.1
|
|
(355.5
|
)
|
(550.1
|
)
|
2,274.6
|
|
||||||||||||
|
Assets from continuing
operations
|
21,382.2
|
|
472.6
|
|
733.0
|
|
9,463.9
|
|
—
|
|
32,051.7
|
|
||||||||||||
|
Capital expenditures
from continuing operations
|
59.7
|
|
0.9
|
|
43.6
|
|
114.5
|
|
—
|
|
218.7
|
|
||||||||||||
|
Depreciation and amortization
|
152.4
|
|
1.2
|
|
64.7
|
|
117.9
|
|
—
|
|
336.2
|
|
||||||||||||
|
Year ended June 30, 2013
|
||||||||||||||||||||||||
|
Revenues from continuing
operations
|
$
|
7,924.9
|
|
$
|
1,973.2
|
|
$
|
1,820.2
|
|
$
|
1.7
|
|
$
|
(432.4
|
)
|
$
|
11,287.6
|
|
||||||
|
Earnings from continuing
operations before income taxes
|
2,216.8
|
|
199.7
|
|
375.3
|
|
(283.3
|
)
|
(432.4
|
)
|
2,076.1
|
|
||||||||||||
|
Assets from continuing
operations
|
24,158.2
|
|
411.4
|
|
696.8
|
|
6,985.0
|
|
—
|
|
32,251.4
|
|
||||||||||||
|
Capital expenditures
from continuing operations
|
57.9
|
|
0.6
|
|
35.1
|
|
81.2
|
|
—
|
|
174.8
|
|
||||||||||||
|
Depreciation and amortization
|
132.2
|
|
1.2
|
|
61.2
|
|
122.1
|
|
—
|
|
316.7
|
|
||||||||||||
|
Year ended June 30, 2012
|
||||||||||||||||||||||||
|
Revenues from continuing
operations
|
$
|
7,449.4
|
|
$
|
1,771.4
|
|
$
|
1,676.2
|
|
$
|
5.5
|
|
$
|
(307.1
|
)
|
$
|
10,595.4
|
|
||||||
|
Earnings from continuing
operations before income taxes
|
2,054.6
|
|
171.1
|
|
322.1
|
|
(139.0
|
)
|
(307.1
|
)
|
2,101.7
|
|
||||||||||||
|
Assets from continuing
operations
|
23,308.0
|
|
376.5
|
|
685.9
|
|
6,303.2
|
|
—
|
|
30,673.6
|
|
||||||||||||
|
Capital expenditures
from continuing operations
|
39.9
|
|
1.2
|
|
39.7
|
|
65.4
|
|
—
|
|
146.2
|
|
||||||||||||
|
Depreciation and amortization
|
127.0
|
|
1.0
|
|
57.7
|
|
133.6
|
|
—
|
|
319.3
|
|
||||||||||||
|
United States
|
Europe
|
Canada
|
Other
|
Total
|
||||||||||||||||
|
Year ended June 30, 2014
|
||||||||||||||||||||
|
Revenues from continuing operations
|
$
|
9,890.2
|
|
$
|
1,387.1
|
|
$
|
437.9
|
|
$
|
491.3
|
|
$
|
12,206.5
|
|
|||||
|
Assets from continuing operations
|
$
|
26,529.3
|
|
$
|
2,724.9
|
|
$
|
2,228.1
|
|
$
|
569.4
|
|
$
|
32,051.7
|
|
|||||
|
Year ended June 30, 2013
|
||||||||||||||||||||
|
Revenues from continuing operations
|
$
|
9,114.9
|
|
$
|
1,279.1
|
|
$
|
442.4
|
|
$
|
451.2
|
|
$
|
11,287.6
|
|
|||||
|
Assets from continuing operations
|
$
|
27,327.0
|
|
$
|
2,261.2
|
|
$
|
2,166.0
|
|
$
|
497.2
|
|
$
|
32,251.4
|
|
|||||
|
Year ended June 30, 2012
|
||||||||||||||||||||
|
Revenues from continuing operations
|
$
|
8,493.3
|
|
$
|
1,269.8
|
|
$
|
426.9
|
|
$
|
405.4
|
|
$
|
10,595.4
|
|
|||||
|
Assets from continuing operations
|
$
|
26,201.9
|
|
$
|
1,969.7
|
|
$
|
2,111.7
|
|
$
|
390.3
|
|
$
|
30,673.6
|
|
|||||
72
Summarized quarterly results of our continuing operations for the two fiscal years ended June 30,
2014
and June 30,
2013
are as follows:
|
First
Quarter
|
Second Quarter
|
Third
Quarter
|
Fourth
Quarter (A)
|
|||||||||||||
|
Year ended June 30, 2014
|
||||||||||||||||
|
Revenues
|
$
|
2,834.8
|
|
$
|
2,977.9
|
|
$
|
3,320.0
|
|
$
|
3,073.7
|
|
||||
|
Costs of revenues
|
$
|
1,721.7
|
|
$
|
1,769.8
|
|
$
|
1,884.4
|
|
$
|
1,845.6
|
|
||||
|
Gross profit
|
$
|
1,113.1
|
|
$
|
1,208.1
|
|
$
|
1,435.6
|
|
$
|
1,228.1
|
|
||||
|
Net earnings from continuing operations
|
$
|
327.7
|
|
$
|
375.8
|
|
$
|
510.4
|
|
$
|
288.7
|
|
||||
|
Basic earnings per share from continuing operations
|
$
|
0.68
|
|
$
|
0.79
|
|
$
|
1.07
|
|
$
|
0.60
|
|
||||
|
Diluted earnings per share from continuing operations
|
$
|
0.68
|
|
$
|
0.78
|
|
$
|
1.06
|
|
$
|
0.60
|
|
||||
|
First
Quarter
|
Second Quarter
|
Third
Quarter
|
Fourth
Quarter (B)
|
|||||||||||||
|
Year ended June 30, 2013
|
||||||||||||||||
|
Revenues
|
$
|
2,632.7
|
|
$
|
2,742.8
|
|
$
|
3,109.3
|
|
$
|
2,802.8
|
|
||||
|
Costs of revenues
|
$
|
1,583.7
|
|
$
|
1,621.6
|
|
$
|
1,743.2
|
|
$
|
1,689.9
|
|
||||
|
Gross profit
|
$
|
1,049.0
|
|
$
|
1,121.2
|
|
$
|
1,366.1
|
|
$
|
1,112.9
|
|
||||
|
Net earnings from continuing operations
|
$
|
301.7
|
|
$
|
350.9
|
|
$
|
481.6
|
|
$
|
224.0
|
|
||||
|
Basic earnings per share from continuing operations
|
$
|
0.62
|
|
$
|
0.73
|
|
$
|
1.00
|
|
$
|
0.46
|
|
||||
|
Diluted earnings per share from continuing operations
|
$
|
0.62
|
|
$
|
0.72
|
|
$
|
0.99
|
|
$
|
0.46
|
|
||||
(A) Net earnings from continuing operations, basic earnings per share from continuing operations and diluted earnings per share from continuing operations include the impact of separation costs related to the planned separation of the Company's Dealer Services business, which decreased net earnings from continuing operations by
$14.9 million
and both basic and diluted earnings per share from continuing operations by
$0.03
.
(B) Net earnings from continuing operations and diluted earnings per share from continuing operations includes the impact of a goodwill impairment charge related to ADP AdvancedMD, which decreased net earnings from continuing operations by
$42.7 million
and both basic and diluted earnings per share from continuing operations by
$0.09
.
With the exception of the repayment of commercial paper obligation on July 1, 2014, the July 2014 increase in the commercial paper program discussed in Note 10, and the item listed below, there are no further subsequent events for disclosure.
The Company's subsidiary captive insurance company, ADP Indemnity, paid a premium of
$167.9 million
in July 2014 to enter into a reinsurance arrangement with ACE American Insurance Company to cover substantially all losses for the fiscal 2015 policy year on terms substantially similar to the fiscal 2014 reinsurance policy to cover losses up to the
$1 million
per occurrence related to the workers' compensation and employer's liability deductible reimbursement insurance protection for PEO Services worksite employees.
73
None.
Attached as Exhibits 31.1 and 31.2 to this Annual Report on Form 10-K are certifications of ADP's Chief Executive Officer and Chief Financial Officer, which are required by Rule 13a-14(a) of the Securities Exchange Act of 1934, as amended (the “Exchange Act”). This “Controls and Procedures” section should be read in conjunction with the report of Deloitte & Touche LLP that appears on page 77 of this Annual Report on Form 10-K and is hereby incorporated herein by reference.
Management's Evaluation of Disclosure Controls and Procedures
The Company carried out an evaluation (the “evaluation”), under the supervision and with the participation of the Company's management, including its Chief Executive Officer and Chief Financial Officer, of the effectiveness of the Company's disclosure controls and procedures, as defined in Rules 13a-15(e) and 15d-15(e) under the Exchange Act. Disclosure controls and procedures include, without limitation, controls and procedures designed to ensure that information required to be disclosed by the Company in the reports that it files or submits under the Exchange Act is accumulated and communicated to the Company's management, including its Chief Executive Officer and Chief Financial Officer, or persons performing similar functions, as appropriate to allow timely decisions regarding required disclosure. Based on the evaluation, the Company's Chief Executive Officer and Chief Financial Officer have concluded that the Company's disclosure controls and procedures were effective as of
June 30, 2014
in ensuring that (i) information required to be disclosed by the Company in reports that it files or submits under the Exchange Act is accumulated and communicated to the Company's management, including its Chief Executive Officer and Chief Financial Officer, to allow timely decisions regarding required disclosure and (ii) such information is recorded, processed, summarized and reported within the time periods specified in the Securities and Exchange Commission's rules and forms.
Management's Report on Internal Control over Financial Reporting
It is the responsibility of Automatic Data Processing, Inc.'s (“ADP”) management to establish and maintain effective internal control over financial reporting (as defined in Rule 13a-15(f) under the Securities Exchange Act of 1934, as amended). Internal control over financial reporting is designed to provide reasonable assurance to ADP's management and board of directors regarding the preparation of reliable financial statements for external purposes in accordance with generally accepted accounting principles.
ADP's internal control over financial reporting includes those policies and procedures that: (i) pertain to the maintenance of records that, in reasonable detail, accurately and fairly reflect the transactions and dispositions of the assets of ADP; (ii) provide reasonable assurance that transactions are recorded as necessary to permit preparation of financial statements in accordance with generally accepted accounting principles, and that receipts and expenditures of ADP are being made only in accordance with authorizations of management and directors of ADP; and (iii) provide reasonable assurance regarding the prevention or timely detection of unauthorized acquisition, use or disposition of ADP's assets that could have a material effect on the financial statements of ADP.
Because of its inherent limitations, internal control over financial reporting may not prevent or detect misstatements. Therefore, even those systems determined to be effective can provide only reasonable assurance with respect to financial statement preparation and presentation.
Management has performed an assessment of the effectiveness of ADP's internal control over financial reporting as of June 30,
2014
based upon criteria set forth in Internal Control - Integrated Framework (1992) issued by the Committee of Sponsoring Organizations of the Treadway Commission. Based on this assessment, management determined that ADP's internal control over financial reporting was effective as of
June 30, 2014
.
74
Deloitte & Touche LLP, the independent registered public accounting firm that audited and reported on the consolidated financial statements of ADP included in this Annual Report on Form 10-K, has issued an attestation report on the operating effectiveness of ADP's internal control over financial reporting. The Deloitte & Touche LLP attestation report is set forth below.
|
/s/ Carlos A. Rodriguez
|
|
Carlos A. Rodriguez
|
|
President and Chief Executive Officer
|
|
|
|
/s/ Jan Siegmund
|
|
Jan Siegmund
|
|
Chief Financial Officer
|
Roseland, New Jersey
August 8, 2014
75
Changes in Internal Control over Financial Reporting
There were no changes in ADP's internal control over financial reporting that occurred during the quarter ended June 30, 2014 that have materially affected, or are reasonably likely to materially affect, ADP's internal control over financial reporting.
76
REPORT OF INDEPENDENT REGISTERED PUBLIC ACCOUNTING FIRM
To the Board of Directors and Stockholders of
Automatic Data Processing, Inc.
Roseland, New Jersey
We have audited the internal control over financial reporting of Automatic Data Processing, Inc. and subsidiaries (the "Company") as of June 30, 2014, based on criteria established in Internal Control - Integrated Framework (1992) issued by the Committee of Sponsoring Organizations of the Treadway Commission. The Company's management is responsible for maintaining effective internal control over financial reporting and for its assessment of the effectiveness of internal control over financial reporting, included in the accompanying Management's Report on Internal Control over Financial Reporting. Our responsibility is to express an opinion on the Company's internal control over financial reporting based on our audit.
We conducted our audit in accordance with the standards of the Public Company Accounting Oversight Board (United States). Those standards require that we plan and perform the audit to obtain reasonable assurance about whether effective internal control over financial reporting was maintained in all material respects. Our audit included obtaining an understanding of internal control over financial reporting, assessing the risk that a material weakness exists, testing and evaluating the design and operating effectiveness of internal control based on the assessed risk, and performing such other procedures as we considered necessary in the circumstances. We believe that our audit provides a reasonable basis for our opinion.
A company's internal control over financial reporting is a process designed by, or under the supervision of, the company's principal executive and principal financial officers, or persons performing similar functions, and effected by the company's board of directors, management, and other personnel to provide reasonable assurance regarding the reliability of financial reporting and the preparation of financial statements for external purposes in accordance with generally accepted accounting principles. A company's internal control over financial reporting includes those policies and procedures that (1) pertain to the maintenance of records that, in reasonable detail, accurately and fairly reflect the transactions and dispositions of the assets of the company; (2) provide reasonable assurance that transactions are recorded as necessary to permit preparation of financial statements in accordance with generally accepted accounting principles, and that receipts and expenditures of the company are being made only in accordance with authorizations of management and directors of the company; and (3) provide reasonable assurance regarding prevention or timely detection of unauthorized acquisition, use, or disposition of the company's assets that could have a material effect on the financial statements.
Because of the inherent limitations of internal control over financial reporting, including the possibility of collusion or improper management override of controls, material misstatements due to error or fraud may not be prevented or detected on a timely basis. Also, projections of any evaluation of the effectiveness of the internal control over financial reporting to future periods are subject to the risk that the controls may become inadequate because of changes in conditions, or that the degree of compliance with the policies or procedures may deteriorate.
In our opinion, the Company maintained, in all material respects, effective internal control over financial reporting as of June 30, 2014, based on the criteria established in Internal Control - Integrated Framework (1992) issued by the Committee of Sponsoring Organizations of the Treadway Commission.
We have also audited, in accordance with the standards of the Public Company Accounting Oversight Board (United States), the consolidated financial statements and consolidated financial statement schedule as of and for the year ended June 30, 2014 of the Company and our report dated
August 8, 2014
expressed an unqualified opinion on those consolidated financial statements and consolidated financial statement schedule.
|
/s/ Deloitte & Touche LLP
|
|
Parsippany, New Jersey
|
August 8, 2014
77
None.
78
The executive officers of the Company, their ages, positions, and the period during which they have been employed by ADP are as follows:
|
Employed by
|
||||||
|
Name
|
|
Age
|
|
Position
|
|
ADP Since
|
|
Steven J. Anenen
|
61
|
President, Dealer Services
|
1975
|
|||
|
John Ayala
|
47
|
President, Employer Services - Small Business
|
2002
|
|||
|
Services, Retirement Services and Insurance Services
|
||||||
|
Mark D. Benjamin
|
43
|
President, Global Enterprise Solutions
|
1992
|
|||
|
Maria Black
|
40
|
President, Employer Services - TotalSource
|
1996
|
|||
|
Michael A. Bonarti
|
48
|
Vice President, General Counsel and Secretary
|
1997
|
|||
|
Michael L. Capone
|
47
|
Vice President and Chief Information Officer
|
1988
|
|||
|
Deborah L. Dyson
|
48
|
Vice President, Client Experience and
|
1988
|
|||
|
Continuous Improvement
|
||||||
|
Michael C. Eberhard
|
52
|
Vice President and Treasurer
|
1998
|
|||
|
Edward B. Flynn, III
|
54
|
Vice President, Employer Services - Sales and Marketing
|
1988
|
|||
|
Regina R. Lee
|
57
|
Vice President
|
1982
|
|||
|
Dermot J. O'Brien
|
48
|
Chief Human Resources Officer
|
2012
|
|||
|
Douglas Politi
|
52
|
President, Added Value Services
|
1992
|
|||
|
Anish D. Rajparia
|
43
|
President, Major Account Services and ADP Canada
|
|
2002
|
||
|
Carlos A. Rodriguez
|
50
|
President and Chief Executive Officer
|
1999
|
|||
|
Alan Sheiness
|
56
|
|
Corporate Controller and Principal Accounting Officer
|
1984
|
||
|
Jan Siegmund
|
|
50
|
Chief Financial Officer
|
1999
|
||
|
Joe Timko
|
54
|
Chief Strategy Officer
|
2013
|
|||
Steven J. Anenen joined ADP in 1975. He has served as President, Dealer Services since 2004.
John Ayala joined ADP in 2002. Prior to his appointment as President, Employer Services - Small Business Services, Retirement Services and Insurance Services in July 2014, he served as Vice President, Client Experience and Continuous Improvement from 2013 to June 2014, as Senior Vice President, Employer Services - Small Business Services from 2011 to January 2013, and as Senior Vice President, Service and Operations, TotalSource from 2008 to 2011.
Mark D. Benjamin joined ADP in 1992. Prior to his appointment as President, Global Enterprise Solutions, which includes Employer Services - International, National Account Services, Benefit Services, TheRightThing, GlobalView and Streamline, in July 2013, he served as President, Employer Services International from July 2011 to June 2013, and as Senior Vice President, Small Business Services and TotalSource from 2008 to June 2011.
Maria Black joined ADP in 1996. Prior to her appointment as President, Employer Services - TotalSource in July 2014, she served as General Manager, ADP United Kingdom from July 2013 to June 2014, and as General Manager, Employer Services - TotalSource Western Central Region from 2008 to June 2013.
Michael A. Bonarti joined ADP in 1997. Prior to his appointment as Vice President, General Counsel and Secretary in June 2010, he served as Staff Vice President and Associate General Counsel from November 2007 to June 2010.
Michael L. Capone joined ADP in 1988. He has served as Vice President and Chief Information Officer since 2008.
Deborah L. Dyson joined ADP in 1988. Prior to her appointment as Vice President, Client Experience and Continuous Improvement in July 2014, she served as Division Vice President / General Manager, Employer Services - Major Account Services South Service Center from July 2012 to June 2014, and as Division Vice President / General Manager, Employer Services - Major Account Services Northwest Service Center from July 2006 to June 2012.
Michael C. Eberhard joined ADP in 1998. Prior to his appointment as Vice President and Treasurer in 2009, he served as Staff Vice President and Assistant Treasurer from 2007 to 2009.
79
Edward B. Flynn, III joined ADP in 1988. Prior to his appointment as Vice President, Employer Services - Sales and Marketing in 2013, he served as Vice President, Employer Services - Sales from 2009 to 2013, and as President, Employer Services International from 2008 to 2009.
Regina R. Lee joined ADP in 1982. Prior to announcing her retirement effective December 31, 2014, she served as President, Employer Services - Major Account Services and ADP Canada from 2013 to June 2014, as President, Employer Services - National Account Services, Major Account Services, ADP Canada, and GlobalView from 2011 to June 2013, as President, Employer Services - Small Business Services and Major Account Services from 2010, and as President, Employer Services - National Account Services and Employer Services International from 2008 to 2010.
Dermot J. O'Brien joined ADP in 2012 as Chief Human Resources Officer. Prior to joining ADP, he was Executive Vice President of Human Resources at TIAA-CREF from 2003 to 2012.
Douglas Politi joined ADP in 1992. Prior to his appointment as President, Added Value Services in 2013, he served as Senior Vice President, CFO Suite (AVS) from 2011 to 2013, and as Senior Vice President, Retirement Services from 2006 to 2011.
Anish D. Rajparia joined ADP in 2002. Prior to his appointment as President, Employer Services - Major Account Services and ADP Canada in July 2014, he served as President, Employer Services - Small Business Services, TotalSource, Retirement Services, and Insurance Services from 2012 to June 2014, as President, Employer Services - Small Business Services, TotalSource, and Retirement Services from 2011 to 2012, and as President, Employer Services International from 2009 to 2011.
Carlos A. Rodriguez joined ADP in 1999. Prior to his appointment in November 2011 to President and Chief Executive Officer, he served as President and Chief Operating Officer from June 2011 to November 2011, as President, Employer Services - National Account Services, ADP Canada, and GlobalView and Employer Services International, from 2010 to May 2011, and as President, Employer Services - Small Business Services from 2007 to 2010.
Alan Sheiness joined ADP in 1984. He has served as Corporate Controller and Principal Accounting Officer since 2007.
Jan Siegmund joined ADP in 1999. Prior to his appointment as Chief Financial Officer in 2012, he served as President, Added Value Services and Chief Strategy Officer from 2009 to 2012, and as President, Added Value Services from 2007 to 2009.
Joe Timko joined ADP in June 2013 as Chief Strategy Officer. Prior to joining ADP, he was Executive Vice President, Chief Technology & Strategy Officer at Pitney Bowes Inc. from April 2012 to June 2013, Chief Strategy & Innovation Officer at Pitney Bowes from February 2010 to April 2012, and a partner in the Technology, Telecom & Industrial Sector practices at McKinsey & Company from 2001 to 2010.
Directors
See “Election of Directors” in the Proxy Statement for the Company's
2014
Annual Meeting of Stockholders, which information is incorporated herein by reference.
Section 16(a) Beneficial Ownership Reporting Compliance
See “Section 16(a) Beneficial Ownership Reporting Compliance” in the Proxy Statement for the Company's
2014
Annual Meeting of Stockholders, which information is incorporated herein by reference.
Code of Ethics
ADP has adopted a code of ethics that applies to its principal executive officer, principal financial officer, principal accounting officer and persons performing similar functions. The code of ethics may be viewed online on ADP's website at www.adp.com under “Ethics” in the “About ADP” section. Any amendment to or waivers from the code of ethics will be disclosed on our website within four business days following the date of the amendment or waiver.
Audit Committee
See “Audit Committee Report” in the Proxy Statement for the Company's
2014
Annual Meeting of Stockholders, which information is incorporated herein by reference.
80
See “Compensation of Executive Officers” and “Election of Directors - Compensation of Non-Employee Directors” in the Proxy Statement for the Company's
2014
Annual Meeting of Stockholders, which information is incorporated herein by reference.
See “Election of Directors - Security Ownership of Certain Beneficial Owners and Managers” and “Election of Directors - Equity Compensation Plan Information” in the Proxy Statement for the Company's
2014
Annual Meeting of Stockholders, which information is incorporated herein by reference.
See “Election of Directors - Corporate Governance” in the Proxy Statement for the Company's
2014
Annual Meeting of Stockholders, which information is incorporated herein by reference.
See “Independent Registered Public Accounting Firm's Fees” in the Proxy Statement for the Company's
2014
Annual Meeting of Stockholders, which information is incorporated herein by reference.
(a) Financial Statements and Financial Statement Schedules
1.
Financial Statements
The following report and consolidated financial statements of the Company are contained in Part II, Item 8 hereof:
Report of Independent Registered Public Accounting Firm
Statements of Consolidated Earnings - years ended June 30,
2014
,
2013
and
2012
Consolidated Balance Sheets - June 30,
2014
and
2013
Statements of Consolidated Stockholders' Equity - years ended June 30,
2014
,
2013
and
2012
Statements of Consolidated Cash Flows - years ended June 30,
2014
,
2013
and
2012
Notes to Consolidated Financial Statements
2.
Financial Statement Schedules
|
|
|
|
Page in Form 10-K
|
|
|
Schedule II - Valuation and Qualifying Accounts
|
|
|
All other Schedules have been omitted because they are inapplicable or are not required or the information is included elsewhere in the financial statements or notes thereto.
(b) Exhibits
The following exhibits are filed with this Annual Report on Form 10-K or incorporated herein by reference to the document set forth next to the exhibit in the list below:
|
3.1
|
Amended and Restated Certificate of Incorporation dated November 11, 1998 - incorporated by reference to Exhibit 3.1 to the Company's Registration Statement No. 333-72023 on Form S-4 filed with the Commission on February 9, 1999
|
|
3.2
|
Amended and Restated By-laws of the Company - incorporated by reference to Exhibit 3.1 to the Company's Current Report on Form 8-K dated April 9, 2014
|
|
10.1
|
Separation and Distribution Agreement, dated as of March 20, 2007, between Automatic Data Processing, Inc. and Broadridge Financial Solutions, LLC - incorporated by reference to Exhibit 10.1 to the Company's Current Report on Form 8-K dated March 21, 2007
|
|
10.2
|
Separation Agreement and General Release, dated November 14, 2011, by and between Gary C. Butler and Automatic Data Processing, Inc. - incorporated by reference to Exhibit 10.1 to the Company's Current Report on Form 8-K dated November 14, 2011
|
81
|
10.3
|
Letter Agreement, dated as of December 14, 2011, between Automatic Data Processing, Inc., and Carlos Rodriguez - incorporated by reference to Exhibit 10.1 to the Company's Current Report on Form 8-K dated December 14, 2011(Management Contract)
|
|
10.4
|
Amended and Restated Supplemental Officers Retirement Plan - incorporated by reference to Exhibit 10.4 to the Company's Current Report on Form 8-K dated November 10, 2009 (Management Compensatory Plan)
|
|
10.5
|
Form of Performance Stock Unit Award Agreement under the 2008 Omnibus Award Plan- incorporated by reference to Exhibit 10.30 to the Company's Annual Report on Form 10-K for the fiscal year ended June 30, 2013) (Management Compensatory Plan)
|
|
10.6
|
2000 Stock Option Plan - incorporated by reference to Exhibit 10.8 to the Company's Quarterly Report on Form 10-Q for the fiscal quarter ended September 30, 2009 (Management Compensatory Plan)
|
|
10.7
|
Automatic Data Processing, Inc. Deferred Compensation Plan, as Amended and Restated Effective July 25, 2014 (Management Compensatory Plan)
|
|
10.8
|
Automatic Data Processing, Inc. Change in Control Severance Plan for Corporate Officers, as amended (Management Compensatory Plan)
|
|
10.9
|
Amended and Restated Employees' Saving-Stock Option Plan - incorporated by reference to Exhibit 10.11 to the Company's Quarterly Report on Form 10-Q for the fiscal quarter ended December 31, 2005 (Management Compensatory Plan)
|
|
10.10
|
2003 Director Stock Plan - incorporated by reference to Exhibit 4.4 to Registration Statement No. 333-147377 on Form S-8 filed with the Commission on November 14, 2007 (Management Compensatory Plan)
|
|
10.11
|
Automatic Data Processing, Inc. Amended and Restated Employees' Savings-Stock Purchase Plan (Management Compensatory Plan)
|
|
10.12
|
364-Day Credit Agreement, dated as of June 18, 2014, among Automatic Data Processing, Inc., the Borrowing Subsidiaries thereto, the Lenders Party thereto, JPMorgan Chase Bank, N.A., as Administrative Agent, Bank of America, N.A., BNP Paribas, Wells Fargo Bank, N.A. and Citibank, N.A., as Syndication Agents, and Deutsche Bank Securities Inc. and Barclays Bank PLC, as Documentation Agents. - incorporated by reference to Exhibit 10.12 to the Company's Current Report on Form 8-K dated June 18, 2014
|
|
10.13
|
Five-Year Credit Agreement, dated as of June 18, 2014, among Automatic Data Processing, Inc., the Borrowing Subsidiaries thereto, the Lenders party thereto, JPMorgan Chase Bank, N.A., as Administrative Agent, J.P. Morgan Europe Limited, as London Agent, JP Morgan Chase Bank, N.A., Toronto Branch, as Canadian Agent, Bank of America, N.A., BNP Paribas, Wells Fargo Bank, N.A., and Citibank, N.A., as Syndication Agents, and Deutsche Bank Securities Inc. and Barclays Bank PLC, as Documentation Agents - incorporated by reference to Exhibit 10.15 to the Company's Current Report on Form 8-K dated June 18, 2014
|
|
10.14
|
Amended and Restated Five-Year Credit Agreement, dated as of June 19, 2013, among Automatic Data Processing, Inc., the Lenders Party thereto, JPMorgan Chase Bank, N.A., as Administrative Agent, Bank of America, N.A., BNP Paribas, Wells Fargo Bank, N.A., Barclays Bank PLC, and Citibank, N.A., as Syndication Agents, and Deutsche Bank Securities Inc., as Documentation Agent. - incorporated by reference to Exhibit 10.18 to the Company's Current Report on Form 8-K dated June 19, 2013
|
|
10.15
|
2000 Stock Option Grant Agreement (Form for Employees) for grants prior to August 14, 2008 - incorporated by reference to Exhibit 10.1 to the Company's Quarterly Report on Form 10-Q for the fiscal quarter ended September 30, 2004 (Management Compensatory Plan)
|
|
10.16
|
2000 Stock Option Grant Agreement (Form for French Associates) for grants prior to August 14, 2008 - incorporated by reference to Exhibit 10.2 to the Company's Quarterly Report on Form 10-Q for the fiscal quarter ended September 30, 2004 (Management Compensatory Plan)
|
|
10.17
|
2000 Stock Option Grant Agreement (Form for Non-Employee Directors) for grants prior to August 14, 2008 - incorporated by reference to Exhibit 10.3 to the Company's Quarterly Report on Form 10-Q for the fiscal quarter ended September 30, 2004 (Management Compensatory Plan)
|
|
10.18
|
2000 Stock Option Grant Agreement (Form for Employees) for grants beginning August 14, 2008 - incorporated by reference to Exhibit 10.25 to the Company's Current Report on Form 8-K dated August 13, 2008 (Management Compensatory Plan)
|
|
10.19
|
Non-Employee Director Compensation Summary Sheet - (Management Compensatory Plan)
|
|
10.20
|
Separation Agreement and Release, dated November 12, 2012, by and between Christopher R. Reidy and Automatic Data Processing, Inc. - incorporated by reference to Exhibit 10.1 to the Company's Current Report on Form 8-K dated November 12, 2012
|
82
|
10.21
|
Separation Agreement and Release, dated April 21, 2014, by and between Regina R. Lee and Automatic Data Processing, Inc. - incorporated by reference to Exhibit 10.1 to the Company's Current Report on Form 8-K dated April 21, 2014
|
|
10.22
|
2008 Omnibus Award Plan - incorporated by reference to Appendix A to the Company's Proxy Statement for its 2008 Annual Meeting of Stockholders filed with the Commission on September 26, 2008 (Management Compensatory Plan)
|
|
10.23
|
French Sub Plan under the 2008 Omnibus Award Plan effective as of January 26, 2012 - incorporated by reference to Exhibit 10.2 to the Company's Quarterly Report on Form 10-Q for the fiscal quarter ended March 31, 2012 (Management Compensatory Plan)
|
|
10.24
|
Form of Restricted Stock Award Agreement under the 2008 Omnibus Award Plan - incorporated by reference to Exhibit 10.31 to the Company's Quarterly Report on Form 10-Q for the fiscal quarter ended December 31, 2008 (Management Compensatory Plan)
|
|
10.25
|
Form of Stock Option Grant Agreement under the 2008 Omnibus Award Plan (Form for French Employees) for grants prior to January 26, 2012 - incorporated by reference to Exhibit 10.30 to the Company's Quarterly Report on Form 10-Q for the fiscal quarter ended December 31, 2008 (Management Compensatory Plan)
|
|
10.26
|
Form of Stock Option Grant Agreement under the 2008 Omnibus Award Plan (Form for French Employees) for grants beginning January 26, 2012 - incorporated by reference to Exhibit 10.1 to the Company's Quarterly Report on Form 10-Q for the fiscal quarter ended March 31, 2012 (Management Compensatory Plan)
|
|
10.27
|
Form of Stock Option Grant Agreement under the 2008 Omnibus Award Plan (Form for Non- Employee Directors) for grants prior to November 12, 2008 - incorporated by reference to Exhibit 10.27 to the Company's Quarterly Report on Form 10-Q for the fiscal quarter ended December 31, 2008 (Management Compensatory Plan)
|
|
10.28
|
Form of Stock Option Grant Agreement under the 2008 Omnibus Award Plan (Form for Non- Employee Directors) for beginning November 12, 2008 (Management Compensatory Plan)
|
|
10.29
|
Form of Stock Option Grant Agreement under the 2008 Omnibus Award Plan (Form for Employees) (Management Compensatory Plan)
|
|
10.30
|
Form of Deferred Stock Unit Award Agreement under the 2008 Omnibus Award Plan- incorporated by reference to Exhibit 10.33 to the Company's Annual Report on Form 10-K for the fiscal year ended June 30, 2012 (Management Compensatory Plan)
|
|
21
|
Subsidiaries of the Company
|
|
23
|
Consent of Independent Registered Public Accounting Firm
|
|
31.1
|
Certification by Carlos A. Rodriguez pursuant to Rule 13a-14(a) of the Securities Exchange Act of 1934
|
|
31.2
|
Certification by Jan Siegmund pursuant to Rule 13a-14(a) of the Securities Exchange Act of 1934
|
|
32.1
|
Certification by Carlos A. Rodriguez pursuant to 18 U.S.C. Section 1350, as adopted pursuant to Section 906 of the Sarbanes-Oxley Act of 2002
|
|
32.2
|
Certification by Jan Siegmund pursuant to 18 U.S.C. Section 1350, as adopted pursuant to Section 906 of the Sarbanes-Oxley Act of 2002
|
|
101.INS
|
XBRL instance document
|
|
101.SCH
|
XBRL taxonomy extension schema document
|
|
101.CAL
|
XBRL taxonomy extension calculation linkbase document
|
|
101.LAB
|
XBRL taxonomy label linkbase document
|
|
101.PRE
|
XBRL taxonomy extension presentation linkbase document
|
|
101.DEF
|
XBRL taxonomy extension definition linkbase document
|
83
AUTOMATIC DATA PROCESSING, INC.
AND SUBSIDIARIES
SCHEDULE II - VALUATION AND QUALIFYING ACCOUNTS
(In thousands)
|
Column A
|
Column B
|
Column C
|
Column D
|
Column E
|
||||||||||||||||||
|
Additions
|
||||||||||||||||||||||
|
(1)
|
(2)
|
|||||||||||||||||||||
|
Balance at beginning of period
|
Charged to costs and expenses
|
Charged to other accounts
|
Deductions
|
Balance at end of period
|
||||||||||||||||||
|
Year ended June 30, 2014:
|
||||||||||||||||||||||
|
Allowance for doubtful accounts:
|
||||||||||||||||||||||
|
Current
|
$
|
50,201
|
|
$
|
17,796
|
|
$
|
—
|
|
$
|
(12,278
|
)
|
(A)
|
$
|
55,719
|
|
||||||
|
Long-term
|
$
|
9,033
|
|
$
|
2,964
|
|
$
|
—
|
|
$
|
(3,639
|
)
|
(A)
|
$
|
8,358
|
|
||||||
|
Deferred tax valuation allowance
|
$
|
48,792
|
|
$
|
6,621
|
|
$
|
3,935
|
|
(B)
|
$
|
(15,305
|
)
|
$
|
44,043
|
|
||||||
|
Year ended June 30, 2013:
|
||||||||||||||||||||||
|
Allowance for doubtful accounts:
|
||||||||||||||||||||||
|
Current
|
$
|
46,042
|
|
$
|
19,664
|
|
$
|
—
|
|
$
|
(15,505
|
)
|
(A)
|
$
|
50,201
|
|
||||||
|
Long-term
|
$
|
8,812
|
|
$
|
2,687
|
|
$
|
—
|
|
$
|
(2,466
|
)
|
(A)
|
$
|
9,033
|
|
||||||
|
Deferred tax valuation allowance
|
$
|
54,127
|
|
$
|
3,887
|
|
$
|
(842
|
)
|
(B)
|
$
|
(8,380
|
)
|
$
|
48,792
|
|
||||||
|
Year ended June 30, 2012:
|
||||||||||||||||||||||
|
Allowance for doubtful accounts:
|
||||||||||||||||||||||
|
Current
|
$
|
50,065
|
|
$
|
23,472
|
|
$
|
—
|
|
$
|
(27,495
|
)
|
(A)
|
$
|
46,042
|
|
||||||
|
Long-term
|
$
|
9,438
|
|
$
|
2,106
|
|
$
|
—
|
|
$
|
(2,732
|
)
|
(A)
|
$
|
8,812
|
|
||||||
|
Deferred tax valuation allowance
|
$
|
62,084
|
|
$
|
4,002
|
|
$
|
(5,465
|
)
|
(B)
|
$
|
(6,494
|
)
|
$
|
54,127
|
|
||||||
(A) Doubtful accounts written off, less recoveries on accounts previously written off.
(B) Includes amounts related to foreign exchange fluctuation.
84
SIGNATURES
Pursuant to the requirements of Section 13 or 15(d) of the Securities Exchange Act of 1934, the Registrant has duly caused this report to be signed on its behalf by the undersigned, thereunto duly authorized.
|
|
AUTOMATIC DATA PROCESSING, INC.
|
||
|
|
(Registrant)
|
||
|
|
|||
|
August 8, 2014
|
By
|
/s/ Carlos A. Rodriguez
|
|
|
Carlos A. Rodriguez
|
|||
|
President and Chief Executive Officer
|
|||
|
Signature
|
|
Title
|
|
Date
|
|
|
|
|
|
|
|
/s/ Carlos A. Rodriguez
|
President and Chief Executive
|
August 8, 2014
|
||
|
(Carlos A. Rodriguez)
|
Officer, Director
|
|||
|
(Principal Executive Officer)
|
||||
|
|
||||
|
/s/ Jan Siegmund
|
Chief Financial Officer
|
August 8, 2014
|
||
|
(Jan Siegmund)
|
(Principal Financial Officer)
|
|||
|
|
||||
|
/s/ Alan Sheiness
|
Corporate Controller
|
August 8, 2014
|
||
|
(Alan Sheiness)
|
|
(Principal Accounting Officer)
|
||
|
|
||||
|
/s/ Ellen R. Alemany
|
Director
|
August 8, 2014
|
||
|
(Ellen R. Alemany)
|
||||
|
|
||||
|
/s/ Gregory D. Brenneman
|
Director
|
August 8, 2014
|
||
|
(Gregory D. Brenneman)
|
||||
|
|
||||
|
/s/ Leslie A. Brun
|
Director
|
August 8, 2014
|
||
|
(Leslie A. Brun)
|
||||
|
|
||||
|
/s/ Richard T. Clark
|
Director
|
August 8, 2014
|
||
|
(Richard T. Clark)
|
|
|||
|
/s/ Eric C. Fast
|
Director
|
|
August 8, 2014
|
|
|
(Eric C. Fast)
|
|
|
||
|
|
||||
|
/s/ Linda R. Gooden
|
Director
|
August 8, 2014
|
||
|
(Linda R. Gooden)
|
||||
|
|
||||
|
/s/ Michael P. Gregoire
|
Director
|
August 8, 2014
|
||
|
(Michael P. Gregoire)
|
||||
85
|
/s/ R. Glenn Hubbard
|
Director
|
August 8, 2014
|
||
|
(R. Glenn Hubbard)
|
||||
|
|
||||
|
/s/ John P. Jones
|
Director
|
August 8, 2014
|
||
|
(John P. Jones)
|
||||
|
|
||||
|
/s/ Gregory L. Summe
|
Director
|
August 8, 2014
|
||
|
(Gregory L. Summe)
|
||||
86
TABLE OF CONTENTS
Part IItem 1. BusinessItem 1A. Risk FactorsItem 1B. Unresolved Staff CommentsItem 2. PropertiesItem 3. Legal ProceedingsPart IIItem 5. Market For Registrant's Common Equity, Related Stockholder Matters and Issuer Purchases Of Equity SecuritiesItem 6. Selected Financial DataNote 1. Non-gaap Financial MeasuresItem 7. Management's Discussion and Analysis Of Financial Condition and Results Of OperationsNote 1. Non-gaap MeasuresItem 7A. Quantitative and Qualitative Disclosures About Market RiskItem 8. Financial Statements and Supplementary DataNote 1. Summary Of Significant Accounting PoliciesNote 2. Separation Of Dealer ServicesNote 3. Other Income, NetNote 4. AcquisitionsNote 5. DivestituresNote 6. Corporate Investments and Funds Held For ClientsNote 7. ReceivablesNote 8. Property, Plant and EquipmentNote 9. Goodwill and Intangible Assets, NetNote 10. Short Term FinancingNote 11. Employee Benefit PlansNote 12. Income TaxesNote 13. Commitments and ContingenciesNote 14. Reclassification Out Of Accumulated Other Comprehensive IncomeNote 15. Financial Data By Segment and Geographic AreaNote 16. Quarterly Financial Results (unaudited)Note 17. Subsequent EventsItem 9. Changes in and Disagreements with Accountants on Accounting and Financial DisclosureItem 9A. Controls and ProceduresItem 9B. Other InformationPart IIIItem 10. Directors, Executive Officers and Corporate GovernanceItem 11. Executive CompensationItem 12. Security Ownership Of Certain Beneficial Owners and Management and Related Stockholder MattersItem 13. Certain Relationships and Related Transactions, and Director IndependenceItem 14. Principal Accounting Fees and ServicesPart IVItem 15. Exhibits, Financial Statement Schedules