AUTODESK, INC.
10-Ks and 10-Qs
|
|
|
|
|
|
|
|
|
|
|
|
|
|
|
|
|
|
|
|
|
|
|
|
|
|
|
|
|
|
|
|
|
|
|
|
|
|
|
|
|
|
|
|
|
|
|
|
|
|
|
|
|
|
|
|
|
|
|
|
|
|
|
|
|
UNITED STATES
SECURITIES AND EXCHANGE COMMISSION
Washington, D.C. 20549
_____________________________________________________________
FORM 10-K
|
x
|
ANNUAL REPORT PURSUANT TO SECTION 13 OR 15(D) OF THE SECURITIES EXCHANGE ACT OF 1934
|
For the fiscal year ended
January 31, 2014
or
|
¨
|
TRANSITION REPORT PURSUANT TO SECTION 13 OR 15(D) OF THE SECURITIES EXCHANGE ACT OF 1934
|
For the transition period from to
Commission File Number: 0-14338
_____________________________________________________________
AUTODESK, INC.
(Exact name of registrant as specified in its charter)
|
Delaware
|
|
94-2819853
|
|
(State or other jurisdiction
of incorporation or organization)
|
|
(I.R.S. employer
Identification No.)
|
|
111 McInnis Parkway,
San Rafael, California
|
|
94903
|
|
(Address of principal executive offices)
|
|
(Zip Code)
|
Registrant’s telephone number, including area code: (415) 507-5000
_____________________________________________________________
Securities registered pursuant to Section 12(b) of the Act:
|
Title of each class
|
|
Name of each exchange
on which registered
|
|
Common Stock, $0.01 Par Value
|
|
The NASDAQ Stock Market LLC
(NASDAQ Global Select Market)
|
Securities registered pursuant to Section 12(g) of the Act: None
_____________________________________________________________
Indicate by check mark if the registrant is a well-known seasoned issuer, as defined in Rule 405 of the Securities Act. Yes
x
No
¨
Indicate by check mark if the registrant is not required to file reports pursuant to Section 13 or Section 15(d) of the Securities Exchange Act of 1934 (“Exchange Act”). Yes
¨
No
x
Indicate by check mark whether the registrant (1) has filed all reports required to be filed by Section 13 or 15(d) of the Exchange Act during the preceding 12 months (or for such shorter period that the registrant was required to file such reports), and (2) has been subject to such filing requirements for the past 90 days. Yes
x
No
¨
Indicate by check mark whether the registrant has submitted electronically and posted on its corporate Web site, if any, every Interactive Data File required to be submitted and posted pursuant to Rule 405 of Regulation S-T during the preceding 12 months (or for such shorter period that the registrant was required to submit and post such files). Yes
x
No
¨
Indicate by check mark if disclosure of delinquent filers pursuant to Item 405 of Regulation S-K is not contained herein, and will not be contained, to the best of registrant’s knowledge, in definitive proxy or information statements incorporated by reference in Part III of this Form 10-K or any amendment to this Form 10-K.
x
Indicate by check mark whether the registrant is a large accelerated filer, an accelerated filer, a non-accelerated filer, or a smaller reporting company. See the definitions of “large accelerated filer,” “accelerated filer” and “smaller reporting company” in Rule 12b-2 of the Exchange Act.
|
Large accelerated filer
x
|
|
Accelerated filer
o
|
Non-accelerated filer
o
|
Smaller reporting company
o
|
||
Indicate by check mark whether the registrant is a shell company (as defined by Rule 12b-2 of the Exchange Act). Yes
¨
No
x
As of July 31, 2013, the last business day of the registrant’s most recently completed second fiscal quarter, there were approximately 221.6 million shares of the registrant’s common stock outstanding that were held by non-affiliates, and the aggregate market value of such shares held by non-affiliates of the registrant (based on the closing sale price of such shares on the NASDAQ Global Select Market on July 31, 2013) was approximately $7.8 billion. Shares of the registrant’s common stock held by each executive officer and director have been excluded in that such persons may be deemed to be affiliates. This determination of affiliate status is not necessarily a conclusive determination for other purposes.
As of February 28, 2014, the registrant had outstanding 227,185,041 shares of common stock.
DOCUMENTS INCORPORATED BY REFERENCE
Portions of the Proxy Statement for registrant’s Annual Meeting of Stockholders (the “Proxy Statement”), are incorporated by reference in Part III of this Form 10-K to the extent stated herein. The Proxy Statement will be filed within 120 days of the registrant’s fiscal year ended
January 31, 2014
.
[THIS PAGE INTENTIONALLY LEFT BLANK]
AUTODESK, INC. FORM 10-K
TABLE OF CONTENTS
|
|
|
Page
|
|
Item 1.
|
||
|
Item 1A.
|
||
|
Item 1B.
|
||
|
Item 2.
|
||
|
Item 3.
|
||
|
Item 4.
|
||
|
Item 5.
|
||
|
Item 6.
|
||
|
Item 7.
|
||
|
Item 7A.
|
||
|
Item 8.
|
||
|
Item 9.
|
||
|
Item 9A.
|
||
|
Item 9B.
|
||
|
Item 10.
|
||
|
Item 11.
|
||
|
Item 12.
|
||
|
Item 13.
|
||
|
Item 14.
|
||
|
Item 15.
|
||

2014 Form 10-K 3
FORWARD-LOOKING INFORMATION
The discussion in this Annual Report on Form 10-K contains trend analyses and other forward-looking statements within the meaning of Section 27A of the Securities Act of 1933 and Section 21E of the Securities Exchange Act of 1934. Forward-looking statements are any statements that look to future events and consist of, among other things, our business strategies; anticipated future financial results; the effectiveness of our efforts to successfully manage transitions to new business models and markets; the effectiveness of efforts to reduce our operating expenses; expected market trends, including the growth of cloud, mobile and social computing; our belief that the strength of our channel network, technological leadership, brand recognition, breadth of product line and large installed base are benefitting us as global economies recover; expected trends in certain financial metrics; our ability to successfully expand adoption of our products; our ability to gain market acceptance of new businesses and sales initiatives; our ability to successfully increase sales of product suites as part of our overall sales strategy; our belief that emerging economies continue to present long-term growth opportunities for us; the impact of our restructuring activities; the sufficiency of our cash to meet our working capital and operating resource expenditure requirements over the next 12 months; and our ability to generate sufficient future taxable income in appropriate tax jurisdictions to realize our net deferred tax assets. In addition, forward-looking statements also consist of statements involving expectations regarding product acceptance, activity related to our stock repurchase program, and short-term and long-term cash requirements, as well as statements involving trend analyses and statements including such words as “may,” “believe,” “could,” “anticipate,” “would,” “might,” “plan,” “expect,” and similar expressions or the negative of these terms or other comparable terminology. These forward-looking statements speak only as of the date of this Annual Report on Form 10-K and are subject to business and economic risks. As such, our actual results could differ materially from those set forth in the forward-looking statements as a result of a number of factors, including those set forth below in Item 1A, “Risk Factors,” and in our other reports filed with the U.S. Securities and Exchange Commission. We assume no obligation to update the forward-looking statements to reflect events that occur or circumstances that exist after the date on which they were made, except as required by law.
PART I
ITEM 1. BUSINESS
Note: A glossary of terms used in this Form 10-K appears at the end of this Item 1.
GENERAL
We are a world leading design software and services company, offering customers productive business solutions through powerful technology products and services. We serve customers in the architecture, engineering and construction; manufacturing; and digital media, consumer and entertainment industries. Our sophisticated software products enable our customers to experience their ideas before they are real. Customers are able to imagine, design and create their ideas by visualizing, simulating and analyzing real-world performance early in the design process by creating and manipulating digital prototypes. These capabilities allow our customers to foster innovation, optimize and improve their designs, save time and money, improve quality, communicate intentions, and collaborate with others. Our professional software products are sold globally, both directly to customers and through a network of resellers and distributors. Additionally, we sell a line of consumer products for digital art, personal design and creativity, and home design. These products are sold over the Internet and in various digital storefronts, including the Apple App Store and the Google Play Store.
Segments
We report based on four reportable operating segments:
|
•
|
Platform Solutions and Emerging Business (“PSEB”), which accounted for
35%
of our net revenue in fiscal
2014
;
|
|
•
|
Architecture, Engineering and Construction (“AEC”), which accounted for
32%
of our net revenue in fiscal
2014
;
|
|
•
|
Manufacturing (“MFG”), which accounted for
25%
of our net revenue in fiscal
2014
; and
|
|
•
|
Media and Entertainment (“M&E”), which accounted for
8%
of our net revenue in fiscal
2014
.
|
2014 Form 10-K 4
A summary of our net revenue and results of operations for our business segments is found in Note
13
, “
Segments
,” in the Notes to our Consolidated Financial Statements.
Our PSEB, AEC and MFG segments derive revenue from the sale of licenses and subscriptions for software products and services to customers who design, build, and own buildings, infrastructures, and manufactured products. In addition to software products, the PSEB, AEC and MFG segments offer a range of services, including consulting, support and training, largely dedicated to enhancing our ability to sell licenses and subscriptions to our software products. Our M&E segment derives revenue from the sale of licenses and subscriptions for software products to creative professionals, post-production facilities, and broadcasters for a variety of applications, including feature films, television programs, commercials, music and corporate videos, interactive game production, web design and interactive web streaming. In addition, our animation products produced by our M&E segment are often used by customers of products from our other segments for the visualization of their designs.
The principal products and services of these segments include the following:
|
•
|
Flagship products, which accounted for approximately
51%
of our net revenue in fiscal
2014
, are our core standalone horizontal, vertical and model-based design products including AutoCAD, AutoCAD LT, AutoCAD Civil 3D, AutoCAD Mechanical, AutoCAD Map, AutoCAD Architecture, Maya and 3ds Max.
|
|
•
|
Suites, which accounted for approximately
34%
of our net revenue in fiscal
2014
, are a combination of products that target a specific user objective (product design, building design, etc.) and support a set of workflows for that objective, including Autodesk Product Design Suites, Autodesk Building Design Suites, Autodesk Infrastructure Design Suites and AutoCAD Design Suites.
|
|
•
|
New and Adjacent products, which accounted for approximately
14%
of our net revenue in fiscal
2014
, are new product offerings as well as products that are not considered flagship or suites, including Autodesk Creative Finishing products, Autodesk Moldflow products and Autodesk Alias Design products.
|
Corporate Information
We were incorporated in California in April 1982 and were reincorporated in Delaware in May 1994. Our principal executive office is located at 111 McInnis Parkway, San Rafael, California 94903, and the telephone number at that address is (415) 507-5000. Our internet address is www.autodesk.com. The information posted on our website is not incorporated into this Annual Report on Form 10-K. Our Annual Report on Form 10-K, Quarterly Reports on Form 10-Q, Current Reports on Form 8-K and amendments to reports filed or furnished pursuant to Sections 13(a) and 15(d) of the Securities Exchange Act of 1934, as amended, are available free of charge on the Investor Relations portion of our web site at www.autodesk.com as soon as reasonably practicable after we electronically file such material with, or furnish it to, the SEC. The public may also read and copy any material we file with the SEC at the SEC's Public Reference Room at 100 F Street N.E. Washington, D.C. 20549. The public may obtain information on the operation of the Public Reference Room by calling the SEC at 1 (800) SEC-0330.
PRODUCTS
The principal product offerings from Autodesk’s different segments are as follows:
PSEB
Our PSEB segment includes our design product, AutoCAD. Our AutoCAD product is a platform product that underpins our design product offerings for all the industries we serve. For example, our AEC and MFG segments offer tailored versions of AutoCAD software for the industries they serve. Our AutoCAD product also provides a platform for our developer partners to build custom solutions for a range of diverse design-oriented markets. PSEB's revenue primarily includes revenue from sales of licenses of our design products, AutoCAD and AutoCAD LT, as well as the Autodesk Design Suite and many other design and consumer products. The segment’s principal product offerings included the following during fiscal
2014
:
|
•
|
AutoCAD
|
AutoCAD software, which is our largest revenue-generating product, is a customizable and extensible computer-aided design (CAD) application for professional design, drafting, detailing and visualization. AutoCAD software provides digital tools that can be used independently and in conjunction with other specific applications in fields ranging from construction to manufacturing, civil engineering and process plant design.
2014 Form 10-K 5
|
•
|
AutoCAD LT
|
AutoCAD LT software is purpose built for professional drafting and detailing. AutoCAD LT includes document sharing capability without the need for software customization or certain advanced functionality found in our AutoCAD product. Users can share all design data with team members who use our AutoCAD product or other Autodesk products built on AutoCAD. AutoCAD LT software is our second largest revenue-generating product.
AEC
Our AEC software products help to improve the way building, civil infrastructure, process plant and construction projects are designed, built and managed. A broad portfolio of solutions enables greater efficiency, accuracy and sustainability across the entire project lifecycle. Our AEC solutions include advanced technology for building information modeling (“BIM”), AutoCAD-based design and documentation productivity software, sustainable design analysis applications, collaboration and project management solutions. BIM, an integrated process for building and infrastructure design, analysis, documentation and construction, uses consistent, coordinated information to improve communication and collaboration between the extended project team. AEC provides a comprehensive portfolio of BIM solutions that help customers deliver projects faster and more economically, while minimizing environmental impact. The segment’s principal product offerings included the following during fiscal
2014
:
|
•
|
Autodesk Building Design Suites
|
Autodesk Building Design Suites ("BDS") give the power of BIM or CAD, with tools for modeling, visualization, and documentation. With a comprehensive set of tools, BDS gives customers the ability to manage all phases of design and construction. Three editions of BDS are available to meet each customer's particular business needs and offers the depth and breadth of the Autodesk portfolio.
|
•
|
Autodesk Revit
|
Purpose-built for BIM, the Autodesk Revit products collect information about a building project and allow this information to be coordinated across all other representations of the project, so that every drawing sheet, 2D and 3D view and schedule is based on internally consistent and complete information from the same underlying building database. The Autodesk Revit products, including AutoCAD Revit Architecture Suite, AutoCAD Revit MEP Suite and AutoCAD Revit Structure Suite, provide an intuitive, sophisticated, model-based design and documentation system for architects; mechanical, electrical and plumbing ("MEP") engineers; structural engineers; design-build teams; and other design and building industry professionals.
|
•
|
Autodesk Infrastructure Design Suites
|
The Infrastructure Design Suites are the BIM for Infrastructure design solution that combines intelligent, model-based tools to help the user to gain more accurate, accessible, and actionable insight. With unique access to the Autodesk infrastructure software portfolio, users can benefit throughout the execution and lifecycle of transportation, land, and water projects. Three editions of Infrastructure Design Suites are available to meet each customer's particular business needs and offers the depth and breadth of the Autodesk portfolio.
|
•
|
AutoCAD Civil 3D
|
AutoCAD Civil 3D products provide a surveying, design, analysis, and documentation solution for civil engineering, including land development, transportation, and environmental projects. Using a model-centric approach that automatically updates documentation as design changes are made, AutoCAD Civil 3D products enable civil engineers, designers, drafters, and surveyors to significantly boost productivity and deliver higher-quality designs and construction documentation faster. With AutoCAD Civil 3D products, the entire project team works from the same consistent, up-to-date model so they stay coordinated throughout all project phases.
2014 Form 10-K 6
|
•
|
AutoCAD Map 3D
|
AutoCAD Map 3D software provides direct access to data needed for infrastructure planning, design and management activities. AutoCAD Map 3D software helps professionals working on transportation, land development, water and power projects to more easily create, manage and analyze design geographic information system and asset data.
MFG
Our MFG segment provides manufacturers in automotive and transportation, industrial machinery, consumer products and building products with comprehensive digital prototyping solutions that bring together product data from all phases of the product development through production process to develop a single digital model created in Autodesk Inventor software. Our solutions for digital prototyping are scalable, attainable, cost-effective and allow for real-world simulation, enabling a broad group of manufacturers to realize benefits with minimal disruption to existing workflows. MFG’s principal product offerings included the following during fiscal
2014
:
|
•
|
Autodesk Product Design Suites
|
Autodesk Product Design Suites ("PDS") is a comprehensive solution for digital prototyping, delivering 3D design, visualization and simulation tools to complete the entire engineering process. The digital prototyping capabilities of PDS can help customers design better products, reduce development costs and get to market faster. Three editions of PDS are available to meet each customer's particular business needs and offers the depth and breadth of the Autodesk portfolio.
|
•
|
Autodesk Inventor
|
Autodesk Inventor allows manufacturers to go beyond 3D design to digital prototyping by giving engineers a comprehensive and flexible set of tools for 3D mechanical design, simulation, analysis, tooling, visualization and documentation. With Autodesk Inventor, engineers can integrate AutoCAD drawings and model-based design data into a single digital model, creating a virtual representation of a final product that enables them to validate the form, fit and function of the product before it is ever built.
|
•
|
AutoCAD Mechanical
|
AutoCAD Mechanical software is purpose-built to accelerate the mechanical design process. AutoCAD Mechanical software offers users significant productivity gains and helps save hours of design time by including all the functionality of AutoCAD software, in addition to comprehensive libraries of standards-based parts and tools for automating common design tasks.
|
•
|
Autodesk Moldflow
|
The Autodesk Moldflow family of injection molding simulation software provides tools that help manufacturers optimize the design of plastic parts and injection molds, and study the injection molding process.
M&E
Our M&E segment is comprised of two product groups: Animation and Creative Finishing. Animation products are sold as software only and provide tools for digital sculpting, modeling, animation, effects, rendering, and compositing for design visualization, visual effects and games production. Creative Finishing products are primarily sold as turnkey solutions for editing, finishing and visual effects design and color grading. Principal product offerings in our M&E segment’s Animation and Creative Finishing product groups included the following during fiscal
2014
:
Animation
|
•
|
Autodesk Maya
|
Autodesk Maya software provides 3D modeling, animation, effects, rendering and compositing solutions that enable film and video artists, game developers and design visualization professionals to digitally create engaging, lifelike images, realistic animations and simulations, extraordinary visual effects, and full length animated feature films.
2014 Form 10-K 7
|
•
|
Autodesk 3ds Max
|
Autodesk 3ds Max software provides 3D modeling, animation and rendering solutions that enable game developers, design visualization professionals and visual effects artists to digitally create realistic images, animations and complex scenes and to digitally communicate abstract or complex mechanical, architectural, engineering and construction concepts.
Creative Finishing
|
•
|
Autodesk Flame, Autodesk Smoke, and Autodesk Lustre
|
Autodesk Flame software is an interactive real-time design, finishing, grading and visual effects solution for supervised post-production. Autodesk Smoke software is a non-linear and non-compressed online editing, effects and finishing software application and is used in commercials, music videos, corporate video, film as well as broadcast design projects. Autodesk Lustre software is a high-performance color grading solution used by artists for creative look development and final color and lighting effects for both film and television.
PRODUCT DEVELOPMENT AND INTRODUCTION
The technology industry is characterized by rapid technological change in computer hardware, operating systems and software. In addition, our customers’ requirements and preferences rapidly evolve, as do their expectations of the performance of our software. To keep pace with these changes, we maintain a vigorous program of new product development to address demands in the marketplace for our products.
Just as the transition from mainframes to personal computers transformed the industry thirty years ago, we believe our industry is undergoing a similar transition from the personal computer to cloud, social, and mobile computing. To address this transition we have accelerated our move to the cloud and are offering more flexible licenses. For example, in fiscal 2014, we began offering BIM 360, Product Lifecycle Management (“PLM”) and Fusion 360, our cloud based offerings, which provide tools, including social and mobile capabilities, to help streamline design, collaboration, and data management processes. We believe that customer adoption of these new offerings will continue to grow as customers across a range of industries began to take advantage of the scalable computing power and flexibility provided through these new services.
We dedicate considerable technical and financial resources to research and development to further enhance our existing products and to create new products and technologies. Research and development expenditures were $
611.1 million
or
27%
of fiscal
2014
net revenue, $
600.0 million
or
26%
of fiscal
2013
net revenue and $
566.5 million
or
26%
of fiscal
2012
net revenue. Our software is primarily developed internally; however, we also use independent firms and contractors to perform some of our product development activities. Additionally, we acquire products or technology developed by others by purchasing or licensing products and technology from third parties. We continually review these investments in an effort to ensure that we are generating sufficient revenue or gaining a competitive advantage to justify their costs.
The majority of our research and product development is performed in the United States, China, Singapore and Canada. However, we employ experienced software developers in many of our other locations. Translation and localization of our products are performed in a number of local markets, principally Singapore and Switzerland. We generally localize and translate our products into German, French, Italian, Spanish, Russian, Japanese, Korean and simplified and traditional Chinese.
We plan to continue to manage significant product development operations internationally over the next several years. We believe that our ability to conduct research and development at various locations throughout the world allows us to optimize product development, lower costs and integrate local market knowledge into our development activities. We continually assess the significant costs and challenges, including intellectual property protection, against the benefits of our international development activities.
In addition, our business and our customers benefit from our relationships with a network of over
4,000
third-party developers who develop and sell their own products that further enhance the range of integrated solutions available to our customers.
For further discussion regarding risks from our product development and introduction efforts, see
Item 1A
, “
Risk Factors
.”
2014 Form 10-K 8
MARKETING AND SALES
We license or sell our products and services globally, primarily through indirect channels consisting of distributors and resellers. To a lesser extent we also transact directly with customers who are primarily large corporations. Our indirect channel model includes both a two-tiered distribution structure, where distributors sell to resellers, and a one-tiered structure, where Autodesk sells directly to resellers. We have a network of approximately
2,500
resellers and distributors worldwide. For fiscal
2014
, approximately
84%
of our revenue was derived from indirect channel sales through distributors and resellers, and we expect that the majority of our revenue will continue to be derived from indirect channel sales in the future. We employ a variety of incentive programs and promotions to align our reseller channel with our business strategies. Sales through our largest distributor, Tech Data Corporation and its affiliates, accounted for
24%
,
23%
and
21%
of our net revenue for fiscal years
2014
,
2013
and
2012
, respectively. We believe our business is not substantially dependent on Tech Data. Our customers through Tech Data are the resellers and end users who purchase our software licenses and services. Should any of the agreements between us and Tech Data be terminated for any reason, we believe the resellers and end users who currently purchase our products through Tech Data would be able to continue to do so under substantially the same terms from one of our many other distributors without substantial disruption to our revenue. No other distributor, reseller, or direct customer accounted for 10% or more of our revenue.
Our customer-related operations are divided into three geographic regions, the Americas; Europe, Middle East and Africa (“EMEA”); and Asia Pacific (“APAC”). Each geographic region is supported by global marketing and sales organizations. These organizations develop and manage overall marketing and sales programs and work closely with a network of domestic and international sales offices. Fiscal
2014
net revenue in the EMEA, Americas and APAC was $
851.8 million
(
37%
), $
818.9 million
(
36%
) and $
603.2 million
(
27%
), respectively. We intend to continue to make our products available in foreign languages. We believe that international sales will continue to comprise the majority of our total net revenue. Adverse economic conditions in the countries that contribute a significant portion of our net revenue, including emerging economies, may have an adverse effect on our business in those countries and our overall financial performance. A summary of our financial information by geographic location is found in Note
13
, “
Segments
,” in the Notes to Consolidated Financial Statements. Our international operations and sales subject us to a variety of risks; see
Item 1A
, “
Risk Factors
,” for further discussion.
We also work directly with reseller and distributor sales organizations, computer manufacturers, other software developers and peripherals manufacturers in cooperative advertising, promotions and trade-show presentations. We employ mass-marketing techniques such as webcasts, seminars, telemarketing, direct mailings, advertising in business and trade journals and social media. We have a worldwide user group organization and we have created online user communities dedicated to the exchange of information related to the use of our products.
In addition to sales of new perpetual use software licenses, we generate revenue through several subscription-based business models. The largest is our maintenance program, under which customers who own a perpetual use license for the most recent version of the underlying product are able to purchase maintenance that provides them with unspecified upgrades when-and-if-available and are able to download e-Learning courses and receive online support over a one year or multi-year maintenance service period.
We also offer more flexible term-based license offerings to our customers. Our subscription-based business models help our customers reduce up-front licensing costs, provide more flexibility with how they use our products and address new categories of customers such as project-based users and small businesses. Over the next few years, we expect to significantly increase our subscription base and the annual value per subscription, which will ultimately drive billings growth.
Our ability to effectively distribute our products depends in part upon the financial and business condition of our distributor and reseller networks. The loss of, or a significant reduction in, business with any one of our major distributors or large resellers could harm our business; see
Item 1A
, “
Risk Factors
,” for further discussion.
CUSTOMER AND RESELLER SUPPORT
We provide technical support and training to customers through a leveraged support model, augmented by direct programs designed to address certain specific needs. Our customers rely primarily on the resellers and distributors from which they purchased licenses to our products for technical support; however, we do provide certain direct support for some of our customers. We support our resellers and distributors through technical product training, sales training classes, the Internet and telephone. We also provide online support directly to our customers through our maintenance program. There are also a number of user group forums in which customers are able to share information.
2014 Form 10-K 9
EDUCATIONAL PROGRAMS
We help students and educators imagine, design, and create a better world by granting them, for little or no fees, Autodesk Software licenses, specialized learning content, education communities, and support networks.
We are committed to helping fuel a lifelong passion for design in students of all ages, and inspiring and supporting educators. As such, we partner with education institutions and work to develop programs that can facilitate a passion for design in students, and provide a good foundation for STEAM (Science, Technology, Engineering, Digital Arts, and Math) growth in the secondary school market. Within our secondary and postsecondary school markets, we are enabling future workforces to graduate industry-ready and Autodesk-literate with marketable software skills that are in high demand. Whether future professional designers or lifelong design hobbyists, our full portfolio of professional-grade and personal design products introduce students and educators at all levels to design and the power of design technology.
DEVELOPER PROGRAMS
One of our key strategies is to maintain an open-architecture design of our software products to facilitate third-party development of complementary products and industry-specific software solutions. This approach enables customers and third parties to customize solutions for a wide variety of highly specific uses. We offer several programs that provide marketing, sales, technical support and programming tools to developers who develop add-on applications for our products. Over
4,000
developers in the Autodesk Developer Network create interoperable products that further enhance the range of integrated solutions available to our customers.
COMPETITION
The markets for our products are highly competitive and subject to rapid change. We strive to increase our competitive separation by investing in research and development, allowing us to bring new products to market and create exciting new versions of existing products that offer compelling efficiencies for our customers. We also compete through investments in marketing and sales to more effectively reach new customers and better serve existing customers.
Our competitors include large, global, publicly traded companies; small, geographically focused firms; startup firms; and solutions produced in-house by their users. Our primary global competitors in the PSEB, AEC and MFG segments include Adobe Systems Incorporated, ANSYS, Inc., AVEVA Group plc, Bentley Systems, Incorporated, Dassault Systèmes S.A. and its subsidiary Dassault Systèmes SolidWorks Corp., Environmental Systems Research Institute, Inc. (ESRI), Intergraph Corporation, a wholly owned subsidiary of Hexagon AB, MSC Software Corporation, Nemetschek AG, PTC, 3D Systems, and Trimble Navigation Limited.
Our M&E segment also competes with a wide range of different companies from large, global, publicly-traded companies to small private entities. Large organizations that produce products that compete in some or all of our markets include Adobe Systems Incorporated, Apple Inc., Avid Technology, Inc., SONY Corporation and Technicolor, among others. The media and entertainment market is highly fragmented with complex interdependencies between many of the larger businesses. As a result, some of our competitors also own subsidiaries that are our customers or our partners in developing or bringing to market some of our solutions. In addition to traditional competitors in developed economies, we encounter new competitors in emerging economies.
The software industry has limited barriers to entry, and the availability of computing power with continually expanding performance at progressively lower prices contributes to the ease of market entry. The industry is presently undergoing a platform shift from the personal computer to cloud and mobile computing. This shift further lowers barriers to entry and poses a disruptive challenge to established software companies. The design software market is characterized by vigorous competition in each of the vertical markets in which we compete, both from existing competitors and by entry of new competitors with innovative technologies. Competition is increasingly enhanced by consolidation of companies with complementary products and technologies and the possibility that competitors in one vertical segment may enter other vertical segments that we serve. In addition, some of our competitors in certain markets have greater financial, technical, sales and marketing and other resources than we do. Because of these and other factors, competitive conditions in these industries are likely to continue to intensify in the future. Increased competition could result in price reductions, reduced net revenue and profit margins and loss of market share, any of which could harm our business. See
Item 1A
, “
Risk Factors
,” for further discussion of risks regarding competition.
2014 Form 10-K 10
We believe that our future results depend largely upon our ability to better serve customers by offering new products, including cloud and mobile computing products, whether by internal development or acquisition, and to continue to provide existing product offerings that compete favorably with respect to ease of use, reliability, performance, range of useful features, continuing product enhancements, reputation, price and training.
INTELLECTUAL PROPERTY AND LICENSES
We maintain an active program to legally protect our investment in technology through intellectual property rights. We protect our intellectual property through a combination of patent, copyright, trademark and trade secret protections, confidentiality procedures and contractual provisions. The nature and extent of legal protection associated with each such intellectual property right depends on, among other things, the type of intellectual property right and the given jurisdiction in which such right arises. We believe that our intellectual property rights are valuable and important to our business, including each of our segments.
Nonetheless, our intellectual property rights may not be successfully asserted in the future or may be invalidated, circumvented or challenged. In addition, the laws of various foreign countries where our products are distributed do not protect our intellectual property rights to the same extent as U.S. laws. Enforcement of intellectual property rights against alleged infringers can sometimes lead to costly litigation and counterclaims. Our inability to protect our proprietary information could harm our business.
From time to time, we receive claims alleging infringement of a third party’s intellectual property rights, including patents. Disputes involving our intellectual property rights or those of another party have in the past and may in the future lead to, among other things, costly litigation or product shipment delays, which could harm our business.
We retain ownership of software we develop. All software is licensed to users and primarily provided in object code pursuant to either shrink-wrap, embedded or on-line licenses, or signed license agreements. These agreements contain restrictions on duplication, disclosure and transfer.
We believe that because of the limitations of laws protecting our intellectual property and the rapid, ongoing technological changes in both the computer hardware and software industries, we must rely principally upon software engineering and marketing skills to maintain and enhance our competitive market position.
While we have recovered some revenue resulting from the unauthorized use of our software products, we are unable to measure the full extent to which piracy of our software products exists. We believe, however, that software piracy is and can be expected to be a persistent problem that negatively impacts our revenue and financial results.
In addition, through various licensing arrangements, we receive certain rights to intellectual property of others. We expect to maintain current licensing arrangements and to secure licensing arrangements in the future, as needed and to the extent available on reasonable terms and conditions, to support continued development and sales of our products and services. Some of these licensing arrangements require or may require royalty payments and other licensing fees. The amount of these payments and fees may depend on various factors, including but not limited to: the structure of royalty payments, offsetting considerations, if any, and the degree of use of the licensed technology.
See
Item 1A
, “
Risk Factors
,” for further discussion of risks related to protecting our intellectual property.
PRODUCTION AND SUPPLIERS
The production of our PSEB, AEC, MFG and certain M&E software products involves duplication of the software media and, for certain products, the printing of user manuals. The purchase of media and the transfer of the software programs onto media for distribution to customers are performed by us and by licensed subcontractors. Media for our products such as DVDs and USB flash drives are available from multiple sources. We offer our maintenance customers an electronic software download option for selected product updates. Customers who choose electronic fulfillment receive the latest version of the software from our vendor’s secure servers. For certain products, user manuals are made available by request only as we work toward reducing our cost of shipping and production as well as the use of natural resources. User manuals and packaging materials are produced to our specifications by outside sources. Production is performed in leased facilities operated by independent third-party contractors. To date, we have not experienced any material difficulties or delays in the production of our software and documentation.
2014 Form 10-K 11
EMPLOYEES
As of
January 31, 2014
, we employed approximately
7,600
people. None of our employees in the United States are represented by a labor union. In certain foreign countries, our employees are represented by work councils. We have never experienced any work stoppages and believe our employee relations are good. Reliance upon employees in other countries entails various risks and changes in these foreign countries, such as government instability or regulation unfavorable to foreign-owned businesses, that could negatively impact our business in the future.
2014 Form 10-K 12
ACQUISTIONS
Over the past three years, we acquired new technology or supplemented our technology by purchasing businesses or certain technology related assets focused in specific markets or industries. For the three years ended
January 31, 2014
,
2013
and
2012
, we acquired a number of companies and certain technology related assets, some of which were accounted for as business combinations. The following were key acquisitions for fiscal years
2014
,
2013
and
2012
:
|
Date of closing
|
|
Company
|
|
Details
|
|
November 2013
|
Graitec SA (“Graitec”)
|
The acquisition of Graitec (including Graitec’s Advance Steel and Advance Concrete product lines, and associated employees) enhanced Autodesk’s offerings for structural engineering and expanded our portfolio of technology for BIM for structural fabrication and detailing. Graitec was integrated into Autodesk’s AEC segment.
|
||
|
December 2012
|
PI-VR GmbH ("PI-VR")
|
The PI-VR acquisition brings sophisticated visualization solutions that will strengthen and enhance our expertise in and offerings for automotive visualization. PI-VR has been integrated into, and the related goodwill was assigned to, the MFG segment.
|
||
|
October 2012
|
Qontext ("Qontext")
|
The Qontext acquisition provides us with an enterprise business and social collaboration platform which extends our reach into design networks via contextual workflows. This also expands our expertise in cloud and social networking by supplementing existing knowledge in cloud, web, and mobile development. Qontext has been integrated into, and the related goodwill was assigned to, the PSEB segment.
|
||
|
August 2012
|
Socialcam ("Socialcam")
|
The Socialcam acquisition strengthens our ability to make our product line more social, and deliver more mobile/web oriented products. In addition, the acquisition integrated with Autodesk 360 to further provide collaboration features to our professional customers. Socialcam has been integrated into, and the related goodwill was assigned to, the PSEB segment.
|
||
|
June 2012
|
Vela Systems, Inc. ("Vela")
|
The Vela acquisition provides a platform to deliver project information to the point of construction. Vela, integrated with Navisworks, augments the model-based data created in Revit, establishing a bi-direction and visual link between model elements and relevant information - streamlining the information management process from design through construction to hand-over and into operations. In addition, this acquisition delivers model-based construction via mobile and cloud. Vela has been integrated into, and the related goodwill was assigned to, the AEC segment.
|
||
|
December 2011
|
T-Splines, Inc. ("T-Splines")
|
The T-Splines acquisition strengthens our Digital Prototyping portfolio with more flexible free-form modeling and will help achieve closer integration between industrial design and engineering workflows. T-Splines has been integrated into, and the related goodwill was assigned to, the MFG segment.
|
||
|
October 2011
|
|
Micro Application Packages Limited
("MAP") |
|
The MAP acquisition expands our portfolio for MEP contractors and fabricators by providing tools for the manufacturing, fabrication and installation of MEP systems. MAP has been integrated into, and the related goodwill was assigned to, the AEC segment.
|
|
August 2011
|
Turbo Squid, Inc. (“Turbo Squid”)
|
The acquisition of certain technology assets from Turbo Squid strengthens our online marketplace platform for our design application users.
|
||
|
August 2011
|
|
Instructables, Inc.
("Instructables") |
|
The Instructables acquisition assists makers of all types by linking Instructables' vibrant online community to our software tools and services, such as SketchBook, 123D and Homestyler that allow anyone to explore design ideas and bring them to life. Instructables has been integrated into, and the related goodwill was assigned to, the PSEB segment.
|
|
March 2011
|
|
Blue Ridge Numerics, Inc.
("Blue Ridge") |
|
The Blue Ridge acquisition broadens our solution for Digital Prototyping to provide customers with a spectrum of computational fluid dynamics (CFD) capabilities that help automate fluid flow and thermal simulation decision-making for designs, while eliminating costly physical prototyping cycles. Blue Ridge has been integrated into, and the related goodwill was assigned to, the MFG segment.
|
|
March 2011
|
|
Scaleform Corporation
("Scaleform") |
|
The Scaleform acquisition furthers Autodesk's ability to provide customers with more complete workflows to more rapidly develop immersive 3D and casual game experiences. Scaleform has been integrated into, and the related goodwill was assigned to, the M&E segment.
|
BACKLOG
We typically ship products shortly after receipt of an order, which is common in the software industry. Our backlog is comprised of current software license product orders which have not yet shipped. The category of current software license product orders which we have not yet shipped consists of orders from customers with approved credit status for currently available software products and may include both orders with current ship dates and orders with ship dates beyond the current fiscal period.
2014 Form 10-K 13
Backlog was $
19.7 million
at
January 31, 2014
compared to $
20.0 million
at
January 31, 2013
. The actual amount of backlog at any particular time may not be a meaningful indicator of future business prospects as this amount is impacted by a number of factors not related to future trends or events such as the order fulfillment process, the method of software delivery or the linearity of our business within the fiscal period.
GLOSSARY OF TERMS
BIM (Building Information Modeling)
—
BIM describes a model-based technology linked with a database of project information, and is the process of generating and managing information throughout the life cycle of a building. BIM is used as a digital representation of the building process to facilitate exchange and interoperability of information in digital formats.
Constant currency growth rates
—
We attempt to represent the changes in the underlying business operations by eliminating fluctuations caused by changes in foreign currency exchange rates as well as eliminating hedge gains or losses recorded within the current and comparative period. Our constant currency methodology removes all hedging gains and losses from the calculation.
Digital prototyping
—
Digital prototyping allows designers, architects and engineers to analyze, simulate and visualize a design using a digital or virtual model rather than a physical model.
Flagship
—
Autodesk flagship products are our core design products. Flagship includes the following products: 3ds Max, AutoCAD, AutoCAD LT, AutoCAD vertical products (such as AutoCAD Architecture and AutoCAD Mechanical), Civil 3D, Inventor products (standalone), Maya, Plant 3D, and Revit products (standalone).
License and Other revenue
—
License and other revenue consists of two components: all forms of product license revenue and other revenue. Product license revenue includes: software license revenue from the sale of new seat licenses and upgrades and product revenue for Creative Finishing. Other revenue includes revenue from consulting, training, Autodesk Developers Network and Creative Finishing customer support, and is recognized over time, as the services are performed.
Maintenance
—
Our maintenance program provides our commercial and educational customers with a cost effective and predictable budgetary option to obtain the productivity benefits of our new releases and enhancements when and if released during the term of their contracts. Under our maintenance program, customers are eligible to receive unspecified upgrades when and if available, downloadable training courses and online support. We recognize maintenance revenue over the term of the agreements, generally between one and three years.
New and Adjacent
—
Autodesk new and adjacent products include Autodesk's new product offerings as well as products that are not included in flagship or suites. New and adjacent includes the following services and products: Autodesk Alias Design products, Autodesk 360 products, Autodesk Consulting, Autodesk Simulation, Autodesk Simulation Multiphysics, Autodesk Buzzsaw, Autodesk CF Design, Autodesk Constructware, Autodesk consumer products, Autodesk Creative Finishing products, Autodesk Moldflow products, Autodesk Navisworks, Autodesk Scaleform, Autodesk Vault products and all other products.
Suites
—
Autodesk design suites are a combination of products that target a specific user objective (product design, building design, etc.) and support a set of workflows for that objective. Our current design and creation suites include: AutoCAD Design Suite, Autodesk Building Design Suite, Autodesk Entertainment Creation Suite, Autodesk Factory Design Suite, Autodesk Infrastructure Design Suite, Autodesk Plant Design Suite, and Autodesk Product Design Suite.
Subscription revenue
—
Autodesk subscription revenue consists of two components: maintenance revenue from our software products and revenue from our cloud service offerings, including Autodesk 360.
|
ITEM 1A.
|
RISK FACTORS
|
We operate in a rapidly changing environment that involves significant risks, a number of which are beyond our control. In addition to the other information contained in this Form 10-K, the following discussion highlights some of these risks and the possible impact of these factors on our business, financial condition and future results of operations. If any of the following risks actually occur, our business, financial condition or results of operations may be adversely impacted, causing the trading price of our common stock to decline. In addition, these risks and uncertainties may impact the “forward-looking” statements described
2014 Form 10-K 14
elsewhere in this Form 10-K and in the documents incorporated herein by reference. They could affect our actual results of operations, causing them to differ materially from those expressed in “forward-looking” statements.
Global economic conditions may further impact our business, financial results and financial condition.
As our business has expanded globally, we have increasingly become subject to risks arising from adverse changes in global economic and political conditions. The past several years have been characterized by weak global economic conditions, a tightening in the credit markets, relatively high unemployment, a low level of liquidity in many financial markets, increased government deficit spending and debt levels, uncertainty about certain governments' abilities to repay such debt or to address certain fiscal issues (such as “austerity” measures in Southern Europe), and volatility in many financial instrument markets. While some recent indicators point to a slow economic recovery, on the whole indicators continue to suggest a mixed trend in economic activity among the different geographical regions and markets.
Over the past several years, many of our customers have experienced tighter credit, negative financial news and weaker financial performance of their businesses and have reduced their workforces, thereby reducing the number of licenses and the number of maintenance contracts they purchase from us. In addition, a number of our customers rely, directly and indirectly, on government spending. Current debt balances of many countries without proportionate increases in revenues have caused many countries to reduce spending and in some cases have forced those countries to restructure their debt in an effort to avoid defaulting under those obligations. This has not only impacted those countries but others that are holders of such debt and those assisting in such restructuring.
These actions may impact, and over the past several years have negatively impacted, our business, financial results and financial condition. In addition, these factors are causing, and over the past several years have caused, us to restructure our business and in turn we have and will incur restructuring charges. Moreover, our financial performance may be negatively impacted by:
|
•
|
lack of credit available to and the insolvency of key channel partners, which may impair our distribution channels and cash flows;
|
|
•
|
counterparty failures negatively impacting our treasury functions, including timely access to our cash reserves and third-party fulfillment of hedging transactions;
|
|
•
|
counterparty failures negatively affecting our insured risks;
|
|
•
|
inability of banks to honor our existing line of credit, which could increase our borrowing expenses or eliminate our ability to obtain short-term financing; and
|
|
•
|
decreased borrowing and spending by our end users on small and large projects in the industries we serve, thereby reducing demand for our products.
|
Even if economic conditions in the U.S. and foreign markets improve generally, a slower economic recovery in industries important to our business, such as the manufacturing and digital media and entertainment industries, may adversely affect our business, financial results and financial condition. If a macro-economic recovery does not occur as rapidly as anticipated, our ability to meet our long-term financial targets may also be adversely affected.
Existing and increased competition and rapidly evolving technological changes may reduce our revenue and profits.
The software industry has limited barriers to entry, and the availability of computing devices with continually expanding performance at progressively lower prices contributes to the ease of market entry. The industry is presently undergoing a platform shift from the personal computer to cloud and mobile computing. This shift further lowers barriers to entry and poses a disruptive challenge to established software companies. The markets in which we compete are characterized by vigorous competition, both by entry of competitors with innovative technologies and by consolidation of companies with complementary products and technologies. In addition, some of our competitors in certain markets have greater financial, technical, sales and marketing and other resources. Furthermore, a reduction in the number and availability of compatible third-party applications, or our inability to rapidly adapt to technological and customer preference changes, including those related to cloud computing, mobile devices, and new computing platforms, may adversely affect the sale of our products. Because of these and other factors, competitive conditions in the industry are likely to intensify in the future. Increased competition could result in price reductions, reduced net revenue and profit margins and loss of market share, any of which would likely harm our business.
2014 Form 10-K 15
We believe that our future results largely depend upon our ability to offer products that compete favorably with respect to reliability, performance, ease of use, range of useful features, continuing product enhancements, reputation and price.
If we fail to successfully manage our business model transition to cloud-based products and more flexible product licenses, our results of operations could be negatively impacted.
To address the industry transition from personal computer to cloud, social, and mobile computing, we have accelerated our move to the cloud and are offering more flexible product licenses. While we expect to increase our subscription base, value per subscription, billings, bookings, ratable and recurring revenue over time as a result of this business model transition, our ability to achieve these financial objectives is subject to risks and uncertainties. The new offerings require a considerable investment of technical, financial, legal and sales resources, and a scalable organization. Market acceptance of such offerings is affected by a variety of factors, including but not limited to: security, reliability, performance, current license terms, customer preference, social/community engagement, customer concerns with entrusting a third party to store and manage their data, public concerns regarding privacy and the enactment of restrictive laws or regulations. Whether our business model transition will prove successful and will accomplish our business and financial objectives is subject to numerous uncertainties, including but not limited to: customer demand, attach and renewal rates, channel acceptance, our ability to further develop and scale infrastructure, our ability to include functionality and usability in such offerings that address customer requirements, tax and accounting implications, pricing and our costs. In addition, the metrics we use to gauge the status of our business model transition may evolve over the course of the transition as significant trends emerge. If we are unable to successfully establish these new offerings and navigate our business model transition in light of the foregoing risks and uncertainties, our results of operations could be negatively impacted.
Our strategy to develop and introduce new products and services exposes us to risks such as limited customer acceptance, costs related to product defects and large expenditures that may not result in additional net revenue or could result in decreased net revenue.
Rapid technological changes, as well as changes in customer requirements and preferences, characterize the software industry. Just as the transition from mainframes to personal computers transformed the industry 30 years ago, we believe our industry is undergoing a similar transition from the personal computer to cloud, mobile and social computing. Customers are also reconsidering the manner in which they license software products, which requires us to constantly evaluate our business model and strategy. In response, we are focused on providing solutions to enable our customers to be more agile and collaborative on their projects. We are also developing consumer products for digital art, personal design and creativity, and home design. We devote significant resources to the development of new technologies. In addition, we frequently introduce new business models or methods that require a considerable investment of technical and financial resources such as an increase in our portfolio of, and focus on, suites and, most recently, our introduction of flexible license and service offerings. We are making such investments through further development and enhancement of our existing products and services, as well as through acquisitions of new product lines. Such investments may not result in sufficient revenue generation to justify their costs and could result in decreased net revenue. If we are not able to meet customer requirements, either with respect to our software products or the manner in which we provide such products, or if we are not able to adapt our business model to meet our customers' requirements, our business, financial condition or results of operations may be adversely impacted.
In particular, a critical component of our growth strategy is to have customers of our AutoCAD and AutoCAD LT products expand their portfolios to include our suites and cloud-based services. Over time, we aim to migrate customers using standalone Autodesk products to expand their portfolio with our suites and cloud-based offerings. At times, sales of licenses of our AutoCAD and AutoCAD LT or standalone Autodesk flagship products have decreased without a corresponding increase in suites product or cloud-based services revenue or without purchases of customer seats to our suites. Should this continue, our results of operations will be adversely affected. Also, adoption of our cloud and mobile computing offerings and changes in the delivery of our software and services to our customers, such as desktop subscription (formally referred to as rental) offerings, will change the way in which we recognize revenue relating to our software and services, with a potential negative impact on our financial performance. The accounting impact of these offerings and other business decisions are expected to result in an increase in the percentage of our ratable revenue, as well as recurring revenue, making for a more predictable business over time, while correspondingly reducing our upfront perpetual revenue stream. Additionally, the software products we offer are complex, and despite extensive testing and quality control, may contain errors or defects. These errors or defects could result in the need for corrective releases to our software products, damage to our reputation, loss of revenue, an increase in product returns or lack of market acceptance of our products, any of which would likely harm our business.
2014 Form 10-K 16
Further, given the rapid speed of changing customer expectations and advancement of technology inherent in the software industry, the extensive and complex efforts required to create useful and widely accepted products and the rapid evolution of cloud computing, mobile devices, new computing platforms and other technologies, such as consumer products, our executive management team must act quickly, continuously and with vision. Although we have articulated a strategy that we believe will fulfill these challenges, if we fail to execute properly on that strategy, adapt that strategy as market conditions evolve or fail to internalize and execute on that strategy, we may fail to meet our customers' expectations, fail to compete with our competitors' products and technology and lose the confidence of our channel partners and employees. This in turn could adversely affect our business and financial performance.
We are dependent on international revenue and operations, exposing us to significant regulatory, global economic, intellectual property, collections, currency exchange rate, taxation, political instability and other risks, which could adversely impact our financial results.
We are dependent on our international operations for a significant portion of our revenue. International net revenue represented
70%
and
71%
of our net revenue in fiscal
2014
and
2013
, respectively. Our international revenue, including that from emerging economies, is subject to general economic and political conditions in foreign markets, including conditions in foreign markets resulting from economic and political conditions in the U.S. Our revenue is also impacted by the relative geographical and country mix of our revenue over time. These factors have recently adversely impacted and may in the future adversely impact our international revenue, and consequently our business as a whole. Our dependency on international revenue makes us much more exposed to global economic and political trends, which can negatively impact our financial results, even if our results in the U.S. are strong for a particular period. Further, a significant portion of our earnings from our international operations may not be freely transferable to the U.S. due to remittance restrictions, adverse tax consequences or other factors. Our intent is that amounts related to foreign earnings permanently reinvested outside the U.S. will remain outside the U.S., and we will meet our U.S. liquidity needs through ongoing cash flows, external borrowings (such as our Senior Notes), or both. However, if, in the future, amounts held by foreign subsidiaries are needed to fund our operations in the U.S., or to service our external borrowings, the repatriation of such amounts to the U.S. could result in a significant incremental tax liability in the period in which the decision to repatriate occurs and payment of any such tax liability would reduce the cash available to fund our operations.
We anticipate that our international operations will continue to account for a significant portion of our net revenue, and, as we expand our international development, sales and marketing expertise, will provide significant support to our overall efforts in countries outside of the U.S. Risks inherent in our international operations include fluctuating currency exchange rates, including risks related to any hedging activities we undertake, unexpected changes in regulatory requirements and practices, delays resulting from difficulty in obtaining export licenses for certain technology, tariffs, quotas and other trade barriers and restrictions, transportation delays, operating in locations with a higher incidence of corruption and fraudulent business practices, particularly in emerging economies, increasing enforcement by the U.S. under the Foreign Corrupt Practices Act, adoption of stricter anti-corruption laws in certain countries, including the United Kingdom, difficulties in staffing and managing foreign sales and development operations, longer collection cycles for accounts receivable, potential changes in tax laws, including possible U.S. and foreign tax law changes that, if enacted, could significantly impact how multinational companies are taxed, tax arrangements with foreign governments, including our ability to meet and review the terms of those tax arrangements, and laws regarding the management of and access to data and public networks, possible future limitations upon foreign owned businesses, increased financial accounting and reporting burdens and complexities, inadequate local infrastructure, greater difficulty in protecting intellectual property, and other factors beyond our control, including popular uprisings, terrorism, war, natural disasters and diseases.
Some of our business partners also have international operations and are subject to the risks described above. Even if we are able to successfully manage the risks of international operations, our business may be adversely affected if our business partners are not able to successfully manage these risks.
Our financial results fluctuate within each quarter and from quarter to quarter making our future revenue and financial results difficult to predict.
Our quarterly financial results have fluctuated in the past and will continue to do so in the future. These fluctuations could cause our stock price to change significantly or experience declines. In addition to the other factors described in this
Part I
,
Item 1A
, some of the factors that could cause our financial results to fluctuate include:
|
•
|
general market, economic, business and political conditions in particular geographies, including Europe and emerging economies,
|
2014 Form 10-K 17
|
•
|
failure to produce sufficient revenue, billings or subscription growth and profitability,
|
|
•
|
results and future projections related to our business model transition,
|
|
•
|
confusion on the part of analysts and investors about the short-term and long-term impact to our business resulting from our business model transition;
|
|
•
|
weak or negative growth in one or more of the industries we serve, including architecture, engineering and construction, manufacturing, education and digital media and entertainment markets,
|
|
•
|
dependence on and the timing of large transactions,
|
|
•
|
changes in product mix, pricing pressure or changes in product pricing,
|
|
•
|
changes in billings linearity,
|
|
•
|
fluctuations in foreign currency exchange rates and the effectiveness of our hedging activity,
|
|
•
|
the ability of governments around the world to adopt fiscal policies, meet their financial and debt obligations, and to finance infrastructure projects,
|
|
•
|
lower growth or contraction of our upgrade or maintenance programs,
|
|
•
|
failure to achieve and maintain planned cost reductions and productivity increases,
|
|
•
|
the effectiveness of our internal business reorganization,
|
|
•
|
restructuring or other accounting charges and unexpected costs or other operating expenses,
|
|
•
|
failure to expand our AutoCAD and AutoCAD LT products customer base to related design products,
|
|
•
|
our inability to rapidly adapt to technological and customer preference changes, including those related to cloud computing, mobile devices, and new computing platforms,
|
|
•
|
the timing of the introduction of new products by us or our competitors,
|
|
•
|
the success of new business or sales initiatives and increasing our portfolio of product suites,
|
|
•
|
the financial and business condition of our reseller and distribution channels,
|
|
•
|
failure to accurately predict the impact of acquired businesses or to identify and realize the anticipated benefits of acquisitions, and successfully integrate such acquired businesses and technologies,
|
|
•
|
perceived or actual technical or other problems with a product or combination of products,
|
|
•
|
unexpected or negative outcomes of matters and expenses relating to litigation or regulatory inquiries,
|
|
•
|
failure to achieve anticipated levels of customer acceptance of key new applications,
|
|
•
|
increases in cloud services-related expenses,
|
|
•
|
security breaches and potential financial penalties to customers and government entities,
|
|
•
|
timing of additional investments in the development of our platform or deployment of our services,
|
|
•
|
timing of product releases and retirements,
|
2014 Form 10-K 18
|
•
|
failure to continue momentum of frequent release cycles or to move a significant number of customers from prior product versions in connection with our programs to retire major products,
|
|
•
|
changes in tax laws or regulations, tax arrangements with foreign governments or accounting rules, such as increased use of fair value measures,
|
|
•
|
changes in sales compensation practices,
|
|
•
|
failure to effectively implement our copyright legalization programs, especially in developing countries,
|
|
•
|
failure to achieve sufficient sell-through in our channels for new or existing products,
|
|
•
|
renegotiation or termination of royalty or intellectual property arrangements,
|
|
•
|
interruptions or terminations in the business of our consultants or third party developers,
|
|
•
|
the timing and degree of expected investments in growth and efficiency opportunities,
|
|
•
|
failure to achieve continued success in technology advancements,
|
|
•
|
catastrophic events or natural disasters,
|
|
•
|
regulatory compliance costs,
|
|
•
|
costs associated with acquisitions of companies and technologies,
|
|
•
|
potential goodwill impairment charges related to prior acquisitions, and
|
|
•
|
adjustments arising from ongoing or future tax examinations.
|
We have also experienced fluctuations in financial results in interim periods in certain geographic regions due to seasonality or regional economic conditions. In particular, our financial results in Europe during our third quarter are usually affected by a slower summer period, and our Asia Pacific operations typically experience seasonal slowing in our third and fourth quarters.
Our operating expenses are based in part on our expectations for future revenue and are relatively fixed in the short term. Accordingly, any revenue shortfall below expectations have had, and in the future could have, an immediate and significant adverse effect on our profitability. Greater than anticipated expenses or a failure to maintain rigorous cost controls would also negatively affect profitability.
Our business could suffer as a result of risks, costs and charges associated with strategic acquisitions and investments such as our fiscal 2015 acquisition of Delcam plc (“Delcam”).
We regularly acquire or invest in businesses, software products and technologies that are complementary to our business through acquisitions, strategic alliances or equity or debt investments. For example, we recently acquired Delcam, a leading supplier of advanced CADCAM and industrial measurement solutions for the manufacturing industry. The risks associated with such acquisitions include, among others, the difficulty of assimilating products, operations and personnel, inheriting liabilities such as intellectual property infringement claims, the failure to realize anticipated revenue and cost projections, the requirement to test and assimilate the internal control processes of the acquired business in accordance with the requirements of Section 404 of the Sarbanes-Oxley Act of 2002 and the diversion of management's time and attention.
In addition, such acquisitions and investments involve other risks such as:
|
•
|
the inability to retain customers, key employees, vendors, distributors, business partners, and other entities associated with the acquired business;
|
2014 Form 10-K 19
|
•
|
the potential impact on relationships with existing customers, vendors and distributors as business partners as a result of acquiring another business;
|
|
•
|
the potential that due diligence of the acquired business or product does not identify significant problems;
|
|
•
|
the potential for incompatible business cultures;
|
|
•
|
significant higher than anticipated transaction or integration-related costs;
|
|
•
|
potential additional exposure to fluctuations in currency exchange rates; and
|
|
•
|
exposure to litigation or other claims in connection with, or inheritance of claims or litigation risk as a result of, an acquisition, including but not limited to, claims from terminated employees, customers, or other third parties.
|
We may not be successful in overcoming such risks, and such acquisitions and investments may negatively impact our business. In addition, such acquisitions and investments have in the past and may in the future contribute to potential fluctuations in our quarterly financial results. These fluctuations could arise from transaction-related costs and charges associated with eliminating redundant expenses or write-offs of impaired assets recorded in connection with acquisitions and investments. These costs or charges could negatively impact our financial results for a given period, cause quarter to quarter variability in our financial results or negatively impact our financial results for several future periods.
If we do not maintain good relationships with the members of our distribution channel, or achieve anticipated levels of sell-through, our ability to generate revenue will be adversely affected. If our distribution channel suffers financial losses, becomes financially unstable or insolvent, or is not provided the right mix of incentives to sell our products, our ability to generate revenue will be adversely affected.
We sell our software products both directly to end-users and through a network of distributors and resellers. For fiscal
2014
and fiscal
2013
, approximately
84%
and
83%
, respectively, of our revenue was derived from indirect channel sales through distributors and resellers, and we expect that the majority of our revenue will continue to be derived from indirect channel sales in the future. Our ability to effectively distribute our products depends in part upon the financial and business condition of our distributor and reseller network. Computer software distributors and resellers typically are not highly capitalized, have previously experienced difficulties during times of economic contraction and experienced difficulties during the past several years. We have processes to ensure that we assess the creditworthiness of distributors and resellers prior to our sales to them. In the past we have taken steps to support them, and may take additional steps in the future, such as extending credit terms and providing temporary discounts. These steps, if taken, could harm our financial results. If our distributors and resellers were to become insolvent, they would not be able to maintain their business and sales, or provide customer support services, which would negatively impact our business and revenue.
We rely significantly upon major distributors and resellers in both the U.S. and international regions, including the distributor Tech Data Corporation and its global affiliates (“Tech Data”). Tech Data accounted for
24%
and
23%
of our total net revenue for fiscal
2014
and
2013
, respectively. Although we believe that we are not substantially dependent on Tech Data, if Tech Data were to experience a significant disruption with its business or if our relationship with Tech Data were to significantly deteriorate, it is possible that our ability to sell to end users would be, at least temporarily, negatively impacted. This could in turn negatively impact our financial results.
Over time, we have modified and will continue to modify aspects of our relationship with our distributors and resellers, such as their incentive programs, pricing to them and our distribution model to motivate and reward them for aligning their businesses with our strategy and business objectives. Changes in these relationships and underlying programs could negatively impact their business and harm our business. In addition, the loss of or a significant reduction in business with those distributors or resellers or the failure to achieve anticipated levels of sell-through with any one of our major international distributors or large resellers could harm our business. In particular, if one or more of such distributors or resellers were unable to meet their obligations with respect to accounts payable to us, we could be forced to write off such accounts and may be required to delay the recognition of revenue on future sales to these customers. These events could have a material adverse effect on our financial results.
Because we derive a substantial portion of our net revenue from a small number of products, including our AutoCAD-based software products and suites, if these products are not successful, our revenue will be adversely affected.
2014 Form 10-K 20
We derive a substantial portion of our net revenue from sales of licenses of a limited number of our products, including AutoCAD software, products based on AutoCAD, which include our suites that serve specific markets, upgrades to those products and products that are interoperable with AutoCAD. Any factor adversely affecting sales of these products, including the product release cycle, market acceptance, product competition, performance and reliability, reputation, price competition, economic and market conditions and the availability of third-party applications, would likely harm our financial results. During fiscal
2014
and
2013
, combined revenue from our AutoCAD and AutoCAD LT products, not including suites having AutoCAD or AutoCAD LT as a component, represented
30%
and
33%
of our total net revenue, respectively.
A significant portion of our revenue is generated through maintenance revenue; decreases in maintenance attach or renewal rates or a decrease in the number of new licenses we sell would negatively impact our future revenue and financial results.
Our maintenance customers have no obligation to attach maintenance to their initial license or renew their maintenance contract after the expiration of their initial maintenance period, which is typically one year. Our customers' attach and renewal rates may decline or fluctuate as a result of a number of factors, including the overall global economy, the health of their businesses, and the perceived value of the maintenance program. If our customers do not attach maintenance to their initial license or renew their maintenance contract for our products, our maintenance revenue will decline and our financial results will suffer.
In addition, a portion of the growth of our maintenance revenue has typically been associated with growth of the number of licenses that we sell. Any reduction in the number of licenses that we sell, even if our customers' attach rates do not change, will have a negative impact on our future maintenance revenue. This in turn would impact our business and harm our financial results.
We recognize maintenance revenue ratably over the term of the maintenance contracts, which is predominantly one year, but may also range up to five years. Decreases in net maintenance billings will negatively impact future maintenance revenue, however future maintenance revenue will also be impacted by other factors such as the amount, timing and mix of contract terms of future billings.
Our restructuring and cost reduction actions may not be as effective as anticipated.
During fiscal years 2013 and 2014, we undertook restructuring plans. If we are unable to realize the outcomes from the restructuring efforts as planned, we may need to undertake additional restructuring efforts, and our business and operating results may be harmed. In taking any future restructuring actions, we may incur additional costs that negatively impact our operating margins. Additionally, a prolonged and slow economic recovery or a renewed recession in U.S. or foreign markets could also lead to additional restructuring actions and associated costs.
In the past, we have taken actions to reduce our cost structure to more closely align our costs with our revenue levels. In taking these actions, we have attempted to balance the cost of such initiatives against their longer term benefits. If we do not achieve the proper balance of these cost reduction initiatives, we may eliminate critical elements of our operations, the loss of which could negatively impact our ability to benefit from an economic recovery. We cannot assure that our cost cutting efforts will achieve appropriate levels of expenses, and we may take additional actions in the future.
We are exposed to fluctuations in currency exchange rates that could negatively impact our financial results and cash flows.
Because we conduct a substantial portion of our business outside the U.S. and we make certain business and resource decisions based on assumptions about foreign currency, we face exposure to adverse movements in foreign currency exchange rates. These exposures may change over time as business practices evolve and economic conditions change, and they could have a material adverse impact on our financial results and cash flows.
We use derivative instruments to manage a portion of our cash flow exposure to fluctuations in foreign currency exchange rates. As part of our risk management strategy, we use foreign currency contracts to manage a portion of our exposures of underlying assets, liabilities and other obligations, which exist as part of our ongoing business operations. These foreign currency instruments have maturities that extend for one to twelve months in the future, and provide us with some protection against currency exposures. However, our attempts to hedge against these risks may not be completely successful, resulting in an adverse impact on our financial results.
The fluctuations of currencies in which we conduct business can both increase and decrease our overall revenue and expenses for any given fiscal period. Although our foreign currency cash flow hedge program extends beyond the current
2014 Form 10-K 21
quarter in order to reduce our exposure to foreign currency volatility, we do not attempt to completely mitigate this risk, and in any case, will incur transaction fees in adopting such hedging programs. Such volatility, even when it increases our revenues or decreases our expenses, impacts our ability to accurately predict our future results and earnings.
Net revenue or earnings shortfalls or the volatility of the market generally may cause the market price of our stock to decline.
The market price for our common stock has experienced significant fluctuations and may continue to fluctuate significantly. The market price for our common stock may be affected by a number of factors, including the other factors described in this
Part I
,
Item 1A
and the following:
|
•
|
shortfalls in our expected financial results, including net revenue, earnings or key performance metrics;
|
|
•
|
quarterly variations in our or our competitors' results of operations;
|
|
•
|
general socio-economic, political or market conditions;
|
|
•
|
confusion on the part of analysts and investors about the short-term and long-term impact to our business resulting from our business model transition;
|
|
•
|
uncertainty about certain governments' abilities to repay debt or effect fiscal policy;
|
|
•
|
changes in estimates of future results or recommendations by securities analysts;
|
|
•
|
the announcement of new products or product enhancements by us or our competitors;
|
|
•
|
unusual events such as significant acquisitions, divestitures, regulatory actions and litigation;
|
|
•
|
changes in laws, rules or regulations applicable to our business;
|
|
•
|
outstanding debt service obligations; and
|
|
•
|
other factors, including factors unrelated to our operating performance, such as instability affecting the economy or the operating performance of our competitors.
|
Significant changes in the price of our common stock could expose us to additional costly and time-consuming litigation. Historically, after periods of volatility in the market price of a company's securities, a company becomes more susceptible to securities class action litigation. This type of litigation is often expensive and diverts management's attention and resources.
From time to time we realign or introduce new business and sales initiatives; if we fail to successfully execute and manage these initiatives, our results of operations could be negatively impacted.
As part of our effort to accommodate our customers' needs and demands and the rapid evolution of technology, we from time to time evolve our business and sales initiatives such as realigning our development and marketing organizations, and expanding our portfolio of suites and our offering of software as a service, and realigning our internal resources in an effort to improve efficiency. Specifically, during fiscal 2013 we undertook organizational changes in order to address major business initiatives, including our desire to accelerate our move to the cloud, transform our customers' experience, increase industry focus to meet customer demands, and develop more effective marketing. These reorganizational efforts included changes to the structure and alignment of our product development and marketing teams and re-organization of our sales teams by industry. We may take such actions without clear indications that they will prove successful, and at times, we have been met with short-term challenges in the execution of such initiatives. Market acceptance of any new business or sales initiative is dependent on our ability to match our customers' needs at the right time and price. Often we have limited prior experience and operating history in these new areas of emphasis. If any of our assumptions about expenses, revenue or revenue recognition principles from these initiatives proves incorrect, or our attempts to improve efficiency are not successful, our actual results may vary materially from those anticipated, and our financial results will be negatively impacted.
A breach of security in our products or computer systems may compromise the integrity of our products, harm our reputation, create additional liability and adversely impact our financial results.
2014 Form 10-K 22
We make significant efforts to maintain the security and integrity of our product source code and computer systems. The risk of a security breach or disruption, particularly through cyber attack or cyber intrusion, including by computer hackers, foreign governments and cyber terrorists, has increased as the number, intensity and sophistication of attempted attacks and intrusions from around the world have increased. These threats include but are not limited to identity theft, unauthorized access, DNS attacks, wireless network attacks, viruses and worms, advanced persistent threat (APT), application centric attacks, peer-to-peer attacks, phishing, backdoor trojans and distributed denial of service (DDoS) attacks. Any of the foregoing could attack our products and computer systems. Despite significant efforts to create security barriers to such programs, it is virtually impossible for us to entirely eliminate this risk. Like all software products, our software is vulnerable to cyber attacks. In the past, hackers have targeted our software, and they may do so in the future. The impact of cyber attacks could disrupt the proper functioning of our software products, cause errors in the output of our customers' work, allow unauthorized access to sensitive, proprietary or confidential information of ours or our customers, and other destructive outcomes.
M
oreover, as we continue to invest in new lines of consumer products and services we are exposed to increased security risks and the potential for unauthorized access to, or improper use of, the information of our consumer users. If any of the foregoing were to occur, our reputation may suffer, customers may stop buying our products, we could face lawsuits and potential liability, and our financial performance could be negatively impacted.
We rely on third-parties to provide us with a number of operational services, including hosting and delivery and certain of our customer services and other operations; any interruption or delay in service from these third parties, breaches of security or privacy, or failures in data collection could expose us to liability, harm our reputation and adversely impact our financial performance.
We rely on hosted computer services from third parties for services that we provide our customers and computer operations for our internal use. As we gather customer data and host certain customer data in third-party facilities, a security breach could compromise the integrity or availability or result in the theft of customer data. In addition, our operations could be negatively affected in the event of a security breach, and we could be subject to the loss or theft of confidential or proprietary information, including source code.
Unauthorized access to this data may be obtained through break-ins, breaches of our secure networks by unauthorized parties, employee theft or misuse, or other misconduct. We rely on a number of third party suppliers in the operation of our business for the provision of various services and materials that we use in the operation of our business and production of our products. Although we seek to diversify our third party suppliers, we may from time to time rely on a single or limited number of suppliers, or upon suppliers in a single country, for these services or materials. The inability of such third parties to satisfy our requirements could disrupt our business operations or make it more difficult for us to implement our business strategy. If any of these situations were to occur, our reputation could be harmed, we could be subject to third party liability, including under data protection and privacy laws in certain jurisdictions, and our financial performance could be negatively impacted.
If we are not able to adequately protect our proprietary rights, our business could be harmed.
We rely on a combination of patent, copyright and trademark laws, trade secret protections, confidentiality procedures and contractual provisions to protect our proprietary rights. Despite such efforts to protect our proprietary rights, unauthorized parties from time to time have copied aspects of our software products or have obtained and used information that we regard as proprietary. Policing unauthorized use of our software products is time-consuming and costly. While we have recovered some revenue resulting from the unauthorized use of our software products, we are unable to measure the extent to which piracy of our software products exists and we expect that software piracy will remain a persistent problem, particularly in emerging economies. Furthermore, our means of protecting our proprietary rights may not be adequate.
Additionally, we actively protect the secrecy of our confidential information and trade secrets, including our source code. If unauthorized disclosure of our source code occurs, we could potentially lose future trade secret protection for that source code. The loss of future trade secret protection could make it easier for third-parties to compete with our products by copying functionality, which could adversely affect our financial performance and our reputation. We also seek to protect our confidential information and trade secrets through the use of non-disclosure agreements with our customers, contractors, vendors and partners. However, it is possible that our confidential information and trade secrets may be disclosed or published without our authorization. If this were to occur, it may be difficult and/or costly for us to enforce our rights, and our financial performance and reputation could be negatively impacted.
2014 Form 10-K 23
We may face intellectual property infringement claims that could be costly to defend and result in the loss of significant rights.
As more software patents are granted worldwide, the number of products and competitors in our industry segments grows and the functionality of products in different industry segments overlaps, we expect that software product developers will be increasingly subject to infringement claims. Infringement or misappropriation claims have in the past been, and may in the future be, asserted against us, and any such assertions could harm our business. Additionally, certain patent holders without products have become more aggressive in threatening and pursuing litigation in attempts to obtain fees for licensing the right to use patents. Any such claims or threats, whether with or without merit, have been and could in the future be time-consuming to defend, result in costly litigation and diversion of resources, cause product shipment delays or require us to enter into royalty or licensing agreements. In addition, such royalty or license agreements, if required, may not be available on acceptable terms, if at all, which would likely harm our business.
Our investment portfolio is composed of a variety of investment vehicles in a number of countries that are subject to interest rate trends, market volatility and other economic factors. If general economic conditions decline, this could cause the credit ratings of our investments to deteriorate, illiquidity in the financial marketplace, and we may experience a decline in interest income, and an inability to sell our investments, leading to impairment in the value of our investments.
It is our policy to invest our cash, cash equivalents and marketable securities in highly liquid instruments with, and in the custody of, financial institutions with high credit ratings and to limit the amounts invested with any one institution, type of security and issuer. However, we are subject to general economic conditions, interest rate trends and volatility in the financial marketplace that can affect the income that we receive from our investments, the net realizable value of our investments (including our cash, cash equivalents and marketable securities) and our ability to sell them. In the U.S., for example, the yields on our portfolio securities are very low due to general economic conditions. Any one of these factors could reduce our investment income, or result in material charges, which in turn could impact our overall net income and earnings per share.
From time to time we make direct investments in privately held companies. The privately held companies in which we invest are considered inherently risky. The technologies and products these companies have under development are typically in the early stages and may never materialize, which could result in a loss of all or a substantial part of our initial investment in these companies. The evaluation of privately held companies is based on information that we request from these companies, which is not subject to the same disclosure regulations as U.S. publicly traded companies, and as such, the basis for these evaluations is subject to the timing and accuracy of the data received from these companies.
If we were to experience a loss on any of our investments that loss may cause us to record an other-than-temporary impairment charge. The effect of this charge could impact our overall net income and earnings per share. In any of these scenarios, our liquidity may be negatively impacted, which in turn may prohibit us from making investments in our business, taking advantage of opportunities and potentially meeting our financial obligations as they come due.
We are subject to legal proceedings and regulatory inquiries, and we may be named in additional legal proceedings or become involved in regulatory inquiries in the future, all of which are costly, distracting to our core business and could result in an unfavorable outcome, or a material adverse effect on our business, financial condition, results of operations, cash flows or the trading price for our securities.
We are involved in legal proceedings and receive inquiries from regulatory agencies. As the global economy has changed and our business has evolved, we have seen an increase in litigation activity and regulatory inquiries. Like many other high technology companies, the number and frequency of inquiries from U.S. and foreign regulatory agencies we have received regarding our business and our business practices, and the business practices of others in our industry, have increased in recent years. In the event that we are involved in significant disputes or are the subject of a formal action by a regulatory agency, we could be exposed to costly and time consuming legal proceedings that could result in any number of outcomes. Although outcomes of such actions vary, any claims or regulatory actions initiated by or against us, whether successful or not, could result in expensive costs of defense, costly damage awards, injunctive relief, increased costs of business, fines or orders to change certain business practices, significant dedication of management time, diversion of significant operational resources, or otherwise harm our business. In any of these cases, our financial results could be negatively impacted.
Although we believe we currently have adequate internal control over financial reporting, we are required to evaluate our internal control over financial reporting under Section 404 of the Sarbanes-Oxley Act of 2002 and any adverse results from such evaluation could result in a loss of investor confidence in our financial reports and have an adverse effect on our stock price.
2014 Form 10-K 24
Pursuant to Section 404, we are required to furnish a report by our management on our internal control over financial reporting. The report contains, among other matters, an assessment of the effectiveness of our internal control over financial reporting as of the end of our fiscal year, including a statement as to whether or not our internal control over financial reporting is effective. This assessment must include disclosure of any material weaknesses in our internal control over financial reporting identified by management.
Although we have determined that our internal control over financial reporting was effective as of
January 31, 2014
, as indicated in our Management Report on Internal Control over Financial Reporting, included in our Annual Report on Form 10-K for the fiscal year ended January 31, 2014, we must continue to monitor and assess our internal control over financial reporting. If our management identifies one or more material weaknesses in our internal control over financial reporting and such weakness remains uncorrected at fiscal year-end, we will be unable to assert such internal control is effective at fiscal year-end. If we are unable to assert that our internal control over financial reporting is effective at fiscal year-end (or if our independent registered public accounting firm is unable to express an opinion on the effectiveness of our internal controls or concludes that we have a material weakness in our internal controls), we could lose investor confidence in the accuracy and completeness of our financial reports, which would likely have an adverse effect on our business and stock price.
In preparing our financial statements we make certain assumptions, judgments and estimates that affect amounts reported in our consolidated financial statements, which, if not accurate, may significantly impact our financial results.
We make assumptions, judgments and estimates for a number of items, including the fair value of financial instruments, goodwill, long-lived assets and other intangible assets, the realizability of deferred tax assets and the fair value of stock awards. We also make assumptions, judgments and estimates in determining the accruals for employee related liabilities including commissions, bonuses, and sabbaticals; and in determining the accruals for uncertain tax positions, partner incentive programs, product returns reserves, allowances for doubtful accounts, asset retirement obligations and legal contingencies. These assumptions, judgments and estimates are drawn from historical experience and various other factors that we believe are reasonable under the circumstances as of the date of the consolidated financial statements. Actual results could differ materially from our estimates, and such differences could significantly impact our financial results.
Changes in existing financial accounting standards or practices, or taxation rules or practices may adversely affect our results of operations.
Changes in existing accounting or taxation rules or practices, new accounting pronouncements or taxation rules, or varying interpretations of current accounting pronouncements or taxation practice could have a significant adverse effect on our results of operations or the manner in which we conduct our business. Further, such changes could potentially affect our reporting of transactions completed before such changes are effective.
For example, the U.S.-based Financial Accounting Standards Board (“FASB”) is currently working together with the International Accounting Standards Board (“IASB”) on several projects to further align accounting principles and facilitate more comparable financial reporting between companies who are required to follow U.S. Generally Accepted Accounting Principles (“GAAP”) under SEC regulations and those who are required to follow IFRS outside of the U.S. These efforts by the FASB and IASB may result in different accounting principles under GAAP that may result in materially different financial results for us in areas including, but not limited to principles for recognizing revenue and lease accounting.
It is not clear if or when these potential changes in accounting principles may become effective, whether we have the proper systems and controls in place to accommodate such changes and the impact that any such changes may have on our consolidated financial position, results of operations and cash flows. In addition, as we evolve and change our business and sales models, we are currently unable to determine how these potential changes may impact our new models, particularly in the area of revenue recognition.
Changes in laws and/or regulations related to the Internet or related to privacy and data security concerns may impact our business or expose us to increased liability.
The future success of our business depends upon the continued use of the Internet as a primary medium for commerce, communication and business applications. Federal, state or foreign government bodies or agencies have in the past adopted, and may in the future adopt, laws or regulations affecting data privacy and the transmission of certain types of content using the Internet. For example, the State of California has adopted legislation requiring operators of commercial websites and mobile applications that collect personal information from California residents to conspicuously post and comply with privacy policies that satisfy certain requirements. Several other U.S. states have adopted legislation requiring companies to protect the security
2014 Form 10-K 25
of personal information that they collect from consumers over the Internet, and more states may adopt similar legislation in the future. Additionally, the Federal Trade Commission has used its authority under Section 5 of the Federal Trade Commission Act to bring actions against companies for failing to maintain adequate security for personal information collected from consumers over the Internet and for failing to comply with privacy-related representations made to Internet users. The U.S. Congress has at various times proposed federal legislation intended to protect the privacy of Internet users and the security of personal information collected from Internet users that would impose additional compliance burdens upon companies collecting personal information from Internet users, and the U.S. Congress may adopt such legislation in the future. The European Union also has adopted various directives regulating data privacy and security and the transmission of content using the Internet involving residents of the European Union, including those directives known as the Data Protection Directive, the E-Privacy Directive, and the Privacy and Electronic Communications Directive, and may adopt similar directives in the future. Several other countries, including Canada and several Latin American and Asian countries, have constitutional protections for, or have adopted legislation protecting, individuals' personal information. Additionally, some federal, state, or foreign governmental bodies have established laws which seek to censor the transmission of certain types of content over the Internet or require that individuals be provided with the ability to permanently delete all electronic personal information, such as the German Multimedia Law of 1997.
Given the variety of global privacy and data protection regimes, it is possible we may find ourselves subject to inconsistent obligations. For instance, the USA Patriot Act is considered by some to be in conflict with certain directives of the European Union. Situations such as these require that we make prospective determinations regarding compliance with conflicting regulations. Increased enforcement of existing laws and regulations, as well as any laws, regulations or changes that may be adopted or implemented in the future, could limit the growth of the use of public cloud applications or communications generally, result in a decline in the use of the Internet and the viability of Internet-based applications, and require implementation of additional technological safeguards.
Our financial results could be negatively impacted if our tax positions are overturned by tax authorities.
We are a U.S.-based multinational company subject to tax in multiple U.S. and foreign tax jurisdictions. Our effective tax rate is based on our expected geographic mix of earnings, statutory rates, intercompany transfer pricing, and enacted tax rules. Significant judgment is required in determining our effective tax rate and in evaluating our tax positions on a worldwide basis. We believe our tax positions, including intercompany transfer pricing policies, are consistent with the tax laws in the jurisdictions in which we conduct our business. It is possible that these positions may be overturned by jurisdictional tax authorities and may have a significant impact on our effective tax rate.
Our business could be adversely affected if we are unable to attract and retain key personnel.
Our success and ability to invest and grow depend largely on our ability to attract and retain highly skilled technical, professional, managerial, sales and marketing personnel. Historically, competition for these key personnel has been intense. The loss of services of any of our key personnel (including key personnel joining our company through acquisitions), the inability to retain and attract qualified personnel in the future, or delays in hiring required personnel, particularly engineering and sales personnel, could make it difficult to meet key objectives, such as timely and effective product introductions and financial goals.
We rely on third party technologies and if we are unable to use or integrate these technologies, our product and service development may be delayed and our financial results negatively impacted.
We rely on certain software that we license from third parties, including software that is integrated with internally developed software and used in our products to perform key functions. These third-party software licenses may not continue to be available on commercially reasonable terms, and the software may not be appropriately supported, maintained or enhanced by the licensors. The loss of licenses to, or inability to support, maintain and enhance any such software could result in increased costs, or in delays or reductions in product shipments until equivalent software can be developed, identified, licensed and integrated, which would likely harm our business.
Disruptions with licensing relationships and third party developers could adversely impact our business.
We license certain key technologies from third parties. Licenses may be restricted in the term or the use of such technology in ways that negatively affect our business. Similarly, we may not be able to obtain or renew license agreements for key technology on favorable terms, if at all, and any failure to do so could harm our business.
2014 Form 10-K 26
Our business strategy has historically depended in part on our relationships with third-party developers who provide products that expand the functionality of our design software. Some developers may elect to support other products or may experience disruption in product development and delivery cycles or financial pressure during periods of economic downturn. In particular markets, such disruptions have in the past, and would likely in the future, negatively impact these third-party developers and end users, which could harm our business.
Additionally, technology created by outsourced product development, whether outsourced to third parties or developed externally and transferred to us through business or technology acquisitions, have certain additional risks such as effective integration into existing products, adequate transfer of technology know-how and ownership and protection of transferred intellectual property.
As a result of our strategy of partnering with other companies for product development, our product delivery schedules could be adversely affected if we experience difficulties with our product development partners.
We partner with certain independent firms and contractors to perform some of our product development activities. We believe our partnering strategy allows us to, among other things, achieve efficiencies in developing new products and maintaining and enhancing existing product offerings. Our partnering strategy creates a dependency on such independent developers. Independent developers, including those who currently develop products for us in the U.S. and throughout the world, may not be able or willing to provide development support to us in the future. In addition, use of development resources through consulting relationships, particularly in non-U.S. jurisdictions with developing legal systems, may be adversely impacted by, and expose us to risks relating to, evolving employment, export and intellectual property laws. These risks could, among other things, expose our intellectual property to misappropriation and result in disruptions to product delivery schedules.
We regularly invest resources to update and improve our internal information technology systems. Should our investments not succeed, or if delays or other issues with new or existing internal technology systems disrupt our operations, our business could be harmed.
We rely on our network and data center infrastructure, internal technology systems and our websites for our development, marketing, operational, support, sales, accounting and financial reporting activities. We are continually investing resources to update and improve these systems and environments in order to meet the growing requirements of our business and customers. Such improvements are often complex, costly and time consuming. In addition, such improvements can be challenging to integrate with our existing technology systems, or uncover problems with our existing technology systems. Unsuccessful implementation of hardware or software updates and improvements could result in disruption in our business operations, loss of revenue, errors in our accounting and financial reporting or damage to our reputation.
Our business may be significantly disrupted upon the occurrence of a catastrophic event.
Our business is highly automated and relies extensively on the availability of our network and data center infrastructure, our internal technology systems and our websites. We also rely on hosted computer services from third parties for services that we provide to our customers and computer operations for our internal use. The failure of our systems or hosted computer services due to a catastrophic event, such as an earthquake, fire, flood, tsunami, weather event, telecommunications failure, power failure, cyber attack or war, could adversely impact our business, financial results and financial condition. We have developed disaster recovery plans and maintain backup systems in order to reduce the potential impact of a catastrophic event, however there can be no assurance that these plans and systems would enable us to return to normal business operations. In addition, any such event could negatively impact a country or region in which we sell our products. This could in turn decrease that country's or region's demand for our products, thereby negatively impacting our financial results.
We issued $
750.0 million
aggregate principal amount of senior unsecured notes in a debt offering in December 2012 and have an existing $
400.0 million
revolving credit facility, and may incur other debt in the future, which may adversely affect our financial condition and future financial results.
In December 2012, we issued
1.95%
notes due
December 15, 2017
in an aggregate principal amount of $
400.0 million
and
3.6%
notes due
December 15, 2022
in an aggregate principal amount of $
350.0 million
. As the December 2017 and December 2022 debt matures, we will have to expend significant resources to either repay or refinance these notes. If we decide to refinance the notes, we may be required to do so on different or less favorable terms or we may be unable to refinance the notes at all, both of which may adversely affect our financial condition.
2014 Form 10-K 27
We also have a $
400.0 million
revolving credit facility. As of
January 31, 2014
, we had
no
outstanding borrowings on the line of credit. Although we have no current plans to borrow under this credit facility, we may use the proceeds of any future borrowing for general corporate purposes, or for future acquisitions or expansion of our business. Our existing and future levels of indebtedness may adversely affect our financial condition and future financial results by, among other things:
|
•
|
increasing our vulnerability to adverse changes in general economic, industry and competitive conditions;
|
|
•
|
requiring the dedication of a greater than expected portion of our expected cash from operations to service our indebtedness, thereby reducing the amount of expected cash flow available for other purposes, including capital expenditures and acquisitions; and
|
|
•
|
limiting our flexibility in planning for, or reacting to, changes in our business and our industry.
|
We are required to comply with the covenants set forth in our senior unsecured notes and revolving credit facility. Our ability to comply with these covenants may be affected by events beyond our control. If we breach any of the covenants and do not obtain a waiver from the noteholders or lenders, then, subject to applicable cure periods, any outstanding indebtedness may be declared immediately due and payable. In addition, changes by any rating agency to our credit rating may negatively impact the value and liquidity of our securities. Under certain circumstances, if our credit ratings are downgraded or other negative action is taken, the interest rate payable by us under our revolving credit facility could increase. Downgrades in our credit ratings could also restrict our ability to obtain additional financing in the future and could affect the terms of any such financing.
|
ITEM 1B.
|
UNRESOLVED STAFF COMMENTS
|
None
|
ITEM 2.
|
PROPERTIES
|
We lease
1,757,000
square feet of office space in
116
locations in the United States and internationally through our foreign subsidiaries. In addition, we own
25,000
square feet of office space in
two
locations internationally through our foreign subsidiaries. Our executive offices and corporate headquarters are located in leased office space in San Rafael, California. Our San Rafael facilities consist of
220,000
square feet under leases that have expiration dates ranging from
December 2017 to December 2019
. We and our foreign subsidiaries lease additional space in various locations throughout the world for local sales, product development and technical support personnel.
All facilities are in good condition. Our facilities, excluding those in restructuring, are operating at capacities averaging
83%
occupancy worldwide as of
January 31, 2014
. We believe that our existing facilities and offices are adequate to meet our requirements for the foreseeable future. See Note
8
, “
Commitments and Contingencies
,” in the Notes to Consolidated Financial Statements for more information about our lease commitments.
|
ITEM 3.
|
LEGAL PROCEEDINGS
|
We are involved in a variety of claims, suits, investigations and proceedings in the normal course of business activities including claims of alleged infringement of intellectual property rights, commercial, employment, piracy prosecution, business practices and other matters. In our opinion, resolution of pending matters is not expected to have a material adverse impact on our consolidated results of operations, cash flows or financial position. Given the unpredictable nature of legal proceedings, there is a reasonable possibility that an unfavorable resolution of one or more such proceedings could in the future materially affect our results of operations, cash flows or financial position in a particular period, however, based on the information known by us as of the date of this filing and the rules and regulations applicable to the preparation of our financial statements, any such amount is either immaterial or it is not possible to provide an estimated amount of any such potential loss.
|
ITEM 4.
|
MINE SAFETY DISCLOSURES
|
Not applicable.
2014 Form 10-K 28
PART II
|
ITEM 5.
|
MARKET FOR REGISTRANT’S COMMON EQUITY, RELATED STOCKHOLDER MATTERS AND ISSUER PURCHASES OF EQUITY SECURITIES
|
Our common stock is traded on the NASDAQ Global Select Market under the symbol ADSK. The following table lists the high and low sales prices for each quarter in the last two fiscal years.
|
High
|
Low
|
||||||
|
Fiscal 2014
|
|||||||
|
First Quarter
|
$
|
41.42
|
|
$
|
35.51
|
|
|
|
Second Quarter
|
40.27
|
|
33.01
|
|
|||
|
Third Quarter
|
42.82
|
|
34.16
|
|
|||
|
Fourth Quarter
|
54.18
|
|
40.09
|
|
|||
|
Fiscal 2013
|
|||||||
|
First Quarter
|
$
|
42.69
|
|
$
|
35.55
|
|
|
|
Second Quarter
|
41.28
|
|
28.52
|
|
|||
|
Third Quarter
|
36.21
|
|
27.70
|
|
|||
|
Fourth Quarter
|
40.00
|
|
30.22
|
|
|||
Dividends
We did not declare any cash or stock dividends in either fiscal
2014
or fiscal
2013
. We anticipate that, for the foreseeable future, we will not pay any cash or stock dividends.
Stockholders
As of
January 31, 2014
, the number of common stockholders of record was
492
. Because many of our shares of common stock are held by brokers or other institutions on behalf of stockholders, we are unable to estimate the total number of stockholders represented by the record holders.
Issuer Purchases of Equity Securities
Autodesk's stock repurchase program is largely to help offset the dilution from the issuance of stock under our employee stock plans and for such other purposes as may be in the interests of Autodesk and its stockholders, and has the effect of returning excess cash generated from our business to stockholders. The number of shares acquired and the timing of the purchases are based on several factors, including general market conditions, the volume of employee stock option exercises, stock issuance, the trading price of our common stock, cash on hand and available in the U.S., and company defined trading windows. In June 2012, the Board of Directors approved the current stock repurchase plan, which authorized the repurchase of
30.0 million
shares; as of
January 31, 2014
,
8.2 million
shares have been repurchased under this plan. This plan does not have a fixed expiration date. During the three and twelve months ended
January 31, 2014
, we repurchased
2.2 million
and
10.5 million
shares of our common stock, respectively. At
January 31, 2014
,
21.8 million
shares remained available for repurchase under the existing repurchase authorization. See Note
9
, “
Stockholders' Equity
,” in the Notes to Consolidated Financial Statements for further discussion.
2014 Form 10-K 29
The following table provides information about the repurchase of our common stock under the stock repurchase programs in open-market transactions during the quarter ended
January 31, 2014
:
|
(Shares in millions)
|
Total Number
of Shares
Purchased
|
Average
Price Paid
per Share
|
Total Number of Shares Purchased as Part of Publicly Announced Plans or Programs(1)
|
Maximum Number of Shares that May Yet Be Purchased Under the Plans or Programs(2)
|
||||||||
|
November 1- November 30
|
0.1
|
|
$
|
45.41
|
|
0.1
|
|
23.9
|
|
|||
|
December 1 - December 31
|
1.9
|
|
47.18
|
|
1.9
|
|
22.0
|
|
||||
|
January 1 - January 31
|
0.2
|
|
49.21
|
|
0.2
|
|
21.8
|
|
||||
|
Total
|
2.2
|
|
$
|
47.29
|
|
2.2
|
|
|||||
____________________
|
(1)
|
Represents shares purchased in open-market transactions under the stock repurchase program approved by the Board of Directors.
|
|
(2)
|
These amounts correspond to the plan approved by the Board of Directors in June 2012 that authorizes the repurchase of
30.0 million
shares. The plan does not have a fixed expiration date.
|
Sales of Unregistered Securities
There were no sales of unregistered securities during the three months ended
January 31, 2014
.
2014 Form 10-K 30
Company Stock Performance
The following graph shows a five-year comparison of cumulative total return (equal to dividends plus stock appreciation) for our Common Stock, the Standard & Poor’s 500 Stock Index and the Dow Jones U.S. Software Index. The following graph and related information will not be deemed to be “soliciting material” or to be “filed” with the SEC, nor will such information be incorporated by reference into any filing pursuant to the Securities Act of 1933 or the Securities Exchange Act of 1934, except to the extent that we specifically incorporate it by reference into such filing.
Comparison of Five Year Cumulative Total Stockholder Return(1)
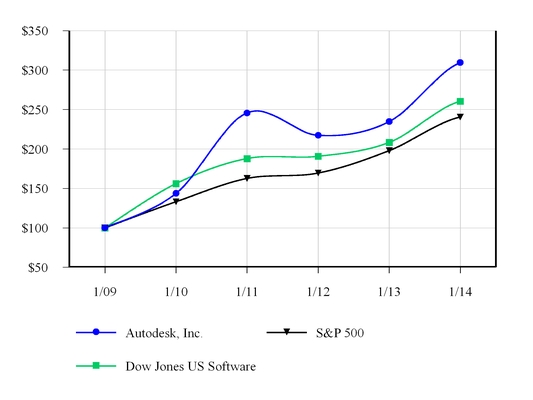
___________________
|
(1)
|
Assumes $100 invested on January 31, 2009, in Autodesk’s stock, the Standard & Poor’s 500 Stock Index, and the Dow Jones U.S. Software Index, with reinvestment of all dividends. Total stockholder returns for prior periods are not an indication of future investment returns.
|
2014 Form 10-K 31
|
ITEM 6.
|
SELECTED FINANCIAL DATA
|
The following selected consolidated financial data is not necessarily indicative of results of future operations, and should be read in conjunction with
Item 7
, “
Management's Discussion and Analysis of Financial Condition and Results of Operations
,” and the consolidated financial statements and related notes thereto included in
Item 8
of this Form 10-K to fully understand factors that may affect the comparability of the information presented below. The financial data for the years ended
January 31, 2014
and
2013
are derived from, and are qualified by reference to, the audited consolidated financial statements that are included in this Form 10-K. The Consolidated Statement of Operations and the Consolidated Statement of Cash Flows for the year ended
January 31,
2012
are derived from, and are qualified by reference to, the audited consolidated financial statements that are included in this Form 10-K. The Consolidated Balance Sheet for the year ended
January 31,
2012
is derived from, and are qualified by reference to, the audited consolidated financial statements that are not included in this Form 10-K. The financial data for the years ended January 31,
2011
and
2010
are derived from audited, consolidated financial statements which are not included in this Form 10-K.
|
|
Fiscal year ended January 31,
|
||||||||||||||||||
|
|
2014
|
2013
|
2012
|
2011
|
2010
|
||||||||||||||
|
|
(In millions, except per share data)
|
||||||||||||||||||
|
For the Fiscal Year:
|
|||||||||||||||||||
|
Net revenue
|
$
|
2,273.9
|
|
$
|
2,312.2
|
|
$
|
2,215.6
|
|
$
|
1,951.8
|
|
$
|
1,713.7
|
|
||||
|
Income from operations
|
284.8
|
|
305.9
|
|
355.6
|
|
271.4
|
|
65.6
|
|
|||||||||
|
Net income
|
228.8
|
|
247.4
|
|
285.3
|
|
212.0
|
|
58.0
|
|
|||||||||
|
Cash flow from operations
|
563.5
|
|
559.1
|
|
573.5
|
|
540.8
|
|
246.8
|
|
|||||||||
|
Common Stock Data:
|
|||||||||||||||||||
|
Basic net income per share
|
$
|
1.02
|
|
$
|
1.09
|
|
$
|
1.25
|
|
$
|
0.93
|
|
$
|
0.25
|
|
||||
|
Diluted net income per share
|
1.00
|
|
1.07
|
|
1.22
|
|
0.90
|
|
0.25
|
|
|||||||||
|
Dividends paid per share
|
—
|
|
—
|
|
—
|
|
—
|
|
—
|
|
|||||||||
|
At Year End:
|
|||||||||||||||||||
|
Total assets
|
$
|
4,595.0
|
|
$
|
4,308.4
|
|
$
|
3,227.8
|
|
$
|
2,787.6
|
|
$
|
2,447.2
|
|
||||
|
Long-term liabilities
|
1,262.0
|
|
1,221.5
|
|
390.8
|
|
308.5
|
|
269.7
|
|
|||||||||
|
Stockholders’ equity
|
2,261.5
|
|
2,043.2
|
|
1,882.9
|
|
1,609.3
|
|
1,473.5
|
|
|||||||||
2014 Form 10-K 32
|
ITEM 7.
|
MANAGEMENT’S DISCUSSION AND ANALYSIS OF FINANCIAL CONDITION AND RESULTS OF OPERATIONS
|
The discussion in our MD&A and elsewhere in this Form 10-K contains trend analyses and other forward-looking statements within the meaning of Section 27A of the Securities Act of 1933 and Section 21E of the Securities Exchange Act of 1934. Forward-looking statements are any statements that look to future events and consist of, among other things, our business strategies, including those discussed in “Strategy” and "Business Outlook" below; anticipated future net revenue; future GAAP and non-GAAP earnings per share; future operating margin and other future financial results (by product type and geography) and operating expenses; the effectiveness of our efforts to successfully manage transitions to new business models and markets; the effectiveness of efforts to reduce our operating expenses; expected market trends, including the growth of cloud, mobile and social computing; the effect of unemployment and availability of credit; the effects of the U.S. credit downgrade and weak global economic conditions; the effects of revenue recognition; our backlog; expected trends in certain financial metrics; the impact of acquisitions and investment activities; the effect of fluctuations in exchange rates and our hedging activities on our financial results; our abilities to successfully expand adoption of our products; our ability to gain market acceptance of new businesses and sales initiatives; our ability to successfully increase sales of product suites as part of our overall sales strategy; the impact of economic volatility and geopolitical activities in certain countries, particularly emerging economy countries, and the resulting effect on our financial results; and the impact of our restructuring activities. In addition, forward-looking statements also consist of statements involving expectations regarding product acceptance, continuation of our stock repurchase program, statements regarding our liquidity and short-term and long-term cash requirements, as well as statements involving trend analyses and statements including such words as “may,” “believe,” “could,” “anticipate,” “would,” “might,” “plan,” “expect,” and similar expressions or the negative of these terms or other comparable terminology. These forward-looking statements speak only as of the date of this Annual Report on Form 10-K and are subject to business and economic risks. As such, our actual results could differ materially from those set forth in the forward-looking statements as a result of the factors set forth above in
Item 1A
, “
Risk Factors
,” and in our other reports filed with the U.S. Securities and Exchange Commission. We assume no obligation to update the forward-looking statements to reflect events that occur or circumstances that exist after the date on which they were made, except as required by law..
Strategy
Autodesk’s vision is to help people imagine, design and create a better world. We do this by developing software and services for the world’s designers, architects, engineers, and digital artists, professionals and non-professionals alike—the people who create the world's products, buildings, infrastructure, films, and games. Autodesk serves professional customers in three primary markets: architecture, engineering and construction; manufacturing; and digital media and entertainment.
Our goal is to provide our customers with the world’s most innovative, and engaging design software and services. Our product and services portfolio allows our customers to digitally visualize, simulate, and analyze their projects, helping them to better understand the consequences of their design decisions; save time, money, and resources; and become more innovative.
Autodesk was founded during the platform transition from mainframes and engineering workstations to personal computers. We developed and sustained a compelling value proposition based upon desktop software for the personal computer. Just as the transition from mainframes to personal computers transformed the industry thirty years ago, we believe our industry is undergoing a similar transition from the personal computer to cloud, social, and mobile computing. To address this transition we have accelerated our move to the cloud and are offering more flexible licenses.
Our strategy is to lead our customers and the industries they serve to the new cloud and mobile platforms. This entails both a technological shift and a business model shift. During the early part of fiscal 2014, we announced more flexible term-based license offerings for certain products. These offerings are designed to give our customers even more flexibility with how they use our products and service offerings and address new types of customers such as project-based users and small businesses. Over the next four years, we expect to significantly increase our subscription base and the annual value of our subscriptions, which we believe will help drive billings growth. During this transition, revenue, deferred revenue, operating margin and EPS will be impacted as more revenue is recognized ratably rather than up front and as new offerings bring a wider variety of price points.
Our strategy is predicated upon our major business initiatives to grow, transform and expand our business:
|
•
|
Grow. We believe opportunity remains in our desktop software business, and we intend to continue to grow this business. In particular we are offering product suites with improved interoperability and usability to enhance our customers' productivity and effectiveness. We are continuing to develop new ways to deliver capability and value to
|
2014 Form 10-K 33
our customers, including flexible license and service offerings, product suites and cloud and social-based services, to better match the business needs of our customers. We will continue to emphasize developing relationships with large, global customers and pursuing opportunities in emerging economies.
|
•
|
Transform. At the same time we grow our desktop software business, we are migrating many of our products to the cloud. This entails development of new cloud computing infrastructure and redesigning our applications to leverage the cloud. We are also developing new capabilities that are enabled by the cloud such as collaborative Product Lifecycle Management (“PLM”), Building Information Modeling (“BIM”) and online simulation. Our goal is to lead our industry in transitioning to the cloud, and use cloud services to provide more value to new and existing subscriptions.
|
|
•
|
Expand. We believe that the combination of cloud, social and mobile computing affords us the opportunity to expand our business into new markets and extend the value of our customers' digital design information into visualization, analysis and simulation. We have added new customers through our products and services that are delivered and experienced through the web, cloud and mobile devices providing our advanced visualization technologies to consumers - a whole new category of Autodesk customer. We intend to continue to develop our business to both add new customers and find new capabilities to incorporate in our core business.
|
We believe suites present a meaningful growth opportunity and is an important part of our overall strategy. As our customers in all industries adopt our design suites, we believe they will experience an increase in their productivity and the value of their design data. For fiscal
2014
, revenue from suites
increased
15%
, as compared to the prior fiscal year. As a percentage of revenue, suites
increased
to
34%
in fiscal
2014
as compared to
29%
in fiscal
2013
.
Expanding our geographic coverage is another key element of our growth strategy. Much of the growth in the world’s construction and manufacturing is happening in emerging economies. Further, emerging economies face many of the challenges that our design technology can help address, including infrastructure build-out and innovative design and manufacturing. Although revenue from emerging countries remained flat during fiscal
2014
as compared to fiscal
2013
, we believe that emerging economies continue to present long-term growth opportunities for us. Revenue from emerging countries represented
15%
and
14%
of fiscal
2014
and fiscal
2013
net revenue, respectively. While we believe there are long-term growth opportunities in emerging economies, conducting business in these countries presents significant challenges, including economic volatility, geopolitical risk, local competition, intellectual property protection, poorly developed business infrastructure, scarcity of talent, software piracy and different purchase patterns as compared to the developed world.
Today, complex challenges such as globalization, urbanization, and sustainable design are driving our customers to new levels of performance and competitiveness, and we are committed to helping them address those challenges and take advantage of new opportunities. To achieve these goals, we are capitalizing on two of our strongest competitive advantages: our ability to bring advanced technology to mainstream markets, and the breadth and depth of our product portfolio.
By innovating within existing technology categories, we bring powerful new design capabilities to volume markets. Our products are designed to be easy-to-learn and use, and to provide customers with a low cost of deployment, a low total cost of access to our software offerings, and a rapid return on investment. In addition, our software architecture allows for extensibility and integration with other products. The breadth of our technology and product line gives us a unique competitive advantage, because it allows our customers to address a wide variety of problems in ways that transcend industry and disciplinary boundaries. This is particularly important in helping our customers address the complex challenges mentioned above. We also believe that our technological leadership and global brand recognition have positioned us well for long-term growth and industry leadership.
In addition to the competitive advantages afforded by our technology, our large global network of distributors, resellers, third-party developers, customers, educational institutions, faculty and students is a key competitive advantage. This network of relationships provides us with a broad and deep reach into volume markets around the world. Our distributor and reseller network is extensive and provides our customers with the resources to purchase, deploy, learn, and support our products quickly and easily. We have a significant number of registered third-party developers who create products that work well with our products and extend them for a variety of specialized applications.
We are committed to helping fuel a lifelong passion for design in students of all ages, and inspiring and supporting educators. As such, we offer extensive educational programs supporting our software and services including a new program, initiated in fiscal 2014, under which we grant software licenses to educational institutions in select regions and to key partners for little or no fees. Through these programs we intend to further Science, Technology, Engineering, Digital Arts, and Math
2014 Form 10-K 34
(STEAM) education initiatives. With an extensive global community of students who are experienced with our software and poised to become the next generation of professional users, our goal is to reduce the cost of training and education of new talent for our customers.
Our strategy includes improving our product functionality and expanding our product offerings through internal development as well as through the acquisition of products, technology and businesses. Acquisitions often increase the speed at which we can deliver product functionality to our customers; however, they entail cost and integration challenges and may, in certain instances, negatively impact our operating margins. We continually review these trade-offs in making decisions regarding acquisitions. We currently anticipate that we will continue to acquire products, technology and businesses as compelling opportunities become available.
Our strategy depends upon a number of assumptions, including that we will be able to continue making our technology available to mainstream markets; leverage our large global network of distributors, resellers, third-party developers, customers, educational institutions, and students; improve the performance and functionality of our products; and adequately protect our intellectual property. If the outcome of any of these assumptions differs from our expectations, we may not be able to implement our strategy, which could potentially adversely affect our business. For further discussion regarding these and related risks see
Part I
,
Item 1A
, “
Risk Factors
.”
Critical Accounting Policies and Estimates
Our Consolidated Financial Statements are prepared in conformity with U.S. generally accepted accounting principles. In preparing our Consolidated Financial Statements, we make assumptions, judgments and estimates that can have a significant impact on amounts reported in our Consolidated Financial Statements. We base our assumptions, judgments and estimates on historical experience and various other factors that we believe to be reasonable under the circumstances. Actual results could differ materially from these estimates under different assumptions or conditions. We regularly reevaluate our assumptions, judgments and estimates. Our significant accounting policies are described in Note 1, “Business and Summary of Significant Accounting Policies,” in the Notes to Consolidated Financial Statements. We believe that of all our significant accounting policies, the following policies involve a higher degree of judgment and complexity. Accordingly, these are the policies we believe are the most critical to aid in fully understanding and evaluating our financial condition and results of operations.
Revenue Recognition.
We recognize revenue when persuasive evidence of an arrangement exists, delivery has occurred or services have been rendered, the price is fixed or determinable and collection is probable. However, determining whether and when some of these criteria have been satisfied often involves assumptions and judgments that can have a significant impact on the timing and amount of revenue we report.
For multiple element arrangements containing only software and software-related elements, we allocate the sales price among each of the deliverables using the residual method, under which revenue is allocated to undelivered elements based on our vendor-specific objective evidence (“VSOE”) of fair value. VSOE is the price charged when an element is sold separately or a price set by management with the relevant authority. If we do not have VSOE of an undelivered software license, we defer revenue recognition on the entire sales arrangement until all elements for which we do not have VSOE are delivered. If we do not have VSOE for undelivered maintenance or services, the revenue for the arrangement is recognized over the longest contractual service period in the arrangement. We are required to exercise judgment in determining whether VSOE exists for each undelivered element based on whether our pricing for these elements is sufficiently consistent.
For multiple elements arrangements involving non-software elements, including cloud subscription services, our revenue recognition policy is based upon the accounting guidance contained in ASC 605,
Revenue Recognition
. For these arrangements, we first allocate the total arrangement consideration based on the relative selling prices of the software group of elements as a whole and to the non-software elements. We then further allocate consideration within the software group to the respective elements within that group using the residual method as described above. We exercise judgment and use estimates in connection with the determination of the amount of revenue to be recognized in each accounting period.
Our assessment of likelihood of collection is also a critical factor in determining the timing of revenue recognition. If we do not believe that collection is probable, the revenue will be deferred until the earlier of when collection is deemed probable or payment is received.
Our indirect channel model includes both a two-tiered distribution structure, where distributors sell to resellers, and a one-tiered structure where Autodesk sells directly to resellers. Our product license revenue from distributors and resellers are generally recognized at the time title to our product passes to the distributor, in a two-tiered structure, or reseller, in a one-tiered
2014 Form 10-K 35
structure, provided all other criteria for revenue recognition are met. This policy is predicated on our ability to estimate sales returns, among other criteria. We are also required to evaluate whether our distributors and resellers have the ability to honor their commitment to make fixed or determinable payments, regardless of whether they collect payment from their customers. Our policy also presumes that we have no significant performance obligations in connection with the sale of our product licenses by our distributors and resellers to their customers. If we were to change any of these assumptions or judgments, it could cause a material increase or decrease in the amount of revenue that we report in a particular period.
As part of the indirect channel model, Autodesk has a partner incentive program that uses quarterly attainment monetary rewards to motivate distributors and resellers to achieve mutually agreed upon business goals in a specified time period. A portion of these incentives reduce license and other revenue in the current period. The remainder, which relates to incentives on our Subscription Program, is recorded as a reduction to deferred revenue in the period the maintenance transaction is billed and subsequently recognized as a reduction to maintenance revenue over the contract period. These incentive balances do not require significant assumptions or judgments. The reserves associated with the partner incentive program are treated on the balance sheet as either contra account receivable (when due to distributors and direct resellers) or accounts payable (when due to indirect resellers).
Marketable Securities.
As described in Note
2
, “
Financial Instruments
,” in the Notes to the Consolidated Financial Statements, our investments in marketable securities are measured at the end of each reporting period and reported at fair value. Fair value is defined as the price that would be received from the sale of an asset or paid to transfer a liability in the principal or most advantageous market for the asset or liability in an orderly transaction between market participants on the measurement date. In determining the fair value of our investments we are sometimes required to use various alternative valuation techniques. Inputs to valuation techniques are either observable or unobservable. Observable inputs reflect market data obtained from independent sources, while unobservable inputs reflect our market assumptions. These two types of inputs have created the following fair value hierarchy:
|
•
|
Level 1
- Quoted prices for identical instruments in active markets;
|
|
•
|
Level 2
- Quoted prices for similar instruments in active markets, quoted prices for identical or similar instruments in markets that are not active, and model-derived valuations in which all significant inputs and significant value drivers are observable in active markets; and
|
|
•
|
Level 3
- Valuations derived from valuation techniques in which one or more significant inputs or significant value drivers are unobservable.
|
This hierarchy requires us to minimize the use of unobservable inputs and to use observable market data, if available, when determining fair value. This is generally true for our cash and cash equivalents and the majority of our marketable securities, which we consider to be Level 1 assets and Level 2 assets. However, determining the fair value of marketable securities when observable inputs are not available (Level 3) requires significant judgment. For example, we use probability weighted discounted cash flow models, in which some of the inputs are unobservable in the market, to estimate the fair value of our convertible debt securities. These assumptions are inherently subjective and involve significant management judgment. Whenever possible, we use observable market data and rely on unobservable inputs only when observable market data is not available, when determining fair value.
All of Autodesk’s marketable securities are subject to a periodic impairment review. We recognize an impairment charge when a decline in the fair value of its investments below the cost basis is judged to be other-than-temporary. Autodesk considers various factors in determining whether to recognize an impairment charge, including the length of time and extent to which the fair value has been less than Autodesk’s cost basis, the financial condition and near-term prospects of the investee, and Autodesk’s intent and ability to hold the investment for a period of time sufficient to allow for any anticipated recovery in the market value.
Business Combinations.
We allocate the purchase price of acquired companies to the assets and liabilities acquired, as well as to in-process research and development based on their estimated fair values at the acquisition date. Any residual purchase price is recorded as goodwill. The allocation of the purchase price allocation requires us to make significant estimates and assumptions, especially at the acquisition date with respect to intangible assets and deferred revenue obligations.
Although we believe the assumptions and estimates we have made are reasonable, they are based in part on historical experience and information obtained from the management of the acquired companies and are inherently uncertain. Examples
2014 Form 10-K 36
of critical estimates used in valuing certain of the intangible assets we have acquired or may acquire in the future include but are not limited to:
|
•
|
future expected cash flows from sales, maintenance agreements and acquired developed technologies;
|
|
•
|
the acquired company’s trade name and customer relationships as well as assumptions about the period of time the acquired trade name and customer relationships will continue to be used in the combined company’s product portfolio;
|
|
•
|
expected costs to develop the in-process research and development into commercially viable products and estimated cash flows from the projects when completed; and
|
|
•
|
discount rates used to determine the present value of estimated future cash flows.
|
These estimates are inherently uncertain and unpredictable, and if different estimates were used the purchase price for the acquisition could be allocated to the acquired assets and liabilities differently from the allocation that we have made. In addition, unanticipated events and circumstances may occur which may affect the accuracy or validity of such estimates, and if such events occur we may be required to record a charge against the value ascribed to an acquired asset or an increase in the amounts recorded for assumed liabilities.
Goodwill.
When we acquire a business, a portion of the purchase consideration is typically allocated to acquired technology and other identifiable intangible assets, such as customer relationships and developed technology. The excess of the purchase consideration over the net of the acquisition-date fair value of identifiable assets acquired and liabilities assumed is recorded as goodwill. The amounts allocated to acquired technology and other intangible assets represent our estimates of their fair values at the acquisition date. We amortize the acquired technology and other intangible assets with finite lives over their estimated useful lives. The estimation of acquisition-date fair values of intangible assets and their useful lives requires us to make assumptions and judgments, including but not limited to an evaluation of macroeconomic conditions as they relate to our business, industry and market trends, projections of future cash flows and appropriate discount rates.
We test goodwill for impairment annually in our fourth fiscal quarter or sooner should events or changes in circumstances indicate potential impairment as required under Accounting Standard Update No. 2011-08, "Testing Goodwill for Impairment” (“ASU 2011-08”). ASU 2011-08 provides for an optional assessment of qualitative factors of impairment (“optional assessment”) prior to necessitating a two-step quantitative impairment test. Should the optional assessment be utilized for any given fiscal year, qualitative factors to consider include cost factors; financial performance; legal, regulatory, contractual, political, business, or other factors; entity specific factors; industry and market considerations, macroeconomic conditions, and other relevant events and factors affecting the reporting unit. If, after assessing the totality of events or circumstances, it is more likely than not that the fair value of the reporting unit is greater than its carrying value, then performing the two-step impairment test is unnecessary.
Under the two-step quantitative impairment test, we use discounted cash flow models which include assumptions regarding projected cash flows. Variances in these assumptions could have a significant impact on our conclusion as to whether goodwill is impaired, or the amount of any impairment charge. Impairment charges, if any, result from instances where the fair values of net assets associated with goodwill are less than their carrying values. As changes in business conditions and our assumptions occur, we may be required to record impairment charges.
For our annual impairment assessment in fiscal
2014
, we did not utilize the optional assessment. Rather, we used the quantitative two-step impairment test for each of our Platform Solutions and Emerging Business (“PSEB”), Manufacturing ("MFG"), Architecture, Engineering and Construction ("AEC"), and Media and Entertainment (“M&E”) reporting units and used a discounted cash flow model which included assumptions regarding projected cash flows. Based on this testing, we determined that the fair value was substantially in excess of the carrying value for each of the four reporting units and that there was no impairment of goodwill during the year ended
January 31, 2014
.
Realizability of Long-Lived Assets.
We assess the realizability of our long-lived assets and related intangible assets, other than goodwill, annually during the fourth fiscal quarter, or sooner should events or changes in circumstances indicate the carrying values of such assets may not be recoverable. We consider the following factors important in determining when to perform an impairment review: significant under-performance of a business or product line relative to budget; shifts in business strategies which affect the continued uses of the assets; significant negative industry or economic trends; and the results of past impairment reviews. When such events or changes in circumstances occur, we assess recoverability of these assets.
2014 Form 10-K 37
We assess
recoverability of these assets by comparing the carrying amounts to the future undiscounted cash flows the assets are expected to generate. If impairment indicators were present based on our undiscounted cash flow models, which include assumptions regarding projected cash flows, we would perform a discounted cash flow analysis to assess impairments on long-lived assets. Variances in these assumptions could have a significant impact on our conclusion as to whether an asset is impaired or the amount of any impairment charge. Impairment charges, if any, result in situations where any fair values of these assets are less than their carrying values.
In addition to our recoverability assessments, we routinely review the remaining estimated useful lives of our long-lived assets. Any reduction in the useful life assumption will result in increased depreciation and amortization expense in the quarter when such determinations are made, as well as in subsequent quarters.
We will continue to evaluate the values of our long-lived assets in accordance with applicable accounting rules. As changes in business conditions and our assumptions occur, we may be required to record impairment charges.
Income Taxes.
We currently have $
187.9 million
of net deferred tax assets, primarily a result of tax credits, net operating losses, and timing differences for reserves, accrued liabilities, stock options, deferred revenue, purchased technologies and capitalized intangibles, partially offset by the establishment of U.S. deferred tax liabilities on unremitted earnings from certain foreign subsidiaries, deferred tax liabilities associated with tax method changes on advanced payments and valuation allowances against U.S. and Canadian deferred tax assets. We perform a quarterly assessment of the recoverability of these net deferred tax assets and believe that we will generate sufficient future taxable income in appropriate tax jurisdictions to realize the net deferred tax assets. Our judgments regarding future profitability may change due to future market conditions and other factors, including intercompany transfer pricing adjustments. Any change in future profitability may require material adjustments to these net deferred tax assets, resulting in a reduction in net income in the period when such determination is made. We believe our tax positions, including intercompany transfer pricing policies, are consistent with the tax laws in the jurisdictions in which we conduct our business. It is possible that these positions may be challenged by jurisdictional tax authorities and may have a significant impact on our effective tax rate.
Stock-Based Compensation
. We measure stock-based compensation cost at the grant date fair value of the award, and recognize expense on a straight-line basis over the requisite service period, which is generally the vesting period. We estimate the fair value of certain stock-based payment awards (including grants of stock options and employee stock purchases related to the employee stock purchase plan) using either the Black-Scholes-Merton option-pricing model or a binomial-lattice model (e.g., Monte Carlo simulation model). To determine the grant-date fair value of our stock-based payment awards, we use a Black-Scholes model or the quoted stock price on the date of grant, unless the awards are subject to market conditions, in which case we use the Monte Carlo simulation model. The Monte Carlo simulation model utilizes multiple input variables to estimate the probability that market conditions will be achieved. These variables include our expected stock price volatility over the expected term of the award, actual and projected employee stock option exercise behaviors, the risk-free interest rate for the expected term of the award and expected dividends. The variables used in these models are reviewed on a quarterly basis and adjusted, as needed. Share-based compensation cost for restricted stock is measured on the closing fair market value of our common stock on the date of grant. The value of the portion of the award that is ultimately expected to vest is recognized as expense in our Consolidated Statements of Operations.
Legal Contingencies
. As described in
Part I
,
Item 3
, “
Legal Proceedings
” and
Part II
,
Item 8
, Note
8
, “
Commitments and Contingencies
,” in the Notes to Consolidated Financial Statements, we are periodically involved in various legal claims and proceedings. We routinely review the status of each significant matter and assess our potential financial exposure. If the potential loss from any matter is considered probable and the amount can be reasonably estimated, we record a liability for the estimated loss. Because of inherent uncertainties related to these legal matters, we base our loss accruals on the best information available at the time. As additional information becomes available, we reassess our potential liability and may revise our estimates. Such revisions could have a material impact on future quarterly or annual results of operations.
Recently Issued Accounting Standards
See
Part II
,
Item 8
, Note
1
, “
Business and Summary of Significant Accounting Policies
,” in the Notes to Consolidated Financial Statements for a full description of recent accounting pronouncements, including the expected dates of adoption and estimated effects on results of operations and financial condition, which is incorporated herein by reference.
2014 Form 10-K 38
Overview of Fiscal
2014
|
Fiscal Year Ended
|
As a % of Net
Revenue
|
Fiscal Year Ended
|
As a % of Net
Revenue
|
||||||||||
|
January 31, 2014
|
January 31, 2013
|
||||||||||||
|
|
(in millions)
|
||||||||||||
|
Net Revenue
|
$
|
2,273.9
|
|
100
|
%
|
$
|
2,312.2
|
|
100
|
%
|
|||
|
Cost of revenue
|
274.3
|
|
12
|
%
|
238.5
|
|
10
|
%
|
|||||
|
Gross Profit
|
1,999.6
|
|
88
|
%
|
2,073.7
|
|
90
|
%
|
|||||
|
Operating expenses
|
1,714.8
|
|
75
|
%
|
1,767.8
|
|
76
|
%
|
|||||
|
Income from Operations
|
$
|
284.8
|
|
13
|
%
|
$
|
305.9
|
|
13
|
%
|
|||
During fiscal
2014
, as compared to the prior fiscal year, net revenue
decreased
2%
, gross profit
decreased
4%
, and income from operations
decreased
7%
. Contributing to the year over year impact to revenue during fiscal
2014
were decreases in license and other revenue partially offset by increases in subscription revenue.
During the latter part of fiscal year 2014, we announced a business model transition as we began offering more flexible license and service offerings that have ratable revenue streams. As a result, our net revenue for fiscal
2014
excluded approximately $30 million that was deferred as a result of the our transition. The $30 million related to flexible license arrangements with certain enterprise customers and had a particular impact on license revenue in the Americas geography and the Architecture, Engineering and Construction ("AEC") business segment.
Negatively impacting revenue, especially within the Asia Pacific ("APAC") geography, were changes in foreign currency rates for fiscal
2014
as compared to the prior fiscal year. In addition, our strategic decision related to our educational program to begin granting software licenses to educational institutions in select regions and to key partners negatively impacted revenue, especially within the Americas geography, between fiscal
2014
and the prior fiscal year.
The reasons for these changes are discussed below under the heading “Results from Operations.”
Revenue Analysis
Revenue from flagship products was
51%
of total net revenue during fiscal
2014
, a decrease of
11%
as compared to the prior fiscal year. Revenue from suites was
34%
of total net revenue for fiscal
2014
, an increase of
15%
as compared to the prior fiscal year. Revenue from new and adjacent products was
14%
of total net revenue during the fiscal
2014
, a decrease of
2%
as compared to fiscal
2013
. We anticipate that, as our new and existing customers migrate from our stand-alone products to suites, our revenue from suites will increase as a percentage of revenue and that our revenue from our flagship and new and adjacent products will continue to decline as a percentage of revenue.
We rely significantly upon major distributors and resellers in both the U.S. and international regions, including Tech Data Corporation and its global affiliates (collectively, “Tech Data”). Tech Data accounted for
24%
and
23%
of our consolidated net revenue during fiscal year
2014
and
2013
, respectively. We believe our business is not substantially dependent on Tech Data. Our customers through Tech Data are the resellers and end users who purchase our software licenses and services. Should any of the agreements between Tech Data and us be terminated for any reason, we believe the resellers and end users who currently purchase our products through Tech Data would be able to continue to do so under substantially the same terms from one of our many other distributors without substantial disruption to our revenue.
Operating Margin Analysis
Income from operations
decreased
7%
in fiscal
2014
due to a $
38.3 million
or
2%
decrease in net revenue and a
$35.8 million
or
15%
increase in cost of revenue partially offset by a $
53.0 million
or
3%
decline in our operating expenses, in each case as compared to the prior fiscal year. Our operating margin remained flat at
13%
for fiscal
2014
and
2013
. The increase in cost of revenue was driven by an increase in cloud services-related expenses. Impacting the decline in operating expenses between fiscal
2014
and
2013
was the world-wide restructuring plan ("Fiscal 2013 Plan") approved by Autodesk during the third quarter of fiscal
2013
and the one-time stock-based compensation expense associated with the acquisition of Socialcam during the third quarter of fiscal
2013
. Partially offsetting the decline in operating expense were restructuring charges from the world-wide restructuring plan ("Fiscal 2014 Plan") approved by Autodesk during the third quarter of fiscal
2014
.
2014 Form 10-K 39
Further discussion regarding the cost of goods sold and operating expense activities are discussed below under the heading “Results of Operations.”
Foreign Currency Analysis
We generate a significant amount of our revenue in the U.S., Japan, Germany, the United Kingdom, and France. Our revenue was negatively impacted by foreign exchange rate changes during fiscal
2014
, as compared to the prior fiscal year. Had applicable exchange rates from fiscal
2013
been in effect during fiscal
2014
and had we excluded foreign exchange hedge gains and losses from fiscal
2014
(“on a constant currency basis”), net revenue would have
increased
1%
compared to the prior fiscal year.
Our total spend, defined as cost of revenue plus operating expenses, during fiscal
2014
decreased
1%
on an as reported basis as compared to the prior fiscal year. Had applicable exchange rates from fiscal
2013
been in effect during fiscal
2014
and had we excluded foreign exchange hedge gains and losses from fiscal
2014
, total spend would have been minimally impacted by foreign exchange rate changes and would have remained flat on a constant currency basis compared to the prior fiscal year.
Changes in the value of the U.S. dollar may have a significant effect on net revenue, total spend and income from operations in future periods. We use foreign currency contracts to reduce the exchange rate effect on a portion of the net revenue of certain anticipated transactions but do not attempt to completely mitigate the impact of fluctuations of such foreign currency against the U.S. dollar.
Balance Sheet and Cash Flow Items
At
January 31, 2014
, we had $
2,544.4 million
in cash and marketable securities. We completed fiscal
2014
with a higher deferred revenue balance and a lower accounts receivable balance as compared to the prior fiscal year. Our deferred revenue balance at
January 31, 2014
included $
789.3 million
of deferred subscription revenue primarily related to customer maintenance contracts, which will be recognized as revenue ratably over the life of the contracts. The term of our maintenance contracts is typically between one and three years. Our cash flow from operations
increased
1%
to
$563.5 million
as of
January 31, 2014
from
$559.1 million
at
January 31, 2013
. We repurchased
10.5 million
shares of our common stock for $
423.8 million
during fiscal
2014
. Comparatively, we repurchased
12.5 million
shares of our common stock for $
431.2 million
during fiscal
2013
. Further discussion regarding the balance sheet and cash flow activities are discussed below under the heading “Liquidity and Capital Resources.”
Business Outlook
Autodesk's business model is evolving. We continue to assess current business offerings including introducing more flexible license and service offerings that have ratable revenue streams. The accounting impact of these offerings and other business decisions are expected to result in an increase in the percentage of our ratable revenue, making for a more predictable business over time, while correspondingly reducing our upfront perpetual revenue stream. Over time, we expect our business model transition to expand our customer base by eliminating higher up-front licensing costs and providing more flexibility with how customers use our products. However, we expect the business model transition to cause our traditional upfront perpetual license revenue to decline without a corresponding decrease in expenses. In the future, we expect this business model transition will increase our long-term revenue growth rate by increasing the annual value per subscription and increasing our subscription base over time.
We expect net revenue for the first quarter of fiscal
2015
will range from $560 million to $575 million, and that GAAP diluted earnings per share will range from $0.01 to $0.04 while non-GAAP diluted earnings per share will range from $0.19 to $0.22. Non-GAAP earnings per diluted share exclude $0.11 related to stock-based compensation expense, $0.06 related to the amortization of acquisition related intangibles and $0.01 related to restructuring charges.
We expect net billings for fiscal
2015
to increase by approximately 5% to 8% compared to fiscal 2014.We expect net revenue for fiscal
2015
to increase by approximately 3% to 5% compared to fiscal 2014. Autodesk anticipates fiscal 2015 GAAP operating margin to be approximately 5% to 8% and non-GAAP operating margin to be approximately 14% to 16%. The 14% non-GAAP operating margin excludes 6 percentage points related to stock-based compensation expense, and 3 percentage points related to the amortization of acquisition related intangibles. The 16% non-GAAP operating margin excludes 5 percentage points related to stock-based compensation expense, and 3 percentage points related to the amortization of acquisition related intangibles. Autodesk expects to add approximately 150,000-200,000 net new subscriptions.
2014 Form 10-K 40
Included within our guidance is the expected reduction in our operating margin for our acquisition of Delcam plc (“Delcam”).
We remain diligent about managing our spend while making essential investments to drive growth. If we are unable to successfully achieve our major business initiatives we may not achieve our financial goals.
Results of Operations
|
|
Fiscal Year Ended January 31, 2014
|
Increase (decrease) compared to
prior fiscal year
|
Fiscal Year Ended January 31, 2013
|
Increase (decrease)
compared to
prior fiscal year
|
Fiscal Year Ended January 31, 2012
|
||||||||||||||||||||
|
|
$
|
%
|
$
|
%
|
|||||||||||||||||||||
|
|
(in millions)
|
||||||||||||||||||||||||
|
Net Revenue:
|
|||||||||||||||||||||||||
|
License and other (1)
|
$
|
1,254.9
|
|
$
|
(109.2
|
)
|
(8
|
)%
|
$
|
1,364.1
|
|
$
|
29.7
|
|
2
|
%
|
$
|
1,334.4
|
|
||||||
|
Subscription (1)
|
1,019.0
|
|
70.9
|
|
7
|
%
|
948.1
|
|
66.9
|
|
8
|
%
|
881.2
|
|
|||||||||||
|
$
|
2,273.9
|
|
$
|
(38.3
|
)
|
(2
|
)%
|
$
|
2,312.2
|
|
$
|
96.6
|
|
4
|
%
|
$
|
2,215.6
|
|
|||||||
|
Net Revenue by Geographic Area:
|
|||||||||||||||||||||||||
|
Americas
|
$
|
818.9
|
|
$
|
(17.3
|
)
|
(2
|
)%
|
$
|
836.2
|
|
$
|
37.7
|
|
5
|
%
|
$
|
798.5
|
|
||||||
|
Europe, Middle East and Africa
|
851.8
|
|
(16.7
|
)
|
(2
|
)%
|
868.5
|
|
6.3
|
|
1
|
%
|
862.2
|
|
|||||||||||
|
Asia Pacific
|
603.2
|
|
(4.3
|
)
|
(1
|
)%
|
607.5
|
|
52.6
|
|
9
|
%
|
554.9
|
|
|||||||||||
|
$
|
2,273.9
|
|
$
|
(38.3
|
)
|
(2
|
)%
|
$
|
2,312.2
|
|
$
|
96.6
|
|
4
|
%
|
$
|
2,215.6
|
|
|||||||
|
Net Revenue by Operating Segment:
|
|||||||||||||||||||||||||
|
Platform Solutions and Emerging Business (1)
|
$
|
789.2
|
|
$
|
(53.8
|
)
|
(6
|
)%
|
$
|
843.0
|
|
$
|
9.9
|
|
1
|
%
|
$
|
833.1
|
|
||||||
|
Architecture, Engineering and Construction (1)
|
730.6
|
|
29.5
|
|
4
|
%
|
701.1
|
|
74.7
|
|
12
|
%
|
626.4
|
|
|||||||||||
|
Manufacturing (1)
|
579.4
|
|
5.6
|
|
1
|
%
|
573.8
|
|
33.5
|
|
6
|
%
|
540.3
|
|
|||||||||||
|
Media and Entertainment (1)
|
174.7
|
|
(19.6
|
)
|
(10
|
)%
|
194.3
|
|
(21.5
|
)
|
(10
|
)%
|
215.8
|
|
|||||||||||
|
$
|
2,273.9
|
|
$
|
(38.3
|
)
|
(2
|
)%
|
$
|
2,312.2
|
|
$
|
96.6
|
|
4
|
%
|
$
|
2,215.6
|
|
|||||||
____________________
|
(1)
|
For comparability, the presentation of the balances at January 31, 2013 and January 31, 2012 were adjusted to align to current year presentation.
|
Fiscal
2014
Net Revenue Compared to Fiscal
2013
Net Revenue
License and Other Revenue
License and other revenue consists of two components: all forms of product license revenue and other revenue. Product license revenue includes: software license revenue from the sale of new seat licenses and upgrades and product revenue for Creative Finishing. Other revenue includes revenue from consulting, training, Autodesk Developers Network and Creative Finishing customer support, and is recognized over time, as the services are performed.
Total License and other revenue
decreased
8%
during fiscal
2014
as compared to fiscal
2013
. This decrease was primarily due to a
7%
decrease in product license revenue as compared to the same period in the prior fiscal year. The decline in product license revenue was primarily due to a decrease of 15% in revenue from our flagship products partially offset by an increase of 10% in our suites products.
During fiscal
2014
, the
7%
decrease in product license revenue was due to a
21%
decrease
in the number of seats sold partially offset by a
14%
increase
in the average net revenue per seat. Product license revenue, as a percentage of License and other revenue, was
84%
for fiscal
2014
and
83%
for fiscal
2013
.
During fiscal
2014
, total other revenue represented
16%
of License and other revenue. Other revenue
decreased
by
11%
during fiscal
2014
as compared to fiscal
2013
. This decrease is primarily due to a 56% decrease in our education products as a
2014 Form 10-K 41
result of our transition to granting no or low-cost software licenses to educational institutions in select regions and to key partners during fiscal
2014
, consistent with our strategy.
Backlog related to current software license product orders that had not shipped at the end of the fiscal year
decreased
by
$0.3 million
from
$20.0 million
at
January 31, 2013
to
$19.7 million
at
January 31, 2014
. Backlog from current software license product orders that we have not yet shipped consists of orders from customers with approved credit status for currently available software products and may include both orders with current ship dates and orders with ship dates beyond the current fiscal period.
Subscription Revenue
Our Subscription revenue consists of two components: maintenance revenue for our software products and revenue for our cloud service offerings, including Autodesk 360. Our maintenance program provides our commercial and educational customers of perpetual products with a cost effective and predictable budgetary option to obtain the productivity benefits of our new releases and enhancements when and if released during the term of their contracts. Under our maintenance program, customers are eligible to receive unspecified upgrades when and if available, downloadable training courses and online support. We recognize maintenance revenue ratably over the term of the maintenance agreement, which is generally between one and three years but can occasionally be as long as five years. Revenue for our cloud service offerings is recognized ratably over the contract term commencing with the date our service is made available to customers and all other revenue recognition criteria have been satisfied.
Subscription revenue
increased
7%
during fiscal
2014
as compared to fiscal
2013
primarily due to a
9%
increase
in commercial maintenance revenue. The
9%
increase
in commercial maintenance revenue was due to a
4%
increase
from commercial enrollment during the corresponding maintenance contract term and a
5%
increase
from net revenue per maintenance seat. Commercial maintenance revenue represented
95%
and
94%
of Subscription revenue for fiscal
2014
and fiscal
2013
, respectively.
Changes in Subscription revenue lag changes in net billings for subscription contracts because we recognize the revenue from those contracts ratably over their contract terms. Net subscription billings remained flat during fiscal
2014
as compared to the prior fiscal year primarily due to a decline in multi-year maintenance subscriptions partially offset by an increase in billings from suites, which have higher maintenance subscription prices.
Our deferred subscription revenue balance at
January 31, 2014
and
January 31, 2013
was $
789.3 million
and $
753.1 million
, respectively, and primarily related to customer maintenance agreements, which will be recognized as revenue ratably over the term of the maintenance agreement.
Net Revenue by Geographic Area
Net revenue in the Americas geography
decreased
by
2%
as reported and on a constant currency basis during fiscal
2014
, as compared to the prior fiscal year. This decrease was primarily due to a
13%
decrease
in our flagship product revenue partially offset by a
14%
increase
in our suites revenue in this geography during fiscal
2014
as compared to fiscal
2013
. The decrease in our revenue in this geography was led by Canada and Brazil partially offset by an increase in revenue from the U.S.
Net revenue in the Europe, Middle East and Africa ("EMEA") geography
decreased
by
2%
, and remained flat on a constant currency basis, during fiscal
2014
as compared to the prior fiscal year. This decrease was primarily due to a
13%
decrease
in our flagship products partially offset by a
21%
increase
in our suites products in this geography during fiscal
2014
as compared to fiscal
2013
. The decrease in our revenue in this geography was led by Ireland, Sweden, and the Netherlands partially offset by an increase in revenue from Finland and the United Kingdom.
Net revenue in the APAC geography
decreased
1%
and
increased
by
5%
on a constant currency basis, during fiscal
2014
as compared to the prior fiscal year, primarily due to a
3%
decrease
in our flagship products partially offset by a
10%
increase
in our suites products in this geography. Our revenue in this geography during fiscal
2014
was impacted by decreases in revenue from Australia, Japan, and Taiwan, partially offset by an increase in revenue from China.
Net revenue in emerging economies remained flat during fiscal
2014
as compared to the prior fiscal year, primarily due to increases in revenue from Lebanon and China offset by a decrease in revenue from the Russian Federation. Revenue from emerging economies represented
15%
and
14%
of total net revenue for fiscal
2014
and
2013
, respectively.
2014 Form 10-K 42
International net revenue represented
70%
and
71%
of our total net revenue for fiscal
2014
and
2013
, respectively. We believe that international revenue will continue to comprise a majority of our total net revenue. Unfavorable economic conditions in the countries that contribute a significant portion of our net revenue, including in emerging economies, may have an adverse effect on our business in those countries and our overall financial performance. Changes in the value of the U.S. dollar relative to other currencies have significantly affected, and could continue to significantly affect, our financial results for a given period even though we hedge a portion of our current and projected revenue. Additionally, weak global economic conditions that have been characterized by restructuring of sovereign debt, high unemployment, and volatility in the financial markets may impact our future financial results.
Net Revenue by Operating Segment
We have four reportable segments: Platform Solutions and Emerging Business ("PSEB"), AEC, Manufacturing ("MFG") and Media and Entertainment ("M&E"). We have no material inter-segment revenue.
Net revenue for PSEB
decreased
by
6%
during fiscal
2014
as compared to the prior fiscal year primarily due to a 9% and 4% decrease in revenue from our flagship products, AutoCAD and AutoCAD LT, respectively.
Net revenue for AEC
increased
by
4%
during fiscal
2014
as compared to the prior fiscal year primarily due to a 31% increase in revenue from our AEC suites, which was primarily driven by Autodesk Building Design Suite and Autodesk Infrastructure Design Suite.
Net revenue for MFG
increased
by
1%
during fiscal
2014
as compared to the prior fiscal year primarily due to a 9% increase in revenue from our MFG suites, which was primarily driven by the Autodesk Product Design Suite. This increase was partially offset by a decrease in revenue from our flagship product, AutoCAD Mechanical.
Net revenue for M&E
decreased
by
10%
during fiscal
2014
as compared to the prior fiscal year, primarily due to a 7% decrease in revenue from Animation and a 17% decrease in revenue from Creative Finishing. The decrease in Animation revenue was primarily due to a 9% decrease in revenue from our flagship product, Maya, and a 16% decrease from our M&E suites, which was driven by our Autodesk Entertainment Creation Suite. The decline in Creative Finishing was marked by a general decrease in M&E industry end-market demand. As more of our customers move to our suites products, our revenue on stand-alone products like 3Ds Max is expected to decrease because it is included in a number of our various segments' suites. Integration of our M&E offerings into our other segments' suites is part of our strategy and we believe it represents a growth opportunity for us over the long-term.
Fiscal
2013
Net Revenue Compared to Fiscal
2012
Net Revenue
This discussion has been updated to conform with the current period's presentation.
License and Other Revenue
Total license and other revenue increased 2% during fiscal 2013 as compared to fiscal 2012. This increase was primarily due to a 4% increase in product license revenue as compared to the same period in the prior fiscal year. The increase in product license revenue was primarily due to an increase of 16% in revenue from our suites products and a 3% increase in revenue from our flagship products.
During fiscal 2013, the 4% increase in product license revenue was due to a 6% increase in the average net revenue per seat partially offset by a 2% decrease in the number of seats sold. Product license revenue, as a percentage of License and other revenue, was
83%
for fiscal 2013 and 82% for fiscal 2012.
During fiscal 2013, total other revenue represented 17% of License and other revenue. Other revenue decreased by 7% during fiscal 2013 as compared to fiscal 2012 primarily due to a 34% decrease in our education products as a result of our transition to granting no or low-cost software licenses to educational institutions in select regions and to key partners during fiscal 2013, consistent with our strategy.
Backlog related to current software license product orders that had not shipped at the end of the fiscal year decreased by $7.1 million during fiscal 2013 from $27.1 million at January 31, 2012 to $20.0 million at January 31, 2013.
2014 Form 10-K 43
Subscription Revenue
Subscription revenue
increased
8%
during fiscal 2013, as compared to fiscal 2012, primarily due to a 4% increase in commercial maintenance revenue. The 4% increase in commercial maintenance revenue was due to an 8% increase from commercial enrollment during the corresponding maintenance contract term partially offset by a 4% decrease in average net revenue per maintenance seat. Commercial maintenance revenue represented
94%
and 97% of Subscription revenue for fiscal 2013 and 2012.
Net subscription billings increased 5% during fiscal 2013 as compared to the prior fiscal year primarily due to early subscription renewals in advance of a price increase and due to new multi-year maintenance contracts.
Our deferred subscription revenue balance at January 31, 2013 and January 31, 2012 was $753.1 million and $644.1 million, respectively, and primarily related to customer maintenance agreements, which will be recognized as revenue ratably over the term of the maintenance agreement.
Net Revenue by Geographic Area
Net revenue in the Americas geography increased by 5% both as reported and on a constant currency basis, during fiscal 2013, as compared to fiscal 2012. This increase was primarily due to a 5% increase in our flagship product revenue and an 8% increase in our suites revenue during fiscal 2013 as compared to fiscal 2012. The increase in our revenue in this geography was led by the U.S. and Canada.
Net revenue in the EMEA geography increased by 1%, or 3% on a constant currency basis, during fiscal 2013 as compared to fiscal 2012. The increase was primarily due to a 13% increase in our suites revenue partially offset by a 4% decrease in our flagship product revenue during fiscal 2013 as compared to fiscal 2012. The increase in our revenue in this geography was led by Ireland, Finland and Germany, partially offset by a decrease in revenue from Sweden and the United Kingdom.
Net revenue in the APAC geography increased by 9%, or 8% on a constant currency basis, during fiscal 2013, as compared to fiscal 2012, primarily due to a 28% increase in our suites revenue and an 8% increase in flagship product revenue during fiscal 2013 as compared to fiscal 2012. Net revenue expansion in the APAC geography during fiscal 2013 was led by Japan, followed by China and South Korea.
Net revenue in emerging economies decreased by 4%, or 2% on a constant currency basis, during fiscal 2013 as compared to fiscal 2012, primarily due to a decrease in revenue from Brazil, Poland and India, partially offset by an increase in revenue from China. Revenue from emerging economies represented 14% of net revenue for fiscal 2013 and 16% for fiscal 2012.
International net revenue represented 71% and 72% of our net revenue in fiscal 2013 and fiscal 2012, respectively.
Net Revenue by Operating Segment
Net revenue for PSEB, which includes our Autodesk Design Suite, increased 1% during fiscal 2013, as compared to fiscal 2012, primarily due to a 2% increase in revenue from our flagship AutoCAD and AutoCAD LT products.
Net revenue for AEC increased 12% during fiscal 2013, as compared to fiscal 2012, primarily due to a 22% increase in revenue from our AEC suites, which includes our Autodesk Building Design Suite.
Net revenue for MFG increased 6% during fiscal 2013, as compared to fiscal 2012, primarily due to an 8% increase in revenue from our MFG suites, which includes the Autodesk Product Design Suite.
Net revenue for M&E decreased 10% during fiscal 2013, as compared to fiscal 2012, primarily due to an 8% decrease in revenue from our Animation product group, which includes our Autodesk Entertainment Creation Suite, and a 16% decrease in revenue from Creative Finishing. The decrease in Animation revenue was primarily due to a 22% decrease in revenue from our flagship product, 3Ds Max, partially offset by a 26% increase in revenue from our animation suites, which includes our Autodesk Entertainment Creation Suite. The overall decrease in M&E revenue is related to a general decrease in the M&E industry end-market demand, as well as the inclusion of our M&E products in other Autodesk industry suites.
2014 Form 10-K 44
Cost of Revenue and Operating Expenses
Cost of Revenue
For comparability, the balances at January 31, 2013 and January 31, 2012, including tables, were adjusted to align to current year presentation, and therefore the discussion has been updated accordingly.
|
Fiscal Year Ended January 31, 2014
|
Increase compared to
prior fiscal year |
Fiscal Year Ended January 31, 2013
|
Increase compared to
prior fiscal year |
Fiscal Year Ended January 31, 2012
|
|||||||||||||||||||||
|
|
|||||||||||||||||||||||||
|
|
$
|
%
|
$
|
%
|
|||||||||||||||||||||
|
|
(in millions)
|
||||||||||||||||||||||||
|
Cost of revenue:
|
|||||||||||||||||||||||||
|
License and other
|
$
|
178.7
|
|
$
|
12.7
|
|
8
|
%
|
$
|
166.0
|
|
$
|
(0.6
|
)
|
—
|
%
|
$
|
166.6
|
|
||||||
|
Subscription
|
95.6
|
|
23.1
|
|
32
|
%
|
72.5
|
|
10.0
|
|
16
|
%
|
62.5
|
|
|||||||||||
|
$
|
274.3
|
|
$
|
35.8
|
|
15
|
%
|
$
|
238.5
|
|
$
|
9.4
|
|
4
|
%
|
$
|
229.1
|
|
|||||||
|
As a percentage of net revenue
|
12
|
%
|
10
|
%
|
10
|
%
|
|||||||||||||||||||
Cost of license and other revenue includes labor costs associated with product setup and fulfillment and costs of fulfilling consulting and training services contracts and collaborative project management services contracts. Cost of license and other revenue also includes stock-based compensation expense, direct material and overhead charges, amortization of purchased technology, professional services fees and royalties. Direct material and overhead charges include the cost of hardware sold (mainly PC-based workstations for Creative Finishing in the M&E segment), costs associated with transferring our software to electronic media, physical media, packaging materials and shipping and handling costs.
Cost of license and other revenue
increased
8%
during fiscal
2014
, as compared to fiscal
2013
, primarily due to an increase in consulting support costs. Cost of license and other revenue remained flat during fiscal
2013
, as compared to fiscal
2012
, primarily due to a decrease in Creative Finishing related expenses, consistent with the decline in Creative Finishing revenue, offset by an increase in stock-based compensation charges and amortization of acquisition related developed technologies.
Cost of subscription revenue includes the labor costs of providing product support to our maintenance and cloud subscription customers, including rent and occupancy, shipping and handling costs, professional services fees related to operating our network infrastructure, including depreciation expense and operating lease payments associated with computer equipment, data center costs, salaries and related expenses of network operations. Cost of subscription revenue
increased
32%
during fiscal
2014
as compared to fiscal
2013
primarily due to an increase in cloud services-related expenses. Cost of subscription revenue
increased
16%
during fiscal
2013
as compared to fiscal
2012
due to an increase in cloud services-related expenses partially offset by decrease in costs as a result of the move to more electronic fulfillment.
Cost of revenue, at least over the near term, is affected by the volume and mix of product sales, mix of physical versus electronic fulfillment, fluctuations in consulting costs, amortization of purchased technology, new customer support offerings, royalty rates for licensed technology embedded in our products and employee stock-based compensation expense.
We expect cost of revenue to increase in absolute dollars and slightly increase as a percentage of net revenue during fiscal
2015
, as compared to fiscal
2014
, primarily due to an increase in costs associated with meeting our major business initiatives.
2014 Form 10-K 45
Marketing and Sales
|
Fiscal Year Ended January 31, 2014
|
Decrease compared to
prior fiscal year |
Fiscal Year Ended January 31, 2013
|
Increase compared to
prior fiscal year |
Fiscal Year Ended January 31, 2012
|
|||||||||||||||||||||
|
|
|||||||||||||||||||||||||
|
|
$
|
%
|
$
|
%
|
|||||||||||||||||||||
|
|
(in millions)
|
||||||||||||||||||||||||
|
Marketing and sales
|
$
|
842.6
|
|
$
|
(32.9
|
)
|
(4
|
)%
|
$
|
875.5
|
|
$
|
32.9
|
|
4
|
%
|
$
|
842.6
|
|
||||||
|
As a percentage of net revenue
|
37
|
%
|
38
|
%
|
38
|
%
|
|||||||||||||||||||
Marketing and sales expenses include salaries, bonuses, benefits and stock-based compensation expense for our marketing and sales employees, the expense of travel, entertainment and training for such personnel, the costs of programs aimed at increasing revenue, such as advertising, trade shows and expositions, and various sales and promotional programs. Marketing and sales expenses also include labor costs of sales and order processing, sales and dealer commissions, rent and occupancy, and the cost of supplies and equipment.
Marketing and sales expenses
decreased
4%
during fiscal
2014
, as compared to fiscal
2013
, primarily due to lower advertising and promotional expenses and employee-related costs from salaries, bonus and commissions. Marketing and sales expenses
increased
4%
during fiscal
2013
, as compared to fiscal
2012
, primarily due to higher employee-related costs from salaries and fringe benefits and stock-based compensation primarily associated with increased headcount and merit increases in fiscal 2013. These costs were partially offset by a decrease in professional fees and advertising costs.
We expect to balance our need to invest in the marketing and sales of our products with our desire to actively manage our sales and marketing operating expenses. As a result, we expect marketing and sales expense to increase in absolute dollars and slightly increase as a percentage of net revenue in fiscal
2015
as compared to fiscal
2014
, primarily due to an increase in costs as we work towards meeting our major business initiatives.
Research and Development
|
|
Fiscal Year Ended January 31, 2014
|
Increase compared to
prior fiscal year |
Fiscal Year Ended January 31, 2013
|
Increase
compared to prior fiscal year |
Fiscal Year Ended January 31, 2012
|
||||||||||||||||||||
|
|
|||||||||||||||||||||||||
|
$
|
%
|
$
|
%
|
||||||||||||||||||||||
|
(in millions)
|
|||||||||||||||||||||||||
|
Research and development
|
$
|
611.1
|
|
$
|
11.1
|
|
2
|
%
|
$
|
600.0
|
|
$
|
33.5
|
|
6
|
%
|
$
|
566.5
|
|
||||||
|
As a percentage of net revenue
|
27
|
%
|
26
|
%
|
26
|
%
|
|||||||||||||||||||
Research and development expenses, which are expensed as incurred, consist primarily of salaries, bonuses, benefits and stock-based compensation expense for research and development employees, and the expense of travel, entertainment and training for such personnel, rent and occupancy, and professional services such as fees paid to software development firms and independent contractors.
Research and development expenses
increased
2%
during fiscal
2014
, as compared to fiscal
2013
, primarily due to an increase in employee-related costs from salaries and fringe benefits and an increase in professional fees partially offset by a decline in stock-based compensation expense due to a one-time charge associated with the acquisition of Socialcam in fiscal 2013. Research and development expenses
increased
6%
during fiscal
2013
, as compared to fiscal
2012
, primarily due to an increase in stock-based compensation expense associated with the acquisition of Socialcam in the third quarter of fiscal 2013 and an increase in salaries and fringe benefits primarily due to merit increases in fiscal 2013.
We expect research and development expense to increase in absolute dollars, and slightly increase as a percentage of net revenue during fiscal
2015
, as compared to fiscal
2014
, as we continue to invest in product development in fiscal
2015
.
2014 Form 10-K 46
General and Administrative
|
|
Fiscal Year Ended January 31, 2014
|
Decrease compared to
prior fiscal year |
Fiscal Year Ended January 31, 2013
|
Increase
compared to prior fiscal year |
Fiscal Year Ended January 31, 2012
|
||||||||||||||||||||
|
|
|||||||||||||||||||||||||
|
$
|
%
|
$
|
%
|
||||||||||||||||||||||
|
|
(in millions)
|
||||||||||||||||||||||||
|
General and administrative
|
$
|
248.3
|
|
$
|
(0.1
|
)
|
—
|
%
|
$
|
248.4
|
|
$
|
25.3
|
|
11
|
%
|
$
|
223.1
|
|
||||||
|
As a percentage of net revenue
|
11
|
%
|
11
|
%
|
10
|
%
|
|||||||||||||||||||
General and administrative expenses include salaries, bonuses, benefits and stock-based compensation expense for our finance, human resources and legal employees, as well as professional fees for legal and accounting services, amortization of acquisition related customer relationships and trade names, gains and losses on our operating expense cash flow hedges, expense of travel, entertainment and training, expense of communication and the cost of supplies and equipment.
General and administrative expenses remained flat from fiscal
2013
to fiscal
2014
. An increase in employee-related costs from salaries and fringe benefits were offset by a decrease in amortization of acquisition related customer relationships and trade names. General and administrative expenses
increased
11%
from fiscal
2012
to fiscal
2013
, primarily due to an increase in amortization of acquisition related customer relationships and trade names and fluctuations in our operating expense hedge activity in fiscal
2013
. Also contributing to the increase was an increase in salaries primarily due to merit increases in fiscal
2013
as compared to fiscal
2012
.
We expect general and administrative expense to slightly increase in absolute dollars but remain relatively consistent as a percentage of net revenue during fiscal
2015
, as compared to fiscal
2014
, primarily due to an increase in costs associated with supporting our major business initiatives.
Restructuring Charges (Benefits), Net
|
|
Fiscal Year Ended January 31, 2014
|
Decrease compared to
prior fiscal year |
Fiscal Year Ended January 31, 2013
|
Increase compared to
prior fiscal year |
Fiscal Year Ended January 31, 2012
|
||||||||||||||||||||
|
|
|||||||||||||||||||||||||
|
$
|
%
|
$
|
%
|
||||||||||||||||||||||
|
|
(in millions)
|
||||||||||||||||||||||||
|
Restructuring charges (benefits), net
|
$
|
12.8
|
|
$
|
(31.1
|
)
|
71
|
%
|
$
|
43.9
|
|
$
|
45.2
|
|
(3,477
|
)%
|
$
|
(1.3
|
)
|
||||||
|
As a percentage of net revenue
|
1
|
%
|
2
|
%
|
—
|
%
|
|||||||||||||||||||
During the third quarter of fiscal
2014
, our Board of Directors approved a world-wide restructuring plan in order to re-balance staffing levels to better align them with the evolving needs of the business. During fiscal
2014
, Autodesk recorded a restructuring charge of $
12.8 million
. Of this amount, $
10.2 million
was recorded for one-time termination benefits and other costs and $
2.6 million
was recorded for facilities-related costs. We expect to substantially pay the one-time termination benefits and facility related liabilities related to this plan by the end of our first quarter of fiscal 2015.
During the third quarter of fiscal 2013, the our Board of Directors approved a world-wide restructuring plan in line with the Company's strategy, including its continuing shift to cloud and mobile computing. The approved plan included a reduction in force and the consolidation of certain leased facilities. As of January 31, 2014, the personnel and facilities related actions included in this restructuring plan were substantially complete. See Note
15
, “
Restructuring Reserves
,” in Notes to Consolidated Financial Statements for further discussion.
2014 Form 10-K 47
Interest and Other (Expense) Income, Net
The following table sets forth the components of interest and other income, net:
|
|
Fiscal Year Ended
January 31,
|
||||||||||
|
|
2014
|
2013
|
2012
|
||||||||
|
|
(in millions)
|
||||||||||
|
Interest and investment (expense) income, net (1)
|
$
|
(9.8
|
)
|
$
|
4.9
|
|
$
|
5.4
|
|
||
|
Gain (loss) on foreign currency
|
4.0
|
|
1.2
|
|
(1.1
|
)
|
|||||
|
(Loss) gain on strategic investments (1)
|
(1.8
|
)
|
(4.0
|
)
|
0.3
|
|
|||||
|
Other income
|
2.7
|
|
2.0
|
|
2.7
|
|
|||||
|
Interest and other (expense) income, net
|
$
|
(4.9
|
)
|
$
|
4.1
|
|
$
|
7.3
|
|
||
____________________
|
(1)
|
For comparability, the presentation of the balances at January 31, 2012 was adjusted to align to current year presentation.
|
Interest and other (expense) income, net,
decreased
$
9.0 million
during fiscal
2014
, as compared to fiscal
2013
, primarily due to a reduction in our net interest and investment (expense) income.
The decrease in interest and investment (expense) income, net, during fiscal
2014
as compared to fiscal
2013
is primarily due to interest expense resulting from the December 2012 issuance of $
400.0 million
aggregate principal amount of
1.95%
senior notes due
December 15, 2017
and $
350.0 million
aggregate principal amount of
3.6%
senior notes due
December 15, 2022
. Interest and investment income fluctuates based on average cash, marketable securities and debt balances, average maturities and interest rates.
Interest and other income, net,
decreased
$
3.2 million
during fiscal
2013
, as compared to fiscal
2012
, primarily due to a reduction in our net interest and investment income and losses incurred due to impairments of certain strategic investments. A loss on strategic investments occurs when a net reduction in valuation occurs or an impairment is recorded. Impairment results from the determination that the value of the investment is no longer recoverable.
Provision for Income Taxes
We account for income taxes and the related accounts under the liability method. Deferred tax liabilities and assets are determined based on the difference between the financial statement and tax bases of assets and liabilities, using enacted rates expected to be in effect during the year in which the basis differences reverse.
Our effective tax rate was
18%
and
20%
during fiscal
2014
and fiscal
2013
, respectively. Our effective tax rate decreased two percentage points from fiscal 2013 to fiscal 2014 due to an increase in tax benefits from foreign earnings taxed at different rates in fiscal 2014 compared to fiscal 2013, offset in part by lower tax benefits from restructuring and additional tax expense associated with uncertain tax positions and audit assessements.
Our effective tax rate was
20%
and
21%
during fiscal
2013
and
2012
, respectively. Our effective tax rate decreased one percentage point from fiscal
2012
to fiscal
2013
primarily due to an increase in tax benefits from foreign earnings taxed at lower rates in fiscal
2013
compared to fiscal
2012
, partially offset by tax benefits associated with closure of audits in fiscal 2011.
Our future effective tax rate may be materially impacted by the amount of benefits and charges from tax amounts associated with our foreign earnings that are taxed at rates different from the federal statutory rate, research credits, state income taxes, the tax impact of stock-based compensation, accounting for uncertain tax positions, business combinations, U.S. Manufacturer's deduction, closure of statute of limitations or settlement of tax audits, changes in valuation allowances and changes in tax laws including possible U.S. tax law changes that, if enacted, could significantly impact how U.S. multinational companies are taxed on foreign subsidiary earnings. A significant amount of our earnings is generated by our Europe and Asia Pacific subsidiaries. Our future effective tax rates may be adversely affected to the extent earnings are lower than anticipated in countries where we have lower statutory tax rates or we repatriate certain foreign earnings on which U.S. taxes have not previously been provided.
2014 Form 10-K 48
At
January 31, 2014
, we had net deferred tax assets of $
187.9 million
. We believe that we will generate sufficient future taxable income in appropriate tax jurisdictions to realize these assets.
For additional information regarding our income tax provision and reconciliation of our effective rate to the federal statutory rate of 35%, see Note
4
, “
Income Taxes
,” in the Notes to Consolidated Financial Statements.
Other Financial Information
In addition to our results determined under U.S. generally accepted accounting principles (“GAAP”) discussed above, we believe the following non-GAAP measures are useful to investors in evaluating our operating performance. For the fiscal years ended
January 31, 2014
,
2013
and
2012
, our gross profit, gross margin, income from operations, operating margin, net income and diluted earnings per share on a GAAP and non-GAAP basis were as follows (in millions except for gross margin, operating margin and per share data):
|
January 31, 2014
|
January 31, 2013
|
January 31, 2012
|
|||||||||
|
|
|
(Unaudited)
|
|
||||||||
|
Gross profit
|
$
|
1,999.6
|
|
$
|
2,073.7
|
|
$
|
1,986.5
|
|
||
|
Non-GAAP gross profit
|
$
|
2,049.8
|
|
$
|
2,118.6
|
|
$
|
2,028.4
|
|
||
|
Gross margin
|
88
|
%
|
90
|
%
|
90
|
%
|
|||||
|
Non-GAAP gross margin
|
90
|
%
|
92
|
%
|
92
|
%
|
|||||
|
Income from operations
|
$
|
284.8
|
|
$
|
305.9
|
|
$
|
355.6
|
|
||
|
Non-GAAP income from operations
|
$
|
510.5
|
|
$
|
587.9
|
|
$
|
533.4
|
|
||
|
Operating margin
|
13
|
%
|
13
|
%
|
16
|
%
|
|||||
|
Non-GAAP operating margin
|
22
|
%
|
25
|
%
|
24
|
%
|
|||||
|
Net income
|
$
|
228.8
|
|
$
|
247.4
|
|
$
|
285.3
|
|
||
|
Non-GAAP net income (1)
|
$
|
385.6
|
|
$
|
450.0
|
|
$
|
405.1
|
|
||
|
Diluted earnings per share (2)
|
$
|
1.00
|
|
$
|
1.07
|
|
$
|
1.22
|
|
||
|
Non-GAAP diluted earnings per share (1) (2)
|
$
|
1.68
|
|
$
|
1.94
|
|
$
|
1.74
|
|
||
_______________
|
(1)
|
Effective in the second quarter of fiscal 2013, Autodesk began excluding gains and losses on strategic investments for purposes of its non-GAAP financial measures. Prior period non-GAAP interest and other income (expense), net, net income and earnings per share amounts have been revised to conform to the current period presentation.
|
|
(2)
|
Earnings per share were computed independently for each of the periods presented; therefore the sum of the earnings per share amount for the quarters may not equal the total for the year.
|
For our internal budgeting and resource allocation process and as a means to evaluate period-to-period comparisons, we use non-GAAP measures to supplement our consolidated financial statements presented on a GAAP basis. These non-GAAP measures do not include certain items that may have a material impact upon our reported financial results. We use non-GAAP measures in making operating decisions because we believe those measures provide meaningful supplemental information regarding our earning potential and performance for management by excluding certain expenses and charges that may not be indicative of our core business operating results. For the reasons set forth below, we believe these non-GAAP financial measures are useful to investors both because (1) they allow for greater transparency with respect to key metrics used by management in its financial and operational decision-making and (2) they are used by our institutional investors and the analyst community to help them analyze the health of our business. This allows investors and others to better understand and evaluate our operating results and future prospects in the same manner as management, compare financial results across accounting periods and to those of peer companies and to better understand the long-term performance of our core business. We also use some of these measures for purposes of determining company-wide incentive compensation.
There are limitations in using non-GAAP financial measures because non-GAAP financial measures are not prepared in accordance with GAAP and may be different from non-GAAP financial measures used by other companies. The non-GAAP financial measures included above are limited in value because they exclude certain items that may have a material impact upon our reported financial results. In addition, they are subject to inherent limitations as they reflect the exercise of judgments by management about which charges are excluded from the non-GAAP financial measures. We compensate for these limitations by analyzing current and future results on a GAAP basis as well as a non-GAAP basis and also by providing GAAP measures in our
2014 Form 10-K 49
public disclosures. The presentation of non-GAAP financial information is meant to be considered in addition to, not as a substitute for or in isolation from, the directly comparable financial measures prepared in accordance with GAAP. We urge investors to review the reconciliation of our non-GAAP financial measures to the comparable GAAP financial measures included below, and not to rely on any single financial measure to evaluate our business.
2014 Form 10-K 50
Reconciliation of GAAP Financial Measures to Non-GAAP Financial Measures
(In millions except for gross margin, operating margin and per share data):
|
|
Fiscal Year Ended
January 31,
|
||||||||||
|
|
2014
|
2013
|
2012
|
||||||||
|
|
(Unaudited)
|
||||||||||
|
Gross profit
|
$
|
1,999.6
|
|
$
|
2,073.7
|
|
$
|
1,986.5
|
|
||
|
Stock-based compensation expense
|
6.0
|
|
5.2
|
|
3.9
|
|
|||||
|
Amortization of purchased intangibles
|
44.2
|
|
39.7
|
|
38.0
|
|
|||||
|
Non-GAAP gross profit
|
$
|
2,049.8
|
|
$
|
2,118.6
|
|
$
|
2,028.4
|
|
||
|
Gross margin
|
88
|
%
|
90
|
%
|
90
|
%
|
|||||
|
Stock-based compensation expense
|
—
|
%
|
—
|
%
|
—
|
%
|
|||||
|
Amortization of purchased intangibles
|
2
|
%
|
2
|
%
|
2
|
%
|
|||||
|
Non-GAAP gross margin
|
90
|
%
|
92
|
%
|
92
|
%
|
|||||
|
Income from operations
|
$
|
284.8
|
|
$
|
305.9
|
|
$
|
355.6
|
|
||
|
Stock-based compensation expense
|
132.2
|
|
156.3
|
|
108.8
|
|
|||||
|
Amortization of purchased intangibles
|
80.7
|
|
81.8
|
|
70.3
|
|
|||||
|
Restructuring charges (benefits), net
|
12.8
|
|
43.9
|
|
(1.3
|
)
|
|||||
|
Non-GAAP income from operations
|
$
|
510.5
|
|
$
|
587.9
|
|
$
|
533.4
|
|
||
|
Operating margin
|
13
|
%
|
13
|
%
|
16
|
%
|
|||||
|
Stock-based compensation expense
|
6
|
%
|
7
|
%
|
5
|
%
|
|||||
|
Amortization of purchased intangibles
|
3
|
%
|
3
|
%
|
3
|
%
|
|||||
|
Restructuring charges (benefits), net
|
—
|
%
|
2
|
%
|
—
|
%
|
|||||
|
Non-GAAP operating margin
|
22
|
%
|
25
|
%
|
24
|
%
|
|||||
|
Net income
|
$
|
228.8
|
|
$
|
247.4
|
|
$
|
285.3
|
|
||
|
Stock-based compensation expense
|
132.2
|
|
156.3
|
|
108.8
|
|
|||||
|
Amortization of purchased intangibles
|
80.7
|
|
81.8
|
|
70.3
|
|
|||||
|
Restructuring charges (benefits), net
|
12.8
|
|
43.9
|
|
(1.3
|
)
|
|||||
|
Loss (gain) on strategic investments (1)
|
1.8
|
|
4.0
|
|
(0.3
|
)
|
|||||
|
Discrete tax provision items
|
(10.2
|
)
|
(26.7
|
)
|
(6.8
|
)
|
|||||
|
Income tax effect of non-GAAP adjustments
|
(60.5
|
)
|
(56.7
|
)
|
(50.9
|
)
|
|||||
|
Non-GAAP net income
|
$
|
385.6
|
|
$
|
450.0
|
|
$
|
405.1
|
|
||
|
Diluted net income per share (2)
|
$
|
1.00
|
|
$
|
1.07
|
|
$
|
1.22
|
|
||
|
Stock-based compensation expense
|
0.57
|
|
0.67
|
|
0.47
|
|
|||||
|
Amortization of purchased intangibles
|
0.35
|
|
0.36
|
|
0.30
|
|
|||||
|
Restructuring charges (benefits), net
|
0.06
|
|
0.18
|
|
(0.01
|
)
|
|||||
|
Loss (gain) on strategic investments (1)
|
—
|
|
0.02
|
|
—
|
|
|||||
|
Discrete tax provision items
|
(0.04
|
)
|
(0.12
|
)
|
(0.03
|
)
|
|||||
|
Income tax effect of non-GAAP adjustments
|
(0.26
|
)
|
(0.24
|
)
|
(0.21
|
)
|
|||||
|
Non-GAAP diluted net income per share (2)
|
$
|
1.68
|
|
$
|
1.94
|
|
$
|
1.74
|
|
||
____________________
|
(1)
|
Effective in the second quarter of fiscal 2013, Autodesk began excluding gains and losses on strategic investments for purposes of its non-GAAP financial measures. Prior period non-GAAP interest and other income (expense), net, net income and earnings per share amounts have been revised to conform to the current period presentation.
|
|
(2)
|
Earnings per share were computed independently for each of the periods presented; therefore the sum of the earnings per share amount for the quarters may not equal the total for the year.
|
2014 Form 10-K 51
Our non-GAAP financial measures may exclude the following:
Stock-based compensation expense
s. We exclude stock-based compensation expenses from non-GAAP measures primarily because they are non-cash expenses and management finds it useful to exclude certain non-cash charges to assess the appropriate level of various operating expenses to assist in budgeting, planning and forecasting future periods. Moreover, because of varying available valuation methodologies, subjective assumptions and the variety of award types that companies can use under FASB ASC Topic 718, we believe excluding stock-based compensation expenses allows investors to make meaningful comparisons between our recurring core business operating results and those of other companies.
Amortization of purchased intangibles.
We incur amortization of acquisition-related purchased intangible assets in connection with acquisitions of certain businesses and technologies. Amortization of intangible assets is inconsistent in amount and frequency and is significantly affected by the timing and size of our acquisitions. Management finds it useful to exclude these variable charges to assess the appropriate level of various operating expenses to assist in budgeting, planning and forecasting future periods. Investors should note that the use of intangible assets contributed to our revenues earned during the periods presented and will contribute to our future period revenues as well. Amortization of purchased intangible assets will recur in future periods.
Goodwill impairment.
This is a non-cash charge to write-down goodwill to fair value when there was an indication that the asset was impaired. As explained above, management finds it useful to exclude certain non-cash charges to assess the appropriate level of various operating expenses to assist in budgeting, planning and forecasting future periods.
Restructuring charges (benefits), net.
These expenses are associated with realigning our business strategies based on current economic conditions. In connection with these restructuring actions, we recognize costs related to termination benefits for former employees whose positions were eliminated, and the closure of facilities and cancellation of certain contracts. We exclude these charges because these expenses are not reflective of ongoing business and operating results. We believe it is useful for investors to understand the effects of these items on our total operating expenses.
Loss (gain) on strategic investments.
We exclude gains and losses related to our strategic investments from our non-GAAP measures primarily because management finds it useful to exclude these variable gains and losses on these investments in assessing our financial results. Included in these amounts are non-cash unrealized gains and losses on the derivative components and realized gains and losses on the sale or losses on the impairment of these investments. We believe excluding these items is useful to investors because these excluded items do not correlate to the underlying performance of our business and these losses or gains were incurred in connection with strategic investments which do not occur regularly.
Establishment of a valuation allowance on certain net deferred tax assets.
This is a non-cash charge to record a valuation allowance on certain deferred tax assets. As explained above, management finds it useful to exclude certain non-cash charges to assess the appropriate level of various cash expenses to assist in budgeting, planning and forecasting future periods.
Discrete tax items.
We exclude the GAAP tax provision, including discrete items, from the non-GAAP measure of income, and include a non-GAAP tax provision based upon the projected annual non-GAAP effective tax rate. Discrete tax items include income tax expenses or benefits that do not relate to ordinary income from continuing operations in the current fiscal year, unusual or infrequently occurring items, or the tax impact of certain stock-based compensation. Examples of discrete tax items include, but are not limited to, certain changes in judgment and changes in estimates of tax matters related to prior fiscal years, certain costs related to business combinations, certain changes in the realizability of deferred tax assets or changes in tax law. Management believes this approach assists investors in understanding the tax provision and the effective tax rate related to ongoing operations. We believe the exclusion of these discrete tax items provides investors with useful supplemental information about the Company's operational performance.
Income tax effects on the difference between GAAP and non-GAAP costs and expenses.
The income tax effects that are excluded from the non-GAAP measures relate to the tax impact on the difference between GAAP and non-GAAP expenses, primarily due to stock-based compensation, amortization of purchased intangibles and restructuring charges (benefits) for GAAP and non-GAAP measures.
Liquidity and Capital Resources
Our primary source of cash is from the sale of licenses to our products. Our primary use of cash is payment of our operating costs which consist primarily of employee-related expenses, such as compensation and benefits, as well as general operating expenses for marketing, facilities and overhead costs. In addition to operating expenses, we also use cash to fund our
2014 Form 10-K 52
stock repurchase program and invest in our growth initiatives, which include acquisitions of products, technology and businesses. See further discussion of these items below.
At
January 31, 2014
, our principal sources of liquidity were cash, cash equivalents and marketable securities totaling $
2,544.4 million
and net accounts receivable of $
423.7 million
.
In fiscal 2013, we issued $
400.0 million
aggregate principal amount of
1.95%
senior notes due
December 15, 2017
and $
350.0 million
aggregate principal amount of
3.6%
senior notes due
December 15, 2022
, (collectively, the "Senior Notes"). As of
March 10, 2014
, we have $
750.0 million
aggregate principal amount of Senior Notes outstanding. In addition, we have a line of credit facility that permits unsecured short-term borrowings of up to $
400.0 million
. As of
March 10, 2014
,
we have no amounts outstanding under the credit facility. We amended and restated the credit facility in May 2013. The amended and restated credit facility expires in May 2018. Borrowings under the credit facility and the net proceeds from the offering of the Senior Notes are available for general corporate purposes.
Our cash and cash equivalents are held by diversified financial institutions globally. Our primary commercial banking relationship is with Citigroup and its global affiliates. In addition, Citibank N.A., an affiliate of Citigroup, is one of the lead lenders and agent in the syndicate of our $
400.0 million
line of credit.
The increase in our cash, cash equivalents and marketable securities to $
2,544.4 million
at
January 31, 2014
from $
2,365.4 million
at
January 31, 2013
is due to cash generated by operating activities, and proceeds from the issuance of common stock following stock option exercises and employee stock plan purchases. These increases to cash, cash equivalents and marketable securities are partially offset by cash used for repurchases of common stock, acquisitions including business combination and technology purchases, capital expenditures, and other investing activities. The cash proceeds from issuance of common stock varies based on our stock price, stock option exercise activity and the volume of employee purchases under the Employee Stock Purchase Plan (“ESP Plan”).
The primary source for net cash provided by operating activities of $
563.5 million
for fiscal
2014
was net income of $
228.8 million
increased by the effect of non-cash expenses totaling $
261.1 million
associated with depreciation, amortization, accretion and stock-based compensation. In addition, net cash flow provided by changes in operating assets and liabilities was $
86.0 million
. The primary source of working capital was a decrease in accounts receivable and an increase in deferred revenue for fiscal
2014
compared to fiscal
2013
. Our days sales outstanding in trade receivables was
66
at
January 31, 2014
compared to
74
at
January 31, 2013
. The days sales outstanding decrease relates primarily to improved billings linearity and strong cash collections resulting in a lower accounts receivable balance compared to the prior year. The primary working capital uses of cash were an increase in deferred income taxes.
At
January 31, 2014
, our short-term investment portfolio had an estimated fair value of $
414.1 million
and a cost basis of $
410.8 million
. The portfolio fair value consisted of $
261.0 million
invested in commercial paper and corporate securities, $
42.7 million
invested in agency bonds, $
38.9 million
invested in mutual funds, $
37.1 million
invested in time deposits with remaining maturities at the date of purchase greater than 90 days and less than one year, $
11.7 million
invested in municipal securities, $
11.4 million
invested in other short-term securities, and $
11.3 million
invested in U.S. government agency securities.
At
January 31, 2014
, $
38.9 million
of trading securities were invested in a defined set of mutual funds as directed by the participants in our Deferred Compensation Plan (see Note
6
, “
Deferred Compensation
,” in the Notes to Consolidated Financial Statements for further discussion).
Long-term cash requirements for items other than normal operating expenses are anticipated for the following: common stock repurchases; the acquisition of businesses, software products, or technologies complementary to our business; and capital expenditures, including the purchase and implementation of internal-use software applications.
Our strategy includes improving our product functionality and expanding our product offerings through internal development as well as through the acquisition of products, technology and businesses. Acquisitions often increase the speed at which we can deliver product functionality to our customers; however, they entail cost and integration challenges and, in certain instances, negatively impact our operating margins. We continually review these trade-offs in making decisions regarding acquisitions. We currently anticipate that we will continue to acquire products, technology and businesses as compelling opportunities become available. Our decision to acquire businesses or technology is dependent on our business needs, the availability of suitable sellers and technology, and our own financial condition.
2014 Form 10-K 53
On November 7, 2013, we entered into a definitive agreement with the shareholders of Delcam plc (“Delcam”) to acquire the entire issued and to be issued share capital for £
20.75
per share, or approximately £
174.6 million
or $
284.6 million
. The transaction closed on February 6, 2014. Other than the Delcam acquisition, as of Ja
nuary 31, 2014, there have been no material changes in our contractual obligations or commercial commitments compared to those disclosed in Management’s Discussion and Analysis of Financial Condition.
Our cash, cash equivalent and marketable securities balances are concentrated in a few locations around the world, with substantial amounts held outside of the U.S. As of
January 31, 2014
, approximately
75%
of our total cash, cash equivalents and marketable securities are located offshore and will fluctuate subject to business needs. Certain amounts held outside the U.S. could be repatriated to the U.S. (subject to local law restrictions), but under current U.S. tax law, could be subject to U.S. income taxes less applicable foreign tax credits. We have provided for the U.S. income tax liability on foreign earnings, except for foreign earnings that are considered permanently reinvested outside the U.S. Our intent is that amounts related to foreign earnings permanently reinvested outside the U.S. will remain outside the U.S. and we will meet our U.S. liquidity needs through ongoing cash flows, external borrowings, or both. We regularly review our capital structure and consider a variety of potential financing alternatives and planning strategies to ensure we have the proper liquidity available in the locations in which it is needed and to fund our existing stock buy-back program with cash that has not been permanently reinvested outside the U.S.
Cash from operations could also be affected by various risks and uncertainties, including, but not limited to the risks detailed in Part I,
Item 1A
titled “
Risk Factors
.” However, based on our current business plan and revenue prospects, we believe that our existing balances, our anticipated cash flows from operations and our available credit facility will be sufficient to meet our working capital and operating resource expenditure requirements for at least the next 12 months.
Our revenue, earnings, cash flows, receivables and payables are subject to fluctuations due to changes in foreign currency exchange rates, for which we have put in place foreign currency contracts as part of our risk management strategy. See Part II, Item 7A, “Quantitative and Qualitative Disclosures about Market Risk” for further discussion.
Contractual Obligations
The following table summarizes our significant financial contractual obligations at
January 31, 2014
and the effect such obligations are expected to have on our liquidity and cash flows in future periods.
|
Total
|
Fiscal 2015
|
Fiscal Years 2016-2017
|
Fiscal Years 2018-2019
|
Thereafter
|
|||||||||||||||
|
|
|
|
(in millions)
|
|
|
||||||||||||||
|
Notes
|
$
|
892.0
|
|
$
|
20.4
|
|
$
|
40.8
|
|
$
|
432.0
|
|
$
|
398.8
|
|
||||
|
Operating lease obligations
|
239.9
|
|
53.1
|
|
86.5
|
|
61.8
|
|
38.5
|
|
|||||||||
|
Purchase obligations
|
65.3
|
|
48.9
|
|
16.4
|
|
—
|
|
—
|
|
|||||||||
|
Deferred compensation obligations
|
38.9
|
|
4.5
|
|
7.9
|
|
4.5
|
|
22.0
|
|
|||||||||
|
Pension obligations
|
21.2
|
|
2.6
|
|
4.5
|
|
4.3
|
|
9.8
|
|
|||||||||
|
Other obligations (1)
|
10.1
|
|
5.6
|
|
0.5
|
|
2.6
|
|
1.4
|
|
|||||||||
|
Total (2)
|
$
|
1,267.4
|
|
$
|
135.1
|
|
|
$
|
156.6
|
|
|
$
|
505.2
|
|
|
$
|
470.5
|
|
|
____________________
|
(1)
|
Other obligations include asset retirement obligations.
|
|
(2)
|
This table generally excludes amounts already recorded on the balance sheet as current liabilities, certain purchase obligations as discussed below, long term deferred revenue and amounts related to income tax liabilities for uncertain tax positions, since we cannot predict with reasonable reliability the timing of cash settlements to the respective taxing authorities (see Note
4
, “
Income Taxes
” to the Notes to Consolidated Financial Statements).
|
Notes consist of the Senior Notes issued in December 2012. The Senior Notes consist of of $
400.0 million
aggregate principal amount of
1.95%
senior notes due
December 15, 2017
notes and $
350.0 million
aggregate principal amount of
3.6%
senior notes due
December 15, 2022
.
Operating lease obligations consist primarily of obligations for facilities, net of sublease income, computer equipment and other equipment leases.
2014 Form 10-K 54
Purchase obligations are contractual obligations for purchase of goods or services and are defined as agreements that are enforceable and legally binding on Autodesk and that specify all significant terms, including: fixed or minimum quantities to be purchased; fixed, minimum or variable price provisions; and the approximate timing of the transaction. Purchase obligations relate primarily to IT infrastructure costs, hosting services agreements, and marketing costs.
Deferred compensation obligations relate to amounts held in a rabbi trust under our non-qualified deferred compensation plan. See Note
6
, “
Deferred Compensation
,” in our Notes to Consolidated Financial Statements for further information regarding this plan.
Pension obligations relate to our obligations for pension plans outside of the U.S. See Note
14
, “
Retirement Benefit Plans
,” in our Notes to Consolidated Financial Statements for further information regarding these obligations.
Purchase orders or contracts for the purchase of supplies and other goods and services are not included in the table above. We are not able to determine the aggregate amount of such purchase orders that represent contractual obligations, as purchase orders may represent authorizations to purchase rather than binding agreements. Our purchase orders are based on our current procurement or development needs and are fulfilled by our vendors within short time horizons. We do not have significant agreements for the purchase of supplies or other goods specifying minimum quantities or set prices that exceed our expected requirements for three months. In addition, we have certain software royalty commitments associated with the shipment and licensing of certain products.
The expected timing of payment of the obligations discussed above is estimated based on current information. Timing of payments and actual amounts paid may be different depending on the time of receipt of goods or services or changes to agreed-upon amounts for some obligations.
We provide indemnifications of varying scopes and certain guarantees, including limited product warranties. Historically, costs related to these warranties and indemnifications have not been significant, but because potential future costs are highly variable, we are unable to estimate the maximum potential impact of these guarantees on our future results of operations.
Issuer Purchases of Equity Securities
Autodesk's stock repurchase program is largely to help offset the dilution from the issuance of stock under our employee stock plans and for such other purposes as may be in the interests of Autodesk and its stockholders, and has the effect of returning excess cash generated from our business to stockholders. The number of shares acquired and the timing of the purchases are based on several factors, including general market conditions, the volume of employee stock option exercises, stock issuance, the trading price of our common stock, cash on hand and available in the U.S., and company defined trading windows. During the three and twelve months ended
January 31, 2014
, we repurchased
2.2 million
and
10.5 million
shares of our common stock, respectively. At
January 31, 2014
,
21.8 million
shares remained available for repurchase under our current repurchase program approved by the Board of Directors. This program does not have a fixed expiration date. See Note
9
, “
Stockholders' Equity
,” in the Notes to Consolidated Financial Statements for further discussion.
Off-Balance Sheet Arrangements
As of
January 31, 2014
, we did not have any significant off-balance sheet arrangements other than operating leases, as defined in Item 303(a)(4)(ii) of Regulation S-K.
|
ITEM 7A.
|
QUANTITATIVE AND QUALITATIVE DISCLOSURES ABOUT MARKET RISK
|
Foreign currency exchange risk
Our revenue, earnings, cash flows, receivables and payables are subject to fluctuations due to changes in foreign currency exchange rates. Our risk management strategy utilizes foreign currency contracts to manage our exposure to foreign currency volatility that exists as part of our ongoing business operations. We utilize cash flow hedge contracts to reduce the exchange rate impact on a portion of the net revenue or operating expense of certain anticipated transactions. In addition, we use balance sheet hedge contracts to reduce the exchange rate risk associated primarily with foreign currency denominated receivables and payables. As of
January 31, 2014
and
2013
, we had open cash flow and balance sheet hedge contracts with future settlements within one to twelve months. Contracts were primarily denominated in euros, Japanese yen, Swiss francs, British pounds, Canadian dollars and Australian dollars. We do not enter into any foreign exchange derivative instruments for trading or
2014 Form 10-K 55
speculative purposes. The notional amount of our option and forward contracts was $
557.2 million
and $
438.2 million
at
January 31, 2014
and
2013
, respectively.
We use foreign currency contracts to reduce the exchange rate impact on the net revenue and operating expenses of certain anticipated transactions. A sensitivity analysis performed on our hedging portfolio as of
January 31, 2014
indicated that a hypothetical 10% appreciation of the U.S. dollar from its value at
January 31, 2014
and
2013
would increase the fair value of our foreign currency contracts by $
7.9 million
and $
29.6 million
, respectively. A hypothetical 10% depreciation of the dollar from its value at
January 31, 2014
and
2013
would increase the fair value of our foreign currency contracts by $
3.7 million
and $
33.1 million
, respectively.
Interest rate risk
Interest rate movements affect both the interest income we earn on our short term investments and the market value of certain longer term securities. At
January 31, 2014
, we had $
1,517.4 million
of cash equivalents and marketable securities, including $
414.1 million
classified as short-term marketable securities and $
277.3 million
classified as long-term marketable securities. If interest rates were to move up or down by 50 and 100 basis points over a twelve month period, the market value change of our marketable securities would have an unrealized gain or loss of $
3.2 million
and $
6.4 million
, respectively.
Other Market Risk
From time to time we make direct investments in privately held companies. The privately held companies in which we invest are considered inherently risky. The technologies and products these companies have under development are typically in the early stages and may never materialize, which could result in a loss of all or a substantial part of our initial investment in these companies. The evaluation of privately held companies is based on information that we request from these companies, which is not subject to the same disclosure regulations as U.S. publicly traded companies, and as such, the basis for these evaluations is subject to the timing and accuracy of the data received from these companies.
2014 Form 10-K 56
|
ITEM 8.
|
FINANCIAL STATEMENTS AND SUPPLEMENTARY DATA
|
AUTODESK, INC.
(In millions, except per share data)
|
|
Fiscal year ended January 31,
|
||||||||||
|
2014
|
2013
|
2012
|
|||||||||
|
Net revenue:
|
|||||||||||
|
License and other
|
$
|
1,254.9
|
|
$
|
1,364.1
|
|
$
|
1,334.4
|
|
||
|
Subscription
|
1,019.0
|
|
948.1
|
|
881.2
|
|
|||||
|
Total net revenue
|
2,273.9
|
|
2,312.2
|
|
2,215.6
|
|
|||||
|
Cost of revenue:
|
|||||||||||
|
Cost of license and other revenue
|
178.7
|
|
166.0
|
|
166.6
|
|
|||||
|
Cost of subscription revenue
|
95.6
|
|
72.5
|
|
62.5
|
|
|||||
|
Total cost of revenue
|
274.3
|
|
238.5
|
|
229.1
|
|
|||||
|
Gross profit
|
1,999.6
|
|
2,073.7
|
|
1,986.5
|
|
|||||
|
Operating expenses:
|
|||||||||||
|
Marketing and sales
|
842.6
|
|
875.5
|
|
842.6
|
|
|||||
|
Research and development
|
611.1
|
|
600.0
|
|
566.5
|
|
|||||
|
General and administrative
|
248.3
|
|
248.4
|
|
223.1
|
|
|||||
|
Restructuring charges (benefits), net
|
12.8
|
|
43.9
|
|
(1.3
|
)
|
|||||
|
Total operating expenses
|
1,714.8
|
|
1,767.8
|
|
1,630.9
|
|
|||||
|
Income from operations
|
284.8
|
|
305.9
|
|
355.6
|
|
|||||
|
Interest and other (expense) income, net
|
(4.9
|
)
|
4.1
|
|
7.3
|
|
|||||
|
Income before income taxes
|
279.9
|
|
310.0
|
|
362.9
|
|
|||||
|
Provision for income taxes
|
(51.1
|
)
|
(62.6
|
)
|
(77.6
|
)
|
|||||
|
Net income
|
$
|
228.8
|
|
$
|
247.4
|
|
$
|
285.3
|
|
||
|
Basic net income per share
|
$
|
1.02
|
|
$
|
1.09
|
|
$
|
1.25
|
|
||
|
Diluted net income per share
|
$
|
1.00
|
|
$
|
1.07
|
|
$
|
1.22
|
|
||
|
Weighted average shares used in computing basic net income per share
|
224.0
|
|
226.4
|
|
227.7
|
|
|||||
|
Weighted average shares used in computing diluted net income per share
|
229.6
|
|
231.7
|
|
233.3
|
|
|||||
See accompanying Notes to Consolidated Financial Statements.
2014 Form 10-K 57
AUTODESK, INC.
CONSOLIDATED STATEMENTS OF COMPREHENSIVE INCOME
(In millions)
|
Fiscal year ended January 31,
|
|||||||||||
|
2014
|
2013
|
2012
|
|||||||||
|
Net income
|
$
|
228.8
|
|
$
|
247.4
|
|
$
|
285.3
|
|
||
|
Other comprehensive income (loss), net of reclassifications:
|
|||||||||||
|
Net gain (loss) on derivative instruments (net of tax effect of $1.1, ($0.5) and $1.0)
|
0.7
|
|
(6.4
|
)
|
10.0
|
|
|||||
|
Change in net unrealized (loss) gain on available-for-sale securities (net of tax effect of $0.3, ($0.6) and $0.0)
|
(1.1
|
)
|
2.0
|
|
0.2
|
|
|||||
|
Change in defined benefit pension items (net of tax effect of $0.6, $0.4 and $0.0)
|
5.4
|
|
(6.1
|
)
|
1.2
|
|
|||||
|
Net change in cumulative foreign currency translation gain (loss) (net of tax effect of $2.1, $2.1 and
($4.4))
|
0.1
|
|
(1.1
|
)
|
(4.9
|
)
|
|||||
|
Total other comprehensive income (loss)
|
5.1
|
|
(11.6
|
)
|
6.5
|
|
|||||
|
Total comprehensive income
|
$
|
233.9
|
|
$
|
235.8
|
|
$
|
291.8
|
|
||
See accompanying Notes to Consolidated Financial Statements.
2014 Form 10-K 58
AUTODESK, INC.
(In millions, except per share data)
|
January 31,
2014 |
January 31,
2013 |
||||||
|
ASSETS
|
|||||||
|
Current assets:
|
|||||||
|
Cash and cash equivalents
|
$
|
1,853.0
|
|
$
|
1,612.2
|
|
|
|
Marketable securities
|
414.1
|
|
342.1
|
|
|||
|
Accounts receivable, net
|
423.7
|
|
495.1
|
|
|||
|
Deferred income taxes
|
56.8
|
|
42.2
|
|
|||
|
Prepaid expenses and other current assets
|
87.4
|
|
60.8
|
|
|||
|
Total current assets
|
2,835.0
|
|
2,552.4
|
|
|||
|
Marketable securities
|
277.3
|
|
411.1
|
|
|||
|
Computer equipment, software, furniture and leasehold improvements, net
|
130.3
|
|
114.9
|
|
|||
|
Purchased technologies, net
|
63.1
|
|
76.0
|
|
|||
|
Goodwill
|
1,009.9
|
|
871.5
|
|
|||
|
Deferred income taxes, net
|
131.1
|
|
122.8
|
|
|||
|
Other assets
|
148.3
|
|
159.7
|
|
|||
|
Total Assets
|
$
|
4,595.0
|
|
$
|
4,308.4
|
|
|
|
LIABILITIES AND STOCKHOLDERS’ EQUITY
|
|||||||
|
Current liabilities:
|
|||||||
|
Accounts payable
|
$
|
84.5
|
|
$
|
94.2
|
|
|
|
Accrued compensation
|
181.2
|
|
189.6
|
|
|||
|
Accrued income taxes
|
24.3
|
|
13.9
|
|
|||
|
Deferred revenue
|
696.2
|
|
647.0
|
|
|||
|
Other accrued liabilities
|
85.3
|
|
99.0
|
|
|||
|
Total current liabilities
|
1,071.5
|
|
1,043.7
|
|
|||
|
Deferred revenue
|
204.4
|
|
187.6
|
|
|||
|
Long term income taxes payable
|
211.8
|
|
194.2
|
|
|||
|
Long term notes payable, net of discount
|
746.4
|
|
745.6
|
|
|||
|
Other liabilities
|
99.4
|
|
94.1
|
|
|||
|
Commitments and contingencies
|
|
|
|||||
|
Stockholders’ equity:
|
|
|
|||||
|
Preferred stock, $0.01 par value; shares authorized 2.0; none issued or outstanding at January 31, 2014 and 2013
|
—
|
|
—
|
|
|||
|
Common stock and additional paid-in capital, $0.01 par value; shares authorized 750.0; 226.7 outstanding at January 31, 2014 and 223.6 outstanding at January 31, 2013
|
1,637.3
|
|
1,449.8
|
|
|||
|
Accumulated other comprehensive (loss)
|
(0.6
|
)
|
(5.7
|
)
|
|||
|
Retained earnings
|
624.8
|
|
599.1
|
|
|||
|
Total stockholders’ equity
|
2,261.5
|
|
2,043.2
|
|
|||
|
Total liabities and stockholders' equity
|
$
|
4,595.0
|
|
$
|
4,308.4
|
|
|
See accompanying Notes to Consolidated Financial Statements.
2014 Form 10-K 59
AUTODESK, INC.
(In millions)
|
|
Fiscal year ended January 31,
|
||||||||||
|
|
2014
|
2013
|
2012
|
||||||||
|
Operating Activities
|
|||||||||||
|
Net income
|
$
|
228.8
|
|
$
|
247.4
|
|
$
|
285.3
|
|
||
|
Adjustments to reconcile net income to net cash provided by operating activities:
|
|||||||||||
|
Depreciation, amortization and accretion
|
128.9
|
|
127.8
|
|
115.5
|
|
|||||
|
Stock-based compensation expense
|
132.2
|
|
156.3
|
|
108.8
|
|
|||||
|
Excess tax benefits from stock-based compensation
|
(9.1
|
)
|
(12.9
|
)
|
(31.5
|
)
|
|||||
|
Restructuring charges (benefits), net
|
12.8
|
|
43.9
|
|
(1.3
|
)
|
|||||
|
Other operating activities
|
(16.1
|
)
|
6.7
|
|
(0.3
|
)
|
|||||
|
Changes in operating assets and liabilities, net of business combinations:
|
|||||||||||
|
Accounts receivable
|
72.3
|
|
(98.1
|
)
|
(71.8
|
)
|
|||||
|
Deferred income taxes
|
(49.4
|
)
|
(28.3
|
)
|
(33.8
|
)
|
|||||
|
Prepaid expenses and other current assets
|
(20.3
|
)
|
0.1
|
|
17.7
|
|
|||||
|
Accounts payable and accrued liabilities
|
(19.6
|
)
|
(28.3
|
)
|
2.9
|
|
|||||
|
Deferred revenue
|
66.0
|
|
113.3
|
|
129.6
|
|
|||||
|
Accrued income taxes
|
37.0
|
|
31.2
|
|
52.4
|
|
|||||
|
Net cash provided by operating activities
|
563.5
|
|
559.1
|
|
573.5
|
|
|||||
|
Investing Activities
|
|||||||||||
|
Purchases of marketable securities
|
(1,214.2
|
)
|
(1,397.7
|
)
|
(614.2
|
)
|
|||||
|
Sales of marketable securities
|
537.0
|
|
332.9
|
|
149.5
|
|
|||||
|
Maturities of marketable securities
|
742.1
|
|
764.8
|
|
409.6
|
|
|||||
|
Acquisitions, net of cash acquired
|
(176.1
|
)
|
(263.7
|
)
|
(221.7
|
)
|
|||||
|
Capital expenditures
|
(64.2
|
)
|
(56.4
|
)
|
(63.0
|
)
|
|||||
|
Other investing activities
|
(18.6
|
)
|
(27.1
|
)
|
(30.5
|
)
|
|||||
|
Net cash used in investing activities
|
(194.0
|
)
|
(647.2
|
)
|
(370.3
|
)
|
|||||
|
Financing Activities
|
|||||||||||
|
Proceeds from issuance of common stock, net of issuance costs
|
288.2
|
|
220.2
|
|
176.1
|
|
|||||
|
Repurchase and retirement of common shares
|
(423.8
|
)
|
(431.2
|
)
|
(327.4
|
)
|
|||||
|
Draws on line of credit
|
—
|
|
110.0
|
|
—
|
|
|||||
|
Proceeds from debt, net of discount
|
—
|
|
745.6
|
|
—
|
|
|||||
|
Repayments of line of credit
|
—
|
|
(110.0
|
)
|
—
|
|
|||||
|
Excess tax benefits from stock-based compensation
|
9.1
|
|
12.9
|
|
31.5
|
|
|||||
|
Other financing activities
|
—
|
|
(6.1
|
)
|
—
|
|
|||||
|
Net cash (used in) provided by financing activities
|
(126.5
|
)
|
541.4
|
|
(119.8
|
)
|
|||||
|
Effect of exchange rate changes on cash and cash equivalents
|
(2.2
|
)
|
2.0
|
|
(1.6
|
)
|
|||||
|
Net increase in cash and cash equivalents
|
240.8
|
|
455.3
|
|
81.8
|
|
|||||
|
Cash and cash equivalents at beginning of fiscal year
|
1,612.2
|
|
1,156.9
|
|
1,075.1
|
|
|||||
|
Cash and cash equivalents at end of fiscal year
|
$
|
1,853.0
|
|
$
|
1,612.2
|
|
$
|
1,156.9
|
|
||
|
Supplemental cash flow information:
|
|||||||||||
|
Cash paid during the year for interest
|
$
|
20.5
|
|
$
|
0.4
|
|
$
|
—
|
|
||
|
Net cash paid during the year for income taxes
|
$
|
75.7
|
|
$
|
59.7
|
|
$
|
63.0
|
|
||
See accompanying Notes to Consolidated Financial Statements.
2014 Form 10-K 60
AUTODESK, INC.
CONSOLIDATED STATEMENTS OF STOCKHOLDERS’ EQUITY
(In millions)
|
|
Common stock
and additional
paid-in capital
|
Accumulated
other
comprehensive
(loss) income
|
Retained
earnings
|
Total
stockholders'
equity
|
||||||||||||||
|
Shares
|
Amount
|
|||||||||||||||||
|
Balances, January 31, 2011
|
227.0
|
|
$
|
1,267.2
|
|
$
|
(0.6
|
)
|
$
|
342.7
|
|
$
|
1,609.3
|
|
||||
|
Common shares issued under stock plans
|
8.6
|
|
176.1
|
|
—
|
|
—
|
|
176.1
|
|
||||||||
|
Stock-based compensation expense
|
—
|
|
108.8
|
|
—
|
|
—
|
|
108.8
|
|
||||||||
|
Tax benefits from employee stock plans
|
—
|
|
24.3
|
|
—
|
|
—
|
|
24.3
|
|
||||||||
|
Net income
|
—
|
|
—
|
|
—
|
|
285.3
|
|
285.3
|
|
||||||||
|
Other comprehensive income
|
—
|
|
—
|
|
6.5
|
|
—
|
|
6.5
|
|
||||||||
|
Repurchase and retirement of common shares
|
(9.7
|
)
|
(211.0
|
)
|
—
|
|
(116.4
|
)
|
(327.4
|
)
|
||||||||
|
Balances, January 31, 2012
|
225.9
|
|
1,365.4
|
|
5.9
|
|
511.6
|
|
1,882.9
|
|
||||||||
|
Common shares issued under stock plans
|
10.2
|
|
220.2
|
|
—
|
|
—
|
|
220.2
|
|
||||||||
|
Stock-based compensation expense
|
—
|
|
139.8
|
|
—
|
|
—
|
|
139.8
|
|
||||||||
|
Tax benefits from employee stock plans
|
—
|
|
(4.3
|
)
|
—
|
|
—
|
|
(4.3
|
)
|
||||||||
|
Net income
|
—
|
|
—
|
|
—
|
|
247.4
|
|
247.4
|
|
||||||||
|
Other comprehensive (loss)
|
—
|
|
—
|
|
(11.6
|
)
|
|
|
(11.6
|
)
|
||||||||
|
Repurchase and retirement of common shares
|
(12.5
|
)
|
(271.3
|
)
|
—
|
|
(159.9
|
)
|
(431.2
|
)
|
||||||||
|
Balances, January 31, 2013
|
223.6
|
|
1,449.8
|
|
(5.7
|
)
|
599.1
|
|
2,043.2
|
|
||||||||
|
Common shares issued under stock plans
|
13.6
|
|
288.2
|
|
—
|
|
—
|
|
288.2
|
|
||||||||
|
Stock-based compensation expense
|
—
|
|
132.2
|
|
—
|
|
—
|
|
132.2
|
|
||||||||
|
Tax benefits from employee stock plans
|
—
|
|
(12.2
|
)
|
—
|
|
—
|
|
(12.2
|
)
|
||||||||
|
Net income
|
—
|
|
—
|
|
—
|
|
228.8
|
|
228.8
|
|
||||||||
|
Other comprehensive income
|
—
|
|
—
|
|
5.1
|
|
—
|
|
5.1
|
|
||||||||
|
Repurchase and retirement of common shares
|
(10.5
|
)
|
(220.7
|
)
|
—
|
|
(203.1
|
)
|
(423.8
|
)
|
||||||||
|
Balances, January 31, 2014
|
226.7
|
|
$
|
1,637.3
|
|
$
|
(0.6
|
)
|
$
|
624.8
|
|
$
|
2,261.5
|
|
||||
See accompanying Notes to Consolidated Financial Statements.
2014 Form 10-K 61
AUTODESK, INC.
NOTES TO CONSOLIDATED FINANCIAL STATEMENTS
January 31, 2014
(Tables in millions of dollars, except per share data, unless otherwise indicated)
1
.
Business and Summary of Significant Accounting Policies
Business
Autodesk, Inc. (“Autodesk” or the “Company”) is a world leading design software and services company, offering customers productive business solutions through powerful technology products and services. The Company serves customers in the architecture, engineering and construction; manufacturing; and digital media, consumer and entertainment industries. The Company’s sophisticated software products enable its customers to experience their ideas before they are real by allowing them to imagine, design, and create their ideas and to visualize, simulate and analyze real-world performance early in the design process by creating digital prototypes. These capabilities allow Autodesk’s customers to foster innovation, optimize and improve their designs, help save time and money, improve quality, and collaborate with others. Autodesk software products are sold globally, both directly to customers and through a network of resellers and distributors.
Principles of Consolidation
The accompanying consolidated financial statements include the accounts of Autodesk and its wholly-owned subsidiaries. All significant intercompany accounts and transactions have been eliminated.
Reclassifications
During the first quarter of fiscal 2014, Autodesk combined maintenance revenue and cloud services offering-related revenue into one category named “Subscription.” As a result, revenue and cost of revenue related to cloud service offerings previously reflected in “License and other revenue” and “Cost of license and other revenue” were reclassified to “Subscription revenue” and “Cost of subscription revenue.” These revenues and expenses have been reclassified in the Consolidated Statements of Operations for fiscal years
2013
and
2012
to conform to the current period presentation as follows:
|
Fiscal year ended January 31,
|
||||||||
|
2013
|
2012
|
|||||||
|
Reclassifications within revenue:
|
||||||||
|
Decrease to License and other revenue
|
$
|
(26.5
|
)
|
$
|
(23.2
|
)
|
||
|
Increase to Subscription revenue
|
26.5
|
|
23.2
|
|
||||
|
Reclassifications within cost of revenue:
|
||||||||
|
Decrease to Cost of license and other revenue
|
$
|
(32.1
|
)
|
$
|
(20.5
|
)
|
||
|
Increase to Cost of subscription revenue
|
32.1
|
|
20.5
|
|
||||
Use of Estimates
The preparation of financial statements in conformity with generally accepted accounting principles requires management to make estimates and assumptions that affect the amounts reported in Autodesk’s consolidated financial statements and notes thereto. These estimates are based on information available as of the date of the consolidated financial statements. On a regular basis, management evaluates these estimates and assumptions. Actual results may differ materially from these estimates.
Examples of significant estimates and assumptions made by management involve the determination of the fair value of acquired assets and liabilities, goodwill, financial instruments, long-lived assets and other intangible assets, the realizability of deferred tax assets and the fair value of stock awards (see “Stock-based Compensation Expense” within this Note
1
and Note
3
“
Employee and Director Stock Plans
” for further discussion). The Company also makes assumptions, judgments and estimates in determining the accruals for uncertain tax positions, variable compensation, partner incentive programs, product returns reserves, allowances for doubtful accounts, asset retirement obligations and legal contingencies.
2014 Form 10-K 62
Foreign Currency Translation and Transactions
The assets and liabilities of Autodesk’s foreign subsidiaries are translated from their respective functional currencies into U.S. dollars at the rates in effect at the balance sheet date, and revenue and expense amounts are translated at exchange rates that approximate those rates in effect during the period in which the underlying transactions occur. Foreign currency translation adjustments are recorded as other comprehensive income (loss).
Gains and losses realized from foreign currency transactions, those transactions denominated in currencies other than the foreign subsidiary’s functional currency, are included in interest and other income, net. Monetary assets and liabilities are remeasured using foreign currency exchange rates at the end of the period, and non-monetary assets are remeasured based on historical exchange rates.
Derivative Financial Instruments
Under its risk management strategy, Autodesk uses derivative instruments to manage its short-term exposures to fluctuations in foreign currency exchange rates which exist as part of ongoing business operations. Autodesk’s general practice is to hedge a majority of transaction exposures denominated in euros, Japanese yen, Swiss francs, British pounds, Canadian dollars, and Australian dollars. These instruments have maturities between one to 12 months in the future. Autodesk does not enter into any derivative instruments for trading or speculative purposes.
The bank counterparties in all contracts expose Autodesk to credit-related losses in the event of their nonperformance. However, to mitigate that risk, Autodesk only contracts with counterparties who meet the Company’s minimum requirements under its counterparty risk assessment process. Autodesk monitors ratings, credit spreads and potential downgrades on at least a quarterly basis. Based on Autodesk’s on-going assessment of counterparty risk, the Company will adjust its exposure to various counterparties. Autodesk generally enters into master netting arrangements, which reduce credit risk by permitting net settlement of transactions with the same counterparty. However, Autodesk does not have any master netting arrangements in place with collateral features.
Autodesk accounts for its derivative instruments as either assets or liabilities on the balance sheet and carries them at fair value. Gains and losses resulting from changes in fair value are accounted for depending on the use of the derivative and whether it is designated and qualifies for hedge accounting. Derivatives that do not qualify for hedge accounting are adjusted to fair value through earnings. See Note
2
, "
Financial Instruments
" for information regarding Autodesk's hedging activities.
Cash and Cash Equivalents
Autodesk considers all highly liquid investments with insignificant interest rate risk and remaining maturities of three months or less at the date of purchase to be cash equivalents. Cash equivalents are recorded at cost, which approximates fair value.
Marketable Securities
Marketable securities are stated at fair value. Marketable securities maturing within one year that are not restricted are classified as current assets.
Autodesk determines the appropriate classification of its marketable securities at the time of purchase and re-evaluates such classification as of each balance sheet date. Autodesk carries all “available-for-sale securities” at fair value, with unrealized gains and losses, net of tax, reported in stockholders’ equity until disposition or maturity. Autodesk carries all “trading securities” at fair value, with unrealized gains and losses, recorded in “Interest and other income, net” in the Company’s Consolidated Statements of Operations.
All of Autodesk’s marketable securities are subject to a periodic impairment review. The Company recognizes an impairment charge when a decline in the fair value of its investments below the cost basis is judged to be other-than-temporary. Autodesk considers various factors in determining whether to recognize an impairment charge, including the length of time and extent to which the fair value has been less than Autodesk’s cost basis, the financial condition and near-term prospects of the investee, and Autodesk’s intent and ability to hold the investment for a period of time sufficient to allow for any anticipated recovery in the market value. Autodesk did not record any other-than temporary impairment charges during fiscal years ended
2014
,
2013
and
2012
. For additional information, see “Concentration of Credit Risk” within this Note
1
and Note
2
, “
Financial Instruments
.”
2014 Form 10-K 63
Accounts Receivable, Net
Accounts receivable, net, consisted of the following as of January 31:
|
2014
|
2013
|
||||||
|
Trade accounts receivable
|
$
|
464.6
|
|
$
|
531.1
|
|
|
|
Less: Allowance for doubtful accounts
|
(4.9
|
)
|
(5.6
|
)
|
|||
|
Product returns reserve
|
(4.0
|
)
|
(4.9
|
)
|
|||
|
Partner programs and other obligations
|
(32.0
|
)
|
(25.5
|
)
|
|||
|
Accounts receivable, net
|
$
|
423.7
|
|
$
|
495.1
|
|
|
Allowances for uncollectible trade receivables are based upon historical loss patterns, the number of days that billings are past due and an evaluation of the potential risk of loss associated with problem accounts.
The product returns reserves are based on historical experience of actual product returns, estimated channel inventory
levels, the timing of new product introductions, channel sell-in for applicable markets and other factors.
As part of the indirect channel model, Autodesk has a partner incentive program that uses quarterly attainment monetary rewards to motivate distributors and resellers to achieve mutually agreed upon business goals in a specified time period. A portion of these incentives reduce license and other revenue in the current period. The remainder, which relates to incentives on our Subscription Program, is recorded as a reduction to deferred revenue in the period the maintenance transaction is billed and subsequently recognized as a reduction to maintenance revenue over the contract period. These incentive balances do not require significant assumptions or judgments. The reserves associated with the partner incentive program are treated on the balance sheet as either contra account receivable (when due to distributors and direct resellers) or accounts payable (when due to indirect resellers).
Concentration of Credit Risk
Autodesk places its cash, cash equivalents and marketable securities in highly liquid instruments with, and in the custody of, diversified financial institutions globally with high credit ratings and limits the amounts invested with any one institution, type of security and issuer.
Geographical concentrations of consolidated cash, cash equivalents and marketable securities held by Autodesk as of January 31:
|
2014
|
2013
|
||||
|
United States
|
25
|
%
|
29
|
%
|
|
|
Other Americas
|
1
|
%
|
1
|
%
|
|
|
Europe, Middle East and Africa (“EMEA”)
|
57
|
%
|
38
|
%
|
|
|
Asia Pacific (“APAC”)
|
17
|
%
|
32
|
%
|
|
Autodesk’s primary commercial banking relationship is with Citigroup Inc. and its global affiliates. Citibank, N.A., an affiliate of Citigroup, is one of the lead lenders and an agent in the syndicate of Autodesk’s $
400.0 million
line of credit facility. It is Autodesk’s policy to limit the amounts invested with any one institution by type of security and issuer.
Autodesk’s accounts receivable are derived from sales to a large number of resellers, distributors and direct customers in the Americas; EMEA; and APAC geographies. Autodesk performs ongoing evaluations of these partners' financial condition and limits the amount of credit extended when deemed necessary, but generally does not require collateral from such parties. Total sales to the Company's largest distributor Tech Data Corporation, and its global affiliates (“Tech Data”), accounted for
24%
,
23%
and
21%
of Autodesk's net revenue for fiscal years ended
2014
,
2013
and
2012
, respectively. The majority of the net revenue from sales to Tech Data relates to Autodesk's Platform Solutions and Emerging Business ("PSEB") segment and is for sales made outside of the United States. In addition, Tech Data accounted for
24%
and
23%
of trade accounts receivable at
January 31, 2014
and
2013
, respectively.
2014 Form 10-K 64
Computer Equipment, Software, Furniture and Leasehold Improvements, Net
Computer equipment, software and furniture are depreciated using the straight-line method over the estimated useful lives of the assets, which range from three to five years. Leasehold improvements are amortized on a straight-line basis over the shorter of their estimated useful lives or the lease term. Depreciation expense was $
47.2 million
in fiscal
2014
, $
45.6 million
in fiscal
2013
and $
43.7 million
in fiscal
2012
.
Computer equipment, software, furniture, leasehold improvements and the related accumulated depreciation at January 31 were as follows:
|
2014
|
2013
|
||||||
|
Computer hardware, at cost
|
$
|
163.0
|
|
$
|
152.3
|
|
|
|
Computer software, at cost
|
80.9
|
|
95.1
|
|
|||
|
Leasehold improvements, land and buildings, at cost
|
163.7
|
|
152.4
|
|
|||
|
Furniture and equipment, at cost
|
51.7
|
|
46.0
|
|
|||
|
Computer software, hardware, leasehold improvements, furniture and equipment, at cost
|
459.3
|
|
445.8
|
|
|||
|
Less: Accumulated depreciation
|
(329.0
|
)
|
(330.9
|
)
|
|||
|
Computer software, hardware, leasehold improvements, furniture and equipment, net
|
$
|
130.3
|
|
$
|
114.9
|
|
|
Costs incurred for computer software developed or obtained for internal use are capitalized for application development activities, if material, and immediately expensed for preliminary project activities and post-implementation activities. These capitalized costs are amortized over the software’s expected useful life, which is generally three years. During fiscal
2014
, Autodesk wrote-off $
48.2 million
of fully depreciated assets.
Software Development Costs
Software development costs incurred prior to the establishment of technological feasibility are included in research and development expenses. Autodesk defines establishment of technological feasibility as the completion of a working model. Software development costs incurred subsequent to the establishment of technological feasibility through the period of general market availability of the products are capitalized and generally amortized over a three year period, if material. Autodesk had
no capitalized software development costs a
t
January 31, 2014
and
January 31, 2013
.
Other Intangible Assets, Net
Other intangible assets include purchased technologies, customer relationships, trade names and the related accumulated amortization. These assets are shown as “Purchased technologies, net” and as part of “Other assets” in the Consolidated Balance Sheet. The majority of Autodesk’s other intangible assets are amortized to expense over the estimated economic life of the product, which ranges from one to ten years. Amortization expense for purchased technologies, customer relationships, trade names, patents, and user lists was $
80.7 million
in fiscal
2014
, $
82.0 million
in fiscal
2013
and $
71.8 million
in fiscal
2012
.
2014 Form 10-K 65
Other intangible assets and related accumulated amortization at January 31 were as follows:
|
2014
|
2013
|
||||||
|
Purchased technologies, at cost
|
$
|
462.4
|
|
$
|
431.0
|
|
|
|
Customer relationships, trade names, patents and user lists, at cost (1)
|
268.1
|
|
259.5
|
|
|||
|
730.5
|
|
690.5
|
|
||||
|
Less: Accumulated amortization
|
(626.2
|
)
|
(546.3
|
)
|
|||
|
Other intangible assets, net
|
$
|
104.3
|
|
$
|
144.2
|
|
|
____________________
|
(1)
|
Included as a net balance in “Other assets” in the Consolidated Balance Sheet. Customer relationships and trade names include the effects of foreign currency translation.
|
The weighted average amortization period for purchased technologies, customer relationships and trade names during fiscal
2014
was
4.1
years. Expected future amortization expense for purchased technologies, customer relationships and trade names, patents and user lists for each of the fiscal years ended thereafter is as follows:
|
|
Fiscal Year ended
January 31,
|
||
|
2015
|
$
|
59.1
|
|
|
2016
|
30.8
|
|
|
|
2017
|
11.1
|
|
|
|
2018
|
1.2
|
|
|
|
2019
|
0.5
|
|
|
|
Thereafter
|
0.8
|
|
|
|
Total
|
$
|
103.5
|
|
Goodwill
Goodwill consists of the excess of cost over the fair value of net assets acquired in business combinations. Autodesk assigns goodwill to the reportable segment associated with each business combination, and tests goodwill for impairment annually in its fourth fiscal quarter or more often if circumstances indicate a potential impairment. For purposes of the goodwill impairment test, a reporting unit is an operating segment or one level below. Autodesk's operating segments are aligned with the management principles of Autodesk's business.
Accounting Standard Update No. 2011-08, "Testing Goodwill for Impairment" provides Autodesk the option to perform an assessment of qualitative factors of impairment (“optional assessment”) prior to necessitating a two-step quantitative impairment test. Should the optional assessment be utilized for any given fiscal year, qualitative factors to consider include cost factors; financial performance; legal, regulatory, contractual, political, business, or other factors; entity specific factors; industry and market considerations, macroeconomic conditions, and other relevant events and factors affecting the reporting unit. If, after assessing the totality of events or circumstances, it is more likely than not that the fair value of the reporting unit is greater than its carrying value, then performing the two-step impairment test is unnecessary.
Therefore, the two-step quantitative impairment test is necessary when either Autodesk does not utilize the optional assessment or, as a result of the optional assessment, it is not more likely than not that the fair value of the reporting unit is greater than its carrying value. In performing the two-step impairment test, Autodesk uses discounted cash flow models which include assumptions regarding projected cash flows. Variances in these assumptions could have a significant impact on Autodesk's conclusion as to whether goodwill is impaired, or the amount of any impairment charge. Impairment charges, if any, result from instances where the fair values of net assets associated with goodwill are less than their carrying values. As changes in business conditions and assumptions occur, Autodesk may be required to record impairment charges. The process of evaluating the potential impairment of goodwill is subjective and requires significant judgment at many points during the analysis. The value of Autodesk’s goodwill could also be impacted by future adverse changes such as: (i) declines in Autodesk’s actual financial results, (ii) a sustained decline in Autodesk’s market capitalization, (iii) significant slowdown in the worldwide
2014 Form 10-K 66
economy or the industries Autodesk serves, or (iv) changes in Autodesk’s business strategy or internal financial results forecasts.
For the fiscal
2014
annual goodwill impairment testing, Autodesk had four reporting units: Platform Solutions and Emerging Business (“PSEB”), Manufacturing ("MFG"), Architecture, Engineering and Construction ("AEC") and Media and Entertainment ("M&E"). For each of four reporting units, Autodesk did not utilize the optional assessment but rather performed the quantitative two-step impairment test. In performing the quantitative two-step test, Autodesk used a discounted cash flow model which included assumptions regarding projected cash flows. Based on this testing, Autodesk determined that the fair value was substantially in excess of the carrying value for each of the four reporting units and that there was no impairment of goodwill during the year ended
January 31, 2014
. In addition, Autodesk did not recognize any goodwill impairment losses in fiscal
2013
or
2012
.
The change in the carrying amount of goodwill during the year ended
January 31, 2014
is as follows:
|
Platform
Solutions and
Emerging
Business
|
Architecture,
Engineering
and
Construction
|
Manufacturing
|
Media and
Entertainment
|
Total
|
|||||||||||||||
|
Balance as of January 31, 2013
|
|||||||||||||||||||
|
Goodwill
|
$
|
129.5
|
|
$
|
310.3
|
|
$
|
389.9
|
|
$
|
191.0
|
|
$
|
1,020.7
|
|
||||
|
Accumulated impairment losses
|
—
|
|
—
|
|
—
|
|
(149.2
|
)
|
(149.2
|
)
|
|||||||||
|
129.5
|
|
310.3
|
|
389.9
|
|
41.8
|
|
871.5
|
|
||||||||||
|
Graitec SA
|
—
|
|
73.4
|
|
|
|
|
|
73.4
|
|
|||||||||
|
Goodwill acquired from other acquisitions
|
12.8
|
|
32.0
|
|
22.2
|
|
—
|
|
67.0
|
|
|||||||||
|
Effect of foreign currency translation, purchase accounting adjustments and other
|
—
|
|
(0.5
|
)
|
(0.5
|
)
|
(1.0
|
)
|
(2.0
|
)
|
|||||||||
|
Balance as of January 31, 2014
|
|||||||||||||||||||
|
Goodwill
|
142.3
|
|
415.2
|
|
411.6
|
|
190.0
|
|
1,159.1
|
|
|||||||||
|
Accumulated impairment losses
|
—
|
|
—
|
|
—
|
|
(149.2
|
)
|
(149.2
|
)
|
|||||||||
|
$
|
142.3
|
|
$
|
415.2
|
|
$
|
411.6
|
|
$
|
40.8
|
|
$
|
1,009.9
|
|
|||||
2014 Form 10-K 67
The change in the carrying amount of goodwill during the year ended
January 31, 2013
is as follows:
|
Platform
Solutions and
Emerging
Business
|
Architecture,
Engineering
and
Construction
|
Manufacturing
|
Media and
Entertainment
|
Total
|
|||||||||||||||
|
Balance as of January 31, 2012
|
|||||||||||||||||||
|
Goodwill
|
$
|
76.6
|
|
$
|
247.7
|
|
$
|
323.3
|
|
$
|
184.0
|
|
$
|
831.6
|
|
||||
|
Accumulated impairment losses
|
—
|
|
—
|
|
—
|
|
(149.2
|
)
|
(149.2
|
)
|
|||||||||
|
76.6
|
|
247.7
|
|
323.3
|
|
34.8
|
|
682.4
|
|
||||||||||
|
Vela Systems
|
—
|
|
57.6
|
|
—
|
|
—
|
|
57.6
|
|
|||||||||
|
Socialcam
|
23.0
|
|
—
|
|
—
|
|
—
|
|
23.0
|
|
|||||||||
|
Qontext
|
24.0
|
|
—
|
|
—
|
|
—
|
|
24.0
|
|
|||||||||
|
PI-VR
|
—
|
|
—
|
|
36.8
|
|
—
|
|
36.8
|
|
|||||||||
|
Goodwill acquired from other acquisitions
|
5.6
|
|
4.3
|
|
29.2
|
|
7.0
|
|
46.1
|
|
|||||||||
|
Effect of foreign currency translation, purchase accounting adjustments and other
|
0.3
|
|
0.7
|
|
0.6
|
|
—
|
|
1.6
|
|
|||||||||
|
Balance as of January 31, 2013
|
|||||||||||||||||||
|
Goodwill
|
129.5
|
|
310.3
|
|
389.9
|
|
191.0
|
|
1,020.7
|
|
|||||||||
|
Accumulated impairment losses
|
—
|
|
—
|
|
—
|
|
(149.2
|
)
|
(149.2
|
)
|
|||||||||
|
$
|
129.5
|
|
$
|
310.3
|
|
$
|
389.9
|
|
$
|
41.8
|
|
$
|
871.5
|
|
|||||
Purchase accounting adjustments reflect revisions made to the Company’s preliminary purchase price allocations during fiscal
2014
and
2013
.
Impairment of Long-Lived Assets
At least annually or more frequently as circumstances dictate, Autodesk reviews its long-lived assets for impairment whenever impairment indicators exist. Autodesk continually monitors events and changes in circumstances that could indicate the carrying amounts of its long-lived assets may not be recoverable. When such events or changes in circumstances occur, Autodesk assesses recoverability of these assets. Recoverability is measured by comparison of the carrying amounts of the assets to the future undiscounted cash flows the assets are expected to generate. If the long-lived assets are considered to be impaired, the impairment to be recognized is equal to the amount by which the carrying value of the assets exceeds its fair market value. There was no impairment of long-lived assets during the year ended
January 31, 2014
. In addition, Autodesk did not recognize any impairment of long-lived assets during the years ended
January 31, 2013
and
2012
.
In addition to the recoverability assessments, Autodesk routinely reviews the remaining estimated useful lives of its long-lived assets. Any reduction in the useful life assumption will result in increased depreciation and amortization expense in the quarter when such determinations are made, as well as in subsequent quarters.
Deferred Tax Assets
Deferred tax assets arise primarily from tax credits, net operating losses, and timing differences for reserves, accrued liabilities, stock options, purchased technologies and capitalized intangibles, partially offset by the establishment of U.S. deferred tax liabilities on unremitted earnings from certain foreign subsidiaries, deferred tax liabilities associated with tax method change on advance payments, and a valuation allowance against California and Canadian deferred tax assets. They are measured using enacted tax rates expected to apply to taxable income in the years in which those temporary differences are expected to reverse. Valuation allowances are established when necessary to reduce gross deferred tax assets to the amount “more likely than not” expected to be realized.
2014 Form 10-K 68
Revenue Recognition
Autodesk recognizes revenue when persuasive evidence of an arrangement exists, delivery has occurred or services have been rendered, the price is fixed or determinable, and collection is probable.
For multiple element arrangements containing only software and software-related elements, Autodesk allocates the sales price among each of the deliverables using the residual method, under which revenue is allocated to undelivered elements based on their vendor-specific objective evidence (“VSOE”) of fair value. VSOE is the price charged when an element is sold separately or a price set by management with the relevant authority. If Autodesk does not have VSOE of an undelivered element, revenue recognition is deferred on the entire sales arrangement until all elements for which Autodesk does not have VSOE are delivered. If Autodesk does not have VSOE for undelivered maintenance or services, the revenue for the arrangement is recognized over the longest contractual service period in the arrangement. Revenue recognition for significant lines of business is discussed further below.
For multiple elements arrangements involving non-software elements, including cloud subscription services, our revenue recognition policy is based upon the accounting guidance contained in ASC 605,
Revenue Recognition
. For these arrangements, we first allocate the total arrangement consideration based on the relative selling prices of the software group of elements as a whole and to the non-software elements. We then further allocate consideration within the software group to the respective elements within that group using the residual method as described above. Autodesk exercises judgment and uses estimates in connection with the determination of the amount of revenue to be recognized in each accounting period.
Autodesk’s assessment of likelihood of collection is also a critical element in determining the timing of revenue recognition. If collection is not probable, the revenue will be deferred until the earlier of when collection is deemed probable or cash is received.
License and other revenue are comprised of two components: (1) all forms of product license revenue and (2) other revenue.
(1) All Forms of Product License Revenue
Product license revenue includes: software license revenue from the sale of new seat licenses and upgrades and product revenue for Creative Finishing.
(2) Other Revenue
Other revenue includes revenue from consulting, training, Autodesk Developers Network and Creative Finishing customer support, and is recognized over time, as the services are performed.
Our Subscription revenue consists of two components: maintenance revenue for our software products and revenue for our cloud service offerings, including Autodesk 360. Our maintenance program provides our commercial and educational customers of perpetual products with a cost effective and predictable budgetary option to obtain the productivity benefits of our new releases and enhancements when and if released during the term of their contracts. Under our maintenance program, customers are eligible to receive unspecified upgrades when and if available, downloadable training courses and online support. We recognize maintenance revenue ratably over the term of the maintenance agreement, which is generally between one and three years but can occasionally be as long as five years. Revenue for our cloud service offerings is recognized ratably over the contract term commencing with the date our service is made available to customers and all other revenue recognition criteria have been satisfied.
Taxes Collected from Customers
Autodesk nets taxes collected from customers against those remitted to government authorities in the consolidated financial statements. Accordingly, taxes collected from customers are not reported as revenue.
Shipping and Handling Costs
Shipping and handling costs are included in cost of revenue for all periods presented.
2014 Form 10-K 69
Stock-based Compensation Expense
The following table summarizes stock-based compensation expense for fiscal
2014
,
2013
and
2012
, respectively, as follows:
|
|
Fiscal Year Ended January 31,
|
||||||||||
|
|
2014
|
2013
|
2012
|
||||||||
|
Cost of license and other revenue
|
$
|
3.8
|
|
$
|
3.7
|
|
$
|
2.7
|
|
||
|
Cost of subscription
|
2.2
|
|
1.5
|
|
1.2
|
|
|||||
|
Marketing and sales
|
58.6
|
|
64.3
|
|
48.3
|
|
|||||
|
Research and development
|
43.7
|
|
61.8
|
|
38.1
|
|
|||||
|
General and administrative
|
23.9
|
|
25.0
|
|
18.5
|
|
|||||
|
Stock-based compensation expense related to stock awards and ESP Plan purchases
|
132.2
|
|
156.3
|
|
108.8
|
|
|||||
|
Tax benefit
|
(36.4
|
)
|
(35.5
|
)
|
(27.1
|
)
|
|||||
|
Stock-based compensation expense related to stock awards and ESP Plan purchases, net
|
$
|
95.8
|
|
$
|
120.8
|
|
$
|
81.7
|
|
||
Autodesk determines the grant-date fair value of its share-based payment awards using a Black-Scholes Merton Option pricing model or the quoted stock price on the date of grant, unless the awards are subject to market conditions, in which case Autodesk uses a binomial-lattice model (e.g., Monte Carlo simulation model). The Monte Carlo simulation model utilizes multiple input variables to estimate the probability that market conditions will be achieved. Autodesk uses the following assumptions to estimate the fair value of stock-based awards:
|
Fiscal Year Ended
|
Fiscal Year Ended
|
Fiscal Year Ended
|
||||||||||
|
|
January 31, 2014
|
January 31, 2013
|
January 31, 2012
|
|||||||||
|
|
Performance Stock Unit (1)
|
ESP Plan
|
Stock Option (2)
|
ESP Plan
|
Stock Option (2)
|
ESP Plan
|
||||||
|
Range of expected volatilities
|
34%
|
27 - 36%
|
41 - 45%
|
41 - 44%
|
40 - 49%
|
34 - 44%
|
||||||
|
Range of expected lives (in years)
|
N/A
|
0.5 - 2.0
|
3.6 - 4.6
|
0.5 - 2.0
|
2.6 - 4.8
|
0.5 - 2.0
|
||||||
|
Expected dividends
|
—%
|
—%
|
—%
|
—%
|
—%
|
—%
|
||||||
|
Range of risk-free interest rates
|
0.1%
|
0.1 - 0.4%
|
0.5 - 0.8%
|
0.1 - 0.3%
|
0.5 - 1.9%
|
0.1 - 0.8%
|
||||||
|
Expected forfeitures
|
7.2 - 7.7%
|
7.2 - 7.7%
|
7.7 - 7.8%
|
7.7 - 7.8%
|
7.8 - 10.5%
|
7.8 - 10.5%
|
||||||
_______________
|
(1)
|
Autodesk did not grant PSUs in fiscal 2013 and 2012 that were subject to market conditions.
|
|
(2)
|
Autodesk did not grant stock options in fiscal 2014.
|
Autodesk estimates expected volatility for stock-based awards based on the average of the following two measures. The first is a measure of historical volatility in the trading market for the Company’s common stock, and the second is the implied volatility of traded forward call options to purchase shares of the Company’s common stock. The expected volatility for PSUs subject to market conditions includes the expected volatility of Autodesk's peer companies within the S&P Computer Software Select Index.
Autodesk estimates the expected life of stock-based awards using both exercise behavior and post-vesting termination behavior as well as consideration of outstanding options.
Autodesk did not pay cash dividends in fiscal
2014
,
2013
or
2012
and does not anticipate paying any cash dividends in the foreseeable future. Consequently, an expected dividend yield of zero is used in the Black-Scholes-Merton option pricing model and the Monte Carlo simulation model.
2014 Form 10-K 70
The risk-free interest rate used in the Black-Scholes-Merton option pricing model and the Monte Carlo simulation model for stock-based awards is the historical yield on U.S. Treasury securities with equivalent remaining lives.
Autodesk recognizes expense only for the stock-based awards that are ultimately expected to vest. Therefore, Autodesk has developed an estimate of the number of awards expected to cancel prior to vesting (“forfeiture rate”). The forfeiture rate is estimated based on historical pre-vest cancellation experience and is applied to all stock-based awards. The Company estimates forfeitures at the time of grant and revises those estimates in subsequent periods if actual forfeitures differ from those estimates.
Advertising Expenses
Advertising costs are expensed as incurred. Total advertising expenses incurred were $
15.6 million
in fiscal
2014
, $
15.6 million
in fiscal
2013
and $
21.3 million
in fiscal
2012
.
Net Income Per Share
Basic net income per share is computed based on the weighted average number of shares of common stock outstanding for the period, excluding stock options and restricted stock units. Diluted net income per share is computed based upon the weighted average shares of common shares outstanding for the period and potentially dilutive common shares, including the effect of stock options and restricted stock units under the treasury stock method.
Accounting Standards in Fiscal
2014
With the exception of those discussed below, there have been no recent changes in accounting pronouncements issued by the FASB or adopted by the Company during the fiscal year ended
January 31, 2014
, that are of significance, or potential significance, to the Company.
Accounting Standards Adopted
Effective February 1, 2013, Autodesk adopted FASB's Accounting Standards Update (“ASU”) 2013-02, Comprehensive Income (Topic 220) - Reporting of Amounts Reclassified Out of Accumulated Other Comprehensive Income. This ASU requires additional disclosure about the changes in the components of accumulated other comprehensive income, including amounts reclassified and amounts due to current period other comprehensive income. The adoption of this standard did not impact the Company's financial condition, results of operations or cash flows.
Effective February 1, 2013, Autodesk adopted FASB's ASU 2011-11 and ASU 2013-01 regarding ASC Topic 210 “Balance Sheet: Disclosure about Offsetting Assets and Liabilities.” This ASU requires that entities disclose additional information about offsetting and related arrangements to enable users of the financial statements to understand the effect of those arrangements on the financial position. The adoption of this standard did not impact the Company's financial condition, results of operations or cash flows.
Recently Issued Accounting Standards
In July 2013, the FASB issued ASU 2013-11 regarding ASC Topic 740 “Income Tax.” This ASU clarifies the guidance on the presentation of an unrecognized tax benefit, or a portion of an unrecognized tax benefit, in the financial statements as a reduction to a deferred tax asset for a net operating loss carryforward, a similar tax loss, or a tax credit carryforward. This ASU will be effective for Autodesk's fiscal year beginning February 1, 2014. Early adoption is permitted. At this time, Autodesk expects that the adoption of this ASU will impact the presentation of tax assets and liabilities on the statement of financial position, but will not impact its consolidated financial position, results of operations or cash flows.
2014 Form 10-K 71
2
.
Financial Instruments
The following tables summarizes the Company's financial instruments' amortized cost, gross unrealized gains, gross unrealized losses, and fair value by significant investment category as of January 31,
2014
and
2013
.
|
January 31, 2014
|
||||||||||||||||||||||||||||||
|
Amortized Cost
|
Gross unrealized gains
|
Gross unrealized losses
|
Fair Value
|
Level 1
|
Level 2
|
Level 3
|
||||||||||||||||||||||||
|
Cash equivalents (1):
|
||||||||||||||||||||||||||||||
|
Certificates of deposit and time deposits
|
$
|
280.7
|
|
$
|
—
|
|
$
|
—
|
|
$
|
280.7
|
|
$
|
30.4
|
|
$
|
250.3
|
|
$
|
—
|
|
|||||||||
|
Municipal securities
|
2.0
|
|
—
|
|
—
|
|
2.0
|
|
2.0
|
|
—
|
|
—
|
|
||||||||||||||||
|
Commercial paper
|
280.5
|
|
—
|
|
—
|
|
280.5
|
|
—
|
|
280.5
|
|
—
|
|
||||||||||||||||
|
Money market funds
|
262.8
|
|
—
|
|
—
|
|
262.8
|
|
—
|
|
262.8
|
|
—
|
|
||||||||||||||||
|
Marketable securities:
|
||||||||||||||||||||||||||||||
|
Short-term available for sale
|
||||||||||||||||||||||||||||||
|
Commercial paper and corporate debt securities
|
261.0
|
|
—
|
|
—
|
|
261.0
|
|
95.4
|
|
165.6
|
|
—
|
|
||||||||||||||||
|
Time deposits
|
37.1
|
|
—
|
|
—
|
|
37.1
|
|
—
|
|
37.1
|
|
—
|
|
||||||||||||||||
|
U.S. government agency securities
|
11.3
|
|
—
|
|
—
|
|
11.3
|
|
11.3
|
|
—
|
|
—
|
|
||||||||||||||||
|
Agency bond
|
42.7
|
|
—
|
|
—
|
|
42.7
|
|
42.7
|
|
—
|
|
—
|
|
||||||||||||||||
|
Municipal securities
|
11.7
|
|
—
|
|
—
|
|
11.7
|
|
11.7
|
|
—
|
|
—
|
|
||||||||||||||||
|
Other (2)
|
11.4
|
|
—
|
|
—
|
|
11.4
|
|
11.4
|
|
—
|
|
—
|
|
||||||||||||||||
|
Short-term trading securities
|
||||||||||||||||||||||||||||||
|
Mutual funds
|
35.6
|
|
3.3
|
|
—
|
|
38.9
|
|
38.9
|
|
—
|
|
—
|
|
||||||||||||||||
|
Long-term available for sale
|
||||||||||||||||||||||||||||||
|
Corporate debt securities
|
179.7
|
|
0.7
|
|
(0.1
|
)
|
180.3
|
|
180.3
|
|
—
|
|
—
|
|
||||||||||||||||
|
Agency bond
|
43.3
|
|
0.1
|
|
—
|
|
43.4
|
|
43.4
|
|
—
|
|
—
|
|
||||||||||||||||
|
U.S. government agency securities
|
9.8
|
|
—
|
|
—
|
|
9.8
|
|
9.8
|
|
—
|
|
—
|
|
||||||||||||||||
|
Municipal securities
|
43.5
|
|
0.3
|
|
—
|
|
43.8
|
|
43.8
|
|
—
|
|
—
|
|
||||||||||||||||
|
Convertible debt securities (3)
|
21.4
|
|
3.2
|
|
(4.4
|
)
|
20.2
|
|
—
|
|
—
|
|
20.2
|
|
||||||||||||||||
|
Derivative contracts (4)
|
10.8
|
|
14.8
|
|
(6.0
|
)
|
19.6
|
|
—
|
|
10.5
|
|
9.1
|
|
||||||||||||||||
|
Total
|
$
|
1,545.3
|
|
$
|
22.4
|
|
$
|
(10.5
|
)
|
$
|
1,557.2
|
|
$
|
521.1
|
|
$
|
1,006.8
|
|
$
|
29.3
|
|
|||||||||
____________________
|
(1)
|
Included in “Cash and cash equivalents” in the accompanying Consolidated Balance Sheets.
|
|
(2)
|
Consists of agency discount notes, U.S. treasury bills, and other short-term securities.
|
|
(3)
|
Considered "available for sale" and included in "Other assets" in the accompanying Consolidated Balance Sheets.
|
|
(4)
|
Included in “Prepaid expenses and other current assets,” "Other assets," or “Other accrued liabilities” in the accompanying Consolidated Balance Sheets.
|
2014 Form 10-K 72
|
January 31, 2013
|
||||||||||||||||||||||||||||||
|
Amortized Cost
|
Gross unrealized gains
|
Gross unrealized losses
|
Fair Value
|
Level 1
|
Level 2
|
Level 3
|
||||||||||||||||||||||||
|
Cash equivalents (1):
|
||||||||||||||||||||||||||||||
|
Certificates of deposit and time deposits
|
$
|
392.4
|
|
$
|
—
|
|
$
|
—
|
|
$
|
392.4
|
|
$
|
17.2
|
|
$
|
375.2
|
|
$
|
—
|
|
|||||||||
|
Corporate Bond
|
1.8
|
|
—
|
|
—
|
|
1.8
|
|
1.8
|
|
—
|
|
—
|
|
||||||||||||||||
|
Commercial paper
|
263.3
|
|
—
|
|
—
|
|
263.3
|
|
—
|
|
263.3
|
|
—
|
|
||||||||||||||||
|
Money market funds
|
596.3
|
|
—
|
|
—
|
|
596.3
|
|
—
|
|
596.3
|
|
—
|
|
||||||||||||||||
|
Marketable securities:
|
||||||||||||||||||||||||||||||
|
Short-term available for sale
|
||||||||||||||||||||||||||||||
|
Commercial paper and corporate debt securities
|
122.9
|
|
0.1
|
|
—
|
|
123.0
|
|
40.4
|
|
82.6
|
|
—
|
|
||||||||||||||||
|
Certificates of deposit and time deposits
|
15.1
|
|
—
|
|
—
|
|
15.1
|
|
10.0
|
|
5.1
|
|
—
|
|
||||||||||||||||
|
U.S. treasury securities
|
83.3
|
|
—
|
|
—
|
|
83.3
|
|
83.3
|
|
—
|
|
—
|
|
||||||||||||||||
|
U.S. government agency securities
|
79.5
|
|
—
|
|
—
|
|
79.5
|
|
79.5
|
|
—
|
|
—
|
|
||||||||||||||||
|
Sovereign debt
|
1.0
|
|
—
|
|
—
|
|
1.0
|
|
—
|
|
1.0
|
|
—
|
|
||||||||||||||||
|
Municipal securities
|
4.6
|
|
—
|
|
—
|
|
4.6
|
|
4.6
|
|
—
|
|
—
|
|
||||||||||||||||
|
Other
|
0.3
|
|
—
|
|
—
|
|
0.3
|
|
0.3
|
|
—
|
|
—
|
|
||||||||||||||||
|
Short-term trading securities
|
||||||||||||||||||||||||||||||
|
Mutual funds
|
31.1
|
|
4.2
|
|
—
|
|
35.3
|
|
35.3
|
|
—
|
|
—
|
|
||||||||||||||||
|
Long-term available for sale
|
||||||||||||||||||||||||||||||
|
Corporate debt securities
|
172.1
|
|
1.4
|
|
—
|
|
173.5
|
|
173.5
|
|
—
|
|
—
|
|
||||||||||||||||
|
U.S. treasury securities
|
145.2
|
|
0.1
|
|
—
|
|
145.3
|
|
145.3
|
|
—
|
|
—
|
|
||||||||||||||||
|
U.S. government agency securities
|
50.8
|
|
0.2
|
|
—
|
|
51.0
|
|
51.0
|
|
—
|
|
—
|
|
||||||||||||||||
|
Municipal securities
|
36.0
|
|
0.1
|
|
—
|
|
36.1
|
|
36.1
|
|
—
|
|
—
|
|
||||||||||||||||
|
Sovereign debt
|
1.0
|
|
—
|
|
—
|
|
1.0
|
|
—
|
|
1.0
|
|
—
|
|
||||||||||||||||
|
Taxable auction-rate securities
|
4.2
|
|
—
|
|
—
|
|
4.2
|
|
—
|
|
—
|
|
4.2
|
|
||||||||||||||||
|
Convertible Debt Securities (2)
|
18.1
|
|
1.6
|
|
(2.2
|
)
|
17.5
|
|
—
|
|
—
|
|
17.5
|
|
||||||||||||||||
|
Derivative contracts (3)
|
10.2
|
|
9.2
|
|
(5.9
|
)
|
13.5
|
|
—
|
|
2.8
|
|
10.7
|
|
||||||||||||||||
|
Total
|
$
|
2,029.2
|
|
$
|
16.9
|
|
$
|
(8.1
|
)
|
$
|
2,038.0
|
|
$
|
678.3
|
|
$
|
1,327.3
|
|
$
|
32.4
|
|
|||||||||
____________________
|
(1)
|
Included in “Cash and cash equivalents” in the accompanying Consolidated Balance Sheets.
|
|
(2)
|
Considered "available for sale" securities and included in "Other assets" in the accompanying Consolidated Balance Sheets.
|
|
(3)
|
Included in “Prepaid expenses and other current assets,” "Other assets," or “Other accrued liabilities” in the accompanying Consolidated Balance Sheets.
|
Autodesk classifies its marketable securities as either short-term or long-term based on each instrument’s underlying contractual maturity date. Marketable securities with remaining maturities of less than
12 months
are classified as short-term and marketable securities with remaining maturities greater than
12 months
are classified as long-term. Autodesk may sell certain of its marketable securities prior to their stated maturities for strategic purposes or in anticipation of credit deterioration.
Autodesk applies fair value accounting for certain financial assets and liabilities, which consist of cash equivalents, marketable securities and other financial instruments, on a recurring basis. The Company defines fair value as the price that would be received from selling an asset or paid to transfer a liability in an orderly transaction between market participants at the measurement date. Fair value is estimated by applying the following hierarchy, which prioritizes the inputs used to measure fair value into three levels and bases the categorization within the hierarchy upon the lowest level of input that is available and significant to the fair value measurement: (Level 1) observable inputs such as quoted prices in active markets; (Level 2) inputs other than quoted prices in active markets for identical assets and liabilities, quoted prices for identical or similar assets or liabilities in inactive markets, or other inputs that are observable or can be corroborated by observable market data for substantially the full term of the assets or liabilities; and (Level 3) unobservable inputs for which there is little or no market data, which require Autodesk to develop its own assumptions. When determining fair value, Autodesk uses observable market
2014 Form 10-K 73
data and relies on unobservable inputs only when observable market data is not available. There have been no transfers between fair value measurement levels during the year ended
January 31, 2014
.
Autodesk's cash equivalents, marketable securities and financial instruments are primarily classified within Level 1 or Level 2 of the fair value hierarchy. Autodesk values it's available for sale securities on pricing from pricing vendors, who may use quoted prices in active markets for identical assets (Level 1) or inputs other than quoted prices that are observable either directly or indirectly in determining fair value (Level 2). Autodesk's Level 2 securities are valued primarily using observable inputs other than quoted prices in active markets for identical assets and liabilities. Autodesk's Level 3 securities consist of investments held in auction rate securities, convertible debt securities and derivative contracts which are valued using probability weighted discounted cash flow models and some of the inputs to the models are unobservable in the market.
A reconciliation of the change in Autodesk’s Level 3 items for the fiscal years ended January 31,
2014
and
2013
was as follows:
|
Fair Value Measurements Using
Significant Unobservable Inputs
|
||||||||||||||||
|
|
(Level 3)
|
|||||||||||||||
|
|
Derivative Contracts
|
Convertible Debt Securities
|
Taxable
Auction-Rate
Securities
|
Total
|
||||||||||||
|
Balance at January 31, 2012
|
$
|
6.2
|
|
$
|
18.3
|
|
$
|
4.2
|
|
$
|
28.7
|
|
||||
|
Purchases
|
2.0
|
|
7.0
|
|
—
|
|
9.0
|
|
||||||||
|
Settlements
|
(1.3
|
)
|
(7.2
|
)
|
—
|
|
(8.5
|
)
|
||||||||
|
Total unrealized gains (losses)
|
3.8
|
|
(0.6
|
)
|
—
|
|
3.2
|
|
||||||||
|
Balance at January 31, 2013
|
10.7
|
|
17.5
|
|
4.2
|
|
32.4
|
|
||||||||
|
Purchases
|
1.3
|
|
3.1
|
|
—
|
|
4.4
|
|
||||||||
|
Settlements
|
—
|
|
—
|
|
(4.0
|
)
|
(4.0
|
)
|
||||||||
|
Net realized losses
|
—
|
|
—
|
|
(0.2
|
)
|
(0.2
|
)
|
||||||||
|
Total unrealized (losses)
|
(2.9
|
)
|
(0.4
|
)
|
—
|
|
(3.3
|
)
|
||||||||
|
Balance at January 31, 2014
|
$
|
9.1
|
|
$
|
20.2
|
|
$
|
—
|
|
$
|
29.3
|
|
||||
The following table summarizes the estimated fair value of Autodesk's “available-for-sale securities” classified by the contractual maturity date of the security:
|
|
January 31, 2014
|
||||||
|
|
Cost
|
Fair Value
|
|||||
|
Due in 1 year
|
$
|
375.2
|
|
$
|
375.2
|
|
|
|
Due in 1 year through 5 years
|
297.7
|
|
297.5
|
|
|||
|
Due in 5 years through 10 years
|
—
|
|
—
|
|
|||
|
Due after 10 years
|
—
|
|
—
|
|
|||
|
Total
|
$
|
672.9
|
|
$
|
672.7
|
|
|
As of January 31,
2014
and
2013
, Autodesk did not have any securities in a continuous unrealized loss position for greater than twelve months.
Autodesk also has direct investments in privately held companies accounted for under the cost method, which are periodically assessed for other-than-temporary impairment. If Autodesk determines that an other-than-temporary impairment has occurred, Autodesk writes down the investment to its fair value. Autodesk estimates fair value of its cost method investments considering available information such as pricing in recent rounds of financing, current cash positions, earnings and cash flow forecasts, recent operational performance and any other readily available market data. During fiscal
2014
, Autodesk recorded
no
other-than-temporary impairment on its privately held equity investments. During fiscal
2013
, Autodesk recorded a
$10.5 million
other-than-temporary impairment on its privately held equity investments.The impairment expense was recorded in “
Interest and other (expense) income, net
” on the Company's Consolidated Statement of Operations.
2014 Form 10-K 74
The sales or settlement of “available-for-sale securities” in fiscal
2014
and fiscal
2013
resulted in a
loss
of $
0.2 million
and a
gain
of $
5.0 million
, respectively. The sales or redemptions of “available-for-sale securities” in fiscal
2012
resulted in no gains or losses. The losses and gains were recorded in "
Interest and other (expense) income, net
" on the Company's Condensed Consolidated Statement of Operations.
Proceeds from the sale and maturity of marketable securities for fiscal
2014
and fiscal
2013
were
$1,279.1 million
and
$1,097.7 million
, respectively.
Derivative Financial Instruments
Under its risk management strategy, Autodesk uses derivative instruments to manage its short-term exposures to fluctuations in foreign currency exchange rates which exist as part of ongoing business operations. Autodesk's general practice is to hedge a portion of transaction exposures denominated in euros, Japanese yen, Swiss francs, British pounds, Canadian dollars and Australian dollars. These instruments have maturities between one to twelve months in the future. Autodesk does not enter into derivative instrument transactions for trading or speculative purposes.
The bank counterparties in all contracts expose Autodesk to credit-related losses in the event of their nonperformance. However, to mitigate that risk, Autodesk only contracts with counterparties who meet the Company's minimum requirements under its counterparty risk assessment process. Autodesk monitors ratings, credit spreads and potential downgrades on at least a quarterly basis. Based on Autodesk's on-going assessment of counterparty risk, the Company will adjust its exposure to various counterparties. Autodesk generally enters into master netting arrangements, which reduce credit risk by permitting net settlement of transactions with the same counterparty. However, Autodesk does not have any master netting arrangements in place with collateral features.
Foreign currency contracts designated as cash flow hedges
Autodesk uses foreign currency contracts to reduce the exchange rate impact on a portion of the net revenue or operating expense of certain anticipated transactions. These contracts are designated and documented as cash flow hedges. The effectiveness of the cash flow hedge contracts is assessed quarterly using regression analysis as well as other timing and probability criteria. To receive cash flow hedge accounting treatment, all hedging relationships are formally documented at the inception of the hedge and the hedges are expected to be highly effective in offsetting changes to future cash flows on hedged transactions. The gross gains and losses on these hedges are included in “
Accumulated other comprehensive (loss)
” and are reclassified into earnings at the time the forecasted revenue or expense is recognized. In the event the underlying forecasted transaction does not occur, or it becomes probable that it will not occur, Autodesk reclassifies the gain or loss on the related cash flow hedge from “
Accumulated other comprehensive (loss)
” to “
Interest and other (expense) income, net
” in the Company's Consolidated Financial Statements at that time.
The net notional amount of these contracts are presented net settled and were $
351.7 million
at
January 31, 2014
and $
359.8 million
at
January 31, 2013
. Outstanding contracts are recognized as either assets or liabilities on the balance sheet at fair value. The majority of the net gain of $
3.5 million
remaining in “
Accumulated other comprehensive (loss)
” as of
January 31, 2014
is expected to be recognized into earnings within the next twelve months.
Derivatives not designated as hedging instruments
Autodesk uses foreign currency contracts which are not designated as hedging instruments to reduce the exchange rate risk associated primarily with foreign currency denominated receivables and payables. These forward contracts are marked-to-market at the end of each fiscal quarter with gains and losses recognized as “
Interest and other (expense) income, net
.” These derivative instruments do not subject the Company to material balance sheet risk due to exchange rate movements because gains and losses on these derivative instruments are intended to offset the gains or losses resulting from the settlement of the underlying foreign currency denominated receivables and payables. The net notional amounts of these foreign currency contracts are presented net settled and were $
205.5 million
at
January 31, 2014
and $
78.4 million
at
January 31, 2013
.
From time to time and consistent with its risk management policy, Autodesk also uses derivative instruments to hedge its economic exposure related to committed, in-process acquisitions priced in foreign currency. Such derivatives do not qualify for hedge accounting and are marked-to-market through earnings, with any gain or loss reflected immediately in “
Interest and other (expense) income, net
,” in each period.
2014 Form 10-K 75
In addition to these foreign currency contracts, Autodesk holds derivative instruments issued by privately held companies, which are not designated as hedging instruments. These derivatives consist of certain conversion options on the convertible debt securities held by Autodesk and an option to acquire a privately held company. These derivatives are recorded at fair value as of each balance sheet date and are recorded in “Other assets.” Changes in the fair values of these instruments are recognized in income as “
Interest and other (expense) income, net
.”
Fair Value of Derivative Instruments:
The fair value of derivative instruments in Autodesk’s Consolidated Balance Sheets were as follows as of
January 31, 2014
and
January 31, 2013
:
|
|
Balance Sheet Location
|
Fair Value at
|
|||||||
|
|
January 31, 2014
|
January 31, 2013
|
|||||||
|
Derivative Assets
|
|||||||||
|
Foreign currency contracts designated as cash flow hedges
|
Prepaid expenses and other current assets (1)
|
$
|
4.4
|
|
$
|
6.7
|
|
||
|
Derivatives not designated as hedging instruments
|
Prepaid expenses and other current assets and Other assets
|
16.9
|
|
10.7
|
|
||||
|
Total derivative assets
|
$
|
21.3
|
|
$
|
17.4
|
|
|||
|
Derivative Liabilities
|
|||||||||
|
Foreign currency contracts designated as cash flow hedges
|
Other accrued liabilities (2)
|
$
|
1.7
|
|
$
|
3.9
|
|
||
|
Total derivative liabilities
|
$
|
1.7
|
|
$
|
3.9
|
|
|||
____________________
|
(1)
|
Considering Autodesk's master netting arrangements, these contracts are presented net settled. The gross balance is $
5.9 million
and $
8.2 million
at
January 31, 2014
and
January 31, 2013
, respectively.
|
|
(2)
|
Considering Autodesk's master netting arrangements, these contracts are presented net settled. The gross balance is $
3.2 million
and $
5.4 million
at
January 31, 2014
and
January 31, 2013
, respectively.
|
The effects of derivatives designated as hedging instruments on Autodesk’s Consolidated Statements of Operations were as follows for the fiscal years ended January 31,
2014
and
2013
, respectively (amounts presented include any income tax effects):
|
|
Foreign Currency Contracts
|
||||||
|
|
Fiscal Year Ended
January 31,
|
||||||
|
|
2014
|
2013
|
|||||
|
Amount of gain recognized in Accumulated other comprehensive income on derivatives (effective portion)
|
$
|
12.2
|
|
$
|
5.1
|
|
|
|
Amount and Location of Gain (Loss) Reclassified from Accumulated other comprehensive income into Income (Effective Portion)
|
|||||||
|
Net revenue
|
$
|
13.1
|
|
$
|
16.0
|
|
|
|
Operating expenses
|
(1.6
|
)
|
(4.6
|
)
|
|||
|
Total
|
$
|
11.5
|
|
$
|
11.4
|
|
|
|
Amount and Location of (Loss) Recognized in Income on Derivatives (Ineffective Portion and Amount Excluded from Effectiveness Testing)
|
|||||||
|
Interest and other (expense) income, net
|
$
|
(0.1
|
)
|
$
|
(0.2
|
)
|
|
The effects of derivatives not designated as hedging instruments on Autodesk’s Consolidated Statements of Operations were as follows for the fiscal years ended
January 31, 2014
and
2013
, respectively (amounts presented include any income tax effects):
2014 Form 10-K 76
|
|
Foreign Exchange
Contracts
|
||||||
|
|
Fiscal Year Ended
January 31,
|
||||||
|
|
2014
|
2013
|
|||||
|
Amount and Location of Gain Recognized in Income on Derivative
|
|||||||
|
Interest and other (expense) income, net
|
$
|
12.8
|
|
$
|
1.5
|
|
|
3
.
Employee and Director Stock Plans
Stock Plans
As of
January 31, 2014
, Autodesk maintained
two
active stock plans for the purpose of granting equity awards to employees and to non-employee members of Autodesk’s Board of Directors: the 2012 Employee Stock Plan (“2012 Employee Plan”), which is available only to employees, and the Autodesk 2012 Outside Directors’ Stock Plan (“2012 Directors' Plan”), which is available only to non-employee directors. Additionally, there are
eight
expired or terminated plans with options outstanding. The exercise price of all stock options granted under these plans was equal to the fair market value of the stock on the grant date.
The 2012 Employee Plan was approved by Autodesk's stockholders and became effective on
January 6, 2012
. On January 14, 2014, Autodesk's stockholders approved amendments to the 2012 Employee Plan, which increased the number of shares reserved for issuance under the plan by
11.4 million
shares and added additional performance goals to the plan. The 2012 Employee Plan replaced the 2008 Employee Stock Plan, as amended ("2008 Plan") and no further equity awards may be granted under the 2008 Plan. The 2012 Employee Plan reserves up to
32.6 million
shares which includes
26.6 million
shares reserved under the 2012 Employee Plan, as well as up to
6.0 million
shares forfeited under certain prior employee stock plans during the life of the 2012 Employee Plan. The 2012 Employee Plan permits the grant of stock options, restricted stock units and restricted stock awards. Each restricted stock unit or restricted stock award granted will be counted against the shares authorized for issuance under the 2012 Employee Plan as
1.79
shares. If a granted option, restricted stock unit or restricted stock award expires or becomes unexercisable for any reason, the unpurchased or forfeited shares that were granted may be returned to the 2012 Employee Plan and may become available for future grant under the 2012 Employee Plan. As of
January 31, 2014
,
14.1 million
shares subject to options or restricted stock awards have been granted under the 2012 Employee Plan. Options and restricted stock that were granted under the 2012 plan vest over periods ranging from
immediately upon grant
to
over a three year period
and options expire
10
years from the date of grant. The 2012 Employee Plan will expire on
June 30, 2022
. At
January 31, 2014
,
19.4 million
shares were available for future issuance under the 2012 Employee Plan.
The 2012 Director's Plan was approved by Autodesk's stockholders and became effective on
January 6, 2012
. The 2012 Directors' Plan replaced the 2010 Outside Directors' Stock Plan, as amended ("2010 Plan"). The 2012 Directors' Plan permits the grant of stock options, restricted stock units and restricted stock awards to non-employee members of Autodesk’s Board of Directors. Each restricted stock unit or restricted stock award granted will be counted against the shares authorized for issuance under the 2012 Directors' Plan as
2.11
shares. As of
January 31, 2014
,
0.4 million
shares subject to restricted stock unit awards have been granted under the 2012 Directors' Plan. Restricted stock units that were granted under the 2012 Outside Directors' Plan vest over
one
to
three
years from the date of grant. The 2012 Directors' Plan reserved
2.6 million
shares of Autodesk common stock. The 2012 Directors' Plan will expire on
June 30, 2022
. At
January 31, 2014
,
2.2 million
shares were available for future issuance under the 2012 Director's Plan.
The following sections summarize activity under Autodesk’s stock plans.
Stock Options:
A summary of stock option activity for the fiscal year ended
January 31, 2014
is as follows:
2014 Form 10-K 77
|
Number of
Shares
|
Weighted average exercise price per share
|
Weighted
average remaining contractual term
|
Aggregate Intrinsic Value (3)
|
|||||||||
|
(in millions)
|
|
(in years)
|
(in millions)
|
|||||||||
|
Options outstanding at January 31, 2013
|
19.0
|
|
$
|
32.69
|
|
|||||||
|
Granted (1)
|
—
|
|
—
|
|
||||||||
|
Exercised
|
(9.2
|
)
|
27.08
|
|
||||||||
|
Canceled/Forfeited
|
(3.9
|
)
|
44.67
|
|
||||||||
|
Options outstanding at January 31, 2014
|
5.9
|
|
$
|
33.54
|
|
4.8
|
$
|
105.3
|
|
|||
|
Options vested and exercisable at January 31, 2014
|
4.0
|
|
$
|
30.98
|
|
4.0
|
$
|
80.3
|
|
|||
|
Options vested and exercisable as of January 31, 2014 and expected to vest thereafter (2)
|
5.9
|
|
$
|
33.52
|
|
4.8
|
$
|
105.0
|
|
|||
|
Options available for grant at January 31, 2014
|
21.6
|
|
||||||||||
_______________
|
(1)
|
Autodesk did not grant stock options in the twelve months ended
January 31, 2014
.
|
|
(2)
|
Options expected to vest reflect an estimated forfeiture rate.
|
|
(3)
|
Represents the total pre-tax intrinsic value, based on Autodesk’s closing stock price of
$51.25
per share as of
January 31, 2014
, which would have been received by the option holders had all option holders exercised their options as of that date.
|
As of
January 31, 2014
, compensation cost of $
8.2 million
related to non-vested options is expected to be recognized over a weighted average period of
0.5
year.
The following table summarizes information about the pre-tax intrinsic value of options exercised and the weighted average grant date fair value per share of options granted during the fiscal years ended
January 31, 2014
,
2013
and
2012
:
|
|
Fiscal year ended
January 31,
|
||||||||||
|
|
2014
|
2013
|
2012
|
||||||||
|
Intrinsic value of options exercised (1)
|
$
|
149.0
|
|
$
|
90.9
|
|
$
|
85.7
|
|
||
|
Weighted average grant date fair value per share of stock options granted (2)
|
$
|
—
|
|
$
|
13.39
|
|
$
|
14.04
|
|
||
——————
|
(1)
|
The intrinsic value of options exercised is calculated as the difference between the exercise price of the option and the market value of the stock on the date of exercise.
|
|
(2)
|
The weighted average grant date fair value per share of stock options granted is calculated, as of the stock option grant date, using the BSM option pricing model. For the twelve months ended
January 31, 2014
, Autodesk did not grant stock options.
|
The following table summarizes information about options vested and exercisable, and outstanding at
January 31, 2014
:
2014 Form 10-K 78
|
|
Options Vested and Exercisable
|
Options Outstanding
|
|||||||||||||||||||||||
|
|
Number of
Shares
(in millions)
|
Weighted
average
contractual
life
(in years)
|
Weighted
average
exercise
price per share
|
Aggregate
intrinsic
value(1)
(in millions)
|
Number of
Shares
(in millions)
|
Weighted
average
contractual
life
(in years)
|
Weighted
average
exercise
price per share
|
Aggregate
intrinsic
value(1)
(in millions)
|
|||||||||||||||||
|
Range of per-share exercise prices:
|
|||||||||||||||||||||||||
|
$2.28 - $29.49
|
1.8
|
|
$
|
22.73
|
|
2.1
|
|
$
|
23.51
|
|
|||||||||||||||
|
$29.50 - $38.08
|
0.9
|
|
32.75
|
|
1.2
|
|
32.46
|
|
|||||||||||||||||
|
$38.55 - $38.55
|
0.1
|
|
38.55
|
|
0.1
|
|
38.55
|
|
|||||||||||||||||
|
$41.62 - $41.62
|
0.9
|
|
41.62
|
|
2.0
|
|
41.62
|
|
|||||||||||||||||
|
$42.39 - $43.81
|
0.3
|
|
43.80
|
|
0.5
|
|
43.79
|
|
|||||||||||||||||
|
4.0
|
|
4.0
|
$
|
30.98
|
|
$
|
80.3
|
|
5.9
|
|
4.8
|
$
|
33.54
|
|
$
|
105.3
|
|
||||||||
____________________
|
(1)
|
Represents the total pre-tax intrinsic value, based on Autodesk’s closing stock price of $
51.25
per share as of
January 31, 2014
, which would have been received by the option holders had all option holders exercised their options as of that date.
|
These options will expire if not exercised at specific dates ranging through
September 2022
.
Restricted Stock:
A summary of restricted stock unit activity for the fiscal year ended
January 31, 2014
is as follows:
|
Unreleased
Restricted
Stock Units
|
Weighted
average grant
date fair value
|
|||||
|
|
(in thousands)
|
|
||||
|
Unreleased restricted stock units at January 31, 2013
|
5,020.8
|
|
$
|
33.89
|
|
|
|
Granted
|
4,077.1
|
|
42.37
|
|
||
|
Released
|
(2,146.1
|
)
|
34.37
|
|
||
|
Canceled/Forfeited
|
(422.0
|
)
|
35.58
|
|
||
|
Performance Adjustment (1)
|
(14.2
|
)
|
35.95
|
|
||
|
Unreleased restricted stock units at January 31, 2014
|
6,515.6
|
|
$
|
39.15
|
|
|
_______________
|
(1)
|
Based on Autodesk's financial results for the performance period, the fiscal 2013 performance stock units were earned at
92.3%
of the target award. The vesting of the performance stock units is subject to the holders satisfying the remaining service condition of the awards.
|
For the restricted stock units granted during fiscal years ended January 31,
2014
,
2013
and
2012
, the weighted average grant date fair value was
$42.37
, $
33.32
and $
37.07
, respectively. The grant date fair value of the shares vested during fiscal years ended January 31,
2014
,
2013
and
2012
was
$73.8 million
,
$33.6 million
and
$18.4 million
, respectively.
During the fiscal year ended January 31,
2014
, Autodesk granted
3.5 million
restricted stock units. The restricted stock units vest over periods ranging from immediately upon grant to a pre-determined date that is typically within three years from the date of grant. Restricted stock units are not considered outstanding stock at the time of grant, as the holders of these units are not entitled to any of the rights of a stockholder, including voting rights. The fair value of the restricted stock units is expensed ratably over the vesting period. Autodesk recorded stock-based compensation expense related to restricted stock units of $
74.9 million
, $
70.5 million
and $
29.1 million
during fiscal years ended January 31,
2014
,
2013
and
2012
, respectively. Included in the $
70.5 million
incurred in fiscal 2013, Autodesk incurred $
16.6 million
relating to the acceleration of vesting of equity awards held in Socialcam for Socialcam employees immediately prior to the acquisition. As of January 31,
2014
, total compensation cost not yet recognized of $
152.4 million
related to non-vested awards, is expected to be recognized over a
2014 Form 10-K 79
weighted average period of
1.9
years. At January 31,
2014
, the number of restricted stock units granted but unreleased was
5.7 million
.
During the fiscal year ended January 31,
2014
, Autodesk granted
0.5 million
performance stock units ("PSUs") for which the ultimate number of shares earned is determined based on the achievement of performance criteria at the end of the stated performance period. The performance criteria is based upon annual revenue and non-GAAP operating margin goals adopted by the Compensation and Human Resource Committee (the “Annual Financial Results”), as well as total stockholder return compared against the S&P Computer Software Select Index (“Relative TSR”). Each PSU covers a three year period:
|
•
|
Up to one third of the PSU may vest following year one depending upon the achievement of Annual Financial Results for year one as well as 1 year Relative TSR (covering year one).
|
|
•
|
Up to one third of the PSU may vest following year two depending upon the achievement of Annual Financial Results for year two as well as 2 year Relative TSR (covering years one and two).
|
|
•
|
Up to one third of the PSU may vest following year three depending upon the achievement of Annual Financial Results for year three as well as 3 year Relative TSR (covering years one, two and three).
|
PSUs are not considered outstanding stock at the time of grant, as the holders of these units are not entitled to any of the rights of a stockholder, including voting rights. Autodesk has determined the grant-date fair value for these awards using a Monte Carlo simulation model since the awards are subject to a market condition. The fair value of the performance restricted stock units is expensed using the accelerated attribution method over the vesting period. Autodesk recorded stock-based compensation expense related to PSUs of $
8.7 million
and
$8.1 million
during fiscal year ended January 31,
2014
and
2013
, respectively. Autodesk did not grant PSUs during the fiscal year ended January 31,
2012
. As of January 31,
2014
, total compensation cost not yet recognized of $
2.3 million
related to non-vested PSUs, is expected to be recognized over a weighted average period of
0.9
years. At January 31,
2014
, the number of PSUs granted but unreleased was
0.8 million
.
1998 Employee Qualified Stock Purchase Plan (“ESP Plan”)
Under Autodesk’s ESP Plan, which was approved by stockholders in 1998, eligible employees may purchase shares of Autodesk’s common stock at their discretion using up to
15%
of their eligible compensation subject to certain limitations, at not less than
85%
of fair market value as defined in the ESP Plan. At
January 31, 2014
, a total of
38.1 million
shares were available for future issuance. This amount automatically increases on the first trading day of each fiscal year by an amount equal to the lesser of
10.0 million
shares or
2%
of the total of (1) outstanding shares plus (2) any shares repurchased by Autodesk during the prior fiscal year. Under the ESP Plan, the Company issues shares on the first trading day following March 31 and September 30 of each fiscal year. The ESP Plan expires during fiscal 2018.
Autodesk issued
2.9 million
shares under the ESP Plan at an average price of $
22.61
per share in fiscal
2014
,
2.9 million
shares at an average price of $
21.79
per share in fiscal
2013
, and
2.8 million
shares at an average price of $
18.26
per share in fiscal
2012
. The weighted average grant date fair value of awards granted under the ESP Plan during fiscal
2014
,
2013
and
2012
, calculated as of the award grant date using the BSM option-pricing model, was $
11.80
, $
12.21
and $
9.95
per share, respectively. Autodesk recorded $
22.9 million
, $
34.0 million
and $
23.8 million
of compensation expense associated with the ESP Plan in fiscal
2014
,
2013
and
2012
, respectively.
2014 Form 10-K 80
Equity Compensation Plan Information
The following table summarizes the number of outstanding options granted to employees and directors, as well as the number of securities remaining available for future issuance under these plans as of
January 31, 2014
:
|
(a)
|
(b)
|
(c)
|
||||||||
|
Plan category
|
Number of securities
to be issued upon
exercise of
outstanding options
|
Weighted-average
exercise price of
outstanding
options
|
Number of securities remaining
available for future issuance
under equity compensation
plans (excluding securities
reflected in column (a)) (in millions)
|
|
||||||
|
Equity compensation plans approved by security holders
|
12.4
|
|
$
|
33.56
|
|
59.7
|
|
(1)
|
||
|
Equity compensation plans not approved by security holders (2)
|
0.1
|
|
$
|
24.20
|
|
—
|
|
|
||
|
Total
|
12.5
|
|
$
|
33.54
|
|
59.7
|
|
|
||
____________________
|
(1)
|
Included in this amount are
38.1 million
securities available for future issuance under Autodesk’s ESP Plan.
|
|
(2)
|
Amounts correspond to Autodesk’s Nonstatutory Stock Option Plan, which was terminated by the Board of Directors in December 2004.
|
4
.
Income Taxes
The provision for income taxes consists of the following:
|
|
Fiscal year ended January 31,
|
||||||||||
|
2014
|
2013
|
2012
|
|||||||||
|
Federal:
|
|||||||||||
|
Current
|
$
|
29.1
|
|
$
|
30.9
|
|
$
|
54.3
|
|
||
|
Deferred
|
(41.4
|
)
|
(13.3
|
)
|
(34.5
|
)
|
|||||
|
State:
|
|||||||||||
|
Current
|
0.6
|
|
7.8
|
|
4.9
|
|
|||||
|
Deferred
|
—
|
|
(18.6
|
)
|
1.3
|
|
|||||
|
Foreign:
|
|||||||||||
|
Current
|
63.9
|
|
54.3
|
|
55.9
|
|
|||||
|
Deferred
|
(1.1
|
)
|
1.5
|
|
(4.3
|
)
|
|||||
|
$
|
51.1
|
|
$
|
62.6
|
|
$
|
77.6
|
|
|||
During fiscal year
2014
, the Company reduced its current federal and state taxes payable by $
0.9 million
related to excess tax benefits from non-qualified stock options, offsetting additional paid-in capital. Pursuant to accounting standards related to stock-based compensation, the Company has unrecorded excess stock option tax benefits of $
191.6 million
as of January 31,
2014
. These amounts will be credited to additional paid-in-capital when such amounts reduce cash taxes payable. Foreign pretax income was $
380.5 million
in fiscal
2014
, $
383.3 million
in fiscal
2013
, and $
383.7 million
in fiscal
2012
.
2014 Form 10-K 81
The differences between the U.S. statutory rate and the aggregate income tax provision are as follows:
|
|
Fiscal year ended January 31,
|
||||||||||
|
2014
|
2013
|
2012
|
|||||||||
|
Income tax provision at U.S. Federal statutory rate
|
$
|
98.0
|
|
$
|
108.5
|
|
$
|
127.0
|
|
||
|
State income tax (benefit) expense, net of the U.S. Federal benefit
|
(2.9
|
)
|
(1.7
|
)
|
2.8
|
|
|||||
|
Foreign income taxed at rates different from the U.S. statutory rate
|
(57.1
|
)
|
(54.5
|
)
|
(61.5
|
)
|
|||||
|
U.S. valuation allowance
|
2.1
|
|
1.7
|
|
1.7
|
|
|||||
|
Non-deductible stock-based compensation
|
10.8
|
|
21.1
|
|
12.8
|
|
|||||
|
Research and development tax credit benefit
|
(8.8
|
)
|
(7.0
|
)
|
(6.0
|
)
|
|||||
|
Tax expense (benefit) from closure of income tax audits and changes in uncertain tax positions
|
3.6
|
|
(2.8
|
)
|
(0.4
|
)
|
|||||
|
Officer compensation in excess of $1.0 million
|
3.0
|
|
1.8
|
|
1.9
|
|
|||||
|
U.S. Manufacturer's deduction
|
(0.1
|
)
|
(4.9
|
)
|
(3.0
|
)
|
|||||
|
Other
|
2.5
|
|
0.4
|
|
2.3
|
|
|||||
|
$
|
51.1
|
|
$
|
62.6
|
|
$
|
77.6
|
|
|||
Significant components of Autodesk’s deferred tax assets and liabilities are as follows:
|
|
January 31,
|
||||||
|
2014
|
2013
|
||||||
|
Nonqualified stock options
|
$
|
37.4
|
|
$
|
67.5
|
|
|
|
Research and development tax credit carryforwards
|
78.4
|
|
54.0
|
|
|||
|
Foreign tax credit carryforwards
|
16.3
|
|
—
|
|
|||
|
Accrued compensation and benefits
|
38.6
|
|
34.5
|
|
|||
|
Other accruals not currently deductible for tax
|
14.5
|
|
15.3
|
|
|||
|
Purchased technology and capitalized software
|
23.4
|
|
9.8
|
|
|||
|
Fixed assets
|
17.5
|
|
18.5
|
|
|||
|
Tax loss carryforwards
|
12.6
|
|
21.0
|
|
|||
|
Deferred Revenue
|
33.1
|
|
28.5
|
|
|||
|
Other
|
5.1
|
|
2.2
|
|
|||
|
Total deferred tax assets
|
276.9
|
|
251.3
|
|
|||
|
Less: valuation allowance
|
(67.2
|
)
|
(51.3
|
)
|
|||
|
Net deferred tax assets
|
209.7
|
|
200.0
|
|
|||
|
Tax method change on advanced payments
|
—
|
|
(3.1
|
)
|
|||
|
Unremitted earnings of foreign subsidiaries
|
(21.8
|
)
|
(31.9
|
)
|
|||
|
Total deferred tax liability
|
(21.8
|
)
|
(35.0
|
)
|
|||
|
Net deferred tax assets
|
$
|
187.9
|
|
$
|
165.0
|
|
|
The valuation allowance increased by $
15.9 million
, $
3.8 million
and $
4.6 million
in fiscal
2014
,
2013
and
2012
, respectively. The fiscal
2014
, fiscal
2013
, and fiscal
2012
changes in valuation allowance were related to U.S. and Canadian deferred taxes.
The Company provides U.S. income taxes on the earnings of foreign subsidiaries, except to the extent subsidiaries' earnings are considered permanently reinvested outside the U.S. As of January 31,
2014
, the cumulative amount of earnings upon which U.S. income taxes have not been provided was $
1,690.0 million
. The unrecognized deferred tax liability for these earnings was approximately $
491.4 million
.
2014 Form 10-K 82
Realization of the Company's net deferred tax assets of $
187.9 million
is dependent upon the Company's ability to generate future taxable income in appropriate tax jurisdictions to obtain benefit from the reversal of temporary differences, net operating loss carryforwards and tax credits. The amount of deferred tax assets considered realizable is subject to adjustment in future periods if estimates of future taxable income are reduced.
As of January 31,
2014
, Autodesk had $
17.0 million
of cumulative federal tax loss carryforwards and $
322.9 million
of cumulative state tax loss carryforwards, which may be available to reduce future income tax liabilities in certain jurisdictions. These federal and state tax loss carryforwards will expire beginning fiscal
2015
through fiscal
2033
and fiscal
2015
through fiscal
2033
, respectively. Autodesk also had
$9.8 million
of cumulative federal and state capital loss carryforwards as of January 31, 2014 which are available to offset future capital gains through fiscal 2018.
As of January 31,
2014
, Autodesk had $
96.1 million
of cumulative federal research tax credit carryforwards, $
49.8 million
of cumulative California state research tax credit carryforwards and $
63.4 million
of cumulative Canadian federal tax credit carryforwards, which may be available to reduce future income tax liabilities in the respective jurisdictions. The federal credit carryforwards will expire beginning fiscal
2020
through fiscal
2034
, the state credit carryforwards may reduce future California income tax liabilities indefinitely, and the Canadian tax credit carryforwards will expire beginning fiscal
2024
through fiscal
2034
. Autodesk also has $
107.6 million
of cumulative foreign tax credit carryforwards, which may be available to reduce future U. S. tax liabilities. The foreign tax credit will expire beginning fiscal
2019
through fiscal
2025
.
Utilization of net operating losses and tax credits may be subject to an annual limitation due to ownership change limitations provided in the Internal Revenue Code and similar state provisions. This annual limitation may result in the expiration of net operating losses and credits before utilization.
As a result of certain business and employment actions and capital investments undertaken by Autodesk, income earned in certain Europe and Asia Pacific countries is subject to reduced tax rates through fiscal and
2016
and
2019
, respectively with extensions available with incremental business and employment actions. The net income tax benefits attributable to the tax status of these business arrangements are estimated to be $
9.7 million
($
0.04
basic net income per share) in fiscal
2014
, $
6.6 million
($
0.03
basic net income per share) in fiscal
2013
and
$10.4 million
($
0.05
basic net income per share) in fiscal
2012
. The income tax benefits were offset partially by accruals of U.S. income taxes on undistributed earnings, among other factors.
As of January 31,
2014
, the Company had $
222.1 million
of gross unrecognized tax benefits, of which $
214.5 million
would impact the effective tax rate, if recognized. It is possible that the amount of unrecognized tax benefits will change in the next twelve months; however an estimate of the range of the possible change cannot be made at this time.
A reconciliation of the beginning and ending amount of the gross unrecognized tax benefits is as follows:
|
Fiscal Year Ended January 31,
|
|||||||||||
|
2014
|
2013
|
2012
|
|||||||||
|
Gross unrecognized tax benefits at the beginning of the fiscal year
|
$
|
212.7
|
|
$
|
201.1
|
|
$
|
188.4
|
|
||
|
Increases for tax positions of prior years
|
1.8
|
|
0.4
|
|
0.4
|
|
|||||
|
Decreases for tax positions of prior years
|
(0.3
|
)
|
(0.4
|
)
|
(0.4
|
)
|
|||||
|
Increases for tax positions related to the current year
|
15.3
|
|
17.8
|
|
14.3
|
|
|||||
|
Decreases for lapse of statute of limitations/audit settlements
|
(7.4
|
)
|
(6.2
|
)
|
(1.6
|
)
|
|||||
|
Gross unrecognized tax benefits at the end of the fiscal year
|
$
|
222.1
|
|
$
|
212.7
|
|
$
|
201.1
|
|
||
It is the Company's continuing practice to recognize interest and/or penalties related to income tax matters in income tax expense. The Company had $
2.8 million
, $
1.9 million
and $
2.4 million
, net of tax benefit, accrued for interest and zero accrued for penalties related to unrecognized tax benefits as of January 31,
2014
,
2013
and
2012
, respectively.
Autodesk and its subsidiaries are subject to income tax in the United States as well as numerous state and foreign jurisdictions. The Company's U.S. and state income tax returns for fiscal year
2003
through fiscal year
2014
remain open to examination. In addition, the Company files tax returns in multiple foreign taxing jurisdictions with open tax years ranging from fiscal year
2003
to
2014
.
2014 Form 10-K 83
5
.
Acquisitions
During the fiscal years ended
January 31, 2014
and
January 31, 2013
, Autodesk completed the business combinations and technology purchases described below. The results of operations for the following acquisitions are included in the accompanying
Consolidated Statement of Operations
since their respective acquisition dates. Pro forma results of operations have not been presented because the effects of the following acquisitions, individually and in the aggregate, were not material to Autodesk's Consolidated Financial Statements.
For acquisitions accounted for as business combinations, Autodesk recorded the tangible and intangible assets acquired and liabilities assumed based on their estimated fair values at the date of acquisition. The fair values assigned to the identifiable intangible assets acquired were based on estimates and assumptions determined by management. Autodesk recorded the excess of consideration transferred over the aggregate fair values as goodwill.
Fiscal
2014
Acquisitions
On November 21, 2013, Autodesk acquired all of the outstanding shares of Graitec SA (“Graitec”) for total cash consideration of
$87.0 million
. The acquisition will enhance Autodesk’s current offerings for structural engineering and expand its portfolio of technology for Building Information Modeling ("BIM") for structural fabrication and detailing. Graitec will be integrated into Autodesk’s AEC segment. The amount of goodwill that is expected to be deductible for tax purposes is $
73.4 million
.
During the fiscal year ended January 31, 2014, Autodesk also completed
14
other business combination and technology acquisitions for total cash consideration of approximately
$89.7 million
. These business combinations and technology acquisitions were not material individually or in aggregate to Autodesk's Consolidated Financial Statements.
The following table summarizes the fair value of the assets acquired and liabilities assumed by major class for each of the business combinations and technology acquisitions completed during the fiscal year ended
January 31, 2014
:
|
Graitec
|
Other
|
||||||
|
Developed technologies
|
$
|
15.9
|
|
$
|
15.9
|
|
|
|
Customer relationships
|
2.2
|
|
2.8
|
|
|||
|
Trade name
|
1.7
|
|
1.8
|
|
|||
|
User List
|
—
|
|
—
|
|
|||
|
Goodwill
|
73.4
|
|
67.0
|
|
|||
|
Deferred Revenue (current and non-current)
|
—
|
|
—
|
|
|||
|
Deferred tax (liability) asset
|
(6.2
|
)
|
0.7
|
|
|||
|
Net tangible assets (liabilities)
|
—
|
|
1.5
|
|
|||
|
$
|
87.0
|
|
$
|
89.7
|
|
||
For Graitec, the allocation of purchase price consideration to the assets and liabilities is not yet finalized. The allocation of the purchase price consideration was based upon a preliminary valuation and Autodesk's estimates and assumptions are subject to change within the measurement period (up to one year from the acquisition date). The primary areas of the preliminary purchase price allocation that are not yet finalized are amounts for income tax assets and liabilities, pending finalization of estimates and assumptions in respect of certain tax aspects of the transaction and residual goodwill.
Fiscal
2013
Acquisitions
On June 7, 2012, Autodesk acquired Vela Systems, Inc. (“Vela”) for total cash consideration of $
76.0 million
. Vela was a privately owned company that provides a cloud-based mobile platform that delivers critical information to the construction and capital projects market. Prior to acquiring Vela, Autodesk had an equity investment with the company that had an acquisition-date fair value of $
6.8 million
using a market approach to value the investment. Valuations using the market approach reflect relevant observable information generated by market transactions involving comparable businesses. As a result of the acquisition, Autodesk recorded a $
3.3 million
gain on the sale of the investment. Vela has been integrated into, and the related
2014 Form 10-K 84
goodwill was assigned to, Autodesk's AEC segment. The amount of goodwill that is expected to be deductible for tax purposes is
zero
.
On August 1, 2012, Autodesk acquired Socialcam, Inc, (“Socialcam”) for total cash consideration of $
59.5 million
. Socialcam was a privately held web-based company offering a smartphone application and web-based service that allows users to capture, edit, and share video. Of the $
59.5 million
, Autodesk incurred $
16.6 million
relating to the acceleration of vesting of equity awards held in Socialcam for Socialcam employees immediately prior to the acquisition. The $
16.6 million
stock based compensation charge is included in "Research and development" in the Consolidated Statement of Operations. Socialcam has been integrated into, and the related goodwill was assigned to, Autodesk’s PSEB segment. The amount of goodwill that is expected to be deductible for tax purposes is
zero
.
On October 4, 2012, Autodesk acquired Qontext, an enterprise business and social collaboration software solution, from India-based Pramati Technologies for $
26.0 million
and hired the Qontext development team. This acquisition is expected to accelerate Autodesk’s ongoing move to the cloud and expansion of social capabilities in the Autodesk 360 cloud-based service. Treated as a business combination, Qontext has been integrated into, and the related goodwill was assigned to, Autodesk’s PSEB segment. The amount of goodwill that is expected to be deductible for tax purposes is $
24.0 million
.
On December 21, 2012, Autodesk acquired PI-VR GmbH (“PI-VR”) for approximately
$48.6 million
. PI-VR was a privately held company based in Berlin, Germany that specializes in sophisticated real time visualization technology used primarily in the automotive industry. PI-VR has been integrated, and the related goodwill was assigned to, Autodesk's MFG segment. The amount of goodwill that is expected to be deductible for tax purposes is zero.
During the fiscal year ended January 31, 2013, Autodesk also completed
nine
other business combination and technology acquisitions for total cash consideration of approximately $
63.2 million
. These business combinations and technology acquisitions were not material individually or in aggregate to Autodesk's Consolidated Financial Statements.
The following table summarizes the fair value of the assets acquired and liabilities assumed by major class for each of the business combinations and technology acquisitions completed during the fiscal year ended
January 31, 2013
:
|
Vela
|
Socialcam
|
Qontext
|
PI-VR
|
Other
|
|||||||||||||||
|
Developed technologies
|
$
|
5.9
|
|
$
|
1.9
|
|
$
|
2.0
|
|
$
|
7.6
|
|
$
|
13.6
|
|
||||
|
Customer relationships
|
3.6
|
|
—
|
|
—
|
|
6.7
|
|
1.5
|
|
|||||||||
|
Trade name
|
2.6
|
|
5.3
|
|
—
|
|
1.9
|
|
2.0
|
|
|||||||||
|
User List
|
—
|
|
22.3
|
|
—
|
|
—
|
|
—
|
|
|||||||||
|
Goodwill
|
57.5
|
|
23.0
|
|
24.0
|
|
36.8
|
|
46.1
|
|
|||||||||
|
Deferred Revenue
|
(2.0
|
)
|
—
|
|
—
|
|
(0.1
|
)
|
—
|
|
|||||||||
|
Deferred tax asset (liability)
|
3.9
|
|
(9.4
|
)
|
—
|
|
(5.0
|
)
|
—
|
|
|||||||||
|
Net tangible assets (liabilities)
|
4.5
|
|
(0.2
|
)
|
—
|
|
0.7
|
|
—
|
|
|||||||||
|
Total
|
$
|
76.0
|
|
$
|
42.9
|
|
$
|
26.0
|
|
$
|
48.6
|
|
$
|
63.2
|
|
||||
6
.
Deferred Compensation
At
January 31, 2014
, Autodesk had marketable securities totaling $
691.4 million
, of which $
38.9 million
related to investments in debt and equity securities that are held in a rabbi trust under non-qualified deferred compensation plans. The total related deferred compensation liability was $
38.9 million
at
January 31, 2014
, of which $
1.9 million
was classified as current and $
37.0 million
was classified as non-current liabilities. The value of debt and equity securities held in the rabbi trust at
January 31, 2013
was $
35.3 million
. The total related deferred compensation liability at
January 31, 2013
was $
35.3 million
, of which $
3.9 million
was classified as current and $
31.4 million
was classified as non-current liabilities. The securities are recorded in the Consolidated Balance Sheets under the current portion of "Marketable Securities". The current and non-current portions of the liability are recorded in the Consolidated Balance Sheets under “Accrued compensation” and “Other liabilities,” respectively.
2014 Form 10-K 85
7
.
Borrowing Arrangements
In December 2012, Autodesk issued $
400.0 million
aggregate principal amount of
1.95%
senior notes due
December 15, 2017
and $
350.0 million
aggregate principal amount of
3.6%
senior notes due
December 15, 2022
, (collectively, the "Senior Notes"). Autodesk received net proceeds of $
739.3 million
from issuance of the Senior Notes, net of a discount of $
4.5 million
and issuance costs of $
6.1 million
. Both the discount and issuance costs are being amortized to interest expense over the respective terms of the Senior Notes using the effective interest method. In the fourth quarter of fiscal 2013, Autodesk used a portion of the proceeds to re-pay the outstanding balance of the credit facility. The remaining proceeds from the Senior Notes are available for general corporate purposes. Autodesk may redeem the Senior Notes at any time, subject to a make whole premium. In addition, upon the occurrence of certain change of control triggering events, Autodesk may be required to repurchase the Senior Notes, at a price equal to
101%
of their principal amount, plus accrued and unpaid interest to the date of repurchase. The Senior Notes contain restrictive covenants that limit our ability to create certain liens, to enter into certain sale and leaseback transactions and to consolidate or merge with, or convey, transfer or lease all or substantially all of our assets, subject to significant qualifications and exceptions. Based on quoted market prices, the fair value of the Senior Notes was approximately $
738.0 million
as of
January 31, 2014
.
Autodesk’s line of credit facility permits unsecured short-term borrowings of up to $
400.0 million
with an option to request an increase in the amount of the credit facility by up to an additional $
100.0 million
, and is available for working capital or other business needs. This credit agreement contains customary covenants that could restrict the imposition of liens on Autodesk’s assets, and restrict the Company’s ability to incur additional indebtedness or make dispositions of assets if Autodesk fails to maintain the financial covenants. The line of credit is syndicated with various financial institutions, including Citibank, N.A., an affiliate of Citigroup, which is one of the lead lenders and an agent. In May 2013, Autodesk amended and restated the credit agreement extending the facility's maturity date from May 2016 to
May 2018
and reducing facility fees and lowering borrowing costs by aligning margins with our recent public investment grade credit ratings. At
January 31, 2014
and
January 31, 2013
, Autodesk had
no
outstanding borrowings on this line of credit.
8
.
Commitments and Contingencies
Lease commitments
Autodesk leases office space and computer equipment under non-cancellable operating lease agreements that expire at various dates through
fiscal 2024
. The leases generally provide that Autodesk pay taxes, insurance and maintenance expenses related to the leased assets. Certain of these lease arrangements contain escalation clauses whereby monthly rent increases over time. At
January 31, 2014
, the aggregate future minimum lease payments required were as follows:
|
2015
|
$
|
53.1
|
|
|
2016
|
47.0
|
|
|
|
2017
|
39.5
|
|
|
|
2018
|
35.7
|
|
|
|
2019
|
26.1
|
|
|
|
Thereafter
|
38.5
|
|
|
|
239.9
|
|
||
|
Less: Sublease income
|
2.9
|
|
|
|
$
|
237.0
|
|
|
Rent expense related to these operating leases recognized on a straight-line basis over the lease period, was as follows:
|
|
Fiscal Year Ended January 31,
|
||||||||||
|
|
2014
|
2013
|
2012
|
||||||||
|
Rent expense
|
$
|
50.2
|
|
$
|
56.1
|
|
$
|
53.0
|
|
||
2014 Form 10-K 86
Purchase commitments
In the normal course of business, Autodesk enters into various purchase commitments for goods or services. Total non-cancellable purchase commitments as of
January 31, 2014
were approximately $
65.3 million
for periods through fiscal 2017
These purchase commitments primarily result from contracts for the acquisition of IT infrastructure, marketing and software development services.
Autodesk has certain royalty commitments associated with the shipment and licensing of certain products. Royalty expense is generally based on a dollar amount per unit shipped or a percentage of the underlying revenue. Royalty expense, which was recorded under cost of license and other revenue on Autodesk’s Consolidated Statements of Operations, was $
18.0 million
in fiscal
2014
, $
16.4 million
in fiscal
2013
and $
16.5 million
in fiscal
2012
.
Guarantees and Indemnifications
In the normal course of business, Autodesk provides indemnifications of varying scopes, including limited product warranties and indemnification of customers against claims of intellectual property infringement made by third parties arising from the use of its products or services. Autodesk accrues for known indemnification issues if a loss is probable and can be reasonably estimated. Historically, costs related to these indemnifications have not been significant, and because potential future costs are highly variable, Autodesk is unable to estimate the maximum potential impact of these indemnifications on its future results of operations.
In connection with the purchase, sale or license of assets or businesses with third parties, Autodesk has entered into or assumed customary indemnification agreements related to the assets or businesses purchased, sold or licensed. Historically, costs related to these indemnifications have not been significant, and because potential future costs are highly variable, Autodesk is unable to estimate the maximum potential impact of these indemnifications on its future results of operations.
As permitted under Delaware law, Autodesk has agreements whereby it indemnifies its officers and directors for certain events or occurrences while the officer or director is, or was, serving at Autodesk’s request in such capacity. The maximum potential amount of future payments Autodesk could be required to make under these indemnification agreements is unlimited; however, Autodesk has directors’ and officers’ liability insurance coverage that is intended to reduce its financial exposure and may enable Autodesk to recover a portion of any future amounts paid. Autodesk believes the estimated fair value of these indemnification agreements in excess of applicable insurance coverage is minimal.
Legal Proceedings
Autodesk is involved in a variety of claims, suits, investigations and proceedings in the normal course of business activities including claims of alleged infringement of intellectual property rights, commercial, employment, piracy prosecution, business practices and other matters. In the Company's opinion, resolution of pending matters is not expected to have a material adverse impact on its consolidated results of operations, cash flows or its financial position. Given the unpredictable nature of legal proceedings, there is a reasonable possibility that an unfavorable resolution of one or more such proceedings could in the future materially affect the Company's results of operations, cash flows or financial position in a particular period, however, based on the information known by the Company as of the date of this filing and the rules and regulations applicable to the preparation of the Company's financial statements, any such amount is either immaterial or it is not possible to provide an estimated amount of any such potential loss.
9
.
Stockholders' Equity
Preferred Stock
Under Autodesk’s Certificate of Incorporation,
2.0 million
shares of preferred stock are authorized. At
January 31, 2014
, there were no preferred shares issued or outstanding. The Board of Directors has the authority to issue the preferred stock in one or more series and to fix rights, preferences, privileges and restrictions, including dividends and the number of shares constituting any series or the designation of such series, without any further vote or action by the stockholders.
Common Stock Repurchase Programs
Autodesk has a stock repurchase program that is used to offset dilution from the issuance of stock under the Company’s employee stock plans and for such other purposes as may be in the interests of Autodesk and its stockholders, which has the
2014 Form 10-K 87
effect of returning excess cash generated from the Company’s business to stockholders. Autodesk repurchased and retired
10.5 million
shares in fiscal
2014
at an average repurchase price of $
40.43
per share,
12.5 million
shares in fiscal
2013
at an average repurchase price of $
34.50
per share and
9.7 million
shares in fiscal
2012
at an average repurchase price of $
33.71
.
At
January 31, 2014
,
21.8 million
shares remained available for repurchase under the repurchase program approved by the Board of Directors. The number of shares acquired and the timing of the purchases are based on several factors, including general market and economic conditions, the number of employee stock option exercises and stock issuances, the trading price of Autodesk common stock, cash on hand and available in the United States, cash requirements for acquisitions, and Company defined trading windows.
10
.
Interest and Other (Expense) Income, net
Interest and other income, net, consists of the following:
|
|
Fiscal Year Ended January 31,
|
||||||||||
|
|
2014
|
2013
|
2012
|
||||||||
|
Interest and investm
ent (expense) income,
net (1)
|
$
|
(9.8
|
)
|
$
|
4.9
|
|
$
|
5.4
|
|
||
|
Gain (loss) on foreign currency
|
4.0
|
|
1.2
|
|
(1.1
|
)
|
|||||
|
(Loss) gain
on strategic investments (1)
|
(1.8
|
)
|
(4.0
|
)
|
0.3
|
|
|||||
|
Other income
|
2.7
|
|
2.0
|
|
2.7
|
|
|||||
|
Interest and other (expense) income, net
|
$
|
(4.9
|
)
|
$
|
4.1
|
|
$
|
7.3
|
|
||
|
(1)
|
For comparability, the presentation of the balances at January 31, 2012 was adjusted to align to current year presentation.
|
11
.
Accumulated Other Comprehensive (Loss) Income
Accumulated other comprehensive (loss) income, net of taxes, was comprised of the following at January 31:
|
|
2014
|
2013
|
2012
|
||||||||
|
Net gain on derivative instruments
|
$
|
3.5
|
|
$
|
2.8
|
|
$
|
9.2
|
|
||
|
Net unrealized
gain
on available-for-sale securities (1)
|
1.8
|
|
2.9
|
|
1.4
|
|
|||||
|
Defined benefit pension items (1)
|
(7.7
|
)
|
(13.1
|
)
|
(7.8
|
)
|
|||||
|
Foreign currency translation adjustments (1)
|
1.8
|
|
1.7
|
|
3.1
|
|
|||||
|
Accumulated other comprehensive (loss)
|
$
|
(0.6
|
)
|
$
|
(5.7
|
)
|
$
|
5.9
|
|
||
(1) For comparability, the presentation of the balances at January 31, 2013 and January 31, 2012 were adjusted to align with current year presentation.
Pre-tax reclassifications from “
Accumulated other comprehensive (loss)
” to the Company's Consolidated Statement of Operations for the twelve months ended
January 2014
were $
12.9 million
.
2014 Form 10-K 88
12
.
Net Income Per Share
Basic net income per share is computed using the weighted average number of shares of common stock outstanding for the period, excluding stock options and restricted stock units. Diluted net income per share is based upon the weighted average number of shares of common stock outstanding for the period and potentially dilutive common shares, including the effect of stock options and restricted stock units under the treasury stock method. The following table sets forth the computation of the numerators and denominators used in the basic and diluted net income per share amounts:
|
|
Fiscal Year Ended January 31,
|
||||||||||
|
|
2014
|
2013
|
2012
|
||||||||
|
Numerator:
|
|||||||||||
|
Net income
|
$
|
228.8
|
|
$
|
247.4
|
|
$
|
285.3
|
|
||
|
Denominator:
|
|||||||||||
|
Denominator for basic net income per share—weighted average shares
|
224.0
|
|
226.4
|
|
227.7
|
|
|||||
|
Effect of dilutive securities
|
5.6
|
|
5.3
|
|
5.6
|
|
|||||
|
Denominator for dilutive net income per share
|
229.6
|
|
231.7
|
|
233.3
|
|
|||||
|
Basic net income per share
|
$
|
1.02
|
|
$
|
1.09
|
|
$
|
1.25
|
|
||
|
Diluted net income per share
|
$
|
1.00
|
|
$
|
1.07
|
|
$
|
1.22
|
|
||
The computation of diluted net income per share does not include shares that are anti-dilutive under the treasury stock method because their exercise prices are higher than the average market value of Autodesk’s stock during the fiscal year. For the fiscal years ended
January 31, 2014
,
2013
and
2012
,
5.4 million
,
9.6 million
and
12.9 million
potentially anti-dilutive shares, respectively, were excluded from the computation of net income per share.
13
.
Segments
Autodesk reports segment information based on the “management” approach. The management approach designates the internal reporting used by management for making decisions and assessing performance as the source of the Company’s reportable segments. Autodesk has four reportable segments: PSEB, AEC, MFG and M&E. Autodesk has no material inter-segment revenue.
The PSEB, AEC and MFG segments derive revenue from the sale of licenses for software products and services to customers who design, build, manage or own building, manufacturing and infrastructure projects. Autodesk's M&E segment derives revenue from the sale of products to creative professionals, post-production facilities and broadcasters for a variety of applications, including feature films, television programs, commercials, music and corporate videos, interactive game production, web design and interactive web streaming.
PSEB includes Autodesk’s design product, AutoCAD. Autodesk’s AutoCAD product is a platform product that underpins the Company’s design product offerings for the industries it serves. For example, AEC and MFG offer tailored versions of AutoCAD software for the industries they serve. Autodesk’s AutoCAD product also provides a platform for Autodesk’s developer partners to build custom solutions for a range of diverse design-oriented markets. PSEB's revenue primarily includes revenue from sales of AutoCAD and AutoCAD LT, the Autodesk Design Suite and many other design products, including consumer design products, as well as from sales of licenses of other Autodesk's design products.
AEC software products help to improve the way building, civil infrastructure, process plant and construction projects are designed, built and managed. A broad portfolio of solutions enables greater efficiency, accuracy and sustainability across the entire project lifecycle. Autodesk AEC solutions include advanced technology for BIM, AutoCAD-based design and documentation productivity software, sustainable design analysis applications, and collaborative project management solutions. BIM, an integrated process for building and infrastructure design, analysis, documentation and construction, uses consistent, coordination information to improve communication and collaboration between the extended project team. AEC provides a comprehensive portfolio of BIM solutions that help customers deliver projects faster and more economically, while minimizing environmental impact. AEC’s revenue primarily includes revenue from the sales of licenses of Autodesk Building Design Suites, AutoCAD Civil 3D, AutoCAD Map, and Autodesk Infrastructure Design Suites.
2014 Form 10-K 89
MFG provides the manufacturers in automotive and transportation, industrial machinery, consumer products and building products with comprehensive digital prototyping solutions that bring together design data from all phases of the product development process to develop a single digital model created in Autodesk Inventor software. Autodesk’s solutions for digital prototyping enable a broad group of manufacturers to realize benefits with minimal disruption to existing workflows. MFG’s revenue primarily includes revenue from the sales of licenses of Autodesk Product Design Suites, AutoCAD Mechanical, and Autodesk Moldflow products.
M&E consists of two product groups: Animation, including design visualization, and Creative Finishing. Animation products, such as Autodesk Maya, Autodesk 3ds Max, and the Autodesk Entertainment Creation Suites, provide tools for digital sculpting, modeling, animation, effects, rendering and compositing, for design visualization, visual effects and games production. M&E products are also included in a number of PSEB, AEC, and MFG focused suites. Creative Finishing products provide editing, finishing and visual effects design and color grading.
All of Autodesk’s reportable segments distribute their respective products primarily through authorized resellers and distributors and, to a lesser extent, through direct sales to end-users.
The accounting policies of the reportable segments are the same as those described in Note
1
, “
Business and Summary of Significant Accounting Policies
.” Autodesk evaluates each segment’s performance on the basis of gross profit. Autodesk currently does not separately accumulate and report asset information by segment, except for goodwill, which is disclosed in Note
1
, “
Business and Summary of Significant Accounting Policies
.”
2014 Form 10-K 90
Information concerning the operations of Autodesk’s reportable segments is as follows:
|
|
Fiscal year ended January 31,
|
||||||||||
|
|
2014
|
2013
|
2012
|
||||||||
|
Net revenue:
|
|||||||||||
|
Platform Solutions and Emerging Business (1)
|
$
|
789.2
|
|
$
|
843.0
|
|
$
|
833.1
|
|
||
|
Architecture, Engineering and Construction (1)
|
730.6
|
|
701.1
|
|
626.4
|
|
|||||
|
Manufacturing
|
579.4
|
|
573.8
|
|
540.3
|
|
|||||
|
Media and Entertainment (1)
|
174.7
|
|
194.3
|
|
215.8
|
|
|||||
|
$
|
2,273.9
|
|
$
|
2,312.2
|
|
$
|
2,215.6
|
|
|||
|
Gross profit:
|
|||||||||||
|
Platform Solutions and Emerging Business (1)
|
$
|
716.8
|
|
$
|
788.8
|
|
$
|
788.0
|
|
||
|
Architecture, Engineering and Construction (1)
|
663.8
|
|
642.0
|
|
569.7
|
|
|||||
|
Manufacturing
|
531.5
|
|
531.3
|
|
496.1
|
|
|||||
|
Media and Entertainment
|
137.8
|
|
156.5
|
|
174.6
|
|
|||||
|
Unallocated (2)
|
(50.3
|
)
|
(44.9
|
)
|
(41.9
|
)
|
|||||
|
$
|
1,999.6
|
|
$
|
2,073.7
|
|
$
|
1,986.5
|
|
|||
|
Depreciation, amortization and accretion:
|
|||||||||||
|
Platform Solutions and Emerging Business
|
$
|
5.5
|
|
$
|
1.8
|
|
$
|
1.8
|
|
||
|
Architecture, Engineering and Construction
|
0.2
|
|
0.2
|
|
0.7
|
|
|||||
|
Manufacturing
|
0.9
|
|
0.5
|
|
1.7
|
|
|||||
|
Media and Entertainment
|
0.2
|
|
0.4
|
|
0.5
|
|
|||||
|
Unallocated
|
122.1
|
|
124.9
|
|
110.8
|
|
|||||
|
$
|
128.9
|
|
$
|
127.8
|
|
$
|
115.5
|
|
|||
_______________
|
(1)
|
Prior period segment revenue amounts have been updated to conform with the current period's presentation.
|
|
(2)
|
Unallocated amounts primarily relate to corporate expenses and other costs and expenses that are managed outside the reportable segments, including stock-based compensation expense.
|
Information regarding Autodesk’s operations by geographic area is as follows:
|
|
Fiscal year ended January 31,
|
||||||||||
|
|
2014
|
2013
|
2012
|
||||||||
|
Net revenue:
|
|||||||||||
|
Americas
|
|||||||||||
|
U.S.
|
$
|
672.3
|
|
$
|
672.1
|
|
$
|
631.0
|
|
||
|
Other Americas
|
146.6
|
|
164.1
|
|
167.5
|
|
|||||
|
Total Americas
|
818.9
|
|
836.2
|
|
798.5
|
|
|||||
|
Europe, Middle East and Africa
|
851.8
|
|
868.5
|
|
862.2
|
|
|||||
|
Asia Pacific
|
|||||||||||
|
Japan
|
274.5
|
|
278.3
|
|
240.5
|
|
|||||
|
Other Asia Pacific
|
328.7
|
|
329.2
|
|
314.4
|
|
|||||
|
Total Asia Pacific
|
603.2
|
|
607.5
|
|
554.9
|
|
|||||
|
Total net revenue
|
$
|
2,273.9
|
|
$
|
2,312.2
|
|
$
|
2,215.6
|
|
||
2014 Form 10-K 91
|
|
January 31,
|
||||||
|
|
2014
|
2013
|
|||||
|
Long-lived assets (1):
|
|||||||
|
Americas
|
|||||||
|
U.S.
|
$
|
1,041.9
|
|
$
|
964.0
|
|
|
|
Other Americas
|
37.1
|
|
39.6
|
|
|||
|
Total Americas
|
1,079.0
|
|
1,003.6
|
|
|||
|
Europe, Middle East and Africa
|
228.6
|
|
168.4
|
|
|||
|
Asia Pacific
|
44.0
|
|
50.1
|
|
|||
|
Total long-lived assets
|
$
|
1,351.6
|
|
$
|
1,222.1
|
|
|
____________________
|
(1)
|
Long-lived assets exclude deferred tax assets and marketable securities.
|
14
.
Retirement Benefit Plans
Pretax Savings Plan
Autodesk has a 401(k) plan that covers nearly all U.S. employees. Eligible employees may contribute up to 50% of their pretax salary, subject to limitations mandated by the Internal Revenue Service. Autodesk makes voluntary cash contributions and matches a portion of employee contributions in cash. Autodesk’s contributions were $
8.1 million
in fiscal
2014
, $
7.9 million
in fiscal
2013
and $
7.3 million
in fiscal
2012
. Autodesk does not allow participants to invest in Autodesk common stock through the 401(k) plan.
Other Plans
Autodesk provides certain defined benefit pension plans to employees primarily located in countries outside of the U.S. The Company deposits funds for specific plans, consistent with the requirements of local law, with insurance companies or third-party trustees, and accrues for the unfunded portion of the obligation, where material. The assumptions used in calculating the obligation for these plans depend on the local economic environment. The net liability related to the funded status of the plans was approximately $
21.5 million
and $
24.0 million
as of
January 31, 2014
and
2013
, respectively. The projected benefit obligation was $
62.2 million
and $
61.5 million
as of
January 31, 2014
and
2013
, respectively. The related fair value of plan assets was $
40.7 million
and $
37.5 million
as of
January 31, 2014
and
2013
, respectively. Autodesk's practice is to fund the pension plans in amounts at least sufficient to meet the minimum requirements of local laws and regulations. The assets of the plans are primarily invested in high quality fixed income investments. Autodesk's contributions were approximately $
6.0 million
, $
5.4 million
and $
4.2 million
in fiscal
2014
,
2013
and
2012
, respectively. As of
January 31, 2014
, Autodesk's estimated future benefit payments are an aggregate $
11.4 million
for
fiscal 2015 through fiscal 2019
and an aggregate of $
9.8 million
for
fiscal 2020 through fiscal 2024
. Autodesk recorded $
7.7 million
and $
13.1 million
of unrealized changes in the unfunded portion of Autodesk’s defined benefit plans in fiscal
2014
and fiscal
2013
, respectively.
Autodesk also provides defined contribution plans in certain foreign countries where required by statute. Autodesk’s funding policy for foreign defined contribution plans is consistent with the local requirements in each country. Autodesk’s contributions to these plans were $
22.3 million
in fiscal
2014
, $
21.5 million
in fiscal
2013
and $
20.4 million
in fiscal
2012
.
In addition, Autodesk offers a non-qualified deferred compensation plan to certain key employees whereby they may defer a portion (or all) of their annual compensation until retirement or a different date specified by the employee in accordance with terms of the plan. See Note
6
, “
Deferred Compensation
,” for further discussion.
15
.
Restructuring Reserves
During the third quarter of fiscal 2014, the Board of Directors of the Company approved a world-wide restructuring plan in order to re-balance staffing levels to better align them with the evolving needs of the business. The Company authorized plan included a reduction of approximately
85
positions and the consolidation of
four
leased facilities, with a total cost of approximately
$15.0 million
("Fiscal 2014 Plan"). The Company expects to substantially pay the one-time termination benefits and facility related liabilities related to the Fiscal 2014 Plan by the end of its first quarter of fiscal 2015.
2014 Form 10-K 92
During the third quarter of fiscal 2013, the Board of Directors of the Company approved a world-wide restructuring plan in line with the Company's strategy, including its continuing shift to cloud and mobile computing ("Fiscal 2013 Plan"). The approved plan resulted in a reduction of approximately
500
positions and the consolidation of
eight
leased facilities, with an aggregate charge of
$46.2 million
to date. As of
January 31, 2014
, the personnel and facilities related actions included in this restructuring plan were substantially complete.
The following table sets forth the restructuring activities for the fiscal years ended
January 31, 2014
and
2013
:
|
Balances, January 31, 2013
|
Additions
|
Payments
|
Adjustments (1)
|
Balances, January 31, 2014
|
|||||||||||||||
|
Fiscal 2013 Plan
|
|||||||||||||||||||
|
Employee termination costs
|
$
|
4.5
|
|
$
|
0.8
|
|
$
|
(5.0
|
)
|
$
|
(0.2
|
)
|
$
|
0.1
|
|
||||
|
Lease termination and asset costs
|
2.8
|
|
1.5
|
|
(4.2
|
)
|
0.1
|
|
0.2
|
|
|||||||||
|
Fiscal 2014 Plan
|
|||||||||||||||||||
|
Employee termination costs
|
$
|
—
|
|
9.4
|
(5.7
|
)
|
(0.2
|
)
|
$
|
3.5
|
|
||||||||
|
Lease termination and asset costs
|
$
|
—
|
|
1.1
|
—
|
|
0.2
|
|
$
|
1.3
|
|
||||||||
|
Total
|
$
|
7.3
|
|
12.8
|
|
(14.9
|
)
|
(0.1
|
)
|
$
|
5.1
|
|
|||||||
|
Current portion (2)
|
$
|
5.8
|
|
$
|
4.0
|
|
|||||||||||||
|
Non-current portion (2)
|
1.5
|
|
1.1
|
|
|||||||||||||||
|
Total
|
$
|
7.3
|
|
$
|
5.1
|
|
|||||||||||||
____________________
|
(1)
|
Adjustments include the impact of foreign currency translation.
|
|
(2)
|
The current and non-current portions of the reserve are recorded in the Consolidated Balance Sheets under “Other accrued liabilities” and “Other liabilities,” respectively.
|
|
Balances, January 31, 2012
|
Additions
|
Payments
|
Adjustments (1)
|
Balances, January 31, 2013
|
|||||||||||||||
|
Fiscal 2013 Plan
|
|||||||||||||||||||
|
Employee termination costs
|
$
|
—
|
|
$
|
41.0
|
|
$
|
(36.1
|
)
|
$
|
(0.4
|
)
|
$
|
4.5
|
|
||||
|
Lease termination and asset costs
|
—
|
|
3.3
|
|
(0.5
|
)
|
—
|
|
2.8
|
|
|||||||||
|
Total
|
$
|
—
|
|
$
|
44.3
|
|
$
|
(36.6
|
)
|
$
|
(0.4
|
)
|
$
|
7.3
|
|
||||
|
Current portion (2)
|
$
|
—
|
|
$
|
5.8
|
|
|||||||||||||
|
Non-current portion (2)
|
—
|
|
1.5
|
|
|||||||||||||||
|
Total
|
$
|
—
|
|
$
|
7.3
|
|
|||||||||||||
____________________
|
(1)
|
Adjustments include the impact of foreign currency translation.
|
|
(2)
|
The current and non-current portions of the reserve are recorded in the Consolidated Balance Sheets under “Other accrued liabilities” and “Other liabilities,” respectively.
|
2014 Form 10-K 93
16
.
Selected Quarterly Financial Information (Unaudited)
Summarized quarterly financial information for fiscal
2014
and
2013
is as follows:
|
2014
|
1st quarter
|
2nd quarter
|
3rd quarter
|
4th quarter
|
Fiscal year
|
||||||||||||||
|
Net revenue
|
$
|
570.4
|
|
$
|
561.7
|
|
$
|
555.2
|
|
$
|
586.6
|
|
$
|
2,273.9
|
|
||||
|
Gross profit
|
502.9
|
|
493.9
|
|
488.1
|
|
514.7
|
|
1,999.6
|
|
|||||||||
|
Income from operations
|
81.4
|
|
83.6
|
|
68.1
|
|
51.7
|
|
284.8
|
|
|||||||||
|
Provision for income taxes
|
(17.0
|
)
|
(20.1
|
)
|
(11.6
|
)
|
(2.4
|
)
|
(51.1
|
)
|
|||||||||
|
Net income
|
55.6
|
|
61.7
|
|
57.6
|
|
53.9
|
|
228.8
|
|
|||||||||
|
Basic net income per share
|
$
|
0.25
|
|
$
|
0.28
|
|
$
|
0.26
|
|
$
|
0.24
|
|
$
|
1.02
|
|
||||
|
Diluted net income per share
|
$
|
0.24
|
|
$
|
0.27
|
|
$
|
0.25
|
|
$
|
0.23
|
|
$
|
1.00
|
|
||||
|
Income from operations includes the following items:
|
|||||||||||||||||||
|
Stock-based compensation expense
|
$
|
33.5
|
|
$
|
31.0
|
|
$
|
31.6
|
|
$
|
36.1
|
|
$
|
132.2
|
|
||||
|
Amortization of acquisition related intangibles
|
21.6
|
|
20.3
|
|
18.2
|
|
20.6
|
|
80.7
|
|
|||||||||
|
Restructuring charges, net
|
0.4
|
|
1.7
|
|
4.4
|
|
6.3
|
|
12.8
|
|
|||||||||
|
2013
|
1st quarter
|
2nd quarter
|
3rd quarter
|
4th quarter
|
Fiscal year
|
||||||||||||||
|
Net revenue
|
$
|
588.6
|
|
$
|
568.7
|
|
$
|
548.0
|
|
$
|
606.9
|
|
$
|
2,312.2
|
|
||||
|
Gross profit
|
529.8
|
|
508.9
|
|
490.1
|
|
544.9
|
|
2,073.7
|
|
|||||||||
|
Income from operations
|
94.0
|
|
92.9
|
|
34.4
|
|
84.6
|
|
305.9
|
|
|||||||||
|
Provision for income taxes
|
(18.6
|
)
|
(27.5
|
)
|
(4.9
|
)
|
(11.6
|
)
|
(62.6
|
)
|
|||||||||
|
Net income
|
78.9
|
|
64.6
|
|
29.4
|
|
74.5
|
|
247.4
|
|
|||||||||
|
Basic net income per share
|
$
|
0.35
|
|
$
|
0.28
|
|
$
|
0.13
|
|
$
|
0.33
|
|
$
|
1.09
|
|
||||
|
Diluted net income per share
|
$
|
0.34
|
|
$
|
0.28
|
|
$
|
0.13
|
|
$
|
0.32
|
|
$
|
1.07
|
|
||||
|
Income from operations includes the following items:
|
|||||||||||||||||||
|
Stock-based compensation expense
|
$
|
33.4
|
|
$
|
33.5
|
|
$
|
51.9
|
|
$
|
37.5
|
|
$
|
156.3
|
|
||||
|
Amortization of acquisition related intangibles
|
17.6
|
|
17.5
|
|
23.7
|
|
23.0
|
|
81.8
|
|
|||||||||
|
Restructuring benefits, net
|
—
|
|
—
|
|
36.7
|
|
7.2
|
|
43.9
|
|
|||||||||
17
.
Subsequent Events
On February 6, 2014, Autodesk acquired the entire issued and to be issued share capital of Delcam plc (“Delcam”), for £
20.75
per share, or approximately £
174.6 million
or $
284.6 million
. Delcam was previously listed as a public company (LON: DLC) and is a leading supplier of advanced CADCAM and industrial measurement solutions for the manufacturing industry. With this transaction Autodesk gains Delcam’s range of design, manufacturing and inspection software that provide automated CADCAM solutions for a variety of industries, ranging from aerospace to toys and sports equipment. The transaction was structured as a cash offer for all the outstanding shares of Delcam, and Delcam will be integrated into Autodesk's Manufacturing reportable segment. The initial accounting for this acquisition was not complete as of March 10, 2014, due to the timing of the acquisition.
2014 Form 10-K 94
REPORT OF ERNST & YOUNG LLP, INDEPENDENT REGISTERED PUBLIC ACCOUNTING FIRM
The Board of Directors and Stockholders of Autodesk, Inc.
We have audited the accompanying consolidated balance sheets of Autodesk, Inc. as of
January 31, 2014
and
2013
, and the related consolidated statements of operations, comprehensive income, stockholders’ equity, and cash flows for each of the three years in the period ended
January 31, 2014
. Our audits also included the financial statement schedule listed in the Index at Item 15(a)(2). These financial statements and schedule are the responsibility of the Company’s management. Our responsibility is to express an opinion on these financial statements and schedule based on our audits.
We conducted our audits in accordance with the standards of the Public Company Accounting Oversight Board (United States). Those standards require that we plan and perform the audit to obtain reasonable assurance about whether the financial statements are free of material misstatement. An audit includes examining, on a test basis, evidence supporting the amounts and disclosures in the financial statements. An audit also includes assessing the accounting principles used and significant estimates made by management, as well as evaluating the overall financial statement presentation. We believe that our audits provide a reasonable basis for our opinion.
In our opinion, the financial statements referred to above present fairly, in all material respects, the consolidated financial position of Autodesk, Inc. at
January 31, 2014
and
2013
, and the consolidated results of its operations and its cash flows for each of the three years in the period ended
January 31, 2014
, in conformity with U.S. generally accepted accounting principles. Also, in our opinion, the related financial statement schedule, when considered in relation to the basic financial statements taken as a whole, presents fairly in all material respects the information set forth therein.
We also have audited, in accordance with the standards of the Public Company Accounting Oversight Board (United States), Autodesk, Inc.’s internal control over financial reporting as of
January 31, 2014
, based on criteria established in
Internal Control—Integrated Framework
issued by the Committee of Sponsoring Organizations of the Treadway Commission (1992 framework) and our report dated
March 10, 2014
expressed an unqualified opinion thereon.
/s/ E
RNST
& Y
OUNG
LLP
San Francisco, California
March 10, 2014
2014 Form 10-K 95
REPORT OF ERNST & YOUNG LLP, INDEPENDENT REGISTERED PUBLIC ACCOUNTING FIRM
The Board of Directors and Stockholders of Autodesk, Inc.
We have audited Autodesk, Inc.’s internal control over financial reporting as of
January 31, 2014
, based on criteria established in
Internal Control—Integrated Framework
issued by the Committee of Sponsoring Organizations of the Treadway Commission (1992 framework) (the COSO criteria). Autodesk, Inc.’s management is responsible for maintaining effective internal control over financial reporting, and for its assessment of the effectiveness of internal control over financial reporting included in the accompanying Management’s Report on Internal Control Over Financial Reporting. Our responsibility is to express an opinion on the company’s internal control over financial reporting based on our audit.
We conducted our audit in accordance with the standards of the Public Company Accounting Oversight Board (United States). Those standards require that we plan and perform the audit to obtain reasonable assurance about whether effective internal control over financial reporting was maintained in all material respects. Our audit included obtaining an understanding of internal control over financial reporting, assessing the risk that a material weakness exists, testing and evaluating the design and operating effectiveness of internal control based on the assessed risk, and performing such other procedures as we considered necessary in the circumstances. We believe that our audit provides a reasonable basis for our opinion.
A company’s internal control over financial reporting is a process designed to provide reasonable assurance regarding the reliability of financial reporting and the preparation of financial statements for external purposes in accordance with generally accepted accounting principles. A company’s internal control over financial reporting includes those policies and procedures that (1) pertain to the maintenance of records that, in reasonable detail, accurately and fairly reflect the transactions and dispositions of the assets of the company; (2) provide reasonable assurance that transactions are recorded as necessary to permit preparation of financial statements in accordance with generally accepted accounting principles, and that receipts and expenditures of the company are being made only in accordance with authorizations of management and directors of the company; and (3) provide reasonable assurance regarding prevention or timely detection of unauthorized acquisition, use, or disposition of the company’s assets that could have a material effect on the financial statements.
Because of its inherent limitations, internal control over financial reporting may not prevent or detect misstatements. Also, projections of any evaluation of effectiveness to future periods are subject to the risk that controls may become inadequate because of changes in conditions, or that the degree of compliance with the policies or procedures may deteriorate.
In our opinion, Autodesk, Inc. maintained, in all material respects, effective internal control over financial reporting as of
January 31, 2014
, based on the COSO criteria.
We also have audited, in accordance with the standards of the Public Company Accounting Oversight Board (United States), the consolidated balance sheets of Autodesk, Inc. as of
January 31, 2014
and
2013
, and the related consolidated statements of operations, comprehensive income, stockholders’ equity, and cash flows for each of the three years in the period ended
January 31, 2014
of Autodesk, Inc. and our report dated
March 10, 2014
expressed an unqualified opinion thereon.
/s/ E
RNST
& Y
OUNG
LLP
San Francisco, California
March 10, 2014
2014 Form 10-K 96
|
ITEM 9.
|
CHANGES IN AND DISAGREEMENTS WITH ACCOUNTANTS ON ACCOUNTING AND FINANCIAL DISCLOSURE
|
None.
|
ITEM 9A.
|
CONTROLS AND PROCEDURES
|
Evaluation of Disclosure Controls and Procedures
Our management evaluated, with the participation of our Chief Executive Officer and Chief Financial Officer, the effectiveness of our disclosure controls and procedures as of the end of the period covered by this Annual Report on Form 10-K. Based on this evaluation, our Chief Executive Officer and Chief Financial Officer have concluded that our disclosure controls and procedures are effective at the reasonable assurance level to ensure that information we are required to disclose in reports that we file or submit under the Securities Exchange Act of 1934, as amended (i) is recorded, processed, summarized and reported within the time periods specified in Securities and Exchange Commission rules and forms; and (ii) is accumulated and communicated to Autodesk’s management, including our Chief Executive Officer and Chief Financial Officer, as appropriate to allow timely decisions regarding required disclosure. Our disclosure controls and procedures are designed to provide reasonable assurance that such information is accumulated and communicated to our management.
Changes in Internal Control Over Financial Reporting
There were no changes in our internal controls over financial reporting (as such term is defined in Rules 13a-15(f) and 15d-15(f) under the Securities Exchange Act of 1934, as amended) during the quarter ended
January 31, 2014
that have materially affected, or are reasonably likely to materially affect, our internal controls over financial reporting.
Management’s Report on Internal Control over Financial Reporting
Our management is responsible for establishing and maintaining adequate internal control over financial reporting (as defined in Rule 13a-15(f) under the Securities Exchange Act of 1934, as amended). Our management assessed the effectiveness of our internal control over financial reporting as of
January 31, 2014
. In making this assessment, our management used the criteria set forth by the Committee of Sponsoring Organizations of the Treadway Commission (“COSO”) in the 1992
Internal Control—Integrated Framework
. Our management has concluded that, as of
January 31, 2014
, our internal control over financial reporting is effective to provide reasonable assurance regarding the reliability of financial reporting and the preparation of financial statements for external purposes in accordance with generally accepted accounting principles. Our independent registered public accounting firm, Ernst & Young, LLP, has issued an audit report on our internal control over financial reporting, which is included in Item 8 herein.
Our management, including our Chief Executive Officer and Chief Financial Officer, does not expect that our disclosure controls and procedures or our internal control over financial reporting will necessarily prevent all errors and all fraud. A control system, no matter how well conceived and operated, can provide only reasonable, not absolute, assurance that the objectives of the control system are met. Further, the design of a control system must reflect the fact that there are resource constraints, and the benefits of controls must be considered relative to their costs. Because of the inherent limitations in all control systems, no evaluation of controls can provide absolute assurance that all control issues and instances of fraud, if any, within Autodesk have been detected.
|
ITEM 9B.
|
OTHER INFORMATION
|
None.
2014 Form 10-K 97
Certain information required by Part III is omitted from this Annual Report because we intend to file a definitive proxy statement pursuant to Regulation 14A for our Annual Meeting of Stockholders not later than 120 days after the end of the fiscal year covered by this Annual Report (the “Proxy Statement”) and certain information included therein is incorporated herein by reference. Only those sections of the Proxy Statement that specifically address the items set forth herein are incorporated by reference.
|
ITEM 10.
|
DIRECTORS, EXECUTIVE OFFICERS AND CORPORATE GOVERNANCE
|
The information required by this Item is incorporated herein by reference to the sections entitled “Proposal One—Election of Directors,” “Section 16(a) Beneficial Ownership Reporting Compliance,” and “Corporate Governance” in our Proxy Statement.
EXECUTIVE OFFICERS OF THE REGISTRANT
As a result of the recent internal realignment and changes in responsibilities, our Board has re-evaluated our executive officers. The following sets forth certain information as of
March 10, 2014
regarding our executive officers.
|
Name
|
Age
|
Position
|
|
|
Carl Bass
|
56
|
President and Chief Executive Officer
|
|
|
Mark J. Hawkins
|
54
|
Executive Vice President and Chief Financial Officer
|
|
|
Jan Becker
|
61
|
Senior Vice President, Human Resources and Corporate Real Estate
|
|
|
Steve M. Blum
|
49
|
Senior Vice President, Worldwide Sales and Services
|
|
|
Pascal W. Di Fronzo
|
49
|
Senior Vice President, General Counsel and Secretary
|
|
Carl Bass
joined Autodesk in September 1993 and has served as President and Chief Executive Officer since May 2006. Mr. Bass served as Interim Chief Financial Officer from August 2008 to April 2009. From June 2004 to April 2006, Mr. Bass served as Chief Operating Officer. From February 2002 to June 2004, Mr. Bass served as Senior Executive Vice President, Design Solutions Group. From August 2001 to February 2002, Mr. Bass served as Executive Vice President, Emerging Business and Chief Strategy Officer. From June 1999 to July 2001, he served as President and Chief Executive Officer of Buzzsaw.com, Inc., a spin-off from Autodesk. Mr. Bass has also held other executive positions within Autodesk. Mr. Bass was a director of McAfee, Inc. from January 2008 until its acquisition by Intel Corporation in February 2011. Mr. Bass has served on the board of directors of E2open since July 2011.
Mark J. Hawkins
joined Autodesk in April 2009 and serves as Executive Vice President and Chief Financial Officer. Prior to joining Autodesk, Mr. Hawkins was Chief Financial Officer and Senior Vice President of Finance and Information Technology at Logitech International S.A. from April 2006 to April 2009. Previously, he was with Dell Inc. for six years, most recently serving as Vice President of Finance for worldwide procurement and logistics. Prior to joining Dell, Mr. Hawkins was employed by Hewlett-Packard Company for 18 years in finance and business-management roles. Mr. Hawkins served on the Board of BMC Software, Inc. from May 2010 through September 2013 at which time BMC was taken private.
Jan Becker
joined Autodesk in September 1992 and has served as Senior Vice President, Human Resources and Corporate Real Estate since June 2000. Ms. Becker previously served in other capacities in the Human Resources Department at Autodesk. Prior to joining Autodesk, Ms. Becker held a variety of senior management positions at Sun Microsystems. Prior to Sun Microsystems, Ms. Becker worked both domestically and internationally at a number of high-tech organizations, including Activision, Digital Equipment Corporation and Hewlett-Packard Company.
Steven M. Blum
joined Autodesk in January 2003 and has served as Senior Vice President, Worldwide Sales and Services since February 2011. From January 2003 to February 2011, he served as senior vice president of Americas Sales. Prior to this position, Blum was Executive Vice President of Sales and Account Management for Parago, Inc. Blum also held positions at Mentor Graphics, most recently serving as Vice President of America's sales. Before joining Mentor Graphics, he held engineering and sales positions at NCR Corporation and Advanced Micro Devices.
Pascal W. Di Fronzo
joined Autodesk in June 1998 and has served as Senior Vice President, General Counsel and Secretary since March 2007. From March 2006 to March 2007, Mr. Di Fronzo served as Vice President, General Counsel and
2014 Form 10-K 98
Secretary, and served as Vice President, Assistant General Counsel and Assistant Secretary from March 2005 through March 2006. Previously, Mr. Di Fronzo served in other business and legal capacities in our Legal Department. Prior to joining Autodesk, he advised high technology and emerging growth companies on business and intellectual property transactions and litigation while in private practice.
There is no family relationship among any of our directors or executive officers.
|
ITEM 11.
|
EXECUTIVE COMPENSATION
|
The information required by this Item is incorporated herein by reference to the section entitled "Corporate Governance" and “Executive Compensation,” in our Proxy Statement.
|
ITEM 12.
|
SECURITY OWNERSHIP OF CERTAIN BENEFICIAL OWNERS AND MANAGEMENT AND RELATED STOCKHOLDER MATTERS
|
The information required by this Item is incorporated herein by reference to the section entitled “Security Ownership of Certain Beneficial Owners and Management,” and “Executive Compensation—Equity Compensation Plan Information” in our Proxy Statement.
|
ITEM 13.
|
CERTAIN RELATIONSHIPS AND RELATED TRANSACTIONS, AND DIRECTOR INDEPENDENCE
|
The information required by this Item is incorporated herein by reference to the section entitled “Certain Relationships and Related Party Transactions” and “Corporate Governance—Independence of the Board of Directors” in our Proxy Statement.
|
ITEM 14.
|
PRINCIPAL ACCOUNTING FEES AND SERVICES
|
The information required by this Item is incorporated herein by reference to the sections entitled “Proposal Two—Ratification of the Appointment of Independent Registered Public Accounting Firm” in our Proxy Statement.
2014 Form 10-K 99
|
ITEM 15.
|
EXHIBITS AND FINANCIAL STATEMENT SCHEDULES
|
(a) The following documents are filed as part of this Report:
1.
Financial Statements
: The information concerning Autodesk’s financial statements, and Report of Ernst & Young LLP, Independent Registered Public Accounting Firm required by this Item is incorporated by reference herein to the section of this Report in
Item 8
, entitled “
Financial Statements and Supplementary Data
.”
2.
Financial Statement Schedule
: The following financial statement schedule of Autodesk, Inc., for the fiscal years ended
January 31, 2014
,
2013
and
2012
, is filed as part of this Report and should be read in conjunction with the Consolidated Financial Statements of Autodesk, Inc.
Schedule II Valuation and Qualifying Accounts
Schedules not listed above have been omitted because they are not applicable or are not required or the information required to be set forth therein is included in the Consolidated Financial Statements or Notes thereto.
3.
Exhibits
: See Item 15(b) below. We have filed, or incorporated into this Report by reference, the exhibits listed on the accompanying Index to Exhibits immediately following the signature page of this Form 10-K.
(b) Exhibits:
We have filed, or incorporated into the Report by reference, the exhibits listed on the accompanying Index to Exhibits immediately following the signature page of this Form 10-K.
(c) Financial Statement Schedules: See Item 15(a), above.
|
|
FINANCIAL STATEMENT SCHEDULE II
|
|
Description
|
Balance at
Beginning
of Fiscal Year
|
Additions
Charged to
Costs and
Expenses or
Revenues
|
Deductions
and
Write-Offs
|
Balance at
End of Fiscal Year
|
|||||||||||
|
|
(in millions)
|
||||||||||||||
|
Fiscal Year ended January 31, 2014
|
|||||||||||||||
|
Allowance for doubtful accounts
|
$
|
5.6
|
|
$
|
1.3
|
|
$
|
2.0
|
|
$
|
4.9
|
|
|||
|
Product returns reserves
|
4.9
|
|
23.1
|
|
24.0
|
|
4.0
|
|
|||||||
|
Partner Program reserves (1)
|
48.3
|
|
278.6
|
|
288.5
|
|
38.4
|
|
|||||||
|
Restructuring
|
8.9
|
|
12.8
|
|
16.1
|
|
5.6
|
|
|||||||
|
Fiscal Year ended January 31, 2013
|
|||||||||||||||
|
Allowance for doubtful accounts
|
$
|
5.5
|
|
$
|
1.5
|
|
$
|
1.4
|
|
$
|
5.6
|
|
|||
|
Product returns reserves
|
5.8
|
|
25.8
|
|
26.7
|
|
4.9
|
|
|||||||
|
Partner Program reserves (1)
|
36.5
|
|
286.9
|
|
275.1
|
|
48.3
|
|
|||||||
|
Restructuring
|
2.4
|
|
45.1
|
|
38.6
|
|
8.9
|
|
|||||||
|
Fiscal Year ended January 31, 2012
|
|||||||||||||||
|
Allowance for doubtful accounts
|
$
|
4.2
|
|
$
|
2.4
|
|
$
|
1.1
|
|
$
|
5.5
|
|
|||
|
Product returns reserves
|
10.6
|
|
32.7
|
|
37.5
|
|
5.8
|
|
|||||||
|
Partner Program reserves (1)
|
37.9
|
|
214.0
|
|
215.4
|
|
36.5
|
|
|||||||
|
Restructuring
|
8.6
|
|
—
|
|
6.2
|
|
2.4
|
|
|||||||
____________________
|
(1)
|
The partner program reserves balance impacts "Accounts receivable, net" or "Accounts payable" on the accompanying Consolidated Balance Sheets.
|
2014 Form 10-K 100
SIGNATURES
Pursuant to the requirements of Section 13 or 15(d) of the Securities Exchange Act of 1934, the Registrant has duly caused this Report to be signed on its behalf by the undersigned, thereunto duly authorized.
|
AUTODESK, INC.
|
|||
|
By:
|
/S/ CARL BASS
|
||
|
Carl Bass
|
|||
|
President and Chief Executive Officer
|
|||
|
Dated:
|
March 10, 2014
|
||
2014 Form 10-K 101
POWER OF ATTORNEY
KNOW ALL PERSONS BY THESE PRESENTS
, that each person whose signature appears below constitutes and appoints Carl Bass and Mark J. Hawkins each as his or her attorney-in-fact, each with the power of substitution, for him or her in any and all capacities, to sign any amendments to this Report on Form 10-K, and to file the same, with exhibits thereto and other documents in connection therewith, with the Securities and Exchange Commission, hereby ratifying and confirming all that each of said attorneys-in-fact, or his substitute or substitutes, may do or cause to be done by virtue hereof.
Pursuant to the requirements of the Securities Exchange Act of 1934, this Report has been signed below by the following persons on behalf of the Registrant and in the capacities as of
March 10, 2014
.
|
Signature
|
|
Title
|
|
/s/ CARL BASS
|
|
President and Chief Executive Officer
(Principal Executive Officer) |
|
Carl Bass
|
||
|
/s/ MARK J. HAWKINS
|
|
Executive Vice President and Chief Financial Officer
(Principal Financial Officer) |
|
Mark J. Hawkins
|
||
|
/s/ PAUL UNDERWOOD
|
Vice President and Controller
(Principal Accounting Officer)
|
|
|
Paul Underwood
|
||
|
/s/ CRAWFORD W. BEVERIDGE
|
|
Director
(Non-executive Chairman of the Board) |
|
Crawford W. Beveridge
|
||
|
/s/ J. HALLAM DAWSON
|
|
Director
|
|
J. Hallam Dawson
|
||
|
/s/ THOMAS GEORGENS
|
Director
|
|
|
Thomas Georgens
|
||
|
/s/ PER-KRISTIAN HALVORSEN
|
|
Director
|
|
Per-Kristian Halvorsen
|
||
|
/s/ MARY T. MCDOWELL
|
|
Director
|
|
Mary T. McDowell
|
||
|
/s/ LORRIE M. NORRINGTON
|
|
Director
|
|
Lorrie M. Norrington
|
||
|
/s/ ELIZABETH RAFAEL
|
|
Director
|
|
Elizabeth Rafael
|
||
|
/s/ STACY J. SMITH
|
|
Director
|
|
Stacy J. Smith
|
||
|
/s/ STEVEN M. WEST
|
|
Director
|
|
Steven M. West
|
||
2014 Form 10-K 102
Index to Exhibits
|
Exhibit No.
|
|
Description
|
|
3.1
|
|
Amended and Restated Certificate of Incorporation of Registrant
(incorporated by reference to Exhibit 3.1 filed with the Registrant’s Annual Report on Form 10-K for the fiscal year ended January 31, 2006, file no. 000-14338)
|
|
3.2
|
|
Amended and Restated Bylaws of Registrant (
incorporated by reference to Exhibit 3.1 filed with the Registrant’s Current Report on Form 8-K filed on September 23, 2013
)
|
|
4.1
|
Indenture dated December 13, 2012, by and between Autodesk, Inc. and U.S. Bank National Association (
incorporated by reference to Exhibit 4.1 filed with the Registrant's Current Report on Form 8-K filed on December 13, 2012
)
|
|
|
4.2
|
First Supplemental Indenture (including Form of Notes) dated December 13, 2012, by and between Autodesk, Inc. and U.S. Bank National Association. (
incorporated by reference to Exhibit 4.2 filed with the Registrant's Current Report on Form 8-K filed on December 13, 2012
)
|
|
|
10.1*
|
|
Registrant’s 1996 Stock Plan (
incorporated by reference to Exhibit 10.1 filed with the Registrant’s Quarterly Report on Form 10-Q for the fiscal quarter ended October 31, 2005
)
|
|
10.2*
|
|
Registrant’s 1996 Stock Plan Forms of Agreement (
incorporated by reference to Exhibit 10.5 filed with the Registrant’s Annual Report on Form 10-K for the fiscal year ended January 31, 2005
)
|
|
10.3*
|
|
Registrant’s 1998 Employee Qualified Stock Purchase Plan, as amended on June 10, 2010
(incorporated by reference to Exhibit 10.3 filed with the Registrant’s Annual Report on Form 10-K for the fiscal year ended January 31, 2013)
|
|
10.4*
|
|
Registrant’s 1998 Employee Qualified Stock Purchase Plan Forms of Agreement (
incorporated by reference to Exhibit 10.2 filed with the Registrant’s Annual Report on Form 10-K for the fiscal year ended January 31, 2005
)
|
|
10.5*
|
|
Registrant’s 1998 Employee Qualified Stock Purchase Plan Form of Agreement (non-U.S. Employees) (
incorporated by reference to Exhibit 10.5 filed with the Registrant’s Annual Report on Form 10-K for the fiscal year ended January 31, 2009
)
|
|
10.6*
|
|
Registrant’s 2000 Directors’ Option Plan, as amended (
incorporated by reference to Exhibit 10.3 filed with the Registrant’s Current Report on Form 8-K filed on June 18, 2008
)
|
|
10.7*
|
|
Registrant’s 2000 Directors’ Option Plan Forms of Agreements (
incorporated by reference to Exhibit 10.2 filed with the Registrant’s Quarterly Report on Form 10-Q for the fiscal quarter ended April 30, 2008
)
|
|
10.8*
|
|
Registrant’s 2006 Employee Stock Plan (
incorporated by reference to Exhibit 10.2 filed with the Registrant’s Current Report on Form 8-K filed on November 15, 2005
)
|
|
10.9*
|
|
Registrant’s 2006 Employee Stock Plan Forms of Agreement (
incorporated by reference to Exhibit 10.8 filed with the Registrant’s Annual Report on Form 10-K for the fiscal year ended January 31, 2006 and Exhibit 10.1 filed with the Registrant’s Current Report on Form 8-K filed on June 20, 2007
)
|
|
10.10*
|
|
Registrant’s 2008 Employee Stock Plan, as amended and restated (
incorporated by reference to Exhibit 10.2 filed with the Registrant’s Quarterly Report on Form 10-Q for the fiscal quarter ended July 31, 2010)
|
|
10.11*
|
|
Registrant’s 2008 Employee Stock Plan Forms of Agreement (
incorporated by reference to Exhibit 10.1 filed with the Registrant’s Quarterly Report on Form 10-Q for the fiscal quarter ended April 30, 2008
)
|
|
10.12*
|
|
Registrant’s 2008 Employee Stock Plan Form of Agreement (
incorporated by reference to Exhibit 10.1 filed with the Registrant’s Current Report on Form 8-K filed on February 6, 2009
)
|
|
10.13*
|
|
Registrant’s 2008 Employee Stock Plan Forms of Restricted Stock Unit Agreements (
incorporated by reference to Exhibit 10.2 filed with the Registrant’s Current Report on Form 8-K filed on June 18, 2008
)
|
|
10.14*
|
|
Registrant’s 2008 Employee Stock Plan Forms of Agreement (non-U.S. Employees) (
incorporated by reference to Exhibit 10.14 filed with the Registrant’s Annual Report on Form 10-K for the fiscal year ended January 31, 2009
)
|
2014 Form 10-K 103
|
Exhibit No.
|
|
Description
|
|
10.15*
|
Registrant's 2012 Employee Stock Plan, as amended and restated (
incorporated by reference to Exhibit 10.1 filed with the Registrant's Current Report on Form 8-K filed on January 15, 2014
)
|
|
|
10.16*
|
Registrant's 2012 Employee Stock Plan Form of Restricted Stock Unit Agreement (
incorporated by reference to Exhibit 10.3 filed with the Registrant's Current Report on Form 8-K filed on March 13, 2012
)
|
|
|
10.17*
|
Registrant's 2012 Employee Stock Plan Form of Stock Option Agreement (
incorporated by reference to Exhibit 10.2 filed with the Registrant's Current Report on Form 8-K filed on March 13, 2012)
|
|
|
10.18*
|
|
Registrant's 2012 Employee Stock Plan Form of Stock Option Agreement (non-U.S. Employees)
(incorporated by reference to Exhibit 10.4 filed with the Registrant's Current Report on Form 8-K filed on March 13, 2012)
|
|
10.19*
|
|
Text of amendment to certain stock option agreements (
incorporated by reference to Exhibit 10.1 filed with the Registrant’s Current Report on Form 8-K filed on September 22, 2006
)
|
|
10.20*
|
|
Amendments to certain stock option agreements (
incorporated by reference to Exhibit 10.16 filed with the Registrant’s Annual Report on Form 10-K for the fiscal year ended January 31, 2009
)
|
|
10.21*
|
|
Registrant’s 2010 Outside Directors’ Stock Plan (
incorporated by reference to Exhibit 10.1 filed with the Registrant’s Current Report on Form 8-K filed on June 16, 2009
)
|
|
10.22*
|
|
Autodesk, Inc. 2010 Outside Directors’ Stock Plan Form of Stock Option Agreement (
incorporated by reference to Exhibit 10.1 filed with the Registrant’s Current Report on Form 8-K filed on March 31, 2010
)
|
|
10.23*
|
|
Autodesk, Inc. 2010 Outside Directors’ Stock Plan Form of Restricted Stock Award Agreement (
incorporated by reference to Exhibit 10.2 filed with the Registrant’s Current Report on Form 8-K filed on March 31, 2010
)
|
|
10.24*
|
Registrant's 2012 Outside Directors' Stock Plan (
incorporated by reference to Exhibit 10.2 filed with the Registrant's Current Report on Form 8-K filed on January 6, 2012
)
|
|
|
10.25*
|
Registrant's 2012 Outside Directors' Stock Plan Form of Restricted Stock Unit Agreement
(incorporated by reference to Exhibit 10.5 filed with the Registrant's Current Report on Form 8-K filed on March 13, 2012)
|
|
|
10.26*
|
|
Form of Promise to Make Cash Payment and Option Amendment (U.S. Employees) (
incorporated by reference to Exhibit 99.1 filed with the Registrant’s Current Report on Form 8-K filed on July 27, 2007
)
|
|
10.27*
|
|
Form of Promise to Make Cash Payment and Option Amendment (Canadian Employees) (
incorporated by reference to Exhibit 99.2 filed with the Registrant’s Current Report on Form 8-K filed on July 27, 2007
)
|
|
10.28*
|
|
Registrant’s Executive Incentive Plan, as amended and restated (
incorporated by reference to Exhibit 10.1 filed with the Registrant’s Current Report on Form 8-K filed on June 14, 2010
)
|
|
10.29*
|
|
Registrant’s 2005 Non-Qualified Deferred Compensation Plan, as amended and restated, effective as of January 1, 2008, as further amended and restated, effective as of December 31, 2008, as further amended and restated, effective as of January 1, 2010
(incorporated by reference to Exhibit 10.1 filed with the Registrant’s Quarterly Report on Form 10-Q for the fiscal quarter ended October 31, 2009)
|
|
10.30*
|
|
Participants, target awards and payout formulas for fiscal year 2014 under the Registrant’s Executive Incentive Plan (
incorporated by reference to Item 5.02 of the Registrant’s Current Report on Form 8-K filed on March 25, 2013
)
|
|
10.31*
|
|
Executive Change in Control Program, as amended and restated (
incorporated by reference to Exhibit 10.1 filed with the Registrant’s Current report on Form 8-K filed on September 23, 2013
)
|
|
10.32*
|
|
Sub-Plan of the Autodesk, Inc. 1998 Employee Qualified Stock Purchase Plan, as amended and restated (
filed herewith
)
|
|
10.33*
|
|
Form of Indemnification Agreement executed by Autodesk and each of its officers and directors (
incorporated by reference to Exhibit 10.8 filed with the Registrant’s Annual Report on Form 10-K for the fiscal year ended January 31, 2005
)
|
|
10.34*
|
|
Third Amended and Restated Employment Agreement between Registrant and Carl Bass dated March 21, 2013 (
incorporated by reference to Exhibit 10.1 filed with the Registrant’s Current Report on Form 8-K filed on March 25, 2013
)
|
|
10.35*
|
Relocation Policy Addendum for Mark Hawkins (
incorporated by reference to Exhibit 10.1 filed with the Registrant's Quarterly Report on Form 10-Q for the fiscal quarter ended October 21, 2011
)
|
|
2014 Form 10-K 104
|
Exhibit No.
|
|
Description
|
|
10.36*
|
|
Registrant’s Equity Incentive Deferral Plan as amended and restated effective as of June 12, 2008 (
incorporated by reference to Exhibit 10.4 filed with the Registrant’s Quarterly Report on Form 10-Q for the fiscal quarter ended July 31, 2008
)
|
|
10.37*
|
Amendment to Registrant's Equity Incentive Deferral Plan effective as of February 17, 2012
(incorporated by reference to Exhibit 10.37 filed with the Registrant's Annual Report on Form 10‑K for the fiscal year ended January 31, 2012)
|
|
|
10.38*
|
Description of Sales Commission Plan (
incorporated by reference to Item 5.02 of the Registrant’s Current
Report on Form 8-K filed on March 25, 2013
)
|
|
|
10.39*
|
Description of amendments to Sales Commission Plan (
incorporated by reference to Item 5.02 of the Registrant’s Current Report on Form 8-K filed on June 14, 2013
)
|
|
|
10.40
|
|
Office Lease between Registrant and the J.H.S. Trust for 111 McInnis Parkway, San Rafael, CA, as amended
(incorporated by reference to Exhibit 10.1 filed with the Registrant’s Quarterly Report on Form 10-Q for the fiscal quarter ended October 31, 2004)
|
|
10.41
|
|
Fourth Amendment to Lease between Registrant and the J.H.S. Holdings L.P. for 111 McInnis Parkway, San Rafael, CA
(incorporated by reference to Exhibit 10.30 filed with the Registrant’s Annual Report on Form 10‑K for the fiscal year ended January 31, 2010)
|
|
10.42
|
|
Amended and Restated Credit Agreement, dated as of May 23, 2013, by and among the Registrant, the lenders from time to time party thereto and Citibank, N.A., as agent
(incorporated by reference to Exhibit 10.1 filed with the Registrant's Current Report on Form 8-K filed on May 24, 2013)
|
|
21.1
|
|
List of Subsidiaries
(filed herewith)
|
|
23.1
|
|
Consent of Independent Registered Public Accounting Firm (Ernst & Young LLP)
(filed herewith)
|
|
24.1
|
|
Power of Attorney (contained in the signature page to this Annual Report)
|
|
31.1
|
|
Certification of Chief Executive Officer pursuant to Rule 13a-14(a) of the Securities Exchange Act of 1934 (
filed herewith
)
|
|
31.2
|
|
Certification of Chief Financial Officer pursuant to Rule 13a-14(a) of the Securities Exchange Act of 1934 (
filed herewith
)
|
|
32.1†
|
|
Certification of Chief Executive Officer and Chief Financial Officer pursuant to 18 U.S.C. Section 1350, as adopted pursuant to Section 906 of the Sarbanes-Oxley Act of 2002
(filed herewith)
|
|
101.INS ††
|
|
XBRL Instance Document
|
|
101.SCH ††
|
|
XBRL Taxonomy Extension Schema
|
|
101.CAL ††
|
|
XBRL Taxonomy Extension Calculation Linkbase
|
|
101.DEF ††
|
|
XBRL Taxonomy Extension Definition Linkbase
|
|
101.LAB ††
|
|
XBRL Taxonomy Extension Label Linkbase
|
|
101.PRE ††
|
|
XBRL Taxonomy Extension Presentation Linkbase
|
____________________
|
*
|
Denotes a management contract or compensatory plan or arrangement.
|
|
†
|
The certifications attached as Exhibit 32.1 that accompany this Annual Report on Form 10-K, are not deemed filed with the Securities and Exchange Commission and are not to be incorporated by reference into any filing of Autodesk, Inc. under the Securities Act of 1933, as amended, or the Securities Exchange Act of 1934, as amended, whether made before or after the date of this Form 10-K, irrespective of any general incorporation language contained in such filing.
|
|
††
|
The financial information contained in these XBRL documents is unaudited.
|
2014 Form 10-K 105
TABLE OF CONTENTS
Part IPart IIItem 7A. Quantitative and Qualitative Disclosures About Market RiskItem 8. Financial Statements and Supplementary DataItem 9. Changes in and Disagreements with Accountants on Accounting and Financial DisclosureItem 9A. Controls and ProceduresItem 9B. Other InformationPart IIIItem 10. Directors, Executive Officers and Corporate GovernanceItem 11. Executive CompensationItem 12. Security Ownership Of Certain Beneficial Owners and Management and Related Stockholder MattersItem 13. Certain Relationships and Related Transactions, and Director IndependenceItem 14. Principal Accounting Fees and ServicesPart IVItem 15. Exhibits and Financial Statement SchedulesItem 15(a)(2)financial Statement Schedule IIItem 15(a)(2)