ADAMS RESOURCES & ENERGY, INC.
10-Ks and 10-Qs
|
|
|
|
|
|
|
|
|
|
|
|
|
|
|
|
|
|
|
|
|
|
|
|
|
|
|
|
|
|
|
|
|
|
|
|
|
|
|
|
|
|
|
|
UNITED STATES SECURITIES AND EXCHANGE COMMISSION
Washington, D.C. 20549
FORM 10-K
(Mark One)
|
X__
|
ANNUAL REPORT PURSUANT TO SECTION 13 OR 15(d) OF THE SECURITIES EXCHANGE ACT OF 1934
|
|
|
For the Fiscal Year ended December 31, 2010
|
OR
| ____ |
TRANSITION REPORT PURSUANT TO SECTION 13 OR 15(d) OF THE SECURITIES EXCHANGE ACT OF 1934
|
|
|
Commission File Number 1-7908
|
ADAMS RESOURCES & ENERGY, INC.
(Exact name of registrant as specified in its charter)
|
Delaware
|
74-1753147
|
4400 Post Oak Pkwy Ste 2700
|
77027
|
|
Houston, Texas
|
|||
|
(State of Incorporation)
|
(I.R.S. Employer Identification No.)
|
(Address of Principal executive offices)
|
(Zip Code)
|
Registrant's telephone number, including area code:
(713) 881-3600
Securities registered pursuant to Section 12(b) of the Act:
|
Title of each class
|
Name of each exchange on which registered
|
|
Common Stock, $.10 Par Value
|
NYSE Amex
|
Indicate by check mark whether the Registrant is a well-known seasoned issuer, as defined in Rule 405 of the Securities Act. YES ___NO _
X
_
Indicate by check mark whether the registrant is not required to file reports pursuant to Section 13 or Section 15(d) of the Exchange Act.
YES ____ NO _
X
_
Indicate by check mark whether the Registrant (1) has filed all reports required to be filed by Section 13 or 15(d) of the Securities Exchange Act of 1934 during the preceding 12 months (or for such shorter period that the registrant was required to file such reports, and (2) has been subject to the filing requirements for the past 90 days. YES_
X_
NO ___
Indicate by check mark whether the registrant has submitted electronically and posted on its corporate Web site, if any, every Interactive Data File required to be submitted and posted pursuant to Rule 405 of Regulation S-T (§232.405 of this chapter) during the preceding 12 months (or for such shorter period that the registrant was required to submit and post such files). YES_
X_
NO ___
Indicate by check mark if disclosure of delinquent filers pursuant to Item 405 of Regulation S-K is not contained herein, and will not be contained, to the best of registrant’s knowledge, in definitive proxy or information statements incorporated by reference in Part III of this Form 10-K or any amendment to this Form 10-K. _
X_
Indicate by check mark whether the registrant is a large accelerated filer, an accelerated filer, or a non-accelerated filer, or a smaller reporting company. See definition of “large accelerated filer” and “accelerated filer and smaller reporting company” in Rule 12b-2 of the Exchange Act.
Large accelerated filer ____ Accelerated filer ____
Non-accelerated filer _
X_
Smaller reporting company _____
Indicate by check mark whether the registrant is a shell company (as defined by Rule 12b-2 of the Act).
YES ___NO _
X
_
The aggregate market value of the voting and non-voting common equity held by nonaffiliates as of the close of business on June 30, 2010 was $37,642,446 based on the closing price of $18.00 per one share of common stock as reported on the NYSE AMEX Exchange for such date. A total of 4,217,596 shares of Common Stock were outstanding at March 10, 2010.
DOCUMENTS INCORPORATED BY REFERENCE
Portions of the Proxy Statement for the Annual Meeting of Stockholders to be held May 18, 2011 are incorporated by reference into Part III of this report.
Items 1 and 2. BUSINESS AND PROPERTIES
Forward-Looking Statements –Safe Harbor Provisions
This annual report on Form 10-K for the year ended December 31, 2010 contains certain forward-looking statements covered by the safe harbors provided under Federal securities law and regulations. To the extent such statements are not recitations of historical fact, forward-looking statements involve risks and uncertainties. In particular, statements under the captions (a) Production and Reserve Information, (b) Regulatory Status and Potential Environmental Liability, (c) Management’s Discussion and Analysis of Financial Condition and Results of Operations, (d) Critical Accounting Policies and Use of Estimates, (e) Quantitative and Qualitative Disclosures about Market Risk, (f) Income Taxes, (g) Concentration of Credit Risk, (h) Price Risk Management Activities, and (i) Commitments and Contingencies, among others, contain forward-looking statements. Where the Company expresses an expectation or belief regarding future results or events, such expression is made in good faith and believed to have a reasonable basis in fact. However, there can be no assurance that such expectation or belief will actually result or be achieved.
With the uncertainties of forward looking statements in mind, the reader should consider the risks discussed elsewhere in this report and other documents filed by the Company with the Securities and Exchange Commission from time to time and the important factors described under “Item 1A. Risk Factors” that could cause actual results to differ materially from those expressed in any forward-looking statement made by or on behalf of the Company.
Business Activities
Adams Resources & Energy, Inc. (“ARE”) and its subsidiaries, collectively (the "Company"), are engaged in the business of marketing crude oil, natural gas and petroleum products, tank truck transportation of liquid chemicals, and oil and gas exploration and production. Adams Resources & Energy, Inc. is a Delaware corporation organized in 1973. The Company’s headquarters are located in 20,700 square feet of leased office space at 4400 Post Oak Parkway, Suite 2700, Houston, Texas 77027 and the telephone number of that address is (713) 881-3600. The revenues, operating results and identifiable assets of each industry segment for the three years ended December 31, 2010 are set forth in Note (8) of Notes to Consolidated Financial Statements included elsewhere herein.
Marketing Segment Subsidiaries
Gulfmark Energy, Inc. (“Gulfmark”), a subsidiary of ARE, purchases crude oil and arranges sales and deliveries to refiners and other customers. Activity is concentrated primarily onshore in Texas and Louisiana with additional operations in Michigan and New Mexico. During 2010, Gulfmark purchased approximately 69,000 barrels per day of crude oil at the wellhead or lease level. Gulfmark also operates 131 tractor-trailer rigs and maintains over 47 pipeline inventory locations or injection stations. Gulfmark has the ability to barge oil from three oil storage facilities along the intercoastal waterway of Texas and Louisiana and maintains 75,000 barrels of storage capacity at certain of the dock facilities in order to access waterborne markets for its products. Gulfmark arranges transportation for sales to customers or enters into exchange transactions with third parties when the cost of the exchange is less than the alternate cost incurred in transporting or storing the crude oil. During 2010, Gulfmark had sales to five customers that comprised 35.8 percent, 20.2 percent, 17.9 percent, 13 percent and 11 percent, respectively, of total Company wide revenues. Management believes that a loss of any of these customers would not have a material adverse effect on the Company’s operations. See also Note 3 of Notes to Consolidated Financial Statements.
1
Adams Resources Marketing, Ltd. (“ARM”), a subsidiary of ARE, operates as a wholesale purchaser, distributor and marketer of natural gas. ARM’s focus is on the purchase of natural gas at the producer level. During 2010, ARM purchased approximately 258,000 million british thermal units (“mmbtu’s”) of natural gas per day at the wellhead and pipeline pooling points. Business is concentrated among approximately 60 independent producers with the primary production areas being the Louisiana and Texas Gulf Coast and the offshore Gulf of Mexico region. ARM provides value added services to its customers by providing access to common carrier pipelines and handling daily volume balancing requirements as well as risk management services.
Ada Resources, Inc. (“Ada”), a subsidiary of ARE, markets branded and unbranded refined petroleum products such as motor fuels and lubricants. Ada makes purchases based on the supplier’s established distributor prices, with such prices generally being lower than Ada’s sales price to its customers. Motor fuel sales include automotive gasoline, biodiesel and conventional diesel fuel. Lubricants consist of passenger car motor oils as well as a full complement of industrial oils and greases. Ada is also involved in the railroad servicing industry, including fueling and lubricating locomotives as well as performing routine maintenance on the power units. Further, the United States Coast Guard has certified Ada as a direct-to-vessel approved marine fuel and lube vendor. Ada’s marketing area primarily includes the Texas Gulf Coast and southern Louisiana. The primary product distribution and warehousing facility is located on 5.5 Company-owned acres in Houston, Texas. The property includes a 60,000 square foot warehouse, 11,000 square feet of office space and bulk storage for 320,000 gallons of lubricating oil.
Operating results are sensitive to a number of factors. Such factors include commodity location, grades of product, individual customer demand for grades or location of product, localized market price structures, availability of transportation facilities, actual delivery volumes that vary from expected quantities, and the timing and costs to deliver the commodity to the customer.
Transportation Segment Subsidiary
Service Transport Company (“STC”), a subsidiary of ARE, transports liquid chemicals on a "for hire" basis throughout the continental United States and Canada. Transportation service is provided to over 400 customers under multiple load contracts in addition to loads covered under STC’s standard price list. Pursuant to regulatory requirements, STC holds a Hazardous Materials Certificate of Registration issued by the U.S. Department of Transportation. Presently, STC operates 283 truck tractors of which 15 are independent owner-operator units and maintains 422 tank trailers. In addition, STC maintains truck terminals in Houston, Corpus Christi, and Nederland, Texas as well as Baton Rouge (St. Gabriel), Louisiana and Mobile (Saraland), Alabama. Transportation operations are headquartered at a terminal facility situated on 22 Company-owned acres in Houston, Texas. This property includes maintenance facilities, an office building, tank wash rack facilities and a water treatment system. The St. Gabriel, Louisiana terminal is situated on 11.5 Company-owned acres and includes an office building, maintenance bays and tank cleaning facilities.
STC is compliant with International Organization for Standardization (“ISO”) 9001:2000 Standard. The scope of this Quality System Certificate covers the carriage of bulk liquids throughout STC’s area of operations as well as the tank trailer cleaning facilities and equipment maintenance. STC’s quality management process is one of its major assets. The practice of using statistical process control covering safety, on-time performance and customer satisfaction aids continuous improvement in all areas of quality service. In addition to its ISO 9001:2000 practices, the American Chemistry Council recognizes STC as a Responsible Care
Ó
Partner. Responsible Care Partners serve the chemical industry and implement and monitor the seven Codes of Management Practices. The seven codes address compliance and continuing improvement in (1) Community Awareness and Emergency Response, (2) Pollution Prevention, (3) Process Safety, (4) Distribution, (5) Employee Health and Safety, (6) Product Stewardship and (7) Security.
Oil and Gas Segment Subsidiary
Adams Resources Exploration Corporation (“AREC”), a subsidiary of ARE, is actively engaged in the exploration and development of domestic oil and natural gas properties primarily in Texas and the south central region of the United States. AREC’s offices are maintained in Houston and the Company holds an interest in 347 wells of which 41 are Company operated.
2
Producing Wells--The following table sets forth the Company's gross and net productive wells as of December 31, 2010. Gross wells are the total number of wells in which the Company has an interest, while net wells are the sum of the fractional interests owned.
|
Oil Wells
|
Gas Wells
|
Total Wells
|
||||||||||||||||||||||
|
Gross
|
Net
|
Gross
|
Net
|
Gross
|
Net
|
|||||||||||||||||||
|
Texas
|
69 | 9.36 | 130 | 11.56 | 199 | 20.92 | ||||||||||||||||||
|
Other
|
94 | 4.26 | 54 | 5.40 | 148 | 9.66 | ||||||||||||||||||
| 163 | 13.62 | 184 | 16.96 | 347 | 30.58 | |||||||||||||||||||
Acreage--The following table sets forth the Company's gross and net developed and undeveloped acreage as of December 31, 2010. Gross acreage represents the Company’s direct ownership and net acreage represents the sum of the fractional interests owned. The Company’s developed acreage is held by current production while undeveloped acreage is held by oil and gas leases with various remaining terms from six months to three years.
|
Developed Acreage
|
Undeveloped Acreage
|
|||||||||||||||
|
Gross
|
Net
|
Gross
|
Net
|
|||||||||||||
|
Texas
|
92,782 | 10,027 | 213,627 | 16,783 | ||||||||||||
|
Kansas
|
480 | 80 | 23,213 | 2,289 | ||||||||||||
|
Other
|
7,499 | 913 | 5,496 | 858 | ||||||||||||
| 100,761 | 11,020 | 242,336 | 19,930 | |||||||||||||
Drilling Activity--The following table sets forth the Company's drilling activity for each of the three years ended December 31, 2010. All drilling activity was onshore in Texas, Louisiana, Arkansas and Kansas.
|
2010
|
2009
|
2008
|
||||||||||||||||||||||
|
Gross
|
Net
|
Gross
|
Net
|
Gross
|
Net
|
|||||||||||||||||||
|
Exploratory wells drilled
|
||||||||||||||||||||||||
|
- Productive
|
- | - | 2 | .10 | 2 | .13 | ||||||||||||||||||
|
- Dry
|
12 | .67 | 7 | .94 | 2 | .22 | ||||||||||||||||||
|
Development wells drilled
|
||||||||||||||||||||||||
|
- Productive
|
41 | 1.77 | 24 | 1.35 | 17 | 1.06 | ||||||||||||||||||
|
- Dry
|
- | - | 2 | .10 | 7 | .68 | ||||||||||||||||||
| 53 | 2.44 | 35 | 2.49 | 28 | 2.09 | |||||||||||||||||||
Production and Reserve Information--The Company's estimated net quantities of proved oil and natural gas reserves and the standardized measure of discounted future net cash flows calculated at a 10% discount rate for the three years ended December 31, 2010, are presented in the table below
(in thousands)
:
|
December 31,
|
||||||||||||
|
2010
|
2009
|
2008
|
||||||||||
|
Crude oil (thousands of barrels)
|
267 | 242 | 230 | |||||||||
|
Natural gas (thousands of mcf)
|
7,794 | 7,248 | 6,443 | |||||||||
|
Standardized measure of discounted future
|
||||||||||||
|
net cash flows from oil and natural gas reserves
|
$ | 16,672 | $ | 9,305 | $ | 11,547 | ||||||
The estimated value of oil and natural gas reserves and future net revenues from oil and natural gas reserves was made by the Company's independent petroleum engineers. The reserve value estimates provided at each of December 31, 2010, 2009 and 2008 are based on market prices of $76.14, $58.43 and $37.87 per barrel for crude oil and $5.26, $4.05 and $5.65 per mcf for natural gas, respectively. For 2010 and 2009, such prices were based on the unweighted arithmetic average of the prices in effect on the first day of the month for each month of the respective twelve month periods as required by Security & Exchange Commission regulations. For 2008, the price reflects the market price on December 31, 2008.
3
Reserve estimates are based on many subjective factors. The accuracy of reserve estimates depends on the quantity and quality of geological data, production performance data, and reservoir engineering data, the pricing assumptions utilized as well as the skill and judgment of petroleum engineers in interpreting such data. The process of estimating reserves requires frequent revision of estimates as additional information is made available through drilling, testing, reservoir studies and acquiring historical pressure and production data. In addition, the discounted present value of estimated future net revenues should not be construed as the fair market value of oil and natural gas producing properties. Such estimates do not necessarily portray a realistic assessment of current value or future performance of such properties. Such revenue calculations are based on estimates as to the timing of oil and natural gas production, and there is no assurance that the actual timing of production will conform to or approximate such estimates. Also, certain assumptions have been made with respect to pricing. The estimates assume prices will remain constant from the date of the engineer's estimates, except for changes reflected under natural gas sales contracts. There can be no assurance that actual future prices will not vary as industry conditions, governmental regulation and other factors impact the market price for oil and natural gas.
The Company's oil and natural gas production for the three years ended December 31, 2010 was as follows:
|
Years Ended
|
Crude Oil
|
Natural
|
||||||
|
December 31
,
|
(
barrels
)
|
Gas (mcf
)
|
||||||
|
2010
|
54,000 | 1,365,000 | ||||||
|
2009
|
49,500 | 1,304,000 | ||||||
|
2008
|
50,500 | 1,243,000 | ||||||
Certain financial information relating to the Company's oil and natural gas division revenues and earnings is summarized as follows:
|
Years Ended December 31,
|
||||||||||||
|
2010
|
2009
|
2008
|
||||||||||
|
Average oil and condensate
|
||||||||||||
|
sales price per barrel
|
$ | 77.09 | $ | 58.10 | $ | 99.25 | ||||||
|
Average natural gas
|
||||||||||||
|
sales price per mcf
|
$ | 5.02 | $ | 4.43 | $ | 9.84 | ||||||
|
Average production cost, per equivalent
|
||||||||||||
|
barrel, charged to expense
|
$ | 13.99 | $ | 13.25 | $ | 18.34 | ||||||
The Company has had no reports to federal authorities or agencies of estimated oil and gas reserves. The Company is not obligated to provide any fixed and determinable quantities of oil or gas in the future under existing contracts or agreements associated with its oil and gas exploration and production segment.
Environmental Compliance and Regulation
The Company is subject to an extensive variety of evolving United States federal, state and local laws, rules and regulations governing the storage, transportation, manufacture, use, discharge, release and disposal of product and contaminants into the environment, or otherwise relating to the protection of the environment. Presented below is a non-exclusive listing of the environmental laws that potentially impact the Company’s activities.
|
-
|
The Solid Waste Disposal Act, as amended by the Resource Conservation and Recovery Act of 1976, as amended.
|
|
-
|
Comprehensive Environmental Response, Compensation and Liability Act of 1980 ("CERCLA" or "Superfund"), as amended.
|
|
-
|
The Clean Water Act of 1972, as amended.
|
|
-
|
Federal Oil Pollution Act of 1990, as amended.
|
|
-
|
The Clean Air Act of 1970, as amended.
|
|
-
|
The Toxic Substances Control Act of 1976, as amended.
|
|
-
|
The Emergency Planning and Community Right-to-Know Act.
|
|
-
|
The Occupational Safety and Health Act of 1970, as amended.
|
4
|
-
|
Texas Clean Air Act.
|
|
-
|
Texas Solid Waste Disposal Act.
|
|
-
|
Texas Water Code.
|
|
-
|
Texas Oil Spill Prevention and Response Act of 1991, as amended.
|
Railroad Commission of Texas (“RRC”)
--The RRC regulates, among other things, the drilling and operation of oil and natural gas wells, the operation of oil and gas pipelines, the disposal of oil and natural gas production wastes and certain storage of unrefined oil and gas. RRC regulations govern the generation, management and disposal of waste from such oil and natural gas operations and provide for the clean up of contamination from oil and natural gas operations. The RRC has promulgated regulations that provide for civil and/or criminal penalties and/or injunctive relief for violations of the RRC regulations.
Louisiana Office of Conservation
--This agency has primary statutory responsibility for regulation and conservation of oil, gas, and other natural resources in the State of Louisiana. Their objectives are to (i) regulate the exploration and production of oil, natural gas and other hydrocarbons; (ii) control and allocate energy supplies and distribution and (iii) protect public safety and the State’s environment from oilfield waste, including regulation of underground injection and disposal practices.
State and Local Government Regulation
--Many states are authorized by the United States Environmental Protection Agency (“EPA”) to enforce regulations promulgated under various federal statutes. In addition, there are numerous other state and local authorities that regulate the environment, some of which impose more stringent environmental standards than federal laws and regulations. The penalties for violations of state law vary, but typically include injunctive relief, recovery of damages for injury to air, water or property and fines for non-compliance.
Oil and Gas Operations
--The Company's oil and gas drilling and production activities are subject to laws and regulations relating to environmental quality and pollution control. One aspect of the Company's oil and gas operation is the disposal of used drilling fluids, saltwater, and crude oil sediments. In addition, low-level naturally occurring radiation may, at times, occur with the production of crude oil and natural gas. The Company's policy is to comply with environmental regulations and industry standards. Environmental compliance has become more stringent and the Company, from time to time, may be required to remediate past practices. Management believes that such required remediation in the future, if any, will not have a material adverse impact on the Company's financial position or results of operations.
All states in which the Company owns producing oil and gas properties have statutory provisions regulating the production and sale of crude oil and natural gas. Regulations typically require permits for the drilling of wells and regulate the spacing of wells, the prevention of waste, protection of correlative rights, the rate of production, prevention and clean-up of pollution and other matters.
Marketing Operations
--The Company's marketing facilities are subject to a number of state and federal environmental statutes and regulations, including the regulation of underground fuel storage tanks. While the Company does not own or operate underground tanks as of December 31, 2010, historically the Company has been an owner and operator of underground storage tanks. The EPA's Office of Underground Tanks and applicable state laws establish regulations requiring owners or operators of underground fuel tanks to demonstrate evidence of financial responsibility for the costs of corrective action and the compensation of third parties for bodily injury and property damage caused by sudden and non-sudden accidental releases arising from operating underground tanks. In addition, the EPA requires the installation of leak detection devices and stringent monitoring of the ongoing condition of underground tanks. Should leakage develop in an underground tank, the operator is obligated for clean up costs. During the period when the Company was an operator of underground tanks, it secured insurance covering both third party liability and clean up costs.
5
Transportation Operations
--The Company's tank truck operations are conducted pursuant to authority of the United States Department of Transportation (“DOT”) and various state regulatory authorities. The Company's transportation operations must also be conducted in accordance with various laws relating to pollution and environmental control. Interstate motor carrier operations are subject to safety requirements prescribed by DOT. Matters such as weight and dimension of equipment are also subject to federal and state regulations. DOT regulations also require mandatory drug testing of drivers and require certain tests for alcohol levels in drivers and other safety personnel. The trucking industry is subject to possible regulatory and legislative changes such as increasingly stringent environmental regulations or limits on vehicle weight and size. Regulatory change may affect the economics of the industry by requiring changes in operating practices or by changing the demand for common or contract carrier services or the cost of providing truckload services. In addition, the Company’s tank wash facilities are subject to increasingly stringent local, state and federal environmental regulations.
The Company has implemented security procedures for drivers and terminal facilities. Satellite tracking transponders installed in the power units are used to communicate en route emergencies to the Company and to maintain constant information as to the unit’s location. If necessary, the Company’s terminal personnel will notify local law enforcement agencies. In addition, the Company is able to advise a customer of the status and location of their loads. Remote cameras and better lighting coverage in the staging and parking areas have augmented terminal security.
Regulatory Status and Potential Environmental Liability
--The operations and facilities of the Company are subject to numerous federal, state and local environmental laws and regulations including those described above, as well as associated permitting and licensing requirements. The Company regards compliance with applicable environmental regulations as a critical component of its overall operation, and devotes significant attention to providing quality service and products to its customers, protecting the health and safety of its employees, and protecting the Company’s facilities from damage. Management believes the Company has obtained or applied for all permits and approvals required under existing environmental laws and regulations to operate its current business. Management has reported that the Company is not subject to any pending or threatened environmental litigation or enforcement action(s), which could materially and adversely affect the Company's business. The Company has, where appropriate, implemented operating procedures at each of its facilities designed to assure compliance with environmental laws and regulation. However, given the nature of the Company’s business, the Company is subject to environmental risks and the possibility remains that the Company's ownership of its facilities and its operations and activities could result in civil or criminal enforcement and public as well as private action(s) against the Company, which may necessitate or generate mandatory clean up activities, revocation of required permits or licenses, denial of application for future permits, and/or significant fines, penalties or damages, any and all of which could have a material adverse effect on the Company. At December 31, 2010, the Company is unaware of any unresolved environmental issues for which additional accounting accruals are necessary.
Employees
At December 31, 2010 the Company employed 740 persons, 15 of whom were employed in the exploration and production of oil and gas, 299 in the marketing of crude oil, natural gas and petroleum products, 405 in transportation operations, and 21 in administrative capacities. None of the Company's employees are represented by a union. Management believes its employee relations are satisfactory.
Federal and State Taxation
The Company is subject to the provisions of the Internal Revenue Code of 1986, as amended (the “Code”). In accordance with the Code, the Company computes its income tax provision based on a 35 percent tax rate. The Company's operations are, in large part, conducted within the State of Texas. Texas operations are subject to a one-half percent state tax on its revenues net of cost of goods sold as defined by the state. Oil and gas activities are also subject to state and local income, severance, property and other taxes. Management believes the Company is currently in compliance with all federal and state tax regulations.
6
Available Information
The Company is required to file periodic reports as well as other information with the Securities and Exchange Commission (“SEC”) within established deadlines. Any document filed with the SEC may be viewed or copied at the SEC’s Public Reference Room at 100 F Street, N.E., Washington, D.C. 20549. Additional information regarding the Public Reference Room can be obtained by calling the SEC at
(800) SEC-0330. The Company’s SEC filings are also available to the public through the SEC’s web site located at
http://www.sec.gov
.
The Company maintains a corporate website at
http://www.adamsresources.com
, on which investors may access free of charge the annual report on Form 10-K, quarterly reports on Form 10-Q, current reports on
Form 8-K and amendments to those reports as soon as is reasonably practicable after filing or furnishing such material with the SEC. Additionally, the Company has adopted and posted on its website a Code of Business Ethics designed to reflect requirements of the Sarbanes-Oxley Act of 2002, NYSE Amex Exchange rules and other applicable laws, rules and regulations. The Code of Business Ethics applies to all of the Company’s directors, officers and employees. Any amendment to the Code of Business Ethics will be posted promptly on the Company’s website. The information contained on or accessible from the Company’s website does not constitute a part of this report and is not incorporated by reference herein. The Company will provide a printed copy of any of these aforementioned documents free of charge upon request by calling ARE at (713)-881-3600 or by writing to:
Adams Resources & Energy, Inc.
ATTN: Richard B. Abshire
4400 Post Oak Parkway, Suite 2700
Houston, Texas 77027
Economic developments could damage operations and materially reduce profitability and cash flows.
Initially in 2008, disruptions in the credit markets and concerns about global economic growth had a significant adverse impact on global financial markets and commodity prices. At times, these factors contributed to a decline in the Company’s stock price and corresponding market capitalization. During 2010, general economic conditions improved and the Company experienced a more normal operating environment with improved commodity prices. Should commodity prices return to a period of rapid decline, future earnings will be reduced. Since the Company has no bank debt obligations nor covenants tied to its stock price, potential declines in the Company’s stock price do not affect the Company’s liquidity or overall financial condition. Should the capital and credit markets experience volatility and the availability of funds remains limited, the Company’s customers and suppliers may incur increased costs associated with issuing commercial paper and/or other debt instruments and this, in turn, could adversely affect the Company’s ability to secure supply and make profitable sales.
General economic conditions could reduce demand for chemical based trucking services.
Customer demand for the Company’s products and services is substantially dependent upon the general economic conditions for the United States which has been slow in years past. In particular, demand for liquid chemical truck transportation services is dependent on activity within the petrochemical sector of the U. S. economy. Chemical sector demand typically varies with the housing and auto markets as well as the relative strength of the U. S. dollar to foreign currencies. A relatively strong U.S. dollar exchange rate tends to suppress export demand for petrochemicals which is adverse to the Company’s transportation operation. Conversely, a weak U. S. dollar exchange rate tends to stimulate export demand for petrochemicals.
The Company’s business is dependent on the ability to obtain trade and other credit
.
The Company’s future development and growth depends in part on its ability to successfully obtain credit from suppliers and other parties. Trade credit arrangements are relied upon as a significant source of liquidity for capital requirements not satisfied by operating cash flow.
7
Should global financial markets and economic conditions disrupt and reduce the stability of financial markets in general and the solvency of creditors specifically, the availability of funding from credit markets would be reduced as many lenders and institutional investors would enact tighter lending standards, refuse to refinance existing debt on terms similar to current debt or in some cases, cease to provide funding to borrowers. These issues coupled with weak economic conditions would make it more difficult for the Company and its suppliers and customers to obtain funding.
If the Company is unable to obtain trade or other forms of credit on reasonable and competitive terms, its ability to continue its marketing and exploration businesses, pursue improvements, and continue future growth will be limited. There is no assurance that the Company will be able to maintain future credit arrangements on commercially reasonable terms.
The financial soundness of customers could affect the Company’s business and operating results
Constraints in the financial markets and other macro-economic challenges that might affect the economy of the United States and other parts of the world could cause the Company’s customers to experience cash flow concerns. As a result, if customers’ operating and financial performance deteriorates, or if they are unable to make scheduled payments or obtain credit, customers would not be able to pay, or may delay payment of, accounts receivable owed to the Company. Any inability of current and/or potential customers to pay for services may adversely affect the Company’s financial condition and results of operations.
Counterparty credit default could have an adverse effect on the Company.
The Company’s revenues are generated under contracts with various counterparties. Results of operations would be adversely affected as a result of non-performance by any of these counterparties of their contractual obligations under the various contracts. A counterparty’s default or non-performance could be caused by factors beyond the Company’s control. A default could occur as a result of circumstances relating directly to the counterparty, or due to circumstances caused by other market participants having a direct or indirect relationship with such counterparty. The Company seeks to mitigate the risk of default by evaluating the financial strength of potential counterparties; however, despite mitigation efforts, defaults by counterparties may occur from time to time.
Escalating diesel fuel prices could have an adverse effect on the Company
As an integral part of the Company’s marketing and transportation businesses, the Company operates a fleet of over 400 truck-tractors and diesel fuel costs are a significant component of operating expense. Such costs generally fluctuate with increasing and decreasing world crude oil prices. While the Company attempts to recoup rising diesel fuel costs through the pricing of its services, to the extent such costs escalate, operating earnings will generally be adversely affected.
Fluctuations in oil and gas prices could have an effect on the Company
.
The Company’s future financial condition, revenues, results of operations and future rate of growth are materially affected by oil and natural gas prices. Oil and natural gas prices historically have been volatile and are likely to continue to be volatile in the future. Moreover, oil and natural gas prices depend on factors outside the control of the Company. These factors include:
8
|
·
|
supply and demand for oil and gas and expectations regarding supply and demand;
|
|
·
|
political conditions in other oil-producing countries, including the possibility of insurgency or war in such areas;
|
|
·
|
economic conditions in the United States and worldwide;
|
|
·
|
governmental regulations and taxation;
|
|
·
|
impact of energy conservation efforts;
|
|
·
|
the price and availability of alternative fuel sources;
|
|
·
|
weather conditions;
|
|
·
|
availability of local, interstate and intrastate transportation systems; and
|
|
·
|
market uncertainty.
|
Revenues are generated under contracts that must be renegotiated periodically.
Substantially all of the Company’s revenues are generated under contracts which expire periodically or which must be frequently renegotiated, extended or replaced. Whether these contracts are renegotiated, extended or replaced is often subject to factors beyond the Company’s control. Such factors include sudden fluctuations in oil and gas prices, counterparty ability to pay for or accept the contracted volumes and, most importantly, an extremely competitive marketplace for the services offered by the Company. There is no assurance that the costs and pricing of the Company’s services can remain competitive in the marketplace or that the Company will be successful in renegotiating its contracts.
Anticipated or scheduled volumes will differ from actual or delivered volumes.
The Company’s crude oil and natural gas marketing operation purchases initial production of crude oil and natural gas at the wellhead under contracts requiring the Company to accept the actual volume produced. The resale of such production is generally under contracts requiring a fixed volume to be delivered. The Company estimates its anticipated supply and matches such supply estimate for both volume and pricing formulas with committed sales volumes. Since actual wellhead volumes produced will never equal anticipated supply, the Company’s marketing margins may be adversely impacted. In many instances, any losses resulting from the difference between actual supply volumes compared to committed sales volumes must be absorbed by the Company.
Environmental liabilities and environmental regulations may have an adverse effect on the Company.
The Company’s business is subject to environmental hazards such as spills, leaks or any discharges of petroleum products and hazardous substances. These environmental hazards could expose the Company to material liabilities for property damage, personal injuries and/or environmental harms, including the costs of investigating and rectifying contaminated properties.
Environmental laws and regulations govern many aspects of the Company’s business, such as drilling and exploration, production, transportation and waste management. Compliance with environmental laws and regulations can require significant costs or may require a decrease in production. Moreover, noncompliance with these laws and regulations could subject the Company to significant administrative, civil and/or criminal fines and/or penalties.
Operations could result in liabilities that may not be fully covered by insurance
.
Transportation of hazardous materials and the oil and gas business involves certain operating hazards such as well blowouts, automobile accidents, explosions, fires and pollution. Any of these operating hazards could cause serious injuries, fatalities or property damage, which could expose the Company to liability. The payment of any of these liabilities could reduce, or even eliminate, the funds available for exploration, development, and acquisition, or could result in a loss of the Company’s properties and may even threaten survival of the enterprise.
9
Consistent with the industry standard, the Company’s insurance policies provide limited coverage for losses or liabilities relating to pollution, with broader coverage for sudden and accidental occurrences. Insurance might be inadequate to cover all liabilities. Moreover, from time to time, obtaining insurance for the Company’s line of business can become difficult and costly. Typically, when insurance cost escalates, the Company may reduce its level of coverage and more risk may be retained to offset cost increases. If substantial liability is incurred and damages are not covered by insurance or exceed policy limits, the Company’s operation and financial condition could be materially adversely affected.
Changes in tax laws or regulations could adversely affect the Company
.
The Internal Revenue Service, the United States Treasury Department and Congress and the states frequently review federal or state income tax legislation. The Company cannot predict whether, when or to what extent new federal or state tax laws, regulations, interpretations or rulings will be adopted. Any such legislative action may prospectively or retroactively modify tax treatment and, therefore, may adversely affect taxation of the Company. On February 14, 2011, the Office of Management and Budget released a summary of the proposed U.S. federal budget for fiscal year 2012. The proposed budget repeals certain tax incentives including the ability to fully deduct intangible drilling costs in the year incurred. Should such provisions become law, the Company’s tax payments would increase with a potentially negative impact on cash flows and drilling activities.
The Company’s business is subject to changing government regulations
.
Federal, state or local government agencies may impose environmental, labor or other regulations that increase costs and/or terminate or suspend operations. The Company’s business is subject to federal, state and local laws and regulations. These regulations relate to, among other things, the exploration, development, production and transportation of oil and natural gas. Existing laws and regulations could be changed, and any changes could increase costs of compliance and costs of operations.
Several proposals are before the U.S. Congress that, if implemented, would either prohibit the practice of hydraulic fracturing or subject the process to regulation under the Safe Drinking Water Act. The Company routinely participates in wells where fracturing techniques are utilized to expand the available space for natural gas and oil to migrate toward the well-bore. It is typically done at substantial depths in very tight formations. Although it is not possible at this time to predict the final outcome of the legislation regarding hydraulic fracturing, any new federal restrictions could result in increased compliance costs or additional operating restrictions.
Estimating reserves, production and future net cash flow is difficult
.
Estimating oil and natural gas reserves is a complex process that involves significant interpretations and assumptions. It requires interpretation of technical data and assumptions relating to economic factors such as future commodity prices, production costs, severance and excise taxes, capital expenditures and remedial costs, and the assumed effect of governmental regulation. As a result, actual results may differ from the Company’s estimates. Also, the use of a 10 percent discount factor for reporting purposes, as prescribed by the SEC, may not necessarily represent the most appropriate discount factor, given actual interest rates and risks to which the Company’s business is subject. Any significant variations from the Company’s valuations could cause the estimated quantities and net present value of the Company’s reserves to differ materially.
The reserve data included in this report is only an estimate. The reader should not assume that the present values referred to in this report represent the current market value of the Company’s estimated oil and natural gas reserves. The timing of the production and the expenses from development and production of oil and natural gas properties will affect both the timing of actual future net cash flows from the Company’s proved reserves and their present value.
10
The Company’s business is dependent on the ability to replace reserves
.
Future success depends in part on the Company’s ability to find, develop and acquire additional oil and natural gas reserves. Without successful acquisition or exploration activities, reserves and revenues will decline as a result of current reserves being depleted by production. The successful acquisition, development or exploration of oil and natural gas properties requires an assessment of recoverable reserves, future oil and natural gas prices and operating costs, potential environmental and other liabilities, and other factors. These assessments are necessarily inexact. As a result, the Company may not recover the purchase price of a property from the sale of production from the property, or may not recognize an acceptable return from properties acquired. In addition, exploration and development operations may not result in any increases in reserves. Exploration or development may be delayed or cancelled as a result of inadequate capital, compliance with governmental regulations or price controls or mechanical difficulties. In the future, the cost to find or acquire additional reserves may become prohibitive.
Revenues are dependent on the ability to successfully complete drilling activity
.
Drilling and exploration are one of the main methods of replacing reserves. However, drilling and exploration operations may not result in any increases in reserves for various reasons. Drilling and exploration may be curtailed, delayed or cancelled as a result of:
|
·
|
lack of acceptable prospective acreage;
|
|
·
|
inadequate capital resources;
|
|
·
|
weather;
|
|
·
|
title problems;
|
|
·
|
compliance with governmental regulations; and
|
|
·
|
mechanical difficulties.
|
Moreover, the costs of drilling and exploration may greatly exceed initial estimates. In such a case, the Company would be required to make additional expenditures to develop its drilling projects. Such additional and unanticipated expenditures could adversely affect the Company’s financial condition and results of operations.
Security issues exist relating to drivers, equipment and terminal facilities
The Company transports liquid combustible materials such as gasoline and petrochemicals and such materials may be a target for terrorist attacks. While the Company employs a variety of security measures to mitigate the risk of such events no assurance can be given that such events will not occur.
Current and future litigation could have an adverse effect on the Company.
The Company is currently involved in several administrative and civil legal proceedings in the ordinary course of its business. Moreover, as incidental to operations, the Company sometimes becomes involved in various lawsuits and/or disputes. Lawsuits and other legal proceedings can involve substantial costs, including the costs associated with investigation, litigation and possible settlement, judgment, penalty or fine. Although insurance is maintained to mitigate these costs, there can be no assurance that costs associated with lawsuits or other legal proceedings will not exceed the limits of insurance policies. The Company’s results of operations could be adversely affected if a judgment, penalty or fine is not fully covered by insurance.
None.
11
From time to time as incident to its operations, the Company may become involved in various lawsuits and/or disputes. Primarily as an operator of an extensive trucking fleet, the Company is a party to motor vehicle accidents, worker compensation claims and other items of general liability as would be typical for the industry. Management of the Company is presently unaware of any claims against the Company that are either outside the scope of insurance coverage, or that may exceed the level of insurance coverage, and could potentially represent a material adverse effect on the Company’s financial position or results of operations.
12
|
Item 5.
|
MARKET FOR THE REGISTRANT'S COMMON STOCK, RELATED SECURITY HOLDER MATTERS AND ISSUER REPURCHASE OF EQUITY SECURITIES
|
The Company's common stock is traded on the NYSE Amex, formerly known as the American Stock Exchange, under the ticker symbol “AE”. The following table sets forth the high and low sales prices of the common stock as reported by the NYSE Amex for each calendar quarter since January 1, 2009.
|
American Stock Exchange
|
||||||||
|
High
|
Low
|
|||||||
|
2009
|
||||||||
|
First Quarter
|
$ | 18.40 | $ | 12.66 | ||||
|
Second Quarter
|
18.49 | 12.75 | ||||||
|
Third Quarter
|
21.95 | 14.83 | ||||||
|
Fourth Quarter
|
25.18 | 19.18 | ||||||
|
2010
|
||||||||
|
First Quarter
|
$ | 23.39 | $ | 17.40 | ||||
|
Second Quarter
|
19.95 | 15.25 | ||||||
|
Third Quarter
|
21.49 | 16.00 | ||||||
|
Fourth Quarter
|
24.95 | 17.86 | ||||||
At March 10, 2011 there were approximately 253 shareholders of record of the Company's common stock and the closing stock price was $25.97 per share. The Company has no securities authorized for issuance under equity compensation plans. The Company made no repurchases of its stock during 2010 and 2009.
On December 15, 2010, the Company paid an annual cash dividend of $.54 per common share to common stockholders of record on December 1, 2010. On December 15, 2009, the Company paid an annual cash dividend of $.50 per common share to common stockholders of record on December 1, 2009. Such dividends totaled $2,277,540 and $2,108,798 for each of 2010 and 2009, respectively.
13
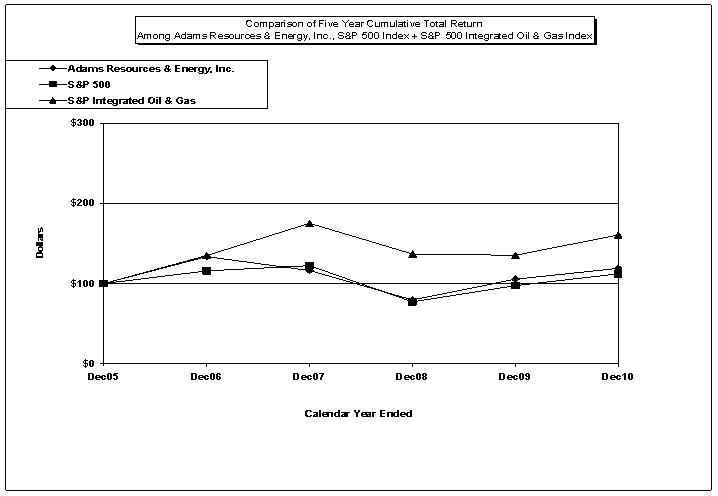
Performance Graph
The performance graph shown below was prepared under the applicable rules of the SEC based on data supplied by Research Data Group. The purpose of the graph is to show comparative total stockholder returns for the Company versus other investment options for a specified period of time. The graph was prepared based upon the following assumptions:
|
1.
|
$100.00 was invested on December 31, 2005 in the Company’s common stock, the S&P 500 Index, and the S&P 500 Integrated Oil and Gas Index.
|
|
2.
|
Dividends are reinvested on the ex-dividend dates.
|
Note: The stock price performance shown on the graph below is not necessarily indicative of future price performance.
|
Total Return To Shareholders
|
||||||
|
(Includes reinvestment of dividends)
|
||||||
|
INDEXED RETURNS
|
||||||
|
Base
|
Years Ending
|
|||||
|
Period
|
||||||
|
Company / Index
|
Dec05
|
Dec06
|
Dec07
|
Dec08
|
Dec09
|
Dec10
|
|
Adams Resources & Energy, Inc.
|
100
|
133.65
|
116.48
|
79.61
|
105.65
|
119.21
|
|
S&P 500 Index
|
100
|
115.80
|
122.16
|
76.96
|
97.33
|
111.99
|
|
S&P 500 Integrated Oil & Gas Index
|
100
|
134.83
|
175.08
|
136.93
|
135.17
|
160.64
|
FIVE YEAR REVIEW OF SELECTED FINANCIAL DATA
|
Years Ended December 31,
|
|||||||||||||||||||||||||
| 2010 |
2009
|
2008
|
2007 | 2006 |
|
|
|
||||||||||||||||||
|
(In thousands, except per share data)
|
|||||||||||||||||||||||||
|
Revenues:
|
|||||||||||||||||||||||||
|
Marketing
|
$ | 2,144,082 | $ | 1,889,583 | $ | 4,074,677 | $ | 2,558,545 | $ | 2,167,502 | |||||||||||||||
|
Transportation
|
56,867 | 44,895 | 67,747 | 63,894 | 62,151 | ||||||||||||||||||||
|
Oil and natural gas
|
11,021 | 8,650 | 17,248 | 13,783 | 16,950 | ||||||||||||||||||||
| $ | 2,211,970 | $ | 1,943,128 | $ | 4,159,672 | $ | 2,636,222 | $ | 2,246,603 | ||||||||||||||||
|
Operating Earnings:
|
|||||||||||||||||||||||||
|
Marketing
|
$ | 16,724 | $ | 17,487 | $ | (2,704 | ) | $ | 20,152 | $ | 12,975 | ||||||||||||||
|
Transportation
|
6,623 | 2,128 | 4,245 | 5,504 | 5,173 | ||||||||||||||||||||
|
Oil and gas operations
|
(1,757 | ) | (3,625 | ) | (3,348 | ) | (2,853 | ) | 5,355 | ||||||||||||||||
|
Oil and gas property sale
|
- | - | - | 12,078 | - | ||||||||||||||||||||
|
General and administrative
|
(9,044 | ) | (9,589 | ) | (9,667 | ) | (10,974 | ) | (8,536 | ) | |||||||||||||||
| 12,546 | 6,401 | (11,474 | ) | 23,907 | 14,967 | ||||||||||||||||||||
|
Other income (expense):
|
|||||||||||||||||||||||||
|
Interest income
|
191 | 125 | 1,103 | 1,741 | 965 | ||||||||||||||||||||
|
Interest expense
|
(36 | ) | (25 | ) | (187 | ) | (134 | ) | (159 | ) | |||||||||||||||
|
Earnings (loss) from continuing operations
|
|||||||||||||||||||||||||
|
before income taxes
|
12,701 | 6,501 | (10,558 | ) | 25,514 | 15,773 | |||||||||||||||||||
|
Income tax (provision) benefit
|
(4,070 | ) | (2,352 | ) | 4,986 | (8,458 | ) | (5,290 | ) | ||||||||||||||||
|
Net earnings (loss)
|
$ | 8,631 | $ | 4,149 | $ | (5,572 | ) | $ | 17,056 | $ | 10,483 | ||||||||||||||
|
Earnings (Loss) Per Share
|
|||||||||||||||||||||||||
|
Basic and diluted earnings (loss) per share
|
$ | 2.05 | $ | .98 | $ | (1.32 | ) | $ | 4.04 | $ | 2.49 | ||||||||||||||
|
Dividends per common share
|
$ | .54 | $ | .50 | $ | .50 | $ | .47 | $ | .42 | |||||||||||||||
|
Financial Position
|
|||||||||||||||||||||||||
|
Working capital
|
$ | 39,978 | $ | 38,372 | $ | 41,559 | $ | 50,572 | $ | 35,208 | |||||||||||||||
|
Total assets
|
301,305 | 249,401 | 210,926 | 357,075 | 289,287 | ||||||||||||||||||||
|
Long-term debt, net of
|
|||||||||||||||||||||||||
|
current maturities
|
- | - | - | - | 3,000 | ||||||||||||||||||||
|
Shareholders’ equity
|
90,155 | 83,801 | 81,761 | 89,442 | 74,368 | ||||||||||||||||||||
|
Dividends on common shares
|
2,277 | 2,109 | 2,109 | 1,982 | 1,771 | ||||||||||||||||||||
________________________________
Notes:
|
-
|
In 2007, certain oil and natural gas producing properties were sold for $14.9 million producing a net gain of $12.1 million.
|
14
|
|
|
Results of Operations
-
Marketing
Marketing revenues, operating earnings and depreciation are as follows
(in thousands):
|
2010
|
2009
|
2008
|
||||||||||
|
Revenues
|
||||||||||||
|
Crude oil
|
$ | 2,005,301 | $ | 1,770,600 | $ | 3,849,531 | ||||||
|
Natural gas
|
10,592 | 14,232 | 11,586 | |||||||||
|
Refined products
|
128,189 | 104,751 | 213,560 | |||||||||
|
Total
|
$ | 2,144,082 | $ | 1,889,583 | $ | 4,074,677 | ||||||
|
Operating Earnings (loss)
|
||||||||||||
|
Crude oil
|
$ | 13,530 | $ | 15,404 | $ | (4,545 | ) | |||||
|
Natural gas
|
3,073 | 2,749 | 2,247 | |||||||||
|
Refined products
|
121 | (666 | ) | (406 | ) | |||||||
|
Total
|
$ | 16,724 | $ | 17,487 | $ | (2,704 | ) | |||||
|
Depreciation
|
||||||||||||
|
Crude oil
|
$ | 2,320 | $ | 1,997 | $ | 2,039 | ||||||
|
Natural gas
|
44 | 166 | 163 | |||||||||
|
Refined products
|
503 | 533 | 565 | |||||||||
|
Total
|
$ | 2,867 | $ | 2,696 | $ | 2,767 | ||||||
Supplemental volume and price information is:
|
2010
|
2009
|
2008
|
||||||||||
|
Field Level Purchases per day
(1)
|
||||||||||||
|
Crude Oil – barrels
|
69,000 | 66,100 | 67,800 | |||||||||
|
Natural Gas – mmbtu’s
|
258,000 | 363,000 | 437,000 | |||||||||
|
Average Purchase Price
|
||||||||||||
|
Crude Oil – per barrel
|
$ | 77.20 | $ | 58.32 | $ | 99.72 | ||||||
|
Natural Gas – per mmbtu
|
$ | 4.28 | $ | 3.75 | $ | 8.63 | ||||||
|
|
(1)
Reflects the volume purchased from third parties at the oil and natural gas field level and pipeline pooling points.
|
Comparison 2010 to 2009
Crude oil revenues were elevated by 13 percent in 2010 due to both volume and price increases. Average crude oil prices increased by 33 percent and crude oil lease level volumes improved by 4 percent as shown in the table above. Total revenue grew by less than the amount indicated by pricing because certain buy/sell arrangements are reported on a net revenue basis and as a result, a change in the Company’s customer mix will increase or decrease comparative reported revenues. During 2010 a larger portion of sales were reported on a net revenue basis, partially offsetting the effect of increased average prices and volumes.
15
Increased crude oil prices boosted operating earnings during 2010. The average acquisition price of crude oil moved from $75 per barrel at the beginning of the year to $88 per barrel for December 2010 resulting in inventory liquidation gains totaling $2,272,000. Similarly, during 2009, crude oil prices rose from the $41 per barrel range in January to the $75 per barrel range by December 2009 producing a $5,780,000 inventory liquidation gain. As of December 31, 2010, the Company held 146,269 barrels of crude oil inventory at an average price of $88.26 per barrel.
Diesel fuel expense which tends to fluctuate in tandem with crude oil prices also has a significant impact on operating earnings. A relatively low level of diesel fuel costs during 2009, served to improve comparative operating earnings for such year. The impact on crude oil operating earnings from inventory liquidation gains and diesel fuel cost is summarized as follows
(in thousands):
|
2010
|
2009
|
2008
|
||||||||||
|
As reported operating earnings
|
$ | 13,530 | $ | 15,404 | $ | (4,545 | ) | |||||
|
Inventory liquidation (gains)
|
(2,272 | ) | (5,780 | ) | 11,883 | |||||||
| $ | 11,258 | $ | 9,624 | $ | 7,338 | |||||||
|
Diesel fuel expense
|
$ | 6,001 | $ | 4,612 | $ | 7,271 | ||||||
During 2010, the Company has generally experienced an increase in per unit margins as the increasing cost to procure supply has lagged end market pricing. This pricing scenario has been driven, in large part, by recent new production trends in the Eagle Ford shale formation of South Texas. This trend looks to continue as the Eagle Ford formation is currently an active area for drilling for several of the Company’s suppliers.
Natural gas sales are reported net of underlying natural gas purchase costs and thus reflect gross margin. As shown above, gross margins were reduced during 2010 as average field level purchase volumes were off 29 percent for the period (see table above). Current volume declines resulted from the Company’s suppliers curtailing drilling activity due to lower natural gas prices. In addition, development of the United States’ natural gas infrastructure including more diverse areas of production and expanded pipeline and storage capacity have served to reduce purchase opportunities and per unit margins. In contrast to the gross margin trend, the Company’s natural gas marketing personnel were able to adjust marketplace strategy and capture additional margin opportunities which bolstered operating earnings for the current year.
Operating earnings for the refined products segment improved in 2010 as the United States economy stabilized.
Both 2009 and 2008 suffered from the downturn in the domestic economy which began during the third quarter of 2008. Due to customer financial stability concerns, refined product operating earnings were additionally impacted in 2009 and 2008 when the bad debt provision was increased by approximately $560,000 and $700,000, respectively. The Company focused on cost controls and instituted personnel cut-backs in the fourth quarter of 2009 to restore profitability to this segment.
Comparison 2009 to 2008
Crude oil revenues declined for 2009 by 54 percent relative to 2008 because of significantly lower average crude oil prices as shown in the table above. While comparative overall crude oil prices were reduced in 2009, the direction of change in price was generally increasing during the period leading to the operating gains as discussed above.
As shown on the comparative table above, natural gas gross margins spiked in 2009 at $14,232,000. This result occurred because in 2009 the Company elected to ship more of its gas supply on the interstate and intrastate pipeline systems. This strategy boosted unit gross margins but also increased pipeline transportation expense, a deduction for operating margins.
Historically, prices received for crude oil and natural gas as well as derivative products have been volatile and unpredictable with price volatility expected to continue. See also discussion under Item 1A Risk Factors.
16
-
Transportation
The transportation segment revenues and operating earnings were as follows
(in thousands):
|
2010
|
2009
|
2008
|
||||||||||||||||||||||
|
Amount
|
Change
(1)
|
Amount
|
Change
(1)
|
Amount
|
Change
(1)
|
|||||||||||||||||||
|
Revenues
|
$ | 56,867 | 27 | % | $ | 44,895 | (34 | )% | $ | 67,747 | 6 | % | ||||||||||||
|
Operating earnings
|
$ | 6,623 | 211 | % | $ | 2,128 | (50 | )% | $ | 4,245 | (23 | )% | ||||||||||||
|
Depreciation
|
$ | 4,288 | 8 | % | $ | 3,970 | 3 | % | $ | 3,843 | (10 | )% | ||||||||||||
______________
|
(1)
|
Represents the percentage increase (decrease) from the prior year.
|
Comparison 2010 to 2009
Revenues and operating results improved for the transportation segment in 2010 due to increased customer demand. The Company’s customers predominately consist of the domestic petrochemical industry and demand for such products has substantially recovered from the slow down occurring in 2009. Serving to improve customer demand was a recovering United States economy, relatively low natural gas prices and improved export demand for petrochemicals. In addition, during the recent economic downturn, the trucking industry reduced capacity by retiring older units without replacement. Following recent demand improvement, industry capacity has been strained allowing rate increases and improved overall profitability. As transportation revenues increase or decrease, operating earnings will typically increase or decrease at an accelerated rate. This trend results because the fixed cost components of the Company’s operation do not vary with changing revenues. As currently configured, operating earnings project at break-even levels when annual revenues average approximately $47 million. Above that level, operating earnings will grow and below that level losses result.
Transportation segment depreciation increased in 2010 as older fully depreciated tractor units were replaced with new model year vehicles. The purchase of 200 current model year tractor and trailer units at an estimated cost of approximately $20 million is planned for 2011 through midway 2012.
Comparison 2009 to 2008
Revenues and operating results turned downward for the transportation segment in 2009 due to reduced customer demand beginning in the third quarter of 2008. The national economic recession occurring at the time severely and adversely impacted this segment of the Company’s business. Typically, as revenues decline, operating earnings decline at a faster rate, as measured by percentage, due to the fixed cost components of operating costs. In March 2009, the Company instituted cost cutting measures including a reduction in personnel levels in order to better align costs with a lower level of revenues. As a result, the rate of decline in operating earnings slowed relative to the rate of decline in revenues beginning in the second quarter of 2009 and these cost cutting measures contributed to a stronger than normal level of improvement in 2010 when customer demand resumed.
-
Oil and Gas
Oil and gas segment revenues and operating earnings are primarily derived from crude oil and natural gas production volumes and prices. Comparative amounts for revenues, operating earnings and depreciation and depletion were as follows
(in thousands):
17
|
2010
|
2009
|
2008
|
||||||||||||||||||||||
|
Amount
|
Change
(1)
|
Amount
|
Change
(1)
|
Amount
|
Change
(1)
|
|||||||||||||||||||
|
Revenues
|
$ | 11,021 | 27 | % | $ | 8,650 | (50 | )% | $ | 17,248 | 25 | % | ||||||||||||
|
Operating earnings (loss)
|
(1,757 | ) | 51 | % | (3,625 | ) | 8 | % | (3,348 | ) | 17 | % | ||||||||||||
|
Depreciation and depletion
|
4,662 | 28 | % | 3,654 | (46 | )% | 6,763 | 16 | % | |||||||||||||||
|
Producing property impairments
|
946 | (30 | )% | 1,350 | (56 | )% | 3,078 | 153 | % | |||||||||||||||
______________
|
(1)
|
Represents the percentage increase (decrease) from the prior year.
|
The revenue and earnings improvement for the oil and gas segment is attributable to crude oil and natural gas volume and price increases as shown in the table below. Volumes improved with the results of recent drilling efforts. Operating earnings in 2010 also benefited from reduced exploration and impairment expenses as shown in the second table below.
As shown above, depreciation and depletion expense was reduced in 2009 because a significant decline in hydrocarbon prices at year-end December 31, 2008 caused significant producing property impairment provisions to be recorded during 2008 and such charges reduced the level of capitalized costs for amortizing in 2009.
Comparative volumes and prices were as follows:
|
2010
|
2009
|
2008
|
|||||||||||||
|
Production Volumes
|
|||||||||||||||
|
- Crude Oil
|
54,000 |
bbls
|
49,500 |
bbls
|
50,500 |
bbls
|
|||||||||
|
- Natural Gas
|
1,365,000 |
mcf
|
1,304,000 |
mcf
|
1,243,000 |
mcf
|
|||||||||
|
Average Price
|
|||||||||||||||
|
- Crude Oil
|
$ | 77.09 |
bbls
|
$ | 58.10 |
bbls
|
$ | 99.25 |
bbls
|
||||||
|
- Natural Gas
|
$ | 5.02 |
mcf
|
$ | 4.43 |
mcf
|
$ | 9.84 |
mcf
|
||||||
Comparative exploration and impairment costs were as follows
(in thousands):
|
2010
|
2009
|
2008
|
||||||||||
|
Dry hole expense
|
$ | 1,894 | $ | 661 | $ | 2,421 | ||||||
|
Prospect impairment
|
1,277 | 2,423 | 2,834 | |||||||||
|
Seismic and geological
|
62 | 734 | 775 | |||||||||
|
Total
|
$ | 3,233 | $ | 3,818 | $ | 6,030 | ||||||
During 2010, the Company participated in the drilling of 53 wells with 41 successful and 12 dry holes. Additionally, the Company had twenty-one wells in process on December 31, 2010 with ultimate evaluation anticipated during 2011. Converting natural gas volumes to equate with crude oil volumes at a ratio of six to one, oil and gas production volumes and proved reserve changes summarized as follows on an equivalent barrel (Eq. Bbls) basis:
18
|
2010
|
2009
|
2008
|
||||||||||
|
(Eq. Bbls.)
|
(Eq. Bbls.)
|
(Eq. Bbls.)
|
||||||||||
|
Proved reserves – beginning of year
|
1,450,000 | 1,304,000 | 1,475,000 | |||||||||
|
Estimated reserve additions
|
536,000 | 439,000 | 395,000 | |||||||||
|
Production volumes
|
(282,000 | ) | (267,000 | ) | (258,000 | ) | ||||||
|
Revisions of previous estimates
|
(138,000 | ) | (26,000 | ) | (308,000 | ) | ||||||
|
Proved reserves - end of year
|
1,566,000 | 1,450,000 | 1,304,000 | |||||||||
During 2010 and in total for the three year period ended December 31, 2010, estimated reserve additions represented 190 percent and 172 percent, respectively, of production volumes.
The Company’s current drilling and exploration efforts are primarily focused as follows:
East Texas Project
Beginning in 2005, the Company began acquiring acreage interests in Nacogdoches and Shelby counties of East Texas. Subsequent drilling activity produced 26 productive wells through the end of 2009. Drilling activity in the area’s Haynesville shale formation increased dramatically in 2010, primarily to maintain the Company’s leasehold position for future development drilling as natural gas prices improve. Twenty-two successful wells were drilled with no dry holes during 2010, bringing the total number of Haynesville shale wells to thirty-four including wells in progress at year end. Last year the Company, with its partner, acquired an additional 19,000 acres in Angelina County due south of the Company’s original acreage position. Acreage maintained by production now totals approximately 37,000 gross acres with approximately 54,000 gross acres remaining to be drilled. The Company’s working interest in this project varies from two percent to five percent and the Company’s acreage position net to its interest is approximately 3,200 acres. Thirty-four additional wells are planned in this area in 2011.
Austin County Project
In 2008, the Company elected to participate in the exploitation of an existing 3-D seismic survey over the Raccoon Bend Dome located in Austin County, Texas. The oil prospect was to test deeper zones that had not been adequately evaluated by earlier drilling. Seven wells were drilled in 2010 bringing the total number of wells drilled in the prospect to eleven with eight of the eleven successfully completed as oil wells. Drilling on this project will continue in 2011 with three or four wells planned back to back during the second quarter. The operator of the property has identified additional locations that may also be drilled in 2011. The Company has an 8% working interest in this prospect.
South Central Kansas Project
The Company is participating with a 10 percent working interest in a large 3-D seismic survey in South Central Kansas and has a working interest in 23,693 gross acres. A number of prospects have been identified and four wells were drilled in 2010. Two of these wells were completed with marginal success and a third well is currently testing after frac. The fourth well was not successful. The seismic is being reevaluated and additional drilling is planned for 2011.
19
West Texas Project
Beginning in 2008, the Company participated in the acquisition and development of approximately 48,000 acres in the Wolfcamp formation of Irion County, Texas. Initial results did not meet expectations and a second third party operator was brought into the project. Twelve Wolfcamp shale wells have now been drilled with seven such wells being horizontal developments. Recent results are positive with initial flow rates over 500 barrels of oil per day. Twenty four wells are planned for drilling on this acreage in 2011 and the Company has an approximate two percent working interest in this project.
Subsequent Property Sale
In January 2011, the Company completed the sale of its interest in certain producing oil and gas properties located in the on-shore Gulf Coast region of Texas. Proceeds from the sale totaled $6.2 million and the Company will report a pre-tax gain of approximately $2.7 million from this transaction during the first quarter of 2011. Total proved reserves sold were approximately 26,000 barrels of crude oil and 2,148,000 mcf of natural gas. Sales negotiations were conducted by the third party operator of the properties on behalf of all working interest owners and the transaction was completed with a separate third party investment entity. The Company’s proportionate interest in the transaction was approximately 5 percent and the Company elected to participate in the sale due to attractive pricing. Proceeds from the sale will be used for general working capital purposes.
|
-
|
General and administrative, interest income and income tax
|
General and administrative expenses were consistent during the five year review period ending December 31, 2010 except during 2007 such costs were elevated due to federally mandated Sarbanes-Oxley compliance costs. Interest income declined for 2010 and 2009 as interest rates on overnight deposits declined to near zero following the significant turmoil that occurred in the financial markets during the fall of 2008. The provision for income taxes is based on Federal and State tax rates and variations are consistent with taxable income in the respective accounting periods.
|
|
-
|
Outlook
|
The marketing and transportation segments have been performing at expected levels and business currently looks to be holding firm. Increased crude oil production in the Company’s South Texas marketing area is also occurring as the Eagle Ford shale play is being developed by third party operators in the region. In contrast to the recent strength in the crude oil markets, natural gas prices have been in decline, falling at times to below $4 per mcf. Despite low natural gas prices, the Company’s recent drilling success has improved oil and gas segment earnings and management believes this earnings trend will continue.
The Company has the following major objectives for 2011:
|
-
|
Maintain marketing operating earnings at the $15 million level exclusive of inventory valuation gains or losses.
|
|
-
|
Maintain transportation operating earnings at the $6 million level.
|
|
-
|
Establish oil and gas operating earnings at the $5 million level and replace 2011 production with current reserve additions.
|
20
Liquidity and Capital Resources
The Company’s liquidity primarily derives from net cash provided from operating activities, which was $36,928,000, $22,285,000 and $13,639,000 for each of 2010, 2009 and 2008, respectively. As of December 31, 2010 and 2009, the Company had no bank debt or other forms of debenture obligations. Cash and cash equivalents totaled $29,032,000 as of December 31, 2010, and such balances are maintained in order to meet the timing of day-to-day cash needs. Working capital, the excess of current assets over current liabilities, totaled $36,928,000 as of December 31, 2010.
Capital expenditures during 2010 included $10,722,000 for marketing and transportation equipment additions, primarily consisting of trucks-tractors, and $11,699,000 in property additions associated with oil and gas exploration and production activities. For 2011, the Company anticipates expending an additional approximately $24 million on oil and gas exploration projects. In addition, approximately $20 million will be expended during 2011 for the purchase of 200 trucks-tractors for the transportation segment and approximately $7 million will be expended for the purchase of 50 trucks-tractors and trailers for the marketing segment with funding for such purchase from available cash flow. These units will serve to replace older units and to increase the marketing and transportation fleets. Funding for these 2011 projects will be from operating cash flow and available working capital. However, the Company has also initiated discussion with a bank about establishing a working capital line of credit in order to provide an additional source of capital should the need arise to fund the anticipated projects. Further, within certain constraints, the proposed projects can be delayed or cancelled should funding become unavailable.
From time to time, the Company may make cash prepayments to certain suppliers of crude oil and natural gas for the Company’s marketing operations. Such prepayments totaled $5,150,000 as of December 31, 2010 and such amounts will be recouped and advanced from month to month as the suppliers deliver product to the Company. The Company also requires certain counterparties to post cash collateral with the Company in order to support their purchase from the Company. Such cash collateral held by the Company totaled $1,700,000 as of December 31, 2010. The Company also maintains a stand-by letter of credit facility with Wells Fargo Bank to provide for the issuance of stand-by letters of credit to the Company’s suppliers of crude oil and natural gas (see Note 1 to Financial Statements). The issuance of stand-by letters of credit enables the Company to avoid posting cash collateral when procuring crude oil and natural gas supply. As of December 31, 2010, letters of credit outstanding totaled $23.9 million. Management believes current cash balances, together with expected cash generated from future operations, will be sufficient to meet short-term and long-term liquidity needs.
Historically, the Company pays an annual dividend in the fourth quarter of each year, and the Company paid a $.54 per common share dividend or $2,277,000 to shareholders of record as of December 1, 2010.
The most significant item affecting future increases or decreases in liquidity is earnings from operations and such earnings are dependent on the success of future operations (see Item 1A. Risk Factors in this annual report of Form 10-K).
Off-balance Sheet Arrangements
The Company maintains certain operating lease arrangements primarily with independent truck owner-operators in order to provide truck-tractor equipment for the Company’s fleet. Any commitments with independent truck owner-operators are on a month-to-month basis. In addition, the Company has entered into certain lease and terminal access contracts in order to provide tank storage and dock access for its crude oil marketing business. Such contracts require certain minimum monthly payments for the term of the contracts. All operating lease commitments qualify for off-balance sheet treatment. Rental expense for the years ended December 31, 2010, 2009, and 2008 was $5,870,000, $6,898,000 and $13,423,000, respectively. As of December 31, 2010, rental commitments under long-term non-cancelable operating leases and terminal arrangements for the next five years are payable as follows: 2011 - $2,070,000; 2012 - $1,539,000; 2013 - $1,427,000; 2014 - $748,000; 2015 – $480,000 and $1,080,000 thereafter.
21
Contractual Cash Obligations
The Company has no capital lease obligations. The Company has entered into certain operating leasing arrangements and terminal access agreements for tankage, truck-tractors, trailers and office space. A summary of the payment periods for contractual cash obligations is as follows
(in thousands):
|
2011
|
2012
|
2013
|
2014
|
2015
|
Thereafter
|
Total
|
||||||||||||||||||||||
|
Lease payments
|
$ | 2,070 | $ | 1,539 | $ | 1,427 | $ | 748 | $ | 480 | $ | 1,080 | $ | 7,344 | ||||||||||||||
In addition to its lease financing obligations, the Company is also committed to purchase certain quantities of crude oil and natural gas in connection with its marketing activities. Such commodity purchase obligations are the basis for commodity sales, which generate the cash flow necessary to meet such purchase obligations. Approximate commodity purchase obligations as of December 31, 2010 are as follows
(in thousands):
|
January
|
Remaining
|
|||||||||||||||||||||||
|
2011
|
2011
|
2012
|
2013
|
Thereafter
|
Total
|
|||||||||||||||||||
|
Crude Oil
|
$ | 186,904 | $ | 5,296 | $ | - | $ | - | $ | - | $ | 192,200 | ||||||||||||
|
Natural Gas
|
22,872 | 125 | - | - | - | 22,997 | ||||||||||||||||||
| $ | 209,776 | $ | 5,421 | $ | - | $ | - | $ | - | $ | 215,197 | |||||||||||||
Insurance
From time to time, the marketplace for all forms of insurance enters into periods of severe cost increases. In the past, during such cyclical periods, the Company has seen costs escalate to the point where desired levels of insurance were either unavailable or unaffordable. The Company’s primary insurance needs are in the areas of worker’s compensation, automobile and umbrella coverage for its trucking fleet and medical insurance for employees. During each of 2010, 2009 and 2008, insurance costs were stable and totaled $10 million, $10.5 million and $10.6 million, respectively. Overall insurance cost may experience renewed rate increases during 2011. Since the Company is generally unable to pass on such cost increases, any increase will need to be absorbed by existing operations.
Competition
In all phases of its operations, the Company encounters strong competition from a number of entities. Many of these competitors possess financial resources substantially in excess of those of the Company. The Company faces competition principally in establishing trade credit, pricing of available materials and quality of service. In its oil and gas operation, the Company also competes for the acquisition of mineral properties. The Company's marketing division competes with major oil companies and other large industrial concerns that own or control significant refining and marketing facilities. These major oil companies may offer their products to others on more favorable terms than those available to the Company. From time to time in recent years, there have been supply imbalances for crude oil and natural gas in the marketplace. This in turn has led to significant fluctuations in prices for crude oil and natural gas. As a result, there is a high degree of uncertainty regarding both the future market price for crude oil and natural gas and the available margin spread between wholesale acquisition costs and sales realization.
Critical Accounting Policies and Use of Estimates
Fair Value Accounting
The Company enters into certain forward commodity contracts that are required to be recorded at fair value and such contracts are recorded as either an asset or liability measured at its fair value. Changes in fair value are recognized immediately in earnings unless the derivatives qualify for, and the Company elects, cash flow hedge accounting. The Company had no contracts designated for hedge accounting during 2010, 2009 and 2008.
22
The Company utilizes a market approach to valuing its commodity contracts. On a contract by contract, forward month by forward month basis, the Company obtains observable market data for valuing its contracts. Such contracts typically have durations that are less than 18 months. As of December 31, 2010, all of the Company’s market value measurements were based on either quoted prices in active markets (Level 1 inputs) or from inputs based on observable market data (Level 2 inputs). See discussion under “Fair Value Measurements” in Note 1 to the Consolidated Financial Statements.
The Company’s fair value contracts give rise to market risk, which represents the potential loss that may result from a change in the market value of a particular commitment. The Company monitors and manages its exposure to market risk to ensure compliance with the Company’s risk management policies. Such policies are regularly assessed to ensure their appropriateness given management’s objectives, strategies and current market conditions.
Trade Accounts
Accounts receivable and accounts payable typically represent the most significant assets and liabilities of the Company. Particularly within the Company’s energy marketing, oil and gas exploration, and production operations, there is a high degree of interdependence with and reliance upon third parties (including transaction counterparties) to provide adequate information for the proper recording of amounts receivable or payable. Substantially all such third parties are larger firms providing the Company with the source documents for recording trade activity. It is commonplace for these entities to retroactively adjust or correct such documents. This typically requires the Company to absorb, benefit from, or pass along such corrections to another third party.
Due to the volume of and complexity of transactions and the high degree of interdependence with third parties, this is a difficult area to control and manage. The Company manages this process by participating in a monthly settlement process with each of its counterparties. Ongoing account balances are monitored monthly and the Company attempts to gain the cooperation of such counterparties to reconcile outstanding balances. The Company also places great emphasis on collecting cash balances due and paying only bonafide and properly supported claims. In addition, the Company maintains and monitors its bad debt allowance. Nevertheless a degree of risk remains due to the custom and practices of the industry.
Oil and Gas Reserve Estimate
The value of the capitalized cost of oil and natural gas exploration and production related assets are dependent on underlying oil and natural gas reserve estimates. Reserve estimates are based on many subjective factors. The accuracy of reserve estimates depends on the quantity and quality of geological data, production performance data and reservoir engineering data, the pricing assumptions utilized as well as the skill and judgment of petroleum engineers in interpreting such data. The process of estimating reserves requires frequent revision of estimates (usually on an annual basis) as additional information becomes available. Calculations of estimated future oil and natural gas revenues are also based on estimates of the timing of oil and natural gas production, and there are no assurances that the actual timing of production will conform to or approximate such estimates. Also, certain assumptions must be made with respect to pricing. The Company’s estimates assume prices will remain constant from the date of the engineer’s estimates, except for changes reflected under natural gas sales contracts. There can be no assurance that actual future prices will not vary as industry conditions, governmental regulation, political conditions, economic conditions, weather conditions, market uncertainty and other factors impact the market price for oil and natural gas.
The Company follows the successful efforts method of accounting, so only costs (including development dry hole costs) associated with producing oil and natural gas wells are capitalized. Estimated oil and natural gas reserve quantities are the basis for the rate of amortization under the Company’s units of production method for depreciating, depleting and amortizing of oil and natural gas properties. Estimated oil and natural gas reserve values also provide the standard for the Company’s periodic review of oil and natural gas properties for impairment.
23
Contingencies
From time to time as incident to its operations, the Company becomes involved in various accidents, lawsuits and/or disputes. Primarily as an operator of an extensive trucking fleet, the Company is a party to motor vehicle accidents, worker compensation claims or other items of general liability as are typical for the industry. In addition, the Company has extensive operations that must comply with a wide variety of tax laws, environmental laws and labor laws, among others. Should an incident occur, management evaluates the claim based on its nature, the facts and circumstances and the applicability of insurance coverage. To the extent management believes that such event may impact the financial condition of the Company, management will estimate the monetary value of the claim and make appropriate accruals or disclosure as provided in the appropriate accounting literature guidelines.
Revenue Recognition
The Company’s crude oil, natural gas and refined products marketing customers are invoiced daily or monthly based on contractually agreed upon terms. Revenue is recognized in the month in which the physical product is delivered to the customer. Where required, the Company also recognizes fair value or mark-to-market gains and losses related to its commodity activities. A detailed discussion of the Company’s revenue recognition policy is included in Note (1) of Notes to Consolidated Financial Statements.
Transportation segment customers are invoiced, and the related revenue is recognized as the service is provided. Oil and natural gas revenue from the Company’s interests in producing wells is recognized as title and physical possession of the oil and natural gas passes to the purchaser.
Recent Accounting Pronouncements
In December 2008, the Securities and Exchange Commission released Final Rule, Modernization of Oil and Gas Reporting to revise the existing Regulation S-K and Regulation S-X reporting requirements to align with current industry practices and technological advances. The new disclosure requirements include provisions that permit the use of new technologies to determine proved reserves if those technologies have been demonstrated empirically to lead to reliable conclusions about reserve volumes. In addition, the new disclosure requirements require a company to (a) disclose its internal control over reserves estimation and report the independence and qualification of its reserves preparer or auditor, (b) file reports when a third party is relied upon to prepare reserves estimates or conducts a reserve audit, (c) report oil and gas reserves using an average price based upon the prior 12-month period rather than period-end prices and (d) disclose the development of any proved undeveloped reserves (PUD’s) including the total quantity of PUD’s at year-end, material changes to PUD’s during the year, investments and progress toward the development of PUD’s and an explanation of the reasons why material concentrations of PUD’s have remained undeveloped for five years or more after disclosure as PUD’s. The accounting changes resulting from changes in definitions and pricing assumptions should be treated as a change in accounting principle that is inseparable from a change in accounting estimate, which is to be applied prospectively. The disclosures required by this ruling became effective beginning December 31, 2009.
24
In January 2010, the FASB issued FASB Accounting Standards Update (ASU) No. 2010-03, “Oil and Gas Reserve Estimations and Disclosures” (ASU No. 2010-03). This update aligns the current oil and gas reserve estimation and disclosure requirements of the Extractive Industries – Oil and Gas topic of the ASC (ASC Topic 932) with the changes required by the SEC final rule, “Modernization of Oil and Gas Reporting,” as discussed above. ASU No. 2010-03 expands the disclosures required for equity method investments, revises the definition of oil and gas producing activities to include nontraditional resources in reserves unless not intended to be upgraded into synthetic oil or gas, amends the definition of proved oil and gas reserves to require 12-month average pricing in estimating reserves, amends and adds definitions in the Master Glossary that is used in estimating proved oil and gas quantities and provides guidance on geographic area with respect to disclosure of information about significant reserves. ASU No. 2010-03 must be applied prospectively as a change in accounting principle that is inseparable from a change in accounting estimate. The Company adopted ASU No. 2010-03 effective December 31, 2009.
In January 2010, the FASB issued Accounting Standards Update (ASU) 2010-06, "Improving Disclosures About Fair Value Measurements" (ASU 2010-06), which amends the Fair Value Measurements and Disclosures Topic of the ASC (ASC Topic 820). Among other provisions, ASC Topic 820 establishes a fair value hierarchy that prioritizes the relative reliability of inputs used in fair value measurements. The hierarchy gives highest priority to Level 1 inputs that represent unadjusted quoted market prices in active markets for identical assets and liabilities that the reporting entity has the ability to access at the measurement date. Level 2 inputs are directly or indirectly observable inputs other than quoted prices included within Level 1. Level 3 inputs are unobservable inputs and have the lowest priority in the hierarchy. This amendment requires new disclosures on the value of, and the reason for, transfers in and out of Levels 1 and 2 of the fair value hierarchy and additional disclosures about purchases, sales, issuances and settlements within Level 3 fair value measurements. ASU 2010-06 also clarifies existing disclosure requirements on levels of disaggregation and about inputs and valuation techniques. ASU 2010-06 is effective for interim and annual reporting periods beginning after December 15, 2009, except for the requirement to provide additional disclosures regarding Level 3 measurements which is effective for interim and annual reporting periods beginning after December 15, 2010.
Management believes the impact of other recently issued standards and updates, which are not yet effective, will not have a material impact on the Company’s consolidated financial position, results of operations or cash flows upon adoption.
The Company’s exposure to market risk includes potential adverse changes in interest rates and commodity prices.
Interest Rate Risk
The Company had no long-term debt outstanding at December 31, 2010 and 2009. A hypothetical ten percent adverse change in the floating rate would not have a material effect on the Company’s results of operations for the fiscal year ended December 31, 2010.
Commodity Price Risk
The Company’s major market risk exposure is in the pricing applicable to its marketing and production of crude oil and natural gas. Realized pricing is primarily driven by the prevailing spot prices applicable to oil and gas. Commodity price risk in the Company’s marketing operations represents the potential loss that may result from a change in the market value of an asset or a commitment. From time to time, the Company enters into forward contracts to minimize or hedge the impact of market fluctuations on its purchases of crude oil and natural gas. The Company may also enter into price support contracts with certain customers to secure a floor price on the purchase of certain supply. In each instance, the Company locks in a separate matching price support contract with a third party in order to minimize the risk of these financial instruments. Substantially all forward contracts fall within a six-month to eighteen-month term with no contracts extending longer than two years in duration.
25
Certain forward contracts are recorded at fair value, depending on management’s assessments of numerous accounting standards and positions that comply with generally accepted accounting principles in the United States. The fair value of such contracts is reflected in the balance sheet as fair value assets and liabilities and any revaluation is recognized on a net basis in the Company’s results of operations. See discussion under “Fair Value Measurements” in Note 1 to the Consolidated Financial Statements.
Historically, prices received for oil and natural gas sales have been volatile and unpredictable with price volatility expected to continue. From January 1, 2009 through December 31, 2010 natural gas price realizations ranged from a monthly low of $2.96 per mmbtu to a monthly high of $5.80 per mmbtu. Crude oil prices ranged from a monthly average low of $35.99 per barrel to a high of $88.34 per barrel during the same period. A hypothetical ten percent adverse change in average natural gas and crude oil prices, assuming no changes in volume levels, would have reduced earnings by approximately $2,393,000 and $2,270,000 for the comparative years ended December 31, 2010 and 2009, respectively.
26
ADAMS RESOURCES & ENERGY, INC. AND SUBSIDIARIES
INDEX TO FINANCIAL STATEMENTS
|
Page
|
|
|
REPORT OF INDEPENDENT REGISTERED PUBLIC ACCOUNTING FIRM
|
28
|
|
FINANCIAL STATEMENTS:
|
|
|
Consolidated Balance Sheets as of December 31, 2010 and 2009
|
29
|
|
Consolidated Statements of Operations for the Years Ended
|
|
|
December 31, 2010, 2009 and 2008
|
30
|
|
Consolidated Statements of Shareholders’ Equity for the Years Ended
|
|
|
December 31, 2010, 2009 and 2008
|
31
|
|
Consolidated Statements of Cash Flows for the Years Ended
|
|
|
December 31, 2010, 2009 and 2008
|
32
|
|
Notes to Consolidated Financial Statements
|
33
|
27
REPORT OF INDEPENDENT REGISTERED PUBLIC ACCOUNTING FIRM
To the Board of Directors and Stockholders of
Adams Resources & Energy, Inc.
Houston, Texas
We have audited the accompanying consolidated balance sheets of Adams Resources & Energy, Inc. and subsidiaries (the “Company”) as of December 31, 2010 and 2009, and the related consolidated statements of operations, shareholders’ equity and cash flows for each of the three years in the period ended December 31, 2010. These financial statements are the responsibility of the Company’s management. Our responsibility is to express an opinion on these financial statements based on our audits.
We conducted our audits in accordance with the standards of the Public Company Accounting Oversight Board (United States). Those standards require that we plan and perform the audit to obtain reasonable assurance about whether the financial statements are free of material misstatement. The Company is not required to have, nor were we engaged to perform, an audit of its internal control over financial reporting. Our audits included consideration of internal control over financial reporting as a basis for designing audit procedures that are appropriate in the circumstances, but not for the purpose of expressing an opinion on the effectiveness of the Company’s internal control over financial reporting. Accordingly, we express no such opinion. An audit also includes examining, on a test basis, evidence supporting the amounts and disclosures in the financial statements, assessing the accounting principles used and significant estimates made by management, as well as evaluating the overall financial statement presentation. We believe that our audits provide a reasonable basis for our opinion.
In our opinion, such consolidated financial statements present fairly, in all material respects, the financial position of Adams Resources & Energy, Inc. and subsidiaries as of December 31, 2010 and 2009, and the results of their operations and their cash flows for the each of the three years in the period ended December 31, 2010, in conformity with accounting principles generally accepted in the United States of America.
As discussed in Note 1 to the Consolidated Financial Statements, the Company changed its method of accounting for oil and natural gas reserves and disclosures on December 31, 2009.
/s/DELOITTE & TOUCHE LLP
Houston, Texas
March 21, 2011
28
ADAMS RESOURCES & ENERGY, INC. AND SUBSIDIARIES
CONSOLIDATED BALANCE SHEETS
(In thousands)
|
December 31,
|
||||||||
|
ASSETS
|
2010
|
2009
|
||||||
|
CURRENT ASSETS:
|
||||||||
|
Cash and cash equivalents
|
$ | 29,032 | $ | 16,806 | ||||
|
Accounts receivable, net of allowance for doubtful accounts of
|
||||||||
|
$1,064 and $1,681, respectively
|
190,169 | 155,941 | ||||||
|
Inventories
|
14,591 | 15,260 | ||||||
|
Fair value contracts
|
2,764 | 1,581 | ||||||
|
Income tax receivable
|
2,316 | 2,171 | ||||||
|
Prepayments
|
8,104 | 10,804 | ||||||
|
Total current assets
|
246,976 | 202,563 | ||||||
|
PROPERTY AND EQUIPMENT:
|
||||||||
|
Marketing
|
25,407 | 19,787 | ||||||
|
Transportation
|
43,131 | 38,859 | ||||||
|
Oil and gas (successful efforts method)
|
73,011 | 73,843 | ||||||
|
Other
|
188 | 171 | ||||||
| 141,737 | 132,660 | |||||||
|
Less – Accumulated depreciation, depletion and amortization
|
(94,148 | ) | (90,355 | ) | ||||
| 47,589 | 42,305 | |||||||
|
OTHER ASSETS:
|
||||||||
|
Oil and gas property held for sale
|
3,389 | - | ||||||
|
Deferred income tax asset
|
374 | 1,290 | ||||||
|
Cash deposits and other
|
2,977 | 3,243 | ||||||
| $ | 301,305 | $ | 249,401 | |||||
|
LIABILITIES AND SHAREHOLDERS’ EQUITY
|
||||||||
|
CURRENT LIABILITIES:
|
||||||||
|
Accounts payable
|
$ | 200,763 | $ | 158,176 | ||||
|
Accounts payable – related party
|
9 | 75 | ||||||
|
Fair value contracts
|
1,478 | 1,331 | ||||||
|
Accrued and other liabilities
|
3,894 | 3,872 | ||||||
|
Current deferred income taxes
|
854 | 737 | ||||||
|
Total current liabilities
|
206,998 | 164,191 | ||||||
|
LONG-TERM DEBT
|
- | - | ||||||
|
OTHER LIABILITIES:
|
||||||||
|
Asset retirement obligations
|
1,390 | 1,315 | ||||||
|
Deferred taxes and other liabilities
|
2,762 | 94 | ||||||
| 211,150 | 165,000 | |||||||
|
COMMITMENTS AND CONTINGENCIES (NOTE 6)
|
||||||||
|
SHAREHOLDERS’ EQUITY:
|
||||||||
|
Preferred stock, $1.00 par value, 960,000 shares authorized,
|
||||||||
|
none outstanding
|
- | - | ||||||
|
Common stock, $.10 par value, 7,500,000 shares authorized,
|
||||||||
|
4,217,596 issued and outstanding
|
422 | 422 | ||||||
|
Contributed capital
|
11,693 | 11,693 | ||||||
|
Retained earnings
|
78,040 | 71,686 | ||||||
|
Total shareholders’ equity
|
90,155 | 83,801 | ||||||
| $ | 301,305 | $ | 249,401 | |||||
The accompanying notes are an integral part of these consolidated financial statements.
29
ADAMS RESOURCES & ENERGY, INC. AND SUBSIDIARIES
CONSOLIDATED STATEMENTS OF OPERATIONS
(In thousands, except per share data)
|
Years Ended December 31,
|
||||||||||||
|
2010
|
2009
|
2008
|
||||||||||
|
REVENUES:
|
||||||||||||
|
Marketing
|
$ | 2,144,082 | $ | 1,889,583 | $ | 4,074,677 | ||||||
|
Transportation
|
56,867 | 44,895 | 67,747 | |||||||||
|
Oil and natural gas
|
11,021 | 8,650 | 17,248 | |||||||||
| 2,211,970 | 1,943,128 | 4,159,672 | ||||||||||
|
COSTS AND EXPENSES:
|
||||||||||||
|
Marketing
|
2,124,491 | 1,869,400 | 4,074,614 | |||||||||
|
Transportation
|
45,956 | 38,797 | 59,659 | |||||||||
|
Oil and gas operations
|
8,116 | 8,621 | 13,833 | |||||||||
|
General and administrative
|
9,044 | 9,589 | 9,667 | |||||||||
|
Depreciation, depletion and amortization
|
11,817 | 10,320 | 13,373 | |||||||||
| 2,199,424 | 1,936,727 | 4,171,146 | ||||||||||
|
Operating Earnings (Loss)
|
12,546 | 6,401 | (11,474 | ) | ||||||||
|
Other Income (Expense):
|
||||||||||||
|
Interest income
|
191 | 125 | 1,103 | |||||||||
|
Interest expense
|
(36 | ) | (25 | ) | (187 | ) | ||||||
|
Earnings (loss) before income taxes
|
12,701 | 6,501 | (10,558 | ) | ||||||||
|
Income Tax (Provision) Benefit:
|
||||||||||||
|
Current
|
(371 | ) | (1,280 | ) | (1,689 | ) | ||||||
|
Deferred
|
(3,699 | ) | (1,072 | ) | 6,675 | |||||||
| (4,070 | ) | (2,352 | ) | 4,986 | ||||||||
|
Net Earnings (Loss)
|
$ | 8,631 | $ | 4,149 | $ | (5,572 | ) | |||||
|
EARNINGS (LOSS) PER SHARE:
|
||||||||||||
|
Basic and diluted net earnings (loss) per share
|
$ | 2.05 | $ | .98 | $ | (1.32 | ) | |||||
The accompanying notes are an integral part of these consolidated financial statements.
30
ADAMS RESOURCES & ENERGY, INC. AND SUBSIDIARIES
CONSOLIDATED STATEMENTS OF SHAREHOLDERS' EQUITY
(In thousands)
|
Total
|
||||||||||||||||
|
Common
|
Contributed
|
Retained
|
Shareholders’
|
|||||||||||||
|
Stock
|
Capital
|
Earnings
|
Equity
|
|||||||||||||
|
BALANCE, January 1, 2008
|
$ | 422 | $ | 11,693 | $ | 77,327 | $ | 89,442 | ||||||||
|
Net earnings
|
- | - | (5,572 | ) | (5,572 | ) | ||||||||||
|
Dividends paid on common stock
|
- | - | (2,109 | ) | (2,109 | ) | ||||||||||
|
BALANCE, December 31, 2008
|
$ | 422 | $ | 11,693 | $ | 69,646 | $ | 81,761 | ||||||||
|
Net earnings (loss)
|
- | - | 4,149 | 4,149 | ||||||||||||
|
Dividends paid on common stock
|
- | - | (2,109 | ) | (2,109 | ) | ||||||||||
|
BALANCE, December 31, 2009
|
$ | 422 | $ | 11,693 | $ | 71,686 | $ | 83,801 | ||||||||
|
Net earnings
|
- | - | 8,631 | 8,631 | ||||||||||||
|
Dividends paid on common stock
|
- | - | (2,277 | ) | (2,277 | ) | ||||||||||
|
BALANCE, December 31, 2010
|
$ | 422 | $ | 11,693 | $ | 78,040 | $ | 90,155 | ||||||||
The accompanying notes are an integral part of these consolidated financial statements.
31
ADAMS RESOURCES & ENERGY, INC. AND SUBSIDIARIES
CONSOLIDATED STATEMENTS OF CASH FLOWS
(In thousands)
|
Years Ended December 31,
|
||||||||||||
|
2010
|
2009
|
2008
|
||||||||||
|
CASH PROVIDED BY OPERATIONS:
|
||||||||||||
|
Net earnings (loss)
|
$ | 8,631 | $ | 4,149 | $ | (5,572 | ) | |||||
|
Adjustments to reconcile net earnings (loss) to net cash
|
||||||||||||
|
from operating activities-
|
||||||||||||
|
Depreciation, depletion and amortization
|
11,817 | 10,320 | 13,373 | |||||||||
|
Property sale (gains) losses
|
94 | (177 | ) | 354 | ||||||||
|
Dry hole costs incurred
|
1,894 | 661 | 2,421 | |||||||||
|
Impairment of oil and natural gas properties
|
2,224 | 3,773 | 5,911 | |||||||||
|
Provision for doubtful accounts
|
29 | 430 | 1,059 | |||||||||
|
Deferred income taxes
|
3,699 | 1,072 | (6,675 | ) | ||||||||
|
Net change in fair value contracts
|
(1,036 | ) | 251 | 1,238 | ||||||||
|
Decrease (increase) in accounts receivable
|
(34,257 | ) | (36,515 | ) | 141,250 | |||||||
|
Decrease (increase) in inventories
|
669 | (1,053 | ) | 569 | ||||||||
|
Decrease (increase) in income tax receivable
|
(145 | ) | 1,458 | (1,075 | ) | |||||||
|
Decrease (increase) in prepayments
|
2,700 | (5,580 | ) | (1,456 | ) | |||||||
|
Increase (decrease) in accounts payable
|
40,521 | 43,069 | (137,548 | ) | ||||||||
|
Increase (decrease) in accrued and other liabilities
|
(406 | ) | (58 | ) | 223 | |||||||
|
Other changes, net
|
494 | 485 | (433 | ) | ||||||||
|
Net cash provided by operating activities
|
36,928 | 22,285 | 13,639 | |||||||||
|
INVESTING ACTIVITIES:
|
||||||||||||
|
Property and equipment additions
|
(22,421 | ) | (22,390 | ) | (17,688 | ) | ||||||
|
Insurance and state collateral (deposits) refunds
|
(151 | ) | (192 | ) | 502 | |||||||
|
Proceeds from property sales
|
147 | 1,004 | 167 | |||||||||
|
Redemption of short-term investments
|
- | - | 10,000 | |||||||||
|
Investment in short-term investments
|
- | - | (10,000 | ) | ||||||||
|
Net cash (used in) investing activities
|
(22,425 | ) | (21,578 | ) | (17,019 | ) | ||||||
|
FINANCING ACTIVITIES:
|
||||||||||||
|
Dividend payments
|
(2,277 | ) | (2,109 | ) | (2,109 | ) | ||||||
|
Net cash (used in) financing activities
|
(2,277 | ) | (2,109 | ) | (2,109 | ) | ||||||
|
Increase (decrease) in cash and cash equivalents
|
12,226 | (1,402 | ) | (5,489 | ) | |||||||
|
Cash and cash equivalents at beginning of year
|
16,806 | 18,208 | 23,697 | |||||||||
|
Cash and cash equivalents at end of year
|
$ | 29,032 | $ | 16,806 | $ | 18,208 | ||||||
The accompanying notes are an integral part of these consolidated financial statements.
32
ADAMS RESOURCES & ENERGY, INC.
NOTES TO CONSOLIDATED FINANCIAL STATEMENTS
(1) Summary of Significant Accounting Policies
Principles of Consolidation
The accompanying consolidated financial statements include the accounts of Adams Resources & Energy, Inc., a Delaware corporation, and its wholly owned subsidiaries (the "Company") after elimination of all intercompany accounts and transactions. The impact on the accompanying financial statements of events occurring after December 31, 2010 has been evaluated through the date of issuance of these financial statements.
Nature of Operations
The Company is engaged in the business of crude oil, natural gas and petroleum products marketing, as well as tank truck transportation of liquid chemicals and oil and gas exploration and production. Its primary area of operation is within a 1,000 mile radius of Houston, Texas.
Cash, Cash Equivalents and Short-term Investments
Cash and cash equivalents include any Treasury bill, commercial paper, money market fund or federal funds with maturity of 90 days or less. Depending on cash availability and market conditions, investments in corporate and municipal bonds may also be made from time to time. The Company invests in tax-free municipal securities in order to enhance the after-tax rate of return from short-term investments of cash. The Company had no corporate bonds or municipal investments as of December 31, 2010 and 2009. Cash and cash equivalents are maintained with major financial institutions and such deposits may exceed the amount of Federally backed insurance provided. While the Company regularly monitors the financial stability of such institutions, cash and cash equivalents ultimately remain at risk subject to the financial viability of such institutions.
Allowance for Doubtful Accounts
Accounts receivable result from sales of crude oil, natural gas and refined products as well as from trucking services. Marketing business wholesale level sales of crude oil and natural gas comprise in excess of
90 percent of accounts receivable and under industry practices, such items are “settled” and paid in cash within
25 days of the month following the transaction date. For such receivables, an allowance for doubtful accounts is determined based on specific account identification. The balance of accounts receivable results primarily from sales of refined petroleum products and trucking services. For this component of receivables, the allowance for doubtful accounts is determined based on a review of specific accounts combined with a review of the general status of the aging of all accounts.
Inventories
Crude oil and petroleum product inventories are carried at the lower of average cost or market. Petroleum products inventory includes gasoline, lubricating oils and other petroleum products purchased for resale. Components of inventory are as follows (
in thousands
):
|
December 31,
|
||||||||
|
2010
|
2009
|
|||||||
|
Crude oil
|
$ | 12,909 | $ | 14,053 | ||||
|
Petroleum products
|
1,682 | 1,207 | ||||||
| $ | 14,591 | $ | 15,260 | |||||
33
Prepayments
The components of prepayments and other are as follows
(in thousands):
|
December 31,
|
||||||||
|
2010
|
2009
|
|||||||
|
Cash collateral deposits for commodity purchases
|
$ | 5,150 | $ | 7,670 | ||||
|
Insurance premiums
|
1,954 | 2,478 | ||||||
|
Natural gas imbalances
|
330 | 89 | ||||||
|
Rents, license and other
|
670 | 567 | ||||||
| $ | 8,104 | $ | 10,804 | |||||
Property and Equipment
Expenditures for major renewals and betterments are capitalized, and expenditures for maintenance and repairs are expensed as incurred. Interest costs incurred in connection with major capital expenditures are capitalized and amortized over the lives of the related assets. When properties are retired or sold, the related cost and accumulated depreciation, depletion and amortization ("DD&A") is removed from the accounts and any gain or loss is reflected in earnings.
Oil and gas exploration and development expenditures are accounted for in accordance with the successful efforts method of accounting. Direct costs of acquiring developed or undeveloped leasehold acreage, including lease bonus, brokerage and other fees, are capitalized. Exploratory drilling costs are initially capitalized until the properties are evaluated and determined to be either productive or nonproductive. Such evaluations are made on a quarterly basis. If an exploratory well is determined to be nonproductive, the costs of drilling the well are charged to expense. Costs incurred to drill and complete development wells, including dry holes, are capitalized. As of December 31, 2010, the Company had no unevaluated or suspended exploratory drilling costs.
Depreciation, depletion and amortization of the cost of proved oil and gas properties is calculated using the unit-of-production method. The reserve base used to calculate depreciation, depletion and amortization for leasehold acquisition costs and the cost to acquire proved properties is the sum of proved developed reserves and proved undeveloped reserves. For lease and well equipment, development costs and successful exploration drilling costs, the reserve base includes only proved developed reserves. All other property and equipment is depreciated using the straight-line method over the estimated average useful lives of three to twenty years.
The Company periodically reviews its long-lived assets for impairment whenever there is evidence that the carrying value of such assets may not be recoverable. Any impairment recognized is permanent and may not be restored. Producing oil and gas properties are reviewed quarterly for impairment triggers on a field-by-field basis. For properties requiring impairment, the fair value is estimated based on an internal discounted cash-flow model. Cash flows are developed based on estimated future production and prices and then discounted using an internal rate of return consistent with that used by the Company in evaluating cash flows for other assets of a similar nature. For the years ended December 31, 2010, 2009 and 2008 there were $946,000, $1,350,000 and $3,078,000 impairment provisions on producing oil and gas properties, respectively.
Fair value measurements for producing oil and gas properties that were subject to fair value impairment for the years ended December 31, 2010 and 2009 summarized as follows
(in thousands):
|
Producing Properties
Subject to Fair
Value Impairment
|
||||||||
|
2010
|
2009
|
|||||||
|
Net book value at January 1, 2010
|
$ | 2,220 | $ | 1,744 | ||||
|
Property additions
|
1,802 | 960 | ||||||
|
Depletion taken
|
(753 | ) | (751 | ) | ||||
|
Impairment valuation loss
|
(946 | ) | (1,350 | ) | ||||
|
Net book at December 31, 2010
|
$ | 2,323 | $ | 603 | ||||
Fair value measurements for producing oil and gas properties are based on Level 3 – Significant Unobservable Inputs – (see Fair Value Measurements below).
On a quarterly basis, management also evaluates the carrying value of non-producing oil and gas properties and may deem them impaired for lack of drilling activity. Accordingly, impairment provisions on non-producing properties totaling $1,277,000, $2,423,000 and $2,834,000 were recorded for the years ended December 31, 2010, 2009 and 2008, respectively. For non-producing properties, impairments are determined based on management’s knowledge of current geological evaluations, drilling results and activity in the area and intent to drill as it relates to the remaining term of the underlying oil and gas leasehold interest.
Cash Deposits and Other Assets
The Company has established certain deposits to support participation in its liability insurance program and remittance of state crude oil severance taxes and other state collateral deposits. Insurance collateral deposits are invested at the discretion of the Company’s insurance carrier and such investments primarily consist of intermediate term federal government bonds and bonds backed by federal agencies. Components of cash deposits and other assets are as follows
(in thousands):
|
December 31,
|
||||||||
|
2010
|
2009
|
|||||||
|
Insurance collateral deposits
|
$ | 2,291 | $ | 2,648 | ||||
|
State collateral deposits
|
166 | 271 | ||||||
|
Materials and supplies
|
520 | 324 | ||||||
| $ | 2,977 | $ | 3,243 | |||||
Revenue Recognition
Commodity purchase and sale contracts utilized by the Company’s marketing businesses qualify as derivative instruments. Further, all natural gas, as well as certain specifically identified crude oil purchase and sale contracts, are designated as trading activities. From the time of contract origination, such trading activity contracts are marked-to-market and recorded on a net revenue basis in the accompanying financial statements.
Substantially all crude oil and refined products purchase and sale contracts qualify and are designated as non-trading activities and the Company elects the normal purchases and sales exception methodology for such activity. For normal purchase and sale activities, the Company’s customers are invoiced monthly based upon contractually agreed upon terms with revenue recognized in the month in which the physical product is delivered to the customer. Such sales are recorded gross in the financial statements because the Company takes title to and has risk of loss for the products, is the primary obligor for the purchase, establishes the sale price independently with a third party and maintains credit risk associated with the sale of the product.
Certain crude oil contracts may be with a single counterparty to provide for similar quantities of crude oil to be bought and sold at different locations. These contracts are entered into for a variety of reasons, including effecting the transportation of the commodity, to minimize credit exposure, and/or to meet the competitive demands of the customer. Such buy/sell arrangements are reflected on a net revenue basis in the accompanying financial statements. The Company’s gross revenues for crude oil contracts with a single counterparty were $1,415,844,000, $874,386,000 and $1,112,903,000 for the years ended December 31, 2010, 2009 and 2008, respectively.
Transportation customers are invoiced, and the related revenue is recognized, as the service is provided. Oil and gas revenue from the Company’s interests in producing wells is recognized as title and physical possession of the oil and gas passes to the purchaser.
34
Letter of Credit Facility
The Company maintains a Credit and Security Agreement with Wells Fargo Bank to provide a $40 million stand-by letter of credit facility. The Wells Fargo facility provides for the issuance of up to $40 million of stand-by letters of credit to support the Company’s crude oil and natural gas purchases within the marketing segment. This facility is collateralized by the eligible accounts receivable within those operations. Stand-by letters of credit issued totaled $23.9 million and 24.5 million as of December 31, 2010 and 2009, respectively. The issued stand-by letters of credit are cancelled as the underlying purchase obligations are satisfied by cash payment when due. The letter of credit facility places certain restrictions on the Company’s Gulfmark Energy, Inc. and Adams Resources Marketing, Ltd. subsidiaries. Such restrictions included the maintenance of a combined 1.1 to 1.0 current ratio and the maintenance of positive net earnings excluding inventory valuation changes, as defined, among other restrictions. Management believes the Company is currently in compliance with all such financial covenants.
Statement of Cash Flows
Interest paid totaled $36,000, $25,000 and $187,000 during the years ended December 31, 2010, 2009 and 2008, respectively. Income taxes paid during these same periods totaled $532,000, $1,152,000, and $3,768,000, respectively. The Company also received a $2,000,000 income tax refund during 2009. Non-cash investing activities for property and equipment in accounts payable were $2,868,000, $440,000 and $561,000 as of December 31, 2010, 2009 and 2008, respectively. There were no significant non-cash financing activities in any of the periods reported.
Earnings Per Share
Earnings per share are based on the weighted average number of shares of common stock and potentially dilutive common stock shares outstanding during the period. The weighted average number of shares outstanding was 4,217,596 for 2010, 2009 and 2008. There were no potentially dilutive securities during those periods.
Share-Based Payments
During the periods presented herein, the Company had no stock-based employee compensation plans, nor any other share-based payment arrangements.
Use of Estimates
The preparation of financial statements in conformity with accounting principles generally accepted in the United States requires management to make estimates and assumptions that affect the reported amounts of assets and liabilities at the date of the financial statements and the reported amounts of revenues and expenses during the reporting period. Actual results could differ from those estimates. Examples of significant estimates used in the accompanying consolidated financial statements include the oil and gas reserve volumes that form the foundation for (1) calculating depreciation, depletion and amortization and (2) deriving cash flow estimates to assess impairment triggers or estimated values associated with oil and gas property, revenue accruals, the provision for bad debts, insurance related accruals, income tax timing differences, contingencies and valuation of fair value contracts.
Income Taxes
Income taxes are accounted for under the provisions of the Income Taxes Topic of the ASC (ASC Topic 740). ASC Topic 740 requires the asset and liability approach for accounting for income taxes. Under this approach, deferred tax assets and liabilities are recognized based on anticipated future tax consequences attributable to differences between financial statement carrying amounts of assets and liabilities and their respective tax basis (see Note 2).
35
Use of Derivative Instruments
The Company’s marketing segment is involved in the purchase and sale of crude oil and natural gas. The Company seeks to make a profit by procuring such commodities as they are produced and then delivering such products to the end users or intermediate use marketplace. As is typical for the industry, such transactions are made pursuant to the terms of forward month commodity purchase and/or sale contracts. These contracts meet the definition of a derivative instrument and therefore, the Company accounts for such contracts at fair value, unless the normal purchase and sale exception is applicable. The Company’s objective of entering into commodity contracts is not to manage commodity price risk nor is the objective to trade or speculate on commodity prices. Rather, such underlying contracts are standard for the industry and are the governing document for the Company’s crude oil and natural gas wholesale distribution businesses. The accounting methodology utilized by the Company for its commodity contracts is further discussed below under the caption “Fair Value Measurements”.
None of the Company’s derivative instruments have been designated as hedging instruments and the estimated fair value of forward month commodity contracts (derivatives) is reflected in the accompanying Consolidated Balance Sheet as of December 31, 2010 as follows
(in thousands):
|
Balance Sheet Location and Amount
|
||||||||||||||||
|
Current
|
Other
|
Current
|
Other
|
|||||||||||||
|
Assets
|
Assets
|
Liabilities
|
Liabilities
|
|||||||||||||
|
Asset Derivatives
|
||||||||||||||||
|
- Fair Value Commodity
|
||||||||||||||||
|
Contracts at Gross Valuation
|
$ | 8,094 | $ | - | $ | - | $ | - | ||||||||
|
Liability Derivatives
|
||||||||||||||||
|
- Fair Value Commodity
|
||||||||||||||||
|
Contracts at Gross Valuation
|
- | - | 6,808 | - | ||||||||||||
|
Less Counterparty Offsets
|
(5,330 | ) | - | (5,330 | ) | - | ||||||||||
|
As Reported Fair Value Contracts
|
$ | 2,764 | $ | - | $ | 1,478 | $ | - | ||||||||
Forward month commodity contracts (derivatives) are reflected in the accompanying Consolidated Balance Sheet as of December 31, 2009 as follows
(in thousands):
|
Balance Sheet Location and Amount
|
||||||||||||||||
|
Current
|
Other
|
Current
|
Other
|
|||||||||||||
|
Assets
|
Assets
|
Liabilities
|
Liabilities
|
|||||||||||||
|
Asset Derivatives
|
||||||||||||||||
|
- Fair Value Commodity
|
||||||||||||||||
|
Contracts at Gross Valuation
|
$ | 2,035 | $ | - | $ | - | $ | - | ||||||||
|
Liability Derivatives
|
||||||||||||||||
|
- Fair Value Commodity
|
||||||||||||||||
|
Contracts at Gross Valuation
|
- | - | 1,785 | - | ||||||||||||
|
Less Counterparty Offsets
|
(454 | ) | - | (454 | ) | - | ||||||||||
|
As Reported Fair Value Contracts
|
$ | 1,581 | $ | - | $ | 1,331 | $ | - | ||||||||
The Company only enters into commodity contracts with counterparties it believes to be creditworthy or obtains collateral support for such activities. No credit loss provision applies to the Company’s forward commodity contract valuations. As of December 31, 2010 and 2009, the Company was not holding nor had it posted any collateral to support its forward month fair value derivative activity. The Company is not subject to any credit-risk related trigger events.
36
Forward month commodity contracts (derivatives) are reflected in the accompanying Consolidated Statement of Operations for the years ended December 31, 2010 and 2009 as follows
(in thousands):
|
Gain (Loss)
|
||||||||||||
|
Location
|
2010
|
2009
|
2008
|
|||||||||
|
Revenues - marketing
|
$ | 1,036 | $ | (251 | ) | $ | (1,238 | ) | ||||
Fair Value Measurements
The carrying amount reported in the balance sheet for cash and cash equivalents, accounts receivable and accounts payable approximates fair value because of the immediate or short-term maturity of these financial instruments.
Fair value contracts consist of derivative financial instruments and are recorded as either an asset or liability measured at its fair value. Changes in fair value are recognized immediately in earnings unless the derivatives qualify for, and the Company elects, cash flow hedge accounting. The Company had no contracts designated for hedge accounting during any current reporting periods.
Fair value estimates are based on assumptions that market participants would use when pricing an asset or liability and the Company uses a fair value hierarchy of three levels that prioritizes the information used to develop those assumptions. Currently, for all items presented herein, the Company utilizes a market approach to valuing its contracts. On a contract by contract, forward month by forward month basis, the Company obtains observable market data for valuing its contracts. The fair value hierarchy gives the highest priority to quoted prices in active markets and the lowest priority to unobservable data. The fair value hierarchy is summarized as follows:
|
|
Level 1 – quoted prices in active markets for identical assets or liabilities that may be accessed at the measurement date. Active markets are those in which transactions for the asset or liability occur in sufficient frequency and volume to provide pricing information on an ongoing basis. The Company utilizes the New York Mercantile Exchange “NYMEX” for its
|
|
|
Level 1 valuations.
|
|
|
Level 2 – (a) quoted prices for similar assets or liabilities in active markets, (b) quoted prices for identical assets or liabilities but in markets that are not actively traded or in which little information is released to the public, (c) observable inputs other than quoted prices and (d) inputs derived from observable market data. Source data for Level 2 inputs include information provided by the NYMEX, the Intercontinental Exchange “ICE”, published price data and indices, third party price survey data and broker provided forward price statistics.
|
|
|
Level 3 – Unobservable market data inputs for assets or liabilities.
|
As of December 31, 2010, the Company’s fair value assets and liabilities are summarized and categorized as follows
(in thousands):
|
Market Data Inputs
|
||||||||||||||||
|
Level 1
|
Level 2
|
Level 3
|
||||||||||||||
|
Quoted Prices
|
Observable
|
Unobservable
|
Total
|
|||||||||||||
|
Derivatives
|
||||||||||||||||
|
- Current assets
|
$ | - | $ | 2,764 | $ | - | $ | 2,764 | ||||||||
|
- Current liabilities
|
(118 | ) | (1,360 | ) | - | (1,478 | ) | |||||||||
|
Net Value
|
$ | (118 | ) | $ | 1,404 | $ | - | $ | 1,286 | |||||||
37
As of December 31, 2009, the Company’s fair value assets and liabilities are summarized and categorized as follows
(in thousands):
|
Market Data Inputs
|
||||||||||||||||
|
Level 1
|
Level 2
|
Level 3
|
||||||||||||||
|
Quoted Prices
|
Observable
|
Unobservable
|
Total
|
|||||||||||||
|
Derivatives
|
||||||||||||||||
|
- Current assets
|
$ | 224 | $ | 1,357 | $ | - | $ | 1,581 | ||||||||
|
- Current liabilities
|
- | (1,331 | ) | - | (1,331 | ) | ||||||||||
|
Net Value
|
$ | 224 | $ | 26 | $ | - | $ | 250 | ||||||||
The Company’s gross transaction volumes for physically settled energy trading contracts were approximately 93,827,000 mmbtu’s, 132,488,000 mmbtu’s, and 159,505,000 mmbtu’s in 2010, 2009 and 2008, respectively.
When determining fair value measurements, the Company makes credit valuation adjustments to reflect both its own nonperformance risk and its counterparty’s nonperformance risk. When adjusting the fair value of derivative contracts for the effect of nonperformance risk, the impact of netting and any applicable credit enhancements, such as collateral postings, thresholds, and guarantees are considered. Credit valuation adjustments utilize Level 3 inputs, such as credit scores to evaluate the likelihood of default by the Company or its counterparties. As of December 31, 2010 and 2009, credit valuation adjustments were not significant to the overall valuation of the Company’s fair value contracts. As a result, applicable fair value assets and liabilities in their entirety are classified in Level 2 of the fair value hierarchy.
The following table illustrates the factors impacting the change in the net value of the Company’s fair value contracts for the year ended December 31, 2010
(in thousands):
|
Level 1
|
Level 2
|
|||||||||||
|
Quoted Prices
|
Observable
|
Total
|
||||||||||
|
Net Fair Value January 1,
|
$ | 224 | $ | 26 | $ | 250 | ||||||
|
- Net realized (gains) losses
|
(224 | ) | (26 | ) | (250 | ) | ||||||
|
- Net unrealized gains (losses)
|
||||||||||||
|
at inception of contract
|
(118 | ) | 1,404 | 1,286 | ||||||||
|
Net Fair Value December 31,
|
$ | (118 | ) | $ | 1,404 | $ | 1,286 | |||||
The following table illustrates the factors impacting the change in the net value of the Company’s fair value contracts for the year ended December 31, 2009
(in thousands):
|
Level 1
|
Level 2
|
|||||||||||
|
Quoted Prices
|
Observable
|
Total
|
||||||||||
|
Net Fair Value January 1,
|
$ | 1,029 | $ | (528 | ) | $ | 501 | |||||
|
- Net realized (gains) losses
|
(1,029 | ) | 528 | (501 | ) | |||||||
|
- Net unrealized gains (losses)
|
||||||||||||
|
at inception of contract
|
224 | 26 | 250 | |||||||||
|
Net Fair Value December 31,
|
$ | 224 | $ | 26 | $ | 250 | ||||||
38
Asset Retirement Obligations
The Company records a long-term liability for the estimated retirement costs associated with certain tangible long-lived assets. The estimated fair value of asset retirement obligations are recorded in the period in which they are incurred and the corresponding cost capitalized by increasing the carrying amount of the related long-lived asset. The liability is accreted to its then present value each period, and the capitalized cost is depreciated over the useful life of the related asset. If the liability is settled for an amount other than the recorded amount, a gain or loss is recognized. A summary of the Company’s asset retirement obligations is presented as follows
(in thousands):
|
2010
|
2009
|
|||||||
|
Balance on January 1,
|
$ | 1,315 | $ | 1,260 | ||||
|
-Liabilities incurred
|
76 | 44 | ||||||
|
-Accretion of discount
|
75 | 74 | ||||||
|
-Liabilities settled
|
(76 | ) | (60 | ) | ||||
|
-Revisions to estimates
|
- | (3 | ) | |||||
|
Balance on December 31,
|
$ | 1,390 | $ | 1,315 | ||||
In addition to an accrual for asset retirement obligations, the Company maintains $75,000 in escrow cash, which is legally restricted for the potential purpose of settling asset retirement costs in accordance with certain state regulations. Such cash deposits are included in other assets in the accompanying balance sheet.
Recent Accounts Pronouncement
In December 2008, the Securities and Exchange Commission released Final Rule, Modernization of Oil and Gas Reporting to revise the existing Regulation S-K and Regulation S-X reporting requirements to align with current industry practices and technological advances. The new disclosure requirements include provisions that permit the use of new technologies to determine proved reserves if those technologies have been demonstrated empirically to lead to reliable conclusions about reserve volumes. In addition, the new disclosure requirements require a company to (a) disclose its internal control over reserves estimation and report the independence and qualification of its reserves preparer or auditor, (b) file reports when a third party is relied upon to prepare reserves estimates or conducts a reserve audit, (c) report oil and gas reserves using an average price based upon the prior 12-month period rather than period-end prices and (d) disclose the development of any proved undeveloped reserves (PUD’s) including the total quantity of PUD’s at year-end, material changes to PUD’s during the year, investments and progress toward the development of PUD’s and an explanation of the reasons why material concentrations of PUD’s have remained undeveloped for five years or more after disclosure as PUD’s. The accounting changes resulting from changes in definitions and pricing assumptions should be treated as a change in accounting principle that is inseparable from a change in accounting estimate, which is to be applied prospectively. The disclosures required by this ruling became effective beginning December 31, 2009.
In January 2010, the FASB issued FASB Accounting Standards Update (ASU) No. 2010-03, “Oil and Gas Reserve Estimations and Disclosures” (ASU No. 2010-03). This update aligns the current oil and gas reserve estimation and disclosure requirements of the Extractive Industries – Oil and Gas topic of the ASC (ASC Topic 932) with the changes required by the SEC final rule, “Modernization of Oil and Gas Reporting,” as discussed above. ASU No. 2010-03 expands the disclosures required for equity method investments, revises the definition of oil and gas producing activities to include nontraditional resources in reserves unless not intended to be upgraded into synthetic oil or gas, amends the definition of proved oil and gas reserves to require 12-month average pricing in estimating reserves, amends and adds definitions in the Master Glossary that is used in estimating proved oil and gas quantities and provides guidance on geographic area with respect to disclosure of information about significant reserves. ASU No. 2010-03 must be applied prospectively as a change in accounting principle that is inseparable from a change in accounting estimate. The Company adopted ASU No. 2010-03 effective December 31, 2009.
39
In January 2010, the FASB issued ASU 2010-06, "Improving Disclosures About Fair Value Measurements" (ASU 2010-06), which amends the Fair Value Measurements and Disclosures Topic of the ASC (ASC Topic 820). Among other provisions, ASC Topic 820 establishes a fair value hierarchy that prioritizes the relative reliability of inputs used in fair value measurements. The hierarchy gives highest priority to Level 1 inputs that represent unadjusted quoted market prices in active markets for identical assets and liabilities that the reporting entity has the ability to access at the measurement date. Level 2 inputs are directly or indirectly observable inputs other than quoted prices included within Level 1. Level 3 inputs are unobservable inputs and have the lowest priority in the hierarchy. This amendment requires new disclosures on the value of, and the reason for, transfers in and out of Levels 1 and 2 of the fair value hierarchy and additional disclosures about purchases, sales, issuances and settlements within Level 3 fair value measurements. ASU 2010-06 also clarifies existing disclosure requirements on levels of disaggregation and about inputs and valuation techniques. ASU 2010-06 is effective for interim and annual reporting periods beginning after December 15, 2009, except for the requirement to provide additional disclosures regarding Level 3 measurements which is effective for interim and annual reporting periods beginning after December 15, 2010.
Management believes the impact of other recently issued standards and updates, which are not yet effective, will not have a material impact on the Company’s consolidated financial position, results of operations or cash flows upon adoption.
(2) Income Taxes
The following table shows the components of the Company's income tax (provision) benefit
(in thousands):
|
Years ended December 31,
|
||||||||||||
|
2010
|
2009
|
2008
|
||||||||||
|
Current:
|
||||||||||||
|
Federal
|
$ | (350 | ) | $ | (649 | ) | $ | (1,349 | ) | |||
|
State
|
721 | (631 | ) | (340 | ) | |||||||
| 371 | (1,280 | ) | (1,689 | ) | ||||||||
|
Deferred:
|
||||||||||||
|
Federal
|
3,688 | (1,286 | ) | 6,199 | ||||||||
|
State
|
11 | 214 | 476 | |||||||||
| $ | 4,070 | $ | (2,352 | ) | $ | 4,986 | ||||||
Taxes computed at the corporate federal income tax rate reconcile to the reported income tax (provision) as follows
(in thousands):
|
Years ended December 31,
|
||||||||||||
|
2010
|
2009
|
2008
|
||||||||||
|
Statutory federal income tax (provision) benefit
|
$ | (4,445 | ) | $ | (2,275 | ) | $ | 3,696 | ||||
|
State income tax (provision) benefit
|
(476 | ) | (270 | ) | 88 | |||||||
|
Federal statutory depletion
|
534 | 186 | 797 | |||||||||
|
Domestic production deduction
|
- | - | 62 | |||||||||
|
Foreign investment write-off
|
201 | - | - | |||||||||
|
Reduction of prior uncertain tax position
|
- | - | 320 | |||||||||
|
Other
|
116 | 7 | 23 | |||||||||
| $ | (4,070 | ) | $ | (2,352 | ) | $ | 4,986 | |||||
40
Deferred income taxes reflect the net difference between the financial statement carrying amounts and the underlying tax basis in such items. The components of the federal deferred tax asset (liability) are as follows
(in thousands):
|
Years Ended December 31,
|
||||||||
|
2010
|
2009
|
|||||||
|
Current deferred tax asset (liability)
|
||||||||
|
Bad debts
|
$ | 372 | $ | 421 | ||||
|
Prepaid insurance
|
(776 | ) | (1,070 | ) | ||||
|
Mark-to-market contracts
|
(450 | ) | (88 | ) | ||||
|
Net current deferred tax (liability)
|
(854 | ) | (737 | ) | ||||
|
Long-term deferred tax asset (liability)
|
||||||||
|
Property
|
(2,885 | ) | 884 | |||||
|
Uniform capitalization
|
396 | 322 | ||||||
|
Insurance returns
|
(45 | ) | (166 | ) | ||||
|
Other
|
243 | 250 | ||||||
|
Net long-term deferred tax asset (liability)
|
(2,291 | ) | 1,290 | |||||
|
Net deferred tax asset (liability)
|
$ | (3,145 | ) | $ | 553 | |||
Financial statement recognition and measurement of positions taken, or expected to be taken, by an entity in its income tax returns must consider the uncertainty and judgment involved in the determination and filing of income taxes. Tax positions taken in an income tax return that are recognized in the financial statements must satisfy a more-likely-than-not recognition threshold, assuming that the tax position will be examined by taxing authorities with full knowledge of all relevant information. As of December 31, 2010 and 2009, the Company had accrued approximately $27,000 and $130,000 including approximately $8,000 and $58,000 of potential interest and penalty, respectively, applicable to certain open and unfiled state tax returns. A reconciliation of the unrecognized tax benefits is as follows
(in thousands):
|
2010
|
2009
|
|||||||
|
Balance as of January 1,
|
$ | 72 | $ | 63 | ||||
|
Additions for tax positions of prior years
|
- | 9 | ||||||
|
Reductions of prior positions
|
(53 | ) | - | |||||
|
Balance as of December 31,
|
$ | 19 | $ | 72 | ||||
The Company has filed all remaining open returns and expects final resolution with all states by year-end 2011. As the actual tax payments are made, the accrual is reduced. The Company has no other unrecognized tax benefits. Interest and penalties associated with income tax liabilities are classified as income tax expense.
The earliest tax years remaining open for audit for Federal and major states of operations are as follows:
|
Earliest Open
|
|
|
Tax Year
|
|
|
Federal
|
2007
|
|
Texas
|
2006
|
|
Louisiana
|
2007
|
|
Michigan
|
2007
|
41
(3) Concentration of Credit Risk
Credit risk represents the amount of loss the Company would absorb if its customers failed to perform pursuant to contractual terms. Management of credit risk involves a number of considerations, such as the financial profile of the customer, the value of collateral held, if any, specific terms and duration of the contractual agreement, and the customer's sensitivity to economic developments. The Company has established various procedures to manage credit exposure, including initial credit approval, credit limits, and rights of offset. Letters of credit and guarantees are also utilized to limit credit risk. Accounts receivable associated with crude oil and natural gas marketing activities comprise approximately 90 percent of the Company’s total receivables and industry practice requires payment for such sales to occur within 25 days of the end of the month following a transaction. The Company’s customer mix, credit policies and the relatively short duration of receivables mitigate the uncertainty typically associated with receivables management.
The Company’s largest customers consist of large multinational integrated oil companies and utilities. In addition, the Company transacts business with independent oil producers, major chemical concerns, crude oil and natural gas trading companies and a variety of commercial energy users. Within this group of customers the Company generally derives up to 50 percent of its revenues from two to three large crude oil refining concerns. While the Company has ongoing established relationships with certain domestic refiners of crude oil, alternative markets are readily available since the Company supplies less than one percent of U. S. domestic refiner demand. As a fungible commodity delivered to major Gulf Coast supply points, the Company’s crude oil sales can be readily delivered to alternative end markets. Management believes that a loss of any of those customers where the Company currently derives more than 10 percent of its revenues would not have a material adverse effect on the Company’s operations.
The Company had accounts receivable from four customers that comprised 22.4 percent, 16.2 percent, 13.7 percent and 10.6 percent, respectively, of total accounts receivable at December 31, 2010. Five customers comprised 35.8 percent, 20.2 percent, 17.9 percent, 13 percent and 11 percent, respectively, of total revenues during 2010. The Company had accounts receivable from three customers that comprised 17.8 percent, 12.6 percent and 10.8 percent, respectively, of total accounts receivable at December 31, 2009. Three customers comprised 39.4 percent, 17.7 percent and 15.7 percent, respectively, of total revenues during 2009. The Company had accounts receivable from one customer that comprised 18.7 percent of total receivables at December 31, 2008. Such customer also comprised 16.3 percent and a second customer comprised 40.3 percent, respectively, of total revenues during 2008.
An allowance for doubtful accounts is provided where appropriate and accounts receivable presented herein are net of allowances for doubtful accounts of $1,064,000 and $1,681,000 at December 31, 2010 and 2009, respectively. As reflected in the table below, during 2009 and 2008 the Company increased its provision for bad debts as a result of a deteriorating economic outlook for the U. S. economy particularly as it impacted the collectability of the Company’s diesel fuel sales to the construction industry.
An analysis of the changes in the allowance for doubtful accounts is presented as follows
(in thousands):
|
2010
|
2009
|
2008
|
||||||||||
|
Balance, beginning of year
|
$ | 1,681 | $ | 1,251 | $ | 192 | ||||||
|
Provisions for bad debts
|
29 | 704 | 1,099 | |||||||||
|
Less: Write-offs and recoveries
|
(646 | ) | (274 | ) | (40 | ) | ||||||
|
Balance, end of year
|
$ | 1,064 | $ | 1,681 | $ | 1,251 | ||||||
(4) Employee Benefits
The Company maintains a 401(k) savings plan for the benefit of its employees. The Company’s contributory expenses for the plan were $565,000, $578,000 and $607,000 in 2010, 2009 and 2008, respectively. No other pension or retirement plans are maintained by the Company.
42
(5) Transactions with Affiliates
Mr. K. S. Adams, Jr., Chairman and Chief Executive Officer, and certain of his family partnerships and affiliates have participated as working interest owners with the Company’s subsidiary, Adams Resources Exploration Corporation. Mr. Adams and such affiliates participate on terms similar to those afforded other non-affiliated working interest owners. In recent years, such related party transactions generally result after the Company has first identified oil and gas prospects of interest. Typically the available dollar commitment to participate in such transactions is greater than the amount management is comfortable putting at risk. In such event, the Company first determines the percentage of the transaction it wants to obtain, which allows a related party to participate in the investment to the extent there is excess available. In those instances where there was no excess availability there has been no related party participation. Similarly, related parties are not required to participate, nor is the Company obligated to offer any such participation to a related or other party. When such related party transactions occur, they are individually reviewed and approved by the Audit Committee comprised of the independent directors on the Company’s Board of Directors. During 2010 and 2009, the Company’s investment commitments totaled approximately $11.7 million and $12.7 million, respectively, in those oil and gas projects where a related party was also participating in such investments. As of December 31, 2010 and 2009, the Company owed a combined net total of $9,000 and $75,000, respectively, to these related parties. In connection with the operation of certain oil and gas properties, the Company also charges such related parties for administrative overhead primarily as prescribed by the Council of Petroleum Accountants Society Bulletin 5. Such overhead recoveries totaled $160,000, $150,000 and $134,000 for the years ended December 31, 2010, 2009, and 2008, respectively.
The Company also enters into certain transactions in the normal course of business with other affiliated entities including direct cost reimbursement for shared phone and secretarial services. For the years ended December 31, 2010, 2009 and 2008, the affiliated entities charged the Company $43,000, $62,000 and $51,000, respectively, of expense reimbursement and the Company charged the affiliates $117,000, $127,000 and $97,000, respectively, for such expense reimbursements.
(6) Commitments and Contingencies
Rental expense primarily results from payments to truck owner-operators for use of their equipment and services on a month-to-month basis. The Company has also entered into longer term operating lease arrangements for tractors, trailers, office space, and other equipment and facilities. In addition, the Company has entered into certain lease and terminal access contracts in order to provide tank storage and dock access for its crude oil marketing business. Such contracts require certain minimum monthly payments for the term of the contracts. Rental expense for the years ended December 31, 2010, 2009, and 2008 was $5,870,000, $6,898,000 and $13,423,000, respectively. At December 31, 2010, commitments under long-term non-cancelable operating leases and terminal arrangements for the next five years and thereafter are payable as follows: 2011 - $2,070,000; 2012 - $1,539,000; 2013 - $1,427,000; 2014 - $748,000; 2015 - $480,000 and $1,080,000 thereafter.
Under certain of the Company’s automobile and workers’ compensation insurance policies, the Company can either receive a return of premium paid or be assessed for additional premiums up to pre-established limits. Additionally under the policies in certain instances the risk of insured losses is shared with a group of similarly situated entities. The Company has appropriately recognized estimated expenses and liabilities related to these policies for losses incurred but not reported to the Company or its insurance carrier of $2,125,911 and $1,934,359 as of December 31, 2010 and 2009, respectively.
From time to time as incidental to its operations, the Company may become involved in various lawsuits and/or disputes. Primarily as an operator of an extensive trucking fleet, the Company is a party to motor vehicle accidents, worker compensation claims and other items of general liability as would be typical for the industry. Management of the Company is presently unaware of any claims against the Company that are either outside the scope of insurance coverage, or that may exceed the level of insurance coverage, and could potentially represent a material adverse effect on the Company’s financial position or results of operations.
43
(7) Guarantees
Pursuant to arranging operating lease financing for truck-tractors and tank trailers, individual subsidiaries of the Company may guarantee the lessor a minimum residual equipment sales value upon the expiration of a lease and sale of the underlying equipment. The Company believes performance under these guarantees to be remote. Aggregate guaranteed residual values for tractors and trailers under operating leases as of December 31, 2010 are as follows
(in thousands):
|
2011
|
2012
|
2013
|
Thereafter
|
Total
|
||||||||||||||||
|
Equipment residual values
|
$ | 181 | $ | 72 | $ | 216 | $ | - | $ | 469 | ||||||||||
In connection with certain contracts for the purchase and resale of branded motor fuels, the Company has received certain price discounts from its suppliers toward the purchase of gasoline and diesel fuel. Such discounts have been passed through to the Company’s customers as an incentive to offset a portion of the costs associated with offering branded motor fuels for sale to the general public. Under the terms of the supply contracts, the Company and its customers are not obligated to return the price discounts, provided the gasoline service station offering such product for sale remains as a branded station for periods ranging from three to ten years. The Company has a number of customers and stations operating under such arrangements, and the Company’s customers are contractually obligated to remain a branded dealer for the required periods of time. Should the Company’s customers seek to void such contracts, the Company would be obligated to return a portion of such discounts received to its suppliers. As of December 31, 2010, the maximum amount of such potential obligation is approximately $1,886,000. Management of the Company believes its customers will adhere to their branding obligations and no such refunds will result.
Presently, neither Adams Resources & Energy, Inc. (“ARE”) nor any of its subsidiaries has any other types of guarantees outstanding that require liability recognition.
ARE frequently issues parent guarantees of commitments resulting from the ongoing activities of its subsidiary companies. The guarantees generally result from subsidiary commodity purchase obligations, subsidiary lease commitments and subsidiary banking transactions. The nature of such items is to guarantee the performance of the subsidiary companies in meeting their respective underlying obligations. Except for operating lease commitments and letters of credit, all such underlying obligations are recorded on the books of the subsidiary companies and are included in the consolidated financial statements included herein. Therefore, no such obligation is recorded again on the books of the parent. The parent would only be called upon to perform under the guarantee in the event of a payment default by the applicable subsidiary company. In satisfying such obligations, the parent would first look to the assets of the defaulting subsidiary company.
As of December 31, 2010, parental guaranteed obligations are approximately as follows
(in thousands):
|
2011
|
2012
|
2013
|
2014
|
Thereafter
|
Total
|
|||||||||||||||||||
|
Lease payments
|
$ | 186 | $ | 56 | $ | 47 | - | - | 289 | |||||||||||||||
|
Equipment residual values
|
181 | 72 | 216 | - | - | 469 | ||||||||||||||||||
|
Commodity purchases
|
49,411 | - | - | - | - | 49,411 | ||||||||||||||||||
|
Letters of credit
|
23,912 | - | - | - | - | 23,912 | ||||||||||||||||||
| $ | 73,690 | $ | 128 | $ | 263 | $ | - | $ | - | $ | 74,081 | |||||||||||||
44
(8) Segment Reporting
The Company is engaged in the business of crude oil, natural gas and petroleum products marketing as well as tank truck transportation of liquid chemicals, and oil and gas exploration and production. Information concerning the Company's various business activities is summarized as follows
(in thousands):
|
Segment Operating
|
Depreciation Depletion and
|
Property and Equipment
|
||||||||||||||
|
Revenues
|
Earnings (loss)
|
Amortization
|
Additions
|
|||||||||||||
|
Year ended December 31, 2010-
|
||||||||||||||||
|
Marketing
|
||||||||||||||||
|
- Crude oil
|
$ | 2,005,301 | $ | 13,530 | $ | 2,320 | $ | 6,051 | ||||||||
|
- Natural gas
|
10,592 | 3,073 | 44 | 115 | ||||||||||||
|
- Refined products
|
128,189 | 121 | 503 | 146 | ||||||||||||
|
Marketing Total
|
2,144,082 | 16,724 | 2,867 | 6,312 | ||||||||||||
|
Transportation
|
56,867 | 6,623 | 4,288 | 4,410 | ||||||||||||
|
Oil and gas
|
11,021 | (1,757 | ) | 4,662 | 11,699 | |||||||||||
| $ | 2,211,970 | $ | 21,590 | $ | 11,817 | $ | 22,421 | |||||||||
|
Year ended December 31, 2009-
|
||||||||||||||||
|
Marketing
|
||||||||||||||||
|
- Crude oil
|
$ | 1,770,600 | $ | 15,404 | $ | 1,997 | $ | 1,947 | ||||||||
|
- Natural gas
|
14,232 | 2,749 | 166 | - | ||||||||||||
|
- Refined products
|
104,751 | (666 | ) | 533 | 177 | |||||||||||
|
Marketing Total
|
1,889,583 | 17,487 | 2,696 | 2,124 | ||||||||||||
|
Transportation
|
44,895 | 2,128 | 3,970 | 7,524 | ||||||||||||
|
Oil and gas
|
8,650 | (3,625 | ) | 3,654 | 12,742 | |||||||||||
| $ | 1,943,128 | $ | 15,990 | $ | 10,320 | $ | 22,390 | |||||||||
|
Year ended December 31, 2008-
|
||||||||||||||||
|
Marketing
|
||||||||||||||||
|
- Crude oil
|
$ | 3,849,531 | $ | (4,545 | ) | $ | 2,039 | $ | 4,715 | |||||||
|
- Natural gas
|
11,586 | 2,247 | 163 | 12 | ||||||||||||
|
- Refined products
|
213,560 | (406 | ) | 565 | 114 | |||||||||||
|
Marketing Total
|
4,074,677 | (2,704 | ) | 2,767 | 4,841 | |||||||||||
|
Transportation
|
67,747 | 4,245 | 3,843 | 809 | ||||||||||||
|
Oil and gas
|
17,248 | (3,348 | ) | 6,763 | 12,038 | |||||||||||
| $ | 4,159,672 | $ | (1,807 | ) | $ | 13,373 | $ | 17,688 | ||||||||
|
|
Intersegment sales are insignificant and all sales by the Company occurred in the United States.
|
Segment operating earnings reflect revenues net of operating costs and depreciation, depletion and amortization and are reconciled to earnings from continuing operations before income taxes, as follows
(in thousands):
|
Years Ended December 31,
|
||||||||||||
|
2010
|
2009
|
2008
|
||||||||||
|
Segment operating earnings (loss)
|
$ | 21,590 | $ | 15,990 | $ | (1,807 | ) | |||||
|
- General and administrative expenses
|
(9,044 | ) | (9,589 | ) | (9,667 | ) | ||||||
|
Operating earnings
|
12,546 | 6,401 | (11,474 | ) | ||||||||
|
- Interest income
|
191 | 125 | 1,103 | |||||||||
|
- Interest expense
|
(36 | ) | (25 | ) | (187 | ) | ||||||
|
Earnings (loss) before income taxes
|
$ | 12,701 | $ | 6,501 | $ | (10,558 | ) | |||||
45
Identifiable assets by industry segment are as follows
(in thousands):
|
Years Ended December 31,
|
||||||||
|
2010
|
2009
|
|||||||
|
Marketing
|
||||||||
|
- Crude oil
|
$ | 184,299 | $ | 130,840 | ||||
|
- Natural gas
|
19,948 | 40,715 | ||||||
|
- Refined products
|
11,594 | 10,133 | ||||||
|
Marketing Total
|
215,841 | 181,688 | ||||||
|
Transportation
|
17,378 | 16,078 | ||||||
|
Oil and gas
|
32,563 | 26,050 | ||||||
|
Other
|
35,523 | 25,585 | ||||||
| $ | 301,305 | $ | 249,401 | |||||
Other identifiable assets are primarily corporate cash, corporate accounts receivable, and properties not identified with any specific segment of the Company's business. Accounting policies for transactions between reportable segments are consistent with applicable accounting policies as disclosed herein.
(9) Quarterly Financial Data (Unaudited) -
Selected quarterly financial data and earnings per share of the Company are presented below for the years ended December 31, 2010 and 2009
(in thousands, except per share data):
|
Net Earnings (loss)
|
Dividends
|
|||||||||||||||||||||||||
|
Operating
|
Per
|
Per
|
||||||||||||||||||||||||
|
Revenues
|
Earnings (loss)
|
Amount
|
Share
|
Amount
|
Share
|
|||||||||||||||||||||
| 2010 - | ||||||||||||||||||||||||||
|
March 31
|
$ | 533,785 | $ | 2,575 | $ | 1,794 | $ | .43 | $ | - | $ | - | ||||||||||||||
|
June 30
|
547,141 | 2,656 | 1,685 | .39 | - | - | ||||||||||||||||||||
|
September 30
|
502,455 | 4,021 | 2,762 | .66 | - | - | ||||||||||||||||||||
|
December 31
|
628,589 | 3,294 | 2,390 | .57 | 2,277 | .54 | ||||||||||||||||||||
|
Total
|
$ | 2,211,970 | $ | 12,546 | $ | 8,631 | $ | 2.05 | $ | 2,277 | $ | .54 | ||||||||||||||
| 2009 - | ||||||||||||||||||||||||||
|
March 31
|
$ | 340,141 | $ | 2,800 | $ | 1,870 | $ | .44 | $ | - | $ | - | ||||||||||||||
|
June 30
|
515,070 | 4,328 | 2,734 | .65 | - | - | ||||||||||||||||||||
|
September 30
|
576,299 | 1,146 | 639 | .15 | - | - | ||||||||||||||||||||
|
December 31
|
511,618 | (1,873 | ) | (1,094 | ) | (.26 | ) | 2,109 | .50 | |||||||||||||||||
|
Total
|
$ | 1,943,128 | $ | 6,401 | $ | 4,149 | $ | .98 | $ | 2,109 | $ | .50 | ||||||||||||||
|
Note:
|
The fourth quarter 2009 operating loss resulted from $833,000 of oil and gas producing property impairments and a $550,000 bad debt provision within the Company’s refined products segment. The full year 2010 and 2009 includes marketing segment pre-tax inventory liquidation gains totaling $2,272,000 and $5,780,000, respectively.
|
The above unaudited interim financial data reflect all adjustments that are in the opinion of management necessary to a fair statement of the results for the period presented. All such adjustments are of a normal recurring nature.
(10) Subsequent Event and Property Held for Sale
In January 2011, the Company completed the sale of its interest in certain producing oil and gas properties. Proceeds from the sale totaled $6.2 million and the Company will record a pre-tax gain from this transaction of approximately $2.7 million during the first quarter of 2011. Such properties sold are included under the caption “Oil and Gas Property Held for Sale” in the accompanying Consolidated Balance Sheet.
46
(11)
Oil and Gas Producing Activities (Unaudited)
The Company’s oil and gas exploration and production activities are conducted in Texas and the south central region of the United States, primarily along the Gulf Coast of Texas and Louisiana.
Oil and Gas Producing Activities -
Total costs incurred in oil and gas exploration and development activities, all incurred within the United States, were as follows
(in thousands):
|
Years Ended December 31,
|
||||||||||||
|
2010
|
2009
|
2008
|
||||||||||
|
Property acquisition costs
|
||||||||||||
|
Unproved
|
$ | 2,295 | $ | 6,199 | $ | 3,139 | ||||||
|
Proved
|
- | - | - | |||||||||
|
Exploration costs
|
||||||||||||
|
Expensed
|
3,233 | 3,818 | 6,030 | |||||||||
|
Capitalized
|
- | 1,035 | 178 | |||||||||
|
Development costs
|
6,233 | 2,341 | 3,466 | |||||||||
|
Total costs incurred
|
$ | 11,761 | $ | 13,393 | $ | 12,813 | ||||||
The aggregate capitalized costs relative to oil and gas producing activities are as follows
(in thousands):
|
|
December 31,
|
|||||||
|
2010
|
2009
|
|||||||
|
Unproved oil and gas properties
|
$ | 12,250 | $ | 9,385 | ||||
|
Proved oil and gas properties
|
69,011 | 64,458 | ||||||
| 81,261 | 73,843 | |||||||
|
Accumulated depreciation, depletion
|
||||||||
|
and amortization
|
(51,857 | ) | (49,797 | ) | ||||
|
Net capitalized cost
|
$ | 29,404 | $ | 24,046 | ||||
Estimated Oil and Natural Gas Reserves -
The following information regarding estimates of the Company's proved oil and gas reserves, all located in Texas and the south central region of the United States, is based on reports prepared on behalf of the Company by its independent petroleum engineers. Because oil and gas reserve estimates are inherently imprecise and require extensive judgments of reservoir engineering data, they are generally less precise than estimates made in conjunction with financial disclosures. The revisions of previous estimates as reflected in the table below result from changes in commodity pricing assumptions and from more precise engineering calculations based upon additional production histories and price changes.
Proved developed and undeveloped reserves are presented as follows
(in thousands):
|
Years Ended December 31,
|
||||||||||||||||||||||||
|
2010
|
2009
|
2008
|
||||||||||||||||||||||
|
Natural
|
Natural
|
Natural
|
||||||||||||||||||||||
|
Gas
|
Oil
|
Gas
|
Oil
|
Gas
|
Oil
|
|||||||||||||||||||
|
(
Mcf’s
)
|
(
Bbls.
)
|
(
Mcf’s
)
|
(
Bbls.
)
|
(
Mcf’s
)
|
(
Bbls
.)
|
|||||||||||||||||||
|
Total proved reserves-
|
||||||||||||||||||||||||
|
Beginning of year
|
7,248 | 242 | 6,443 | 230 | 7,068 | 297 | ||||||||||||||||||
|
Revisions of previous estimates
|
(832 | ) | - | (129 | ) | (4 | ) | (1,350 | ) | (83 | ) | |||||||||||||
|
Oil and gas reserves sold
|
- | - | - | - | - | - | ||||||||||||||||||
|
Extensions, discoveries and
|
||||||||||||||||||||||||
|
Other reserve additions
|
2,743 | 79 | 2,238 | 66 | 1,968 | 67 | ||||||||||||||||||
|
Production
|
(1,365 | ) | (54 | ) | (1,304 | ) | (50 | ) | (1,243 | ) | (51 | ) | ||||||||||||
|
End of year
|
7,794 | 267 | 7,248 | 242 | 6,443 | 230 | ||||||||||||||||||
The components of proved oil and gas reserves for the three years ended December 31, 2010 is presented below. All reserves are in the United States
(in thousands):
|
Years Ended December 31,
|
||||||||||||||||||||||||
|
2010
|
2009
|
2008
|
||||||||||||||||||||||
|
Natural
|
Natural
|
Natural
|
||||||||||||||||||||||
|
Gas
|
Oil
|
Gas
|
Oil
|
Gas
|
Oil
|
|||||||||||||||||||
|
(
Mcf’s
)
|
(
Bbls.
)
|
(
Mcf’s
)
|
(
Bbls.
)
|
(
Mcf’s
)
|
(
Bbls
.)
|
|||||||||||||||||||
|
Proved developed reserves
|
7,134 | 240 | 6,295 | 242 | 6,443 | 230 | ||||||||||||||||||
|
Proved undeveloped reserves
|
660 | 27 | 953 | - | - | - | ||||||||||||||||||
|
Total proved reserves
|
7,794 | 267 | 7,248 | 242 | 6,443 | 230 | ||||||||||||||||||
Proved undeveloped reserves originated in 2009 when active drilling efforts during such period identified and delineated additional reserve average. During 2010 additional drilling efforts converted such undeveloped reserves to the developed category.
The Company has developed internal policies and controls for estimating and recording oil and gas reserve data. The estimation and recording of proved reserves is required to be in compliance with SEC definitions and guidance. The Company assigns responsibility for compliance in reserve bookings to the office of President of the Company’s AREC subsidiary. No portion of this individual’s compensation is directly dependent on the quantity of reserves booked. Reserve estimates are required to be made by qualified reserve estimators, as defined by Society of Petroleum Engineers’ Standards.
The Company employs the third party petroleum consultant, Ryder Scott Company, to prepare its oil and gas reserve data estimates as of December 31 2010, 2009 and 2008. The firm of Ryder Scott is well recognized within the industry for more than 50 years. As prescribed by the SEC, such proved reserves were estimated using 12-month average oil and gas prices, based on the first-day-of-the-month price for each month in the period, and year-end production and development costs for the December 31, 2010 and 2009’s estimate, without escalation. At December 31, 2008 and in previous years, such proved reserves were estimated using oil and gas prices and production and development costs as of December 31 of each such year, without escalation.
The process of estimating oil and gas reserves is complex and requires significant judgment. Uncertainties are inherent in estimating quantities of proved reserves, including many factors beyond the estimator’s control. Reserve engineering is a subjective process of estimating subsurface accumulations of oil and gas that cannot be measured in an exact manner, and the accuracy of any reserve estimate is a function of the quality of available data and the interpretation thereof. As a result, estimates by different engineers often vary, sometimes significantly. In addition, physical factors such as the results of drilling, testing and production subsequent to the date of an estimate, as well as economic factors such as changes in product prices, may justify revision of such estimates. Accordingly, oil and gas quantities ultimately recovered will vary from reserve estimates.
Standardized Measure of Discounted Future Net Cash Flows from Oil and Gas Operations and Changes Therein -
The standardized measure of discounted future net cash flows was determined based on the economic conditions in effect at the end of the years presented, except in those instances where fixed and determinable gas price escalations are included in contracts. The disclosures below do not purport to present the fair market value of the Company's oil and gas reserves. An estimate of the fair market value would also take into account, among other things, the recovery of reserves in excess of proved reserves, anticipated future changes in prices and costs, a discount factor more representative of the time value of money and risks inherent in reserve estimates. The standardized measure of discounted future net cash flows is presented as follows
(in thousands):
47
|
Years Ended December 31,
|
||||||||||||
|
2010
|
2009
|
2008
|
||||||||||
|
Future gross revenues
|
$ | 61,311 | $ | 43,498 | $ | 45,081 | ||||||
|
Future costs -
|
||||||||||||
|
Lease operating expenses
|
(17,288 | ) | (15,969 | ) | (14,080 | ) | ||||||
|
Development costs
|
(1,596 | ) | (2,495 | ) | (816 | ) | ||||||
|
Future net cash flows before income taxes
|
42,427 | 25,034 | 30,185 | |||||||||
|
Discount at 10% per annum
|
(16,777 | ) | (10,719 | ) | (12,421 | ) | ||||||
|
Discounted future net cash flows
|
||||||||||||
|
before income taxes
|
25,650 | 14,315 | 17,764 | |||||||||
|
Future income taxes, net of discount at
|
||||||||||||
|
10% per annum
|
(8,978 | ) | (5,010 | ) | (6,217 | ) | ||||||
|
Standardized measure of discounted
|
||||||||||||
|
future net cash flows
|
$ | 16,672 | $ | 9,305 | $ | 11,547 | ||||||
The reserve estimates provided at December 31, 2010, 2009 and 2008 are based on aggregate prices of $76.14, $58.43 and $37.87 per barrel for crude oil and $5.26, $4.05 and $5.65 per mcf for natural gas, respectively. For 2010 and 2009, such prices were based on the unweighted arithmetic average of the prices in effect on the first day of the month for each month of the respective twelve month periods as required by Securities & Exchange Commission regulations. For 2008, the price reflects the market price on December 31, 2008.
The affect of income taxes and discounting on the standardized measure of discounted future net cash flows is presented as follows
(in thousands):
|
Years ended December 31,
|
||||||||||||
|
2010
|
2009
|
2008
|
||||||||||
|
Future net cash flows before income taxes
|
$ | 42,427 | $ | 25,034 | $ | 30,185 | ||||||
|
Future income taxes
|
(14,849 | ) | (8,762 | ) | (10,565 | ) | ||||||
|
Future net cash flows
|
27,578 | 16,272 | 19,620 | |||||||||
|
Discount at 10% per annum
|
(10,906 | ) | (6,967 | ) | (8,073 | ) | ||||||
|
Standardized measure of discounted
|
||||||||||||
|
future net cash flows
|
$ | 16,672 | $ | 9,305 | $ | 11,547 | ||||||
The principal sources of changes in the standardized measure of discounted future net flows are as follows
(in thousands):
|
Years Ended December 31,
|
||||||||||||
|
2010
|
2009
|
2008
|
||||||||||
|
Beginning of year
|
$ | 9,305 | $ | 11,547 | $ | 19,590 | ||||||
|
Sale of oil and gas reserves
|
- | - | - | |||||||||
|
Net change in prices and production costs
|
9,435 | (4,890 | ) | (10,041 | ) | |||||||
|
New field discoveries and extensions, net of future
|
||||||||||||
|
production costs
|
9,068 | 3,471 | 11,571 | |||||||||
|
Sales of oil and gas produced, net of production costs
|
(7,084 | ) | (5,114 | ) | (12,523 | ) | ||||||
|
Net change due to revisions in quantity estimates
|
(1,369 | ) | (347 | ) | (6,293 | ) | ||||||
|
Accretion of discount
|
1,072 | 1,242 | 2,234 | |||||||||
|
Production rate changes and other
|
213 | 2,189 | 2,679 | |||||||||
|
Net change in income taxes
|
(3,968 | ) | 1,207 | 4,330 | ||||||||
|
End of year
|
$ | 16,672 | $ | 9,305 | $ | 11,547 | ||||||
48
Results of Operations for Oil and Gas Producing Activities -
The results of oil and gas producing activities, excluding corporate overhead and interest costs, are as follows
(in thousands):
|
Years Ended December 31,
|
||||||||||||
|
2010
|
2009
|
2008
|
||||||||||
|
Revenues
|
$ | 11,021 | $ | 8,650 | $ | 17,248 | ||||||
|
Costs and expenses -
|
||||||||||||
|
Production
|
(3,937 | ) | (3,536 | ) | (4,725 | ) | ||||||
|
Producing property impairment
|
(946 | ) | (1,350 | ) | (3,078 | ) | ||||||
|
Exploration
|
(3,233 | ) | (3,735 | ) | (6,030 | ) | ||||||
|
Depreciation, depletion and amortization
|
(4,662 | ) | (3,654 | ) | (6,763 | ) | ||||||
|
Operating income (loss) before income taxes
|
(1,757 | ) | (3,625 | ) | (3,348 | ) | ||||||
|
Income tax (expense) benefit
|
615 | 1,268 | 1,172 | |||||||||
|
Operating income (loss)
|
$ | (1,142 | ) | $ | (2,357 | ) | $ | (2,176 | ) | |||
|
Item 9.
|
CHANGES IN AND DISAGREEMENTS WITH ACCOUNTANTS ON ACCOUNTING AND FINANCIAL DISCLOSURE
|
None.
Disclosure Controls and Procedures
The Company maintains “disclosure controls and procedures” (as defined in Rule 13a-15(e) and 15d-15(e) under the Securities Exchange Act of 1934, as amended (the “Exchange Act”) that are designed to ensure that information required to be disclosed in the reports that the Company files or submits under the Exchange Act are recorded, processed, summarized and reported within the time periods specified in the Securities and Exchange Commission’s rules and forms and is accumulated and communicated to management, including the Company’s Chief Executive Officer and Chief Financial Officer, as appropriate, to allow timely discussions regarding required disclosure. As of the end of the period covered by this annual report, an evaluation was carried out under the supervision and with the participation of the Company’s management, including the Company’s Chief Executive Officer and Chief Financial Officer, of the effectiveness of the design and operation of the Company’s disclosure controls and procedures. Based upon that evaluation, the Chief Executive Officer and the Chief Financial Officer concluded the disclosure controls and procedures as of the end of the period covered by this report are effective to ensure that information required to be disclosed in the Company’s Exchange Act filings is recorded, processed, summarized and reported within the periods specified in the Securities and Exchange Commission’s rules and forms.
Management’s Report on Internal Control Over Financial Reporting
Management is responsible for establishing and maintaining adequate internal control over financial reporting as defined in Rule 13a-15(f) under the Exchange Act. The Company’s internal control over financial reporting is a process designed under the supervision of the Company’s Chief Executive Officer and the Chief Financial Officer to provide reasonable assurance regarding the reliability of financial reporting and the preparation of financial statements for external purposes in accordance with accounting principles generally accepted in the United States.
Because of its inherent limitations, internal control over financial reporting may not prevent or detect misstatements. Also, projections of any evaluation of effectiveness to future periods are subject to the risk that controls may become inadequate because of changes in conditions, or that the degree of compliance with policies and procedures may deteriorate.
49
Management, including the Company’s Chief Executive Officer and Chief Financial Officer, assessed the effectiveness of the Company’s internal control over financial reporting as of December 31, 2010. In making this assessment, management used the criteria described in
Internal Control – Integrated Framework
issued by the Committee of Sponsoring Organizations of the Treadway Commission (COSO). Based on this assessment, management, including the Company’s Chief Executive Officer and Chief Financial Officer, concluded that internal control over financial reporting was effective at a reasonable assurance level as of December 31, 2010.
This annual report does not include an attestation report of the Company’s independent registered public accounting firm regarding internal control over financial reporting. This management’s report was not subject to attestation by an independent registered public accounting firm pursuant to the rules of the Securities and Exchange Commission that permit the Company to provide only management’s report in this annual report.
This Management’s Report on Internal Control over Financial Reporting shall not be deemed “filed” for purposes of Section 18 of the Exchange Act or incorporated by reference in any filing under the Securities Act of 1933, as amended, or the Exchange Act, except as shall be expressly set forth by specific reference in such a filing.
Changes in Internal Control over Financial Reporting.
There have not been any changes in the Company’s internal control over financial reporting during the fiscal quarter ended December 31, 2010 that have materially affected, or are reasonably likely to materially affect, the Company’s internal control over financial reporting.
None.
50
|
Item 10.
|
DIRECTORS, EXECUTIVE OFFICERS AND CORPORATE GOVERNANCE
|
The information concerning directors, corporate governance and executive officers of the Company is incorporated by reference from the Company’s definitive Proxy Statement for the Annual Meeting of Shareholders to be held May 18, 2011, under the heading “Election of Directors” and “Executive Officers”, respectively, to be filed with the Commission not later than 120 days after the end of the fiscal year covered by this Form 10-K.
|
Item 11.
|
EXECUTIVE COMPENSATION
|
The information required by Item 11 is incorporated by reference from the Company’s definitive Proxy Statement for the Annual Meeting of Shareholders to be held May 18, 2011, under the heading “Executive Compensation” to be filed with the Commission not later than 120 days after the end of the fiscal year covered by this Form 10-K.
|
Item 12.
|
SECURITY OWNERSHIP OF CERTAIN BENEFICIAL OWNERS AND MANAGEMENT AND RELATED STOCKHOLDER MATTERS
|
The information required by Item 12 is incorporated by reference from the Company’s definitive Proxy Statement for the Annual Meeting of Shareholders to be held May 18, 2011, under the heading “Voting Securities and Principal Holders Thereof” to be filed with the Commission not later than 120 days after the end of the fiscal year covered by this Form 10-K.
|
Item 13.
|
CERTAIN RELATIONSHIPS, RELATED PARTY TRANSACTIONS AND DIRECTOR INDEPENDENCE
|
The information required by Item 13 is incorporated by reference from the Company’s definitive Proxy Statement for the Annual Meeting of Shareholders to be held May 18, 2011, under the headings “Transactions with Related Parties” and “Director Independence” to be filed with the Commission not later than 120 days after the end of the fiscal year covered by this Form 10-K.
|
Item 14.
|
PRINCIPAL ACCOUNTING FEES AND SERVICES
|
The information required by Item 14 is incorporated by reference from the Company’s definitive Proxy Statement for the Annual Meeting of Shareholders to be held May 18, 2011, under the heading “Principal Accounting Fees and Services” to be filed with the Commission not later than 120 days after the end of the fiscal year covered by this Form 10-K.
51
|
Item 15.
|
EXHIBITS AND FINANCIAL STATEMENT SCHEDULES
|
(a) The following documents are filed as a part of this Form 10-K:
1. Financial Statements
Report of Independent Registered Public Accounting Firm
Consolidated Balance Sheets as of December 31, 2010 and 2009
Consolidated Statements of Operations for the Years Ended
December 31, 2010, 2009 and 2008
Consolidated Statements of Shareholders' Equity for the Years Ended
December 31, 2010, 2009 and 2008
Consolidated Statements of Cash Flows for the Years Ended
December 31, 2010, 2009 and 2008
Notes to Consolidated Financial Statements
|
2.
|
All financial schedules have been omitted because they are not applicable or the required information is shown in the financial statements or notes thereto.
|
|
3.
|
Exhibits required to be filed
|
|
3(a)
|
-
|
Certificate of Incorporation of the Company, as amended. (Incorporated by reference to Exhibit 3(a) filed with the Annual Report on Form 10-K (-File No. 1-7908) of the Company for the fiscal year ended December 31, 1987)
|
|
3(b)
|
-
|
Bylaws of the Company, as amended (Incorporated by reference to Exhibits 3.2 and 3.2.1 of Amendment No. 1 to the Registration Statement on Form S-1 filed with the Securities and Exchange Commission on October 29, 1973 - File No. 2-48144)
|
|
3(c)
|
-
|
Amendment to the Bylaws of the Company to add an Article VII, Section 8. Indemnification of Directors, Officers, Employees and Agents (Incorporated by reference to Exhibit 3(c) of the Annual Report on Form 10-K (-File No. 1-7908) of the Company for the fiscal year ended December 31, 1986)
|
|
3(d)
|
-
|
Adams Resources & Energy, Inc. and Subsidiaries’ Code of Ethics (Incorporated by reference to Exhibit 3(d) of the Annual Report on Form 10-K (-File No. 1-7908) of the Company for the fiscal year ended December 31, 2002)
|
|
4(a)
|
-
|
Specimen common stock Certificate (Incorporated by reference to Exhibit 4(a) of the Annual Report on Form 10-K of the Company (-File No. 1-7908) for the fiscal year ended December 31, 1991)
|
52
|
4(b)
|
-
|
Credit and Security Agreement between Gulfmark Energy, Inc., Adams Resources Marketing, Ltd and Wells Fargo Bank, National Association dated August 27, 2009 (Incorporated by reference to Exhibit 4(b) of the Quarterly Report on Form 10-Q for the period ended September 30, 2009.
|
|
10.1(a)
|
- Employment agreement of Frank T. Webster, President, dated May 4, 2004 by and between Adams Resources & Energy, Inc. and Frank T. Webster (Incorporated by reference to Exhibit 10.1 to the Company’s quarterly report on Form 10-Q filed on November 11, 2004)
|
|
10.1(b)*
|
- Amendment to Employment Agreement of Frank T. Webster, President, dated December 6, 2010 by and between Adams Resources & Energy, Inc. and Frank T. Webster.
|
|
10.1(c)
|
- Change in control/severance agreement dated July 25, 2008 by and between Adams Resources & Energy, Inc. and Richard B. Abshire (Incorporated by reference to Exhibit 10.1 to the Company’s current report on Form 8-K filed on July 25, 2008)
|
|
21*
|
-
|
Subsidiaries of the Registrant
|
|
23.1*
|
-
|
Consent of Ryder Scott Company
|
|
31.1*
|
-
|
Adams Resources & Energy, Inc. Certification Pursuant to 17 CFR 13a-14 (a)/15d-14(a), As adopted pursuant to Section 302 of the Sarbanes-Oxley Act of 2002
|
|
31.2*
|
-
|
Adams Resources & Energy, Inc. Certification Pursuant to 17 CFR 13a-14(a)/15d-14(a), as adopted pursuant to Section 302 of the Sarbanes-Oxley Act of 2002
|
|
32.1*
|
-
|
Certification Pursuant to 18 U.S.C. Section 1350, as adopted pursuant to Section 906 of the Sarbanes-Oxley Act of 2002
|
|
32.2*
|
-
|
Certification Pursuant to 18 U.S.C. Section 1350, as adopted pursuant to Section 906 of the Sarbanes-Oxley Act of 2002
|
|
99.1*
|
-
|
Ryder Scott Company Report
|
|
|
______________________________
|
|
|
* - Filed herewith
|
Copies of all agreements defining the rights of holders of long-term debt of the Company and its subsidiaries, which agreements authorize amounts not in excess of 10% of the total consolidated assets of the Company, are not filed herewith but will be furnished to the Commission upon request.
53
SIGNATURES
Pursuant to the requirements of Section 13 or 15(d) of the Securities Exchange Act of 1934, the registrant has duly caused this report to be signed on its behalf by the undersigned, thereunto duly authorized.
|
ADAMS RESOURCES & ENERGY, INC.
|
|
|
(Registrant)
|
|
|
By
/s/Richard B. Abshire
|
By
/s/ K. S. Adams, Jr.
|
|
Richard B. Abshire,
|
K. S. Adams, Jr.,
|
|
Vice President and Chief Financial Officer
|
Chairman of the Board and
|
|
(Principal Financial Officer)
|
Chief Executive Officer
|
|
(Principal Executive Officer
|
Date: March 21, 2011
Pursuant to the requirements of the Securities Exchange Act of 1934, this report has been signed below by the following persons on behalf of the Registrant and in the capacities and on the date indicated.
|
By
/s/ Frank T. Webster
|
By
/s/ E. C. Reinauer, Jr.
|
|
Frank T. Webster, Director
|
E. C. Reinauer, Jr., Director
|
|
By
/s/ Larry E. Bell
|
By
/s/ E. Jack Webster, Jr.
|
|
Larry E. Bell, Director
|
E. Jack Webster, Jr., Director
|
54
EXHIBIT INDEX
|
Exhibit
|
|
|
Number
|
Description
|
|
3(a)
|
- Certificate of Incorporation of the Company, as amended. (Incorporated by reference to Exhibit 3(a) filed with the Annual Report on Form 10-K of the Company for the fiscal year ended December 31, 1987)
|
|
3(b)
|
- Bylaws of the Company, as amended (Incorporated by reference to Exhibits 3.2 and 3.2.1 of Amendment No. 1 to the Registration Statement on Form S-1 filed with the Securities and Exchange Commission on October 29, 1973 – File No. 2-48144)
|
|
3(c)
|
- Amendment to the Bylaws of the Company to add an Article VII, Section 8. Indemnification of Directors, Officers, Employees and Agents (Incorporated by reference to Exhibit 3(c) of the Annual Report on Form 10-K of the Company for the fiscal year ended December 31, 1986)
|
|
3(d)
|
- Adams Resources & Energy, Inc. and Subsidiaries’ Code of Ethics (Incorporated by reference to Exhibit 3(d) of the Annual Report on Form 10-K of the Company for the fiscal year ended December 31, 2002)
|
|
4(a)
|
- Specimen common stock Certificate (Incorporated by reference to Exhibit 4(a) of the Annual Report on Form 10-K of the Company for the fiscal year ended December 31, 1991)
|
|
4(b)
|
- Credit and Security Agreement between Gulfmark Energy, Inc., Adams Resources Marketing, Ltd and Wells Fargo Bank, National Association dated August 27, 2010 (Incorporated by reference to Exhibit 4(b) of the Quarterly Report on Form 10-Q for the period ended September 31, 2010
|
|
10.1(a)
10.1(b)*
10.1(c)
|
- Employment agreement of Frank T. Webster, President, dated May 4, 2004 by and between Adams Resources & Energy, Inc. and Frank T. Webster (Incorporated by reference to Exhibit 10.1 to the Company’s quarterly report on Form 10-Q filed on November 11, 2004)
- Amendment to Employment Agreement of Frank T. Webster, President, dated December 6, 2010 by and between Adams Resources & Energy, Inc. and Frank T. Webster.
- Change in control/severance agreement dated July 25, 2008 by and between Adams Resources & Energy, Inc. and Richard B. Abshire (Incorporated by reference to Exhibit 10.1 to the Company’s current report on Form 8-K filed on July 25, 2008)
|
|
21*
|
- Subsidiaries of the Registrant
|
|
23.1*
|
- Consent of Ryder Scott Company
|
|
31.1*
|
- Certification Pursuant to 17 CFR 13a-14(a)/15d-14(a), As Adopted Pursuant to Section 302 of the Sarbanes-Oxley Act of 2002
|
|
31.2*
|
- Certification Pursuant to 17 CFR 13a-14(a)/15d-14(a), As Adopted Pursuant to Section 302 of the Sarbanes-Oxley Act of 2002
|
|
32.1*
|
- Certification Pursuant to 18 U.S.C. Section 1350, As Adopted Pursuant to Section 906 of the Sarbanes-Oxley Act of 2002
|
|
32.2*
|
- Certification Pursuant to 18 U.S.C. Section 1350, As Adopted Pursuant to Section 906 of the Sarbanes-Oxley Act of 2002
|
|
99.1*
|
- Ryder Scott Company Report
|
|
|
______________________________
|
|
|
* - Filed herewith
|
55
TABLE OF CONTENTS
Part IItem 1A. Risk FactorsItem 1B Unresolved Staff CommentsItem 3. Legal ProceedingsItem 4. ReservedPart IIItem 5. Market For The Registrant's Common Stock, Related Security Holder Matters and Issuer Repurchase Of Equity SecuritiesItem 6. Selected Financial DataItem 7. Management's Discussion and Analysis Of Financial Condition and Results Of OperationsItem 7A. Quantitative and Qualitative Disclosures About Market RiskItem 8. Financial StatementsItem 9. Changes in and Disagreements with Accountants on Accounting and Financial DisclosureItem 9A. Controls and ProceduresItem 9B. OtherPart IIIItem 10. Directors, Executive Officers and Corporate GovernanceItem 11. Executive CompensationItem 12. Security Ownership Of Certain Beneficial Owners and Management and Related Stockholder MattersItem 13. Certain Relationships, Related Party Transactions and Director IndependenceItem 14. Principal Accounting Fees and ServicesPart IVItem 15. Exhibits and Financial Statement Schedules