ADAMS RESOURCES & ENERGY, INC.
10-Ks and 10-Qs
|
|
|
|
|
|
|
|
|
|
|
|
|
|
|
|
|
|
|
|
|
|
|
|
|
|
|
|
|
|
|
|
|
|
|
|
|
|
|
|
|
|
|
|
UNITED STATES
SECURITIES AND EXCHANGE COMMISSION
Washington, D.C. 20549
FORM 10-K
(Mark One)
þ
ANNUAL REPORT PURSUANT TO SECTION 13 OR 15(d) OF
THE SECURITIES EXCHANGE ACT OF 1934
For the fiscal year ended
December 31, 2017
OR
o
TRANSITION REPORT PURSUANT TO SECTION 13 OR 15(d) OF
THE SECURITIES EXCHANGE ACT OF 1934
For the transition period from ___ to ___.
Commission file number: 1-7908
ADAMS RESOURCES & ENERGY, INC.
(
Exact name of Registrant as Specified in Its Charter)
|
DELAWARE
|
74-1753147
|
||
|
(State or Other Jurisdiction of
Incorporation or Organization)
|
(I.R.S. Employer Identification No.)
|
||
|
17 SOUTH BRIAR HOLLOW LANE, SUITE 100, HOUSTON, TEXAS 77027
|
|||
|
(Address of Principal Executive Offices) (Zip Code)
|
|||
|
(713) 881-3600
|
|||
|
(Registrant’s Telephone Number, Including Area Code)
|
|||
Securities registered pursuant to Section 12(b) of the Act:
|
Title of Each Class
|
Name of Each Exchange On Which Registered
|
|
Common Stock, $0.10 Par Value
|
NYSE MKT
|
Securities to be registered pursuant to Section 12(g) of the Act
: None.
Indicate by check mark if the registrant is a well-known seasoned issuer, as defined in Rule 405 of the Securities Act. Yes
o
No
þ
Indicate by check mark if the registrant is not required to file reports pursuant to Section 13 or Section 15(d) of the Act. Yes
o
No
þ
Indicate by check mark whether the registrant (1) has filed all reports required to be filed by Section 13 or 15(d) of the Securities Exchange Act of 1934 during the preceding 12 months (or for such shorter period that the registrant was required to file such reports), and (2) has been subject to such filing requirements for the past 90 days. Yes
þ
No
o
Indicate by check mark whether the registrant has submitted electronically and posted on its corporate Website, if any, every Interactive Data File required to be submitted and posted pursuant to Rule 405 of Regulation S-T during the preceding 12 months (or for such shorter period that the registrant was required to submit and post such files). Yes
þ
No
o
Indicate by check mark if disclosure of delinquent filers pursuant to Item 405 of Regulation S-K is not contained herein, and will not be contained, to the best of registrant’s knowledge, in definitive proxy or information statements incorporated by reference in Part III of this Form 10-K or any amendment to this Form 10-K.
þ
Indicate by check mark whether the registrant is a large accelerated filer, an accelerated filer, a non-accelerated filer, a smaller reporting company, or an emerging growth company. See definitions of “large accelerated filer,” “accelerated filer,” “smaller reporting company” and “emerging growth company” in Rule 12b-2 of the Exchange Act.
Large accelerated filer
o
Accelerated filer
þ
Non-accelerated filer
o
Smaller reporting company
o
Emerging growth company
o
If an emerging growth company, indicate by check mark if the registrant has elected not to use the extended transition period for complying with any new or revised financial accounting standards provided pursuant to Section 13(a) of the Exchange Act.
o
Indicate by check mark whether the registrant is a shell company (as defined in Rule 12b-2 of the Exchange Act). Yes
o
No
þ
The aggregate market value of the company’s voting and non-voting common shares held by non-affiliates as of the close of business on June 30, 2017 was
$88,123,994
based on the closing price of
$41.08
per one share of common stock as reported on the NYSE MKT for such date. There were
4,217,596
shares of Common Stock outstanding at
March 1, 2018
.
DOCUMENTS INCORPORATED BY REFERENCE
Portions of the Proxy Statement for the Annual Meeting of Stockholders to be held
May 8, 2018
are incorporated by reference into Part III of this report.
ADAMS RESOURCES & ENERGY, INC.
TABLE OF CONTENTS
|
Page
Number
|
||
2
CAUTIONARY STATEMENT REGARDING FORWARD-LOOKING INFORMATION
This annual report on Form 10-K for the year ended
December 31, 2017
(our “annual report”) contains various forward-looking statements and information that are based on our beliefs, as well as assumptions made by us and information currently available to us. When used in this document, words such as “anticipate,” “project,” “expect,” “plan,” “seek,” “goal,” “estimate,” “forecast,” “intend,” “could,” “should,” “would,” “will,” “believe,” “may,” “potential” and similar expressions and statements regarding our plans and objectives for future operations are intended to identify forward-looking statements. Although we believe that our expectations reflected in such forward-looking statements are reasonable, we cannot give any assurances that such expectations will prove to be correct. Forward-looking statements are subject to a variety of risks, uncertainties and assumptions as described in more detail under Part I, Item 1A of this annual report. If one or more of these risks or uncertainties materialize, or if underlying assumptions prove incorrect, our actual results may vary materially from those anticipated, estimated, projected or expected. You should not put undue reliance on any forward-looking statements. The forward-looking statements in this annual report speak only as of the date hereof. Except as required by federal and state securities laws, we undertake no obligation to publicly update or revise any forward-looking statements, whether as a result of new information, future events or any other reason.
Items 1 and 2.
Business and Properties.
General
Adams Resources & Energy, Inc. (“AE”) is a publicly traded Delaware corporation organized in 1973, the common shares of which are listed on the NYSE MKT LLC (“NYSE MKT”) under the ticker symbol “AE”. We and our subsidiaries are primarily engaged in the business of crude oil marketing, transportation and storage in various crude oil and natural gas basins in the lower 48 states of the United States (“U.S.”). We also conduct tank truck transportation of liquid chemicals and dry bulk and ISO tank container storage and transportation primarily in the lower 48 states of the U.S. with deliveries into Canada and Mexico, and with terminals in the Gulf Coast region of the U.S. Our headquarters are located in 27,932 square feet of office space located at 17 South Briar Hollow Lane, Suite 100, Houston, Texas 77027, and the telephone number of that address is (713) 881-3600. Unless the context requires otherwise, references to “we,” “us,” “our,” the “Company” or “AE” are intended to mean the business and operations of Adams Resources & Energy, Inc. and its consolidated subsidiaries.
Historically, we have operated and reported in three business segments: (i) crude oil marketing, transportation and storage, (ii) tank truck transportation of liquid chemicals and dry bulk and ISO tank container storage and transportation, and (iii) upstream crude oil and natural gas exploration and production. We exited the upstream crude oil and natural gas exploration and production business during 2017 with the sale of our upstream crude oil and natural gas exploration and production assets.
For detailed financial information regarding our business segments, see Note 8 in the Notes to Consolidated Financial Statements included under Part II, Item 8 of this annual report.
2017 Developments
Subsidiary Bankruptcy, Deconsolidation and Sale
On April 21, 2017, one of our wholly owned subsidiaries, Adams Resources Exploration Corporation (“AREC”), filed a voluntary petition in the United States Bankruptcy Court for the District of Delaware (the “Bankruptcy Court”) seeking relief under Chapter 11 of Title 11 of the United States Code (the “Bankruptcy Code”), Case No. 17-10866 (KG). AREC operated its business and managed its properties as “debtors-in-possession” under the jurisdiction of the Bankruptcy Court and in accordance with the applicable provisions of the Bankruptcy Code and order of the Bankruptcy Court. AE was the primary creditor in the Chapter 11 process.
3
During the second quarter of 2017, we recorded a non-cash charge of approximately $1.6 million associated with the deconsolidation of AREC, which reflected the excess of the net assets of AREC over its estimated fair value based on an expected sales transaction price of approximately $5.0 million, net of estimated transaction costs. During the third quarter of 2017, Bankruptcy Court approval was obtained on three asset purchase and sales agreements with three unaffiliated parties, and AREC closed on the sales of substantially all of its assets.
In October 2017, AREC submitted its liquidation plan to the Bankruptcy Court for approval. In connection with the sales of these assets and submission of the liquidation plan, we recognized an additional loss of $1.9 million during the third quarter of 2017, which represents the difference between the proceeds we expect to be paid upon settlement of the bankruptcy, net of anticipated remaining closing costs identified as part of the liquidation plan, and the book value of our cost method investment. In December 2017, we received proceeds of approximately $2.8 million from AREC related to the settlement of a portion of the bankruptcy process. We obtained approval of a confirmed plan in December 2017, and we expect the case to be dismissed during the first half of 2018. We anticipate receiving an additional $0.4 million in 2018 when the bankruptcy case is dismissed.
In connection with the bankruptcy filing, AREC entered into a Debtor in Possession Credit and Security Agreement (“DIP Credit Agreement”) with AE dated as of April 25, 2017, in an aggregate amount of up to $1.25 million. AREC borrowed approximately $0.4 million under the DIP Credit Agreement, and the amount was repaid during the third quarter of 2017 with proceeds from the sales of the assets. See Note 3 in the Notes to Consolidated Financial Statements for further information.
Voluntary Early Retirement Program
In August 2017, we implemented a voluntary early retirement program for certain employees, which resulted in an increase in personnel expenses of approximately $1.4 million. Of this amount, approximately $1.0 million was included in general and administrative expenses and $0.4 million was included in operating expenses.
Impairment of Investment in Unconsolidated Affiliate
During the third quarter of 2017, we completed a review of our investment in VestaCare, Inc. (“VestaCare”) and determined that there was an other than temporary impairment as the current projected operating results of VestaCare did not support the carrying value of our investment. As such, we recognized a pre-tax impairment charge of $2.5 million during the third quarter of 2017 related to our investment in VestaCare. See Note 7 in the Notes to Consolidated Financial Statements for further information.
Business Segments
Marketing
Our marketing segment consists of the operations of our wholly owned subsidiary, Gulfmark Energy, Inc. (“Gulfmark”). Our crude oil marketing activities generate revenue from the sale and delivery of crude oil purchased either directly from producers or from others on the open market. We purchase crude oil and arrange sales and deliveries to refiners and other customers, primarily onshore in Texas, Oklahoma, North Dakota, Michigan and Louisiana. Our marketing activities includes a fleet of approximately 144 tractor-trailer rigs, the majority of which we own and operate, used to transport crude oil. We also maintain over 164 pipeline inventory locations or injection stations. We have the ability to barge crude oil from four crude oil storage facilities along the Intercoastal Waterway of Texas and Louisiana, and we maintain approximately 425,000 barrels of storage capacity at the dock facilities in order to access waterborne markets for our products.
4
The following table shows the age of our owned and leased tractors and trailers within our marketing segment at December 31, 2017:
|
Tractors
(1)
|
Trailers
|
||||
|
Model Year:
|
|||||
|
2018
|
16
|
|
—
|
|
|
|
2017
|
4
|
|
—
|
|
|
|
2015
|
19
|
|
3
|
|
|
|
2014
|
39
|
|
23
|
|
|
|
2013
|
59
|
|
41
|
|
|
|
2012
|
7
|
|
14
|
|
|
|
2011
|
—
|
|
75
|
|
|
|
2008 and earlier
|
—
|
|
45
|
|
|
|
Total
|
144
|
|
201
|
|
|
____________________
|
(1)
|
Includes 15 tractors that we lease from a third party under a capital lease agreement. See Note 13 in the Notes to Consolidated Financial Statements for further information.
|
We purchase crude oil at the field (wellhead) level. Volume and price information were as follows for the periods indicated:
|
Year Ended December 31,
|
||||||||
|
2017
|
2016
|
2015
|
||||||
|
Field level purchase volumes – per day
(1)
|
||||||||
|
Crude oil – barrels
|
67,447
|
|
72,900
|
|
106,400
|
|
||
|
Average purchase price
|
||||||||
|
Crude oil – per barrel
|
$49.88
|
$39.30
|
$45.41
|
|||||
____________________
|
(1)
|
Reflects the volume purchased from third parties at the field level of operations.
|
Field level purchase volumes depict our day-to-day operations of acquiring crude oil at the wellhead, transporting crude oil, and delivering it to market sales points. We held crude oil inventory at a weighted average composite price as follows at the dates indicated (in barrels):
|
December 31,
|
||||||||||||||
|
2017
|
2016
|
2015
|
||||||||||||
|
Average
|
Average
|
Average
|
||||||||||||
|
Barrels
|
Price
|
Barrels
|
Price
|
Barrels
|
Price
|
|||||||||
|
Crude oil inventory
|
198,011
|
|
$61.57
|
255,146
|
|
$51.22
|
261,718
|
|
$29.31
|
|||||
We deliver physical supplies to refinery customers or enter into commodity exchange transactions from time to time to protect from a decline in inventory valuation. During the year ended December 31, 2017, we had sales to four customers that comprised 22.8 percent, 17.1 percent, 10.8 percent and 10.7 percent, respectively, of total consolidated revenues. We believe alternative market outlets for our commodity sales are readily available and a loss of any of these customers would not have a material adverse effect on our operations. See Note 14 in the Notes to Consolidated Financial Statements for further information regarding credit risk.
5
Operating results for our marketing segment are sensitive to a number of factors. These factors include commodity location, grades of product, individual customer demand for grades or location of product, localized market price structures, availability of transportation facilities, actual delivery volumes that vary from expected quantities, and the timing and costs to deliver the commodity to the customer.
Transportation
Our transportation segment consists of the operations of our wholly owned subsidiary, Service Transport Company (“STC”). STC transports liquid chemicals and, to a lesser extent, dry bulk on a “for hire” basis throughout the continental U.S., Canada and into Mexico. STC also provides ISO tank container storage and transportation for customers. Transportation services are provided to customers under multiple load contracts in addition to loads covered under STC’s standard price list.
The following table shows the age of our owned and leased tractors and trailers within our transportation segment at December 31, 2017:
|
Tractors
(1)
|
Trailers
|
||||
|
Model Year:
|
|||||
|
2016
|
30
|
|
52
|
|
|
|
2015
|
38
|
|
30
|
|
|
|
2014
|
1
|
|
35
|
|
|
|
2013
|
102
|
|
—
|
|
|
|
2012
|
70
|
|
30
|
|
|
|
2011
|
3
|
|
—
|
|
|
|
2008 and earlier
|
—
|
|
384
|
|
|
|
Total
|
244
|
|
531
|
|
|
____________________
|
(1)
|
Excludes 35 independent contractor tractors.
|
Miles traveled was as follows for the periods indicated (in thousands):
|
Year Ended December 31,
|
||||||||
|
2017
|
2016
|
2015
|
||||||
|
Mileage
|
21,835
|
|
22,611
|
|
25,205
|
|
||
STC also operates truck terminals in Houston, Corpus Christi, and Nederland, Texas, and Baton Rouge (St. Gabriel), Louisiana, St. Rose, Louisiana and Mobile (Saraland), Alabama. Transportation operations are headquartered at a terminal facility situated on 26.5 acres that we own in Houston, Texas. This property includes maintenance facilities, an office building, tank wash rack facilities and a water treatment system. The St. Gabriel, Louisiana terminal is situated on 11.5 acres that we own and includes an office building, maintenance bays and tank cleaning facilities. Pursuant to regulatory requirements, STC holds a Hazardous Materials Certificate of Registration issued by the U.S. Department of Transportation (“DOT”).
STC is a recognized certified partner with the American Chemistry Council’s Responsible Care Management System (“RCMS”); the scope of this RCMS certification covers the carriage of bulk liquids throughout STC’s area of operations as well as the tank trailer cleaning facilities and equipment maintenance. STC’s quality management process is one of its major assets. The practice of using statistical process control covering safety, on-time performance and customer satisfaction aids continuous improvement in all areas of quality service. The American Chemistry Responsible Care Partners serve the chemical industry and implement and monitor the seven Codes of Management Practices. The seven codes address compliance and continuing improvement in (1) Community Awareness and Emergency Response, (2) Pollution Prevention, (3) Process Safety, (4) Distribution, (5) Employee Health and Safety, (6) Product Stewardship, and (7) Security.
6
Investments in Unconsolidated Affiliates
We own an approximate 15 percent equity interest (less than 3 percent voting interest) in VestaCare, Inc., a California corporation (“VestaCare”), through Adams Resources Medical Management, Inc. (“ARMM”), a wholly owned subsidiary. We acquired our interest in VestaCare in April 2016 for a $2.5 million cash payment, which we impaired during the third quarter of 2017. VestaCare provides an array of software as a service (SaaS) electronic payment technologies to medical providers, payers and patients including VestaCare’s most recent product offering, VestaPay™. VestaPay™ allows medical care providers to structure fully automated and dynamically updating electronic payment plans for their patients. We do not currently have any plans to pursue additional medical-related investments. See Note 7 in the Notes to Consolidated Financial Statements for further information.
Competition
In all phases of our operations, we encounter strong competition from a number of entities. Many of these competitors possess financial resources substantially in excess of ours. We face competition principally in establishing trade credit, pricing of available materials and quality of service. Our marketing division competes with major crude oil companies and other large industrial concerns that own or control significant refining, midstream and marketing facilities. These major crude oil companies may offer their products to others on more favorable terms than those available to us.
Seasonality
In the trucking industry, revenue has historically followed a seasonal pattern for various commodities and customer businesses. Peak freight demand has historically occurred in the months of September, October and November. After the December holiday season and during the remaining winter months, freight volumes are typically lower as many customers reduce shipment levels. Operating expenses have historically been higher in the winter months primarily due to decreased fuel efficiency, increased cold weather-related maintenance costs of revenue equipment, and increased insurance claim costs attributable to adverse winter weather conditions. Revenue can also be impacted by weather, holidays and the number of business days that occur during a given period, as revenue is directly related to the available working days of shippers.
Although our marketing business is not materially affected by seasonality, certain aspects of our operations are impacted by seasonal changes, such as tropical weather conditions, energy demand in connection with heating and cooling requirements and the summer driving season.
Regulatory Matters
We are subject to an extensive variety of evolving federal, state and local laws, rules and regulations governing the storage, transportation, manufacture, use, discharge, release and disposal of product and contaminants into the environment, or otherwise relating to the protection of the environment. Below is a non-exclusive listing of the environmental laws that potentially impact our activities.
|
•
|
The Solid Waste Disposal Act, as amended by the Resource Conservation and Recovery Act of 1976, as amended.
|
|
•
|
The Clean Water Act of 1972, as amended.
|
|
•
|
The Clean Air Act of 1970, as amended.
|
|
•
|
The Toxic Substances Control Act of 1976, as amended.
|
|
•
|
The Emergency Planning and Community Right-to-Know Act.
|
|
•
|
The Occupational Safety and Health Act of 1970, as amended.
|
|
•
|
Texas Clean Air Act.
|
|
•
|
Texas Solid Waste Disposal Act.
|
|
•
|
Texas Water Code.
|
|
•
|
Texas Oil Spill Prevention and Response Act of 1991, as amended.
|
7
Railroad Commission of Texas (“RRC”)
The RRC regulates, among other things, the drilling and operation of crude oil and natural gas wells, the operation of crude oil and natural gas pipelines, the disposal of crude oil and natural gas production wastes, and certain storage of crude oil and natural gas. RRC regulations govern the generation, management and disposal of waste from these crude oil and natural gas operations and provide for the cleanup of contamination from crude oil and natural gas operations.
Louisiana Office of Conservation
The Louisiana Office of Conservation has primary statutory responsibility for regulation and conservation of crude oil, natural gas, and other natural resources in the State of Louisiana. Their objectives are to (i) regulate the exploration and production of crude oil, natural gas and other hydrocarbons, (ii) control and allocate energy supplies and distribution thereof, and (iii) protect public safety and the environment from oilfield waste, including the regulation of underground injection and disposal practices.
State and Local Government Regulation
Many states are authorized by the U.S. Environmental Protection Agency (“EPA”) to enforce regulations promulgated under various federal statutes. In addition, there are numerous other state and local authorities that regulate the environment, some of which impose more stringent environmental standards than federal laws and regulations. The penalties for violations of state law vary, but typically include injunctive relief and recovery of damages for injury to air, water or property as well as fines for non-compliance.
Trucking Activities
Our marketing and transportation businesses operate truck fleets pursuant to the authority of the DOT and various state authorities. Trucking operations must be conducted in accordance with various laws relating to pollution and environmental control as well as safety requirements prescribed by states and by the DOT. Matters such as weight and dimension of equipment are also subject to federal and state regulations. These regulations also require mandatory drug testing of drivers and require certain tests for alcohol levels in drivers and other safety personnel. The trucking industry is subject to possible regulatory and legislative changes, such as increasingly stringent environmental requirements or limits on vehicle weight and size. Regulatory change may affect the economics of the industry by requiring changes in operating practices or by changing the demand for private and common or contract carrier services or the cost of providing truckload services. In addition, our tank wash facilities are subject to increasingly stringent local, state and federal environmental regulations.
We have implemented security procedures for drivers and terminal facilities. Satellite tracking transponders installed in the power units are used to communicate emergencies to us and to maintain constant information as to the unit’s location. If necessary, our terminal personnel will notify local law enforcement agencies. In addition, we are able to advise a customer of the status and location of their loads. Remote cameras and enhanced lighting coverage in the staging and parking areas have augmented terminal security. We have a focus on safety in the communities in which we operate, including leveraging camera technology to enhance driver behavior and awareness.
Regulatory Status and Potential Environmental Liability
Our operations and facilities are subject to numerous federal, state and local environmental laws and regulations including those described above, as well as associated permitting and licensing requirements. We regard compliance with applicable environmental regulations as a critical component of our overall operation, and devote significant attention to providing quality service and products to our customers, protecting the health and safety of our employees, and protecting our facilities from damage. We believe we have obtained or applied for all permits and approvals required under existing environmental laws and regulations to operate our current business. We are not subject to any pending or threatened environmental litigation or enforcement actions which could materially and adversely affect our business.
8
We have, where appropriate, implemented operating procedures at each of our facilities designed to assure compliance with environmental laws and regulation. However, given the nature of our business, we are subject to environmental risks, and the possibility remains that our ownership of our facilities and our operations and activities could result in civil or criminal enforcement and public as well as private actions against us, which may necessitate or generate mandatory cleanup activities, revocation of required permits or licenses, denial of application for future permits, and/or significant fines, penalties or damages, any and all of which could have a material adverse effect on us. See “Item 1A.
Risk Factors
” for further discussion. At December 31, 2017, we are not aware of any unresolved environmental issues for which additional accounting accruals are necessary.
Employees
At December 31, 2017, we employed 575 persons. None of our employees are represented by a union. We believe our employee relations are satisfactory.
Federal and State Taxation
We are subject to the provisions of the Internal Revenue Code of 1986, as amended (the “Code”). In accordance with the Code, we computed our income tax provision based on a 35 percent tax rate for the year ended December 31, 2017. On December 22, 2017, the Tax Cut and Jobs Act was enacted into law resulting in a reduction in the federal corporate income tax rate from 35 percent to 21 percent for years beginning in 2018. We conduct a significant amount of business within the State of Texas. Texas operations are subject to a one-half percent state tax on its revenues net of cost of goods sold as defined by the state. We believe we are currently in compliance with all federal and state tax regulations.
Available Information
We electronically file certain documents with the U.S. Securities and Exchange Commission (“SEC”). We file annual reports on Form 10-K; quarterly reports on Form 10-Q; and current reports on Form 8-K (as appropriate); along with any related amendments and supplements thereto. You may read and copy any material we file with the SEC at the SEC’s Public Reference Room at 100 F Street, N.E., Washington, D.C. 20549. You may obtain information regarding the Public Reference Room by calling the SEC at (800) SEC-0330. In addition, the SEC maintains a website at
www.sec.gov
that contains reports and other information regarding registrants that file electronically with the SEC.
We also make available free of charge our Annual Reports on Form 10-K, Quarterly Reports on Form 10-Q, Current Reports on Form 8-K and any amendments to those reports filed or furnished pursuant to Section 13(a) or 15(d) of the Exchange Act, simultaneously with or as soon as reasonably practicable after filing such materials with, or furnishing such materials to, the SEC, and on our website
www.adamsresources.com
. The information on our website, or information about us on any other website, is not incorporated by reference into this report.
Item 1A.
Risk Factors
.
An investment in our common stock involves certain risks. If any of the following key risks were to occur, it could have a material adverse effect on our financial position, results of operations and cash flows. In any such circumstance and others described below, the trading price of our securities could decline and you could lose part or all of your investment.
9
Economic developments could damage our operations and materially reduce our profitability and cash flows.
Potential disruptions in the credit markets and concerns about global economic growth could have a significant adverse impact on global financial markets and commodity prices. These factors could contribute to a decline in our stock price and corresponding market capitalization. If commodity prices experience a period of rapid decline, or a prolonged period of low commodity prices, our future earnings will be reduced. We currently do not have bank debt obligations. If the capital and credit markets experience volatility and the availability of funds become limited, our customers and suppliers may incur increased costs associated with issuing commercial paper and/or other debt instruments and this, in turn, could adversely affect our ability to secure supply and make profitable sales.
General economic conditions could reduce demand for chemical based trucking services.
Customer demand for our products and services is substantially dependent upon the general economic conditions for the U.S., which are cyclical in nature. In particular, demand for liquid chemical truck transportation services is dependent on activity within the petrochemical sector of the U.S. economy. Chemical sector demand typically varies with the housing and auto markets as well as the relative strength of the U.S. dollar to foreign currencies. A relatively strong U.S. dollar exchange rate may be adverse to our transportation operation since it tends to suppress export demand for petrochemicals. Conversely, a weak U.S. dollar exchange rate tends to stimulate export demand for petrochemicals.
Our business is dependent on the ability to obtain trade and other credit
.
Our future development and growth depends, in part, on our ability to successfully obtain credit from suppliers and other parties. Trade credit arrangements are relied upon as a significant source of liquidity for capital requirements not satisfied by operating cash flow. If global financial markets and economic conditions disrupt and reduce stability in general, and the solvency of creditors specifically, the availability of funding from credit markets, would be reduced as many lenders and institutional investors would enact tighter lending standards, refuse to refinance existing debt on terms similar to current debt or, in some cases, cease to provide funding to borrowers. These issues coupled with weak economic conditions would make it more difficult for us, our suppliers and our customers to obtain funding. If we are unable to obtain trade or other forms of credit on reasonable and competitive terms, the ability to continue our marketing businesses, pursue improvements, and continue future growth will be limited. We cannot assure you that we will be able to maintain future credit arrangements on commercially reasonable terms.
Fluctuations in crude oil and natural gas prices could have an adverse effect on us
.
Our future financial condition, revenues, results of operations and future rate of growth are materially affected by crude oil and natural gas prices that historically have been volatile and are likely to continue to be volatile in the future. Crude oil and natural gas prices depend on factors outside of our control. These factors include:
|
•
|
supply and demand for crude oil and natural gas and expectations regarding supply and demand;
|
|
•
|
political conditions in other crude oil-producing countries, including the possibility of insurgency or war in such areas;
|
|
•
|
economic conditions in the U.S. and worldwide;
|
|
•
|
governmental regulations and taxation;
|
|
•
|
impact of energy conservation efforts;
|
|
•
|
the price and availability of alternative fuel sources;
|
|
•
|
weather conditions;
|
|
•
|
availability of local, interstate and intrastate transportation systems; and
|
|
•
|
market uncertainty.
|
10
The financial soundness of customers could affect our business and operating results.
Constraints in the financial markets and other macro-economic challenges that might affect the economy of the U.S. and other parts of the world could cause our customers to experience cash flow concerns. As a result, if our customers’ operating and financial performance deteriorates, or if they are unable to make scheduled payments or obtain credit, customers would not be able to pay, or may delay payment of, accounts receivable owed to us. Any inability of current and/or potential customers to pay for services may adversely affect our financial condition and results of operations.
Counterparty credit default could have an adverse effect on us.
Our revenues are generated under contracts with various counterparties, and our results of operations could be adversely affected by non-performance under the various contracts. A counterparty’s default or non-performance could be caused by factors beyond our control. A default could occur as a result of circumstances relating directly to the counterparty, or due to circumstances caused by other market participants having a direct or indirect relationship with the counterparty. We seek to mitigate the risk of default by evaluating the financial strength of potential counterparties; however, despite mitigation efforts, contractual defaults may occur from time to time.
Potentially escalating diesel fuel prices could have an adverse effect on us.
As an integral part of our marketing and transportation businesses, we operate approximately 390 truck-tractors, and diesel fuel costs are a significant component of our operating expenses. These costs generally fluctuate with increasing and decreasing world crude oil prices. During periods of high prices, we attempt to recoup rising diesel fuel costs through the pricing of our services; however to the extent these costs escalate, our operating earnings will generally be adversely affected.
Revenues are generated under contracts that must be renegotiated periodically.
Substantially all of our revenues are generated under contracts which expire periodically or which must be frequently renegotiated, extended or replaced. Whether these contracts are renegotiated, extended or replaced is often subject to factors beyond our control. These factors include sudden fluctuations in crude oil and natural gas prices, counterparty ability to pay for or accept the contracted volumes and, most importantly, an extremely competitive marketplace for the services we offer. We cannot assure you that the costs and pricing of our services can remain competitive in the marketplace or that we will be successful in renegotiating our contracts.
Anticipated or scheduled volumes will differ from actual or delivered volumes.
Our crude oil marketing business purchases initial production of crude oil at the wellhead under contracts requiring us to accept the actual volume produced. The resale of this production is generally under contracts requiring a fixed volume to be delivered. We estimate our anticipated supply and match that supply estimate for both volume and pricing formulas with committed sales volumes. Since actual wellhead volumes produced will never equal anticipated supply, our marketing margins may be adversely impacted. In many instances, any losses resulting from the difference between actual supply volumes compared to committed sales volumes must be absorbed by us.
Environmental liabilities and environmental regulations may have an adverse effect on us.
Our business is subject to environmental hazards such as spills, leaks or any discharges of petroleum products and hazardous substances. These environmental hazards could expose us to material liabilities for property damage, personal injuries, and/or environmental harms, including the costs of investigating and rectifying contaminated properties.
11
Environmental laws and regulations govern many aspects of our business, such as drilling and exploration, production, transportation and waste management. Compliance with environmental laws and regulations can require significant costs or may require a decrease in production. Moreover, noncompliance with these laws and regulations could subject us to significant administrative, civil, and/or criminal fines and/or penalties, as well as potential injunctive relief. See discussion under Item 1 and 2.
Business and Properties —
Regulatory Matters
, and in the sections that follow, for additional detail.
Our operations could result in liabilities that may not be fully covered by insurance
.
Transportation of hazardous materials involves certain operating hazards such as automobile accidents, explosions, fires and pollution. Any of these operating hazards could cause serious injuries, fatalities or property damage, which could expose us to liability. The payment of any of these liabilities could reduce, or even eliminate, the funds available for other areas.
Consistent with the industry standard, our insurance policies provide limited coverage for losses or liabilities relating to pollution, with broader coverage provided for sudden and accidental occurrences. Insurance might be inadequate to cover all liabilities. Obtaining insurance for our line of business can become difficult and costly. Typically, when insurance cost escalates, we may reduce our level of coverage, and more risk may be retained to offset cost increases. If substantial liability is incurred and damages are not covered by insurance or exceed policy limits, our operation and financial condition could be materially adversely affected.
We could be adversely affected by changes in tax laws or regulations
.
The Internal Revenue Service, the U.S. Treasury Department, Congress and the states frequently review federal or state income tax legislation. We cannot predict whether, when, or to what extent new federal or state tax laws, regulations, interpretations or rulings will be adopted. Any such legislative action may prospectively or retroactively modify tax treatment and, therefore, may adversely affect taxation of us.
The Tax Cuts and Jobs Act, signed into law on December 22, 2017, is expected to have a favorable impact on our effective tax rate and net income as reported under generally accepted accounting principles in the U.S. both in the first fiscal quarter of 2018 and subsequent reporting periods to which the Tax Cuts and Jobs Act is effective. However, given the many changes resulting from the Tax Cuts and Jobs Act, we are assessing the impact of the Tax Cuts and Jobs Act, and there can be no assurances that it will have a favorable impact. You should consult with your tax advisors with respect to the effect of the Tax Cuts and Jobs Act and any other regulatory or administrative developments and proposals and the potential effect on your investment in AE.
Our business is subject to changing government regulations
.
Federal, state or local government agencies may impose environmental, labor or other regulations that increase costs and/or terminate or suspend operations. Our business is subject to federal, state and local laws and regulations. These regulations relate to, among other things, transportation of crude oil and natural gas. Existing laws and regulations could be changed, and any changes could increase costs of compliance and costs of operations.
Security issues exist relating to drivers, equipment and terminal facilities.
We transport liquid combustible materials including petrochemicals, and these materials may be a target for terrorist attacks. While we employ a variety of security measures to mitigate risks, we cannot assure you that such events will not occur.
12
Current and future litigation could have an adverse effect on us.
We are currently involved in certain administrative and civil legal proceedings as part of the ordinary course of our business. Moreover, as incidental to operations, we sometimes become involved in various lawsuits and/or disputes. Lawsuits and other legal proceedings can involve substantial costs, including the costs associated with investigation, litigation and possible settlement, judgment, penalty or fine. Although we maintain insurance to mitigate these costs, we cannot assure you that costs associated with lawsuits or other legal proceedings will not exceed the limits of insurance policies. Our results of operations could be adversely affected if a judgment, penalty or fine is not fully covered by insurance.
Climate change legislation or regulations restricting emissions of “greenhouse gases” (“GHGs”) could result in increased operating costs and reduced demand for the crude oil and natural gas we produce, market and transport.
More stringent laws and regulations relating to climate change and GHGs may be adopted and could cause us to incur material expenses to comply with such laws and regulations. In the absence of comprehensive federal legislation on GHG emission control, the EPA attempted to require the permitting of GHG emissions; although the Supreme Court struck down the permitting requirements, it upheld the EPA’s authority to control GHG emissions when a permit is required due to emissions of other pollutants. The EPA also requires the reporting of GHG emissions from specified large GHG emission sources including onshore and offshore crude oil and natural gas production facilities and onshore crude oil and natural gas processing, transmission, storage and distribution facilities. Reporting of GHG emissions from such large facilities is required on an annual basis. We do not presently operate any such large GHG emission sources but, if we were to do so in the future, we would incur costs associated with evaluating and meeting this reporting obligation.
In May 2016, the EPA finalized rules to reduce methane emissions from new, modified or reconstructed sources in the crude oil and natural gas sector, although the rules are currently the subject of litigation and in June 2017, the EPA proposed a 2-year stay of the rules. The EPA announced in March 2016 that it also intends to reduce methane emissions for existing sources, but the EPA announced in March 2017 that it no longer intends to pursue regulation of methane emissions from existing sources. In November 2016, the Bureau of Land Management issued final rules to reduce methane emissions from venting, flaring, and leaks during crude oil and natural gas operations on public lands, although the present administration is proposing to delay the implementation dates applicable to requirements under these rules. Several states, are pursuing similar measures to regulate emissions of methane from new and existing sources within the crude oil and natural gas source category.
In addition, the U.S. Congress has considered legislation to reduce emissions of GHGs, and many states and regions have already taken legal measures to reduce or measure GHG emission levels, often involving the planned development of GHG emission inventories and/or regional cap and trade programs. Most of these cap and trade programs require major sources of emissions or major producers of fuels to acquire and surrender emission allowances. The number of allowances available for purchase is reduced each year in an effort to reduce overall GHG emissions, and the cost of these allowances could escalate significantly over time. In the markets in which we currently operate, our operations are not affected by such GHG cap and trade programs. On an international level, almost 200 nations agreed in December 2015 to an international climate change agreement in Paris, France that calls for countries to set their own GHG emissions targets and be transparent about the measures each country will use to achieve its GHG emissions targets. Although the present administration has announced its intention to withdraw from the Paris accord, several states and local governments remain committed to its principles in their effectuation of policy and regulations. It is not possible at this time to predict how or when the U.S. might impose restrictions on GHGs as a result of the international climate change agreement. The adoption and implementation of any legislation or regulatory programs imposing GHG reporting obligations on, or limiting emissions of GHGs from, our equipment and operations could require us to incur costs to reduce emissions of GHGs associated with our operations including costs to operate and maintain our facilities, install new emission controls on our facilities, acquire allowances to authorize our GHG emissions, pay any taxes related to GHG emissions, administer and manage a GHG emissions program. Such programs also could adversely affect demand for the crude oil and natural gas that we market and transport.
13
We are subject to risks associated with climate change.
In an interpretative guidance on climate change disclosures, the SEC indicates that climate change could have an effect on the severity of weather (including hurricanes and floods), sea levels, the arability of farmland, and water availability and quality. If such effects were to occur, our operations have the potential to be adversely affected. Potential adverse effects could include disruption of our marketing and transportation activities, including, for example, damages to our facilities from powerful winds or floods, or increases in our costs of operation or reductions in the efficiency of our operations, as well as potentially increased costs for insurance coverages in the aftermath of such effects. Significant physical effects of climate change could also have an indirect effect on our financing and operations by disrupting the transportation or process related services provided by companies or suppliers with whom we have a business relationship. In addition, the demand for and consumption of our products and services (due to change in both costs and weather patterns), and the economic health of the regions in which we operate, could have a material adverse effect on our business, financial condition, results of operations and cash flows. We may not be able to recover through insurance some or any of the damages, losses or costs that may result from potential physical effects of climate change.
Cyber-attacks or other disruptions to our information technology systems could lead to reduced revenue, increased costs, liability claims, fines or harm to our competitive position.
We are subject to cybersecurity risks and may incur increasing costs in connection with our efforts to enhance and ensure security and in response to actual or attempted cybersecurity attacks. Substantial aspects of our business depend on the secure operation of our computer systems and websites. Security breaches could expose us to a risk of loss, misuse, or interruption of sensitive and critical information and functions, including our own proprietary information and that of our customers, suppliers and employees. Such breaches could result in operational impacts, reputational harm, competitive disadvantage, litigation, regulatory enforcement actions, and liability. While we devote substantial resources to maintaining adequate levels of cybersecurity, we cannot assure you that we will be able to prevent all of the rapidly evolving types of cyberattacks. Actual or anticipated attacks and risks may cause us to incur increasing costs for technology, personnel and services to enhance security or to respond to occurrences.
We have programs, processes and technologies in place to attempt to prevent, detect, contain, respond to and mitigate security-related threats and potential incidents. We undertake ongoing improvements to our systems, connected devices and information-sharing products in order to minimize vulnerabilities, in accordance with industry and regulatory standards; however, because the techniques used to obtain unauthorized access change frequently and can be difficult to detect and anticipating, identifying or preventing these intrusions or mitigating them if and when they occur is challenging and makes us more vulnerable to cyber-attacks than other companies not similarly situated.
If our security measures are circumvented, proprietary information may be misappropriated, our operations may be disrupted, and our computers or those of our customers or other third parties may be damaged. Compromises of our security may result in an interruption of operations, violation of applicable privacy and other laws, significant legal and financial exposure, damage to our reputation, and a loss of confidence in our security measures.
Item 1B.
Unresolved Staff Comments
.
None.
14
Item 3.
Legal Proceedings
.
From time to time as incidental to our operations, we may become involved in various lawsuits and/or disputes. Primarily as an operator of an extensive trucking fleet, we are a party to motor vehicle accidents, workers’ compensation claims and other items of general liability as would be typical for the industry. We are currently unaware of any claims against us that are either outside the scope of insurance coverage or that may exceed the level of insurance coverage and could potentially represent a material adverse effect on our financial position or results of operations.
See Note 13 in the Notes to Consolidated Financial Statements for further discussion.
Item 4.
Mine Safety Disclosures
.
Not applicable.
|
Item 5.
|
Market for Registrant’s Common Stock, Related Stockholder Matters, and Issuer Purchases of Equity Securities.
|
Our common stock is traded on the NYSE MKT under the ticker symbol “AE”. As of February 28, 2018, there were approximately 140 shareholders of record of our common shares. The following table presents high and low sales prices for our common stock for the periods presented as reported by the NYSE MKT and the amount, record date and payment date of the quarterly cash dividends we paid on each of our common shares with respect to such periods.
|
Cash Dividend History
|
|||||||||
|
Price Ranges
|
Per
|
Record
|
Payment
|
||||||
|
High
|
Low
|
Share
|
Date
|
Date
|
|||||
|
2015
|
|||||||||
|
1st Quarter
|
$73.28
|
$47.31
|
$0.22
|
6/3/2015
|
6/17/2015
|
||||
|
2nd Quarter
|
$70.00
|
$39.00
|
$0.22
|
9/3/2015
|
9/17/2015
|
||||
|
3rd Quarter
|
$48.60
|
$38.88
|
$0.22
|
12/2/2015
|
12/16/2015
|
||||
|
4th Quarter
|
$46.86
|
$33.55
|
$0.22
|
3/11/2016
|
3/23/2016
|
||||
|
2016
|
|||||||||
|
1st Quarter
|
$43.00
|
$30.00
|
$0.22
|
6/3/2016
|
6/17/2016
|
||||
|
2nd Quarter
|
$44.27
|
$35.25
|
$0.22
|
9/6/2016
|
9/19/2016
|
||||
|
3rd Quarter
|
$39.47
|
$29.64
|
$0.22
|
12/5/2016
|
12/19/2016
|
||||
|
4th Quarter
|
$44.00
|
$35.17
|
$0.22
|
3/10/2017
|
3/24/2017
|
||||
|
2017
|
|||||||||
|
1st Quarter
|
$41.99
|
$34.23
|
$0.22
|
6/2/2017
|
6/16/2017
|
||||
|
2nd Quarter
|
$43.80
|
$35.64
|
$0.22
|
9/6/2017
|
9/20/2017
|
||||
|
3rd Quarter
|
$42.77
|
$32.80
|
$0.22
|
12/5/2017
|
12/19/2017
|
||||
|
4th Quarter
|
$50.59
|
$40.36
|
$0.22
|
3/9/2018
|
3/23/2018
|
||||
Issuer Purchases of Equity Securities
None.
15
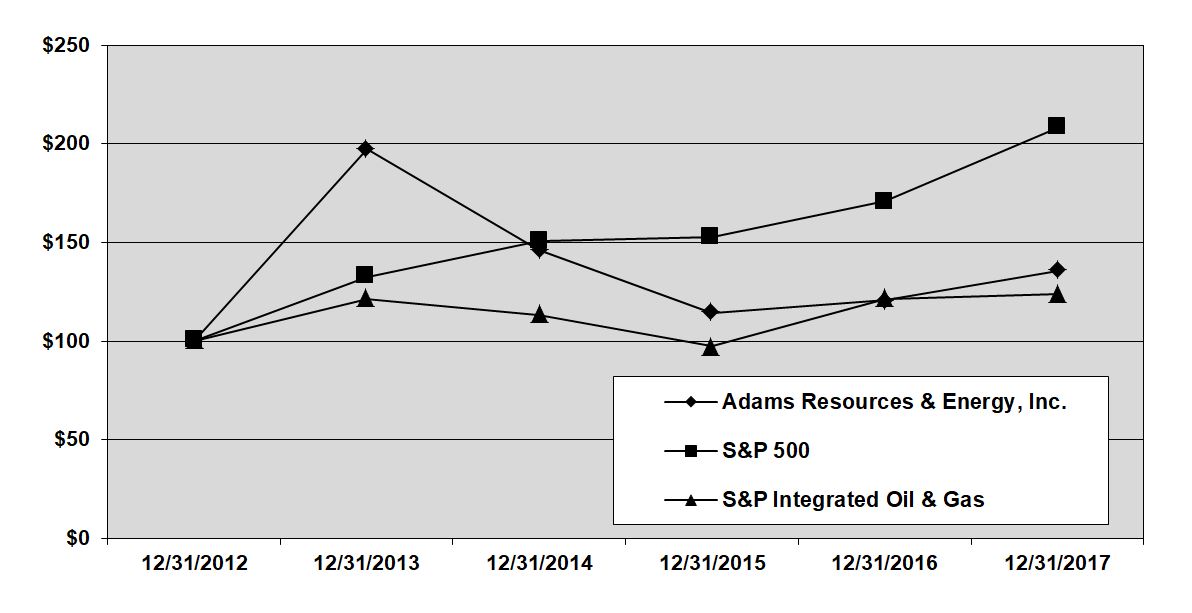
Performance Graph
The following graph compares the total shareholder return performance of our common stock with the performance of: (i) the Standard & Poor’s 500 Stock Index (“S&P 500”) and (ii) the S&P 500 Integrated Oil and Gas Index. The graph assumes that $100 was invested in our common stock and each comparison index beginning on December 31, 2012 and that all dividends were reinvested on a quarterly basis on the ex-dividend dates. The graph was prepared under the applicable rules of the SEC based on data supplied by Research Data Group. The stock performance shown on the graph is not necessarily indicative of future price performance.
|
December 31,
|
|||||||||||||||||||||||
|
2012
|
2013
|
2014
|
2015
|
2016
|
2017
|
||||||||||||||||||
|
Adams Resources & Energy, Inc.
|
$
|
100.00
|
|
$
|
197.45
|
|
$
|
146.15
|
|
$
|
114.46
|
|
$
|
120.99
|
|
$
|
135.74
|
|
|||||
|
S&P 500
|
100.00
|
|
132.39
|
|
150.51
|
|
152.59
|
|
170.84
|
|
208.14
|
|
|||||||||||
|
S&P Integrated Oil & Gas
|
100.00
|
|
121.53
|
|
113.35
|
|
97.64
|
|
121.21
|
|
123.73
|
|
|||||||||||
16
Item 6.
Selected Financial Data.
The following table presents our selected historical consolidated financial data. This information has been derived from and should be read in conjunction with our audited financial statements included under Part II, Item 8 of this annual report, which presents our audited balance sheets as of December 31, 2017 and 2016 and related consolidated statements of operations, cash flows and shareholders’ equity for the three years ended December 31, 2017, 2016 and 2015, respectively. As presented in the table, amounts are in thousands (except per share data).
|
Year Ended December 31,
|
|||||||||||||||||||
|
2017
|
2016
|
2015
|
2014
|
2013
|
|||||||||||||||
|
|
|||||||||||||||||||
|
Revenues:
|
|||||||||||||||||||
|
Marketing
|
$
|
1,267,275
|
|
$
|
1,043,775
|
|
$
|
1,875,885
|
|
$
|
4,050,497
|
|
$
|
3,863,057
|
|
||||
|
Transportation
|
53,358
|
|
52,355
|
|
63,331
|
|
68,968
|
|
68,783
|
|
|||||||||
|
Oil and natural gas
|
1,427
|
|
3,410
|
|
5,063
|
|
13,361
|
|
14,129
|
|
|||||||||
|
Total revenues
|
1,322,060
|
|
1,099,540
|
|
1,944,279
|
|
4,132,826
|
|
3,945,969
|
|
|||||||||
|
Costs and expenses:
|
|||||||||||||||||||
|
Marketing
|
1,247,763
|
|
1,016,733
|
|
1,841,893
|
|
4,020,017
|
|
3,815,006
|
|
|||||||||
|
Transportation
|
48,538
|
|
45,154
|
|
52,076
|
|
56,802
|
|
56,504
|
|
|||||||||
|
Oil and natural gas
|
948
|
|
2,084
|
|
6,931
|
|
7,817
|
|
6,117
|
|
|||||||||
|
Oil and natural gas property impairments
(1)
|
3
|
|
313
|
|
12,082
|
|
8,009
|
|
2,631
|
|
|||||||||
|
Oil and natural gas property sale
(2)
|
—
|
|
—
|
|
—
|
|
(2,528
|
)
|
—
|
|
|||||||||
|
General and administrative
|
9,707
|
|
10,410
|
|
9,939
|
|
8,613
|
|
9,060
|
|
|||||||||
|
Depreciation, depletion and amortization
|
13,599
|
|
18,792
|
|
23,717
|
|
24,615
|
|
22,275
|
|
|||||||||
|
Operating earnings (losses)
|
1,502
|
|
6,054
|
|
(2,359
|
)
|
9,481
|
|
34,376
|
|
|||||||||
|
Loss on deconsolidation of subsidiary
(3)
|
(3,505
|
)
|
—
|
|
—
|
|
—
|
|
—
|
|
|||||||||
|
Impairment of investment in unconsolidated
|
|||||||||||||||||||
|
affiliate
(4)
|
(2,500
|
)
|
—
|
|
—
|
|
—
|
|
—
|
|
|||||||||
|
Interest income (expense)
|
1,076
|
|
580
|
|
314
|
|
299
|
|
174
|
|
|||||||||
|
Earnings (losses) from continuing operations
|
(3,427
|
)
|
6,634
|
|
(2,045
|
)
|
9,780
|
|
34,550
|
|
|||||||||
|
Income tax (provision) benefit
|
2,945
|
|
(2,691
|
)
|
770
|
|
(3,561
|
)
|
(12,429
|
)
|
|||||||||
|
Earnings (losses) before investment in
|
|||||||||||||||||||
|
unconsolidated affiliate
|
|||||||||||||||||||
|
and discontinued operations
|
(482
|
)
|
3,943
|
|
(1,275
|
)
|
6,219
|
|
22,121
|
|
|||||||||
|
Discontinued operations, net of taxes
|
—
|
|
—
|
|
—
|
|
304
|
|
(511
|
)
|
|||||||||
|
Losses from investment in unconsolidated
|
|||||||||||||||||||
|
affiliate, net of tax
(5)
|
—
|
|
(1,430
|
)
|
—
|
|
—
|
|
—
|
|
|||||||||
|
Net (losses) earnings
|
$
|
(482
|
)
|
$
|
2,513
|
|
$
|
(1,275
|
)
|
$
|
6,523
|
|
$
|
21,610
|
|
||||
|
Earnings (losses) per share:
|
|||||||||||||||||||
|
From continuing operations
|
$
|
(0.11
|
)
|
$
|
0.94
|
|
$
|
(0.30
|
)
|
$
|
1.48
|
|
$
|
5.24
|
|
||||
|
From investment in unconsolidated
|
|||||||||||||||||||
|
affiliate
|
—
|
|
(0.34
|
)
|
—
|
|
—
|
|
—
|
|
|||||||||
|
From discontinued operations
|
—
|
|
—
|
|
—
|
|
0.07
|
|
(0.12
|
)
|
|||||||||
|
Basic and diluted earnings per share
|
$
|
(0.11
|
)
|
$
|
0.60
|
|
$
|
(0.30
|
)
|
$
|
1.55
|
|
$
|
5.12
|
|
||||
|
Dividends per common share
|
$
|
0.88
|
|
$
|
0.88
|
|
$
|
0.88
|
|
$
|
0.88
|
|
$
|
0.66
|
|
||||
17
|
December 31,
|
|||||||||||||||||||
|
2017
|
2016
|
2015
|
2014
|
2013
|
|||||||||||||||
|
|
|||||||||||||||||||
|
Cash
|
$
|
109,393
|
|
$
|
87,342
|
|
$
|
91,877
|
|
$
|
80,184
|
|
$
|
60,733
|
|
||||
|
Total assets
|
282,704
|
|
246,872
|
|
243,215
|
|
340,814
|
|
448,082
|
|
|||||||||
|
Long-term debt
|
—
|
|
—
|
|
—
|
|
—
|
|
—
|
|
|||||||||
|
Shareholders’ equity
|
147,119
|
|
151,312
|
|
152,510
|
|
157,497
|
|
154,685
|
|
|||||||||
|
Dividends on common shares
|
3,711
|
|
3,711
|
|
3,712
|
|
3,711
|
|
2,783
|
|
|||||||||
________________________
|
(1)
|
During 2015, we recognized an impairment of $10.3 million on producing properties, and an impairment of $1.8 million on non-producing properties.
|
|
(2)
|
During 2014, we sold certain crude oil and natural gas producing properties for $4.1 million, producing a net gain of $2.5 million.
|
|
(3)
|
During 2017, we recognized an impairment related to the bankruptcy, deconsolidation and sale of our upstream crude oil and natural gas exploration and production subsidiary.
|
|
(4)
|
During 2017, we recognized an impairment on our medical investment in VestaCare.
|
|
(5)
|
During 2016, we recognized losses and an impairment on our medical investment in Bencap LLC (“Bencap”). We have no other medical-related investments, and we currently do not have any plans to pursue additional medical-related investments.
|
18
Item 7.
Management’s Discussion and Analysis of Financial Condition and Results of Operations
.
The following information should be read in conjunction with our Consolidated Financial Statements and accompanying notes included under Part II, Item 8 of this annual report. Our financial statements have been prepared in accordance with generally accepted accounting principles (“GAAP”) in the United States (“U.S.”).
Overview of Business
Adams Resources & Energy, Inc. (“AE”), a Delaware corporation organized in 1973, and its subsidiaries are primarily engaged in the business of crude oil marketing, transportation and storage in various crude oil and natural gas basins in the lower 48 states of the U.S. We also conduct tank truck transportation of liquid chemicals and dry bulk and ISO tank container storage and transportation primarily in the lower 48 states of the U.S. with deliveries into Canada and Mexico, and with terminals in the Gulf Coast region of the U.S.
Historically, we have operated and reported in three business segments: (i) crude oil marketing, transportation and storage, (ii) tank truck transportation of liquid chemicals and dry bulk and ISO tank container storage and transportation, and (iii) upstream crude oil and natural gas exploration and production. We exited the upstream crude oil and natural gas exploration and production business during 2017 with the sale of our upstream crude oil and natural gas exploration and production assets.
2017 Developments
Subsidiary Bankruptcy, Deconsolidation and Sale
On April 21, 2017, one of our wholly owned subsidiaries, AREC, filed a voluntary petition in the U.S. Bankruptcy Court seeking relief under Chapter 11 of Title 11 of the Bankruptcy Code. AREC operated its business and managed its properties as “debtors-in-possession” under the jurisdiction of the Bankruptcy Court and in accordance with the applicable provisions of the Bankruptcy Code and order of the Bankruptcy Court. AE was the primary creditor in the Chapter 11 process.
During the second quarter of 2017, we recorded a non-cash charge of approximately $1.6 million associated with the deconsolidation of AREC, which reflected the excess of the net assets of AREC over its estimated fair value based on an expected sales transaction price of approximately $5.0 million, net of estimated transaction costs. During the third quarter of 2017, Bankruptcy Court approval was obtained on three asset purchase and sales agreements with three unaffiliated parties, and AREC closed on the sales of substantially all of its assets.
In October 2017, AREC submitted its liquidation plan to the Bankruptcy Court for approval. In connection with the sales of these assets and submission of the liquidation plan, we recognized an additional loss of $1.9 million during the third quarter of 2017, which represents the difference between the proceeds we expect to be paid upon settlement of the bankruptcy, net of anticipated remaining closing costs identified as part of the liquidation plan, and the book value of our cost method investment. In December 2017, we received proceeds of approximately $2.8 million from AREC related to the settlement of a portion of the bankruptcy process. We obtained approval of a confirmed plan in December 2017, and we expect the case to be dismissed during the first half of 2018. We anticipate receiving an additional $0.4 million in 2018 when the bankruptcy case is dismissed.
In connection with the bankruptcy filing, AREC entered into the DIP Credit Agreement with AE, which was repaid during the third quarter of 2017 with proceeds from the sales of the assets. See Note 3 in the Notes to Consolidated Financial Statements for further information.
19
Voluntary Early Retirement Program
In August 2017, we implemented a voluntary early retirement program for certain employees, which resulted in an increase in personnel expenses of approximately $1.4 million. Of this amount, approximately $1.0 million was included in general and administrative expenses and $0.4 million was included in operating expenses.
Impairment of Investment in Unconsolidated Affiliate
During the third quarter of 2017, we completed a review of our investment in VestaCare and determined that there was an other than temporary impairment as the current projected operating results of VestaCare did not support the carrying value of our investment. As such, we recognized a pre-tax impairment charge of $2.5 million during the third quarter of 2017 related to our investment in VestaCare. See Note 7 in the Notes to Consolidated Financial Statements for further information.
Results of Operations
Marketing
Our crude oil marketing segment revenues, operating earnings and selected costs were as follows for the periods indicated (in thousands):
|
Year Ended December 31,
|
|||||||||||||||||
|
2017
|
2016
|
Change
(1)
|
2015
|
Change
(1)
|
|||||||||||||
|
Revenues
|
$
|
1,267,275
|
|
$
|
1,043,775
|
|
21.4
|
%
|
$
|
1,875,885
|
|
(44.4
|
%)
|
||||
|
Operating earnings
|
11,700
|
|
17,045
|
|
(31.4
|
%)
|
22,895
|
|
(25.6
|
%)
|
|||||||
|
Depreciation and amortization
|
7,812
|
|
9,997
|
|
(21.9
|
%)
|
11,097
|
|
(9.9
|
%)
|
|||||||
|
Driver commissions
|
13,058
|
|
14,933
|
|
(12.6
|
%)
|
22,262
|
|
(32.9
|
%)
|
|||||||
|
Insurance
|
4,509
|
|
7,442
|
|
(39.4
|
%)
|
8,732
|
|
(14.8
|
%)
|
|||||||
|
Fuel
|
5,278
|
|
5,397
|
|
(2.2
|
%)
|
9,928
|
|
(45.6
|
%)
|
|||||||
____________________
|
(1)
|
Represents the percentage increase (decrease) from the prior year.
|
Volume and price information were as follows for the periods indicated:
|
Year Ended December 31,
|
|||||||||||
|
2017
|
2016
|
2015
|
|||||||||
|
Field level purchase volumes – per day
(1)
|
|||||||||||
|
Crude oil – barrels
|
67,447
|
|
72,900
|
|
106,400
|
|
|||||
|
Average purchase price
|
|||||||||||
|
Crude oil – per barrel
|
$
|
49.88
|
|
$
|
39.30
|
|
$
|
45.41
|
|
||
____________________
|
(1)
|
Reflects the volume purchased from third parties at the field level of operations.
|
2017 compared to 2016
. Crude oil marketing revenues increased by
$223.5 million
during the year ended December 31, 2017 as compared to 2016 primarily as a result of an increase in the market price of crude oil, which increased revenues by approximately $329.7 million, partially offset by lower crude oil volumes, which decreased revenues by approximately $106.2 million. The average crude oil price received was $39.30 for 2016, which increased to $49.88 for 2017.
20
Our marketing operating earnings for the year ended December 31, 2017 decreased by
$5.3 million
as compared to 2016, primarily as a result of declines in crude oil volumes, including declines as a result of the effects of Hurricane Harvey, which affected the Gulf Coast area in late August and early September 2017, as well as a narrowing of margins during 2017. Operating earnings were also impacted by inventory valuation changes (as shown in the table below) and the implementation in August 2017 of a voluntary early retirement program for certain employees, which resulted in an increase in personnel expenses of approximately $0.4 million. During the latter part of 2017, volumes began increasing as activity in certain marketing areas increased primarily as a result of increased wellhead purchases.
Driver commissions decreased by
$1.9 million
during the year ended December 31, 2017 as compared to 2016, primarily as a result of the decrease in crude oil marketing volumes in 2017. Insurance costs decreased by
$2.9 million
during the year ended December 31, 2017 as compared to 2016, primarily as a result of favorable driver safety performance and reduced mileage during 2017 as compared to 2016. Fuel costs decreased by
$0.1 million
during the year ended December 31, 2017 as compared to 2016 consistent with decreased marketing volumes and lower crude oil prices during 2016, offset by an increase in the price of diesel fuel during 2017 as compared to 2016.
2016 compared to 2015
. Crude oil marketing revenues decreased by
$832.1 million
during the year ended December 31, 2016 as compared to 2015, primarily as a result of lower crude oil volumes, which decreased revenues by approximately $475.5 million and a decrease in the market price of crude oil, which decreased revenues by approximately $356.6 million. The average crude oil price received was $45.41 for 2015, which decreased to $39.30 for 2016. Lower crude oil prices resulted in curtailed drilling efforts in most areas. Crude marketing volumes decreased as a result of lower wellhead purchases in 2016 as compared to 2015.
Our marketing segment operating earnings for the year ended December 31, 2016 decreased by
$5.9 million
as compared to 2015, primarily as a result of declines in crude oil volumes and a decrease in the market price of crude oil. Volume declines resulted from a decrease in wellhead purchases, partially offset by inventory valuation changes (as shown in the table below).
Driver commissions decreased by
$7.3 million
during the year ended December 31, 2016 as compared to 2015, primarily as a result of the decrease in crude oil marketing volumes. Insurance costs decreased by
$1.3 million
during the year ended December 31, 2016 as compared to 2015, primarily as a result of favorable driver safety performance during 2016 as compared to 2015. Fuel costs decreased by
$4.5 million
during the year ended December 31, 2016 as compared to 2015 consistent with decreased marketing volumes and lower crude oil prices during 2016 as compared to 2015.
Field Level Operating Earnings (Non-GAAP Financial Measure)
.
Inventory valuations and forward commodity contract (derivatives or mark-to-market) valuations are two significant factors affecting comparative crude oil marketing segment operating earnings. As a purchaser and shipper of crude oil, we hold inventory in storage tanks and third-party pipelines. During periods of increasing crude oil prices, we recognize inventory liquidation gains while during periods of falling prices, we recognize inventory liquidation and valuation losses.
Crude oil marketing operating earnings can be affected by the valuations of our forward month commodity contracts (derivative instruments). These non-cash valuations are calculated and recorded at each period end based on the underlying data existing as of such date. We generally enter into these derivative contracts as part of a pricing strategy based on crude oil purchases at the wellhead (field level). The valuation of derivative instruments at period end requires the recognition of non-cash “mark-to-market” gains and losses.
21
The impact of inventory liquidations and derivative valuations on our marketing segment operating earnings is summarized in the following reconciliation of our non-GAAP financial measure for the periods indicated (in thousands):
|
Year Ended December 31,
|
|||||||||||
|
2017
|
2016
|
2015
|
|||||||||
|
As reported segment operating earnings
(1)
|
$
|
11,700
|
|
$
|
17,045
|
|
$
|
22,895
|
|
||
|
Add (subtract):
|
|||||||||||
|
Inventory liquidation gains
|
(3,372
|
)
|
(8,243
|
)
|
—
|
|
|||||
|
Inventory valuation losses
|
—
|
|
—
|
|
5,357
|
|
|||||
|
Derivative valuation (gains) losses
|
27
|
|
(243
|
)
|
188
|
|
|||||
|
Field level operating earnings
(2)
|
$
|
8,355
|
|
$
|
8,559
|
|
$
|
28,440
|
|
||
____________________
|
(1)
|
Segment operating earnings included inventory liquidation gains of $3.3 million and $8.2 million for the years ended December 31, 2017 and 2016, respectively, and inventory valuation losses of $5.4 million for the year ended December 31, 2015.
|
|
(2)
|
The use of field level operating earnings is (a) unique to us, (b) not a substitute for a GAAP measure and (c) may not be comparable to any similar measures developed by industry participants. We utilize this data to evaluate the profitability of our operations.
|
Field level operating earnings and field level purchase volumes depict our day-to-day operation of acquiring crude oil at the wellhead, transporting the product and delivering the product to market sales points. Field level operating earnings decreased during the year ended December 31, 2017 as compared to 2016, primarily due to increased personnel costs related to the voluntary early retirement program, partially offset by increased volumes and the effects of a newly negotiated barge contract, which reduced operating expenses, beginning in the third quarter of 2017.
Field level operating earnings decreased during the year ended December 31, 2016 as compared to 2015 as competition and additional industry infrastructure development progressed in the region. A key factor in unit margins is the value difference between crude oil supplies in the mid-continent region of the U.S. versus crude oil supply costs in the eastern region of the U.S. We have been able to capture some of this value difference by shipping crude oil from the Texas Gulf Coast to other locations.
We held crude oil inventory at a weighted average composite price as follows at the dates indicated (in barrels):
|
December 31,
|
||||||||||||||||||||
|
2017
|
2016
|
2015
|
||||||||||||||||||
|
Average
|
Average
|
Average
|
||||||||||||||||||
|
Barrels
|
Price
|
Barrels
|
Price
|
Barrels
|
Price
|
|||||||||||||||
|
Crude oil inventory
|
198,011
|
|
$
|
61.57
|
|
255,146
|
|
$
|
51.22
|
|
261,718
|
|
$
|
29.31
|
|
|||||
Historically, prices received for crude oil have been volatile and unpredictable with price volatility expected to continue. See “Item 1A.
Risk Factors.
”
22
Transportation
Our transportation segment revenues, operating earnings (losses) and selected costs were as follows for the periods indicated (in thousands):
|
Year Ended December 31,
|
|||||||||||||||||
|
2017
|
2016
|
Change
(1)
|
2015
|
Change
(1)
|
|||||||||||||
|
Revenues
|
$
|
53,358
|
|
$
|
52,355
|
|
1.9
|
%
|
$
|
63,331
|
|
(17.3
|
%)
|
||||
|
Operating earnings (losses)
|
$
|
(544
|
)
|
$
|
(48
|
)
|
1033.3
|
%
|
$
|
3,701
|
|
(101.3
|
%)
|
||||
|
Depreciation and amortization
|
$
|
5,364
|
|
$
|
7,249
|
|
(26.0
|
%)
|
$
|
7,554
|
|
(4.0
|
%)
|
||||
|
Driver commissions
|
$
|
11,546
|
|
$
|
11,227
|
|
2.8
|
%
|
$
|
13,265
|
|
(15.4
|
%)
|
||||
|
Insurance
|
$
|
5,452
|
|
$
|
4,952
|
|
10.1
|
%
|
$
|
4,543
|
|
9.0
|
%
|
||||
|
Fuel
|
$
|
6,401
|
|
$
|
5,688
|
|
12.5
|
%
|
$
|
8,134
|
|
(30.1
|
%)
|
||||
|
Maintenance expense
|
$
|
6,061
|
|
$
|
5,410
|
|
12.0
|
%
|
$
|
6,365
|
|
(15.0
|
%)
|
||||
|
Mileage (000s)
|
21,836
|
|
22,611
|
|
(3.4
|
%)
|
25,205
|
|
(10.3
|
%)
|
|||||||
____________________
|
(1)
|
Represents the percentage increase (decrease) from the prior year.
|
Our revenue rate structure includes a component for fuel costs in which fuel cost fluctuations are largely passed through to the customer over time. Revenues, net of fuel cost, were as follows for the periods indicated (in thousands):
|
Year Ended December 31,
|
|||||||||||
|
2017
|
2016
|
2015
|
|||||||||
|
Total transportation revenue
|
$
|
53,358
|
|
$
|
52,355
|
|
$
|
63,331
|
|
||
|
Diesel fuel cost
|
(6,401
|
)
|
(5,688
|
)
|
(8,134
|
)
|
|||||
|
Revenues, net of fuel cost
(1)
|
$
|
46,957
|
|
$
|
46,667
|
|
$
|
55,197
|
|
||
____________________
|
(1)
|
Revenues, net of fuel cost, is a non-GAAP financial measure and is utilized for internal analysis of the results of our transportation segment.
|
2017 compared to 2016
. Revenues, net of fuel cost, increased by
$0.3 million
during the year ended December 31, 2017, primarily as a result of increased activity in our transportation segment. We began to see a slight increase in transportation activity during late 2017, and we continue to pursue our strategy of streamlining operations and diversifying offerings in our transportation segment. This increase in services resulted in an increase in variable expenses related to transportation activities. Fuel increased by
$0.7 million
as a result of an increase in the price of diesel during 2017 as compared to 2016. Our operating results for 2017 were also adversely impacted by Hurricane Harvey, which affected the Gulf Coast area in late August and early September of 2017, resulting in decreased revenues and lower mileage during 2017.
2016 compared to 2015
.
Revenues, net of fuel cost, decreased by
$8.5 million
during the year ended December 31, 2016 as compared to 2015, because of lower demand as indicated by the decreased mileage during 2016 as compared to 2015. The combination of lower demand and excess industry-wide trucking capacity led to pressures on volumes and freight rates throughout 2016. The result is an adverse impact on operating earnings. During 2016, we reduced expenses through staff reductions and selling of older inefficient equipment. Fuel decreased by
$2.4 million
as a result of lower mileage during 2016 as compared to 2015.
23
Equipment additions and retirement for the transportation fleet were as follows for the periods indicated:
|
Year Ended December 31,
|
||||||||
|
2017
|
2016
|
2015
|
||||||
|
New truck-tractors purchased
|
—
|
|
30 units
|
|
60 units
|
|
||
|
Truck-tractors retired
|
21 units
|
|
—
|
|
—
|
|
||
|
New trailers purchased
|
—
|
|
54 units
|
|
12 units
|
|
||
|
Trailers retired
|
—
|
|
50 units
|
|
—
|
|
||
The sale of retired equipment produced gains of less than $0.1 million, $0.4 million and less than $0.1 million during the years ended December 31, 2017, 2016 and 2015, respectively.
Our customers are primarily in the domestic petrochemical industry. Customer demand is affected by low natural gas prices (a basic feedstock cost for the petrochemical industry) and high export demand for petrochemicals. During 2016, the competitive landscape in the transportation sector remained difficult and led to lower revenues in this segment. During late 2017, we have seen an increase in customer demand for chemical tank trucking, and we are working on capturing those opportunities.
Oil and Gas
Our upstream crude oil and natural gas exploration and production segment revenues and operating earnings (losses) were primarily a function of crude oil and natural gas prices and volumes. We accounted for our upstream operations under the successful efforts method of accounting. As a result of AREC’s bankruptcy filing in April 2017 and our loss of control of this subsidiary, we deconsolidated AREC effective with its bankruptcy filing and recorded our investment in AREC under the cost method of accounting. Our results for 2017 are only through April 30, 2017, during the period in which AREC was consolidated.
Our upstream crude oil and natural gas exploration and production segment revenues, operating earnings (losses) and selected costs were as follows for the periods indicated (in thousands):
|
Year Ended December 31,
|
|||||||||||||||||
|
2017
|
2016
|
Change
(1)
|
2015
|
Change
(1)
|
|||||||||||||
|
Revenues
(2)
|
$
|
1,427
|
|
$
|
3,410
|
|
(58.2
|
%)
|
$
|
5,063
|
|
(32.6
|
%)
|
||||
|
Operating earnings (losses)
(2)
|
53
|
|
(533
|
)
|
109.9
|
%
|
(19,016
|
)
|
97.2
|
%
|
|||||||
|
Depreciation and depletion
(2)
|
423
|
|
1,546
|
|
(72.6
|
%)
|
5,066
|
|
(69.5
|
%)
|
|||||||
|
Dry hole expense
(2)
|
—
|
|
—
|
|
0.0
|
%
|
817
|
|
(100.0
|
%)
|
|||||||
|
Prospect impairments
(2)
|
3
|
|
283
|
|
(98.9
|
%)
|
1,758
|
|
(83.9
|
%)
|
|||||||
|
Producing property impairments
(2)
|
—
|
|
30
|
|
(100.0
|
%)
|
10,324
|
|
(99.7
|
%)
|
|||||||
____________________
|
(1)
|
Represents the percentage increase (decrease) from the prior year.
|
|
(2)
|
Results for 2017 represents amounts for the period from January 1, 2017 through April 30, 2017.
|
2017 compared to 2016
. Our upstream crude oil and natural gas exploration and production revenues and depreciation and depletion expense decreased $2.0 million and $1.1 million, respectively, during the year ended December 31, 2017 as compared to 2016. These decreases were primarily as a result of the deconsolidation of AREC effective with its bankruptcy filing in April 2017 (four months of revenues and expenses in 2017 versus twelve months of revenues and expenses in 2016) as well as production declines offsetting commodity price increases in 2017.
24
2016 compared to 2015
. Our upstream crude oil and natural gas exploration and production segment revenues and depreciation and depletion expense decreased $1.7 million and $3.5 million, respectively, during the year ended December 31, 2016 as compared to 2015, primarily as a result of production declines. Sales volumes decreased following normal production declines as persistently low prices curtailed the development of crude oil and natural gas properties in 2015 and 2016. Contributing to operating losses were property impairments as shown in the table above. Property impairments in 2015 occurred as result of declines in crude oil prices. Depreciation and depletion expense, calculated on a units-of-production basis, decreased primarily due to lower production volumes in 2016.
Volume and price information was as follows for the periods indicated (volumes in thousands):
|
Year Ended December 31,
|
|||||||||||
|
2017
|
2016
|
2015
|
|||||||||
|
|
|||||||||||
|
Crude oil
|
|||||||||||
|
Volume – barrels
(1)
|
11,643
|
|
34,200
|
|
50,000
|
|
|||||
|
Average price per barrel
|
$
|
49.44
|
|
$
|
38.07
|
|
$
|
46.51
|
|
||
|
Natural gas
|
|||||||||||
|
Volume – Mcf
(1)
|
189,488
|
|
662,000
|
|
889,000
|
|
|||||
|
Average price per Mcf
|
$
|
2.86
|
|
$
|
2.26
|
|
$
|
2.46
|
|
||
|
Natural gas liquids
|
|||||||||||
|
Volume – barrels
(1)
|
11,204
|
|
42,500
|
|
42,100
|
|
|||||
|
Average price per barrel
|
$
|
26.77
|
|
$
|
14.39
|
|
$
|
12.70
|
|
||
________________________________
|
(1)
|
Volumes for 2017 are only through April 30, 2017 as a result of the deconsolidation of this subsidiary due to its bankruptcy filing.
|
During the period from January 1, 2017 through April 30, 2017, we participated in the drilling of six wells in the Permian Basin and one well in the Haynesville Shale with no dry holes. During the year ended December 31, 2016, we participated in the drilling of seven wells in Permian Basin with no dry holes, and during the year ended December 31, 2015, we participated in the drilling of 14 wells with one dry hole.
During the years ended December 31, 2016 and 2015, impairment charges for crude oil and natural gas properties were approximately $0.3 million and $12.1 million, respectively.
Capitalized crude oil and natural gas property costs were amortized in expense as the underlying crude oil and natural gas reserves were produced (units-of-production method).
General and Administrative Expense
General and administrative expenses decreased by
$0.7 million
during the year ended December 31, 2017 as compared to 2016, primarily due to the deconsolidation of AREC in April 2017 (four months of expense in 2017 versus twelve months of expense in 2016), partially offset by an increase of approximately $1.0 million in personnel expenses in 2017 as a result of a voluntary early retirement program for certain employees, and higher legal and audit fees in 2017.
General and administrative expenses increased by
$0.5 million
during the year ended December 31, 2016 as compared to 2015, primarily as a result of increased use of outside consultants in the fourth quarter of 2016. Expenses in 2015 were higher due to a $1.1 million lump sum payment made during the first quarter of 2015 to our former President upon his retirement.
25
Investments in Unconsolidated Affiliates
During the second quarter of 2017, we deconsolidated AREC effective with its bankruptcy filing on April 21, 2017 and recorded our investment in AREC under the cost method of accounting. Based upon bids received in the auction process (see Note 3 in the Notes to Consolidated Financial Statements for further information), we determined that the fair value of our investment in AREC was expected to be lower than its net book value immediately prior to the deconsolidation. As a result, during the second quarter of 2017, we recorded a non-cash charge of $1.6 million associated with the deconsolidation of AREC, which reflected the excess of the net assets of AREC over its estimated fair value based on an expected sales transaction price of approximately $5.0 million, net of estimated transaction costs. During the third quarter of 2017, we recognized an additional loss of $1.9 million, which represents the difference between the proceeds we expect to be paid upon settlement of the bankruptcy, net of anticipated remaining closing costs identified as part of the liquidation plan, and the book value of our cost method investment.
During the third quarter of 2017, we completed a review of our investment in VestaCare and determined that there was an other than temporary impairment as the current projected operating results of VestaCare did not support the carrying value of our investment. As such, we recognized a pre-tax impairment charge of $2.5 million during the third quarter of 2017 related to our investment in VestaCare.
During the year ended December 31, 2016, we completed a review of our equity method investment in Bencap and determined that there was an other than temporary impairment. Under the terms of the investment agreement, Bencap had the option to request borrowings from us of up to $1.5 million (on or after December 5, 2016 but before October 31, 2018) that we were required to provide or forfeit our 30 percent member interest. During 2016, our management determined that we were unlikely to provide additional funding due to Bencap’s lower than projected revenue growth and operating losses since investment inception. During the third quarter of 2016, we recognized an after-tax net loss of $1.4 million to write-off our investment in Bencap, which included a pre-tax impairment charge of $1.7 million, pre-tax losses from the equity method investment of $0.5 million and a tax benefit of $0.8 million.
Income Taxes
Provision for (benefit from) income taxes is based upon federal and state tax rates, and variations in amounts are consistent with taxable income in the respective accounting periods.
On December 22, 2017, the Tax Cut and Jobs Act was enacted into law resulting in a reduction in the federal corporate income tax rate from 35 percent to 21 percent for years beginning in 2018. At December 31, 2017, we had a deferred tax liability of approximately
$3.3 million
(reflecting a reduction of approximately $2.0 million resulting from the lower rate under which those deferred taxes would be expected to be recovered or settled). As a result of the lower tax rate, we expect to see a decrease in either our provision for or benefit from income taxes during 2018 as compared to 2017.
See Note 11 in the Notes to Consolidated Financial Statements for further information.
26
Liquidity and Capital Resources
Liquidity
Our liquidity is from our cash balance and net cash provided by operating activities and is therefore dependent on the success of future operations. If our cash inflow subsides or turns negative, we will evaluate our investment plan and remain flexible.
One of our wholly owned subsidiaries, AREC, filed for bankruptcy in April 2017. Over the past few years, we have de-emphasized our upstream operations and do not expect this Chapter 11 filing by AREC to have a material adverse impact on any of our core businesses. In connection with its bankruptcy filing, AREC entered into the DIP Credit Agreement with AE. AREC borrowed approximately $0.4 million under the DIP Credit Agreement, and the amount was repaid during the third quarter of 2017 with proceeds from the sales of the assets. AE was the primary creditor in AREC’s Chapter 11 process. As a result of an auction process (see Note 1 in the Notes to Consolidated Financial Statements), AREC sold its assets for approximately $5.2 million during 2017. After settlement of certain claims in late 2017, AE received approximately $2.8 million from AREC. AE anticipates receiving an additional $0.4 million in 2018 when the bankruptcy case is dismissed.
At December 31, 2017, 2016 and 2015, we had no bank debt or other forms of debenture obligations. We maintain cash balances in order to meet the timing of day-to-day cash needs. Cash and working capital, the excess of current assets over current liabilities, were as follows at the dates indicated (in thousands):
|
December 31,
|
|||||||||||
|
2017
|
2016
|
2015
|
|||||||||
|
Cash and cash equivalents
|
$
|
109,393
|
|
$
|
87,342
|
|
$
|
91,877
|
|
||
|
Working capital
|
116,087
|
|
106,444
|
|
96,340
|
|
|||||
We maintain a stand-by letter of credit facility with Wells Fargo Bank, National Association to provide for the issuance of up to $60 million in stand-by letters of credit for the benefit of suppliers of crude oil within our crude oil marketing segment and for other purposes. Stand-by letters of credit are issued as needed and are canceled as the underlying purchase obligations are satisfied by cash payment when due. The issuance of stand-by letters of credit enables us to avoid posting cash collateral when procuring crude oil supply. We are currently using the letter of credit facility for a letter of credit related to our insurance program. At
December 31, 2017
, we had
$2.2 million
outstanding under this facility. During January 2018, the letter of credit amount outstanding decreased to approximately $0.9 million. No letter of credit amounts were outstanding at December 31,
2016
.
We believe current cash balances, together with expected cash generated from future operations, and the ease of financing truck and trailer additions through leasing arrangements (should the need arise) will be sufficient to meet our short-term and long-term liquidity needs.
We utilize cash from operations to make discretionary investments in our marketing and transportation businesses. With the exception of operating and capital lease commitments primarily associated with storage tank terminal arrangements, leased office space and tractors, our future commitments and planned investments can be readily curtailed if operating cash flows decrease. See “Other Items” below for information regarding our operating and capital lease obligations.
The most significant item affecting future increases or decreases in liquidity is earnings from operations, and these earnings are dependent on the success of future operations. See “Part I, Item 1A.
Risk Factors.
”
27
Cash Flows from Operating, Investing and Financing Activities
Our consolidated cash flows from operating, investing and financing activities were as follows for the periods indicated (in thousands):
|
Year Ended December 31,
|
|||||||||||
|
2017
|
2016
|
2015
|
|||||||||
|
Cash provided by (used in):
|
|||||||||||
|
Operating activities
|
$
|
26,096
|
|
$
|
6,944
|
|
$
|
25,477
|
|
||
|
Investing activities
|
(216
|
)
|
(7,768
|
)
|
(10,072
|
)
|
|||||
|
Financing activities
|
(3,829
|
)
|
(3,711
|
)
|
(3,712
|
)
|
|||||
Operating activities
. Net cash flows provided by operating activities for the year ended December 31, 2017 increased by
$19.2 million
when compared to 2016. This increase was primarily due to an increase in revenues, partially offset by increased operating and general and administrative expenses.
Net cash flows provided by operating activities for the year ended December 31, 2016 decreased by
$18.5 million
when compared to 2015. This decrease was primarily due to a decrease in revenues, partially offset by a decrease in operating and general and administrative expenses.
At various times each month, we may make cash prepayments and/or early payments in advance of the normal due date to certain suppliers of crude oil within our marketing operations. Crude oil supply prepayments are recouped and advanced from month to month as the suppliers deliver product to us. In addition, in order to secure crude oil supply, we may also “early pay” our suppliers in advance of the normal payment due date of the twentieth of the month following the month of production. These “early payments” reduce cash and accounts payable as of the balance sheet date. We also require certain customers to make similar early payments or to post cash collateral with us in order to support their purchases from us. Early payments and cash collateral received from customers increases cash and reduces accounts receivable as of the balance sheet date.
Early payments were as follows at the dates indicated (in thousands):
|
December 31,
|
|||||||||||
|
2017
|
2016
|
2015
|
|||||||||
|
Early payments received
|
$
|
20,078
|
|
$
|
15,032
|
|
$
|
16,770
|
|
||
|
Cash collateral received
|
—
|
|
—
|
|
840
|
|
|||||
|
Prepayments to suppliers
|
—
|
|
—
|
|
167
|
|
|||||
|
Early payments to suppliers
|
6,100
|
|
14,382
|
|
11,645
|
|
|||||
We rely heavily on our ability to obtain open-line trade credit from our suppliers especially with respect to our crude oil marketing operations. During the fourth quarter of 2016, we elected to make several early payments in our crude oil marketing operations. Our cash balance increased by approximately
$22.1 million
at December 31, 2017 relative to the year ended December 31, 2016 as the year end 2016 balance was slightly lower than normal as a result of these early payments made during the fourth quarter of 2016. Consistent with higher crude commodity prices, the need for early payments was higher at December 31, 2017 as compared to December 31, 2016 and 2015.
28
Investing activities
. Net cash flows used in investing activities for the year ended December 31, 2017 decreased by
$7.6 million
when compared to 2016. The decrease was primarily due to a
$5.8 million
decrease in capital spending for property and equipment (see table below), a
$4.7 million
decrease in investments in unconsolidated affiliates and the receipt of
$2.8 million
of proceeds related to the partial settlement of AREC’s bankruptcy, partially offset by a
$3.0 million
decrease in cash proceeds from the sales of assets. During 2016, we invested a total of
$4.7 million
in two medical-related investments, VestaCare and Bencap.
Net cash flows used in investing activities for the year ended December 31, 2016 decreased by
$2.3 million
when compared to 2015. The decrease was primarily due to a
$2.6 million
decrease in capital spending for property and equipment (see table below) and a
$3.0 million
increase in cash proceeds from the sales of assets, partially offset by a
$4.7 million
increase in investments in unconsolidated affiliates, as discussed above.
Financing activities
. Cash used in financing activities for the year ended December 31, 2017 increased by
$0.1 million
when compared to 2016 and 2015. During each of the years ended December 31, 2017, 2016 and 2015, we paid a quarterly cash dividend of $0.22 per common share ($0.88 per common share per year), or
$3.7 million
. During 2017, we paid
$0.1 million
of principal repayments on capital lease obligations that we entered into in 2017 for certain of our tractors in our marketing segment, with principal contractual commitments to be paid over a period of five years.
Capital Projects
We use cash from operations and existing cash balances to make discretionary investments in our marketing and transportation businesses. Capital spending for the past five years was as follows for the periods indicated (in thousands):
|
Year Ended December 31,
|
|||||||||||||||||||
|
2017
|
2016
|
2015
|
2014
|
2013
|
|||||||||||||||
|
Crude oil marketing
(1)
|
$
|
468
|
|
$
|
1,321
|
|
$
|
2,126
|
|
$
|
13,598
|
|
$
|
11,343
|
|
||||
|
Truck transportation
|
351
|
|
6,868
|
|
6,579
|
|
8,994
|
|
3,165
|
|
|||||||||
|
Oil and natural gas exploration
|
1,825
|
|
295
|
|
2,369
|
|
7,931
|
|
13,094
|
|
|||||||||
|
Medical management
|
—
|
|
4,700
|
|
—
|
|
—
|
|
—
|
|
|||||||||
|
Capital spending
|
$
|
2,644
|
|
$
|
13,184
|
|
$
|
11,074
|
|
$
|
30,523
|
|
$
|
27,602
|
|
||||
_______________
|
(1)
|
Our marketing segment amount for 2017 does not include approximately
$1.8 million
of tractors acquired under capital leases.
|
Our crude oil marketing segment spending levels were consistent during 2013 and 2014 and were backed by crude oil prices remaining strong, in the $90 – $100 per barrel range. In late 2014, crude oil prices fell and we curtailed spending during 2015, 2016 and 2017.
In our transportation segment, 2013 was stable with an increase in expenditures in 2014 to add capacity tracking with the petrochemical industry expansion efforts. However, in late 2015 and continuing into 2016 and 2017, demand for truck services weakened. The major project for 2016 was improvements to the existing Houston terminal facility. We are seeing increased demand in our transportation segment in 2017 and have plans to grow this segment in 2017.
We exited the crude oil and natural gas exploration and production business with the bankruptcy filing and subsequent sale of our crude oil and natural gas assets. We currently do not have any plans to pursue additional medical-related investments.
29
Other Items
Contractual Obligations
The following table summarizes our significant contractual obligations at December 31, 2017 (in thousands):
|
Payments due by period
|
|||||||||||||||||||
|
Total
|
Less than 1 year
|
1-3 years
|
3-5 years
|
More than 5 years
|
|||||||||||||||
|
Capital lease obligations
(1)
|
$
|
1,847
|
|
$
|
398
|
|
$
|
796
|
|
$
|
653
|
|
$
|
—
|
|
||||
|
Operating lease obligations
(2)
|
3,407
|
|
2,758
|
|
531
|
|
95
|
|
23
|
|
|||||||||
|
Purchase obligations
(3)
|
123,238
|
|
123,238
|
|
—
|
|
—
|
|
—
|
|
|||||||||
|
Total contractual obligations
|
$
|
128,492
|
|
$
|
126,394
|
|
$
|
1,327
|
|
$
|
748
|
|
$
|
23
|
|
||||
___________________
|
(1)
|
Amounts represent our principal contractual commitments, including interest, outstanding under capital leases we entered into during 2017 for certain tractors in our marketing segment.
|
|
(2)
|
Amounts represent rental obligations under non-cancelable operating leases and terminal arrangements with terms in excess of one year.
|
|
(3)
|
Amount represents commitments to purchase certain quantities of crude oil substantially in January 2018 in connection with our crude oil marketing activities. These commodity purchase obligations are the basis for commodity sales, which generate the cash flow necessary to meet such purchase obligations.
|
In January 2018, we entered into a new lease agreement with a seven year term for storage tanks and other related assets in the Port of Victoria area of Texas in our crude oil marketing segment. Annual commitments for the years ended December 31, 2018 through 2025 will be approximately $1.5 million per year, for a total of approximately $10.1 million.
We maintain certain lease arrangements with independent truck owner-operators for use of their equipment and driver services on a month-to-month basis. In addition, we enter into office space and certain lease and terminal access contracts in order to provide tank storage and dock access for our crude oil marketing business. These storage and access contracts require certain minimum monthly payments for the term of the contracts. Rental expense was as follows for the periods indicated (in thousands):
|
Year Ended December 31,
|
|||||||||||
|
2017
|
2016
|
2015
|
|||||||||
|
Rental expense
|
$
|
12,073
|
|
$
|
11,314
|
|
$
|
11,168
|
|
||
Insurance
Our primary insurance needs are workers’ compensation, automobile and umbrella liability coverage for our trucking fleet and medical insurance for our employees. Insurance costs were as follows for the periods indicated (in thousands):
|
Year Ended December 31,
|
|||||||||||
|
2017
|
2016
|
2015
|
|||||||||
|
Insurance costs
|
$
|
10,438
|
|
$
|
13,330
|
|
$
|
15,570
|
|
||
Off-Balance Sheet Arrangements
We have no off-balance sheet arrangements that have or are reasonably expected to have a material current or future effect on our financial position, results of operations or cash flows.
30
Related Party Transactions
For information regarding our related party transactions, see Note 9 of the Notes to Consolidated Financial Statements included under Part II, Item 8 of this annual report.
Recent Accounting Developments
For information regarding recent accounting developments, see Note 2 of the Notes to Consolidated Financial Statements included under Part II, Item 8 of this annual report.
Outlook
We took various steps to streamline our business in 2017, which we anticipate will lead to increased margins in both of our core segments during 2018. Our focus in 2018 will be on expanding our core businesses and working on strategic business development. In spite of recovering crude oil prices and increased production in our crude oil gathering and marketing core areas, margins remain tight. Competition with peers and with pipeline direct connects to lease production remains challenging.
Our major objectives for 2018 are as follows:
|
•
|
Marketing – We will have a focus on increasing margins to maximize cash flow, capturing midstream opportunities associated with increasing rig counts, drilling and completion activity in the U.S.
|
|
•
|
Transportation – We plan to increase truck utilization, upgrade fleet quality and enhance driver retention and recruitment. The transportation segment is uniquely positioned to take advantage of major downstream infrastructure projects that are taking place across the Gulf Coast.
|
|
•
|
Strategic business development – We will deploy a disciplined investment approach to growth in our two core segments and funding new growth opportunities that are adjacent and complimentary to existing operating activities.
|
Critical Accounting Policies and Estimates
In our financial reporting processes, we employ methods, estimates and assumptions that affect the reported amounts of assets and liabilities and disclosure of contingent assets and liabilities as of the date of our financial statements. These methods, estimates and assumptions also affect the reported amounts of revenues and expenses for each reporting period. Investors should be aware that actual results could differ from these estimates if the underlying assumptions prove to be incorrect. The following sections discuss the use of estimates within our critical accounting policies and estimates.
Fair Value Accounting
We enter into certain forward commodity contracts that are required to be recorded at fair value, and these contracts are recorded as either an asset or liability measured at its fair value. Changes in fair value are recognized immediately in earnings unless the derivatives qualify for, and we elect, cash flow hedge accounting. We had no contracts designated for hedge accounting during the years ended December 31, 2017, 2016 and 2015.
31
We utilize a market approach to valuing our commodity contracts. On a contract by contract, forward month by forward month basis, we obtain observable market data for valuing our contracts that typically have durations of less than 18 months. At December 31, 2017, all of our market value measurements were based on inputs based on observable market data (Level 2 inputs). See discussion under “Fair Value Measurements” in Note 10 to the Consolidated Financial Statements.
Our fair value contracts give rise to market risk, which represents the potential loss that may result from a change in the market value of a particular commitment. We monitor and manage our exposure to market risk to ensure compliance with our risk management policies. These risk management policies are regularly assessed to ensure their appropriateness given our objectives, strategies and current market conditions.
Trade Accounts and Allowance for Doubtful Accounts
Our trade accounts receivable has high volume and complexity of transactions and a high degree of interdependence with third parties. We manage our receivables by participating in a monthly settlement process with each of our counterparties. Ongoing account balances are monitored monthly, and we attempt to gain the cooperation of our counterparties to reconcile outstanding balances. We also place great emphasis on collecting cash balances due and paying only bonafide and properly supported claims. In addition, we maintain and monitor our bad debt allowance. We perform credit evaluations of our customers and grant credit based on past payment history, financial conditions and anticipated industry conditions. Customer payments are regularly monitored and a provision for doubtful accounts is established based on specific situations and overall industry conditions. However, a degree of risk remains due to the custom and practices of the industry. See Note 2 in the Notes to Consolidated Financial Statements for further information.
Liability and Contingency Accruals
From time to time as incidental to our operations, we become involved in various accidents, lawsuits and/or disputes. As an operator of an extensive trucking fleet, we are a party to motor vehicle accidents, worker compensation claims or other items of general liability as are typical for the industry. In addition, we have extensive operations that must comply with a wide variety of tax laws, environmental laws and labor laws, among others. Should an incident occur, we evaluate the claim based on its nature, the facts and circumstances and the applicability of insurance coverage. When our assessment indicates that it is probable that a liability has occurred and the amount of the liability can be reasonably estimated, we make appropriate accruals or disclosure. We base our estimates on all known facts at the time and our assessment of the ultimate outcome, including consultation with external experts and counsel. We revise these estimates as additional information is obtained or resolution is achieved.
At December 31, 2017, we were not aware of any contingencies or liabilities that would have a material adverse effect on our financial position, results of operations or cash flows.
Revenue Recognition
Our crude oil marketing customers are invoiced monthly based on contractually agreed upon terms. Revenue is recognized in the month in which the physical product is delivered to the customer. Where required, we also recognize fair value or mark-to-market gains and losses related to its commodity activities. See discussion under “Revenue Recognition” in Note 2 to the Consolidated Financial Statements. Transportation segment customers are invoiced, and the related revenue is recognized as the service is provided.
See Note 2 in the Notes to Consolidated Financial Statements for a discussion regarding our adoption on January 1, 2018 of the new accounting standard related to revenue recognition.
32
Item 7A.
Quantitative and Qualitative Disclosures about Market Risk
In the normal course of business, we are exposed to certain risks, including changes in interest rates and commodity prices.
Commodity Price Risk
Our major market risk exposure is in the pricing applicable to our marketing and production of crude oil and natural gas. Realized pricing is primarily driven by the prevailing spot prices applicable to crude oil and natural gas. Commodity price risk in our marketing operations represents the potential loss that may result from a change in the market value of an asset or a commitment. From time to time, we enter into forward contracts to minimize or hedge the impact of market fluctuations on our purchases of crude oil and natural gas. In each instance, we lock in a separate matching price support contract with a third party in order to minimize the risk of these financial instruments. Substantially all forward contracts fall within a six-month to eighteen-month term with no contracts extending longer than two years in duration.
Certain forward contracts are recorded at fair value, depending on our assessments of numerous accounting standards and positions that comply with GAAP in the U.S. The fair value of these contracts is reflected in the balance sheet as fair value assets and liabilities and any revaluation is recognized on a net basis in our results of operations (see Note 2 to the Consolidated Financial Statements for further information).
Historically, prices received for crude oil and natural gas sales have been volatile and unpredictable with price volatility expected to continue. From January 1, 2016 through December 31, 2017, our crude oil monthly average wholesale purchase costs ranged from an average low of $26.26 per barrel to a monthly average high of $60.16 per barrel during the same period. A hypothetical ten percent additional adverse change in average hydrocarbon prices, assuming no changes in volume levels, would have reduced earnings by approximately $1.2 million and $1.6 million for the years ended December 31, 2017 and 2016, respectively.
33
Item 8.
Financial Statements and Supplementary Data
.
ADAMS RESOURCES & ENERGY, INC. AND SUBSIDIARIES
INDEX TO CONSOLIDATED FINANCIAL STATEMENTS
|
Page No.
|
|
|
Reports of Independent Registered Public Accounting Firms
|
|
|
Consolidated Balance Sheets as of December 31, 2017 and 2016
|
|
|
Consolidated Statements of Operations
for the Years Ended December 31, 2017, 2016 and 2015 |
|
|
Consolidated Statements of Cash Flows
for the Years Ended December 31, 2017, 2016 and 2015 |
|
|
Consolidated Statements of Shareholders’ Equity
for the Years Ended December 31, 2017, 2016 and 2015 |
|
|
Notes to Consolidated Financial Statements
|
|
|
Note 1 – Organization and Basis of Presentation
|
|
|
Note 2 – Summary of Significant Accounting Policies
|
|
|
Note 3 – Subsidiary Bankruptcy, Deconsolidation and Sale
|
|
|
Note 4 – Prepayments and Other Current Assets
|
|
|
Note 5 – Property and Equipment
|
|
|
Note 6 – Cash Deposits and Other Assets
|
|
|
Note 7 – Investments in Unconsolidated Affiliates
|
|
|
Note 8 – Segment Reporting
|
|
|
Note 9 – Transactions with Affiliates
|
|
|
Note 10 – Derivative Instruments and Fair Value Measurements
|
|
|
Note 11 – Income Taxes
|
|
|
Note 12 – Supplemental Cash Flow Information
|
|
|
Note 13 – Commitments and Contingencies
|
|
|
Note 14 – Concentration of Credit Risk
|
|
|
Note 15 – Quarterly Financial Information (Unaudited)
|
|
|
Note 16 – Oil and Gas Producing Activities (Unaudited)
|
|
34
REPORT OF INDEPENDENT REGISTERED PUBLIC ACCOUNTING FIRM
To the Shareholders and Board of Directors
Adams Resources & Energy, Inc.
Opinion on the Consolidated Financial Statements
We have audited the accompanying consolidated balance sheet of Adams Resources & Energy, Inc. and subsidiaries (the “Company”) as of December 31, 2017, the related consolidated statements of operations, shareholders’ equity, and cash flows for the year ended December 31, 2017, and the related notes (collectively, the “consolidated financial statements”). In our opinion, the consolidated financial statements present fairly, in all material respects, the financial position of the Company as of December 31, 2017, and the results of its operations and its cash flows for the year ended December 31, 2017, in conformity with U.S. generally accepted accounting principles.
We also have audited, in accordance with the standards of the Public Company Accounting Oversight Board (United States) (PCAOB), the Company’s internal control over financial reporting as of December 31, 2017, based on criteria established in
Internal Control – Integrated Framework (2013)
issued by the Committee of Sponsoring Organizations of the Treadway Commission, and our report dated
March 12, 2018
expressed an unqualified opinion on the effectiveness of the Company’s internal control over financial reporting.
Basis for Opinion
These consolidated financial statements are the responsibility of the Company’s management. Our responsibility is to express an opinion on these consolidated financial statements based on our audits. We are a public accounting firm registered with the PCAOB and are required to be independent with respect to the Company in accordance with the U.S. federal securities laws and the applicable rules and regulations of the Securities and Exchange Commission and the PCAOB.
We conducted our audits in accordance with the standards of the PCAOB. Those standards require that we plan and perform the audit to obtain reasonable assurance about whether the consolidated financial statements are free of material misstatement, whether due to error or fraud. Our audits included performing procedures to assess the risks of material misstatement of the consolidated financial statements, whether due to error or fraud, and performing procedures that respond to those risks. Such procedures included examining, on a test basis, evidence regarding the amounts and disclosures in the consolidated financial statements. Our audits also included evaluating the accounting principles used and significant estimates made by management, as well as evaluating the overall presentation of the consolidated financial statements. We believe that our audits provide a reasonable basis for our opinion.
/s/ KPMG LLP
We have served as the Company’s auditor since 2017.
Houston, Texas
March 12, 2018
35
REPORT OF INDEPENDENT REGISTERED PUBLIC ACCOUNTING FIRM
To the Board of Directors and Stockholders of
Adams Resources & Energy, Inc.
Houston, Texas
We have audited the accompanying consolidated balance sheet of Adams Resources & Energy, Inc. and subsidiaries (the “Company”) as of December 31, 2016, and the related consolidated statements of operations, shareholders’ equity, and cash flows for each of the two years in the period ended December 31, 2016. These financial statements are the responsibility of the Company’s management. Our responsibility is to express an opinion on these financial statements based on our audits.
We conducted our audits in accordance with the standards of the Public Company Accounting Oversight Board (United States). Those standards require that we plan and perform the audit to obtain reasonable assurance about whether the financial statements are free of material misstatement. An audit includes examining, on a test basis, evidence supporting the amounts and disclosures in the financial statements. An audit also includes assessing the accounting principles used and significant estimates made by management, as well as evaluating the overall financial statement presentation. We believe that our audits provide a reasonable basis for our opinion.
In our opinion, such consolidated financial statements present fairly, in all material respects, the financial position of Adams Resources & Energy, Inc. and subsidiaries as of December 31, 2016, and the results of their operations and their cash flows for each of the two years in the period ended December 31, 2016, in conformity with accounting principles generally accepted in the United States of America.
/s/ DELOITTE & TOUCHE LLP
Houston, Texas
March 31, 2017
36
ADAMS RESOURCES & ENERGY, INC. AND SUBSIDIARIES
CONSOLIDATED BALANCE SHEETS
(In thousands)
|
December 31,
|
||||||||
|
2017
|
2016
|
|||||||
|
ASSETS
|
||||||||
|
Current assets:
|
||||||||
|
Cash and cash equivalents
|
$
|
109,393
|
|
$
|
87,342
|
|
||
|
Accounts receivable, net of allowance for doubtful
accounts of $303 and $225, respectively
|
121,353
|
|
87,162
|
|
||||
|
Inventory
|
12,192
|
|
13,070
|
|
||||
|
Derivative assets
|
166
|
|
112
|
|
||||
|
Income tax receivable
|
1,317
|
|
2,735
|
|
||||
|
Prepayments and other current assets
|
1,264
|
|
2,097
|
|
||||
|
Total current assets
|
245,685
|
|
192,518
|
|
||||
|
Property and equipment, net
|
29,362
|
|
46,325
|
|
||||
|
Investments in unconsolidated affiliates
|
425
|
|
2,500
|
|
||||
|
Cash deposits and other assets
|
7,232
|
|
5,529
|
|
||||
|
Total assets
|
$
|
282,704
|
|
$
|
246,872
|
|
||
|
LIABILITIES AND SHAREHOLDERS’ EQUITY
|
||||||||
|
Current liabilities:
|
||||||||
|
Accounts payable
|
$
|
124,706
|
|
$
|
79,897
|
|
||
|
Accounts payable – related party
|
5
|
|
53
|
|
||||
|
Derivative liabilities
|
145
|
|
64
|
|
||||
|
Current portion of capital lease obligations
|
338
|
|
—
|
|
||||
|
Other current liabilities
|
4,404
|
|
6,060
|
|
||||
|
Total current liabilities
|
129,598
|
|
86,074
|
|
||||
|
Other long-term liabilities:
|
||||||||
|
Asset retirement obligations
|
1,273
|
|
2,329
|
|
||||
|
Capital lease obligations
|
1,351
|
|
—
|
|
||||
|
Deferred taxes and other liabilities
|
3,363
|
|
7,157
|
|
||||
|
Total liabilities
|
135,585
|
|
95,560
|
|
||||
|
Commitments and contingencies (Note 13)
|
|
|
||||||
|
Shareholders’ equity:
|
||||||||
|
Preferred stock – $1.00 par value, 960,000 shares
authorized, none outstanding
|
—
|
|
—
|
|
||||
|
Common stock – $0.10 par value, 7,500,000 shares
authorized, 4,217,596 shares outstanding
|
422
|
|
422
|
|
||||
|
Contributed capital
|
11,693
|
|
11,693
|
|
||||
|
Retained earnings
|
135,004
|
|
139,197
|
|
||||
|
Total shareholders’ equity
|
147,119
|
|
151,312
|
|
||||
|
Total liabilities and shareholders’ equity
|
$
|
282,704
|
|
|
$
|
246,872
|
|
|
See Notes to Consolidated Financial Statements.
37
ADAMS RESOURCES & ENERGY, INC. AND SUBSIDIARIES
CONSOLIDATED STATEMENTS OF OPERATIONS
(In thousands, except per share data)
|
Year Ended December 31,
|
||||||||||||
|
2017
|
2016
|
2015
|
||||||||||
|
Revenues:
|
||||||||||||
|
Marketing
|
$
|
1,267,275
|
|
$
|
1,043,775
|
|
$
|
1,875,885
|
|
|||
|
Transportation
|
53,358
|
|
52,355
|
|
63,331
|
|
||||||
|
Oil and natural gas
|
1,427
|
|
3,410
|
|
5,063
|
|
||||||
|
Total revenues
|
1,322,060
|
|
1,099,540
|
|
1,944,279
|
|
||||||
|
Costs and expenses:
|
||||||||||||
|
Marketing
|
1,247,763
|
|
1,016,733
|
|
1,841,893
|
|
||||||
|
Transportation
|
48,538
|
|
45,154
|
|
52,076
|
|
||||||
|
Oil and natural gas
|
948
|
|
2,084
|
|
6,931
|
|
||||||
|
Oil and natural gas property impairments
|
3
|
|
313
|
|
12,082
|
|
||||||
|
General and administrative
|
9,707
|
|
10,410
|
|
9,939
|
|
||||||
|
Depreciation, depletion and amortization
|
13,599
|
|
18,792
|
|
23,717
|
|
||||||
|
Total costs and expenses
|
1,320,558
|
|
1,093,486
|
|
1,946,638
|
|
||||||
|
Operating earnings (losses)
|
1,502
|
|
6,054
|
|
(2,359
|
)
|
||||||
|
Other income (expense):
|
||||||||||||
|
Loss on deconsolidation of subsidiary (Note 3)
|
(3,505
|
)
|
—
|
|
—
|
|
||||||
|
Impairment of investment in unconsolidated affiliate
|
(2,500
|
)
|
—
|
|
—
|
|
||||||
|
Interest income
|
1,103
|
|
582
|
|
327
|
|
||||||
|
Interest expense
|
(27
|
)
|
(2
|
)
|
(13
|
)
|
||||||
|
Total other income (expense), net
|
(4,929
|
)
|
580
|
|
314
|
|
||||||
|
(Losses) earnings before income taxes and investment
|
||||||||||||
|
in unconsolidated affiliate
|
(3,427
|
)
|
6,634
|
|
(2,045
|
)
|
||||||
|
Income tax (provision) benefit:
|
||||||||||||
|
Current
|
(895
|
)
|
(2,778
|
)
|
(4,073
|
)
|
||||||
|
Deferred
|
3,840
|
|
87
|
|
4,843
|
|
||||||
|
Income tax benefit (provision)
|
2,945
|
|
(2,691
|
)
|
770
|
|
||||||
|
Earnings (losses) from continuing operations
|
(482
|
)
|
3,943
|
|
(1,275
|
)
|
||||||
|
Losses from investment in unconsolidated affiliate, net of
|
||||||||||||
|
tax benefit of $—, $770 and $—, respectively
|
—
|
|
(1,430
|
)
|
—
|
|
||||||
|
Net (losses) earnings
|
$
|
(482
|
)
|
$
|
2,513
|
|
$
|
(1,275
|
)
|
|||
|
Earnings (losses) per share:
|
||||||||||||
|
From continuing operations
|
$
|
(0.11
|
)
|
$
|
0.94
|
|
$
|
(0.30
|
)
|
|||
|
From investment in unconsolidated affiliate
|
—
|
|
(0.34
|
)
|
—
|
|
||||||
|
Basic and diluted net (losses) earnings per common share
|
$
|
(0.11
|
)
|
$
|
0.60
|
|
$
|
(0.30
|
)
|
|||
|
Weighted average number of common shares outstanding
|
4,218
|
|
4,218
|
|
4,218
|
|
||||||
|
Dividends per common share
|
$
|
0.88
|
|
$
|
0.88
|
|
$
|
0.88
|
|
|||
See Notes to Consolidated Financial Statements.
38
ADAMS RESOURCES & ENERGY, INC. AND SUBSIDIARIES
(In thousands)
|
Year Ended December 31,
|
||||||||||||
|
2017
|
2016
|
2015
|
||||||||||
|
Operating activities:
|
||||||||||||
|
Net (losses) earnings
|
$
|
(482
|
)
|
$
|
2,513
|
|
$
|
(1,275
|
)
|
|||
|
Adjustments to reconcile net (losses) earnings to net cash
|
||||||||||||
|
provided by operating activities:
|
||||||||||||
|
Depreciation, depletion and amortization
|
13,599
|
|
18,792
|
|
23,717
|
|
||||||
|
Gains on sale of property
|
(594
|
)
|
(1,966
|
)
|
(535
|
)
|
||||||
|
Dry hole costs incurred
|
—
|
|
—
|
|
817
|
|
||||||
|
Impairment of oil and natural gas properties
|
3
|
|
313
|
|
12,082
|
|
||||||
|
Provision for doubtful accounts
|
78
|
|
19
|
|
27
|
|
||||||
|
Deferred income taxes
|
(3,840
|
)
|
(857
|
)
|
(4,843
|
)
|
||||||
|
Net change in fair value contracts
|
27
|
|
(243
|
)
|
188
|
|
||||||
|
Losses from equity investment
|
—
|
|
468
|
|
—
|
|
||||||
|
Impairment of investments in unconsolidated affiliates
|
2,500
|
|
1,732
|
|
—
|
|
||||||
|
Loss on deconsolidation of subsidiary (Note 3)
|
3,505
|
|
—
|
|
—
|
|
||||||
|
Changes in assets and liabilities:
|
||||||||||||
|
Accounts receivable
|
(34,935
|
)
|
(15,368
|
)
|
72,594
|
|
||||||
|
Accounts receivable/payable, affiliates
|
271
|
|
—
|
|
—
|
|
||||||
|
Inventories
|
878
|
|
(5,399
|
)
|
5,810
|
|
||||||
|
Income tax receivable
|
1,418
|
|
(148
|
)
|
(1,617
|
)
|
||||||
|
Prepayments and other current assets
|
831
|
|
492
|
|
8,351
|
|
||||||
|
Accounts payable
|
44,790
|
|
6,984
|
|
(87,404
|
)
|
||||||
|
Accrued liabilities
|
(991
|
)
|
52
|
|
(166
|
)
|
||||||
|
Other
|
(962
|
)
|
(440
|
)
|
(2,269
|
)
|
||||||
|
Net cash provided by operating activities
|
26,096
|
|
6,944
|
|
25,477
|
|
||||||
|
Investing activities:
|
||||||||||||
|
Property and equipment additions
|
(2,644
|
)
|
(8,484
|
)
|
(11,074
|
)
|
||||||
|
Proceeds from property sales
|
720
|
|
3,706
|
|
719
|
|
||||||
|
Proceeds from sales of AREC assets
|
2,775
|
|
—
|
|
—
|
|
||||||
|
Investments in unconsolidated affiliates
|
—
|
|
(4,700
|
)
|
—
|
|
||||||
|
Insurance and state collateral (deposits) refunds
|
(1,067
|
)
|
1,710
|
|
283
|
|
||||||
|
Net cash used in investing activities
|
(216
|
)
|
(7,768
|
)
|
(10,072
|
)
|
||||||
|
Financing activities:
|
||||||||||||
|
Principal repayments of capital lease obligations
|
(118
|
)
|
—
|
|
—
|
|
||||||
|
Dividends paid on common stock
|
(3,711
|
)
|
(3,711
|
)
|
(3,712
|
)
|
||||||
|
Net cash used in financing activities
|
(3,829
|
)
|
(3,711
|
)
|
(3,712
|
)
|
||||||
|
Increase (decrease) in cash and cash equivalents
|
22,051
|
|
(4,535
|
)
|
11,693
|
|
||||||
|
Cash and cash equivalents at beginning of period
|
87,342
|
|
91,877
|
|
80,184
|
|
||||||
|
Cash and cash equivalents at end of period
|
$
|
109,393
|
|
$
|
87,342
|
|
$
|
91,877
|
|
|||
See Notes to Consolidated Financial Statements.
39
ADAMS RESOURCES & ENERGY, INC. AND SUBSIDIARIES
CONSOLIDATED STATEMENTS OF SHAREHOLDERS’ EQUITY
(In thousands)
|
Total
|
||||||||||||||||
|
Common
|
Contributed
|
Retained
|
Stockholders’
|
|||||||||||||
|
Stock
|
Capital
|
Earnings
|
Equity
|
|||||||||||||
|
Balance, January 1, 2015
|
$
|
422
|
|
$
|
11,693
|
|
$
|
145,382
|
|
$
|
157,497
|
|
||||
|
Net losses
|
—
|
|
—
|
|
(1,275
|
)
|
(1,275
|
)
|
||||||||
|
Dividends paid on common stock
|
—
|
|
—
|
|
(3,712
|
)
|
(3,712
|
)
|
||||||||
|
Balance, December 31, 2015
|
422
|
|
11,693
|
|
140,395
|
|
152,510
|
|
||||||||
|
Net earnings
|
—
|
|
—
|
|
2,513
|
|
2,513
|
|
||||||||
|
Dividends paid on common stock
|
—
|
|
—
|
|
(3,711
|
)
|
(3,711
|
)
|
||||||||
|
Balance, December 31, 2016
|
422
|
|
11,693
|
|
139,197
|
|
151,312
|
|
||||||||
|
Net losses
|
—
|
|
—
|
|
(482
|
)
|
(482
|
)
|
||||||||
|
Dividends paid on common stock
|
—
|
|
—
|
|
(3,711
|
)
|
(3,711
|
)
|
||||||||
|
Balance, December 31, 2017
|
$
|
422
|
|
$
|
11,693
|
|
$
|
135,004
|
|
$
|
147,119
|
|
||||
See Notes to Consolidated Financial Statements.
40
ADAMS RESOURCES & ENERGY, INC. AND SUBSIDIARIES
NOTES TO CONSOLIDATED FINANCIAL STATEMENTS
Organization
Adams Resources & Energy, Inc. (“AE”) is a publicly traded Delaware corporation organized in 1973, the common shares of which are listed on the NYSE MKT LLC (“NYSE MKT”) under the ticker symbol “AE”. We and our subsidiaries are primarily engaged in the business of crude oil marketing, transportation and storage in various crude oil and natural gas basins in the lower
48
states of the United States (“U.S.”). We also conduct tank truck transportation of liquid chemicals and dry bulk and ISO tank container storage and transportation primarily in the lower 48 states of the U.S. with deliveries into Canada and Mexico and with terminals in the Gulf Coast region of the U.S. Unless the context requires otherwise, references to “we,” “us,” “our,” the “Company” or “AE” are intended to mean the business and operations of Adams Resources & Energy, Inc. and its consolidated subsidiaries.
On April 21, 2017, one of our wholly owned subsidiaries, Adams Resources Exploration Corporation (“AREC”), filed a voluntary petition in the United States Bankruptcy Court for the District of Delaware (the “Bankruptcy Court”) seeking relief under Chapter 11 of Title 11 of the United States Code (the “Bankruptcy Code”), Case No. 17-10866 (KG). AREC operated its business and managed its properties as “debtors-in-possession” under the jurisdiction of the Bankruptcy Court and in accordance with the applicable provisions of the Bankruptcy Code and order of the Bankruptcy Court. AE was the primary creditor in the Chapter 11 process.
On May 3, 2017, AREC filed a motion with the Bankruptcy Court for approval of an auction process to sell its assets pursuant to Section 363 of the Bankruptcy Code and for approval to engage an advisor to conduct the auction. The auction commenced on July 19, 2017 to determine the highest or otherwise best bid to acquire all or substantially all of AREC’s assets. During the third quarter of 2017, Bankruptcy Court approval was obtained on
three
asset purchase and sales agreements with three unaffiliated parties, and AREC closed on the sales of substantially all of its assets (see Note 3 for further information).
As a result of AREC’s voluntary bankruptcy filing in April 2017, we no longer controlled the operations of AREC; therefore, we deconsolidated AREC effective with the bankruptcy filing and recorded our investment in AREC under the cost method (see Note 3 for further information). We obtained approval of a confirmed plan in December 2017, and we expect the case to be dismissed during the first half of 2018. Over the past few years, we have de-emphasized our upstream operations and do not expect this Chapter 11 filing by AREC to have a material adverse impact on any of our core businesses.
Historically, we have operated and reported in
three
business segments: (i) crude oil marketing, transportation and storage, (ii) tank truck transportation of liquid chemicals and dry bulk and ISO tank container storage and transportation, and (iii) upstream crude oil and natural gas exploration and production. We exited the crude oil and natural gas exploration and production business during 2017 with the sale of our crude oil and natural gas exploration and production assets (see Note 3 for further information).
The consolidated financial statements and the accompanying notes are prepared in accordance with U.S. generally accepted accounting principles (“GAAP”) and the rules of the U.S. Securities and Exchange Commission (“SEC”). All significant intercompany transactions and balances have been eliminated in consolidation.
41
ADAMS RESOURCES & ENERGY, INC. AND SUBSIDIARIES
NOTES TO CONSOLIDATED FINANCIAL STATEMENTS
Use of Estimates
The preparation of our financial statements in conformity with GAAP requires management to use estimates and assumptions that affect the reported amount of assets and liabilities and disclosure of contingent assets and liabilities at the date of the financial statements and the reported amounts of revenues and expenses during the reporting period. We base our estimates and judgments on historical experience and on various other assumptions and information we believe to be reasonable under the circumstances. Estimates and assumptions about future events and their effects cannot be perceived with certainty and, accordingly, these estimates may change as new events occur, as more experience is acquired, as additional information is obtained and as the operating environment changes. While we believe the estimates and assumptions used in the preparation of the consolidated financial statements are appropriate, actual results could differ from those estimates.
We adhere to the following significant accounting policies in the preparation of our consolidated financial statements.
Accounts Receivable and Allowance for Doubtful Accounts
Accounts receivable associated with crude oil marketing activities comprise approximately
90 percent
of our total receivables, and industry practice requires payment for these sales to occur within
20
days of the end of the month following a transaction. Our customer makeup, credit policies and the relatively short duration of receivables mitigate the uncertainty typically associated with receivables management. An allowance for doubtful accounts is provided where appropriate.
Our allowance for doubtful accounts is determined based on specific identification combined with a review of the general status of the aging of all accounts. We consider the following factors in our review of our allowance for doubtful accounts: (i) historical experience with customers, (ii) the perceived financial stability of customers based on our research, (iii) the levels of credit we grant to customers, and (iv) the duration of the receivable. We may increase the allowance for doubtful accounts in response to the specific identification of customers involved in bankruptcy proceedings and similar financial difficulties. On a routine basis, we review estimates associated with the allowance for doubtful accounts to ensure that we have recorded sufficient reserves to cover potential losses. See Note 14 for further information regarding credit risk.
The following table presents our allowance for doubtful accounts activity for the periods indicated (in thousands):
|
Year Ended December 31,
|
|||||||||||
|
2017
|
2016
|
2015
|
|||||||||
|
Balance at beginning of period
|
$
|
225
|
|
$
|
206
|
|
$
|
179
|
|
||
|
Charges to costs and expenses
|
137
|
|
100
|
|
116
|
|
|||||
|
Deductions
|
(59
|
)
|
(81
|
)
|
(89
|
)
|
|||||
|
Balance at end of period
|
$
|
303
|
|
$
|
225
|
|
$
|
206
|
|
||
Cash and Cash Equivalents
Cash and cash equivalents represent unrestricted cash on hand and highly liquid investments with original maturities of less than three months from the date of purchase. Cash and cash equivalents are maintained with major financial institutions, and deposit amounts may exceed the amount of federally backed insurance provided. While we regularly monitor the financial stability of these institutions, cash and cash equivalents ultimately remain at risk subject to the financial viability of these institutions.
42
ADAMS RESOURCES & ENERGY, INC. AND SUBSIDIARIES
NOTES TO CONSOLIDATED FINANCIAL STATEMENTS
Derivative Instruments
In the normal course of our operations, our crude oil marketing segment purchases and sells crude oil. We seek to profit by procuring the commodity as it is produced and then delivering the product to the end users or the intermediate use marketplace. As typical for the industry, these transactions are made pursuant to the terms of forward month commodity purchase and/or sale contracts. Some of these contracts meet the definition of a derivative instrument, and therefore, we account for these contracts at fair value, unless the normal purchase and sale exception is applicable. These types of underlying contracts are standard for the industry and are the governing document for our crude oil marketing segment. None of our derivative instruments have been designated as hedging instruments.
Employee Benefits
We maintain a 401(k) savings plan for the benefit of our employees. We do not maintain any other pension or retirement plans. Our 401(k) plan contributory expenses were as follows for the periods indicated (in thousands):
|
Year Ended December 31,
|
|||||||||||
|
2017
|
2016
|
2015
|
|||||||||
|
Contributory expenses
|
$
|
734
|
|
$
|
757
|
|
$
|
768
|
|
||
Earnings Per Share
Earnings per share are based on the weighted average number of shares of common stock and potentially dilutive common stock shares outstanding during the period. The weighted average number of shares outstanding was
4,217,596
for each of the years ended
December 31, 2017
,
2016
and
2015
. There were no potentially dilutive securities outstanding during those periods.
Fair Value Measurements
The carrying amounts reported in the consolidated balance sheets for cash and cash equivalents, accounts receivable and accounts payable approximates fair value because of the immediate or short-term maturity of these financial instruments.
Our fair value estimates are based on either (i) actual market data or (ii) assumptions that other market participants would use in pricing an asset or liability, including estimates of risk, in the principal market of the asset or liability at a specified measurement date. Recognized valuation techniques employ inputs such as contractual prices, quoted market prices or rates, operating costs, discount factors and business growth rates. These inputs may be either readily observable, corroborated by market data or generally unobservable. In developing our estimates of fair value, we endeavor to utilize the best information available and apply market-based data to the highest extent possible. Accordingly, we utilize valuation techniques (such as the market approach) that maximize the use of observable inputs and minimize the use of unobservable inputs.
A three-tier hierarchy has been established that classifies fair value amounts recognized in the financial statements based on the observability of inputs used to estimate such fair values. The hierarchy considers fair value amounts based on observable inputs (Levels 1 and 2) to be more reliable and predictable than those based primarily on unobservable inputs (Level 3). At each balance sheet reporting date, we categorize our financial assets and liabilities using this hierarchy.
43
ADAMS RESOURCES & ENERGY, INC. AND SUBSIDIARIES
NOTES TO CONSOLIDATED FINANCIAL STATEMENTS
The characteristics of the fair value amounts classified within each level of the hierarchy are described as follows:
|
•
|
Level 1 fair values are based on quoted prices, which are available in active markets for identical assets or liabilities as of the measurement date. Active markets are defined as those in which transactions for identical assets or liabilities occur with sufficient frequency so as to provide pricing information on an ongoing basis. For Level 1 valuation of marketable securities, we utilize market quotations provided by our primary financial institution. For the valuations of derivative financial instruments, we utilize the New York Mercantile Exchange (“NYMEX”) for certain commodity valuations.
|
|
•
|
Level 2 fair values are based on (a) quoted prices for similar assets or liabilities in active markets, (b) quoted prices for identical assets or liabilities but in markets that are not actively traded or in which little information is released to the public, (c) observable inputs other than quoted prices, and (d) inputs derived from observable market data. Source data for Level 2 inputs include information provided by the NYMEX, published price data and indices, third party price survey data and broker provided forward price statistics.
|
|
•
|
Level 3 fair values are based on unobservable market data inputs for assets or liabilities.
|
Fair value contracts consist of derivative financial instruments and are recorded as either an asset or liability measured at its fair value. Changes in fair value are recognized immediately in earnings unless the derivatives qualify for, and we elect, cash flow hedge accounting. We had no contracts designated for hedge accounting during any of the current reporting periods (see Note 10 for further information).
Fair value estimates are based on assumptions that market participants would use when pricing an asset or liability, and we use a fair value hierarchy of three levels that prioritizes the information used to develop those assumptions. Currently, for all items presented herein, we utilize a market approach to valuing our contracts. On a contract by contract, forward month by forward month basis, we obtain observable market data for valuing our contracts. The fair value hierarchy gives the highest priority to quoted prices in active markets and the lowest priority to unobservable data.
Impairment Testing for Long-Lived Assets
Long-lived assets (primarily property and equipment) are reviewed for impairment when events or changes in circumstances indicate that the carrying amount of these assets may not be recoverable. Long-lived assets with carrying values that are not expected to be recovered through future cash flows are written-down to their estimated fair values. The carrying value of a long-lived asset is deemed not recoverable if it exceeds the sum of undiscounted cash flows expected to result from the use and eventual disposition of the asset. If the asset’s carrying value exceeds the sum of its undiscounted cash flows, a non-cash asset impairment charge equal to the excess of the asset’s carrying value over its estimated fair value is recorded. Fair value is defined as the price that would be received to sell an asset or be paid to transfer a liability in an orderly transaction between market participants at a specified measurement date. We measure fair value using market price indicators or, in the absence of such data, appropriate valuation techniques. See Note 10 for information regarding impairment charges related to long-lived assets.
Income Taxes
Income taxes are accounted for using the asset and liability method. Under this approach, deferred tax assets and liabilities are recognized based on anticipated future tax consequences attributable to differences between financial statement carrying amounts of such items and their respective tax basis (see Note 11 for further information). On December 22, 2017, the Tax Cut and Jobs Act was enacted into law resulting in a reduction in the federal corporate income tax rate from 35 percent to 21 percent for years beginning in 2018, which will impact our deferred tax assets and liabilities.
44
ADAMS RESOURCES & ENERGY, INC. AND SUBSIDIARIES
NOTES TO CONSOLIDATED FINANCIAL STATEMENTS
Inventory
Inventory consists of crude oil held in storage tanks and at third-party pipelines as part of our crude oil marketing operations. Crude oil inventory is carried at the lower of average cost or net realizable value.
Letter of Credit Facility
We maintain a Credit and Security Agreement with Wells Fargo Bank, National Association to provide up to a $
60 million
stand-by letter of credit facility used to support crude oil purchases within our crude oil marketing segment and for other purposes. We are currently using the letter of credit facility for a letter of credit related to our insurance program. This facility is collateralized by the eligible accounts receivable within the crude oil marketing segment and expires on August 27, 2019.
The issued stand-by letters of credit are canceled as the underlying purchase obligations are satisfied by cash payment when due. The letter of credit facility places certain restrictions on Gulfmark Energy, Inc., one of our wholly owned subsidiaries. These restrictions include the maintenance of a combined
1.1
to 1.0 current ratio and the maintenance of positive net earnings excluding inventory valuation changes, as defined, among other restrictions. We are currently in compliance with all such financial covenants. At
December 31, 2017
, we had
$2.2 million
outstanding under this facility.
No
letter of credit amounts were outstanding at December 31,
2016
.
Property and Equipment
Property and equipment is recorded at cost. Expenditures for additions, improvements and other enhancements to property and equipment are capitalized, and minor replacements, maintenance and repairs that do not extend asset life or add value are charged to expense as incurred. When property and equipment assets are retired or otherwise disposed of, the related cost and accumulated depreciation is removed from the accounts and any resulting gain or loss is included in results of operations in operating costs and expenses for the respective period. Property and equipment, except for land, is depreciated using the straight-line method over the estimated average useful lives of
three
to
twenty years
.
Oil and natural gas exploration and development expenditures were accounted for in accordance with the successful efforts method of accounting. Direct costs of acquiring developed or undeveloped leasehold acreage, including lease bonus, brokerage and other fees, were capitalized. Exploratory drilling costs were initially capitalized until the properties were evaluated and determined to be either productive or nonproductive. These evaluations were made on a quarterly basis. If an exploratory well was determined to be nonproductive, the costs of drilling the well were charged to expense. Costs incurred to drill and complete development wells, including dry holes, were capitalized. At December 31, 2017 and 2016, we had no unevaluated or “suspended” exploratory drilling costs. In April 2017, our upstream crude oil and natural gas exploration and production subsidiary was deconsolidated and accounted for under the cost method of accounting (see Notes 1 and 3 for further discussion).
We capitalize interest costs, if any, incurred in connection with major capital expenditures while the asset is in its construction phase. The capitalized interest is recorded as part of the asset to which it relates and is amortized over the asset’s estimated useful life as a component of depreciation expense. When capitalized interest is recorded, it reduces interest expense.
Asset retirement obligations (“AROs”) are legal obligations associated with the retirement of tangible long-lived assets that result from their acquisition, construction, development and/or normal operation. When an ARO is incurred, we record a liability for the ARO and capitalize an equal amount as an increase in the carrying value of the related long-lived asset. ARO amounts are measured at their estimated fair value using expected present value techniques. Over time, the ARO liability is accreted to its present value (through accretion expense), and the capitalized amount is depreciated over the remaining useful life of the related long-lived asset. We will incur a gain or loss to the extent that our ARO liabilities are not settled at their recorded amounts.
See Note 5 for additional information regarding our property and equipment and AROs.
45
ADAMS RESOURCES & ENERGY, INC. AND SUBSIDIARIES
NOTES TO CONSOLIDATED FINANCIAL STATEMENTS
Revenue Recognition
Certain commodity purchase and sale contracts utilized by our crude oil marketing business qualify as derivative instruments with certain specifically identified contracts also designated as trading activities. From the time of contract origination, these trading activity contracts are marked-to-market and recorded on a net revenue basis in the accompanying consolidated financial statements.
Most crude oil purchase and sale contracts qualify and are designated as non-trading activities, and we consider these contracts as normal purchases and sales activity. For normal purchases and sales, our customers are invoiced monthly based upon contractually agreed upon terms with revenue recognized in the month in which the physical product is delivered to the customer. These sales are recorded on a gross basis in the financial statements because we take title, have risk of loss for the products, are the primary obligor for the purchase, establish the sale price independently with a third party and maintain credit risk associated with the sale of the product.
Certain crude oil contracts may be with a single counterparty to provide for similar quantities of crude oil to be bought and sold at different locations. These contracts are entered into for a variety of reasons, including effecting the transportation of the commodity, to minimize credit exposure, and/or to meet the competitive demands of the customer. These buy/sell arrangements are reflected on a net revenue basis in the accompanying consolidated financial statements.
Reporting these crude oil contracts on a gross revenue basis would increase our reported revenues as follows for the periods indicated (in thousands):
|
Year Ended December 31,
|
|||||||||||
|
2017
|
2016
|
2015
|
|||||||||
|
Revenue gross-up
|
$
|
203,095
|
|
$
|
314,270
|
|
$
|
480,111
|
|
||
Transportation segment customers are invoiced, and the related revenue is recognized as the service is provided.
Recent Accounting Pronouncements
Revenue Recognition
. In May 2014, the Financial Accounting Standards Board (“FASB”) issued Accounting Standards Codification Topic 606,
Revenue from Contracts with Customers
(“ASC 606”). The new accounting standard, along with its related amendments, replaces the current rules-based GAAP governing revenue recognition with a principles-based approach. Under the new standard, a company recognizes revenue when it satisfies a performance obligation by transferring a promised good or service to a customer at an amount that reflects the consideration it expects to receive in exchange for those goods and services. The standard also requires additional disclosure about the nature, amount, timing and uncertainty of revenue and cash flows arising from customer contracts, including significant judgments and changes in judgments. ASC 606 is effective for interim and annual reporting periods beginning after December 15, 2017 and may be applied on either a full or modified retrospective basis.
We adopted the new standard and all related amendments on January 1, 2018 using the modified retrospective approach. This approach required us to apply the new revenue standard to (i) all new revenue contracts entered into after January 1, 2018 and (ii) all existing revenue contracts open as of January 1, 2018, with a cumulative adjustment to retained earnings, if applicable. In accordance with this approach, our consolidated revenues for periods prior to January 1, 2018 will not be restated. In addition, no cumulative adjustment will be required to be made to our retained earnings, as there are no material differences in the nature, amount, timing or uncertainty of revenues recognized following our adoption of this new standard on January 1, 2018. We have also evaluated our business processes, systems and controls to ensure the accuracy and timeliness of the recognition and disclosure requirements under the new revenue guidance.
46
ADAMS RESOURCES & ENERGY, INC. AND SUBSIDIARIES
NOTES TO CONSOLIDATED FINANCIAL STATEMENTS
Leases
. In February 2016, the FASB issued ASC 842,
Leases
(“ASC 842”), which requires substantially all leases (with the exception of leases with a term of one year or less) to be recorded on the balance sheet using a method referred to as the right-of-use (“ROU”) asset approach. We plan to adopt the new standard on January 1, 2019 using the modified retrospective approach.
The new standard introduces two lease accounting models, which result in a lease being classified as either a “finance” or “operating” lease on the basis of whether the lessee effectively obtains control of the underlying asset during the lease term. A lease would be classified as a finance lease if it meets one of five classification criteria, four of which are generally consistent with current lease accounting guidance. By default, a lease that does not meet the criteria to be classified as a finance lease will be deemed an operating lease. Regardless of classification, the initial measurement of both lease types will result in the balance sheet recognition of a ROU asset representing a company’s right to use the underlying asset for a specified period of time and a corresponding lease liability. The lease liability will be recognized at the present value of the future lease payments, and the ROU asset will equal the lease liability adjusted for any prepaid rent, lease incentives provided by the lessor, and any indirect costs.
The subsequent measurement of each type of lease varies. Leases classified as a finance lease will be accounted for using the effective interest method. Under this approach, a lessee will amortize the ROU asset (generally on a straight-line basis in a manner similar to depreciation) and the discount on the lease liability (as a component of interest expense). Leases classified as an operating lease will result in the recognition of a single lease expense amount that is recorded on a straight-line basis (or another systematic basis, if more appropriate).
We have started the process of reviewing our lease agreements in light of the new guidance. Although we are in the early stages of our ASC 842 implementation project, we anticipate that this new lease guidance will cause significant changes to the way leases are recorded, presented and disclosed in our consolidated financial statements.
Bankruptcy Filing, Deconsolidation and Sale
On April 21, 2017, AREC filed a voluntary petition in the Bankruptcy Court seeking relief under the Bankruptcy Code. AREC operated its business and managed its properties as “debtors-in-possession” under the jurisdiction of the Bankruptcy Court and in accordance with the applicable provisions of the Bankruptcy Code and order of the Bankruptcy Court. As a result of AREC’s bankruptcy filing, AE ceded its authority to the Bankruptcy Court, and AE management could not carry on AREC activities in the ordinary course of business without Bankruptcy Court approval. AE managed the day-to-day operations of AREC, but did not have discretion to make significant capital or operating budgetary changes or decisions or to purchase or sell significant assets, as AREC’s material decisions were subject to review and approval by the Bankruptcy Court. For these reasons, we concluded that AE lost control of AREC, and no longer had significant influence over AREC during the pendency of the bankruptcy. Therefore, we deconsolidated AREC effective with the filing of the Chapter 11 bankruptcy in April 2017.
In order to deconsolidate AREC, the carrying values of the assets and liabilities of AREC were removed from our consolidated balance sheet as of April 30, 2017, and we recorded our investment in AREC at its estimated fair value of approximately
$5.0 million
. We determined the fair value of our investment based upon bids we received in an auction process (see Note 1 for further discussion). We also determined that the estimated fair value of our investment in AREC was expected to be lower than its net book value immediately prior to the deconsolidation. As a result, during the second quarter of 2017, we recorded a non-cash charge of approximately
$1.6 million
associated with the deconsolidation of AREC, which reflected the excess of the net assets of AREC over its estimated fair value based on the expected sales transaction price of approximately
$5.0 million
, net of estimated transaction costs. Subsequent to the deconsolidation of AREC, we accounted for our investment in AREC using the cost method of accounting because AE did not exercise significant influence over the operations of AREC due to the Chapter 11 filing.
47
ADAMS RESOURCES & ENERGY, INC. AND SUBSIDIARIES
NOTES TO CONSOLIDATED FINANCIAL STATEMENTS
On August 1, 2017, a hearing was held before the Bankruptcy Court seeking approval of asset purchase and sales agreements under Section 363 of the Bankruptcy Code with three unaffiliated parties to purchase AREC’s crude
oil and natural gas assets for aggregate cash proceeds of approximately
$5.2 million
. The Bankruptcy Court approved the asset purchase and sales agreements, and we closed on the sales of these assets during the third quarter of 2017.
In October 2017, AREC submitted its liquidation plan to the Bankruptcy Court for approval. In connection with the sales of these assets and submission of the liquidation plan, we recognized an additional loss of
$1.9 million
during the third quarter of 2017, which represents the difference between the proceeds we expect to be paid upon settlement of the bankruptcy, net of anticipated remaining closing costs identified as part of the liquidation plan, and the book value of our cost method investment. In December 2017, we received proceeds of approximately
$2.8 million
from AREC related to the settlement of a portion of the bankruptcy process. The bankruptcy process is expected to be completed with a confirmed plan during 2018.
DIP Financing – Related Party Relationship
In connection with the bankruptcy filing, AREC entered into a Debtor in Possession Credit and Security Agreement with AE (“DIP Credit Agreement”) dated as of April 25, 2017, in an aggregate amount of up to
$1.25 million
, of which the funds were to be used by AREC solely to fund operations through August 11, 2017. Loans under the DIP Credit Agreement accrued interest at a rate of LIBOR plus
2.0 percent
per annum and were due and payable upon the earlier of (a) twelve months after the petition date, (b) the closing of the sale of substantially all of AREC’s assets, (c) the effective date of a Chapter 11 plan of reorganization of AREC, and (d) the date that the DIP loan was accelerated upon the occurrence of an event of default, as defined in the DIP Credit Agreement. AREC borrowed approximately
$0.4 million
under the DIP Credit Agreement, and the amount was repaid during the third quarter of 2017 with proceeds from the sales of the assets.
The components of prepayments and other current assets were as follows at the dates indicated (in thousands):
|
December 31,
|
|||||||
|
2017
|
2016
|
||||||
|
Insurance premiums
|
$
|
425
|
|
$
|
1,403
|
|
|
|
Rents, licenses and other
|
839
|
|
694
|
|
|||
|
Total
|
$
|
1,264
|
|
$
|
2,097
|
|
|
48
ADAMS RESOURCES & ENERGY, INC. AND SUBSIDIARIES
NOTES TO CONSOLIDATED FINANCIAL STATEMENTS
The historical costs of our property and equipment and related accumulated depreciation balances were as follows at the dates indicated (in thousands):
|
Estimated
|
|||||||||
|
Useful Life
|
December 31,
|
||||||||
|
in Years
|
2017
|
2016
|
|||||||
|
Tractors and trailers
(1)
|
5 – 6
|
$
|
88,065
|
|
$
|
89,576
|
|
||
|
Oil and gas (successful efforts)
|
|
—
|
|
62,784
|
|
||||
|
Field equipment
|
2 – 5
|
18,490
|
|
18,282
|
|
||||
|
Buildings
|
5 – 39
|
15,727
|
|
15,707
|
|
||||
|
Office equipment
|
1 – 5
|
1,929
|
|
1,913
|
|
||||
|
Land
|
1,790
|
|
1,790
|
|
|||||
|
Construction in progress
|
275
|
|
596
|
|
|||||
|
Total
|
126,276
|
|
190,648
|
|
|||||
|
Less accumulated depreciation
|
(96,914
|
)
|
(144,323
|
)
|
|||||
|
Property and equipment, net
|
$
|
29,362
|
|
$
|
46,325
|
|
|||
______________
|
(1)
|
2017 includes assets held under capital leases. During the third quarter of 2017, we entered into capital leases for certain tractors in our marketing segment. Gross property and equipment and accumulated amortization associated with assets held under capital leases were
$1.8 million
and
$0.1 million
, respectively, at December 31, 2017 (see Note 13 for further information).
|
Components of depreciation, depletion and amortization expense were as follows for the periods indicated (in thousands):
|
Year Ended December 31,
|
|||||||||||
|
2017
|
2016
|
2015
|
|||||||||
|
Depreciation, depletion and amortization, excluding amounts
|
|||||||||||
|
under capital leases
|
$
|
13,478
|
|
$
|
18,792
|
|
$
|
23,717
|
|
||
|
Amortization of property and equipment under capital leases
|
121
|
|
—
|
|
—
|
|
|||||
|
Total depreciation, depletion and amortization
|
$
|
13,599
|
|
$
|
18,792
|
|
$
|
23,717
|
|
||
Crude Oil and Natural Gas Exploration and Production Assets
Our subsidiary that owned the upstream crude
oil and natural gas exploration and production assets was deconsolidated effective with its bankruptcy filing in April 2017 and subsequently accounted for as a cost method investment (see Note 3). These upstream crude oil and natural gas exploration and production assets were sold during the third quarter of 2017. We have no further interest in these assets.
Impairment provisions including in upstream crude oil and natural gas exploration and production segment operating losses were as follows for the periods indicated (in thousands):
|
Year Ended December 31,
|
|||||||||||
|
2017
|
2016
|
2015
|
|||||||||
|
Producing property impairments
|
$
|
—
|
|
$
|
30
|
|
$
|
10,324
|
|
||
|
Non-producing property impairments
|
3
|
|
283
|
|
1,758
|
|
|||||
|
Total crude oil and natural gas impairments
|
$
|
3
|
|
$
|
313
|
|
$
|
12,082
|
|
||
49
ADAMS RESOURCES & ENERGY, INC. AND SUBSIDIARIES
NOTES TO CONSOLIDATED FINANCIAL STATEMENTS
At December 31, 2017 and 2016, we had no capitalized costs for non-producing crude oil and natural gas leasehold interests.
Gains on sales of assets
We sold certain used trucks and equipment from our marketing and transportation segments and recorded net pre-tax gains as follows for the periods indicated (in thousands):
|
Year Ended December 31,
|
|||||||||||
|
2017
|
2016
|
2015
|
|||||||||
|
Sales of used trucks and equipment
|
$
|
594
|
|
$
|
1,966
|
|
$
|
535
|
|
||
Asset Retirement Obligations
We record AROs for the estimated retirement costs associated with certain tangible long-lived assets. The estimated fair value of AROs are recorded in the period in which they are incurred and the corresponding cost capitalized by increasing the carrying amount of the related long-lived asset. The liability is accreted to its then present value each period, and the capitalized cost is depreciated over the useful life of the asset. If the liability is settled for an amount other than the recorded amount, an increase or decrease to expense is recognized. A summary of our AROs is presented as follows for the periods indicated (in thousands):
|
Year Ended December 31,
|
|||||||||||
|
2017
|
2016
|
2015
|
|||||||||
|
ARO liability beginning balance
|
$
|
2,329
|
|
$
|
2,469
|
|
$
|
2,464
|
|
||
|
Liabilities incurred
|
18
|
|
162
|
|
39
|
|
|||||
|
Accretion of discount
|
58
|
|
92
|
|
93
|
|
|||||
|
Liabilities settled
|
(261
|
)
|
(394
|
)
|
(127
|
)
|
|||||
|
Deconsolidation of subsidiary
(1)
|
(871
|
)
|
—
|
|
—
|
|
|||||
|
ARO liability ending balance
|
$
|
1,273
|
|
$
|
2,329
|
|
$
|
2,469
|
|
||
_______________
|
(1)
|
Relates to our upstream crude oil and natural gas exploration and production subsidiary that was deconsolidated in April 2017 as a result of its bankruptcy filing (see Note 3 for further information).
|
Components of cash deposits and other assets were as follows at the dates indicated (in thousands):
|
December 31,
|
|||||||
|
2017
|
2016
|
||||||
|
Amounts associated with liability insurance program:
|
|||||||
|
Insurance collateral deposits
|
$
|
3,767
|
|
$
|
2,599
|
|
|
|
Excess loss fund
|
2,284
|
|
1,450
|
|
|||
|
Accumulated interest income
|
814
|
|
812
|
|
|||
|
Other amounts:
|
|||||||
|
State collateral deposits
|
57
|
|
143
|
|
|||
|
Materials and supplies
|
273
|
|
354
|
|
|||
|
Other
|
37
|
|
171
|
|
|||
|
Total
|
$
|
7,232
|
|
$
|
5,529
|
|
|
50
ADAMS RESOURCES & ENERGY, INC. AND SUBSIDIARIES
NOTES TO CONSOLIDATED FINANCIAL STATEMENTS
We have established certain deposits to support participation in our liability insurance program and remittance of state crude oil severance taxes and other state collateral deposits. Insurance collateral deposits are held by the insurance company to cover past or potential open claims based upon a percentage of the maximum assessment under our insurance policies. Excess amounts in our loss fund represent premium payments in excess of claims incurred to date that we may be entitled to recover through settlement or commutation as claim periods are closed. Interest income is earned on the majority of amounts held by the insurance companies and will be paid to us upon settlement of policy years.
Insurance collateral deposits are invested at the discretion of our insurance carrier. This fair value measure relies on inputs from quoted prices for similar assets and is thus categorized as a “Level 3” valuation in the fair value hierarchy (see Note 10 for further information).
At December 31, 2017, we had no remaining balances in our medical-related investments. We currently do not have any plans to pursue additional medical-related investments.
Bencap
In December 2015, we formed a new wholly owned subsidiary, Adams Resources Medical Management, Inc. (“ARMM”), and in January 2016, ARMM acquired a
30 percent
member interest in Bencap LLC (“Bencap”) for a
$2.2 million
cash payment. Bencap provides medical insurance brokerage and medical claims auditing services to employers utilizing ERISA governed employee benefit plans. We accounted for this investment under the equity method of accounting.
Under the terms of the investment agreement, Bencap had the option to request borrowings from us of up to
$1.5 million
(on or after December 5, 2016 but before October 31, 2018) that we were required to provide or forfeit our
30 percent
member interest. During 2016, our management determined that we were unlikely to provide additional funding due to Bencap’s lower than projected revenue growth and operating losses since investment inception. We completed a review of our equity method investment in Bencap during 2016 and determined that there was an other than temporary impairment. During the third quarter of 2016, we recognized an after-tax net loss of
$1.4 million
to write-off our investment in Bencap, which consisted of a pre-tax impairment charge of approximately
$1.7 million
, pre-tax losses from the equity method investment of
$0.5 million
and an income tax benefit of
$0.8 million
. In February 2017, in accordance with the terms of the investment agreement, Bencap requested additional funding of approximately
$0.5 million
from us. We declined the additional funding request and as a result, forfeited our
30 percent
member interest in Bencap. At December 31, 2017, we had
no
further ownership interest in Bencap.
VestaCare
In April 2016, ARMM acquired an approximate
15 percent
equity interest (less than
3 percent
voting interest) in VestaCare, Inc., a California corporation (“VestaCare”), for a
$2.5 million
cash payment. VestaCare provides an array of software as a service (SaaS) electronic payment technologies to medical providers, payers and patients including VestaCare’s most recent product offering, VestaPay™. VestaPay™ allows medical care providers to structure fully automated and dynamically updating electronic payment plans for their patients. We account for this investment under the cost method of accounting. During the third quarter of 2017, we reviewed our investment in VestaCare and determined that the current projected operating results did not support the carrying value of the investment. As such, during the third quarter of 2017, we recognized an impairment charge of
$2.5 million
to write-off our investment in VestaCare. At December 31, 2017, we continue to own an approximate
15 percent
equity interest in VestaCare.
51
ADAMS RESOURCES & ENERGY, INC. AND SUBSIDIARIES
NOTES TO CONSOLIDATED FINANCIAL STATEMENTS
AREC
As a result of AREC’s voluntary bankruptcy filing in April 2017 and our loss of control of AREC, we deconsolidated AREC in April 2017, and we recorded our investment in this subsidiary under the cost method of accounting. We recorded a non-cash charge during the second quarter of 2017 of approximately
$1.6 million
associated with the deconsolidation of AREC, which reflected the excess of the net assets of AREC over its estimated fair value based on the expected sales transaction price, net of estimated transaction costs. As a result of the sale of substantially all of AREC’s assets during the third quarter of 2017, we recognized an additional loss of
$1.9 million
, which represents the difference between the net proceeds we expect to be paid upon settlement of the bankruptcy, net of anticipated remaining closing costs identified as part of the liquidation plan, and the book value of our cost method investment. In December 2017, we received proceeds of approximately
$2.8 million
from AREC related to the settlement of a portion of the bankruptcy process. At December 31, 2017, our remaining investment in AREC was
$0.4 million
(see Note 3 for further information). The remaining investment will be removed upon settlement of the bankruptcy, which is anticipated during the first half of 2018.
52
ADAMS RESOURCES & ENERGY, INC. AND SUBSIDIARIES
NOTES TO CONSOLIDATED FINANCIAL STATEMENTS
Historically, our
three
reporting segments have been: (i) crude oil marketing, transportation and storage, (ii) tank truck transportation of liquid chemicals and dry bulk and ISO tank container storage and transportation, and (iii) upstream crude oil and natural gas exploration and production. Our upstream crude oil and natural gas exploration and production wholly owned subsidiary filed for bankruptcy in April 2017 (see Note 3 for further information), and as a result of our loss of control of the wholly owned subsidiary, AREC was deconsolidated and is accounted for under the cost method of accounting. AREC remained a reportable segment until its deconsolidation, effective April 30, 2017.
Information concerning our various business activities was follows for the periods indicated (in thousands):
|
Reporting Segments
|
|||||||||||||||
|
Marketing
|
Transportation
|
Oil and Gas
|
Total
|
||||||||||||
|
Year Ended December 31, 2017
|
|||||||||||||||
|
Revenues
|
$
|
1,267,275
|
|
$
|
53,358
|
|
$
|
1,427
|
|
$
|
1,322,060
|
|
|||
|
Segment operating (losses) earnings
(1) (2)
|
11,700
|
|
(544
|
)
|
53
|
|
11,209
|
|
|||||||
|
Depreciation, depletion and amortization
|
7,812
|
|
5,364
|
|
423
|
|
13,599
|
|
|||||||
|
Property and equipment additions
(3)
|
468
|
|
351
|
|
1,825
|
|
2,644
|
|
|||||||
|
Year Ended December 31, 2016
|
|||||||||||||||
|
Revenues
|
$
|
1,043,775
|
|
$
|
52,355
|
|
$
|
3,410
|
|
$
|
1,099,540
|
|
|||
|
Segment operating (losses) earnings
(1)
|
17,045
|
|
(48
|
)
|
(533
|
)
|
16,464
|
|
|||||||
|
Depreciation, depletion and amortization
|
9,997
|
|
7,249
|
|
1,546
|
|
18,792
|
|
|||||||
|
Property and equipment additions
|
1,321
|
|
6,868
|
|
295
|
|
8,484
|
|
|||||||
|
Year Ended December 31, 2015
|
|||||||||||||||
|
Revenues
|
$
|
1,875,885
|
|
$
|
63,331
|
|
$
|
5,063
|
|
$
|
1,944,279
|
|
|||
|
Segment operating (losses) earnings
(1) (4)
|
22,895
|
|
3,701
|
|
(19,016
|
)
|
7,580
|
|
|||||||
|
Depreciation, depletion and amortization
|
11,097
|
|
7,554
|
|
5,066
|
|
23,717
|
|
|||||||
|
Property and equipment additions
|
2,126
|
|
6,579
|
|
2,369
|
|
11,074
|
|
|||||||
_________________
|
(1)
|
Our marketing segment’s operating earnings included inventory liquidation gains of
$3.3 million
and
$8.2 million
for the years ended
December 31, 2017
and
2016
, respectively, and inventory valuation losses of
$5.4 million
for the year ended December 31,
2015
.
|
|
(2)
|
Segment operating (losses) earnings includes approximately
$0.4 million
of costs related to a voluntary early retirement program that was implemented in August 2017.
|
|
(3)
|
Our marketing segment’s property and equipment additions do not include approximately
$1.8 million
of tractors acquired during the third quarter of 2017 under capital leases. See Note 13 for further information.
|
|
(4)
|
Our crude oil and natural gas
segment’s operating earnings included property impairments of
$12.1 million
for the year ended
December 31, 2015
.
|
53
ADAMS RESOURCES & ENERGY, INC. AND SUBSIDIARIES
NOTES TO CONSOLIDATED FINANCIAL STATEMENTS
Segment operating earnings reflect revenues net of operating costs and depreciation, depletion and amortization expense and are reconciled to earnings (losses) before income taxes and investment in unconsolidated affiliate, as follows for the periods indicated (in thousands):
|
Year Ended December 31,
|
|||||||||||
|
2017
|
2016
|
2015
|
|||||||||
|
Segment operating earnings
|
$
|
11,209
|
|
$
|
16,464
|
|
$
|
7,580
|
|
||
|
General and administrative
(1)
|
(9,707
|
)
|
(10,410
|
)
|
(9,939
|
)
|
|||||
|
Operating earnings (losses)
|
1,502
|
|
6,054
|
|
(2,359
|
)
|
|||||
|
Loss on deconsolidation of subsidiary
|
(3,505
|
)
|
—
|
|
—
|
|
|||||
|
Impairment of investment in unconsolidated affiliate
|
(2,500
|
)
|
—
|
|
—
|
|
|||||
|
Interest income
|
1,103
|
|
582
|
|
327
|
|
|||||
|
Interest expense
|
(27
|
)
|
(2
|
)
|
(13
|
)
|
|||||
|
(Losses) earnings before income taxes and investment
|
|||||||||||
|
in unconsolidated affiliate
|
$
|
(3,427
|
)
|
$
|
6,634
|
|
$
|
(2,045
|
)
|
||
_______________
|
(1)
|
General and administrative expenses for the year ended December 31, 2017 included approximately
$1.0 million
of costs related to a voluntary early retirement program we implemented in August 2017.
|
Identifiable assets by industry segment were as follows at the dates indicated (in thousands):
|
December 31,
|
|||||||||||
|
2017
|
2016
|
2015
|
|||||||||
|
Reporting segment:
|
|||||||||||
|
Marketing
|
$
|
134,745
|
|
$
|
107,257
|
|
$
|
96,723
|
|
||
|
Transportation
|
29,069
|
|
32,120
|
|
35,010
|
|
|||||
|
Oil and Gas
(1)
|
425
|
|
7,279
|
|
8,930
|
|
|||||
|
Cash and other
|
118,465
|
|
100,216
|
|
102,552
|
|
|||||
|
Total assets
|
$
|
282,704
|
|
$
|
246,872
|
|
$
|
243,215
|
|
||
____________________
|
(1)
|
At December 31, 2017, amount represents our remaining cost method investment in this segment. See Note 3 for further information.
|
Intersegment sales are insignificant. Other identifiable assets are primarily corporate cash, corporate accounts receivable, investments and properties not identified with any specific segment of our business. Accounting policies for transactions between reportable segments are consistent with applicable accounting policies as disclosed herein.
We enter into certain transactions in the normal course of business with affiliated entities including direct cost reimbursement for shared phone and administrative services. In addition, we lease our corporate office space from an affiliated entity.
We utilize our former affiliate, Bencap, to administer certain of our employee medical benefit programs including a detail audit of individual medical claims (see Note 13 for further information). Bencap earns a fee from us for providing such services at a discounted amount from its standard charge to non-affiliates. As discussed in Note 7, at
December 31, 2017
, we have
no
further ownership interest in Bencap.
54
ADAMS RESOURCES & ENERGY, INC. AND SUBSIDIARIES
NOTES TO CONSOLIDATED FINANCIAL STATEMENTS
Activities with affiliates were as follows for the periods indicated (in thousands):
|
Year Ended December 31,
|
|||||||||||
|
2017
|
2016
|
2015
|
|||||||||
|
Overhead recoveries
(1)
|
$
|
—
|
|
$
|
32
|
|
$
|
97
|
|
||
|
Affiliate billings to us
|
81
|
|
65
|
|
68
|
|
|||||
|
Billings to affiliates
|
4
|
|
5
|
|
35
|
|
|||||
|
Rentals paid to affiliate
|
583
|
|
628
|
|
618
|
|
|||||
|
Fee paid to Bencap
(2)
|
108
|
|
583
|
|
—
|
|
|||||
___________________
|
(1)
|
In connection with the operation of certain crude oil and natural gas properties, we charged related parties for administrative overhead. In late 2016, these charges ended as properties were either plugged and abandoned or operating responsibilities for these properties were transferred to another entity.
|
|
(2)
|
Amount represents fees paid to Bencap through the forfeiture of our investment during the first quarter of 2017. As a result of the investment forfeiture, Bencap is no longer an affiliate.
|
DIP Financing
In connection with its voluntary bankruptcy filing, AREC entered into the DIP Credit Agreement with AE, of which amounts outstanding were repaid during the third quarter of 2017 with proceeds from the sales of AREC’s assets. We earned interest income of approximately
$0.1 million
under the DIP Credit Agreement through
December 31, 2017
(see Note 3 for further information).
Derivative Instruments
At December 31, 2017, we had in place
20
commodity purchase and sale contracts, of which
four
of these contracts had no fair value associated with them as the contractual prices of crude oil were within the range of prices specified in the agreements. These contracts encompassed approximately:
|
•
|
452
barrels per day of crude oil during January 2018;
|
|
•
|
322
barrels per day of crude oil during February through May 2018;
|
|
•
|
258
barrels per day of crude oil during June 2018;
|
|
•
|
646
barrels per day of crude oil during July 2018;
|
|
•
|
322
barrels per day of crude oil during August through September 2018; and
|
|
•
|
258
barrels per day of crude oil during October through December 2018.
|
55
ADAMS RESOURCES & ENERGY, INC. AND SUBSIDIARIES
NOTES TO CONSOLIDATED FINANCIAL STATEMENTS
The estimated fair value of forward month commodity contracts (derivatives) reflected in the accompanying consolidated balance sheet were as follows at the date indicated (in thousands):
|
December 31, 2017
|
|||||||||||||||
|
Balance Sheet Location and Amount
|
|||||||||||||||
|
Current
|
Other
|
Current
|
Other
|
||||||||||||
|
Assets
|
Assets
|
Liabilities
|
Liabilities
|
||||||||||||
|
Asset derivatives:
|
|||||||||||||||
|
Fair value forward hydrocarbon commodity
|
|||||||||||||||
|
contracts at gross valuation
|
$
|
166
|
|
$
|
—
|
|
$
|
—
|
|
$
|
—
|
|
|||
|
Liability derivatives:
|
|||||||||||||||
|
Fair value forward hydrocarbon commodity
|
|||||||||||||||
|
contracts at gross valuation
|
—
|
|
—
|
|
145
|
|
—
|
|
|||||||
|
Less counterparty offsets
|
—
|
|
—
|
|
—
|
|
—
|
|
|||||||
|
As reported fair value contracts
|
$
|
166
|
|
$
|
—
|
|
$
|
145
|
|
$
|
—
|
|
|||
At
December 31, 2016
,
two
contracts comprised our derivative valuations. These contracts encompassed approximately
65
barrels per day of diesel fuel during January through March 2017 and
145,000
barrels of crude oil per month during January through April 2017.
The estimated fair value of forward month commodity contracts (derivatives) reflected in the accompanying consolidated balance sheet were as follows at the date indicated (in thousands):
|
December 31, 2016
|
|||||||||||||||
|
Balance Sheet Location and Amount
|
|||||||||||||||
|
Current
|
Other
|
Current
|
Other
|
||||||||||||
|
Assets
|
Assets
|
Liabilities
|
Liabilities
|
||||||||||||
|
Asset derivatives:
|
|||||||||||||||
|
Fair value forward hydrocarbon commodity
|
|||||||||||||||
|
contracts at gross valuation
|
$
|
378
|
|
$
|
—
|
|
$
|
—
|
|
$
|
—
|
|
|||
|
Liability derivatives:
|
|||||||||||||||
|
Fair value forward hydrocarbon commodity
|
|||||||||||||||
|
contracts at gross valuation
|
—
|
|
—
|
|
330
|
|
—
|
|
|||||||
|
Less counterparty offsets
|
(266
|
)
|
—
|
|
(266
|
)
|
—
|
|
|||||||
|
As reported fair value contracts
|
$
|
112
|
|
$
|
—
|
|
$
|
64
|
|
$
|
—
|
|
|||
We only enter into commodity contracts with creditworthy counterparties and evaluate our exposure to significant counterparties on an ongoing basis. At
December 31, 2017
and
2016
, we were not holding nor have we posted any collateral to support our forward month fair value derivative activity. We are not subject to any credit-risk related trigger events. We have no other financial investment arrangements that would serve to offset our derivative contracts.
Forward month commodity contracts (derivatives) reflected in the accompanying consolidated statements of operations were as follows for the periods indicated (in thousands):
|
Gains (Losses)
|
|||||||||||
|
Year Ended December 31,
|
|||||||||||
|
2017
|
2016
|
2015
|
|||||||||
|
Revenues – marketing
|
$
|
(26
|
)
|
$
|
243
|
|
$
|
(188
|
)
|
||
56
ADAMS RESOURCES & ENERGY, INC. AND SUBSIDIARIES
NOTES TO CONSOLIDATED FINANCIAL STATEMENTS
Fair Value Measurements
The following tables set forth, by level with the Level 1, 2 and 3 fair value hierarchy, the carrying values of our financial assets and liabilities at the dates indicated (in thousands):
|
December 31, 2017
|
|||||||||||||||||||
|
Fair Value Measurements Using
|
|||||||||||||||||||
|
Quoted Prices
|
|||||||||||||||||||
|
in Active
|
Significant
|
||||||||||||||||||
|
Markets for
|
Other
|
Significant
|
|||||||||||||||||
|
Identical Assets
|
Observable
|
Unobservable
|
|||||||||||||||||
|
and Liabilities
|
Inputs
|
Inputs
|
Counterparty
|
||||||||||||||||
|
(Level 1)
|
(Level 2)
|
(Level 3)
|
Offsets
|
Total
|
|||||||||||||||
|
Derivatives:
|
|||||||||||||||||||
|
Current assets
|
$
|
—
|
|
$
|
166
|
|
$
|
—
|
|
$
|
—
|
|
$
|
166
|
|
||||
|
Current liabilities
|
—
|
|
(145
|
)
|
—
|
|
—
|
|
(145
|
)
|
|||||||||
|
Net value
|
$
|
—
|
|
$
|
21
|
|
$
|
—
|
|
$
|
—
|
|
$
|
21
|
|
||||
|
December 31, 2016
|
|||||||||||||||||||
|
Fair Value Measurements Using
|
|||||||||||||||||||
|
Quoted Prices
|
|||||||||||||||||||
|
in Active
|
Significant
|
||||||||||||||||||
|
Markets for
|
Other
|
Significant
|
|||||||||||||||||
|
Identical Assets
|
Observable
|
Unobservable
|
|||||||||||||||||
|
and Liabilities
|
Inputs
|
Inputs
|
Counterparty
|
||||||||||||||||
|
(Level 1)
|
(Level 2)
|
(Level 3)
|
Offsets
|
Total
|
|||||||||||||||
|
Derivatives:
|
|||||||||||||||||||
|
Current assets
|
$
|
—
|
|
$
|
378
|
|
$
|
—
|
|
$
|
(266
|
)
|
$
|
112
|
|
||||
|
Current liabilities
|
—
|
|
(330
|
)
|
—
|
|
266
|
|
(64
|
)
|
|||||||||
|
Net value
|
$
|
—
|
|
$
|
48
|
|
$
|
—
|
|
$
|
—
|
|
$
|
48
|
|
||||
These assets and liabilities are measured on a recurring basis and are classified based on the lowest level of input used to estimate their fair value. Our assessment of the relative significance of these inputs requires judgments.
When determining fair value measurements, we make credit valuation adjustments to reflect both our own nonperformance risk and our counterparty’s nonperformance risk. When adjusting the fair value of derivative contracts for the effect of nonperformance risk, we consider the impact of netting and any applicable credit enhancements. Credit valuation adjustments utilize Level 3 inputs, such as credit scores to evaluate the likelihood of default by us or our counterparties. At
December 31, 2017
and
2016
, credit valuation adjustments were not significant to the overall valuation of our fair value contracts. As a result, applicable fair value assets and liabilities are included in their entirety in the fair value hierarchy.
57
ADAMS RESOURCES & ENERGY, INC. AND SUBSIDIARIES
NOTES TO CONSOLIDATED FINANCIAL STATEMENTS
Nonrecurring Fair Value Measurements
Certain nonfinancial assets and liabilities are measured at fair value on a nonrecurring basis and are subject to fair value adjustments in certain circumstances, such as when there is evidence of impairment. The following table presents categories of long-lived assets that were subject to non-recurring fair value measurements during the year ended
December 31, 2017
(in thousands):
|
Fair Value Measurements at the End of the Reporting Period Using
|
|||||||||||||||||||
|
Quoted Prices
|
|||||||||||||||||||
|
in Active
|
Significant
|
||||||||||||||||||
|
Carrying
|
Markets for
|
Other
|
Significant
|
Total
|
|||||||||||||||
|
Value at
|
Identical Assets
|
Observable
|
Unobservable
|
Non-Cash
|
|||||||||||||||
|
December 31,
|
and Liabilities
|
Inputs
|
Inputs
|
Impairment
|
|||||||||||||||
|
2017
|
(Level 1)
|
(Level 2)
|
(Level 3)
|
Loss
|
|||||||||||||||
|
Oil and gas properties -
|
|||||||||||||||||||
|
Investment in AREC
|
$
|
425
|
|
$
|
—
|
|
$
|
425
|
|
$
|
—
|
|
$
|
3,505
|
|
||||
|
Investment in VestaCare
|
—
|
|
—
|
|
—
|
|
—
|
|
2,500
|
|
|||||||||
|
$
|
6,005
|
|
|||||||||||||||||
The following table presents categories of long-lived assets that were subject to non-recurring fair value measurements during the year ended December 31, 2016 (in thousands):
|
Fair Value Measurements at the End of the Reporting Period Using
|
|||||||||||||||||||
|
Quoted Prices
|
|||||||||||||||||||
|
in Active
|
Significant
|
||||||||||||||||||
|
Carrying
|
Markets for
|
Other
|
Significant
|
Total
|
|||||||||||||||
|
Value at
|
Identical Assets
|
Observable
|
Unobservable
|
Non-Cash
|
|||||||||||||||
|
December 31,
|
and Liabilities
|
Inputs
|
Inputs
|
Impairment
|
|||||||||||||||
|
2016
|
(Level 1)
|
(Level 2)
|
(Level 3)
|
Loss
|
|||||||||||||||
|
Investment in Bencap
|
$
|
—
|
|
$
|
—
|
|
$
|
—
|
|
$
|
—
|
|
$
|
2,200
|
|
||||
|
Oil and gas properties
|
62,784
|
|
—
|
|
—
|
|
62,784
|
|
313
|
|
|||||||||
|
$
|
2,513
|
|
|||||||||||||||||
The following table presents categories of long-lived assets that were subject to non-recurring fair value measurements during the year ended December 31, 2015 (in thousands):
|
Fair Value Measurements at the End of the Reporting Period Using
|
|||||||||||||||||||
|
Quoted Prices
|
|||||||||||||||||||
|
in Active
|
Significant
|
||||||||||||||||||
|
Carrying
|
Markets for
|
Other
|
Significant
|
Total
|
|||||||||||||||
|
Value at
|
Identical Assets
|
Observable
|
Unobservable
|
Non-Cash
|
|||||||||||||||
|
December 31,
|
and Liabilities
|
Inputs
|
Inputs
|
Impairment
|
|||||||||||||||
|
2015
|
(Level 1)
|
(Level 2)
|
(Level 3)
|
Loss
|
|||||||||||||||
|
Oil and gas properties
|
$
|
77,117
|
|
$
|
—
|
|
$
|
—
|
|
$
|
77,117
|
|
$
|
12,082
|
|
||||
58
ADAMS RESOURCES & ENERGY, INC. AND SUBSIDIARIES
NOTES TO CONSOLIDATED FINANCIAL STATEMENTS
The components of our income tax (provision) benefit were as follows for the periods indicated (in thousands):
|
Year Ended December 31,
|
|||||||||||
|
2017
|
2016
|
2015
|
|||||||||
|
Current:
|
|||||||||||
|
Federal
|
$
|
(1,418
|
)
|
$
|
(2,103
|
)
|
$
|
(3,883
|
)
|
||
|
State
|
523
|
|
(675
|
)
|
(190
|
)
|
|||||
|
Total current
|
(895
|
)
|
(2,778
|
)
|
(4,073
|
)
|
|||||
|
Deferred:
|
|||||||||||
|
Federal
|
3,722
|
|
777
|
|
5,011
|
|
|||||
|
State
|
118
|
|
80
|
|
(168
|
)
|
|||||
|
Total deferred
|
3,840
|
|
857
|
|
4,843
|
|
|||||
|
Total provision for (benefit from) income taxes
(1)
|
$
|
2,945
|
|
$
|
(1,921
|
)
|
$
|
770
|
|
||
______________
|
(1)
|
2016 includes a tax benefit of
$0.8 million
related to losses from our investment in Bencap, and is included in the loss from investment in unconsolidated affiliate category on the consolidated statements of operations.
|
A reconciliation of the provision for (benefit from) income taxes with amounts determined by applying the statutory U.S. federal income tax rate to income before income taxes was as follows for the periods indicated (in thousands):
|
Year Ended December 31,
|
|||||||||||
|
2017
|
2016
|
2015
|
|||||||||
|
Pre-tax net book income
(1)
|
$
|
(3,427
|
)
|
$
|
4,434
|
|
$
|
(2,045
|
)
|
||
|
Statutory federal income tax (provision) benefit
|
$
|
1,165
|
|
$
|
(1,552
|
)
|
$
|
716
|
|
||
|
State income tax (provision) benefit
|
736
|
|
(387
|
)
|
(233
|
)
|
|||||
|
Federal statutory depletion
|
153
|
|
62
|
|
144
|
|
|||||
|
Federal tax rate adjustment
|
2,007
|
|
—
|
|
—
|
|
|||||
|
Valuation allowance
|
(1,038
|
)
|
—
|
|
—
|
|
|||||
|
Other
|
(78
|
)
|
(44
|
)
|
143
|
|
|||||
|
Total provision for (benefit from) income taxes
|
$
|
2,945
|
|
$
|
(1,921
|
)
|
$
|
770
|
|
||
|
Effective income tax rate
(2)
|
86
|
%
|
43
|
%
|
38
|
%
|
|||||
_______________
|
(1)
|
2016 includes the pre-tax loss from investment in unconsolidated affiliate of
$2.2 million
.
|
|
(2)
|
Excluding the adjustment related to the federal tax rate change, the effective income tax rate for 2017 is
58 percent
.
|
59
ADAMS RESOURCES & ENERGY, INC. AND SUBSIDIARIES
NOTES TO CONSOLIDATED FINANCIAL STATEMENTS
Deferred income taxes reflect the net difference between the financial statement carrying amounts and the underlying income tax basis in these items. The components of the federal deferred tax asset (liability) were as follows at the dates indicated (in thousands):
|
December 31,
|
|||||||
|
2017
|
2016
|
||||||
|
Long-term deferred tax asset (liability):
(1)
|
|||||||
|
Prepaid and other insurance
|
$
|
(684
|
)
|
$
|
(1,058
|
)
|
|
|
Property
|
(2,497
|
)
|
(7,341
|
)
|
|||
|
Investments in unconsolidated affiliates
|
623
|
|
606
|
|
|||
|
Valuation allowance related to investments in unconsolidated affiliates
|
(623
|
)
|
—
|
|
|||
|
Uniform capitalization
|
—
|
|
729
|
|
|||
|
Other
|
(121
|
)
|
(93
|
)
|
|||
|
Net long-term deferred tax liability
|
(3,302
|
)
|
(7,157
|
)
|
|||
|
Net deferred tax liability
|
$
|
(3,302
|
)
|
$
|
(7,157
|
)
|
|
______________
|
(1)
|
Amounts as of December 31, 2017 have been revalued at 21 percent as a result of the enactment of the Tax Cuts and Jobs Act on December 22, 2017.
|
Financial statement recognition and measurement of positions taken, or expected to be taken, by an entity in its income tax returns must consider the uncertainty and judgment involved in the determination and filing of income taxes. Tax positions taken in an income tax return that are recognized in the financial statements must satisfy a more-likely-than-not recognition threshold, assuming that the tax position will be examined by taxing authorities with full knowledge of all relevant information. We have no significant unrecognized tax benefits. Interest and penalties associated with income tax liabilities are classified as income tax expense.
The earliest tax years remaining open for audit for federal and major states of operations are as follows:
|
Earliest Open
|
|
|
Tax Year
|
|
|
Federal
|
2013
|
|
Texas
|
2013
|
|
Louisiana
|
2014
|
|
Michigan
|
2013
|
Other Matters
The Tax Cuts and Jobs Act (the “Act”) was signed into law on December 22, 2017. The Act changed many aspects of U.S. corporate income taxation and included a reduction of the corporate income tax rate from 35 percent to 21 percent, implementation of a territorial tax system and imposition of a tax on deemed repatriated earnings of foreign subsidiaries. We recognized the tax effects of the Act in the year ended December 31, 2017 and recorded a
$2.0 million
tax benefit, which relates entirely to the remeasurement of deferred tax liabilities to the 21 percent tax rate. Upon completion of our 2017 U.S. income tax return in 2018, we may identify additional remeasurement adjustments to our recorded deferred tax liabilities. We will continue to assess our income taxes as future guidance is issued but do not currently anticipate significant revisions will be necessary. Any such revisions will be treated in accordance with the measurement period guidance outlined in Staff Accounting Bulletin No. 118.
60
ADAMS RESOURCES & ENERGY, INC. AND SUBSIDIARIES
NOTES TO CONSOLIDATED FINANCIAL STATEMENTS
Supplemental cash flows and non-cash transactions were as follows for the periods indicated (in thousands):
|
Year Ended December 31,
|
|||||||||||
|
2017
|
2016
|
2015
|
|||||||||
|
Cash paid for interest
|
$
|
22
|
|
$
|
2
|
|
$
|
13
|
|
||
|
Cash paid for federal and state taxes
|
459
|
|
2,589
|
|
6,197
|
|
|||||
|
Non-cash transactions:
|
|||||||||||
|
Change in accounts payable related to property and equipment
additions
|
70
|
|
679
|
|
1,707
|
|
|||||
|
Property and equipment acquired under capital leases
|
1,808
|
|
—
|
|
—
|
|
|||||
Capital Lease Obligations
During the third quarter of 2017, we entered into capital leases for certain of our tractors in our marketing segment. The following table summarizes our principal contractual commitments outstanding under our capital leases at December 31, 2017 for the next five years, and in total thereafter (in thousands):
|
2018
|
$
|
398
|
|
|
2019
|
398
|
|
|
|
2020
|
398
|
|
|
|
2021
|
398
|
|
|
|
2022
|
255
|
|
|
|
Thereafter
|
—
|
|
|
|
Total minimum lease payments
|
1,847
|
|
|
|
Less: Amount representing interest
|
(158
|
)
|
|
|
Present value of capital lease obligations
|
1,689
|
|
|
|
Less current portion of capital lease obligations
|
(338
|
)
|
|
|
Total long-term capital lease obligations
|
$
|
1,351
|
|
Operating Lease Obligations
We lease certain property and equipment under noncancellable and cancelable operating leases. Our significant lease agreements consist of (i) arrangements with independent truck owner-operators for use of their equipment and driver services; (ii) leased office space; and (iii) certain lease and terminal access contracts in order to provide tank storage and dock access for our crude oil marketing business. Currently, our significant lease agreements have terms that range from
one
to
eight
years.
61
ADAMS RESOURCES & ENERGY, INC. AND SUBSIDIARIES
NOTES TO CONSOLIDATED FINANCIAL STATEMENTS
Lease expense is charged to operating costs and expenses on a straight-line basis over the period of expected economic benefit. Contingent rental payments are expensed as incurred. We are generally required to perform routine maintenance on the underlying leased assets. Maintenance and repairs of leased assets resulting from our operations are charged to expense as incurred. Rental expense was as follows for the periods indicated (in thousands):
|
Year Ended December 31,
|
|||||||||||
|
2017
|
2016
|
2015
|
|||||||||
|
Rental expense
|
$
|
12,073
|
|
$
|
11,314
|
|
$
|
11,168
|
|
||
At
December 31, 2017
, rental obligations under non-cancelable operating leases and terminal arrangements with terms in excess of one year for the next five years and thereafter are payable as follows (in thousands):
|
2018
|
2019
|
2020
|
2021
|
2022
|
Thereafter
|
Total
|
||||||||||||||||||||||
|
Operating leases
|
$
|
2,758
|
|
$
|
463
|
|
$
|
68
|
|
$
|
63
|
|
$
|
32
|
|
$
|
23
|
|
$
|
3,407
|
|
|||||||
Insurance Policies
Under our automobile and workers’ compensation insurance policies that were in place through September 30, 2017, we pre-funded our estimated losses, and therefore, we could either receive a return of premium paid or be assessed for additional premiums up to pre-established limits. Additionally, in certain instances, the risk of insured losses was shared with a group of similarly situated entities through an insurance captive. We have appropriately recognized estimated expenses and liabilities related to these policies for losses incurred but not reported to us or our insurance carrier. The amount of pre-funded insurance premiums left to cover potential future losses totaled as follows at the dates indicated (in thousands):
|
December 31,
|
|||||||
|
2017
|
2016
|
||||||
|
Pre-funded premiums for losses incurred but not reported
|
$
|
988
|
|
$
|
2,657
|
|
|
If the potential insurance claims do not further develop, the pre-funded premiums will be returned to us as a premium refund.
Effective October 1, 2017, we changed the structure of our automobile and workers’ compensation insurance policies. We have exited the group captive and now establish a liability for expected claims incurred but not reported on a monthly basis as we move forward. As claims are paid, the liability is relieved. At December 31, 2017, our accrual for automobile and workers’ compensation claims was
$0.5 million
.
We maintain a self-insurance program for managing employee medical claims. A liability for expected claims incurred but not reported is established on a monthly basis. As claims are paid, the liability is relieved. We also maintain third party insurance stop-loss coverage for annual aggregate medical claims exceeding
$4.5 million
. Medical accrual amounts were as follows at the dates indicated (in thousands):
|
December 31,
|
|||||||
|
2017
|
2016
|
||||||
|
Accrued medical claims
|
$
|
1,329
|
|
$
|
1,411
|
|
|
62
ADAMS RESOURCES & ENERGY, INC. AND SUBSIDIARIES
NOTES TO CONSOLIDATED FINANCIAL STATEMENTS
Litigation
AREC was named as a defendant in a number of Louisiana lawsuits involving alleged environmental contamination from prior drilling operations. Such suits typically allege improper disposal of oilfield wastes in earthen pits, with
one
matter involving allegations that drilling operations in 1986 contributed to the formation of a sinkhole in 2012 (the “Sinkhole Cases”). The Sinkhole Cases, while arising from a singular event, include a number of different lawsuits brought in Louisiana State Court and one consolidated action in the United States District Court for the Eastern District of Louisiana. In addition to the Sinkhole Cases, AREC is also currently involved in two other suits. These suits are styled
LePetit Chateau Deluxe v. Adams Resources Exploration Corporation
dated March 2004 filed in Acadia Parish, Louisiana, and
Henning Management, LLC v. Adams Resources Exploration Corporation
dated November 2013 filed in Jefferson Davis Parish, Louisiana. Each suit involves multiple industry defendants with substantially larger proportional interest in the properties. In the
LePetit Chateau Deluxe
matter, all the larger defendants have settled the case.
The plaintiffs in each of these matters are seeking unspecified compensatory and punitive damages. While we do not believe that these claims will result in a material adverse effect on us, significant attorney fees may be incurred to address claims related to these suits. At
December 31, 2016
, we had
$0.5 million
accrued for future legal costs for these matters. During May 2017, AREC was dismissed without prejudice as a party to the suit with
Henning Management.
We also determined that the likelihood of future claims from other remaining litigation was remote. As such, we released the
$0.5 million
accrual for future legal settlements related to these matters. At
December 31, 2017
, we had
no
remaining accruals for legal costs for these matters.
From time to time as incidental to our operations, we may become involved in various lawsuits and/or disputes. Primarily as an operator of an extensive trucking fleet, we are a party to motor vehicle accidents, worker compensation claims and other items of general liability as would be typical for the industry. We are presently unaware of any claims against us that are either outside the scope of insurance coverage or that may exceed the level of insurance coverage and could potentially represent a material adverse effect on our financial position or results of operations.
Guarantees
AE issues parent guarantees of commitments associated with the activities of its subsidiary companies. The guarantees generally result from subsidiary commodity purchase obligations, subsidiary operating lease commitments and subsidiary banking transactions. The nature of these arrangements is to guarantee the performance of the subsidiary in meeting their respective underlying obligations. The parent would only be called upon to perform under the guarantee in the event of a payment default by the applicable subsidiary company. In satisfying such obligations, the parent would first look to the assets of the defaulting subsidiary company.
At
December 31, 2017
, parental guaranteed obligations were approximately
$48.2 million
. Currently, neither AE nor any of its subsidiaries has any other types of guarantees outstanding that require liability recognition.
We may incur credit risk to the extent our customers do not fulfill their obligations to us pursuant to contractual terms. Risks of nonpayment and nonperformance by our customers are a major consideration in our business, and our credit procedures and policies may not be adequate to sufficiently eliminate customer credit risk. Managing credit risk involves a number of considerations, such as the financial profile of the customer, the value of collateral held, if any, specific terms and duration of the contractual agreement, and the customer’s sensitivity to economic developments. We have established various procedures to manage credit exposure, including initial credit approval, credit limits, and rights of offset. We also utilize letters of credit and guarantees to limit exposure.
63
ADAMS RESOURCES & ENERGY, INC. AND SUBSIDIARIES
NOTES TO CONSOLIDATED FINANCIAL STATEMENTS
Our largest customers consist of large multinational integrated crude oil companies and independent domestic refiners of crude oil. In addition, we transact business with independent crude oil producers, major chemical concerns, crude oil trading companies and a variety of commercial energy users. Within this group of customers, we derive approximately
50 percent
of our revenues from
three
to
five
large crude oil refining customers. While we have ongoing established relationships with certain domestic refiners of crude oil, alternative markets are readily available since we supply less than
one percent
of U.S. domestic refiner demand. As a fungible commodity delivered to major Gulf Coast supply points, our crude oil sales can be readily delivered to alternative end markets.
We believe that a loss of any of those customers where we currently derive more than 10 percent of our revenues would not have a material adverse effect on our operations as shown in the table below:
|
Individual customer sales
|
Individual customer receivables in excess
|
|||||||||||||||
|
in excess of 10% of revenues
|
of 10% of total receivables
|
|||||||||||||||
|
for the year ended December 31,
|
at December 31,
|
|||||||||||||||
|
2017
|
2016
|
2015
|
2017
|
2016
|
2015
|
|||||||||||
|
22.8
|
%
|
18.2
|
%
|
24.4
|
%
|
19.1
|
%
|
20.9
|
%
|
20.3
|
%
|
|||||
|
17.1
|
%
|
16.5
|
%
|
13.8
|
%
|
15.0
|
%
|
14.0
|
%
|
16.5
|
%
|
|||||
|
10.8
|
%
|
15.9
|
%
|
11.1
|
%
|
10.1
|
%
|
12.7
|
%
|
|||||||
|
10.7
|
%
|
10.6
|
%
|
10.4
|
%
|
|||||||||||
64
ADAMS RESOURCES & ENERGY, INC. AND SUBSIDIARIES
NOTES TO CONSOLIDATED FINANCIAL STATEMENTS
The following table presents selected quarterly financial data for the periods indicated (in thousands, except per share data):
|
First
|
Second
|
Third
|
Fourth
|
||||||||||||
|
Quarter
|
Quarter
|
Quarter
|
Quarter
|
||||||||||||
|
Year Ended December 31, 2017
|
|||||||||||||||
|
Revenues
|
$
|
303,087
|
|
$
|
315,202
|
|
$
|
295,311
|
|
$
|
408,460
|
|
|||
|
Operating (losses) earnings
|
(1,584
|
)
|
619
|
|
(1,290
|
)
|
3,757
|
|
|||||||
|
Earnings (losses) from continuing operations
|
(860
|
)
|
(282
|
)
|
(3,033
|
)
|
3,693
|
|
|||||||
|
Net (losses) earnings
|
(860
|
)
|
(282
|
)
|
(3,033
|
)
|
3,693
|
|
|||||||
|
Earnings (losses) per share:
|
|||||||||||||||
|
From continuing operations
|
$
|
(0.20
|
)
|
$
|
(0.07
|
)
|
$
|
(0.72
|
)
|
$
|
0.88
|
|
|||
|
From investment in unconsolidated
|
|||||||||||||||
|
affiliate
|
—
|
|
—
|
|
—
|
|
—
|
|
|||||||
|
Basic and diluted net (losses) earnings per share
|
$
|
(0.20
|
)
|
$
|
(0.07
|
)
|
$
|
(0.72
|
)
|
$
|
0.88
|
|
|||
|
Year Ended December 31, 2016
|
|||||||||||||||
|
Revenues
|
$
|
250,531
|
|
$
|
293,163
|
|
$
|
256,877
|
|
$
|
298,969
|
|
|||
|
Operating (losses) earnings
|
2,339
|
|
5,601
|
|
(1,822
|
)
|
(64
|
)
|
|||||||
|
Earnings (losses) from continuing operations
|
1,554
|
|
3,540
|
|
(983
|
)
|
(168
|
)
|
|||||||
|
Net (losses) earnings
|
1,430
|
|
3,404
|
|
(2,153
|
)
|
(168
|
)
|
|||||||
|
Earnings (losses) per share:
|
|||||||||||||||
|
From continuing operations
|
$
|
0.37
|
|
$
|
0.84
|
|
$
|
(0.23
|
)
|
$
|
(0.04
|
)
|
|||
|
From investment in unconsolidated
|
|||||||||||||||
|
affiliate
|
(0.03
|
)
|
(0.03
|
)
|
(0.28
|
)
|
—
|
|
|||||||
|
Basic and diluted net (losses) earnings per share
|
$
|
0.34
|
|
$
|
0.81
|
|
$
|
(0.51
|
)
|
$
|
(0.04
|
)
|
|||
65
ADAMS RESOURCES & ENERGY, INC. AND SUBSIDIARIES
NOTES TO CONSOLIDATED FINANCIAL STATEMENTS
Our wholly owned subsidiary, AREC, participated in the exploration and development of domestic crude oil and natural gas properties primarily in the Permian Basin of West Texas and the Haynesville Shale. AREC’s offices were maintained in Houston, and at December 31, 2016, we held an interest in
470
producing wells of which we operated
six
. As discussed further in Note 3, AREC was deconsolidated effective with its bankruptcy filing in April 2017, and we recorded our investment in AREC under the cost method of accounting in April 2017. During the third quarter of 2017, AREC closed on the sale of substantially all of its assets. As a result of the sales of these assets, we no longer have an ownership interest in any crude oil and natural gas producing activities. In the disclosures and tables below, amounts for 2017 are for the period from January 1, 2017 through April 30, 2017, as a result of the deconsolidation of AREC due to its bankruptcy filing.
Crude Oil and Natural Gas Producing Activities
Total costs incurred in crude oil and natural gas exploration and development activities, all within the U.S., were as follows for the periods indicated (in thousands):
|
Year Ended December 31,
|
|||||||||||
|
2017
|
2016
|
2015
|
|||||||||
|
Property acquisition costs:
|
|||||||||||
|
Unproved
|
$
|
4
|
|
$
|
32
|
|
$
|
348
|
|
||
|
Proved
|
—
|
|
—
|
|
—
|
|
|||||
|
Exploration costs:
|
|||||||||||
|
Expensed
|
5
|
|
291
|
|
1,667
|
|
|||||
|
Capitalized
|
—
|
|
—
|
|
—
|
|
|||||
|
Development costs
|
1,815
|
|
—
|
|
370
|
|
|||||
|
Total costs incurred
|
$
|
1,824
|
|
$
|
323
|
|
$
|
2,385
|
|
||
The aggregate capitalized costs relative to crude oil and natural gas producing activities were as follows at the dates indicated (in thousands):
|
December 31,
|
|||||||
|
2017
|
2016
|
||||||
|
Unproved crude oil and natural gas properties
|
$
|
—
|
|
$
|
—
|
|
|
|
Proved crude oil and natural gas properties
|
—
|
|
62,784
|
|
|||
|
Subtotal
|
—
|
|
62,784
|
|
|||
|
Accumulated depreciation, depletion and amortization
|
—
|
|
(56,426
|
)
|
|||
|
Net capitalized cost
|
$
|
—
|
|
$
|
6,358
|
|
|
66
ADAMS RESOURCES & ENERGY, INC. AND SUBSIDIARIES
NOTES TO CONSOLIDATED FINANCIAL STATEMENTS
Estimated Crude Oil and Natural Gas Reserves
The following information regarding estimates of our proved crude oil and natural gas reserves, substantially all located onshore in Texas and Louisiana, was based on reports prepared on our behalf by our independent petroleum engineers. Because crude oil and natural gas reserve estimates are inherently imprecise and require extensive judgments of reservoir engineering data, they are generally less precise than estimates made in conjunction with financial disclosures. The revisions of previous estimates as reflected in the table below result from changes in commodity pricing assumptions and from more precise engineering calculations based upon additional production histories and price changes. As discussed previously, AREC was deconsolidated effective with its bankruptcy filing in April 2017, and we recorded our investment in AREC under the cost method of accounting in April 2017. During the third quarter of 2017, AREC closed on the sale of substantially all of its assets. As a result of the sales of these assets, we no longer have an ownership interested in any crude oil and natural gas producing activities. In the tables below, amounts for 2017 are for the period from January 1, 2017 through April 30, 2017, as a result of the deconsolidation of AREC due to its bankruptcy filing.
Proved developed and undeveloped reserves were as follows for the periods indicated (in thousands):
|
Year Ended December 31,
|
|||||||||||||||||
|
2017
|
2016
|
2015
|
|||||||||||||||
|
Natural
|
Crude
|
Natural
|
Crude
|
Natural
|
Crude
|
||||||||||||
|
Gas
|
Oil
|
Gas
|
Oil
|
Gas
|
Oil
|
||||||||||||
|
(Mcf)
|
(Bbls)
|
(Mcf)
|
(Bbls)
|
(Mcf)
|
(Bbls)
|
||||||||||||
|
Total proved reserves:
|
|
||||||||||||||||
|
Beginning of year
|
4,214
|
|
187
|
|
4,835
|
|
226
|
|
5,611
|
|
318
|
|
|||||
|
Revisions of previous estimates
|
—
|
|
—
|
|
65
|
|
24
|
|
27
|
|
(2
|
)
|
|||||
|
Crude oil and natural gas reserves sold
|
(4,067
|
)
|
(170
|
)
|
(175
|
)
|
(4
|
)
|
—
|
|
(3
|
)
|
|||||
|
Extensions, discoveries and other
|
|||||||||||||||||
|
reserve additions
|
42
|
|
6
|
|
151
|
|
18
|
|
86
|
|
13
|
|
|||||
|
Production
|
(189
|
)
|
(23
|
)
|
(662
|
)
|
(77
|
)
|
(889
|
)
|
(100
|
)
|
|||||
|
End of year
|
—
|
|
—
|
|
4,214
|
|
187
|
|
4,835
|
|
226
|
|
|||||
The components of our previously owned proved crude oil and natural gas reserves, all within the U.S., were as follows for the periods indicated (in thousands):
|
Year Ended December 31,
|
|||||||||||||||||
|
2017
|
2016
|
2015
|
|||||||||||||||
|
Natural
|
Crude
|
Natural
|
Crude
|
Natural
|
Crude
|
||||||||||||
|
Gas
|
Oil
|
Gas
|
Oil
|
Gas
|
Oil
|
||||||||||||
|
(Mcf)
|
(Bbls)
|
(Mcf)
|
(Bbls)
|
(Mcf)
|
(Bbls)
|
||||||||||||
|
Proved developed reserves
|
—
|
|
—
|
|
4,214
|
|
187
|
|
4,813
|
|
223
|
|
|||||
|
Proved undeveloped reserves
|
—
|
|
—
|
|
—
|
|
—
|
|
22
|
|
3
|
|
|||||
|
Total proved reserves
|
—
|
|
—
|
|
4,214
|
|
187
|
|
4,835
|
|
226
|
|
|||||
We had developed internal policies and controls for estimating and recording crude oil and natural gas reserve data. The estimation and recording of proved reserves is required to be in compliance with SEC definitions and guidance. We assigned responsibility for compliance in reserve bookings to the office of President of AREC. No portion of this individual’s compensation was directly dependent on the quantity of reserves booked. Reserve estimates are required to be made by qualified reserve estimators, as defined by Society of Petroleum Engineers’ Standards.
67
ADAMS RESOURCES & ENERGY, INC. AND SUBSIDIARIES
NOTES TO CONSOLIDATED FINANCIAL STATEMENTS
We employed a third party petroleum consultant, Ryder Scott Company, to prepare our crude oil and natural gas reserve data estimates as of
December 31, 2016
and
2015
. The firm of Ryder Scott is well recognized within the industry for more than 50 years. As prescribed by the SEC, such proved reserves were estimated using
12
-month average crude oil and natural gas prices, based on the first-day-of-the-month price for each month in the period, and year-end production and development costs for each of the years presented, all without escalation.
The process of estimating crude oil and natural gas reserves is complex and requires significant judgment. Uncertainties are inherent in estimating quantities of proved reserves, including many factors beyond the estimator’s control. Reserve engineering is a subjective process of estimating subsurface accumulations of crude oil and natural gas that cannot be measured in an exact manner, and the accuracy of any reserve estimate is a function of the quality of available data and the interpretation thereof. As a result, assessments by different engineers often vary, sometimes significantly. In addition, physical factors such as the results of drilling, testing and production subsequent to the date of an estimate, as well as economic factors such as changes in product prices, may justify revision of such estimates. Accordingly, crude oil and natural gas quantities ultimately recovered will vary from reserve estimates.
Standardized Measure of Discounted Future Net Cash Flows from Crude Oil and Natural Gas Operations and Changes Therein
The standardized measure of discounted future net cash flows was determined based on the economic conditions in effect at the end of the years presented, except in those instances where fixed and determinable gas price escalations were included in contracts. The disclosures below do not purport to present the fair market value of our previously owned crude oil and natural gas reserves. An estimate of the fair market value would also take into account, among other things, the recovery of reserves in excess of proved reserves, anticipated future changes in prices and costs, a discount factor more representative of the time value of money and risks inherent in reserve estimates. The standardized measure of discounted future net cash flows was as follows for the periods indicated (in thousands):
|
Year Ended December 31,
|
|||||||||||
|
2017
|
2016
|
2015
|
|||||||||
|
Future gross revenues
|
$
|
—
|
|
$
|
17,938
|
|
$
|
23,040
|
|
||
|
Future costs:
|
|||||||||||
|
Lease operating expenses
|
—
|
|
(12,421
|
)
|
(14,524
|
)
|
|||||
|
Development costs
|
—
|
|
(38
|
)
|
(103
|
)
|
|||||
|
Future net cash flows before income taxes
|
—
|
|
5,479
|
|
8,413
|
|
|||||
|
Discount at 10% per annum
|
—
|
|
(2,002
|
)
|
(2,987
|
)
|
|||||
|
Discounted future net cash flows before income taxes
|
—
|
|
3,477
|
|
5,426
|
|
|||||
|
Future income taxes, net of discount at 10% per annum
|
—
|
|
(1,217
|
)
|
(1,899
|
)
|
|||||
|
Standardized measure of discounted future net cash flows
|
$
|
—
|
|
$
|
2,260
|
|
$
|
3,527
|
|
||
The estimated value of crude oil and natural gas reserves and future net revenues derived therefrom are highly dependent upon crude oil and natural gas commodity price assumptions. For such estimates, our independent petroleum engineers assumed market prices as presented in the table below:
|
Year Ended December 31,
|
|||||||||||
|
2017
|
2016
|
2015
|
|||||||||
|
Market price:
|
|||||||||||
|
Crude oil per barrel
|
$
|
—
|
|
$
|
38.34
|
|
$
|
45.83
|
|
||
|
Natural gas per thousand cubic feet (Mcf)
|
$
|
—
|
|
$
|
2.56
|
|
$
|
2.62
|
|
||
68
ADAMS RESOURCES & ENERGY, INC. AND SUBSIDIARIES
NOTES TO CONSOLIDATED FINANCIAL STATEMENTS
These prices were based on the unweighted arithmetic average of the prices in effect on the first day of the month for each month of the respective twelve month periods as required by SEC regulations. The prices reported in the reserve disclosures for natural gas included the value of associated natural gas liquids. Crude oil and natural gas reserve values and future net cash flow estimates are very sensitive to pricing assumptions and will vary accordingly.
The effect of income taxes and discounting on the standardized measure of discounted future net cash flows was as follows for the periods indicated (in thousands):
|
Year Ended December 31,
|
|||||||||||
|
2017
|
2016
|
2015
|
|||||||||
|
Future net cash flows before income taxes
|
$
|
—
|
|
$
|
5,479
|
|
$
|
8,413
|
|
||
|
Future income taxes
|
—
|
|
(1,918
|
)
|
(2,945
|
)
|
|||||
|
Future net cash flows
|
—
|
|
3,561
|
|
5,468
|
|
|||||
|
Discount at 10% per annum
|
—
|
|
(1,301
|
)
|
(1,941
|
)
|
|||||
|
Standardized measure of discounted future net cash flows
|
$
|
—
|
|
$
|
2,260
|
|
$
|
3,527
|
|
||
The principal sources of changes in the standardized measure of discounted future net cash flows were as follows for the periods indicated (in thousands):
|
Year Ended December 31,
|
|||||||||||
|
2017
|
2016
|
2015
|
|||||||||
|
Beginning of year
|
$
|
2,260
|
|
$
|
3,527
|
|
$
|
15,744
|
|
||
|
Sale of crude oil and natural gas reserves
|
(2,732
|
)
|
(350
|
)
|
(54
|
)
|
|||||
|
Net change in prices and production costs
|
—
|
|
(1,391
|
)
|
(17,622
|
)
|
|||||
|
New field discoveries and extensions, net of future
production costs
|
94
|
|
275
|
|
292
|
|
|||||
|
Sales of crude oil and natural gas produced, net of production costs
|
(476
|
)
|
87
|
|
1,038
|
|
|||||
|
Net change due to revisions in quantity estimates
|
—
|
|
181
|
|
38
|
|
|||||
|
Accretion of discount
|
130
|
|
194
|
|
1,116
|
|
|||||
|
Production rate changes and other
|
(493
|
)
|
(945
|
)
|
(3,603
|
)
|
|||||
|
Net change in income taxes
|
1,217
|
|
682
|
|
6,578
|
|
|||||
|
End of year
|
$
|
—
|
|
$
|
2,260
|
|
$
|
3,527
|
|
||
Results of Operations for Crude Oil and Natural Gas Producing Activities
The results of crude oil and natural gas producing activities, excluding corporate overhead and interest costs, were as follows for the periods indicated (in thousands):
|
Year Ended December 31,
|
|||||||||||
|
2017
|
2016
|
2015
|
|||||||||
|
Revenues
|
$
|
1,427
|
|
$
|
3,410
|
|
$
|
5,063
|
|
||
|
Costs and expenses:
|
|||||||||||
|
Production
|
(951
|
)
|
(3,337
|
)
|
(7,022
|
)
|
|||||
|
Producing property impairment
|
—
|
|
(30
|
)
|
(10,324
|
)
|
|||||
|
Exploration
|
—
|
|
—
|
|
(1,667
|
)
|
|||||
|
Depreciation, depletion and amortization
|
(423
|
)
|
(1,546
|
)
|
(5,066
|
)
|
|||||
|
Operating loss before income taxes
|
53
|
|
(1,503
|
)
|
(19,016
|
)
|
|||||
|
Income tax benefit (expense)
|
(19
|
)
|
526
|
|
6,656
|
|
|||||
|
Operating earnings (losses)
|
$
|
34
|
|
$
|
(977
|
)
|
$
|
(12,360
|
)
|
||
69
|
Item 9.
|
Changes in and Disagreements with Accountants on Accounting and Financial Disclosure.
|
On June 7, 2017, we dismissed Deloitte & Touche, LLP (“Deloitte”) as our independent registered public accounting firm. There was no dispute or disagreement with the firm on any issue. On June 7, 2017, we appointed KPMG LLP as our new independent registered public accounting firm to perform independent audit services for the fiscal year ended December 31, 2017.
Item 9A.
Controls and Procedures.
Disclosure Controls and Procedures
As of the end of the period covered by this annual report, our management carried out an evaluation, with the participation of our Executive Chairman and Chief Financial Officer, of the effectiveness of our disclosure controls and procedures pursuant to Rule 13a-15(e) and 15d-15(e) of the Exchange Act. Based on this evaluation, as of the end of the period covered by this annual report, our Executive Chairman and our Chief Financial Officer concluded:
|
(i)
|
that our disclosure controls and procedures are designed to ensure that information required to be disclosed by us in the reports that we file or submit under the Exchange Act is recorded, processed, summarized and reported within the time periods specified in the SEC’s rules and forms, and that such information is accumulated and communicated to our management, including our principal executive and financial officers, as appropriate to allow for timely decisions regarding required disclosures; and
|
|
(ii)
|
that our disclosure controls and procedures are effective.
|
Changes in Internal Control over Financial Reporting
There have been no changes in our internal control over financial reporting (as defined in Rule 13a-15(f) under the Securities Exchange Act of 1934) during the fourth quarter of 2017, that have materially affected, or are reasonably likely to materially affect, our internal control over financial reporting.
MANAGEMENT’S ANNUAL REPORT ON INTERNAL CONTROL
OVER FINANCIAL REPORTING AS OF DECEMBER 31, 2017
Management of Adams Resources & Energy, Inc. and its consolidated subsidiaries is responsible for establishing and maintaining adequate internal control over financial reporting as defined in Rule 13a-15(f) and 15d-15(f) of the Securities Exchange Act of 1934, as amended. Our internal control over financial reporting is a process designed under the supervision of our Executive Chairman and Chief Financial Officer to provide reasonable assurance regarding the reliability of financial reporting and the preparation of financial statements for external purposes in accordance with accounting principles generally accepted in the United States.
Because of its inherent limitations, internal control over financial reporting may not prevent or detect misstatements. Also, projections of any evaluation of effectiveness to future periods are subject to the risk that controls may become inadequate because of changes in conditions, or that the degree of compliance with policies and procedures may deteriorate.
Management, including the Company’s Executive Chairman and Chief Financial Officer, assessed the effectiveness of the Company’s internal control over financial reporting as of December 31, 2017. In making this assessment, management used the criteria described in
Internal Control – Integrated Framework (2013)
issued by the Committee of Sponsoring Organizations of the Treadway Commission (“COSO”). Based on this assessment, management, including the Company’s Executive Chairman and Chief Financial Officer, concluded that internal control over financial reporting was effective as of December 31, 2017.
70
KPMG LLP has issued its attestation report regarding our internal control over financial reporting. That report is included within this Item 9A (See “Report of Independent Registered Public Accounting Firm”).
Pursuant to the requirements of Rules 13a-15(f) and 15d-15(f) of the Securities Exchange Act of 1934, as amended, this annual report on Internal Control Over Financial Reporting has been signed below by the following persons on behalf of the registrant and in their respective capacities indicated below on
March 12, 2018
.
|
/s/ Townes G. Pressler
|
/s/ Josh C. Anders
|
|
|
Townes G. Pressler
|
Josh C. Anders
|
|
|
Executive Chairman
|
Chief Financial Officer
|
|
REPORT OF INDEPENDENT REGISTERED PUBLIC ACCOUNTING FIRM
To the Shareholders and Board of Directors
Adams Resources & Energy, Inc.:
Opinion on Internal Control Over Financial Reporting
We have audited Adams Resources & Energy, Inc.’s and subsidiaries (the “Company”) internal control over financial reporting as of December 31, 2017, based on criteria established in
Internal Control — Integrated Framework (2013)
issued by the Committee of Sponsoring Organizations of the Treadway Commission. In our opinion, the Company maintained, in all material respects, effective internal control over financial reporting as of December 31, 2017, based on criteria established in
Internal Control — Integrated Framework (2013)
issued by the Committee of Sponsoring Organizations of the Treadway Commission.
We also have audited, in accordance with the standards of the Public Company Accounting Oversight Board (United States) (PCAOB), the consolidated balance sheet of the Company as of December 31, 2017, the related consolidated statements of operations, shareholders’ equity, and cash flows for the year ended December 31, 2017, and the related notes (collectively, the consolidated financial statements), and our report dated
March 12, 2018
expressed an unqualified opinion on those consolidated financial statements.
Basis for Opinion
The Company’s management is responsible for maintaining effective internal control over financial reporting and for its assessment of the effectiveness of internal control over financial reporting, included in the accompanying Management’s Annual Report on Internal Control Over Financial Reporting as of December 31, 2017. Our responsibility is to express an opinion on the Company’s internal control over financial reporting based on our audit. We are a public accounting firm registered with the PCAOB and are required to be independent with respect to the Company in accordance with the U.S. federal securities laws and the applicable rules and regulations of the Securities and Exchange Commission and the PCAOB.
We conducted our audit in accordance with the standards of the PCAOB. Those standards require that we plan and perform the audit to obtain reasonable assurance about whether effective internal control over financial reporting was maintained in all material respects. Our audit of internal control over financial reporting included obtaining an understanding of internal control over financial reporting, assessing the risk that a material weakness exists, and testing and evaluating the design and operating effectiveness of internal control based on the assessed risk. Our audit also included performing such other procedures as we considered necessary in the circumstances. We believe that our audit provides a reasonable basis for our opinion.
71
Definition and Limitations of Internal Control Over Financial Reporting
A company’s internal control over financial reporting is a process designed to provide reasonable assurance regarding the reliability of financial reporting and the preparation of financial statements for external purposes in accordance with generally accepted accounting principles. A company’s internal control over financial reporting includes those policies and procedures that (1) pertain to the maintenance of records that, in reasonable detail, accurately and fairly reflect the transactions and dispositions of the assets of the company; (2) provide reasonable assurance that transactions are recorded as necessary to permit preparation of financial statements in accordance with generally accepted accounting principles, and that receipts and expenditures of the company are being made only in accordance with authorizations of management and directors of the company; and (3) provide reasonable assurance regarding prevention or timely detection of unauthorized acquisition, use, or disposition of the company’s assets that could have a material effect on the financial statements.
Because of its inherent limitations, internal control over financial reporting may not prevent or detect misstatements. Also, projections of any evaluation of effectiveness to future periods are subject to the risk that controls may become inadequate because of changes in conditions, or that the degree of compliance with the policies or procedures may deteriorate.
/s/ KPMG LLP
Houston, Texas
March 12, 2018
Item 9B.
Other Information.
None.
|
Item 10.
|
Directors, Executive Officers and Corporate Governance.
|
The information required by this item will be included in our definitive Proxy Statement in connection with our 2018 Annual Meeting of Shareholders (the “2018 Proxy Statement”), which will be filed with the SEC within 120 days after the end of the fiscal year ended December 31, 2017, under the headings “Election of Directors” and “Executive Officers” and is incorporated herein by reference.
|
Item 11.
|
Executive Compensation.
|
The information required by this item will be set forth in our 2018 Proxy Statement, which will be filed with the SEC within 120 days after the end of the fiscal year ended December 31, 2017, under the heading “Executive Compensation” and is incorporated herein by reference.
|
Item 12.
|
Security Ownership of Certain Beneficial Owners and Management and Related Stockholder Matters.
|
The information required by this item will be set forth in our 2018 Proxy Statement, which will be filed with the SEC within 120 days after the end of the fiscal year ended December 31, 2017, under the heading “Voting Securities and Principal Holders Thereof” and is incorporated herein by reference.
72
|
Item 13.
|
Certain Relationships and Related Transactions, and Director Independence.
|
The information required by this item will be set forth in our 2018 Proxy Statement, which will be filed with the SEC within 120 days after the end of the fiscal year ended December 31, 2017, under the headings “Transactions with Related Parties” and “Director Independence” and is incorporated herein by reference.
|
Item 14.
|
Principal Accounting Fees and Services
|
The information required by this item will be set forth in our 2018 Proxy Statement, which will be filed with the SEC within 120 days after the end of the fiscal year ended December 31, 2017, under the heading “Principal Accounting Fees and Services” and is incorporated herein by reference.
|
Item 15.
|
Exhibits, Financial Statement Schedules
|
(a) The following documents are filed as a part of this annual report:
|
(1)
|
Financial Statements: See “Index to Consolidated Financial Statements” beginning on page
34
of this annual report for the financial statements included herein.
|
|
(2)
|
Financial Statement Schedules: The separate filing of financial statement schedules has been omitted because such schedules are either not applicable or the information called for therein appears in the footnotes of our Consolidated Financial Statements.
|
|
(3)
|
Exhibits:
|
|
Exhibit
Number
|
Exhibit
|
|
|
3.1
|
Certificate of Incorporation of Adams Resources & Energy, Inc., as amended (incorporated by reference to Exhibit 3(a) to Form 10-K for the year ended December 31, 1987).
|
|
|
3.2
|
||
|
3.3
|
||
|
4.1
|
Specimen common stock certificate (incorporated by reference to Exhibit 4(a) to Form 10-K for the fiscal year ended December 31, 1991).
|
|
|
4.2
|
||
|
10.1+
|
||
|
10.2+
|
||
|
10.3
|
||
73
|
Exhibit
Number
|
Exhibit
|
|
|
10.4*
|
||
|
21*
|
||
|
23.1*
|
||
|
31.1*
|
||
|
31.2*
|
||
|
32.1*
|
||
|
32.2*
|
||
|
99.1
|
||
|
101.CAL*
|
XBRL Calculation Linkbase Document
|
|
|
101.DEF*
|
XBRL Definition Linkbase Document
|
|
|
101.INS*
|
XBRL Instance Document
|
|
|
101.LAB*
|
XBRL Labels Linkbase Document
|
|
|
101.PRE*
|
XBRL Presentation Linkbase Document
|
|
|
101.SCH*
|
XBRL Schema Document
|
|
______________________________
* Filed for furnished (in the case of Exhibits 32.1 and 32.2) with this report.
+ Management contract or compensation plan or arrangement.
|
Item 16.
|
Form 10-K Summary
|
Not applicable.
74
SIGNATURES
Pursuant to the requirements of Section 13 or 15(d) of the Securities Exchange Act of 1934, the registrant has duly caused this report to be signed on its behalf by the undersigned, thereunto duly authorized on
March 12, 2018
.
|
ADAMS RESOURCES & ENERGY, INC.
|
||
|
(Registrant)
|
||
|
By:
|
/s/ Townes G. Pressler
|
|
|
Townes G. Pressler
|
||
|
Executive Chairman
|
||
|
(Principal Executive Officer)
|
||
|
By:
|
/s/ Josh C. Anders
|
|
|
Josh C. Anders
|
||
|
Chief Financial Officer
|
||
|
(Principal Financial Officer and Principal
|
||
|
Accounting Officer)
|
||
75
Pursuant to the requirements of the Securities Exchange Act of 1934, this report has been signed below by the following persons on behalf of the registrant and in the capacities indicated below on
March 12, 2018
.
|
Signature
|
Title
|
|
|
/s/ Townes G. Pressler
|
Director and Executive Chairman of the Board
|
|
|
Townes G. Pressler
|
||
|
/s/ Larry E. Bell
|
Director
|
|
|
Larry E. Bell
|
||
|
/s/ Murray E. Brasseux
|
Director
|
|
|
Murray E. Brasseux
|
||
|
/s/ Michelle A. Earley
|
Director
|
|
|
Michelle A. Earley
|
||
|
/s/ Richard C. Jenner
|
Director
|
|
|
Richard C. Jenner
|
||
|
/s/ E.C. Reinauer, Jr.
|
Director
|
|
|
E.C. Reinauer, Jr.
|
||
|
/s/ W.R. Scofield
|
Director
|
|
|
W.R. Scofield
|
||
76
TABLE OF CONTENTS
Part IItem 1A. Risk FactorsItem 1B. Unresolved Staff CommentsItem 3. Legal ProceedingsItem 4. Mine Safety DisclosuresPart IIItem 5. Market For Registrant S Common Stock, Related Stockholder Matters, and Issuer Purchases Of Equity SecuritiesItem 6. Selected Financial DataItem 7. Management S Discussion and Analysis Of Financial Condition and Results Of OperationsItem 7A. Quantitative and Qualitative Disclosures About Market RiskItem 8. Financial Statements and Supplementary DataNote 1. Organization and Basis Of PresentationNote 2. Summary Of Significant Accounting PoliciesNote 3. Subsidiary Bankruptcy, Deconsolidation and SaleNote 4. Prepayments and Other Current AssetsNote 5. Property and EquipmentNote 6. Cash Deposits and Other AssetsNote 7. Investments in Unconsolidated AffiliatesNote 8. Segment ReportingNote 9. Transactions with AffiliatesNote 10. Derivative Instruments and Fair Value MeasurementsNote 11. Income TaxesNote 12. Supplemental Cash Flow InformationNote 13. Commitment and ContingenciesNote 14. Concentration Of Credit RiskNote 15. Quarterly Financial Information (unaudited)Note 16. Oil and Gas Producing Activities (unaudited)Item 9. Changes in and Disagreements with Accountants on Accounting and Financial DisclosureItem 9A. Controls and ProceduresItem 9B. Other InformationPart IIIItem 10. Directors, Executive Officers and Corporate GovernanceItem 11. Executive CompensationItem 12. Security Ownership Of Certain Beneficial Owners and Management and Related Stockholder MattersItem 13. Certain Relationships and Related Transactions, and Director IndependenceItem 14. Principal Accounting Fees and ServicesPart IVItem 15. Exhibits, Financial Statement SchedulesItem 16. Form 10-k Summary