AES CORP
10-Ks and 10-Qs
|
|
|
|
|
|
|
|
|
|
|
|
|
|
|
|
|
|
|
|
|
|
|
|
|
|
|
|
|
|
|
|
|
|
|
|
|
|
|
|
|
|
|
|
|
|
|
|
|
|
|
|
|
|
|
|
|
|
|
UNITED STATES
SECURITIES AND EXCHANGE COMMISSION
WASHINGTON, D.C. 20549
____________________________________
FORM 10-K
_____________________________________
|
ý
|
ANNUAL REPORT PURSUANT TO SECTION 13 OR 15(d) OF THE SECURITIES EXCHANGE ACT OF 1934
|
For the Fiscal Year Ended
December 31, 2013
-OR-
|
¨
|
TRANSITION REPORT FILED PURSUANT TO SECTION 13 OR 15(d) OF THE SECURITIES EXCHANGE ACT OF 1934
|
|
COMMISSION FILE NUMBER 1-12291
|
|

THE AES CORPORATION
(Exact name of registrant as specified in its charter)
|
Delaware
|
54 1163725
|
|
|
(State or other jurisdiction of
incorporation or organization)
|
(I.R.S. Employer
Identification No.)
|
|
|
4300 Wilson Boulevard Arlington, Virginia
|
22203
|
|
|
(Address of principal executive offices)
|
(Zip Code)
|
|
|
Registrant’s telephone number, including area code: (703) 522-1315
|
||
|
Securities registered pursuant to Section 12(b) of the Act:
|
||
|
Title of Each Class
|
Name of Each Exchange on Which Registered
|
|
|
Common Stock, par value $0.01 per share
|
New York Stock Exchange
|
|
|
AES Trust III, $3.375 Trust Convertible Preferred Securities
|
New York Stock Exchange
|
|
Securities registered pursuant to Section 12(g) of the Act:
None
Indicate by check mark if the Registrant is a well-known seasoned issuer, as defined in Rule 405 of the Securities Act. Yes
x
No
o
Indicate by check mark if the Registrant is not required to file reports pursuant to Section 13 or Section 15 (d) of the Act. Yes
o
No
x
Indicate by check mark whether the registrant (1) has filed all reports required to be filed by Section 13 or 15(d) of the Securities Exchange Act of 1934 during the preceding 12 months (or for such shorter period that the registrant was required to file such reports), and (2) has been subject to such filing requirements for the past 90 days. Yes
x
No
o
Indicate by check mark whether the registrant has submitted electronically and posted on its corporate Web site, if any, every Interactive Data File required to be submitted and posted pursuant to Rule 405 of Regulation S-T during the preceding 12 months (or for such shorter period that the registrant was required to submit and post such files). Yes
x
No
o
Indicate by check mark if disclosure of delinquent filers pursuant to Item 405 of Regulation S-K is not contained herein, and will not be contained, to the best of registrant’s knowledge, in definitive proxy or information statements incorporated by reference in Part III of this Form 10-K or any amendment to this Form 10-K.
x
Indicate by check mark whether the registrant is a large accelerated filer, an accelerated filer, a non-accelerated filer or a smaller reporting company. See the definitions of “large accelerated filer,” “accelerated filer” and “smaller reporting company” in Rule 12b-2 of the Exchange Act. (Check one):
|
Large accelerated filer
x
|
Accelerated filer
o
|
Non-accelerated filer
o
|
Smaller reporting company
o
|
|
(Do not check if a smaller
reporting company)
|
|||
Indicate by check mark whether the Registrant is a shell company (as defined in Rule 12b-2 of the Exchange Act). Yes
o
No
x
The aggregate market value of the voting and non-voting common equity held by non-affiliates on June 28, 2013, the last business day of the Registrant’s most recently completed second fiscal quarter (based on the closing sale price of $11.87 of the Registrant’s Common Stock, as reported by the New York Stock Exchange on such date) was approximately $7.36 billion.
The number of shares outstanding of Registrant’s Common Stock, par value $0.01 per share, on
February 18, 2014
was
723,927,523
DOCUMENTS INCORPORATED BY REFERENCE
Portions of Registrant’s Proxy Statement for its 2013 annual meeting of stockholders are incorporated by reference in Parts II and III
THE AES CORPORATION
FISCAL YEAR 2013 FORM 10-K
TABLE OF CONTENTS
In this Annual Report the terms “AES,” “the Company,” “us,” or “we” refer to The AES Corporation and all of its subsidiaries and affiliates, collectively. The term “The AES Corporation” and “Parent Company” refers only to the parent, publicly-held holding company, The AES Corporation, excluding its subsidiaries and affiliates.
FORWARD-LOOKING INFORMATION
In this filing we make statements concerning our expectations, beliefs, plans, objectives, goals, strategies, and future events or performance. Such statements are “forward-looking statements” within the meaning of the Private Securities Litigation Reform Act of 1995. Although we believe that these forward-looking statements and the underlying assumptions are reasonable, we cannot assure you that they will prove to be correct.
Forward-looking statements involve a number of risks and uncertainties, and there are factors that could cause actual results to differ materially from those expressed or implied in our forward-looking statements. Some of those factors (in addition to others described elsewhere in this report and in subsequent securities filings) include:
|
•
|
the economic climate, particularly the state of the economy in the areas in which we operate, including the fact that the global economy faces considerable uncertainty for the foreseeable future, which further increases many of the risks discussed in this Form 10-K;
|
|
•
|
changes in inflation, demand for power, interest rates and foreign currency exchange rates, including our ability to hedge our interest rate and foreign currency risk;
|
|
•
|
changes in the price of electricity at which our Generation businesses sell into the wholesale market and our Utility businesses purchase to distribute to their customers, and the success of our risk management practices, such as our ability to hedge our exposure to such market price risk;
|
|
•
|
changes in the prices and availability of coal, gas and other fuels (including our ability to have fuel transported to our facilities) and the success of our risk management practices, such as our ability to hedge our exposure to such market price risk, and our ability to meet credit support requirements for fuel and power supply contracts;
|
|
•
|
changes in and access to the financial markets, particularly changes affecting the availability and cost of capital in order to refinance existing debt and finance capital expenditures, acquisitions, investments and other corporate purposes;
|
|
•
|
our ability to manage liquidity and comply with covenants under our recourse and non-recourse debt, including our ability to manage our significant liquidity needs and to comply with covenants under our senior secured credit facility and other existing financing obligations;
|
|
•
|
changes in our or any of our subsidiaries’ corporate credit ratings or the ratings of our or any of our subsidiaries’ debt securities or preferred stock, and changes in the rating agencies’ ratings criteria;
|
|
•
|
our ability to purchase and sell assets at attractive prices and on other attractive terms;
|
|
•
|
our ability to compete in markets where we do business;
|
|
•
|
our ability to manage our operational and maintenance costs, the performance and reliability of our generating plants, including our ability to reduce unscheduled down-times;
|
|
•
|
our ability to locate and acquire attractive “greenfield” projects and our ability to finance, construct and begin operating our “greenfield” projects on schedule and within budget;
|
|
•
|
our ability to enter into long-term contracts, which limit volatility in our results of operations and cash flow, such as Power Purchase Agreements (“PPA”), fuel supply, and other agreements and to manage counterparty credit risks in these agreements;
|
|
•
|
variations in weather, especially mild winters and cooler summers in the areas in which we operate, low levels of wind or sunlight for our wind and solar businesses, and the occurrence of difficult hydrological conditions for our hydro-power plants, as well as hurricanes and other storms and disasters;
|
|
•
|
our ability to meet our expectations in the development, construction, operation and performance of our new facilities, whether greenfield, brownfield or investments in the expansion of existing facilities;
|
1
|
•
|
the success of our initiatives in other renewable energy projects, as well as greenhouse gas emissions reduction projects and energy storage projects;
|
|
•
|
our ability to keep up with advances in technology;
|
|
•
|
the potential effects of threatened or actual acts of terrorism and war;
|
|
•
|
the expropriation or nationalization of our businesses or assets by foreign governments, whether with or without adequate compensation;
|
|
•
|
our ability to achieve expected rate increases in our Utility businesses;
|
|
•
|
changes in laws, rules and regulations affecting our international businesses;
|
|
•
|
changes in laws, rules and regulations affecting our North America business, including, but not limited to, regulations which may affect competition, the ability to recover net utility assets and other potential stranded costs by our utilities;
|
|
•
|
changes in law resulting from new local, state, federal or international energy legislation and changes in political or regulatory oversight or incentives affecting our wind business, our solar joint venture, our other renewables projects and our initiatives in greenhouse gas reductions and energy storage, including tax incentives;
|
|
•
|
changes in environmental laws, including requirements for reduced emissions of sulfur, nitrogen, carbon, mercury, hazardous air pollutants and other substances, greenhouse gas legislation, regulation and/or treaties and coal ash regulation;
|
|
•
|
changes in tax laws and the effects of our strategies to reduce tax payments;
|
|
•
|
the effects of litigation and government and regulatory investigations;
|
|
•
|
our ability to maintain adequate insurance;
|
|
•
|
decreases in the value of pension plan assets, increases in pension plan expenses and our ability to fund defined benefit pension and other post-retirement plans at our subsidiaries;
|
|
•
|
losses on the sale or write-down of assets due to impairment events or changes in management intent with regard to either holding or selling certain assets;
|
|
•
|
changes in accounting standards, corporate governance and securities law requirements;
|
|
•
|
our ability to maintain effective internal controls over financial reporting;
|
|
•
|
our ability to attract and retain talented directors, management and other personnel, including, but not limited to, financial personnel in our foreign businesses that have extensive knowledge of accounting principles generally accepted in the United States;
|
|
•
|
the performance of business and asset acquisitions, including our acquisition of DPL Inc., and our ability to successfully integrate and operate acquired businesses and assets, such as DPL, and effectively realize anticipated benefits; and
|
|
•
|
information security breaches.
|
These factors in addition to others described elsewhere in this Form 10-K, including those described under Item 1A.—Risk Factors, and in subsequent securities filings, should not be construed as a comprehensive listing of factors that could cause results to vary from our forward-looking information.
We undertake no obligation to publicly update or revise any forward-looking statements, whether as a result of new information, future events, or otherwise. If one or more forward-looking statements are updated, no inference should be drawn that additional updates will be made with respect to those or other forward-looking statements.
2
|
ITEM 1.
|
BUSINESS
|
Overview
We are a diversified power generation and utility company organized into six market-oriented Strategic Business Units (“SBUs”): US (United States), Andes (Chile, Colombia, and Argentina), Brazil, MCAC (Mexico, Central America and Caribbean), EMEA (Europe, Middle East and Africa), and Asia. We were incorporated in 1981.
Item 1.—
Business
is an outline of our strategy and our businesses by SBU, including key financial drivers. Additional items that may have an impact on our businesses are discussed in Item 1A. –
Risk Factors
and Item 3.—
Legal Proceedings
.
Strategy
Our strategic plan intends to maximize the risk-adjusted value of our portfolio for shareholders through our efforts to execute upon the following objectives:
|
•
|
First, we are managing our portfolio of generation and utility businesses to create value for our stakeholders, including customers and shareholders, through safe, reliable, and sustainable operations and effective cost management.
|
|
•
|
Second, we are driving our business to manage capital more effectively and to increase the amount of discretionary cash available for deployment into debt repayment, growth investments, shareholder dividends, and share buybacks.
|
|
•
|
Third, we are realigning our geographic focus. To this end, we will continue to exit markets where we do not have a competitive advantage or where we are unable to earn a fair risk-adjusted return relative to monetization alternatives. In addition, we will focus our growth investments on platform expansions or opportunities to expand our existing operations.
|
|
•
|
Finally, we are working to reduce the cash flow and earnings volatility of our businesses by proactively managing our currency, commodity and political risk exposures, mostly through contractual and regulatory mechanisms, as well as commercial hedging activities. We also will continue to limit our risk by utilizing non-recourse project financing for the majority of our businesses.
|
Business Lines & Strategic Business Units
Within our six SBUs, as discussed above, we have two lines of business. The first business line is generation, where we own and/or operate power plants to generate and sell power to customers, such as utilities, industrial users, and other intermediaries. The second business line is utilities, where we own and/or operate utilities to generate or purchase, distribute, transmit and sell electricity to end-user customers in the residential, commercial, industrial and governmental sectors within a defined service area. In certain circumstances, our utilities also generate and sell electricity on the wholesale market.
For each SBU, the following table summarizes our generation and utility businesses by capacity, number of facilities, utility customers and utility GWh sold.
|
SBU
|
Generation Capacity (Gross MW)
|
|
Generation Facilities
|
Utility Customers
|
Utility GWh
|
Utility Businesses
|
|||||||
|
US
|
|||||||||||||
|
Generation
|
6,015
|
|
|
13
|
|
||||||||
|
Utilities
|
6,934
|
|
|
18
|
|
1.2 million
|
35,595
|
|
2
|
|
|||
|
Andes
|
|||||||||||||
|
Generation
|
8,075
|
|
|
33
|
|
||||||||
|
Brazil
|
|||||||||||||
|
Generation
|
3,298
|
|
|
13
|
|
||||||||
|
Utilities
|
8.0 million
|
55,190
|
|
2
|
|
||||||||
|
MCAC
|
|||||||||||||
|
Generation
|
3,140
|
|
|
13
|
|
||||||||
|
Utilities
|
1.3 million
|
3,655
|
|
4
|
|
||||||||
|
EMEA
|
|||||||||||||
|
Generation
|
7,513
|
|
|
23
|
|
||||||||
|
Utilities
|
936
|
|
|
11
|
|
1.0 million
|
3,569
|
|
1
|
|
|||
|
Asia
|
|||||||||||||
|
Generation
|
1,248
|
|
3
|
|
|||||||||
|
37,159
|
|
(1)
|
127
|
|
11.5 million
|
98,009
|
|
9
|
|
||||
|
(1)
|
29,609 proportional MW. Proportional MW is equal to gross MW times AES’ equity ownership percentage.
|
3
Generation
We currently own and/or operate a generation portfolio of 29,289 MW, excluding the generation capabilities of our integrated utilities. Our generation fleet is diversified by fuel type. See discussion below under
Fuel Costs
.
Performance drivers of our generation businesses include types of electricity sales agreements, plant reliability and flexibility, fuel costs, fixed-cost management, sourcing and competition.
Electricity Sales Contracts
Our generation businesses sell electricity under medium- or long-term contracts (“contract sales”) or under short-term agreements in competitive markets (“short-term sales”).
Contract Sales.
Most of our generation fleet sells electricity under contracts. Our medium-term contract sales have a term of 2 to 5 years, while our long-term contracts have a term of more than 5 years. Across our portfolio, the average remaining contract term is 7 years.
In contract sales, our generation businesses recover variable costs including fuel and variable operations and maintenance (“O&M”) costs, either through direct or indexation-based contractual pass-throughs or tolling arrangements. When the contract does not include a fuel pass-through, we typically hedge fuel costs or enter into fuel supply agreements for a similar contract period (see discussion under “Fuel Costs”). These contracts are intended to reduce exposure to the volatility of fuel prices and electricity prices by linking the business’s revenues and costs. These contracts also help us to fund a significant portion of the total capital cost of the project through long-term non-recourse project-level financing.
Capacity Payments and Contract Sales.
Most of our contract sales include a capacity payment that covers projected fixed costs of the plant, including fixed O&M expenses and a return on capital invested. In addition, most of our contracts require that the majority of the capacity payment be denominated in the currency matching our fixed costs, including debt and return on capital invested. Although our project debt may consist of both fixed and floating rate debt, we typically hedge a significant portion of our exposure to variable interest rates. For foreign exchange, we generally structure the revenue of the business to match the currency of the debt and fixed costs. Some of our contracted businesses also receive a regulated market based capacity payment, which are discussed in more detail in the
Capacity Payments and Short-Term Sales
section.
Thus, these contracts, or other related commercial arrangements, significantly mitigate our exposure to changes in power and fuel prices, currency fluctuations and changes in interest rates. In addition, these contracts generally provide for a recovery of our fixed operating expenses and a return on our investment, as long as we operate the plant to the reliability and efficiency standards required in the contract.
Short-Term Sales.
Our other generation businesses sell power and ancillary services under short-term contracts with an average term of less than 2 years, including spot sales, directly in the short-term market, or, in some cases, at regulated prices. The short-term markets are typically administered by a system operator to coordinate dispatch. Short-term markets generally operate on merit order dispatch, where the least expensive generation facilities, based upon variable cost or bid price, are dispatched first and the most expensive facilities are dispatched last. The short-term price is typically set at the marginal cost of energy or bid price (the cost of the last plant required to meet system demand). As a result, the cash flows and earnings associated with these businesses are more sensitive to fluctuations in the market price for electricity. In addition, many of these wholesale markets include markets for ancillary services to support the reliable operation of the transmission system. Across our portfolio, we provide a wide array of ancillary services, including voltage support, frequency regulation and spinning reserves.
In certain markets, such as Argentina and Kazakhstan, a regulator establishes the prices for electricity and fuel and adjusts them periodically for inflation, changes in fuel prices and other factors. In these cases, our businesses are particularly sensitive to changes in regulation.
Capacity Payments and Short-Term Sales.
Many of the markets in which we operate include regulated capacity markets. These capacity markets are intended to provide additional revenue based upon availability without reliance on the energy margin from the merit order dispatch. Capacity markets are typically priced based on the cost of a new entrant and the system capacity relative to the desired level of reserve margin (generation available in excess of peak demand). Our generating facilities selling in the short-term markets typically receive capacity payments based on their availability in the market. Our most significant capacity revenues are earned by our generation capacity in Ohio and Northern Ireland.
4
Plant Reliability and Flexibility
Our contract and short-term sales provide incentives to our generation plants to optimally manage availability, operating efficiency and flexibility. Capacity payments under contract sales are frequently tied to meeting minimum standards. In short-term sales, our plants must be reliable and flexible to capture peak market prices and to maximize market-based revenues. In addition, our flexibility allows us to capture ancillary service revenue, meeting local market needs.
Fuel Costs
For our thermal generation plants, fuel is a significant component of our total cost of generation. For contract sales, we often enter into fuel supply agreements to match the contract period, or we may hedge our fuel costs. Some of our contracts have periodic adjustments for changes in fuel cost indices. In those cases, we have fuel supply agreements with shorter terms to match those adjustments. For certain projects, we have tolling arrangements where the power offtaker is responsible for the supply and cost of fuel to our plants.
In short-term sales, we sell power at market prices that are generally reflective of the market cost of fuel at the time, and thus procure fuel supply on a short-term basis, generally designed to match up with our market sales profile. Since fuel price is often the primary determinant for power prices, the economics of projects with short-term sales are often subject to volatility of relative fuel prices.
30% of our generation fleet is coal-fired. In the United States, most of our plants are supplied from domestic coal. At our non-U.S. generation plants and at our plant in Hawaii, we source coal internationally. Across our fleet, we utilize our global sourcing program to maximize the purchasing power of our fuel procurement.
36% of our generation plants are fueled by natural gas. Generally, we use gas from local supplies in each market. A few exceptions to this are AES Gener in Chile, where we purchase imported gas from third parties, and our plants in the Dominican Republic, where we import Liquefied Natural Gas (“LNG”) to utilize in the local market.
5% of our generation fleet utilizes oil, diesel and petroleum coke (“pet coke”) for fuel. Oil and diesel are sourced locally at prices linked to international markets, while pet coke is largely sourced from Mexico and the U.S. The remaining 29% of our portfolio is comprised mostly of hydro, wind and solar generation plants, and energy storage capacity, which do not have significant fuel costs.
Renewable Generation Facilities
We currently own and operate 9,216 MW (4,959 proportional MW) of renewable generation, including hydro, wind, energy storage, biomass and landfill gas. Additionally, in 2008, we formed a 50/50 joint venture with Riverstone to develop, own and operate solar installations. Since its launch, Silver Ridge Power has commenced commercial operations of 522 MW (261 Proportional MW) of solar projects in Bulgaria, France, Greece, India, Italy, Puerto Rico and Spain, and has 266 MW (133 Proportional MW) under construction.
Energy Storage
AES has more than 170 MW of battery-based grid resources in commercial operation today, primarily in the U.S. and Chile. By adding these energy storage solutions to existing platforms in its SBUs, AES is better serving its customers’ needs for reliability services. AES is working to further develop its energy storage fleet by adding storage capabilities to projects in operation and construction and those in advanced development. One key market AES is exploring for energy storage development is California, where the Utilities Commission approved a target for procurement of approximately 1,300 MW of storage-based resources.
Seasonality, Weather Variations and Economic Activity
Our generation businesses are affected by seasonal weather patterns throughout the year and, therefore, operating margin is not generated evenly by month during the year. Additionally, weather variations, including temperature, solar and wind resources, and hydrological conditions, may also have an impact on generation output at our renewable generation facilities. See Item 7. —
Management's Discussion and Analysis, Key Trends and Uncertainties
of this Form 10-K for further details of the impact of dry hydrological conditions. In competitive markets for power, local economic activity can also have an impact on power demand and short-term prices for power.
5
Fixed-Cost Management
In our businesses with long-term contracts, the majority of the fixed operating and maintenance costs are recovered through the capacity payment. However, for all generation businesses, managing fixed costs and reducing them over time is a driver of business performance.
Competition
For our businesses with medium- or long-term contracts, there is limited competition during the term of the contract. For short-term sales, plant dispatch and the price of electricity are determined by market competition and local dispatch and reliability rules.
Utilities
AES’ 9 utility businesses distribute power to more than 11 million people in four countries. These businesses also include generation capacity totaling 7,870 MW (7,458 proportional MW). These businesses have a variety of structures, ranging from integrated utility to pure transmission and distribution businesses.
In general, our utilities sell electricity directly to end-users, such as homes and businesses, and bill customers directly. Key performance drivers for utilities include the regulated rate of return and tariff, seasonality, weather variations, economic activity, reliability of service and competition.
Regulated Rate of Return and Tariff
In exchange for the exclusive right to sell or distribute electricity in a franchise area, our utility businesses are subject to government regulation. This regulation sets the prices (“tariffs”) that our utilities are allowed to charge retail customers for electricity and establishes service standards that we are required to meet.
Our utilities are generally permitted to earn a regulated rate of return on assets, determined by the regulator based on the utility’s allowed regulatory asset base, capital structure and cost of capital. The asset base on which the utility is permitted a return is determined by the regulator and is based on the amount of assets that are considered used and useful in serving customers. Both the allowed return and the asset base are important components of the utility’s earning power. The allowed rate of return and operating expenses deemed reasonable by the regulator are recovered through the regulated tariff that the utility charges to its customers.
The tariff may be reviewed and reset by the regulator from time to time depending on local regulations, or the utility may seek a change in its tariffs. The tariff is generally based upon a certain usage level and may include a pass-through to the customer of costs that are not controlled by the utility, such as the costs of fuel (in the case of integrated utilities) and/or the costs of purchased energy. In addition to fuel and purchased energy, other types of costs may be passed through to customers via an existing mechanism, such as certain environmental expenditures that are covered under an environmental tracker at our utility in Indiana, Indianapolis Power & Light Company (“IPL”). Components of the tariff that are directly passed through to the customer are usually adjusted through a summary regulatory process or an existing formula-based mechanism. In some regulatory regimes, customers with demand above an established level are unregulated and can choose to contract with other retail energy suppliers directly and pay a wheeling and other non-bypassable fees, which are fees to the distribution company for use of its distribution system.
The regulated tariff generally recognizes that our utility businesses should recover certain operating and fixed costs, as well as manage uncollectible amounts, quality of service and non-technical losses. Utilities therefore need to manage costs to the levels reflected in the tariff or risk non-recovery of costs or diminished returns.
Seasonality, Weather Variations and Economic Activity
Our utility businesses are affected by seasonal weather patterns throughout the year and, therefore, the operating revenues and associated operating expenses are not generated evenly by month during the year. Additionally, weather variations may also have an impact based on the number of customers, temperature variances from normal conditions and customers’ historic usage levels and patterns. The retail kilowatt hours (“kWh”) sales, after adjustments for weather variations, are affected by changes in local economic activity, energy efficiency and distributed generation initiatives, as well as the number of retail customers.
6
Reliability of Service
Our utility businesses must meet certain reliability standards, such as duration and frequency of outages. Those standards may be specific with incentives or penalties for performance against these standards. In other cases, the standards are implicit and the utility must operate to meet customer expectations.
Competition
Our integrated utilities, such as IPL and The Dayton Power & Light Company (“DP&L”), operate as the sole distributor of electricity within their respective jurisdictions. Our businesses own and operate all of the businesses and facilities necessary to generate, transmit and distribute electricity. Competition in the regulated electric business is primarily from the on-site generation of industrial customers; however, in Ohio, customers in our service territory have the ability to switch to alternative suppliers for their generation service. Our integrated utilities, particularly DP&L, are exposed to the volatility in wholesale prices to the extent our generating capacity exceeds the native load served under the regulated tariff and short-term contracts. See the full discussion under the US SBU.
At our pure transmission and distribution businesses, such as those in Brazil and El Salvador, we face relatively limited competition due to significant barriers to entry. At many of these businesses, large customers, as defined by the relevant regulator, can leave and choose to return to regulated service.
Development and Construction
We develop and construct new generation facilities. For our utility businesses, new plants may be built in response to customer needs or to comply with regulatory developments and are developed subject to regulatory approval that permits recovery of our capital cost and a return on our investment. For our generation businesses, our priority for development is platform expansion opportunities, where we can add on to our existing facilities in our key platform markets where we have a competitive advantage. We make the decision to invest in new projects by evaluating the project returns and financial profile against a fair risk-adjusted return for the investment and against alternative uses of capital, including corporate debt repayment and share buybacks.
In some cases, we enter into long-term contracts for output from new facilities prior to commencing construction. To limit required equity contributions from The AES Corporation, we also seek non-recourse project debt financing and other sources of capital, including partners where it is commercially attractive. For construction, we typically contract with a third party to manage construction, although our construction management team supervises the construction work and tracks progress against the project's budget and the required safety, efficiency and productivity standards.
Environmental Matters
We are subject to various international, federal, state, and local regulations in all of our markets. These regulations govern such items as the determination of the market mechanism for setting the system marginal price for energy and the establishment of guidelines and incentives for the addition of new capacity.
We are also subject to various federal, state, regional and local environmental protection and health and safety laws and regulations governing, among other things, the generation, storage, handling, use, disposal and transportation of hazardous materials; the emission and discharge of hazardous and other materials into the environment; and the health and safety of our employees. These laws and regulations often require a lengthy and complex process of obtaining and renewing permits and other governmental authorizations from federal, state and local agencies. Violation of these laws, regulations or permits can result in substantial fines, other sanctions, suspension or revocation of permits and/or facility shutdowns. See later in Item 1.—
Business
—
Environmental and Land Use Regulations
for further regulatory and environmental discussion.
Strategic Business Units
All SBUs include generation facilities and four include utility businesses. The Company measures the operating performance of its SBUs using Adjusted Pre-Tax Contribution (“Adjusted PTC”), a non-GAAP measure (see definition below).
AES’ primary sources of Revenue, Operating Margin and Adjusted PTC are from generation and utility businesses. The contribution to Adjusted PTC by SBU for the year ended December 31, 2013 is shown below. The percentages shown are the contribution by each SBU to gross Adjusted PTC, i.e., the total Adjusted PTC by SBU, before deductions for Corporate. See Item 8.—
Financial Statements and Supplementary Data
of this Form 10-K for reconciliation.
7
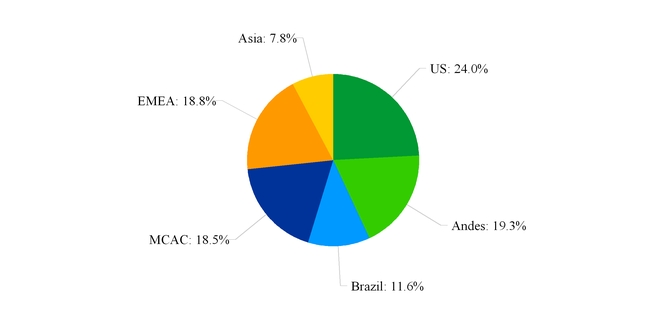
In 2013, approximately 73% of Adjusted PTC was contributed by our businesses in the Americas - including the US, Andes, Brazil and MCAC SBUs. Asia and EMEA accounted for the remaining 27%.
We define Adjusted PTC as pre-tax income from continuing operations attributable to AES excluding gains or losses of the consolidated entity due to (a) unrealized gains or losses related to derivative transactions, (b) unrealized foreign currency gains or losses, (c) significant gains or losses due to dispositions and acquisitions of business interests, (d) significant losses due to impairments, and (e) costs due to the early retirement of debt. Adjusted PTC also includes net equity in earnings of affiliates on an after-tax basis. Adjusted PTC in each SBU includes the effect of intercompany transactions with other SBUs other than interest and charges for certain management services.
Risks
We routinely encounter and address risks, some of which may cause our future results to be different, sometimes materially different, than we presently anticipate. The categories of risk we have identified in Item 1A.—
Risk Factors
of this Form 10-K include the following:
|
•
|
risks related to our high level of indebtedness;
|
|
•
|
risks associated with our ability to raise needed capital;
|
|
•
|
external risks associated with revenue and earnings volatility;
|
|
•
|
risks associated with our operations; and
|
|
•
|
risks associated with governmental regulation and laws.
|
The categories of risk identified above are discussed in greater detail in Item 1A.—
Risk Factors
of this Form 10-K. These risk factors should be read in conjunction with Item 7.—
Management’s Discussion and Analysis of Financial Condition and Results of Operations
, and the Consolidated Financial Statements and related notes included elsewhere in this report.
Our Organization and Segments
The segment reporting structure uses the Company’s management reporting structure as its foundation to reflect how the Company manages the business internally and is organized by geographic regions which provide better socio-political-economic understanding of our business. The management reporting structure is organized along
six
strategic business units (“SBUs”) — led by our Chief Executive Officer (“CEO”). During the fourth quarter of 2013, in conjunction with finalization of its reporting structure, the Company revised its internal reporting to align more closely with its operations. As a result, the
8
Company applied the accounting guidance for segment reporting and determined that its reportable segments are aligned with the six SBUs as below:
|
•
|
US SBU
|
|
•
|
Andes SBU
|
|
•
|
Brazil SBU
|
|
•
|
MCAC SBU
|
|
•
|
EMEA SBU
|
|
•
|
Asia SBU
|
Corporate and Other
—For financial reporting purposes, the Company’s Corporate activities are reported within “Corporate and Other” because they do not require separate disclosure under segment reporting accounting guidance. See Item 7.—
Management’s Discussion and Analysis of Financial Condition and Results of Operations
and Note 17—
Segment and Geographic Information
included in Item 8.—
Financial Statements and Supplementary Data
of this Form 10-K for further discussion of the Company’s segment structure used for financial reporting purposes.
Silver Ridge Power and certain other unconsolidated businesses are accounted for using the equity method of accounting. Therefore, their operating results are included in “Net Equity in Earnings of Affiliates” on the face of the Consolidated Statements of Operations, not in revenue and operating margin.
“Corporate and Other” also includes costs related to corporate overhead which are not directly associated with the operations of our six reportable segments and other intercompany charges such as self-insurance premiums which are fully eliminated in consolidation. See Note 17—
Segment and Geographic Information
included in Item 8.—
Financial Statements and Supplementary Data
of this Form 10-K for information on revenue from external customers, Adjusted PTC (a non-GAAP measure) and total assets by segment.
The following describes our businesses within our six SBUs:
US SBU
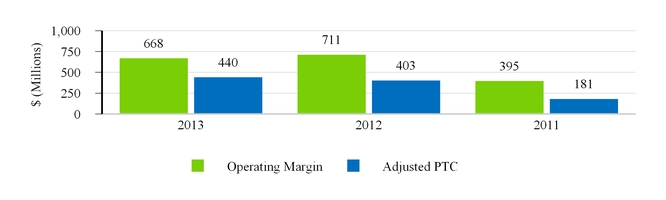
Our US SBU has 14 generation facilities and two integrated utilities in the United States. Our US operations accounted for
21%
,
20%
and
10%
of consolidated AES operating margin and
24%
,
20%
and
10%
of consolidated AES adjusted PTC (a non-GAAP measure) in
2013
,
2012
and
2011
, respectively. The percentages shown are the contribution by our US SBU to gross operating margin and adjusted PTC before deductions for Corporate.
The following table provides highlights of our U.S. operations:
|
Generation Capacity
|
12,949 gross MW (12,949 proportional MW)
|
|
|
Utilities Penetration
|
1,170,000 customers (35,595 GWh)
|
|
|
Generation Facilities
|
14
|
|
|
Utility Businesses
|
2 integrated utilities (includes 18 generation plants)
|
|
|
Key Generation Businesses
|
Southland, Hawaii and US Wind
|
|
|
Key Utility Businesses
|
IPL and DPL
|
|
9
Operating installed capacity of our US SBU totals 12,949 MW. IPL’s parent, IPALCO Enterprises, Inc., and DPL Inc. are SEC registrants, and as such, follow public filing requirements of the Securities Exchange Act of 1934. Set forth in the table below is a list of our U.S. generation businesses:
|
Business
|
Location
|
Fuel
|
Gross MW
|
AES Equity Ownership (Percent, Rounded)
|
Year Acquired or Began Operation
|
|||||||
|
Southland—Alamitos
|
US—CA
|
Gas
|
2,075
|
|
100
|
%
|
1998
|
|||||
|
Southland—Redondo Beach
|
US—CA
|
Gas
|
1,392
|
|
100
|
%
|
1998
|
|||||
|
Southland—Huntington Beach
|
US—CA
|
Gas
|
474
|
|
100
|
%
|
1998
|
|||||
|
Shady Point
|
US—OK
|
Coal
|
360
|
|
100
|
%
|
1991
|
|||||
|
Buffalo Gap II
(1)
|
US—TX
|
Wind
|
233
|
|
100
|
%
|
2007
|
|||||
|
Hawaii
|
US—HI
|
Coal
|
206
|
|
100
|
%
|
1992
|
|||||
|
Warrior Run
|
US—MD
|
Coal
|
205
|
|
100
|
%
|
2000
|
|||||
|
Buffalo Gap III
(1)
|
US—TX
|
Wind
|
170
|
|
100
|
%
|
2008
|
|||||
|
Deepwater
|
US—TX
|
Pet Coke
|
160
|
|
100
|
%
|
1986
|
|||||
|
Beaver Valley
|
US—PA
|
Coal
|
132
|
|
100
|
%
|
1985
|
|||||
|
Buffalo Gap I
(1)
|
US—TX
|
Wind
|
121
|
|
100
|
%
|
2006
|
|||||
|
Armenia Mountain
(1)
|
US—PA
|
Wind
|
101
|
|
100
|
%
|
2009
|
|||||
|
Laurel Mountain
|
US—WV
|
Wind
|
98
|
|
100
|
%
|
2011
|
|||||
|
Mountain View I & II
(1)
|
US—CA
|
Wind
|
67
|
|
100
|
%
|
2008
|
|||||
|
Laurel Mountain ES
(3)
|
US—WV
|
Energy Storage
|
64
|
|
100
|
%
|
2011
|
|||||
|
Mountain View IV
|
US—CA
|
Wind
|
49
|
|
100
|
%
|
2012
|
|||||
|
Tait ES
(3)
|
US—OH
|
Energy Storage
|
40
|
|
100
|
%
|
2013
|
|||||
|
Tehachapi
|
US—CA
|
Wind
|
38
|
|
100
|
%
|
2006
|
|||||
|
Palm Springs
|
US—CA
|
Wind
|
30
|
|
100
|
%
|
2005
|
|||||
|
6,015
|
|
|||||||||||
|
(1)
|
AES owns these assets together with third party tax equity investors with variable ownership interests. The tax equity investors receive a portion of the economic attributes of the facilities, including tax attributes that vary over the life of the projects. The proceeds from the issuance of tax equity are recorded as noncontrolling interest in the Company’s Consolidated Balance Sheet.
|
|
(2)
|
AES operates these facilities located throughout the US through management or O&M agreements and owns no equity interest in these businesses.
|
|
(3)
|
Energy Storage MW are power plant equivalent dispatchable resource, including supply and load capability.
|
Set forth in the tables below is a list of our U.S. utilities and their generation facilities:
|
Business
|
Location
|
Approximate Number of Customers Served as of 12/31/2013
|
GWh Sold in 2013
|
AES Equity Interest (Percent, Rounded)
|
Year
Acquired
|
||||||||
|
DPL
|
US—OH
|
693,000
|
|
19,561
|
|
100
|
%
|
2011
|
|||||
|
IPL
|
US—IN
|
477,000
|
|
16,034
|
|
100
|
%
|
2001
|
|||||
|
1,170,000
|
|
35,595
|
|
||||||||||
|
Business
|
Location
|
Fuel
|
Gross MW
|
AES Equity Interest (Percent, Rounded)
|
Year Acquired or Began Operation
|
|||||||
|
DPL
(1)
|
US—OH
|
Coal/Diesel/Solar
|
3,453
|
|
100
|
%
|
2011
|
|||||
|
IPL
(2)
|
US—IN
|
Coal/Gas/Oil
|
3,481
|
|
100
|
%
|
2001
|
|||||
|
6,934
|
|
|||||||||||
|
(1)
|
DPL subsidiary DP&L has the following plants - Tait Units 1-3 and diesels, Yankee Street, Yankee Solar, Monument and Sidney. DP&L jointly-owned plants: Beckjord Unit 6, Conesville Unit 4, East Bend Unit 2, Killen, Miami Fort Units 7 & 8, Stuart and Zimmer. In addition to the above, DP&L, also owns a 4.9% equity ownership in OVEC, an electric generating company. OVEC has two plants in Cheshire, Ohio and Madison, Indiana with a combined generation capacity of approximately 2,109 MW. DP&L’s share of this generation capacity is approximately 103 MW. DPLE Energy, LLC plants: Tait Units 4-7 and Montpelier Units 1-4.
|
|
(2)
|
IPL plants: Eagle Valley, Georgetown, Harding Street and Petersburg.
|
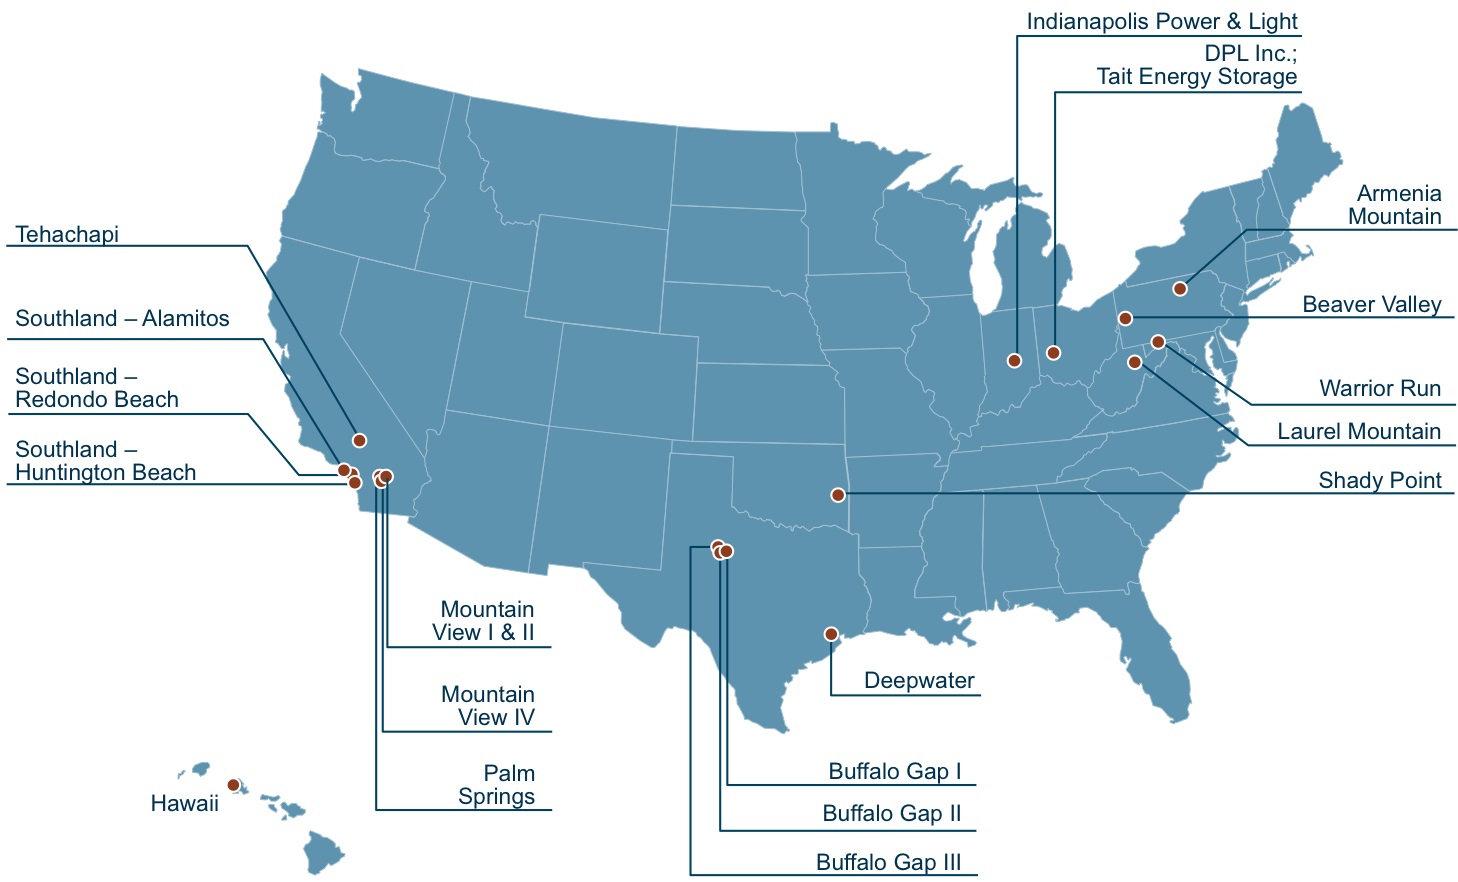
10
The following map illustrates the location of our U.S. facilities:
US Businesses
US Utilities
IPALCO
Business Description.
IPALCO owns all of the outstanding common stock of IPL. IPL is engaged primarily in generating, transmitting, distributing and selling electric energy to more than 470,000 customers in the city of Indianapolis and neighboring areas within the state of Indiana. IPL has an exclusive right to provide electric service to those customers. IPL’s service area covers about 528 square miles with a population of approximately 919,000. IPL owns and operates four generating stations. Two of the generating stations are primarily coal-fired. The third station has a combination of units that use coal (baseload capacity), natural gas and/or oil (peaking capacity) for fuel to produce electricity. The fourth station is a small peaking station that uses gas-fired combustion turbine technology for the production of electricity. IPL’s net electric generation capacity for winter is 3,272 MW and net summer capacity is 3,148 MW.
Market Structure.
IPL is one of many transmission system owner members in the Midcontinent Independent System Operator, Inc. (“MISO”). MISO is a Regional Transmission Organization ("RTO"), which maintains functional control over the combined transmission systems of its members and manages one of the largest energy and ancillary services markets in the U.S. IPL offers the available electricity production of each of its generation assets into the MISO day-ahead and real-time markets. MISO operates on a merit order dispatch, considering transmission constraints and other reliability issues to meet the total demand in the MISO region.
Regulatory Framework
Retail Ratemaking.
In addition to the regulations referred to below in “U.S. Regulatory Matters”, IPL is subject to regulation by the Indiana Utility Regulatory Commission (“IURC”) with respect to: IPL’s services and facilities; retail rates and charges; the issuance of long-term securities; and certain other matters. The regulatory power of the IURC over IPL’s business is both comprehensive and typical of the traditional form of regulation generally imposed by state public utility commissions. IPL’s tariff rates for electric service to retail customers consist of basic rates and charges, which are set and approved by the IURC after public hearings. The IURC gives consideration to all allowable costs for ratemaking purposes including a fair return on the fair value of the utility property used and useful in providing service to customers. In addition, IPL’s rates include various adjustment mechanisms including, but not limited to, those to reflect changes in fuel costs to generate electricity or purchased power prices, referred to as Fuel Adjustment Charges (“FAC”), and for the timely recovery of costs incurred to comply with environmental laws and regulations referred to as Environmental Compliance Cost Recovery Adjustment
11
(“ECCRA”). See Senate Bill 251 discussion under
Other United States Environmental and Land Use Legislation and Regulations
later in this section. These components function somewhat independently of one another, but the overall structure of IPL’s rates and charges would be subject to review at the time of any review of IPL’s basic rates and charges.
Environmental Matters
Mercury and Air Toxics Standards (“MATS”).
IPL has 2,623 MW of coal-fired generation, which is subject to MATS regulation. IPL plans to retire 472 MW (529 MW gross capacity) and install environmental upgrades on 2,125 MW (2,426 MW gross capacity). Most of IPL’s coal-fired capacity has acid gas scrubbers or comparable control technologies; however, there are other improvements to these control technologies that are necessary to achieve compliance. On August 14, 2013, the IURC approved IPL’s MATS plan, which includes investing up to $511 million in the installation of new pollution control equipment on IPL’s five largest baseload generating units. These coal-fired units are located at IPL’s Petersburg and Harding Street generating stations. Pursuant to an Indiana statute, the IURC also approved IPL’s request to recover operating and construction costs for this equipment (including a return) through a rate adjustment mechanism, with certain stipulations. Funding for these capital expenditures is expected to be obtained from additional debt financing at IPL; equity contributions from AES; borrowing capacity on IPL’s committed credit facilities; and cash generated from operating activities.
Replacement Generation.
IPL has several generating units that we expect to retire or refuel in the next few years. These units are primarily coal-fired and represent 472 MW of net capacity in total. To replace this generation, in April 2013, IPL filed a petition and case-in-chief with the IURC seeking a Certificate of Public Convenience and Necessity (“CPCN”) to build a 550 to 725 MW combined cycle gas turbine (“CCGT”) at its Eagle Valley Station site in Indiana and to refuel Harding Street Station Units 5 and 6 from coal to natural gas (106 MW net capacity each). The total estimated cost of these projects is $667 million. IPL is seeking authority to accrue post in-service allowance for debt and equity funds used during construction, and to defer the recognition of depreciation expense of the CCGT until such time that IPL is allowed to collect a return and depreciation expense on the CCGT. If approved, the CCGT is expected to be placed into service in April 2017 and the refueling project is expected to be complete by April 2016. For the refueling project, we are requesting timely recovery of 80% of the revenue requirement of these federally mandated costs under Senate Bill 251, and deferral of the remaining 20% until the resolution of a base rate case filed with the IURC. If Harding Street Units 5 and 6 are not refueled, they will likely need to be retired because it is currently not economical to install controls on those units to comply with MATS. If we receive approval for the CCGT, the costs to build and operate the equipment would not be recoverable by IPL until the resolution of a base rate case with the IURC. IPL expects to receive an order on this matter from the IURC in the second quarter of 2014.
National Pollution Discharge Elimination System (“NPDES”).
On August 28, 2012, Indiana Department of Environmental Management (“IDEM”) issued NPDES permits to the IPL Petersburg, Harding Street, and Eagle Valley generating stations, which became effective in October 2012. In April 2013, IPL received an extension to the compliance deadline through September 2017 as part of an agreed order with IDEM. IPL is conducting studies to determine what operational changes and/or additional equipment will be required to comply with the new limitations. IPL cannot predict the impact of these regulations on IPL’s consolidated results of operations, cash flows, or financial condition, but it is expected to be material. Recovery of these costs is expected through an Indiana statute, which allows for 80% recovery of qualifying costs through a rate adjustment mechanism with the remainder recorded as a regulatory asset to be considered for recovery in the next basic rate case proceeding; however, there can be no assurances that IPL would be successful in that regard. See Water Discharges discussion under
Other
United States Environmental and Land Use Legislation and Regulations
for further details of NPDES later in this section.
Key Financial Drivers
IPL's financial results are driven primarily by retail demand and rate base growth. Retail demand is influenced by local macroeconomic conditions. In addition, weather, energy efficiency and wholesale prices could also impact financial results. IPL’s rate base growth is influenced by the timely recovery of capital expenditures, as well as passage of new legislation or implementation of regulations.
DPL Inc. ("DPL")
Business Description.
DPL is an energy holding company whose principal subsidiaries include DP&L, DPL Energy, LLC (“DPLE”), and DPL Energy Resources, Inc. (“DPLER”).
DP&L generates, transmits, distributes and sells electricity to more than 515,000 customers in a 6,000 square mile area of West Central Ohio. DP&L, solely or through partnerships, owns 2,897 MW of generation capacity and numerous transmission facilities.
12
DPLE owns peaking generation units representing 556 MW located in Ohio and Indiana.
DPLER, a competitive retail marketer, sells retail electricity to more than 308,000 retail customers in Ohio and Illinois. Approximately 130,000 of these customers are also distribution customers of DP&L in Ohio.
Market Structure
Customer Switching.
Since January 2001, electric customers within Ohio have been permitted to choose to purchase power under a contract with a Competitive Retail Electric Service Provider (“CRES Provider”) or continue to purchase power from their local utility under Standard Service Offer (“SSO”) rates established by tariff. DP&L and other Ohio utilities continue to have the exclusive right to provide delivery service in their state certified territories and DP&L has the obligation to supply retail generation service to customers that do not choose an alternative supplier. Beginning in 2014, a portion of the SSO generation supply will no longer be supplied by DP&L but will be provided by third parties through the competitive bid process. Ten percent of the SSO load will be sourced through competitive bid in 2014, 40% in 2015, 70% in 2016 and 100% in 2017. The Public Utilities Commission of Ohio (“PUCO”) maintains jurisdiction over DP&L’s delivery of electricity, SSO and other retail electric services. The PUCO has issued extensive rules on how and when a customer can switch generation suppliers, how the local utility will interact with CRES Providers and customers, including for billing and collection purposes, and which elements of a utility’s rates are “bypassable” (i.e., avoided by a customer that elects a CRES Provider) and which elements are “non-bypassable” (i.e., charged to all customers receiving a distribution service irrespective of what entity provides the retail generation service). Several communities in DP&L’s service area have passed ordinances allowing the communities to become government aggregators for the purpose of offering retail generation service to their residences.
Overall power market prices, as well as government aggregation initiatives within DP&L’s service territory, have led or may lead to the entrance of additional competitors in its service territory. During the year ended December 31, 2013, approximately 42% of customers representing 67% of 2013’s overall energy usage (kWh) within DP&L’s service area had elected to obtain their supply service from CRES Providers. DPL’s subsidiary DPLER is a CRES Provider that has been marketing generation services to customers in Ohio and Illinois, both inside and outside DP&L's service territory. During 2013, DPLER accounted for approximately 5,874 million kWh (63%) and other CRES Providers accounted for about 3,471 million kWh (37%) of the total 9,345 million kWh supplied by CRES Providers within DP&L’s service territory. The volume supplied by DPLER represents 42% of DP&L’s total distribution volume during 2013. DPL currently cannot determine the extent to which customer switching to CRES Providers will occur in the future and the impact this will have on its operations, but any additional switching could have a material adverse effect on its future results of operations, financial condition and cash flows.
PJM Operations.
DP&L is a member of the PJM Interconnection, LLC (“PJM”). The PJM RTO operates the transmission systems owned by utilities operating in all or parts of Pennsylvania, New Jersey, Maryland, Delaware, D.C., Virginia, Ohio, West Virginia, Kentucky, North Carolina, Tennessee, Indiana and Illinois. PJM has an integrated planning process to identify potential needs for additional transmission to be built to avoid future reliability problems. PJM also runs the day-ahead and real-time energy markets, ancillary services market, and forward capacity market for its members. As a member of PJM, DP&L is also subject to charges and costs associated with PJM operations as approved by the Federal Energy Regulatory Commission ("FERC"). The Reliability Pricing Model (“RPM”) is PJM’s capacity construct. The purpose of RPM is to enable PJM to obtain sufficient resources to reliably meet the needs of electric customers within the PJM footprint. PJM conducts an auction to establish the price by zone. DP&L’s capacity has been located in the rest of the RTO area of PJM.
The PJM RPM auctions are held three years in advance for a period covering 12 months starting from June 1. Auctions for the period covering June 1, 2017 through May 30, 2018 are expected to take place in May of 2014. Future auction results are dependent upon various factors, including the demand and supply situation, capacity additions and retirements and any changes in the current auction rules related to bidding for demand response and energy efficiency resources in the RPM capacity auctions. For DPL-owned generation, applicable capacity prices and capacity cleared for periods through the auction year 2016/17 are as follows:
|
Auction Year (June 01- May 31)
|
2016/17
|
2015/16
|
2014/15
|
2013/14
|
2012/13
|
2011/12
|
||||||
|
Capacity Clearing Price ($/MW-Day)
|
$59
|
$136
|
$126
|
$28
|
$16
|
$110
|
||||||
|
Capacity Cleared (MW)
|
3,125
|
3,099
|
3,455
|
3,283
|
3,609
|
3,666
|
||||||
On a calendar-year basis, capacity prices and annual capacity revenues earned or projected to be earned by DPL are as follows:
|
Year
|
2016
|
2015
|
2014
|
2013
|
2012
|
|||||
|
Computed Average Capacity Price ($/MW-Day)
|
$91
|
$132
|
$85
|
$23
|
$55
|
|||||
|
Computed Gross RPM Capacity Revenue ($ millions)
|
$104
|
$156
|
$107
|
$29
|
$75
|
|||||
13
According to the terms of DP&L’s RPM rider, a portion of the capacity revenue is credited to SSO customers primarily based on the load still being served to the SSO customers. Accordingly, in 2013, DP&L credited 29% of the RPM capacity revenue to SSO customers. However, with ongoing switching and transitioning to the market, the amount to be credited will decline each year until reaching zero by June 1, 2017.
Regulatory Framework
Retail Regulation.
DP&L is subject to regulation by the PUCO, for its distribution services and facilities, retail rates and charges, reliability of service, compliance with renewable energy portfolio, energy efficiency program requirements and certain other matters. DP&L’s rates for electric service to retail customers consist of basic rates and charges that are set and approved by the PUCO after public hearings. In addition, DP&L’s rates include various adjustment mechanisms including but not limited to, those to reflect changes in fuel costs to generate electricity or purchased power prices, and the timely recovery of costs incurred to comply with alternative energy, renewables, energy efficiency, and economic development costs. These components function independently of one another, but the overall structure of DP&L’s retail rates and charges are subject to the rules and regulations established by the PUCO.
Retail Rate Structure.
Since Ohio is deregulated and allows customers to choose retail generation providers, DP&L is required to provide retail generation service to any customer that has not signed a contract with a CRES provider at SSO rates. SSO rates are subject to rules and regulations of the PUCO and are established based on an Electric Security Plan (“ESP”) filing. DP&L’s wholesale transmission rates are regulated by the FERC. DP&L’s distribution rates are regulated by the PUCO and are established through a traditional cost-based rate setting process. DP&L is permitted to recover its costs of providing distribution service as well as earn a regulated rate of return on assets, determined by the regulator, based on the utility’s allowed regulated asset base, capital structure and cost of capital.
In 2012, DP&L filed an ESP with the PUCO to establish SSO rates that were to be in effect starting January 2013. An order was issued by the PUCO in September 2013 (the “ESP Order”), which states that DP&L’s next ESP begins January 1, 2014 and extends through May 31, 2017. DP&L’s prior rate structure remained in place until January 1, 2014. The primary provisions of the ESP Order are as follows:
|
•
|
DP&L to collect a non-bypassable Service Stability Rider (“SSR”) equal to $110 million per year for 2014 through 2016. DP&L has the opportunity to seek an additional $46 million through a five-month extension of the SSR, provided it meets certain regulatory filing obligations. Such obligations include, but are not limited to: (a) filing a divestiture plan with the PUCO by December 31, 2013 to separate DP&L’s generation assets from the utility; and (b) filing a distribution rate case no later than July 1, 2014;
|
|
•
|
DP&L must separate its generation assets no later than May 31, 2017 through a transfer of the assets to a DPL affiliate or a divestiture; and
|
|
•
|
DP&L must phase-in a competitive bidding structure with 10% of DP&L’s SSO load sourced through the competitive bid starting in January 2014, 40% in 2015, 70% in 2016 and 100% by June 2017.
|
On October 28, 2013, DP&L conducted its first competitive bidding process as required by the ESP, which resulted in an average clearing price of $49.32 per MWh for 10% of its SSO load for the delivery period January 1, 2014 through May 31, 2017. The competitive bidding process determined who will provide generation service for 10% of DP&L’s SSO for January 1, 2014 through May 31, 2017 load at this price. The net effect will be a lower operating margin in future years. The 2014 auction will determine who will provide generation service for an additional 30% of DP&L’s SSO load for January 1, 2015 through May 31, 2017; and the 2016 auction will determine who will provide generation service for an additional 30% for DP&L’s SSO load for January 1, 2016 through May 31, 2017. Future blended rates, beyond 2014, are dependent on the actual auction results that will take place on an annual basis.
DP&L filed a generation separation application at the end of December 2013, as required in its ESP order, with the PUCO and on February 25, 2013, filed a supplemental application. In the supplemental application, DP&L reaffirmed its commitment to separate the generation assets on or before May 31, 2017. DP&L continues to look at multiple options to effectuate the separation including the transfer to an unregulated affiliate or through a sale process. Assuming a transfer to an affiliate, we have requested the ability for the DP&L to, among other things: (a) maintain the greater of, (i) total debt of up to $750 million; or (ii) total debt equal to 75% of rate base; (b) transfer the assets at a fair market value; and (c) keep OVEC as part of the utility post separation.
Environmental Matters
In relation to MATS, 3,246 MW of DPL's generation capacity is largely compliant with MATS, and DPL does not expect to incur material capital expenditures to ensure compliance with MATS. However, DP&L has 207 MW of generation capacity
14
that is jointly-owned and expected to cease operations due to the inability to comply with the requirements under MATS. For more information see
Other United States Environmental and Land Use Legislation and Regulations
discussion later in this section.
Key Financial Drivers
Although the recent ESP decision provides some clarity on the underlying drivers through 2016, challenges remain for DPL beyond 2016.
Through 2016, DPL financial results are likely to be driven by many factors including, but not limited to, the following:
|
•
|
PJM capacity prices auctioned already (as discussed above)
|
|
•
|
Non-bypassable revenue: $73 million in 2013 and allowed to earn $110 million annually from 2014 through 2016
|
|
•
|
Customer switching, competitive bidding and SSO rates (as discussed above)
|
|
•
|
Retail margins earned at DPLER
|
Beyond 2016, DPL financial drivers include many factors, such as the following:
|
•
|
PJM capacity prices
|
|
•
|
Recovery in the power market, particularly as it relates to an expansion in dark spreads
|
|
•
|
Sale or transfer to a DPL affiliate of DP&L generation assets
|
|
•
|
DPL’s ability to reduce its cost structure and lower the amount of non-recourse debt at DPL
|
See Item 1A.—
Risk Factors
for additional discussion on DPL.
U.S. Generation
Business Description.
In the U.S., we own a diversified generation portfolio in terms of geography, technology and fuel source. The principal markets where we are engaged in the generation and supply of electricity (energy and capacity) are the Western Electricity Coordinating Council (“WECC”), PJM, Southwest Power Pool Electric Energy Network (“SPP”) and Hawaii. AES Southland, in the WECC, is our most significant generating business.
AES Southland
Business Description.
In terms of aggregate installed capacity, AES Southland is one of the largest generation operators in California, with an installed capacity of 3,941 MW, accounting for approximately 6% of the state’s installed capacity and 17% of the peak demand of Southern California Edison. The three coastal power plants comprising AES Southland are in areas that are critical for local reliability and play an important role in integrating the increasing amounts of renewable generation resources in California.
Market Structure.
All of AES Southland’s capacity is contracted through a long-term agreement, which expires in mid-2018 (the “Tolling Agreement”). Under the Tolling Agreement, AES Southland’s largest revenue driver is unit availability, as approximately 98% of its revenue comes from availability-related payments. Historically, AES Southland has generally met or exceeded its contractual availability requirements under the Tolling Agreement and may capture bonuses for exceeding availability requirements in peak periods.
The offtaker under the Tolling Agreement provides gas to the three facilities at no cost; therefore, AES Southland is not exposed to significant fuel price risk. AES Southland does, however, guarantee the efficiency of each unit so that any fuel consumed in excess of what would have been consumed had the guaranteed efficiency been achieved is paid for by AES Southland. Additionally, if the units operate at an efficiency better than the guaranteed efficiency, AES Southland gets credit for the gas that is not consumed. The business is also exposed to the cost of replacement power for a limited time period if any of the plants are dispatched by the offtaker and are not able to meet the required dispatch schedule for generation of electric energy.
AES Southland delivers electricity into the California Independent System Operator’s market through its Tolling Agreement counterparty.
Regulatory Framework
Environmental Matters.
15
For a discussion of environmental regulatory matters affecting U.S. Generation, see
“Environmental and Land Use Regulations”
below.
Key Financial Drivers
AES Southland’s contractual availability is the single most important driver of operations. Its units are generally required to achieve at least 86% availability in each contract year; AES Southland has historically met or exceeded its contractual availability.
Additional U.S. Generation Businesses
Business Description.
Additional businesses include thermal and wind generating facilities, of which AES Hawaii and our U.S. wind generation business are the most significant.
Many of our U.S. generation plants provide baseload operations and are required to maintain a guaranteed level of availability. Any change in availability has a direct impact on financial performance. The plants are generally eligible for availability bonuses on an annual basis if they meet certain requirements. In addition to plant availability, fuel cost is a key business driver for some of our facilities.
AES Hawaii
. AES Hawaii receives a fuel payment from its offtaker, which is based on a fixed rate indexed to the Gross National Product – Implicit Price Deflator (“GNPIPD”). Since the fuel payment is not directly linked to market prices for fuel, the risk arising from fluctuations in market prices for coal is borne by AES Hawaii.
To mitigate the risk from such fluctuations, AES Hawaii has entered into fixed-price coal purchase commitments that end in February 2015; the business could be subject to variability in coal pricing beginning in March 2015. To mitigate fuel risk beyond February 2015, AES Hawaii plans to seek additional fuel purchase commitments on favorable terms. However, if market prices rise and AES Hawaii is unable to procure coal supply on favorable terms, the financial performance of AES Hawaii could be materially and adversely affected.
U.S. Wind
. AES has 1,039 MW of wind capacity in the U.S., primarily located in California, Texas and West Virginia. Typically, these facilities sell under long-term PPAs. AES financed most of these projects with tax-equity structures. AES manages the wind portfolio as part of its broader investments in the U.S., leveraging operational and commercial resources to supplement the experienced subject matter experts in the wind industry to achieve optimal results.
Market Structure.
Two of the primary fuels used by our U.S. generation facilities, coal and pet coke, are commodities with international prices set by market factors, although the price of the third primary fuel, natural gas is generally set domestically. Price variations for these fuels can change the composition of generation costs and energy prices in our generation businesses. Many of these generation businesses have entered into long-term PPAs with utilities or other offtakers. Some coal-fired power plant businesses in the U.S. with PPAs have mechanisms to recover fuel costs from the offtaker, including an energy payment that is partially based on the market price of coal. In addition, these businesses often have an opportunity to increase or decrease profitability from payments under their PPAs depending on such items as plant efficiency and availability, heat rate, ability to buy coal at lower costs through AES’ global sourcing program, and fuel flexibility. Revenue may change materially as prices in fuel markets fluctuate, but the variable margin or profitability should not be materially changed when market price fluctuations in fuel are borne by the offtaker.
Regulatory Framework.
Several of our generation businesses in the United States, currently operate as Qualifying Facilities (“QFs”) as defined under the Public Utility Regulatory Policies Act (“PURPA”). These businesses entered into long-term contracts with electric utilities that had a mandatory obligation under PURPA requirements to purchase power from QFs at the utility’s avoided cost (i.e., the likely costs for both energy and capital investment that would have been incurred by the purchasing utility if that utility had to provide its own generating capacity or purchase it from another source). To be a QF, a cogeneration facility must produce electricity and useful thermal energy for an industrial or commercial process or heating or cooling applications in certain proportions to the facility’s total energy output, and must meet certain efficiency standards. To be a QF, a small power production facility must generally use a renewable resource as its energy input and meet certain size criteria.
Our non-QF generation businesses in the United States currently operate as Exempt Wholesale Generators (“EWG”) as defined under EPAct 1992. These businesses, subject to approval of FERC, have the right to sell power at market-based rates, either directly to the wholesale market or to a third party offtaker such as a power marketer or utility/industrial customer. Under the Federal Power Act (“FPA”) and FERC’s regulations, approval from FERC to sell wholesale power at market-based rates is generally dependent upon a showing to FERC that the seller lacks market power in generation and transmission, that the seller and its affiliates cannot erect other barriers to market entry and that there is no opportunity for abusive transactions involving
16
regulated affiliates of the seller. To prevent market manipulation, FERC requires sellers with market-based rate authority to file certain reports, including a triennial updated market power analysis for markets in which they control certain threshold amounts of generation.
Other Regulatory Matters
The U.S. wholesale electricity market consists of multiple distinct regional markets that are subject to both federal regulation, as implemented by the U.S. FERC, and regional regulation as defined by rules designed and implemented by the RTOs, non-profit corporations that operate the regional transmission grid and maintain organized markets for electricity. These rules for the most part govern such items as the determination of the market mechanism for setting the system marginal price for energy and the establishment of guidelines and incentives for the addition of new capacity. See Item 1A.—
Risk Factors
for additional discussion on U.S. regulatory matters.
Our businesses are subject to emission regulations, which may result in increased operating costs or the purchase of additional pollution control equipment if emission levels are exceeded. Our businesses periodically review their obligations for compliance with environmental laws, including site restoration and remediation. Because of the uncertainties associated with environmental assessment and remediation activities, future costs of compliance or remediation could be higher or lower than the amount currently accrued, if any. For a discussion of environmental laws and regulations affecting the U.S. business, see
Other United States Environmental and Land Use Legislation and Regulations
later in this section. In April 2012, the EPA’s rule to establish maximum achievable control technology standards for each hazardous air pollutant regulated under the Clean Air Act (“CAA”) emitted from coal and oil-fired electric utilities, known as MATS became effective.
Andes SBU
Our Andes SBU has generation facilities in three countries — Chile, Colombia and Argentina. Our Andes operations accounted for
17%
,
16%
and
19%
of consolidated AES Operating Margin and
19%
,
18%
and
29%
of AES Adjusted PTC (a non-GAAP measure) in
2013
,
2012
and
2011
, respectively. The percentages shown are the contribution by our Andes SBU to gross Operating Margin and Adjusted PTC before deductions for Corporate.
AES Gener, which owns all of our assets in Chile, Chivor in Colombia and TermoAndes in Argentina, as detailed below, is a publicly-listed company in Chile. AES has a 71% ownership interest in AES Gener and this business is consolidated in our financial statements.
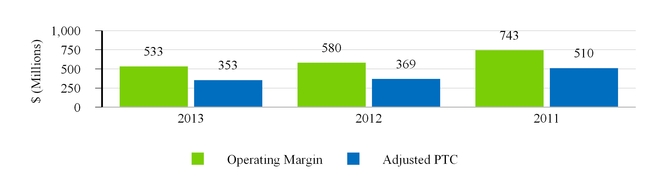
The following table provides highlights of our Andes operations:
|
Countries
|
Chile, Colombia and Argentina
|
|
|
Generation Capacity
|
8,075 gross MW (6,189 proportional MW)
|
|
|
Generation Facilities
|
37 (including 4 under construction)
|
|
|
Key Generation Businesses
|
AES Gener, Chivor and AES Argentina
|
|
17
Operating installed capacity of our Andes SBU totals 8,075 MW, of which 44%, 43% and 13% is located in Argentina, Chile and Colombia, respectively. Set forth in the table below is a list of our Andes SBU generation facilities:
|
Business
|
Location
|
Fuel
|
Gross MW
|
AES Equity Interest (Percent, Rounded)
|
Year Acquired or Began Operation
|
|||||||
|
Chivor
|
Colombia
|
Hydro
|
1,000
|
|
71
|
%
|
2000
|
|||||
|
Colombia Subtotal
|
1,000
|
|
||||||||||
|
Gener
(1)
|
Chile
|
Hydro/Coal/Diesel/Biomass
|
985
|
|
71
|
%
|
2000
|
|||||
|
Guacolda
(2)
|
Chile
|
Coal/Pet Coke
|
608
|
|
35
|
%
|
2000
|
|||||
|
Electrica Angamos
|
Chile
|
Coal
|
545
|
|
71
|
%
|
2011
|
|||||
|
Electrica Santiago
(3)
|
Chile
|
Gas/Diesel
|
479
|
|
71
|
%
|
2000
|
|||||
|
Norgener
|
Chile
|
Coal/Pet Coke
|
277
|
|
71
|
%
|
2000
|
|||||
|
Electrica Ventanas
(4)
|
Chile
|
Coal
|
272
|
|
71
|
%
|
2010
|
|||||
|
Electrica Campiche
(5)
|
Chile
|
Coal
|
272
|
|
71
|
%
|
2013
|
|||||
|
Electrica Angamos ES
(6)
|
Chile
|
Energy Storage
|
40
|
|
71
|
%
|
2011
|
|||||
|
Gener - Norgener ES (Los Andes)
(6)
|
Chile
|
Energy Storage
|
24
|
|
71
|
%
|
2009
|
|||||
|
Chile Subtotal
|
3,502
|
|
||||||||||
|
TermoAndes
(7)
|
Argentina
|
Gas/Diesel
|
643
|
|
71
|
%
|
2000
|
|||||
|
AES Gener Subtotal
|
5,145
|
|
||||||||||
|
Alicura
|
Argentina
|
Hydro
|
1,050
|
|
100
|
%
|
2000
|
|||||
|
Paraná-GT
|
Argentina
|
Gas/Oil/Biodiesel
|
845
|
|
100
|
%
|
2001
|
|||||
|
San Nicolás
|
Argentina
|
Coal/Oil/Gas
|
675
|
|
100
|
%
|
1993
|
|||||
|
Los Caracoles
(8)
|
Argentina
|
Hydro
|
125
|
|
—
|
%
|
2009
|
|||||
|
Cabra Corral
|
Argentina
|
Hydro
|
102
|
|
100
|
%
|
1995
|
|||||
|
Quebrada de Ullum
(8)
|
Argentina
|
Hydro
|
45
|
|
—
|
%
|
2004
|
|||||
|
Ullum
|
Argentina
|
Hydro
|
45
|
|
100
|
%
|
1996
|
|||||
|
Sarmiento
|
Argentina
|
Gas/Diesel
|
33
|
|
100
|
%
|
1996
|
|||||
|
El Tunal
|
Argentina
|
Hydro
|
10
|
|
100
|
%
|
1995
|
|||||
|
Argentina Subtotal
|
2,930
|
|
||||||||||
|
Andes Total
|
8,075
|
|
||||||||||
|
(1)
|
Gener plants: Alfalfal, Laguna Verde, Laguna Verde Turbogas, Laja, Los Vientos, Maitenes, Queltehues, San Francisco de Mostazal, Santa Lidia, Ventanas and Volcán.
|
|
(2)
|
Guacolda plants: Guacolda 1, Guacolda 2, Guacolda 3 and Guacolda 4. Unconsolidated entities for which the results of operations are reflected in Equity in Earnings of Affiliates.
|
|
(3)
|
Electrica Santiago plants: Nueva Renca and Renca.
|
|
(4)
|
Electrica Ventanas plant: Nueva Ventanas.
|
|
(5)
|
Electrica Campiche plant: Ventanas IV.
|
|
(6)
|
Energy Storage MW are power plant equivalent dispatchable resource, including supply and load capability.
|
|
(7)
|
TermoAndes is located in Argentina, but is connected to both the SING in Chile and the SADI in Argentina.
|
|
(8)
|
AES operates these facilities through management or O&M agreements and owns no equity interest in these businesses.
|
Under construction
The following table lists our plants under construction in the Andes SBU:
|
Business
|
Location
|
Fuel
|
Gross MW
|
AES Equity Interest (Percent, Rounded)
|
Expected Year of Commercial Operations
|
|||||||
|
Gener - Cochrane
|
Chile
|
Energy Storage
|
40
|
|
42
|
%
|
2016
|
|||||
|
Gener - Cochrane
|
Chile
|
Coal
|
532
|
|
42
|
%
|
2016
|
|||||
|
Gener - Alto Maipo
|
Chile
|
Run-of-River Hydro
|
531
|
|
42
|
%
|
2018
|
|||||
|
Gener—Guacolda V
|
Chile
|
Coal
|
152
|
|
35
|
%
|
2015
|
|||||
|
Chile Subtotal
|
1,255
|
|
||||||||||
|
Chivor—Tunjita
|
Colombia
|
Hydro
|
20
|
|
71
|
%
|
2014
|
|||||
|
Colombia Subtotal
|
20
|
|
||||||||||
|
Andes Total
|
1,275
|
|
||||||||||
18
The following map illustrates the location of our Andes facilities:
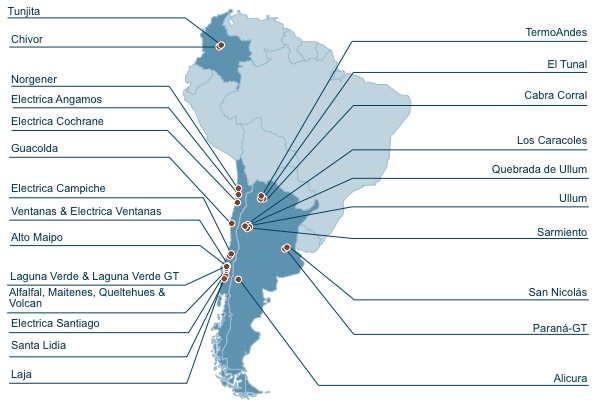
Andes Businesses
Chile
Business Description.
In Chile, through AES Gener, we are engaged in the generation and supply of electricity (energy and capacity) in the two principal markets: the Central Interconnected Electricity System (“SIC”) and Northern Interconnected Electricity System (“SING”). In terms of aggregate installed capacity, AES Gener is the second largest generation operator in Chile with an installed capacity of 4,081 MW, including TermoAndes and excluding energy storage, and a market share of 22% as of December 31, 2013.
AES Gener owns a diversified generation portfolio in Chile in terms of geography, technology, customers and fuel source. AES Gener’s installed capacity is located near the principal electricity consumption centers, including Santiago, Valparaiso and Antofagasta. AES Gener’s diverse generation portfolio, composed of hydroelectric, coal, gas, diesel and biomass facilities, allows the businesses to operate under a variety of market and hydrological conditions, manage AES Gener’s contractual obligations with regulated and unregulated customers and, as required, provide back-up spot market energy to the SIC and SING. AES Gener has experienced significant growth in recent years, responding to market opportunities with the completion of nine generation projects totaling approximately 1,700 MW and increasing AES Gener’s installed capacity by 49% from 2006 to 2013. Additionally, we are constructing an additional 1,255 MW, comprised of the 152 MW coal-fired Guacolda V in the SIC, the 532 MW coal-fired Cochrane plant in the SING and the 531 MW Alto Maipo run-of-the river hydroelectric plant in the SIC.
In Chile, we align AES Gener’s contracts with their efficient generation capacity, contracting a significant portion of their baseload capacity, currently coal and hydroelectric, under long-term contracts with a diversified customer base, which includes both regulated and unregulated customers. AES Gener reserves its higher variable cost units as designated back-up facilities, principally the diesel- and gas-fired units in Chile, for sales to the spot market during scarce system supply conditions, such as dry hydrological conditions and plant outages. In Chile, sales on the spot market are made only to other generation companies that are members of the relevant Economic Load Dispatch Center (“CDEC”) at the system marginal cost.
AES Gener currently has long-term contracts, with average terms of 13 and 16 years, with regulated distribution companies and unregulated customers, such as mining and industrial companies. In general, these long-term contracts include both fixed and variable payments along with indexation mechanisms, which periodically adjust prices based on the generation
19
cost structure related to the U.S. Consumer Price Index (“U.S. CPI”), the international price of coal, and in some cases, with pass-through of fuel and regulatory costs, including changes in law.
In addition to energy payments, AES Gener also receives firm capacity payments for contributing to the system’s ability to meet peak demand. These payments are added to the final electricity price paid by both unregulated and regulated customers. In each system, the CDEC annually determines the firm capacity amount allocated to each power plant. A plant’s firm capacity is defined as the capacity that it can guarantee at peak hours during critical conditions, such as droughts, taking into account statistical information regarding maintenance periods and water inflows in the case of hydroelectric plants. The capacity price is fixed by the National Energy Commission (“CNE”) in the semi annual node price report and indexed to the U.S. CPI and other relevant indices.
Market Structure.
Chile has four power systems, largely as a result of its geographic shape and size. The SIC is the largest of these systems, with an installed capacity of 14,080 MW as of December 31, 2013. The SIC serves approximately 92% of the Chilean population, including the densely populated Santiago Metropolitan Region, and represents 75% of the country’s electricity demand. The SING serves about 6% of the Chilean population, representing 24% of Chile’s electricity consumption, and is mostly oriented toward mining companies.
In 2013, thermoelectric generation represented 71% of the total generation in Chile. In the SIC, thermoelectric generation represents 55% of installed capacity, is required to fulfill demand not satisfied by hydroelectric output, and is critical to guaranteeing reliable and dependable electricity supply under dry hydrological conditions. In the SING, which includes the Atacama Desert, the driest desert in the world, thermoelectric capacity represents 99.7% of installed capacity. The fuels used for generation, mainly coal, diesel and LNG, have international prices.
In the SIC, where hydroelectric plants represent a large part of the system’s installed capacity, hydrological conditions largely influence plant dispatch and, therefore, spot market prices, given that river flow volumes, melting snow and initial water levels in reservoirs largely determine the dispatch of the system’s hydroelectric and thermoelectric generation plants. Rainfall and snowfall occurs in Chile principally in the southern cone winter season (June to August) and during the remainder of the year precipitation is scarce. When rain is abundant, energy produced by hydroelectric plants can amount to more than 70% of total generation. In 2013, hydroelectric generation represented 39% of total energy production.
Regulatory Framework
Electricity Regulation.
The government entity that has primary responsibility for the Chilean electricity system is the Ministry of Energy, acting directly or through the CNE and the Superintendency of Electricity and Fuels. The electricity sector is divided into three segments: generation, transmission and distribution. In general terms, generation and transmission expansion are subject to market competition, while transmission operation and distribution, are subject to price regulation. The transmission segment consists of companies that transmit the electricity produced by generation companies at high voltage. Companies that are owners of a trunk transmission system cannot participate in the generation or distribution segments.
Companies in the SIC and the SING that possess generation, transmission, sub-transmission or additional transmission facilities, as well as unregulated customers directly connected to transmission facilities, are coordinated through the CDEC, which minimizes the operating costs of the electricity system, while meeting all service quality and reliability requirements. The principal purpose of the CDEC is to ensure that the most efficient electricity generation available to meet demand is dispatched to customers. The CDEC dispatches plants in merit order, based on their variable cost of production, which allows for electricity to be supplied at the lowest available cost.
All generators can commercialize energy through contracts with distribution companies for their regulated and unregulated customers, or directly with unregulated customers. Unregulated customers are customers whose connected capacity is higher than 2 MW. By law, both regulated and unregulated customers are required to purchase 100% of their electricity requirements under contract. Generators may also sell energy to other power generation companies on a short-term basis. Power generation companies may engage in contracted sales amongst themselves at negotiated prices, outside the spot market. Electricity prices in Chile, under contract and on the spot market, are denominated in U.S. Dollars, although payments are made in Chilean Pesos.
Other Regulatory Considerations
. In 2011, a regulation on air emission standards for thermoelectric power plants became effective. This regulation provides for stringent limits on emission of particulate matter and gases produced by the combustion of solid and liquid fuels, particularly coal. For existing plants, including those currently under construction, the new limits for particulate matter emissions went into effect at the end of 2013 and the new limits for SO
2
(sulfur dioxide), NOx (nitrogen dioxide) and mercury emission will begin to apply in mid-2016, except for those plants operating in zones declared saturated or latent zones (areas at risk of or affected by excessive air pollution), where these emission limits will become effective by June 2015. In order to comply with the new emission standards, AES Gener initiated investments in Chile at its older coal facilities
20
(Ventanas I and II and Norgener I and II, constructed between 1964 and 1997) in 2012. As of December 31, 2013, AES Gener has invested approximately $155 million and expects the remaining $96 million will be invested in 2014, in order to comply within the required time frame. Additionally, its equity method investee Guacolda started the installation of new equipment during 2013, spending approximately $36 million (Guacolda I, II and IV) and the remaining $185 million will be invested between 2014 and 2016.
Chilean law requires every electricity generator to supply a certain portion of its total contractual obligations with non-conventional renewable energies (“NCREs”). In October 2013, the NCRE law was amended, increasing the NCRE requirements. The law distinguishes between energy contracts executed before and after July 1, 2013. For contracts executed between August 31, 2007 and July 1, 2013, the NCRE requirement is equal to 5% in 2014 with annual contract increases of 0.5% until reaching 10% in 2024. The NCRE requirement for contracts executed after July 1, 2013 is equal to 6% in 2013, with annual increases of 1% thereafter until reaching 12% in 2020, and subsequently annual increases of 1.5% until it is equal to 20% in 2025. Generation companies are able to meet this requirement by developing their own NCRE generation capacity (wind, solar, biomass, geothermal and small hydroelectric technology), purchasing NCREs from qualified generators or by paying the applicable fines for non-compliance. AES Gener currently fulfills the NCRE requirements by utilizing AES Gener’s own biomass power plants and by purchasing NCREs from other generation companies. It has sold certain water rights to companies that are developing small hydro projects, entering into power purchase agreements with these companies in order to promote development of these projects, while at the same time meeting the NCRE requirements. At present, AES Gener is in the process of negotiating additional NCRE supply contracts to meet the future requirements.
Key Financial Drivers
In Chile, AES Gener’s contracting strategy, determining both the amount of capacity to contract or leave uncommitted for spot market sales and the relevant pricing formulas including indexation, is important to our profitability. AES Gener aligns its contracts with its efficient generation capacity, contracting a significant portion of its efficient capacity under long-term contracts, while reserving its higher variable cost units for sales on the spot market. The performance of its generating assets, efficiency and availability, is also a critical part of its strategy in order to maximize contracted margins and avoid exposure to spot price volatility.
In the SIC, hydrological conditions are also an important financial driver, since they largely influence plant dispatch and, therefore, spot market prices. AES Gener becomes a short-term purchaser of electricity from other generation companies during rainy hydrological conditions, when spot market prices are at their lowest, and AES Gener’s spot sales of electricity generated by their back-up facilities increase in periods of low water conditions, when spot market prices are at their highest. Both extreme hydrological conditions provide AES Gener with improved earnings and cash flow.
Since 2007, AES Gener has constructed and initiated commercial operations of approximately 1,700 MW of new capacity, representing a significant portion of the increase in installed capacity and investment in the SIC and SING during the period. In Chile, AES Gener has two coal-fired projects under construction with gross capacity of 684 MW, 152 MW of which is represented by Guacolda V in the northern part of the SIC, which is scheduled to begin operations in the second half of 2015, and the 532 MW Cochrane project in the SING, which is expected to begin operations in 2016. The Cochrane project includes a 40 MW energy storage project, which is also scheduled to initiate operations in 2016. Additionally, in the SIC, AES Gener initiated construction of the 531 MW two unit Alto Maipo run-of-river hydroelectric project in December 2013, adjacent to our existing Alfalfal power plant. Alto Maipo is the largest permitted project in the SIC market and includes 67 kilometers of tunnel work as part of the construction. This project is scheduled to start operations in 2018 and is expected to represent approximately 4% of the energy demand in the SIC at that time.
Colombia
Business Description.
As of December 31, 2013, AES Gener’s net power production in Colombia was 3,373 GWh (5% of the country’s total generation). Chivor, a subsidiary of AES Gener, owns a hydroelectric facility with installed capacity of 1,000 MW, located approximately 160 km east of Bogota. The installed capacity represents approximately 7% of system capacity as of December 31, 2013. The plant consists of eight 125 MW dam-based hydroelectric generating units in two separate sub-facilities. All of Chivor’s installed capacity in Colombia is hydroelectric and is therefore dependent on the prevailing hydrological conditions in the region in which it operates. Hydrological conditions largely influence generation and the spot prices at which Chivor sells its non-contracted generation in Colombia.
Chivor’s commercial strategy focuses on selling between 75% and 85% of the annual expected output under contracts, principally with distribution companies, in order to provide cash flow stability. These bilateral contracts with distribution companies are awarded in public bids and normally last from one to three years. The remaining generation is sold on the spot market to other generation and trading companies at the system marginal cost, allowing us to maximize the operating margin.
21
Additionally, Chivor receives reliability payments for the availability and reliability of Chivor’s reservoir during periods of scarcity, such as adverse hydrological conditions. These payments, referred to as “reliability charge payments” are designed to compensate generation companies for the firm energy that they are capable of providing to the system during critical periods of low supply in order to prevent electricity shortages.
Market Structure
Electricity supply in Colombia is concentrated in one main system, the National Interconnected System (“SIN”). The SIN encompasses one-third of Colombia’s territory, providing coverage to 96% of the country’s population. The SIN’s installed capacity totaled 14,600 MW as of December 31, 2013, comprised of 67% hydroelectric generation, 32% thermoelectric generation and 1% other. The dominance of hydroelectric generation and the marked seasonal variations in Colombia’s hydrology result in price volatility in the short-term market. In 2013, 72% of total energy demand was supplied by hydroelectric plants with the remaining supply from thermoelectric generation (27%) and cogeneration and self-generation power (1%). From 2003 to 2013, electricity demand in the SIN has grown at a compound annual growth rate of 2.9% and the Mining and Energetic Planning Unit (“UPME”) projects an average compound annual growth rate in electricity demand of 3% per year for the next ten years.
Regulatory Framework
Electricity Regulation.
Since 1994, the electricity sector in Colombia has operated under a competitive market framework for the generation and sale of electricity and a regulated framework for transmission and distribution. The distinct activities of the electricity sector are governed by various laws and the regulations and technical standards issued by the Energy and Gas Regulation Commission (“CREG”). Other government entities that play an important role in the electricity industry include: the Ministry of Mines and Energy, which defines the government’s policy for the energy sector; the Public Utility Superintendency of Colombia, which is in charge of overseeing and inspecting the utility companies; and the UPME, which is in charge of planning the expansion of the generation and transmission network.
The generation sector is organized on a competitive basis with companies selling their generation in the wholesale market at the short-term price or under bilateral contracts with other participants, including distribution companies, generators and traders, and unregulated customers at freely negotiated prices. Generation companies must submit price bids and report the quantity of energy available on a daily basis. The National Dispatch Center dispatches generators in merit order based on bid offers in order to ensure that demand will be satisfied by the lowest cost combination of available generating units.
Other Regulatory Considerations.
In the past few years, Colombian authorities have discussed proposals to make certain regulatory changes, which have not been implemented as of February 2014. One proposal is to replace or complement the current public auction system in which each distribution company holds an auction for its specific requirements and subsequently executes bilateral contracts with generation or trading companies, with a centralized auction in which the market administrator purchases energy for all distribution companies. Additionally, a proposal has been discussed that would allow authorities to dictate emergency energy situations, in cases such as severe drought conditions, in order to implement measures to prevent shortages and other negative economic impacts.
Key Financial Drivers
Hydrological conditions largely influence Chivor’s generation level. Maintaining the appropriate contract level, while working to maximize revenue, through sale of excess generation, is key to Chivor’s results of operations.
In Colombia, AES Gener is currently constructing the 20 MW Tunjita run-of-river hydroelectric project, which is scheduled to start operations in the second half of 2014.
Argentina
Our Business.
As of December 31, 2013, AES Argentina operates 3,573 MW which represents 11% of the country’s total installed capacity. The installed capacity in the Argentine Interconnected System ("SADI") includes the TermoAndes plant, a subsidiary of AES Gener, which is connected both to the SADI and the Chilean SING. AES Argentina has a diversified generation portfolio of ten generation facilities, comprised of 62% thermoelectric and 38% hydroelectric capacity. All of the thermoelectric capacity has the capability to burn alternative fuels. Approximately 69% of the thermoelectric capacity can operate alternatively with natural gas or diesel oil and the remaining 31% can operate alternatively with natural gas or fuel oil.
AES Argentina sells its production to customers in the short-term market, where prices are largely regulated. In 2013, approximately 81% of the energy was sold in the short-term market and 19% was sold under contract, as a result of the Energy Plus sales made by TermoAndes. Short-term prices are determined in Argentine Pesos by the Wholesale Electric Market Administrator (“CAMMESA”) and have been frozen at approximately $120 Pesos per MWh for the past three years.
22
All of the thermoelectric facilities have the ability to use natural gas and receive gas supplied through contracts with Argentine producers. In recent years, gas supply restrictions in Argentina, particularly during the winter season, have affected some of the plants, specifically the TermoAndes plant which is connected to the SING by a transmission line owned by AES Gener. The TermoAndes plant commenced operations in 2000, selling exclusively into the Chilean SING. In 2008, following requirements of the Argentine authorities, TermoAndes connected its two gas turbines to the SADI, while maintaining its steam turbine connected to the SING. However, since mid-December 2011, TermoAndes has been selling the plant’s full capacity in the SADI. TermoAndes’ electricity permit to export to the SING expired on January 31, 2013 and potential renewal is being evaluated.
Market Structure.
The SADI electricity market is managed by CAMMESA. As of December 31, 2013, the installed capacity of the SADI totaled 31,399 MW. In 2013, 66% of total energy demand was supplied by thermoelectric plants, 29% by hydroelectric plants and 5% from nuclear, wind and solar plants.
Thermoelectric generation in the SADI is principally fueled by natural gas. However, since 2004, and due to natural gas shortages, in addition to increasing electricity demand, the use of alternative fuels in thermoelectric generation, such as oil and coal has increased. Given the importance of hydroelectric facilities in the SADI, hydrological conditions determining river flow volumes and initial water levels in reservoirs largely influence hydroelectric and thermoelectric plant dispatch. Rainfall occurs principally in the southern cone winter season (June to August).
Regulatory Framework
Electricity Regulation.
The Argentine regulatory framework divides the electricity sector into generation, transmission and distribution. The wholesale electric market is made up of generation companies, transmission companies, distribution companies and large customers who are allowed to buy and sell electricity. Generation companies can sell their output in the short-term market or to customers in the contract market. The wholesale electric market is administrated by CAMMESA, which is responsible for dispatch coordination and determination of short-term prices. The Electricity National Regulatory Agency is in charge of regulating public service activities and the Ministry of Federal Planning, Public Investment and Services, through the Energy Secretariat, regulates system dispatch and grants concessions or authorizations for sector activities.
Since 2001, significant modifications have also been made to the electricity regulatory framework. These modifications include tariff conversion to Argentinean Pesos, freezing of tariffs, the cancelation of inflation adjustment mechanisms and the introduction of a complex pricing system in the wholesale electric market, which have materially affected electricity generators, transporters and distributors, and generated substantial price differences within the market. Since 2004, as a result of energy market reforms and overdue accounts receivables owed by the government to generators operating in Argentina, AES Argentina contributed certain accounts receivables to fund the construction of new power plants under FONINVEMEM agreements. These receivables accrue interest and are collected in monthly installments over 10 years once the related plants begin operations. At this point, three funds have been created to construct three facilities. The first two plants are operating and payments are being received, while the third plant is under construction. AES Argentina will receive a pro rata ownership interest in these newly-built plants once the accounts receivables have been paid. See Item 7.
Capital Resources and Liquidity — Long-Term Receivables
and Note 7.
Financing Receivables
for further discussion of receivables in Argentina.
On March 26, 2013, the Secretariat of Energy released Resolution 95/2013, which affects the remuneration of generators whose sales prices had been frozen since 2003. This new regulation, which modified the current regulatory framework for the electricity industry, is applicable to generation companies with certain exceptions. It defined a new compensation system based on compensating for fixed costs, non-fuel variable costs and an additional margin. Resolution 95/2013 converted the Argentine electric market towards an "average cost" compensation scheme, increasing revenues of generators that were not selling their production under the Energy Plus scheme or under energy supply contracts with CAMMESA. Resolution 95/2013 applies to all of AES Argentina's plants, excluding TermoAndes. Based on Note 2053, sent by the Ministry of Energy in March 2013, it is understood that TermoAndes' units are not affected by the resolution since they sell under the Energy Plus scheme.
Thermal units must achieve an availability target, which varies by technology in order to receive full fixed cost revenues. The availability of most of AES Argentina's units exceeds this market average. As a result of Resolution 95/2013, revenues to AES Argentina's thermal units increased, while the impact on hydroelectric units is dependent on hydrology. The new resolution also established that all fuels, except coal, are to be provided by CAMMESA. Thermoelectric natural gas plants not affected by the resolution, such as TermoAndes, are able to purchase gas directly from the producers for Energy Plus sales.
Additionally, under the resolution, the energy margin is divided into two components. One component of the margin is paid on a monthly basis, and the second component is held as a receivable, which will be contributed for future power projects to be defined by the authorities (similar to FONINVEMEM). The receivables component is lower than in previous regulations.
23
Key Financial Drivers
Potential changes in regulations, particularly changes related to the recognition of the coal-related cost of the San Nicolas plant or the Energy Plus framework, are key drivers for the Argentina business. The ability to contract sales with unregulated customers at TermoAndes and obtain the natural gas required to supply the contracts is another area of focus for the business. Macroeconomic conditions, foreign currency exchange rates, further regulatory changes, and AES Argentina's ability to collect on receivables, including FONINVEMEM and future receivables, impact operating performance and cash flow. Finally, hydrological conditions affect our plants' dispatch. See Item 7. —
Key Trends and Uncertainties - Argentina
for further discussion of Argentina.
Brazil SBU
Our Brazil SBU has generation and distribution facilities. Our Brazil operations accounted for
27%
,
27%
and
45%
of consolidated AES Operating Margin and
12%
,
16%
and
23%
of consolidated AES Adjusted PTC (a non-GAAP measure) in 2013, 2012 and
2011
, respectively. The percentages shown are the contribution by our Brazil SBU to gross operating margin and adjusted PTC before deductions for Corporate.
Eletropaulo and Tietê are publicly listed companies in Brazil. AES has a 16% economic interest in Eletropaulo and a 24% economic interest in Tietê, and these businesses are consolidated in our financial statements because we control them.
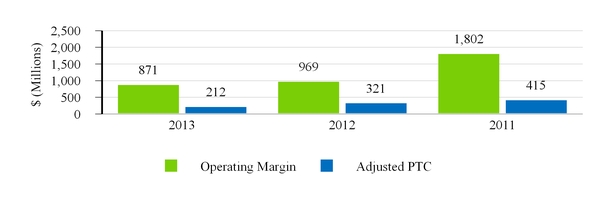
The following table provides highlights of our Brazil operations:
|
Generation Capacity
|
3,298 gross MW (932 proportional MW)
|
|
|
Utilities Penetration
|
8.0 million customers (55,190 GWh)
|
|
|
Generation Facilities
|
13
|
|
|
Utility Businesses
|
2
|
|
|
Key Generation Businesses
|
Tietê and Uruguaiana
|
|
|
Key Utility Businesses
|
Eletropaulo and Sul
|
|
Generation.
Operating installed capacity of our Brazil SBU totals 2,658 MW in AES Tietê plants, located in the State of São Paulo. Tietê represents approximately 11%, as of December 31, 2013, of the total generation capacity in the State of São Paulo and is the third largest private generator in Brazil. We also have another generation plant, AES Uruguaiana, located in the South of Brazil with an installed capacity of 640 MW.
Set forth in the table below is a list of our Brazil SBU generation facilities:
|
Business
|
Location
|
Fuel
|
Gross MW
|
AES Equity Interest (Percent, Rounded)
|
Year Acquired or Began Operation
|
|||||||
|
Tietê
(1)
|
Brazil
|
Hydro
|
2,658
|
|
24
|
%
|
1999
|
|||||
|
Uruguaiana
|
Brazil
|
Gas
|
640
|
|
46
|
%
|
2000
|
|||||
|
Brazil Total
|
3,298
|
|
||||||||||
|
(1)
|
Tietê plants with installed capacity: Água Vermelha (1,396 MW), Bariri (143 MW), Barra Bonita (141 MW), Caconde (80 MW), Euclides da Cunha (109 MW), Ibitinga (132 MW), Limoeiro (32 MW), Mogi-Guaçu (7 MW), Nova Avanhandava (347 MW), Promissão (264 MW), Sao Joaquim (3 MW) and Sao Jose (4 MW).
|
Distribution.
AES owns interests in two distribution facilities in Brazil, Eletropaulo and Sul. Eletropaulo operates in the metropolitan area of São Paulo and adjacent regions, distributing electricity to 24 municipalities in a total area of 4,526 km
2
, covering a region of high demographic density and the largest concentration of GDP in the country. Serving approximately
24
20.1 million people and 6.7 million consumer units, Eletropaulo is the largest power distributor in Brazil, according to the 2012 ranking of the Brazilian Association of the Distributors of Electric Energy (Abradee).
Sul is responsible for supplying electricity to 118 municipalities of the metropolitan region of Porto Alegre to the border with Uruguay and Argentina. The service area covers 99,512 km
2
, serving approximately 3.5 million people and 1.3 million consumer units.
Set forth in the table below is a list of our Brazil SBU distribution facilities:
|
Business
|
Location
|
Approximate Number of Customers Served as of 12/31/2013
|
GWh Sold in 2013
|
AES Equity Interest (Percent, Rounded)
|
Year Acquired
|
||||||||
|
Eletropaulo
|
Brazil
|
6,682,000
|
|
46,216
|
|
16
|
%
|
1998
|
|||||
|
Sul
|
Brazil
|
1,270,000
|
|
8,974
|
|
100
|
%
|
1997
|
|||||
|
7,952,000
|
|
55,190
|
|
||||||||||
The following map illustrates the location of our Brazil facilities:
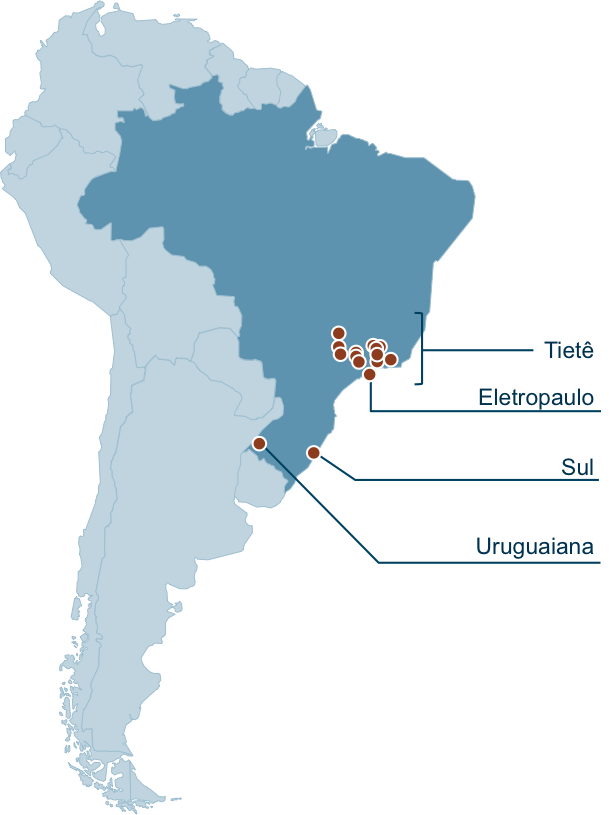
Brazil Generation Businesses
Business Description
Tietê is a portfolio of 12 hydroelectric power plants, with total installed capacity of 2,658 MW in the state of São Paulo. Tietê was privatized in 1999 under a 30-year concession expiring in 2029. AES owns a 24% economic interest, our partner the Brazilian Development Bank (“BNDES”) owns 28% and the remaining shares are publicly held or held by government-related entities. AES is the controlling shareholder and manages and consolidates this business.
Tietê sells nearly 100% of its assured capacity, approximately 11,108 GWh, to Eletropaulo under a long-term PPA, which is expiring in December 2015. The contract is price-adjusted annually for inflation, and as of December 31, 2013, the price was R$194/MWh.
Under the concession agreement, Tietê has an obligation to increase its capacity by 15%. Tietê, as well as other concessionaire generators, have not yet met this requirement due to regulatory, environmental, hydrological and fuel constraints. A legal case has been initiated by the state of São Paulo requiring the investment to be performed. Tietê is in the process of analyzing options to meet the obligation.
Uruguaiana is a 640 MW gas-fired combined cycle power plant commissioned in December 2000. AES manages and owns a 46% economic interest and the remaining is held by BNDES. The facility is located in the town of Uruguaiana in the state of Rio Grande do Sul. The plant’s operations were suspended in April 2009 due to unavailability of gas. The facility
25
operated on a short-term basis in February and March 2013 due to a short-term supply of LNG for the facility. Uruguaiana is working to secure gas on a long-term basis, to operate at the plant’s full capacity.
Market Structure
Brazil has installed capacity of 123,973 MW, which is 74% hydroelectric, 16% thermal and 10% renewable (biomass and wind). Brazil's national grid is divided into four subsystems. Tietê sells into the Southeast subsystem of the national grid, while Uruguaiana sells into the South.
Regulatory Framework
In Brazil, the Ministry of Mines and Energy ("MME") determines the maximum amount of energy that a plant can sell, called “Assured Energy”, which represents the long-term average expected energy production of the plant. Under current rules, a generation plant's Assured Energy can be sold to distribution companies through long-term (regulated) auctions or under unregulated bilateral contracts with large consumers or energy trading companies.
The National System Operator (“ONS”) is responsible for coordinating and controlling the operation of the national grid. The ONS dispatches generators based on hydrological conditions, reservoir levels, electricity demand and the prices of fuel and thermal generation. Given the importance of hydro generation in the country, the ONS sometimes reduces dispatch of hydro facilities and increases dispatch of thermal facilities to protect reservoir levels in the system.
Hydrological risk is shared among hydroelectric generation plants through the Energy Reallocation Mechanism ("MRE"). If the hydro system generates less than total Assured Energy of the system, hydro generators may need to purchase energy in the short-term market to fulfill their contract obligations.
Key Financial Drivers
As the system is highly dependent on hydroelectric generation, Tietê and Uruguaiana are affected by the hydrology in the overall sector, as well as the availability of Tietê’s plants and reliability of the Uruguaiana facility. The availability of gas for continued operations is a driver for Uruguaiana.
Tietê's PPA with Eletropaulo expires in December 2015. After that, Tietê’s strategy is to contract most of its Assured Energy in the free market and sell the remaining portion in the spot market. Tietê’s strategy is reassessed from time to time according to changes in market conditions, hydrology and other factors. As of December 31, 2013, Tietê had contracted an average of 478 MW, or approximately 38%, of its Assured Energy for delivery in 2016. For Tietê's uncontracted Assured Energy available for delivery in 2016, Tietê expects 2016 prices in the range of R$ 115-R$ 130/MWh, prior to adjustments for inflation. Future prices could vary materially from this range, depending on the supply and demand for electricity, hydrological, and other market conditions.
Brazil Utility Businesses
Business Description
Eletropaulo distributes electricity to the Greater São Paulo area, Brazil’s main economic and financial center. Eletropaulo is the largest electric power distributor in Latin America in terms of both revenues and volume of energy distribution.
AES owns 16% of the economic interest of Eletropaulo. Our partner, BNDES, owns 19% and the remaining shares are publicly held or held by government-related entities. AES is the controlling shareholder and manages and consolidates this business. Eletropaulo holds a 30-year concession that expires in 2028.
AES owns 100% of Sul. Sul distributes electricity in the metropolitan region of Porto Alegre up to the frontier with Uruguay and Argentina, respectively, in the municipalities of Santana do Livramento and Uruguaiana/São Borja at the extreme west of the state of Rio Grande do Sul. AES owns 100% of Sul and manages this business under a 30-year concession expiring in 2027.
Regulatory Framework
In Brazil, ANEEL, a government agency, sets the tariff for each distribution company based on a Return on Asset Base methodology, which also benchmarks operational costs against other distribution companies.
The tariff charged to regulated customers consists of two elements: (i) pass through of non-manageable costs under a determined methodology (“Parcel A”), which includes energy purchase costs, sector charges and transmission and distribution system expenses; and (ii) a manageable cost component (“Parcel B”), which includes operation and maintenance costs (defined
26
by ANEEL), recovery of investments and a component for a return to the distributor. The return to distributors is calculated as the net asset base multiplied by the regulatory weighted average cost of capital ("Regulatory WACC"), which is set for all industry participants during each tariff reset cycle. The current Regulatory WACC, after tax, is 7.5%.
Each year, ANEEL reviews each distributor's tariff for an annual tariff adjustment. The annual tariff adjustments allow for pass-through of Parcel A costs and inflation impacts on Parcel B costs, adjusted for expected efficiency gains and quality performances. Distribution companies are required to contract between 100% and 105% of anticipated energy needs through the regulated auction market. If contracted levels fall below required levels, distribution companies may be subject to limitations on the pass-through treatment of energy purchase costs, as well as penalties.
Every four to five years, ANEEL resets each distributor's tariff to incorporate the revised Regulatory WACC and determination of the distributor's net asset base. Eletropaulo’s tariff reset occurs every four years and the next tariff reset will be in July 2015. Sul’s tariff is reset every five years and the next tariff reset is expected in April 2018.
Eletropaulo Regulatory Asset Base Update. The Brazilian regulator (ANEEL) has challenged the parameters of a tariff reset for Eletropaulo, in which the Company has a 16% ownership interest, which was implemented in July 2012 and retroactive to 2011. ANEEL has asserted that during the period between 2007 and 2011, certain assets that were included in the regulatory asset base should not have been included and that Eletropaulo should refund customers for the return on the disputed assets that was earned during this period. On December 17, 2013, ANEEL determined, at the administrative level, that Eletropaulo should adjust the prior (2007-2011) regulatory asset base and refund customers in the amount of $269 million over a period of up to four tariff processes beginning in July 2014. Eletropaulo filed for an administrative appeal requesting ANEEL to reconsider their decision and requested that the decision be suspended until the appeal process was completed. On January 28, 2014, ANEEL denied Eletropaulo’s request to suspend the effects of the previous decision. On January 29, 2014, Eletropaulo requested and received from the Federal Court of Brazil an injunction for the suspension of the effects of ANEEL’s previous decision. The injunction will remain in effect until ANEEL formally decides to reconsider their decision. If ANEEL were to confirm the original decision and the related refund to customers, the injunction would no longer be effective. The Company has recognized a regulatory liability of approximately $269 million in the Company’s fourth quarter results of operations since ANEEL has compelled the Company to refund customers beginning in July 2014. While Eletropaulo believes it has meritorious arguments on this matter and intends to pursue its objections to ANEEL’s rulings vigorously, the aforementioned rulings require Eletropaulo to refund customers beginning in July 2014, and therefore recognition of a regulatory liability is required. If Eletropaulo does prevail in the underlying case, Eletropaulo would seek recovery of the amounts refunded to customers, however there can be no assurance that Eletropaulo will prevail on the request for reconsideration by ANEEL or the underlying case.
Key Financial Drivers
Eletropaulo and Sul are affected by the demand for electricity, which is driven by economic activity, weather patterns and customers’ consumption behavior. Operating performance also is driven by the quality of service, efficient management of operating and maintenance costs, and the ability to control non-technical losses. Finally, annual tariff adjustments and periodic tariff resets by ANEEL impact results from operations. In addition, Eletropaulo is involved in a dispute with Centrais Elétricas Brasileiras S.A. (“Eletrobrás”) regarding a liability from the privatization of Eletropaulo. See Item 3.
Legal Proceedings
for further discussion of this dispute. If Eletropaulo is found liable in the dispute, Eletropaulo's results from operations could be materially affected.
MCAC SBU
Our MCAC SBU has a portfolio of distribution businesses and generation facilities, including renewable energy, in five countries, with a total capacity of 3,140 MW and distribution networks serving 1.3 million customers as of December 31, 2013. MCAC operations accounted for
17%
,
16%
and
13%
of consolidated AES Operating Margin and
19%
,
19%
and
17%
of consolidated AES Adjusted PTC (a non-GAAP measure) in
2013
,
2012
and
2011
, respectively. The percentages shown are the contribution by our MCAC SBU to gross Operating Margin and Adjusted PTC before deductions for Corporate.
27
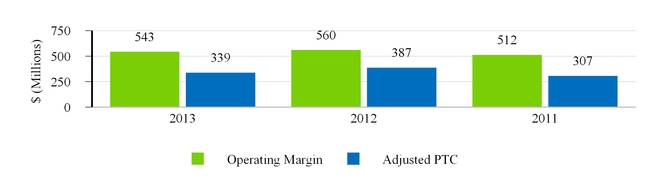
The following table provides highlights of our MCAC SBU operations:
|
Countries
|
Dominican Republic, El Salvador, Mexico, Panama and Puerto Rico
|
|
|
Generation Capacity
|
3,140 gross MW (2,489 proportional MW)
|
|
|
Utilities Penetration
|
1.3 million customers (3,655 GWh)
|
|
|
Generation Facilities
|
13
|
|
|
Utility Businesses
|
4
|
|
|
Key Generation Businesses
|
Andres, Panama and TEG TEP
|
|
|
Key Utility Businesses
|
El Salvador
|
|
The total operating installed capacity of our MCAC SBU is distributed 34%, 27%, 22% and 17% in Mexico, Dominican Republic, Panama and Puerto Rico, respectively. The table below lists our MCAC SBU facilities:
|
Business
|
Location
|
Fuel
|
Gross MW
|
AES Equity Interest (Percent, Rounded)
|
Year Acquired or Began Operation
|
|||||||
|
Andres
|
Dominican Republic
|
Gas
|
319
|
|
100
|
%
|
2003
|
|||||
|
Itabo
(1)
|
Dominican Republic
|
Coal/Gas
|
295
|
|
50
|
%
|
2000
|
|||||
|
DPP (Los Mina)
|
Dominican Republic
|
Gas
|
236
|
|
100
|
%
|
1996
|
|||||
|
Dominican Republic Subtotal
|
850
|
|
||||||||||
|
AES Nejapa
|
El Salvador
|
Landfill Gas
|
6
|
|
100
|
%
|
2011
|
|||||
|
El Salvador Subtotal
|
6
|
|
||||||||||
|
Merida III
|
Mexico
|
Gas
|
505
|
|
55
|
%
|
2000
|
|||||
|
Termoelectrica del Golfo (TEG)
|
Mexico
|
Pet Coke
|
275
|
|
99
|
%
|
2007
|
|||||
|
Termoelectrica del Penoles (TEP)
|
Mexico
|
Pet Coke
|
275
|
|
99
|
%
|
2007
|
|||||
|
Mexico Subtotal
|
1,055
|
|
||||||||||
|
Bayano
|
Panama
|
Hydro
|
260
|
|
49
|
%
|
1999
|
|||||
|
Changuinola
|
Panama
|
Hydro
|
223
|
|
89
|
%
|
2011
|
|||||
|
Chiriqui—Esti
|
Panama
|
Hydro
|
120
|
|
49
|
%
|
2003
|
|||||
|
Chiriqui—Los Valles
|
Panama
|
Hydro
|
54
|
|
49
|
%
|
1999
|
|||||
|
Chiriqui—La Estrella
|
Panama
|
Hydro
|
48
|
|
49
|
%
|
1999
|
|||||
|
Panama Subtotal
|
705
|
|
||||||||||
|
Puerto Rico
|
US—PR
|
Coal
|
524
|
|
100
|
%
|
2002
|
|||||
|
Puerto Rico Subtotal
|
524
|
|
||||||||||
|
MCAC Total
|
3,140
|
|
||||||||||
|
(1)
|
Itabo plants: Itabo complex (two coal-fired steam turbines and one gas-fired steam turbine).
|
28
MCAC Utilities.
Our distribution businesses are located in El Salvador and distribute power to 1.3 million people in the country. This business consists of 4 companies, each of which operates in defined service areas as described in the table below:
|
Business
|
Location
|
Approximate Number of Customers Served as of 12/31/2013
|
GWh Sold in 2013
|
AES Equity Interest (Percent, Rounded)
|
Year Acquired
|
||||||||
|
CAESS
|
El Salvador
|
567,000
|
|
2,142
|
|
75
|
%
|
2000
|
|||||
|
CLESA
|
El Salvador
|
354,000
|
|
864
|
|
64
|
%
|
1998
|
|||||
|
DEUSEM
|
El Salvador
|
72,000
|
|
123
|
|
74
|
%
|
2000
|
|||||
|
EEO
|
El Salvador
|
277,000
|
|
526
|
|
89
|
%
|
2000
|
|||||
|
1,270,000
|
|
3,655
|
|
||||||||||
The following map illustrates the location of our MCAC facilities:
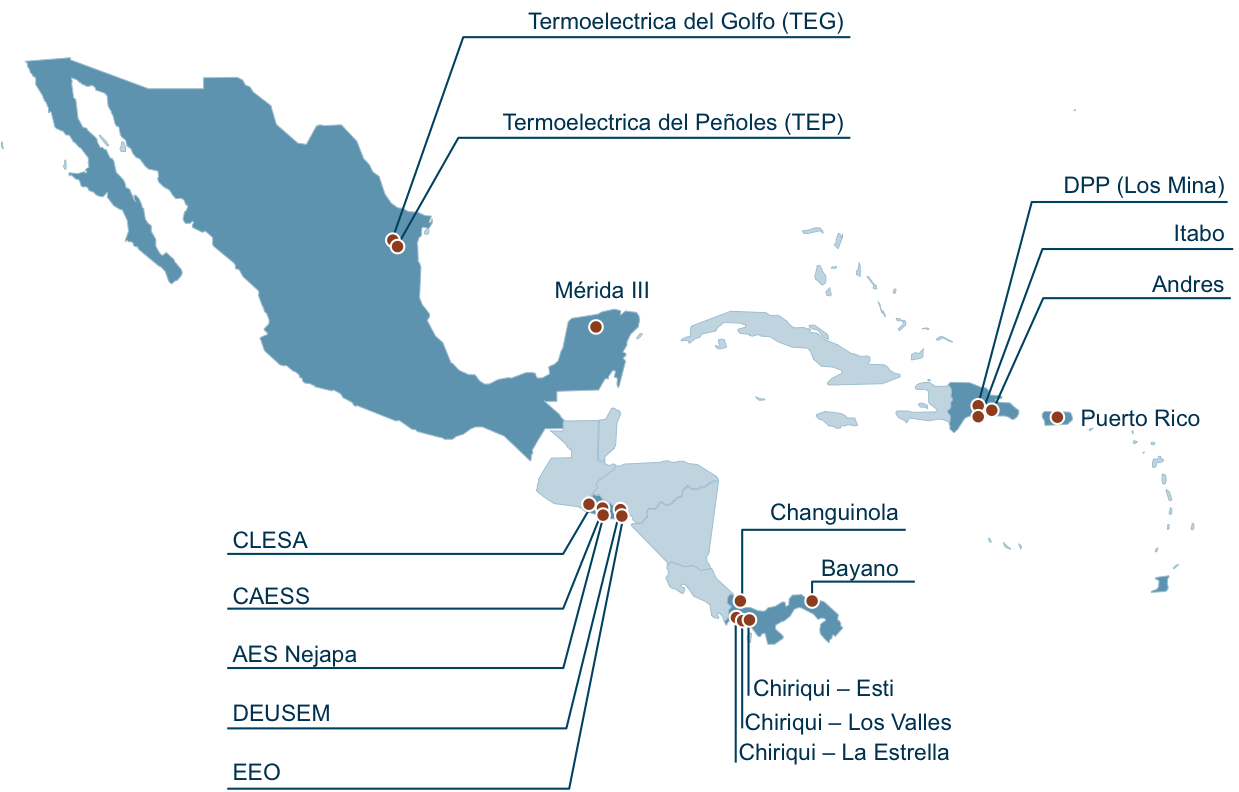
MCAC Businesses
Dominican Republic
Business Description.
AES Dominicana consists of its operating subsidiaries Itabo, Andres and Dominican Power Partners (“DPP”). AES has 23% of the system capacity (850 MW) and supplies approximately 40% of energy demand through its three generation facilities.
Itabo is 50%-owned by AES, 49.97% owned by FONPER, a government-owned utility and the remaining 0.03% is owned by employees. Itabo owns and operates two thermal power generation units with 295 MW of installed capacity in total. Itabo's PPAs are with government-owned distribution companies and expire in 2016.
Andres and DPP are both wholly-owned subsidiaries of AES. Andres has a combined cycle gas turbine and generation capacity of 319 MW and the only LNG import facility, with 160,000 cubic meters of storage capacity, in the country. DPP (Los Mina) has two open cycle natural gas turbines and generation capacity of 236 MW. Both Andres and DPP have in aggregate 555 MW of installed capacity, of which 450 MW is mostly contracted until 2018 with government-owned distribution companies and large customers.
AES Dominicana has a long-term LNG purchase contract through 2023 for 33.6 trillion btu/year with a price linked to NYMEX Henry Hub. This translates into a competitive advantage, as we are currently purchasing LNG at prices lower than those on the international market. The LNG contract terms allow the diversion of the cargoes to various markets in Latin America. These plants capitalize on the competitively-priced LNG contract by selling power where the market is dominated by expensive fuel oil-based generation.
29
In 2005, Andres entered into a contract to sell re-gasified LNG for further distribution to industrial users within the Dominican Republic, using compression technology to transport it within the country. In January 2010, the first LNG truck tanker loading terminal started operations. With this investment, AES is capturing demand from industrial and commercial customers.
Market Structure
Electricity Market.
The Dominican Republic has one main interconnected system with approximately 3,700 MW of installed capacity, composed primarily of thermal generation (85%), and hydroelectric power plants (15%).
Natural Gas Market
. The natural gas market in the Dominican Republic developed in 2001, when AES entered into a long-term contract for LNG and constructed AES Dominicana’s LNG regasification terminal.
Regulatory Framework
The regulatory framework in the Dominican Republic consists of a decentralized industry including generation, transmission and distribution, where generation companies can earn revenue through short- and long-term PPAs, ancillary services and a competitive wholesale generation market. All electric companies (generators, transmission and distributors), are subject to and regulated by the General Electricity Law (“GEL”).
Two main agencies are responsible for monitoring and ensuring compliance with the GEL. The National Energy Commission (“CNE”) is in charge of drafting and coordinating the legal framework and regulatory legislation; proposing and adopting policies and procedures to assure best practices; drafting plans to ensure the proper functioning and development of the energy sector; and promoting investment. The Superintendence of Electricity’s (“SIE”) main responsibilities include monitoring and supervising compliance with legal provisions and rules and monitoring compliance with the technical procedures governing generation, transmission, distribution and commercialization of electricity, and supervising electric market behavior in order to avoid monopolistic practices.
The electricity tariff applicable to regulated customers is subject to regulation within the concessions of the distribution companies. Clients with demand above 1.2 MW are classified as unregulated customers and their tariffs are unregulated.
Fuels and hydrocarbons are regulated by a specific law, which establishes prices to end customers and a tax on consumption of fossil fuels. For natural gas there are regulations related to the procedures to be followed to grant licenses and concession: i) distribution, including transportation and loading and compression plant; ii) the installation and operation of natural gas stations, including consumers and potential modifications of existing facilities; and iii) conversion equipment suppliers for vehicles. The regulation is administered by the Industrial and Commerce Ministry (“ICM”) who supervises commercial and industrial activities in the Dominican Republic as well as the fuels and natural gas commercialization to the end users.
Key Financial Drivers
Key drivers of financial results are plant reliability, the competitively-priced LNG contract, ancillary service revenues, and spot prices.
In addition, the financial weakness of the three state-owned distribution companies is due to low collection rates, high levels of non-technical losses and the delay in payments for the electricity supplied by generators. At times when outstanding balances have accumulated, AES Dominicana has accepted payment through other means, such as government bonds, in order to reduce their outstanding receiveables. There can be no guarantee that alternative collection methodologies will always be an avenue available for payment options. See Item 7.
Capital Resources and Liquidity — Long-Term Receivables
and Note 7.
Financing Receivables
for further discussion of receivables in the Dominican Republic.
Panama
Business Description
. AES owns and operates five hydroelectric plants, representing 705 MW of installed capacity, or 30% of the installed capacity in Panama. The majority of our capacity in Panama is run-of-river, with the exception of the 260 MW Bayano project.
Market Structure.
Panama’s current total installed capacity is 2,341 MW, of which 60% is hydroelectric and the remaining 40% is fueled by diesel, bunker fuel, and coal.
The Panamanian power sector is composed of three distinct operating business units: generation, distribution and transmission, all of which are governed by the Electric Law 6 enacted in 1997.
30
Generators can enter into long-term PPAs with distributors or unregulated consumers. In addition, generators can enter into alternative supply contracts with each other. Outside of the PPA market, generators may buy and sell energy in the short-term market.
The National Dispatch Center (“CND”) implements the economic dispatch of electricity in the wholesale market. The CND's objectives are to minimize the total cost of generation and maintain the reliability and security of the electric power system, taking into account the price of water, which determines the dispatch of hydro plants with reservoirs. Short-term power prices are determined on an hourly basis by the last dispatched generating unit.
Regulatory Framework.
The National Secretary of Energy (“SNE”) has the responsibilities of planning, supervising and controlling policies of the energy sector within Panama. With these responsibilities, the SNE proposes laws and regulations to the executive agencies that promote the procurement of electrical energy, hydrocarbons and alternative energy for the country.
The regulator of public services, known as the National Authority of Public Services (“ASEP”) is an autonomous agency of the government. ASEP is responsible for the control and oversight of public services including electricity and the transmission and distribution of natural gas utilities and the companies that provide such services.
Generators can only contract their firm capacity. Physical generation of energy is determined by the CND regardless of contractual arrangements.
Key Financial Drivers
Given that most of AES' portfolio is run-of-river, hydrological conditions have an important influence on its profitability. Variations in actual hydrology can result in excess or a short energy balance relative to our contract obligations. During the low inflow period (January to May), generation tends to be lower and AES Panama may purchase energy in the short-term market to cover contractual obligations. During the remainder of the year (June to December), generation tends to be higher; energy generated in excess of contract volumes is sold to the short-term market. In addition to hydrological conditions, commodity prices affect short-term electricity prices.
Mexico
Business Description.
AES owns installed capacity of 1,055 MW in Mexico, including the 550 MW Termoeléctrica del Golfo (“TEG”) and Termoeléctrica Peñoles (“TEP”), facilities and Merida III (“Merida”), a 505 MW generation facility.
The TEG and TEP coal-fired plants, located in San Luis Potosi, supply power to their offtakers under long-term PPAs that have a 90% availability guarantee. TEG and TEP secure their fuel (pet coke) under a long-term contract.
Merida is a combined-cycle gas turbine (“CCGT”), located in Merida, on Mexico’s Yucatan peninsula. Merida sells power to the Federal Commission of Electricity (“CFE”) under a capacity- and energy-based long-term PPA through 2025. Additionally, the plant purchases natural gas and diesel fuel under a long-term contract, the cost of which is then passed through to CFE under the terms of the PPA.
Market Structure
Mexico has a single national electricity grid, the National Power System (“SEN”), covering nearly all of Mexico’s territory. Mexico has an installed capacity totaling 53 GW with a generation mix of 62% thermal, 22% hydroelectric and 16% other. Electricity consumption is split between the following end users: industrial (59%), residential (26%) and commercial and service (15%).
Regulatory Framework
The CFE, which is mandated by the Mexican Constitution, is the state-owned electric monopoly, which operates the national grid and generates electricity for the public. CFE regulates wholesale tariffs, which are largely set by the marginal production cost of oil and gas-fired generation. The Mexican energy system is fully integrated under the sole responsibility of CFE. The Electric Public Service Law allows privately owned projects to produce electricity for self-supply application and/or IPP structures.
Private parties are allowed to invest in certain activities in Mexico’s electric power market, and obtain permits from the Ministry of Energy for: (i) generating power for self-supply; (ii) generating power through co-generation processes; (iii) generating power through independent production; (iv) small-scale production; and (v) importing and exporting electrical power. Permit holders are required to enter into PPAs with the CFE to sell all surplus power produced. Merida provides power
31
exclusively to CFE under a long-term contract. TEG/TEP provides the majority of its output to two offtakers under long-term contracts, and can sell any excess or surplus energy produced to CFE at a predetermined day-ahead price.
Key Financial Drivers
Plant availability is the largest single performance driver of this business. Additionally, AES’ Mexican businesses benefit from the wholesale price margin versus pet coke costs for any sales greater than the guaranteed output.
Other MCAC Businesses
Puerto Rico
AES Puerto Rico is a 524 MW coal-fired cogeneration plant utilizing Circulating Fluidized Bed Boiler (“CFB”) technology, representing approximately 14% of the installed capacity in Puerto Rico. The plant has a long-term PPA with the Puerto Rico Electric Power Authority (“PREPA”), a state-owned entity that supplies virtually all of the electric power consumed in the Commonwealth and generates, transmits and distributes electricity to 1.5 million customers.
El Salvador
AES is the majority owner of four of the five distribution companies operating in El Salvador. The distribution companies are operated by AES on an integrated basis under a single management team. AES El Salvador’s territory covers 80% of the country. AES El Salvador accounted for 3,655 GWh of market energy purchases during 2013, or about 63% market share of the country’s total market energy purchases.
The sector is governed by the General Electricity Law, and the general and specific orders issued by Superintendencia General de Electricidad y Telecomunicacions (“SIGET” or “The Regulator”). The Regulator, jointly with the distribution companies in El Salvador, completed the tariff reset process in December 2012 and defined the tariff calculation to be applicable for the next five years (2013-2017).
EMEA SBU
Our EMEA SBU has generation facilities in eight countries and a distribution utility in one country. Our EMEA operations accounted for
13%
,
14%
and
10%
of AES consolidated Operating Margin and
19%
,
18%
and
15%
of AES consolidated Adjusted PTC (a non-GAAP measure) in
2013
,
2012
and
2011
, respectively. The percentages shown are the contribution by our EMEA SBU to gross Operating Margin and Adjusted PTC before deductions for Corporate.
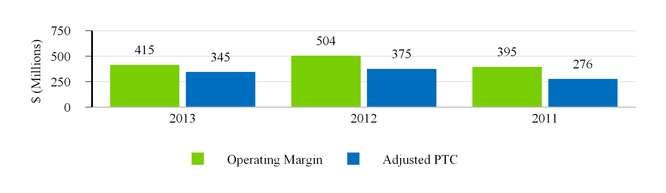
The following table provides highlights of our EMEA operations:
|
Countries
|
Bulgaria, Cameroon, Jordan, Kazakhstan, Netherlands, Nigeria, Turkey and United Kingdom
|
|
|
Generation Capacity
|
8,449 gross MW (6,089 proportional MW)
|
|
|
Utilities Penetration
|
1 million customers (3,569 GWh)
|
|
|
Generation Facilities
|
24 (including 1 under construction)
|
|
|
Utility Business
|
1
|
|
|
Key Generation Businesses
|
Maritza, Kilroot, Ballylumford, and Kazakhstan
|
|
Operating installed capacity of our EMEA SBU totaled 8,449 MW, of which 32%, 24% and 15% is located in Kazakhstan, United Kingdom and Cameroon, respectively. Set forth in the table below is a list of our EMEA SBU generation facilities:
32
|
Business
|
Location
|
Fuel
|
Gross MW
|
AES Equity Interest (Percent, Rounded)
|
Year Acquired or Began Operation
|
|||||||
|
Maritza
|
Bulgaria
|
Coal
|
690
|
|
100
|
%
|
2011
|
|||||
|
St. Nikola
|
Bulgaria
|
Wind
|
156
|
|
89
|
%
|
2010
|
|||||
|
Bulgaria Subtotal
|
846
|
|
||||||||||
|
Kribi
(1)
|
Cameroon
|
Gas
|
216
|
|
56
|
%
|
2013
|
|||||
|
Dibamba
(1)
|
Cameroon
|
Heavy Fuel Oil
|
86
|
|
56
|
%
|
2009
|
|||||
|
Cameroon Subtotal
|
302
|
|
||||||||||
|
Amman East
|
Jordan
|
Gas
|
380
|
|
37
|
%
|
2009
|
|||||
|
Jordan Subtotal
|
380
|
|
||||||||||
|
Ust—Kamenogorsk CHP
|
Kazakhstan
|
Coal
|
1,354
|
|
100
|
%
|
1997
|
|||||
|
Shulbinsk HPP
(2)
|
Kazakhstan
|
Hydro
|
702
|
|
—
|
%
|
1997
|
|||||
|
Ust—Kamenogorsk HPP
(2)
|
Kazakhstan
|
Hydro
|
331
|
|
—
|
%
|
1997
|
|||||
|
Sogrinsk CHP
|
Kazakhstan
|
Coal
|
301
|
|
100
|
%
|
1997
|
|||||
|
Kazakhstan Subtotal
|
2,688
|
|
||||||||||
|
Elsta
(3)
|
Netherlands
|
Gas
|
630
|
|
50
|
%
|
1998
|
|||||
|
Netherlands Subtotal
|
630
|
|
||||||||||
|
Ebute
|
Nigeria
|
Gas
|
294
|
|
95
|
%
|
2001
|
|||||
|
Nigeria Subtotal
|
294
|
|
||||||||||
|
Kocaeli
(3),(4)
|
Turkey
|
Gas
|
158
|
|
50
|
%
|
2011
|
|||||
|
Bursa
(3),(4)
|
Turkey
|
Gas
|
156
|
|
50
|
%
|
2011
|
|||||
|
Kepezkaya
(3),(4)
|
Turkey
|
Hydro
|
28
|
|
50
|
%
|
2010
|
|||||
|
Kumkoy
(3),(4)
|
Turkey
|
Hydro
|
18
|
|
50
|
%
|
2011
|
|||||
|
Damlapinar
(3),(4)
|
Turkey
|
Hydro
|
16
|
|
50
|
%
|
2010
|
|||||
|
Istanbul (Koc University)
(3),(4)
|
Turkey
|
Gas
|
2
|
|
50
|
%
|
2011
|
|||||
|
Turkey Subtotal
|
378
|
|
||||||||||
|
Ballylumford
|
United Kingdom
|
Gas
|
1,246
|
|
100
|
%
|
2010
|
|||||
|
Kilroot
(5)
|
United Kingdom
|
Coal/Oil
|
662
|
|
99
|
%
|
1992
|
|||||
|
Drone Hill
|
United Kingdom
|
Wind
|
29
|
|
100
|
%
|
2012
|
|||||
|
North Rhins
|
United Kingdom
|
Wind
|
22
|
|
100
|
%
|
2010
|
|||||
|
Sixpenny Wood
|
United Kingdom
|
Wind
|
20
|
|
100
|
%
|
2013
|
|||||
|
Yelvertoft
|
United Kingdom
|
Wind
|
16
|
|
100
|
%
|
2013
|
|||||
|
United Kingdom Subtotal
|
1,995
|
|
||||||||||
|
EMEA Total
|
7,513
|
|
||||||||||
|
(1)
|
These businesses met the held-for-sale criteria on November 7, 2013. The earnings from these businesses are reported as part of discontinued operations. See Note 23 —
Discontinued Operations and Held-for-Sale Businesses
included in Item 8. —
Financial Statements and Supplementary Data
of this Form 10-K for further information.
|
|
(2)
|
AES operates these facilities under concession agreements until 2017.
|
|
(3)
|
Unconsolidated entities, the results of operations of which are reflected in Equity in Earnings of Affiliates.
|
|
(4)
|
Joint Venture with Koc Holding.
|
|
(5)
|
Includes Kilroot Open Cycle Gas Turbine (“OCGT”).
|
Under construction
The following table lists our plants under construction in the EMEA SBU:
|
Business
|
Location
|
Fuel
|
Gross MW
|
AES Equity Interest (Percent, Rounded)
|
Expected Year of Commercial Operation
|
|||||||
|
IPP4 Jordan
|
Jordan
|
Heavy Fuel Oil
|
247
|
|
60
|
%
|
2014
|
|||||
|
Jordan Subtotal
|
247
|
|
||||||||||
|
EMEA Total
|
247
|
|
||||||||||
Set forth below is a list of our EMEA utility businesses:
|
Business
|
Location
|
Approximate Number of Customers Served as of 12/31/2012
|
GWh Sold in 2012
|
AES Equity Interest (Percent, Rounded)
|
Year Acquired
|
||||||||
|
Sonel
|
Cameroon
|
816,000
|
|
3,569
|
|
56
|
%
|
2001
|
|||||
|
Cameroon Subtotal
|
816,000
|
|
3,569
|
|
|||||||||
|
EMEA Total
|
816,000
|
|
3,569
|
|
|||||||||
33
Set forth below is information on the generation facilities of Sonel:
|
Business
|
Location
|
Fuel
|
Gross MW
|
AES Equity Interest (Percent, Rounded)
|
Year Acquired or Began Operation
|
|||||||
|
Sonel
(1)
|
Cameroon
|
Hydro/Diesel/Heavy Fuel Oil
|
936
|
|
56
|
%
|
2001
|
|||||
|
(1)
|
Sonel plants: Bafoussam, Bassa, Djamboutou, Edéa, Lagdo, Limbé, Logbaba I, Logbaba II, Oyomabang I, Oyomabang II, Song Loulou, and other small remote network units. These businesses met the held-for-sale criteria on November 7, 2013. The earnings from these businesses are reported as part of discontinued operations. See Note 23 —
Discontinued Operations and Held-for-Sale Businesses
included in Item 8. —
Financial Statements and Supplementary Data
of this Form 10-K for further information.
|
The following map illustrates the location of our EMEA facilities:

EMEA Businesses
Bulgaria
Business Description
. Our Maritza plant is a 690 MW lignite fuel plant that was commissioned in June 2011. Maritza is the only coal-fired power plant in Bulgaria that is fully compliant with the EU Industrial Emission Directive, which comes into force in 2016. Maritza’s entire power output is contracted with Natsionala Elektricheska Kompania (“NEK”) under a 15-year PPA expiring in 2026, capacity and energy based, with a fuel pass-though. The lignite and limestone are supplied under a 15-year fuel supply contract.
AES also owns an 89% interest in the St. Nikola wind farm with 156 MW of installed capacity. St. Nikola was commissioned in March 2010. Its entire power output is contracted with NEK under a 15-year PPA.
Market Structure
The maximum market capacity in 2013 was approximately 13.6 GW. Thermal generation, which is mostly coal-fired, and nuclear power plants account for 64% of installed capacity.
Regulatory Framework
The electricity sector in Bulgaria operates under the Energy Act 2004 that allows the sale of electricity to take place freely at negotiated prices, at regulated prices between parties or on the organized market. In practice, an organized market for trading electricity has not yet evolved, so NEK remains the main wholesale buyer for power generated in Bulgaria.
34
Our investments in Bulgaria rely on long-term PPAs with NEK, the state-owned electricity public supplier and energy trading company. NEK is facing some liquidity issues and has been delayed in making payments under the PPAs with Maritza and St. Nikola. The key financial challenges for NEK include a regulated price that did not fully recover current and prior periods costs, higher than expected costs related to renewable energy resources, and non-recovery of NEK costs for balancing the electricity system.
In addition, parliamentary elections were held in May 2013 after the prior government was forced out by social unrest, partly related to protests over the perception of high energy prices. Energy legislation was amended by the new government in 2013 and new tariffs became effective in January 2014, which are intended to re-balance the energy system and strengthen NEK’s financial position. At this time, it is difficult to predict the impact of these political conditions and regulatory changes on our businesses in Bulgaria.
Maritza has experienced on-going delays in the collection of outstanding receivables from NEK. In November 2013, Maritza and NEK signed an agreement to reschedule payments of the overdue balance as of the agreement date. Through January 2014, NEK has made payments according to the terms of the agreement. As of December 31, 2013, Maritza had an outstanding receivables balance of $91 million, including $70 million of receivables overdue by less than 90 days and $21 million of current receivables. In addition, Maritza had a balance of $60 million of receivables, which are not yet due under the November 2013 agreement. See
Key Trends and Uncertainties, Macroeconomics, Bulgaria
in Item 7—
Management Discussion and Analysis
to this Form 10-K for further information.
The restructuring of NEK is one of the requirements to complete the liberalization of Bulgaria’s electricity system under the European Union's 3
rd
energy liberalization package. During the fourth quarter of 2013, Maritza was formally approached by NEK with a request to consent to a proposed NEK restructuring, which contemplates a full unbundling of Electricity System Operator (ESO) from NEK and a transfer of the transmission grid from NEK to ESO. In February 2014, the NEK restructuring was implemented after approval by the regulatory authorities. Maritza and its lenders are analyzing the NEK restructuring and its impact on NEK’s financial condition and liquidity.
On February 18, 2014, Standard & Poor's lowered NEK's credit rating from BB- to B+ with a negative outlook. This credit rating is lower than the rating NEK had of BB upon the issuance of the Government Support Letter in 2005. Given the credit rating is lower, the PPA could be terminated at the discretion of Maritza and the lenders which triggers a cross default under the project debt agreements. See Item 1A -
Risk Factors
-
“We may not be able to enter into long-term contracts, which reduce volatility in our results of operations.
” As a result of any of the foregoing events, we may face a loss of earnings and/or cash flows from the affected businesses (or be unable to exercise remedies for a breach of the PPA) and may have to provide loans or equity to support affected businesses or projects, restructure them, write down their value and/or face the possibility that these projects cannot continue operations or provide returns consistent with our expectations, any of which could have a material impact on the Company.
Key Financial Drivers
Plant availability is the largest single performance driver of this business. Another key driver is NEK's ability to meet the terms of the existing long-term PPA.
United Kingdom
Business Description
AES’ generation businesses in the United Kingdom operate in two different markets – the Irish Single Electricity Market (“SEM”) for the businesses located in Northern Ireland (1,908 MW) and the UK wholesale electricity market for the businesses located in Scotland and England (87 MW).
The Northern Ireland generation facilities consist of two plants within the Belfast region. Our Kilroot plant is a 662 MW coal-fired plant, and our Ballylumford plant is a 1,246 MW gas-fired plant. These plants provide approximately 70% of the Northern Ireland installed capacity and 18% of the combined installed capacity for the island of Ireland.
Kilroot is a merchant plant that bids into the SEM market. Kilroot derives its value from the capacity payments offered through the SEM Capacity Payment Mechanism, the variable margin when scheduled in merit and the margin from constrained dispatch (when dispatched out of merit to support the system in relation to the wind generation, voltage and transmission constraints). In addition to the above, value is also secured from ancillary services.
35
Ballylumford is partially contracted (600 MW) under a PPA with Northern Ireland Electricity (“NIE”) that ends in 2018, with an extension at the offtaker’s option through 2023, with the remaining capacity bid into the SEM market. One of the Ballylumford stations of 540 MW does not meet the standards of the EU Industrial Emission Directive discussed below, which will most likely result in closing at the end of 2015, unless further investment is committed. Ballylumford's key sources of revenue are availability payments received under the PPA and capacity payments offered through the SEM Capacity Payment Mechanism. Additionally, Ballylumford receives revenue from constrained dispatch which means costs of operation are recovered from the market.
The Scotland and England businesses consist of four wind generation facilities totaling 87 MW. A further wind development pipeline of approximately 250 MW has been submitted for permitting consents. The operating wind projects sell their power to licensed suppliers in the United Kingdom market under long-term PPAs for the full output, generating half of the revenues from the United Kingdom wholesale electricity market and half from green certificates.
Market Structure
The majority of the generation capacity in the SEM is represented by gas-fired power plants, which results in market sensitivity to gas prices. Wind generation capacity represents approximately 18% of the total generation capacity. The governments of Northern Ireland and the Republic of Ireland plan further increases in renewables. Market availability and liquidity of hedging products is weak, reflecting the limited size and immaturity of the market, the predominance of vertical integration and lack of forward pricing. There are essentially three products (baseload, mid-merit and peaking) which are traded between the two largest generators and suppliers.
Regulatory Framework
Electricity Regulation.
The SEM is an energy market, which was established in 2007 and is completely distinct from the United Kingdom power market. It is based on a gross mandatory pool, within which all generators with a capacity higher than 10 MW must trade the physical delivery of power. Generators are dispatched based on merit order.
In addition, there is a capacity payment mechanism to ensure that sufficient generating capacity is offered to the market. The capacity payment is derived from a regulated Euro-based capacity payment pool, established a year ahead by the Regulatory Authority. Capacity payments are based on the declared availability of a unit and have a degree of volatility to reflect seasonal influences, demand and the actual out-turn of generation declared available over each trading period.
Environmental Regulation
The European Commission adopted in 2011 the Industrial Emission Directive (“IED”) that establishes the emission limit values (“ELVs”) for SO
2
, NOx and dust emissions to be complied with starting in 2016. This affects our Kilroot business which currently complies with the dust ELV, but for the SO
2
, and particularly NOx, significant investment will be required.
The IED provides for two options that may be implemented by the EU member states – Transitional National Plan (“TNP”) or Limited Life Time Derogation. The TNP would allow the power plants to continue to operate between 2016-2020, being exempt from compliance with ELVs, but observing a ceiling set for maximum annual emissions that is established looking at the last 10 years average emissions and operating hours. Under the TNP, power plants will have to implement investment plans that will ensure compliance by 2020. The Limited Life Time Derogation will allow plants to run between 2016 and 2023, being exempt from the compliance with ELVs, but for no more than 17,500 hours. Kilroot has elected the TNP as it gives the business significant operating flexibility without further investment. We are also reviewing the commercial positioning of the Kilroot business and the financial value that could be derived out of making the plant fully compliant with IED ELV’s post-2016. As of the end of 2013, favorable commodity pricing is supportive of this investment and we will be exploring the range of technical solutions available in early 2014. An investment of approximately $24 million is required.
Key Financial Drivers
For our business in the SEM market the key drivers are availability and commodity prices (gas and coal), and regulatory changes. The contracted plants’ financial results are influenced by availability.
In the United Kingdom, part of our revenue stream is indexed to short-term electricity market prices, which are largely influenced by delivered gas prices.
The future value of the Northern Ireland businesses will depend on gas price volatility and any alterations to the SEM market structure and payment mechanism.
36
Kazakhstan
Business Description.
Our businesses account for approximately 4% of the total annual generation in Kazakhstan. Of the total capacity of 2,688 MW, 1,033 MW is hydroelectric and operates under a concession agreement until the beginning of October 2017 and 1,655 MW of coal-fired capacity is owned outright. The thermal plants are designed to produce heat with electricity as a co- or by-product.
The Kazakhstan businesses act as merchant plants for electricity sales by entering into bilateral contracts directly with consumers for periods of generally no more than one year. There are no opportunities for the plants to be in contracted status, as there is no central offtaker, and the few businesses that could take a whole plant’s generation tend to have in-house generation capacity. The 2012 amendments to the Electricity Law state that a centrally organized capacity market will be established by 2016, but the offtaker still only signs annual contracts.
The hydroelectric plants are run-of-river and rely on river flow and precipitation (particularly snow). Due to the presence of a large multi-year storage dam upstream and a growing season minimum river flow rate agreement with Russia (downstream) the plants are protected against significant downside risk to their volume in years with low precipitation. AES does not control water flow which impacts our generation.
Ust Kamenogorsk CHP provides heat to the city of Ust Kamenogorsk through the city heat network company (Ust Kamenogorsk Heat Nets). These sales could be considered as contracted, since Ust Kamenogorsk Heat Nets has no alternative suppliers.
Market Structure
The Kazakhstan electricity market totals approximately 20,442 MW, of which 16,008 MW is available. The bulk of the generating capacity in Kazakhstan is thermal, with coal as the main fuel. As coal is abundantly available in Kazakhstan, most plants are designed to burn local coal. The geographical remoteness of Kazakhstan, in combination with its abundant resources, means that coal prices are not reflective of world coal prices (current delivered cost is less than $24 per metric ton). In addition, the government closely monitors coal prices, due to their impact on the price of socially necessary heating and on electricity tariffs.
Regulatory Framework
All Kazakhstan generating companies sell electricity at or below their respective tariff-cap level. These tariff-cap levels have been fixed by the Kazakhstan Ministry of Industry and New Technology (“MINT”) for the period 2009-2015 for each of the thirteen groups of generators. These groups were determined by the MINT based on a number of factors including type of plant and fuel used.
In July 2012, Kazakhstan enacted various amendments to its Electricity Law. Among the amendments was a requirement for all profits generated by electricity producers during the years 2013-2015 to be reinvested. Accordingly, the business will be unable to pay dividends for the period 2013-2015. Under the amended Electricity Law, electricity producers must, on an annual basis, enter into investment obligation agreements (“IOAs”) with the MINT detailing their annual investment obligations. These annual IOAs must equal the sum of the upcoming year’s planned depreciation and profit. Selection of investment projects for the IOAs is at the discretion of electricity producers, but the MINT has the right to reject submitted IOA proposals. An electricity producer without an IOA executed by the MINT may not charge tariffs exceeding its incremental cost of production, excluding depreciation. On December 20, 2012, the MINT executed IOA with all four AES generators in Kazakhstan, which allow revenue at the tariff-cap level, but all generated cash will need to be reinvested.
Heat production in Kazakhstan is also regulated as a natural monopoly. The heat tariffs are set on a cost-plus basis by making an application to the Regulator (DAREM). Tariffs can either be for one-year or multi-year periods.
Key Financial Drivers
The main business drivers are plant availability, tariff caps set by MINT, signing of IOA, approval of heat tariffs by the Regulator, and weather conditions.
Other EMEA Businesses
In Nigeria, we own the 294 MW gas-fired Ebute power plant. The plant operates under a capacity-based PPA contract with the state-owned entity Power Holding Company of Nigeria (“PHCN”), which expires in November 2014. Earnings are driven primarily by capacity payments paid under the PPA. It sells power generated by a nine unit barge-mounted gas turbine
37
system, with fuel currently supplied by the offtaker. However, due to the ongoing PHCN privatization process, in the future, Ebute will have to source its own fuel, although with the ability to pass some or all of its cost through the tariff.
In Turkey, we currently own in partnership with Koc Holding, 378 MW of hydroelectric and gas-fired plants. The Turkey hydro businesses fall under the renewable feed-in tariff, while the gas assets are dispatched in the market. Our businesses in Turkey are operated under a joint venture structure; they are reported as equity in earnings of affiliates.
In Jordan we have a controlling interest in Amman East, a 380 MW oil/gas-fired plant fully contracted with the national utility under a 25-year PPA. We consolidate the results of this business in our operations. We also have a 247 MW oil-fired peaker under construction in Jordan. The project is similar in structure with Amman East and is fully contracted with the national utility under a 25-year PPA.
In the Netherlands, we own 50% of the Elsta facility, a 630 MW gas-fired plant that supplies steam and electricity under long-term contracts ending in 2018. Elsta’s income is reported as equity in earnings.
In Cameroon we are involved in the generation, transmission, distribution and sale of electricity through AES Sonel, an integrated utility, and two Independent Power Producers (IPP).
We own 56% of AES Sonel with the remaining 44% held by the Republic of Cameroon. AES Sonel is the only electricity provider in Cameroon. It is regulated by the Agence de Régulation de Secteur d’Electricité (ARSEL). AES Sonel operates and maintains 936 MW of generation, two interconnected transmission networks and distributes electricity to more than 800,000 primarily residential customers. AES Sonel operates under a 20-year concession agreement that was signed in July 2001. Electricity demand has increased at an average annual rate of 6.6%, since 2010. Growth is expected to continue especially in the residential segment.
In addition, AES is part owner and sole operator of two IPPs in Cameroon: Dibamba Power Development Company (“DPDC”), with an 86 MW heavy fuel oil plant, and Kribi Power Development Company (“KPDC”), with a 216 MW gas/light fuel oil plant. DPDC and KPDC have the same ownership structure; 56% AES and 44% Republic of Cameroon. Contracts at KPDC and DPDC are primarily capacity-based with Government protections. DPDC has a 20-year tolling agreement with AES Sonel and KPDC has a 20-year PPA with AES Sonel and a 20-year gas supply agreement with the Government-owned Societe Nationale des Hydrocarbures (“SNH”).
AES has 1,238 MW of generation in Cameroon—almost 100% of the country’s total capacity; of which 60% is hydroelectric, 18% gas, 16% heavy fuel oil, and 6% diesel.
In September 2013, AES entered into an agreement for the sale of its holding in Cameroon. See Note 23 -
Discontinued Operations and Held-for-Sale Businesses
included in
Item 8. - Financial Statements and Supplementary Information
included in this Form 10-K for further information.
Asia SBU
Our Asia SBU has generation facilities in four countries. Our Asia operations accounted for
5%
,
7%
and
4%
of AES consolidated Operating Margin and
8%
,
10%
and
6%
of AES consolidated Adjusted PTC (a non-GAAP measure) in 2013, 2012 and
2011
, respectively. The percentages shown are the contribution by our Asia SBU to gross Operating Margin and Adjusted PTC before deductions for Corporate.
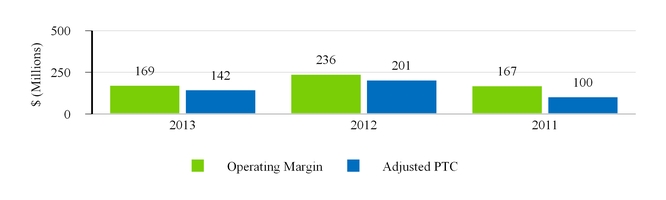
38
The following table provides highlights of our Asia operations:
|
Countries
|
India, Philippines, Sri Lanka and Vietnam
|
|
|
Generation Capacity
|
1,248 gross MW (964 proportional MW)
|
|
|
Generation Facilities
|
4 (including 1 under construction)
|
|
|
Key Businesses
|
Masinloc, OPGC and Mong Duong II
|
|
Operating installed capacity of our Asia SBU totals 1,248 MW, of which 53%, 34% and 13% located in the Philippines, India and Sri Lanka respectively. Set forth below in the table is a list of our Asia SBU generation facilities:
|
Business
|
Location
|
Fuel
|
Gross MW
|
AES Equity Interest (Percent, Rounded)
|
Year Acquired or Began Operation
|
|||||||
|
OPGC
(1)
|
India
|
Coal
|
420
|
|
49
|
%
|
1998
|
|||||
|
India Subtotal
|
420
|
|
||||||||||
|
Masinloc
|
Philippines
|
Coal
|
660
|
|
92
|
%
|
2008
|
|||||
|
Philippines Subtotal
|
660
|
|
||||||||||
|
Kelanitissa
|
Sri Lanka
|
Diesel
|
168
|
|
90
|
%
|
2003
|
|||||
|
Sri Lanka Subtotal
|
168
|
|
||||||||||
|
Asia Total
|
1,248
|
|
||||||||||
|
(1)
|
Unconsolidated entities for which the results of operations are reflected in Equity in Earnings of Affiliates.
|
Under construction
|
Business
|
Location
|
Fuel
|
Gross MW
|
AES Equity Interest (Percent, Rounded)
|
Expected Year of Commercial Operation
|
|||||||
|
Mong Duong II
|
Vietnam
|
Coal
|
1,240
|
|
51
|
%
|
2015
|
|||||
The following map illustrates the location of our Asia facilities:
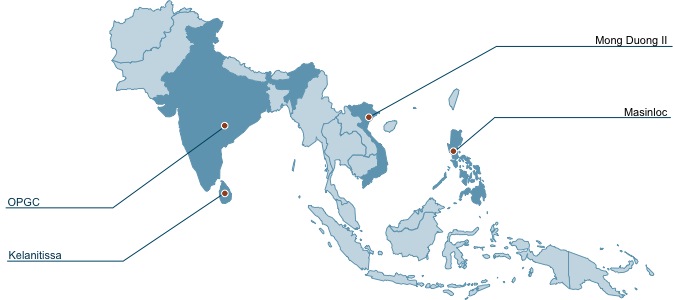
Asia Businesses
Philippines
Business Description.
In April 2008, AES acquired the 660 MW Masinloc coal-fired power plant, located in Luzon. Subsequent to the acquisition, AES performed a substantial rehabilitation program that was completed in 2010, resulting in improvements in reliability, environmental emissions, and plant safety performance. Generating capacity was improved from 433 MW at acquisition to 630 MW, and plant availability increased from 74% at acquisition to current 89%.
More than 90% of Masinloc’s peak capacity and variable margin are contracted through medium-to long-term bilateral contracts primarily with Meralco, several electric cooperatives and industrial customers.
39
Market Structure
The Philippine power market is divided into three grids representing the country’s three major island groups — Luzon, Visayas and Mindanao. Luzon (which includes Manila and is the country’s largest island) is interconnected with Visayas and represents 88% of the total demand of both regions. Luzon and Visayas together have an installed capacity of 13,905 MW.
There is diversity in the mix of the Luzon - Visayas generation, with coal accounting for 37%, natural gas for 20%, hydroelectric for 18%, geothermal generation for 9%, and the remaining 16% from other generating plants (such as wind, biomass, blended, and oil) which are either dispatched by the system operator only during system emergencies or dispatched by the market during peak demand.
The primary customers for electricity are private distribution utilities, electric cooperatives, and to a lesser extent large industrial customers. Approximately 90% - 95% of the system’s total energy requirement is being sold/purchased through medium (3-5 years) to long (6-10 years) term bilateral contracts. Both medium and long term bilateral contracts have a renewal extension clause. The remaining 5% - 10% of energy is sold through the Wholesale Electricity Spot Market (“WESM”), which is the real time, bid-based and hourly market for energy where the sellers and the buyers adjust their differences between their production/demand and their contractual commitments.
Regulatory Framework
Electricity Regulation.
The Philippines has divided its power sector into generation, transmission, distribution and supply under the Electric Power Industry Reform Act of 2001 (“EPIRA”). The EPIRA primarily aims to increase private sector participation in the power sector and to privatize the Government’s generation and transmission assets. Generation and supply are open and competitive sectors, while transmission and distribution are regulated sectors. Sale of power is conducted primarily through medium-term bilateral contracts between generation companies and customers specifying the volume, price and conditions for the sale of energy and capacity, which are approved by the Energy Regulatory Commission (“ERC”). Power is traded in the WESM which operates under a gross pool, central dispatch and net settlement protocols. Parties to bilateral contracts settle their transactions outside of the WESM and distribution companies or electricity cooperatives buy their imbalance (i.e., power requirements not covered by bilateral contracts) from the WESM. Distribution utilities and electric cooperatives are allowed to pass on to their end-users the ERC-approved bilateral contract rates, including WESM purchases.
Other Regulatory Considerations.
EPIRA established the Retail Competition and Open Access (“RC&OA”) under which Retail Electricity Suppliers, who are duly licensed by the ERC, may supply directly to Contestable Customers (end-users with an average demand of at least 1,000 kW), with distribution companies or electricity cooperatives providing non-discriminatory wire services. The ERC has issued a joint statement with DOE declaring December 26, 2012 as the commencement date of the RC&OA. The period from December 26, 2012 to June 25, 2013 was deemed the transition period with full implementation occurring on June 26, 2013.
Environmental Regulation
The Renewable Energy Act of 2008 was enacted in December 2008 to promote non-conventional renewable energy sources, such as solar, wind, small hydroelectric and biomass energies. The law requires electric power participants to initially source 10% of their supply from eligible renewable energy resources. The initial requirement of 10% is preliminary, as the National Renewable Energy Board has not set the final figure. If the regulations are implemented, our businesses in the Philippines could be affected by requirements requiring all generators to supply a portion of their generation from renewable energy resources.
Key Financial Drivers
The key drivers of the business are Masinloc’s availability, system reliability, demand growth, and reserve margins.
Other Asia Businesses
India
Business Description
Our generation business in India consists of the 420 MW coal-fired Odisha Power Generation Corporation (“OPGC”) located in the state of Odisha. AES acquired 49% of OPGC in 1998, with the remaining 51% owned by the state. Saurashtra is a 100% owned 39 MW wind plant located in the state of Gujarat, which commenced operations in early 2012. In September 2013 AES entered into an agreement for the sale of Saurashtra.
40
OPGC has a 30-year PPA with GRIDCO Limited, a state utility, expiring in 2026. The PPA is comprised of a capacity payment based on fixed parameters and a variable component comprised of fuel costs, where actual fuel costs are a pass-through. OPGC is an unconsolidated entity and results are reported in Equity in Earnings of Affiliates.
AES has one coal-fired project under development with a total capacity of 1,320 MW, which is an expansion of our existing OPGC business. The project is expected to start construction in 2014 and begin operations in 2018.
Vietnam
Business Description
The Mong Duong II power project is a 1,240 MW plant being constructed under a Build, Operate and Transfer (“BOT”) agreement in Quang Ninh province of Vietnam. The project is currently the largest private sector power project in the country. AES-VCM Mong Duong Power Company Limited (“the BOT Company”), a limited liability joint venture established by the affiliates of AES (51%), Posco Energy Corporation (30%) and China Investment Corporation (19%). The BOT Company has a PPA term of 25 years with Vietnam Electricity (“EVN”). At the end of the term of the PPA, the BOT Company will be transferred to the Vietnamese Government in accordance with the BOT contract. Upon reaching commercial operations, EVN will have exclusive rights on the facility’s entire capacity and energy. Vietnam National Coal-Mineral Industries Group (“Vinacomin”), a stated-owned entity, is the project’s coal supplier under a 25-year coal supply agreement.
The tariff has two components: Capacity charge and the foreign component of Operation and Maintenance Charge (“O&M”), which are paid in U.S. Dollars and the local component of O&M and fuel charge which are paid in Vietnam Dong. In addition, the U.S. Dollar and Vietnam Dong component of O&M are linked to a published Consumer Price Index of the U.S. and Vietnam respectively. Fuel costs in general are pass-through elements in the fuel charge.
The project is currently under construction and is scheduled to commence operations in the second half of 2015.
Financial Data by Country
The table below presents information, by country, about our consolidated operations for each of the three years ended December 31, 2013, 2012 and
2011
, respectively, and property, plant and equipment as of December 31, 2013 and 2012, respectively. Revenue is recognized in the country in which it is earned and assets are reflected in the country in which they are located.
41
|
Revenue
|
Property, Plant & Equipment, net
|
|||||||||||||||||||
|
2013
|
2012
|
2011
|
2013
|
2012
|
||||||||||||||||
|
(in millions)
|
||||||||||||||||||||
|
United States
(1)
|
$
|
3,630
|
|
$
|
3,736
|
|
$
|
2,088
|
|
$
|
7,523
|
|
$
|
7,540
|
|
|||||
|
Non-U.S.:
|
||||||||||||||||||||
|
Brazil
(2)
|
5,015
|
|
5,788
|
|
6,640
|
|
5,293
|
|
5,756
|
|
||||||||||
|
Chile
|
1,569
|
|
1,679
|
|
1,608
|
|
3,312
|
|
2,993
|
|
||||||||||
|
El Salvador
|
860
|
|
854
|
|
755
|
|
292
|
|
284
|
|
||||||||||
|
Dominican Republic
|
832
|
|
761
|
|
674
|
|
689
|
|
670
|
|
||||||||||
|
United Kingdom
|
558
|
|
505
|
|
587
|
|
603
|
|
578
|
|
||||||||||
|
Argentina
(3)
|
545
|
|
857
|
|
979
|
|
256
|
|
278
|
|
||||||||||
|
Colombia
|
523
|
|
453
|
|
365
|
|
412
|
|
383
|
|
||||||||||
|
Philippines
|
497
|
|
559
|
|
480
|
|
776
|
|
800
|
|
||||||||||
|
Mexico
|
440
|
|
397
|
|
404
|
|
748
|
|
759
|
|
||||||||||
|
Bulgaria
(4)
|
422
|
|
369
|
|
251
|
|
1,606
|
|
1,606
|
|
||||||||||
|
Puerto Rico
|
328
|
|
293
|
|
298
|
|
562
|
|
570
|
|
||||||||||
|
Panama
|
250
|
|
266
|
|
189
|
|
1,028
|
|
1,069
|
|
||||||||||
|
Kazakhstan
|
156
|
|
151
|
|
145
|
|
183
|
|
141
|
|
||||||||||
|
Jordan
|
142
|
|
121
|
|
124
|
|
439
|
|
222
|
|
||||||||||
|
Sri Lanka
|
53
|
|
169
|
|
140
|
|
7
|
|
8
|
|
||||||||||
|
Spain
|
—
|
|
119
|
|
258
|
|
—
|
|
—
|
|
||||||||||
|
Cameroon
(5)
|
—
|
|
—
|
|
—
|
|
—
|
|
—
|
|
||||||||||
|
Ukraine
(6)
|
—
|
|
—
|
|
—
|
|
—
|
|
—
|
|
||||||||||
|
Hungary
(7)
|
—
|
|
—
|
|
—
|
|
—
|
|
—
|
|
||||||||||
|
Vietnam
|
—
|
|
—
|
|
—
|
|
1,296
|
|
887
|
|
||||||||||
|
Other Non-U.S.
(8)
|
71
|
|
87
|
|
113
|
|
87
|
|
91
|
|
||||||||||
|
Total Non-U.S.
|
12,261
|
|
13,428
|
|
14,010
|
|
17,589
|
|
17,095
|
|
||||||||||
|
Total
|
$
|
15,891
|
|
$
|
17,164
|
|
$
|
16,098
|
|
$
|
25,112
|
|
$
|
24,635
|
|
|||||
|
(1)
|
Excludes revenue of $
23 million
, $
63 million
and $
396 million
for the years ended
December 31, 2013
,
2012
and
2011
, respectively, and property, plant and equipment of $
69 million
and $
123 million
as of
December 31, 2013
and
2012
, respectively, related to Condon, Mid-West Wind, Eastern Energy, Thames, Red Oak and Ironwood which were reflected as discontinued operations and assets held for sale in the accompanying Consolidated Statements of Operations and Consolidated Balance Sheets. Additionally property, plant and equipment excludes $
25 million
as of
December 31, 2012
related to wind turbines which were reflected as assets held for sale in the accompanying Consolidated Balance Sheets.
|
|
(2)
|
Excludes revenue of $
124 million
for the year ended
December 31, 2011
related to Brazil Telecom which was reflected as discontinued operations in the accompanying Consolidated Statements of Operations.
|
|
(3)
|
Excludes revenue of $
102 million
for the year ended
December 31, 2011
related to our Argentina distribution businesses which were reflected as discontinued operations in the accompanying Consolidated Statements of Operations.
|
|
(4)
|
Our wind project in Maritza started operations in June 2011.
|
|
(5)
|
Excludes revenue of $
474 million
, $
457 million
and $
386 million
for the years ended
December 31, 2013
,
2012
and
2011
, respectively, and property, plant and equipment of $
1,100 million
and $
992 million
as of
December 31, 2013
and
2012
respectively, related to Dibamba, Kribi and Sonel which were reflected as discontinued operations and assets held for sale in the accompanying Consolidated Statements of Operations and Consolidated Balance Sheets.
|
|
(6)
|
Excludes revenue of $
187 million
, $
491 million
and $
418 million
for the years ended
December 31, 2013
,
2012
and
2011
, respectively, and property, plant and equipment of $
112 million
at
December 31, 2012
related to Kievoblenergo and Rivnooblenergo which were reflected as discontinued operations and assets held for sale in the accompanying Consolidated Statements of Operations and Consolidated Balance Sheets.
|
|
(7)
|
Excludes revenue of $
18 million
and $
219 million
for the years ended
December 31, 2012
and
2011
, respectively, related to Borsod, Tiszapalkonya and Tisza II, which were reflected as discontinued operations and assets held for sale in the accompanying Consolidated Statements of Operations.
|
|
(8)
|
Excludes revenue of $
6 million
, $
11 million
and $
18 million
for the years ended
December 31, 2013
,
2012
and
2011
, respectively, and property, plant and equipment of $
19 million
and $
54 million
as of
December 31, 2013
and
2012
, respectively, related to Saurashtra, Poland wind and carbon reduction projects, which were reflected as discontinued operations and assets held for sale in the accompanying Consolidated Statements of Operations and Consolidated Balance Sheets.
|
Environmental and Land Use Regulations
The Company faces certain risks and uncertainties related to numerous environmental laws and regulations, including existing and potential greenhouse gas (“GHG”) legislation or regulations, and actual or potential laws and regulations pertaining to water discharges, waste management (including disposal of coal combustion byproducts), and certain air
42
emissions, such as SO
2
, NO
X
, particulate matter, mercury and other hazardous air pollutants. Such risks and uncertainties could result in increased capital expenditures or other compliance costs which could have a material adverse effect on certain of our United States or international subsidiaries, and our consolidated results of operations. For further information about these risks, see Item 1A.—
Risk Factors
, “
Our businesses are subject to stringent environmental laws and regulations
,” “
Our businesses are subject to enforcement initiatives from environmental regulatory agencies
,” and “
Regulators, politicians, non-governmental organizations and other private parties have expressed concern about greenhouse gas, or GHG, emissions and the potential risks associated with climate change and are taking actions which could have a material adverse impact on our consolidated results of operations, financial condition and cash flows
” in this Form 10-K. For a discussion of the laws and regulations of individual countries within each SBU where our subsidiaries operate, see discussion within Item 1. of this Form 10-K under the applicable SBUs.
Many of the countries in which the Company does business also have laws and regulations relating to the siting, construction, permitting, ownership, operation, modification, repair and decommissioning of, and power sales from, electric power generation or distribution assets. In addition, international projects funded by the International Finance Corporation, the private sector lending arm of the World Bank, or many other international lenders are subject to World Bank environmental standards or similar standards, which tend to be more stringent than local country standards. The Company often has used advanced generation technologies in order to minimize environmental impacts, such as circulating fluidized bed (“CFB”) boilers and advanced gas turbines, and environmental control devices such as flue gas desulphurization for SO
2
emissions and selective catalytic reduction for NO
X
emissions.
Environmental laws and regulations affecting electric power generation and distribution facilities are complex, change frequently and have become more stringent over time. The Company has incurred and will continue to incur capital costs and other expenditures to comply with these environmental laws and regulations. See
Item 7
.—Management’s Discussion and Analysis of Financial Condition and Results of Operations—Environmental Capital Expenditures
in this Form 10-K for more detail. The Company and its subsidiaries may be required to make significant capital or other expenditures to comply with these regulations. There can be no assurance that the businesses operated by the subsidiaries of the Company will be able to recover any of these compliance costs from their counterparties or customers such that the Company’s consolidated results of operations, financial condition and cash flows would not be materially affected.
Various licenses, permits and approvals are required for our operations. Failure to comply with permits or approvals, or with environmental laws, can result in fines, penalties, capital expenditures, interruptions or changes to our operations. Certain subsidiaries of the Company are subject to litigation or regulatory action relating to environmental permits or approvals. See
Item 3.
—Legal Proceedings
in this Form 10-K for more detail with respect to environmental litigation and regulatory action, including a Notice of Violation (“NOV”) issued by the United States Environmental Protection Agency ("EPA") against IPL concerning new source review and prevention of significant deterioration issues under the United States Clean Air Act ("CAA").
United States Environmental and Land Use Legislation and Regulations
In the United States the CAA and various state laws and regulations regulate emissions of air pollutants, including SO
2
, NO
X
, particulate matter (“PM”), mercury and other hazardous air pollutants (“HAPs”). Certain applicable rules are discussed in further detail below.
CAIR and CSAPR
. The EPA promulgated the “Clean Air Interstate Rule” (“CAIR”) on March 10, 2005, which required allowance surrender for SO
2
and
NO
X
emissions from existing power plants located in 28 eastern states and the District of Columbia. CAIR contemplated two implementation phases. The first phase was to begin in 2009 and 2010 for N
O
X
and SO
2
, respectively. A second phase with additional allowance surrender obligations for both air emissions was to begin in 2015. To implement the required emission reductions for this rule, the states were to establish emission allowance based “cap-and-trade” programs. CAIR was subsequently challenged in federal court, and on July 11, 2008, the United States Court of Appeals for the D.C. Circuit issued an opinion striking down much of CAIR and remanding it to the EPA.
In response to the D.C. Circuit’s opinion, on July 7, 2011, the EPA issued a new rule titled “Federal Implementation Plans to Reduce Interstate Transport of Fine Particulate Matter and Ozone in 27 States,” which is now referred to as the Cross-State Air Pollution Rule (“CSAPR”). The CSAPR was scheduled to go into force on January 1, 2012 and would have required significant reductions in SO
2
and NO
X
emissions from power plants in many states in which subsidiaries of the Company operate. Once fully implemented, the rule would have required additional
SO
2
emission reductions of 73% and additional
NO
X
reductions of 54% from 2005 levels.
Many states, utilities and other affected parties filed petitions for review, challenging the CSAPR before the D.C. Circuit. On August 21, 2012, a three-judge panel of the D.C. Circuit vacated the CSAPR and required EPA to continue administering CAIR pending the promulgation of a valid replacement to the CSAPR. In June 2013, the U.S. Supreme Court granted a petition
43
to review the D.C. Circuit’s decision vacating CSAPR. Oral argument was held on December 10, 2013 and a decision is expected in the next several months. We cannot predict the U.S. Supreme Court's actions and it is difficult to predict what steps would follow any ruling. If the U.S. Supreme Court were to reverse the D.C. Circuit, there remain numerous challenges to the CSAPR that must be addressed, some of which could again result in delay or invalidation of the CSAPR. Further, it is difficult to predict what the EPA will do in response to any decision. EPA has announced plans to propose a transport rule for
NO
X
emissions that would address ozone in October 2014. This rule would be based on a more stringent ozone standard than was the original CSAPR. Also, many of the areas that were projected to be in non-attainment for both ozone and PM
2.5
are now in attainment, calling into question the basis for the original CSAPR. Nonetheless, the Company anticipates an increase in capital costs and other expenditures and the operational restrictions that would be required to comply with a reinstated CSAPR or with replacement rules addressing transport of N
O
X
and SO
2
. At this time, we cannot predict the impact that such rules would have on the Company; they could have a material impact on the Company's business, financial condition and results of operations.
MATS
. The EPA is obligated under Section 112 of the CAA to develop a rule requiring pollution controls for hazardous air pollutants, including mercury, hydrogen chloride, hydrogen fluoride, and nickel species, among other substances, from coal and oil-fired power plants. In connection with such rule, the CAA requires the EPA to establish Maximum Achievable Control Technology (“MACT”). MACT is defined as the emission limitation achieved by the “best performing 12%” of sources in the source category. Pursuant to Section 112 of the CAA, the EPA promulgated a final rule on December 16, 2011, called the Mercury Air Toxics Standards (“MATS”) establishing National Emissions Standards for Hazardous Air Pollutants (“NESHAP”) from coal and oil-fired electric utility steam generating units. These emission standards reflect the EPA’s application of MATS standards for each pollutant regulated under the rule. The rule requires all coal-fired power plants to comply with the applicable MATS standards within three years, with the possibility of obtaining an additional year, if needed, to complete the installation of necessary controls. To comply with the rule, many coal-fired power plants may need to install additional control technology to control acid gases, mercury or particulate matter, or they may need to repower with an alternate fuel or retire operations. Most of the Company’s United States coal-fired plants operated by the Company’s subsidiaries have scrubbers or comparable control technologies designed to remove SO
2
and which also remove some acid gases. However, there are other improvements to such control technologies that may be needed even at these plants to assure compliance with the MATS standards. Older coal-fired facilities that do not currently have a SO
2
scrubber installed are particularly at risk. For a discussion of the deactivation and planned deactivation of certain units owned or partially owned by IPL and DP&L as a result of existing and expected environmental regulations, including MATS, see "
— Unit Retirement and Replacement Generation
" below.
IPL estimates additional expenditures related to the MATS rule for environmental controls for its baseload generating units to be approximately $511 million through 2016, excluding demolition costs. In August 2013, the Indiana Utility Regulatory Commission (“IURC”) approved IPL’s MATS petition and request for a Certificate of Public Convenience and Necessity for this amount (including supplemental testimony). These filings detail the installations of new pollution control equipment that IPL plans to add to its five largest baseload generating units. The IURC also approved, with certain stipulations, IPL’s request to recover through its environmental rate adjustment mechanism all operating and capital expenditures (including a return) related to compliance. Recovery of these costs is through an Indiana statute that allows for 100% recovery of qualifying costs through a rate adjustment mechanism. As part of its Order, the IURC stipulated that if IPL’s Harding Street unit is retired before IPL has fully depreciated the new controls (which have a 20-year depreciable life), IPL shall not continue to collect depreciation expense on the clean energy projects included in the MATS Order for that unit. IPL management is currently evaluating the impact of this recent Order.
Several lawsuits challenging the MATS rule have been filed and consolidated into a single proceeding before the United States Court of Appeals for the District of Columbia Circuit. Oral argument was held on the challenges on December 10, 2013 and a decision on the challenges is anticipated in the next several months. We cannot predict the outcome of this litigation.
New Source Review
. The new source review (“NSR”) requirements under the CAA impose certain requirements on major emission sources, such as electric generating stations, if changes are made to the sources that result in a significant increase in air emissions. Certain projects, including power plant modifications, are excluded from these NSR requirements, if they meet the routine maintenance, repair and replacement (“RMRR”) exclusion of the CAA. There is ongoing uncertainty, and significant litigation, regarding which projects fall within the RMRR exclusion. The EPA has pursued a coordinated compliance and enforcement strategy to address NSR compliance issues at the nation’s coal-fired power plants. The strategy has included both the filing of suits against power plant owners and the issuance of Notices of Violation (“NOVs”) to a number of power plant owners alleging NSR violations. See Item 3.—
Legal Proceedings
in this Form 10-K for more detail with respect to environmental litigation and regulatory action, including a NOV issued by the EPA against IPL concerning NSR and prevention of significant deterioration issues under the CAA.
DP&L’s Stuart Station and Hutchings Station have received NOVs from the EPA alleging that certain activities undertaken in the past are outside the scope of the RMRR exclusion. Additionally, generation units partially owned by DP&L
44
but operated by other utilities have received such NOVs relating to equipment repairs or replacements alleged to be outside the RMRR exclusion. The NOVs issued to DP&L-operated plants have not been pursued through litigation by the EPA.
If NSR requirements were imposed on any of the power plants owned by the Company's subsidiaries, the results could have a material adverse impact on the Company’s business, financial condition and results of operations. In connection with the imposition of any such NSR requirements on our U.S. utilities, DP&L and IPL, the utilities would seek recovery of any operating or capital expenditures related to air pollution control technology to reduce regulated air emissions; however, there can be no assurances that they would be successful in that regard.
Regional Haze Rule.
In July 1999, the EPA published the “Regional Haze Rule” to reduce haze and protect visibility in designated federal areas. On June 15, 2005, the EPA proposed amendments to the Regional Haze Rule that set guidelines for determining “best available retrofit technology” (“BART”) at affected plants and how to demonstrate "reasonable progress" towards eliminating man-made haze by 2064. The amendment to the Regional Haze Rule required states to consider five factors when establishing BART for sources, including the availability of emission controls, the cost of the controls and the effect of reducing emission on visibility in Class I areas (including wilderness areas, national parks and similar areas). The statute requires compliance within five years after the EPA approves the relevant state implementation plan (“SIP”) or issues a federal implementation plan, although individual states may impose more stringent compliance schedules.
The EPA had previously determined that states included in the CAIR or CSAPR would not be required to make source-specific BART determinations for BART-affected electric generating units, reasoning that the emissions reductions required by these rules were "better than BART." Some environmental groups challenged these determinations. On December 2, 2011, the EPA published a notice that it entered a consent decree with several environmental groups that requires the EPA to review and take final action on regional haze requirements for more than 40 states and territories, including those states that are subject to CAIR or CSAPR. That requirement has been held in abeyance pending the outcome of the U.S. Supreme Court ruling on the CSAPR.
Greenhouse Gas Emissions.
In July 2013, President Obama announced plans to use executive orders to reduce greenhouse gas ("GHG") emissions and related climate change measures. In particular, the President directed the EPA to initiate rulemakings to set new source performance standards (“NSPS”) for fossil fuel-fired electric generating units pursuant to Section 111(b) of the CAA. The President also directed the EPA to begin a process pursuant to Section 111(d) of the CAA under which the states and the EPA would seek to achieve reductions in GHG emissions from existing fossil fuel-fired electric generating units through the establishment of existing source performance standards (“ESPS”).
The EPA proposed the NSPS for new electric generating units on January 8, 2014. The proposed NSPS would establish CO
2
standards of 1100 lbs/MWh for newly constructed coal-fueled electric generating plant, which reflects the partial capture and storage of CO
2
emissions from the plant. The NSPS also would impose standards of 1000 lbs/MWh for large natural gas combined cycle (“NGCC”) facilities and 1100 lbs/MWh for smaller and peaking NGCC facilities. These standards would apply to any electric generating unit with construction commencing after January 8, 2014. The comment period for this rule will run through March 10, 2014. The Company cannot predict whether these standards will be changed prior to the rule becoming final but the NSPS could have an impact on the Company’s plans to construct and/or reconstruct electric generating units in some locations.
The EPA also has announced plans to issue regulations designed to achieve GHG emissions reductions from existing electric generating units. The EPA plans to propose a rule requiring states to submit to EPA a plan for establishing GHG performance standards for coal- and gas-fired electric generating units in June 2014. The EPA also will issue guidelines to the states regarding the process for setting the performance standards, including how to determine the “best system of emission reduction,” which is to be the basis for setting the performance standards. The EPA will take comment on the proposed rule and guidelines and has stated its intention to finalize the rule in June 2015. The EPA has stated that it expects the states to submit plans for implementing the existing source performance standards by June 2016. At this time, the Company cannot predict whether this rule will have a material impact on the Company or its subsidiaries.
Water Discharges.
The Company’s facilities are subject to a variety of rules governing water discharges. In particular, the Company’s U.S. facilities are subject to the U.S. Clean Water Act Section 316(b) rule issued by the EPA which seeks to protect fish and other aquatic organisms by requiring existing steam electric generating facilities to utilize the “Best Technology Available” (“BTA”) for cooling water intake structures. The EPA published a proposed rule establishing requirements under 316(b) regulations on April 20, 2011. The proposal establishes BTA requirements regarding impingement standards with respect to aquatic organisms for all facilities that withdraw above 2 million gallons per day of water from certain bodies of water and utilize at least 25% of the withdrawn water for cooling purposes. To meet these BTA requirements, as currently proposed, cooling water intake structures associated with once through cooling processes will need modifications of existing traveling screens that protect aquatic organisms and will need to add a fish return and handling system for each cooling system.
45
Existing closed cycle cooling facilities may require upgrades to water intake structure systems. The proposal would also require comprehensive site-specific studies during the permitting process and may require closed-cycle cooling systems in order to meet BTA entrainment standards.
Under a consent decree filed in the U.S. District Court for the Southern District of New York, the EPA was required to issue a final rule by January 14, 2014; however, the EPA has not yet issued such final rule. Until such regulations are final, the EPA has instructed state regulatory agencies to use their best professional judgment in determining how to evaluate what constitutes BTA for protecting fish and other aquatic organisms from cooling water intake structures. Certain states in which the Company operates power generation facilities have been delegated authority and are moving forward to issue National Pollutant Discharge Elimination System (“NPDES”) permits with best technology available determinations in the absence of any final rule from the EPA. On September 27, 2010, the California Office of Administrative Law approved a policy adopted by the California State Water Resources Control Board with respect to power plant cooling water intake structures that withdraw from coastal and estuarine waters. This policy became effective on October 1, 2010, and establishes technology-based standards to implement Section 316(b) of the U.S. Clean Water Act in NPDES permits that withdraw from coastal and estuarine waters in California. At this time, it is contemplated that the Company’s Redondo Beach, Huntington Beach and Alamitos power plants in California (collectively, “AES Southland”) will need to have in place BTA by December 31, 2020, or repower the facilities. On April 1, 2011, AES Southland filed an Implementation Plan with the State Water Resources Control Board that indicated its intent to repower the facilities in a phased approach, with the final units being in compliance by 2024. The State Water Resources Board is currently reviewing the implementation plans and has requested additional information to assist with its evaluation. Power plants will be required to comply with the more stringent of state or federal requirements. At present, the Company cannot predict the final requirements under the EPA Section 316(b) regulation, but the Company anticipates compliance costs could have a material impact on our consolidated financial condition or results of operations.
On January 7, 2013, the Ohio EPA issued an NPDES permit for J.M. Stuart Station. The primary issues involve the temperature and thermal discharges from the Station including the point at which the water quality standards are applied, i.e., whether water quality standards apply at the point where the Station discharge canal discharges into the Ohio River, or whether, as the EPA alleges, the discharge canal is an extension of Little Three Mile Creek and the water quality standards apply at the point where water enters the discharge canal. In addition, there are a number of other water-related permit requirements established with respect to metals and other materials contained in the discharges from the Station. The NPDES permit establishes interim standards related to the thermal discharge for 54 months that are comparable to current levels of discharge by Stuart Station. Permanent standards for both temperature and overall thermal discharges are established as of 55 months after the permit is effective, except that an additional transitional period of approximately 22 months is allowed if compliance with the permanent standards is to be achieved through a plan of construction and various milestones on the construction schedule are met. DP&L is still analyzing the NPDES permit, but it is believed that there is a strong potential that compliance will require capital expenses that are material to DP&L. The cost of compliance and the timing of such costs is uncertain and may vary considerably depending on a compliance plan that would need to be developed, the type of capital projects that may be necessary, and the uncertainties that may arise in the likely event that permits and approvals from other governmental entities would likely be required to construct and operate any such capital project. DP&L has appealed various aspects of the final permit to the Environmental Review Appeals Commission. The outcome of such appeal is uncertain.
On August 28, 2012, the Indiana Department of Environmental Management ("IDEM") issued NPDES permits to the IPL Petersburg, Harding Street and Eagle Valley generating stations, which became effective in October 2012. NPDES permits regulate specific industrial waste water and storm water discharges to the waters of Indiana under Sections 402 and 405 of the U.S. Clean Water Act. These permits set new levels of acceptable metal effluent water discharge, as well as monitoring and other requirements designed to protect aquatic life, with full compliance required by October 2015. As part of an agreed order with IDEM in April 2013, IPL received a two-year extension of the required compliance date, through September 2017. IPL is conducting studies to determine what operational changes and/or additional equipment will be required to comply with the new limitation. In developing its compliance plans, IPL must make assumptions about the outcomes of future federal rulemaking with respect to coal combustion byproducts, cooling water intake and waste water effluents. In light of the uncertainties at this time, we cannot predict the impact of these regulations on our consolidated results of operations, cash flows, or financial condition, but it is expected to be material to IPL. Recovery of these costs is expected through an Indiana statute, which allows for 80% recovery of qualifying costs through a rate adjustment mechanism and the remainder through a base rate case proceeding; however, there can be no assurances that IPL would be successful in that regard.
In April 2013, the EPA announced proposed rules to reduce toxic pollutants discharged into waterways by power plants. The proposed rules are intended to update the existing technology-based rules for controlling the discharge of pollutants from various waste streams associated with steam electric generating facilities. The proposed rules identify four preferred options for controlling the discharge of these pollutants, and EPA believes that over half of existing power plants will comply with these rules, if they become final, without incurring costs. However, it is too early to determine whether the impacts of this rule, if and
46
when it becomes final, will materially impact the Company or its subsidiaries. EPA is required to finalize these rules by May 2014.
Waste Management.
In the course of operations, the Company’s facilities generate solid and liquid waste materials requiring eventual disposal or processing. With the exception of coal combustion byproducts (“CCB”), the wastes are not usually physically disposed of on our property, but are shipped off site for final disposal, treatment or recycling. CCB, which consists of bottom ash, fly ash and air pollution control wastes, is disposed of at some of our coal-fired power generation plant sites using engineered, permitted landfills. Waste materials generated at our electric power and distribution facilities include CCB, oil, scrap metal, rubbish, small quantities of industrial hazardous wastes such as spent solvents, tree and land clearing wastes and polychlorinated biphenyl (“PCB”) contaminated liquids and solids. The Company endeavors to ensure that all of its solid and liquid wastes are disposed of in accordance with applicable national, regional, state and local regulations. On June 21, 2010, the EPA published in the Federal Register a proposed rule to regulate CCB under the Resource Conservation and Recovery Act (“RCRA”). The proposed rule provides two possible options for CCB regulation, and both options contemplate heightened structural integrity requirements for surface impoundments of CCB. The first option contemplates regulation of CCB as a hazardous waste subject to regulation under Subtitle C of the RCRA. Under this option, existing surface impoundments containing CCB would be required to be retrofitted with composite liners and these impoundments would likely be phased out over several years. State and/or federal permit programs would be developed for storage, transport and disposal of CCB. States could bring enforcement actions for non-compliance with permitting requirements, and the EPA would have oversight responsibilities as well as the authority to bring lawsuits for non-compliance. The second option contemplates regulation of CCB under Subtitle D of the RCRA. Under this option, the EPA would create national criteria applicable to CCB landfills and surface impoundments. Existing impoundments would also be required to be retrofitted with composite liners and would likely be phased out over several years. This option would not contain federal or state permitting requirements. The primary enforcement mechanism under regulation pursuant to Subtitle D would be private lawsuits.
Although the public comment period for this proposed regulation has expired, the EPA twice issued a Notice of Data Availability (“NODA”), which allowed the public to submit additional information. The EPA is expected to promulgate a final rule in 2014. The EPA is also conducting a coal ash reuse risk analysis that the EPA has stated it will complete before issuing a final rule. The EPA is likely to retain its five-year deadline for meeting the final rule’s surface impoundment requirements. While the exact impact and compliance cost associated with future regulations of CCB cannot be established until such regulations are finalized, there can be no assurance that the Company’s businesses, financial condition or results of operations would not be materially and adversely affected by such regulations.
Senate Bill 251.
In May 2011, Senate Bill 251 became a law in the State of Indiana. Senate Bill 251 is a comprehensive bill which, among other things, provides Indiana utilities, including IPL, with a means for recovering 80% of costs incurred to comply with federal mandates through a periodic retail rate adjustment mechanism. This includes costs to comply with regulations from the EPA, FERC, the North American Electric Reliability Corporation (“NERC”), Department of Energy, etc., including capital intensive requirements and/or proposals described herein, such as cooling water intake regulations, waste management and coal combustion byproducts, wastewater effluent, MISO transmission expansion costs and polychlorinated biphenyls. It does not change existing legislation that allows for 100% recovery of clean coal technology designed to reduce air pollutants.
Some of the most important features of Senate Bill 251 to IPL are as follows. Any energy utility in Indiana seeking to recover federally mandated costs incurred in connection with a compliance project shall apply to the Indiana Utility Regulatory Commission (“IURC”) for a certificate of public convenience and necessity (“CPCN”) for the compliance project. It sets forth certain factors that the IURC must consider in determining whether to grant a CPCN. It further specifies that if the IURC approves a proposed compliance project and the projected federally mandated costs associated with the project, the following apply: (i) 80% of the approved costs shall be recovered by the energy utility through a periodic retail rate adjustment mechanism; (ii) 20% of the approved costs shall be deferred and recovered by the energy utility as part of the next general rate case filed with the IURC; and (iii) actual costs exceeding the projected federally mandated costs of the approved compliance project by more than 25% shall require specific justification and approval before being authorized in the energy utility’s next general rate case. Senate Bill 251 also requires the IURC to adopt rules to establish a voluntary clean energy portfolio standard program. Such program will provide incentives to participating electricity suppliers to obtain specified percentages of electricity from clean energy sources in accordance with clean portfolio standard goals, including requiring at least 50% of the clean energy to originate from Indiana suppliers. The goals can also be met by purchasing clean energy credits.
CERCLA
. The Comprehensive Environmental Response, Compensation and Liability Act of 1980 (“CERCLA” aka “Superfund”) may be the source of claims against certain of the Company’s U.S. subsidiaries from time to time. There is ongoing litigation at a site known as the South Dayton Landfill where a group of companies already recognized as Potentially Responsible Parties (“PRP”) have sued DP&L and other unrelated entities seeking a contribution towards the costs of assessment and remediation. DP&L is actively opposing such claims. In 2003, DP&L received notice that the EPA considers
47
DP&L to be a PRP at the Tremont City landfill Superfund site. No actions have taken place since 2003 regarding the Tremont City landfill. The Company is unable to determine whether there will be any liability, or the size of any liability that may ultimately be assessed against DP&L at these two sites, but any such liability could be material to DP&L.
Unit Retirement and Replacement Generation
. In the second quarter of 2013, IPL retired in place five oil-fired peaking units with an average life of approximately 61 years (approximately 168 MW net capacity in total), as such units were not equipped with the advanced environmental control technologies need to comply with existing and expected environmental regulations. Although these units represented approximately 5% of IPL’s generating capacity, they were seldom dispatched by Midcontinent Independent System Operator, Inc. in recent years due to their relatively higher production cost and in some instances repairs were needed. In addition to these recently retired units, IPL has several other generating units that it expects to retire or refuel by 2017. These units are primarily coal-fired and represent 472 MW of net capacity in total. To replace this generation, in April 2013, IPL filed a petition and case-in-chief with the IURC in April 2013 seeking a CPCN to build a 550 to 725 MW combined cycle gas turbine (“CCGT”) at its Eagle Valley Station site in Indiana and to refuel Harding Street Station Units 5 and 6 from coal to natural gas (106 MW net capacity each). The total estimated cost of these projects is $667 million. IPL is seeking authority to accrue post in-service allowance for debt and equity funds used during construction, and to defer the recognition of depreciation expense of the CCGT until such time that IPL is allowed to collect a return and depreciation expense on the CCGT. If approved, the CCGT is expected to be placed into service in April 2017 and the refueling project is expected to be complete by April 2016. If IPL receives approval for the CCGT, the costs to build and operate the equipment, other than fuel costs, would not be recoverable by IPL until the resolution of a base rate case with the IURC. For the refueling project, IPL is requesting timely recovery of 80% of the revenue requirement of these federally mandated costs under Senate Bill 251, and deferral of the remaining 20% until the resolution of a base rate case filed with the IURC. If the Harding Street Units 5 and 6 are not refueled, they will likely need to be retired because it is currently not economical to install controls on those units to comply with MATS. IPL expects to receive an order on the CPCN from the IURC in the second quarter of 2014.
As a result of existing and expected environmental regulations, including MATS, DP&L notified PJM that it plans to retire the six coal-fired units aggregating approximately 360 MW at its wholly-owned Hutchings Generation Station. Hutchings Unit 4 was retired in June 2013. In conjunction with administrative agreements reached in 2013 with the EPA and Ohio’s Regional Air Pollution Control Authority that resolved alleged violations of air quality standards, DP&L accelerated its plans with respect to Hutchings Units 1, 2, 3, 5 and 6 by June 2015 and has removed equipment so that combustion of coal will not be possible after September 2013. Conversion of the coal-fired units to natural gas was investigated, but the cost of investment exceeded the expected return. In addition, DP&L owns approximately 207 MW of coal-fired generation at Beckjord Unit 6, which is operated by Duke Energy Ohio. The co-owners of Beckjord Unit 6 have notified PJM that they plan to retire Beckjord Unit 6 by June 1, 2015. At this time, DP&L does not have plans to replace the units that will be retired.
International Environmental Regulations
For a discussion of the IED regulations adopted by the European Commission, see “—
EMEA Businesses-United Kingdom — Environmental Regulation"
above.
Customers
We sell to a wide variety of customers. No individual customer accounted for 10% or more of our
2013
total revenue. In our generation business, we own and/or operate power plants to generate and sell power to wholesale customers such as utilities and other intermediaries. Our utilities sell to end-user customers in the residential, commercial, industrial and governmental sectors in a defined service area.
Employees
As of
December 31, 2013
, we employed approximately 22,000 people.
48
Executive Officers
The following individuals are our executive officers:
Andrés R. Gluski,
56 years old, has been President, Chief Executive Officer ("CEO") and a member of our Board of Directors since September 2011 and is Chairman of the Strategy and Investment Committee of the Board. Prior to assuming his current position, Mr. Gluski served as Executive Vice President ("EVP") and Chief Operating Officer ("COO") of the Company since March 2007. Prior to becoming the COO of AES, Mr. Gluski was EVP and the Regional President of Latin America from 2006 to 2007. Mr. Gluski was Senior Vice President ("SVP") for the Caribbean and Central America from 2003 to 2006, CEO of La Electricidad de Caracas (“EDC”) from 2002 to 2003 and CEO of AES Gener (Chile) in 2001. Prior to joining AES in 2000, Mr. Gluski was EVP and Chief Financial Officer ("CFO") of EDC, EVP of Banco de Venezuela (Grupo Santander), Vice President ("VP") for Santander Investment, and EVP and CFO of CANTV (subsidiary of GTE). Mr. Gluski has also worked with the International Monetary Fund in the Treasury and Latin American Departments and served as Director General of the Ministry of Finance of Venezuela. Mr. Gluski is also Chairman of AES Gener since 2005 and AES Brasiliana since 2006 and serves on the Board of AES Entek, a joint venture between AES and Koc Holdings that will develop and operate power projects in Turkey. Mr. Gluski is also on the Boards of Cliffs Natural Resources, The Council of Americas, US Spain Council, The Edison Electric Institute, and the U.S.-Brazil CEO Forum. In 2013, President Obama appointed Mr. Gluski to the President's Export Council. Mr. Gluski is a magna cum laude graduate of Wake Forest University and holds an M.A and a Ph.D. in Economics from the University of Virginia.
Elizabeth Hackenson
, 53 years old, was named Chief Information Officer (“CIO”) and SVP of AES in October 2008. Prior to assuming her current position, Ms. Hackenson was the SVP and CIO at Alcatel-Lucent from 2006 to 2008, where she managed the development of technology programs for Applications, Operations and Infrastructure. Previously, she also served as the EVP and CIO for MCI from 2004 to 2006. Her corporate tenure has spanned several Fortune 100 companies including, British Telecom (Concert), AOL (UUNET) and EDS. She served in a variety of senior management positions, working on the management and delivery of information technology services to support business needs across a corporate-wide enterprise. Ms. Hackenson serves on the Boards of Dayton Power & Light and its parent company DPL, Inc. Indianapolis Power & Light and its parent company IPALCO, AES Sul and AES Chivor. She also serves as a Director on the Greater Washington Board of Trade and is a Strategic Advisor to the Paladin Group. Ms. Hackenson earned her degree from New York State University.
Brian A. Miller,
48 years old, is an EVP of the Company, General Counsel, and Corporate Secretary. Mr. Miller joined the Company in 2001 and has served in various positions including VP, Deputy General Counsel, Corporate Secretary, General Counsel for North America and Assistant General Counsel. In 2010, Mr. Miller joined the Board of AES Entek, a joint venture that will develop and operate power projects in Turkey, between AES and Koc Holdings. In November of 2011, Mr. Miller joined the Board of Dayton Power & Light Company and its parent company, DPL, Inc. He is also a member of the Board of AES Chivor and Silver Ridge Power, a joint venture between AES and Riverstone Holdings LLC. Prior to joining AES, he was an attorney with the law firm Chadbourne & Parke, LLP. Mr. Miller received a bachelor’s degree in History and Economics from Boston College and holds a Juris Doctorate from the University of Connecticut School Of Law.
Thomas M. O’Flynn
, age 54, has served as EVP and CFO of the Company since September of 2012. Previously, Mr. O’Flynn served as Senior Advisor to the Private Equity Group of Blackstone, an investment and advisory group and held this position from 2010 to 2012. During this period, Mr. O’Flynn also served as COO and CFO of Transmission Developers, Inc. (TDI), a Blackstone-controlled company that develops innovative power transmission projects in an environmentally responsible manner. From 2001 to 2009, he served as the CFO of PSEG, a New Jersey-based merchant power and utility company. He also served as President of PSEG Energy Holdings from 2007 to 2009. From 1986 to 2001, Mr. O’Flynn was in the Global Power and Utility Group of Morgan Stanley. He served as a Managing Director for his last five years and as head of the North American Power Group from 2000 to 2001. He was responsible for senior client relationships and led a number of large merger, financing, restructuring and advisory transactions. Mr. O’Flynn serves as a member of the Boards of AES Gener, Silver Ridge Power, a joint venture between AES and Riverstone Holdings LLC, Dayton Power & Light and its parent company, DPL, Inc. He is also currently on the Board of Directors of the New Jersey Performing Arts Center and is Chairman of the Institute for Sustainability & Energy at Northwestern University. Mr. O’Flynn has a BA in Economics from Northwestern University and an MBA in Finance from the University of Chicago.
Andrew Vesey
, 58 years old, serves as COO and EVP since November of 2012. In this position, he leads AES’ Global Operations Portfolio. Mr. Vesey has held numerous positions with AES, including EVP and COO, Global Utilities from October of 2011 to November of 2012; EVP and Regional President of Latin America and Africa from April of 2009 through October of 2011; EVP and Regional President for Latin America from March 2008 through March 2009; and Chief Operating Officer for Latin America from July 2007 through February 2008. Mr. Vesey also served as VP and Group Manager for AES
49
Latin America, DR-CAFTA Region, VP of the Global Business Transformation Group, and Vice President of the Integrated Utilities Development Group. Mr. Vesey is also Chairman of the Indianapolis Power & Light, IPALCO, Dayton Power & Light and DPL, Inc Boards and serves on the Boards of AES Sonel and AES Gener. In addition, Mr. Vesey is a member of the Board of the Trust for the Americas, US Energy Association, US Philippines Society and the Institute of the Americas. Prior to joining AES in 2004, Mr. Vesey was a Managing Director of the Utility Finance and Regulatory Advisory Practice at FTI Consulting Inc., a partner in the Energy, Chemicals and Utilities Practice of Ernst & Young LLP, and CEO and Managing Director of Citipower Pty of Melbourne, Australia. He received his BA in Economics and a BS in Mechanical Engineering from Union College in Schenectady, New York and his MS from New York University.
How to Contact AES and Sources of Other Information
Our principal offices are located at 4300 Wilson Boulevard, Arlington, Virginia 22203. Our telephone number is (703) 522-1315. Our website address is
http://www.aes.com
. Our annual reports on Form 10-K, quarterly reports on Form 10-Q and current reports on Form 8-K and any amendments to such reports filed pursuant to Section 13(a) or Section 15(d) of the Securities Exchange Act of 1934 (the “Exchange Act”) are posted on our website. After the reports are filed with, or furnished to, the Securities and Exchange Commission (“SEC”), they are available from us free of charge. Material contained on our website is not part of and is not incorporated by reference in this Form 10-K. You may also read and copy any materials we file with the SEC at the SEC’s Public Reference Room at 100 F Street, N.E., Washington, D.C. 20549. You may obtain information about the operation of the Public Reference Room by calling the SEC at 1-800-SEC-0330. The SEC maintains an internet website that contains the reports, proxy and information statements and other information that we file electronically with the SEC at www.sec.gov.
Our CEO and our CFO have provided certifications to the SEC as required by Section 302 of the Sarbanes-Oxley Act of 2002. These certifications are included as exhibits to this Annual Report on Form 10-K.
Our CEO provided a certification pursuant to Section 303A of the New York Stock Exchange Listed Company Manual on May 17, 2013.
Our Code of Business Conduct (“Code of Conduct”) and Corporate Governance Guidelines have been adopted by our Board of Directors. The Code of Conduct is intended to govern, as a requirement of employment, the actions of everyone who works at AES, including employees of our subsidiaries and affiliates. Our Ethics and Compliance Department provides training, information, and certification programs for AES employees related to the Code of Conduct. The Ethics and Compliance Department also has programs in place to prevent and detect criminal conduct, promote an organizational culture that encourages ethical behavior and a commitment to compliance with the law, and to monitor and enforce AES policies on corruption, bribery, money laundering and associations with terrorists groups. The Code of Conduct and the Corporate Governance Guidelines are located in their entirety on our website. Any person may obtain a copy of the Code of Conduct or the Corporate Governance Guidelines without charge by making a written request to: Corporate Secretary, The AES Corporation, 4300 Wilson Boulevard, Arlington, VA 22203. If any amendments to, or waivers from, the Code of Conduct or the Corporate Governance Guidelines are made, we will disclose such amendments or waivers on our website.
You should consider carefully the following risks, along with the other information contained in or incorporated by reference in this Form 10-K. Additional risks and uncertainties also may adversely affect our business and operations including those discussed in Item 7.—Management’s Discussion and Analysis of Financial Condition and Results of Operations in this Form 10-K. If any of the following events actually occur, our business, financial results and financial condition could be materially adversely affected.
Risks Related to our High Level of Indebtedness
We have a significant amount of debt, a large percentage of which is secured, which could adversely affect our business and the ability to fulfill our obligations.
As of
December 31, 2013
, we had approximately
$21.0 billion
of outstanding indebtedness on a consolidated basis. All outstanding borrowings under The AES Corporation’s senior secured credit facility and certain other indebtedness are secured by certain of our assets, including the pledge of capital stock of many of The AES Corporation’s directly held subsidiaries. Most of the debt of The AES Corporation’s subsidiaries is secured by substantially all of the assets of those subsidiaries. Since we have such a high level of debt, a substantial portion of cash flow from operations must be used to make payments on this debt. Furthermore, since a significant percentage of our assets are used to secure this debt, this reduces the amount of collateral
50
that is available for future secured debt or credit support and reduces our flexibility in dealing with these secured assets. This high level of indebtedness and related security could have other important consequences to us and our investors, including:
|
•
|
making it more difficult to satisfy debt service and other obligations at the holding company and/or individual subsidiaries;
|
|
•
|
increasing the likelihood of a downgrade of our debt, which could cause future debt costs and/or payments to increase under our debt and related hedging instruments and consume an even greater portion of cash flow;
|
|
•
|
increasing our vulnerability to general adverse industry conditions and economic conditions, including but not limited to adverse changes in foreign exchange rates and commodity prices;
|
|
•
|
reducing the availability of cash flow to fund other corporate purposes and grow our business;
|
|
•
|
limiting our flexibility in planning for, or reacting to, changes in our business and the industry;
|
|
•
|
placing us at a competitive disadvantage to our competitors that are not as highly leveraged; and
|
|
•
|
limiting, along with the financial and other restrictive covenants relating to such indebtedness, among other things, our ability to borrow additional funds as needed or take advantage of business opportunities as they arise, pay cash dividends or repurchase common stock.
|
The agreements governing our indebtedness, including the indebtedness of our subsidiaries, limit, but do not prohibit the incurrence of additional indebtedness. To the extent we become more leveraged, the risks described above would increase. Further, our actual cash requirements in the future may be greater than expected. Accordingly, our cash flows may not be sufficient to repay at maturity all of the outstanding debt as it becomes due and, in that event, we may not be able to borrow money, sell assets, raise equity or otherwise raise funds on acceptable terms or at all to refinance our debt as it becomes due. See Note 12 –
Debt
included in Item 8. of this Form 10-K for a schedule of our debt maturities.
The AES Corporation is a holding company and its ability to make payments on its outstanding indebtedness, including its public debt securities, is dependent upon the receipt of funds from its subsidiaries by way of dividends, fees, interest, loans or otherwise.
The AES Corporation is a holding company with no material assets other than the stock of its subsidiaries. All of The AES Corporation’s revenue is generated through its subsidiaries. Accordingly, almost all of The AES Corporation’s cash flow is generated by the operating activities of its subsidiaries. Therefore, The AES Corporation’s ability to make payments on its indebtedness and to fund its other obligations is dependent not only on the ability of its subsidiaries to generate cash, but also on the ability of the subsidiaries to distribute cash to it in the form of dividends, fees, interest, tax sharing, loans or otherwise.
However, our subsidiaries face various restrictions in their ability to distribute cash to The AES Corporation. Most of the subsidiaries are obligated, pursuant to loan agreements, indentures or non-recourse financing arrangements, to satisfy certain restricted payment covenants or other conditions before they may make distributions to The AES Corporation. In addition, the payment of dividends or the making of loans, advances or other payments to The AES Corporation may be subject to other contractual, legal or regulatory restrictions or may be prohibited altogether. Business performance and local accounting and tax rules may limit the amount of retained earnings that may be distributed to us as a dividend. Subsidiaries in foreign countries may also be prevented from distributing funds to The AES Corporation as a result of foreign governments restricting the repatriation of funds or the conversion of currencies. Any right that The AES Corporation has to receive any assets of any of its subsidiaries upon any liquidation, dissolution, winding up, receivership, reorganization, bankruptcy, insolvency or similar proceedings (and the consequent right of the holders of The AES Corporation’s indebtedness to participate in the distribution of, or to realize proceeds from, those assets) will be effectively subordinated to the claims of any such subsidiary’s creditors (including trade creditors and holders of debt issued by such subsidiary).
The AES Corporation’s subsidiaries are separate and distinct legal entities and, unless they have expressly guaranteed any of The AES Corporation’s indebtedness, have no obligation, contingent or otherwise, to pay any amounts due pursuant to such debt or to make any funds available whether by dividends, fees, loans or other payments.
Even though The AES Corporation is a holding company, existing and potential future defaults by subsidiaries or affiliates could adversely affect The AES Corporation.
We attempt to finance our domestic and foreign projects primarily under loan agreements and related documents which, except as noted below, require the loans to be repaid solely from the project’s revenues and provide that the repayment of the loans (and interest thereon) is secured solely by the capital stock, physical assets, contracts and cash flow of that project
51
subsidiary or affiliate. This type of financing is usually referred to as non-recourse debt or “non-recourse financing.” In some non-recourse financings, The AES Corporation has explicitly agreed to undertake certain limited obligations and contingent liabilities, most of which by their terms will only be effective or will be terminated upon the occurrence of future events. These obligations and liabilities take the form of guarantees, indemnities, letter of credit reimbursement agreements and agreements to pay, in certain circumstances, the project lenders or other parties.
As of
December 31, 2013
, we had approximately
$21.0 billion
of outstanding indebtedness on a consolidated basis, of which approximately
$5.7 billion
was recourse debt of The AES Corporation and approximately
$15.4 billion
was non-recourse debt. In addition, we have outstanding guarantees, indemnities, letters of credit, and other credit support commitments which are further described in this Form 10-K in Item 7.—Management’s Discussion and Analysis of Financial Condition and Results of Operations—
Capital Resources and Liquidity
—
Parent Company Liquidity
.
Some of our subsidiaries are currently in default with respect to all or a portion of their outstanding indebtedness. The total debt classified as current in our consolidated balance sheets related to such defaults was
$1.1 billion
at
December 31, 2013
. While the lenders under our non-recourse financings generally do not have direct recourse to The AES Corporation (other than to the extent of any credit support given by The AES Corporation), defaults thereunder can still have important consequences for The AES Corporation, including, without limitation:
|
•
|
reducing The AES Corporation’s receipt of subsidiary dividends, fees, interest payments, loans and other sources of cash since the project subsidiary will typically be prohibited from distributing cash to The AES Corporation during the pendency of any default;
|
|
•
|
under certain circumstances, triggering The AES Corporation’s obligation to make payments under any financial guarantee, letter of credit or other credit support which The AES Corporation has provided to or on behalf of such subsidiary;
|
|
•
|
causing The AES Corporation to record a loss in the event the lender forecloses on the assets;
|
|
•
|
triggering defaults in The AES Corporation’s outstanding debt and trust preferred securities. For example, The AES Corporation’s senior secured credit facilities and outstanding senior notes include events of default for certain bankruptcy related events involving material subsidiaries. In addition, The AES Corporation’s senior secured credit facilities include certain events of default relating to accelerations of outstanding material debt of material subsidiaries or any subsidiaries that in the aggregate constitute a material subsidiary;
|
|
•
|
the loss or impairment of investor confidence in the Company; or
|
|
•
|
foreclosure on the assets that are pledged under the non-recourse loans, therefore eliminating any and all potential future benefits derived from those assets.
|
None of the projects that are currently in default are owned by subsidiaries that individually or in the aggregate meet the applicable standard of materiality in The AES Corporation’s senior secured credit facilities or other debt agreements in order for such defaults to trigger an event of default or permit acceleration under such indebtedness. However, as a result of future mix of distributions, write-down of assets, dispositions and other matters that affect our financial position and results of operations, it is possible that one or more of these subsidiaries, individually or in the aggregate, could fall within the applicable standard of materiality and thereby upon an acceleration of such subsidiary’s debt, trigger an event of default and possible acceleration of the indebtedness under The AES Corporation’s senior secured credit facilities or other indebtedness of The AES Corporation.
Risks Associated with our Ability to Raise Needed Capital
The AES Corporation, or the Parent Company, has significant cash requirements and limited sources of liquidity.
The AES Corporation requires cash primarily to fund:
|
•
|
principal repayments of debt;
|
|
•
|
interest and preferred dividends;
|
|
•
|
acquisitions;
|
|
•
|
construction and other project commitments;
|
|
•
|
other equity commitments, including business development investments;
|
52
|
•
|
equity repurchases and/or cash dividends on our common stock;
|
|
•
|
taxes; and
|
|
•
|
Parent Company overhead costs.
|
The AES Corporation’s principal sources of liquidity are:
|
•
|
dividends and other distributions from its subsidiaries;
|
|
•
|
proceeds from debt and equity financings at the Parent Company level; and
|
|
•
|
proceeds from asset sales.
|
For a more detailed discussion of The AES Corporation’s cash requirements and sources of liquidity, please see Item 7.—Management’s Discussion and Analysis of Financial Condition and Results of Operations—
Capital Resources and Liquidity
of this Form 10-K.
While we believe that these sources will be adequate to meet our obligations at the Parent Company level for the foreseeable future, this belief is based on a number of material assumptions, including, without limitation, assumptions about our ability to access the capital or commercial lending markets, the operating and financial performance of our subsidiaries, exchange rates, our ability to sell assets, and the ability of our subsidiaries to pay dividends. Any number of assumptions could prove to be incorrect and therefore there can be no assurance that these sources will be available when needed or that our actual cash requirements will not be greater than expected. For example, in recent years, certain financial institutions have gone bankrupt. In the event that a bank who is party to our senior secured credit facility or other facilities goes bankrupt or is otherwise unable to fund its commitments, we would need to replace that bank in our syndicate or risk a reduction in the size of the facility, which would reduce our liquidity. In addition, our cash flow may not be sufficient to repay at maturity the entire principal outstanding under our credit facilities and our debt securities and we may have to refinance such obligations. There can be no assurance that we will be successful in obtaining such refinancing on terms acceptable to us or at all and any of these events could have a material effect on us.
Our ability to grow our business could be materially adversely affected if we were unable to raise capital on favorable terms.
From time to time, we rely on access to capital markets as a source of liquidity for capital requirements not satisfied by operating cash flows. Our ability to arrange for financing on either a recourse or non-recourse basis and the costs of such capital are dependent on numerous factors, some of which are beyond our control, including:
|
•
|
general economic and capital market conditions;
|
|
•
|
the availability of bank credit;
|
|
•
|
investor confidence;
|
|
•
|
the financial condition, performance and prospects of The AES Corporation in general and/or that of any subsidiary requiring the financing as well as companies in our industry or similar financial circumstances; and
|
|
•
|
changes in tax and securities laws which are conducive to raising capital.
|
Should future access to capital not be available to us, we may have to sell assets or decide not to build new plants or expand or improve existing facilities, either of which would affect our future growth, results of operations or financial condition.
A downgrade in the credit ratings of The AES Corporation or its subsidiaries could adversely affect our ability to access the capital markets which could increase our interest costs or adversely affect our liquidity and cash flow.
If any of the credit ratings of The AES Corporation or its subsidiaries were to be downgraded, our ability to raise capital on favorable terms could be impaired and our borrowing costs could increase. Furthermore, depending on The AES Corporation’s credit ratings and the trading prices of its equity and debt securities, counterparties may no longer be as willing to accept general unsecured commitments by The AES Corporation to provide credit support. Accordingly, with respect to both new and existing commitments, The AES Corporation may be required to provide some other form of assurance, such as a letter of credit and/or collateral, to backstop or replace any credit support by The AES Corporation. There can be no assurance that such counterparties will accept such guarantees or that AES could arrange such further assurances in the future. In addition,
53
to the extent The AES Corporation is required and able to provide letters of credit or other collateral to such counterparties, it will limit the amount of credit available to The AES Corporation to meet its other liquidity needs.
We may not be able to raise sufficient capital to fund developing projects in certain less developed economies which could change or in some cases adversely affect our growth strategy.
Part of our strategy is to grow our business by developing businesses in less developed economies where the return on our investment may be greater than projects in more developed economies. Commercial lending institutions sometimes refuse to provide non-recourse project financing in certain less developed economies, and in these situations we have sought and will continue to seek direct or indirect (through credit support or guarantees) project financing from a limited number of multilateral or bilateral international financial institutions or agencies. As a precondition to making such project financing available, the lending institutions may also require governmental guarantees of certain project and sovereign related risks. There can be no assurance, however, that project financing from the international financial agencies or that governmental guarantees will be available when needed, and if they are not, we may have to abandon the project or invest more of our own funds which may not be in line with our investment objectives and would leave less funds for other projects.
External Risks Associated with Revenue and Earnings Volatility
Our businesses may incur substantial costs and liabilities and be exposed to price volatility as a result of risks associated with the wholesale electricity markets, which could have a material adverse effect on our financial performance.
Some of our businesses sell electricity in the wholesale spot markets in cases where they operate at levels in excess of their power sales agreements or retail load obligations. Our businesses may also buy electricity in the wholesale spot markets. As a result, we are exposed to the risks of rising and falling prices in those markets. The open market wholesale prices for electricity can be volatile and often reflect the fluctuating cost of fuels such as coal, natural gas or oil in addition to other factors described below. Consequently, any changes in the supply and cost of coal, natural gas, or oil may impact the open market wholesale price of electricity.
Volatility in market prices for fuel and electricity may result from among other things:
|
•
|
plant availability in the markets generally;
|
|
•
|
availability and effectiveness of transmission facilities owned and operated by third parties;
|
|
•
|
competition;
|
|
•
|
demand for energy commodities;
|
|
•
|
electricity usage;
|
|
•
|
seasonality;
|
|
•
|
interest rate and foreign exchange rate fluctuation;
|
|
•
|
availability and price of emission credits;
|
|
•
|
input prices;
|
|
•
|
hydrology and other weather conditions;
|
|
•
|
illiquid markets;
|
|
•
|
transmission or transportation constraints or inefficiencies;
|
|
•
|
availability of competitively priced renewables sources;
|
|
•
|
available supplies of natural gas, crude oil and refined products, and coal;
|
|
•
|
generating unit performance;
|
|
•
|
natural disasters, terrorism, wars, embargoes, and other catastrophic events;
|
|
•
|
energy, market and environmental regulation, legislation and policies;
|
|
•
|
geopolitical concerns affecting global supply of oil and natural gas;
|
54
|
•
|
general economic conditions in areas where we operate which impact energy consumption: and
|
|
•
|
bidding behavior and market bidding rules.
|
Our financial position and results of operations may fluctuate significantly due to fluctuations in currency exchange rates experienced at our foreign operations.
Our exposure to currency exchange rate fluctuations results primarily from the translation exposure associated with the preparation of the Consolidated Financial Statements, as well as from transaction exposure associated with transactions in currencies other than an entity’s functional currency. While the Consolidated Financial Statements are reported in U.S. Dollars, the financial statements of many of our subsidiaries outside the United States are prepared using the local currency as the functional currency and translated into U.S. Dollars by applying appropriate exchange rates. As a result, fluctuations in the exchange rate of the U.S. Dollar relative to the local currencies where our subsidiaries outside the United States report could cause significant fluctuations in our results. In addition, while our expenses with respect to foreign operations are generally denominated in the same currency as corresponding sales, we have transaction exposure to the extent receipts and expenditures are not denominated in the subsidiary’s functional currency. Moreover, the costs of doing business abroad may increase as a result of adverse exchange rate fluctuations. Our financial position and results of operations could be affected by fluctuations in the value of a number of currencies. See Item 7A.—
Quantitative and Qualitative Information Disclosures about Market Risk
to this Form 10-K for further information.
We may not be adequately hedged against our exposure to changes in commodity prices or interest rates.
We routinely enter into contracts to hedge a portion of our purchase and sale commitments for electricity, fuel requirements and other commodities to lower our financial exposure related to commodity price fluctuations. As part of this strategy, we routinely utilize fixed price forward physical purchase and sales contracts, futures, financial swaps, and option contracts traded in the over-the-counter markets or on exchanges. We also enter into contracts which help us hedge our interest rate exposure on variable rate debt. However, we may not cover the entire exposure of our assets or positions to market price or interest rate volatility, and the coverage will vary over time. Furthermore, the risk management practices we have in place may not always perform as planned. In particular, if prices of commodities or interest rates significantly deviate from historical prices or interest rates or if the price or interest rate volatility or distribution of these changes deviates from historical norms, our risk management practices may not protect us from significant losses. As a result, fluctuating commodity prices or interest rates may negatively impact our financial results to the extent we have unhedged or inadequately hedged positions. In addition, certain types of economic hedging activities may not qualify for hedge accounting under GAAP, resulting in increased volatility in our net income. The Company may also suffer losses associated with “basis risk” which is the difference in performance between the hedge instrument and the targeted underlying exposure. Furthermore, there is a risk that the current counterparties to these arrangements may fail or are unable to perform part or all of their obligations under these arrangements.
In the past few years, we have faced substantial challenges in the United States as a result of high coal prices relative to natural gas, which has affected the results of certain of our coal plants in the region, particularly those which are merchant plants that are exposed to market risk and those that have hybrid merchant risk, meaning those businesses that have a PPA in place but purchase fuel at market prices or under short term contracts. For our businesses with PPA pricing that does not perfectly pass through our fuel costs, the businesses attempt to manage the exposure through flexible fuel purchasing and timing of entry and terms of our fuel supply agreements; however, these risk management efforts may not be successful and the resulting commodity exposure could have a material impact on these businesses and/or our results of operations.
Supplier and/or customer concentration may expose the Company to significant financial credit or performance risks.
We often rely on a single contracted supplier or a small number of suppliers for the provision of fuel, transportation of fuel and other services required for the operation of certain of our facilities. If these suppliers cannot perform, we would seek to meet our fuel requirements by purchasing fuel at market prices, exposing us to market price volatility and the risk that fuel and transportation may not be available during certain periods at any price, which could adversely impact the profitability of the affected business and our results of operations, and could result in a breach of agreements with other counterparties, including, without limitation, offtakers or lenders.
At times, we rely on a single customer or a few customers to purchase all or a significant portion of a facility’s output, in some cases under long-term agreements that account for a substantial percentage of the anticipated revenue from a given facility. We have also hedged a portion of our exposure to power price fluctuations through forward fixed price power sales. Counterparties to these agreements may breach or may be unable to perform their obligations. We may not be able to enter into replacement agreements on terms as favorable as our existing agreements, or at all. If we were unable to enter into replacement PPAs, these businesses may have to sell power at market prices. A breach by a counterparty of a PPA or other agreement could also result in the breach of other agreements, including, without limitation, the debt documents of the affected business.
55
The failure of any supplier or customer to fulfill its contractual obligations to The AES Corporation or our subsidiaries could have a material adverse effect on our financial results. Consequently, the financial performance of our facilities is dependent on the credit quality of, and continued performance by, suppliers and customers.
The market pricing of our common stock has been volatile and may continue to be volatile in future periods.
The market price for our common stock has been volatile in the past, and the price of our common stock could fluctuate substantially in the future. Stock price movements on a quarter by quarter basis for the past two years are set forth in Item 5.—Market—
Market Information
of this Form 10-K. Factors that could affect the price of our common stock in the future include general conditions in our industry, in the power markets in which we participate and in the world, including environmental and economic developments, over which we have no control, as well as developments specific to us, including, risks that could result in revenue and earnings volatility as well as other risk factors described in this Item 1A.—
Risk Factors
and those matters described in Item 7.—
Management’s Discussion and Analysis of Financial Conditions and Results of Operations
.
Risks Associated with our Operations
We do a significant amount of business outside the United States, including in developing countries, which presents significant risks.
A significant amount of our revenue is generated outside the United States and a significant portion of our international operations is conducted in developing countries. Part of our growth strategy is to expand our business in developing countries because the growth rates and the opportunity to implement operating improvements and achieve higher operating margins may be greater than those typically achievable in more developed countries. International operations, particularly the operation, financing and development of projects in developing countries, entail significant risks and uncertainties, including, without limitation:
|
•
|
economic, social and political instability in any particular country or region;
|
|
•
|
adverse changes in currency exchange rates;
|
|
•
|
government restrictions on converting currencies or repatriating funds;
|
|
•
|
unexpected changes in foreign laws and regulations or in trade, monetary or fiscal policies;
|
|
•
|
high inflation and monetary fluctuations;
|
|
•
|
restrictions on imports of coal, oil, gas or other raw materials required by our generation businesses to operate;
|
|
•
|
threatened or consummated expropriation or nationalization of our assets by foreign governments;
|
|
•
|
risks relating to the failure to comply with the U.S. Foreign Corrupt Practices Act, United Kingdom Bribery Act or other anti-bribery laws applicable to our operations;
|
|
•
|
difficulties in hiring, training and retaining qualified personnel, particularly finance and accounting personnel with GAAP expertise;
|
|
•
|
unwillingness of governments, government agencies, similar organizations or other counterparties to honor their contracts;
|
|
•
|
unwillingness of governments, government agencies, courts or similar bodies to enforce contracts that are economically advantageous to subsidiaries of the Company and economically unfavorable to counterparties, against such counterparties, whether such counterparties are governments or private parties;
|
|
•
|
inability to obtain access to fair and equitable political, regulatory, administrative and legal systems;
|
|
•
|
adverse changes in government tax policy;
|
|
•
|
difficulties in enforcing our contractual rights or enforcing judgments or obtaining a favorable result in local jurisdictions; and
|
|
•
|
potentially adverse tax consequences of operating in multiple jurisdictions.
|
Any of these factors, by itself or in combination with others, could materially and adversely affect our business, results of operations and financial condition. Our operations may experience volatility in revenues and operating margin which have
56
caused and are expected to cause significant volatility in our results of operations and cash flows. The volatility is caused by regulatory and economic difficulties, political instability and currency devaluations being experienced in many of these countries. This volatility reduces the predictability and enhances the uncertainty associated with cash flows from these businesses. A number of our businesses are facing challenges associated with regulatory changes.
The operation of power generation, distribution and transmission facilities involves significant risks that could adversely affect our financial results. We and/or our subsidiaries may not have adequate risk mitigation and/or insurance coverage for liabilities.
We are in the business of generating and distributing electricity, which involves certain risks that can adversely affect financial and operating performance, including:
|
•
|
changes in the availability of our generation facilities or distribution systems due to increases in scheduled and unscheduled plant outages, equipment failure, failure of transmission systems, labor disputes, disruptions in fuel supply, poor hydrologic and wind conditions, inability to comply with regulatory or permit requirements or catastrophic events such as fires, floods, storms, hurricanes, earthquakes, explosions, terrorist acts, cyber attacks or other similar occurrences; and
|
|
•
|
changes in our operating cost structure including, but not limited to, increases in costs relating to: gas, coal, oil and other fuel; fuel transportation; purchased electricity; operations, maintenance and repair; environmental compliance, including the cost of purchasing emissions offsets and capital expenditures to install environmental emission equipment; transmission access; and insurance.
|
Our businesses require reliable transportation sources (including related infrastructure such as roads, ports and rail), power sources and water sources to access and conduct operations. The availability and cost of this infrastructure affects capital and operating costs and levels of production and sales. Limitations, or interruptions in this infrastructure or at the facilities of our subsidiaries, including as a result of third parties intentionally or unintentionally disrupting this infrastructure or the facilities of our subsidiaries, could impede their ability to produce electricity. This could have a material adverse effect on our businesses’ results of operations, financial condition and prospects.
In addition, a portion of our generation facilities were constructed many years ago. Older generating equipment may require significant capital expenditures for maintenance. The equipment at our plants, whether old or new, is also likely to require periodic upgrading, improvement or repair, and replacement equipment or parts may be difficult to obtain in circumstances where we rely on a single supplier or a small number of suppliers. The inability to obtain replacement equipment or parts may impact the ability of our plants to perform and could therefore have a material impact on our business and results of operations. Breakdown or failure of one of our operating facilities may prevent the facility from performing under applicable power sales agreements which, in certain situations, could result in termination of a power purchase or other agreement or incurrence of a liability for liquidated damages and/or other penalties.
As a result of the above risks and other potential hazards associated with the power generation, distribution and transmission industries, we may from time to time become exposed to significant liabilities for which we may not have adequate risk mitigation and/or insurance coverage. Power generation involves hazardous activities, including acquiring, transporting and unloading fuel, operating large pieces of rotating equipment and delivering electricity to transmission and distribution systems. In addition to natural risks, such as earthquakes, floods, lightning, hurricanes and wind, hazards, such as fire, explosion, collapse and machinery failure, are inherent risks in our operations which may occur as a result of inadequate internal processes, technological flaws, human error or actions of third parties or other external events. The control and management of these risks depend upon adequate development and training of personnel and on the existence of operational procedures, preventative maintenance plans and specific programs supported by quality control systems which reduce, but do not eliminate, the possibility of the occurrence and impact of these risks.
The hazards described above, along with other safety hazards associated with our operations, can cause significant personal injury or loss of life, severe damage to and destruction of property, plant and equipment, contamination of, or damage to, the environment and suspension of operations. The occurrence of any one of these events may result in our being named as a defendant in lawsuits asserting claims for substantial damages, environmental cleanup costs, personal injury and fines and/or penalties. We maintain an amount of insurance protection that we believe is customary, but there can be no assurance that our insurance will be sufficient or effective under all circumstances and against all hazards or liabilities to which we may be subject. A claim for which we are not fully insured or insured at all could hurt our financial results and materially harm our financial condition. Further, due to rising insurance costs and changes in the insurance markets, we cannot provide assurance that insurance coverage will continue to be available on terms similar to those presently available to us or at all. Any losses not covered by insurance could have a material adverse effect on our financial condition, results of operations or cash flows.
57
Our businesses’ insurance does not cover every potential risk associated with its operations. Adequate coverage at reasonable rates is not always obtainable. In addition, insurance may not fully cover the liability or the consequences of any business interruptions such as equipment failure or labor dispute. The occurrence of a significant adverse event not fully or partially covered by insurance could have a material adverse effect on the Company’s business, results or operations, financial condition and prospects.
Any of the above risks could have a material adverse effect on our business and results of operations.
Our inability to attract and retain skilled people could have a material adverse effect on our operations.
Our operating success and ability to carry out growth initiatives depends in part on our ability to retain executives and to attract and retain additional qualified personnel who have experience in our industry and in operating a company of our size and complexity, including people in our foreign businesses. The inability to attract and retain qualified personnel could have a material adverse effect on our business, because of the difficulty of promptly finding qualified replacements. For example, we routinely are required to assess the financial impacts of complicated business transactions which occur on a worldwide basis. These assessments are dependent on hiring personnel on a worldwide basis with sufficient expertise in U.S. GAAP to timely and accurately comply with United States reporting obligations. An inability to maintain adequate internal accounting and managerial controls and hire and retain qualified personnel could have an adverse effect on our financial and tax reporting.
We have contractual obligations to certain customers to provide full requirements service, which makes it difficult to predict and plan for load requirements and may result in increased operating costs to certain of our businesses.
We have contractual obligations to certain customers to supply power to satisfy all or a portion of their energy requirements. The uncertainty regarding the amount of power that our power generation and distribution facilities must be prepared to supply to customers may increase our operating costs. A significant under—or over-estimation of load requirements could result in our facilities not having enough or having too much power to cover their obligations, in which case we would be required to buy or sell power from or to third parties at prevailing market prices. Those prices may not be favorable and thus could increase our operating costs.
We may not be able to enter into long-term contracts, which reduce volatility in our results of operations. Even when we successfully enter into long-term contracts, our generation businesses are often dependent on one or a limited number of customers and a limited number of fuel suppliers.
Many of our generation plants conduct business under long-term sales and supply contracts, which helps these businesses to manage risks by reducing the volatility associated with power and input costs and providing a stable revenue and cost structure. In these instances, we rely on power sales contracts with one or a limited number of customers for the majority of, and in some cases all of, the relevant plant’s output and revenues over the term of the power sales contract. The remaining terms of the power sales contracts of our generation plants range from one to 25 years. In many cases, we also limit our exposure to fluctuations in fuel prices by entering into long-term contracts for fuel with a limited number of suppliers. In these instances, the cash flows and results of operations are dependent on the continued ability of customers and suppliers to meet their obligations under the relevant power sales contract or fuel supply contract, respectively. Some of our long-term power sales agreements are at prices above current spot market prices and some of our long-term fuel supply contracts are at prices below current market prices. The loss of significant power sales contracts or fuel supply contracts, or the failure by any of the parties to such contracts that prevents us from fulfilling our obligations there under, could adversely impact our strategy by resulting in costs that exceed revenue, which could have a material adverse impact on our business, results of operations and financial condition. In addition, depending on market conditions and regulatory regimes, it may be difficult for us to secure long-term contracts, either where our current contracts are expiring or for new development projects. The inability to enter into long-term contracts could require many of our businesses to purchase inputs at market prices and sell electricity into spot markets, which may not be favorable.
We have sought to reduce counterparty credit risk under our long-term contracts in part by entering into power sales contracts with utilities or other customers of strong credit quality and by obtaining guarantees from certain sovereign governments of the customer’s obligations. However, many of our customers do not have, or have failed to maintain, an investment-grade credit rating, and our generation business cannot always obtain government guarantees and if they do, the government does not always have an investment grade credit rating. We have also sought to reduce our credit risk by locating our plants in different geographic areas in order to mitigate the effects of regional economic downturns. However, there can be no assurance that our efforts to mitigate this risk will be successful.
58
Competition is increasing and could adversely affect us.
The power production markets in which we operate are characterized by numerous strong and capable competitors, many of whom may have extensive and diversified developmental or operating experience (including both domestic and international) and financial resources similar to or greater than ours. Further, in recent years, the power production industry has been characterized by strong and increasing competition with respect to both obtaining power sales agreements and acquiring existing power generation assets. In certain markets, these factors have caused reductions in prices contained in new power sales agreements and, in many cases, have caused higher acquisition prices for existing assets through competitive bidding practices. The evolution of competitive electricity markets and the development of highly efficient gas-fired power plants have also caused, or are anticipated to cause, price pressure in certain power markets where we sell or intend to sell power. These competitive factors could have a material adverse effect on us.
Some of our subsidiaries participate in defined benefit pension plans and their net pension plan obligations may require additional significant contributions.
Certain of our subsidiaries have defined benefit pension plans covering substantially all of their respective employees. Of the thirty defined benefit plans, five are at United States subsidiaries and the remaining plans are at foreign subsidiaries. Pension costs are based upon a number of actuarial assumptions, including an expected long-term rate of return on pension plan assets, the expected life span of pension plan beneficiaries and the discount rate used to determine the present value of future pension obligations. Any of these assumptions could prove to be wrong, resulting in a shortfall of pension plan assets compared to pension obligations under the pension plan. The Company periodically evaluates the value of the pension plan assets to ensure that they will be sufficient to fund the respective pension obligations. The Company’s exposure to market volatility is mitigated to some extent due to the fact that the asset allocations in our largest plans include a significant weighting of investments in fixed income securities that are less volatile than investments in equity securities. Future downturns in the debt and/or equity markets, or the inaccuracy of any of our significant assumptions underlying the estimates of our subsidiaries’ pension plan obligations, could result in an increase in pension expense and future funding requirements, which may be material. Our subsidiaries who participate in these plans are responsible for satisfying the funding requirements required by law in their respective jurisdiction for any shortfall of pension plan assets compared to pension obligations under the pension plan. This may necessitate additional cash contributions to the pension plans that could adversely affect the Parent Company and our subsidiaries’ liquidity.
For additional information regarding the funding position of the Company’s pension plans, see Item 7.—Management’s Discussion and Analysis of Financial Condition and Results of Operations—
Critical Accounting
—
Estimates
—
Pension and Postretirement Obligations
and Note 15 —
Benefit Plans
included in Item 8. —
Financial Statements and Supplementary Data
included in this Form 10-K.
Our business is subject to substantial development uncertainties.
Certain of our subsidiaries and affiliates are in various stages of developing and constructing power plants, some but not all of which have signed long-term contracts or made similar arrangements for the sale of electricity. Successful completion depends upon overcoming substantial risks, including, but not limited to, risks relating to siting, financing, engineering and construction, permitting, governmental approvals, commissioning delays, or the potential for termination of the power sales contract as a result of a failure to meet certain milestones.
In certain cases, our subsidiaries may enter into obligations in the development process even though the subsidiaries have not yet secured financing, power purchase arrangements, or other aspects of the development process. For example, in certain cases, our subsidiaries may instruct contractors to begin the construction process or seek to procure equipment even where they do not have financing or a power purchase agreement in place (or conversely, to enter into a power purchase, procurement or other agreement without financing in place). If the project does not proceed, our subsidiaries may remain obligated for certain liabilities even though the project will not proceed. Development is inherently uncertain and we may forgo certain development opportunities and we may undertake significant development costs before determining that we will not proceed with a particular project. We believe that capitalized costs for projects under development are recoverable; however, there can be no assurance that any individual project will be completed and reach commercial operation. If these development efforts are not successful, we may abandon a project under development and write off the costs incurred in connection with such project. At the time of abandonment, we would expense all capitalized development costs incurred in connection therewith and could incur additional losses associated with any related contingent liabilities.
59
In some of our joint venture projects and businesses and at The AES Corporation, we have granted protective rights to minority shareholders or we own less than a majority of the equity in the project or business and do not manage or otherwise control the project or business, which entails certain risks.
We have invested in some joint ventures where our subsidiaries share operational, management, investment and/or other control rights with our joint venture partners. In many cases, we may exert influence over the joint venture pursuant to a management contract, by holding positions on the board of the joint venture company or on management committees and/or through certain limited governance rights, such as rights to veto significant actions. However, we do not always have this type of influence over the project or business in every instance and we may be dependent on our joint venture partners or the management team of the joint venture to operate, manage, invest or otherwise control such projects or businesses. Our joint venture partners or the management team of our joint ventures may not have the level of experience, technical expertise, human resources, management and other attributes necessary to operate these projects or businesses optimally, and they may not share our business priorities. In some joint venture agreements where we do have majority control of the voting securities, we have entered into shareholder agreements granting protective minority rights to the other shareholders.
The approval of joint venture partners also may be required for us to receive distributions of funds from jointly owned entities or to transfer our interest in projects or businesses. The control or influence exerted by our joint venture partners may result in operational management and/or investment decisions which are different from the decisions our subsidiaries would make if they operated independently and could impact the profitability and value of these joint ventures. In addition, in the event that a joint venture partner becomes insolvent or bankrupt or is otherwise unable to meet its obligations to the joint venture or its share of liabilities at the joint venture, we may be subject to joint and several liability for these joint ventures, if and to the extent provided for in our governing documents or applicable law.
The AES Corporation entered into a Shareholders Agreement with Terrific Investment Corporation ("Investor"), a subsidiary of China Investment Corporation, in connection with the purchase of shares from AES in 2010. The Shareholders Agreement provides Investor with certain rights, including, without limitation, the right to nominate a Director to the Board of The AES Corporation, registration rights for the shares held by Investor, including demand registration rights and piggyback registration rights. Further information regarding the Shareholders Agreement can be found in the agreement itself, which is filed as an exhibit to this Form 10-K.
Our renewable energy projects and other initiatives face considerable uncertainties including, development, operational and regulatory challenges.
Wind Generation, Silver Ridge Power (formerly AES Solar) and our investments in projects such as energy storage are subject to substantial risks. Projects of this nature have been developed through advancement in technologies which may not be proven or whose commercial application is limited, and which are unrelated to our core business. Some of these business lines are dependent upon favorable regulatory incentives to support continued investment, and there is significant uncertainty about the extent to which such favorable regulatory incentives will be available in the future.
Furthermore, production levels for our wind and solar projects may be dependent upon adequate wind or sunlight, or biogas production which can vary significantly from period to period, resulting in volatility in production levels and profitability. For example, for our wind projects, wind resource estimates are based on historical experience when available and on wind resource studies conducted by an independent engineer, and are not expected to reflect actual wind energy production in any given year.
As a result, these types of renewable energy projects face considerable risk relative to our core business, including the risk that favorable regulatory regimes expire or are adversely modified. In addition, because certain of these projects depend on technology outside of our expertise in generation and utility businesses, there are risks associated with our ability to develop and manage such projects profitably. Furthermore, at the development or acquisition stage, because of the nascent nature of these industries or the limited experience with the relevant technologies, our ability to predict actual performance results may be hindered and the projects may not perform as predicted. There are also risks associated with the fact that some of these projects exist in markets where long-term fixed price contracts for the major cost and revenue components may be unavailable, which in turn may result in these projects having relatively high levels of volatility. Even where available, many of our renewable projects sell power under a Feed-in-Tariff, which may be eliminated or reduced, which can impact the profitability of these projects, or make money through the sale of Emission Reductions products, such as Certified Emissions Reductions, Renewable Energy Certificates or Renewable Obligation Certificates, and the price of these products may be volatile.
These projects can be capital-intensive and generally are designed with a view to obtaining third party financing, which may be difficult to obtain. As a result, these capital constraints may reduce our ability to develop these projects or obtain third party financing for these projects. These risks may be exacerbated by the current global economic crisis, including our management’s increased focus on liquidity, which may also result in slower growth in the number of projects we can pursue.
60
The economic downturn could also impact the value of our assets in these countries and our ability to develop these projects. If the value of these assets decline, this could result in a material impairment or a series of impairments which are material in the aggregate, which would adversely affect our financial statements.
Impairment of goodwill or long-lived assets would negatively impact our consolidated results of operations and net worth.
As of
December 31, 2013
, the Company had approximately
$1.6 billion
of goodwill, which represented approximately
4.0%
of our total assets on its Consolidated Balance Sheet. Goodwill is not amortized, but is evaluated for impairment at least annually, or more frequently if impairment indicators are present. We could be required to evaluate the potential impairment of goodwill outside of the required annual evaluation process if we experience situations, including but not limited to: deterioration in general economic conditions, or our operating or regulatory environment; increased competitive environment; increase in fuel costs, particularly when we are unable to pass through the impact to customers; negative or declining cash flows; loss of a key contract or customer particularly when we are unable to replace it on equally favorable terms; divestiture of a significant component of our business; or adverse actions or assessments by a regulator. These types of events and the resulting analyses could result in goodwill impairment, which could substantially affect our results of operations for those periods. Additionally, goodwill may be impaired if our acquisitions do not perform as expected. See the risk factor
“Our acquisitions may not perform as expected.”
for further discussion.
Long-lived assets are initially recorded at fair value and are amortized or depreciated over their estimated useful lives. Long-lived assets are evaluated for impairment only when impairment indicators are present whereas goodwill is evaluated for impairment on an annual basis or more frequently if potential impairment indicators are present. Otherwise, the recoverability assessment of long-lived assets is similar to the potential impairment evaluation of goodwill particularly as it relates to the identification of potential impairment indicators, and making estimates and assumptions to determine fair value, as described above.
Certain of our businesses are sensitive to variations in weather.
Our businesses are affected by variations in general weather conditions and unusually severe weather. Our businesses forecast electric sales on the basis of normal weather, which represents a long-term historical average. While we also consider possible variations in normal weather patterns and potential impacts on our facilities and our businesses, there can be no assurance that such planning can prevent these impacts, which can adversely affect our business. Generally, demand for electricity peaks in winter and summer. Typically, when winters are warmer than expected and summers are cooler than expected, demand for energy is lower, resulting in less demand for electricity than forecasted. Significant variations from normal weather where our businesses are located could have a material impact on our results of operations.
In addition, we are dependent upon hydrological conditions prevailing from time to time in the broad geographic regions in which our hydroelectric generation facilities are located. If hydrological conditions result in droughts or other conditions that negatively affect our hydroelectric generation business, our results of operations could be materially adversely affected.
Information security breaches could harm our business.
A security breach of our information technology systems or plant control systems used to manage and monitor operations could impact the reliability of our generation fleets and/or the reliability of our transmission and distribution systems. A security breach that impairs our technology infrastructure could disrupt normal business operations and affect our ability to control our transmission and distribution assets, access customer information and limit our communications with third parties. Our security measures may not prevent such security breaches. Any loss of confidential or proprietary data through a breach could impair our reputation, expose us to legal claims, or impact our ability to make collections or otherwise impact our operations, and materially adversely affect our business and results of operations.
Our acquisitions may not perform as expected.
Historically, acquisitions have been a significant part of our growth strategy. We may continue to grow our business through acquisitions. Although acquired businesses may have significant operating histories, we will have a limited or no history of owning and operating many of these businesses and possibly limited or no experience operating in the country or region where these businesses are located. Some of these businesses may have been government owned and some may be operated as part of a larger integrated utility prior to their acquisition. If we were to acquire any of these types of businesses, there can be no assurance that:
|
•
|
we will be successful in transitioning them to private ownership;
|
|
•
|
such businesses will perform as expected;
|
61
|
•
|
integration or other one-time costs will not be greater than expected;
|
|
•
|
we will not incur unforeseen obligations or liabilities;
|
|
•
|
such businesses will generate sufficient cash flow to support the indebtedness incurred to acquire them or the capital expenditures needed to develop them; or
|
|
•
|
the rate of return from such businesses will justify our decision to invest capital to acquire them.
|
We have not realized the anticipated benefits and cost savings of the DPL acquisition, and DPL continues to face business and regulatory challenges.
In November 2011, we acquired DPL Inc., owner of DP&L. To date, we have not realized the benefits that we anticipated at the time of acquisition. During 2012, DPL obtained a waiver and amendment to certain of its loan documents, which included new covenants and various restrictions, including restrictions on DPL’s ability to distribute dividends to The AES Corporation. DPL continues to face a number of business and regulatory challenges.
Many of the risks facing DPL are similar to the risks facing our other regulated utility businesses, including with respect to rate regulation, which is moving towards a market-based pricing mechanism (under the laws of Ohio), increased costs due to energy efficiency requirements and other environmental and health and safety regulations, volatility of fuels costs, increased benefit plan costs and exposure to environmental liabilities. In September 2013 the PUCO issued an order on the Electric Service Plan (“ESP”) field by DP&L to establish SSO rates that were to be in effect starting January 2013. The order approved a plan of a non-bypassable charge that is designed to recover $110 million per year for three years from all customers beginning January 2014 and ending December 2016 with the potential for an additional $45.8 million for five months beginning January 2017 and ending May 2017. The ESP also includes a three year, five month transition to market, whereby a wholesale competitive bidding structure will be phased in to supply generation service to SSO customers. DP&L filed its plan for legal separation of its generation assets. The outcome of final separation plans is uncertain and could have a material impact on our results. See Item 1.—Business—
US SBU, Businesses—DPL, Inc.
for further information on the ESP and separation plan.
DPL also faces unique risks, including increased competition as a result of Ohio legislation that permits its customers to select alternative electric generation service providers. Under this legislation, customers can elect to buy transmission and generation service from a PUCO-certified Competitive Retail Electric Service Provider (“CRES Provider”) offering services to customers in DP&L’s service territory. Increased competition by CRES Providers in DP&L’s service territory for retail generation service has resulted in the loss of existing customers and reduced revenues and could result in the loss of additional customers and further reduced revenues as well as increased costs to retain existing customers or attract new customers. The following are a few of the factors that could result in increased switching by customers to PUCO-certified CRES Providers in the future:
|
•
|
Low wholesale price levels may lead to existing CRES Providers becoming more active in DPL’s service territory, and additional CRES Providers entering DPL’s territory.
|
|
•
|
DPL could also experience customer switching through governmental aggregation, where a municipality may contract with a CRES Provider to provide generation service to the customers located within the municipal boundaries. Greater than expected customers switching would decrease DPL’s margins and increase its costs thereby causing its financial performance to be worse than the Company projected.
|
Failure by DPL to perform as expected for any reason could adversely affect DPL’s business and financial results and could adversely affect DPL’s ability to refinance certain debt (or to do so on favorable terms) which is due in the near or intermediate term DP&L has scheduled debt maturities in 2013 totaling approximately $771 million (including a $200 million revolving credit facility and a $101 million letter of credit facility). Certain of these maturities are currently subject to a first mortgage. It is DP&L’s intention to refinance the first mortgage bonds under similar terms that would also allow for the potential legal separation of its generation assets. While DP&L and its advisors believe that such a refinancing under favorable terms is probable, there can be no assurances that the prospective creditors might require pricing, terms and/or conditions that are worse than those currently in place. Any of the foregoing could have a material adverse effect on the Company.
The Company and DPL have operated and will continue to operate, independently. It is possible that the ongoing integration process could result in the loss of key DPL employees, the disruption of DPL’s ongoing businesses, unexpected integration issues, higher than expected integration costs or an overall integration process that takes longer than originally anticipated.
62
In addition, at times, the attention of certain members of the Company’s and DPL’s management and resources may be focused on the ongoing integration of the businesses of the two companies and diverted from day-to-day business operations, which may disrupt each of the companies’ ongoing businesses and the business of the combined company.
Risks associated with Governmental Regulation and Laws
Our operations are subject to significant government regulation and our business and results of operations could be adversely affected by changes in the law or regulatory schemes.
Our inability to predict, influence or respond appropriately to changes in law or regulatory schemes, including any inability to obtain expected or contracted increases in electricity tariff or contract rates or tariff adjustments for increased expenses, could adversely impact our results of operations or our ability to meet publicly announced projections or analysts’ expectations. Furthermore, changes in laws or regulations or changes in the application or interpretation of regulatory provisions in jurisdictions where we operate, particularly at our utilities where electricity tariffs are subject to regulatory review or approval, could adversely affect our business, including, but not limited to:
|
•
|
changes in the determination, definition or classification of costs to be included as reimbursable or pass-through costs to be included in the rates we charge our customers, including but not limited to costs incurred to upgrade our power plants to comply with more stringent environmental regulations;
|
|
•
|
changes in the determination of what is an appropriate rate of return on invested capital or a determination that a utility’s operating income or the rates it charges customers are too high, resulting in a reduction of rates or consumer rebates;
|
|
•
|
changes in the definition or determination of controllable or non-controllable costs;
|
|
•
|
adverse changes in tax law;
|
|
•
|
changes in law or regulation which limit or otherwise affect the ability of our counterparties (including sovereign or private parties) to fulfill their obligations (including payment obligations) to us or our subsidiaries;
|
|
•
|
changes in environmental law which impose additional costs on our subsidiaries;
|
|
•
|
changes in the definition of events which may or may not qualify as changes in economic equilibrium;
|
|
•
|
changes in the timing of tariff increases;
|
|
•
|
other changes in the regulatory determinations under the relevant concessions;
|
|
•
|
other changes related to licensing or permitting which affect our ability to conduct business; or
|
|
•
|
other changes that impact the short or long term price-setting mechanism in the markets where we operate.
|
Any of the above events may result in lower margins for the affected businesses, which can adversely affect our business.
In many countries where we conduct business, the regulatory environment is constantly changing and it may be difficult to predict the impact of the regulations on our businesses. On July 21, 2010, President Obama signed the Dodd-Frank Wall Street Reform and Consumer Protection Act (the “Dodd-Frank Act”). While the bulk of regulations contained in the Dodd-Frank Act regulate financial institutions and their products, there are several provisions related to corporate governance, executive compensation, disclosure and other matters which relate to public companies generally. The types of provisions described above are currently not expected to have a material impact on the Company or its results of operations. Furthermore, while the Dodd-Frank Act substantially expands the regulation regarding the trading, clearing and reporting of derivative transactions, the Dodd-Frank Act provides for commercial end-user exemptions which may apply to our derivative transactions. However, even with the exemption, the Dodd-Frank Act could still have a material adverse impact on the Company, as the regulation of derivatives (which includes capital and margin requirements for non-exempt companies), could limit the availability of derivative transactions that we use to reduce interest rate, commodity and currency risks, which would increase our exposure to these risks. Even if derivative transactions remain available, the costs to enter into these transactions may increase, which could adversely affect the operating results of certain projects; cause us to default on certain types of contracts where we are contractually obligated to hedge certain risks, such as project financing agreements; prevent us from developing new projects where interest rate hedging is required; cause the Company to abandon certain of its hedging strategies and transactions, thereby increasing our exposure to interest rate, commodity and currency risk; and/or consume substantial liquidity by forcing the Company to post cash and/or other permitted collateral in support of these derivatives. In addition to the Dodd-Frank Act, in 2012, the European Market Infrastructure Regulation (“EMIR”) became effective. EMIR includes
63
regulations related to the trading, reporting and clearing of derivatives and the impacts described above could also result from our (or our subsidiaries’) efforts to comply with EMIR. It is also possible that additional similar regulations may be passed in other jurisdictions where we conduct business. Any of these outcomes could have a material adverse effect on the Company.
Our business in the United States is subject to the provisions of various laws and regulations administered in whole or in part by the FERC and NERC, including PURPA, the Federal Power Act, and the EPAct 2005. Actions by the FERC, NERC and by state utility commissions can have a material effect on our operations.
EPAct 2005 authorizes the FERC to remove the obligation of electric utilities under Section 210 of PURPA to enter into new contracts for the purchase or sale of electricity from or to QFs if certain market conditions are met. Pursuant to this authority, the FERC has instituted a rebuttable presumption that utilities located within the control areas of the Midwest Independent Transmission System Operator, Inc., PJM Interconnection, L.L.C., ISO New England, Inc., the New York Independent System Operator, Inc. (“NYISO”) and the Electric Reliability Council of Texas, Inc. are not required to purchase or sell power from or to QFs above a certain size. In addition, the FERC is authorized under EPAct 2005 to remove the purchase/sale obligations of individual utilities on a case-by-case basis. While this law does not affect existing contracts, as a result of the changes to PURPA, our QFs may face a more difficult market environment when their current long-term contracts expire.
EPAct 2005 repealed PUHCA 1935 and enacted PUHCA 2005 in its place. PUHCA 1935 had the effect of requiring utility holding companies to operate in geographically proximate regions and therefore limited the range of potential combinations and mergers among utilities. By comparison, PUHCA 2005 has no such restrictions and simply provides the FERC and state utility commissions with enhanced access to the books and records of certain utility holding companies. The repeal of PUHCA 1935 removed barriers to mergers and other potential combinations which could result in the creation of large, geographically dispersed utility holding companies. These entities may have enhanced financial strength and therefore an increased ability to compete with us in the United States generation market.
In accordance with Congressional mandates in the EPAct 1992 and now in EPAct 2005, the FERC has strongly encouraged competition in wholesale electric markets. Increased competition may have the effect of lowering our operating margins. Among other steps, the FERC has encouraged RTOs and ISOs to develop demand response bidding programs as a mechanism for responding to peak electric demand. These programs may reduce the value of our peaking assets which rely on very high prices during a relatively small number of hours to recover their costs. Similarly, the FERC is encouraging the construction of new transmission infrastructure in accordance with provisions of EPAct 2005. Although new transmission lines may increase market opportunities, they may also increase the competition in our existing markets.
While the FERC continues to promote competition, some state utility commissions have reversed course and begun to encourage the construction of generation facilities by traditional utilities to be paid for on a cost-of-service basis by retail ratepayers. Such actions have the effect of reducing sale opportunities in the competitive wholesale generating markets in which we operate.
FERC has civil penalty authority over violations of any provision of Part II of the Federal Power Act (“FPA”) which concerns wholesale generation or transmission, as well as any rule or order issued thereunder. FERC is authorized to assess a maximum civil penalty of $1 million per violation for each day that the violation continues. The FPA also provides for the assessment of criminal fines and imprisonment for violations under the FPA. This penalty authority was enhanced in EPAct 2005. With this expanded enforcement authority, violations of the FPA and FERC’s regulations could potentially have more serious consequences than in the past.
Pursuant to EPAct 2005, the North American Electric Reliability Corporation (“NERC”) has been certified by FERC as the Electric Reliability Organization (“ERO”) to develop mandatory and enforceable electric system reliability standards applicable throughout the United States to improve the overall reliability of the electric grid. These standards are subject to FERC review and approval. Once approved, the reliability standards may be enforced by FERC independently, or, alternatively, by the ERO and regional reliability organizations with responsibility for auditing, investigating and otherwise ensuring compliance with reliability standards, subject to FERC oversight. Monetary penalties of up to $1 million per day per violation may be assessed for violations of the reliability standards.
Our utility businesses in the U.S. face significant regulation by their respective state utility commissions. The regulatory discretion is reasonably broad in both Indiana and Ohio and includes regulation as to services and facilities, the valuation of property, the construction, purchase, or lease of electric generating facilities, the classification of accounts, rates of depreciation, the increase or decrease in retail rates and charges, the issuance of certain securities, the acquisition and sale of some public utility properties or securities and certain other matters. These businesses face the risk of unexpected or adverse regulatory action which could have a material adverse effect on our results of operations, financial condition, and cash flows. See Item 1.—Business—
US SBU, U.S. Utilities
and Item 1A.—Risk Factors —“
We have not realized the anticipated benefits
64
and cost savings of the DPL acquisition, and DPL continues to face business and regulatory challenges
” for further information on the regulation faced by our U.S. utilities.
Our businesses are subject to stringent environmental laws and regulations.
Our activities are subject to stringent environmental laws and regulations by many federal, regional, state and local authorities, international treaties and foreign governmental authorities. These laws and regulations generally concern emissions into the air, effluents into the water, use of water, wetlands preservation, remediation of contamination, waste disposal, endangered species and noise regulation, among others. Failure to comply with such laws and regulations or to obtain or comply with any necessary environmental permits pursuant to such laws and regulations could result in fines or other sanctions. Environmental laws and regulations affecting power generation and distribution are complex and have tended to become more stringent over time. Congress and other domestic and foreign governmental authorities have either considered or implemented various laws and regulations to restrict or tax certain emissions, particularly those involving air emissions and water discharges. See the various descriptions of these laws and regulations contained in Item 1.—Business of this Form 10-K. These laws and regulations have imposed, and proposed laws and regulations could impose in the future, additional costs on the operation of our power plants. We have incurred and will continue to incur significant capital and other expenditures to comply with these and other environmental laws and regulations. Changes in, or new, environmental restrictions may force the Company to incur significant expenses or expenses that may exceed our estimates. There can be no assurance that we would be able to recover all or any increased environmental costs from our customers or that our business, financial condition, including recorded asset values or results of operations, would not be materially and adversely affected by such expenditures or any changes in domestic or foreign environmental laws and regulations.
Our businesses are subject to enforcement initiatives from environmental regulatory agencies.
The EPA has pursued an enforcement initiative against coal-fired generating plants alleging wide-spread violations of the new source review and prevention of significant deterioration provisions of the CAA. The EPA has brought suit against a number of companies and has obtained settlements with approximately 26 companies over such allegations. The allegations typically involve claims that a company made major modifications to a coal-fired generating unit without proper permit approval and without installing best available control technology. The principal, but not exclusive, focus of this EPA enforcement initiative is emissions of SO
2
and NO
X
. In connection with this enforcement initiative, the EPA has imposed fines and required companies to install improved pollution control technologies to reduce emissions of SO
2
and NO
X
. There can be no assurance that foreign environmental regulatory agencies in countries in which our subsidiaries operate will not pursue similar enforcement initiatives under relevant laws and regulations.
Regulators, politicians, non-governmental organizations and other private parties have expressed concern about greenhouse gas, or GHG, emissions and the potential risks associated with climate change and are taking actions which could have a material adverse impact on our consolidated results of operations, financial condition and cash flows.
As discussed in Item 1.—Business, at the international, federal and various regional and state levels, rules are in effect or policies are under development to regulate GHG emissions, thereby effectively putting a cost on such emissions in order to create financial incentives to reduce them. In
2013
, the Company’s subsidiaries operated businesses which had total CO
2
emissions of approximately 72.1 million metric tonnes, approximately 40.6 million of which were emitted by businesses located in the United States (both figures ownership adjusted). The Company uses CO
2
emission estimation methodologies supported by “The Greenhouse Gas Protocol” reporting standard on GHG emissions. For existing power generation plants, CO
2
emissions data are either obtained directly from plant continuous emission monitoring systems or calculated from actual fuel heat inputs and fuel type CO
2
emission factors. The estimated annual CO
2
emissions from fossil fuel electric power generation facilities of the Company’s subsidiaries that are in construction or development and have received the necessary air permits for commercial operations are approximately 19.3 million metric tonnes (ownership adjusted). This overall estimate is based on a number of projections and assumptions which may prove to be incorrect, such as the forecasted dispatch, anticipated plant efficiency, fuel type, CO
2
emissions rates and our subsidiaries’ achieving completion of such construction and development projects. However, it is certain that the projects under construction or development when completed will increase emissions of our portfolio and therefore could increase the risks associated with regulation of GHG emissions. Because there is significant uncertainty regarding these estimates, actual emissions from these projects under construction or development may vary substantially from these estimates.
The non-utility, generation subsidiaries of the Company often seek to pass on any costs arising from CO
2
emissions to contract counterparties, but there can be no assurance that such subsidiaries of the Company will effectively pass such costs onto the contract counterparties or that the cost and burden associated with any dispute over which party bears such costs would not be burdensome and costly to the relevant subsidiaries of the Company. The utility subsidiaries of the Company may
65
seek to pass on any costs arising from CO
2
emissions to customers, but there can be no assurance that such subsidiaries of the Company will effectively pass such costs to the customers, or that they will be able to fully or timely recover such costs.
Foreign, federal, state or regional regulation of GHG emissions could have a material adverse impact on the Company’s financial performance. The actual impact on the Company’s financial performance and the financial performance of the Company’s subsidiaries will depend on a number of factors, including among others, the degree and timing of GHG emissions reductions required under any such legislation or regulations, the cost of emissions reduction equipment and the price and availability of offsets, the extent to which market based compliance options are available, the extent to which our subsidiaries would be entitled to receive GHG emissions allowances without having to purchase them in an auction or on the open market and the impact of such legislation or regulation on the ability of our subsidiaries to recover costs incurred through rate increases or otherwise. As a result of these factors, our cost of compliance could be substantial and could have a material adverse impact on our results of operations.
In January 2005, based on European Community “Directive 2003/87/EC on Greenhouse Gas Emission Allowance Trading,” the European Union Greenhouse Gas Emission Trading Scheme (“EU ETS”) commenced operation as the largest multi-country GHG emission trading scheme in the world. On February 16, 2005, the Kyoto Protocol became effective. The Kyoto Protocol requires all developed countries that have ratified it to substantially reduce their GHG emissions, including CO
2
. To date, compliance with the Kyoto Protocol and the EU ETS has not had a material adverse effect on the Company’s consolidated results of operations, financial condition and cash flows.
The United States has not ratified the Kyoto Protocol. In the United States, there currently is no federal legislation imposing a mandatory GHG emission reduction programs (including for CO
2
) affecting the electric power generation facilities of the Company’s subsidiaries. However, the EPA has adopted regulations pertaining to GHG emissions that require new sources of GHG emissions of over 100,000 tons per year, and existing sources planning physical changes that would increase their GHG emissions by more than 75,000 tons per year, to obtain new source review permits from the EPA prior to construction or modification. Additionally, the EPA has proposed a rule establishing New Source Performance Standards for CO
2
emissions for newly constructed fossil-fueled electric utility steam generating units ("EUSGUs") larger than 25 MW. The EPA is expected to propose regulations that would apply to modified or existing EUSGUs by June 2014. For further discussion of the regulation of GHG emission, see
"
Item 1. Business
— Environmental and Land Use Regulations — United States Environmental and Land Use Legislation and Regulations — Greenhouse Gas Emissions"
above
Such regulations, and in particular regulations applying to modified or existing EUSGUs, could increase our costs directly and indirectly and have a material adverse effect on our business and/or results of operations. See Item 1.—Business of this Form 10-K for further discussion about these environmental agreements, laws and regulations.
At the state level, the Regional Greenhouse Gas Initiative ("RGGI"), a cap-and-trade program covering CO
2
emissions from electric power generation facilities in the Northeast, became effective in January 2009, and California has adopted comprehensive legislation and regulations that requires mandatory GHG reductions from several industrial sectors, including the electric power generation industry. At this time, other than with regard to RGGI (further described below) and proposed Hawaii regulations relating to the collection of fees on GHG emissions, the impact of both of which we do not expect to be material, the Company cannot estimate the costs of compliance with United States federal, regional or state CO
2
emissions reduction legislation or initiatives, due to the fact that most of these proposals are not being actively pursued or are in the early stages of development and any final regulations or laws, if adopted, could vary drastically from current proposals; in the case of California, we anticipate no material impact due to the fact that we expect such costs will be passed through to our offtakers under the terms of existing tolling agreements.
The RGGI program became effective in January 2009. The first regional auction of RGGI allowances needed to be acquired by power generators to comply with state programs implementing RGGI was held in September 2008, with subsequent auctions occurring approximately every quarter. Our subsidiary in Maryland is our only subsidiary that was subject to RGGI in
2013
. Of the approximately 40.6 million metric tonnes of CO
2
emitted in the United States by our subsidiaries in
2013
(ownership adjusted), approximately 1.5 million metric tonnes were emitted by our subsidiary in Maryland. The Company estimates that the RGGI compliance costs could be approximately $3.2 million for
2014
. There is a risk that our actual compliance costs under RGGI will differ from our estimates by a material amount and that our model could underestimate our costs of compliance.
In addition to government regulators, other groups such as politicians, environmentalists and other private parties have expressed increasing concern about GHG emissions. For example, certain financial institutions have expressed concern about providing financing for facilities which would emit GHGs, which can affect our ability to obtain capital, or if we can obtain capital, to receive it on commercially viable terms. Further, rating agencies may decide to downgrade our credit ratings based on the emissions of the businesses operated by our subsidiaries or increased compliance costs which could make financing
66
unattractive. In addition, plaintiffs have brought tort lawsuits against the Company because of its subsidiaries’ GHG emissions. Unless the United States Congress acts to preempt such suits as part of comprehensive federal legislation, additional lawsuits may be brought against the Company or its subsidiaries in the future. While the litigation mentioned has been dismissed, it is impossible to predict whether similar future lawsuits are likely to prevail or result in damages awards or other relief. Consequently, it is impossible to determine whether such lawsuits are likely to have a material adverse effect on the Company’s consolidated results of operations and financial condition.
Furthermore, according to the Intergovernmental Panel on Climate Change, physical risks from climate change could include, but are not limited to, increased runoff and earlier spring peak discharge in many glacier and snow-fed rivers, warming of lakes and rivers, an increase in sea level, changes and variability in precipitation and in the intensity and frequency of extreme weather events. Physical impacts may have the potential to significantly affect the Company’s business and operations, and any such potential impact may render it more difficult for our businesses to obtain financing. For example, extreme weather events could result in increased downtime and operation and maintenance costs at the electric power generation facilities and support facilities of the Company’s subsidiaries. Variations in weather conditions, primarily temperature and humidity also would be expected to affect the energy needs of customers. A decrease in energy consumption could decrease the revenues of the Company’s subsidiaries. In addition, while revenues would be expected to increase if the energy consumption of customers increased, such increase could prompt the need for additional investment in generation capacity. Changes in the temperature of lakes and rivers and changes in precipitation that result in drought could adversely affect the operations of the fossil fuel-fired electric power generation facilities of the Company’s subsidiaries. Changes in temperature, precipitation and snow pack conditions also could affect the amount and timing of hydroelectric generation.
In addition to potential physical risks noted by the Intergovernmental Panel on Climate Change, there could be damage to the reputation of the Company and its subsidiaries due to public perception of GHG emissions by the Company’s subsidiaries, and any such negative public perception or concerns could ultimately result in a decreased demand for electric power generation or distribution from our subsidiaries. The level of GHG emissions made by subsidiaries of the Company is not a factor in the compensation of executives of the Company.
If any of the foregoing risks materialize, costs may increase or revenues may decrease and there could be a material adverse effect on the electric power generation businesses of the Company’s subsidiaries and on the Company’s consolidated results of operations, financial condition and cash flows.
Tax legislation initiatives or challenges to our tax positions could adversely affect our results of operations and financial condition.
Our subsidiaries have operations in the United States and various non-United States jurisdictions. As such, we are subject to the tax laws and regulations of the United States federal, state and local governments and of many non-United States jurisdictions. From time to time, legislative measures may be enacted that could adversely affect our overall tax positions regarding income or other taxes. There can be no assurance that our effective tax rate or tax payments will not be adversely affected by these legislative measures. In addition, United States federal, state and local, as well as non-United States, tax laws and regulations are extremely complex and subject to varying interpretations. There can be no assurance that our tax positions will be sustained if challenged by relevant tax authorities and if not sustained, there could be a material impact on our results of operations.
We and our affiliates are subject to material litigation and regulatory proceedings.
We and our affiliates are parties to material litigation and regulatory proceedings. See Item 3.—Legal Proceedings below. There can be no assurances that the outcome of such matters will not have a material adverse effect on our consolidated financial position.
|
ITEM 1B.
|
UNRESOLVED STAFF COMMENTS
|
None.
We maintain offices in many places around the world, generally pursuant to the provisions of long—and short-term leases, none of which we believe are material. With a few exceptions, our facilities, which are described in Item 1 of this Form 10-K, are subject to mortgages or other liens or encumbrances as part of the project’s related finance facility. In addition, the majority of our facilities are located on land that is leased. However, in a few instances, no accompanying project financing exists for the facility, and in a few of these cases, the land interest may not be subject to any encumbrance and is owned outright by the subsidiary or affiliate.
67
The Company is involved in certain claims, suits and legal proceedings in the normal course of business. The Company has accrued for litigation and claims where it is probable that a liability has been incurred and the amount of loss can be reasonably estimated. The Company believes, based upon information it currently possesses and taking into account established reserves for estimated liabilities and its insurance coverage, that the ultimate outcome of these proceedings and actions is unlikely to have a material adverse effect on the Company’s financial statements. It is reasonably possible, however, that some matters could be decided unfavorably to the Company and could require the Company to pay damages or make expenditures in amounts that could be material but cannot be estimated as of
December 31, 2013
.
In 1989, Centrais Elétricas Brasileiras S.A. (“Eletrobrás”) filed suit in the Fifth District Court in the State of Rio de Janeiro (“FDC”) against Eletropaulo Eletricidade de São Paulo S.A. (“EEDSP”) relating to the methodology for calculating monetary adjustments under the parties’ financing agreement. In April 1999, the FDC found for Eletrobrás and in September 2001, Eletrobrás initiated an execution suit in the FDC to collect approximately
R$1.43 billion
(
$605 million
) from Eletropaulo (as estimated by Eletropaulo) and a lesser amount from an unrelated company, Companhia de Transmissão de Energia Elétrica Paulista (“CTEEP”) (Eletropaulo and CTEEP were spun off of EEDSP pursuant to its privatization in 1998). In November 2002, the FDC rejected Eletropaulo’s defenses in the execution suit. On appeal, the case was remanded to the FDC for further proceedings. In December 2012, the FDC issued a decision that Eletropaulo is liable for the debt. However, that decision was annulled on appeal and the case was remanded to the FDC for further proceedings. On remand at the FDC, an accounting expert will issue a report on the amount of the alleged debt and the responsibility for its payment in light of the privatization. The parties will be entitled to take discovery and present arguments on the issues to be determined by the expert. If the FDC again finds Eletropaulo liable for the debt, after the amount of the alleged debt is determined, Eletrobrás will be entitled to resume the execution suit in the FDC. If Eletrobrás does so, Eletropaulo will be required to provide security for its alleged liability. In that case, if Eletrobrás requests the seizure of such security and the FDC grants such request, Eletropaulo’s results of operations may be materially adversely affected and, in turn the Company’s results of operations could be materially adversely affected. In addition, in February 2008, CTEEP filed a lawsuit in the FDC against Eletrobrás and Eletropaulo seeking a declaration that CTEEP is not liable for any debt under the financing agreement. Eletropaulo believes it has meritorious defenses to the claims asserted against it and will defend itself vigorously in these proceedings; however, there can be no assurances that it will be successful in its efforts.
In September 1996, a public civil action was asserted against Eletropaulo and Associação Desportiva Cultural Eletropaulo (the “Associação”) relating to alleged environmental damage caused by construction of the Associação near Guarapiranga Reservoir. The initial decision that was upheld by the Appellate Court of the State of São Paulo in 2006 found that Eletropaulo should repair the alleged environmental damage by demolishing certain construction and reforesting the area, and either sponsor an environmental project which would cost approximately
R$1.5 million
(
$635 thousand
) as of
December 31, 2012
, or pay an indemnification amount of approximately
R$15 million
(
$6 million
). Eletropaulo has appealed this decision to the Supreme Court and the Supreme Court affirmed the decision of the Appellate Court. Following the Supreme Court’s decision, the case is being remanded to the court of first instance for further proceedings and to monitor compliance by the defendants with the terms of the decision.
In December 2001, Gridco Ltd. ("Gridco") served a notice to arbitrate pursuant to the Indian Arbitration and Conciliation Act of 1996 on the Company, AES Orissa Distribution Private Limited (“AES ODPL”), and Jyoti Structures (“Jyoti”) pursuant to the terms of the shareholders agreement between Gridco, the Company, AES ODPL, Jyoti and the Central Electricity Supply Company of Orissa Ltd. ("CESCO"), an affiliate of the Company. In the arbitration, Gridco asserted that a comfort letter issued by the Company in connection with the Company's indirect investment in CESCO obligates the Company to provide additional financial support to cover all of CESCO's financial obligations to Gridco. Gridco appeared to be seeking approximately
$189 million
in damages, plus undisclosed penalties and interest, but a detailed alleged damage analysis was not filed by Gridco. The Company counterclaimed against Gridco for damages. In June 2007, a 2-to-1 majority of the arbitral tribunal rendered its award rejecting Gridco’s claims and holding that none of the respondents, the Company, AES ODPL, or Jyoti, had any liability to Gridco. The respondents’ counterclaims were also rejected. A majority of the tribunal later awarded the respondents, including the Company, some of their costs relating to the arbitration. Gridco has filed challenges of the tribunal's awards with the local Indian court. Those challenges remain pending. The Company believes that it has meritorious defenses to the claims asserted against it and will defend itself vigorously in these proceedings; however, there can be no assurances that it will be successful in its efforts.
In March 2003, the office of the Federal Public Prosecutor for the State of São Paulo, Brazil (“MPF”) notified Eletropaulo that it had commenced an inquiry into the BNDES financings provided to AES Elpa and AES Transgás, the rationing loan provided to Eletropaulo, changes in the control of Eletropaulo, sales of assets by Eletropaulo, and the quality of service provided by Eletropaulo to its customers. The MPF requested various documents from Eletropaulo relating to these
68
matters. In July 2004, the MPF filed a public civil lawsuit in the Federal Court of São Paulo (“FCSP”) alleging that BNDES violated Law 8429/92 (the Administrative Misconduct Act) and BNDES’s internal rules by: (1) approving the AES Elpa and AES Transgás loans; (2) extending the payment terms on the AES Elpa and AES Transgás loans; (3) authorizing the sale of Eletropaulo’s preferred shares at a stock-market auction; (4) accepting Eletropaulo’s preferred shares to secure the loan provided to Eletropaulo; and (5) allowing the restructurings of Light Serviços de Eletricidade S.A. and Eletropaulo. The MPF also named AES Elpa and AES Transgás as defendants in the lawsuit because they allegedly benefited from BNDES’s alleged violations. In May 2006, the FCSP ruled that the MPF could pursue its claims based on the first, second, and fourth alleged violations noted above. The MPF subsequently filed an interlocutory appeal with the Federal Court of Appeals (“FCA”) seeking to require the FCSP to consider all five alleged violations. Also, in July 2006, AES Elpa and AES Transgás filed an interlocutory appeal with the FCA, which was subsequently consolidated with the MPF’s interlocutory appeal, seeking a transfer of venue and to enjoin the FCSP from considering any of the alleged violations. In June 2009, the FCA granted the injunction sought by AES Elpa and AES Transgás and transferred the case to the Federal Court of Rio de Janeiro. In May 2010, the MPF filed an appeal with the Superior Court of Justice (“SCJ”) challenging the transfer. In November 2012, the SCJ ruled that the lawsuit must be returned to the FCSP. AES Elpa and AES Brasiliana (the successor of AES Transgás) believe they have meritorious defenses to the allegations asserted against them and will defend themselves vigorously in these proceedings; however, there can be no assurances that they will be successful in their efforts.
Pursuant to their environmental audit, AES Sul and AES Florestal discovered 200 barrels of solid creosote waste and other contaminants at a pole factory that AES Florestal had been operating. The conclusion of the audit was that a prior operator of the pole factory, Companhia Estadual de Energia (“CEEE”), had been using those contaminants to treat the poles that were manufactured at the factory. On their initiative, AES Sul and AES Florestal communicated with Brazilian authorities and CEEE about the adoption of containment and remediation measures. In March 2008, the State Attorney of the State of Rio Grande do Sul, Brazil filed a public civil action against AES Sul, AES Florestal and CEEE seeking an order requiring the companies to recover the contaminated area located on the grounds of the pole factory and an indemnity payment (approximately
R$6 million
(
$3 million
)) to the State’s Environmental Fund. In October 2011, the State Attorney Office filed a request for an injunction ordering the defendant companies to remediate the contaminated area immediately. The court granted injunctive relief on October 18, 2011, but determined only that defendant CEEE was required to proceed with the remediation work. In May 2012, CEEE began the remediation work in compliance with the injunction. The remediation costs are estimated to be approximately
R$60 million
(
$25 million
) and the work is ongoing. The case is in the evidentiary stage awaiting the production of the court’s expert opinion on several matters, including which of the parties had utilized the products found in the area. The Company believes that it has meritorious defenses to the claims asserted against it and will defend itself vigorously in these proceedings; however, there can be no assurances that it will be successful in its efforts.
In January 2004, the Company received notice of a “Formulation of Charges” filed against the Company by the Superintendence of Electricity of the Dominican Republic. In the “Formulation of Charges,” the Superintendence asserts that the existence of three generation companies (Empresa Generadora de Electricidad Itabo, S.A. (“Itabo”), Dominican Power Partners, and AES Andres BV) and one distribution company (Empresa Distribuidora de Electricidad del Este, S.A. (“Este”)) in the Dominican Republic, violates certain cross-ownership restrictions contained in the General Electricity Law of the Dominican Republic. In February 2004, the Company filed in the First Instance Court of the National District of the Dominican Republic an action seeking injunctive relief based on several constitutional due process violations contained in the “Formulation of Charges” (“Constitutional Injunction”). In February 2004, the Court granted the Constitutional Injunction and ordered the immediate cessation of any effects of the “Formulation of Charges,” and the enactment by the Superintendence of Electricity of a special procedure to prosecute alleged antitrust complaints under the General Electricity Law. In March 2004, the Superintendence of Electricity appealed the Court’s decision. In July 2004, the Company divested any interest in Este. The Superintendence of Electricity’s appeal remains pending. The Company believes it has meritorious defenses to the claims asserted against it and will defend itself vigorously in these proceedings; however, there can be no assurances that it will be successful in its efforts.
In March 2009, AES Uruguaiana Empreendimentos S.A. (“AESU”) in Brazil initiated arbitration in the International Chamber of Commerce (“ICC”) against YPF S.A. (“YPF”) seeking damages and other relief relating to YPF’s breach of the parties’ gas supply agreement (“GSA”). Thereafter, in April 2009, YPF initiated arbitration in the ICC against AESU and two unrelated parties, Companhia de Gas do Estado do Rio Grande do Sul and Transportador de Gas del Mercosur S.A. (“TGM”), claiming that AESU wrongfully terminated the GSA and caused the termination of a transportation agreement (“TA”) between YPF and TGM (“YPF Arbitration”). YPF sought an unspecified amount of damages from AESU, a declaration that YPF’s performance was excused under the GSA due to certain alleged force majeure events, or, in the alternative, a declaration that the GSA and the TA should be terminated without a finding of liability against YPF because of the allegedly onerous obligations imposed on YPF by those agreements. In addition, in the YPF Arbitration, TGM asserted that if it was determined that AESU was responsible for the termination of the GSA, AESU was liable for TGM’s alleged losses, including losses under the TA. In April 2011, the arbitrations were consolidated into a single proceeding. The hearing on liability issues took place in
69
December 2011. In May 2013, the arbitral Tribunal issued a liability award in AESU's favor. YPF thereafter challenged the award in Argentine court. That challenge is pending. Also, after it issued the liability award, the arbitral Tribunal temporarily suspended the next phase of the arbitration on damages issues, but the Tribunal subsequently lifted that suspension. AESU has made its initial submission on damages. The Tribunal has advised that the final evidentiary hearing will take place in December 2014. AESU believes it has meritorious claims and defenses and will assert them vigorously; however, there can be no assurances that it will be successful in its efforts.
In April 2009, the Antimonopoly Agency in Kazakhstan initiated an investigation of the power sales of Ust-Kamenogorsk HPP (“UK HPP”) and Shulbinsk HPP, hydroelectric plants under AES concession (collectively, the “Hydros”), for the period of January-February 2009. The Antimonopoly Agency determined that the Hydros abused their market position and charged monopolistically high prices for power from January-February 2009. The Agency sought an order from the administrative court requiring UK HPP to pay an administrative fine of approximately KZT
120 million
(
$1 million
) and to disgorge profits for the period at issue, estimated by the Antimonopoly Agency to be approximately KZT
440 million
(
$3 million
). No fines or damages have been paid to date, however, as the proceedings in the administrative court have been suspended due to the initiation of related criminal proceedings against officials of the Hydros. In the course of criminal proceedings, the financial police have expanded the periods at issue to the entirety of 2009 in the case of UK HPP and from January-October 2009 in the case of Shulbinsk HPP, and sought increased damages of KZT
1.2 billion
(
$8 million
) from UK HPP and KZT
1.3 billion
(
$8 million
) from Shulbinsk HPP. The Hydros believe they have meritorious defenses and will assert them vigorously in these proceedings; however, there can be no assurances that they will be successful in their efforts.
In October 2009, AES Merida III, S. de R.L. de C.V. (AES Merida), one of our businesses in Mexico, initiated arbitration against its fuel supplier and electricity offtaker, Comisión Federal de Electricidad (“CFE”), seeking a declaration that CFE breached the parties’ power purchase agreement (“PPA”) by supplying gas that did not comply with the PPA’s specifications. Alternatively, AES Merida requested a declaration that the supply of such gas by CFE is a force majeure event under the PPA. CFE disputed the claims. Although it did not assert counterclaims, in its closing brief CFE asserted that it is entitled to a partial refund of the capacity charge payments that it made for power generated with the out-of-specification gas. In July 2012, the arbitral Tribunal issued an award in AES Merida’s favor. In December 2012, CFE initiated an action in Mexican court seeking to nullify the award. That action remains pending. AES Merida has opposed the request and asserted a counterclaim to confirm the award. AES Merida believes it has meritorious defenses in that action; however, there can be no assurances that it will be successful.
In October 2009, IPL received a Notice of Violation (“NOV”) and Finding of Violation from the EPA pursuant to the Clean Air Act (“CAA”) Section 113(a). The NOV alleges violations of the CAA at IPL’s three primarily coal-fired electric generating facilities dating back to 1986. The alleged violations primarily pertain to the Prevention of Significant Deterioration and nonattainment New Source Review requirements under the CAA. Since receiving the letter, IPL management has met with EPA staff regarding possible resolutions of the NOV. At this time, we cannot predict the ultimate resolution of this matter. However, settlements and litigated outcomes of similar cases have required companies to pay civil penalties, install additional pollution control technology on coal-fired electric generating units, retire existing generating units, and invest in additional environmental projects. A similar outcome in this case could have a material impact to IPL and could, in turn, have a material impact on the Company. IPL would seek recovery of any operating or capital expenditures related to air pollution control technology to reduce regulated air emissions; however, there can be no assurances that it would be successful in that regard.
In November 2009, April 2010, December 2010, April 2011, June 2011, August 2011, and November 2011, substantially similar personal injury lawsuits were filed by a total of 49 residents and decedent estates in the Dominican Republic against the Company, AES Atlantis, Inc., AES Puerto Rico, LP, AES Puerto Rico, Inc., and AES Puerto Rico Services, Inc., in the Superior Court for the State of Delaware. In each lawsuit, the plaintiffs allege that the coal combustion byproducts of AES Puerto Rico’s power plant were illegally placed in the Dominican Republic from October 2003 through March 2004 and subsequently caused the plaintiffs’ birth defects, other personal injuries, and/or deaths. The plaintiffs did not quantify their alleged damages, but generally alleged that they are entitled to compensatory and punitive damages. The Company is not able to estimate damages, if any, at this time. The AES defendants moved for partial dismissal of both the November 2009 and April 2010 lawsuits on various grounds. In July 2011, the Superior Court dismissed the plaintiffs’ international law and punitive damages claims, but held that the plaintiffs had stated intentional tort, negligence, and strict liability claims under Dominican law, which the Superior Court found governed the lawsuits. The Superior Court granted the plaintiffs leave to amend their complaints in accordance with its decision, and in September 2011, the plaintiffs in the November 2009 and April 2010 lawsuits did so. In November 2011, the AES defendants again moved for partial dismissal of those amended complaints, and in both lawsuits, the Superior Court dismissed the plaintiffs' claims for future medical monitoring expenses but declined to dismiss their claims under Dominican Republic Law 64-00. The AES defendants filed an answer to the November 2009 lawsuit in June 2012. The Superior Court has stayed the remaining six lawsuits, as well as any subsequently filed similar lawsuits. The Superior Court has also ordered that, for the present, discovery will proceed only in the November 2009 lawsuit and will be limited to causation
70
and exposure issues. The AES defendants believe they have meritorious defenses and will defend themselves vigorously; however, there can be no assurances that they will be successful in their efforts.
On December 21, 2010, AES-3C Maritza East 1 EOOD, which owns a 670 MW lignite-fired power plant in Bulgaria, made the first in a series of demands on the performance bond securing the construction Contractor’s obligations under the parties’ EPC Contract. The Contractor failed to complete the plant on schedule. The total amount demanded by Maritza under the performance bond was approximately €155 million. The Contractor obtained an injunction from a lower French court purportedly preventing the issuing bank from honoring the bond demands. However, the Versailles Court of Appeal canceled the injunction in July 2011, and therefore the issuing bank paid the bond demands in full. In addition, in December 2010, the Contractor stopped commissioning of the power plant’s two units, allegedly because of the purported characteristics of the lignite supplied to it for commissioning. In January 2011, the Contractor initiated arbitration on its lignite claim, seeking an extension of time to complete the power plant, an increase to the contract price, and other relief, including in relation to the bond demands. The Contractor later added claims relating to the alleged unavailability of the grid during commissioning. Maritza rejected the Contractor’s claims and asserted counterclaims for delay liquidated damages and other relief relating to the Contractor’s failure to complete the power plant and other breaches of the EPC Contract. Maritza also terminated the EPC Contract for cause and asserted arbitration claims against the Contractor relating to the termination. The Contractor asserted counterclaims relating to the termination. The Contractor is seeking approximately
€240 million
(
$330 million
) in the arbitration, unspecified damages for alleged injury to reputation, and other relief. The arbitral hearing took place on November 27-December 6, 2013, and on January 6-17, 2014. The parties will make final written and oral submissions later this year. Maritza believes it has meritorious claims and defenses and will assert them vigorously in these proceedings; however, there can be no assurances that it will be successful in its efforts.
On February 11, 2011, Eletropaulo received a notice of violation from São Paulo State’s Environmental Authorities for allegedly destroying 0.32119 hectares of native vegetation at the Conservation Park of Serra do Mar (“Park”), without previous authorization or license. The notice of violation asserted a fine of approximately
R$1 million
(
$423 thousand
) and the suspension of Eletropaulo activities in the Park. As a response to this administrative procedure before the São Paulo State Environmental Authorities (“São Paulo EA”), Eletropaulo timely presented its defense on February 28, 2011 seeking to vacate the notice of violation or reduce the fine. In December 2011, the São Paulo EA declined to vacate the notice of violation but recognized the possibility of 40% reduction in the fine if Eletropaulo agrees to recover the affected area with additional vegetation. Eletropaulo has not appealed the decision and is now discussing the terms of a possible settlement with the São Paulo EA, including a plan to recover the affected area by primarily planting additional trees. In March 2012, the State of São Paulo Prosecutor’s Office of São Bernardo do Campo initiated a Civil Proceeding to review the compliance by Eletropaulo with the terms of any possible settlement. Eletropaulo has had several meetings and field inspections to settle the details of the recovery project. Eletropaulo was informed by the Park Administrator that the area where the recovery project was to be located was no longer available. The Park Administrator subsequently approved a new area for the recovery project, subject to approval of the current owner, which Eletropaulo is seeking. Eletropaulo is also considering alternatives to recover the damage other than reforestation.
In February 2011, a consumer protection group, S.O.S. Consumidores (“SOSC”), filed a lawsuit in the State of São Paulo Federal Court against the Brazilian Regulatory Agency (“ANEEL”), Eletropaulo and all other distribution companies in the State of São Paulo, claiming that the distribution companies had overcharged customers for electricity. SOSC asserted that the distribution companies’ tariffs had been incorrectly calculated by ANEEL, and that the tariffs were required to be corrected from the effective dates of the relevant concession contracts. SOSC asserted that ANEEL erred in May 2010, when the agency corrected the alleged error going forward but declared that the tariff calculations made in the past were correct. Eletropaulo opposed the lawsuit on the ground that it had not wrongfully collected amounts from its customers, as its tariffs had been calculated in accordance with the concession contract with the Federal Government and ANEEL’s rules. Subsequently, the lawsuit was transferred to the Federal Court of Belo Horizonte ("FCBH"), which was presiding over similar lawsuits against other distribution companies and ANEEL. In January 2014, the FCBH dismissed the lawsuit against Eletropaulo and the other distribution companies. SOSC may appeal. Even if it does not, SOSC's lawsuit will continue against ANEEL. If SOSC ultimately prevails against the agency, it is possible that SOSC may file a lawsuit against Eletropaulo seeking refunds. Eletropaulo estimates that its liability to customers could be approximately
R$855 million
(
$362 million
). Eletropaulo believes it has meritorious defenses and will defend itself vigorously in this lawsuit; however, there can be no assurances that it will be successful in its efforts.
In June 2011, the São Paulo Municipal Tax Authority (the “Municipality”) filed 60 tax assessments in São Paulo administrative court against Eletropaulo, seeking approximately
R$1.2 billion
(
$508 million
) in services tax (“ISS”) that allegedly had not been collected on revenues for services rendered by Eletropaulo. Eletropaulo challenged the assessments on the ground that the revenues at issue were not subject to ISS. In October 2013, the First Instance Administrative Court determined that Eletropaulo is liable for approximately
R$1.03 billion
(
$436 million
) in ISS and related penalties. Eletropaulo has appealed to the Second Instance Administrative Court. Eletropaulo believes it has meritorious defenses to the assessments
71
and will defend itself vigorously in these proceedings; however, there can be no assurances that it will be successful in its efforts.
In January 2012, the Brazil Federal Tax Authority issued an assessment alleging that AES Tietê paid PIS and COFINS taxes from 2007 to 2010 at a lower rate than the tax authority believed was applicable. AES Tietê challenged the assessment on the ground that the tax rate was set in the applicable legislation. In April 2013, the First Instance Administrative Court determined that AES Tietê should calculate the taxes at the higher rate and that AES Tietê was liable for
R$829 million
(
$351 million
) in unpaid taxes, interest and penalties. AES Tietê has filed an appeal to the Second Instance Administrative Court and no tax is due while the appeal is pending. AES Tietê believes it has meritorious defenses to the claim and will defend itself vigorously in these proceedings; however, there can be no assurances that it will be successful in its efforts.
In August 2012, Fondo Patrimonial de las Empresas Reformadas (“FONPER”) (the Dominican instrumentality that holds the Dominican Republic’s shares in Empresa Generadora de Electricidad Itabo, S.A. (“Itabo”)) filed a criminal complaint against certain current and former employees of AES. The criminal proceedings include a related civil component initiated against Coastal Itabo, Ltd. (“Coastal”) (the AES affiliate shareholder of Itabo) and New Caribbean Investment, S.A. (“NCI”) (the AES affiliate that manages Itabo). FONPER asserts claims relating to the alleged mismanagement of Itabo and seeks approximately $270 million in damages. The Dominican District Attorney (“DA”) has admitted the criminal complaint and is investigating the allegations set forth therein. In September 2012, one of the individual defendants responded to the criminal complaint, denying the charges and seeking an immediate dismissal of same. In April 2013, the DA requested that the Dominican Camara de Cuentas ("Camara") perform an audit of the allegations in the criminal complaint. The audit is ongoing and the Camara has not issued its report to date. Further, in August 2012, Coastal and NCI initiated an international arbitration proceeding against FONPER and the Dominican Republic, seeking a declaration that Coastal and NCI have acted both lawfully and in accordance with the relevant contracts with FONPER and the Dominican Republic in relation to the management of Itabo. Coastal and NCI also seek a declaration that the criminal complaint is a breach of the relevant contracts between the parties, including the obligation to arbitrate disputes. Coastal and NCI further seek damages from FONPER and the Dominican Republic resulting from their breach of contract. FONPER and the Dominican Republic have denied the claims and challenged the jurisdiction of the arbitral tribunal. The tribunal has not yet established the procedural schedule for the arbitration. The AES defendants believe they have meritorious claims and defenses, which they will assert vigorously; however, there can be no assurance that they will be successful in their efforts.
In April 2013, the East Kazakhstan Ecology Department (“ED”) issued an order directing AES Ust-Kamenogorsk CHP ("UK CHP") to pay approximately KZT
720 million
(
$4.6 million
) in damages (“ED's April 2013 Order”). The ED claimed that UK CHP was illegally operating without an emissions permit for 27 days in February-March 2013. In June 2013, the ED filed a lawsuit with the Specialized Interregional Economic Court (the “Economic Court”) seeking to require UK CHP to pay the assessed damages. UK CHP thereafter filed a separate lawsuit with the Economic Court challenging the ED's April 2013 Order and ED's allegations. In August 2013, the Economic Court ruled in favor of UK CHP in the lawsuit filed by UK CHP and required the ED to vacate the ED's April 2013 Order. That ruling was upheld on intermediate appeal. The ED may appeal. The Economic Court also dismissed the lawsuit filed by the ED. UK CHP believes it has meritorious claims and defenses to the claims asserted against it and will defend itself vigorously in these proceedings; however, there can be no assurance that it will be successful in its efforts.
In December 2013, AES Changuinola’s EPC Contractor initiated arbitration pursuant to the parties’ EPC Contract and related settlement agreements. The Contractor alleges, among other things, that AES Changuinola has failed to make a settlement payment, release retainage, and acknowledge completion of AES Changuinola hydropower facility. In total, the Contractor seeks approximately $41 million in damages, plus interest and costs. AES Changuinola will contest the claims. AES Changuinola believes it has meritorious defenses which it will assert vigorously; however, there can be no assurance that it will be successful in its efforts.
Not applicable.
72
|
ITEM 5.
|
MARKET FOR REGISTRANT’S COMMON EQUITY, RELATED STOCKHOLDER MATTERS AND ISSUER PURCHASES OF EQUITY SECURITIES
|
Recent Sales of Unregistered Securities
None.
Purchases of Equity Securities by the Issuer and Affiliated Purchasers
Stock Repurchase Program
In December 2013 the Company’s Board of Directors approved an increase of
$211 million
to the stock repurchase program (the “Program”) under which the Company can repurchase AES common stock. The Board authorization permits the Company to repurchase stock through a variety of methods, including open market repurchases and/or privately negotiated transactions. There can be no assurances as to the amount, timing or prices of repurchases, which may vary based on market conditions and other factors. The Program does not have an expiration date and can be modified or terminated by the Board of Directors at any time. During the year ended
December 31, 2013
, shares of common stock repurchased under this plan totaled
25,297,042
at a total cost of
$322 million
which includes a nominal amount of commissions (average of
$12.73
per share including commissions), bringing the cumulative total purchases under the program to
94,728,430
shares at a total cost of
$1.1 billion
which includes a nominal amount of commissions (average of
$12.10
per share including commissions).
The following table presents information regarding purchases made by The AES Corporation of its common stock in the fourth quarter of
2013
.
|
Repurchase Period
|
Total Number of Shares Purchased
|
Average Price Paid Per Share
|
Total Number of Shares Repurchased as part of a Publicly Announced Purchase Plan (1)
|
Dollar Value of Maximum Number Of Shares To Be Purchased Under the Plan
|
||||||||||
|
10/1/2013 - 10/31/13
|
—
|
|
—
|
|
—
|
|
$
|
237,465,694
|
|
|||||
|
11/1/2013 - 11/30/13
|
—
|
|
—
|
|
—
|
|
237,465,694
|
|
||||||
|
12/1/2013 - 12/31/13
|
20,000,000
|
|
12.91
|
|
20,000,000
|
|
191,479,504
|
|
||||||
|
Total
|
20,000,000
|
|
$
|
12.91
|
|
20,000,000
|
|
|||||||
Market Information
Our common stock is currently traded on the New York Stock Exchange (“NYSE”) under the symbol “AES.” The closing price of our common stock as reported by the NYSE on February 18,
2014
, was $14.76, per share. The Company repurchased 25,297,042, 24,790,384 and 25,541,980 shares of its common stock in
2013
,
2012
and
2011
, respectively. The following tables set forth the high and low stock prices and cash dividends declared for the periods indicated:
|
|
2013
|
2012
|
|||||||||||||||||||||
|
|
Sales Prices
|
Cash Dividends
|
Sales Prices
|
Cash Dividends
|
|||||||||||||||||||
|
|
High
|
Low
|
Declared
|
High
|
Low
|
Declared
|
|||||||||||||||||
|
First Quarter
|
$
|
12.73
|
|
$
|
10.66
|
|
$
|
—
|
|
$
|
14.01
|
|
$
|
11.85
|
|
$
|
—
|
|
|||||
|
Second Quarter
|
14.00
|
|
11.17
|
|
0.08
|
|
13.25
|
|
11.64
|
|
—
|
|
|||||||||||
|
Third Quarter
|
13.77
|
|
11.62
|
|
—
|
|
12.94
|
|
10.83
|
|
0.04
|
|
|||||||||||
|
Fourth Quarter
|
15.54
|
|
13.16
|
|
0.09
|
|
11.25
|
|
9.52
|
|
0.04
|
|
|||||||||||
Dividends
We commenced a quarterly cash dividend of $0.04 per share beginning in the fourth quarter of 2012. During the fourth quarter of 2013, the Board of Directors voted to increase the quarterly dividend to $0.05 per share. There can be no assurance that the AES Board will declare the dividend or, if declared, the amount of any dividend.
Under the terms of our senior secured credit facility, which we entered into with a commercial bank syndicate, we have limitations on our ability to pay cash dividends and/or repurchase stock. Our project subsidiaries’ ability to declare and pay cash dividends to us is subject to certain limitations contained in the project loans, governmental provisions and other agreements to which our project subsidiaries are subject. See the information contained under Item 12.—Security Ownership of
73
Certain Beneficial Owners and Management and Related Stockholder Matters—
Securities Authorized for Issuance under Equity Compensation Plans
of this Form 10-K.
Holders
As of February 18,
2014
, there were approximately 5,529 record holders of our common stock.
Performance Graph
THE AES CORPORATION
PEER GROUP INDEX/STOCK PRICE PERFORMANCE
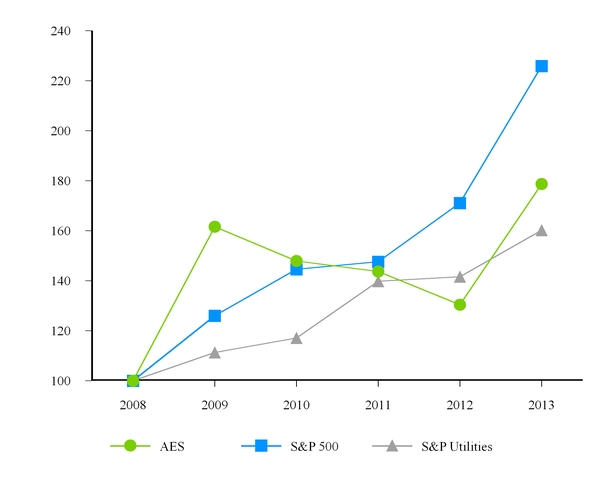
Source: Bloomberg
We have selected the Standard and Poor’s (“S&P”) 500 Utilities Index as our peer group index. The S&P 500 Utilities Index is a published sector index comprising the 31 electric and gas utilities included in the S&P 500.
The five year total return chart assumes $100 invested on December 31, 2008 in AES Common Stock, the S&P 500 Index and the S&P 500 Utilities Index. The information included under the heading “Performance Graph” shall not be considered “filed” for purposes of Section 18 of the Securities Exchange Act of 1934 or incorporated by reference in any filing under the Securities Act of 1933 or the Securities Exchange Act of 1934.
The following table sets forth our selected financial data as of the dates and for the periods indicated. You should read this data together with Item 7.—
Management’s Discussion and Analysis of Financial Condition and Results of Operations
and the Consolidated Financial Statements and the notes thereto included in Item 8.—
Financial Statements and Supplementary Data
of this Form 10-K. The selected financial data for each of the years in the five year period ended December 31, 2013 have been derived from our audited Consolidated Financial Statements. Prior period amounts have been restated to reflect discontinued operations in all periods presented. Our historical results are not necessarily indicative of our future results.
74
Acquisitions, disposals, reclassifications and changes in accounting principles affect the comparability of information included in the tables below. Please refer to the Notes to the Consolidated Financial Statements included in Item 8.—
Financial Statements and Supplementary Data
of this Form 10-K for further explanation of the effect of such activities. Please also refer to Item 1A.—
Risk Factors
of this Form 10-K and Note 26—Risks and Uncertainties to the Consolidated Financial Statements included in Item 8.—
Financial Statements and Supplementary Data
of this Form 10-K for certain risks and uncertainties that may cause the data reflected herein not to be indicative of our future financial condition or results of operations.
SELECTED FINANCIAL DATA
|
|
Year Ended December 31,
|
||||||||||||||||||
|
Statement of Operations Data
|
2013
|
2012
|
2011
(1)
|
2010
|
2009
|
||||||||||||||
|
|
(in millions, except per share amounts)
|
||||||||||||||||||
|
Revenue
|
$
|
15,891
|
|
$
|
17,164
|
|
$
|
16,098
|
|
$
|
14,644
|
|
$
|
12,038
|
|
||||
|
Income (loss) from continuing operations
(2)
|
730
|
|
(420
|
)
|
1,602
|
|
1,420
|
|
1,699
|
|
|||||||||
|
Income (loss) from continuing operations attributable to The AES Corporation, net of tax
|
284
|
|
(960
|
)
|
506
|
|
457
|
|
632
|
|
|||||||||
|
Discontinued operations, net of tax
|
(170
|
)
|
48
|
|
(448
|
)
|
(448
|
)
|
26
|
|
|||||||||
|
Net income (loss) attributable to The
AES Corporation
|
$
|
114
|
|
$
|
(912
|
)
|
$
|
58
|
|
$
|
9
|
|
$
|
658
|
|
||||
|
Per Common Share Data
|
|
|
|
|
|
||||||||||||||
|
Basic (loss) earnings per share:
|
|||||||||||||||||||
|
Income (loss) from continuing operations attributable to The AES Corporation, net of tax
|
$
|
0.38
|
|
$
|
(1.27
|
)
|
$
|
0.65
|
|
$
|
0.59
|
|
$
|
0.95
|
|
||||
|
Discontinued operations, net of tax
|
(0.23
|
)
|
0.06
|
|
(0.58
|
)
|
(0.58
|
)
|
0.04
|
|
|||||||||
|
Basic earnings (loss) per share
|
$
|
0.15
|
|
$
|
(1.21
|
)
|
$
|
0.07
|
|
$
|
0.01
|
|
$
|
0.99
|
|
||||
|
Diluted (loss) earnings per share:
|
|||||||||||||||||||
|
Income (loss) from continuing operations attributable to The AES Corporation, net of tax
|
$
|
0.38
|
|
$
|
(1.27
|
)
|
$
|
0.65
|
|
$
|
0.59
|
|
$
|
0.94
|
|
||||
|
Discontinued operations, net of tax
|
(0.23
|
)
|
0.06
|
|
(0.58
|
)
|
(0.58
|
)
|
0.04
|
|
|||||||||
|
Diluted earnings (loss) per share
|
$
|
0.15
|
|
$
|
(1.21
|
)
|
$
|
0.07
|
|
$
|
0.01
|
|
$
|
0.98
|
|
||||
|
Dividends Declared Per Common Share
|
$
|
0.17
|
|
0.08
|
|
—
|
|
—
|
|
—
|
|
||||||||
|
|
December 31,
|
||||||||||||||||||
|
Balance Sheet Data:
|
2013
|
2012
|
2011
(1)
|
2010
|
2009
|
||||||||||||||
|
|
(in millions)
|
||||||||||||||||||
|
Total assets
|
$
|
40,411
|
|
$
|
41,830
|
|
$
|
45,346
|
|
$
|
40,511
|
|
$
|
39,535
|
|
||||
|
Non-recourse debt (noncurrent)
|
13,318
|
|
12,265
|
|
13,261
|
|
10,986
|
|
11,454
|
|
|||||||||
|
Non-recourse debt (noncurrent)—Discontinued operations
|
124
|
|
322
|
|
1,369
|
|
1,558
|
|
1,410
|
|
|||||||||
|
Recourse debt (noncurrent)
|
5,551
|
|
5,951
|
|
6,180
|
|
4,149
|
|
5,301
|
|
|||||||||
|
Cumulative preferred stock of subsidiaries
|
78
|
|
78
|
|
78
|
|
60
|
|
60
|
|
|||||||||
|
Retained earnings (accumulated deficit)
|
(150
|
)
|
(264
|
)
|
678
|
|
620
|
|
650
|
|
|||||||||
|
The AES Corporation stockholders’ equity
|
4,330
|
|
4,569
|
|
5,946
|
|
6,473
|
|
4,675
|
|
|||||||||
|
(1)
|
DPL was acquired on November 28, 2011 and its results of operations have been included in AES’s consolidated results of operations from the date of acquisition. See Note 24—
Acquisitions and Dispositions
to the Consolidated Financial Statements included in Item 8.—
Financial Statements and Supplementary Data
of this Form 10-K for further information.
|
|
(2)
|
Includes pretax impairment of
$467 million
, $1.9 billion, $190 million, $325 million and $139 million for the years ended December 31, 2013, 2012, 2011, 2010 and 2009, respectively. See Note 10—
Goodwill and Other Intangible Assets
and Note 21—
Asset Impairment Expense
included in Item 8.—
Financial Statements and Supplementary Data
of this Form 10-K for further information.
|
Overview of Our Business
We are a diversified power generation and utility company organized into six market-oriented Strategic Business Units (“SBUs”): US (United States), Andes (Chile, Colombia, and Argentina), Brazil, MCAC (Mexico, Central America and the Caribbean), EMEA (Europe, Middle East and Africa), and Asia. For additional information regarding our business, see Item 1. —
Business
of this Form 10-K.
75
Our Organization
— The segment reporting structure uses the Company’s management reporting structure as its foundation to reflect how the Company manages the business internally and is organized by geographic regions which provide better socio-political-economic understanding of our business. The management reporting structure is organized along
six
strategic business units (“SBUs”) — led by our Chief Executive Officer (“CEO”). In 2012, the Company substantially completed its operational management and reporting restructuring. During the fourth quarter of 2013, the Company finalized its internal operational reporting and applied the accounting guidance for segment reporting. As a result, the Company has determined that its reportable segments are aligned with the six SBU's. Management’s discussion and analysis of Operating Margin, Adjusted Operating Margin and Adjusted Pre-Tax Contribution is organized according to the SBU structure as follows:
|
•
|
US SBU
|
|
•
|
Andes SBU
|
|
•
|
Brazil SBU
|
|
•
|
MCAC SBU
|
|
•
|
EMEA SBU
|
|
•
|
Asia SBU
|
Corporate and Other
— The Company’s corporate operations are reported within “Corporate and Other” because they do not require separate disclosure under segment reporting accounting guidance.
Key Topics in the Management Discussion and Analysis
Our discussion covers the following:
|
•
|
Overview of 2013 Results and Strategic Performance
|
|
•
|
Review of Consolidated Results of Operations
|
|
•
|
SBU Analysis and Non-GAAP Measures
|
|
•
|
Key Trends and Uncertainties
|
|
•
|
Capital Resources and Liquidity
|
Overview of
2013
Results and Strategic Performance
In 2013, our performance was driven by very dry hydrological conditions across key markets in Latin America, our cost reductions, capital allocation decisions, including debt repayment and share repurchases, and a lower effective tax rate.
Earnings Per Share Results in
2013
_____________________________
|
Year Ended December 31,
|
|||||||||||
|
2013
|
2012
|
2011
|
|||||||||
|
Diluted earnings per share from continuing operations
|
$
|
0.38
|
|
$
|
(1.27
|
)
|
$
|
0.65
|
|
||
|
Adjusted earnings per share (a non-GAAP measure)
(1)
|
$
|
1.29
|
|
$
|
1.21
|
|
$
|
1.11
|
|
||
|
(1)
|
See reconciliation and definition under Non-GAAP Measure.
|
Diluted earnings per share from continuing operations increased
$1.65
, to
$0.38
, principally due to lower goodwill impairment expense, lower income tax expense, lower foreign currency losses, and lower interest expense, partially offset by lower operating margin, an increase in losses on early extinguishment of debt, lower gain on sale of investments, higher losses from disposal and impairment of discontinued businesses, and higher other than temporary impairments of our equity method investments.
Adjusted earnings per share, a non-GAAP measure, increased by
7%
to
$1.29
primarily due to a lower effective tax rate, lower interest expense, and lower general and administrative expenses, partially offset by lower operating margin.
Management’s Priorities
Management is focused on the following priorities:
|
•
|
Management of our portfolio of Generation and Utility businesses to create value for our stakeholders, including customers and shareholders, through safe, reliable, and sustainable operations and effective cost management;
|
76
|
•
|
Driving our business to manage capital more effectively and to increase the amount of discretionary cash available for deployment into debt repayment, growth investments, shareholder dividends and share buybacks;
|
|
•
|
Realignment of our geographic focus. To this end, we will continue to exit markets where we do not have a competitive advantage or where we are unable to earn a fair risk-adjusted return relative to monetization alternatives. In addition, we will focus our growth investments on platform expansions or opportunities to expand our existing operations; and
|
|
•
|
Reduce the cash flow and earnings volatility of our businesses by proactively managing our currency, commodity and political risk exposures, mostly through contractual and regulatory mechanisms, as well as commercial hedging activities. We also will continue to limit our risk by utilizing non-recourse project financing for the majority of our businesses.
|
2013 Strategic Performance
We continued to execute on our strategic objectives of safe, reliable and sustainable operations, improvement of available capital and deployment of discretionary cash and realignment of our geographic focus. Key highlights of our progress during the
year ended
December 31, 2013
include:
Safe, Reliable and Sustainable Operations —
Our 2013 operating performance for the year was driven by the strategic management of our assets and cost reductions across our portfolio, but we also faced dry hydrological conditions across many markets in Latin America and challenges at two of our utilities in Brazil and the US.
We continue to focus on safety as our top priority. Our safety performance improved in 2013, as we lowered our lost-time incident case rates for both employees and operational contractors.
AES' strategic initiatives have resulted in both better operational availability and reliability of our generation portfolio, as measured by our Key Performance Indicators ("KPIs"). For example, our asset management program works to optimize the timing of plant maintenance by focusing on market pricing trends to minimize the costs of outages. This is evidenced by our performance in the Commercial Availability ("CA") KPI, as defined below, which improved 4%. Another strategic initiative focuses on the techniques of coal blending and using a variety of coals to improve margin. Coal blending can reduce the efficiency of certain generating units, which unfavorably affects our heat rate; however, it is offset by the financial benefits from utilizing lower-cost coal.
Our utility portfolio also recorded some improvements in KPIs for the year. Our dedication to providing reliable energy is evidenced by the improvement in our System Average Interruption Duration Index ("SAIDI") and System Average Interruption Frequency Index ("SAIFI"), which improved 15% and 24%, respectively, compared to 2012. SAIDI and SAIFI metrics benefited in 2013 from fewer significant weather events in the US and asset optimization in the US and Brazil, such as crew productivity improvement, tree-trimming, and pole replacement.
Our key performance indicators for 2013 and 2012 are as follows:
|
For the Years Ended December 31,
|
|||||||||
|
2013
|
2012
|
Variance 2012-2013
|
|||||||
|
Safety: Employee Lost-Time Incident Case Rate
|
.105
|
|
.108
|
|
3%
|
|
|||
|
Safety: Operational Contractor Lost-Time Incident Case Rate
|
.114
|
|
.173
|
|
34%
|
|
|||
|
Generation
|
|||||||||
|
Commercial Availability (%)
|
93.55
|
%
|
89.09
|
%
|
4.46
|
%
|
|||
|
Equivalent Forced Outage Factor (EFOF, %)
|
2.92
|
%
|
2.93
|
%
|
—
|
%
|
|||
|
Heat Rate (BTU/kWh)
|
9,638
|
|
9,476
|
|
(162
|
)
|
|||
|
Utility
|
|||||||||
|
System Average Interruption Duration Index (SAIDI, hours)
|
5.96
|
|
7.01
|
|
1.05
|
|
|||
|
System Average Interruption Frequency Index (SAIFI, number of interruptions)
|
2.97
|
|
3.93
|
|
0.96
|
|
|||
|
Non-Technical Losses (%)
|
2.52
|
%
|
2.19
|
%
|
(0.33
|
)%
|
|||
_________________________________________________
Definitions:
|
•
|
Lost-Time Incident Case Rate: Number of lost-time cases per number of full-time employees or contractors.
|
|
•
|
Commercial Availability: Actual variable margin, as a percentage of potential variable margin if the unit had been available at full capacity during outages.
|
|
•
|
Equivalent Forced Outage Factor: The percentage of the time that a plant is not capable of producing energy, due to unplanned operational reductions in production.
|
77
|
•
|
Heat Rate: The amount of energy used by an electrical generator or power plant to generate one kilowatt-hour (kWh).
|
|
•
|
System Average Interruption Duration Index: The total hours of interruption the average customer experiences annually.
|
|
•
|
System Average Interruption Frequency Index: The average number of interruptions the average customer experiences annually.
|
|
•
|
Non-Technical Losses: Delivered energy that was not billed due to measurement error, theft or other reasons.
|
We achieved the improvement in our KPIs while also reducing costs across our portfolio. Since 2011, we have reduced our general and administrative and business development costs at our corporate offices and our SBUs by $143 million.
While we made progress on our KPIs and cost cutting initiatives in 2013, generation in gigawatt-hours (GWh) decreased 4%, driven by dry hydrological conditions in many markets in Latin America. The impact of low water inflows on our generation was most significant in Panama, Colombia, and Brazil.
Finally, two of our utility businesses in Brazil and Ohio faced some challenges. In Brazil, Eletropaulo received a ruling on customer refunds in December 2013, which resulted in a $269 million regulatory liability recognized in the fourth quarter. AES owns 16% of Eletropaulo. See Item 1.
Brazil SBU — Eletropaulo — Eletropaulo Regulatory Asset Base Update
for further discussion.
In Ohio, DPL received a ruling on its ESP application to establish rates effective January 1, 2014. While the ruling allows for a non-bypassable charge through 2016, lower expectations for dark spreads and capacity prices present longer-term challenges for the business. As a result of these and other factors, DPL recorded a goodwill impairment of
$307 million
in the fourth quarter. See Item 1.
US SBU — DPL — Regulatory Matters
for further discussion of the ruling and Note 10.
Goodwill and Other Intangibles
for further discussion of the impairment.
Improving Available Capital and Deployment of Discretionary Cash
We continue to focus on improving cash generation and optimizing the use of our parent discretionary cash. During 2013, we generated $2.7 billion of cash flow from operating activities and closed multiple asset sales. In terms of uses, we deployed our discretionary cash to pay four quarterly dividends of $0.04 per share, allocated $322 million to repurchase 25 million shares (see Note 16. -
Equity
in Item 8. -
Financial Statements
of this Form 10-K for further information), allocated $464 million to reduce recourse debt and extend near-term maturities at the Parent Company, and invested $198 million in our subsidiaries for platform expansions and other purposes. The largest platform investments in 2013 included environmental upgrades at Indianapolis Power & Light facilities that will receive full recovery for qualifying costs, including a return on equity, and our expansion project at our Amman East facility in Jordan.
Realigning Our Geographic Focus
In 2013, we announced or closed 8 asset sale transactions, representing $497 million in equity proceeds to AES. With these transactions, we exited operations in Spain, China, Ukraine, and Trinidad, and we plan to exit Cameroon after the sale of our Cameroonian businesses closes in 2014. These asset sales are part of our strategy to drive shareholder value by exiting markets where we do not have a compelling competitive advantage and reinvesting capital into expanding our platforms.
Throughout 2013, we added 522 MW of new capacity, through four platform expansion projects. Our planned future capacity growth will come from a combination of projects currently under construction and development. We have 2,762 MW of new capacity under construction, including the 531 MW Alto Maipo hydroelectric project in Chile, which broke ground late in 2013. In addition, we have environmental upgrades of approximately 2,400 MW under construction at Indianapolis Power & Light (IPL). These projects are scheduled to come on-line through 2018.
78
Review of Consolidated Results of Operations
|
Years Ended December 31,
|
||||||||||||||||||
|
Results of operations
|
2013
|
2012
|
2011
|
% change 2013 vs. 2012
|
% change 2012 vs. 2011
|
|||||||||||||
|
($ in millions, except per share amounts)
|
||||||||||||||||||
|
Revenue:
|
||||||||||||||||||
|
US SBU
|
$
|
3,630
|
|
$
|
3,736
|
|
$
|
2,088
|
|
-3
|
%
|
79
|
%
|
|||||
|
Andes SBU
|
2,639
|
|
3,020
|
|
2,989
|
|
-13
|
%
|
1
|
%
|
||||||||
|
Brazil SBU
|
5,015
|
|
5,788
|
|
6,640
|
|
-13
|
%
|
-13
|
%
|
||||||||
|
MCAC SBU
|
2,713
|
|
2,573
|
|
2,327
|
|
5
|
%
|
11
|
%
|
||||||||
|
EMEA SBU
|
1,347
|
|
1,344
|
|
1,469
|
|
—
|
%
|
-9
|
%
|
||||||||
|
Asia SBU
|
550
|
|
733
|
|
625
|
|
-25
|
%
|
17
|
%
|
||||||||
|
Corporate and Other
|
7
|
|
9
|
|
8
|
|
-22
|
%
|
13
|
%
|
||||||||
|
Intersegment eliminations
|
(10
|
)
|
(39
|
)
|
(48
|
)
|
74
|
%
|
19
|
%
|
||||||||
|
Total Revenue
|
15,891
|
|
17,164
|
|
16,098
|
|
-7
|
%
|
7
|
%
|
||||||||
|
Operating Margin:
|
||||||||||||||||||
|
US SBU
|
$
|
668
|
|
$
|
711
|
|
$
|
395
|
|
-6
|
%
|
80
|
%
|
|||||
|
Andes SBU
|
533
|
|
580
|
|
743
|
|
-8
|
%
|
-22
|
%
|
||||||||
|
Brazil SBU
|
871
|
|
969
|
|
1,802
|
|
-10
|
%
|
-46
|
%
|
||||||||
|
MCAC SBU
|
543
|
|
560
|
|
512
|
|
-3
|
%
|
9
|
%
|
||||||||
|
EMEA SBU
|
415
|
|
504
|
|
395
|
|
-18
|
%
|
28
|
%
|
||||||||
|
Asia SBU
|
169
|
|
236
|
|
167
|
|
-28
|
%
|
41
|
%
|
||||||||
|
Corporate and Other
|
(16
|
)
|
(12
|
)
|
—
|
|
-33
|
%
|
NA
|
|
||||||||
|
Intersegment eliminations
|
64
|
|
35
|
|
26
|
|
83
|
%
|
35
|
%
|
||||||||
|
Total Operating Margin
|
3,247
|
|
3,583
|
|
4,040
|
|
-9
|
%
|
-11
|
%
|
||||||||
|
General and administrative expenses
|
(220
|
)
|
(274
|
)
|
(346
|
)
|
20
|
%
|
21
|
%
|
||||||||
|
Interest expense
|
(1,482
|
)
|
(1,544
|
)
|
(1,530
|
)
|
4
|
%
|
-1
|
%
|
||||||||
|
Interest income
|
275
|
|
348
|
|
398
|
|
-21
|
%
|
-13
|
%
|
||||||||
|
Loss on extinguishment of debt
|
(229
|
)
|
(8
|
)
|
(62
|
)
|
NM
|
|
87
|
%
|
||||||||
|
Other expense
|
(76
|
)
|
(82
|
)
|
(86
|
)
|
7
|
%
|
5
|
%
|
||||||||
|
Other income
|
125
|
|
98
|
|
142
|
|
28
|
%
|
-31
|
%
|
||||||||
|
Gain on sale of investments
|
26
|
|
219
|
|
8
|
|
-88
|
%
|
NM
|
|
||||||||
|
Goodwill impairment expense
|
(372
|
)
|
(1,817
|
)
|
(17
|
)
|
80
|
%
|
NM
|
|
||||||||
|
Asset impairment expense
|
(95
|
)
|
(73
|
)
|
(173
|
)
|
-30
|
%
|
58
|
%
|
||||||||
|
Foreign currency transaction losses
|
(22
|
)
|
(170
|
)
|
(32
|
)
|
87
|
%
|
-431
|
%
|
||||||||
|
Other non-operating expense
|
(129
|
)
|
(50
|
)
|
(82
|
)
|
-158
|
%
|
39
|
%
|
||||||||
|
Income tax expense
|
(343
|
)
|
(685
|
)
|
(656
|
)
|
50
|
%
|
-4
|
%
|
||||||||
|
Net equity in earnings (losses) of affiliates
|
25
|
|
35
|
|
(2
|
)
|
-29
|
%
|
NM
|
|
||||||||
|
Income (loss) from continuing operations
|
730
|
|
(420
|
)
|
1,602
|
|
274
|
%
|
-126
|
%
|
||||||||
|
Income (loss) from operations of discontinued businesses
|
(27
|
)
|
47
|
|
(158
|
)
|
-157
|
%
|
130
|
%
|
||||||||
|
Net gain (loss) from disposal and impairments of discontinued businesses
|
(152
|
)
|
16
|
|
86
|
|
NM
|
|
-81
|
%
|
||||||||
|
Net income (loss)
|
551
|
|
(357
|
)
|
1,530
|
|
254
|
%
|
-123
|
%
|
||||||||
|
Noncontrolling interests:
|
||||||||||||||||||
|
Loss from continuing operations attributable to noncontrolling interests
|
(446
|
)
|
(540
|
)
|
(1,096
|
)
|
17
|
%
|
51
|
%
|
||||||||
|
Income (loss) from discontinued operations attributable to noncontrolling interests
|
9
|
|
(15
|
)
|
(376
|
)
|
160
|
%
|
96
|
%
|
||||||||
|
Net income (loss) attributable to The AES Corporation
|
$
|
114
|
|
$
|
(912
|
)
|
$
|
58
|
|
113
|
%
|
NM
|
|
|||||
|
AMOUNTS ATTRIBUTABLE TO THE AES CORPORATION COMMON STOCKHOLDERS:
|
|
|
||||||||||||||||
|
Income (loss) from continuing operations, net of tax
|
$
|
284
|
|
$
|
(960
|
)
|
$
|
506
|
|
130
|
%
|
-290
|
%
|
|||||
|
Income (loss) from discontinued operations, net of tax
|
(170
|
)
|
48
|
|
(448
|
)
|
-454
|
%
|
111
|
%
|
||||||||
|
Net income (loss)
|
$
|
114
|
|
$
|
(912
|
)
|
$
|
58
|
|
113
|
%
|
NM
|
|
|||||
|
Net cash provided by operating activities
|
$
|
2,715
|
|
$
|
2,901
|
|
$
|
2,884
|
|
-6
|
%
|
1
|
%
|
|||||
|
Cash dividends per common share
|
$
|
0.17
|
|
$
|
0.08
|
|
$
|
—
|
|
113
|
%
|
NA
|
|
|||||
__
___________________________
NM — Not meaningful
79
Components of Revenue, Cost of Sales and Operating Margin—
Revenue includes revenue earned from the sale of energy from our utilities and the production of energy from our generation plants, which are classified as regulated and non-regulated on the Consolidated Statements of Operations, respectively. Revenue also includes the gains or losses on derivatives (including embedded derivatives other than foreign currency embedded derivatives) associated with the sale of electricity.
Cost of sales includes costs incurred directly by the businesses in the ordinary course of business. Examples include electricity and fuel purchases, operations and maintenance costs, depreciation and amortization expense, bad debt expense and recoveries, general administrative and support costs (including employee-related costs directly associated with the operations of the business). Cost of sales also includes the gains or losses on derivatives (including embedded derivatives other than foreign currency embedded derivatives) associated with the purchase of electricity or fuel.
Operating margin is defined as revenue less cost of sales.
Year ended
December 31, 2013
:
Revenue
decrease
d
$1.3 billion
, or
7%
, to
$15.9 billion
in
2013
compared with
$17.2 billion
in
2012
. The key operating drivers of the change at each of the SBUs are as follows:
|
•
|
US — Overall unfavorable impact of $106 million driven by the early termination of the PPA at Beaver Valley in early 2013, customer switching as well as lower capacity rates at DPL, and the short-term restart in 2012 of two Huntington Beach generating units at Southland in California, partially offset by higher wholesale volume and prices at IPL in Indiana.
|
|
•
|
Andes — Overall unfavorable impact of $381 million driven by unfavorable FX of $128 million, lower prices from the impact of Resolution 95 in Argentina, and lower contract and spot prices at Gener in Chile, partially offset by higher spot prices at Chivor in Colombia as a result of dry hydrology.
|
|
•
|
Brazil — Overall unfavorable impact of $773 million driven by unfavorable FX of $631 million, lower demand as well as lower pass-through costs and the tariff reset implemented in April 2013 at Sul, and a decrease at Eletropaulo related to the recognition of a regulatory liability for customer refunds (See Item 1. -
Business - Brazil SBU - Eletropaulo Regulatory Asset Base Update
) somewhat offset by higher tariffs. Negative results above partially offset by higher prices and sales at Tietê and the temporary re-start of operations during February and March of 2013 at Uruguaiana.
|
|
•
|
MCAC — Overall favorable impact of $140 million driven by higher spot prices as well as higher spot and gas sales to third parties in the Dominican Republic, higher prices in Mexico and Puerto Rico, partially offset by lower generation net of higher prices due to lower hydrology in Panama.
|
|
•
|
EMEA — Overall favorable impact of $3 million driven by higher energy prices at Kilroot, pass-through costs at Maritza and Jordan, as well as higher dispatch and fewer outages at Ballylumford, partially offset by lower capacity prices. The favorable results above were largely offset by the sale of 80% of our ownership in Cartagena in February 2012 and a non-recurring favorable arbitration settlement in 2012.
|
|
•
|
Asia — Overall unfavorable impact of $183 million due to higher contract levels at lower prices to reduce spot exposure, the reversal of a contingency and unrealized derivative gains in 2012 at Masinloc in the Philippines as well as lower generation at Kelanitissa in Sri Lanka as a result of higher hydrology.
|
Operating margin
decrease
d
$336 million
, or
9%
, to
$3.2 billion
in
2013
compared with
$3.6 billion
in
2012
. The key operating drivers of the change at each of the SBUs are as follows:
|
•
|
US — Overall unfavorable impact of $43 million driven by the short-term restart of two Huntington Beach units at Southland in 2012, higher outages and related fixed costs at Hawaii, and higher maintenance costs at IPL in Indiana. The negative drivers above were partially offset by higher contributions for US Wind businesses and
DPL with lower amortization expense largely offset by higher customer switching.
|
|
•
|
Andes — Overall unfavorable impact of $47 million driven by Chivor due to lower generation, somewhat offset by higher spot prices due to dry hydrology, and Chile due to lower generation, higher spot purchases, and lower contract prices, offset by the commencement of operations of Ventanas IV in March 2013. These negative drivers were partially offset by lower outages and higher volumes at Argentina, somewhat offset by unfavorable foreign currency translation and lower rates from the implementation of Resolution 95.
|
|
•
|
Brazil — Overall unfavorable impact of $98 million driven by unfavorable FX impact of $84 million, lower tariffs and demand at Sul, as well as lower volumes and higher energy purchases due to low hydrology at Tietê, partially offset by the favorable reversal of a liability and the temporary re-start of operations at Uruguaiana and
|
80
higher tariffs and lower fixed costs at Eletropaulo, somewhat offset by recognition of a regulatory liability as discussed above.
|
•
|
MCAC — Overall unfavorable impact of $17 million driven by Panama due to dry hydrological conditions, which resulted in lower generation and higher energy purchases at higher prices, somewhat offset by favorable net settlements. Negative drivers above were partially offset by the Dominican Republic with higher spot sales, higher international gas prices and volume of gas sales to third parties and higher availability in El Salvador due to the tariff increase at the beginning of 2013.
|
|
•
|
EMEA — Overall unfavorable impact of $89 million driven by Cartagena due to a non-recurring, favorable arbitration settlement in 2012 and the two-stage sale of the business as discussed above as well as Ballylumford due to lower capacity payments, somewhat offset by fewer outages. The negative results above were partially offset by favorable dark spreads from higher energy prices and lower coal costs at Kilroot and fewer outages and lower fixed costs at Maritza.
|
|
•
|
Asia — Overall unfavorable impact of $67 million driven by higher contracted volume at lower prices as discussed above as well as reversal of a contingency of $16 million and an unrealized derivative gain in 2012 at Masinloc.
|
Year Ended December 31, 2012
Revenue increased
$1.1 billion
, or
7%
, to
$17.2 billion
in
2012
compared with
$16.1 billion
in
2011
. The key operating drivers of the change at each of the SBUs are as follows:
|
•
|
US — Overall favorable impact of $1.6 billion driven by the impact of new businesses including $1.5 billion at DPL, acquired in November 2011. Additional drivers include IPL in Indiana with higher prices and Southland in California due to the short-term restart of two Huntington Beach generating units in 2012.
|
|
•
|
Andes — Overall favorable impact of $31 million driven by Chile due to the impact of new operations at Angamos in Chile which commenced operations in April 2011 as well as higher contract volume, partially offset by lower spot sales from Termoandes in Argentina to Chile and Chivor due to higher prices. Favorable drivers above partially offset by unfavorable FX of $66 million and Argentina due to lower prices and the impact of outages, despite higher volume.
|
|
•
|
Brazil — Overall unfavorable impact of $852 million driven by unfavorable FX of $1.1 billion as well as Eletropaulo due to lower tariffs as a result of the July 2012 tariff reset, which was delayed from July 2011, partially offset by higher pass-through costs at Sul and higher contract and spot prices at Tietê.
|
|
•
|
MCAC — Overall favorable impact of $246 million driven by new operations at Changuinola, which commenced operations in October 2011, and the re-start of operations at the Esti plant in Panama, as well as the Dominican Republic due to higher prices and volume from gas sales and higher ancillary services, slightly offset by unfavorable foreign currency translation impact of $17 million in Mexico.
|
|
•
|
EMEA — Overall unfavorable impact of $125 million driven by unfavorable FX of $39 million, a decrease at Cartagena due to the sale of 80% of our ownership in February 2012, somewhat offset by a non-recurring favorable arbitration settlement, and Ballylumford in the United Kingdom due to higher outages and lower demand. The lower results were partially offset by new operations at Maritza, which commenced operations in June 2011.
|
|
•
|
Asia — Overall favorable impact of $108 million driven by Masinloc in the Philippines due to higher demand net of lower prices, the reversal of a contingency and unrealized derivative gains in 2012, and favorable foreign currency translation of $14 million.
|
Operating margin decreased $457 million, or 11%, to $3.6 billion in
2012
compared with
$4.0 billion
in
2011
. The key operating drivers of the change at each of the SBUs are as follows:
|
•
|
US — Overall favorable impact of $316 million driven by the first full year of operations at DPL, lower repair and maintenance costs at IPL, the short-term restart of two units at Southland, and fewer outages at Hawaii.
|
|
•
|
Andes — Overall unfavorable impact of $163 million driven by Chile due to higher replacement energy costs and lower spot sales at Termoandes, Argentina due to lower prices and higher fixed costs, partially offset by an increase at Chivor due to non-recurring equity tax in 2011 and a net favorable impact of higher spot prices and lower volumes.
|
81
|
•
|
Brazil — Overall unfavorable impact of $833 million driven by unfavorable FX impact of $146 million, lower tariffs at Eletropaulo as discussed above and higher fixed costs, partially offset by higher contract prices from the annual PPA price adjustment at Tietê, and higher tariffs at Sul.
|
|
•
|
MCAC — Overall favorable impact of $48 million driven by Panama due to the first full year of operations at Changuinola as well as the re-start of operations at the Esti plant, somewhat offset by lower prices as well as Mexico due to fewer outages and higher volume and the Dominican Republic due to favorable prices, primarily higher spot and LNG prices, somewhat offset by lower availability.
|
|
•
|
EMEA — Overall favorable impact of $109 million driven by Maritza due to the first full year of operations, Kilroot with increased dispatch, and Cartagena due to a non-recurring favorable arbitration settlement, somewhat offset by the sale of 80% as discussed above. The favorable drivers above were partially offset by Ballylumford due to lower capacity prices, higher outages and related maintenance costs, and lower volume.
|
|
•
|
Asia — Overall favorable impact of $69 million driven by Masinloc due to higher market demand net of lower rates, the reversal of a contingency and higher unrealized derivative gains.
|
General and administrative expenses
General and administrative expenses includes expenses related to corporate staff functions and/or initiatives, executive management, finance, legal, human resources and information systems, as well as global development costs.
General and administrative expenses
decrease
d
$54 million
, or
20%
, to
$220 million
in
2013
from
2012
primarily due to Company restructuring efforts, resulting in a decrease in employee related costs, professional fees and business development costs.
General and administrative expenses
decrease
d
$72 million
, or
21%
, to
$274 million
in
2012
from
2011
primarily due to reductions in business development and systems administration costs.
Interest expense
Interest expense
decrease
d
$62 million
, or
4%
, to
$1.5 billion
in
2013
from
2012
. The decrease was primarily due to reduced debt principal as well as the prior year prepayment of an interest rate cash flow hedge that resulted in a reclassification of deferred losses from other comprehensive income to earnings at the Parent Company, favorable foreign currency translation and lower interest rates in Brazil, as well as income resulting from ineffectiveness on interest rate swaps in Puerto Rico that continue to qualify for hedge accounting. These decreases were partially offset by a monetary correction on the adjustment to the regulatory liability related to the asset base at Eletropaulo as a result of a ruling by the regulator in December 2013.
Interest expense
increase
d $
14 million
, or
1%
, to
$1.5 billion
in
2012
from
2011
. This increase was primarily due to debt at DPL, acquired in November 2011, additional indebtedness at the Parent Company to finance the acquisition of DPL, and less interest capitalization due to the commencement of operations at various projects. The increase was partially offset by a reduction in interest expense in Brazil, due to lower short-term interest rates, lower debt principal and favorable foreign currency translation, as well as lower interest expense for Cartagena, which was deconsolidated following the sale of 80% of our interest in the first quarter of 2012 and higher capitalized interest at Gener in 2012.
Interest income
Interest income
decrease
d
$73 million
, or
21%
, to
$275 million
in
2013
from
2012
. The
decrease
was primarily in Brazil, due to lower interest-bearing assets, lower investment balances, unfavorable foreign currency translation, and lower interest rates. The decrease was partially offset by interest income related to FONINVEMEM III receivables in Argentina which satisfied the criteria for recognition during 2013.
Interest income
decrease
d
$50 million
, or
13%
, to
$348 million
in
2012
from
2011
. The
decrease
was mainly in Brazil, due to a reduction in interest-bearing assets, unfavorable foreign currency translation and lower interest rates, partially offset by inflation adjustments on interest-bearing assets and interest earned on receivables for spot sales in the Dominican Republic.
82
Loss on extinguishment of debt was
$229 million
for the
year ended December 31, 2013
. This loss was primarily related to the loss on the early retirement of recourse debt at the Parent Company and the loss on the early extinguishment of debt at Masinloc. See Note 12. —
Debt
included in Item 8. —
Financial Statements and Supplementary Data
of this Form 10-K for further information.
Loss on extinguishment of debt was $8 million and $62 million for the years ended December 31, 2012 and
2011
. The loss in 2012 was primarily related to early retirement of debt at the Parent Company and at Eletropaulo. The loss in 2011 was primarily related to a $36 million premium paid on early retirement of debt at Gener and $15 million related to the early retirement of senior notes due in 2011 at IPL.
Other income and expense
See discussion of the components of other income and expense in Note 20 —
Other Income and Expense
included in Item 8. —
Financial Statements and Supplementary Data
of this Form 10-K for further information.
Gain on sale of investments
Gain on sale of investments for the year ended
December 31, 2013
was
$26 million
, which is primarily related to the sale of our remaining 20% interest in Cartagena as well as the sale of our 10% equity interest in Trinidad Generation Unlimited. See Note 24. -
Acquisitions and Dispositions
included in Item 8. -
Financial Statements and Supplemental Data
of this Form 10-K for further information.
Gain on sale of investments for the year ended
December 31, 2012
was
$219 million
, which was primarily related to the sale of 80% of our interest in Cartagena, as well as the sale of certain investments in China.
Gain on sale of investments for the year ended December 31, 2011 was $8 million, which was primarily related to the sale of Wuhu, an equity method investment in China.
Goodwill impairment
The Company recognized goodwill impairment expense of
$372 million
,
$1.8 billion
, and
$17 million
for the years ended
December 31, 2013
, 2012, and
2011
. See Note 10 —
Goodwill Impairment
included in Item 8. —
Financial Statements and Supplementary Data
of this Form 10-K for further information.
Asset impairment expense
The Company recognized asset impairment expense of
$95 million
,
$73 million
and
$173 million
, respectively, for the years ended
December 31, 2013
, 2012 and
2011
. See Note 21 —
Asset Impairment Expense
included in Item 8. —
Financial Statements and Supplementary Data
of this Form 10-K for further information.
Foreign currency transaction gains (losses)
Foreign currency transaction gains (losses) were as follows:
|
Years Ended December 31,
|
||||||||||||
|
2013
|
2012
|
2011
|
||||||||||
|
(in millions)
|
||||||||||||
|
Chile
|
$
|
(20
|
)
|
$
|
9
|
|
$
|
(19
|
)
|
|||
|
Brazil
|
(12
|
)
|
(16
|
)
|
(12
|
)
|
||||||
|
Philippines
|
(10
|
)
|
(159
|
)
|
3
|
|
||||||
|
AES Corporation
|
5
|
|
5
|
|
(4
|
)
|
||||||
|
Argentina
|
2
|
|
(5
|
)
|
16
|
|
||||||
|
Other
|
13
|
|
(4
|
)
|
(16
|
)
|
||||||
|
Total
(1)
|
$
|
(22
|
)
|
$
|
(170
|
)
|
$
|
(32
|
)
|
|||
___________________________________________
(1)
Includes gains (losses) of $60 million, $(160) million and $44 million on foreign currency derivative contracts for the years ended December 31, 2013, 2012 and 2011, respectively.
83
The Company recognized net foreign currency transaction losses of
$22 million
for the year ended
December 31, 2013
primarily due to:
|
•
|
losses of $20 million in Chile were primarily due to a 9% weakening of the Chilean Peso, resulting in losses at Gener (a U.S. Dollar functional currency subsidiary) associated with net working capital denominated in Chilean Pesos, mainly cash, accounts receivables and tax receivables, partially offset by gains related to foreign currency derivatives.
|
|
•
|
losses of $12 million in Brazil were primarily due to a 15% weakening of the Brazilian Real resulting in losses mainly associated with U.S. Dollar denominated liabilities; and
|
|
•
|
losses of $10 million in the Philippines (a U.S. Dollar functional currency subsidiary beginning in 2013) were primarily due to the 8% weakening of the Philippine Peso, resulting in revaluation of cash accounts, customer receivables and deferred tax asset; partially offset by
|
|
•
|
Gains of $8 million at The AES Corporation were primarily due to increases in the valuation of intercompany notes receivable denominated in foreign currencies, resulting from the strengthening of the Euro and British Pound during the year, partially offset by losses related to foreign currency option purchases.
|
The Company recognized foreign currency transaction losses of
$170 million
for the year ended
December 31, 2012
primarily due to:
|
•
|
losses of $159 million in the Philippines were primarily due to unrealized foreign exchange losses on embedded derivatives as a result of the forecasted strengthening of the Philippine Peso, partially offset by gains from the 7% appreciation of the Philippine Peso on U.S. Dollar denominated debt at Masinloc, which had been a Philippine Peso functional currency subsidiary; and
|
|
•
|
losses of $16 million in Brazil were primarily due to a 9% devaluation of the Brazilian Real resulting in losses mainly associated with U.S. Dollar denominated liabilities; partially offset by
|
|
•
|
gains of $10 million at The AES Corporation were primarily due to increases in the valuation of intercompany notes receivable denominated in foreign currencies, resulting from the strengthening of the Euro and British Pound during the year, partially offset by losses related to foreign currency option purchases.
|
The Company recognized foreign currency transaction losses of
$32 million
for the
year ended
December 31,
2011
primarily due to:
|
•
|
losses of $19 million in Chile were primarily due to an 11% devaluation of the Chilean Peso, resulting in losses at Gener (a U.S. Dollar functional currency subsidiary) associated with net working capital denominated in Chilean Pesos, mainly cash, accounts receivable, tax receivables and a $5 million loss on foreign currency derivatives; and
|
|
•
|
losses of $12 million in Brazil were primarily due to a 13% devaluation of the Brazilian Real resulting in losses mainly associated with U.S. Dollar denominated liabilities; and
|
|
•
|
losses of $8 million at The AES Corporation were primarily due to decreases in the valuation of intercompany notes receivable denominated in foreign currencies, resulting from the weakening of the Euro and British Pound during the year, partially offset by gains related to foreign currency option purchases; partially offset by
|
|
•
|
gains of $16 million in Argentina were primarily due to an unrealized gain on a foreign currency embedded derivative related to government receivables, partially offset by losses due to the 8% devaluation of the Argentine Peso, resulting in losses at AES Argentina (an Argentine Peso functional currency subsidiary) associated with its U.S. Dollar denominated debt.
|
Other non-operating expense
Total other non-operating expense was
$129 million
,
$50 million
and
$82 million
for the years ended
December 31, 2013
, 2012 and
2011
. See Note 9 —
Other Non-Operating Expense
included in Item 8. —
Financial Statements and Supplementary Data
of this Form 10-K for further information.
Income tax expense
Income tax expense
decrease
d
$342 million
, or
50%
, to
$343 million
in 2013. The Company’s effective tax rates were
33%
and
298%
for the years ended
December 31, 2013
and
2012
, respectively.
84
The net
decrease
in the 2013 effective tax rate was principally due to a 2012 nondeductible impairment of goodwill at our U.S. utility, DPL, and in part to net favorable resolution of various uncertain tax positions in 2013. See Note 10 -
Goodwill and Other Intangible Assets
for additional information regarding goodwill impairment and Note 22 -
Income Taxes
included in Item 8. —
Financial Statements and Supplementary Data
of this Form 10-K for additional information regarding uncertain tax positions.
Income tax expense
increase
d
$29 million
, or
4%
, to
$685 million
in 2012. The Company’s effective tax rates were
298%
and
29%
for the years ended December 31, 2012 and
2011
, respectively.
The net
increase
in the 2012 effective tax rate was principally due to a nondeductible impairment of goodwill at our U.S. utility, DPL. See Note 10 -
Goodwill and Other Intangible Assets
included in Item 8. —
Financial Statements and Supplementary Data
of this Form 10-K for additional information regarding goodwill impairment.
Our effective tax rate reflects the tax effect of significant operations outside the United States, which are generally taxed at rates lower than the U.S. statutory rate of 35 percent. A future proportionate change in the composition of income before income taxes from foreign and domestic tax jurisdictions could impact our periodic effective tax rate.
We recognized tax expense of $343 million for the year ended December 31, 2013, while our cash payments for income taxes, net of refunds, totaled $570 million. The difference resulted primarily from income tax benefit on current year U.S. losses and from the loss associated with the regulatory liability for customer refunds recognized at Eletropaulo which is not currently deductible for local tax purposes.
The Company also benefits from reduced tax rates in certain countries as a result of satisfying specific commitments regarding employment and capital investment. One such benefit related to our operations in the Philippines will expire in the 4th quarter of 2014. Accordingly, the Company’s effective tax rate and cash tax payments may increase in future periods. See Note 22 - Income Taxes for additional information regarding these reduced rates.
Net equity in earnings of affiliates
Net equity in earnings of affiliates
decrease
d
$10 million
, or
29%
, to
$25 million
in 2013 from
$35 million
in 2012. The
decrease
was primarily due to the sale of Yangcheng in China in the third quarter of 2012 as well as higher losses at Entek in Turkey resulting from a loss on an embedded foreign currency derivative, partially offset by increased earnings at Guacolda due to higher energy sales as a result of lower purchase costs.
Net equity in earnings of affiliates
increase
d
$37 million
to
$35 million
in 2012 from a net loss of $2 million in
2011
. The
increase
was primarily related to increased tariff pricing, lower coal prices, and lower depreciation at Yangcheng in China in 2012. Additionally, there were impairment charges at AES Solar in 2011 of which our share was $36 million. This was partially offset by lower net income caused by higher electricity purchase costs at Guacolda.
Income from continuing operations attributable to noncontrolling interests
Income from continuing operations attributable to noncontrolling interests
decrease
d
$94 million
, or
17%
, to
$446 million
in 2013. The
decrease
was primarily due to lower operating income at Tiete and Panama related to lower hydrology, the recognition of a regulatory liability related to customer refunds at Eletropaulo, and a reduction in income at Cartagena which was deconsolidated in February 2012 as a result of the sale of 80% of our interest.
The loss from continuing operations attributable to noncontrolling interests
decrease
d
$556 million
, or
51%
, from $1,096 to
$540 million
in 2012. This was primarily due to decreased operating margin at Eletropaulo as a result of the tariff reset and higher fixed costs.
Discontinued operations
Total discontinued operations was a
net loss
of
$179 million
, a
net income
of
$63 million
, and a
net loss
of
$72 million
for the years ended
December 31, 2013
,
2012
and
2011
, respectively. See Note 23 —
Discontinued Operations and Held-for-Sale Businesses
included in Item 8. —
Financial Statements and Supplementary Data
of this Form 10-K for further information.
85
Net Income attributable to The AES Corporation
Net income attributable to The AES Corporation
increase
d
$1.0 billion
to
$114 million
in
2013
compared to a net loss of
$912 million
in
2012
. The key drivers of the
increase
included:
|
•
|
lower goodwill impairment expense;
|
|
•
|
lower income tax expense;
|
|
•
|
lower foreign currency losses;
|
|
•
|
lower interest expense, primarily at the Parent Company, due to a reduction in debt principal as well as the prior year prepayment of an interest rate cash flow hedge that resulted in a reclassification of deferred losses from other comprehensive income to earnings; and
|
|
•
|
lower general and administrative expense.
|
These
increase
s were partially offset by:
|
•
|
lower operating margin as described above;
|
|
•
|
the loss on the early extinguishment of debt at the Parent Company and at Masinloc;
|
|
•
|
lower gain on sale of investments recorded in 2013 on the sale of our remaining 20% interest in Cartagena as well as our 10% equity interest in Trinidad compared to the prior year gain recorded from the sale of 80% of our interest in Cartagena in the first quarter of 2012;
|
|
•
|
an increase in losses from the disposal and impairment of the discontinued businesses;
|
|
•
|
other non-operating expense associated with an impairment at our equity method investment at Elsta in the Netherlands.
|
Net loss attributable to The AES Corporation was $912 million in 2012, which is a decrease of $1 billion compared to net income of $58 million in 2011. The key driver of the decrease was the goodwill impairment at DPL of $1.82 billion as described in Note 10—
Goodwill Impairment and Other Intangible Assets
included in Item 8.—
Financial Statements and Supplementary Data
of this Form 10-K.
Excluding the goodwill impairment at DPL, the Company would have reported net income attributable to AES of $905 million, which is an improvement of $847 million compared to 2011. The key drivers of this increase were:
|
•
|
the favorable impact of operating margin earned by new businesses, mainly our wholly-owned subsidiaries: DPL, Maritza, and Changuinola, higher demand at Masinloc, a 92% owned subsidiary, partially offset by a reduced operating margin at Eletropaulo, in which we hold only a 16% economic interest and a lower operating margin earned by our generation businesses in Chile and Argentina;
|
|
•
|
the gains related to the sale in 2012 of 80% of our interest in Cartagena and the sale of our investments in China, as well as the loss recorded in 2011 on the sale of our Argentina distribution businesses;
|
|
•
|
a decrease in losses from the operation of discontinued businesses, primarily related to Eastern Energy in New York, which was deconsolidated in December 2011;
|
|
•
|
the decrease in asset impairments related to Wind projects and Kelanitissa;
|
|
•
|
lower general and administrative expenses in 2012 compared to 2011; and
|
|
•
|
the 2011 premium paid on the early retirement of debt in Chile and at IPL.
|
These increases were partially offset by:
|
•
|
higher foreign currency transaction losses in 2012 compared to 2011; and
|
|
•
|
an increase in interest expense primarily due to debt at DPL, which was acquired in November 2011, and additional debt at the Parent Company to finance the acquisition of DPL.
|
Net Cash Provided by Operating Activities
—Consists of the operating cash flow of all consolidated subsidiaries, including noncontrolling interests.
86
The net
decrease
in cash flows from operating activities of
$186 million
, or
6%
to
$2.7 billion
for the
year ended
December 31, 2013
compared to the
year ended
December 31, 2012
was primarily the result of the following:
|
•
|
US — an increase of $74 million primarily due to a bankruptcy settlement payment to the New York entities in 2012 and the proceeds from the PPA termination at Beaver Valley in January 2013;
|
|
•
|
Andes — a decrease of $276 million primarily driven by higher working capital requirements;
|
|
•
|
Brazil — a decrease of $106 million primarily related to lower collections and higher energy purchases at Sul, partially offset by the recovery of deferred costs from regulator, lower transmission costs and regulatory charges at Eletropaulo;
|
|
•
|
MCAC — an increase of $185 million primarily driven by a $90 million payment related to an amendment to a fuel contract and lower working capital requirements;
|
|
•
|
Asia — a decrease of $85 million primarily driven by higher working capital requirements and lower operating results at Masinloc.
|
The net decrease in cash flows from operating activities of
$17 million
, or
1%
to
$2.9 billion
for the
year ended
December 31, 2012
compared to the
year ended
December 31, 2011
was primarily the result of the following:
|
•
|
US — an increase of $320 million at our utility businesses primarily due to the operations, net of debt service costs, of DPL which was acquired in November 2011;
|
|
•
|
Andes — an increase of $57 million driven by cash provided by the operating activities of the new plant at Angamos, recovery of value added tax at Campiche and reduced working capital requirements at Gener, partially offset by reduced operating margin from Gener operations other than Angamos;
|
|
•
|
Brazil — a decrease of $503 million at our utility businesses primarily driven by higher priced energy purchases, regulatory charges and transmission costs payments, higher operating and maintenance expenses and lower accounts receivable collections due to the lower tariff starting in July 2012 at Eletropaulo, partially offset by a lower payment of income taxes;
|
|
•
|
MCAC — an increase of $25 million at our generation businesses primarily due to the operations of the Esti plant being back on line from June 2012 and higher volumes of PPA sales at Panama and lower coal volume and price in 2012 at Itabo, partially offset by lower collections and lower sales in the Dominican Republic and higher taxes paid at Panama;
|
|
•
|
EMEA — an increase of $42 million driven primarily by cash provided by the operating activities of the new plant at Maritza partially offset by a loss in revenue from a generator failure at Ballylumford in Northern Ireland; and
|
|
•
|
Asia — an increase of $88 million driven primarily by Masinloc in the Philippines due to higher demand and reduced working capital requirements.
|
Non-GAAP Measures
Adjusted Operating Margin, adjusted pre-tax contribution (“Adjusted PTC”) and adjusted earnings per share (“Adjusted EPS”) are non-GAAP supplemental measures that are used by management and external users of our consolidated financial statements such as investors, industry analysts and lenders.
Adjusted Operating Margin
Operating margin is defined as revenue less cost of sales. Cost of sales includes costs incurred directly by the businesses in the ordinary course of business, such as:
|
•
|
Electricity and fuel purchases
|
|
•
|
Operations and maintenance costs,
|
|
•
|
Depreciation and amortization expense,
|
|
•
|
Bad debt expense and recoveries,
|
|
•
|
General administrative and support costs at the businesses, and
|
|
•
|
Gains or losses on derivatives associated with the purchase of electricity or fuel.
|
87
We define Adjusted Operating Margin as operating margin, adjusted for the impact of noncontrolling interests, excluding unrealized gains or losses related to derivative transactions.
The GAAP measure most comparable to Adjusted Operating Margin is operating margin. We believe that Adjusted Operating Margin better reflects the underlying business performance of the Company. Factors in this determination include the impact of noncontrolling interests, where AES consolidates the results of a subsidiary that is not wholly-owned by the Company, as well as the variability due to unrealized derivatives gains or losses. Adjusted Operating Margin should not be construed as an alternative to operating margin, which is determined in accordance with GAAP.
Adjusted Pre-Tax Contribution and Adjusted Earnings Per Share
We define adjusted pre-tax contribution ("Adjusted PTC") as pre-tax income from continuing operations attributable to AES excluding gains or losses of the consolidated entity due to (a) unrealized gains or losses related to derivative transactions, (b) unrealized foreign currency gains or losses, (c) gains or losses due to dispositions and acquisitions of business interests, (d) losses due to impairments, and (e) costs due to the early retirement of debt. Adjusted PTC also includes net equity in earnings of affiliates on an after-tax basis.
Adjusted pre-tax contribution reflects the impact of noncontrolling interests and excludes the items specified in the definition above. In addition to the revenue and cost of sales reflected in operating margin, adjusted pre-tax contribution includes the other components of our income statement, such as:
|
•
|
General and administrative expense in the corporate segment, as well as business development costs;
|
|
•
|
Interest expense and interest income;
|
|
•
|
Other expense and other income;
|
|
•
|
Realized foreign currency transaction gains and losses; and
|
|
•
|
Net equity in earnings of affiliates.
|
We define Adjusted EPS as diluted earnings per share from continuing operations excluding gains or losses of the consolidated entity due to (a) unrealized gains or losses related to derivative transactions, (b) unrealized foreign currency gains or losses, (c) gains or losses due to dispositions and acquisitions of business interests, (d) losses due to impairments, and (e) costs due to the early retirement of debt.
The GAAP measure most comparable to Adjusted PTC is income from continuing operations attributable to AES. The GAAP measure most comparable to Adjusted EPS is diluted earnings per share from continuing operations. We believe that Adjusted PTC and Adjusted EPS better reflect the underlying business performance of the Company and are considered in the Company’s internal evaluation of financial performance. Factors in this determination include the variability due to unrealized gains or losses related to derivative transactions, unrealized foreign currency gains or losses, losses due to impairments and strategic decisions to dispose of or acquire business interests or retire debt, which affect results in a given period or periods. In addition, for Adjusted PTC, earnings before tax represents the business performance of the Company before the application of statutory income tax rates and tax adjustments, including the effects of tax planning, corresponding to the various jurisdictions in which the Company operates. Adjusted PTC and Adjusted EPS should not be construed as alternatives to income from continuing operations attributable to AES and diluted earnings per share from continuing operations, which are determined in accordance with GAAP.
For the year ended
December 31, 2013
, the Company changed the definition of Adjusted PTC and Adjusted EPS to exclude the gains or losses attributable to AES common stockholders at our equity method investments for these same types of items. Previously, these amounts were not excluded from the calculation of Adjusted EPS and Adjusted PTC because the Company did not have a controlled process for obtaining this information from our equity method investments. Accordingly, the Company has also reflected the change in the comparative years ended
December 31, 2012
and 2011.
88
Reconciliations of Non-GAAP Measures
Adjusted Operating Margin
|
Reconciliation of Adjusted Operating Margin to Operating Margin
|
Years Ended December 31,
|
|||||||||||
|
2013
|
2012
|
2011
|
||||||||||
|
Adjusted Operating Margin
|
($'s in millions)
|
|||||||||||
|
US
|
$
|
684
|
|
$
|
707
|
|
$
|
406
|
|
|||
|
Andes
|
402
|
|
431
|
|
564
|
|
||||||
|
Brazil
|
271
|
|
356
|
|
489
|
|
||||||
|
MCAC
|
472
|
|
489
|
|
419
|
|
||||||
|
EMEA
|
392
|
|
447
|
|
351
|
|
||||||
|
Asia
|
159
|
|
204
|
|
153
|
|
||||||
|
Corp/Other
|
(16
|
)
|
(12
|
)
|
2
|
|
||||||
|
Intersegment Eliminations
|
64
|
|
35
|
|
26
|
|
||||||
|
Total Adjusted Operating Margin
|
2,428
|
|
2,657
|
|
2,410
|
|
||||||
|
Noncontrolling Interests Adjustment
|
833
|
|
908
|
|
1,643
|
|
||||||
|
Derivatives Adjustment
|
(14
|
)
|
18
|
|
(13
|
)
|
||||||
|
Operating Margin
|
3,247
|
|
3,583
|
|
4,040
|
|
||||||
Adjusted Pre-Tax Contribution
: For a reconciliation of Adjusted PTC to net income from continuing operations, see Note 17 —
Segment and Geographic Information
included in Item 8. —
Financial Statements and Supplementary Data
of this Form 10-K.
Adjusted EPS
|
Years Ended December 31,
|
|||||||||||||
|
Reconciliation of Adjusted Earnings Per Share
|
2013
|
2012
|
2011
|
||||||||||
|
Diluted earnings (loss) per share from continuing operations
|
$
|
0.38
|
|
$
|
(1.26
|
)
|
$
|
0.65
|
|
||||
|
Unrealized derivative (gains) losses
(1)
|
(0.05
|
)
|
0.11
|
|
(0.02
|
)
|
|||||||
|
Unrealized foreign currency transaction (gains) losses
(2)
|
0.02
|
|
(0.02
|
)
|
0.06
|
|
|||||||
|
Disposition/acquisition (gains)
|
(0.03
|
)
|
(3)
|
(0.18
|
)
|
(4)
|
—
|
|
|||||
|
Impairment losses
|
0.75
|
|
(5)
|
2.55
|
|
(6)
|
0.38
|
|
(7)
|
||||
|
Loss on extinguishment of debt
|
0.22
|
|
(8)
|
0.01
|
|
(9)
|
0.04
|
|
(10)
|
||||
|
Adjusted earnings per share
|
$
|
1.29
|
|
$
|
1.21
|
|
$
|
1.11
|
|
||||
_____________________________
|
(1)
|
Unrealized derivative (gains) losses were net of income tax per share of
$(0.02)
,
$0.04
and $
(0.01)
in
2013
,
2012
, and
2011
, respectively.
|
|
(2)
|
Unrealized foreign currency transaction (gains) losses were net of income tax per share of $
0.02
, $
0.00
and $
0.01
in
2013
,
2012
, and
2011
, respectively.
|
|
(3)
|
Amount primarily relates to the gain from the sale of the remaining 20% of our interest in Cartagena for $
20
million ($
15
million, or $
0.02
per share, net of income tax per share of $
0.01
) as well as the gain from the sale of Trinidad for $
3
million ($
4
million, or $
0.01
per share, net of income tax per share of $
0.00
).
|
|
(4)
|
Amount primarily relates to the gains from the sale of 80% of our interest in Cartagena for $
178
million ($
109
million, or $
0.14
per share, net of income tax per share of $
0.09
) and equity method investments in China of $
24
million ($
25
million, or $
0.03
per share, including an income tax credit of $
1
million, or income tax per share of $
0.00
).
|
|
(5)
|
Amount primarily relates to the goodwill impairments at DPL of $
307
million ($
307
million, or $
0.41
per share, net of income tax per share of $
0.00
), at Ebute of $
58
million ($
58
million, or $
0.08
per share, net of income tax per share of $
0.00
) and at Mountain View of $
7
million ($
7
million, or $
0.01
per share, net of income tax per share of $
0.00
). Amount also includes an other-than-temporary impairment of our equity method investment at Elsta in the Netherlands of $
129
million ($
128
million, or $
0.17
per share, net of income tax per share of $
0.00
) and asset impairments at Beaver Valley of $
46
million ($
30
million, or $
0.04
per share, net of income tax per share of $
0.02
), at DPL of $
26
million ($
17
million, or $
0.02
per share, net of income tax per share of $
0.01
), at Itabo (San Lorenzo) of $
16
million ($
6
million, or $
0.01
per share, net of noncontrolling interest of $
8
million and of income tax per share of $
0.00
), at El Salvador for $
4
million ($
4
million, or $
0.01
per share, net of income tax per share of $
0.00
).
|
|
(6)
|
Amount primarily relates to the goodwill impairment at DPL of $
1.82
billion ($
1.82
billion, or $
2.39
per share, net of income tax per share of $
0.00
). Amount also includes other-than-temporary impairment of equity method investments in China of $
32
million ($
32
million, or $
0.04
per share, net of income tax per share of $
0.00
), and at InnoVent of $
17
million ($
17
million, or $
0.02
per share, net of income tax per share of $
0.00
), as well as asset impairments of Wind turbines and projects of $
41
million ($
26
million, or $
0.03
per share, net of income tax per share of $
0.02
) and asset impairments at Kelanitissa of $
19
million ($
17
million, or $
0.02
per share,
|
89
net of noncontrolling interest of $
2
million and of income tax per share of $
0.00
) and at St. Patrick of $
11
million ($
11
million or $
0.01
per share, net of income tax per share of $
0.00
).
|
(7)
|
Amount includes other-than-temporary impairment of equity method investments at Chigen, including Yangcheng, of $
79
million ($
79
million, or $
0.10
per share, net of income tax per share of $
0.00
), asset impairment of Wind turbines of $
116
million ($
75
million, or $
0.10
per share, net of income tax per share of $
0.05
), Kelanitissa of $
42
million ($
38
million, or $
0.05
per share, net of noncontrolling interest of $
4
million and income tax per share of $
0.00
), Bohemia of $
9
million ($
9
million, and $
0.01
per share, net of income tax per share of $
0.00
) and goodwill impairment at Chigen of $
17
million ($
17
million or $
0.02
per share, net of income tax per share of $
0.00
).
|
|
(8)
|
Amounts primarily relates to the loss on early retirement of debt at Corporate of $
165
million ($
107
million, or $
0.14
per share, net of income tax per share of $
0.08
), at Masinloc of $
43
million ($
39
million, or $
0.05
per share, net of income tax per share of $
0.00
) and Changuinola of $
14
million ($
10
million, or $
0.01
per share, net of income tax per share of $
0.01
).
|
|
(9)
|
Amount primarily relates to the loss on retirement of debt at the Parent Company of $
15
million ($
10
million, or $
0.01
per share, net of income tax per share of $
0.01
).
|
|
(10)
|
Amount includes loss on retirement of debt at Gener of $
38
million ($
22
million, or $
0.03
per share, net of noncontrolling interest of $
11
million and of income tax per share of $
0.01
) and at IPL of $
15
million ($
10
million, or $
0.01
per share, net of income tax per share of $
0.01
).
|
The Company reported a loss from continuing operations of
$1.27
per share in 2012. For purposes of measuring diluted loss per share under GAAP, common stock equivalents were excluded from weighted-average shares as their inclusion would be anti-dilutive. However, for purposes of computing Adjusted EPS, the Company has included the impact of dilutive common stock equivalents as the inclusion of the defined adjustments result in income for Adjusted EPS. The table below reconciles the weighted-average shares used in GAAP diluted earnings per share to the weighted-average shares used in calculating the non-GAAP measure of Adjusted EPS.
|
Year Ended December 31, 2012
|
|||||||||||
|
Loss
|
Shares
|
$ per share
|
|||||||||
|
Reconciliation of Denominator Used For Adjusted Earnings Per Share
|
(in millions except per share data)
|
||||||||||
|
GAAP DILUTED (LOSS) PER SHARE
|
|||||||||||
|
Loss from continuing operations attributable to The AES Corporation common stockholders
|
$
|
(960
|
)
|
755
|
|
$
|
(1.27
|
)
|
|||
|
EFFECT OF DILUTIVE SECURITIES
|
|||||||||||
|
Stock options
|
—
|
|
1
|
|
—
|
|
|||||
|
Restricted stock units
|
—
|
|
4
|
|
0.01
|
|
|||||
|
NON-GAAP DILUTED (LOSS) PER SHARE
|
$
|
(960
|
)
|
760
|
|
$
|
(1.26
|
)
|
|||
Operating Margin and Adjusted PTC Analysis
US SBU
The following table summarizes Operating Margin, Adjusted Operating Margin and Adjusted PTC for our US SBU for the periods indicated:
|
For the Years Ended December 31,
|
||||||||||||||||||||||||||
|
2013
|
2012
|
2011
|
$ Change 2013 vs. 2012
|
$ Change 2012 vs. 2011
|
% Change 2013 vs. 2012
|
% Change 2012 vs. 2011
|
||||||||||||||||||||
|
($’s in millions)
|
||||||||||||||||||||||||||
|
Operating Margin
|
$
|
668
|
|
$
|
711
|
|
$
|
395
|
|
$
|
(43
|
)
|
$
|
316
|
|
-6
|
%
|
80
|
%
|
|||||||
|
Noncontrolling Interests Adjustment
|
—
|
|
—
|
|
—
|
|
||||||||||||||||||||
|
Derivatives Adjustment
|
16
|
|
(4)
|
|
11
|
|
||||||||||||||||||||
|
Adjusted Operating Margin
|
$
|
684
|
|
$
|
707
|
|
$
|
406
|
|
$
|
(23
|
)
|
$
|
301
|
|
-3
|
%
|
74
|
%
|
|||||||
|
Adjusted PTC
|
$
|
440
|
|
$
|
403
|
|
$
|
181
|
|
$
|
37
|
|
$
|
222
|
|
9
|
%
|
|
123
|
%
|
||||||
Fiscal year
2013
versus
2012
Operating margin for
2013
decrease
d
$43 million
, or
6%
. This performance was driven primarily by the following businesses and key operating drivers:
|
•
|
US Generation decreased $26 million, driven by a $24 million decline from the short-term restart of two Huntington Beach units at Southland in 2012, and higher outages at Hawaii of $24 million, partially offset by higher contributions from the US Wind portfolio of $32 million.
|
90
|
•
|
IPL declined $23 million, as a result of $13 million in higher maintenance costs driven by the timing and duration of major generating unit overhauls, and higher depreciation expense of $6 million due to additional utility plant assets placed in service.
|
These decreases were partially offset by:
|
•
|
DPL increased $6 million, as lower amortization expense of $81 million offset:
|
|
◦
|
A $30 million decrease in sales margin, as customer switching drove retail price decreases partially offset by higher wholesale volumes;
|
|
◦
|
Lower PJM capacity margins of $12 million; and
|
|
◦
|
$19 million from unrealized gains on derivatives in 2012, which did not recur in 2013.
|
Adjusted Operating Margin declined
$23 million
for the US SBU due to the drivers above, excluding the impact of unrealized derivative gains and losses. AES owns 100% of its businesses in the US, so there is no adjustment for noncontrolling interests.
Adjusted PTC increased
$37 million
driven by net gains of $53 million recognized as a result of the early termination of the PPA and coal supply contract at Beaver Valley, partially offset by the decrease of
$23 million
in Adjusted Operating Margin described above.
Fiscal year
2012
versus
2011
Operating margin
increase
d by
$316 million
, or
80%
. This performance was driven primarily by the following businesses and key operating drivers:
|
•
|
DPL increased $249 million from the first full year of operations, as the acquisition was completed in November 2011.
|
|
•
|
IPL increased $15 million, due to $21 million in lower repairs and maintenance costs, as a result of fewer generating unit outages, partially offset by higher pension expenses of $5 million.
|
|
•
|
US Generation increased $53 million, as a result of a $21 million increase from the short-term restart of two Huntington Beach generating units at Southland and fewer outages at Hawaii of $19 million.
|
Adjusted Operating Margin increased
$301 million
due to the drivers above, excluding the impact of unrealized derivative gains and losses.
Adjusted PTC increased
$222 million
driven by the increase of
$301 million
in Adjusted Operating Margin described above, partially offset by higher interest expense from the first full year of operations at DPL.
Andes SBU
The following table summarizes Operating Margin, Adjusted Operating Margin and Adjusted PTC for our Andes SBU for the periods indicated:
|
For the Years Ended December 31,
|
||||||||||||||||||||||||||
|
2013
|
2012
|
2011
|
$ Change 2013 vs. 2012
|
$ Change 2012 vs. 211
|
% Change 2013 vs. 2012
|
% Change 2012 vs. 2011
|
||||||||||||||||||||
|
($’s in millions)
|
||||||||||||||||||||||||||
|
Operating Margin
|
$
|
533
|
|
$
|
580
|
|
$
|
743
|
|
$
|
(47
|
)
|
$
|
(163
|
)
|
-8
|
%
|
-22
|
%
|
|||||||
|
Noncontrolling Interests Adjustment
|
$
|
(131
|
)
|
(149
|
)
|
(179
|
)
|
|||||||||||||||||||
|
Derivatives Adjustment
|
—
|
|
—
|
|
—
|
|
||||||||||||||||||||
|
Adjusted Operating Margin
|
$
|
402
|
|
$
|
431
|
|
$
|
564
|
|
$
|
(29
|
)
|
$
|
(133
|
)
|
-7
|
%
|
-24
|
%
|
|||||||
|
Adjusted PTC
|
$
|
353
|
|
$
|
369
|
|
$
|
510
|
|
$
|
(16
|
)
|
$
|
(141
|
)
|
-4
|
%
|
-28
|
%
|
|||||||
Fiscal year
2013
versus
2012
Including the
unfavorable
impact of foreign currency translation and remeasurement of
$18 million
, operating margin
decrease
d
$47 million
, or
8%
. This performance was driven primarily by the following businesses and key operating drivers:
|
•
|
Chivor (Colombia) decreased $42 million, as dry hydrological conditions reduced generation output and spot volumes but increased spot prices in the market. Lower volumes had an unfavorable impact of $115 million, partially offset by the favorable impact of $84 million from higher prices.
|
91
|
•
|
Gener (Chile) declined $8 million, as a reduction of $30 million from lower contract prices and higher spot purchases was partially offset by higher generation of $24 million, as the commencement of operations at Ventanas IV in March 2013 was offset by lower gas availability and lower coal generation.
|
These decreases were partially offset by:
|
•
|
AES Argentina increased $4 million, as lower outages of $18 million and higher volumes of $15 million were partially offset by lower rates of $8 million from the implementation of Resolution 95 and unfavorable exchange rates of $9 million.
|
Adjusted Operating Margin declined
$29 million
for the year due to the drivers above, adjusted for the impact of noncontrolling interests. AES owns 71% of Gener and Chivor and 100% of AES Argentina.
Adjusted PTC decreased
$16 million
, driven by the decrease of
$29 million
in Adjusted Operating Margin described above, partially offset by higher interest income from the beginning of the accrual of interest on the FONINVEMEM III receivables in Argentina.
Fiscal year
2012
versus
2011
Including the
unfavorable
impact of foreign currency translation and remeasurement of
$4 million
, operating margin for 2012
decrease
d
$163 million
, or
22%
. This performance was driven primarily by the following businesses and key operating drivers:
|
•
|
Gener decreased $122 million, driven by a decrease of $108 million from higher costs to supply energy contracts and lower spot sales from Termoandes in Argentina to Chile.
|
|
•
|
AES Argentina declined $61 million, as a result of lower prices of $28 million and higher fixed costs of $25 million.
|
These decreases were partially offset by:
|
•
|
Chivor increased $26 million, due to a non-recurring equity tax of $11 million recognized in 2011 and a favorable impact of $9 million from higher spot prices.
|
Adjusted Operating Margin declined
$133 million
due to the drivers above, excluding the impact of unrealized derivative losses. AES owns 71% of Gener and Chivor and 100% of AES Argentina.
Adjusted PTC decreased
$141 million
driven by the decrease of
$133 million
in Adjusted Operating Margin described above and a decrease in equity earnings from Guacolda of $12 million.
Brazil SBU
The following table summarizes Operating Margin, Adjusted Operating Margin and Adjusted PTC for our Brazil SBU for the periods indicated:
|
For the Years Ended December 31,
|
||||||||||||||||||||||||||
|
2013
|
2012
|
2011
|
$ Change 2013 vs. 2012
|
$ Change 2012 vs. 2011
|
% Change 2013 vs. 2011
|
% Change 2012 vs. 2011
|
||||||||||||||||||||
|
($’s in millions)
|
||||||||||||||||||||||||||
|
Operating Margin
|
$
|
871
|
|
$
|
969
|
|
$
|
1,802
|
|
$
|
(98
|
)
|
$
|
(833
|
)
|
-10
|
%
|
-46
|
%
|
|||||||
|
Noncontrolling Interests Adjustment
|
$
|
(600
|
)
|
(613
|
)
|
(1,313
|
)
|
|||||||||||||||||||
|
Derivatives Adjustment
|
—
|
|
—
|
|
—
|
|
||||||||||||||||||||
|
Adjusted Operating Margin
|
$
|
271
|
|
$
|
356
|
|
$
|
489
|
|
$
|
(85
|
)
|
$
|
(133
|
)
|
-24
|
%
|
-27
|
%
|
|||||||
|
Adjusted PTC
|
$
|
212
|
|
$
|
321
|
|
$
|
415
|
|
$
|
(109
|
)
|
$
|
(94
|
)
|
-34
|
%
|
-23
|
%
|
|||||||
Fiscal year
2013
versus
2012
Including the
unfavorable
impact of foreign currency translation of
$84 million
, operating margin
decrease
d
$98 million
, or
10%
. This performance was driven primarily by the following businesses and key operating drivers:
|
•
|
Sul decreased $96 million, due to lower tariffs of $33 million from the April 2013 tariff reset and lower volumes of $44 million due to lower demand.
|
|
•
|
Tietê decreased $81 million, driven by the negative impact of foreign currency translation of $68 million and lower volumes and higher energy purchases due to low hydrology of $24 million.
|
92
These decreases were partially offset by:
|
•
|
Uruguaiana increased $64 million, as a result of the extinguishment of a liability of $57 million and the temporary re-start of operations during February and March of 2013.
|
|
•
|
Eletropaulo increased $17 million, driven by higher tariffs of $171 million and lower fixed costs of $42 million, partially offset by the recognition of a regulatory liability $224 million related to customer refunds.
|
Adjusted Operating Margin decreased
$85 million
primarily due to the drivers discussed above, adjusted for the impact of noncontrolling interests. AES owns 16% of Eletropaulo, 46% of Uruguaiana, 100% of Sul and 24% of Tietê.
Adjusted PTC decreased
$109 million
, driven by the decrease of
$85 million
in Adjusted Operating Margin described above and higher interest expense from higher outstanding debt and a monetary correction related to the asset base ruling for Eletropaulo in December 2013.
Fiscal year
2012
versus
2011
Including the
unfavorable
impact of foreign currency translation of
$146 million
, operating margin
decrease
d
$833 million
, or
46%
. This performance was driven primarily by the following businesses and key operating drivers:
|
•
|
Eletropaulo decreased by $761 million, due to lower tariffs of $640 million driven by the July 2012 tariff reset, which was delayed from July 2011, and higher fixed costs of $218 million.
|
|
•
|
Tietê decreased $78 million, driven by the negative impact of foreign currency translation of $125 million, partially offset by higher PPA prices of $72 million from the annual PPA price adjustment.
|
These decreases were partially offset by:
|
•
|
Sul increased $10 million, as a result of included higher tariffs of $33 million from the annual tariff adjustment, partially offset by the negative impact of foreign currency translation of $26 million.
|
Adjusted Operating Margin decreased
$133 million
for the year primarily due to the drivers discussed above, adjusted for the impact of noncontrolling interests. AES owns 16% of Eletropaulo, 46% of Uruguaiana, 100% of Sul and 24% of Tietê.
Adjusted PTC decreased
$94 million
, as a result of the decrease of
$133 million
in Adjusted Operating Margin described above, partially offset by lower interest expense, as a result of lower interest rates and the prepayment of Brasiliana debt in December 2011.
MCAC SBU
The following table summarizes Operating Margin, Adjusted Operating Margin and Adjusted PTC for our MCAC SBU for the periods indicated:
|
For the Years Ended December 31,
|
||||||||||||||||||||||||||
|
2013
|
2012
|
2011
|
$ Change 2013 vs. 2012
|
$ Change 2012 vs. 2011
|
% Change 2013 vs. 2012
|
% Change 2012 vs. 2011
|
||||||||||||||||||||
|
($’s in millions)
|
||||||||||||||||||||||||||
|
Operating Margin
|
$
|
543
|
|
$
|
560
|
|
$
|
512
|
|
$
|
(17
|
)
|
$
|
48
|
|
-3
|
%
|
9
|
%
|
|||||||
|
Noncontrolling Interests Adjustment
|
$
|
(69
|
)
|
$
|
(74
|
)
|
$
|
(93
|
)
|
|||||||||||||||||
|
Derivatives Adjustment
|
(2
|
)
|
3
|
|
—
|
|
||||||||||||||||||||
|
Adjusted Operating Margin
|
$
|
472
|
|
$
|
489
|
|
$
|
419
|
|
$
|
(17
|
)
|
$
|
70
|
|
-3
|
%
|
17
|
%
|
|||||||
|
Adjusted PTC
|
$
|
339
|
|
$
|
387
|
|
$
|
307
|
|
$
|
(48
|
)
|
$
|
80
|
|
-12
|
%
|
26
|
%
|
|||||||
Fiscal year
2013
versus
2012
Including the unfavorable impact of currency translation of $2 million, operating margin
decrease
d
$17 million
, or
3%
. This performance was driven primarily by the following businesses and key operating drivers:
|
•
|
Panama decreased $75 million, driven by dry hydrological conditions, which resulted in lower generation and higher energy purchases at higher prices of $88 million, partially offset by favorable net settlements related to the Esti tunnel of $22 million.
|
93
This decrease was partially offset by:
|
•
|
Dominican Republic increased $42 million, as a result of higher net energy transactions of $28 million, higher gas sales to third parties of $20 million, partially offset by $6 million due to other factors such as higher fixed costs.
|
|
•
|
El Salvador increased $17 million, due to the tariff increase approved by the regulator at the beginning of 2013.
|
Adjusted Operating Margin decreased
$17 million
due to the drivers above, adjusted for the impact of noncontrolling interests and excluding unrealized gains and losses on derivatives. AES owns 89.8% of Changuinola and 49% of its other generation facilities in Panama, 100% of Andres and Los Mina and 50% of Itabo in the Dominican Republic and a weighted average of 75% of its businesses in El Salvador.
Adjusted PTC decreased
$48 million
, driven by the decrease in Adjusted Operating Margin of
$17 million
described above and lower interest income in the Dominican Republic and the receipt of property damage insurance proceeds in 2012 related to the Esti tunnel in Panama.
Fiscal year
2012
versus
2011
Including the
unfavorable
impact of foreign currency translation of
$2 million
, operating margin
increase
d
$48 million
, or
9%
. This performance was driven primarily by the following businesses and key operating drivers:
|
•
|
Panama, which increased $30 million, primarily driven by higher generation of $50 million from the re-start of operations at the Esti plant and the first full year of operations at Changuinola, which commenced operations in September 2011, partially offset by lower spot prices of $21 million;
|
|
•
|
Dominican Republic, which increased $10 million, primarily as a result of favorable prices of $35 million, primarily higher spot and LNG prices, as well as lower coal costs, partially offset by lower availability of $19 million.
|
|
•
|
Mexico, which increased by $12 million, driven by fewer outages at TEG and TEP of $8 million and higher volumes at Merida of $7 million.
|
Adjusted Operating Margin increased
$70 million
due to the drivers above adjusted for the impact of noncontrolling interests and excluding unrealized gains and losses on derivatives. AES owned 100% of Changuinola, 49% of its other generation facilities in Panama, 100% of Andres and Los Mina and 50% of Itabo in the Dominican Republic, and 100% of TEG and TEP and 65% of Merida in Mexico.
Adjusted PTC increased
$80 million
, driven by the increase in Adjusted Operating Margin of
$70 million
described above, realized foreign currency transaction gains in Mexico and higher equity in earnings from Trinidad. These favorable trends were partially offset by a one-time reimbursement of tax expense in the Dominican Republic in 2011.
EMEA SBU
The following table summarizes Operating Margin, Adjusted Operating Margin and Adjusted PTC for our EMEA SBU for the periods indicated:
|
For the Years Ended December 31,
|
||||||||||||||||||||||||||
|
2013
|
2012
|
2011
|
$ Change 2013 vs. 2012
|
$ Change 2012 vs. 2011
|
% Change 2013 vs. 2012
|
% Change 2012 vs. 2011
|
||||||||||||||||||||
|
($’s in millions)
|
||||||||||||||||||||||||||
|
Operating Margin
|
$
|
415
|
|
$
|
504
|
|
$
|
395
|
|
$
|
(89
|
)
|
$
|
109
|
|
-18
|
%
|
28
|
%
|
|||||||
|
Noncontrolling Interests Adjustment
|
$
|
(23
|
)
|
$
|
(55
|
)
|
$
|
(46
|
)
|
|||||||||||||||||
|
Derivatives Adjustment
|
—
|
|
(2
|
)
|
2
|
|
||||||||||||||||||||
|
Adjusted Operating Margin
|
$
|
392
|
|
$
|
447
|
|
$
|
351
|
|
$
|
(55
|
)
|
$
|
96
|
|
-12
|
%
|
27
|
%
|
|||||||
|
Adjusted PTC
|
$
|
345
|
|
$
|
375
|
|
$
|
276
|
|
$
|
(30
|
)
|
$
|
99
|
|
-8
|
%
|
|
36
|
%
|
||||||
Fiscal year
2013
versus
2012
Including the
favorable
impact of foreign currency translation of
$5 million
, operating margin
decrease
d
$89 million
, or
18%
. This performance was driven primarily by the following businesses and key operating drivers:
|
•
|
Cartagena (Spain) declined $105 million, as a result of:
|
94
|
◦
|
A non-recurring, favorable arbitration settlement of $95 million in the first quarter of 2012; and
|
|
◦
|
The two-stage sale of the business, as AES owned 71% of the facility through February 2012 and 14% through April 2013, when the sale was completed.
|
|
•
|
Ballylumford (United Kingdom) decreased $29 million, due to lower rates and capacity payments of $48 million, partially offset by fewer outages of $19 million.
|
These decreases were partially offset by:
|
•
|
Maritza (Bulgaria) increased $30 million, driven by $10 million from fewer outages, $6 million lower fixed costs, and favorable foreign exchange rates of $7 million.
|
|
•
|
Kilroot (United Kingdom) increased $28 million, driven by favorable dark spreads from higher energy prices and lower coal costs.
|
Adjusted Operating Margin decreased
$55 million
due to the drivers above adjusted for noncontrolling interests, primarily Cartagena, and excluding unrealized gains and losses on derivatives.
Adjusted PTC decreased
$30 million
, driven primarily by the decrease of
$55 million
in Adjusted Operating Margin described above, partially offset by lower interest expense and realized foreign currency gains at Kilroot and higher equity earnings from Turkey and Elsta.
Fiscal year
2012
versus
2011
Including the
unfavorable
impact of foreign currency translation of
$20 million
, operating margin
increase
d
$109 million
, or
28%
. This performance was driven primarily by the following businesses and key operating drivers:
|
•
|
Maritza increased $113 million, as a result of the first full year of operations. The plant commenced commercial op
erations in June 2011 and reached full capacity in December 2011.
|
|
•
|
Kilroot increased $35 million, due to increased dispatch of the plant.
|
|
•
|
Cart
agena increased $26 million, due to:
|
|
◦
|
A non-recurring favorable arbitration settlement of $95 million;
|
|
◦
|
Partially offset by a decrease from the sale of 80% of our ownership of Cartagena in February 2012, as discu
ssed above.
|
These increases were partially offset by:
|
•
|
Ballylumford decreased $49 million, due to lower rates and capacity payments under the PPA of $20 million, hig
her outages and related maintenance costs of $16 million, and lower volumes of $8 million.
|
Adjusted Operating Margin increased
$96 million
for the year, due to the drivers above adjusted for the impact of noncontrolling interests, primarily Cartagena, and excluding unrealized gains and losses on derivatives.
Adjusted PTC increased
$99 million
, driven by the increase of
$96 million
in Adjusted Operating Margin described above, as well as lower interest expense.
Asia SBU
Asia — Generation
The following table summarizes Operating Margin, Adjusted Operating Margin and Adjusted PTC for our Generation businesses in Asia for the periods indicated:
|
For the Years Ended December 31,
|
||||||||||||||||||||||||||
|
2013
|
2012
|
2011
|
$ Change 2013 vs. 2012
|
$ Change 2012 vs. 2011
|
% Change 2013 vs. 2012
|
% Change 2012 vs. 2011
|
||||||||||||||||||||
|
($’s in millions)
|
||||||||||||||||||||||||||
|
Operating Margin
|
$
|
169
|
|
$
|
236
|
|
$
|
167
|
|
$
|
(67
|
)
|
$
|
69
|
|
-28
|
%
|
41
|
%
|
|||||||
|
Noncontrolling Interests Adjustment
|
(10
|
)
|
(17
|
)
|
(12
|
)
|
||||||||||||||||||||
|
Derivatives Adjustment
|
—
|
|
(15
|
)
|
(2
|
)
|
||||||||||||||||||||
|
Adjusted Operating Margin
|
$
|
159
|
|
$
|
204
|
|
$
|
153
|
|
$
|
(45
|
)
|
$
|
51
|
|
-22
|
%
|
33
|
%
|
|||||||
|
Adjusted PTC
|
$
|
142
|
|
$
|
201
|
|
$
|
100
|
|
$
|
(59
|
)
|
$
|
101
|
|
-29
|
%
|
|
101
|
%
|
||||||
95
Fiscal year
2013
versus
2012
Operating margin decreased $67 million, or 28%. This performance was driven primarily by the following business and key operating drivers:
|
•
|
Masinloc (Philippines) decreased $62 million, due to:
|
|
◦
|
The net impact of higher contracted volumes at lower prices, as a result of a new 7-year contract to reduce spot exposure, with an unfavorable impact of $31 million;
|
|
◦
|
A reversal of a contingency of $16 million in 2012; and
|
|
◦
|
An unrealized derivative gain of $15 million in 2012.
|
Adjusted Operating Margin decreased
$45 million
due to the drivers above adjusted for the impact of non-controlling interests and excluding unrealized gains on derivatives. AES owns 92% of Masinloc.
Adjusted PTC decreased
$59 million
, driven by the decrease of
$45 million
in Adjusted Operating Margin described above, as well as a reduction in equity earnings from the sale of our businesses in China in 2012, partially offset by lower interest expense at Masinloc.
Fiscal year
2012
versus
2011
Including the favorable impact of foreign currency translation of
$6 million
, operating margin
increase
d
$69 million
, or
41%
. This performance was driven primarily by the following business and key operating drivers:
|
•
|
Masinloc increased by $73 million, due to higher market demand partially offset by lower rates of $36 million, a reversal of a contingency of $16 million, and a higher unrealized derivative gain of $13 million.
|
Adjusted Operating Margin increased
$51 million
due to the drivers discussed above adjusted for the impact of noncontrolling interests and excluding unrealized gains on derivatives. AES owns 92% of Masinloc.
Adjusted PTC increased
$101 million
, driven primarily by the increase of
$51 million
in Adjusted Operating Margin described above, as well as higher net equity in earnings from businesses in China, and lower business development costs.
Key Trends and Uncertainties
During 2014 and beyond, we expect to face the following challenges at certain of our businesses. Management expects that improved operating performance at certain businesses, growth from new businesses and global cost reduction initiatives may lessen or offset their impact. If these favorable effects do not occur, or if the challenges described below and elsewhere in this section impact us more significantly than we currently anticipate, or if volatile foreign currencies and commodities move more unfavorably, then these adverse factors (or other adverse factors unknown to us) may impact our operating margin, net income attributable to The AES Corporation and cash flows. We continue to monitor our operations and address challenges as they arise. For the risk factors related to our business, see Item 1. —
Business
and Item 1A. —
Risk Factors
of this Form 10-K.
Operational
Sensitivity to Dry Hydrological Conditions
Our hydroelectric generation facilities are sensitive to changes in the weather, particularly the level of water inflows into generation facilities. In 2013, Brazil, Panama, Colombia and Chile experienced lower than expected rainfall, while Chile also recorded lower snowpack relative to historical levels. Low rainfall and water inflows caused reservoir levels to be below historical levels, reduced generation output, and increased prices for electricity. Through February 2014, hydrological conditions in Brazil, Panama, Chile and Colombia continue to be below historical averages. If our hydroelectric generation facilities cannot generate sufficient energy to meet contractual arrangements, we may need to purchase energy to fulfill our obligations, which could have a material adverse impact on our results of operations. We expect hydrological volatility to continue for the remainder of 2014.
In Brazil, the system operator controls all hydroelectric generation dispatch and reservoir levels and manages an Energy Reallocation Mechanism to share hydrological risk across all generators. The Energy Reallocation Mechanism helps to manage our exposure to spot market prices in below-average hydrology scenarios. We expect the system operator in Brazil to pursue a more conservative reservoir management strategy going forward, including the dispatch of 12 to 15 GW of thermal generation capacity, which could result in electricity prices higher than historical levels.
96
Macroeconomic and Political
During the past few years, economic conditions in some countries where our subsidiaries conduct business have deteriorated. Global economic conditions remain volatile and could have an adverse impact on our businesses in the event these recent trends continue.
Argentina
— In Argentina, economic conditions are deteriorating, as measured by indicators such as non-receding inflation, increased government deficits, diminished sovereign reserves, lack of foreign currency accessibility, the potential for continued devaluation of the local currency, and a decline in expectations for economic growth. Many of these economic conditions in conjunction with the restrictions to freely access the foreign exchange currency established by the Argentine Government since 2012, have contributed to the development of a limited parallel unofficial foreign exchange market that is less favorable than the official exchange. At
December 31, 2013
, all transactions at our businesses in Argentina were translated using the official exchange rate published by the Argentine Central Bank. See Note 7 —
Long-Term Financing Receivables
in Item 8. —
Financial Statements and Supplementary Data
of this Form 10-K for further information on the long-term receivables. In January 2014, the Argentine Peso devalued by approximately 20%, the most rapid depreciation since 2002. Further weakening of the Argentine Peso and local economic activity could cause significant volatility in our results of operations, cash flows, the ability to pay dividends to the Parent Company, and the value of our assets.
Bulgaria
—Our investments in Bulgaria rely on offtaker contracts with NEK, the state-owned electricity public supplier and energy trading company. Maritza, a coal-fired generation facility, has experienced ongoing delays in the collection of outstanding receivables from its offtaker. In November 2013, Maritza and NEK signed a rescheduling agreement for the overdue receivables as of the agreement date. Under the terms of the agreement, NEK paid $70 million of the overdue receivables and agreed to pay the remaining receivables in 13 equal monthly installments beginning December 2013. NEK has made payments according to the schedule through January 2014. As of
December 31, 2013
, Maritza had an outstanding receivables of $151 million representing $21 million of current receivables, $60 million of the rescheduled receivables not yet due and $70 million of receivables overdue by less than 90 days. Although Maritza continued to collect overdue receivables during the fourth quarter of 2013, there can be no assurance that the business will continue making collections, which could result in a write-off of the remaining receivables. In addition, depending on NEK’s ability to honor its obligations and other factors, the value of other assets could also be impaired, or the business may be in another default of its loan covenants. The Company has long-lived assets in Bulgaria of $1.7 billion and net equity of $639 million. See Note 12 —
Debt
included in Item 8.—
Financial Statements and Supplementary Data
of this Form 10-K for further information on current existing debt defaults. Further, Maritza is in litigation related to construction delays and related matters. For further information on the litigation see Item 3. —
Legal Proceedings
.
Furthermore, as noted in Item 1. —
Business — Bulgaria
, during the fourth quarter of 2013, NEK requested a consent from Maritza for a restructuring. In February 2014, the NEK restructuring was implemented after approval by the regulatory authorities. Maritza and its lenders are analyzing the NEK restructuring and its impact on NEK’s financial condition and liquidity. If Maritza and its lenders do not consent and if NEK’s credit rating falls below the rating NEK had upon the issuance of the Government Support Letter in 2005, NEK will have defaulted under the PPA, which will trigger an event of default under the project debt agreements. For further information on the importance of long-term contracts and our counterparty credit risk, see Item 1A. — Risk Factors —
“We may not be able to enter into long-term contracts, which reduce volatility in our results of operations.
” As a result of any of the foregoing events, we may face a loss of earnings and/or cash flows from the affected businesses (or be unable to exercise remedies for a breach of the PPA) and may have to provide loans or equity to support affected businesses or projects, restructure them, write down their value and/or face the possibility that these projects cannot continue operations or provide returns consistent with our expectations, any of which could have a material impact on the Company.
If global economic conditions deteriorate further, it could also affect the prices we receive for the electricity we generate or transmit. Utility regulators or parties to our generation contracts may seek to lower our prices based on prevailing market conditions pursuant to PPAs, concession agreements or other contracts as they come up for renewal or reset. In addition, rising fuel and other costs coupled with contractual price or tariff decreases could restrict our ability to operate profitably in a given market. Each of these factors, as well as those discussed above, could result in a decline in the value of our assets including those at the businesses we operate, our equity investments and projects under development and could result in asset impairments that could be material to our operations. We continue to monitor our projects and businesses.
97
Impairments
Goodwill
—
In the fourth quarter of
2013
, the Company completed its annual October 1 goodwill impairment tests and recognized goodwill impairment expense of
$314 million
. The Company also identified three reporting units, DP&L, DPLER and Buffalo Gap, which were considered “at risk.” A reporting unit is considered “at risk” when its fair value is not higher than its carrying amount by more than 10%. The Company monitors its reporting units at risk of step 1 failure on an ongoing basis. During the nine months ended September 30, 2013, such evaluations continued at Ebute, considered at risk as of December 31, 2012, and culminated in the recognition of goodwill impairment expense of $58 million in the third quarter of 2013. Since 2012, the DP&L reporting unit remains at risk subsequent to its goodwill impairment of $1.82 billion recognized in 2012 and
$307 million
in the fourth quarter of 2013. During the nine months ended September 30, 2013, the Company continued to monitor the business environment and regulatory developments. In the fourth quarter of 2013, DP&L recognized goodwill impairment expense of
$307 million
as part of its annual goodwill impairment test. Buffalo Gap failed Step 1 of the annual goodwill impairment test, but no goodwill impairment was recognized. It is possible that the Company may incur goodwill impairment at DP&L, DPLER, Buffalo Gap or any of other reporting unit in future periods if adverse changes in their business or operating environments occur. As of December 31, 2013, DP&L, DPLER and Buffalo Gap had goodwill of
$316 million
, $136 million and $28 million, respectively. See Note
10
—
Goodwill and Other Intangible Assets
included in Item 8. —
Financial Statements and Supplementary Data
of this Form 10-K for further information.
Capital Resources and Liquidity
Overview
As of
December 31, 2013
, the Company had unrestricted cash and cash equivalents of
$1.6 billion
, of which approximately
$132 million
was held at the Parent Company and qualified holding companies, and approximately
$668 million
was held in short term investments primarily at subsidiaries. In addition, we had restricted cash and debt service reserves of
$1.1 billion
. The Company also had non-recourse and recourse aggregate principal amounts of debt outstanding of
$15.4 billion
and
$5.7 billion
, respectively. Of the approximately
$2.1 billion
of our current non-recourse debt,
$1.0 billion
was presented as such because it is due in the next twelve months and
$1.1 billion
relates to debt considered in default due to covenant violations. We expect such current maturities will be repaid from net cash provided by operating activities of the subsidiary to which the debt relates or through opportunistic refinancing activity or some combination thereof. Approximately
$118 million
of our recourse debt matures within the next twelve months, which we expect to repay using a combination of cash on hand at the Parent Company, net cash provided by operating activities and/or net proceeds from the issuance of new debt at the Parent Company.
We rely mainly on long-term debt obligations to fund our construction activities. We have, to the extent available at acceptable terms, utilized non-recourse debt to fund a significant portion of the capital expenditures and investments required to construct and acquire our electric power plants, distribution companies and related assets. Our non-recourse financing is designed to limit cross default risk to the Parent Company or other subsidiaries and affiliates. Our non-recourse long-term debt is a combination of fixed and variable interest rate instruments. Generally, a portion or all of the variable rate debt is fixed through the use of interest rate swaps. In addition, the debt is typically denominated in the currency that matches the currency of the revenue expected to be generated from the benefiting project, thereby reducing currency risk. In certain cases, the currency is matched through the use of derivative instruments. The majority of our non-recourse debt is funded by international commercial banks, with debt capacity supplemented by multilaterals and local regional banks.
Given our long-term debt obligations, the Company is subject to interest rate risk on debt balances that accrue interest at variable rates. When possible, the Company will borrow funds at fixed interest rates or hedge its variable rate debt to fix its interest costs on such obligations. In addition, the Company has historically tried to maintain at least 70% of its consolidated long-term obligations at fixed interest rates, including fixing the interest rate through the use of interest rate swaps. These efforts apply to the notional amount of the swaps compared to the amount of related underlying debt. Presently, the Parent Company’s only material un-hedged exposure to variable interest rate debt relates to indebtedness under its senior secured credit facility. On a consolidated basis, of the Company’s
$15.4 billion
of total non-recourse debt outstanding as of
December 31, 2013
, approximately
$3.8 billion
bore interest at variable rates that were not subject to a derivative instrument which fixed the interest rate.
In addition to utilizing non-recourse debt at a subsidiary level when available, the Parent Company provides a portion, or in certain instances all, of the remaining long-term financing or credit required to fund development, construction or acquisition of a particular project. These investments have generally taken the form of equity investments or intercompany loans, which are subordinated to the project’s non-recourse loans. We generally obtain the funds for these investments from our cash flows from operations, proceeds from the sales of assets and/or the proceeds from our issuances of debt, common stock and other securities. Similarly, in certain of our businesses, the Parent Company may provide financial guarantees or other credit support
98
for the benefit of counterparties who have entered into contracts for the purchase or sale of electricity, equipment or other services with our subsidiaries or lenders. In such circumstances, if a business defaults on its payment or supply obligation, the Parent Company will be responsible for the business’ obligations up to the amount provided for in the relevant guarantee or other credit support. At
December 31, 2013
, the Parent Company had provided outstanding financial and performance-related guarantees or other credit support commitments to or for the benefit of our businesses, which were limited by the terms of the agreements, of approximately
$661 million
in aggregate (excluding those collateralized by letters of credit and other obligations discussed below).
As a result of the Parent Company’s below investment grade rating, counterparties may be unwilling to accept our general unsecured commitments to provide credit support. Accordingly, with respect to both new and existing commitments, the Parent Company may be required to provide some other form of assurance, such as a letter of credit, to backstop or replace our credit support. The Parent Company may not be able to provide adequate assurances to such counterparties. To the extent we are required and able to provide letters of credit or other collateral to such counterparties, this will reduce the amount of credit available to us to meet our other liquidity needs. At
December 31, 2013
, we had
$1 million
in letters of credit outstanding, provided under our senior secured credit facility, and
$163 million
in cash collateralized letters of credit outstanding outside of our senior secured credit facility. These letters of credit operate to guarantee performance relating to certain project development activities and business operations. During the year ended
December 31, 2013
, the Company paid letter of credit fees ranging from
0.2%
to
3.25%
per annum on the outstanding amounts.
We expect to continue to seek, where possible, non-recourse debt financing in connection with the assets or businesses that we or our affiliates may develop, construct or acquire. However, depending on local and global market conditions and the unique characteristics of individual businesses, non-recourse debt may not be available on economically attractive terms or at all. If we decide not to provide any additional funding or credit support to a subsidiary project that is under construction or has near-term debt payment obligations and that subsidiary is unable to obtain additional non-recourse debt, such subsidiary may become insolvent, and we may lose our investment in that subsidiary. Additionally, if any of our subsidiaries lose a significant customer, the subsidiary may need to withdraw from a project or restructure the non-recourse debt financing. If we or the subsidiary choose not to proceed with a project or are unable to successfully complete a restructuring of the non-recourse debt, we may lose our investment in that subsidiary.
Many of our subsidiaries depend on timely and continued access to capital markets to manage their liquidity needs. The inability to raise capital on favorable terms, to refinance existing indebtedness or to fund operations and other commitments during times of political or economic uncertainty may have material adverse effects on the financial condition and results of operations of those subsidiaries. In addition, changes in the timing of tariff increases or delays in the regulatory determinations under the relevant concessions could affect the cash flows and results of operations of our businesses.
As of
December 31, 2013
, the Company had approximately
$306 million
and
$24 million
of accounts receivable related to certain of its generation businesses in Argentina and the Dominican Republic and its utility businesses in Brazil classified as
“Noncurrent assets — other”
and “
Current assets — Accounts receivable
,” respectively. The noncurrent portion primarily consists of accounts receivable in Argentina that, pursuant to amended agreements or government resolutions, have collection periods that extend beyond
December 31,
2014
, or one year from the latest balance sheet date. The majority of Argentinian receivables have been converted into long-term financing for the construction of power plants. See Note 7 —
Long-Term Financing Receivables
included in Item 8. —
Financial Statements and Supplementary Data
and Item 1. —
Business
—
Regulatory Matters — Argentina
of this Form 10-K for further information.
Consolidated Cash Flows
During the
year ended
December 31, 2013
, cash and cash equivalents
decrease
d
$258 million
to
$1.6 billion
. The
decrease
in cash and cash equivalents was due to
$2.7 billion
of cash
provided by
operating activities,
$1.8 billion
of cash
used in
investing activities,
$1.1 billion
of cash
used in
financing activities,
an unfavorable
effect of foreign currency exchange rates on cash of
$59 million
and a
$4 million
increase
in cash of discontinued and held-for-sale businesses.
|
$ Change
|
||||||||||||||||||||
|
2013
|
2012
|
2011
|
2013 vs. 2012
|
2012 vs. 2011
|
||||||||||||||||
|
(in millions)
|
||||||||||||||||||||
|
Net cash provided by (used in) operating activities
|
$
|
2,715
|
|
$
|
2,901
|
|
$
|
2,884
|
|
$
|
(186
|
)
|
$
|
17
|
|
|||||
|
Net cash provided by (used in) investing activities
|
(1,774
|
)
|
(895
|
)
|
(4,906
|
)
|
(879
|
)
|
4,011
|
|
||||||||||
|
Net cash provided by (used in) financing activities
|
(1,136
|
)
|
(1,867
|
)
|
1,412
|
|
731
|
|
(3,279
|
)
|
||||||||||
99
Operating Activities
Operating cash flow for the
year ended
December 31, 2013
resulted primarily from the net income adjusted for non-cash items, principally depreciation and amortization, gain from sale of investments and impairment expense, partially offset by a net use of cash for operating activities of
$76 million
in operating assets and liabilities. This was primarily due to the following:
|
•
|
a decrease of
$725 million
in accounts payable and other current liabilities primarily at Eletropaulo and Sul due to lower costs and a decrease in regulatory liabilities and at Uruguaiana primarily related to the extinguishment of a liability as well as lower generation and higher payments to fuel supplier at Kelanitissa;
|
|
•
|
an increase of
$103 million
in other assets primarily due to an increase in noncurrent regulatory assets at Eletropaulo and Sul, resulting from higher priced energy purchases which are recoverable through future tariffs and an increase at Alicura related to the recognition of interest associated to FONINVEMEM agreement, partially offset by a decrease in noncurrent regulatory assets at IPL related to the annual adjustment to pension benefits based on the actuarial valuation; partially offset by
|
|
•
|
a decrease of
$358 million
in prepaid expenses and other current assets mainly due to a decrease in current regulatory assets, for the recovery of prior period tariff cycle energy purchases and regulatory charges at Eletropaulo;
|
|
•
|
a decrease of
$146 million
in accounts receivable primarily related to lower tariffs at Eletropaulo combined with lower tariff and reduced consumption at Sul as well as lower revenue offset by higher collections at Kelanitissa, partially offset by lower collections at Maritza; and
|
|
•
|
an increase of
$137 million
in other liabilities primarily due to an increase in noncurrent regulatory liabilities at Eletropaulo partially offset by a decrease in pension liability at IPL ;
|
|
•
|
an increase of
$95 million
in net income tax and other tax payables primarily due to accruals for new current tax liabilities offset by payments of income taxes.
|
Net cash provided by operating activities was
$2.9 billion
during the
year ended
December 31, 2012
. Operating cash flow for the
year ended
December 31, 2012
resulted primarily from net loss adjusted for non-cash items, principally gain and losses on sales and disposals and impairment charges, depreciation and amortization and deferred income taxes, partially offset by a net use of cash for operating activities of
$68 million
for operating assets and liabilities. This was primarily due to:
|
•
|
an increase of
$589 million
in other assets primarily due to an increase in noncurrent regulatory assets at Eletropaulo, resulting from higher priced energy purchases, regulatory charges and transmission costs which are recoverable through future tariffs and the establishment of a noncurrent note receivable at Cartagena in Spain following the arbitration settlement, prior to its deconsolidation;
|
|
•
|
an increase of
$241 million
in accounts receivable primarily due to lower collection Eletropaulo and Andres as well as an increase in revenue at Sul and Kelanitissa;
|
|
•
|
a decrease of
$47 million
in net income tax and other tax payables primarily for the payment of income taxes in excess of the accrual of new tax liabilities; partially offset by
|
|
•
|
an increase of
$335 million
in other liabilities primarily explained by an increase in noncurrent regulatory liabilities at Eletropaulo related to the tariff reset;
|
|
•
|
an increase of
$330 million
in accounts payable and other current liabilities primarily at Eletropaulo due to an increase in current regulatory liabilities driven by the tariff reset, offset by a decrease in other current liabilities arising from value-added tax payables; and
|
|
•
|
a decrease of
$120 million
in prepaid expenses and other current assets mainly due to the recovery of value-added taxes at our construction projects in Chile.
|
Net cash provided by operating activities was
$2.9 billion
for the
year ended
December 31, 2011
. Operating cash flow resulted primarily from net income adjusted for non-cash items, principally depreciation and amortization, contingencies, deferred income taxes, losses on the extinguishment of debt, gains and losses on sales and disposals and impairment charges as well as a net favorable change of
$52 million
in operating assets and liabilities. This was primarily due to:
|
•
|
an increase of
$351 million
in other liabilities primarily due to an increase in noncurrent regulatory liabilities at Eletropaulo and Sul as the result of lower prices paid for energy purchases compared with the charges recovered through the tariff;
|
100
|
•
|
an increase of
$322 million
in accounts payable and other current liabilities primarily driven by an increase in current regulatory liabilities at Eletropaulo driven by the tariff reset, partially offset by the amount returned to consumers for regulatory liabilities and VAT on commercial losses reversal, as well as an increase in accrued interest on recourse debt at the Parent Company;
|
|
•
|
an increase of
$166 million
net income tax payables and other tax payables primarily due to accruals for new current tax liabilities offset by payments of income taxes; partially offset by
|
|
•
|
an increase of
$403 million
in other assets mainly explained by an increase in noncurrent regulatory assets at Eletropaulo, resulting from higher priced energy purchases, transmission costs and regulatory charges compared with charges recovered through the tariff;
|
|
•
|
an increase of
$236 million
in accounts receivable primarily due to an increase in amounts billed at several businesses including Eletropaulo and new plants at Maritza and Angamos; and
|
|
•
|
an increase of
$141 million
in inventory primarily driven by higher coal purchases at Gener as well as increased inventory at Angamos as it started operations in 2011.
|
The net
decrease
in cash flows from operating activities of
$186 million
, or
6%
to
$2.7 billion
for the
year ended
December 31, 2013
compared to the
year ended
December 31, 2012
was primarily the result of the following:
|
•
|
US — an increase of $74 million primarily due to bankruptcy settlement payment of the New York entities in 2012 and the proceeds from the PPA termination at Beaver Valley in January 2013;
|
|
•
|
Andes — a decrease of $276 million primarily driven by higher working capital requirements;
|
|
•
|
Brazil — a decrease of $106 million primarily related to lower collections and higher energy purchases at Sul, partially offset by the recovery of deferred costs from regulator, lower transmission costs and regulatory charges at Eletropaulo;
|
|
•
|
MCAC — an increase of $185 million primarily driven by a $90 million payment related to an amendment to a fuel contract and lower working capital requirements;
|
|
•
|
Asia — a decrease of $85 million primarily driven by higher working capital requirements and lower operating results at Masinloc.
|
The net decrease in cash flows from operating activities of
$17 million
, or
1%
to
$2.9 billion
for the
year ended
December 31, 2012
compared to the
year ended
December 31, 2011
was primarily the result of the following:
|
•
|
US — an increase of $320 million at our utility businesses primarily due to the operations, net of debt service costs, of DPL which was acquired in November 2011;
|
|
•
|
Andes — an increase of $57 million driven by cash provided by the operating activities of the new plant at Angamos, recovery of value added tax at Campiche and reduced working capital requirements at Gener, partially offset by reduced operating margin from Gener operations other than Angamos;
|
|
•
|
Brazil — a decrease of $503 million at our utility businesses primarily driven by higher priced energy purchases, regulatory charges and transmission costs payments, higher operating and maintenance expenses and lower accounts receivable collections due to the lower tariff starting in July 2012 at Eletropaulo, partially offset by a lower payment of income taxes;
|
|
•
|
MCAC — an increase of $25 million at our generation businesses primarily due to the operations of the Esti plant being back on line from June 2012 and higher volumes of PPA sales at Panama and lower coal volume and prices in 2012 at Itabo, partially offset by lower collections and lower sales in the Dominican Republic and higher taxes paid at Panama;
|
|
•
|
EMEA — an increase of $42 million driven primarily by cash provided by the operating activities of the new plant at Maritza partially offset by a loss in revenue from a generator failure at Ballylumford in Northern Ireland; and
|
|
•
|
Asia — an increase of $88 million driven primarily by Masinloc in the Philippines due to higher demand and reduced working capital requirements.
|
101
Investing Activities
Net cash
used in
investing activities was
$1.8 billion
for the
year ended
December 31, 2013
primarily attributable to the following:
|
•
|
Capital expenditures of $
2.0 billion
consisting of $1.1 billion of growth capital expenditures and $934 million of maintenance and environmental capital expenditures. Growth capital expenditures included amounts at Gener of $317 million, Eletropaulo of $223 million, Jordan of $200 million, Sul of $72 million, Mong Duong of $48 million, DPL of $40 million, Sixpenny Wood of $25 million, Altai of $21 million, Yelvertoft of $20 million and Kribi of $20 million. Maintenance and environmental expenditures included amounts at IPL of $246 million, Eletropaulo of $138 million, Tietê of $94 million, Gener of $92 million, DPL of $76 million, Sul of $61 million and Altai of $43 million; partially offset by
|
|
•
|
Proceeds from the sale of businesses, net of cash sold of $
170 million
including $110 million for the sale of the Ukraine businesses, $31 million for the sale of our 10% equity interest in Trinidad and $24 million for the sale of our remaining interest in Cartagena.
|
Net cash
used in
investing activities was
$895 million
for the
year ended
December 31, 2012
primarily attributable to the following:
|
•
|
Capital expenditures of $
2.1 billion
consisting of $1.1 billion of growth capital expenditures and $1 billion of maintenance and environmental capital expenditures. Growth capital expenditures included amounts at Gener of $258 million, Eletropaulo of $236 million, Sul of $111 million, Mong Duong of $83 million, DPL of $71 million, Kribi of $51, Maritza of $35 million, K2 YEL of $24 million, Drone Hill of $20 million and Mountain View 4 of $18 million. Maintenance and environmental capital expenditures included amounts at Eletropaulo of $215 million, IPL of $134 million, DPL of $117 million, Sul of $90 million, Gener of $77 million, Panama of $68 million, Tietê of $63 million, Altai of $26 million, Termo Andes of $24 million, Alicura of $22 million and Itabo of $22 million; partially offset by
|
|
•
|
Proceeds from the sale of businesses, net of cash sold of $
639 million
including $228 million for the sale of Red Oak and Ironwood, $164 million for the sale of three wholly-owned hydropower plants previously owned by the IC Ictas joint venture to our Entek joint venture in which we hold a 50% interest, $131 million for the sale of Cili and several equity method investments in China, $63 million for the sale of 80% of our interest in Cartagena and $42 million for the sale of our investments in Innovent and St. Patrick;
|
|
•
|
Sales of short-term investments, net of purchases of $
530 million
including amounts at Eletropaulo of $232 million, Gener of $126 million, Brasiliana of $102 million, Sul of $56 million and Tietê of $28 million; and
|
|
•
|
Proceeds from government grants for asset construction of $
122 million
including amounts at Laurel Mountain of $82 million and Mountain View 4 of $30 million.
|
Net cash
used in
investing activities
increase
d
$879 million
to
$1.8 billion
for the
year ended
December 31, 2013
compared to net cash
used in
investing activities of
$895 million
for the
year ended
December 31, 2012
. This net
increase
was primarily due to an increase in purchases of short-term investments, net of sales of $
612 million
and a decrease in proceeds from the sale of businesses, net of cash sold of
$469 million
, partially offset by a decrease in capital expenditures of $
120 million
.
Financing Activities
Net cash
used in
financing activities was
$1.1 billion
for the
year ended
December 31, 2013
primarily attributable to the following:
|
•
|
Repayments of recourse and non-recourse debt of
$4.6 billion
including amounts at the Parent Company of $1.2 billion, DPL of $948 million, Masinloc of $560 million, Changuinola of $412 million, Tietê of $396 million, Caess of $301 million, IPL of $110 million, Warrior Run of $100 million, Puerto Rico of $73 million, Maritza of $57 million, Southland of $54 million, Sonel of $47 million and Sul of $44 million;
|
|
•
|
Payments for financed capital expenditures were
$591 million
primarily at Mong Duong for payments to the contractors which took place more than three months after the associated equipment was purchased or work performed;
|
|
•
|
Distributions to noncontrolling interests of
$557 million
including amounts at Tietê of $205 million, Brasiliana of $128 million, Gener of $62 million and Buffalo Gap of $54 million;
|
102
|
•
|
Purchase of treasury stock of
$322 million
at the Parent Company;
|
|
•
|
Payments for financing fees of
$176 million
including amounts at Gener of $54 million including amounts at the Alto Maipo and Cochrane projects, Mong Duong of $28 million and Eletropaulo of $25 million; partially offset by
|
|
•
|
Issuances of recourse and non-recourse debt of
$5 billion
including amounts of $750 million at the Parent Company, Gener of $707 million including amounts at the Cochrane and Alto Maipo projects, DPL of $645 million, Masinloc of $500 million, Tietê of $496 million, Mong Duong of $471 million, Changuinola of $420 million, Caess of $310 million, Jordan of $180 million, IPL of $170 million and Sul of $153 million; and
|
|
•
|
Contributions from noncontrolling interests of $
210 million
including amounts at Gener of $109 million including amounts at the Cochrane and Alto Maipo projects and at Mong Duong of $77 million.
|
Net cash
used in
financing activities was
$1.9 billion
for the
year ended
December 31, 2012
primarily attributable to the following:
|
•
|
Repayments of recourse and non-recourse debt of
$1.6 billion
including amounts at Eletropaulo of $510 million, the Parent Company of $236 million, Kribi of $181 million, Gener of $83 million, Southland of $48 million, Maritza of $47 million, Puerto Rico of $47 million, Sonel of $47 million, , Nigen of $40 million, Masinloc of $40 million, Warrior Run of $35 million and Hawaii of $30 million;
|
|
•
|
Distributions to noncontrolling interests of
$895 million
including amounts at Brasiliana of $255 million, Tietê of $249 million, Eletropaulo of $203 million, Gener of $93 million and Panama of $23 million;
|
|
•
|
Repayments under the revolving credit facilities of
$321 million
including amounts at the Parent Company of $295 million and Alicura of $33 million;
|
|
•
|
The purchase of treasury stock at the Parent Company was
$301 million
;
|
|
•
|
Financed capital expenditures of
$162 million
primarily at Mong Duong for payments to the contractors which took place more than three months after the associated equipment was purchased or work performed; partially offset by
|
|
•
|
Issuance of non-recourse debt of $
1.4 billion
including amounts at Eletropaulo of $715 million, Kribi of $245 million, Mong Duong of $185 million, K2 YEL of $48 million, Sul of $48 million, Alicura of $35 million and Panama of $25 million.
|
Net cash
used in
financing activities
decrease
d
$731 million
to
$1.1 billion
for the
year ended
December 31, 2013
compared to net cash
used in
financing activities of
$1.9 billion
for the
year ended
December 31, 2012
. This net
decrease
was primarily due to an increase in the issuance of recourse and non-recourse debt of $
3.6 billion
, decreases in distributions to noncontrolling interests of $
338 million
, net repayments under revolving credit facilities of $
299 million
and an increase in contributions from noncontrolling interests of
$167 million
. This was partially offset by an increase in the repayments of recourse and non-recourse debt of $
3 billion
, an increase in payments for financed capital expenditures of $
429 million
, an increase in payments for financings fees of $
136 million
and dividends paid of
$89 million
.
Proportional Free Cash Flow (a non-GAAP measure)
We define Proportional Free Cash Flow as cash flows from operating activities less maintenance capital expenditures (including non-recoverable environmental capital expenditures), adjusted for the estimated impact of noncontrolling interests.
We exclude environmental capital expenditures that are expected to be recovered through regulatory, contractual or other mechanisms. An example of recoverable environmental capital expenditures is IPL's investment in MATS-related environmental upgrades that are recovered through a tracker. See Item 1.
US SBU — IPL — Environmental Matters
for details of these investments.
The GAAP measure most comparable to proportional free cash flow is cash flows from operating activities. We believe that proportional free cash flow better reflects the underlying business performance of the Company, as it measures the cash generated by the business, after the funding of maintenance capital expenditures, that may be available for investing or repaying debt or other purposes. Factors in this determination include the impact of noncontrolling interests, where AES consolidates the results of a subsidiary that is not wholly-owned by the Company.
The presentation of free cash flow has material limitations. Proportional free cash flow should not be construed as an alternative to cash from operating activities, which is determined in accordance with GAAP. Proportional free cash flow does not represent our cash flow available for discretionary payments because it excludes certain payments that are required or to
103
which we have committed, such as debt service requirements and dividend payments. Our definition of proportional free cash flow may not be comparable to similarly titled measures presented by other companies.
|
2013
|
2012
|
2011
|
||||||||||
|
(in millions)
|
||||||||||||
|
Consolidated
|
||||||||||||
|
Net cash provided by operating activities
|
$
|
2,715
|
|
$
|
2,901
|
|
$
|
2,884
|
|
|||
|
Less: Maintenance Capital Expenditures, net of reinsurance proceeds
|
760
|
|
923
|
|
878
|
|
||||||
|
Less: Non-recoverable Environmental Capital Expenditures
|
101
|
|
66
|
|
17
|
|
||||||
|
Free Cash Flow
|
$
|
1,854
|
|
$
|
1,912
|
|
$
|
1,989
|
|
|||
|
|
|
|
|
|
|
|||||||
|
Reconciliation of Proportional Operating Cash Flow
|
||||||||||||
|
Net cash provided by operating activities
|
$
|
2,715
|
|
|
$
|
2,901
|
|
|
$
|
2,884
|
|
|
|
Less: Proportional Adjustment Factor
|
$
|
834
|
|
|
$
|
966
|
|
|
$
|
1,312
|
|
|
|
Proportional Operating Cash Flow
|
$
|
1,881
|
|
|
$
|
1,935
|
|
|
$
|
1,572
|
|
|
|
Proportional
|
|
|
|
|
|
|
||||||
|
Proportional Operating Cash Flow
|
$
|
1,881
|
|
$
|
1,935
|
|
$
|
1,572
|
|
|||
|
Less: Proportional Maintenance Capital Expenditures, net of reinsurance proceeds
|
535
|
|
634
|
|
563
|
|
||||||
|
Less: Proportional Non-recoverable Environmental Capital Expenditures
|
75
|
|
51
|
|
12
|
|
||||||
|
Proportional Free Cash Flow
|
$
|
1,271
|
|
$
|
1,250
|
|
$
|
997
|
|
|||
Proportional Free Cash Flow for the
year ended
December 31, 2013
compared to the
year ended
December 31, 2012
increased
$21 million
, driven primarily by increases from the following SBUs and key operating drivers:
|
•
|
MCAC, driven by higher operating cash flow, as a result of a $90 million payment related to an amendment to a fuel contract and lower working capital requirements, and
|
|
•
|
US, as a result of higher operating cash flow from a bankruptcy settlement payment of the New York entities in 2012 and the proceeds from the PPA termination at Beaver Valley in January 2013, as well as lower capital expenditures.
|
These increases were partially offset by:
|
•
|
Andes, driven by lower operating cash flow from higher working capital requirements, and
|
|
•
|
Asia, largely due to lower operating cash flow from higher working capital requirements and lower operating results at Masinloc.
|
Proportional Free Cash Flow for the
year ended
December 31, 2012 compared to the
year ended
December 31, 2011
increased
$253 million
, driven primarily by increases from the following SBUs and key operating drivers:
|
•
|
US, driven by higher operating cash flow at our utility businesses primarily due to the operations, net of debt service costs, of DPL which was acquired in November 2011.
|
This increase was partially offset by:
|
•
|
Brazil, driven by lower operating cash flow at Eletropaulo.
|
Contractual Obligations
A summary of our contractual obligations, commitments and other liabilities as of December 31, 2013 is presented in the table below, which excludes any businesses classified as discontinued operations or held-for-sale (in millions):
|
Contractual Obligations
|
Total
|
Less than 1 year
|
1-3 years
|
3-5 years
|
More than 5 years
|
Other
|
Footnote Reference
(5)
|
||||||||||||||||||||
|
Debt Obligations
(1)
|
$
|
21,049
|
|
$
|
2,180
|
|
$
|
3,846
|
|
$
|
4,158
|
|
$
|
10,865
|
|
$
|
—
|
|
12
|
|
|||||||
|
Interest Payments on Long-Term Debt
(2)
|
8,159
|
|
1,215
|
|
2,177
|
|
1,583
|
|
3,184
|
|
—
|
|
n/a
|
|
|||||||||||||
|
Capital Lease Obligations
(3)
|
195
|
|
13
|
|
25
|
|
21
|
|
136
|
|
—
|
|
13
|
|
|||||||||||||
|
Operating Lease Obligations
(3)
|
602
|
|
41
|
|
82
|
|
80
|
|
399
|
|
—
|
|
13
|
|
|||||||||||||
|
Electricity Obligations
(3)
|
41,165
|
|
2,793
|
|
5,600
|
|
4,941
|
|
27,831
|
|
—
|
|
13
|
|
|||||||||||||
|
Fuel Obligations
(3)
|
6,746
|
|
1,274
|
|
1,155
|
|
866
|
|
3,451
|
|
—
|
|
13
|
|
|||||||||||||
|
Other Purchase Obligations
(3)
|
10,496
|
|
1,526
|
|
2,301
|
|
1,250
|
|
5,419
|
|
—
|
|
13
|
|
|||||||||||||
|
Other Long-Term Liabilities
|
|
||||||||||||||||||||||||||
|
Reflected on AES’s Consolidated Balance Sheet under GAAP
(4)
|
869
|
|
—
|
|
255
|
|
93
|
|
381
|
|
140
|
|
n/a
|
|
|||||||||||||
|
Total
|
$
|
89,281
|
|
$
|
9,042
|
|
$
|
15,441
|
|
$
|
12,992
|
|
$
|
51,666
|
|
$
|
140
|
|
|||||||||
104
|
(1)
|
Includes recourse and non-recourse debt presented on the Consolidated Balance Sheet. See Note 12—
Debt
to the Consolidated Financial Statements included in Item 8—
Financial Statements and Supplementary Data
of this Form 10-K which provides additional disclosure regarding these obligations. These amounts exclude capital lease obligations which are included in the capital lease category, see (3) below.
|
|
(2)
|
Interest payments are estimated based on final maturity dates of debt securities outstanding at December 31,
2013
and do not reflect anticipated future refinancing, early redemptions or new debt issuances. Variable rate interest obligations are estimated based on rates as of December 31,
2013
.
|
|
(3)
|
See Note 13—
Commitments
to the Consolidated Financial Statements included in Item 8 of this Form 10-K for further information.
|
|
(4)
|
These amounts do not include current liabilities on the Consolidated Balance Sheet except for the current portion of uncertain tax obligations. Noncurrent uncertain tax obligations are reflected in the “Other” column of the table above as the Company is not able to reasonably estimate the timing of the future payments. In addition, the amounts do not include: (1) regulatory liabilities (See Note 11—
Regulatory Assets and Liabilities
), (2) contingencies (See Note 14—
Contingencies
), (3) pension and other post retirement employee benefit liabilities (see Note 15—
Benefit Plans
) or (4) any taxes (See Note 22—
Income Taxes
) except for uncertain tax obligations, as the Company is not able to reasonably estimate the timing of future payments. See the indicated notes to the Consolidated Financial Statements included in Item 8 of this Form 10-K for additional information on the items excluded. Derivatives (See Note 6—
Derivative Instruments and Hedging Activities
) and incentive compensation are excluded as the Company is not able to reasonably estimate the timing or amount of the future payments.
|
|
(5)
|
For further information see the note referenced below in Item 8.—
Financial Statements and Supplementary Data
of this form 10-K
.
|
Parent Company Liquidity
The following discussion of Parent Company Liquidity has been included because we believe it is a useful measure of the liquidity available to The AES Corporation, or the Parent Company, given the non-recourse nature of most of our indebtedness. Parent Company Liquidity as outlined below is a non-GAAP measure and should not be construed as an alternative to cash and cash equivalents which are determined in accordance with GAAP, as a measure of liquidity. Cash and cash equivalents are disclosed in the condensed consolidated statements of cash flows. Parent Company Liquidity may differ from similarly titled measures used by other companies. The principal sources of liquidity at the Parent Company level are:
|
•
|
dividends and other distributions from our subsidiaries, including refinancing proceeds;
|
|
•
|
proceeds from debt and equity financings at the Parent Company level, including availability under our credit facilities; and
|
|
•
|
proceeds from asset sales.
|
Cash requirements at the Parent Company level are primarily to fund:
|
•
|
interest;
|
|
•
|
principal repayments of debt;
|
|
•
|
acquisitions;
|
|
•
|
construction commitments;
|
|
•
|
other equity commitments;
|
|
•
|
common stock repurchases;
|
|
•
|
taxes;
|
|
•
|
Parent Company overhead and development costs; and
|
|
•
|
dividends on common stock.
|
The Company defines Parent Company Liquidity as cash available to the Parent Company plus available borrowings under existing credit facilities. The cash held at qualified holding companies represents cash sent to subsidiaries of the Company domiciled outside of the U.S. Such subsidiaries have no contractual restrictions on their ability to send cash to the Parent Company. Parent Company Liquidity is reconciled to its most directly comparable U.S. GAAP financial measure, “cash and cash equivalents,” at
December 31, 2013
and
2012
as follows:
105
|
Parent Company Liquidity
|
2013
|
2012
|
||||||
|
(in millions)
|
||||||||
|
Consolidated cash and cash equivalents
|
$
|
1,642
|
|
$
|
1,900
|
|
||
|
Less: Cash and cash equivalents at subsidiaries
|
1,510
|
|
1,589
|
|
||||
|
Parent and qualified holding companies’ cash and cash equivalents
|
132
|
|
311
|
|
||||
|
Commitments under Parent credit facilities
|
800
|
|
800
|
|
||||
|
Less: Letters of credit under the credit facilities
|
(1
|
)
|
(5
|
)
|
||||
|
Borrowings available under Parent credit facilities
|
799
|
|
795
|
|
||||
|
Total Parent Company Liquidity
|
$
|
931
|
|
$
|
1,106
|
|
||
The Company paid dividends of $0.16 per share to its common stockholders during the year ended
December 31, 2013
. While we intend to continue payment of dividends and believe we will have sufficient liquidity to do so, we can provide no assurance we will be able to continue the payment of dividends. In December 2013, the Company repurchased 20 million shares of its common stock from CIC for
$258 million
. See Note 16—
Equity, Stock Repurchase Program
for further information.
Recourse Debt:
Our recourse debt at year-end was approximately
$5.7 billion
and
$6.0 billion
in
2013
and
2012
, respectively. The following table sets forth our Parent Company contingent contractual obligations as of December 31, 2013:
|
Contingent contractual obligations
|
Amount
|
Number of Agreements
|
Maximum Exposure Range for Each Agreement
|
||||||
|
(in millions)
|
(in millions)
|
||||||||
|
Guarantees
|
$
|
661
|
|
—
|
|
<$1 - 280
|
|||
|
Cash collateralized letters of credit
|
163
|
|
—
|
|
<$1 - 109
|
||||
|
Letters of credit under the senior secured credit facility
|
1
|
|
—
|
|
<$1
|
||||
|
Total
|
$
|
825
|
|
—
|
|
||||
As of December 31,
2013
, the Company had
no
commitments to invest in subsidiaries under construction and to purchase related equipment that were not included in the letters of credit discussed above.
We have a diverse portfolio of performance-related contingent contractual obligations. These obligations are designed to cover potential risks and only require payment if certain targets are not met or certain contingencies occur. The risks associated with these obligations include change of control, construction cost overruns, subsidiary default, political risk, tax indemnities, spot market power prices, sponsor support and liquidated damages under power sales agreements for projects in development, in operation and under construction. In addition, we have an asset sale program through which we may have customary indemnity obligations under certain assets sale agreements. While we do not expect that we will be required to fund any material amounts under these contingent contractual obligations beyond 2013, many of the events which would give rise to such obligations are beyond our control. We can provide no assurance that we will be able to fund our obligations under these contingent contractual obligations if we are required to make substantial payments thereunder.
While we believe that our sources of liquidity will be adequate to meet our needs for the foreseeable future, this belief is based on a number of material assumptions, including, without limitation, assumptions about our ability to access the capital markets (see
Key Trends and Uncertainties, Global Economic Conditions
), the operating and financial performance of our subsidiaries, currency exchange rates, power market pool prices, and the ability of our subsidiaries to pay dividends. In addition, our subsidiaries’ ability to declare and pay cash dividends to us (at the Parent Company level) is subject to certain limitations contained in loans, governmental provisions and other agreements. We can provide no assurance that these sources will be available when needed or that the actual cash requirements will not be greater than anticipated. See Item 1A.—
Risk Factors
, “
The AES Corporation is a holding company and its ability to make payments on its outstanding indebtedness, including its public debt securities, is dependent upon the receipt of funds from its subsidiaries by way of dividends, fees, interest, loans or otherwise
.” of this Form 10-K.
Various debt instruments at the Parent Company level, including our senior secured credit facility, contain certain restrictive covenants. The covenants provide for, among other items:
|
•
|
limitations on other indebtedness, liens, investments and guarantees;
|
|
•
|
limitations on dividends, stock repurchases and other equity transactions;
|
|
•
|
restrictions and limitations on mergers and acquisitions, sales of assets, leases, transactions with affiliates and off-balance sheet and derivative arrangements;
|
106
|
•
|
maintenance of certain financial ratios; and
|
|
•
|
financial and other reporting requirements.
|
As of December 31, 2013, we were in compliance with these covenants at the Parent Company level.
Non-Recourse Debt
While the lenders under our non-recourse debt financings generally do not have direct recourse to the Parent Company, defaults thereunder can still have important consequences for our results of operations and liquidity, including, without limitation:
|
•
|
reducing our cash flows as the subsidiary will typically be prohibited from distributing cash to the Parent Company during the time period of any default;
|
|
•
|
triggering our obligation to make payments under any financial guarantee, letter of credit or other credit support we have provided to or on behalf of such subsidiary;
|
|
•
|
causing us to record a loss in the event the lender forecloses on the assets; and
|
|
•
|
triggering defaults in our outstanding debt at the Parent Company.
|
For example, our senior secured credit facilities and outstanding debt securities at the Parent Company include events of default for certain bankruptcy related events involving material subsidiaries. In addition, our revolving credit agreement at the Parent Company includes events of default related to payment defaults and accelerations of outstanding debt of material subsidiaries.
Some of our subsidiaries are currently in default with respect to all or a portion of their outstanding indebtedness. The total non-recourse debt classified as current in the accompanying condensed consolidated balance sheet amounts to
$2.1 billion
. The portion of current debt related to such defaults was
$1.1 billion
at
December 31, 2013
, all of which was non-recourse debt related to two subsidiaries — Maritza and Kavarna. In addition, discontinued operations at Sonel and Kribi had debt in default of
$257 million
and
$247 million
, respectively; and discontinued operations at Saurashtra had debt of
$21 million
that is classified as current because a covenant violation is probable within the next twelve months.
None of the subsidiaries that are currently in default are subsidiaries that met the applicable definition of materiality under AES’s corporate debt agreements as of
December 31, 2013
in order for such defaults to trigger an event of default or permit acceleration under AES’s indebtedness. However, as a result of additional dispositions of assets, other significant reductions in asset carrying values or other matters in the future that may impact our financial position and results of operations or the financial position of the individual subsidiary, it is possible that one or more of these subsidiaries could fall within the definition of a “material subsidiary” and thereby upon an acceleration trigger an event of default and possible acceleration of the indebtedness under the Parent Company’s outstanding debt securities.
Critical Accounting Policies and Estimates
The Consolidated Financial Statements of AES are prepared in conformity with U.S. GAAP, which requires the use of estimates, judgments and assumptions that affect the reported amounts of assets and liabilities at the date of the financial statements and the reported amounts of revenue and expenses during the periods presented. AES’s significant accounting policies are described in Note 1—
General and Summary of Significant Accounting Policies
to the Consolidated Financial Statements included in Item 8 of this Form 10-K.
An accounting estimate is considered critical if:
|
•
|
the estimate requires management to make assumptions about matters that were highly uncertain at the time the estimate was made;
|
|
•
|
different estimates reasonably could have been used; or
|
|
•
|
the impact of the estimates and assumptions on financial condition or operating performance is material.
|
Management believes that the accounting estimates employed are appropriate and the resulting balances are reasonable; however, actual results could materially differ from the original estimates, requiring adjustments to these balances in future periods. Management has discussed these critical accounting policies with the Audit Committee, as appropriate. Listed below
107
are the Company’s most significant critical accounting estimates and assumptions used in the preparation of the Consolidated Financial Statements.
Income Taxes
We are subject to income taxes in both the United States and numerous foreign jurisdictions. Our worldwide income tax provision requires significant judgment and is based on calculations and assumptions that are subject to examination by the Internal Revenue Service and other taxing authorities. The Company and certain of its subsidiaries are under examination by relevant taxing authorities for various tax years. The Company regularly assesses the potential outcome of these examinations in each tax jurisdiction when determining the adequacy of the provision for income taxes. Accounting guidance for uncertainty in income taxes prescribes a more-likely-than-not recognition threshold. Tax reserves have been established, which the Company believes to be adequate in relation to the potential for additional assessments. Once established, reserves are adjusted only when there is more information available or when an event occurs necessitating a change to the reserves. While the Company believes that the amounts of the tax estimates are reasonable, it is possible that the ultimate outcome of current or future examinations may be materially different than the reserve amounts.
Deferred tax assets and liabilities are recognized for the future tax consequences attributable to differences between the financial statement carrying amounts of the existing assets and liabilities, and their respective income tax bases. The Company establishes a valuation allowance when it is more likely than not that all or a portion of a deferred tax asset will not be realized.
The Company’s provision for income taxes could be adversely impacted by changes to the U.S. taxation of earnings of our foreign subsidiaries. Since 2006, the Company has benefited from the Controlled Foreign Corporation look-through rule, originally enacted for the 2006 through 2009 tax years in the Tax Increase Prevention and Reconciliation Act (“TIPRA”) of 2005 and retroactively reinstated for the 2010 and 2011 tax years via the Tax Relief, Unemployment Insurance Reauthorization, and Job Creation Act of 2010. On January 3, 2013, the Controlled Foreign Corporation look-through rule was retroactively reinstated to January 1, 2012 for a period of two years through the American Taxpayer Relief Act of 2012. In determining the Company’s effective tax rate for the year ended December 31, 2012, the Company excluded the benefits of this provision since enactment of this reinstatement did not occur by December 31, 2012. However, the benefit was recorded in the first quarter of 2013 for the retroactive reinstatement of the provision. There can be no assurance that this provision will continue to be extended beyond the two year period that ended December 31, 2013. Accordingly, if this provision is not renewed, our expected effective tax rate could increase by amounts that may be material.
Impairments
Our accounting policies on goodwill and long-lived assets are described in detail in Note 1—
General and Summary of Significant Accounting Policies
, included in Item 8 of this Form 10-K. The Company makes considerable judgments in its impairment evaluations of goodwill and long-lived assets; however, the fair value determination is typically the most judgmental part in an impairment evaluation.
The Company determines the fair value of a reporting unit or a long-lived asset (asset group) by applying the approaches prescribed under the fair value measurement accounting framework. Generally, the market approach and income approach are most relevant in the fair value measurement of our reporting units and long-lived assets; however, due to the lack of available relevant observable market information in many circumstances, the Company often relies on the income approach. The Company may engage an independent valuation firm to assist management with the valuation. The decision to engage an independent valuation firm considers all relevant facts and circumstances, including a cost/benefit analysis and the Company’s internal valuation knowledge of the long-lived asset (asset group) or business. The Company develops the underlying assumptions consistent with its internal budgets and forecasts for such valuations. Additionally, the Company uses an internal discounted cash flow valuation model (the “DCF model”), based on the principles of present value techniques, to estimate the fair value of its reporting units or long-lived assets under the income approach. The DCF model estimates fair value by discounting our internal budgets and cash flow forecasts, adjusted to reflect market participant assumptions, to the extent necessary, at an appropriate discount rate.
Management applies considerable judgment in selecting several input assumptions during the development of our internal budgets and cash flow forecasts. Examples of the input assumptions that our budgets and forecasts are sensitive to include macroeconomic factors such as growth rates, industry demand, inflation, exchange rates, power prices and commodity prices. Whenever appropriate, management obtains these input assumptions from observable market data sources (e.g., Economic Intelligence Unit) and extrapolates the market information if an input assumption is not observable for the entire forecast period. Many of these input assumptions are dependent on other economic assumptions, which are often derived from statistical economic models with inherent limitations such as estimation differences. Further, several input assumptions are based on historical trends which often do not recur. The input assumptions most significant to our budgets and cash flows are based on expectations of macroeconomic factors which have been volatile recently. It is not uncommon that different market data
108
sources have different views of the macroeconomic factors expectations and related assumptions. As a result, macroeconomic factors and related assumptions are often available in a narrow range; however, in some situations these ranges become wide and the use of a different set of input assumptions could produce significantly different budgets and cash flow forecasts.
A considerable amount of judgment is also applied in the estimation of the discount rate used in the DCF model. To the extent practical, inputs to the discount rate are obtained from market data sources (e.g., Bloomberg, Capital IQ, etc.). The Company selects and uses a set of publicly traded companies from the relevant industry to estimate the discount rate inputs. Management applies judgment in the selection of such companies based on its view of the most likely market participants. It is reasonably possible that the selection of a different set of likely market participants could produce different input assumptions and result in the use of a different discount rate.
Fair value of a reporting unit or a long-lived asset (asset group) is sensitive to both input assumptions to our budgets and cash flow forecasts and the discount rate. Further, estimates of long-term growth and terminal value are often critical to the fair value determination. As part of the impairment evaluation process, management analyzes the sensitivity of fair value to various underlying assumptions. The level of scrutiny increases as the gap between fair value and carrying amount decreases. Changes in any of these assumptions could result in management reaching a different conclusion regarding the potential impairment, which could be material. Our impairment evaluations inherently involve uncertainties from uncontrollable events that could positively or negatively impact the anticipated future economic and operating conditions.
Further discussion of the impairment charges recognized by the Company can be found within Note 10—
Goodwill and Other Intangible Assets,
Note 21—
Asset Impairment Expense
and Note 9—
Other Non-Operating Expense
to the Consolidated Financial Statements included in Item 8 of this Form 10-K.
Fair Value
Fair Value Hierarchy
The Company uses valuation techniques and methodologies that maximize the use of observable inputs and minimize the use of unobservable inputs. Where available, fair value is based on observable market prices or parameters or derived from such prices or parameters. Where observable prices are not available, valuation models are applied to estimate the fair value using the available observable inputs. The valuation techniques involve some level of management estimation and judgment, the degree of which is dependent on the price transparency for the instruments or market and the instruments’ complexity.
To increase consistency and enhance disclosure of the fair value of financial instruments, the fair value measurement standard includes a fair value hierarchy to prioritize the inputs used to measure fair value into three categories. An asset or liability’s level within the fair value hierarchy is based on the lowest level of input significant to the fair value measurement, where Level 1 is the highest and Level 3 is the lowest. For more information regarding the fair value hierarchy, see Note 1—
General and Summary of Significant Accounting Policies
included in Item 8. –
Financial Statements and Supplementary Data
of this Form 10-K.
Fair Value of Financial Instruments
A significant number of the Company’s financial instruments are carried at fair value with changes in fair value recognized in earnings or other comprehensive income each period. The Company makes estimates regarding the valuation of assets and liabilities measured at fair value in preparing the Consolidated Financial Statements. These assets and liabilities include short and long-term investments in debt and equity securities, included in the balance sheet line items “Short-term investments” and “Other assets (Noncurrent)”, derivative assets, included in “Other current assets” and “Other assets (Noncurrent)” and derivative liabilities, included in “Accrued and other liabilities (current)” and “Other long-term liabilities”. Investments are generally fair valued based on quoted market prices or other observable market data such as interest rate indices. The Company’s investments are primarily certificates of deposit, government debt securities and money market funds. Derivatives are valued using observable data as inputs into internal valuation models. The Company’s derivatives primarily consist of interest rate swaps, foreign currency instruments, and commodity and embedded derivatives. Additional discussion regarding the nature of these financial instruments and valuation techniques can be found in Note 4—
Fair Value
included in Item 8. –
Financial Statements and Supplementary Data
of this Form 10-K.
Fair Value of Nonfinancial Assets and Liabilities
Significant estimates are made in determining the fair value of long-lived tangible and intangible assets (i.e., property, plant and equipment, intangible assets and goodwill) during the impairment evaluation process. In addition, the majority of assets acquired and liabilities assumed in a business combination are required to be recognized at fair value under the relevant
109
accounting guidance. In determining the fair value of these items, management makes several assumptions discussed in the Impairments section.
Accounting for Derivative Instruments and Hedging Activities
We enter into various derivative transactions in order to hedge our exposure to certain market risks. We primarily use derivative instruments to manage our interest rate, commodity and foreign currency exposures. We do not enter into derivative transactions for trading purposes.
In accordance with the accounting standards for derivatives and hedging, we recognize all derivatives as either assets or liabilities in the balance sheet and measure those instruments at fair value except where derivatives qualify and are designated as “normal purchase/normal sale” transactions. Changes in fair value of derivatives are recognized in earnings unless specific hedge criteria are met. Income and expense related to derivative instruments are recognized in the same category as that generated by the underlying asset or liability. See Note 6—
Derivative Instruments and Hedging Activities
included in Item 8 of this Form 10-K for further information on the classification.
The accounting standards for derivatives and hedging enable companies to designate qualifying derivatives as hedging instruments based on the exposure being hedged. These hedge designations include fair value hedges and cash flow hedges. Changes in the fair value of a derivative that is highly effective and is designated and qualifies as a fair value hedge, are recognized in earnings as offsets to the changes in fair value of the exposure being hedged. The Company has no fair value hedges at this time. Changes in the fair value of a derivative that is highly effective and is designated as and qualifies as a cash flow hedge, are deferred in accumulated other comprehensive income and are recognized into earnings as the hedged transactions occur. Any ineffectiveness is recognized in earnings immediately. For all hedge contracts, the Company provides formal documentation of the hedge and effectiveness testing in accordance with the accounting standards for derivatives and hedging.
The fair value measurement accounting standard provides additional guidance on the definition of fair value and defines fair value as the price that would be received to sell an asset or paid to transfer a liability in an orderly transaction between market participants at the measurement date, or exit price. The fair value measurement standard requires the Company to consider and reflect the assumptions of market participants in the fair value calculation. These factors include nonperformance risk (the risk that the obligation will not be fulfilled) and credit risk, both of the reporting entity (for liabilities) and of the counterparty (for assets). Due to the nature of the Company’s interest rate swaps, which are typically associated with non-recourse debt, credit risk for AES is evaluated at the subsidiary level rather than at the Parent Company level. Nonperformance risk on the Company’s derivative instruments is an adjustment to the initial asset/liability fair value position that is derived from internally developed valuation models that utilize observable market inputs.
As a result of uncertainty, complexity and judgment, accounting estimates related to derivative accounting could result in material changes to our financial statements under different conditions or utilizing different assumptions. As a part of accounting for these derivatives, we make estimates concerning nonperformance, volatilities, market liquidity, future commodity prices, interest rates, credit ratings (both ours and our counterparty’s) and exchange rates.
The fair value of our derivative portfolio is generally determined using internal valuation models, most of which are based on observable market inputs including interest rate curves and forward and spot prices for currencies and commodities. The Company derives most of its financial instrument market assumptions from market efficient data sources (e.g., Bloomberg, Reuters and Platt’s). In some cases, where market data is not readily available, management uses comparable market sources and empirical evidence to derive market assumptions to determine a financial instrument’s fair value. In certain instances, the published curve may not extend through the remaining term of the contract and management must make assumptions to extrapolate the curve. Additionally, in the absence of quoted prices, we may rely on “indicative pricing” quotes from financial institutions to input into our valuation model for certain of our foreign currency swaps. These indicative pricing quotes do not constitute either a bid or ask price and therefore are not considered observable market data. For individual contracts, the use of different valuation models or assumptions could have a material effect on the calculated fair value.
Regulatory Assets and Liabilities
Management continually assesses whether the regulatory assets are probable of future recovery by considering factors such as applicable regulatory changes, recent rate orders applicable to other regulated entities and the status of any pending or potential deregulation legislation. If future recovery of costs ceases to be probable, any asset write-offs would be required to be recognized in operating income.
New Accounting Pronouncements
110
The Company did not adopt any new accounting pronouncements during the year that had a material impact on the Company's financial position or results of operations. See Note 1 -
General and Summary of Significant Accounting Policies
included in Item 8 of this Form 10-K for further information about accounting pronouncements issued but not yet effective.
Overview Regarding Market Risks
Our businesses are exposed to and proactively manage market risk. Our primary market risk exposure is to the price of commodities, particularly electricity, oil, natural gas, coal and environmental credits. We operate in multiple countries and as such are subject to volatility in exchange rates at varying degrees at the subsidiary level and between our functional currency, the U.S. Dollar, and currencies of the countries in which we operate. We are also exposed to interest rate fluctuations due to our issuance of debt and related financial instruments.
These disclosures set forth in this Item 7A are based upon a number of assumptions; actual effects may differ. The safe harbor provided in Section 27A of the Securities Act of 1933 and Section 21E of the Securities Exchange Act of 1934 shall apply to the disclosures contained in this Item 7A. For further information regarding market risk, see Item 1A. —
Risk Factors
,
Our financial position and results of operations may fluctuate significantly due to fluctuations in currency exchange rates experienced at our foreign operations
,
Our businesses may incur substantial costs and liabilities and be exposed to price volatility as a result of risks associated with the wholesale electricity markets, which could have a material adverse effect on our financial performance,
and
We may not be adequately hedged against our exposure to changes in commodity prices or interest rates
of the
2012
Form 10-K.
Commodity Price Risk
Although we prefer to hedge our exposure to the impact of market fluctuations in the price of electricity, fuels and environmental credits, some of our generation businesses operate under short-term sales or under contract sales that leave an un-hedged exposure on some of our capacity or through imperfect fuel pass-throughs. In our utility businesses, we may be exposed to commodity price movements depending on our excess or shortfall of generation relative to load obligations and sharing or pass-through mechanisms. These businesses subject our operational results to the volatility of prices for electricity, fuels and environmental credits in competitive markets. We employ risk management strategies to hedge our financial performance against the effects of fluctuations in energy commodity prices. The implementation of these strategies can involve the use of physical and financial commodity contracts, futures, swaps and options. At our generation businesses for 2014-2016, 75% to 80% of our variable margin is hedged against changes in commodity prices. At our utility businesses for 2014-2016, 85% to 90% of our variable margin is insulated from changes in commodity prices.
When hedging the output of our generation assets, we utilize contract sales that lock in the spread per MWh between variable costs and the price at which the electricity can be sold. The portion of our sales and purchases that are not subject to such agreements or contracted businesses where indexation is not perfectly matched to business drivers will be exposed to commodity price risk.
AES businesses will see changes in variable margin performance as global commodity prices shift. For 2014, we project pretax earnings exposure on a 10% move in commodity prices would be approximately $25 million for natural gas, $15 million for oil and $10 million for coal. Our estimates exclude correlation of oil with coal or natural gas. For example, a decline in oil or natural gas prices can be accompanied by a decline in coal price if commodity prices are correlated. In aggregate, the Company’s downside exposure occurs with lower oil, lower natural gas, and higher coal prices. Exposures at individual businesses will change as new contracts or financial hedges are executed, and our sensitivity to changes in commodity prices generally increases in later years with reduced hedge levels at some of our businesses.
Commodity prices affect our businesses differently depending on the local market characteristics and risk management strategies. Generation costs can be directly affected by movements in the price of natural gas, oil and coal. Spot power prices and contract indexation provisions are affected by the same commodity price movements. We have some natural offsets across our businesses such that low commodity prices may benefit certain businesses and be a cost to others. Offsets are not perfectly linear or symmetric. The sensitivities are affected by a number of non-market, or indirect market factors. Examples of these factors include hydrology, energy market supply/demand balances, regional fuel supply issues, regional competition, bidding strategies and regulatory interventions such as price caps. Operational flexibility changes the shape of our sensitivities. For instance, certain power plants may limit downside exposure by reducing dispatch in low market environments. Volume variation also affects our commodity exposure. The volume sold under contracts or retail concessions can vary based on weather and economic conditions resulting in a higher or lower volume of sales in spot markets. Thermal unit availability and hydrology can affect the generation output available for sale and can affect the marginal unit setting power prices.
111
In the US SBU, the generation businesses are largely contracted but may have residual risk to the extent contracts are not perfectly indexed to the business drivers. IPL sells power at wholesale once retail demand is served, so retail sales demand may affect commodity exposure. Additionally, at DPL, open access allows our retail customers to switch to alternative suppliers; falling energy prices may increase the rate at which our customers switch to alternative suppliers; DPL sells generation in excess of its retail demand under short-term sales. Given that natural gas-fired generators set power prices for many markets, higher natural gas prices expand margins. The positive impact on margins will be moderated if natural gas-fired generators set the market price only during peak periods.
In the Andes SBU, our business in Chile owns assets in the central and northern regions of the country and has a portfolio of contract sales in both. In the central region, the contract sales cover the efficient generation from our coal-fired and hydroelectric assets. Any residual spot price risk will primarily be driven by the amount of hydrological inflows. In the case of low hydroelectric generation, spot price exposure is capped by the ability to dispatch our natural gas/diesel assets. There is a small amount of coal generation in the northern region that is not covered by the portfolio of contract sales and therefore subject to spot price risk. In both regions, generators with oil or oil-linked fuel generally set power prices. In Colombia, we operate under a short-term sales strategy and have commodity exposure to un-hedged volumes. Because we own hydroelectric assets there, contracts are not indexed to fuel.
In the Brazil SBU, the hydroelectric generating facility is covered by contract sales. Under normal hydrological volatility, spot price risk is mitigated through a regulated sharing mechanism across all hydroelectric generators in the country. Under more extreme hydrological conditions, the sharing mechanism may not be sufficient to cover the business' contract position, and therefore it may have to purchase power at spot prices driven by the cost of thermal generation.
In the MCAC SBU, our businesses have commodity exposure on un-hedged volumes. Panama is largely contracted under a portfolio of fixed volume contract sales. To the extent hydrological inflows are greater than or less than the contract sales volume, the business will be sensitive to changes in spot power prices which may be driven by oil prices in some time periods. In the Dominican Republic, we own natural gas-fired assets contracted under a portfolio of contract sales and a coal-fired asset contracted with a single contract, and both contract and spot prices may move with commodity prices.
In the EMEA SBU, our Kilroot facility operates on a short-term sales strategy. To the extent that sales are un-hedged, the commodity risk at our Kilroot business is due to the dark spread -- the difference between electricity price and our coal-based variable dispatch cost. Natural gas-fired generators set power prices for many periods, so higher natural gas prices expand margins and higher coal prices reduce them. The positive impact on margins will be moderated if natural gas-fired generators set the market price only during certain peak periods. At our Ballylumford facility, the regulator has the right to terminate the contract, which would impact our commodity exposure. Our operations in Turkey are sensitive to the spread between power and natural gas prices, both of which have historically demonstrated a relationship to oil. As a result of these relationships, falling oil prices could compress margins realized at the business.
In the Asia SBU, our Masinloc business is a coal-fired generation facility which hedges its output under a portfolio of contract sales that are indexed to fuel prices, with generation in excess of contract volume sold in the spot market. Low oil prices may be a driver of margin compression since oil affects spot power sale prices.
Foreign Exchange Rate Risk
In the normal course of business, we are exposed to foreign currency risk and other foreign operations risks that arise from investments in foreign subsidiaries and affiliates. A key component of these risks stems from the fact that some of our foreign subsidiaries and affiliates utilize currencies other than our consolidated reporting currency, the U.S. Dollar. Additionally, certain of our foreign subsidiaries and affiliates have entered into monetary obligations in the U.S. Dollar or currencies other than their own functional currencies. We have varying degrees of exposure to changes in the exchange rate between the U.S. Dollar and the following currencies: Argentine Peso, Brazilian Real, British Pound, Chilean Peso, Colombian Peso, Dominican Peso, Euro, Indian Rupee, Kazakhstani Tenge, Mexican Peso and Philippine Peso. These subsidiaries and affiliates have attempted to limit potential foreign exchange exposure by entering into revenue contracts that adjust to changes in foreign exchange rates. We also use foreign currency forwards, swaps and options, where possible, to manage our risk related to certain foreign currency fluctuations.
We have entered into hedges to partially mitigate the exposure of earnings translated into the U.S. Dollar to foreign exchange volatility. The largest foreign exchange risks over a twelve-month forward-looking period are stemming from the following currencies: Argentine Peso, Brazilian Real, Colombian Peso, and Euro. As of
December 31, 2013
, assuming a 10% U.S. Dollar appreciation, adjusted pretax earnings attributable to foreign subsidiaries exposed to movement in the exchange rate of the Argentine Peso, Brazilian Real, Colombian Peso, and Euro relative to the U.S. Dollar are projected to be reduced by approximately $5 million, $20 million, less than $10 million and less than $10 million respectively, for 2014. These numbers have been produced by applying a one-time 10% U.S. Dollar appreciation to forecasted exposed pretax earnings for 2014
112
coming from the respective subsidiaries exposed to the currencies listed above, net of the impact of outstanding hedges and holding all other variables constant. The numbers presented above are net of any transactional gains/losses. These sensitivities may change in the future as new hedges are executed or existing hedges are unwound. Additionally, updates to the forecasted pretax earnings exposed to foreign exchange risk may result in further modification. The sensitivities presented do not capture the impacts of any administrative market restrictions or currency inconvertibility.
Interest Rate Risks
We are exposed to risk resulting from changes in interest rates as a result of our issuance of variable and fixed-rate debt, as well as interest rate swap, cap and floor and option agreements.
Decisions on the fixed-floating debt ratio are made to be consistent with the risk factors faced by individual businesses or plants. Depending on whether a plant’s capacity payments or revenue stream is fixed or varies with inflation, we partially hedge against interest rate fluctuations by arranging fixed-rate or variable-rate financing. In certain cases, particularly for non-recourse financing, we execute interest rate swap, cap and floor agreements to effectively fix or limit the interest rate exposure on the underlying financing. Most of our interest rate risk is related to non-recourse financings at our businesses.
As of
December 31, 2013
, the portfolio’s pretax earnings exposure for 2014 to a 100-basis-point increase in interest rates for our Argentine Peso, Brazilian Real, British Pound, Colombian Peso, Euro, Kazakhstani Tenge and U.S. Dollar denominated debt would be approximately $20 million based on the impact of a one time, 100-basis-point upward shift in interest rates on interest expense for the debt denominated in these currencies. The amounts do not take into account the historical correlation between these interest rates.
113
|
ITEM 8.
|
FINANCIAL STATEMENTS AND SUPPLEMENTARY DATA
|
REPORT OF INDEPENDENT REGISTERED PUBLIC ACCOUNTING FIRM
The Board of Directors and Stockholders of The AES Corporation:
We have audited the accompanying consolidated balance sheets of The AES Corporation as of
December 31, 2013
and 2012, and the related consolidated statements of operations, comprehensive income, changes in equity, and cash flows for each of the three years in the period ended December 31, 2013. Our audits also included the financial statement schedules listed in the index at Item 15(a). These financial statements and schedules are the responsibility of the Company's management. Our responsibility is to express an opinion on these financial statements based on our audits.
We conducted our audits in accordance with the standards of the Public Company Accounting Oversight Board (United States). Those standards require that we plan and perform the audit to obtain reasonable assurance about whether the financial statements are free of material misstatement. An audit also includes examining, on a test basis, evidence supporting the amounts and disclosures in the financial statements. An audit also includes assessing the accounting principles used and significant estimates made by management, as well as evaluating the overall financial statement presentation. We believe that our audits provide a reasonable basis for our opinion.
In our opinion, the financial statements referred to above present fairly, in all material respects, the consolidated financial position of The AES Corporation at
December 31, 2013
and 2012, and the consolidated results of its operations and its cash flows for each of the three years in the period ended
December 31, 2013
, in conformity with U.S. generally accepted accounting principles. Also, in our opinion, the related financial statement schedules, when considered in relation to the basic financial statements taken as a whole, present fairly, in all material respects, the information set forth therein.
We also have audited, in accordance with the standards of the Public Company Accounting Oversight Board (United States), The AES Corporation’s internal control over financial reporting as of
December 31, 2013
, based on criteria established in Internal Control-Integrated Framework issued by the Committee of Sponsoring Organizations of the Treadway Commission (1992 framework) and our report dated
February 25, 2014
expressed an unqualified opinion thereon.
/s/ Ernst & Young LLP
McLean, Virginia
February 25, 2014
114
THE AES CORPORATION
DECEMBER 31, 2013 AND 2012
See Accompanying Notes to Consolidated Financial Statements.
|
December 31,
2013 |
December 31,
2012 |
|||||||
|
(in millions, except share
and per share data)
|
||||||||
|
ASSETS
|
||||||||
|
CURRENT ASSETS
|
||||||||
|
Cash and cash equivalents
|
$
|
1,642
|
|
$
|
1,900
|
|
||
|
Restricted cash
|
597
|
|
734
|
|
||||
|
Short-term investments
|
668
|
|
693
|
|
||||
|
Accounts receivable, net of allowance for doubtful accounts of $134 and $195, respectively
|
2,363
|
|
2,539
|
|
||||
|
Inventory
|
684
|
|
719
|
|
||||
|
Deferred income taxes
|
166
|
|
199
|
|
||||
|
Prepaid expenses
|
179
|
|
222
|
|
||||
|
Other current assets
|
976
|
|
1,072
|
|
||||
|
Current assets of discontinued operations and held-for-sale assets
|
464
|
|
387
|
|
||||
|
Total current assets
|
7,739
|
|
8,465
|
|
||||
|
NONCURRENT ASSETS
|
||||||||
|
Property, Plant and Equipment:
|
||||||||
|
Land
|
922
|
|
1,005
|
|
||||
|
Electric generation, distribution assets and other
|
30,596
|
|
30,278
|
|
||||
|
Accumulated depreciation
|
(9,604
|
)
|
(9,145
|
)
|
||||
|
Construction in progress
|
3,198
|
|
2,497
|
|
||||
|
Property, plant and equipment, net
|
25,112
|
|
24,635
|
|
||||
|
Other Assets:
|
||||||||
|
Investments in and advances to affiliates
|
1,010
|
|
1,196
|
|
||||
|
Debt service reserves and other deposits
|
541
|
|
510
|
|
||||
|
Goodwill
|
1,622
|
|
1,999
|
|
||||
|
Other intangible assets, net of accumulated amortization of $153 and $222, respectively
|
297
|
|
324
|
|
||||
|
Deferred income taxes
|
666
|
|
940
|
|
||||
|
Other noncurrent assets
|
2,170
|
|
2,188
|
|
||||
|
Noncurrent assets of discontinued operations and held-for-sale assets
|
1,254
|
|
1,573
|
|
||||
|
Total other assets
|
7,560
|
|
8,730
|
|
||||
|
TOTAL ASSETS
|
$
|
40,411
|
|
$
|
41,830
|
|
||
|
LIABILITIES AND EQUITY
|
||||||||
|
CURRENT LIABILITIES
|
||||||||
|
Accounts payable
|
$
|
2,259
|
|
$
|
2,545
|
|
||
|
Accrued interest
|
263
|
|
287
|
|
||||
|
Accrued and other liabilities
|
2,114
|
|
2,347
|
|
||||
|
Non-recourse debt, including $267 and $275, respectively, related to variable interest entities
|
2,062
|
|
2,494
|
|
||||
|
Recourse debt
|
118
|
|
11
|
|
||||
|
Current liabilities of discontinued operations and held-for-sale businesses
|
837
|
|
635
|
|
||||
|
Total current liabilities
|
7,653
|
|
8,319
|
|
||||
|
NONCURRENT LIABILITIES
|
||||||||
|
Non-recourse debt, including $979 and $858, respectively, related to variable interest entities
|
13,318
|
|
12,265
|
|
||||
|
Recourse debt
|
5,551
|
|
5,951
|
|
||||
|
Deferred income taxes
|
1,119
|
|
1,179
|
|
||||
|
Pension and other post-retirement liabilities
|
1,310
|
|
2,418
|
|
||||
|
Other noncurrent liabilities
|
3,299
|
|
3,523
|
|
||||
|
Noncurrent liabilities of discontinued operations and held-for-sale businesses
|
432
|
|
583
|
|
||||
|
Total noncurrent liabilities
|
25,029
|
|
25,919
|
|
||||
|
Contingencies and Commitments (see Notes 13 and 14)
|
|
|
||||||
|
Cumulative preferred stock of subsidiaries
|
78
|
|
78
|
|
||||
|
EQUITY
|
||||||||
|
THE AES CORPORATION STOCKHOLDERS’ EQUITY
|
||||||||
|
Common stock ($0.01 par value, 1,200,000,000 shares authorized; 813,316,510 issued and 722,508,342 outstanding at December 31, 2013 and 810,679,839 issued and 744,263,855 outstanding at December 31, 2012)
|
8
|
|
8
|
|
||||
|
Additional paid-in capital
|
8,443
|
|
8,525
|
|
||||
|
Accumulated deficit
|
(150
|
)
|
(264
|
)
|
||||
|
Accumulated other comprehensive loss
|
(2,882
|
)
|
(2,920
|
)
|
||||
|
Treasury stock, at cost (90,808,168 shares at December 31, 2013 and 66,415,984 shares at December 31, 2012)
|
(1,089
|
)
|
(780
|
)
|
||||
|
Total AES Corporation stockholders’ equity
|
4,330
|
|
4,569
|
|
||||
|
NONCONTROLLING INTERESTS
|
3,321
|
|
2,945
|
|
||||
|
Total equity
|
7,651
|
|
7,514
|
|
||||
|
TOTAL LIABILITIES AND EQUITY
|
$
|
40,411
|
|
$
|
41,830
|
|
||
115
THE AES CORPORATION
YEARS ENDED DECEMBER 31, 2013, 2012, AND 2011
|
2013
|
2012
|
2011
|
||||||||||
|
(in millions, except per share amounts)
|
||||||||||||
|
Revenue:
|
||||||||||||
|
Regulated
|
$
|
8,056
|
|
$
|
8,977
|
|
$
|
8,699
|
|
|||
|
Non-Regulated
|
7,835
|
|
8,187
|
|
7,399
|
|
||||||
|
Total revenue
|
15,891
|
|
17,164
|
|
16,098
|
|
||||||
|
Cost of Sales:
|
||||||||||||
|
Regulated
|
(6,837
|
)
|
(7,594
|
)
|
(6,325
|
)
|
||||||
|
Non-Regulated
|
(5,807
|
)
|
(5,987
|
)
|
(5,733
|
)
|
||||||
|
Total cost of sales
|
(12,644
|
)
|
(13,581
|
)
|
(12,058
|
)
|
||||||
|
Operating margin
|
3,247
|
|
3,583
|
|
4,040
|
|
||||||
|
General and administrative expenses
|
(220
|
)
|
(274
|
)
|
(346
|
)
|
||||||
|
Interest expense
|
(1,482
|
)
|
(1,544
|
)
|
(1,530
|
)
|
||||||
|
Interest income
|
275
|
|
348
|
|
398
|
|
||||||
|
Loss on extinguishment of debt
|
(229
|
)
|
(8
|
)
|
(62
|
)
|
||||||
|
Other expense
|
(76
|
)
|
(82
|
)
|
(86
|
)
|
||||||
|
Other income
|
125
|
|
98
|
|
142
|
|
||||||
|
Gain on sale of investments
|
26
|
|
219
|
|
8
|
|
||||||
|
Goodwill impairment expense
|
(372
|
)
|
(1,817
|
)
|
(17
|
)
|
||||||
|
Asset impairment expense
|
(95
|
)
|
(73
|
)
|
(173
|
)
|
||||||
|
Foreign currency transaction losses
|
(22
|
)
|
(170
|
)
|
(32
|
)
|
||||||
|
Other non-operating expense
|
(129
|
)
|
(50
|
)
|
(82
|
)
|
||||||
|
INCOME FROM CONTINUING OPERATIONS BEFORE TAXES AND EQUITY IN EARNINGS OF AFFILIATES
|
1,048
|
|
230
|
|
2,260
|
|
||||||
|
Income tax expense
|
(343
|
)
|
(685
|
)
|
(656
|
)
|
||||||
|
Net equity in earnings (losses) of affiliates
|
25
|
|
35
|
|
(2
|
)
|
||||||
|
INCOME (LOSS) FROM CONTINUING OPERATIONS
|
730
|
|
(420
|
)
|
1,602
|
|
||||||
|
Income (loss) from operations of discontinued businesses, net of income tax (benefit) expense of $24, $26, and $(48), respectively
|
(27
|
)
|
47
|
|
(158
|
)
|
||||||
|
Net gain (loss) from disposal and impairments of discontinued businesses, net of income tax (benefit) expense of $(15), $68, and $300, respectively
|
(152
|
)
|
16
|
|
86
|
|
||||||
|
NET INCOME (LOSS)
|
551
|
|
(357
|
)
|
1,530
|
|
||||||
|
Noncontrolling interests:
|
||||||||||||
|
Less: Income from continuing operations attributable to noncontrolling interests
|
(446
|
)
|
(540
|
)
|
(1,096
|
)
|
||||||
|
Less: (Income) loss from discontinued operations attributable to noncontrolling interests
|
9
|
|
(15
|
)
|
(376
|
)
|
||||||
|
Total net income attributable to noncontrolling interests
|
(437
|
)
|
(555
|
)
|
(1,472
|
)
|
||||||
|
NET INCOME (LOSS) ATTRIBUTABLE TO THE AES CORPORATION
|
$
|
114
|
|
$
|
(912
|
)
|
$
|
58
|
|
|||
|
AMOUNTS ATTRIBUTABLE TO THE AES CORPORATION COMMON STOCKHOLDERS:
|
||||||||||||
|
Income (loss) from continuing operations, net of tax
|
$
|
284
|
|
$
|
(960
|
)
|
$
|
506
|
|
|||
|
Income (loss) from discontinued operations, net of tax
|
(170
|
)
|
48
|
|
(448
|
)
|
||||||
|
Net income (loss)
|
$
|
114
|
|
$
|
(912
|
)
|
$
|
58
|
|
|||
|
BASIC EARNINGS PER SHARE:
|
||||||||||||
|
Income (loss) from continuing operations attributable to The AES Corporation common stockholders, net of tax
|
$
|
0.38
|
|
$
|
(1.27
|
)
|
$
|
0.65
|
|
|||
|
Income (loss) from discontinued operations attributable to The AES Corporation common stockholders, net of tax
|
(0.23
|
)
|
0.06
|
|
(0.58
|
)
|
||||||
|
NET INCOME (LOSS) ATTRIBUTABLE TO THE AES CORPORATION COMMON STOCKHOLDERS
|
$
|
0.15
|
|
$
|
(1.21
|
)
|
$
|
0.07
|
|
|||
|
DILUTED EARNINGS PER SHARE:
|
||||||||||||
|
Income (loss) from continuing operations attributable to The AES Corporation common stockholders, net of tax
|
$
|
0.38
|
|
$
|
(1.27
|
)
|
$
|
0.65
|
|
|||
|
Income (loss) from discontinued operations attributable to The AES Corporation common stockholders, net of tax
|
(0.23
|
)
|
0.06
|
|
(0.58
|
)
|
||||||
|
NET INCOME (LOSS) ATTRIBUTABLE TO THE AES CORPORATION COMMON STOCKHOLDERS
|
$
|
0.15
|
|
$
|
(1.21
|
)
|
$
|
0.07
|
|
|||
|
DIVIDENDS DECLARED PER COMMON SHARE
|
$
|
0.17
|
|
$
|
0.08
|
|
$
|
—
|
|
|||
See Accompanying Notes to Consolidated Financial Statements.
116
THE AES CORPORATION
CONSOLIDATED STATEMENTS OF COMPREHENSIVE INCOME
YEARS ENDED DECEMBER 31, 2013, 2012, AND 2011
|
2013
|
2012
|
2011
|
||||||||||
|
(in millions)
|
||||||||||||
|
NET INCOME (LOSS)
|
$
|
551
|
|
$
|
(357
|
)
|
$
|
1,530
|
|
|||
|
Available-for-sale securities activity:
|
||||||||||||
|
Change in fair value of available-for-sale securities, net of income tax (expense) benefit of $0, $0 and $0, respectively
|
(1
|
)
|
1
|
|
1
|
|
||||||
|
Reclassification to earnings, net of income tax (expense) benefit of $0, $0 and $0, respectively
|
1
|
|
(1
|
)
|
(2
|
)
|
||||||
|
Total change in fair value of available-for-sale securities
|
—
|
|
—
|
|
(1
|
)
|
||||||
|
Foreign currency translation activity:
|
||||||||||||
|
Foreign currency translation adjustments, net of income tax (expense) benefit of $10, $0, and $18, respectively
|
(375
|
)
|
(247
|
)
|
(484
|
)
|
||||||
|
Reclassification to earnings, net of income tax (expense) benefit of $0, $0 and $0, respectively
|
41
|
|
37
|
|
188
|
|
||||||
|
Total foreign currency translation adjustments
|
(334
|
)
|
(210
|
)
|
(296
|
)
|
||||||
|
Derivative activity:
|
||||||||||||
|
Change in derivative fair value, net of income tax (expense) benefit of $(31), $35 and $108, respectively
|
108
|
|
(134
|
)
|
(379
|
)
|
||||||
|
Reclassification to earnings, net of income tax (expense) of $(41), $(56) and $(22), respectively
|
139
|
|
177
|
|
137
|
|
||||||
|
Total change in fair value of derivatives
|
247
|
|
43
|
|
(242
|
)
|
||||||
|
Pension activity:
|
||||||||||||
|
Change in pension adjustments due to prior service cost, net of income tax (expense) benefit of $0, $0, and $0
|
—
|
|
(1
|
)
|
—
|
|
||||||
|
Change in pension adjustments due to net actuarial gain (loss) for the period, net of income tax (expense) benefit of $(198), $300, and $117
|
379
|
|
(587
|
)
|
(223
|
)
|
||||||
|
Reclassification to earnings due to amortization of net actuarial loss, net of income tax (expense) of $(26), $(15), and $(6), respectively
|
52
|
|
24
|
|
13
|
|
||||||
|
Total pension adjustments
|
431
|
|
(564
|
)
|
(210
|
)
|
||||||
|
OTHER COMPREHENSIVE INCOME (LOSS)
|
344
|
|
(731
|
)
|
(749
|
)
|
||||||
|
COMPREHENSIVE INCOME (LOSS)
|
895
|
|
(1,088
|
)
|
781
|
|
||||||
|
Less: Comprehensive (income) loss attributable to noncontrolling interests
|
(743
|
)
|
14
|
|
(1,098
|
)
|
||||||
|
COMPREHENSIVE INCOME (LOSS) ATTRIBUTABLE TO THE AES CORPORATION
|
$
|
152
|
|
$
|
(1,074
|
)
|
$
|
(317
|
)
|
|||
See Accompanying Notes to Consolidated Financial Statements.
117
THE AES CORPORATION
CONSOLIDATED STATEMENTS OF CHANGES IN EQUITY
YEARS ENDED DECEMBER 31, 2013, 2012, AND 2011
|
THE AES CORPORATION STOCKHOLDERS
|
||||||||||||||||||||||||||||||
|
Common Stock
|
Treasury Stock
|
Additional
Paid-In
Capital
|
Retained
Earnings
(Accumulated
Deficit)
|
Accumulated
Other
Comprehensive
Loss
|
Noncontrolling
Interests
|
|||||||||||||||||||||||||
|
Shares
|
Amount
|
Shares
|
Amount
|
|||||||||||||||||||||||||||
|
(in millions)
|
||||||||||||||||||||||||||||||
|
Balance at January 1, 2011
|
804.9
|
|
$
|
8
|
|
17.3
|
|
$
|
(216
|
)
|
$
|
8,444
|
|
$
|
620
|
|
$
|
(2,383
|
)
|
$
|
3,940
|
|
||||||||
|
Net income
|
—
|
|
—
|
|
—
|
|
—
|
|
—
|
|
58
|
|
—
|
|
1,472
|
|
||||||||||||||
|
Total change in fair value of available-for-sale securities, net of income tax
|
—
|
|
—
|
|
—
|
|
—
|
|
—
|
|
—
|
|
(1
|
)
|
—
|
|
||||||||||||||
|
Total Foreign currency translation adjustment, net of income tax
|
—
|
|
—
|
|
—
|
|
—
|
|
—
|
|
—
|
|
(143
|
)
|
(153
|
)
|
||||||||||||||
|
Total change in derivative fair value, including a reclassification to earnings, net of income tax
|
—
|
|
—
|
|
—
|
|
—
|
|
—
|
|
—
|
|
(190
|
)
|
(52
|
)
|
||||||||||||||
|
Total pension adjustments, net of income tax
|
—
|
|
—
|
|
—
|
|
—
|
|
—
|
|
—
|
|
(41
|
)
|
(169
|
)
|
||||||||||||||
|
Total other comprehensive income
|
|
|
|
|
|
|
|
|
|
|
|
|
(375
|
)
|
(374
|
)
|
||||||||||||||
|
Capital contributions from noncontrolling interests
|
—
|
|
—
|
|
—
|
|
—
|
|
—
|
|
—
|
|
—
|
|
8
|
|
||||||||||||||
|
Distributions to noncontrolling interests
|
—
|
|
—
|
|
—
|
|
—
|
|
—
|
|
—
|
|
—
|
|
(1,254
|
)
|
||||||||||||||
|
Disposition of businesses
|
—
|
|
—
|
|
—
|
|
—
|
|
—
|
|
—
|
|
—
|
|
(27
|
)
|
||||||||||||||
|
Acquisition of treasury stock
|
—
|
|
—
|
|
25.5
|
|
(279
|
)
|
—
|
|
—
|
|
—
|
|
—
|
|
||||||||||||||
|
Issuance and exercise of stock-based compensation benefit plans, net of income tax
|
2.7
|
|
—
|
|
(0.4
|
)
|
6
|
|
44
|
|
—
|
|
—
|
|
—
|
|
||||||||||||||
|
Sale of subsidiary shares to noncontrolling interests
|
—
|
|
—
|
|
—
|
|
—
|
|
19
|
|
—
|
|
—
|
|
16
|
|
||||||||||||||
|
Acquisition of subsidiary shares from noncontrolling interests
|
—
|
|
—
|
|
—
|
|
—
|
|
—
|
|
—
|
|
—
|
|
2
|
|
||||||||||||||
|
Balance at December 31, 2011
|
807.6
|
|
$
|
8
|
|
42.4
|
|
$
|
(489
|
)
|
$
|
8,507
|
|
$
|
678
|
|
$
|
(2,758
|
)
|
$
|
3,783
|
|
||||||||
|
Net income (loss)
|
—
|
|
—
|
|
—
|
|
—
|
|
—
|
|
(912
|
)
|
—
|
|
555
|
|
||||||||||||||
|
Total Foreign currency translation adjustment, net of income tax
|
—
|
|
—
|
|
—
|
|
—
|
|
—
|
|
—
|
|
(90
|
)
|
(120
|
)
|
||||||||||||||
|
Total change in derivative fair value, including a reclassification to earnings, net of income tax
|
—
|
|
—
|
|
—
|
|
—
|
|
—
|
|
—
|
|
53
|
|
(10
|
)
|
||||||||||||||
|
Total pension adjustments, net of income tax
|
—
|
|
—
|
|
—
|
|
—
|
|
—
|
|
—
|
|
(125
|
)
|
(439
|
)
|
||||||||||||||
|
Total other comprehensive income
|
|
|
|
|
|
|
|
|
|
|
|
|
(162
|
)
|
(569
|
)
|
||||||||||||||
|
Capital contributions from noncontrolling interests
|
—
|
|
—
|
|
—
|
|
—
|
|
—
|
|
—
|
|
—
|
|
30
|
|
||||||||||||||
|
Distributions to noncontrolling interests
|
—
|
|
—
|
|
—
|
|
—
|
|
—
|
|
—
|
|
—
|
|
(802
|
)
|
||||||||||||||
|
Disposition of businesses
|
—
|
|
—
|
|
—
|
|
—
|
|
—
|
|
—
|
|
—
|
|
(44
|
)
|
||||||||||||||
|
Acquisition of treasury stock
|
—
|
|
—
|
|
24.8
|
|
(301
|
)
|
—
|
|
—
|
|
—
|
|
—
|
|
||||||||||||||
|
Issuance and exercise of stock-based compensation benefit plans, net of income tax
|
3.1
|
|
—
|
|
(0.8
|
)
|
10
|
|
37
|
|
—
|
|
—
|
|
—
|
|
||||||||||||||
|
Dividends declared on common stock ($0.08 per share)
|
—
|
|
—
|
|
—
|
|
—
|
|
(30
|
)
|
(30
|
)
|
—
|
|
—
|
|
||||||||||||||
|
Sale of subsidiary shares to noncontrolling interests
|
—
|
|
—
|
|
—
|
|
—
|
|
7
|
|
—
|
|
—
|
|
5
|
|
||||||||||||||
|
Acquisition of subsidiary shares from noncontrolling interests
|
—
|
|
—
|
|
—
|
|
—
|
|
4
|
|
—
|
|
—
|
|
(13
|
)
|
||||||||||||||
|
Balance at December 31, 2012
|
810.7
|
|
$
|
8
|
|
66.4
|
|
$
|
(780
|
)
|
$
|
8,525
|
|
$
|
(264
|
)
|
$
|
(2,920
|
)
|
$
|
2,945
|
|
||||||||
|
Net income (loss)
|
—
|
|
—
|
|
—
|
|
—
|
|
—
|
|
114
|
|
—
|
|
437
|
|
||||||||||||||
|
Total Foreign currency translation adjustment, net of income tax
|
—
|
|
—
|
|
—
|
|
—
|
|
—
|
|
—
|
|
(227
|
)
|
(107
|
)
|
||||||||||||||
|
Total change in derivative fair value, including a reclassification to earnings, net of income tax
|
—
|
|
—
|
|
—
|
|
—
|
|
—
|
|
—
|
|
174
|
|
73
|
|
||||||||||||||
|
Total pension adjustments, net of income tax
|
—
|
|
—
|
|
—
|
|
—
|
|
—
|
|
—
|
|
91
|
|
340
|
|
||||||||||||||
|
Total other comprehensive income
|
|
|
|
|
|
|
|
|
|
|
|
|
38
|
|
306
|
|
||||||||||||||
|
Capital contributions from noncontrolling interests
|
—
|
|
—
|
|
—
|
|
—
|
|
—
|
|
—
|
|
—
|
|
109
|
|
||||||||||||||
|
Distributions to noncontrolling interests
|
—
|
|
—
|
|
—
|
|
—
|
|
—
|
|
—
|
|
—
|
|
(553
|
)
|
||||||||||||||
|
Disposition of businesses
|
—
|
|
—
|
|
—
|
|
—
|
|
—
|
|
—
|
|
—
|
|
(13
|
)
|
||||||||||||||
|
Acquisition of treasury stock
|
—
|
|
—
|
|
25.3
|
|
(322
|
)
|
—
|
|
—
|
|
—
|
|
—
|
|
||||||||||||||
|
Issuance and exercise of stock-based compensation benefit plans, net of income tax
|
2.6
|
|
—
|
|
(0.9
|
)
|
13
|
|
33
|
|
—
|
|
—
|
|
—
|
|
||||||||||||||
|
Dividends declared on common stock ($0.17 per share)
|
—
|
|
—
|
|
—
|
|
—
|
|
(125
|
)
|
—
|
|
—
|
|
—
|
|
||||||||||||||
|
Sale of subsidiary shares to noncontrolling interests
|
—
|
|
—
|
|
—
|
|
—
|
|
16
|
|
—
|
|
—
|
|
91
|
|
||||||||||||||
|
Acquisition of subsidiary shares from noncontrolling interests
|
—
|
|
—
|
|
—
|
|
—
|
|
(6
|
)
|
—
|
|
—
|
|
(1
|
)
|
||||||||||||||
|
Balance at December 31, 2013
|
813.3
|
|
$
|
8
|
|
90.8
|
|
$
|
(1,089
|
)
|
$
|
8,443
|
|
$
|
(150
|
)
|
$
|
(2,882
|
)
|
$
|
3,321
|
|
||||||||
See Accompanying Notes to Consolidated Financial Statements
118
THE AES CORPORATION
YEARS ENDED DECEMBER 31, 2013, 2012, AND 2011
|
2013
|
2012
|
2011
|
||||||||||
|
|
||||||||||||
|
(in millions)
|
||||||||||||
|
OPERATING ACTIVITIES:
|
||||||||||||
|
Net income (loss)
|
$
|
551
|
|
$
|
(357
|
)
|
$
|
1,530
|
|
|||
|
Adjustments to net income (loss):
|
||||||||||||
|
Depreciation and amortization
|
1,294
|
|
1,394
|
|
1,262
|
|
||||||
|
Loss (gain) on sale of assets and investments
|
14
|
|
(174
|
)
|
20
|
|
||||||
|
Impairment expenses
|
661
|
|
1,940
|
|
366
|
|
||||||
|
Deferred income taxes
|
(158
|
)
|
162
|
|
(199
|
)
|
||||||
|
Provisions for contingencies
|
44
|
|
47
|
|
30
|
|
||||||
|
Loss on the extinguishment of debt
|
229
|
|
8
|
|
62
|
|
||||||
|
Loss (gain) on disposals and impairments - discontinued operations
|
163
|
|
(84
|
)
|
(388
|
)
|
||||||
|
Other
|
(7
|
)
|
33
|
|
149
|
|
||||||
|
Changes in operating assets and liabilities
|
||||||||||||
|
(Increase) decrease in accounts receivable
|
146
|
|
(241
|
)
|
(236
|
)
|
||||||
|
(Increase) decrease in inventory
|
16
|
|
24
|
|
(141
|
)
|
||||||
|
(Increase) decrease in prepaid expenses and other current assets
|
358
|
|
120
|
|
(7
|
)
|
||||||
|
(Increase) decrease in other assets
|
(103
|
)
|
(589
|
)
|
(403
|
)
|
||||||
|
Increase (decrease) in accounts payable and other current liabilities
|
(725
|
)
|
330
|
|
322
|
|
||||||
|
Increase (decrease) in income tax payables, net and other tax payables
|
95
|
|
(47
|
)
|
166
|
|
||||||
|
Increase (decrease) in other liabilities
|
137
|
|
335
|
|
351
|
|
||||||
|
Net cash provided by operating activities
|
2,715
|
|
2,901
|
|
2,884
|
|
||||||
|
INVESTING ACTIVITIES:
|
||||||||||||
|
Capital expenditures
|
(1,988
|
)
|
(2,108
|
)
|
(2,430
|
)
|
||||||
|
Acquisitions - net of cash acquired
|
(7
|
)
|
(20
|
)
|
(3,562
|
)
|
||||||
|
Proceeds from the sale of businesses, net of cash sold
|
170
|
|
639
|
|
927
|
|
||||||
|
Proceeds from the sale of assets
|
62
|
|
46
|
|
117
|
|
||||||
|
Sale of short-term investments
|
4,361
|
|
6,437
|
|
6,075
|
|
||||||
|
Purchase of short-term investments
|
(4,443
|
)
|
(5,907
|
)
|
(5,860
|
)
|
||||||
|
Decrease (increase) in restricted cash, debt service reserves and other assets
|
44
|
|
(15
|
)
|
(223
|
)
|
||||||
|
Affiliate advances and equity investments
|
(7
|
)
|
(89
|
)
|
(155
|
)
|
||||||
|
Proceeds from performance bond
|
—
|
|
—
|
|
199
|
|
||||||
|
Proceeds from government grants for asset construction
|
2
|
|
122
|
|
8
|
|
||||||
|
Other investing
|
32
|
|
—
|
|
(2
|
)
|
||||||
|
Net cash used in investing activities
|
(1,774
|
)
|
(895
|
)
|
(4,906
|
)
|
||||||
|
FINANCING ACTIVITIES:
|
||||||||||||
|
(Repayments) borrowings under the revolving credit facilities, net
|
(22
|
)
|
(321
|
)
|
437
|
|
||||||
|
Issuance of recourse debt
|
750
|
|
—
|
|
2,050
|
|
||||||
|
Issuance of non-recourse debt
|
4,277
|
|
1,391
|
|
3,218
|
|
||||||
|
Repayments of recourse debt
|
(1,210
|
)
|
(235
|
)
|
(476
|
)
|
||||||
|
Repayments of non-recourse debt
|
(3,390
|
)
|
(1,325
|
)
|
(2,217
|
)
|
||||||
|
Payments for financing fees
|
(176
|
)
|
(40
|
)
|
(202
|
)
|
||||||
|
Distributions to noncontrolling interests
|
(557
|
)
|
(895
|
)
|
(1,088
|
)
|
||||||
|
Contributions from noncontrolling interests
|
210
|
|
43
|
|
6
|
|
||||||
|
Dividends paid on AES common stock
|
(119
|
)
|
(30
|
)
|
—
|
|
||||||
|
Payments for financed capital expenditures
|
(591
|
)
|
(162
|
)
|
(31
|
)
|
||||||
|
Purchase of treasury stock
|
(322
|
)
|
(301
|
)
|
(279
|
)
|
||||||
|
Other financing
|
14
|
|
8
|
|
(6
|
)
|
||||||
|
Net cash (used in) provided by financing activities
|
(1,136
|
)
|
(1,867
|
)
|
1,412
|
|
||||||
|
Effect of exchange rate changes on cash
|
(59
|
)
|
5
|
|
(122
|
)
|
||||||
|
(Increase) decrease in cash of discontinued and held-for-sale businesses
|
(4
|
)
|
132
|
|
(4
|
)
|
||||||
|
Total increase (decrease) in cash and cash equivalents
|
(258
|
)
|
276
|
|
(736
|
)
|
||||||
|
Cash and cash equivalents, beginning
|
1,900
|
|
1,624
|
|
2,360
|
|
||||||
|
Cash and cash equivalents, ending
|
$
|
1,642
|
|
$
|
1,900
|
|
$
|
1,624
|
|
|||
|
SUPPLEMENTAL DISCLOSURES:
|
||||||||||||
|
Cash payments for interest, net of amounts capitalized
|
$
|
1,398
|
|
$
|
1,509
|
|
$
|
1,442
|
|
|||
|
Cash payments for income taxes, net of refunds
|
$
|
570
|
|
$
|
647
|
|
$
|
971
|
|
|||
|
SCHEDULE OF NONCASH INVESTING AND FINANCING ACTIVITIES
|
||||||||||||
|
Assets acquired in noncash asset exchange or capital lease
|
$
|
34
|
|
$
|
12
|
|
$
|
20
|
|
|||
See Accompanying Notes to Consolidated Financial Statements.
119
THE AES CORPORATION
NOTES TO CONSOLIDATED FINANCIAL STATEMENTS
DECEMBER 31, 2013, 2012, AND 2011
1. GENERAL AND SUMMARY OF SIGNIFICANT ACCOUNTING POLICIES
The AES Corporation is a holding company (the “Parent Company”) that through its subsidiaries and affiliates, (collectively, “AES” or “the Company”) operates a geographically diversified portfolio of electricity generation and distribution businesses. Generally, given this holding company structure, the liabilities of the individual operating entities are not recourse to the parent and are isolated to the operating entities. Most of our operating entities are structured as limited liability entities, which limit the liability of shareholders. The structure is generally the same regardless of whether a subsidiary is consolidated under a voting or interest model.
CORRECTION OF AN ERROR
—Certain amounts related to the payment of costs for the construction of our Muong Dong facility in Vietnam were misclassified as an investing activity on the Consolidated Statement of Cash Flows in 2012. The error was related to costs that were paid under extended payment terms as allowed by the construction contract, but should have been reflected as financing activities in accordance with the accounting guidance for cash flows. As a result, cash flows from investing activities were overstated by
$128 million
and cash flows from financing activities were understated by
$128 million
. Cash flows from investing activities were previously reported as
$1 billion
and have now been restated to
$895 million
for the year ended December 31, 2012. Cash flows from financing activities were previously reported as
$1.7 billion
and have now been restated to
$1.9 billion
for the year ended December 31, 2012. There was no impact on amounts presented on the Consolidated Balance Sheet as of December 31, 2012 or the Consolidated Statement of Operations for the year ended December 31, 2012.
PRINCIPLES OF CONSOLIDATION
—The Consolidated Financial Statements of the Company include the accounts of The AES Corporation and its subsidiaries, which are the entities that it controls. Furthermore, variable interest entities (“VIEs”) in which the Company has a variable interest have been consolidated where the Company is the primary beneficiary and thus controls the VIE. Intercompany transactions and balances are eliminated in consolidation. Investments in which the Company has the ability to exercise significant influence, but not control, are accounted for using the equity method of accounting.
DP&L, our utility in Ohio, has undivided interests in seven generation facilities and numerous transmission facilities. These undivided interests in jointly-owned facilities are accounted for on a pro rata basis in our consolidated financial statements. Certain expenses, primarily fuel costs for the generating units, are allocated to the joint owners based on their energy usage. The remaining expenses, investments in fuel inventory, plant materials and operating supplies and capital additions are allocated to the joint owners in accordance with their respective ownership interests.
USE OF ESTIMATES
—The preparation of these consolidated financial statements in conformity with accounting principles generally accepted in the United States of America (“U.S. GAAP”) requires the Company to make estimates and assumptions that affect reported amounts of assets and liabilities and disclosures of contingent assets and liabilities at the date of the consolidated financial statements, as well as the reported amounts of revenue and expenses during the reporting period. Actual results could differ from those estimates. Items subject to such estimates and assumptions include: the carrying amount and estimated useful lives of long-lived assets; impairment of goodwill, long-lived assets and equity method investments; valuation allowances for receivables and deferred tax assets; the recoverability of regulatory assets; the estimation of regulatory liabilities; the fair value of financial instruments; the fair value of assets and liabilities acquired in a business combination; the measurement of noncontrolling interest using the hypothetical liquidation at book value (“HLBV”) method for certain wind generation partnerships; pension liabilities; environmental liabilities; and potential litigation claims and settlements.
DISCONTINUED OPERATIONS AND RECLASSIFICATIONS
—A discontinued operation is a component of the Company that either has been disposed of or is classified as held for sale and the Company does not expect to have significant cash flows from or significant continuing involvement with the component as of one year after its disposal or sale. A component comprises operations and cash flows that can be clearly distinguished, operationally and for financial reporting purposes, from the rest of the Company. Prior period amounts have been retrospectively revised to reflect the businesses determined to be discontinued operations. Cash flows at discontinued and held for sale businesses are included within the relevant categories within operating, investing and financing activities. The aggregate amount of cash flows is offset by the net increase or decrease in cash of discontinued and held for sale businesses, which is presented as a separate line item in the Consolidated Statements of Cash Flows. When an operation is classified as held for sale, the Company recognizes impairment, if any, at the consolidated financial statement level which also includes noncontrolling interests. However, any gain or loss on the completion of a disposal transaction is recognized only for the Company's ownership interest. When reclassifications are made in the current period, the amounts reported in the prior period financial statements are reclassified to conform to the current year presentation.
120
THE AES CORPORATION
NOTES TO CONSOLIDATED FINANCIAL STATEMENTS—(Continued)
DECEMBER 31, 2013, 2012, AND 2011
The reclassifications relate primarily to general and administrative costs at certain of the Company's strategic business units ("SBUs") that were previously classified as "general and administrative expenses" that were reclassified to" cost of sales".
FAIR VALUE
—Fair value is the price that would be received to sell an asset or paid to transfer a liability in an orderly, hypothetical transaction between market participants at the measurement date, or exit price. The Company applies the fair value measurement accounting guidance to financial assets and liabilities in determining the fair value of investments in marketable debt and equity securities, included in the consolidated balance sheet line items “Short-term investments” and “Other assets (noncurrent)”; derivative assets, included in “Other current assets” and “Other assets (noncurrent)”; and, derivative liabilities, included in “Accrued and other liabilities (current)” and “Other long-term liabilities.” The Company applies the fair value measurement guidance to nonfinancial assets and liabilities upon the acquisition of a business or in conjunction with the measurement of a potential impairment loss on an asset group or goodwill under the accounting guidance for the impairment of long-lived assets or goodwill.
The Company makes assumptions about what market participants would assume in valuing an asset or liability based on the best information available. These factors include nonperformance risk (the risk that the obligation will not be fulfilled) and credit risk of the subsidiary (for liabilities) and of the counterparty (for assets). The Company is prohibited from including transaction costs and any adjustments for blockage factors in determining fair value. The principal or most advantageous market is considered from the perspective of the subsidiary owning the asset or with the liability.
Fair value is based on observable market prices where available. Where they are not available, specific valuation models and techniques are applied depending on what is being fair valued. These models and techniques maximize the use of observable inputs and minimize the use of unobservable inputs. The process involves varying levels of management judgment, the degree of which is dependent on price transparency and complexity. An asset's or liability’s level within the fair value hierarchy is based on the lowest level of input significant to the fair value measurement, where Level 1 is the highest and Level 3 is the lowest. The three levels are defined as follows:
|
•
|
Level 1—unadjusted quoted prices in active markets accessible by the Company for identical assets or liabilities. Active markets are those in which transactions for the asset or liability occur with sufficient frequency and volume to provide pricing information on an ongoing basis.
|
|
•
|
Level 2—pricing inputs other than quoted market prices included in Level 1 which are based on observable market data, that are directly or indirectly observable for substantially the full term of the asset or liability. These include quoted market prices for similar assets or liabilities, quoted market prices for identical or similar assets in markets that are not active, adjusted quoted market prices, inputs from observable data such as interest rate and yield curves, volatilities or default rates observable at commonly quoted intervals or inputs derived from observable market data by correlation or other means.
|
|
•
|
Level 3—pricing inputs that are unobservable from objective sources. Unobservable inputs are only used to the extent observable inputs are not available. These inputs maintain the concept of an exit price from the perspective of a market participant and reflect assumptions of other market participants. The Company considers all market participant assumptions that are available without unreasonable cost and effort. These are given the lowest priority and are generally used in internally developed methodologies to generate management’s best estimate of the fair value when no observable market data is available.
|
Any transfers between all levels within the fair value hierarchy levels are recognized at the end of the reporting period.
CASH AND CASH EQUIVALENTS
—The Company considers unrestricted cash on hand, deposits in banks, certificates of deposit and short-term marketable securities that mature within three months or less from the date of purchase to be cash and cash equivalents. The carrying amounts of such balances approximate fair value.
RESTRICTED CASH AND DEBT SERVICE RESERVES
—These include cash balances which are restricted as to withdrawal or usage by the subsidiary that owns the cash. The nature of restrictions includes restrictions imposed by financing agreements such as security deposits kept as collateral, debt service reserves, maintenance reserves and others, as well as restrictions imposed by long-term PPAs.
INVESTMENTS IN MARKETABLE SECURITIES
—The Company’s marketable investments are primarily unsecured debentures, certificates of deposit, government debt securities and money market funds. Short-term investments in marketable debt and equity securities consist of securities with original maturities in excess of three months with remaining maturities of less than one year.
121
THE AES CORPORATION
NOTES TO CONSOLIDATED FINANCIAL STATEMENTS—(Continued)
DECEMBER 31, 2013, 2012, AND 2011
Marketable debt securities that the Company has both the positive intent and ability to hold to maturity are classified as held-to-maturity and are carried at amortized cost. Other marketable securities that the Company does not intend to hold to maturity are classified as available-for-sale or trading and are carried at fair value. Available-for-sale investments are fair valued at the end of each reporting period where the unrealized gains or losses are reflected in accumulated other comprehensive loss (“AOCL”), a separate component of equity. However, in measuring the other-than-temporary impairment of debt securities, the Company identifies two components: 1) the amount representing the credit loss, which is recognized as “other non-operating expense” in the Consolidated Statements of Operations; and 2) the amount related to other factors, which is recognized in AOCL unless there is a plan to sell the security, in which case it would be recognized in earnings. The amount recognized in AOCL for held-to-maturity debt securities is then amortized in earnings over the remaining life of such securities.
Investments classified as trading are fair valued at the end of each reporting period through the Consolidated Statements of Operations. Interest and dividends on investments are reported in "interest income" and "other income", respectively. Gains and losses on sales of investments are determined using the specific identification method.
ACCOUNTS AND NOTES RECEIVABLE AND ALLOWANCE FOR DOUBTFUL ACCOUNTS
—Accounts and notes receivable are carried at amortized cost. The Company periodically assesses the collectability of accounts receivable, considering factors such as specific evaluation of collectability, historical collection experience, the age of accounts receivable and other currently available evidence of the collectability, and records an allowance for doubtful accounts for the estimated uncollectible amount as appropriate. Certain of our businesses charge interest on accounts receivable either under contractual terms or where charging interest is a customary business practice. In such cases, interest income is recognized on an accrual basis. So long as the collection of interest is not reasonably assured, interest income is recognized as cash is received. Individual accounts and notes receivable are written off when they are no longer deemed collectible.
INVENTORY
—Inventory primarily consists of coal, fuel oil and other raw materials used to generate power, and spare parts and supplies used to maintain power generation and distribution facilities. Inventory is carried at lower of cost or market. Cost is the sum of the purchase price and incidental expenditures and charges incurred to bring the inventory to its existing condition or location. Cost is determined under the first-in, first-out (“FIFO”), average cost or specific identification method. Generally, cost is reduced to market value if the market value of inventory has declined and it is probable that the utility of inventory, in its disposal in the ordinary course of business, will not be recovered through revenue earned from the generation of power.
LONG-LIVED ASSETS
—Long-lived assets include property, plant and equipment, assets under capital leases and intangible assets subject to amortization (i.e., finite-lived intangible assets).
Property, plant and equipment
Property, plant and equipment are stated at cost, net of accumulated depreciation. The cost of renewals and improvements that extend the useful life of property, plant and equipment are capitalized.
Construction progress payments, engineering costs, insurance costs, salaries, interest and other costs directly relating to construction in progress are capitalized during the construction period, provided the completion of the project is deemed probable, or expensed at the time the Company determines that development of a particular project is no longer probable. The continued capitalization of such costs is subject to ongoing risks related to successful completion, including those related to government approvals, site identification, financing, construction permitting and contract compliance. Construction in progress balances are transferred to electric generation and distribution assets when an asset group is ready for its intended use. Government subsidies, liquidated damages recovered for construction delays and income tax credits are recorded as a reduction to property, plant and equipment and reflected in cash flows from investing activities.
Depreciation, after consideration of salvage value and asset retirement obligations, is computed primarily using the straight-line method over the estimated useful lives of the assets, which are determined on a composite or component basis. Maintenance and repairs are charged to expense as incurred. Capital spare parts, including rotable spare parts, are included in electric generation and distribution assets. If the spare part is considered a component, it is depreciated over its useful life after the part is placed in service. If the spare part is deemed part of a composite asset, the part is depreciated over the composite useful life even when being held as a spare part.
The Company’s Brazilian subsidiaries, which include both generation and distribution companies, operate under concession contracts. Certain estimates are utilized to determine depreciation expense for the Brazilian subsidiaries, including the useful lives of the property, plant and equipment and the amounts to be recovered at the end of the concession contract. The
122
THE AES CORPORATION
NOTES TO CONSOLIDATED FINANCIAL STATEMENTS—(Continued)
DECEMBER 31, 2013, 2012, AND 2011
amounts to be recovered under these concession contracts are based on estimates that are inherently uncertain and actual amounts recovered may differ from those estimates.
Intangible Assets Subject to Amortization
Finite-lived intangible assets are amortized over their useful lives which range from
1
–
50
years. The Company accounts for purchased emission allowances as intangible assets and records an expense when utilized or sold. Granted emission allowances are valued at zero.
Impairment of Long-lived Assets
When circumstances indicate that the carrying amount of long-lived assets (asset group) held-for-use may not be recoverable, the Company evaluates the assets for potential impairment using internal projections of undiscounted cash flows expected to result from the use and eventual disposal of the assets. Events or changes in circumstances that may necessitate a recoverability evaluation may include but are not limited to: adverse changes in the regulatory environment, unfavorable changes in power prices or fuel costs, increased competition due to additional capacity in the grid, technological advancements, declining trends in demand, or an expectation that it is more likely than not that the asset will be disposed of before the end of its previously estimated useful life. If the carrying amount of the assets exceeds the undiscounted cash flows and exceeds any fair value of the assets, an impairment expense is recognized for the excess up to the carrying amount of the long-lived assets (but up to any fair value for any individual long-lived asset that is determinable without undue cost and effort). For regulated assets, an impairment expense could be reduced by the establishment of a regulatory asset, if recovery through approved rates was probable. For non-regulated assets, impairment is recognized as an expense. When long-lived assets meet the criteria to be classified as held-for-sale and the carrying amount of the disposal group exceeds its fair value less costs to sell, an impairment expense is recognized for the excess up to the carrying amount of the long-lived assets; if the fair value of the disposal group subsequently exceeds the carrying amount while the disposal group is still held-for-sale, any impairment expense previously recognized will be reversed up to the lower of the prior expense or the subsequent excess.
DEFERRED FINANCING COSTS
—Costs incurred in connection with the issuance of long-term debt are deferred and amortized over the related financing period using the effective interest method or the straight-line method when it does not differ materially from the effective interest method. Make-whole payments in connection with early debt retirements are classified as cash flows used in financing activities.
EQUITY METHOD INVESTMENTS
—Investments in entities over which the Company has the ability to exercise significant influence, but not control, are accounted for using the equity method of accounting and reported in “Investments in and advances to affiliates” on the Consolidated Balance Sheets. The Company periodically assesses if there is an indication that the fair value of an equity method investment is less than its carrying amount. When an indicator exists, any excess of the carrying amount over its estimated fair value is recognized as impairment when the loss in value is deemed other-than-temporary and included in “Other non-operating expense” in the Consolidated Statements of Operations.
The Company discontinues the application of the equity method when an investment is reduced to zero and the Company is not otherwise committed to provide further financial support to the investee. The Company resumes the application of the equity method if the investee subsequently reports net income to the extent that the Company’s share of such net income equals the share of net losses not recognized during the period in which the equity method of accounting was suspended.
GOODWILL AND INDEFINITE-LIVED INTANGIBLE ASSETS
—The Company evaluates goodwill and indefinite-lived intangible assets for impairment on an annual basis and whenever events or changes in circumstances necessitate an evaluation for impairment. The Company’s annual impairment testing date is October 1.
Goodwill
The Company evaluates goodwill impairment at the reporting unit level, which is an operating segment, as defined in the segment reporting accounting guidance, or a component (i.e., one level below an operating segment). In determining its reporting units, the Company starts with its management reporting structure. Operating segments are identified and then analyzed to identify components which make up these operating segments. Two or more components are combined into a single reporting unit if they are economically similar. Assets and liabilities are allocated to a reporting unit if the assets will be employed by or a liability relates to the operations of the reporting unit or would be considered by a market participant in determining its fair value. Goodwill resulting from an acquisition is assigned to the reporting units that are expected to benefit
123
THE AES CORPORATION
NOTES TO CONSOLIDATED FINANCIAL STATEMENTS—(Continued)
DECEMBER 31, 2013, 2012, AND 2011
from the synergies of the acquisition. Generally, each AES business with a goodwill balance constitutes a reporting unit as they are not reported to segment management together with other businesses and are not similar to other businesses in a segment.
Goodwill is evaluated for impairment either under the qualitative assessment option or the two-step test approach depending on facts and circumstances of a reporting unit, including: the excess of fair value over carrying amount in the last valuation or changes in business environment. If the Company qualitatively determines it is “more likely than not” that the fair value of a reporting unit is greater than its carrying amount, the two-step impairment test is unnecessary. Otherwise, goodwill is evaluated for impairment using the two step test, where the carrying amount of a reporting unit is compared to its fair value in Step 1; if the fair value exceeds the carrying amount, Step 2 is unnecessary. If the carrying amount exceeds the reporting unit’s fair value, this could indicate potential impairment and Step 2 of the goodwill evaluation process is required to determine if goodwill is impaired and to measure the amount of impairment loss to recognize, if any. When Step 2 is necessary, the fair value of individual assets and liabilities is determined using valuations (which in some cases may be based in part on third party valuation reports), or other observable sources of fair value, as appropriate. If the carrying amount of goodwill exceeds its implied fair value, the excess is recognized as an impairment loss.
Most of the Company’s reporting units are not publicly traded. Therefore, the Company estimates the fair value of its reporting units using internal budgets and forecasts, adjusted for any market participants’ assumptions and discounted at the rate of return required by a market participant. The Company considers both market and income-based approaches to determine a range of fair value, but typically concludes that the value derived using an income-based approach is more representative of fair value due to the lack of direct market comparables. The Company does use market data to corroborate and determine the reasonableness of the fair value derived from the income-based discounted cash flow analysis.
Indefinite-lived Intangible Assets
The Company’s indefinite-lived intangible assets primarily include land use rights, easements, concessions and trade name. These are tested for impairment on an annual basis or whenever events or changes in circumstances necessitate an evaluation for impairment. If the carrying amount of an intangible asset exceeds its fair value, the excess is recognized as impairment expense. When deemed appropriate, the Company uses the qualitative assessment option under the accounting guidance on goodwill and intangible assets to determine whether the existence of events or circumstances indicate that it is more likely than not that an intangible asset is impaired. If, after assessing the totality of events and circumstances, the Company determines that it is not more likely than not that an intangible asset is impaired, no further action is taken. The accounting guidance provides the option to bypass the qualitative assessment for any intangible asset in any period and proceed directly to performing the quantitative impairment test.
ACCOUNTS PAYABLE AND OTHER ACCRUED LIABILITIES
—Accounts payable consists of amounts due to trade creditors related to the Company’s core business operations. These payables include amounts owed to vendors and suppliers for items such as energy purchased for resale, fuel, maintenance, inventory and other raw materials. Other accrued liabilities include items such as income taxes, regulatory liabilities, legal contingencies and employee-related costs including payroll, benefits and related taxes.
REGULATORY ASSETS AND LIABILITIES
—The Company records assets and liabilities that result from the regulated ratemaking process that are not recognized under GAAP for non-regulated entities. Regulatory assets generally represent incurred costs that have been deferred due to the probability of future recovery in customer rates. Regulatory liabilities generally represent obligations to make refunds to customers. Management continually assesses whether the regulatory assets are probable of future recovery by considering factors such as applicable regulatory changes, recent rate orders applicable to other regulated entities and the status of any pending or potential deregulation legislation. If future recovery of costs previously deferred ceases to be probable, the related regulatory assets are written off and recognized in income from continuing operations.
PENSION AND OTHER POSTRETIREMENT PLANS
—The Company recognizes in its Consolidated Balance Sheets an asset or liability reflecting the funded status of pension and other postretirement plans with current year changes in the funded status recognized in AOCL, except for those plans at certain of the Company’s regulated utilities that can recover portions of their pension and postretirement obligations through future rates. All plan assets are recorded at fair value. AES follows the measurement date provisions of the accounting guidance, which require a year-end measurement date of plan assets and obligations for all defined benefit plans.
INCOME TAXES
—Deferred tax assets and liabilities are recognized for the future tax consequences attributable to differences between the financial statement carrying amounts of the existing assets and liabilities, and their respective income
124
THE AES CORPORATION
NOTES TO CONSOLIDATED FINANCIAL STATEMENTS—(Continued)
DECEMBER 31, 2013, 2012, AND 2011
tax bases. The Company establishes a valuation allowance when it is more likely than not that all or a portion of a deferred tax asset will not be realized. The Company’s tax positions are evaluated under a more-likely-than-not recognition threshold and measurement analysis before they are recognized for financial statement reporting.
Uncertain tax positions have been classified as noncurrent income tax liabilities unless expected to be paid within one year. The Company’s policy for interest and penalties related to income tax exposures is to recognize interest and penalties as a component of the provision for income taxes in the Consolidated Statements of Operations.
ASSET RETIREMENT OBLIGATIONS
—The Company records the fair value of the liability for a legal obligation to retire an asset in the period in which the obligation is incurred. When a new liability is recognized, the Company capitalizes the costs of the liability by increasing the carrying amount of the related long-lived asset. The liability is accreted to its present value each period and the capitalized cost is depreciated over the useful life of the related asset. Upon settlement of the obligation, the Company eliminates the liability and, based on the actual cost to retire, may incur a gain or loss.
NONCONTROLLING INTERESTS
—Noncontrolling interests are classified as a separate component of equity in the Consolidated Balance Sheets and Consolidated Statements of Changes in Equity. Additionally, net income and comprehensive income attributable to noncontrolling interests are reflected separately from consolidated net income and comprehensive income in the Consolidated Statements of Operations and Consolidated Statements of Changes in Equity. Any change in ownership of a subsidiary while the controlling financial interest is retained is accounted for as an equity transaction between the controlling and noncontrolling interests. Losses continue to be attributed to the noncontrolling interests, even when the noncontrolling interests’ basis has been reduced to zero.
Although, in general, the noncontrolling ownership interest in earnings is calculated based on ownership percentage, certain of the Company’s businesses are subject to certain profit sharing arrangements. These agreements exist for Wind Generation partnerships to designate different allocations of value among investors, where the allocations change in form or percentage over the life of the partnership. For these businesses, the Company uses the HLBV method when it is a reasonable approximation of the profit sharing arrangement. HLBV uses a balance sheet approach, which measures the Company’s equity in income or loss by calculating the change in the amount of net worth the partners are legally able to claim based on a hypothetical liquidation of the entity at the beginning of a reporting period compared to the end of that period.
GUARANTOR ACCOUNTING
—At the inception of a guarantee, the Company records the fair value of a guarantee as a liability, with the offset dependent on the circumstances under which the guarantee was issued. The Company does not recognize guarantees given to third parties for its subsidiaries’ future performance.
FOREIGN CURRENCY TRANSLATION
—A business’ functional currency is the currency of the primary economic environment in which the business operates and is generally the currency in which the business generates and expends cash. Subsidiaries and affiliates whose functional currency is a currency other than the U.S. Dollar translate their assets and liabilities into U.S. Dollars at the current exchange rates in effect at the end of the fiscal period. The revenue and expense accounts of such subsidiaries and affiliates are translated into U.S. Dollars at the average exchange rates that prevailed during the period. Translation adjustments are included in AOCL. Gains and losses on intercompany foreign currency transactions that are long-term in nature and which the Company does not intend to settle in the foreseeable future, are also recognized in AOCL. Gains and losses that arise from exchange rate fluctuations on transactions denominated in a currency other than the functional currency are included in determining net income. Accumulated foreign currency translation adjustments are reclassified to net income only when realized upon sale or upon complete or substantially complete liquidation of the investment in a foreign entity. The accumulated adjustments are included in carrying amounts in impairment assessments where the Company has committed to a plan that will cause the accumulated adjustments to be reclassified to earnings
REVENUE RECOGNITION
—Revenue from Utilities is classified as regulated in the Consolidated Statements of Operations. Revenue from the sale of energy is recognized in the period during which the sale occurs. The calculation of revenue earned but not yet billed is based on the number of days not billed in the month, the estimated amount of energy delivered during those days and the estimated average price per customer class for that month. Differences between actual and estimated unbilled revenue are usually immaterial. The Company has businesses where it sells and purchases power to and from Independent System Operators (“ISOs”) and Regional Transmission Organizations (“RTOs”). In those instances, the Company accounts for these transactions on a net hourly basis because the transactions are settled on a net hourly basis. Revenue from Generation businesses is classified as non-regulated and is recognized based upon output delivered and capacity provided, at rates as specified under contract terms or prevailing market rates. Certain of the Company PPAs meet the definition of an operating lease or contain similar arrangements. Typically, minimum lease payments from such PPAs are recognized as revenue
125
THE AES CORPORATION
NOTES TO CONSOLIDATED FINANCIAL STATEMENTS—(Continued)
DECEMBER 31, 2013, 2012, AND 2011
on a straight line basis over the lease term whereas contingent rentals are recognized when earned. Revenue is recorded net of any taxes assessed on and collected from customers, which are remitted to the governmental authorities.
SHARE-BASED COMPENSATION
—The Company grants share-based compensation in the form of stock options and restricted stock units. The expense is based on the grant-date fair value of the equity or liability instrument issued and is recognized on a straight-line basis over the requisite service period, net of estimated forfeitures. Currently, the Company uses a Black-Scholes option pricing model to estimate the fair value of stock options granted to its employees.
GENERAL AND ADMINISTRATIVE EXPENSES
—General and administrative expenses include corporate and other expenses related to corporate staff functions and initiatives, primarily executive management, finance, legal, human resources and information systems, which are not directly allocable to our business segments. Additionally, all costs associated with business development efforts are classified as general and administrative expenses.
DERIVATIVES AND HEDGING ACTIVITIES
—Under the accounting standards for derivatives and hedging, the Company recognizes all contracts that meet the definition of a derivative, except those designated as normal purchase or normal sale at inception, as either assets or liabilities in the Consolidated Balance Sheets and measures those instruments at fair value. See the Company’s fair value policy and Note 4—
Fair Value
for additional discussion regarding the determination of the fair value. The PPAs and fuel supply agreements entered into by the Company are evaluated to determine if they meet the definition of a derivative or contain embedded derivatives, either of which require separate valuation and accounting. To be a derivative under the accounting standards for derivatives and hedging, an agreement would need to have a notional and an underlying, require little or no initial net investment and could be net settled. Generally, these agreements do not meet the definition of a derivative, often due to the inability to be net settled. On a quarterly basis, we evaluate the markets for the commodities to be delivered under these agreements to determine if facts and circumstances have changed such that the agreements could then be net settled and meet the definition of a derivative.
Derivatives primarily consist of interest rate swaps, cross-currency swaps, foreign currency instruments, and commodity derivatives. The Company enters into various derivative transactions in order to hedge its exposure to certain market risks, primarily interest rate, foreign currency and commodity price risks. Regarding interest rate risk, the Company and our subsidiaries generally utilize variable rate debt financing for construction projects and operations so interest rate swap, lock, cap, and floor agreements are entered into to manage interest rate risk by effectively fixing or limiting the interest rate exposure on the underlying financing and are typically designated as cash flow hedges. Regarding foreign currency risk, we are exposed to it as a result of our investments in foreign subsidiaries and affiliates that may be impacted by significant fluctuations in foreign currency exchange rates so foreign currency options and forwards are utilized, where deemed appropriate, to manage the risk related to these fluctuations. Cross-currency swaps are utilized in certain instances to manage the risk related to fluctuations in both interest rates and certain foreign currencies. In addition, certain of our subsidiaries have entered into contracts which contain embedded derivatives as a portion of the contracts is denominated in a currency other than the functional or local currency of that subsidiary or the currency of the item. Regarding commodity price risk, we are exposed to the impact of market fluctuations in the price of electricity, fuel and environmental credits. Although we primarily consist of businesses with long-term contracts or retail sales concessions (which provide our distribution businesses with a franchise to serve a specific geographic region), a portion of our current and expected future revenues are derived from businesses without significant long-term purchase or sales contracts. We use an overall hedging strategy, not just derivatives, to hedge our financial performance against the effects of fluctuations in commodity prices.
The accounting standards for derivatives and hedging enable companies to designate qualifying derivatives as hedging instruments based on the exposure being hedged. The Company only has cash flow hedges at this time. Changes in the fair value of a derivative that is highly effective, designated and qualifies as a cash flow hedge are deferred in AOCL and are recognized into earnings as the hedged transactions affect earnings. Any ineffectiveness is recognized in earnings immediately. For all designated and qualifying hedges, the Company maintains formal documentation of the hedge and effectiveness testing in accordance with the accounting standards for derivatives and hedging. If AES determines that the derivative is no longer highly effective as a hedge, hedge accounting will be discontinued prospectively. For cash flow hedges of forecasted transactions, AES estimates the future cash flows of the forecasted transactions and evaluates the probability of the occurrence and timing of such transactions. Changes in conditions or the occurrence of unforeseen events could require discontinuance of hedge accounting or could affect the timing of the reclassification of gains or losses on cash flow hedges from AOCL into earnings.
While derivative transactions are not entered into for trading purposes, some contracts are not eligible for hedge accounting. Changes in the fair value of derivatives not designated and qualifying as cash flow hedges are immediately recognized in earnings. Regardless of when gains or losses on derivatives (including all those where the fair value measurement
126
THE AES CORPORATION
NOTES TO CONSOLIDATED FINANCIAL STATEMENTS—(Continued)
DECEMBER 31, 2013, 2012, AND 2011
is classified as Level 3) are recognized in earnings, they are generally classified as follows: interest expense for interest rate and cross-currency derivatives, foreign currency transaction gains or losses for foreign currency derivatives, and non-regulated revenue or non-regulated cost of sales for commodity and other derivatives. However, gains and losses on interest rate and cross-currency derivatives are classified as foreign currency transaction gains and losses if they offset the remeasurement of the foreign currency-denominated debt being hedged by the cross-currency swaps and the amount reclassified from AOCL to cost of sales to offset depreciation where the variable-rate interest capitalized as part of the asset was hedged during its construction. Cash flows arising from derivatives are included in the Consolidated Statements of Cash Flows as an operating activity given the nature of the underlying risk being economically hedged and the lack of significant financing elements, except that cash flows on designated and qualifying hedges of variable-rate interest during construction are classified as an investing activity.
The Company has elected not to offset net derivative positions in the financial statements. Accordingly, the Company does not offset such derivative positions against the fair value of amounts (or amounts that approximate fair value) recognized for the right to reclaim cash collateral (a receivable) or the obligation to return cash collateral (a payable) under master netting arrangements.
ACCOUNTING PRONOUNCEMENTS ISSUED BUT NOT YET EFFECTIVE
—The following accounting standards have been issued, but are not yet effective for, and have not been adopted by AES.
ASU No. 2013-11, Income Taxes (Topic 740), "Presentation of an Unrecognized Tax Benefit When a Net Operating Loss Carryforward, a Similar Tax Loss, or a Tax Credit Carryforward Exists (a consensus of the FASB Emerging Issues Task Force)."
In July 2013, the FASB issued ASU No. 2013-11, which requires the netting of unrecognized tax benefits (“UTBs”) against a deferred tax asset for a loss or other carryforward that would apply in settlement of uncertain tax positions. Under the new standard, UTBs will be netted against all available same-jurisdiction loss or other tax carryforwards that would be utilized, rather than only against carryforwards that are created by the UTBs. ASU No. 2013-11 is effective for annual reporting periods beginning after December 15, 2013 and interim periods therein. The new standard requires prospective adoption, but allows optional retrospective adoption. Based on balances as of December 31, 2013, the estimated impact to the Company’s Consolidated Balance Sheet is a reduction of $71 million to “Other noncurrent liabilities” and an offsetting increase to “Deferred income taxes” under “Noncurrent Liabilities”. There will be no impact on the results of operations and cash flows.
ASU No. 2013-7, Presentation of Financial Statements (Topic 205), "Liquidation Basis of Accounting"
In April 2013, the FASB issued ASU No. 2013-7, which requires an entity to prepare financial statements on a liquidation basis when liquidation is imminent, unless the liquidation is the same as the plan specified in an entity's governing documents created at its inception. Under the liquidation basis of accounting, an entity will measure and present assets at the estimated amount of cash proceeds or other consideration that it expects to collect in settling or disposing of those assets in carrying out its plan for liquidation. This includes assets the entity previously had not recognized under U.S. GAAP, but expects to either sell in liquidation or use in settling liabilities (for example, trademarks). An entity will recognize and measure its liabilities in accordance with U.S. GAAP that otherwise applies to those liabilities. An entity should not anticipate it will be legally released from being the primary obligor under those liabilities, either judicially or by creditors. An entity will also accrue and separately present the costs it expects to incur and the income it expects to earn during the course of the liquidation, including any costs associated with the disposal or settlement of its assets and liabilities. ASU No. 2013-7 also requires additional disclosures. ASU No. 2013-7 is effective for annual reporting periods beginning after December 15, 2013. Early adoption is permitted. The adoption of ASU No, 2013-7 is not expected to have a significant impact on the Company's consolidated financial position, results of operations and cash flows.
ASU No. 2013-5, Foreign Currency Matters (Topic 830), “Parent’s Accounting for the Cumulative Translation Adjustment upon Derecognition of Certain Subsidiaries or Groups of Assets within a Foreign Entity or of an Investment in a Foreign Entity.”
In March 2013, the FASB issued ASU No. 2013-5, which requires an entity to release any related cumulative translation adjustment into net income when it ceases to have a controlling financial interest in a subsidiary or group of assets that is a business (other than a sale of in-substance real estate) within a foreign entity. Accordingly, the cumulative translation adjustment should be released into net income only if the sale or transfer results in the complete or substantially complete liquidation of the foreign entity in which the subsidiary or group of assets had resided. For an equity method investment that is a foreign entity, the partial sale guidance still applies. As such, a pro rata portion of the cumulative translation adjustment should be released into net income upon a partial sale of such an equity method investment. In those instances, the cumulative
127
THE AES CORPORATION
NOTES TO CONSOLIDATED FINANCIAL STATEMENTS—(Continued)
DECEMBER 31, 2013, 2012, AND 2011
adjustment is released into net income only if the partial sale represents a complete or substantially complete liquidation of the foreign entity that contains the equity method investment. The amendments are effective prospectively for fiscal years (and interim reporting periods within those years) beginning after December 15, 2013. Any impact of adopting ASU No. 2013-5 on the Company’s financial position and results of operations will depend on the nature and extent of future sales or dispositions of any entities that had created a cumulative translation adjustment.
ASU No. 2014-5, Service Concession Arrangements (Topic 853) (a consensus of the FASB Emerging Issues Task Force)
In January 2014, the FASB issued ASU No. 2014-5 stating the certain service concession arrangements with public-sector grantors are not within the scope of lease accounting. Operating entities entering into these arrangements should not recognize the related infrastructure as its property, plant and equipment and should apply other accounting guidance. The guidance is effective for interim periods beginning after December 15, 2014. Early adoption is permitted. The guidance should be applied on a modified prospective basis to these arrangements in existence as of the beginning of the fiscal year of adoption. The cumulative effect of adoption would be a recognized as an adjustment to the opening balance of retained earnings in the year of adoption. The Company is evaluating whether and to what extent the guidance would be applicable and have a significant impact on its consolidated financial position, results of operations and cash flows.
2. INVENTORY
Inventory is valued primarily using the average cost method. The following table summarizes the Company’s inventory balances as of
December 31, 2013
and
2012
:
|
2013
|
2012
|
|||||||
|
(in millions)
|
||||||||
|
Coal, fuel oil and other raw materials
|
$
|
334
|
|
$
|
372
|
|
||
|
Spare parts and supplies
|
350
|
|
347
|
|
||||
|
Total
|
$
|
684
|
|
$
|
719
|
|
||
3. PROPERTY, PLANT AND EQUIPMENT
The following table summarizes the components of the electric generation and distribution assets and other property, plant and equipment with their estimated useful lives. The amounts are stated net of impairment losses recognized as further discussed in Note 21—
Asset Impairment Expense.
|
Estimated
Useful Life
|
December 31,
|
|||||||||
|
2013
|
2012
|
|||||||||
|
(in years)
|
(in millions)
|
|||||||||
|
Electric generation and distribution facilities
|
6 - 68
|
$
|
27,619
|
|
$
|
26,385
|
|
|||
|
Other buildings
|
5 - 50
|
1,726
|
|
2,616
|
|
|||||
|
Furniture, fixtures and equipment
|
3 - 30
|
312
|
|
386
|
|
|||||
|
Other
|
1 - 46
|
939
|
|
891
|
|
|||||
|
Total electric generation and distribution assets and other
|
30,596
|
|
30,278
|
|
||||||
|
Accumulated depreciation
|
(9,604
|
)
|
(9,145
|
)
|
||||||
|
Net electric generation and distribution assets and other
(1)(2)
|
$
|
20,992
|
|
$
|
21,133
|
|
||||
|
(1)
|
Net electric generation and distribution assets and other related to the Company's held-for-sale businesses of $
1.2 billion
and
$1.3 billion
as of
December 31, 2013
and
2012
, respectively, were excluded from the table above and were included in the noncurrent assets of discontinued and held-for-sale businesses in the consolidated balance sheets.
|
|
(2)
|
Net electric generation and distribution assets, and other include unamortized internal use software costs of $
133 million
and $
141 million
as of
December 31, 2013
and
2012
, respectively.
|
The following table summarizes depreciation expense (including the amortization of assets recorded under capital leases), amortization of internal use software and interest capitalized during development and construction on qualifying assets for the years ended
December 31, 2013
,
2012
and
2011
:
|
2013
|
2012
|
2011
|
||||||||||
|
(in millions)
|
||||||||||||
|
Depreciation expense (including amortization of assets recorded under capital leases)
|
$
|
1,193
|
|
$
|
1,173
|
|
$
|
1,078
|
|
|||
|
Amortization of internal use software
|
36
|
|
45
|
|
42
|
|
||||||
|
Interest capitalized during development and construction
|
84
|
|
88
|
|
155
|
|
||||||
128
THE AES CORPORATION
NOTES TO CONSOLIDATED FINANCIAL STATEMENTS—(Continued)
DECEMBER 31, 2013, 2012, AND 2011
Property, plant and equipment, net of accumulated depreciation, of
$15 billion
and
$16 billion
was mortgaged, pledged or subject to liens as of
December 31, 2013
and
2012
, respectively.
The following table summarizes regulated and non-regulated generation and distribution property, plant and equipment and accumulated depreciation as of
December 31, 2013
and
2012
:
|
December 31,
|
||||||||
|
2013
|
2012
|
|||||||
|
(in millions)
|
||||||||
|
Regulated assets
|
$
|
13,031
|
|
$
|
13,395
|
|
||
|
Regulated accumulated depreciation
|
(4,732
|
)
|
(4,711
|
)
|
||||
|
Regulated generation, distribution assets and other, net
|
8,299
|
|
8,684
|
|
||||
|
Non-regulated assets
|
17,565
|
|
16,883
|
|
||||
|
Non-regulated accumulated depreciation
|
(4,872
|
)
|
(4,434
|
)
|
||||
|
Non-regulated generation, distribution assets and other, net
|
12,693
|
|
12,449
|
|
||||
|
Net electric generation and distribution assets and other
|
$
|
20,992
|
|
$
|
21,133
|
|
||
The following table summarizes the amounts recognized, which were related to asset retirement obligations, for the years ended
December 31, 2013
and
2012
:
|
2013
|
2012
|
|||||||
|
(in millions)
|
||||||||
|
Balance at January 1
|
$
|
120
|
|
$
|
110
|
|
||
|
Additional liabilities incurred
|
1
|
|
3
|
|
||||
|
Liabilities settled
|
(4
|
)
|
(3
|
)
|
||||
|
Accretion expense
|
9
|
|
6
|
|
||||
|
Change in estimated cash flows
|
16
|
|
3
|
|
||||
|
Translation adjustments
|
—
|
|
1
|
|
||||
|
Balance at December 31
|
$
|
142
|
|
$
|
120
|
|
||
The Company’s asset retirement obligations covered by the relevant guidance primarily include active ash landfills, water treatment basins and the removal or dismantlement of certain plants and equipment. There were
no
legally restricted assets for purposes of settling asset retirement obligations for the years ended
December 31, 2013
and
2012
.
Ownership of Coal-Fired Facilities
DP&L has undivided ownership interests in seven coal-fired generation facilities jointly owned with other utilities. As of
December 31, 2013
, DP&L had
$24 million
of construction work in process at such facilities. DP&L’s share of the operating costs of such facilities is included in Cost of Sales in the Consolidated Statement of Operations and its share of investment in the facilities is included in Property, Plant and Equipment in the Consolidated Balance Sheet. DP&L’s undivided ownership interest in such facilities at
December 31, 2013
is as follows:
|
DP&L Share
|
DP&L Investment
|
|||||||||||||||||
|
Ownership
|
Production Capacity (MW)
|
Gross Plant In Service
|
Accumulated Depreciation
|
Construction Work In Process
|
||||||||||||||
|
($ in millions)
|
||||||||||||||||||
|
Production units:
|
||||||||||||||||||
|
Beckjord Unit 6
|
50
|
%
|
207
|
|
$
|
2
|
|
$
|
1
|
|
$
|
—
|
|
|||||
|
Conesville Unit 4
|
17
|
%
|
129
|
|
24
|
|
—
|
|
—
|
|
||||||||
|
East Bend Station
|
31
|
%
|
186
|
|
12
|
|
5
|
|
—
|
|
||||||||
|
Killen Station
|
67
|
%
|
402
|
|
306
|
|
9
|
|
4
|
|
||||||||
|
Miami Fort Units 7 and 8
|
36
|
%
|
368
|
|
212
|
|
13
|
|
1
|
|
||||||||
|
Stuart Station
|
35
|
%
|
808
|
|
205
|
|
12
|
|
16
|
|
||||||||
|
Zimmer Station
|
28
|
%
|
365
|
|
177
|
|
25
|
|
3
|
|
||||||||
|
Transmission
|
various
|
|
—
|
|
41
|
|
4
|
|
—
|
|
||||||||
|
Total
|
2,465
|
|
$
|
979
|
|
$
|
69
|
|
$
|
24
|
|
|||||||
129
THE AES CORPORATION
NOTES TO CONSOLIDATED FINANCIAL STATEMENTS—(Continued)
DECEMBER 31, 2013, 2012, AND 2011
4. FAIR VALUE
The fair value of current financial assets and liabilities, debt service reserves and other deposits approximate their reported carrying amounts. The estimated fair values of the Company’s assets and liabilities have been determined using available market information. By virtue of these amounts being estimates and based on hypothetical transactions to sell assets or transfer liabilities, the use of different market assumptions and/or estimation methodologies may have a material effect on the estimated fair value amounts.
Valuation Techniques
The fair value measurement accounting guidance describes three main approaches to measuring the fair value of assets and liabilities: (1) market approach, (2) income approach and (3) cost approach. The market approach uses prices and other relevant information generated from market transactions involving identical or comparable assets or liabilities. The income approach uses valuation techniques to convert future amounts to a single present value amount. The measurement is based on current market expectations of the return on those future amounts. The cost approach is based on the amount that would currently be required to replace an asset. The Company measures its investments and derivatives at fair value on a recurring basis. Additionally, in connection with annual or event-driven impairment evaluations, certain nonfinancial assets and liabilities are measured at fair value on a nonrecurring basis. These include long-lived tangible assets (i.e., property, plant and equipment), goodwill and intangible assets (e.g., sales concessions, land use rights and emissions allowances, etc.). In general, the Company determines the fair value of investments and derivatives using the market approach and the income approach, respectively. In the nonrecurring measurements of nonfinancial assets and liabilities, all three approaches are considered; however, the value estimated under the income approach is often the most representative of fair value. Assets and liabilities are classified in their entirety based on the lowest level of input that is significant to the fair value measurement. The Company’s assessment of the significance of a particular input to the fair value measurement requires judgment, and may affect the determination of the fair value of the assets and liabilities and their placement within the fair value hierarchy levels.
Investments
The Company’s investments measured at fair value generally consist of marketable debt and equity securities. Equity securities are measured at fair value using quoted market prices. Debt securities primarily consist of unsecured debentures, certificates of deposit and government debt securities held by our Brazilian subsidiaries. Returns and pricing on these instruments are generally indexed to the CDI (Brazilian equivalent to London Inter-Bank Offered Rate, or LIBOR, a benchmark interest rate widely used by banks in the interbank lending market) or Selic (overnight borrowing rate) rates in Brazil. Fair value is determined from comparisons to market data obtained for similar assets and are considered Level 2 in the fair value hierarchy. For more detail regarding the fair value of investments see Note 5 —
Investments in Marketable Securities
.
Derivatives
Any Level 1 derivative instruments are exchange-traded commodity futures for which the pricing is observable in active markets, and as such, these are not expected to transfer to other levels. There have been no transfers between Level 1 and Level 2.
For all derivatives, with the exception of any classified as Level 1, the income approach is used, which consists of forecasting future cash flows based on contractual notional amounts and applicable and available market data as of the valuation date. Among the most common market data inputs used in the income approach include volatilities, spot and forward benchmark interest rates (such as LIBOR and Euro Inter Bank Offered Rate (“EURIBOR”)), foreign exchange rates and commodity prices. Forward rates with the same tenor as the derivative instrument being valued are generally obtained from published sources, with these forward rates being assessed quarterly at a portfolio-level for reasonableness versus comparable published information provided from another source. When significant inputs are not observable, the Company uses relevant techniques to best estimate the inputs, such as regression analysis or prices for similarly traded instruments available in the market.
For derivatives for which there is a standard industry valuation model, the Company uses a third-party treasury and risk management software product that uses a standard model and observable inputs to estimate the fair value. For these derivatives, the Company performs analytical procedures and makes comparisons to other third-party information in order to assess the reasonableness of the fair value. For derivatives for which there is not a standard industry valuation model (such as PPAs and fuel supply agreements that are derivatives or include embedded derivatives), the Company has created internal valuation models to estimate the fair value, using observable data to the extent available. At each quarter-end, the models for the commodity and foreign currency-based derivatives are generally prepared and reviewed by employees who globally manage the respective commodity and foreign currency risks and are analytically reviewed independent of those employees.
130
THE AES CORPORATION
NOTES TO CONSOLIDATED FINANCIAL STATEMENTS—(Continued)
DECEMBER 31, 2013, 2012, AND 2011
Those cash flows are then discounted using the relevant spot benchmark interest rate (such as LIBOR or EURIBOR). The Company then makes a credit valuation adjustment (“CVA”) by further discounting the cash flows for nonperformance or credit risk based on the observable or estimated debt spread of the Company’s subsidiary or its counterparty and the tenor of the respective derivative instrument. The CVA for asset positions is based on the counterparty’s credit ratings and debt spreads. The CVA for liability positions is based on the Parent Company’s or the subsidiary’s current debt spread. In the absence of readily obtainable credit information, the Parent Company’s or the subsidiary’s estimated credit rating (based on applying a standard industry model to historical financial information and then considering other relevant information) and spreads of comparably rated entities or the respective country’s debt spreads are used as a proxy. All derivative instruments are analyzed individually and are subject to unique risk exposures.
The Company’s methodology to fair value its derivatives is to start with any observable inputs; however, in certain instances the published forward rates or prices may not extend through the remaining term of the contract and management must make assumptions to extrapolate the curve, which necessitates the use of unobservable inputs, such as proxy commodity prices or historical settlements to forecast forward prices. In addition, in certain instances, there may not be market or market-corroborated data readily available, requiring the use of unobservable inputs. Similarly, in certain instances, the spread that reflects the credit or nonperformance risk is unobservable. The fair value hierarchy of an asset or a liability is based on the level of significance of the input assumptions. An input assumption is considered significant if it affects the fair value by at least 10%. Assets and liabilities are classified as Level 3 when the use of unobservable inputs is significant. When the use of unobservable inputs is insignificant, assets and liabilities are classified as Level 2. Transfers between Level 3 and Level 2 are determined as of the end of the reporting period and result from changes in significance of unobservable inputs used to calculate the CVA.
Changes in the above significant unobservable inputs that lead to a significant and unusual impact to current period earnings are disclosed to the Financial Audit Committee. For interest rate derivatives, increases (decreases) in the estimates of the Company's own credit spreads would decrease (increase) the value of the derivatives in a liability position. For foreign currency derivatives, increases (decreases) in the estimate of the above exchange rate would increase (decrease) the value of the derivative. For commodity and other derivatives in the above table, increases (decreases) in the estimated inflation would increase (decrease) the value of those embedded derivatives, while increases (decreases) in the estimated market price for power would increase (decrease) the value of that embedded derivative.
Debt
Recourse and non-recourse debt are carried at amortized cost. The fair value of recourse debt is estimated based on quoted market prices. The fair value of non-recourse debt is estimated differently based upon the type of loan. In general, the carrying amount of variable rate debt is a close approximation of its fair value. For fixed rate loans, the fair value is estimated using quoted market prices or discounted cash flow analyses. In the discounted cash flow analysis, the discount rate is based on the credit rating of the individual debt instruments, if available, or the credit rating of the subsidiary. If the subsidiary’s credit rating is not available, a synthetic credit rating is determined using certain key metrics, including cash flow ratios and interest coverage, as well as other industry specific factors. For subsidiaries located outside the U.S., in the event that the country rating is lower than the credit rating previously determined, the country rating is used for purposes of the discounted cash flow analysis. The fair value of recourse and non-recourse debt excludes accrued interest at the valuation date. The fair value was determined using available market information as of December 31, 2013. The Company is not aware of any factors that would significantly affect the fair value amounts subsequent to December 31, 2013.
Nonfinancial Assets and Liabilities
For nonrecurring measurements derived using the income approach, fair value is determined using valuation models based on the principles of discounted cash flows (“DCF”). The income approach is most often used in the impairment evaluation of long-lived tangible assets, goodwill and intangible assets. The Company uses its internally developed DCF valuation models as the primary means to determine nonrecurring fair value measurements though other valuation approaches prescribed under the fair value measurement accounting guidance are also considered. Depending on the complexity of a valuation, an independent valuation firm may be engaged to assist management in the valuation process. A few examples of input assumptions to such valuations include macroeconomic factors such as growth rates, industry demand, inflation, exchange rates and power and commodity prices. Whenever possible, the Company attempts to obtain market observable data to develop input assumptions. Where the use of market observable data is limited or not available for certain input assumptions, the Company develops its own estimates using a variety of techniques such as regression analysis and extrapolations.
For nonrecurring measurements derived using the market approach, recent market transactions involving the sale of identical or similar assets are considered. The use of this approach is limited because it is often difficult to identify sale transactions of identical or similar assets. This approach is used in impairment evaluations of certain intangible assets. Otherwise, it is used to corroborate the fair value determined under the income approach.
131
THE AES CORPORATION
NOTES TO CONSOLIDATED FINANCIAL STATEMENTS—(Continued)
DECEMBER 31, 2013, 2012, AND 2011
For nonrecurring measurements derived using the cost approach, fair value is typically based upon a replacement cost approach. Under this approach, the depreciated replacement cost of assets is derived by first estimating the current replacement cost of assets and then applying the remaining useful life percentages to such costs. Further adjustments for economic and functional obsolescence are made to the depreciated replacement cost. This approach involves a considerable amount of judgment, which is why its use is limited to the measurement of long-lived tangible assets. Like the market approach, this approach is also used to corroborate the fair value determined under the income approach.
Fair Value Considerations
In determining fair value, the Company considers the source of observable market data inputs, liquidity of the instrument, the credit risk of the counterparty and the risk of the Company’s or its counterparty’s nonperformance. The conditions and criteria used to assess these factors are:
Sources of market assumptions
The Company derives most of its market assumptions from market efficient data sources (e.g., Bloomberg and Reuters). To determine fair value, where market data is not readily available, management uses comparable market sources and empirical evidence to develop its own estimates of market assumptions.
Market liquidity
The Company evaluates market liquidity based on whether the financial or physical instrument, or the underlying asset, is traded in an active or inactive market. An active market exists if the prices are fully transparent to market participants, can be measured by market bid and ask quotes, the market has a relatively large proportion of trading volume as compared to the Company’s current trading volume and the market has a significant number of market participants that will allow the market to rapidly absorb the quantity of assets traded without significantly affecting the market price. Another factor the Company considers when determining whether a market is active or inactive is the presence of government or regulatory controls over pricing that could make it difficult to establish a market based price when entering into a transaction.
Nonperformance risk
Nonperformance risk refers to the risk that an obligation will not be fulfilled and affects the value at which a liability is transferred or an asset is sold. Nonperformance risk includes, but may not be limited to, the Company or its counterparty’s credit and settlement risk. Nonperformance risk adjustments are dependent on credit spreads, letters of credit, collateral, other arrangements available and the nature of master netting arrangements. The Company and its subsidiaries are parties to various interest rate swaps and options; foreign currency options and forwards; and derivatives and embedded derivatives, which subject the Company to nonperformance risk. The financial and physical instruments held at the subsidiary level are generally non-recourse to the Parent Company.
Nonperformance risk on the investments held by the Company is incorporated in the fair value derived from quoted market data to mark the investments to fair value.
132
THE AES CORPORATION
NOTES TO CONSOLIDATED FINANCIAL STATEMENTS—(Continued)
DECEMBER 31, 2013, 2012, AND 2011
Recurring Measurements
The following table sets forth, by level within the fair value hierarchy, the Company’s financial assets and liabilities that were measured at fair value on a recurring basis as of
December 31, 2013
and
2012
:
|
|
December 31, 2013
|
December 31, 2012
|
||||||||||||||||||||||||||||||
|
|
Level 1
|
Level 2
|
Level 3
|
Total
|
Level 1
|
Level 2
|
Level 3
|
Total
|
||||||||||||||||||||||||
|
|
(in millions)
|
|||||||||||||||||||||||||||||||
|
Assets
|
||||||||||||||||||||||||||||||||
|
AVAILABLE-FOR-SALE:
(1)
|
||||||||||||||||||||||||||||||||
|
Debt securities:
|
||||||||||||||||||||||||||||||||
|
Unsecured debentures
|
$
|
—
|
|
$
|
435
|
|
$
|
—
|
|
$
|
435
|
|
$
|
—
|
|
$
|
448
|
|
$
|
—
|
|
$
|
448
|
|
||||||||
|
Certificates of deposit
|
—
|
|
151
|
|
—
|
|
151
|
|
—
|
|
143
|
|
—
|
|
143
|
|
||||||||||||||||
|
Government debt securities
|
—
|
|
25
|
|
—
|
|
25
|
|
—
|
|
34
|
|
—
|
|
34
|
|
||||||||||||||||
|
Subtotal
|
—
|
|
611
|
|
—
|
|
611
|
|
—
|
|
625
|
|
—
|
|
625
|
|
||||||||||||||||
|
Equity securities:
|
||||||||||||||||||||||||||||||||
|
Mutual funds
|
—
|
|
44
|
|
—
|
|
44
|
|
—
|
|
56
|
|
—
|
|
56
|
|
||||||||||||||||
|
Subtotal
|
—
|
|
44
|
|
—
|
|
44
|
|
—
|
|
56
|
|
—
|
|
56
|
|
||||||||||||||||
|
Total available-for-sale
|
—
|
|
655
|
|
—
|
|
655
|
|
—
|
|
681
|
|
—
|
|
681
|
|
||||||||||||||||
|
TRADING:
|
||||||||||||||||||||||||||||||||
|
Equity securities:
|
||||||||||||||||||||||||||||||||
|
Mutual funds
|
13
|
|
—
|
|
—
|
|
13
|
|
12
|
|
—
|
|
—
|
|
12
|
|
||||||||||||||||
|
Total trading
|
13
|
|
—
|
|
—
|
|
13
|
|
12
|
|
—
|
|
—
|
|
12
|
|
||||||||||||||||
|
DERIVATIVES:
|
||||||||||||||||||||||||||||||||
|
Interest rate derivatives
|
—
|
|
98
|
|
—
|
|
98
|
|
—
|
|
2
|
|
—
|
|
2
|
|
||||||||||||||||
|
Cross currency derivatives
|
—
|
|
5
|
|
—
|
|
5
|
|
—
|
|
6
|
|
—
|
|
6
|
|
||||||||||||||||
|
Foreign currency derivatives
|
—
|
|
15
|
|
98
|
|
113
|
|
—
|
|
2
|
|
79
|
|
81
|
|
||||||||||||||||
|
Commodity derivatives
|
—
|
|
18
|
|
6
|
|
24
|
|
—
|
|
8
|
|
3
|
|
11
|
|
||||||||||||||||
|
Total derivatives
|
—
|
|
136
|
|
104
|
|
240
|
|
—
|
|
18
|
|
82
|
|
100
|
|
||||||||||||||||
|
TOTAL ASSETS
|
$
|
13
|
|
$
|
791
|
|
$
|
104
|
|
$
|
908
|
|
$
|
12
|
|
$
|
699
|
|
$
|
82
|
|
$
|
793
|
|
||||||||
|
Liabilities
|
||||||||||||||||||||||||||||||||
|
DERIVATIVES:
|
||||||||||||||||||||||||||||||||
|
Interest rate derivatives
|
$
|
—
|
|
$
|
221
|
|
$
|
101
|
|
$
|
322
|
|
$
|
—
|
|
$
|
153
|
|
$
|
412
|
|
$
|
565
|
|
||||||||
|
Cross currency derivatives
|
—
|
|
11
|
|
—
|
|
11
|
|
—
|
|
6
|
|
—
|
|
6
|
|
||||||||||||||||
|
Foreign currency derivatives
|
—
|
|
16
|
|
5
|
|
21
|
|
—
|
|
7
|
|
7
|
|
14
|
|
||||||||||||||||
|
Commodity derivatives
|
—
|
|
15
|
|
2
|
|
17
|
|
—
|
|
13
|
|
4
|
|
17
|
|
||||||||||||||||
|
Total derivatives
|
—
|
|
263
|
|
108
|
|
371
|
|
—
|
|
179
|
|
423
|
|
602
|
|
||||||||||||||||
|
TOTAL LIABILITIES
|
$
|
—
|
|
$
|
263
|
|
$
|
108
|
|
$
|
371
|
|
$
|
—
|
|
$
|
179
|
|
$
|
423
|
|
$
|
602
|
|
||||||||
_____________________________
|
(1)
|
Amortized cost approximated fair value at
December 31, 2013
and
2012
.
|
133
THE AES CORPORATION
NOTES TO CONSOLIDATED FINANCIAL STATEMENTS—(Continued)
DECEMBER 31, 2013, 2012, AND 2011
The following tables present a reconciliation of net derivative assets and liabilities measured at fair value on a recurring basis using significant unobservable inputs (Level 3) for the years ended
December 31, 2013
and
2012
(presented net by type of derivative where any foreign currency impacts are presented as part of gains (losses) in earnings or other comprehensive income as appropriate). Transfers between Level 3 and Level 2 are determined as of the end of the reporting period and principally result from changes in the significance of unobservable inputs used to calculate the credit valuation adjustment.
|
|
Year Ended December 31, 2013
|
|||||||||||||||
|
|
Interest
Rate
|
Foreign
Currency
|
Commodity
|
Total
|
||||||||||||
|
|
(in millions)
|
|||||||||||||||
|
Balance at January 1
|
$
|
(412
|
)
|
$
|
72
|
|
$
|
(1
|
)
|
$
|
(341
|
)
|
||||
|
Total gains (losses) (realized and unrealized):
|
||||||||||||||||
|
Included in earnings
|
13
|
|
53
|
|
4
|
|
70
|
|
||||||||
|
Included in other comprehensive income - derivative activity
|
93
|
|
—
|
|
—
|
|
93
|
|
||||||||
|
Included in other comprehensive income - foreign currency translation activity
|
(4
|
)
|
(23
|
)
|
—
|
|
(27
|
)
|
||||||||
|
Included in regulatory (assets) liabilities
|
—
|
|
—
|
|
2
|
|
2
|
|
||||||||
|
Settlements
|
100
|
|
(5
|
)
|
(1
|
)
|
94
|
|
||||||||
|
Transfers of (assets) liabilities out of Level 3
|
109
|
|
(4
|
)
|
105
|
|
||||||||||
|
Balance at December 31
|
$
|
(101
|
)
|
$
|
93
|
|
$
|
4
|
|
$
|
(4
|
)
|
||||
|
Total gains (losses) for the period included in earnings attributable to the change in unrealized gains (losses) relating to assets and liabilities held at the end of the period
|
$
|
10
|
|
$
|
53
|
|
$
|
1
|
|
$
|
64
|
|
||||
|
|
Year Ended December 31, 2012
|
|||||||||||||||||||
|
|
Interest
Rate
|
Cross
Currency
|
Foreign
Currency
|
Commodity
|
Total
|
|||||||||||||||
|
|
(in millions)
|
|||||||||||||||||||
|
Balance at January 1
|
$
|
(128
|
)
|
$
|
(18
|
)
|
$
|
50
|
|
$
|
2
|
|
$
|
(94
|
)
|
|||||
|
Total gains (losses) (realized and unrealized):
|
||||||||||||||||||||
|
Included in earnings
|
(2
|
)
|
—
|
|
32
|
|
(5
|
)
|
25
|
|
||||||||||
|
Included in other comprehensive income - derivative activity
|
(28
|
)
|
3
|
|
—
|
|
—
|
|
(25
|
)
|
||||||||||
|
Included in other comprehensive income - foreign currency translation activity
|
(1
|
)
|
—
|
|
(7
|
)
|
—
|
|
(8
|
)
|
||||||||||
|
Included in regulatory (assets) liabilities
|
—
|
|
—
|
|
—
|
|
9
|
|
9
|
|
||||||||||
|
Settlements
|
26
|
|
15
|
|
(3
|
)
|
(7
|
)
|
31
|
|
||||||||||
|
Transfers of assets (liabilities) into Level 3
|
(285
|
)
|
—
|
|
—
|
|
—
|
|
(285
|
)
|
||||||||||
|
Transfers of (assets) liabilities out of Level 3
|
6
|
|
—
|
|
—
|
|
—
|
|
6
|
|
||||||||||
|
Balance at December 31
|
$
|
(412
|
)
|
$
|
—
|
|
$
|
72
|
|
$
|
(1
|
)
|
$
|
(341
|
)
|
|||||
|
Total gains (losses) for the period included in earnings attributable to the change in unrealized gains (losses) relating to assets and liabilities held at the end of the period
|
$
|
(1
|
)
|
$
|
—
|
|
$
|
28
|
|
$
|
(3
|
)
|
$
|
24
|
|
|||||
The following table summarizes the significant unobservable inputs used for the Level 3 derivative assets (liabilities) as of
December 31, 2013
:
|
Type of Derivative
|
Fair Value
|
Unobservable Input
|
Amount or Range
(Weighted Average)
|
||||||
|
(in millions)
|
|||||||||
|
Interest rate
|
$
|
(101
|
)
|
Subsidiaries’ credit spreads
|
4.44%-5.87% (4.69%)
|
|
|||
|
Foreign currency:
|
|||||||||
|
Embedded derivative — Argentine Peso
|
98
|
|
Argentine Peso to U.S. Dollar currency exchange rate after 1 year
|
9.94 - 21.11 (16.35)
|
|
||||
|
Embedded derivative — Euro
|
(4
|
)
|
Subsidiaries’ credit spreads
|
4.44
|
%
|
||||
|
Other
|
(1
|
)
|
|||||||
|
Commodity:
|
|||||||||
|
Other
|
4
|
|
|||||||
|
Total
|
$
|
(4
|
)
|
||||||
Nonrecurring Measurements
When evaluating impairment of goodwill, long-lived assets, discontinued operations and held-for-sale businesses, and equity method investments, the Company measures fair value using the applicable fair value measurement guidance. Impairment expense is measured by comparing the fair value at the evaluation date to their then-latest available carrying
134
THE AES CORPORATION
NOTES TO CONSOLIDATED FINANCIAL STATEMENTS—(Continued)
DECEMBER 31, 2013, 2012, AND 2011
amount. The following table summarizes major categories of assets and liabilities measured at fair value on a nonrecurring basis during the period and their level within the fair value hierarchy:
|
Year Ended December 31, 2013
|
|||||||||||||||
|
Carrying
Amount
|
Fair Value
|
Gross
Loss
|
|||||||||||||
|
Level 1
|
Level 2
|
Level 3
|
|||||||||||||
|
(in millions)
|
|||||||||||||||
|
Assets
|
|||||||||||||||
|
Long-lived assets held and used:
(1)
|
|||||||||||||||
|
Itabo (San Lorenzo)
|
23
|
|
—
|
|
—
|
|
7
|
|
16
|
|
|||||
|
Beaver Valley
|
61
|
|
—
|
|
—
|
|
15
|
|
46
|
|
|||||
|
DP&L (Conesville)
|
26
|
|
—
|
|
—
|
|
—
|
|
26
|
|
|||||
|
Long-lived assets held for sale:
(1)
|
|||||||||||||||
|
U.S. wind turbines
|
25
|
|
—
|
|
25
|
|
—
|
|
—
|
|
|||||
|
Discontinued operations and held-for-sale businesses:
(2)
|
|||||||||||||||
|
Cameroon
|
414
|
|
—
|
|
356
|
|
—
|
|
63
|
|
|||||
|
Saurashtra
|
19
|
|
—
|
|
7
|
|
—
|
|
12
|
|
|||||
|
Ukraine utilities
|
164
|
|
—
|
|
124
|
|
—
|
|
44
|
|
|||||
|
Poland wind projects
|
79
|
|
—
|
|
14
|
|
—
|
|
65
|
|
|||||
|
U.S. wind projects
|
77
|
|
—
|
|
30
|
|
—
|
|
47
|
|
|||||
|
Equity method investments
(3)
|
240
|
|
—
|
|
—
|
|
111
|
|
129
|
|
|||||
|
Goodwill
|
|||||||||||||||
|
DP&L
|
623
|
|
—
|
|
—
|
|
316
|
|
307
|
|
|||||
|
Ebute
|
58
|
|
—
|
|
—
|
|
—
|
|
58
|
|
|||||
|
MountainView
|
7
|
|
—
|
|
—
|
|
—
|
|
7
|
|
|||||
|
Year Ended December 31, 2012
|
||||||||||||||||||||
|
Carrying
Amount
|
Fair Value
|
Gross
Loss
|
||||||||||||||||||
|
Level 1
|
Level 2
|
Level 3
|
||||||||||||||||||
|
(in millions)
|
||||||||||||||||||||
|
Assets
|
||||||||||||||||||||
|
Long-lived assets held and used:
(1)
|
||||||||||||||||||||
|
Kelanitissa
|
$
|
29
|
|
$
|
—
|
|
$
|
—
|
|
$
|
10
|
|
$
|
19
|
|
|||||
|
U.S. wind projects
|
21
|
|
—
|
|
—
|
|
—
|
|
21
|
|
||||||||||
|
Long-lived assets held for sale:
(1)
|
||||||||||||||||||||
|
U.S. wind turbines
|
45
|
|
—
|
|
—
|
|
25
|
|
20
|
|
||||||||||
|
St. Patrick
|
33
|
|
—
|
|
22
|
|
—
|
|
11
|
|
||||||||||
|
Discontinued operations and held-for-sale businesses:
(2)
|
||||||||||||||||||||
|
Tisza II
|
105
|
|
—
|
|
14
|
|
—
|
|
91
|
|
||||||||||
|
Equity method investments
(3)
|
205
|
|
—
|
|
155
|
|
—
|
|
50
|
|
||||||||||
|
Goodwill
|
||||||||||||||||||||
|
DP&L
|
2,440
|
|
—
|
|
—
|
|
623
|
|
1,817
|
|
||||||||||
_____________________________
|
(1)
|
See Note 21 —
Asset Impairment Expense
for further information.
|
|
(2)
|
See Note 23 —
Discontinued Operations and Held-For-Sale Businesses
for further information. Also, the gross loss equals the carrying amount of the disposal group less its fair value less costs to sell.
|
|
(3)
|
See Note 9 —
Other Non-Operating Expense
for further information.
|
135
THE AES CORPORATION
NOTES TO CONSOLIDATED FINANCIAL STATEMENTS—(Continued)
DECEMBER 31, 2013, 2012, AND 2011
The following table summarizes the significant unobservable inputs used in the Level 3 measurement of long-lived assets during the
year ended December 31, 2013
:
|
Fair Value
|
Valuation Technique
|
Unobservable Input
|
Range (Weighted Average)
|
||||||||
|
(in millions)
|
($ in millions)
|
||||||||||
|
Long-lived assets held and used:
|
|||||||||||
|
Beaver Valley
|
$
|
15
|
|
Discounted cash flow
|
Annual revenue growth
|
3% to 45% (19%)
|
|
||||
|
Annual pretax operating margin
|
-42% to 41% (25%)
|
|
|||||||||
|
Weighted-average cost of capital
|
7
|
%
|
|||||||||
|
DPL (Conesville)
|
—
|
|
Discounted cash flow
|
Annual revenue growth
|
-31% to 18% (0%)
|
|
|||||
|
Annual pretax operating margin
|
-9% to 18% (10%)
|
|
|||||||||
|
Weighted-average cost of capital
|
8
|
%
|
|||||||||
|
Itabo (San Lorenzo)
|
7
|
|
Market approach
|
Broker quote
|
7
|
|
|||||
|
Equity method investment:
|
|||||||||||
|
Elsta
|
111
|
|
Discounted cash flow
|
Annual revenue growth
|
-66% to 24% (0%)
|
|
|||||
|
Annual pretax operating margin
|
15% to 68% (40%)
|
|
|||||||||
|
Cost of equity
|
7.8% to 9.8% (8.4%)
|
|
|||||||||
|
Total
|
$
|
133
|
|
||||||||
Financial Instruments not Measured at Fair Value in the Condensed Consolidated Balance Sheets
The following table sets forth the carrying amount, fair value and fair value hierarchy of the Company’s financial assets and liabilities that are not measured at fair value in the condensed consolidated balance sheets as of
December 31, 2013
and
2012
, but for which fair value is disclosed.
|
Carrying
Amount
|
Fair Value
|
|||||||||||||||||||
|
Total
|
Level 1
|
Level 2
|
Level 3
|
|||||||||||||||||
|
(in millions)
|
||||||||||||||||||||
|
December 31, 2013
|
||||||||||||||||||||
|
Assets
|
||||||||||||||||||||
|
Accounts receivable — noncurrent
(1)
|
$
|
260
|
|
$
|
194
|
|
$
|
—
|
|
$
|
—
|
|
$
|
194
|
|
|||||
|
Liabilities
|
||||||||||||||||||||
|
Non-recourse debt
|
15,380
|
|
15,620
|
|
—
|
|
13,397
|
|
2,223
|
|
||||||||||
|
Recourse debt
|
5,669
|
|
6,164
|
|
—
|
|
6,164
|
|
—
|
|
||||||||||
|
December 31, 2012
|
||||||||||||||||||||
|
Assets
|
||||||||||||||||||||
|
Accounts receivable — noncurrent
(1)
|
$
|
304
|
|
$
|
188
|
|
$
|
—
|
|
$
|
—
|
|
$
|
188
|
|
|||||
|
Liabilities
|
||||||||||||||||||||
|
Non-recourse debt
|
14,759
|
|
15,481
|
|
—
|
|
13,266
|
|
2,215
|
|
||||||||||
|
Recourse debt
|
5,962
|
|
6,628
|
|
—
|
|
6,628
|
|
—
|
|
||||||||||
_____________________________
|
(1)
|
These accounts receivable principally relate to amounts due from CAMMESA, the administrator of the wholesale electricity market in Argentina, and are included in
“Noncurrent assets — Other”
in the accompanying consolidated balance sheets. The fair value of these accounts receivable excludes value-added tax of
$46 million
and
$55 million
at
December 31, 2013
and
2012
, respectively.
|
5. INVESTMENTS IN MARKETABLE SECURITIES
The Company’s investments in marketable debt and equity securities as of
December 31, 2013
and
2012
by security class and by level within the fair value hierarchy have been disclosed in Note 4 —
Fair Value
. The security classes are determined based on the nature and risk of a security and are consistent with how the Company manages, monitors and measures its marketable securities. As of
December 31, 2013
, all available-for-sale debt securities had stated maturities within one year. Gains and losses on the sale of investments are determined using the specific-identification method. Pretax gains and losses related to available-for-sale and trading securities are generally immaterial for disclosure purposes. For the years ended
December 31, 2013
,
2012
, and
2011
, there were no realized losses on the sale of available-for-sale securities and
no
other-than-temporary impairment of marketable securities recognized in earnings or other comprehensive income. The following table summarizes the gross proceeds from sale of available-for-sale securities for the years ended
December 31, 2013
,
2012
, and
2011
:
|
2013
|
2012
|
2011
|
||||||||||
|
(in millions)
|
||||||||||||
|
Gross proceeds from sales of available-for-sale securities
|
$
|
4,406
|
|
$
|
6,489
|
|
$
|
6,119
|
|
|||
136
THE AES CORPORATION
NOTES TO CONSOLIDATED FINANCIAL STATEMENTS—(Continued)
DECEMBER 31, 2013, 2012, AND 2011
6. DERIVATIVE INSTRUMENTS AND HEDGING ACTIVITIES
Volume of Activity
The following tables set forth, by type of derivative, the Company’s outstanding notional under its derivatives and the weighted-average remaining term as of
December 31, 2013
regardless of whether the derivative instruments are in qualifying cash flow hedging relationships:
|
Current
|
Maximum
|
||||||||||||||||||
|
Interest Rate and Cross Currency
|
Derivative
Notional
|
Derivative Notional Translated to USD
|
Derivative
Notional
|
Derivative Notional Translated to USD
|
Weighted-Average Remaining Term
|
% of Debt Currently Hedged by Index
(2)
|
|||||||||||||
|
(in millions)
|
(in years)
|
||||||||||||||||||
|
Interest Rate Derivatives:
(1)
|
|||||||||||||||||||
|
LIBOR (U.S. Dollar)
|
3,493
|
|
$
|
3,493
|
|
4,675
|
|
$
|
4,675
|
|
9
|
73
|
%
|
||||||
|
EURIBOR (Euro)
|
574
|
|
789
|
|
575
|
|
791
|
|
12
|
83
|
%
|
||||||||
|
LIBOR (British Pound)
|
67
|
|
111
|
|
67
|
|
111
|
|
8
|
83
|
%
|
||||||||
|
Cross Currency Swaps:
|
|||||||||||||||||||
|
Chilean Unidad de Fomento
|
6
|
|
248
|
|
6
|
|
248
|
|
8
|
85
|
%
|
||||||||
_____________________________
|
(1)
|
The Company’s interest rate derivative instruments primarily include accreting and amortizing notionals. The maximum derivative notional represents the largest notional at any point between
December 31, 2013
and the maturity of the derivative instrument, which includes forward-starting derivative instruments. The interest rate and cross currency derivatives range in maturity through
2030
and
2028
, respectively.
|
|
(2)
|
The percentage of variable-rate debt currently hedged is based on the related index and excludes forecasted issuances of debt and variable-rate debt tied to other indices where the Company has no interest rate derivatives.
|
|
December 31, 2013
|
|||||||||
|
Foreign Currency Derivatives
|
Notional
(1)
|
Notional Translated to USD
|
Weighted-Average Remaining Term
(2)
|
||||||
|
(in millions)
|
(in years)
|
||||||||
|
Foreign Currency Options and Forwards:
|
|||||||||
|
Chilean Unidad de Fomento
|
6
|
|
$
|
248
|
|
1
|
|||
|
Chilean Peso
|
60,521
|
|
115
|
|
<1
|
||||
|
Brazilian Real
|
182
|
|
78
|
|
<1
|
||||
|
Euro
|
53
|
|
73
|
|
<1
|
||||
|
Colombian Peso
|
133,860
|
|
69
|
|
<1
|
||||
|
Argentine Peso
|
43
|
|
7
|
|
<1
|
||||
|
British Pound
|
35
|
|
57
|
|
<1
|
||||
|
Embedded Foreign Currency Derivatives:
|
|||||||||
|
Argentine Peso
|
905
|
|
139
|
|
10
|
||||
|
Kazakhstani Tenge
|
816
|
|
5
|
|
4
|
||||
_____________________________
|
(1)
|
Represents contractual notionals. The notionals for options have not been probability adjusted, which generally would decrease them.
|
|
(2)
|
Represents the remaining tenor of our foreign currency derivatives weighted by the corresponding notional. These options and forwards and these embedded derivatives range in maturity through
2017
and
2025
, respectively.
|
|
December 31, 2013
|
|||||
|
Weighted-Average
|
|||||
|
Commodity Derivatives
|
Notional
|
Remaining Term
(1)
|
|||
|
(in millions)
|
(in years)
|
||||
|
Power (MWh)
|
5
|
|
3
|
||
_____________________________
|
(1)
|
Represents the remaining tenor of our commodity derivatives weighted by the corresponding volume. These derivatives range in maturity through
2016
.
|
137
THE AES CORPORATION
NOTES TO CONSOLIDATED FINANCIAL STATEMENTS—(Continued)
DECEMBER 31, 2013, 2012, AND 2011
Accounting and Reporting
Assets and Liabilities
The following tables set forth the Company’s derivative instruments as of
December 31, 2013
and 2012, first by whether or not they are designated hedging instruments, then by whether they are current or noncurrent to the extent they are subject to master netting agreements or similar agreements (where the rights to set-off relate to settlement of amounts receivable and payable under those derivatives) and by balances no longer accounted for as derivatives.
|
December 31, 2013
|
December 31, 2012
|
|||||||||||||||||||||||
|
Designated
|
Not Designated
|
Total
|
Designated
|
Not Designated
|
Total
|
|||||||||||||||||||
|
(in millions)
|
||||||||||||||||||||||||
|
Assets
|
||||||||||||||||||||||||
|
Interest rate derivatives
|
$
|
96
|
|
$
|
2
|
|
$
|
98
|
|
$
|
—
|
|
$
|
2
|
|
$
|
2
|
|
||||||
|
Cross currency derivatives
|
5
|
|
—
|
|
5
|
|
6
|
|
—
|
|
6
|
|
||||||||||||
|
Foreign currency derivatives
|
4
|
|
109
|
|
113
|
|
—
|
|
81
|
|
81
|
|
||||||||||||
|
Commodity derivatives
|
8
|
|
16
|
|
24
|
|
2
|
|
9
|
|
11
|
|
||||||||||||
|
Total assets
|
$
|
113
|
|
$
|
127
|
|
$
|
240
|
|
$
|
8
|
|
$
|
92
|
|
$
|
100
|
|
||||||
|
Liabilities
|
||||||||||||||||||||||||
|
Interest rate derivatives
|
$
|
318
|
|
$
|
4
|
|
$
|
322
|
|
$
|
544
|
|
$
|
21
|
|
$
|
565
|
|
||||||
|
Cross currency derivatives
|
11
|
|
—
|
|
11
|
|
6
|
|
—
|
|
6
|
|
||||||||||||
|
Foreign currency derivatives
|
15
|
|
6
|
|
21
|
|
7
|
|
7
|
|
14
|
|
||||||||||||
|
Commodity derivatives
|
7
|
|
10
|
|
17
|
|
8
|
|
9
|
|
17
|
|
||||||||||||
|
Total liabilities
|
$
|
351
|
|
$
|
20
|
|
$
|
371
|
|
$
|
565
|
|
$
|
37
|
|
$
|
602
|
|
||||||
|
December 31, 2013
|
December 31, 2012
|
|||||||||||||||
|
Assets
|
Liabilities
|
Assets
|
Liabilities
|
|||||||||||||
|
(in millions)
|
||||||||||||||||
|
Current
|
$
|
32
|
|
$
|
157
|
|
$
|
14
|
|
$
|
178
|
|
||||
|
Noncurrent
|
208
|
|
214
|
|
86
|
|
424
|
|
||||||||
|
Total
|
$
|
240
|
|
$
|
371
|
|
$
|
100
|
|
$
|
602
|
|
||||
|
Derivatives subject to master netting agreement or similar agreement:
|
||||||||||||||||
|
Gross amounts recognized in the balance sheet
|
$
|
91
|
|
$
|
314
|
|
$
|
25
|
|
$
|
522
|
|
||||
|
Gross amounts of derivative instruments not offset
|
(9
|
)
|
(9
|
)
|
(9
|
)
|
(9
|
)
|
||||||||
|
Gross amounts of cash collateral received/pledged not offset
|
(3
|
)
|
(6
|
)
|
—
|
|
(5
|
)
|
||||||||
|
Net amount
|
$
|
79
|
|
$
|
299
|
|
$
|
16
|
|
$
|
508
|
|
||||
|
Other balances that had been, but are no longer, accounted for as derivatives that are to be amortized to earnings over the remaining term of the associated PPA
|
$
|
169
|
|
$
|
190
|
|
$
|
186
|
|
$
|
191
|
|
||||
138
THE AES CORPORATION
NOTES TO CONSOLIDATED FINANCIAL STATEMENTS—(Continued)
DECEMBER 31, 2013, 2012, AND 2011
Effective Portion of Cash Flow Hedges
The following tables set forth the pretax gains (losses) recognized in accumulated other comprehensive loss (“AOCL”) and earnings related to the effective portion of derivative instruments in qualifying cash flow hedging relationships (including amounts that were reclassified from AOCL as interest expense related to interest rate derivative instruments that previously, but no longer, qualify for cash flow hedge accounting), as defined in the accounting standards for derivatives and hedging, for the years ended
December 31, 2013
,
2012
, and
2011
:
|
Gains (Losses) Recognized in AOCL
|
Gains (Losses) Reclassified from AOCL into Earnings
|
|||||||||||||||||||||||||
|
Years Ended December 31,
|
Classification in Condensed Consolidated Statements of Operations
|
Years Ended December 31,
|
||||||||||||||||||||||||
|
Type of Derivative
|
2013
|
2012
|
2011
|
|
2013
|
2012
|
2011
|
|||||||||||||||||||
|
(in millions)
|
(in millions)
|
|||||||||||||||||||||||||
|
Interest rate derivatives
|
$
|
155
|
|
$
|
(175
|
)
|
$
|
(475
|
)
|
Interest expense
|
$
|
(127
|
)
|
$
|
(135
|
)
|
$
|
(125
|
)
|
|||||||
|
Non-regulated cost of sales
|
(5
|
)
|
(6
|
)
|
(3
|
)
|
||||||||||||||||||||
|
Net equity in earnings of affiliates
|
(6
|
)
|
(7
|
)
|
(4
|
)
|
||||||||||||||||||||
|
Asset impairment expense
|
—
|
|
(6
|
)
|
—
|
|
||||||||||||||||||||
|
Gain on sale of investments
|
(21
|
)
|
(96
|
)
|
—
|
|
||||||||||||||||||||
|
Cross currency derivatives
|
(18
|
)
|
4
|
|
(36
|
)
|
Interest expense
|
(10
|
)
|
(12
|
)
|
(10
|
)
|
|||||||||||||
|
Foreign currency transaction gains (losses)
|
(18
|
)
|
26
|
|
(16
|
)
|
||||||||||||||||||||
|
Foreign currency derivatives
|
—
|
|
10
|
|
24
|
|
Foreign currency transaction gains (losses)
|
12
|
|
5
|
|
1
|
|
|||||||||||||
|
Commodity derivatives
|
2
|
|
(8
|
)
|
—
|
|
Non-regulated revenue
|
(3
|
)
|
(2
|
)
|
—
|
|
|||||||||||||
|
Non-regulated cost of sales
|
(2
|
)
|
—
|
|
(2
|
)
|
||||||||||||||||||||
|
Total
|
$
|
139
|
|
$
|
(169
|
)
|
$
|
(487
|
)
|
$
|
(180
|
)
|
$
|
(233
|
)
|
$
|
(159
|
)
|
||||||||
The pretax accumulated other comprehensive income (loss) expected to be recognized as an increase (decrease) to income from continuing operations before income taxes over the next twelve months as of
December 31, 2013
is
$(119) million
for interest rate hedges,
$(4) million
for cross currency swaps,
$4 million
for foreign currency hedges, and
$(3) million
for commodity and other hedges.
For the year ended December 31,
2012
, pre-tax losses of
$10 million
, net of noncontrolling interests were reclassified into earnings as a result of the discontinuance of a cash flow hedge because it was probable that the forecasted transaction would not occur by the end of the originally specified time period (as documented at the inception of the hedging relationship) or within an additional
two
-month time period thereafter. There was
no
such item for the years ended
December 31, 2013
and
2011
.
Ineffective Portion of Cash Flow Hedges
The following table sets forth the pretax gains (losses) recognized in earnings related to the ineffective portion of derivative instruments in qualifying cash flow hedging relationships, as defined in the accounting standards for derivatives and hedging, for the years ended
December 31, 2013
,
2012
, and
2011
:
|
Gains (Losses) Recognized in Earnings
|
||||||||||||||
|
Classification in
Condensed Consolidated
Statements of Operations
|
Years Ended December 31,
|
|||||||||||||
|
Type of Derivative
|
2013
|
2012
|
2011
|
|||||||||||
|
(in millions)
|
||||||||||||||
|
Interest rate derivatives
|
Interest expense
|
$
|
42
|
|
$
|
(2
|
)
|
$
|
(6
|
)
|
||||
|
Net equity in earnings of affiliates
|
1
|
|
(1
|
)
|
(2
|
)
|
||||||||
|
Cross currency derivatives
|
Interest expense
|
—
|
|
(1
|
)
|
(4
|
)
|
|||||||
|
Total
|
$
|
43
|
|
$
|
(4
|
)
|
$
|
(12
|
)
|
|||||
139
THE AES CORPORATION
NOTES TO CONSOLIDATED FINANCIAL STATEMENTS—(Continued)
DECEMBER 31, 2013, 2012, AND 2011
Not Designated for Hedge Accounting
The following table sets forth the gains (losses) recognized in earnings related to derivative instruments not designated as hedging instruments under the accounting standards for derivatives and hedging and the amortization of balances that had been, but are no longer, accounted for as derivatives, for the
year ended
December 31, 2013
,
2012
and
2011
:
|
Gains (Losses) Recognized in Earnings
|
||||||||||||||
|
Classification in Condensed Consolidated
Statements of Operations
|
Years Ended December 31,
|
|||||||||||||
|
Type of Derivative
|
2013
|
2012
|
2011
|
|||||||||||
|
(in millions)
|
||||||||||||||
|
Interest rate derivatives
|
Interest expense
|
$
|
(1
|
)
|
$
|
(5
|
)
|
$
|
(4
|
)
|
||||
|
Net equity in earnings of affiliates
|
(6
|
)
|
—
|
|
—
|
|
||||||||
|
Foreign currency derivatives
|
Foreign currency transaction gains (losses)
|
64
|
|
(141
|
)
|
60
|
|
|||||||
|
Net equity in earnings of affiliates
|
(24
|
)
|
—
|
|
—
|
|
||||||||
|
Commodity and other derivatives
|
Non-regulated revenue
|
11
|
|
24
|
|
13
|
|
|||||||
|
Regulated revenue
|
—
|
|
(10
|
)
|
1
|
|
||||||||
|
Non-regulated cost of sales
|
1
|
|
2
|
|
(9
|
)
|
||||||||
|
Regulated cost of sales
|
2
|
|
(15
|
)
|
(5
|
)
|
||||||||
|
Income (loss) from operations of discontinued businesses
|
(18
|
)
|
(4
|
)
|
(76
|
)
|
||||||||
|
Total
|
$
|
29
|
|
$
|
(149
|
)
|
$
|
(20
|
)
|
|||||
Credit Risk-Related Contingent Features
DP&L, a utility within our United States strategic business unit, has certain over-the-counter commodity derivative contracts under master netting agreements that contain provisions that require DP&L to maintain an investment-grade issuer credit rating from credit rating agencies. Since DP&L's rating has fallen below investment grade, certain of the counterparties to the derivative contracts have requested immediate and ongoing full overnight collateralization of the mark-to-market loss (fair value excluding credit valuation adjustments), which was
$11 million
and
$13 million
as of
December 31, 2013
and
2012
, respectively, for all derivatives with credit risk-related contingent features. As of
December 31, 2013
and
2012
, DP&L had posted
$6 million
and
$5 million
, respectively, of cash collateral directly with third parties and in a broker margin account and DP&L held
$3 million
and
$0 million
, respectively, of cash collateral from counterparties to its derivative instruments that were in an asset position. After consideration of the netting of counterparty assets, DP&L could have been required to, but did not, provide additional collateral of
$0 million
and
$2 million
as of
December 31, 2013
and
2012
, respectively.
7. FINANCING RECEIVABLES
Financing receivables are defined as receivables that have contractual maturities of greater than one year. The Company has financing receivables pursuant to amended agreements or government resolutions that are due from certain Latin American governmental bodies, primarily in Argentina. The following table sets forth the breakdown of financing receivables by country as of
December 31, 2013
and
2012
:
|
2013
|
2012
|
|||||||
|
(in millions)
|
||||||||
|
Argentina
(1)
|
$
|
164
|
|
$
|
196
|
|
||
|
Dominican Republic
|
2
|
|
35
|
|
||||
|
Brazil
|
18
|
|
8
|
|
||||
|
Total long-term financing receivables
|
$
|
184
|
|
$
|
239
|
|
||
_____________________________
|
(1)
|
Excludes noncurrent receivables of
$122 million
and
$120 million
, respectively, as of
December 31, 2013
and
2012
, which have not been converted into financing receivables and do not have contractual maturities of greater than one year. Also, excludes the foreign currency-related embedded derivative assets associated with the financing receivables which had a fair value of
$97 million
and
$69 million
, respectively, as of
December 31, 2013
and
2012
.
|
Argentina—
As a result of energy market reforms in 2004 and consistent with contractual arrangements, AES Argentina entered into
three
agreements with the Argentine government called (as translated into English) the Fund for the Investment Needed to Increase the Supply of Electricity in the Wholesale Market (“FONINVEMEM Agreements”) to contribute a portion of their accounts receivable into a fund for financing the construction of combined cycle and gas-fired plants. These receivables accrue interest and are collected in monthly installments over
10 years
once the related plant begins operations. In addition, AES Argentina receives an ownership interest in these newly built plants once the receivables have been fully repaid.
140
THE AES CORPORATION
NOTES TO CONSOLIDATED FINANCIAL STATEMENTS—(Continued)
DECEMBER 31, 2013, 2012, AND 2011
Collection of the principal and interest on these receivables is subject to various business risks and uncertainties including, but not limited to, the completion and operation of power plants which generate cash for payments of these receivables, regulatory changes that could impact the timing and amount of collections, and economic conditions in Argentina. The Company monitors these risks including the credit ratings of the Argentine government on a quarterly basis to assess the collectability of these receivables. The Company accrues interest on these receivables once the recognition criteria have been met. The Company’s collection estimates are based on assumptions that it believes to be reasonable but are inherently uncertain. Actual future cash flows could differ from these estimates.
The receivables under the first
two
FONINVEMEM Agreements are being actively collected since the related plants commenced operations in 2010. In assessing the collectability of the receivables under these agreements, the Company also considers how the collections have historically been made timely in accordance with the agreements. The receivables related to the third FONINVEMEM Agreement are not currently due as commercial operation of the two related gas-fired plants has not been achieved. In assessing the collectability of the receivables under this agreement, the Company also considers the extent to which significant milestones necessary to complete the plants have been achieved or are still probable.
On March 26, 2013, the Argentine government passed Resolution No. 95/2013 ("Resolution 95") to develop a new energy regulatory framework that would apply to all generation companies with certain exceptions. The new regulatory framework remunerates fixed and variable costs plus a margin that will depend on both the technology and fuel used to generate the electricity. On May 31, 2013, Resolution 95 became effective retroactively to February 1, 2013. During June 2013, CAMMESA, the administrator of the wholesale electricity market in Argentina, started the implementation by billing the transactions according to the Resolution 95 procedures. In addition, Resolution 95 determines the portion of future outstanding receivables that shall be contributed into the new trusts to be set up by the Argentine government.
8. INVESTMENTS IN AND ADVANCES TO AFFILIATES
The following table summarizes the relevant effective equity ownership interest and carrying values for the Company’s investments accounted for under the equity method as of December 31, 2013 and
2012
.
|
|
|
December 31,
|
|||||||||||||
|
2013
|
2012
|
2013
|
2012
|
||||||||||||
|
Affiliate
|
Country
|
Carrying Value (in millions)
|
Ownership Interest %
|
||||||||||||
|
Silver Ridge Power
(1)
|
Various
|
$
|
291
|
|
$
|
307
|
|
50
|
%
|
50
|
%
|
||||
|
Barry
(2)
|
United Kingdom
|
—
|
|
—
|
|
100
|
%
|
100
|
%
|
||||||
|
CET
(2)(3)
|
Brazil
|
—
|
|
13
|
|
N/A
|
|
72
|
%
|
||||||
|
Chigen affiliates
(4)
|
China
|
—
|
|
2
|
|
N/A
|
|
35
|
%
|
||||||
|
Elsta
(2)(5)
|
Netherlands
|
120
|
|
219
|
|
50
|
%
|
50
|
%
|
||||||
|
Entek
|
Turkey
|
165
|
|
234
|
|
50
|
%
|
50
|
%
|
||||||
|
Guacolda
|
Chile
|
245
|
|
196
|
|
35
|
%
|
35
|
%
|
||||||
|
OPGC
|
India
|
186
|
|
199
|
|
49
|
%
|
49
|
%
|
||||||
|
Trinidad Generation Unlimited
(2)(6)
|
Trinidad
|
—
|
|
24
|
|
N/A
|
|
10
|
%
|
||||||
|
Other affiliates
|
Various
|
3
|
|
2
|
|
||||||||||
|
Total investments in and advances to affiliates
|
$
|
1,010
|
|
$
|
1,196
|
|
|||||||||
|
(1)
|
Represent our investments in AES Solar Energy Ltd in Europe, AES Solar Power LLC in the United States and AES Solar Power, PR, LLC in Puerto Rico. The collective solar energy affiliates were consolidated into a single entity, Silver Ridge Power, during 2013.
|
|
(2)
|
Represent VIEs in which the Company holds a variable interest, but is not the primary beneficiary.
|
|
(3)
|
The Company acquired all of the noncontrolling interests of CET during the fourth quarter of 2013, which resulted in the consolidation of this entity.
|
|
(4)
|
Represent our investment in Chengdu AES Kaihua Gas Turbine Company Ltd. The Company disposed of this investment during the first quarter of 2013.
|
|
(5)
|
The Company recognized a
$129 million
impairment of its investment in Elsta during 2013. For additional information see Note 9 —
Other Non-Operating Expense
.
|
|
(6)
|
The Company sold its interest in Trinidad Generation Unlimited during the third quarter of 2013.
|
The following investments, accounted for under the equity method of accounting, had changes in ownership interest during the year or other circumstances leading to the equity method of accounting:
141
THE AES CORPORATION
NOTES TO CONSOLIDATED FINANCIAL STATEMENTS—(Continued)
DECEMBER 31, 2013, 2012, AND 2011
AES Barry Ltd.
—The Company holds a
100%
ownership interest in AES Barry Ltd. (“Barry”), a dormant entity in the United Kingdom that disposed of its generation and other operating assets. Due to a debt agreement, no material financial or operating decisions can be made without the banks’ consent, and the Company does not control Barry. As of December 31, 2013 and 2012, other long-term liabilities included
$55 million
related to this debt agreement.
Trinidad Generation Unlimited (“TGU”)
—Although the Company’s ownership in TGU was
10%
, the Company accounted for the investment as an equity method investment due to the Company’s ability to exercise significant influence through the supermajority vote requirement for any significant future project development activities. The Company sold its interest in TGU during the third quarter of 2013.
Summarized Financial Information
The following tables summarize financial information of the Company’s 50%-or-less owned affiliates and majority-owned unconsolidated subsidiaries that are accounted for using the equity method.
|
|
50%-or-less Owned Affiliates
|
Majority-Owned Unconsolidated Subsidiaries
|
|||||||||||||||||||||
|
Years ended December 31,
|
2013
|
2012
|
2011
|
2013
|
2012
|
2011
|
|||||||||||||||||
|
|
(in millions)
|
(in millions)
|
|||||||||||||||||||||
|
Revenue
|
$
|
1,099
|
|
$
|
1,868
|
|
$
|
1,668
|
|
$
|
2
|
|
$
|
106
|
|
$
|
24
|
|
|||||
|
Operating margin
|
295
|
|
355
|
|
258
|
|
—
|
|
26
|
|
24
|
|
|||||||||||
|
Net income (loss)
|
53
|
|
146
|
|
(5
|
)
|
—
|
|
(5
|
)
|
(5
|
)
|
|||||||||||
|
December 31,
|
2013
|
2012
|
|
2013
|
2012
|
|
|||||||||||||||||
|
|
(in millions)
|
|
(in millions)
|
|
|||||||||||||||||||
|
Current assets
|
$
|
842
|
|
$
|
1,097
|
|
$
|
1
|
|
$
|
2
|
|
|||||||||||
|
Noncurrent assets
|
3,722
|
|
5,253
|
|
20
|
|
38
|
|
|||||||||||||||
|
Current liabilities
|
600
|
|
680
|
|
1
|
|
55
|
|
|||||||||||||||
|
Noncurrent liabilities
|
2,096
|
|
2,899
|
|
75
|
|
20
|
|
|||||||||||||||
|
Noncontrolling interests
|
15
|
|
(228
|
)
|
—
|
|
—
|
|
|||||||||||||||
|
Stockholders’ equity
|
1,853
|
|
2,999
|
|
(55
|
)
|
(35
|
)
|
|||||||||||||||
At
December 31, 2013
, accumulated deficit included
$168 million
related to the undistributed earnings of the Company’s 50%-or-less owned affiliates. Distributions received from these affiliates were
$6 million
,
$22 million
, and
$36 million
for the years ended December 31, 2013,
2012
, and
2011
, respectively. As of December 31, 2013, the aggregate carrying amount of our investments in equity affiliates exceeded the underlying equity in their net assets by
$214 million
.
9. OTHER NON-OPERATING EXPENSE
|
Years Ended December 31,
|
||||||||||||
|
2013
|
2012
|
2011
|
||||||||||
|
(in millions)
|
||||||||||||
|
Elsta
|
$
|
129
|
|
$
|
—
|
|
$
|
—
|
|
|||
|
China generation and wind
|
—
|
|
32
|
|
79
|
|
||||||
|
InnoVent
|
—
|
|
17
|
|
—
|
|
||||||
|
Other
|
—
|
|
1
|
|
3
|
|
||||||
|
Total other non-operating expense
|
$
|
129
|
|
$
|
50
|
|
$
|
82
|
|
|||
2013
Elsta—
Elsta BV & Co CV ("Elsta"), a
630
MW combined cycle gas-fired plant in the Netherlands, is accounted for under the equity method of accounting. The Company evaluates its equity method investments for impairment whenever certain indicators are present suggesting that the fair value of an equity method investment is less than its carrying value and the evaluation would consider whether the decline is other-than-temporary. This analysis requires a significant amount of judgment to identify events or circumstances indicating that an equity method investment may be impaired. Once an impairment indicator is identified, the Company must determine if an impairment exists, and if so, whether the impairment is other-than-temporary in which case the equity method investment is written down to its estimated fair value. During 2013, the Company identified an impairment indicator resulting from initial negotiations with Elsta's offtakers for an extension of the existing PPA which expires during 2018, suggesting that the income earned under the existing PPA would likely be reduced upon an extension and that the resulting decline in the estimated fair value of the Company's equity method investment in Elsta was other-than-temporary. The
142
THE AES CORPORATION
NOTES TO CONSOLIDATED FINANCIAL STATEMENTS—(Continued)
DECEMBER 31, 2013, 2012, AND 2011
Company recognized an impairment of
$129 million
by reducing the carrying value of
$240 million
to the estimated fair value of
$111 million
. The Company estimated fair value using probability-weighted outcomes which contemplated various scenarios involving the amendments to the existing PPA.
2012
China Generation and InnoVent
—In the first quarter of 2012, the Company concluded that it was more likely than not that it would sell its interest in its equity method investments in China and France and recorded other-than-temporary-impairment ("OTTI") of
$32 million
and
$17 million
, respectively.
2011
China
—In 2011, the Company recognized OTTI of
$79 million
on its equity method investments in China. This primarily included
$74 million
OTTI on Yangcheng, a
2100
MW coal-fired plant in which the Company held
25%
equity interest. During the nine months ended September 30, 2011, continually increasing coal prices in China reduced operating margins of coal generation facilities with no corresponding increase in tariffs. As of September 30, 2011, Yangcheng had a carrying amount of
$100 million
which was written down to its estimated fair value of
$26 million
determined under the discounted cash flow analysis, and the difference was recognized as other non-operating expense.
10
. GOODWILL AND OTHER INTANGIBLE ASSETS
Goodwill
The following table summarizes the changes in the carrying amount of goodwill, by reportable segment for the years ended
December 31, 2013
and
2012
.
|
US
|
Andes
|
MCAC
|
EMEA
|
Asia
|
Total
|
||||||||||||||||||
|
Balance as of December 31, 2011
|
|||||||||||||||||||||||
|
Goodwill
|
$
|
2,672
|
|
$
|
899
|
|
$
|
149
|
|
$
|
180
|
|
$
|
80
|
|
$
|
3,980
|
|
|||||
|
Accumulated impairment losses
|
(21
|
)
|
—
|
|
—
|
|
(122
|
)
|
(17
|
)
|
(160
|
)
|
|||||||||||
|
Net balance
|
2,651
|
|
899
|
|
149
|
|
58
|
|
63
|
|
3,820
|
|
|||||||||||
|
Impairment losses
|
(1,817
|
)
|
—
|
|
—
|
|
—
|
|
—
|
|
(1,817
|
)
|
|||||||||||
|
Goodwill acquired during the year
|
—
|
|
—
|
|
—
|
|
—
|
|
—
|
|
(1)
|
—
|
|
||||||||||
|
Foreign currency translation and other
|
(9
|
)
|
—
|
|
—
|
|
—
|
|
5
|
|
(4
|
)
|
|||||||||||
|
Balance as of December 31, 2012
|
|||||||||||||||||||||||
|
Goodwill
|
2,663
|
|
899
|
|
149
|
|
180
|
|
68
|
|
3,959
|
|
|||||||||||
|
Accumulated impairment losses
|
(1,838
|
)
|
—
|
|
—
|
|
(122
|
)
|
—
|
|
(1,960
|
)
|
|||||||||||
|
Net balance
|
825
|
|
899
|
|
149
|
|
58
|
|
68
|
|
1,999
|
|
|||||||||||
|
Impairment losses
|
(314
|
)
|
—
|
|
—
|
|
(58
|
)
|
—
|
|
(372
|
)
|
|||||||||||
|
Goodwill associated with the sale of a business
|
—
|
|
—
|
|
—
|
|
—
|
|
—
|
|
—
|
|
|||||||||||
|
Foreign currency translation and other
|
(5
|
)
|
—
|
|
—
|
|
—
|
|
—
|
|
(5
|
)
|
|||||||||||
|
Balance as of December 31, 2013
|
|||||||||||||||||||||||
|
Goodwill
|
2,658
|
|
899
|
|
149
|
|
180
|
|
68
|
|
3,954
|
|
|||||||||||
|
Accumulated impairment losses
|
(2,152
|
)
|
—
|
|
—
|
|
(180
|
)
|
—
|
|
(2,332
|
)
|
|||||||||||
|
Net balance
|
$
|
506
|
|
$
|
899
|
|
$
|
149
|
|
$
|
—
|
|
$
|
68
|
|
$
|
1,622
|
|
|||||
_____________________________
|
(1)
|
Both the gross carrying amount and the accumulated impairment losses of the Asia generation segment have been reduced by
$17 million
with no impact on the net carrying amount for the segment. This relates to Chigen, which had fully impaired goodwill of
$17 million
and was sold during the year.
|
DP&L—
During the fourth quarter of 2013, the Company performed the annual goodwill impairment test at its DP&L reporting unit ("DP&L") and recognized a goodwill impairment expense of
$307 million
. The reporting unit failed Step 1 as its fair value was less than its carrying amount primarily due to lower estimates of capacity prices in future years as well as lower dark spreads contributing to lower overall operating margins. The fair value of the reporting unit was determined under the income approach using a discounted cash flow valuation model. The significant assumptions included within the discounted cash flow valuation model were capacity price curves, amount of the non-bypassable charge, commodity price curves, dispatching, valuation of regulatory assets and liabilities, discount rates and deferred income taxes. In Step 2, goodwill was determined to have an implied fair value of
$316 million
after the hypothetical purchase price allocation under the accounting guidance for business combinations. The goodwill associated with the DP&L acquisition is not deductible for tax purposes. Accordingly, there is no financial statement tax benefit related to the impairment. The pretax impairment impacted the
143
THE AES CORPORATION
NOTES TO CONSOLIDATED FINANCIAL STATEMENTS—(Continued)
DECEMBER 31, 2013, 2012, AND 2011
Company’s effective tax rate for the year ended December 31, 2013, which was
33%
. DP&L is reported in the US SBU reportable segment.
The Company had previously recognized a goodwill impairment expense of
$1.82 billion
in 2012 at the DP&L reporting unit. During 2012, North American natural gas prices declined significantly compared to the previous year, which exerted downward pressure on wholesale power prices in the Ohio power market. These falling power prices compressed wholesale margins at DP&L and led to increased customer switching from DP&L to other competitive retail electric service (“CRES”) providers, including DPLER, who were offering retail prices lower than DP&L’s standard service offer. In addition, several municipalities in DP&L’s service territory passed ordinances allowing them to become government aggregators and contracted with CRES providers to provide generation service to the customers located within the municipal boundaries, further contributing to the switching trend. CRES providers also became more active in DP&L’s service territory. These developments reduced DP&L’s forecasted profitability, operating cash flows and liquidity. As a result, in September 2012, management reduced its previous forecasts of profitability and operating cash flows. Collectively, these events were considered an interim goodwill impairment indicator at the DP&L reporting unit. There were no interim impairment indicators identified for the goodwill at DPLER. The goodwill associated with the DP&L acquisition is not deductible for tax purposes. Accordingly, there was no financial statement tax benefit related to the impairment. The pretax impairment impacted the Company’s effective tax rate for the year ended December 31, 2012, which was
298%
.
MountainView—
During the fourth quarter of 2013, the Company performed the annual goodwill impairment test at its MountainView reporting unit,
two
wind projects in California with an aggregate generation capacity of
67
MW, and recognized a full impairment of goodwill of
$7 million
. Factors contributing to impairment were lower forward power prices impacting revenue after the expiration of the current PPA and higher discount rates. In Step 1, the fair value of MountainView was determined under the income approach using a discounted cash flow valuation model. The significant assumptions included within the discounted cash flow valuation model were power price curves, fixed costs, discount rates and income tax attributes associated with the projects. MountainView failed Step 1 and its goodwill was determined to have no value in Step 2. MountainView is reported in the US SBU reportable segment.
Buffalo Gap—
During the fourth quarter of 2013, the Company performed the annual goodwill impairment test at its Buffalo Gap reporting unit,
three
wind projects in Texas with an aggregate generation capacity of
524
MW. The reporting unit failed Step 1 and Step 2 was performed to measure the amount of goodwill impairment. In Step 2, after the hypothetical purchase price allocation under the relevant accounting guidance, the implied fair value of goodwill was greater than its carrying amount. As a result,
no
impairment was recognized. Buffalo Gap is reported in the US SBU reportable segment.
Ebute—
During the third quarter of 2013, the Company performed an interim goodwill impairment test at Ebute, a
294
MW gas-fired plant in Nigeria and recognized the entire goodwill balance of
$58 million
as goodwill impairment expense. Ebute currently operates on leased land located within the PHCN Egbin Power Station Compound (“Egbin”) in Ijede, Ikorodu, Lagos. A controlling stake in Egbin was sold to a private investor as part of the Nigerian government privatization program in 2007, but the sale transaction did not close until the third quarter of 2013. The Company has been evaluating Ebute's future options for the continuation of the plant operation after the end of the current PPA on an ongoing basis. The viability of a number of such options is subject to the Company's ability to secure among other things long-term land rights, permits, gas transportation and supply agreements, and a new or extended PPA. In this evaluation, the Company has been continually assessing the probability of success of each of these options. Based on communications with the Nigerian government and other power sector stakeholders it interacts with to secure the required key project components and agreements, in September 2013, management determined that the prospects for Ebute's future expansion had significantly reduced. These adverse developments were considered as impairment indicators for Ebute's goodwill and long-lived assets. The long-lived assets were deemed recoverable based on the undiscounted cash flow recoverability analysis. In Step 1, the fair value of Ebute was determined using the income approach based on a discounted cash flow valuation model. The significant assumptions included within the discounted cash flow valuation model were the ability to obtain an extension to the existing land lease, permits, gas transportation and supply agreements, future PPA terms, maintenance and growth capital expenditures, and discount rates. Ebute failed Step 1 and its goodwill was determined to have no value in Step 2. Ebute is reported in the EMEA SBU reportable segment.
Chigen—
During the third quarter of 2011, the Company performed an interim impairment test at Chigen, our wholly owned subsidiary that held equity interests in Chinese ventures, and recognized the entire goodwill balance of
$17 million
as goodwill impairment expense. The Company had identified higher coal prices and the resulting reduced operating margins in China as an impairment indicator. These factors had resulted in a significant downward revision to Chigen's cash flow forecasts.
144
THE AES CORPORATION
NOTES TO CONSOLIDATED FINANCIAL STATEMENTS—(Continued)
DECEMBER 31, 2013, 2012, AND 2011
Chigen failed Step 1 and its goodwill was determined to have no value in Step 2. Chigen was reported in the Asia SBU reportable segment.
Intangible Assets
The following tables summarize the balances comprising other intangible assets in the accompanying Consolidated Balance Sheets as of
December 31, 2013
and
2012
:
|
December 31, 2013
|
December 31, 2012
|
||||||||||||||||||||||
|
Gross Balance
|
Accumulated
Amortization
|
Net Balance
|
Gross Balance
|
Accumulated
Amortization
|
Net Balance
|
||||||||||||||||||
|
(in millions)
|
(in millions)
|
||||||||||||||||||||||
|
Subject to Amortization
|
|||||||||||||||||||||||
|
Project development rights
(1)
|
$
|
31
|
|
$
|
(1
|
)
|
$
|
30
|
|
$
|
32
|
|
$
|
(1
|
)
|
$
|
31
|
|
|||||
|
Sales concessions
(2)
|
95
|
|
(45
|
)
|
50
|
|
108
|
|
(49
|
)
|
59
|
|
|||||||||||
|
Contractual payment rights
(3)
|
74
|
|
(33
|
)
|
41
|
|
72
|
|
(23
|
)
|
49
|
|
|||||||||||
|
Management rights
|
37
|
|
(13
|
)
|
24
|
|
40
|
|
(14
|
)
|
26
|
|
|||||||||||
|
Emission allowances
|
4
|
|
—
|
|
4
|
|
5
|
|
—
|
|
5
|
|
|||||||||||
|
Electric security plan
|
—
|
|
—
|
|
—
|
|
87
|
|
(87
|
)
|
—
|
|
|||||||||||
|
Contracts
|
46
|
|
(24
|
)
|
22
|
|
44
|
|
(20
|
)
|
24
|
|
|||||||||||
|
Customer contracts and relationships
|
63
|
|
(34
|
)
|
29
|
|
66
|
|
(26
|
)
|
40
|
|
|||||||||||
|
Other
(4)
|
20
|
|
(3
|
)
|
17
|
|
13
|
|
(2
|
)
|
11
|
|
|||||||||||
|
Subtotal
|
370
|
|
(153
|
)
|
217
|
|
467
|
|
(222
|
)
|
245
|
|
|||||||||||
|
Indefinite-Lived Intangible Assets
|
|||||||||||||||||||||||
|
Land use rights
|
46
|
|
—
|
|
46
|
|
50
|
|
—
|
|
50
|
|
|||||||||||
|
Water rights
|
20
|
|
—
|
|
20
|
|
18
|
|
—
|
|
18
|
|
|||||||||||
|
Trademark/Trade name
|
5
|
|
—
|
|
5
|
|
6
|
|
—
|
|
6
|
|
|||||||||||
|
Other
|
9
|
|
—
|
|
9
|
|
5
|
|
—
|
|
5
|
|
|||||||||||
|
Subtotal
|
80
|
|
—
|
|
80
|
|
79
|
|
—
|
|
79
|
|
|||||||||||
|
Total
|
$
|
450
|
|
$
|
(153
|
)
|
$
|
297
|
|
$
|
546
|
|
$
|
(222
|
)
|
$
|
324
|
|
|||||
_____________________________
|
(1)
|
Represent development rights, including but not limited to, land control, various permits and right to acquire equity interests in development projects resulting from asset acquisitions by our wind operations in the U.K. The balance excludes project development rights of
$70 million
relating to our Poland wind operations that were fully impaired in the third quarter of 2013 and subsequently sold in November 2013. See Note
23
—
Discontinued Operations and Held for Sale Businesses
for further information.
|
|
(2)
|
Excludes net balance of sales concessions of
$32
and
$34 million
as of
December 31, 2013
and 2012, respectively, relating to our utility businesses in Cameroon that have been included in noncurrent assets of
Discontinued Operations and Held for Sale Businesses
. See Note
23
—
Discontinued Operations and Held for Sale Businesses
for further information.
|
|
(3)
|
Represent legal rights to receive system reliability payments from the regulator.
|
|
(4)
|
Includes renewable energy certificates, land use rights and various other intangible assets none of which is individually significant
.
|
The following table summarizes, by category, intangible assets acquired during the years ended
December 31, 2013
and
2012
:
|
December 31, 2013
|
|||||||||
|
Amount
|
Subject to Amortization/
Indefinite-Lived
|
Weighted Average
Amortization Period
|
Amortization
Method
|
||||||
|
(in millions)
|
(in years)
|
||||||||
|
Renewable energy certificates
|
$
|
3
|
|
Subject to amortization
|
Various
|
As utilized
|
|||
|
Other
|
2
|
|
Various
|
N/A
|
N/A
|
||||
|
Total
|
$
|
5
|
|
||||||
|
December 31, 2012
|
|||||||||
|
Amount
|
Subject to Amortization/
Indefinite-Lived
|
Weighted Average
Amortization Period
|
Amortization
Method
|
||||||
|
(in millions)
|
(in years)
|
||||||||
|
Renewable energy certificates
|
$
|
5
|
|
Subject to amortization
|
Various
|
As utilized
|
|||
|
Water rights
|
13
|
|
Indefinite-lived
|
N/A
|
N/A
|
||||
|
Other
|
1
|
|
Various
|
N/A
|
N/A
|
||||
|
Total
|
$
|
19
|
|
||||||
145
THE AES CORPORATION
NOTES TO CONSOLIDATED FINANCIAL STATEMENTS—(Continued)
DECEMBER 31, 2013, 2012, AND 2011
The following table summarizes the estimated amortization expense, by intangible asset category, for
2014
through
2018
:
|
Estimated amortization expense
|
|||||||||||||||||||
|
2014
|
2015
|
2016
|
2017
|
2018
|
|||||||||||||||
|
(in millions)
|
|||||||||||||||||||
|
Customer relationships & contracts
|
$
|
5
|
|
$
|
3
|
|
$
|
3
|
|
$
|
3
|
|
$
|
3
|
|
||||
|
Sales concessions
|
4
|
|
4
|
|
4
|
|
3
|
|
3
|
|
|||||||||
|
Contractual payment rights
|
2
|
|
2
|
|
2
|
|
2
|
|
2
|
|
|||||||||
|
All other
|
5
|
|
5
|
|
5
|
|
5
|
|
4
|
|
|||||||||
|
Total
|
$
|
16
|
|
$
|
14
|
|
$
|
14
|
|
$
|
13
|
|
$
|
12
|
|
||||
Intangible asset amortization expense was
$29 million
,
$115 million
and
$20 million
for the years ended
December 31, 2013
,
2012
and
2011
, respectively.
146
THE AES CORPORATION
NOTES TO CONSOLIDATED FINANCIAL STATEMENTS—(Continued)
DECEMBER 31, 2013, 2012, AND 2011
11. REGULATORY ASSETS AND LIABILITIES
The Company has recorded regulatory assets and liabilities that it expects to pass through to its customers in accordance with, and subject to, regulatory provisions as follows:
|
December 31,
|
Recovery/Refund Period
|
||||||||
|
2013
|
2012
|
||||||||
|
(in millions)
|
|||||||||
|
REGULATORY ASSETS
|
|||||||||
|
Current regulatory assets:
|
|||||||||
|
Brazil tariff recoveries:
(1)
|
|||||||||
|
Energy purchases
|
$
|
87
|
|
$
|
189
|
|
Annually as part of the tariff adjustment
|
||
|
Transmission costs, regulatory fees and other
|
52
|
|
78
|
|
Annually as part of the tariff adjustment
|
||||
|
El Salvador tariff recoveries
(2)
|
108
|
|
115
|
|
Quarterly as part of the tariff adjustment
|
||||
|
Other
(3)
|
35
|
|
26
|
|
Various
|
||||
|
Total current regulatory assets
|
282
|
|
408
|
|
|||||
|
Noncurrent regulatory assets:
|
|||||||||
|
Defined benefit pension obligations at IPL and DPL
(4)(5)
|
261
|
|
430
|
|
Various
|
||||
|
Income taxes recoverable from customers
(4)(6)
|
72
|
|
81
|
|
Various
|
||||
|
Brazil tariff recoveries:
(1)
|
|||||||||
|
Energy purchases
|
62
|
|
97
|
|
Annually as part of the tariff adjustment
|
||||
|
Transmission costs, regulatory fees and other
|
4
|
|
59
|
|
Annually as part of the tariff adjustment
|
||||
|
Deferred Midwest ISO costs
(7)
|
98
|
|
89
|
|
To be determined
|
||||
|
Other
(3)
|
139
|
|
115
|
|
Various
|
||||
|
Total noncurrent regulatory assets
|
636
|
|
871
|
|
|||||
|
TOTAL REGULATORY ASSETS
|
$
|
918
|
|
$
|
1,279
|
|
|||
|
REGULATORY LIABILITIES
|
|||||||||
|
Current regulatory liabilities:
|
|||||||||
|
Brazil tariff reset adjustment
(8)
|
$
|
245
|
|
$
|
89
|
|
Two Years
|
||
|
Efficiency program costs
(9)
|
25
|
|
32
|
|
Annually as part of the tariff adjustment
|
||||
|
Brazil regulatory asset base adjustment
(13)
|
34
|
|
—
|
|
Up to four tariff periods
|
||||
|
Brazil tariff refunds:
(1)
|
|||||||||
|
Energy purchases
|
48
|
|
171
|
|
Annually as part of the tariff adjustment
|
||||
|
Transmission costs, regulatory fees and other
|
69
|
|
55
|
|
Annually as part of the tariff adjustment
|
||||
|
Other
(10)
|
40
|
|
41
|
|
Various
|
||||
|
Total current regulatory liabilities
|
461
|
|
388
|
|
|||||
|
Noncurrent regulatory liabilities:
|
|||||||||
|
Brazil tariff reset adjustment
(8)
|
82
|
|
445
|
|
Two Years
|
||||
|
Asset retirement obligations
(11)
|
696
|
|
672
|
|
Over life of assets
|
||||
|
Brazil regulatory asset base adjustment
(13)
|
235
|
|
—
|
|
Up to four tariff periods
|
||||
|
Brazil special obligations
(12)
|
502
|
|
463
|
|
To be determined
|
||||
|
Brazil tariff refunds:
(1)
|
|||||||||
|
Energy purchases
|
16
|
|
46
|
|
Annually as part of the tariff adjustment
|
||||
|
Transmission costs, regulatory fees and other
|
42
|
|
42
|
|
Annually as part of the tariff adjustment
|
||||
|
Efficiency program costs
(9)
|
10
|
|
17
|
|
Annually as part of the tariff adjustment
|
||||
|
Other
(10)
|
9
|
|
17
|
|
Various
|
||||
|
Total noncurrent regulatory liabilities
|
1,592
|
|
1,702
|
|
|||||
|
TOTAL REGULATORY LIABILITIES
|
$
|
2,053
|
|
$
|
2,090
|
|
|||
_____________________________
|
(1)
|
Recoverable or refundable per National Electric Energy Agency (“ANEEL”) regulations through the Annual Tariff Adjustment (“IRT”). These costs are generally non-controllable costs and primarily consist of purchased electricity, energy transmission costs and sector costs that are considered volatile. These costs are passed through for a period of
12
months as part of the annual tariff adjustment. Any remaining balance is considered in the following annual tariff adjustment, being a total of
24
months to recover or refund the costs.
|
147
THE AES CORPORATION
NOTES TO CONSOLIDATED FINANCIAL STATEMENTS—(Continued)
DECEMBER 31, 2013, 2012, AND 2011
|
(2)
|
Deferred fuel costs incurred by our El Salvador subsidiaries associated with purchase of energy from the El Salvador spot market and the power generation plants. In El Salvador, the deferred fuel adjustment represents the variance between the actual fuel costs and the fuel costs recovered in the tariffs. The variance is recovered quarterly at the tariff reset period.
|
|
(3)
|
Includes assets with and without a rate of return. Other current regulatory assets that did not earn a rate of return were
$13 million
and
$19 million
, as of December 31, 2013 and 2012, respectively. Other noncurrent regulatory assets that did not earn a rate of return were
$71 million
and
$60 million
, as of
December 31, 2013
and
2012
, respectively. Other current and noncurrent regulatory assets primarily consist of:
|
|
▪
|
Unamortized losses on long-term debt reacquired or redeemed in prior periods at IPL and DPL, which are amortized over the lives of the original issues in accordance with the FERC and PUCO rules.
|
|
▪
|
Unamortized carrying charges and certain other costs related to Petersburg unit 4 at IPL.
|
|
▪
|
Deferred storm costs incurred primarily in 2008 to repair storm damage at DPL, which have been deferred until such time that DPL seeks recovery in a future rate proceeding.
|
|
▪
|
Additional Regulatory Asset Base (RAB) from a favorable decision on tariff reset (administrative appeal) at Eletropaulo.
|
|
(4)
|
Past expenditures on which the Company does not earn a rate of return.
|
|
(5)
|
The regulatory accounting standards allow the defined pension and postretirement benefit obligation to be recorded as a regulatory asset equal to the previously unrecognized actuarial gains and losses and prior service costs that are expected to be recovered through future rates. Pension expense is recognized based on the plan’s actuarially determined pension liability. Recovery of costs is probable, but not yet determined. Pension contributions made by our Brazilian subsidiaries are not included in regulatory assets as those contributions are not covered by the established tariff in Brazil.
|
|
(6)
|
Probability of recovery through future rates, based upon established regulatory practices, which permit the recovery of current taxes. This amount is expected to be recovered, without interest, over the period as book-tax temporary differences reverse and become current taxes.
|
|
(7)
|
Transmission service costs and other administrative costs from IPL’s participation in the Midwest ISO market, which are recoverable but do not earn a rate of return. Recovery of costs is probable, but the timing is not yet determined.
|
|
(8)
|
In July 2012, the Brazilian energy regulator (the “Regulator”) approved the periodic review and reset of a component of Eletropaulo’s regulated tariff, which determines the margin to be earned by Eletropaulo. The review and reset of this tariff component is retroactive to July 2011 and will be applied to customers’ invoices from July 2012 to June 2015. From July 2011 through June 2012, Eletropaulo invoiced customers under the then existing tariff rate, as required by the Regulator. As the new tariff rate is lower than the pre-existing tariff rate, Eletropaulo is required to reduce customer tariffs for this difference over the next year. Accordingly, from July 2011 through June 2012, Eletropaulo recognized a regulatory liability for such estimated future refunds, which was subsequently adjusted as of June 30, 2012 upon the finalization of the new tariff with the Regulator. The refund to customers was considered in the 2013 tariff adjustment, which contemplates an amortization of
67.55%
as from July 4, 2013. The remaining balance, representing
32.45%
, will be considered in the next annual tariff adjustment. As of
December 31, 2013
, Eletropaulo had recorded a current and noncurrent regulatory liability of
$245 million
and
$82 million
, respectively.
|
|
(9)
|
Amounts received for costs expected to be incurred to improve the efficiency of our plants in Brazil as part of the IRT.
|
|
(10)
|
Other current and noncurrent regulatory liabilities primarily consist of liabilities owed to electricity generators due to variance in energy prices during rationing periods (“Free Energy”). Our Brazilian subsidiaries are authorized to recover or refund this cost associated with monthly energy price variances between the wholesale energy market prices owed to the power generation plants producing Free Energy and the capped price reimbursed by the local distribution companies which are passed through to the final customers through energy tariffs. The balance excludes asset retirement obligations that were reclassified out of Other.
|
|
(11)
|
Obligations for removal costs which do not have an associated legal retirement obligation as defined by the accounting standards on asset retirement obligations.
|
|
(12)
|
Obligations established by ANEEL in Brazil associated with electric utility concessions and represent amounts received from customers or donations not subject to return. These donations are allocated to support energy network expansion and to improve utility operations to meet customers’ needs. The term of the obligation is established by ANEEL. Settlement shall occur when the concession ends.
|
|
(13)
|
Represents adjustments to the regulatory asset base resulting from an administrative ruling in December 2013 which compelled Eletropaulo to refund customers beginning in July 2014.
|
The current regulatory assets and liabilities are recorded in “Other current assets” and “Accrued and other liabilities,” respectively, on the accompanying Consolidated Balance Sheets. The noncurrent regulatory assets and liabilities are recorded in “Other noncurrent assets” and “Other noncurrent liabilities,” respectively, in the accompanying Consolidated Balance Sheets. The following table summarizes regulatory assets and liabilities by reportable segment as of December 31, 2013 and
2012
:
148
THE AES CORPORATION
NOTES TO CONSOLIDATED FINANCIAL STATEMENTS—(Continued)
DECEMBER 31, 2013, 2012, AND 2011
|
December 31,
|
|||||||||||||||
|
2013
|
2012
|
||||||||||||||
|
Regulatory Assets
|
Regulatory Liabilities
|
Regulatory Assets
|
Regulatory Liabilities
|
||||||||||||
|
(in millions)
|
|||||||||||||||
|
Brazil SBU
|
$
|
260
|
|
$
|
1,336
|
|
$
|
427
|
|
$
|
1,390
|
|
|||
|
US SBU
|
550
|
|
717
|
|
737
|
|
700
|
|
|||||||
|
MCAC SBU
|
108
|
|
—
|
|
115
|
|
—
|
|
|||||||
|
Total
|
$
|
918
|
|
$
|
2,053
|
|
$
|
1,279
|
|
$
|
2,090
|
|
|||
12. DEBT
Non-Recourse Debt
The following table summarizes the carrying amount and terms of non-recourse debt as of
December 31, 2013
and 2012:
|
NON-RECOURSE DEBT
|
Weighted Average Interest Rate
|
Maturity
|
December 31,
|
||||||||||
|
2013
|
2012
|
||||||||||||
|
(in millions)
|
|||||||||||||
|
VARIABLE RATE:
(1)
|
|||||||||||||
|
Bank loans
|
3.30
|
%
|
2014 – 2029
|
$
|
2,783
|
|
$
|
3,556
|
|
||||
|
Notes and bonds
|
10.51
|
%
|
2014 – 2040
|
1,845
|
|
1,887
|
|
||||||
|
Debt to (or guaranteed by) multilateral, export credit agencies or development banks
(2)
|
2.46
|
%
|
2014 – 2034
|
2,446
|
|
1,711
|
|
||||||
|
Other
|
4.62
|
%
|
2014 – 2043
|
349
|
|
349
|
|
||||||
|
FIXED RATE:
|
|||||||||||||
|
Bank loans
|
5.06
|
%
|
2014 – 2023
|
477
|
|
209
|
|
||||||
|
Notes and bonds
|
6.25
|
%
|
2014 – 2073
|
7,164
|
|
6,448
|
|
||||||
|
Debt to (or guaranteed by) multilateral, export credit agencies or development banks
(2)
|
4.65
|
%
|
2014 – 2027
|
164
|
|
411
|
|
||||||
|
Other
|
6.55
|
%
|
2014 – 2061
|
152
|
|
188
|
|
||||||
|
SUBTOTAL
|
15,380
|
|
(3)
|
14,759
|
|
(3)
|
|||||||
|
Less: Current maturities
|
(2,062
|
)
|
(2,494
|
)
|
|||||||||
|
TOTAL
|
$
|
13,318
|
|
$
|
12,265
|
|
|||||||
|
(1)
|
The interest rate on variable rate debt represents the total of a variable component that is based on changes in an interest rate index and of a fixed component. The Company has interest rate swaps and option agreements in an aggregate notional principal amount of approximately
$3.6 billion
on non-recourse debt outstanding at December 31, 2013. These agreements economically fix the variable component of the interest rates on the portion of the variable-rate debt being hedged so that the total interest rate on that debt has been fixed at rates ranging from approximately
4.09%
to
8.98%
and
5.85%
to
8.75%
for swaps and options, respectively. These agreements expire at various dates from
2014
through
2030
.
|
|
(2)
|
Multilateral loans include loans funded and guaranteed by bilaterals, multilaterals, development banks and other similar institutions.
|
|
(3)
|
Non-recourse debt of
$658 million
as of December 31, 2013 was excluded from non-recourse debt and included in current and noncurrent liabilities of held for sale and discontinued businesses in the accompanying Consolidated Balance Sheets. There were
no
amounts excluded in 2012.
|
Non-recourse debt as of December 31, 2013 is scheduled to reach maturity as set forth in the table below:
|
December 31,
|
Annual Maturities
|
||
|
(in millions)
|
|||
|
2014
|
$
|
2,062
|
|
|
2015
|
692
|
|
|
|
2016
|
2,422
|
|
|
|
2017
|
792
|
|
|
|
2018
|
1,444
|
|
|
|
Thereafter
|
7,968
|
|
|
|
Total non-recourse debt
|
$
|
15,380
|
|
As of December 31, 2013, AES subsidiaries with facilities under construction had a total of approximately
$2.9 billion
of committed but unused credit facilities available to fund construction and other related costs. Excluding these facilities under construction, AES subsidiaries had approximately
$1.4 billion
in a number of available but unused committed credit lines to
149
THE AES CORPORATION
NOTES TO CONSOLIDATED FINANCIAL STATEMENTS—(Continued)
DECEMBER 31, 2013, 2012, AND 2011
support their working capital, debt service reserves and other business needs. These credit lines can be used for borrowings, letters of credit, or a combination of these uses.
Significant transactions
During the year ended December 31, 2013, we had the following significant debt transactions at our subsidiaries:
|
•
|
Tietê issued new debt of
$496 million
partially offset by repayments of
$396 million
;
|
|
•
|
El Salvador issued new debt of
$310 million
partially offset by repayments of
$301 million
;
|
|
•
|
Sul issued new debt of
$153 million
partially offset by repayments of
$44 million
;
|
|
•
|
Mong Duong drew
$471 million
under its construction loan facility;
|
|
•
|
DPL terminated its
$425 million
term loan and replaced it with a new
$200 million
term loan, and had additional repayments of
$53 million
;
|
|
•
|
DP&L issued
$445 million
of first mortgage bonds to partially repay
$470 million
of existing bonds which were repaid at par on October 1, 2013;
|
|
•
|
IPL issued new debt of
$170 million
partially offset by repayments of
$110 million
;
|
|
•
|
Masinloc refinanced its senior debt facility of
$500 million
and incurred a loss on extinguishment of debt of
$43 million
. See Note 20—
Other Income and Expense
for further information;
|
|
•
|
Jordan drew
$180 million
under its construction loan facility;
|
|
•
|
Cochrane drew
$210 million
under its construction loan facility;
|
|
•
|
Gener issued
$450 million
of junior subordinated capital notes to pay Gener's outstanding notes due March 2014 and development of new projects, among other purposes; and
|
|
•
|
Changuinola issued new debt of
$420 million
partially offset by repayments of
$412 million
.
|
Non-Recourse Debt Covenants, Restrictions and Defaults
The terms of the Company’s non-recourse debt include certain financial and non-financial covenants. These covenants are limited to subsidiary activity and vary among the subsidiaries. These covenants may include but are not limited to maintenance of certain reserves, minimum levels of working capital and limitations on incurring additional indebtedness.
As of December 31, 2013 and 2012, approximately
$492 million
and
$560 million
, respectively, of restricted cash was maintained in accordance with certain covenants of the non-recourse debt agreements, and these amounts were included within “Restricted cash” and “Debt service reserves and other deposits” in the accompanying Consolidated Balance Sheets.
Various lender and governmental provisions restrict the ability of certain of the Company’s subsidiaries to transfer their net assets to the Parent Company. Such restricted net assets of subsidiaries amounted to approximately
$2.2 billion
at December 31, 2013.
The following table summarizes the Company’s subsidiary non-recourse debt in default or accelerated as of
December 31, 2013
and is included in the current portion of non-recourse debt:
|
Primary Nature
of Default
|
December 31, 2013
|
||||||||
|
Subsidiary
|
Default
|
Net Assets
|
|||||||
|
(in millions)
|
|||||||||
|
Maritza
|
Covenant
|
$
|
850
|
|
$
|
714
|
|
||
|
Kavarna
|
Covenant
|
205
|
|
90
|
|
||||
|
Total
|
$
|
1,055
|
|
||||||
In addition to the defaults listed in the table above, Sonel and Kribi in Cameroon and Saurashtra in India have been classified as discontinued operations. As of
December 31, 2013
, Sonel, Kribi, and Saurashtra had debt in default of
$257 million
,
$247 million
and
$21 million
; and net assets of
$387 million
,
$3 million
and
$2 million
, respectively. For further information please see Note 23 —
Discontinued Operations and Held-for-Sale Businesses.
The defaults are not payment defaults, but are instead technical defaults triggered by failure to comply with other covenants and/or other conditions such as (but not limited to) failure to meet information covenants, complete construction or
150
THE AES CORPORATION
NOTES TO CONSOLIDATED FINANCIAL STATEMENTS—(Continued)
DECEMBER 31, 2013, 2012, AND 2011
other milestones in an allocated time, meet certain minimum or maximum financial ratios, or other requirements contained in the non-recourse debt documents of the Company.
In addition, in the event that there is a default, bankruptcy or maturity acceleration at a subsidiary that meets the applicable definition of materiality under the corporate debt agreements of The AES Corporation, there could be a cross-default to the Company’s recourse debt. At December 31, 2013, none of the defaults listed above results in a cross-default under the recourse debt of the Company.
RECOURSE DEBT
The following table summarizes the carrying amount and terms of recourse debt of the Company as of
December 31, 2013
and 2012:
|
Interest Rate
|
Final
Maturity
|
December 31,
|
|||||||||
|
RECOURSE DEBT
|
2013
|
2012
|
|||||||||
|
(in millions)
|
|||||||||||
|
Senior Unsecured Note
|
7.75%
|
2014
|
110
|
|
500
|
|
|||||
|
Senior Unsecured Note
|
7.75%
|
2015
|
356
|
|
500
|
|
|||||
|
Senior Unsecured Note
|
9.75%
|
2016
|
369
|
|
535
|
|
|||||
|
Senior Unsecured Note
|
8.00%
|
2017
|
1,150
|
|
1,500
|
|
|||||
|
Senior Secured Term Loan
|
LIBOR + 2.75%
|
2018
|
799
|
|
807
|
|
|||||
|
Senior Unsecured Note
|
8.00%
|
2020
|
625
|
|
625
|
|
|||||
|
Senior Unsecured Note
|
7.38%
|
2021
|
1,000
|
|
1,000
|
|
|||||
|
Senior Unsecured Note
|
4.88%
|
2023
|
750
|
|
—
|
|
|||||
|
Term Convertible Trust Securities
|
6.75%
|
2029
|
517
|
|
517
|
|
|||||
|
Unamortized discounts
|
(7
|
)
|
(22
|
)
|
|||||||
|
SUBTOTAL
|
5,669
|
|
5,962
|
|
|||||||
|
Less: Current maturities
|
(118
|
)
|
(11
|
)
|
|||||||
|
Total
|
$
|
5,551
|
|
$
|
5,951
|
|
|||||
The table below summarizes the principal amounts due, net of unamortized discounts, under our recourse debt for the next five years and thereafter:
|
December 31,
|
Net Principal Amounts Due
|
||
|
(in millions)
|
|||
|
2014
|
$
|
118
|
|
|
2015
|
364
|
|
|
|
2016
|
368
|
|
|
|
2017
|
1,158
|
|
|
|
2018
|
764
|
|
|
|
Thereafter
|
2,897
|
|
|
|
Total recourse debt
|
$
|
5,669
|
|
On April 30, 2013, the Company issued
$500 million
aggregate principal amount of
4.875%
senior notes due 2023. On May 17, 2013, the Company issued an additional
$250 million
aggregate principal amount of
4.875%
senior notes due 2023 to form a single series with the notes issued on April 30, 2013. After this offering, the Company completed the redemption of
$928 million
aggregate principal of its existing
7.75%
senior notes due 2014,
7.75%
senior notes due 2015,
9.75%
senior notes due 2016, and
8.0%
senior notes due 2017 through respective tender offers in May 2013. In June 2013, the Company redeemed an additional
$122 million
of its
7.75%
senior notes due 2014 as per the optional redemption provisions of the senior note indentures. As a result of these transactions, the Company voluntarily reduced outstanding principal by
$300 million
and extended maturities of an additional
$750 million
to
10 years
. The Company recognized a loss on extinguishment of debt of
$163 million
on these transactions that is included in the Consolidated Statement of Operations.
On July 26, 2013, the Company entered into an amendment No. 3 to the senior secured credit facility dated as of July 29, 2010 that amended the terms and conditions of the senior secured credit facility, including the following changes:
|
•
|
the final maturity date of the senior secured credit facility is extended to July 26, 2018 from January 29, 2015;
|
|
•
|
the interest rate margin applicable to the senior secured credit facility is based on the credit rating assigned to the loans under the senior secured credit facility, with pricing at LIBOR +
2.25%
as of
December 31, 2013
;
|
151
THE AES CORPORATION
NOTES TO CONSOLIDATED FINANCIAL STATEMENTS—(Continued)
DECEMBER 31, 2013, 2012, AND 2011
|
•
|
there is an undrawn fee of
0.50%
per annum; and
|
|
•
|
the subsidiary guarantors party to the senior secured credit facility are released from their obligations under the old senior secured credit facility and have no obligations under the amended senior secured credit facility.
|
The aggregate commitment for the senior secured credit facility remains
$800 million
. There were no draws on this credit facility as of
December 31, 2013
and 2012.
Recourse Debt Covenants and Guarantees
The Company’s obligations under the senior secured credit facilities are, subject to certain exceptions, secured by:
|
(i)
|
all of the capital stock of domestic subsidiaries owned directly by the Company and
65%
of the capital stock of certain foreign subsidiaries owned directly or indirectly by the Company; and
|
|
(ii)
|
certain intercompany receivables, certain intercompany notes and certain intercompany tax sharing agreements.
|
The senior secured credit facilities are subject to mandatory prepayment under certain circumstances, including the sale of certain assets. In such a situation, the net cash proceeds from the sale must be applied pro rata to repay the term loan using
60%
of net cash proceeds, reduced to
50%
when and if the parent’s recourse debt to cash flow ratio is less than 5:1. The lenders have the option to waive their pro rata redemption.
The senior secured credit facility contains customary covenants and restrictions on the Company’s ability to engage in certain activities, including, but not limited to, limitations on other indebtedness, liens, investments and guarantees; limitations on restricted payments such as shareholder dividends and equity repurchases; restrictions on mergers and acquisitions, sales of assets, leases, transactions with affiliates and off-balance sheet or derivative arrangements; and other financial reporting requirements.
The senior secured credit facility also contains financial covenants requiring the Company to maintain certain financial ratios including a cash flow to interest coverage ratio, calculated quarterly, which provides that a minimum ratio of the Company’s adjusted operating cash flow to the Company’s interest charges related to recourse debt of
1.3
× must be maintained at all times and a recourse debt to cash flow ratio, calculated quarterly, which provides that the ratio of the Company’s total recourse debt to the Company’s adjusted operating cash flow must not exceed a maximum of
7.5
×.
The terms of the Company’s senior unsecured notes and senior secured credit facility contain certain covenants including, without limitation, limitation on the Company’s ability to incur liens or enter into sale and leaseback transactions.
TERM CONVERTIBLE TRUST SECURITIES
Between 1999 and 2000, AES Trust III, a wholly owned special purpose business trust and a VIE, issued approximately
10.35 million
of
$50
par value Term Convertible Preferred Securities (“TECONS”) with a semi annual coupon payment of
$3.375
for total proceeds of
$517 million
and concurrently purchased
$517 million
of
6.75%
Junior Subordinated Convertible Debentures due 2029 (the “6.75% Debentures”) issued by AES. The Company consolidates AES Trust III in its consolidated financial statements and classifies the TECONS as recourse debt on its Consolidated Balance Sheet. The Company’s obligations under the 6.75% Debentures and other relevant trust agreements, in aggregate, constitute a full and unconditional guarantee by the Company of the TECON Trusts’ obligations. As of December 31, 2013 and 2012, the sole assets of AES Trust III are the 6.75% Debentures.
AES, at its option, can redeem the 6.75% Debentures which would result in the required redemption of the TECONS issued by AES Trust III, currently for
$50
per TECON. The TECONS must be redeemed upon maturity of the 6.75% Debentures. The TECONS are convertible into the common stock of AES at each holder’s option prior to October 15, 2029 at the rate of
1.4216
, representing a conversion price of
$35.17
per share. The maximum number of shares of common stock AES would be required to issue should all holders decide to convert their securities would be
14.7 million
shares.
Dividends on the TECONS are payable quarterly at an annual rate of 6.75%. The Trust is permitted to defer payment of dividends for up to
20
consecutive quarters, provided that the Company has exercised its right to defer interest payments under the corresponding debentures or notes. During such deferral periods, dividends on the TECONS would accumulate quarterly and accrue interest, and the Company may not declare or pay dividends on its common stock. AES has not exercised the option to defer any dividends at this time and all dividends due under the Trust have been paid.
152
THE AES CORPORATION
NOTES TO CONSOLIDATED FINANCIAL STATEMENTS—(Continued)
DECEMBER 31, 2013, 2012, AND 2011
13. COMMITMENTS
LEASES
—The Company and its subsidiaries enter into long-term non-cancelable lease arrangements which, for accounting purposes, are classified as either operating lease or capital lease. Operating leases primarily include certain transmission lines, office rental and site leases. Operating lease rental expense for the years ended
December 31,
2013
,
2012
, and
2011
was
$46 million
,
$57 million
and
$59 million
, respectively. Capital leases primarily include transmission lines at our subsidiaries in Brazil, vehicles, and office and other operating equipment. Capital leases are recognized in Property, Plant and Equipment within “Electric generation and distribution assets.” The gross value of the capital lease assets as of
December 31,
2013
and
2012
was
$93 million
and
$94 million
, respectively. The table below sets forth the future minimum lease payments under operating and capital leases for continuing operations together with the present value of the net minimum lease payments under capital leases as of December 31,
2013
for
2014
through
2018
and thereafter:
|
Future Commitments for
|
|||||||
|
December 31,
|
Capital Leases
|
Operating Leases
|
|||||
|
(in millions)
|
|||||||
|
2014
|
$
|
13
|
|
$
|
41
|
|
|
|
2015
|
13
|
|
42
|
|
|||
|
2016
|
12
|
|
40
|
|
|||
|
2017
|
11
|
|
40
|
|
|||
|
2018
|
10
|
|
40
|
|
|||
|
Thereafter
|
136
|
|
399
|
|
|||
|
Total
|
195
|
|
$
|
602
|
|
||
|
Less: Imputed interest
|
120
|
|
|||||
|
Present value of total minimum lease payments
|
$
|
75
|
|
||||
CONTRACTS
—The Company’s operating subsidiaries enter into long-term contracts for construction projects, maintenance and service, transmission of electricity, operations services and purchase of electricity and fuel. In general, these contracts are subject to variable quantities or prices and are terminable in limited circumstances only. Electricity purchase contracts primarily include energy auction agreements at our Brazil subsidiaries with extended terms from 2013 through 2028. The table below sets forth the future minimum commitments for continuing operations under these contracts as of
December 31,
2013
for
2014
through
2018
and thereafter. Actual purchases under these contracts for the years ended
December 31,
2013
,
2012
, and
2011
are also presented:
|
Electricity Purchase Contracts
|
Fuel Purchase Contracts
|
Other Purchase Contracts
|
|||||||||
|
Actual purchases during the year ended December 31,
|
(in millions)
|
||||||||||
|
2011
|
$
|
2,463
|
|
$
|
1,577
|
|
$
|
1,515
|
|
||
|
2012
|
2,819
|
|
1,832
|
|
1,637
|
|
|||||
|
2013
|
2,665
|
|
1,590
|
|
1,743
|
|
|||||
|
Future commitments for the year ending December 31,
|
|||||||||||
|
2014
|
$
|
2,793
|
|
$
|
1,274
|
|
$
|
1,526
|
|
||
|
2015
|
2,792
|
|
718
|
|
1,326
|
|
|||||
|
2016
|
2,808
|
|
437
|
|
975
|
|
|||||
|
2017
|
2,403
|
|
432
|
|
674
|
|
|||||
|
2018
|
2,538
|
|
434
|
|
576
|
|
|||||
|
Thereafter
|
27,831
|
|
3,451
|
|
5,419
|
|
|||||
|
Total
|
$
|
41,165
|
|
$
|
6,746
|
|
$
|
10,496
|
|
||
14. CONTINGENCIES
Guarantees, Letters of Credit
In connection with certain project financing, acquisition and dispositions, power purchase and other agreements, the Parent Company has expressly undertaken limited obligations and commitments, most of which will only be effective or will be terminated upon the occurrence of future events. In the normal course of business, the Parent Company has entered into various agreements, mainly guarantees and letters of credit, to provide financial or performance assurance to third parties on behalf of AES businesses. These agreements are entered into primarily to support or enhance the creditworthiness otherwise achieved by
153
THE AES CORPORATION
NOTES TO CONSOLIDATED FINANCIAL STATEMENTS—(Continued)
DECEMBER 31, 2013, 2012, AND 2011
a business on a stand-alone basis, thereby facilitating the availability of sufficient credit to accomplish their intended business purposes. Most of the contingent obligations relate to future performance commitments which the Company or its businesses expect to fulfill within the normal course of business. The expiration dates of these guarantees vary from less than
one
year to more than
21
years.
The following table summarizes the Parent Company’s contingent contractual obligations as of
December 31, 2013
. Amounts presented in the table below represent the Parent Company’s current undiscounted exposure to guarantees and the range of maximum undiscounted potential exposure. The maximum exposure is not reduced by the amounts, if any, that could be recovered under the recourse or collateralization provisions in the guarantees. The amounts include obligations made by the Parent Company for the direct benefit of the lenders associated with the non-recourse debt of its businesses of
$24 million
.
|
Contingent Contractual Obligations
|
Amount
|
Number of
Agreements
|
Maximum Exposure Range for
Each Agreement
|
|||||
|
(in millions)
|
(in millions)
|
|||||||
|
Guarantees
|
$
|
661
|
|
21
|
<$1 - 280
|
|||
|
Cash collateralized letters of credit
|
163
|
|
12
|
<$1 - 109
|
||||
|
Letters of credit under the senior secured credit facility
|
1
|
|
3
|
<$1
|
||||
|
Total
|
$
|
825
|
|
36
|
||||
As of December 31, 2013, the Parent Company had
no
commitments to invest in subsidiaries under construction and to purchase related equipment that were not included in the letters of credit discussed above. During the year ended
December 31, 2013
, the Company paid letter of credit fees ranging from
0.2%
to
3.25%
per annum on the outstanding amounts of letters of credit.
Environmental
The Company periodically reviews its obligations as they relate to compliance with environmental laws, including site restoration and remediation. As of
December 31, 2013
, the Company had recorded liabilities of
$19 million
for projected environmental remediation costs. Due to the uncertainties associated with environmental assessment and remediation activities, future costs of compliance or remediation could be higher or lower than the amount currently accrued. Moreover, where no reserve has been recognized, it is reasonably possible that the Company may be required to incur remediation costs or make expenditures in amounts that could be material but could not be estimated as of
December 31, 2013
. In aggregate, the Company estimates that the range of potential losses related to environmental matters, where estimable, to be up to
$4 million
. The amounts considered reasonably possible do not include amounts reserved as discussed above.
Litigation
The Company is involved in certain claims, suits and legal proceedings in the normal course of business. The Company accrues for litigation and claims when it is probable that a liability has been incurred and the amount of loss can be reasonably estimated. The Company has evaluated claims in accordance with the accounting guidance for contingencies that it deems both probable and reasonably estimable and, accordingly, has recorded aggregate reserves for all claims of approximately
$239 million
and
$320 million
as of
December 31, 2013
and 2012, respectively. These reserves are reported on the consolidated balance sheets within “accrued and other liabilities” and “other noncurrent liabilities.” A significant portion of the reserves relate to employment, non-income tax and customer disputes in international jurisdictions, principally Brazil. Certain of the Company’s subsidiaries, principally in Brazil, are defendants in a number of labor and employment lawsuits. The complaints generally seek unspecified monetary damages, injunctive relief, or other relief. The subsidiaries have denied any liability and intend to vigorously defend themselves in all of these proceedings. There can be no assurance that these reserves will be adequate to cover all existing and future claims or that we will have the liquidity to pay such claims as they arise.
The Company believes, based upon information it currently possesses and taking into account established reserves for liabilities and its insurance coverage, that the ultimate outcome of these proceedings and actions is unlikely to have a material effect on the Company’s consolidated financial statements. However, where no reserve has been recognized, it is reasonably possible that some matters could be decided unfavorably to the Company and could require the Company to pay damages or make expenditures in amounts that could be material but could not be estimated as of
December 31, 2013
. The material contingencies where a loss is reasonably possible primarily include: claims under financing agreements; disputes with offtakers, suppliers and EPC contractors; alleged violation of monopoly laws and regulations; income tax and non-income tax matters with tax authorities; and regulatory matters. In aggregate, the Company estimates that the range of potential losses, where estimable, related to these reasonably possible material contingencies to be between
$887 million
and
$1.4 billion
. The amounts
154
THE AES CORPORATION
NOTES TO CONSOLIDATED FINANCIAL STATEMENTS—(Continued)
DECEMBER 31, 2013, 2012, AND 2011
considered reasonably possible do not include amounts reserved, as discussed above. These material contingencies do not include income tax-related contingencies which are considered part of our uncertain tax positions.
15. BENEFIT PLANS
Defined Contribution Plan
The Company sponsors
one
defined contribution plan (“the Plan”), qualified under section 401 of the Internal Revenue Code. All U.S. employees of the Company are eligible to participate in the Plan except for those employees who are covered by a collective bargaining agreement, unless such agreement specifically provides that the employee is considered an eligible employee under the Plan. The Plan provides matching contributions in AES common stock, other contributions at the discretion of the Compensation Committee of the Board of Directors in AES common stock and discretionary tax deferred contributions from the participants. Participants are fully vested in their own contributions and the Company’s matching contributions. Participants vest in other company contributions ratably over a
five
-year period ending on the fifth anniversary of their hire date. For the year ended
December 31, 2013
, the Company’s contributions to the Plan were approximately
$15 million
, and for the years ended December 31,
2012
and
2011
, contributions were
$21 million
and
$22 million
per year, respectively.
Defined Benefit Plans
Certain of the Company’s subsidiaries have defined benefit pension plans covering substantially all of their respective employees. Pension benefits are based on years of credited service, age of the participant and average earnings. Of the
30
active defined benefit plans as of
December 31, 2013
,
5
are at U.S. subsidiaries and the remaining plans are at foreign subsidiaries
.
The following table reconciles the Company’s funded status, both domestic and foreign, as of
December 31, 2013
and
2012
:
|
December 31,
|
||||||||||||||||
|
2013
|
2012
|
|||||||||||||||
|
U.S.
|
Foreign
|
U.S.
|
Foreign
|
|||||||||||||
|
(in millions)
|
||||||||||||||||
|
CHANGE IN PROJECTED BENEFIT OBLIGATION:
|
||||||||||||||||
|
Benefit obligation as of January 1
|
$
|
1,210
|
|
$
|
6,768
|
|
$
|
1,044
|
|
$
|
5,761
|
|
||||
|
Service cost
|
16
|
|
26
|
|
14
|
|
18
|
|
||||||||
|
Interest cost
|
46
|
|
515
|
|
48
|
|
509
|
|
||||||||
|
Employee contributions
|
—
|
|
4
|
|
—
|
|
5
|
|
||||||||
|
Plan amendments
|
—
|
|
—
|
|
7
|
|
1
|
|
||||||||
|
Plan settlements
|
—
|
|
—
|
|
(1
|
)
|
(2
|
)
|
||||||||
|
Benefits paid
|
(75
|
)
|
(407
|
)
|
(51
|
)
|
(431
|
)
|
||||||||
|
Assumption of a plan due to the resolution of bankruptcy proceedings
(1)
|
—
|
|
—
|
|
51
|
|
—
|
|
||||||||
|
Actuarial (gain) loss
|
(138
|
)
|
(1,436
|
)
|
98
|
|
1,412
|
|
||||||||
|
Effect of foreign currency exchange rate changes
|
—
|
|
(721
|
)
|
—
|
|
(505
|
)
|
||||||||
|
Benefit obligation as of December 31
|
$
|
1,059
|
|
$
|
4,749
|
|
$
|
1,210
|
|
$
|
6,768
|
|
||||
|
CHANGE IN PLAN ASSETS:
|
||||||||||||||||
|
Fair value of plan assets as of January 1
|
$
|
883
|
|
$
|
4,712
|
|
$
|
762
|
|
$
|
4,400
|
|
||||
|
Actual return on plan assets
|
81
|
|
(345
|
)
|
97
|
|
944
|
|
||||||||
|
Employer contributions
|
52
|
|
160
|
|
49
|
|
161
|
|
||||||||
|
Employee contributions
|
—
|
|
4
|
|
—
|
|
5
|
|
||||||||
|
Plan settlements
|
—
|
|
—
|
|
(1
|
)
|
(2
|
)
|
||||||||
|
Benefits paid
|
(75
|
)
|
(407
|
)
|
(51
|
)
|
(431
|
)
|
||||||||
|
Assumption of a plan due to the resolution of bankruptcy proceedings
(1)
|
—
|
|
—
|
|
27
|
|
—
|
|
||||||||
|
Effect of foreign currency exchange rate changes
|
—
|
|
(519
|
)
|
—
|
|
(365
|
)
|
||||||||
|
Fair value of plan assets as of December 31
|
$
|
941
|
|
$
|
3,605
|
|
$
|
883
|
|
$
|
4,712
|
|
||||
|
RECONCILIATION OF FUNDED STATUS
|
||||||||||||||||
|
Funded status as of December 31
|
$
|
(118
|
)
|
$
|
(1,144
|
)
|
$
|
(327
|
)
|
$
|
(2,056
|
)
|
||||
|
(1)
|
The Company assumed the pension plan for AES Eastern Energy on December 28, 2012 as part of the settlement of the bankruptcy proceedings. See Note 23—
Discontinued Operations and Held for Sale Businesses
for further information.
|
155
THE AES CORPORATION
NOTES TO CONSOLIDATED FINANCIAL STATEMENTS—(Continued)
DECEMBER 31, 2013, 2012, AND 2011
The following table summarizes the amounts recognized on the Consolidated Balance Sheets related to the funded status of the plans, both domestic and foreign, as of
December 31, 2013
and
2012
:
|
2013
|
2012
|
|||||||||||||||
|
U.S.
|
Foreign
|
U.S.
|
Foreign
|
|||||||||||||
|
(in millions)
|
||||||||||||||||
|
AMOUNTS RECOGNIZED ON THE
|
||||||||||||||||
|
CONSOLIDATED BALANCE SHEETS
|
||||||||||||||||
|
Noncurrent assets
|
$
|
—
|
|
$
|
23
|
|
$
|
—
|
|
$
|
—
|
|
||||
|
Accrued benefit liability—current
|
—
|
|
(4
|
)
|
—
|
|
(3
|
)
|
||||||||
|
Accrued benefit liability—noncurrent
|
(118
|
)
|
(1,163
|
)
|
(327
|
)
|
(2,053
|
)
|
||||||||
|
Net amount recognized at end of year
|
$
|
(118
|
)
|
$
|
(1,144
|
)
|
$
|
(327
|
)
|
$
|
(2,056
|
)
|
||||
The following table summarizes the Company’s accumulated benefit obligation, both domestic and foreign, as of December 31, 2013 and
2012
:
|
2013
|
2012
|
||||||||||||||||
|
U.S.
|
Foreign
|
U.S.
|
Foreign
|
||||||||||||||
|
(in millions)
|
|||||||||||||||||
|
Accumulated Benefit Obligation
|
$
|
1,036
|
|
$
|
4,686
|
|
$
|
1,180
|
|
$
|
6,662
|
|
|||||
|
Information for pension plans with an accumulated benefit obligation in excess of plan assets:
|
|||||||||||||||||
|
Projected benefit obligation
|
$
|
1,059
|
|
$
|
4,412
|
|
$
|
1,210
|
|
$
|
6,398
|
|
|||||
|
Accumulated benefit obligation
|
1,036
|
|
4,366
|
|
1,180
|
|
6,319
|
|
|||||||||
|
Fair value of plan assets
|
941
|
|
3,246
|
|
883
|
|
4,360
|
|
|||||||||
|
Information for pension plans with a projected benefit obligation in excess of plan assets:
|
|||||||||||||||||
|
Projected benefit obligation
|
$
|
1,059
|
|
$
|
4,425
|
|
(1)
|
$
|
1,210
|
|
$
|
6,768
|
|
||||
|
Fair value of plan assets
|
941
|
|
3,259
|
|
(1)
|
883
|
|
4,712
|
|
||||||||
|
(1)
|
$1.1 billion
of the total net unfunded projected benefit obligation is due to Eletropaulo in Brazil.
|
The table below summarizes the significant weighted average assumptions used in the calculation of benefit obligation and net periodic benefit cost, both domestic and foreign, as of December 31,
2013
and
2012
:
|
2013
|
2012
|
||||||||||||
|
U.S.
|
Foreign
|
U.S.
|
Foreign
|
||||||||||
|
Benefit Obligation:
|
|||||||||||||
|
Discount rates
|
4.89
|
%
|
10.80
|
%
|
(2)
|
3.86
|
%
|
8.28
|
%
|
(2)
|
|||
|
Rates of compensation increase
|
3.94
|
%
|
(1)
|
6.44
|
%
|
3.94
|
%
|
(1)
|
6.47
|
%
|
|||
|
Periodic Benefit Cost:
|
|||||||||||||
|
Discount rate
|
3.86
|
%
|
8.28
|
%
|
4.67
|
%
|
9.54
|
%
|
|||||
|
Expected long-term rate of return on plan assets
|
7.15
|
%
|
11.16
|
%
|
7.28
|
%
|
10.81
|
%
|
|||||
|
Rate of compensation increase
|
3.94
|
%
|
(1)
|
6.47
|
%
|
3.94
|
%
|
(1)
|
5.99
|
%
|
|||
|
(1)
|
A U.S. subsidiary of the Company has a defined benefit obligation of
$651 million
and
$764 million
as of December 31, 2013 and
2012
, respectively, and uses salary bands to determine future benefit costs rather than rates of compensation increases. Rates of compensation increases in the table above do not include amounts related to this specific defined benefit plan.
|
|
(2)
|
Includes an inflation factor that is used to calculate future periodic benefit cost, but is not used to calculate the benefit obligation.
|
The Company establishes its estimated long-term return on plan assets considering various factors, which include the targeted asset allocation percentages, historic returns and expected future returns.
The measurement of pension obligations, costs and liabilities is dependent on a variety of assumptions. These assumptions include estimates of the present value of projected future pension payments to all plan participants, taking into consideration the likelihood of potential future events such as salary increases and demographic experience. These assumptions may have an effect on the amount and timing of future contributions.
The assumptions used in developing the required estimates include the following key factors:
|
•
|
discount rates;
|
156
THE AES CORPORATION
NOTES TO CONSOLIDATED FINANCIAL STATEMENTS—(Continued)
DECEMBER 31, 2013, 2012, AND 2011
|
•
|
salary growth;
|
|
•
|
retirement rates;
|
|
•
|
inflation;
|
|
•
|
expected return on plan assets; and
|
|
•
|
mortality rates.
|
The effects of actual results differing from the Company’s assumptions are accumulated and amortized over future periods and, therefore, generally affect the Company’s recognized expense in such future periods.
Sensitivity of the Company’s pension funded status to the indicated increase or decrease in the discount rate and long-term rate of return on plan assets assumptions is shown below. Note that these sensitivities may be asymmetric and are specific to the base conditions at year-end 2013. They also may not be additive, so the impact of changing multiple factors simultaneously cannot be calculated by combining the individual sensitivities shown. The funded status as of December 31,
2013
is affected by the assumptions as of that date. Pension expense for
2013
is affected by the December 31,
2012
assumptions. The impact on pension expense from a one percentage point change in these assumptions is shown in the table below (in millions):
|
Increase of 1% in the discount rate
|
$
|
(59
|
)
|
|
|
Decrease of 1% in the discount rate
|
48
|
|
||
|
Increase of 1% in the long-term rate of return on plan assets
|
(52
|
)
|
||
|
Decrease of 1% in the long-term rate of return on plan assets
|
52
|
|
||
The following table summarizes the components of the net periodic benefit cost, both domestic and foreign, for the years ended December 31,
2013
,
2012
, and
2011
:
|
2013
|
2012
|
2011
|
||||||||||||||||||||||
|
Components of Net Periodic Benefit Cost:
|
U.S.
|
Foreign
|
U.S.
|
Foreign
|
U.S.
|
Foreign
|
||||||||||||||||||
|
(in millions)
|
||||||||||||||||||||||||
|
Service cost
|
$
|
16
|
|
$
|
26
|
|
$
|
14
|
|
$
|
18
|
|
$
|
8
|
|
$
|
18
|
|
||||||
|
Interest cost
|
46
|
|
515
|
|
48
|
|
509
|
|
33
|
|
564
|
|
||||||||||||
|
Expected return on plan assets
|
(64
|
)
|
(484
|
)
|
(55
|
)
|
(444
|
)
|
(33
|
)
|
(509
|
)
|
||||||||||||
|
Amortization of prior service cost
|
5
|
|
—
|
|
4
|
|
—
|
|
4
|
|
—
|
|
||||||||||||
|
Amortization of net loss
|
23
|
|
77
|
|
19
|
|
38
|
|
13
|
|
22
|
|
||||||||||||
|
Loss on curtailment
|
—
|
|
—
|
|
—
|
|
—
|
|
—
|
|
5
|
|
||||||||||||
|
Settlement gain recognized
|
—
|
|
—
|
|
—
|
|
1
|
|
—
|
|
—
|
|
||||||||||||
|
Total pension cost
|
$
|
26
|
|
$
|
134
|
|
$
|
30
|
|
$
|
122
|
|
$
|
25
|
|
$
|
100
|
|
||||||
The following table summarizes the amounts reflected in Accumulated Other Comprehensive Loss, including accumulated other comprehensive loss attributable to noncontrolling interests, on the Consolidated Balance Sheet as of December 31,
2013
, that have not yet been recognized as components of net periodic benefit cost and amounts expected to be reclassified to earnings in the next fiscal year:
|
December 31, 2013
|
||||||||||||||||
|
Accumulated Other
Comprehensive Income (Loss)
|
Amounts expected to be reclassified to earnings in next fiscal year
|
|||||||||||||||
|
U.S.
|
Foreign
|
U.S.
|
Foreign
|
|||||||||||||
|
(in millions)
|
||||||||||||||||
|
Prior service cost
|
$
|
—
|
|
$
|
(1
|
)
|
$
|
—
|
|
$
|
—
|
|
||||
|
Unrecognized net actuarial gain (loss)
|
20
|
|
(998
|
)
|
—
|
|
(37
|
)
|
||||||||
|
Total
|
$
|
20
|
|
$
|
(999
|
)
|
$
|
—
|
|
$
|
(37
|
)
|
||||
157
THE AES CORPORATION
NOTES TO CONSOLIDATED FINANCIAL STATEMENTS—(Continued)
DECEMBER 31, 2013, 2012, AND 2011
The following table summarizes the Company’s target allocation for 2013 and pension plan asset allocation, both domestic and foreign, as of December 31, 2013 and
2012
:
|
Percentage of Plan Assets as of December 31,
|
|||||||||||||||||
|
Target Allocations
|
2013
|
2012
|
|||||||||||||||
|
Asset Category
|
U.S.
|
Foreign
|
U.S.
|
Foreign
|
U.S.
|
Foreign
|
|||||||||||
|
Equity securities
|
45
|
%
|
15% - 29%
|
37.09
|
%
|
19.84
|
%
|
32.28
|
%
|
19.76
|
%
|
||||||
|
Debt securities
|
51
|
%
|
60% - 85%
|
46.97
|
%
|
75.32
|
%
|
46.66
|
%
|
76.21
|
%
|
||||||
|
Real estate
|
2
|
%
|
0% - 4%
|
2.44
|
%
|
2.77
|
%
|
—
|
%
|
2.57
|
%
|
||||||
|
Other
|
2
|
%
|
0% - 6%
|
13.50
|
%
|
2.07
|
%
|
21.06
|
%
|
1.46
|
%
|
||||||
|
Total pension assets
|
100.00
|
%
|
100.00
|
%
|
100.00
|
%
|
100.00
|
%
|
|||||||||
The U.S. plans seek to achieve the following long-term investment objectives:
|
•
|
maintenance of sufficient income and liquidity to pay retirement benefits and other lump sum payments;
|
|
•
|
long-term rate of return in excess of the annualized inflation rate;
|
|
•
|
long-term rate of return, net of relevant fees, that meet or exceed the assumed actuarial rate; and
|
|
•
|
long-term competitive rate of return on investments, net of expenses, that is equal to or exceeds various benchmark rates.
|
The asset allocation is reviewed periodically to determine a suitable asset allocation which seeks to manage risk through portfolio diversification and takes into account, among other possible factors, the above-stated objectives, in conjunction with current funding levels, cash flow conditions and economic and industry trends. The following table summarizes the Company’s U.S. plan assets by category of investment and level within the fair value hierarchy as of December 31, 2013 and
2012
:
|
December 31, 2013
|
December 31, 2012
|
|||||||||||||||||||||||||||||||
|
U.S. Plans
|
Level 1
|
Level 2
|
Level 3
|
Total
|
Level 1
|
Level 2
|
Level 3
|
Total
|
||||||||||||||||||||||||
|
(in millions)
|
||||||||||||||||||||||||||||||||
|
Equity securities:
|
||||||||||||||||||||||||||||||||
|
Common stock
|
$
|
46
|
|
$
|
—
|
|
$
|
—
|
|
$
|
46
|
|
$
|
134
|
|
$
|
—
|
|
$
|
—
|
|
$
|
134
|
|
||||||||
|
Mutual funds
|
303
|
|
—
|
|
—
|
|
303
|
|
151
|
|
—
|
|
—
|
|
151
|
|
||||||||||||||||
|
Debt securities:
|
|
|
||||||||||||||||||||||||||||||
|
Government debt securities
|
24
|
|
8
|
|
—
|
|
32
|
|
32
|
|
—
|
|
—
|
|
32
|
|
||||||||||||||||
|
Corporate debt securities
|
—
|
|
159
|
|
—
|
|
159
|
|
4
|
|
149
|
|
—
|
|
153
|
|
||||||||||||||||
|
Mutual funds
(1)
|
251
|
|
—
|
|
—
|
|
251
|
|
227
|
|
—
|
|
—
|
|
227
|
|
||||||||||||||||
|
Real Estate:
|
||||||||||||||||||||||||||||||||
|
Real Estate
|
—
|
|
23
|
|
—
|
|
23
|
|
—
|
|
—
|
|
—
|
|
—
|
|
||||||||||||||||
|
Other:
|
|
|
||||||||||||||||||||||||||||||
|
Cash and cash equivalents
|
56
|
|
—
|
|
—
|
|
56
|
|
43
|
|
—
|
|
—
|
|
43
|
|
||||||||||||||||
|
Other investments
|
40
|
|
31
|
|
—
|
|
71
|
|
38
|
|
105
|
|
—
|
|
143
|
|
||||||||||||||||
|
Total plan assets
|
$
|
720
|
|
$
|
221
|
|
$
|
—
|
|
$
|
941
|
|
$
|
629
|
|
$
|
254
|
|
$
|
—
|
|
$
|
883
|
|
||||||||
|
(1)
|
Mutual funds categorized as debt securities consist of mutual funds for which debt securities are the primary underlying investment.
|
158
THE AES CORPORATION
NOTES TO CONSOLIDATED FINANCIAL STATEMENTS—(Continued)
DECEMBER 31, 2013, 2012, AND 2011
The investment strategy of the foreign plans seeks to maximize return on investment while minimizing risk. The assumed asset allocation has less exposure to equities in order to closely match market conditions and near term forecasts. The following table summarizes the Company’s foreign plan assets by category of investment and level within the fair value hierarchy as of December 31, 2013 and
2012
:
|
December 31, 2013
|
December 31, 2012
|
|||||||||||||||||||||||||||||||
|
Foreign Plans
|
Level 1
|
Level 2
|
Level 3
|
Total
|
Level 1
|
Level 2
|
Level 3
|
Total
|
||||||||||||||||||||||||
|
(in millions)
|
||||||||||||||||||||||||||||||||
|
Equity securities:
|
||||||||||||||||||||||||||||||||
|
Common stock
|
$
|
23
|
|
$
|
—
|
|
$
|
—
|
|
$
|
23
|
|
$
|
28
|
|
$
|
—
|
|
$
|
—
|
|
$
|
28
|
|
||||||||
|
Mutual funds
|
322
|
|
—
|
|
—
|
|
322
|
|
457
|
|
—
|
|
—
|
|
457
|
|
||||||||||||||||
|
Private equity
(1)
|
—
|
|
—
|
|
370
|
|
370
|
|
—
|
|
—
|
|
446
|
|
446
|
|
||||||||||||||||
|
Debt securities:
|
|
|
||||||||||||||||||||||||||||||
|
Certificates of deposit
|
—
|
|
2
|
|
—
|
|
2
|
|
—
|
|
3
|
|
—
|
|
3
|
|
||||||||||||||||
|
Unsecured debentures
|
—
|
|
13
|
|
—
|
|
13
|
|
—
|
|
16
|
|
—
|
|
16
|
|
||||||||||||||||
|
Government debt securities
|
12
|
|
95
|
|
—
|
|
107
|
|
9
|
|
206
|
|
—
|
|
215
|
|
||||||||||||||||
|
Mutual funds
(2)
|
174
|
|
2,410
|
|
—
|
|
2,584
|
|
139
|
|
3,208
|
|
—
|
|
3,347
|
|
||||||||||||||||
|
Other debt securities
|
—
|
|
9
|
|
—
|
|
9
|
|
—
|
|
10
|
|
—
|
|
10
|
|
||||||||||||||||
|
Real estate:
|
|
|
||||||||||||||||||||||||||||||
|
Real estate
(1)
|
—
|
|
—
|
|
100
|
|
100
|
|
—
|
|
—
|
|
121
|
|
121
|
|
||||||||||||||||
|
Other:
|
|
|
||||||||||||||||||||||||||||||
|
Cash and cash equivalents
|
15
|
|
—
|
|
—
|
|
15
|
|
1
|
|
—
|
|
—
|
|
1
|
|
||||||||||||||||
|
Participant loans
(3)
|
—
|
|
—
|
|
60
|
|
60
|
|
—
|
|
—
|
|
68
|
|
68
|
|
||||||||||||||||
|
Total plan assets
|
$
|
546
|
|
$
|
2,529
|
|
$
|
530
|
|
$
|
3,605
|
|
$
|
634
|
|
$
|
3,443
|
|
$
|
635
|
|
$
|
4,712
|
|
||||||||
|
(1)
|
Plan assets of our Brazilian subsidiaries are invested in private equities and commercial real estate through the plan administrator in Brazil. The fair value of these assets is determined using the income approach through annual appraisals based on a discounted cash flow analysis.
|
|
(2)
|
Mutual funds categorized as debt securities consist of mutual funds for which debt securities are the primary underlying investment.
|
|
(3)
|
Loans to participants are stated at cost, which approximates fair value.
|
The following table presents a reconciliation of all plan assets measured at fair value using significant unobservable inputs (Level 3) for the years ended December 31, 2013 and
2012
:
|
2013
|
2012
|
|||||||
|
(in millions)
|
||||||||
|
Balance at January 1
|
$
|
635
|
|
$
|
755
|
|
||
|
Actual return on plan assets:
|
||||||||
|
Returns relating to assets still held at reporting date
|
(26
|
)
|
(64
|
)
|
||||
|
Returns relating to assets sold during the period
|
||||||||
|
Purchases, sales and settlements, net
|
—
|
|
3
|
|
||||
|
Change due to exchange rate changes
|
(79
|
)
|
(59
|
)
|
||||
|
Balance at December 31
|
$
|
530
|
|
$
|
635
|
|
||
The following table summarizes the estimated cash flows for U.S. and foreign expected employer contributions and expected future benefit payments, both domestic and foreign:
|
U.S.
|
Foreign
|
|||||||
|
(in millions)
|
||||||||
|
Expected employer contribution in 2014
|
$
|
56
|
|
$
|
167
|
|
||
|
Expected benefit payments for fiscal year ending:
|
||||||||
|
2014
|
62
|
|
381
|
|
||||
|
2015
|
63
|
|
396
|
|
||||
|
2016
|
64
|
|
409
|
|
||||
|
2017
|
66
|
|
425
|
|
||||
|
2018
|
67
|
|
440
|
|
||||
|
2019 - 2023
|
361
|
|
2,437
|
|
||||
159
THE AES CORPORATION
NOTES TO CONSOLIDATED FINANCIAL STATEMENTS—(Continued)
DECEMBER 31, 2013, 2012, AND 2011
16. EQUITY
Equity Transactions with Noncontrolling Interests
During the year ended December 31, 2013, the Company completed transactions which increased noncontrolling interests in Alto Maipo and Cochrane,
two
projects under development in Chile. Although there was a decrease in the Company's ownership interest, the Company retained control of both projects, which continue to be accounted for as consolidated subsidiaries. The difference between the fair value of the consideration received for these transactions and the corresponding adjustment to noncontrolling interest of
$16 million
was recognized as an equity transaction through Additional Paid-in Capital.
The following table summarizes the net income (loss) attributable to The AES Corporation and all transfers (to) from noncontrolling interests for the years ended December 31,
2013
and
2012
.
|
2013
|
2012
|
|||||||
|
(in millions)
|
||||||||
|
Net income (loss) attributable to The AES Corporation
|
$
|
114
|
|
$
|
(912
|
)
|
||
|
Transfers (to) from the noncontrolling interest:
|
||||||||
|
Net increase in The AES Corporation's paid-in capital for sale of subsidiary shares
|
16
|
|
7
|
|
||||
|
Increase (decrease) in The AES Corporation's paid-in capital for purchase of subsidiary shares
|
(6
|
)
|
4
|
|
||||
|
Net transfers (to) from noncontrolling interest
|
10
|
|
11
|
|
||||
|
Change from net income attributable to The AES Corporation and transfers (to) from noncontrolling interests
|
$
|
124
|
|
$
|
(901
|
)
|
||
Accumulated Other Comprehensive Loss
The changes in accumulated other comprehensive loss by component, net of tax and noncontrolling interests for the
year ended
December 31, 2013
were as follows:
|
Unrealized
derivative
losses, net
|
Unfunded
pension
obligations, net
|
Available for sale securities, net
|
Foreign currency
translation
adjustment, net
|
Total
|
||||||||||||||||
|
(in millions)
|
||||||||||||||||||||
|
Balance at January 1
|
$
|
(481
|
)
|
$
|
(382
|
)
|
$
|
—
|
|
$
|
(2,057
|
)
|
$
|
(2,920
|
)
|
|||||
|
Other comprehensive income before reclassifications
|
46
|
|
78
|
|
(1
|
)
|
(263
|
)
|
(140
|
)
|
||||||||||
|
Amounts reclassified from accumulated other comprehensive loss
|
128
|
|
13
|
|
1
|
|
36
|
|
178
|
|
||||||||||
|
Net current-period other comprehensive income
|
174
|
|
91
|
|
—
|
|
(227
|
)
|
38
|
|
||||||||||
|
Balance at December 31
|
$
|
(307
|
)
|
$
|
(291
|
)
|
$
|
—
|
|
$
|
(2,284
|
)
|
$
|
(2,882
|
)
|
|||||
160
THE AES CORPORATION
NOTES TO CONSOLIDATED FINANCIAL STATEMENTS—(Continued)
DECEMBER 31, 2013, 2012, AND 2011
Reclassifications out of accumulated other comprehensive loss for the
year ended
December 31, 2013
were as follows:
|
Details About Accumulated Other Comprehensive Loss Components
|
Affected Line Item in the Consolidated Statement of Operations
|
Year Ended December 31, 2013
(1)
|
||||
|
(in millions)
|
||||||
|
Unrealized derivative losses, net
|
||||||
|
Non-regulated revenue
|
$
|
(3
|
)
|
|||
|
Non-regulated cost of sales
|
(7
|
)
|
||||
|
Interest expense
|
(137
|
)
|
||||
|
Gain on sale of investments
|
(21
|
)
|
||||
|
Foreign currency transaction gains (losses)
|
(6
|
)
|
||||
|
Income from continuing operations before taxes and equity in earnings of affiliates
|
(174
|
)
|
||||
|
Income tax expense
|
41
|
|
||||
|
Net equity in earnings of affiliates
|
(6
|
)
|
||||
|
Income from continuing operations
|
(139
|
)
|
||||
|
Income from continuing operations attributable to noncontrolling interests
|
11
|
|
||||
|
Net income attributable to The AES Corporation
|
$
|
(128
|
)
|
|||
|
Amortization of defined benefit pension actuarial loss, net
|
||||||
|
Regulated cost of sales
|
$
|
(73
|
)
|
|||
|
Non-regulated cost of sales
|
(4
|
)
|
||||
|
General and administrative expenses
|
(1
|
)
|
||||
|
Income from continuing operations before taxes and equity in earnings of affiliates
|
(78
|
)
|
||||
|
Income tax expense
|
26
|
|
||||
|
Income from continuing operations
|
(52
|
)
|
||||
|
Income from continuing operations attributable to noncontrolling interests
|
39
|
|
||||
|
Net income attributable to The AES Corporation
|
$
|
(13
|
)
|
|||
|
Available-for-sale securities, net
|
||||||
|
Interest income
|
$
|
(1
|
)
|
|||
|
Net income attributable to The AES Corporation
|
$
|
(1
|
)
|
|||
|
Foreign currency translation adjustment, net
|
||||||
|
Gain on sale of investments
|
$
|
(1
|
)
|
|||
|
Net loss from disposal and impairments of discontinued businesses
|
(35
|
)
|
||||
|
Net income attributable to The AES Corporation
|
$
|
(36
|
)
|
|||
|
Total reclassifications for the period, net of income tax and noncontrolling interests
|
$
|
(178
|
)
|
|||
_____________________________
|
(1)
|
Amounts in parentheses indicate debits to the consolidated statement of operations.
|
Dividend
On November 4, 2013, the Board of Directors of the Company declared a quarterly common stock dividend of
$0.05
per share payable on February 18, 2014 to shareholders of record at the close of business on February 3, 2014.
Stock Repurchase Program
On December 11, 2013, the Board of Directors (the “Board”) of the Company increased the size of the common stock repurchase program (the “Program”) by authorizing the repurchase of up to an additional
$211 million
of the Company’s common stock, leaving approximately
$450 million
available for purchases of the Company’s common stock in one or more transactions, including through open-market repurchases, Rule 10b5-1 plans and privately negotiated transactions. There can be no assurances as to the amount, timing or prices of repurchases, which may vary based on market conditions and other factors. The Program does not have an expiration date and it can be modified or terminated by the Company’s Board at any time.
On December 18, 2013, the Company completed the underwritten secondary public offering (the “Offering”) of
46,000,000
shares (the “Offered Shares”) of its common stock by the Terrific Investment Corporation (the “Selling Stockholder”), a subsidiary controlled by China Investment Corporation at a price of
$13.45
per share. The Offered Shares included the full exercise of the underwriters’ option to purchase up to
6,000,000
additional shares of the Company’s common stock to cover over-allotments, which option was exercised in full by the underwriters on December 13, 2013. The Company did not receive any of the proceeds from the Offering. Also, on December 18, 2013, the Company completed the repurchase of
20 million
shares of its common stock from the Selling Stockholder at a price per share of
$12.912
for an aggregate purchase price of
$258 million
.
161
THE AES CORPORATION
NOTES TO CONSOLIDATED FINANCIAL STATEMENTS—(Continued)
DECEMBER 31, 2013, 2012, AND 2011
During the year ended
December 31, 2013
, shares of common stock repurchased under the Program (including the
20 million
share repurchase in December referenced above) totaled
25,297,042
at a total cost of
$322 million
. The cumulative purchases under the Program totaled
94,728,430
shares at a total cost of
$1.1 billion
, which includes a nominal amount of commissions (average price per share of
$12.10
, including commissions). As of
December 31, 2013
,
$191 million
was available under the Program.
The common stock repurchased has been classified as treasury stock and accounted for using the cost method. A total of
90,808,168
and
66,415,984
shares were held as treasury stock at
December 31, 2013
and
2012
, respectively. Restricted stock units under the Company’s employee benefit plans are issued from treasury stock. The Company has not retired any common stock repurchased since it began the Program in July 2010.
17. SEGMENTS AND GEORGRAPHIC INFORMATION
The segment reporting structure uses the Company’s management reporting structure as its foundation to reflect how the Company manages the business internally and is organized by geographic regions which provide better socio-political-economic understanding of our business. In 2012, the management reporting structure was re-organized along
six
strategic business units (“SBUs”) — led by our Chief Executive Officer (“CEO”). During the fourth quarter of 2013, in conjunction with finalization of its reporting structure, the Company revised its internal reporting to align more closely with its operations. As a result, the Company applied the accounting guidance for segment reporting and determined that its reportable segments have changed and are now aligned with the six SBUs. All prior-period results have been retrospectively revised to reflect the new segment reporting structure. The Company has decreased from
nine
to the following
six
reportable segments based on the
six
SBUs:
|
•
|
US SBU;
|
|
•
|
Andes SBU;
|
|
•
|
Brazil SBU;
|
|
•
|
MCAC SBU;
|
|
•
|
EMEA SBU; and
|
|
•
|
Asia SBU
|
Corporate and Other
— Silver Ridge Power (formerly AES Solar Holding Company) and certain other unconsolidated businesses are accounted for using the equity method of accounting; therefore, their operating results are included in “Net Equity in Earnings of Affiliates” on the face of the Consolidated Statements of Operations, not in revenue or Adjusted pre-tax contribution (“Adjusted PTC”). “Corporate and Other” also includes corporate overhead costs which are not directly associated with the operations of our
six
reportable segments and other intercompany charges such as self-insurance premiums which are fully eliminated in consolidation.
The Company uses Adjusted PTC as its primary segment performance measure. Adjusted PTC, a non-GAAP measure, is defined by the Company as pre-tax income from continuing operations attributable to AES excluding unrealized gains or losses related to derivative transactions, unrealized foreign currency gains or losses, gains or losses due to dispositions and acquisitions of business interests, losses due to impairments and costs due to the early retirement of debt. For the year ended
December 31, 2013
, the Company changed the definition of Adjusted PTC to exclude the gains or losses attributable to AES common stockholders at our equity method investments for these same types of items. Previously, these amounts were not excluded from the calculation of Adjusted PTC. Accordingly, the Company has also reflected the change in the comparative year ended
December 31, 2012
. The Company has concluded that Adjusted PTC best reflects the underlying business performance of the Company and is the most relevant measure considered in the Company’s internal evaluation of the financial performance of its segments. Additionally, given its large number of businesses and complexity, the Company concluded that Adjusted PTC is a more transparent measure that better assists the investor in determining which businesses have the greatest impact on the overall Company results.
Total revenue includes inter-segment revenue primarily related to the sale of coal between Andes and the US. No material inter-segment revenue relationships exist between other segments. Corporate allocations include certain self-insurance activities which are reflected within segment adjusted PTC. All intra-segment activity has been eliminated with respect to revenue and adjusted PTC within the segment. Inter-segment activity has been eliminated within the total consolidated results. Asset information for businesses that were discontinued or classified as held-for-sale as of
December 31, 2013
is segregated and is shown in the line “Discontinued businesses” in the accompanying segment tables.
162
THE AES CORPORATION
NOTES TO CONSOLIDATED FINANCIAL STATEMENTS—(Continued)
DECEMBER 31, 2013, 2012, AND 2011
Information about the Company’s operations by segment for the years ended
December 31, 2013
,
2012
and
2011
was as follows:
|
Revenue
Year Ended December 31,
|
Total Revenue
|
Intersegment
|
External Revenue
|
|||||||||||||||||||||||||||||||||
|
2013
|
2012
|
2011
|
2013
|
2012
|
2011
|
2013
|
2012
|
2011
|
||||||||||||||||||||||||||||
|
(in millions)
|
||||||||||||||||||||||||||||||||||||
|
US SBU
|
$
|
3,630
|
|
$
|
3,736
|
|
$
|
2,088
|
|
$
|
—
|
|
$
|
—
|
|
$
|
(1
|
)
|
$
|
3,630
|
|
$
|
3,736
|
|
$
|
2,087
|
|
|||||||||
|
Andes SBU
|
2,639
|
|
3,020
|
|
2,989
|
|
(1
|
)
|
(33
|
)
|
(36
|
)
|
2,638
|
|
2,987
|
|
2,953
|
|
||||||||||||||||||
|
Brazil SBU
|
5,015
|
|
5,788
|
|
6,640
|
|
—
|
|
—
|
|
—
|
|
5,015
|
|
5,788
|
|
6,640
|
|
||||||||||||||||||
|
MCAC SBU
|
2,713
|
|
2,573
|
|
2,327
|
|
(1
|
)
|
—
|
|
(3
|
)
|
2,712
|
|
2,573
|
|
2,324
|
|
||||||||||||||||||
|
EMEA SBU
|
1,347
|
|
1,344
|
|
1,469
|
|
—
|
|
(1
|
)
|
(2
|
)
|
1,347
|
|
1,343
|
|
1,467
|
|
||||||||||||||||||
|
Asia SBU
|
550
|
|
733
|
|
625
|
|
—
|
|
—
|
|
—
|
|
550
|
|
733
|
|
625
|
|
||||||||||||||||||
|
Corporate and Other
|
7
|
|
9
|
|
8
|
|
(8
|
)
|
(5
|
)
|
(6
|
)
|
(1
|
)
|
4
|
|
2
|
|
||||||||||||||||||
|
Total Revenue
|
$
|
15,901
|
|
$
|
17,203
|
|
$
|
16,146
|
|
$
|
(10
|
)
|
$
|
(39
|
)
|
$
|
(48
|
)
|
$
|
15,891
|
|
$
|
17,164
|
|
$
|
16,098
|
|
|||||||||
|
Adjusted Pre-Tax Contribution
(1)
Year Ended December 31,
|
Total Adjusted
Pre-tax Contribution
|
Intersegment
|
External Adjusted
Pre-tax Contribution
|
||||||||||||||||||||||||||||||||
|
2013
|
2012
|
2011
|
2013
|
2012
|
2011
|
2013
|
2012
|
2011
|
|||||||||||||||||||||||||||
|
(in millions)
|
|||||||||||||||||||||||||||||||||||
|
US SBU
|
$
|
440
|
|
$
|
403
|
|
181
|
|
$
|
11
|
|
$
|
40
|
|
53
|
|
$
|
451
|
|
$
|
443
|
|
$
|
234
|
|
||||||||||
|
Andes SBU
|
353
|
|
369
|
|
510
|
|
19
|
|
(16
|
)
|
(32
|
)
|
372
|
|
353
|
|
478
|
|
|||||||||||||||||
|
Brazil SBU
|
212
|
|
321
|
|
415
|
|
3
|
|
3
|
|
3
|
|
215
|
|
324
|
|
418
|
|
|||||||||||||||||
|
MCAC SBU
|
339
|
|
387
|
|
307
|
|
12
|
|
10
|
|
3
|
|
351
|
|
397
|
|
310
|
|
|||||||||||||||||
|
EMEA SBU
|
345
|
|
375
|
|
276
|
|
7
|
|
(2
|
)
|
12
|
|
352
|
|
373
|
|
288
|
|
|||||||||||||||||
|
Asia SBU
|
142
|
|
201
|
|
100
|
|
2
|
|
2
|
|
2
|
|
144
|
|
203
|
|
102
|
|
|||||||||||||||||
|
Corporate and Other
|
(624
|
)
|
(717
|
)
|
(650
|
)
|
(54
|
)
|
(37
|
)
|
(41
|
)
|
(678
|
)
|
(754
|
)
|
(691
|
)
|
|||||||||||||||||
|
Total Adjusted Pre-Tax Contribution
|
1,207
|
|
1,339
|
|
1,139
|
|
—
|
|
—
|
|
—
|
|
1,207
|
|
1,339
|
|
1,139
|
|
|||||||||||||||||
|
Reconciliation to Income from Continuing Operations before Taxes and Equity Earnings of Affiliates:
|
||||||||||||
|
Non-GAAP Adjustments:
|
||||||||||||
|
Unrealized derivative gains (losses)
|
57
|
|
(120
|
)
|
31
|
|
||||||
|
Unrealized foreign currency gains (losses)
|
(41
|
)
|
13
|
|
(50
|
)
|
||||||
|
Disposition/acquisition gains
|
30
|
|
206
|
|
—
|
|
||||||
|
Impairment losses
|
(588
|
)
|
(1,951
|
)
|
(337
|
)
|
||||||
|
Loss on extinguishment of debt
|
(225
|
)
|
(16
|
)
|
(46
|
)
|
||||||
|
Pre-tax contribution
|
440
|
|
(529
|
)
|
737
|
|
||||||
|
Add: income from continuing operations before taxes, attributable to noncontrolling interests
|
633
|
|
794
|
|
1,521
|
|
||||||
|
Less: Net equity in earnings (losses) of affiliates
|
25
|
|
35
|
|
(2
|
)
|
||||||
|
Income from continuing operations before taxes and equity in earnings of affiliates
|
$
|
1,048
|
|
$
|
230
|
|
$
|
2,260
|
|
|||
_____________________________
|
(1)
|
Adjusted pre-tax contribution in each segment before intersegment eliminations includes the effect of intercompany transactions with other segments except for interest, charges for certain management fees and the write-off of intercompany balances.
|
Assets by segment as of
December 31, 2013
,
2012
and
2011
were as follows:
|
Total Assets
|
Depreciation and Amortization
|
Capital Expenditures
|
||||||||||||||||||||||||||||||||||
|
2013
|
2012
|
2011
|
2013
|
2012
|
2011
|
2013
|
2012
|
2011
|
||||||||||||||||||||||||||||
|
(in millions)
|
||||||||||||||||||||||||||||||||||||
|
US SBU
|
$
|
9,952
|
|
$
|
10,651
|
|
$
|
12,714
|
|
$
|
440
|
|
$
|
518
|
|
$
|
300
|
|
$
|
426
|
|
$
|
405
|
|
$
|
406
|
|
|||||||||
|
Andes SBU
|
7,356
|
|
6,619
|
|
6,482
|
|
186
|
|
174
|
|
151
|
|
471
|
|
389
|
|
385
|
|
||||||||||||||||||
|
Brazil SBU
|
8,388
|
|
9,710
|
|
10,602
|
|
259
|
|
281
|
|
331
|
|
588
|
|
718
|
|
738
|
|
||||||||||||||||||
|
MCAC SBU
|
5,075
|
|
5,030
|
|
4,962
|
|
145
|
|
136
|
|
116
|
|
111
|
|
192
|
|
220
|
|
||||||||||||||||||
|
EMEA SBU
|
4,191
|
|
4,085
|
|
4,086
|
|
155
|
|
145
|
|
159
|
|
341
|
|
162
|
|
196
|
|
||||||||||||||||||
|
Asia SBU
|
2,810
|
|
2,587
|
|
1,800
|
|
33
|
|
30
|
|
32
|
|
576
|
|
221
|
|
150
|
|
||||||||||||||||||
|
Discontinued businesses
|
1,718
|
|
1,960
|
|
3,445
|
|
55
|
|
85
|
|
148
|
|
52
|
|
143
|
|
335
|
|
||||||||||||||||||
|
Corporate and Other & eliminations
|
921
|
|
1,188
|
|
1,255
|
|
21
|
|
25
|
|
25
|
|
14
|
|
40
|
|
31
|
|
||||||||||||||||||
|
Total Assets
|
$
|
40,411
|
|
$
|
41,830
|
|
$
|
45,346
|
|
$
|
1,294
|
|
$
|
1,394
|
|
$
|
1,262
|
|
$
|
2,579
|
|
$
|
2,270
|
|
$
|
2,461
|
|
|||||||||
163
THE AES CORPORATION
NOTES TO CONSOLIDATED FINANCIAL STATEMENTS—(Continued)
DECEMBER 31, 2013, 2012, AND 2011
|
Interest Income
|
Interest Expense
|
|||||||||||||||||||||||
|
2013
|
2012
|
2011
|
2013
|
2012
|
2011
|
|||||||||||||||||||
|
(in millions)
|
||||||||||||||||||||||||
|
US SBU
|
$
|
—
|
|
$
|
3
|
|
$
|
1
|
|
$
|
290
|
|
$
|
291
|
|
$
|
194
|
|
||||||
|
Andes SBU
|
37
|
|
20
|
|
20
|
|
135
|
|
128
|
|
126
|
|
||||||||||||
|
Brazil SBU
|
210
|
|
278
|
|
346
|
|
364
|
|
305
|
|
452
|
|
||||||||||||
|
MCAC SBU
|
20
|
|
33
|
|
22
|
|
138
|
|
192
|
|
166
|
|
||||||||||||
|
EMEA SBU
|
2
|
|
8
|
|
5
|
|
80
|
|
94
|
|
108
|
|
||||||||||||
|
Asia SBU
|
6
|
|
5
|
|
2
|
|
30
|
|
43
|
|
46
|
|
||||||||||||
|
Corporate and Other & eliminations
|
—
|
|
1
|
|
2
|
|
445
|
|
491
|
|
438
|
|
||||||||||||
|
Total
|
$
|
275
|
|
$
|
348
|
|
$
|
398
|
|
$
|
1,482
|
|
$
|
1,544
|
|
$
|
1,530
|
|
||||||
|
Investments in and Advances to Affiliates
|
Equity in Earnings (Losses)
|
|||||||||||||||||||||||
|
2013
|
2012
|
2011
|
2013
|
2012
|
2011
|
|||||||||||||||||||
|
(in millions)
|
||||||||||||||||||||||||
|
US SBU
|
$
|
1
|
|
$
|
—
|
|
$
|
—
|
|
$
|
—
|
|
$
|
—
|
|
$
|
—
|
|
||||||
|
Andes SBU
|
248
|
|
198
|
|
188
|
|
44
|
|
18
|
|
35
|
|
||||||||||||
|
Brazil SBU
|
—
|
|
—
|
|
—
|
|
—
|
|
—
|
|
—
|
|
||||||||||||
|
MCAC SBU
|
—
|
|
24
|
|
19
|
|
4
|
|
5
|
|
(2
|
)
|
||||||||||||
|
EMEA SBU
|
286
|
|
454
|
|
512
|
|
(5
|
)
|
8
|
|
10
|
|
||||||||||||
|
Asia SBU
|
186
|
|
202
|
|
367
|
|
10
|
|
32
|
|
5
|
|
||||||||||||
|
Corporate and Other & eliminations
|
289
|
|
318
|
|
336
|
|
(28
|
)
|
(28
|
)
|
(50
|
)
|
||||||||||||
|
Total
|
$
|
1,010
|
|
$
|
1,196
|
|
$
|
1,422
|
|
$
|
25
|
|
$
|
35
|
|
$
|
(2
|
)
|
||||||
The table below presents information, by country, about the Company’s consolidated operations for each of the three years in the period ended
December 31, 2013
and as of
December 31, 2013
and
2012
, respectively. Revenue is recorded in the country in which it is earned and assets are recorded in the country in which they are located.
|
Revenue
|
Property, Plant & Equipment, net
|
|||||||||||||||||||
|
2013
|
2012
|
2011
|
2013
|
2012
|
||||||||||||||||
|
(in millions)
|
||||||||||||||||||||
|
United States
(1)
|
$
|
3,630
|
|
$
|
3,736
|
|
$
|
2,088
|
|
$
|
7,523
|
|
$
|
7,540
|
|
|||||
|
Non-U.S.:
|
||||||||||||||||||||
|
Brazil
(2)
|
5,015
|
|
5,788
|
|
6,640
|
|
5,293
|
|
5,756
|
|
||||||||||
|
Chile
|
1,569
|
|
1,679
|
|
1,608
|
|
3,312
|
|
2,993
|
|
||||||||||
|
El Salvador
|
860
|
|
854
|
|
755
|
|
292
|
|
284
|
|
||||||||||
|
Dominican Republic
|
832
|
|
761
|
|
674
|
|
689
|
|
670
|
|
||||||||||
|
United Kingdom
|
558
|
|
505
|
|
587
|
|
603
|
|
578
|
|
||||||||||
|
Argentina
(3)
|
545
|
|
857
|
|
979
|
|
256
|
|
278
|
|
||||||||||
|
Colombia
|
523
|
|
453
|
|
365
|
|
412
|
|
383
|
|
||||||||||
|
Philippines
|
497
|
|
559
|
|
480
|
|
776
|
|
800
|
|
||||||||||
|
Mexico
|
440
|
|
397
|
|
404
|
|
748
|
|
759
|
|
||||||||||
|
Bulgaria
(4)
|
422
|
|
369
|
|
251
|
|
1,606
|
|
1,606
|
|
||||||||||
|
Puerto Rico
|
328
|
|
293
|
|
298
|
|
562
|
|
570
|
|
||||||||||
|
Panama
|
250
|
|
266
|
|
189
|
|
1,028
|
|
1,069
|
|
||||||||||
|
Kazakhstan
|
156
|
|
151
|
|
145
|
|
183
|
|
141
|
|
||||||||||
|
Jordan
|
142
|
|
121
|
|
124
|
|
439
|
|
222
|
|
||||||||||
|
Sri Lanka
|
53
|
|
169
|
|
140
|
|
7
|
|
8
|
|
||||||||||
|
Spain
|
—
|
|
119
|
|
258
|
|
—
|
|
—
|
|
||||||||||
|
Cameroon
(5)
|
—
|
|
—
|
|
—
|
|
—
|
|
—
|
|
||||||||||
|
Ukraine
(6)
|
—
|
|
—
|
|
—
|
|
—
|
|
—
|
|
||||||||||
|
Hungary
(7)
|
—
|
|
—
|
|
—
|
|
—
|
|
—
|
|
||||||||||
|
Vietnam
|
—
|
|
—
|
|
—
|
|
1,296
|
|
887
|
|
||||||||||
|
Other Non-U.S.
(8)
|
71
|
|
87
|
|
113
|
|
87
|
|
91
|
|
||||||||||
|
Total Non-U.S.
|
12,261
|
|
13,428
|
|
14,010
|
|
17,589
|
|
17,095
|
|
||||||||||
|
Total
|
$
|
15,891
|
|
$
|
17,164
|
|
$
|
16,098
|
|
$
|
25,112
|
|
$
|
24,635
|
|
|||||
164
THE AES CORPORATION
NOTES TO CONSOLIDATED FINANCIAL STATEMENTS—(Continued)
DECEMBER 31, 2013, 2012, AND 2011
|
(1)
|
Excludes revenue of $
23 million
, $
63 million
and $
396 million
for the years ended
December 31, 2013
,
2012
and
2011
, respectively, and property, plant and equipment of $
69 million
and $
123 million
as of
December 31, 2013
and
2012
, respectively, related to Condon, Mid-West Wind, Eastern Energy, Thames, Red Oak and Ironwood which were reflected as discontinued operations and assets held for sale in the accompanying Consolidated Statements of Operations and Consolidated Balance Sheets. Additionally, property, plant and equipment excludes $
25 million
as of
December 31, 2012
related to wind turbines which were reflected as assets held for sale in the accompanying Consolidated Balance Sheets.
|
|
(2)
|
Excludes revenue of $
124 million
for the year ended
December 31, 2011
related to Brazil Telecom, which was reflected as discontinued operations in the accompanying Consolidated Statements of Operations.
|
|
(3)
|
Excludes revenue of $
102 million
for the year ended
December 31, 2011
related to our Argentina distribution businesses, which were reflected as discontinued operations in the accompanying Consolidated Statements of Operations.
|
|
(4)
|
Our wind project in Maritza started operations in June 2011.
|
|
(5)
|
Excludes revenue of $
474 million
, $
457 million
and $
386 million
for the years ended
December 31, 2013
,
2012
and
2011
, respectively, and property, plant and equipment of $
1,100 million
and $
992 million
as of
December 31, 2013
and
2012
respectively, related to Dibamba, Kribi and Sonel, which were reflected as discontinued operations and assets held for sale in the accompanying Consolidated Statements of Operations and Consolidated Balance Sheets.
|
|
(6)
|
Excludes revenue of $
187 million
, $
491 million
and $
418 million
for the years ended
December 31, 2013
,
2012
and
2011
, respectively, and property, plant and equipment of $
112 million
as of
December 31, 2012
related to Kievoblenergo and Rivnooblenergo, which were reflected as discontinued operations and assets held for sale in the accompanying Consolidated Statements of Operations and Consolidated Balance Sheets.
|
|
(7)
|
Excludes revenue of $
18 million
and $
219 million
for the years ended
December 31, 2012
and
2011
, respectively, related to Borsod, Tiszapalkonya and Tisza II, which were reflected as discontinued operations and assets held for sale in the accompanying Consolidated Statements of Operations.
|
|
(8)
|
Excludes revenue of $
6 million
, $
11 million
and $
18 million
for the years ended
December 31, 2013
,
2012
and
2011
, respectively, and property, plant and equipment of $
19 million
and $
54 million
as of
December 31, 2013
and
2012
, respectively, related to Saurashtra, Poland wind and our carbon reduction projects, which were reflected as discontinued operations and assets held for sale in the accompanying Consolidated Statements of Operations and Consolidated Balance Sheets.
|
18. SHARE-BASED COMPENSATION
STOCK OPTIONS
—AES grants options to purchase shares of common stock under stock option plans to employees and non-employee directors. Under the terms of the plans, the Company may issue options to purchase shares of the Company’s common stock at a price equal to
100%
of the market price at the date the option is granted. Stock options are generally granted based upon a percentage of an employee’s base salary. Stock options issued under these plans in 2013,
2012
and
2011
have a
three
-year vesting schedule and vest in one-third increments over the
three
-year period. The stock options have a contractual term of
ten
years. At December 31, 2013, approximately
15 million
shares were remaining for award under the plans. In all circumstances, stock options granted by AES do not entitle the holder the right, or obligate AES, to settle the stock option in cash or other assets of AES.
The following table presents the weighted average fair value of each option grant and the underlying weighted average assumptions, as of the grant date, using the Black-Scholes option-pricing model:
|
December 31,
|
||||||||||||
|
2013
|
2012
|
2011
|
||||||||||
|
Expected volatility
|
23
|
%
|
26
|
%
|
31
|
%
|
||||||
|
Expected annual dividend yield
|
1
|
%
|
1
|
%
|
—
|
%
|
||||||
|
Expected option term (years)
|
6
|
|
6
|
|
6
|
|
||||||
|
Risk-free interest rate
|
1.13
|
%
|
1.08
|
%
|
2.65
|
%
|
||||||
|
Fair value at grant date
|
$
|
2.23
|
|
$
|
3.04
|
|
$
|
4.54
|
|
|||
The Company exclusively relies on implied volatility as the expected volatility to determine the fair value using the Black-Scholes option-pricing model. The implied volatility may be exclusively relied upon due to the following factors:
|
•
|
The Company utilizes a valuation model that is based on a constant volatility assumption to value its employee share options;
|
|
•
|
The implied volatility is derived from options to purchase AES common stock that are actively traded;
|
|
•
|
The market prices of both the traded options and the underlying shares are measured at a similar point in time and on a date reasonably close to the grant date of the employee share options;
|
|
•
|
The traded options have exercise prices that are both near-the-money and close to the exercise price of the employee share options; and
|
|
•
|
The remaining maturities of the traded options on which the estimate is based are at least
one
year.
|
165
THE AES CORPORATION
NOTES TO CONSOLIDATED FINANCIAL STATEMENTS—(Continued)
DECEMBER 31, 2013, 2012, AND 2011
The Company uses a simplified method to determine the expected term based on the average of the original contractual term and the pro rata vesting period. This simplified method is used for stock options granted during
2013
,
2012
and
2011
. This simplified method may be used as the Company’s stock options have the following characteristics:
|
•
|
The stock options are granted at-the-money;
|
|
•
|
Exercisability is conditional only on performing service through the vesting date;
|
|
•
|
If an employee terminates service prior to vesting, the employee forfeits the stock options;
|
|
•
|
If an employee terminates service after vesting, the employee has a limited time to exercise the stock option; and
|
|
•
|
The stock option is nonhedgeable and not transferable.
|
The Company does not discount the grant date fair values to estimate post-vesting restrictions. Post-vesting restrictions include black-out periods when the employee is not able to exercise stock options based on their potential knowledge of information prior to the release of that information to the public.
The following table summarizes the components of stock-based compensation related to employee stock options recognized in the Company’s financial statements:
|
December 31,
|
||||||||||||
|
2013
|
2012
|
2011
|
||||||||||
|
(in millions)
|
||||||||||||
|
Pre-tax compensation expense
|
$
|
2
|
|
$
|
2
|
|
$
|
7
|
|
|||
|
Tax benefit
|
(1
|
)
|
(1
|
)
|
(2
|
)
|
||||||
|
Stock options expense, net of tax
|
$
|
1
|
|
$
|
1
|
|
$
|
5
|
|
|||
|
Total intrinsic value of options exercised
|
$
|
5
|
|
$
|
10
|
|
$
|
8
|
|
|||
|
Total fair value of options vested
|
2
|
|
5
|
|
7
|
|
||||||
|
Cash received from the exercise of stock options
|
13
|
|
9
|
|
4
|
|
||||||
No cash was used to settle stock options or compensation cost capitalized as part of the cost of an asset for the years ended December 31,
2013
,
2012
and
2011
. As of December 31,
2013
,
$3 million
of total unrecognized compensation cost related to stock options is expected to be recognized over a weighted average period of
1.8
years.
A summary of the option activity for the year ended December 31,
2013
follows (number of options in thousands, dollars in millions except per option amounts):
|
Options
|
Weighted Average Exercise Price
|
Weighted Average Remaining Contractual Term (in years)
|
Aggregate Intrinsic Value
|
||||||||||
|
Outstanding at December 31, 2012
|
7,883
|
|
$
|
14.91
|
|
||||||||
|
Exercised
|
(1,349
|
)
|
9.56
|
|
|||||||||
|
Forfeited and expired
|
(1,097
|
)
|
16.70
|
|
|||||||||
|
Granted
|
1,428
|
|
11.25
|
|
|||||||||
|
Outstanding at December 31, 2013
|
6,865
|
|
$
|
14.91
|
|
5.1
|
$
|
12
|
|
||||
|
Vested and expected to vest at December 31, 2013
|
6,618
|
|
$
|
15.04
|
|
5.0
|
$
|
11
|
|
||||
|
Eligible for exercise at December 31, 2013
|
4,646
|
|
$
|
16.42
|
|
3.6
|
$
|
6
|
|
||||
The aggregate intrinsic value in the table above represents the total pre-tax intrinsic value (the difference between the Company’s closing stock price on the last trading day of
2013
and the exercise price, multiplied by the number of in-the-money options) that would have been received by the option holders had all option holders exercised their options on December 31, 2013. The amount of the aggregate intrinsic value will change based on the fair market value of the Company’s stock.
The Company initially recognizes compensation cost on the estimated number of instruments for which the requisite service is expected to be rendered. In 2013, AES has estimated a weighted average forfeiture rate of
25.50%
for stock options granted in 2013. This estimate will be revised if subsequent information indicates that the actual number of instruments forfeited is likely to differ from previous estimates. Based on the estimated forfeiture rate, the Company expects to expense
$2.4 million
on a straight-line basis over a three year period (approximately
$0.8 million
per year) related to stock options granted during the year ended December 31,
2013
.
166
THE AES CORPORATION
NOTES TO CONSOLIDATED FINANCIAL STATEMENTS—(Continued)
DECEMBER 31, 2013, 2012, AND 2011
RESTRICTED STOCK
Restricted Stock Units
—The Company issues restricted stock units (“RSUs”) under its long-term compensation plan. The RSUs are generally granted based upon a percentage of the participant’s base salary. The units have a
three
-year vesting schedule and vest in one-third increments over the
three
-year period. Units granted prior to 2011 are required to be held for an additional
two
years before they can be converted into shares, and thus become transferable. There is no such requirement for units granted in 2011 and afterwards. In all circumstances, restricted stock units granted by AES do not entitle the holder the right, or obligate AES, to settle the restricted stock unit in cash or other assets of AES.
For the years ended December 31,
2013
,
2012
, and
2011
, RSUs issued had a grant date fair value equal to the closing price of the Company’s stock on the grant date. The Company does not discount the grant date fair values to reflect any post-vesting restrictions. RSUs granted to employees during the years ended December 31,
2013
,
2012
, and
2011
had grant date fair values per RSU of
$11.19
,
$13.54
and
$12.65
, respectively.
The following table summarizes the components of the Company’s stock-based compensation related to its employee RSUs recognized in the Company’s consolidated financial statements:
|
December 31,
|
||||||||||||
|
2013
|
2012
|
2011
|
||||||||||
|
(in millions)
|
||||||||||||
|
RSU expense before income tax
|
$
|
12
|
|
$
|
11
|
|
$
|
11
|
|
|||
|
Tax benefit
|
(3
|
)
|
(3
|
)
|
(3
|
)
|
||||||
|
RSU expense, net of tax
|
$
|
9
|
|
$
|
8
|
|
$
|
8
|
|
|||
|
Total value of RSUs converted
(1)
|
$
|
10
|
|
$
|
9
|
|
$
|
5
|
|
|||
|
Total fair value of RSUs vested
|
$
|
12
|
|
$
|
12
|
|
$
|
10
|
|
|||
|
(1)
|
Amount represents fair market value on the date of conversion.
|
There was no cash used to settle RSUs or compensation cost capitalized as part of the cost of an asset for the years ended December 31,
2013
,
2012
, and
2011
. As of December 31,
2013
,
$13 million
of total unrecognized compensation cost related to RSUs is expected to be recognized over a weighted average period of approximately
1.7
years. There were no modifications to RSU awards during the year ended December 31, 2013.
A summary of the activity of RSUs for the year ended December 31,
2013
follows (number of RSUs in thousands):
|
RSUs
|
Weighted Average Grant Date Fair Values
|
Weighted Average Remaining Vesting Term
|
|||||||
|
Nonvested at December 31, 2012
|
2,092
|
|
$
|
13.02
|
|
||||
|
Vested
|
(942
|
)
|
12.82
|
|
|||||
|
Forfeited and expired
|
(337
|
)
|
12.55
|
|
|||||
|
Granted
|
1,444
|
|
11.19
|
|
|||||
|
Nonvested at December 31, 2013
|
2,257
|
|
$
|
12.01
|
|
1.8
|
|||
|
Vested at December 31, 2013
|
2,315
|
|
$
|
8.68
|
|
||||
|
Vested and expected to vest at December 31, 2013
|
4,353
|
|
$
|
10.26
|
|
||||
The Company initially recognizes compensation cost on the estimated number of instruments for which the requisite service is expected to be rendered. In 2013, AES has estimated a weighted average forfeiture rate of
24.18%
for RSUs granted in 2013. This estimate will be revised if subsequent information indicates that the actual number of instruments forfeited is likely to differ from previous estimates. Based on the estimated forfeiture rate, the Company expects to expense
$12 million
on a straight-line basis over a three year period related to RSUs granted during the year ended December 31,
2013
.
The table below summarizes the RSUs that vested and were converted during the years ended December 31,
2013
,
2012
, and
2011
(number of RSUs in thousands):
|
2013
|
2012
|
2011
|
|||||||
|
RSUs vested during the year
|
942
|
|
1,138
|
|
982
|
|
|||
|
RSUs converted during the year, net of shares withheld for taxes
|
905
|
|
761
|
|
442
|
|
|||
|
Shares withheld for taxes
|
407
|
|
312
|
|
150
|
|
|||
167
THE AES CORPORATION
NOTES TO CONSOLIDATED FINANCIAL STATEMENTS—(Continued)
DECEMBER 31, 2013, 2012, AND 2011
Performance Stock Units
—The Company issues performance stock units (“PSUs”) to officers under its long-term compensation plan. PSUs are restricted stock units of which
50%
of the units awarded include a market condition and the remaining
50%
include a performance condition. Vesting will occur if the applicable continued employment conditions are satisfied and (a) for the units subject to the market condition the Total Stockholder Return (“TSR”) on AES common stock exceeds the TSR of the Standard and Poor’s 500 Utilities Sector Index over the
three
-year measurement period beginning on January 1
st
of the grant year and ending on December 31
st
of the third year and (b) for the units subject to the performance condition if the Company’s actual Adjusted EBITDA meets the performance target over the
three
-year measurement period beginning on January 1
st
of the grant year and ending on December 31
st
of the third year. The market and performance conditions determine the vesting and final share equivalent per PSU and can result in earning an award payout range of
0%
to
200%
, depending on the achievement. In all circumstances, PSUs granted by AES do not entitle the holder the right, or obligate AES, to settle the restricted stock unit in cash or other assets of AES.
The effect of the market condition on PSUs issued to officers of the Company during
2013
is reflected in the award’s fair value on the grant date. The results of the valuation estimated the fair value at
$13.28
per share, equating to
119%
of the Company’s closing stock price on the date of grant. PSUs that included a market condition granted during the year ended December 31,
2013
,
2012
, and
2011
had a grant date fair value per RSU of
$13.28
,
$19.75
and
$17.68
, respectively. The fair value of the PSUs with a performance condition had a grant date fair value of
$11.17
equal to the closing price of the Company’s stock on the grant date. The Company believes that it is probable that the performance condition will be met; this will continue to be evaluated throughout the performance period. If the fair value of the market condition was not applied to PSUs issued to officers, the total grant date fair value of PSUs granted during the year ended December 31, 2013 would have decreased by
$1 million
.
Restricted stock units with a market condition awarded to officers of the Company prior to 2011 contained only the market condition measuring the TSR on AES common stock. These units were required to be held for an additional two years subsequent to vesting before they could be converted into shares and become transferable. There is no such requirement for the shares granted during 2011 and afterwards.
The following table summarizes the components of the Company’s stock-based compensation related to its PSUs recognized in the Company’s consolidated financial statements:
|
December 31,
|
||||||||||||
|
2013
|
2012
|
2011
|
||||||||||
|
(in millions)
|
||||||||||||
|
PSU expense before income tax
|
$
|
4
|
|
$
|
5
|
|
$
|
5
|
|
|||
|
Tax benefit
|
(1
|
)
|
(1
|
)
|
(1
|
)
|
||||||
|
PSU expense, net of tax
|
$
|
3
|
|
$
|
4
|
|
$
|
4
|
|
|||
|
Total value of PSUs converted
(1)
|
$
|
—
|
|
$
|
—
|
|
$
|
—
|
|
|||
|
Total fair value of PSUs vested
|
—
|
|
2
|
|
—
|
|
||||||
|
(1)
|
Amount represents fair market value on the date of conversion.
|
There was no cash used to settle PSUs or compensation cost capitalized as part of the cost of an asset for the years ended December 31,
2013
,
2012
, and
2011
. As of December 31, 2013,
$7 million
of total unrecognized compensation cost related to PSUs is expected to be recognized over a weighted average period of approximately
1.8
years. There were no modifications to PSU awards during the year ended December 31,
2013
.
A summary of the activity of PSUs for the year ended December 31,
2013
follows (number of PSUs in thousands):
|
PSUs
|
Weighted Average Grant Date Fair Values
|
Weighted Average Remaining Vesting Term
|
|||||||
|
Nonvested at December 31, 2012
|
1,082
|
|
$
|
14.96
|
|
||||
|
Vested
|
—
|
|
—
|
|
|||||
|
Forfeited and expired
|
(367
|
)
|
12.94
|
|
|||||
|
Granted
|
624
|
|
12.23
|
|
|||||
|
Nonvested at December 31, 2013
|
1,339
|
|
$
|
14.24
|
|
1.4
|
|||
|
Vested at December 31, 2013
|
343
|
|
$
|
6.68
|
|
||||
|
Vested and expected to vest at December 31, 2013
|
1,486
|
|
12.68
|
|
|||||
168
THE AES CORPORATION
NOTES TO CONSOLIDATED FINANCIAL STATEMENTS—(Continued)
DECEMBER 31, 2013, 2012, AND 2011
The Company initially recognizes compensation cost on the estimated number of instruments for which the requisite service is expected to be rendered. In 2013, AES has estimated a forfeiture rate of
25.50%
for PSUs granted in 2013. This estimate will be revised if subsequent information indicates that the actual number of instruments forfeited is likely to differ from previous estimates. Based on the estimated forfeiture rate, the Company expects to expense
$6 million
on a straight-line basis over a three year period (approximately
$2 million
per year) related to PSUs granted during the year ended December 31,
2013
.
The table below summarizes the PSUs that vested and were converted during the years ended December 31,
2013
,
2012
, and
2011
(number of PSUs in thousands):
|
2013
|
2012
|
2011
|
|||||||
|
PSUs vested during the year
|
—
|
|
343
|
|
—
|
|
|||
|
PSUs converted during the year, net of shares withheld for taxes
|
—
|
|
—
|
|
—
|
|
|||
|
Shares withheld for taxes
|
—
|
|
—
|
|
—
|
|
|||
19. CUMULATIVE PREFERRED STOCK OF SUBSIDIARIES
Our subsidiaries IPL and DPL had outstanding shares of cumulative preferred stock of
$78 million
at December 31,
2013
and
2012
.
IPL had
$60 million
of cumulative preferred stock outstanding at December 31,
2013
and
2012
, which represented
five
series of preferred stock. The total annual dividend requirements were approximately
$3 million
at December 31,
2013
and
2012
. Certain series of the preferred stock were redeemable solely at the option of the issuer at prices between
$100
and
$118
per share. Holders of the preferred stock are entitled to elect a majority of IPL’s board of directors if IPL has not paid dividends to its preferred stockholders for
four
consecutive quarters. Based on the preferred stockholders’ ability to elect a majority of IPL’s board of directors in this circumstance, the redemption of the preferred shares is considered to be not solely within the control of the issuer and the preferred stock is considered temporary equity and presented in the mezzanine level of the Consolidated Balance Sheets in accordance with the relevant accounting guidance for noncontrolling interests and redeemable securities.
DPL had
$18 million
of cumulative preferred stock outstanding at December 31,
2013
and
2012
, which represented
three
series of preferred stock issued by DP&L, a wholly owned subsidiary of DPL. The total annual dividend requirements were approximately
$1 million
at December 31, 2013. The DP&L preferred stock may be redeemed at DP&L’s option as determined by its board of directors at per-share redemption prices between
$101
and
$103
per share, plus cumulative preferred dividends. In addition, DP&L’s Amended Articles of Incorporation contain provisions that permit preferred stockholders to elect members of the DP&L Board of Directors in the event that cumulative dividends on the preferred stock are in arrears in an aggregate amount equivalent to at least
four
full quarterly dividends. Based on the preferred stockholders’ ability to elect members of DP&L’s board of directors in this circumstance, the redemption of the preferred shares is considered to be not solely within the control of the issuer and the preferred stock is considered temporary equity and presented in the mezzanine level of the Consolidated Balance Sheets in accordance with the relevant accounting guidance for noncontrolling interests and redeemable securities.
169
THE AES CORPORATION
NOTES TO CONSOLIDATED FINANCIAL STATEMENTS—(Continued)
DECEMBER 31, 2013, 2012, AND 2011
20. OTHER INCOME AND EXPENSE
Other Income
Other income generally includes contract terminations, gains on asset sales and extinguishments of liabilities, favorable judgments on contingencies, and other income from miscellaneous transactions. The components of other income are summarized as follows:
|
Years Ended December 31,
|
||||||||||||
|
2013
|
2012
|
2011
|
||||||||||
|
(in millions)
|
||||||||||||
|
Contract termination - Beaver Valley
|
$
|
60
|
|
$
|
—
|
|
$
|
—
|
|
|||
|
Gain on sale of assets
|
12
|
|
21
|
|
46
|
|
||||||
|
Reversal of legal contingency
|
10
|
|
—
|
|
—
|
|
||||||
|
Insurance proceeds
|
—
|
|
38
|
|
11
|
|
||||||
|
Tax credit settlement
|
—
|
|
—
|
|
31
|
|
||||||
|
Gain on extinguishment of tax and other liabilities
|
9
|
|
—
|
|
14
|
|
||||||
|
Other
|
34
|
|
39
|
|
40
|
|
||||||
|
Total other income
|
$
|
125
|
|
$
|
98
|
|
$
|
142
|
|
|||
Other Expense
Other expense generally includes losses on disposal of assets, losses resulting from debt extinguishments, legal contingencies and losses from other miscellaneous transactions. The components of other expense are summarized as follows:
|
Years Ended December 31,
|
||||||||||||
|
2013
|
2012
|
2011
|
||||||||||
|
(in millions)
|
||||||||||||
|
Loss on disposal of assets
|
$
|
51
|
|
$
|
64
|
|
$
|
66
|
|
|||
|
Contract termination
|
7
|
|
—
|
|
—
|
|
||||||
|
Other
|
18
|
|
18
|
|
20
|
|
||||||
|
Total other expense
|
$
|
76
|
|
$
|
82
|
|
$
|
86
|
|
|||
21. ASSET IMPAIRMENT EXPENSE
|
Year Ended December 31,
|
||||||||||||
|
2013
|
2012
|
2011
|
||||||||||
|
(in millions)
|
||||||||||||
|
Beaver Valley
|
46
|
|
—
|
|
—
|
|
||||||
|
Conesville (DP&L)
|
26
|
|
—
|
|
—
|
|
||||||
|
Itabo (San Lorenzo)
|
16
|
|
—
|
|
—
|
|
||||||
|
U.S. wind turbines and projects
|
—
|
|
41
|
|
116
|
|
||||||
|
Kelanitissa
|
—
|
|
19
|
|
42
|
|
||||||
|
St. Patrick
|
—
|
|
11
|
|
—
|
|
||||||
|
Other
|
7
|
|
2
|
|
15
|
|
||||||
|
Total asset impairment expense
|
$
|
95
|
|
$
|
73
|
|
$
|
173
|
|
|||
Beaver Valley
— In January 2013, Beaver Valley, a wholly owned
125
MW coal-fired plant in Pennsylvania, entered into an agreement to early terminate its PPA with the offtaker in exchange for a lump-sum payment of
$60 million
which was received on January 9, 2013. The termination was effective January 8, 2013. Beaver Valley also terminated its fuel supply agreement. Under the PPA termination agreement, annual capacity agreements between the offtaker and PJM Interconnection, LLC (“PJM”) (a regional transmission organization) for 2013 - 2016 have been assigned to Beaver Valley. The termination of the PPA resulted in a significant reduction in the future cash flows of the asset group and was considered an impairment indicator. The carrying amount of the asset group was not recoverable. The carrying amount of the asset group exceeded the fair value of the asset group, resulting in an asset impairment expense of
$46 million
. Beaver Valley is reported in the US SBU reportable segment.
DP&L (Conesville)
— During the fourth quarter of 2013, the Company tested the recoverability of long-lived assets at Conesville, a
129
MW coal-fired plant in Ohio jointly-owned by DP&L (a wholly-owned subsidiary of AES). Gradual decreases in power prices as well as lower estimates of future capacity prices in conjunction with the DP&L reporting unit failing Step 1 of the annual goodwill impairment test were determined to be impairment indicators. The Company performed a
170
THE AES CORPORATION
NOTES TO CONSOLIDATED FINANCIAL STATEMENTS—(Continued)
DECEMBER 31, 2013, 2012, AND 2011
long-lived asset impairment test and determined that the carrying amount of the asset group was not recoverable. The Conesville asset group was determined to have
zero
fair value using discounted cash flows under the income approach. As a result, the Company recognized an asset impairment expense of
$26 million
. Conesville is reported in the US SBU reportable segment.
Itabo (San Lorenzo)
—During the third quarter of 2013, the Company tested the recoverability of long-lived assets at San Lorenzo, a
35
Megawatt ("MW") LNG fueled plant of Itabo. Itabo was informed by Super-Intendencia de Electridad (“SIE”), the system regulator in the Dominican Republic, that it would not receive capacity revenue going forward. This communication in combination with current adverse market conditions were determined to be an impairment indicator. The Company performed a long-lived asset impairment test considering different scenarios and determined that, based on undiscounted cash flows, the carrying amount of San Lorenzo was not recoverable. The fair value of San Lorenzo was determined using the market approach based on a broker quote and it was determined that its carrying amount of
$23 million
exceeded the estimated fair value of
$7 million
. As a result, the Company recognized an asset impairment expense of
$16 million
. Itabo is reported in the MCAC SBU reportable segment.
U.S. wind turbines and projects
— In 2012 and 2011, the Company recognized asset impairment expense of
$41 million
and
$116 million
, respectively, on certain wind turbines and projects. The wind turbines, held in storage, met the held-for-sale criteria due to less viable internal deployment scenarios and the ongoing receipt of offers from potential buyers. Accordingly, the Company measured the turbines at fair value less cost to sell under the market approach. In June 2013, the Company sold these turbines and recognized an after tax gain of
$2 million
. In addition, the Company determined that two early-stage wind development projects that were capitalizing certain project costs were no longer probable because of the Company’s shift in capital allocation for developing these projects. The Company assessed the value of the projects using the market approach and, after consultation with third party valuation firms and internal development staff, the fair value was determined to be
zero
resulting in full impairment. These wind turbines and projects were reported in the US SBU reportable segment.
Kelanitissa
—In 2012 and 2011, the Company recognized asset impairment expense of
$19 million
and
$42 million
, respectively, for the long-lived assets at Kelanitissa, a diesel-fired generation plant in Sri Lanka. The Company continued to evaluate the recoverability of its long-lived assets at Kelanitissa as a result of both the requirement to transfer the plant to the government at the end of the PPA and the expectation of lower future operating cash flows. The evaluations during this period indicated that the long-lived assets were no longer recoverable and, accordingly, were written down to their estimated fair value. Kelanitissa is reported in the Asia SBU reportable segment.
St. Patrick
—In 2012, the Company received approval from its Board of Directors for the sale of its wholly owned subsidiary Ferme Eolienne Saint Patrick SAS (“St. Patrick”). Upon meeting the held-for-sale criteria including the Board’s approval, long-lived assets with a carrying amount of
$33 million
were written down to their fair value of
$22 million
(i.e., the sale price attributed to St. Patrick) and an impairment expense of
$11 million
was recorded. The sale transaction subsequently closed on June 28, 2012. St. Patrick was reported in the EMEA SBU reportable segment.
22. INCOME TAXES
Income Tax Provision
The following table summarizes the expense for income taxes on continuing operations, for the years ended December 31,
2013
,
2012
and
2011
:
|
2013
|
2012
|
2011
|
||||||||||
|
(in millions)
|
||||||||||||
|
Federal:
|
||||||||||||
|
Current
|
$
|
(28
|
)
|
$
|
—
|
|
$
|
—
|
|
|||
|
Deferred
|
(110
|
)
|
24
|
|
(150
|
)
|
||||||
|
State:
|
||||||||||||
|
Current
|
1
|
|
(2
|
)
|
1
|
|
||||||
|
Deferred
|
1
|
|
(11
|
)
|
1
|
|
||||||
|
Foreign:
|
||||||||||||
|
Current
|
509
|
|
538
|
|
837
|
|
||||||
|
Deferred
|
(30
|
)
|
136
|
|
(33
|
)
|
||||||
|
Total
|
$
|
343
|
|
$
|
685
|
|
$
|
656
|
|
|||
171
THE AES CORPORATION
NOTES TO CONSOLIDATED FINANCIAL STATEMENTS—(Continued)
DECEMBER 31, 2013, 2012, AND 2011
Effective and Statutory Rate Reconciliation
The following table summarizes a reconciliation of the U.S. statutory federal income tax rate to the Company’s effective tax rate, as a percentage of income from continuing operations before taxes for the years ended December 31,
2013
,
2012
and
2011
:
|
2013
|
2012
|
2011
|
|||||||
|
Statutory Federal tax rate
|
35
|
%
|
35
|
%
|
35
|
%
|
|||
|
State taxes, net of Federal tax benefit
|
(3
|
)%
|
(21
|
)%
|
—
|
%
|
|||
|
Taxes on foreign earnings
|
(4
|
)%
|
(32
|
)%
|
(2
|
)%
|
|||
|
Valuation allowance
|
—
|
%
|
16
|
%
|
(3
|
)%
|
|||
|
Uncertain tax positions
|
(5
|
)%
|
9
|
%
|
—
|
%
|
|||
|
Bad debt deduction
|
(3
|
)%
|
—
|
%
|
—
|
%
|
|||
|
Change in tax law
|
(1
|
)%
|
17
|
%
|
—
|
%
|
|||
|
Goodwill impairment
|
12
|
%
|
276
|
%
|
—
|
%
|
|||
|
Other—net
|
2
|
%
|
(2
|
)%
|
(1
|
)%
|
|||
|
Effective tax rate
|
33
|
%
|
298
|
%
|
29
|
%
|
|||
The current income taxes receivable and payable are included in Other Current Assets and Accrued and Other Liabilities, respectively, on the accompanying Consolidated Balance Sheets. The noncurrent income taxes receivable and payable are included in Other Noncurrent Assets and Other Noncurrent Liabilities, respectively, on the accompanying Consolidated Balance Sheets. The following table summarizes the income taxes receivable and payable as of December 31,
2013
and
2012
:
|
2013
|
2012
|
|||||||
|
(in millions)
|
||||||||
|
Income taxes receivable—current
|
$
|
206
|
|
$
|
294
|
|
||
|
Income taxes receivable—noncurrent
|
—
|
|
15
|
|
||||
|
Total income taxes receivable
|
$
|
206
|
|
$
|
309
|
|
||
|
Income taxes payable—current
|
$
|
322
|
|
$
|
393
|
|
||
|
Income taxes payable—noncurrent
|
2
|
|
2
|
|
||||
|
Total income taxes payable
|
$
|
324
|
|
$
|
395
|
|
||
Deferred Income Taxes
—Deferred income taxes reflect the net tax effects of (a) temporary differences between the carrying amounts of assets and liabilities for financial reporting purposes and the amounts used for income tax purposes and (b) operating loss and tax credit carryforwards. These items are stated at the enacted tax rates that are expected to be in effect when taxes are actually paid or recovered.
As of December 31, 2013, the Company had federal net operating loss carryforwards for tax purposes of approximately
$2.8 billion
expiring in years 2023 to 2033. Approximately
$77 million
of the net operating loss carryforward related to stock option deductions will be recognized in additional paid-in capital when realized. The Company also had federal general business tax credit carryforwards of approximately
$18 million
expiring primarily from 2021 to 2033, and federal alternative minimum tax credits of approximately
$5 million
that carry forward without expiration. The Company had state net operating loss carryforwards as of December 31, 2013 of approximately
$7.1 billion
expiring in years 2016 to 2033. As of December 31, 2013, the Company had foreign net operating loss carryforwards of approximately
$3.9 billion
that expire at various times beginning in 2014 and some of which carry forward without expiration, and tax credits available in foreign jurisdictions of approximately
$15 million
,
$1 million
of which expire in 2017 to 2024 and
$14 million
of which carryforward without expiration.
Valuation allowances increased
$195 million
during 2013 to
$1.1 billion
at December 31, 2013. This net increase was primarily the result of valuation allowance activity at one of our Brazilian subsidiaries.
Valuation allowances increased
$2 million
during 2012 to
$895 million
at December 31, 2012. This net increase was primarily the result of valuation allowance activity at certain U.S. state jurisdictions.
The Company believes that it is more likely than not that the net deferred tax assets as shown below will be realized when future taxable income is generated through the reversal of existing taxable temporary differences and income that is expected to be generated by businesses that have long-term contracts or a history of generating taxable income. The Company continues to monitor the utilization of its deferred tax asset for its U.S. consolidated net operating loss carryforward. Although management believes it is more likely than not that this deferred tax asset will be realized through generation of sufficient taxable income prior to expiration of the loss carryforwards, such realization is not assured.
172
THE AES CORPORATION
NOTES TO CONSOLIDATED FINANCIAL STATEMENTS—(Continued)
DECEMBER 31, 2013, 2012, AND 2011
The following table summarizes the deferred tax assets and liabilities, as of December 31,
2013
and
2012
:
|
2013
|
2012
|
|||||||
|
(in millions)
|
||||||||
|
Differences between book and tax basis of property
|
$
|
(2,178
|
)
|
$
|
(2,089
|
)
|
||
|
Other taxable temporary differences
|
(337
|
)
|
(377
|
)
|
||||
|
Total deferred tax liability
|
(2,515
|
)
|
(2,466
|
)
|
||||
|
Operating loss carryforwards
|
2,108
|
|
1,592
|
|
||||
|
Capital loss carryforwards
|
103
|
|
108
|
|
||||
|
Bad debt and other book provisions
|
277
|
|
330
|
|
||||
|
Retirement costs
|
291
|
|
611
|
|
||||
|
Tax credit carryforwards
|
38
|
|
46
|
|
||||
|
Other deductible temporary differences
|
420
|
|
512
|
|
||||
|
Total gross deferred tax asset
|
3,237
|
|
3,199
|
|
||||
|
Less: valuation allowance
|
(1,090
|
)
|
(895
|
)
|
||||
|
Total net deferred tax asset
|
2,147
|
|
2,304
|
|
||||
|
Net deferred tax asset (liability)
|
$
|
(368
|
)
|
$
|
(162
|
)
|
||
The Company considers undistributed earnings of certain foreign subsidiaries to be indefinitely reinvested outside of the United States and, accordingly, no U.S. deferred taxes have been recorded with respect to such earnings in accordance with the relevant accounting guidance for income taxes. Should the earnings be remitted as dividends, the Company may be subject to additional U.S. taxes, net of allowable foreign tax credits. It is not practicable to estimate the amount of any additional taxes which may be payable on the undistributed earnings.
Income from operations in certain countries is subject to reduced tax rates as a result of satisfying specific commitments regarding employment and capital investment. The Company’s income tax benefits related to the tax status of these operations are estimated to be
$70 million
,
$81 million
and
$60 million
for the years ended December 31,
2013
,
2012
and
2011
, respectively. The per share effect of these benefits after noncontrolling interests was
$0.09
,
$0.10
and
$0.07
for the years ended December 31,
2013
,
2012
and
2011
, respectively. The benefit related to our operations in the Philippines will expire in the fourth quarter of 2014. The Company’s income tax benefits related to these specific operations are estimated to be
$41 million
,
$60 million
and
$34 million
for the years ended December 31, 2013, 2012 and 2011. The per share effect of these benefits after noncontrolling interests was
$0.05
,
$0.07
and
$0.04
for the years ended December 31, 2013, 2012 and 2011.
The following table summarizes the income (loss) from continuing operations, before income taxes, net equity in earnings of affiliates and noncontrolling interests, for the years ended December 31,
2013
,
2012
and
2011
:
|
2013
|
2012
|
2011
|
||||||||||
|
(in millions)
|
||||||||||||
|
U.S.
|
$
|
(575
|
)
|
$
|
(1,921
|
)
|
$
|
(524
|
)
|
|||
|
Non-U.S.
|
1,623
|
|
2,151
|
|
2,784
|
|
||||||
|
Total
|
$
|
1,048
|
|
$
|
230
|
|
$
|
2,260
|
|
|||
Uncertain Tax Positions
Uncertain tax positions have been classified as noncurrent income tax liabilities unless expected to be paid in one year. The Company’s policy for interest and penalties related to income tax exposures is to recognize interest and penalties as a component of the provision for income taxes in the Consolidated Statements of Operations.
As of December 31,
2013
and
2012
, the total amount of gross accrued income tax related interest included in the Consolidated Balance Sheets was
$12 million
and
$17 million
, respectively. The total amount of gross accrued income tax related penalties included in the Consolidated Balance Sheets as of December 31,
2013
and
2012
was
$1 million
and
$4 million
, respectively.
The total expense (benefit) for interest related to unrecognized tax benefits for the years ended December 31,
2013
,
2012
and
2011
amounted to
$(4) million
,
$3 million
and
$3 million
, respectively. For the years ended December 31,
2013
,
2012
and
2011
, the total expense (benefit) for penalties related to unrecognized tax benefits amounted to
$(3) million
,
$1 million
and
$0 million
, respectively.
173
THE AES CORPORATION
NOTES TO CONSOLIDATED FINANCIAL STATEMENTS—(Continued)
DECEMBER 31, 2013, 2012, AND 2011
We are potentially subject to income tax audits in numerous jurisdictions in the U.S. and internationally until the applicable statute of limitations expires. Tax audits by their nature are often complex and can require several years to complete. The following is a summary of tax years potentially subject to examination in the significant tax and business jurisdictions in which we operate:
|
Jurisdiction
|
Tax Years Subject to Examination
|
|
|
Argentina
|
2006-2013
|
|
|
Brazil
|
2008-2013
|
|
|
Chile
|
2009-2013
|
|
|
Colombia
|
2011-2013
|
|
|
El Salvador
|
2010-2013
|
|
|
United Kingdom
|
2009-2013
|
|
|
United States (Federal)
|
2010-2013
|
|
As of December 31,
2013
,
2012
and
2011
, the total amount of unrecognized tax benefits was
$392 million
,
$475 million
and
$464 million
, respectively. The total amount of unrecognized tax benefits that would benefit the effective tax rate as of December 31, 2013, 2012 and
2011
is
$360 million
,
$444 million
and
$418 million
, respectively, of which
$26 million
,
$45 million
and
$47 million
, respectively, would be in the form of tax attributes that would warrant a full valuation allowance.
The total amount of unrecognized tax benefits anticipated to result in a net decrease to unrecognized tax benefits within 12 months of December 31, 2013 is estimated to be between
$6 million
and
$10 million
.
The following is a reconciliation of the beginning and ending amounts of unrecognized tax benefits for the years ended December 31,
2013
,
2012
and
2011
:
|
2013
|
2012
|
2011
|
||||||||||
|
(in millions)
|
||||||||||||
|
Balance at January 1
|
$
|
475
|
|
$
|
464
|
|
$
|
430
|
|
|||
|
Additions for current year tax positions
|
7
|
|
12
|
|
6
|
|
||||||
|
Additions for tax positions of prior years
|
10
|
|
29
|
|
49
|
|
||||||
|
Reductions for tax positions of prior years
|
(3
|
)
|
(29
|
)
|
(18
|
)
|
||||||
|
Effects of foreign currency translation
|
—
|
|
—
|
|
(1
|
)
|
||||||
|
Settlements
|
(65
|
)
|
—
|
|
—
|
|
||||||
|
Lapse of statute of limitations
|
(32
|
)
|
(1
|
)
|
(2
|
)
|
||||||
|
Balance at December 31
|
$
|
392
|
|
$
|
475
|
|
$
|
464
|
|
|||
The Company and certain of its subsidiaries are currently under examination by the relevant taxing authorities for various tax years. The Company regularly assesses the potential outcome of these examinations in each of the taxing jurisdictions when determining the adequacy of the amount of unrecognized tax benefit recorded. While it is often difficult to predict the final outcome or the timing of resolution of any particular uncertain tax position, we believe we have appropriately accrued for our uncertain tax benefits. However, audit outcomes and the timing of audit settlements and future events that would impact our previously recorded unrecognized tax benefits and the range of anticipated increases or decreases in unrecognized tax benefits are subject to significant uncertainty. It is possible that the ultimate outcome of current or future examinations may exceed our provision for current unrecognized tax benefits in amounts that could be material, but cannot be estimated as of December 31,
2013
. Our effective tax rate and net income in any given future period could therefore be materially impacted.
23
. DISCONTINUED OPERATIONS AND HELD-FOR-SALE BUSINESSES
Discontinued operations include the results of the following businesses:
|
•
|
Poland wind projects (sold in November 2013);
|
|
•
|
U.S. wind projects (held for sale in November 2013);
|
|
•
|
Cameroon (held for sale in September 2013);
|
|
•
|
Saurashtra (held for sale in September 2013);
|
|
•
|
Ukraine utilities (sold in April 2013);
|
|
•
|
Tisza II (sold in December 2012);
|
174
THE AES CORPORATION
NOTES TO CONSOLIDATED FINANCIAL STATEMENTS—(Continued)
DECEMBER 31, 2013, 2012, AND 2011
|
•
|
Red Oak and Ironwood (sold in April 2012);
|
|
•
|
Argentina utilities (sold in November 2011);
|
|
•
|
Eletropaulo Telecomunicacões Ltda. and AES Communications Rio de Janeiro S.A. (collectively, “Brazil Telecom”), our Brazil telecommunication businesses (sold in October 2011);
|
|
•
|
Carbon reduction projects (disposed of in June 2012);
|
|
•
|
Poland and the U.K. Wind projects (abandoned in December 2011);
|
|
•
|
Eastern Energy in New York (disposed of in December 2012);
|
|
•
|
Borsod in Hungary (disposed of in November 2011);
|
|
•
|
Thames in Connecticut (disposed of in December 2011).
|
Information for businesses included in discontinued operations and the income (loss) on disposal and impairment of discontinued operations for the years ended December 31,
2013
,
2012
and
2011
is provided in the tables below:
|
2013
|
2012
|
2011
|
||||||||||
|
(in millions)
|
||||||||||||
|
Revenue
|
$
|
689
|
|
$
|
1,043
|
|
$
|
1,661
|
|
|||
|
Income (loss) from operations of discontinued businesses, before income tax
|
$
|
(3
|
)
|
$
|
73
|
|
$
|
(206
|
)
|
|||
|
Income tax benefit (expense)
|
(24
|
)
|
(26
|
)
|
48
|
|
||||||
|
Income (loss) from operations of discontinued businesses, after income tax
|
$
|
(27
|
)
|
$
|
47
|
|
$
|
(158
|
)
|
|||
|
Net gain (loss) from disposal and impairments of discontinued businesses, after income tax
|
$
|
(152
|
)
|
$
|
16
|
|
$
|
86
|
|
|||
Poland wind projects—
In November 2013, the Company sold AES Polish Wind Holdings B.V., ("Poland Wind") a wholly owned subsidiary that held ownership interests ranging between
61%
–
89%
in
ten
wind development projects in Poland. Net proceeds from the sale transaction were
$7 million
and a loss on disposal of
$2 million
was recognized. In the third quarter of 2013, the Company had recognized impairments of
$65 million
on these projects when these were classified as held and used. Poland Wind was previously reported in the EMEA SBU reportable segment.
U.S. wind projects—
In November 2013, the Company executed an agreement for the sale of its
100%
membership interests in
three
wind projects with an aggregate generation capacity of
234
MW: Condon in California, Lake Benton I in Minnesota and Storm Lake II in Iowa. Under the terms of the sale agreement, the buyer has an option to purchase the Company's
100%
interest in Armenia Mountain, a
101
MW wind project in Pennsylvania at a fixed price of
$75 million
. The option is exercisable between January 1, 2015 and April 1, 2015 (both dates inclusive). Upon meeting the held-for-sale criteria for Condon, Lake Benton I and Storm Lake II, the Company recognized an impairment of
$47 million
(of which
$7 million
was attributable to noncontrolling interests held by tax equity partners) representing the difference between their aggregate carrying amount of
$77 million
and the fair value less costs to sell of
$30 million
. The sale transaction closed on January 30, 2014 and net proceeds of
$27 million
were received. Approximately
$3 million
of the net proceeds received has been deferred and allocated to the buyer's option to purchase Armenia Mountain. These wind projects were previously reported in the US SBU reportable segment. Armenia Mountain has not yet met the held-for-sale criteria and accordingly is reflected within continuing operations.
Saurashtra—
In October 2013, the Company executed a sale agreement for the sale of its wholly owned subsidiary AES Saurashtra Private Ltd, a
39
MW wind project in India. The transaction is subject to lenders' approval and customary conditions precedent. The lenders' approval was received in January 2014 and the sale is expected to close in the first quarter of 2014. Since meeting the held-for-sale criteria, the Company recognized an impairment of
$12 million
representing the difference between its carrying amount of
$19 million
and fair value less costs to sell of
$7 million
. The sale transaction closed on February 24, 2014 and net proceeds of
$8 million
were received. Saurashtra was previously reported in the Asia SBU reportable segment.
Cameroon—
In September 2013, the Company executed sale agreements for the sale of AES White Cliffs B.V. (owner of
56%
of AES SONEL S.A), AES Kribi Holdings B.V. (owner of
56%
of Kribi Power Development Company S.A.) and AES Dibamba Holdings B.V., (owner of
56%
of Dibamba Power Development Company S.A.). The transaction is subject to the Cameroon government approval and certain conditions precedent, which should be fulfilled or waived before March 31, 2014. The transaction is expected to close in the first quarter of 2014. Since meeting the held-for-sale criteria, the Company recognized impairments of
$63 million
representing the difference between their aggregate carrying amount of
$414 million
and fair value less costs to sell of
$351 million
. These businesses were previously reported in EMEA SBU reportable segment.
175
THE AES CORPORATION
NOTES TO CONSOLIDATED FINANCIAL STATEMENTS—(Continued)
DECEMBER 31, 2013, 2012, AND 2011
Ukraine utilities
—In April 2013, the Company completed the sale of its
two
utility businesses in Ukraine to VS Energy International and received net proceeds of
$113 million
after working capital adjustments. The Company sold its
89.1%
equity interest in AES Kyivoblenergo, which serves
881,000
customers in the Kiev region, and its
84.6%
percent equity interest in AES Rivneoblenergo, which serves
412,000
customers in the Rivne region. The Company recognized net impairments of
$38 million
during the 2013. These businesses were previously reported in the EMEA SBU reportable segment.
Tisza II
—In December 2012, the Company completed the sale of its
100%
ownership interest in Tisza II, a
900
MW gas/oil fired plant in Hungary. Net proceeds from the sale transaction were
$14 million
and the Company recognized a loss on disposal of
$87 million
, net of tax (including the realization of cumulative foreign currency translation loss of
$73 million
). In 2011 and 2010, the long-lived asset group of Tisza II was evaluated for impairment due to deteriorating economic and business conditions in Hungary, and was determined to be unrecoverable based on undiscounted cash flows. As a result, the Company had measured the asset group at fair value using discounted cash flows analysis and recognized asset impairment expense of
$52 million
and
$85 million
in 2011 and 2010, respectively, which is included in loss from operations of discontinued businesses above. Tisza II was reported in the EMEA SBU reportable segment.
Red Oak and Ironwood
—In April 2012, the Company completed the sale of its
100%
interest in Red Oak, an
832
MW coal-fired plant in New Jersey, and Ironwood, a
710
MW coal-fired plant in Pennsylvania, for
$228 million
and recognized a gain of
$73 million
, net of tax. Both Red Oak and Ironwood were reported in the US SBU reportable segment.
Argentina utilities
—In November 2011, the Company completed the sale of its
90%
equity interest in Edelap and Edes,
two
utility companies in Argentina serving approximately
329,000
and
172,000
customers, respectively, and its
51%
equity interest in Central Dique, a
68
MW gas and diesel generation plant (collectively, “Argentina utilities”) in Argentina. Net proceeds from the sale were approximately
$4 million
. The Company recognized a loss on disposal of
$338 million
, net of tax (including the realization of cumulative foreign currency translation loss of
$208 million
). These businesses were previously reported in the Andes SBU reportable segment.
Brazil Telecom
—In October 2011, a subsidiary of the Company completed the sale of its ownership interest in
two
telecommunication companies in Brazil. The Company held approximately
46%
ownership interest in these companies through the subsidiary. The subsidiary received net proceeds of approximately
$893 million
. The gain on sale was approximately
$446 million
, net of tax. These businesses were previously reported in the Brazil SBU reportable segment.
Carbon reduction projects
—In December 2011, the Company’s board of directors approved plans to sell its
100%
equity interests in its carbon reduction businesses in Asia and Latin America. The aggregate carrying amount of
$49 million
of these projects was written down as their estimated fair value was considered
zero
, resulting in a pre-tax impairment expense of
$40 million
, which is included in income from operations of discontinued businesses. The impairment expense recognized was limited to the carrying amounts of the individual assets within the asset group, where the fair value was greater than the carrying amount. When the disposal group met the held for sale criteria, the disposal group was measured at the lower of carrying amount or fair value less cost to sell. Carbon reduction projects were previously reported in the Asia and MCAC SBU reportable segments.
Poland and the U.K. wind projects—
In the fourth quarter of 2011, the Company determined that it would no longer pursue certain development projects in Poland and the United Kingdom due to revisions in its growth strategy. As a result, the Company abandoned these projects and recognized the related project development rights, which were previously included in intangible assets, as a loss on disposal of discontinued operations of
$22 million
, net of tax. These wind projects were previously reported in the EMEA SBU reportable segment.
Eastern Energy—
In March 2011, AES Eastern Energy (“AEE”) met the held for sale criteria and was reclassified from continuing operations to held for sale. AEE operated
four
coal-fired power plants: Cayuga, Greenidge, Somerset and Westover, representing generation capacity of
1,169
MW in the western New York power market. In 2010, AEE had recognized a pre-tax impairment expense of
$827 million
due to adverse market conditions. In December 2011, AEE along with certain of its affiliates filed for bankruptcy protection and was recorded as a cost method investment. In December 2012, the AEE bankruptcy proceedings were finalized and a gain of
$30 million
, net of tax, was recognized in gain on disposal of discontinued businesses. AEE was previously reported in the US SBU reportable segment.
Borsod—
In November 2011, Borsod, which holds
two
coal/biomass-fired generation plants in Hungary with generating capacity of
161
MW, filed for liquidation and was recorded as a cost method investment. Borsod was previously reported in the EMEA SBU reportable segment.
176
THE AES CORPORATION
NOTES TO CONSOLIDATED FINANCIAL STATEMENTS—(Continued)
DECEMBER 31, 2013, 2012, AND 2011
Thames—
In December 2011, Thames, a
208
MW coal-fired plant in Connecticut, met the discontinued operations criteria and its operating results were retrospectively reflected as discontinued operations. Thames had filed for liquidation in February 2011, and was recorded as a cost method investment with the historical operating results reflected in discontinued operations. Thames was previously reported in the US SBU reportable segment.
24. ACQUISITIONS AND DISPOSITIONS
Acquisitions
DPL
—In 2011, AES completed the acquisition of
100%
of the common stock of DPL Inc. (“DPL”), the parent company of The Dayton Power and Light Company (“DP&L”), a utility based in Ohio, for approximately
$3.5 billion
, pursuant to the terms and conditions of a definitive agreement (the “Merger Agreement”) dated April 19, 2011. Upon completion of the acquisition, DPL became a wholly owned subsidiary of AES.
Dispositions
Trinidad Generation Unlimited
—On July 10, 2013, the Company completed the sale of its
10%
equity interest in Trinidad Generation Unlimited, an equity method investment, to the government of Trinidad and received net proceeds of
$31 million
. The carrying amount of the investment was
$28 million
and a gain of
$3 million
was recognized.
Cartagena
— On April 26, 2013, the Company sold its remaining interest in AES Energia Cartagena S.R.L. (“AES Cartagena”), a
1,199
MW gas-fired generation business in Spain upon the exercise of a purchase option included in the 2012 sale agreement where the Company sold its majority interest in the business. Net proceeds from the exercise of the option were approximately
$24 million
and the Company recognized a pretax gain of
$20 million
during the second quarter of 2013. In 2012, the Company had sold
80%
of its
70.81%
equity interest in Cartagena and had recognized a pretax gain of
$178 million
. Under the terms of the 2012 sale agreement, the buyer was granted an option to purchase the Company’s remaining
20%
interest during a
five
-month period beginning March 2013, which was exercised on April 26, 2013 as described above.
Due to the Company’s continued ownership interest, which extended beyond
one
year from the completion of the sale of its
80%
interest in February 2012, the prior-period operating results of AES Cartagena were not classified as discontinued operations.
InnoVent and St. Patrick
—On June 28, 2012, the Company closed the sale of its equity interest in InnoVent and controlling interest in St. Patrick. Net proceeds from the sale transactions were
$42 million
. The prior period operating results of St. Patrick were not deemed material for reclassification to discontinued operations. See Note 21—
Asset Impairment Expense
and Note 9—
Other Non-Operating Expense
for further information.
China
—On September 6, 2012 and December 31, 2012, the Company completed the sale of its interest in equity method investments in China. These investments included coal-fired, hydropower and wind generation facilities accounted for under the equity method of accounting. Net proceeds from the sale were approximately
$133 million
and the Company recognized a pretax gain of
$27 million
on the transaction, which is reflected as a gain on sale of investment. See Note 9—
Other Non-Operating Expense
for further information.
25. EARNINGS PER SHARE
Basic and diluted earnings per share are based on the weighted-average number of shares of common stock and potential common stock outstanding during the period. Potential common stock, for purposes of determining diluted earnings per share, includes the effects of dilutive restricted stock units, stock options and convertible securities. The effect of such potential common stock is computed using the treasury stock method or the if-converted method, as applicable.
The following tables present a reconciliation of the numerator and denominator of the basic and diluted earnings per share computation for income from continuing operations for the years ended
December 31, 2013
,
2012
and
2011
. In the table below, income represents the numerator and weighted-average shares represent the denominator:
177
THE AES CORPORATION
NOTES TO CONSOLIDATED FINANCIAL STATEMENTS—(Continued)
DECEMBER 31, 2013, 2012, AND 2011
|
Years Ended December 31,
|
||||||||||||||||||||||||||||||||||
|
2013
|
2012
|
2011
|
||||||||||||||||||||||||||||||||
|
Income
|
Shares
|
$ per Share
|
Loss
|
Shares
|
$ per Share
|
Income
|
Shares
|
$ per Share
|
||||||||||||||||||||||||||
|
(in millions except per share data)
|
||||||||||||||||||||||||||||||||||
|
BASIC EARNINGS PER SHARE
|
||||||||||||||||||||||||||||||||||
|
Income (loss) from continuing operations attributable to The AES Corporation common stockholders
|
$
|
284
|
|
743
|
|
$
|
0.38
|
|
$
|
(960
|
)
|
755
|
|
$
|
(1.27
|
)
|
$
|
506
|
|
$
|
778
|
|
$
|
0.65
|
|
|||||||||
|
EFFECT OF DILUTIVE SECURITIES
|
|
|||||||||||||||||||||||||||||||||
|
Stock options
|
—
|
|
1
|
|
—
|
|
—
|
|
—
|
|
—
|
|
—
|
|
2
|
|
—
|
|
||||||||||||||||
|
Restricted stock units
|
—
|
|
4
|
|
—
|
|
—
|
|
—
|
|
—
|
|
—
|
|
3
|
|
—
|
|
||||||||||||||||
|
DILUTED EARNINGS PER SHARE
|
$
|
284
|
|
748
|
|
$
|
0.38
|
|
$
|
(960
|
)
|
755
|
|
$
|
(1.27
|
)
|
$
|
506
|
|
$
|
783
|
|
$
|
0.65
|
|
|||||||||
The calculation of diluted earnings per share excluded
6 million
,
7 million
and
6 million
options outstanding at
December 31, 2013
,
2012
and
2011
, respectively, that could potentially dilute basic earnings per share in the future. These options were not included in the computation of diluted earnings per share because their exercise price exceeded the average market price during the related period.
The calculation of diluted earnings per share excluded
1
million options outstanding at
December 31, 2012
, that could potentially dilute earnings per share in the future. These options were not included in the computation of diluted earnings per share for the year ended
December 31, 2012
, because their inclusion would be anti-dilutive given the loss from continuing operations in the related period. Had the Company generated income from continuing operations in the year ended
December 31, 2012
,
1
million of potential common shares of common stock related to the restricted stock units would have been included in diluted average shares outstanding.
The calculation of diluted earnings per share also excluded
1
million restricted stock units outstanding at
December 31, 2013
and
2012
, that could potentially dilute basic earnings per share in the future. These restricted stock units were not included in the computation of diluted earnings per share because the average amount of compensation cost per share attributed to future service and not yet recognized exceeded the average market price during the related period and thus to include the restricted units would have been anti-dilutive. The calculation of diluted earnings per share also excluded
6
million restricted stock units outstanding at
December 31, 2012
, that could potentially dilute earnings per share in the future. These restricted units were not included in the computation of diluted earnings per share for the year ended
December 31, 2012
, because their impact would be anti-dilutive given the loss from continuing operations. Had the Company generated income from continuing operations in the year ended
December 31, 2012
,
4
million of potential common shares of common stock related to the restricted stock units would have been included in diluted average shares outstanding.
For the years ended
December 31, 2013
,
2012
and
2011
, all convertible debentures were omitted from the earnings per share calculation because they were anti-dilutive.
During the year ended
December 31, 2013
,
1
million shares of common stock were issued under the Company’s profit sharing plan and
1
million shares of common stock were issued upon the exercise of stock options.
26. RISKS AND UNCERTAINTIES
AES is a diversified power generation and utility company organized into
six
market-oriented Strategic Business Units ("SBUs"). See additional discussion of the Company’s principal markets in Note 17—
Segment and Geographic Information
. Within our six SBUs, we have two primary lines of business: Generation and Utilities. The Generation line of business uses a wide range of fuels and technologies to generate electricity such as coal, gas, hydro, wind, solar and biomass. Our Utilities business is comprised of businesses that transmit, distribute, and in certain circumstances, generate power. In addition, the Company has operations in the renewables area. These efforts include projects primarily in wind and solar.
Operating and Economic Risks
—The Company operates in several developing economies where macroeconomic conditions are usually more volatile than developed economies. Deteriorating market conditions often expose the Company to the risk of decreased earnings and cash flows due to, among other factors, adverse fluctuations in the commodities and foreign currency spot markets. Additionally, credit markets around the globe continue to tighten their standards, which could impact our ability to finance growth projects through access to capital markets. Currently, the Company has a below-investment grade rating from Standard & Poor’s of BB-. This could affect the Company's ability to finance new and/or existing development
178
THE AES CORPORATION
NOTES TO CONSOLIDATED FINANCIAL STATEMENTS—(Continued)
DECEMBER 31, 2013, 2012, AND 2011
projects at competitive interest rates. As of
December 31, 2013
, the Company had
$1.6 billion
of unrestricted cash and cash equivalents.
During
2013
, approximately
77%
of our revenue, and
97%
of our revenue from discontinued businesses, was generated outside the United States and a significant portion of our international operations is conducted in developing countries. We continue to invest in several developing countries to expand our existing platform and operations. International operations, particularly the operation, financing and development of projects in developing countries, entail significant risks and uncertainties, including, without limitation:
|
•
|
economic, social and political instability in any particular country or region;
|
|
•
|
inability to economically hedge energy prices;
|
|
•
|
volatility in commodity prices;
|
|
•
|
adverse changes in currency exchange rates;
|
|
•
|
government restrictions on converting currencies or repatriating funds;
|
|
•
|
unexpected changes in foreign laws, regulatory framework, or in trade, monetary or fiscal policies;
|
|
•
|
high inflation (such as Argentina. See Note
29
—
Subsequent Events
for the Argentine Peso devaluation after year end) and monetary fluctuations;
|
|
•
|
restrictions on imports of coal, oil, gas or other raw materials required by our generation businesses to operate;
|
|
•
|
threatened or consummated expropriation or nationalization of our assets by foreign governments;
|
|
•
|
unwillingness of governments, government agencies, similar organizations or other counterparties to honor their commitments;
|
|
•
|
unwillingness of governments, government agencies, courts or similar bodies to enforce contracts that are economically advantageous to subsidiaries of the Company and economically unfavorable to counterparties, against such counterparties, whether such counterparties are governments or private parties;
|
|
•
|
inability to obtain access to fair and equitable political, regulatory, administrative and legal systems;
|
|
•
|
adverse changes in government tax policy;
|
|
•
|
difficulties in enforcing our contractual rights or enforcing judgments or obtaining a just result in local jurisdictions; and
|
|
•
|
potentially adverse tax consequences of operating in multiple jurisdictions.
|
Any of these factors, individually or in combination with others, could materially and adversely affect our business, results of operations and financial condition. In addition, our Latin American operations experience volatility in revenue and earnings which have caused and are expected to cause significant volatility in our results of operations and cash flows. The volatility is caused by regulatory and economic difficulties, political instability, indexation of certain PPAs to fuel prices, and currency fluctuations being experienced in many of these countries particularly Argentina. This volatility reduces the predictability and enhances the uncertainty associated with cash flows from these businesses.
Our inability to predict, influence or respond appropriately to changes in law or regulatory schemes, including any inability to obtain reasonable increases in tariffs or tariff adjustments for increased expenses, could adversely impact our results of operations or our ability to meet publicly announced projections or analysts’ expectations. Furthermore, changes in laws or regulations or changes in the application or interpretation of regulatory provisions in jurisdictions where we operate, particularly our Utility businesses where electricity tariffs are subject to regulatory review or approval, could adversely affect our business, including, but not limited to:
|
•
|
changes in the determination, definition or classification of costs to be included as reimbursable or pass-through costs;
|
|
•
|
changes in the definition or determination of controllable or noncontrollable costs;
|
|
•
|
adverse changes in tax law;
|
|
•
|
changes in the definition of events which may or may not qualify as changes in economic equilibrium;
|
|
•
|
changes in the timing of tariff increases;
|
|
•
|
other changes in the regulatory determinations under the relevant concessions; or
|
|
•
|
changes in environmental regulations, including regulations relating to GHG emissions in any of our businesses.
|
Any of the above events may result in lower margins for the affected businesses, which can adversely affect our results of operations.
179
THE AES CORPORATION
NOTES TO CONSOLIDATED FINANCIAL STATEMENTS—(Continued)
DECEMBER 31, 2013, 2012, AND 2011
Foreign Currency Risks
—AES operates businesses in many foreign countries and such operations could be impacted by significant fluctuations in foreign currency exchange rates. Fluctuations in currency exchange rate between U. S. Dollar and the following currencies could create significant fluctuations to earnings and cash flows: the Argentine peso, the Brazilian real, the Dominican Republic peso, the Euro, the Chilean peso, the Colombian peso, the Philippine peso and the Kazakhstan Tenge.
Concentrations
—Due to the geographical diversity of its operations, the Company does not have any significant concentration of customers or sources of fuel supply. Several of the Company’s generation businesses rely on PPAs with one or a limited number of customers for the majority of, and in some cases all of, the relevant businesses' output over the term of the PPAs. However, no single customer accounted for 10% or more of total revenue in
2013
,
2012
or
2011
.
The cash flows and results of operations of our businesses depend on the credit quality of their customers and the continued ability of their customers and suppliers to meet their obligations under PPAs and fuel supply agreements. If a substantial portion of the Company’s long-term PPAs and/or fuel supply were modified or terminated, the Company would be adversely affected to the extent that it was unable to replace such contracts at equally favorable terms.
27. RELATED PARTY TRANSACTIONS
Certain of our businesses in Panama, the Dominican Republic and Kazakhstan are partially owned by governments either directly or through state-owned institutions. In the ordinary course of business, these businesses enter into energy purchase and sale transactions, and transmission agreements with other state-owned institutions which are controlled by such governments. At two of our generation businesses in Mexico, the offtakers exercise significant influence, but not control, through representation on these businesses’ Board of Directors. These offtakers are also required to hold a nominal ownership interest in such businesses. In Chile, we provide capacity and energy under contractual arrangements to our investments which are accounted for under the equity method of accounting. Additionally, the Company provides certain support and management services to several of its affiliates under various agreements. The Company’s Consolidated Statements of Operations included the following transactions with related parties for the years indicated:
|
|
Years Ended December 31,
|
||||||||||
|
|
2013
|
2012
|
2011
|
||||||||
|
|
(in millions)
|
||||||||||
|
Revenue—Non-Regulated
|
$
|
825
|
|
$
|
820
|
|
$
|
657
|
|
||
|
Cost of Sales—Non-Regulated
|
161
|
|
120
|
|
125
|
|
|||||
|
Interest expense
|
5
|
|
10
|
|
7
|
|
|||||
The following table summarizes the balances receivable from and payable to related parties included in the Company’s Consolidated Balance Sheets as of December 31,
2013
and
2012
:
|
2013
|
2012
|
||||||
|
|
(in millions)
|
||||||
|
Receivables from related parties
|
$
|
109
|
|
$
|
146
|
|
|
|
Accounts and notes payable to related parties
|
67
|
|
195
|
|
|||
During 2013, the Company repurchased
20 million
shares of its common stock from China Investment Corporation ("CIC") for
$258 million
. See Note 16 —
Equity, Stock Repurchase Program
for further information.
During 2011, the Company sold
19%
of its interest in Mong Duong to Stable Investment Corporation, a subsidiary of CIC. At December 31, 2011, Terrific Investment Corporation, also a subsidiary of CIC, owned approximately
15%
of the Company’s outstanding shares of common stock and has representation on the Company’s Board of Directors.
28. SELECTED QUARTERLY FINANCIAL DATA (UNAUDITED)
Quarterly Financial Data
The following tables summarize the unaudited quarterly statements of operations for the Company for
2013
and
2012
. Amounts have been restated to reflect discontinued operations in all periods presented and reflect all adjustments necessary in the opinion of management for a fair statement of the results for interim periods.
180
THE AES CORPORATION
NOTES TO CONSOLIDATED FINANCIAL STATEMENTS—(Continued)
DECEMBER 31, 2013, 2012, AND 2011
|
|
Quarter Ended 2013
|
||||||||||||||
|
|
Mar 31
|
June 30
|
Sept 30
|
Dec 31
|
|||||||||||
|
|
(in millions, except per share data)
|
||||||||||||||
|
Revenue
|
$
|
4,150
|
|
$
|
3,943
|
|
$
|
3,998
|
|
$
|
3,800
|
|
|||
|
Operating margin
|
749
|
|
901
|
|
927
|
|
670
|
|
|||||||
|
Income (loss) from continuing operations, net of tax
(1)
|
230
|
|
332
|
|
341
|
|
(173
|
)
|
|||||||
|
Discontinued operations, net of tax
|
(31
|
)
|
1
|
|
(118
|
)
|
(31
|
)
|
|||||||
|
Net income (loss)
|
$
|
199
|
|
$
|
333
|
|
$
|
223
|
|
$
|
(204
|
)
|
|||
|
Net income (loss) attributable to The AES Corporation
|
$
|
82
|
|
$
|
167
|
|
$
|
71
|
|
$
|
(206
|
)
|
|||
|
Basic income (loss) per share:
|
|||||||||||||||
|
Income (loss) from continuing operations attributable to The AES Corporation, net of tax
|
$
|
0.15
|
|
$
|
0.22
|
|
$
|
0.24
|
|
$
|
(0.23
|
)
|
|||
|
Discontinued operations attributable to The AES Corporation, net of tax
|
(0.04
|
)
|
—
|
|
(0.15
|
)
|
(0.05
|
)
|
|||||||
|
Basic income (loss) per share attributable to The AES Corporation
|
$
|
0.11
|
|
$
|
0.22
|
|
$
|
0.09
|
|
$
|
(0.28
|
)
|
|||
|
Diluted income (loss) per share:
|
|||||||||||||||
|
Income (loss) from continuing operations attributable to The AES Corporation, net of tax
|
$
|
0.15
|
|
$
|
0.22
|
|
$
|
0.24
|
|
$
|
(0.23
|
)
|
|||
|
Discontinued operations attributable to The AES Corporation, net of tax
|
(0.04
|
)
|
—
|
|
(0.15
|
)
|
(0.05
|
)
|
|||||||
|
Diluted income (loss) per share attributable to The AES Corporation
|
$
|
0.11
|
|
$
|
0.22
|
|
$
|
0.09
|
|
$
|
(0.28
|
)
|
|||
|
Dividends declared per common share
|
$
|
—
|
|
$
|
0.08
|
|
$
|
—
|
|
$
|
0.09
|
|
|||
|
|
Quarter Ended 2012
|
||||||||||||||
|
|
Mar 31
|
June 30
|
Sept 30
|
Dec 31
|
|||||||||||
|
|
(in millions, except per share data)
|
||||||||||||||
|
Revenue
|
$
|
4,448
|
|
$
|
3,990
|
|
$
|
4,353
|
|
$
|
4,373
|
|
|||
|
Operating margin
|
1,044
|
|
693
|
|
964
|
|
882
|
|
|||||||
|
Income (loss) from continuing operations, net of tax
(2)
|
504
|
|
150
|
|
(1,429
|
)
|
355
|
|
|||||||
|
Discontinued operations, net of tax
|
11
|
|
57
|
|
27
|
|
(32
|
)
|
|||||||
|
Net income (loss)
|
$
|
515
|
|
|
$
|
207
|
|
|
$
|
(1,402
|
)
|
|
$
|
323
|
|
|
Net income (loss) attributable to The AES Corporation
|
$
|
341
|
|
$
|
140
|
|
$
|
(1,568
|
)
|
$
|
175
|
|
|||
|
Basic income (loss) per share:
|
|||||||||||||||
|
Income (loss) from continuing operations attributable to The AES Corporation, net of tax
|
$
|
0.43
|
|
$
|
0.10
|
|
$
|
(2.12
|
)
|
$
|
0.29
|
|
|||
|
Discontinued operations attributable to The AES Corporation, net of tax
|
0.02
|
|
0.08
|
|
0.02
|
|
(0.06
|
)
|
|||||||
|
Basic income (loss) per share attributable to The AES Corporation
|
$
|
0.45
|
|
$
|
0.18
|
|
$
|
(2.10
|
)
|
$
|
0.23
|
|
|||
|
Diluted income (loss) per share:
|
|||||||||||||||
|
Income (loss) from continuing operations attributable to The AES Corporation, net of tax
|
$
|
0.43
|
|
$
|
0.10
|
|
$
|
(2.12
|
)
|
$
|
0.29
|
|
|||
|
Discontinued operations attributable to The AES Corporation, net of tax
|
0.01
|
|
0.08
|
|
0.02
|
|
(0.06
|
)
|
|||||||
|
Diluted income (loss) per share attributable to The AES Corporation
|
$
|
0.44
|
|
$
|
0.18
|
|
$
|
(2.10
|
)
|
$
|
0.23
|
|
|||
|
Dividends declared per common share
|
$
|
—
|
|
$
|
—
|
|
$
|
0.04
|
|
$
|
0.04
|
|
|||
|
(1)
|
Includes pretax impairment expense of
$48 million
,
$0 million
,
$74 million
and
$467 million
, for the first, second, third and fourth quarters of
2013
, respectively. See Note 21—
Asset Impairment Expense
and Note 10—
Goodwill and Other Intangible Assets
for further discussion.
|
|
(2)
|
Includes pretax impairment expense of
$10 million
,
$18 million
,
$1.9 billion
and
$(31) million
, for the first, second, third and fourth quarters of
2012
, respectively. See Note 21—
Asset Impairment Expense
and Note 10—
Goodwill and Other Intangible Assets
for further discussion.
|
29
. SUBSEQUENT EVENTS
Argentina Exchange Rate
—In the third week of January 2014, the Argentine Peso experienced significant decline against the U.S. dollar after the central bank reduced its intervention in currency markets. The Argentine economy faced sustained high inflation in several recent years based on unofficial estimates (the inflation statistics published by the government are approximately
10%
lower). The expectations for the unofficial inflation in 2014 remain high. If this situation continues, Argentina may face the risk of hyperinflation as defined in U.S. GAAP (a situation where the cumulative inflation over three years approximates
100%
or more). As of December 31, 2013, the aggregate carrying amount of the Company’s investment in Argentina was
$481 million
.
U.S. Wind projects sale
—The sale of U.S. wind projects closed on January 30, 2014. See Note 23 —
Discontinued Operations and Held-for-Sale Businesses
for further information.
181
THE AES CORPORATION
NOTES TO CONSOLIDATED FINANCIAL STATEMENTS—(Continued)
DECEMBER 31, 2013, 2012, AND 2011
Recourse Debt
— On February 14, 2014, the Company commenced tender offers to purchase (collectively, the “Tender Offers”) for cash up to a total of
$300 million
aggregate principal amount of its outstanding
7.75%
senior notes due 2015,
9.75%
senior notes due 2016, and
8.00%
senior notes due 2017. The tender offers are subject to certain customary terms and conditions which are described in the tender offer documentation, including obtaining financing to fund the tender offers. The Tender Offers are scheduled to expire at 11:59 p.m., New York City time, on March 14, 2014, unless extended or earlier terminated by AES.
Saurashtra
—The sale of AES Saurashtra Private Ltd. closed on
February 24, 2014
. See Note 23 —
Discontinued Operations and Held-for-Sale Businesses
for further information.
182
|
ITEM 9.
|
CHANGES IN AND DISAGREEMENTS WITH ACCOUNTANTS ON ACCOUNTING AND FINANCIAL DISCLOSURE
|
None.
Conclusion Regarding the Effectiveness of Disclosure Controls and Procedures
The Company maintains disclosure controls and procedures that are designed to ensure that information required to be disclosed in the reports that the Company files or submits under the Securities Exchange Act of 1934, as amended (the “Exchange Act”) is recorded, processed, summarized and reported within the time periods specified in the SEC’s rules and forms, and that such information is accumulated and communicated to the Chief Executive Officer (“CEO”) and Chief Financial Officer (“CFO”), as appropriate, to allow timely decisions regarding required disclosures.
The Company carried out the evaluation required by Rules 13a-15(b) and 15d-15(b), under the supervision and with the participation of our management, including the CEO and CFO, of the effectiveness of our “disclosure controls and procedures” (as defined in the Exchange Act Rules 13a-15(e) and 15d-15(e)). Based upon this evaluation, the CEO and CFO concluded that as of December 31, 2013, our disclosure controls and procedures were effective.
Management’s Report on Internal Control over Financial Reporting
Management of the Company is responsible for establishing and maintaining adequate internal control over financial reporting, as defined in Rule 13a-15(f) under the Exchange Act. The Company’s internal control over financial reporting is a process designed to provide reasonable assurance regarding the reliability of financial reporting and the preparation of financial statements for external purposes in accordance with GAAP and includes those policies and procedures that:
|
•
|
pertain to the maintenance of records that in reasonable detail, accurately and fairly reflect the transactions and dispositions of the assets of the Company;
|
|
•
|
provide reasonable assurance that transactions are recorded as necessary to permit preparation of financial statements in accordance with GAAP, and that receipts and expenditures of the Company are being made only in accordance with authorizations of management and directors of the Company; and
|
|
•
|
provide reasonable assurance that unauthorized acquisition, use or disposition of the Company’s assets that could have a material effect on the financial statements are prevented or detected timely.
|
Management, including our CEO and CFO, does not expect that our internal controls will prevent or detect all errors and all fraud. A control system, no matter how well designed and operated, can provide only reasonable, not absolute, assurance that the objectives of the control system are met. Further, the design of a control system must reflect the fact that there are resource constraints, and the benefits of controls must be considered relative to their costs. In addition, any evaluation of the effectiveness of controls is subject to risks that those internal controls may become inadequate in future periods because of changes in business conditions, or that the degree of compliance with the policies or procedures deteriorates.
Management assessed the effectiveness of our internal control over financial reporting as of
December 31, 2013
. In making this assessment, management used the criteria established in Internal Control—Integrated Framework issued by the Committee of Sponsoring Organizations (“COSO”) in 1992. Based on this assessment, management believes that the Company maintained effective internal control over financial reporting as of
December 31, 2013
.
The effectiveness of the Company’s internal control over financial reporting as of
December 31, 2013
, has been audited by Ernst & Young LLP, an independent registered public accounting firm, as stated in their report, which appears herein.
Changes in Internal Control Over Financial Reporting:
There were no changes that occurred during the quarter ended
December 31, 2013
that have materially affected, or are reasonably likely to materially affect, our internal control over financial reporting.
183
REPORT OF INDEPENDENT REGISTERED PUBLIC ACCOUNTING FIRM
The Board of Directors and Stockholders of The AES Corporation:
We have audited The AES Corporation’s internal control over financial reporting as of
December 31, 2013
based on criteria established in Internal Control-Integrated Framework issued by the Committee of Sponsoring Organizations of the Treadway Commission (1992 framework) (the COSO criteria). The AES Corporation’s management is responsible for maintaining effective internal control over financial reporting, and for its assessment of the effectiveness of internal control over financial reporting included in the accompanying Management’s Report on Internal Control over Financial Reporting. Our responsibility is to express an opinion on the Company’s internal control over financial reporting based on our audit.
We conducted our audit in accordance with the standards of the Public Company Accounting Oversight Board (United States). Those standards require that we plan and perform the audit to obtain reasonable assurance about whether effective internal control over financial reporting was maintained in all material respects. Our audit included obtaining an understanding of internal control over financial reporting, assessing the risk that a material weakness exists, testing and evaluating the design and operating effectiveness of internal control based on the assessed risk, and performing such other procedures as we considered necessary in the circumstances. We believe that our audit provides a reasonable basis for our opinion.
A company’s internal control over financial reporting is a process designed to provide reasonable assurance regarding the reliability of financial reporting and the preparation of financial statements for external purposes in accordance with generally accepted accounting principles. A company’s internal control over financial reporting includes those policies and procedures that (1) pertain to the maintenance of records that, in reasonable detail, accurately and fairly reflect the transactions and dispositions of the assets of the company; (2) provide reasonable assurance that transactions are recorded as necessary to permit preparation of financial statements in accordance with generally accepted accounting principles, and that receipts and expenditures of the company are being made only in accordance with authorizations of management and directors of the company; and (3) provide reasonable assurance regarding prevention or timely detection of unauthorized acquisition, use, or disposition of the company’s assets that could have a material effect on the financial statements.
Because of its inherent limitations, internal control over financial reporting may not prevent or detect misstatements. Also, projections of any evaluation of effectiveness to future periods are subject to the risk that controls may become inadequate because of changes in conditions, or that the degree of compliance with the policies or procedures may deteriorate.
In our opinion, The AES Corporation maintained, in all material respects, effective internal control over financial reporting as of
December 31, 2013
, based on the COSO criteria.
We also have audited, in accordance with the standards of the Public Company Accounting Oversight Board (United States), the consolidated balance sheets of The AES Corporation as of
December 31, 2013
and 2012, and the related consolidated statements of operations, comprehensive income, changes in equity, and cash flows for each of the three years in the period ended
December 31, 2013
of The AES Corporation and our report dated
February 25, 2014
expressed an unqualified opinion thereon.
/s/ Ernst & Young LLP
McLean, Virginia
February 25, 2014
None.
184
|
ITEM 10.
|
DIRECTORS, EXECUTIVE OFFICERS AND CORPORATE GOVERNANCE
|
The following information is incorporated by reference from the Registrant’s Proxy Statement for the Registrant’s 2014 Annual Meeting of Stock Holders which the Registrant expects will be filed on or around March 4, 2014 (the “2014 Proxy Statement”):
|
•
|
information regarding the directors required by this item found under the heading
Board of Directors
;
|
|
•
|
information regarding AES’s Code of Ethics found under the heading
AES Code of Business Conduct and Corporate Governance Guidelines
;
|
|
•
|
information regarding compliance with Section 16 of the Exchange Act required by this item found under the heading
Governance Matters—Section 16(a) Beneficial Ownership Reporting Compliance
; and
|
|
•
|
information regarding AES’s Financial Audit Committee found under the heading
The Committees of the Board—Financial Audit Committee (the “Audit Committee”).
|
Certain information regarding executive officers required by this Item is set forth as a supplementary item in Part I hereof (pursuant to Instruction 3 to Item 401(b) of Regulation S-K). The other information required by this Item, to the extent not included above, will be contained in our 2013 Proxy Statement and is herein incorporated by reference.
|
ITEM 11.
|
EXECUTIVE COMPENSATION
|
The following information is contained in the 2014 Proxy Statement and is incorporated by reference: the information regarding executive compensation contained under the heading
Compensation Discussion and Analysis
and the Compensation Committee Report on Executive Compensation under the heading
Report of the Compensation Committee
.
|
ITEM 12.
|
SECURITY OWNERSHIP OF CERTAIN BENEFICIAL OWNERS AND MANAGEMENT AND RELATED STOCKHOLDER MATTERS
|
|
(a)
|
Security Ownership of Certain Beneficial Owners.
|
See the information contained under the caption “Security Ownership of Certain Beneficial Owners, Directors, and Executive Officers” of the Proxy Statement for the 2014 Annual Meeting of Shareholders of the Registrant, which information is incorporated herein by reference.
|
(b)
|
Security Ownership of Directors and Executive Officers.
|
See the information contained under the caption “Security Ownership of Certain Beneficial Owners, Directors, and Executive Officers” of the Proxy Statement for the 2014 Annual Meeting of Shareholders of the Registrant, which information is incorporated herein by reference.
|
(c)
|
Changes in Control.
|
None.
|
(d)
|
Securities Authorized for Issuance under Equity Compensation Plans.
|
The following table provides information about shares of AES common stock that may be issued under AES’ equity compensation plans, as of December 31, 2013:
185
Securities Authorized for Issuance under Equity Compensation Plans (As of December 31, 2013)
|
(a)
|
(b)
|
(c)
|
|||||||
|
Plan category
|
Number of securities to be issued upon exercise of outstanding options, warrants and rights
|
Weighted average exercise price of outstanding options, warrants and rights
|
Number of securities remaining available for future issuance under equity compensation plans (excluding securities reflected in column (a))
|
||||||
|
Equity compensation plans approved by security holders
(1)
|
15,174,730
|
|
(2)
|
$
|
14.91
|
|
14,571,150
|
|
|
|
Equity compensation plans not approved by security holders
|
—
|
|
$
|
—
|
|
—
|
|
||
|
Total
|
15,174,730
|
|
$
|
14.91
|
|
14,571,150
|
|
||
|
(1)
|
The following equity compensation plans have been approved by the Company’s Stockholders:
|
|
(A)
|
The AES Corporation 2003 Long Term Compensation Plan was adopted in 2003 and provided for 17,000,000 shares authorized for issuance thereunder. In 2008, an amendment to the Plan to provide an additional 12,000,000 shares was approved by AES’s stockholders, bringing the total authorized shares to 29,000,000. In 2010, an additional amendment to the Plan to provide an additional 9,000,000 shares was approved by AES’s stockholders, bringing the total authorized shares to 38,000,000. The weighted average exercise price of Options outstanding under this plan included in Column (b) is $14.86 (excluding PSU and RSU awards), with 14,571,150 shares available for future issuance.
|
|
(B)
|
The AES Corporation 2001 Plan for outside directors adopted in 2001 provided for 2,750,000 shares authorized for issuance. The weighted average exercise price of Options outstanding under this plan included in Column (b) is $18.62. In conjunction with the 2010 amendment to the 2003 Long Term Compensation plan, ongoing award issuance from this plan was discontinued in 2010. Any remaining shares under this plan, which are not reserved for issuance under outstanding awards, are not available for future issuance and thus the amount of 2,061,723 shares is not included in Column (c) above.
|
|
(C)
|
The AES Corporation Second Amended and Restated Deferred Compensation Plan for directors provided for 2,000,000 shares authorized for issuance. Column (b) excludes the Director stock units granted thereunder. In conjunction with the 2010 amendment to the 2003 Long Term Compensation Plan, ongoing award issuance from this plan was discontinued in 2010 as Director stock units will be issued from the 2003 Long Term Compensation Plan. Any remaining shares under this plan, which are not reserved for issuance under outstanding awards, are not available for future issuance and thus the amount of 105,341 shares is not included in Column (c) above.
|
|
(D)
|
The AES Corporation Incentive Stock Option Plan adopted in 1991 provided for 57,500,000 shares authorized for issuance. The weighted average exercise price of Options outstanding under this plan included in Column (b) is $35.44. This plan terminated on June 1, 2001, such that no additional grants may be granted under the plan after that date. Any remaining shares under this plan, which are not reserved for issuance under outstanding awards, are not available for future issuance in light of this plan’s termination and thus 24,354,930 shares are not included in Column (c) above.
|
|
(2)
|
Includes 6,958,098 (of which 2,658,412 are vested and 4,299,686 are unvested) shares underlying PSU and RSU awards (assuming performance at a maximum level), 1,351,573 shares underlying Director stock unit awards, and 6,865,059 shares issuable upon the exercise of Stock Option grants, for an aggregate number of 15,174,730 shares.
|
|
ITEM 13.
|
CERTAIN RELATIONSHIPS AND RELATED TRANSACTIONS, AND DIRECTOR INDEPENDENCE
|
The information regarding related party transactions required by this item is included in the 2014 Proxy Statement found under the headings
Transactions with Related Persons, Proposal I: Election of Directors
and
The Committees of the Board
and are incorporated herein by reference.
|
ITEM 14.
|
PRINCIPAL ACCOUNTANT FEES AND SERVICES
|
The information concerning principal accountant fees and services included in the 2014 Proxy Statement contained under the heading
Information Regarding The Independent Registered Public Accounting Firm’s Fees, Services and Independence
and is incorporated herein by reference.
186
|
ITEM 15.
|
EXHIBITS AND FINANCIAL STATEMENT SCHEDULES
|
|
(a)
|
Financial Statements.
|
|
Financial Statements and Schedules:
|
Page
|
|
|
S-2-S-8
|
||
|
(b)
|
Exhibits.
|
|
3.1
|
Sixth Restated Certificate of Incorporation of The AES Corporation is incorporated herein by reference to Exhibit 3.1 of the Company’s Form 10-K for the year ended December 31, 2008.
|
|
|
3.2
|
By-Laws of The AES Corporation, as amended and incorporated herein by reference to Exhibit 3.1 of the Company’s Form 8-K filed on August 11, 2009.
|
|
|
4
|
There are numerous instruments defining the rights of holders of long-term indebtedness of the Registrant and its consolidated subsidiaries, none of which exceeds ten percent of the total assets of the Registrant and its subsidiaries on a consolidated basis. The Registrant hereby agrees to furnish a copy of any of such agreements to the Commission upon request. Since these documents are not required filings under Item 601 of Regulation S-K, the Company has elected to file certain of these documents as Exhibits 4.(a)—4.(p).
|
|
|
4.(a)
|
Junior Subordinated Indenture, dated as of March 1, 1997, between The AES Corporation and Wells Fargo Bank, National Association, as successor to Bank One, National Association (formerly known as The First National Bank of Chicago) is incorporated herein by reference to Exhibit 4.(a) of the Company’s Form 10-K for the year ended December 31, 2008.
|
|
|
4.(b)
|
Third Supplemental Indenture, dated as of October 14, 1999, between The AES Corporation and Wells Fargo Bank, National Association, as successor to Bank One, National Association is incorporated herein by reference to Exhibit 4.(b) of the Company’s Form 10-K for the year ended December 31, 2008.
|
|
|
4.(c)
|
Senior Indenture, dated as of December 8, 1998, between The AES Corporation and Wells Fargo Bank, National Association, as successor to Bank One, National Association (formerly known as The First National Bank of Chicago) is incorporated herein by reference to Exhibit 4.01 of the Company’s Form 8-K filed on December 11, 1998 (SEC File No. 001-12291).
|
|
|
4.(d)
|
Form of Second Supplemental Indenture, dated as of June 11, 1999, between The AES Corporation and Wells Fargo Bank, National Association, as successor to Bank One, National Association (formerly known as The First National Bank of Chicago) is incorporated herein by reference to Exhibit 4.01 of the Company’s Form 8-K filed on June 11, 1999 (SEC File No. 001-12291).
|
|
|
4.(e)
|
Third Supplemental Indenture, dated as of September 12, 2000, between The AES Corporation and Wells Fargo Bank, National Association, as successor to Bank One, National Association is incorporated herein by reference to Exhibit 4.(e) of the Company’s Form 10-K for the year ended December 31, 2008.
|
|
|
4.(f)
|
Form of Fifth Supplemental Indenture, dated as of February 9, 2001, between The AES Corporation and Wells Fargo Bank, National Association, as successor to Bank One, National Association is incorporated herein by reference to Exhibit 4.1 of the Company’s Form 8-K filed on February 8, 2001 (SEC File No. 001-12291).
|
|
|
4.(g)
|
Form of Sixth Supplemental Indenture, dated as of February 22, 2001, between The AES Corporation and Wells Fargo Bank, National Association, as successor to Bank One, National Association is incorporated herein by reference to Exhibit 4.1 of the Company’s Form 8-K filed on February 21, 2001 (SEC File No. 001-12291).
|
|
187
|
4.(h)
|
Ninth Supplemental Indenture, dated as of April 3, 2003, between The AES Corporation and Wells Fargo Bank, National Association (as successor by consolidation to Wells Fargo Bank Minnesota, National Association) is incorporated herein by reference to Exhibit 4.6 of the Company’s Form S-4 filed on December 7, 2007.
|
|
|
4.(i)
|
Form of Tenth Supplemental Indenture, dated as of February 13, 2004, between The AES Corporation and Wells Fargo Bank, National Association (as successor by consolidation to Wells Fargo Bank Minnesota, National Association) is incorporated herein by reference to Exhibit 4.1 of the Company’s Form 8-K filed on February 13, 2004 (SEC File No. 001-12291).
|
|
|
4.(j)
|
Eleventh Supplemental Indenture, dated as of October 15, 2007, between The AES Corporation and Wells Fargo Bank, National Association is incorporated herein by reference to Exhibit 4.7 of the Company’s Form S-4 filed on December 7, 2007.
|
|
|
4.(k)
|
Twelfth Supplemental Indenture, dated as of October 15, 2007, between The AES Corporation and Wells Fargo Bank, National Association is incorporated herein by reference to Exhibit 4.8 of the Company’s Form S-4 filed on December 7, 2007.
|
|
|
4.(l)
|
Thirteenth Supplemental Indenture, dated as of May 19, 2008, between The AES Corporation and Wells Fargo Bank, National Association is incorporated herein by reference to Exhibit 4.(l) of the Company’s Form 10-K for the year ended December 31, 2008.
|
|
|
4.(m)
|
Fourteenth Supplemental Indenture, dated as of April 2, 2009, between The AES Corporation and Wells Fargo Bank, National Association is incorporated herein by reference to Exhibit 99.1 of the Company’s Form 8-K filed on April 2, 2009.
|
|
|
4.(n)
|
Fifteenth Supplemental Indenture, dated as of June 15, 2011, between The AES Corporation and Wells Fargo Bank, National Association is incorporated herein by reference to Exhibit 4.3 of the Company’s Form 8-K filed on June 15, 2011.
|
|
|
4.(o)
|
Indenture, dated October 3, 2011, between Dolphin Subsidiary II, Inc. and Wells Fargo Bank, National Association is incorporated herein by reference to Exhibit 4.1 of the Company’s Form 8-K filed on October 5, 2011.
|
|
|
4.(p)
|
Sixteenth Supplemental Indenture, dated April 30, 2013, between The AES Corporation and Wells Fargo Bank, N.A., as Trustee is incorporated herein by reference to Exhibit 4.1 of the Company's Form 8-K filed on April 30, 2013 (SEC File No. 001-12291).
|
|
|
10.1
|
The AES Corporation Profit Sharing and Stock Ownership Plan are incorporated herein by reference to Exhibit 4(c)(1) of the Registration Statement on Form S-8 (Registration No. 33-49262) filed on July 2, 1992.
|
|
|
10.2
|
The AES Corporation Incentive Stock Option Plan of 1991, as amended, is incorporated herein by reference to Exhibit 10.30 of the Company’s Form 10-K for the year ended December 31, 1995 (SEC File No. 00019281).
|
|
|
10.3
|
Applied Energy Services, Inc. Incentive Stock Option Plan of 1982 is incorporated herein by reference to Exhibit 10.31 of the Registration Statement on Form S-1 (Registration No. 33-40483).
|
|
|
10.4
|
Deferred Compensation Plan for Executive Officers, as amended, is incorporated herein by reference to Exhibit 10.32 of Amendment No. 1 to the Registration Statement on Form S-1 (Registration No. 33-40483).
|
|
|
10.5
|
Deferred Compensation Plan for Directors, as amended and restated, on February 17, 2012 is incorporated herein by reference to Exhibit 10.5 of the Company's Form 10-K for the year ended December 31, 2012.
|
|
|
10.6
|
The AES Corporation Stock Option Plan for Outside Directors, as amended and restated, on December 7, 2007 is incorporated herein by reference to Exhibit 10.6 of the Company's Form 10-K for the year ended December 31, 2012.
|
|
|
10.7
|
The AES Corporation Supplemental Retirement Plan is incorporated herein by reference to Exhibit 10.63 of the Company’s Form 10-K for the year ended December 31, 1994 (SEC File No. 00019281).
|
|
|
10.7A
|
Amendment to The AES Corporation Supplemental Retirement Plan, dated March 13, 2008 is incorporated herein by reference to Exhibit 10.9.A of the Company’s Form 10-K for the year ended December 31, 2007.
|
|
|
10.8
|
The AES Corporation 2001 Stock Option Plan is incorporated herein by reference to Exhibit 10.12 of the Company’s Form 10-K for the year ended December 31, 2000 (SEC File No. 001-12291).
|
|
|
10.9
|
Second Amended and Restated Deferred Compensation Plan for Directors is incorporated herein by reference to Exhibit 10.13 of the Company’s Form 10-K for the year ended December 31, 2000 (SEC File No. 001-12291).
|
|
|
10.10
|
The AES Corporation 2001 Non-Officer Stock Option Plan is incorporated herein by reference to Exhibit 10.12 of the Company’s Form 10-K for the year ended December 31, 2002 (SEC File No. 001-12291).
|
|
188
|
10.10A
|
Amendment to the 2001 Stock Option Plan and 2001 Non-Officer Stock Option Plan, dated March 13, 2008 is incorporated herein by reference to Exhibit 10.12.A of the Company’s Form 10-K for the year ended December 31, 2007.
|
|
|
10.11
|
The AES Corporation 2003 Long Term Compensation Plan, as amended and restated on April 22, 2010, is incorporated herein by reference to Exhibit 10.1 of the Company’s Form 8-K filed on April 27, 2010.
|
|
|
10.12
|
Form of AES Nonqualified Stock Option Award Agreement under The AES Corporation 2003 Long Term Compensation Plan (Outside Directors) is incorporated herein by reference to Exhibit 10.2 of the Company’s Form 8-K filed on April 27, 2010.
|
|
|
10.13
|
Form of AES Performance Stock Unit Award Agreement under The AES Corporation 2003 Long Term Compensation Plan (filed herewith).
|
|
|
10.14
|
Form of AES Restricted Stock Unit Award Agreement under The AES Corporation 2003 Long Term Compensation Plan (filed herewith).
|
|
|
10.15
|
Form of AES Performance Unit Award Agreement under The AES Corporation 2003 Long Term Compensation Plan (filed herewith).
|
|
|
10.16
|
Form of AES Nonqualified Stock Option Award Agreement under The AES Corporation 2003 Long Term Compensation Plan (filed herewith).
|
|
|
10.17
|
The AES Corporation Restoration Supplemental Retirement Plan, as amended and restated, dated December 29, 2008 is incorporated herein by reference to Exhibit 10.15 of the Company’s Form 10-K for the year ended December 31, 2008.
|
|
|
10.17A
|
Amendment to The AES Corporation Restoration Supplemental Retirement Plan, dated December 9, 2011 is incorporated herein by reference to Exhibit 10.17A of the Company's Form 10-K for the year ended December 31, 2012.
|
|
|
10.18
|
The AES Corporation International Retirement Plan, as amended and restated on December 29, 2008 is incorporated herein by reference to Exhibit 10.16 of the Company’s Form 10-K for the year ended December 31, 2008.
|
|
|
10.18A
|
Amendment to The AES Corporation International Retirement Plan, dated December 9, 2011 is incorporated herein by reference to Exhibit 10.18A of the Company's Form 10-K for the year ended December 31, 2012.
|
|
|
10.19
|
The AES Corporation Severance Plan, as amended and restated on October 28, 2011 is incorporated herein by reference to Exhibit 10.19 of the Company’s Form 10-K for the year ended December 31, 2011.
|
|
|
10.20
|
The AES Corporation Amended and Restated Executive Severance Plan dated August 1, 2012 is incorporated herein by reference to Exhibit 10.2 of the Company’s Form 10-Q for the period ended June 30, 2012.
|
|
|
10.21
|
The AES Corporation Performance Incentive Plan, as amended and restated on April 22, 2010 is incorporated herein by reference to Exhibit 10.4 of the Company’s Form 8-K filed on April 27, 2010.
|
|
|
10.22
|
The AES Corporation Deferred Compensation Program For Directors dated February 17, 2012 is incorporated herein by reference to Exhibit 10.22 of the Company’s Form 10-K filed on December 31, 2011.
|
|
|
10.23
|
The AES Corporation Amended and Restated Employment Agreement with Paul Hanrahan is incorporated herein by reference to Exhibit 99.1 of the Company’s Form 8-K filed on December 31, 2008.
|
|
|
10.24
|
The AES Corporation Amended and Restated Employment Agreement with Victoria D. Harker is incorporated herein by reference to Exhibit 99.2 of the Company’s Form 8-K filed on December 31, 2008.
|
|
|
10.25
|
The AES Corporation Employment Agreement with Andrés Gluski is incorporated herein by reference to Exhibit 99.3 of the Company’s Form 8-K filed on December 31, 2008.
|
|
|
10.26
|
Separation Agreement, between Paul T. Hanrahan and The AES Corporation dated September 4, 2011 is incorporated by reference to Exhibit 10.1 of the Company’s Form 10-Q for the period ended September 30, 2011.
|
|
|
10.27
|
Mutual Agreement, between Andrés Gluski and The AES Corporation dated October 7, 2011 is incorporated herein by reference to Exhibit 10.2 of the Company’s Form 10-Q for the period ended September 30, 2011.
|
|
|
10.28
|
Separation Agreement, dated April 27, 2012, between the Company and Victoria D. Harker is incorporated herein by reference to Exhibit 10.1 of the Company’s Form 10-Q for the period ended June 30, 2012.
|
|
189
|
10.29
|
Separation Agreement, dated November 19, 2012 between the Company and Edward C. Hall, III is incorporated herein by reference to Exhibit 10.29 of the Company's Form 10-K for the year ended December 31, 2012.
|
|
|
10.30
|
Amendment No. 3, dated as of July 26, 2013 to the Fifth Amended and Restated Credit and Reimbursement Agreement, dated as of July 29, 2010 is incorporated herein by reference to Exhibit 10.1 of the Company's Form 8-K filed on July 29, 2013.
|
|
|
10.30A
|
Sixth Amended and Restated Credit and Reimbursement Agreement dated as of July 26, 2013 among The AES Corporation, a Delaware corporation, the Banks listed on the signature pages thereof, Citibank, N.A., as Administrative Agent and Collateral Agent, Citigroup Global Markets Inc., as Lead Arranger and Book Runner, Banc of America Securities LLC, as Lead Arranger and Book Runner and Co-Syndication Agent, Barclays Capital, as Lead Arranger and Book Runner and Co-Syndication Agent, RBS Securities Inc., as Lead Arranger and Book Runner and Co-Syndication Agent and Union Bank, N.A., as Lead Arranger and Book Runner and Co-Syndication Agent is incorporated herein by reference to Exhibit 10.1.A of the Company's Form 8-K filed on July 29, 2013.
|
|
|
10.30B
|
Appendices and Exhibits to the Sixth Amended and Restated Credit and Reimbursement Agreement, dated as of July 29, 2013 is incorporated herein by reference to Exhibit 10.1.B of the Company’s Form 8-K filed on July 29, 2013.
|
|
|
10.31
|
Collateral Trust Agreement dated as of December 12, 2002 among The AES Corporation, AES International Holdings II, Ltd., Wilmington Trust Company, as corporate trustee and Bruce L. Bisson, an individual trustee is incorporated herein by reference to Exhibit 4.2 of the Company’s Form 8-K filed on December 17, 2002 (SEC File No. 001-12291).
|
|
|
10.32
|
Security Agreement dated as of December 12, 2002 made by The AES Corporation to Wilmington Trust Company, as corporate trustee and Bruce L. Bisson, as individual trustee is incorporated herein by reference to Exhibit 4.3 of the Company’s Form 8-K filed on December 17, 2002 (SEC File No. 001-12291).
|
|
|
10.33
|
Charge Over Shares dated as of December 12, 2002 between AES International Holdings II, Ltd. and Wilmington Trust Company, as corporate trustee and Bruce L. Bisson, as individual trustee is incorporated herein by reference to Exhibit 4.4 of the Company’s Form 8-K filed on December 17, 2002 (SEC File No. 001-12291).
|
|
|
10.34
|
Stock Purchase Agreement between The AES Corporation and Terrific Investment Corporation dated November 6, 2009 is incorporated herein by reference to Exhibit 10.1 of the Company’s Form 8-K filed on November 11, 2009.
|
|
|
10.35
|
Stockholder Agreement between The AES Corporation and Terrific Investment Corporation dated March 12, 2010 is incorporated herein by reference to Exhibit 10.1 of the Company’s Form 8-K filed on March 15, 2010.
|
|
|
10.36
|
Agreement and Plan of Merger, dated April 19, 2011, by and among The AES Corporation, DPL Inc. and Dolphin Sub, Inc. is incorporated herein by reference to Exhibit 2.1 of the Company’s Form 8-K filed on April 20, 2011.
|
|
|
10.37
|
Credit Agreement dated as of May 27, 2011 among The AES Corporation, as borrower, the banks listed therein and Bank of America, N.A., as administrative agent is incorporated herein by reference to Exhibit 10.1 of the Company’s Form 8-K filed on June 1, 2011.
|
|
|
10.37A
|
Amendment No.1 dated February 27, 2013 to the Credit Agreement dated as of May 27, 2011 among The AES Corporation, as borrower, the banks listed therein and Bank of America N.A., as administrative agent is incorporated herein by reference to exhibit 10.1 of the Company's Form 10-Q for the period ending March 31, 2013.
|
|
|
10.38
|
Common Stock Repurchase Agreement, dated as of December 11, 2013, by and between The AES Corporation and Terrific Investment Corporation is incorporated herein by reference to Exhibit 10.1 of the Company's Form 8-K filed on December 13, 2013.
|
|
|
12
|
Statement of computation of ratio of earnings to fixed charges (filed herewith).
|
|
|
21
|
Subsidiaries of The AES Corporation (filed herewith).
|
|
|
23.1
|
Consent of Independent Registered Public Accounting Firm, Ernst & Young LLP (filed herewith).
|
|
|
24
|
Powers of Attorney (filed herewith).
|
|
|
31.1
|
Rule 13a-14(a)/15d-14(a) Certification of Andrés Gluski (filed herewith).
|
|
|
31.2
|
Rule 13a-14(a)/15d-14(a) Certification of Thomas M. O’Flynn (filed herewith).
|
|
|
32.1
|
Section 1350 Certification of Andrés Gluski (filed herewith).
|
|
|
32.2
|
Section 1350 Certification of Thomas M. O’Flynn (filed herewith).
|
|
190
|
101.INS
|
XBRL Instance Document (filed herewith).
|
|
|
101.SCH
|
XBRL Taxonomy Extension Schema Document (filed herewith).
|
|
|
101.CAL
|
XBRL Taxonomy Extension Calculation Linkbase Document (filed herewith).
|
|
|
101.DEF
|
XBRL Taxonomy Extension Definition Linkbase Document (filed herewith).
|
|
|
101.LAB
|
XBRL Taxonomy Extension Label Linkbase Document (filed herewith).
|
|
|
101.PRE
|
XBRL Taxonomy Extension Presentation Linkbase Document (filed herewith).
|
|
|
(c)
|
Schedules
|
Schedule I—Condensed Financial Information of Registrant
Schedule II—Valuation and Qualifying Accounts
191
SIGNATURES
Pursuant to the requirements of Section 13 or 15(d) of the Securities Exchange Act of 1934, as amended, the Company has duly caused this report to be signed on its behalf by the undersigned, thereunto duly authorized.
|
THE AES CORPORATION
(Company)
|
||||
|
Date:
|
February 25, 2014
|
By:
|
/s/ A
NDRÉS
G
LUSKI
|
|
|
Name:
|
Andrés Gluski
|
|||
|
President, Chief Executive Officer
|
||||
Pursuant to the requirements of the Securities Exchange Act of 1934, as amended, this report has been signed below by the following persons on behalf of the Company and in the capacities and on the dates indicated.
|
Name
|
Title
|
Date
|
||
|
*
|
President, Chief Executive Officer (Principal Executive Officer) and Director
|
|||
|
Andrés Gluski
|
February 25, 2014
|
|||
|
*
|
Director
|
|||
|
Zhang Guobao
|
February 25, 2014
|
|||
|
*
|
Director
|
|||
|
Charles L. Harrington
|
February 25, 2014
|
|||
|
*
|
Director
|
|||
|
Kristina M. Johnson
|
February 25, 2014
|
|||
|
*
|
Director
|
|||
|
Tarun Khanna
|
February 25, 2014
|
|||
|
*
|
Director
|
|||
|
Philip Lader
|
February 25, 2014
|
|||
|
*
|
Director
|
|||
|
James H. Miller
|
February 25, 2014
|
|||
|
*
|
Director
|
|||
|
Sandra O. Moose
|
February 25, 2014
|
|||
|
*
|
Director
|
|||
|
John B. Morse
|
February 25, 2014
|
|||
|
*
|
Director
|
|||
|
Moises Naim
|
February 25, 2014
|
|||
|
*
|
Chairman of the Board and Lead Independent Director
|
|||
|
Charles O. Rossotti
|
February 25, 2014
|
|||
|
*
|
Director
|
|||
|
Sven Sandstrom
|
February 25, 2014
|
|||
|
/s/ T
HOMAS
M. O’F
LYNN
|
Executive Vice President and Chief Financial Officer (Principal Financial Officer)
|
|||
|
Thomas M. O’Flynn
|
February 25, 2014
|
|||
|
/s/ SHARON A. VIRAG
|
Vice President and Controller (Principal Accounting Officer)
|
|||
|
Sharon A. Virag
|
February 25, 2014
|
|||
|
*By:
|
/s/ BRIAN A. MILLER
|
February 25, 2014
|
|
|
Attorney-in-fact
|
|||
192
THE AES CORPORATION AND SUBSIDIARIES
INDEX TO FINANCIAL STATEMENT SCHEDULES
Schedules other than those listed above are omitted as the information is either not applicable, not required, or has been furnished in the financial statements or notes thereto included in Item 8 hereof.
See Notes to Schedule I
S-1
THE AES CORPORATION
SCHEDULE I CONDENSED FINANCIAL INFORMATION OF PARENT
BALANCE SHEETS
|
December 31,
|
||||||||
|
2013
|
2012
|
|||||||
|
(in millions)
|
||||||||
|
ASSETS
|
||||||||
|
Current Assets:
|
||||||||
|
Cash and cash equivalents
|
$
|
131
|
|
$
|
305
|
|
||
|
Restricted cash
|
177
|
|
227
|
|
||||
|
Accounts and notes receivable from subsidiaries
|
708
|
|
594
|
|
||||
|
Deferred income taxes
|
4
|
|
8
|
|
||||
|
Prepaid expenses and other current assets
|
39
|
|
28
|
|
||||
|
Total current assets
|
1,059
|
|
1,162
|
|
||||
|
Investment in and advances to subsidiaries and affiliates
|
9,245
|
|
9,393
|
|
||||
|
Office Equipment:
|
||||||||
|
Cost
|
78
|
|
86
|
|
||||
|
Accumulated depreciation
|
(65
|
)
|
(72
|
)
|
||||
|
Office equipment, net
|
13
|
|
14
|
|
||||
|
Other Assets:
|
||||||||
|
Deferred financing costs (net of accumulated amortization of $71 and $58, respectively)
|
75
|
|
76
|
|
||||
|
Deferred income taxes
|
857
|
|
573
|
|
||||
|
Other Assets
|
1
|
|
—
|
|
||||
|
Total other assets
|
933
|
|
649
|
|
||||
|
Total
|
$
|
11,250
|
|
$
|
11,218
|
|
||
|
LIABILITIES AND STOCKHOLDERS’ EQUITY
|
||||||||
|
Current Liabilities:
|
||||||||
|
Accounts payable
|
$
|
15
|
|
$
|
15
|
|
||
|
Accounts and notes payable to subsidiaries
|
49
|
|
50
|
|
||||
|
Accrued and other liabilities
|
216
|
|
241
|
|
||||
|
Senior notes payable—current portion
|
118
|
|
11
|
|
||||
|
Total current liabilities
|
398
|
|
317
|
|
||||
|
Long-term Liabilities:
|
||||||||
|
Senior notes payable
|
5,034
|
|
5,434
|
|
||||
|
Junior subordinated notes and debentures payable
|
517
|
|
517
|
|
||||
|
Accounts and notes payable to subsidiaries
|
859
|
|
242
|
|
||||
|
Other long-term liabilities
|
112
|
|
139
|
|
||||
|
Total long-term liabilities
|
6,522
|
|
6,332
|
|
||||
|
Stockholders’ equity:
|
||||||||
|
Common stock
|
8
|
|
8
|
|
||||
|
Additional paid-in capital
|
8,443
|
|
8,525
|
|
||||
|
Accumulated deficit
|
(150
|
)
|
(264
|
)
|
||||
|
Accumulated other comprehensive loss
|
(2,882
|
)
|
(2,920
|
)
|
||||
|
Treasury stock
|
(1,089
|
)
|
(780
|
)
|
||||
|
Total stockholders’ equity
|
4,330
|
|
4,569
|
|
||||
|
Total
|
$
|
11,250
|
|
$
|
11,218
|
|
||
See Notes to Schedule I.
S-2
THE AES CORPORATION
SCHEDULE I CONDENSED FINANCIAL INFORMATION OF PARENT
STATEMENTS OF OPERATIONS
|
For the Years Ended December 31
|
||||||||||||
|
2013
|
2012
|
2011
|
||||||||||
|
(in millions)
|
||||||||||||
|
Revenue from subsidiaries and affiliates
|
$
|
32
|
|
$
|
20
|
|
$
|
59
|
|
|||
|
Equity in earnings (loss) of subsidiaries and affiliates
|
498
|
|
(437
|
)
|
352
|
|
||||||
|
Interest income
|
66
|
|
119
|
|
158
|
|
||||||
|
General and administrative expenses
|
(171
|
)
|
(213
|
)
|
(227
|
)
|
||||||
|
Other Income
|
14
|
|
99
|
|
4
|
|
||||||
|
Other Expense
|
(11
|
)
|
(15
|
)
|
(18
|
)
|
||||||
|
Loss on extinguishment of debt
|
(165
|
)
|
(4
|
)
|
—
|
|
||||||
|
Interest expense
|
(436
|
)
|
(502
|
)
|
(444
|
)
|
||||||
|
Income (loss) before income taxes
|
(173
|
)
|
(933
|
)
|
(116
|
)
|
||||||
|
Income tax benefit (expense)
|
287
|
|
21
|
|
174
|
|
||||||
|
Net income (loss)
|
$
|
114
|
|
$
|
(912
|
)
|
$
|
58
|
|
|||
See Notes to Schedule I.
S-3
THE AES CORPORATION
SCHEDULE I CONDENSED FINANCIAL INFORMATION OF PARENT
STATEMENTS OF COMPREHENSIVE INCOME
YEARS ENDED DECEMBER 31, 2013, 2012, AND 2011
|
2013
|
2012
|
2011
|
||||||||||
|
(in millions)
|
||||||||||||
|
NET INCOME (LOSS)
|
$
|
114
|
|
$
|
(912
|
)
|
$
|
58
|
|
|||
|
Available-for-sale securities activity:
|
||||||||||||
|
Change in fair value of available-for-sale securities, net of income tax (expense) benefit of $0, $0 and $0, respectively
|
(1
|
)
|
1
|
|
1
|
|
||||||
|
Reclassification to earnings, net of income tax (expense) benefit of $0, $0 and $0, respectively
|
1
|
|
(1
|
)
|
(2
|
)
|
||||||
|
Total change in fair value of available-for-sale securities
|
—
|
|
—
|
|
(1
|
)
|
||||||
|
Foreign currency translation activity:
|
||||||||||||
|
Foreign currency translation adjustments, net of income tax (expense) benefit of $10, $0 and $18, respectively
|
(263
|
)
|
(127
|
)
|
(297
|
)
|
||||||
|
Reclassification to earnings, net of income tax (expense) benefit of $0, $0 and $0, respectively
|
36
|
|
37
|
|
154
|
|
||||||
|
Total foreign currency translation adjustments, net of tax
|
(227
|
)
|
(90
|
)
|
(143
|
)
|
||||||
|
Derivative activity:
|
||||||||||||
|
Change in derivative fair value, net of income tax (expense) benefit of $(31), $33 and $95, respectively
|
46
|
|
(108
|
)
|
(311
|
)
|
||||||
|
Reclassification to earnings, net of income tax (expense) benefit of $(32), $(51) and $(21), respectively
|
128
|
|
161
|
|
121
|
|
||||||
|
Total change in fair value of derivatives, net of tax
|
174
|
|
53
|
|
(190
|
)
|
||||||
|
Pension activity:
|
||||||||||||
|
Prior service cost for the period, net of tax
|
—
|
|
(1
|
)
|
—
|
|
||||||
|
Net actuarial (loss) for the period, net of income tax (expense) benefit of $(42), $64 and $25, respectively
|
78
|
|
(130
|
)
|
(43
|
)
|
||||||
|
Amortization of net actuarial loss, net of income tax (expense) benefit of $(5), $(5) and $(1), respectively
|
13
|
|
6
|
|
2
|
|
||||||
|
Total change in unfunded pension obligation
|
91
|
|
(125
|
)
|
(41
|
)
|
||||||
|
OTHER COMPREHENSIVE INCOME (LOSS)
|
38
|
|
(162
|
)
|
(375
|
)
|
||||||
|
COMPREHENSIVE INCOME (LOSS)
|
$
|
152
|
|
$
|
(1,074
|
)
|
$
|
(317
|
)
|
|||
See Notes to Schedule I.
S-4
THE AES CORPORATION
SCHEDULE I CONDENSED FINANCIAL INFORMATION OF PARENT
STATEMENTS OF CASH FLOWS
|
For the Years Ended December 31,
|
||||||||||||
|
2013
|
2012
|
2011
|
||||||||||
|
(in millions)
|
||||||||||||
|
Net cash provided by operating activities
|
$
|
418
|
|
$
|
694
|
|
$
|
719
|
|
|||
|
Investing Activities:
|
||||||||||||
|
Proceeds from asset sales, net of expenses
|
(5
|
)
|
—
|
|
—
|
|
||||||
|
Investment in and net advances to subsidiaries
|
201
|
|
(168
|
)
|
(2,655
|
)
|
||||||
|
Return of capital
|
230
|
|
660
|
|
304
|
|
||||||
|
(Increase) decrease in restricted cash
|
50
|
|
44
|
|
(261
|
)
|
||||||
|
Additions to property, plant and equipment
|
(11
|
)
|
(24
|
)
|
(28
|
)
|
||||||
|
(Purchase) sale of short term investments, net
|
1
|
|
1
|
|
2
|
|
||||||
|
Net cash provided by (used in) investing activities
|
466
|
|
513
|
|
(2,638
|
)
|
||||||
|
Financing Activities:
|
||||||||||||
|
Borrowings (payments) under the revolver, net
|
—
|
|
(295
|
)
|
295
|
|
||||||
|
Borrowings of notes payable and other coupon bearing securities
|
750
|
|
—
|
|
2,050
|
|
||||||
|
Repayments of notes payable and other coupon bearing securities
|
(1,210
|
)
|
(236
|
)
|
(477
|
)
|
||||||
|
Loans (to) from subsidiaries
|
(152
|
)
|
(236
|
)
|
(5
|
)
|
||||||
|
Purchase of treasury stock
|
(322
|
)
|
(301
|
)
|
(279
|
)
|
||||||
|
Proceeds from issuance of common stock
|
13
|
|
8
|
|
4
|
|
||||||
|
Common stock dividends paid
|
(119
|
)
|
(30
|
)
|
—
|
|
||||||
|
Payments for deferred financing costs
|
(17
|
)
|
(1
|
)
|
(75
|
)
|
||||||
|
Net cash (used in) provided by financing activities
|
(1,057
|
)
|
(1,091
|
)
|
1,513
|
|
||||||
|
Effect of exchange rate changes on cash
|
(1
|
)
|
—
|
|
1
|
|
||||||
|
Increase (decrease) in cash and cash equivalents
|
(174
|
)
|
116
|
|
(405
|
)
|
||||||
|
Cash and cash equivalents, beginning
|
305
|
|
189
|
|
594
|
|
||||||
|
Cash and cash equivalents, ending
|
$
|
131
|
|
$
|
305
|
|
$
|
189
|
|
|||
|
Supplemental Disclosures:
|
||||||||||||
|
Cash payments for interest, net of amounts capitalized
|
$
|
442
|
|
$
|
479
|
|
$
|
392
|
|
|||
|
Cash payments for income taxes, net of refunds
|
$
|
11
|
|
$
|
—
|
|
$
|
(6
|
)
|
|||
See Notes to Schedule I.
S-5
THE AES CORPORATION
SCHEDULE I
NOTES TO SCHEDULE I
1. Application of Significant Accounting Principles
The Schedule I Condensed Financial Information of the Parent includes the accounts of The AES Corporation (the “Parent Company”) and certain holding companies.
Accounting for Subsidiaries and Affiliates
—The Parent Company has accounted for the earnings of its subsidiaries on the equity method in the financial information.
Income Taxes
—Positions taken on the Parent Company’s income tax return which satisfy a more-likely-than-not threshold will be recognized in the financial statements. The income tax expense or benefit computed for the Parent Company reflects the tax assets and liabilities on a stand-alone basis and the effect of filing a consolidated U.S. income tax return with certain other affiliated companies.
Accounts and Notes Receivable from Subsidiaries
—Amounts have been shown in current or long-term assets based on terms in agreements with subsidiaries, but payment is dependent upon meeting conditions precedent in the subsidiary loan agreements.
Reclassifications
—During the current year, certain amounts that have previously been reported as part of General and administrative expenses on the Statement of Operations have been reclassified to Loss on extinguishment of debt, Other income or Other expense. The prior period amounts reported as General and administrative expenses have been reclassified to conform to current presentation.
2. Debt
Senior Notes and Loans Payable
|
December 31,
|
|||||||||||||
|
Interest Rate
|
Maturity
|
2013
|
2012
|
||||||||||
|
(in millions)
|
|||||||||||||
|
Senior Unsecured Note
|
7.75%
|
2014
|
$
|
110
|
|
$
|
500
|
|
|||||
|
Senior Unsecured Note
|
7.75%
|
2015
|
356
|
|
500
|
|
|||||||
|
Senior Unsecured Note
|
9.75%
|
2016
|
369
|
|
535
|
|
|||||||
|
Senior Unsecured Note
|
8.00%
|
2017
|
1,150
|
|
1,500
|
|
|||||||
|
Senior Secured Term Loan
|
LIBOR + 2.75%
|
2018
|
799
|
|
807
|
|
|||||||
|
Revolving Loan under Senior Secured Credit Facility
|
LIBOR + 2.25%
|
2018
|
—
|
|
—
|
|
|||||||
|
Senior Unsecured Note
|
8.00
|
%
|
2020
|
625
|
|
625
|
|
||||||
|
Senior Unsecured Note
|
7.38%
|
2021
|
1,000
|
|
1,000
|
|
|||||||
|
Senior Unsecured Note
|
4.88%
|
2023
|
750
|
|
—
|
|
|||||||
|
Unamortized discounts
|
(7
|
)
|
(22
|
)
|
|||||||||
|
SUBTOTAL
|
5,152
|
|
5,445
|
|
|||||||||
|
Less: Current maturities
|
(118
|
)
|
(11
|
)
|
|||||||||
|
Total
|
$
|
5,034
|
|
$
|
5,434
|
|
|||||||
Junior Subordinated Notes Payable
|
December 31,
|
||||||||||||
|
Interest Rate
|
Maturity
|
2013
|
2012
|
|||||||||
|
(in millions)
|
||||||||||||
|
Term Convertible Trust Securities
|
6.75%
|
2029
|
$
|
517
|
|
$
|
517
|
|
||||
FUTURE MATURITIES OF DEBT
—Recourse debt as of December 31, 2013 is scheduled to reach maturity as set forth in the table below:
S-6
|
December 31,
|
Annual Maturities
|
||
|
(in millions)
|
|||
|
2014
|
$
|
118
|
|
|
2015
|
364
|
|
|
|
2016
|
368
|
|
|
|
2017
|
1,158
|
|
|
|
2018
|
764
|
|
|
|
Thereafter
|
2,897
|
|
|
|
Total debt
|
$
|
5,669
|
|
3. Dividends from Subsidiaries and Affiliates
Cash dividends received from consolidated subsidiaries and from affiliates accounted for by the equity method were as follows:
|
2013
|
2012
|
2011
|
||||||||||
|
(in millions)
|
||||||||||||
|
Subsidiaries
|
$
|
818
|
|
$
|
1,140
|
|
$
|
1,091
|
|
|||
|
Affiliates
|
—
|
|
—
|
|
—
|
|
||||||
4. Guarantees and Letters of Credit
GUARANTEES
—In connection with certain of its project financing, acquisition, and power purchase agreements, the Company has expressly undertaken limited obligations and commitments, most of which will only be effective or will be terminated upon the occurrence of future events. These obligations and commitments, excluding those collateralized by letter of credit and other obligations discussed below, were limited as of December 31, 2013, by the terms of the agreements, to an aggregate of approximately
$661 million
representing
21
agreements with individual exposures ranging from less than
$1 million
up to
$280 million
.
LETTERS OF CREDIT
—At December 31, 2013, the Company had
$1 million
in letters of credit outstanding under the senior unsecured credit facility representing
3
agreements with individual exposures ranging up to less than
$1 million
, which operate to guarantee performance relating to certain project development and construction activities and subsidiary operations. At December 31, 2013, the Company had
$163 million
in cash collateralized letters of credit outstanding representing
12
agreements with individual exposures ranging from less than
$1 million
up to
$109 million
, which operate to guarantee performance relating to certain project development and construction activities and subsidiary operations. During 2013, the Company paid letter of credit fees ranging from
0.2%
to
3.25%
per annum on the outstanding amounts.
S-7
THE AES CORPORATION
SCHEDULE II
VALUATION AND QUALIFYING ACCOUNTS
(IN MILLIONS)
|
Balance at Beginning of the Period
|
Charged to Cost and Expense
|
Amounts Written off
|
Translation Adjustment
|
Balance at the End of the Period
|
||||||||||||||||
|
Allowance for accounts receivables
|
||||||||||||||||||||
|
(current and noncurrent)
|
||||||||||||||||||||
|
Year ended December 31, 2011
|
$
|
212
|
|
$
|
26
|
|
$
|
(41
|
)
|
$
|
(22
|
)
|
$
|
175
|
|
|||||
|
Year ended December 31, 2012
|
175
|
|
114
|
|
(79
|
)
|
(15
|
)
|
195
|
|
||||||||||
|
Year ended December 31, 2013
|
195
|
|
38
|
|
(77
|
)
|
(22
|
)
|
134
|
|
||||||||||
S-8
TABLE OF CONTENTS
Part IItem 1. BusinessItem 8. - Financial Statements and Supplementary InformationItem 1A. Risk FactorsItem 1B. Unresolved Staff CommentsItem 2. PropertiesItem 3. Legal ProceedingsItem 4. Mine Safety DisclosuresPart IIItem 5. Market For Registrant S Common Equity, Related Stockholder Matters and Issuer Purchases Of Equity SecuritiesItem 6. Selected Financial DataItem 7. Management S Discussion and Analysis Of Financial Condition and Results Of OperationsItem 7A. Quantitative and Qualitative Disclosures About Market RiskItem 8. Financial Statements and Supplementary DataItem 9. Changes in and Disagreements with Accountants on Accounting and Financial DisclosureItem 9A. Controls and ProceduresItem 9B. Other InformationPart IIIItem 10. Directors, Executive Officers and Corporate GovernanceItem 11. Executive CompensationItem 12. Security Ownership Of Certain Beneficial Owners and Management and Related Stockholder MattersItem 13. Certain Relationships and Related Transactions, and Director IndependenceItem 14. Principal Accountant Fees and ServicesPart IVItem 15. Exhibits and Financial Statement Schedules