AES CORP
10-Ks and 10-Qs
|
|
|
|
|
|
|
|
|
|
|
|
|
|
|
|
|
|
|
|
|
|
|
|
|
|
|
|
|
|
|
|
|
|
|
|
|
|
|
|
|
|
|
|
|
|
|
|
|
|
|
|
|
|
|
|
|
|
|
UNITED STATES
SECURITIES AND EXCHANGE COMMISSION
WASHINGTON, D.C. 20549
____________________________________
FORM 10-K
_____________________________________
|
x
|
ANNUAL REPORT PURSUANT TO SECTION 13 OR 15(d) OF THE SECURITIES EXCHANGE ACT OF 1934
|
For the Fiscal Year Ended
December 31, 2016
-OR-
|
¨
|
TRANSITION REPORT FILED PURSUANT TO SECTION 13 OR 15(d) OF THE SECURITIES EXCHANGE ACT OF 1934
|
|
COMMISSION FILE NUMBER 1-12291
|
|

THE AES CORPORATION
(Exact name of registrant as specified in its charter)
|
Delaware
|
54 1163725
|
|
|
(State or other jurisdiction of
incorporation or organization)
|
(I.R.S. Employer
Identification No.)
|
|
|
4300 Wilson Boulevard Arlington, Virginia
|
22203
|
|
|
(Address of principal executive offices)
|
(Zip Code)
|
|
|
Registrant's telephone number, including area code: (703) 522-1315
|
||
|
Securities registered pursuant to Section 12(b) of the Act:
|
||
|
Title of Each Class
|
Name of Each Exchange on Which Registered
|
|
|
Common Stock, par value $0.01 per share
|
New York Stock Exchange
|
|
|
AES Trust III, $3.375 Trust Convertible Preferred Securities
|
New York Stock Exchange
|
|
Securities registered pursuant to Section 12(g) of the Act: None
Indicate by check mark if the Registrant is a well-known seasoned issuer, as defined in Rule 405 of the Securities Act. Yes
x
No
o
Indicate by check mark if the Registrant is not required to file reports pursuant to Section 13 or Section 15 (d) of the Act. Yes
x
No
o
Indicate by check mark whether the registrant (1) has filed all reports required to be filed by Section 13 or 15(d) of the Securities Exchange Act of 1934 during the preceding 12 months (or for such shorter period that the registrant was required to file such reports), and (2) has been subject to such filing requirements for the past 90 days. Yes
x
No
o
Indicate by check mark whether the registrant has submitted electronically and posted on its corporate Web site, if any, every Interactive Data File required to be submitted and posted pursuant to Rule 405 of Regulation S-T during the preceding 12 months (or for such shorter period that the registrant was required to submit and post such files). Yes
x
No
o
Indicate by check mark if disclosure of delinquent filers pursuant to Item 405 of Regulation S-K is not contained herein, and will not be contained, to the best of registrant's knowledge, in definitive proxy or information statements incorporated by reference in Part III of this Form 10-K or any amendment to this Form 10-K.
x
Indicate by check mark whether the registrant is a large accelerated filer, an accelerated filer, a non-accelerated filer or a smaller reporting company. See the definitions of “large accelerated filer,” “accelerated filer” and “smaller reporting company” in Rule 12b-2 of the Exchange Act. (Check one):
|
Large accelerated filer
x
|
Accelerated filer
o
|
Non-accelerated filer
o
|
Smaller reporting company
o
|
|
(Do not check if a smaller
reporting company)
|
|||
Indicate by check mark whether the Registrant is a shell company (as defined in Rule 12b-2 of the Exchange Act). Yes
o
No
x
The aggregate market value of the voting and non-voting common equity held by non-affiliates on June 30,
2016
, the last business day of the Registrant's most recently completed second fiscal quarter (based on the adjusted closing sale price of
$12.48
of the Registrant's Common Stock, as reported by the New York Stock Exchange on such date) was approximately
$8.22 billion
.
The number of shares outstanding of Registrant's Common Stock, par value $0.01 per share, on
February 17, 2017
was
659,183,208
DOCUMENTS INCORPORATED BY REFERENCE
Portions of Registrant's Proxy Statement for its
2017
annual meeting of stockholders are incorporated by reference in Parts II and III
THE AES CORPORATION FISCAL YEAR
2016
FORM 10-K
TABLE OF CONTENTS
GLOSSARY OF TERMS
When the following terms and abbreviations appear in the text of this report, they have the meanings indicated below:
|
Adjusted EPS
|
Adjusted Earnings Per Share, a non-GAAP measure
|
|
Adjusted PTC
|
Adjusted Pretax Contribution, a non-GAAP measure of operating performance
|
|
AES
|
The Parent Company and its subsidiaries and affiliates
|
|
AFUDC
|
Allowance for Funds Used During Construction
|
|
ANEEL
|
Brazilian National Electric Energy Agency
|
|
AOCL
|
Accumulated Other Comprehensive Loss
|
|
ASC
|
Accounting Standards Codification
|
|
ASEP
|
National Authority of Public Services
|
|
BACT
|
Best Available Control Technology
|
|
BART
|
Best Available Retrofit Technology
|
|
BNDES
|
Brazilian Development Bank
|
|
BOT
|
Build, Operate and Transfer
|
|
BTA
|
Best Technology Available
|
|
CAA
|
United States Clean Air Act
|
|
CAMMESA
|
Wholesale Electric Market Administrator in Argentina
|
|
CCGT
|
Combined Cycle Gas Turbine
|
|
CDI
|
Brazilian equivalent to LIBOR
|
|
CDPQ
|
La Caisse de depot et placement du Quebec
|
|
CEO
|
Chief Executive Officer
|
|
CERCLA
|
Comprehensive Environmental Response, Compensation and Liability Act of 1980 (a.k.a. "Superfund")
|
|
CFB
|
Circulating Fluidized Bed Boiler
|
|
CHP
|
Combined Heat and Power
|
|
COFINS
|
Contribuição para o Financiamento da Seguridade Social
|
|
CO
2
|
Carbon Dioxide
|
|
COSO
|
Committee of Sponsoring Organizations of the Treadway Commission
|
|
CP
|
Capacity Performance
|
|
CPCN
|
Certificate of Public Convenience and Necessity
|
|
CPP
|
Clean Power Plan
|
|
CRES
|
Competitive Retail Electric Service
|
|
CSAPR
|
Cross-State Air Pollution Rule
|
|
CWA
|
U.S. Clean Water Act
|
|
Dodd-Frank Act
|
Dodd-Frank Wall Street Reform and Consumer Protection Act
|
|
DP&L
|
The Dayton Power & Light Company
|
|
DPL
|
DPL Inc.
|
|
DPLE
|
DPL Energy, LLC, a wholly-owned subsidiary of DPL (renamed AES Ohio Generation, LLC effective 2/1/2016)
|
|
DPLER
|
DPL Energy Resources, Inc.
|
|
DPP
|
Dominican Power Partners
|
|
EBITDA
|
Earnings before Interest, Taxes, Depreciation & Amortization
|
|
EMIR
|
European Market Infrastructure Regulation
|
|
EPA
|
United States Environmental Protection Agency
|
|
EPC
|
Engineering, Procurement, and Construction
|
|
ERC
|
Energy Regulatory Commission
|
|
ERCOT
|
Electric Reliability Council of Texas
|
|
ESP
|
Electric Security Plan
|
|
EU ETS
|
European Union Greenhouse Gas Emission Trading Scheme
|
|
EURIBOR
|
Euro Inter Bank Offered Rate
|
|
EUSGU
|
Electric Utility Steam Generating Unit
|
|
EVN
|
Electricity of Vietnam
|
|
EVP
|
Executive Vice President
|
|
FAC
|
Fuel Adjustment Charges
|
|
FASB
|
Financial Accounting Standards Board
|
|
FERC
|
Federal Energy Regulatory Commission
|
|
FONINVEMEM
|
Fund for the Investment Needed to Increase the Supply of Electricity in the Wholesale Market
|
|
FPA
|
Federal Power Act
|
|
FX
|
Foreign Exchange
|
|
GAAP
|
Generally Accepted Accounting Principles in the United States
|
|
GHG
|
Greenhouse Gas
|
|
GRIDCO
|
Grid Corporation of Odisha Ltd.
|
1
|
GWh
|
Gigawatt Hours
|
|
HLBV
|
Hypothetical Liquidation Book Value
|
|
IDEM
|
Indiana Department of Environmental Management
|
|
IFC
|
International Finance Corporation
|
|
IPALCO
|
IPALCO Enterprises, Inc.
|
|
IPL
|
Indiana, Indianapolis Power & Light Company
|
|
IPP
|
Independent Power Producers
|
|
ISO
|
Independent System Operator
|
|
IURC
|
Indiana Utility Regulatory Commission
|
|
kWh
|
Kilowatt Hours
|
|
LIBOR
|
London Inter Bank Offered Rate
|
|
LNG
|
Liquefied Natural Gas
|
|
MATS
|
Mercury and Air Toxics Standards
|
|
MISO
|
Midcontinent Independent System Operator, Inc.
|
|
MW
|
Megawatts
|
|
MWh
|
Megawatt Hours
|
|
NCI
|
Noncontrolling Interest
|
|
NEK
|
Natsionalna Elektricheska Kompania (state-owned electricity public supplier in Bulgaria)
|
|
NERC
|
North American Electric Reliability Corporation
|
|
NGCC
|
Natural Gas Combined Cycle
|
|
NOV
|
Notice of Violation
|
|
NO
X
|
Nitrogen Dioxide
|
|
NPDES
|
National Pollutant Discharge Elimination System
|
|
NSPS
|
New Source Performance Standards
|
|
NYISO
|
New York Independent System Operator, Inc.
|
|
NYSE
|
New York Stock Exchange
|
|
O&M
|
Operations and Maintenance
|
|
OPGC
|
Odisha Power Generation Corporation, Ltd.
|
|
Parent Company
|
The AES Corporation
|
|
PCB
|
Polychlorinated biphenyl
|
|
Pet Coke
|
Petroleum Coke
|
|
PIS
|
Partially Integrated System
|
|
PJM
|
PJM Interconnection, LLC
|
|
PM
|
Particulate Matter
|
|
PPA
|
Power Purchase Agreement
|
|
PREPA
|
Puerto Rico Electric Power Authority
|
|
PSA
|
Power Supply Agreement
|
|
PSD
|
Prevention of Significant Deterioration
|
|
PSU
|
Performance Stock Unit
|
|
PUCO
|
The Public Utilities Commission of Ohio
|
|
PURPA
|
Public Utility Regulatory Policies Act
|
|
QF
|
Qualifying Facility
|
|
RGGI
|
Regional Greenhouse Gas Initiative
|
|
RMRR
|
Routine Maintenance, Repair and Replacement
|
|
RPM
|
Reliability Pricing Model
|
|
RSU
|
Restricted Stock Unit
|
|
RTO
|
Regional Transmission Organization
|
|
SADI
|
Argentine Interconnected System
|
|
SBU
|
Strategic Business Unit
|
|
SCE
|
Southern California Edison
|
|
SEC
|
United States Securities and Exchange Commission
|
|
SEM
|
Single Electricity Market
|
|
SIC
|
Central Interconnected Electricity System
|
|
SIN
|
National Interconnected System
|
|
SING
|
Northern Interconnected Electricity System
|
|
SIP
|
State Implementation Plan
|
|
SNE
|
National Secretary of Energy
|
|
SO
2
|
Sulfur Dioxide
|
|
SSO
|
Standard Service Offer
|
|
TA
|
Transportation Agreement
|
|
TECONS
|
Term Convertible Preferred Securities
|
|
U.S.
|
United States
|
|
VAT
|
Value Added Tax
|
2
|
VIE
|
Variable Interest Entity
|
|
Vinacomin
|
Vietnam National Coal-Mineral Industries Holding Corporation Ltd.
|
|
WACC
|
Weighted Average Cost of Capital
|
3
In this Annual Report the terms “AES,” “the Company,” “us,” or “we” refer to The AES Corporation and all of its subsidiaries and affiliates, collectively. The terms “The AES Corporation” and “Parent Company” refer only to the parent, publicly held holding company, The AES Corporation, excluding its subsidiaries and affiliates.
FORWARD-LOOKING INFORMATION
In this filing we make statements concerning our expectations, beliefs, plans, objectives, goals, strategies, and future events or performance. Such statements are “forward-looking statements” within the meaning of the Private Securities Litigation Reform Act of 1995. Although we believe that these forward-looking statements and the underlying assumptions are reasonable, we cannot assure you that they will prove to be correct.
Forward-looking statements involve a number of risks and uncertainties, and there are factors that could cause actual results to differ materially from those expressed or implied in our forward-looking statements. Some of those factors (in addition to others described elsewhere in this report and in subsequent securities filings) include:
|
•
|
the economic climate, particularly the state of the economy in the areas in which we operate, including the fact that the global economy faces considerable uncertainty for the foreseeable future, which further increases many of the risks discussed in this Form 10-K;
|
|
•
|
changes in inflation, demand for power, interest rates and foreign currency exchange rates, including our ability to hedge our interest rate and foreign currency risk;
|
|
•
|
changes in the price of electricity at which our generation businesses sell into the wholesale market and our utility businesses purchase to distribute to their customers, and the success of our risk management practices, such as our ability to hedge our exposure to such market price risk;
|
|
•
|
changes in the prices and availability of coal, gas and other fuels (including our ability to have fuel transported to our facilities) and the success of our risk management practices, such as our ability to hedge our exposure to such market price risk, and our ability to meet credit support requirements for fuel and power supply contracts;
|
|
•
|
changes in and access to the financial markets, particularly changes affecting the availability and cost of capital in order to refinance existing debt and finance capital expenditures, acquisitions, investments and other corporate purposes;
|
|
•
|
our ability to manage liquidity and comply with covenants under our recourse and non-recourse debt, including our ability to manage our significant liquidity needs and to comply with covenants under our senior secured credit facility and other existing financing obligations;
|
|
•
|
changes in our or any of our subsidiaries' corporate credit ratings or the ratings of our or any of our subsidiaries' debt securities or preferred stock, and changes in the rating agencies' ratings criteria;
|
|
•
|
our ability to purchase and sell assets at attractive prices and on other attractive terms;
|
|
•
|
our ability to compete in markets where we do business;
|
|
•
|
our ability to manage our operational and maintenance costs, the performance and reliability of our generating plants, including our ability to reduce unscheduled down times;
|
|
•
|
our ability to locate and acquire attractive "greenfield" or "brownfield" projects and our ability to finance, construct and begin operating our "greenfield" or "brownfield" projects on schedule and within budget;
|
|
•
|
our ability to enter into long-term contracts, which limit volatility in our results of operations and cash flow, such as PPAs, fuel supply, and other agreements and to manage counterparty credit risks in these agreements;
|
|
•
|
variations in weather, especially mild winters and cooler summers in the areas in which we operate, the occurrence of difficult hydrological conditions for our hydropower plants, as well as hurricanes and other storms and disasters, and low levels of wind or sunlight for our wind and solar facilities;
|
|
•
|
our ability to meet our expectations in the development, construction, operation and performance of our new facilities, whether greenfield, brownfield or investments in the expansion of existing facilities;
|
|
•
|
the success of our initiatives in other renewable energy projects, as well as GHG emissions reduction projects and energy storage projects;
|
|
•
|
our ability to keep up with advances in technology;
|
|
•
|
the potential effects of threatened or actual acts of terrorism and war;
|
|
•
|
the expropriation or nationalization of our businesses or assets by foreign governments, with or without adequate compensation;
|
4
|
•
|
our ability to achieve reasonable rate treatment in our utility businesses;
|
|
•
|
changes in laws, rules and regulations affecting our international businesses;
|
|
•
|
changes in laws, rules and regulations affecting our North America business, including, but not limited to, regulations which may affect competition, the ability to recover net utility assets and other potential stranded costs by our utilities;
|
|
•
|
changes in law resulting from new local, state, federal or international energy legislation and changes in political or regulatory oversight or incentives affecting our wind business and solar projects, our other renewables projects and our initiatives in GHG reductions and energy storage, including tax incentives;
|
|
•
|
changes in environmental laws, including requirements for reduced emissions of sulfur, nitrogen, carbon, mercury, hazardous air pollutants and other substances, GHG legislation, regulation and/or treaties and coal ash regulation;
|
|
•
|
changes in tax laws and the effects of our strategies to reduce tax payments;
|
|
•
|
the effects of litigation and government and regulatory investigations;
|
|
•
|
our ability to maintain adequate insurance;
|
|
•
|
decreases in the value of pension plan assets, increases in pension plan expenses and our ability to fund defined benefit pension and other postretirement plans at our subsidiaries;
|
|
•
|
losses on the sale or write-down of assets due to impairment events or changes in management intent with regard to either holding or selling certain assets;
|
|
•
|
changes in accounting standards, corporate governance and securities law requirements;
|
|
•
|
our ability to maintain effective internal controls over financial reporting;
|
|
•
|
our ability to attract and retain talented directors, management and other personnel, including, but not limited to, financial personnel in our foreign businesses that have extensive knowledge of accounting principles generally accepted in the United States; and
|
|
•
|
information security breaches.
|
These factors in addition to others described elsewhere in this Form 10-K, including those described under Item 1A.—
Risk Factors
, and in subsequent securities filings, should not be construed as a comprehensive listing of factors that could cause results to vary from our forward-looking information.
We undertake no obligation to publicly update or revise any forward-looking statements, whether as a result of new information, future events, or otherwise. If one or more forward-looking statements are updated, no inference should be drawn that additional updates will be made with respect to those or other forward-looking statements.
5
Item 1.
Business
is an outline of our strategy and our businesses by SBU, including key financial drivers. Additional items that may have an impact on our businesses are discussed in Item 1A.—
Risk Factors
and Item 3.—
Legal Proceedings
.
Executive Summary
Incorporated in 1981, AES is a diversified power generation and utility company, providing affordable, sustainable energy through our diverse portfolio of thermal and renewable generation facilities as well as distribution businesses. Our vision is to be the world's leading sustainable power company by leveraging our unique electricity platforms and the knowledge of our people to provide the energy and infrastructure solutions our customers truly need. Our people share a passion to help meet the world's current and increasing energy needs, while providing communities and countries the opportunity for economic growth due to the availability of reliable, affordable electric power.
Future growth across our company will be heavily weighted towards less carbon-intensive wind, solar and gas generation. Growth in renewables not only provides an opportunity for direct investments in wind and solar generation, but also presents significant potential for energy storage. We are a leader in lithium ion, battery-based energy storage, with more than 400 MW in operation, under construction or in advanced development across seven countries. We believe lithium ion-based energy storage will play a critical role in an increasingly renewables-based generation mix. With our technological experience, presence in key markets and channel sales partnerships, we are positioned to capitalize on this rapidly growing market.
Additionally, we have been expanding our LNG infrastructure in Central America, where we are helping to displace oil-fired generation in favor of a cheaper and cleaner alternative. In the United States, at IPL, we recently completed a multi-year rate-base investment in environmental upgrades to our coal plants and are in the process of re-powering several units from coal to gas.
6
Strategic Priorities
We have made significant progress towards meeting our strategic goals to maximize value for our shareholders.
|
Leveraging Our Platforms
|
|||||||
|
Focusing our growth in markets where we already operate and have a competitive advantage to realize attractive risk-adjusted returns
|
|||||||
|
●
|
In 2016, brought on-line nine projects for a total of 2,976 MW
|
||||||
|
●
|
3,389 MW currently under construction
|
||||||
|
○
|
Represents $6.4 billion in total capital expenditures
|
||||||
|
○
|
Majority of AES’ $1.1 billion in equity already funded
|
||||||
|
○
|
Expected to come on-line through 2019
|
||||||
|
●
|
Will continue to advance select projects from our development pipeline
|
||||||
|
Reducing Complexity
|
|||||||
|
Exiting businesses and markets where we do not have a competitive advantage, simplifying our portfolio and reducing risk
|
|||||||
|
●
|
Since 2011
|
||||||
|
○
|
Sold assets to generate $3.6 billion in equity proceeds
|
||||||
|
○
|
Decreased total number of countries where we have operations from 28 to 17
|
||||||
|
●
|
In 2016, announced or closed $510 million in equity proceeds from sales or sell-downs of six businesses
|
||||||
|
Performance Excellence
|
|||||||
|
Striving to be the low-cost manager of a portfolio of assets and deriving synergies and scale from our businesses
|
|||||||
|
●
|
In 2015, launched a $150 million cost reduction and revenue enhancement initiative
|
||||||
|
○
|
Includes overhead reductions, procurement efficiencies and operational improvements
|
||||||
|
○
|
Achieved $50 million in savings in 2016 and expect to ramp up to a total of $150 million in 2018
|
||||||
|
Expanding Access to Capital
|
|||||||
|
Optimizing risk-adjusted returns in existing businesses and growth projects
|
|||||||
|
●
|
Adjust our global exposure to commodity, fuel, country and other macroeconomic risks
|
||||||
|
●
|
Building strategic partnerships at the project and business level with an aim to optimize our risk-adjusted returns in our business and growth projects.
|
||||||
|
Allocating Capital in a Disciplined Manner
|
|||||||
|
Maximizing risk-adjusted returns to our shareholders by investing our free cash flow to strengthen our credit and deliver attractive growth in cash flow and earnings
|
|||||||
|
●
|
In 2016, we generated substantial cash by executing on our strategy, which we allocated in line with our capital allocation framework
|
||||||
|
○
|
Used $312 million to prepay and refinance Parent Company debt
|
||||||
|
○
|
Returned $369 million to shareholders through share repurchases and quarterly dividends
|
||||||
|
■
|
Increased our quarterly dividend by 9.1% to $0.12 per share beginning in the first quarter of 2017
|
||||||
|
○
|
Invested $394 million in our subsidiaries
|
||||||
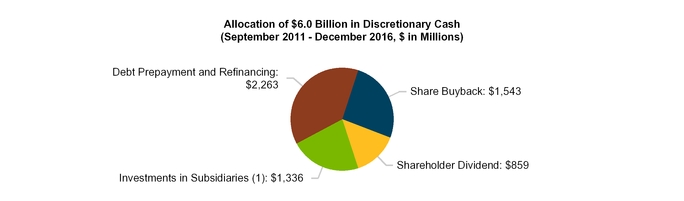
_____________________________
|
(1)
|
Investments in subsidiaries excludes $2.2 billion investment in DPL.
|
7
Segments
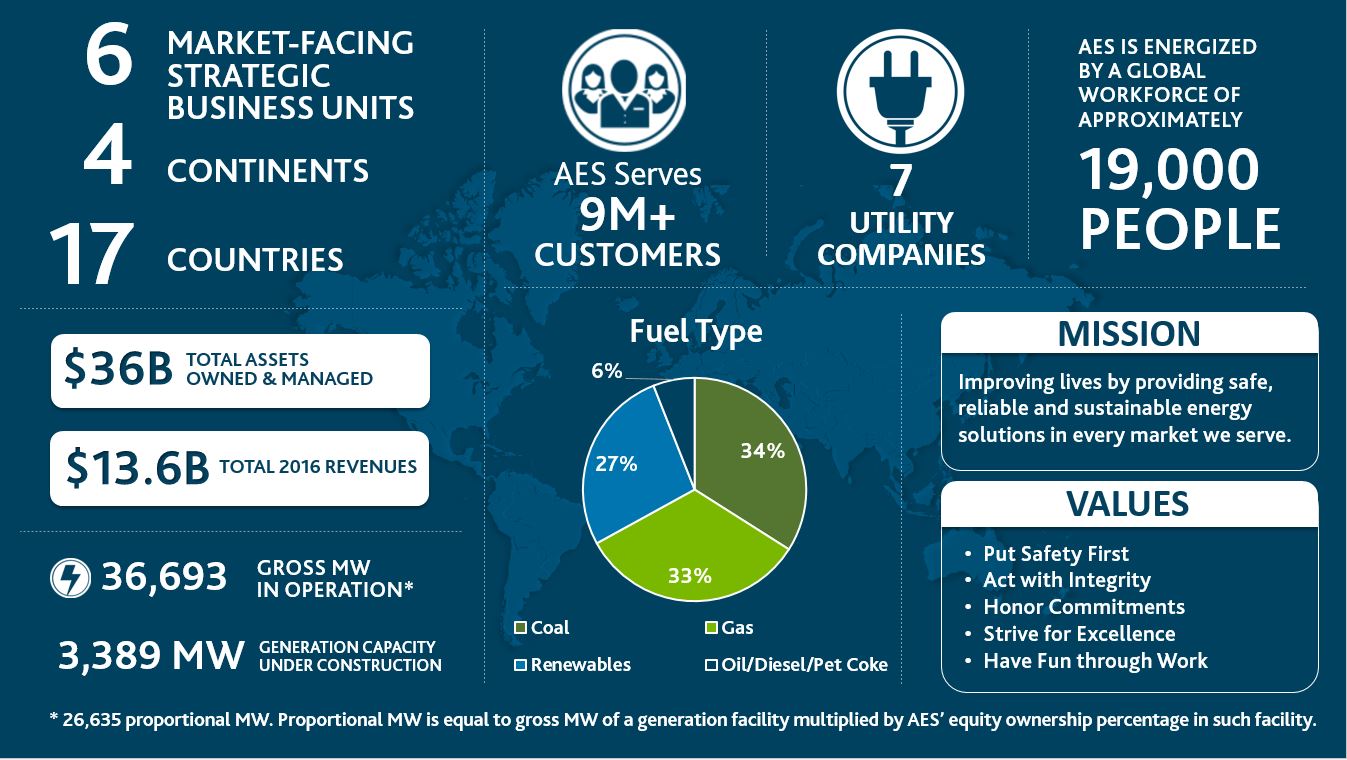
We are organized into six market-oriented strategic business units ("SBUs"):
US
(United States),
Andes
(Chile, Colombia, and Argentina),
Brazil
,
MCAC
(Mexico, Central America and the Caribbean),
Europe
, and
Asia
— which are led by our SBU Presidents. Within our six SBUs, we have two lines of business. The first business line is generation, where we own and/or operate power plants to generate and sell power to customers, such as utilities, industrial users, and other intermediaries. The second business line is utilities, where we own and/or operate utilities to generate or purchase, distribute, transmit and sell electricity to end-user customers in the residential, commercial, industrial and governmental sectors within a defined service area. In certain circumstances, our utilities also generate and sell electricity on the wholesale market.
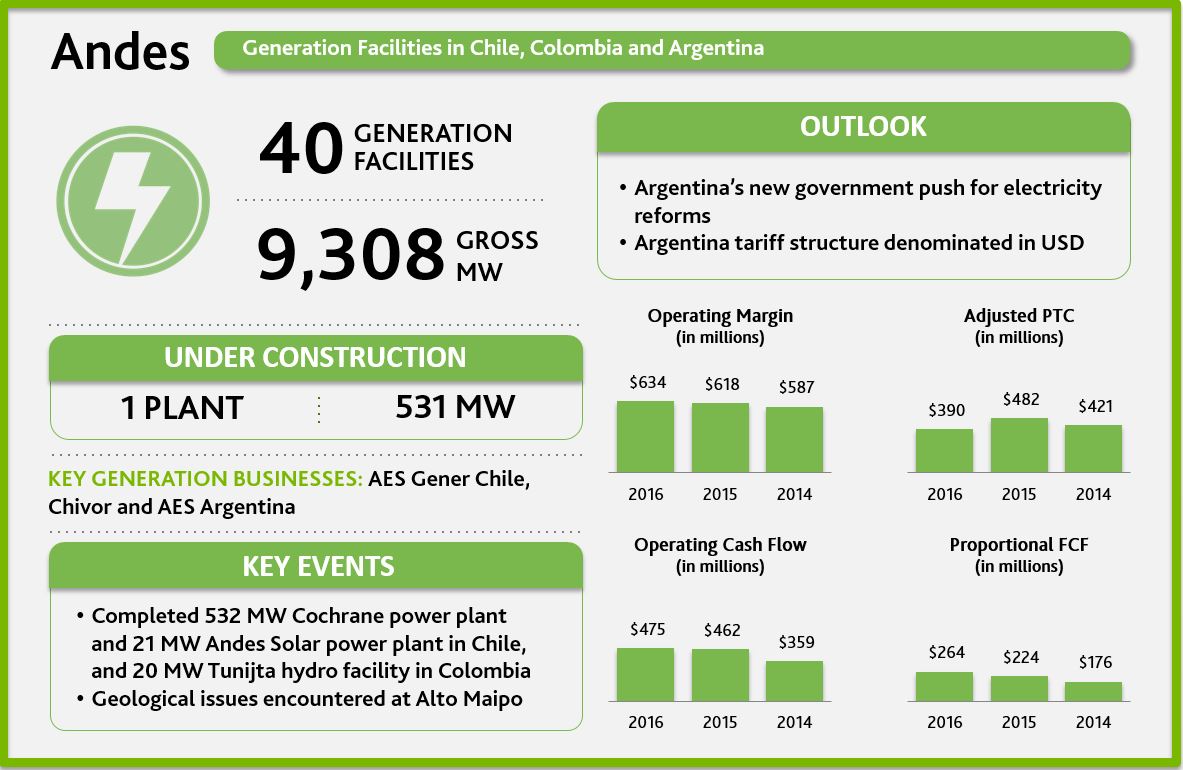
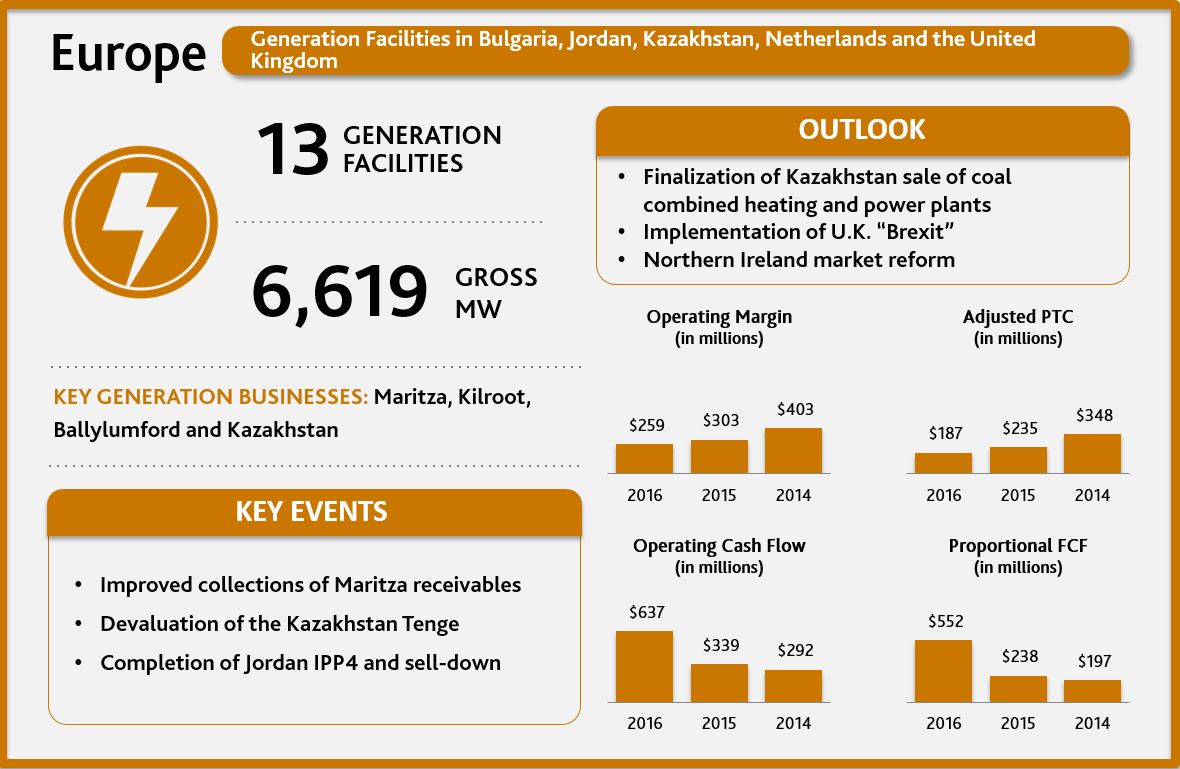
The Company measures the operating performance of its SBUs using Adjusted PTC and Proportional Free Cash Flow, both of which are non-GAAP measures. The Adjusted PTC and Proportional Free Cash Flow by SBU for the year ended December 31,
2016
are shown below. The percentages for Adjusted PTC and Proportional Free Cash Flow are the contribution by each SBU to the gross metric, i.e., the total Adjusted PTC by SBU, before deductions for Corporate. See Item 7.—
Management's Discussion and Analysis SBU Performance Analysis
of this Form 10-K for reconciliation and definitions of Adjusted PTC and Proportional Free Cash Flow.

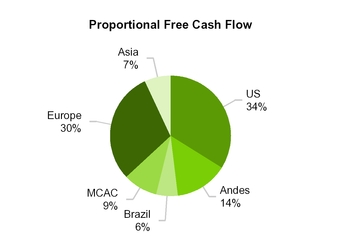
The following summarizes our businesses within our six SBUs.
8
9


10

11
Overview
Generation
We currently own and/or operate a generation portfolio of
30,379
MW, excluding the generation capabilities of our integrated utilities. Our generation fleet is diversified by fuel type. See discussion below under
Fuel Costs
.
Performance drivers of our generation businesses include types of electricity sales agreements, plant reliability and flexibility, fuel costs, seasonality, weather variations and economic activity, fixed-cost management, and competition.
Electricity Sales Contracts
— Our generation businesses sell electricity under medium- or long-term contracts ("contract sales") or under short-term agreements in competitive markets ("short-term sales").
Contract Sales
— Most of our generation fleet sells electricity under contracts. Our medium-term contract sales have a term of 2 to 5 years, while our long-term contracts have a term of more than 5 years. Across our portfolio, the average remaining contract term is 6 years.
In contract sales, our generation businesses recover variable costs including fuel and variable O&M costs, either through direct or indexation-based contractual pass-throughs or tolling arrangements. When the contract does not include a fuel pass-through, we typically hedge fuel costs or enter into fuel supply agreements for a similar contract period (see discussion under
the
Fuel Costs
section below). These contracts are intended to reduce exposure to the volatility of fuel prices and electricity prices by linking the business's revenues and costs. These contracts also help us to fund a significant portion of the total capital cost of the project through long-term non-recourse project-level financing.
Capacity Payments and Contract Sales
— Most of our contract sales include a capacity payment that covers projected fixed costs of the plant, including fixed O&M expenses and a return on capital invested. In addition, most of our contracts require that the majority of the capacity payment be denominated in the currency matching our fixed costs. We generally structure our business to eliminate or reduce foreign exchange risk by matching the currency of revenue and expenses, including fixed costs and debt. Our project debt may consist of both fixed and floating rate debt for which we typically hedge a significant portion of our exposure. Some of our contracted businesses also receive a regulated market-based capacity payment, which is discussed in more detail in the
Capacity Payments and Short-Term Sales
section below.
Thus, these contracts, or other related commercial arrangements, significantly mitigate our exposure to changes in power and fuel prices, currency fluctuations and changes in interest rates. In addition, these contracts generally provide for a recovery of our fixed operating expenses and a return on our investment, as long as we operate the plant to the reliability and efficiency standards required in the contract.
Short-Term Sales
— Our other generation businesses sell power and ancillary services under short-term contracts with an average term of less than 2 years, including spot sales, directly in the short-term market, or, in some cases, at regulated prices. The short-term markets are typically administered by a system operator to coordinate dispatch. Short-term markets generally operate on merit order dispatch, where the least expensive generation facilities, based upon variable cost or bid price, are dispatched first and the most expensive facilities are dispatched last. The short-term price is typically set at the marginal cost of energy or bid price (the cost of the last plant required to meet system demand). As a result, the cash flows and earnings associated with these businesses are more sensitive to fluctuations in the market price for electricity. In addition, many of these wholesale markets include markets for ancillary services to support the reliable operation of the transmission system. Across our portfolio, we provide a wide array of ancillary services, including voltage support, frequency regulation and spinning reserves.
In certain markets, such as Argentina and Kazakhstan, a regulator establishes the prices for electricity and fuel and adjusts them periodically for inflation, changes in fuel prices and other factors. In these cases, our businesses are particularly sensitive to changes in regulation.
Capacity Payments
— Many of the markets in which we operate include regulated capacity markets. These capacity markets are intended to provide additional revenue based upon availability without reliance on the energy margin from the merit order dispatch. Capacity markets are typically priced based on the cost of a new entrant and the system capacity relative to the desired level of reserve margin (generation available in excess of peak demand). Our generating facilities selling in the short-term markets typically receive capacity payments based on their availability in the market. Our most significant capacity revenues are earned by our generation capacity in Ohio and Northern Ireland.
12
Plant Reliability and Flexibility
— Our contract and short-term sales provide incentives to our generation plants to optimally manage availability, operating efficiency and flexibility. Capacity payments under contract sales are frequently tied to meeting minimum standards. In short-term sales, our plants must be reliable and flexible to capture peak market prices and to maximize market-based revenues. In addition, our flexibility allows us to capture ancillary service revenue while meeting local market needs.
Fuel Costs
— For our thermal generation plants, fuel is a significant component of our total cost of generation. For contract sales, we often enter into fuel supply agreements to match the contract period, or we may hedge our fuel costs. Some of our contracts have periodic adjustments for changes in fuel cost indices. In those cases, we have fuel supply agreements with shorter terms to match those adjustments. For certain projects, we have tolling arrangements where the power offtaker is responsible for the supply and cost of fuel to our plants.
In short-term sales, we sell power at market prices that are generally reflective of the market cost of fuel at the time, and thus procure fuel supply on a short-term basis, generally designed to match up with our market sales profile. Since fuel price is often the primary determinant for power prices, the economics of projects with short-term sales are often subject to volatility of relative fuel prices. For further information regarding commodity price risk please see Item 7A.—
Quantitative and Qualitative Disclosures about Market Risk
in this Form 10-K.
34%
of the capacity of our generation fleet is coal-fired. In the U.S., most of our plants are supplied from domestic coal. At our non-U.S. generation plants, and at our plant in Hawaii, we source coal internationally. Across our fleet, we utilize our global sourcing program to maximize the purchasing power of our fuel procurement.
33%
of the capacity of our generation plants are fueled by natural gas. Generally, we use gas from local suppliers in each market. A few exceptions to this are AES Gener in Chile, where we purchase imported gas from third parties, and our plants in the Dominican Republic, where we import LNG to utilize in the local market.
27%
of the capacity of our generation plants are fueled by renewables, including hydro, wind and energy storage, which do not have significant fuel costs.
6%
of the capacity of our generation fleet utilizes oil, diesel and petroleum coke ("pet coke") for fuel. Oil and diesel are sourced locally at prices linked to international markets, while pet coke is largely sourced from Mexico and the U.S.
Renewable Generation Facilities
— We currently own and operate
8,228
MW (4,293 proportional MW) of renewable generation, including hydro, wind, energy storage, solar, biomass and landfill gas.
Seasonality, Weather Variations and Economic Activity
— Our generation businesses are affected by seasonal weather patterns throughout the year and, therefore, operating margin is not generated evenly by month during the year. Additionally, weather variations, including temperature, solar and wind resources, and hydrological conditions, may also have an impact on generation output at our renewable generation facilities. In competitive markets for power, local economic activity can also have an impact on power demand and short-term prices for power.
Fixed-Cost Management
—
In our businesses with long-term contracts, the majority of the fixed O&M costs are recovered through the capacity payment. However, for all generation businesses, managing fixed costs and reducing them over time is a driver of business performance.
Competition
— For our businesses with medium- or long-term contracts, there is limited competition during the term of the contract. For short-term sales, plant dispatch and the price of electricity are determined by market competition and local dispatch and reliability rules.
Utilities
AES' seven utility businesses distribute power to
9.4 million
people in three countries. AES' two utilities in the U.S. also include generation capacity totaling
6,314
MW. The utility businesses have a variety of structures, ranging from integrated utility to pure transmission and distribution businesses.
In general, our utilities sell electricity directly to end-users, such as homes and businesses, and bill customers directly. Key performance drivers for utilities include the regulated rate of return and tariff, seasonality, weather variations, economic activity, reliability of service and competition. Revenue from utilities is classified as regulated in the Consolidated Statements of Operations.
Regulated Rate of Return and Tariff
— In exchange for the exclusive right to sell or distribute electricity in a franchise area, our utility businesses are subject to government regulation. This regulation sets the prices ("tariffs") that our utilities are allowed to charge retail customers for electricity and establishes service standards that we are required to meet.
13
Our utilities are generally permitted to earn a regulated rate of return on assets, determined by the regulator based on the utility's allowed regulatory asset base, capital structure and cost of capital. The asset base on which the utility is permitted a return is determined by the regulator and is based on the amount of assets that are considered used and useful in serving customers. Both the allowed return and the asset base are important components of the utility's earning power. The allowed rate of return and operating expenses deemed reasonable by the regulator are recovered through the regulated tariff that the utility charges to its customers.
The tariff may be reviewed and reset by the regulator from time to time depending on local regulations, or the utility may seek a change in its tariffs. The tariff is generally based upon a certain usage level and may include a pass-through to the customer of costs that are not controlled by the utility, such as the costs of fuel (in the case of integrated utilities) and/or the costs of purchased energy. In addition to fuel and purchased energy, other types of costs may be passed through to customers via an existing mechanism, such as certain environmental expenditures that are covered under an environmental tracker at our utility in Indiana, IPL. Components of the tariff that are directly passed through to the customer are usually adjusted through a summary regulatory process or an existing formula-based mechanism. In some regulatory regimes, customers with demand above an established level are unregulated and can choose to contract with other retail energy suppliers directly and pay wheeling and other non-bypassable fees, which are fees to the distribution company for use of its distribution system.
The regulated tariff generally recognizes that our utility businesses should recover certain operating and fixed costs, as well as manage uncollectible amounts, quality of service and non-technical losses. Utilities, therefore, need to manage costs to the levels reflected in the tariff, or risk non-recovery of costs or diminished returns.
Seasonality, Weather Variations and Economic Activity
— Our utility businesses are affected by seasonal weather patterns throughout the year and, therefore, the operating revenues and associated operating expenses are not generated evenly by month during the year. Additionally, weather variations may also have an impact based on the number of customers, temperature variances from normal conditions and customers' historic usage levels and patterns. The retail kWh sales, after adjustments for weather variations, are affected by changes in local economic activity, energy efficiency and distributed generation initiatives, as well as the number of retail customers.
Reliability of Service
— Our utility businesses must meet certain reliability standards, such as duration and frequency of outages. Those standards may be specific with incentives or penalties for performance against these standards. In other cases, the standards are implicit and the utility must operate to meet customer expectations.
Competition
— Our integrated utilities, IPL and DP&L, operate as the sole distributor of electricity within their respective jurisdictions. Our businesses own and operate all of the businesses and facilities necessary to generate, transmit and distribute electricity. Competition in the regulated electric business is primarily from the on-site generation for industrial customers; however, in Ohio, customers in our service territory have the ability to switch to alternative suppliers for their generation service. Our integrated utilities, particularly DP&L, are exposed to the volatility in wholesale prices to the extent our generating capacity exceeds the native load served under the regulated tariff and short-term contracts. See the full discussion under the US SBU.
At our pure transmission and distribution businesses, such as those in Brazil and El Salvador, we face relatively limited competition due to significant barriers to entry. At many of these businesses, large customers, as defined by the relevant regulator, have the option to both leave and return to regulated service.
Development and Construction
We develop and construct new generation facilities. For our utility businesses, new plants may be built in response to customer needs or to comply with regulatory developments and are developed subject to regulatory approval that permits recovery of our capital cost and a return on our investment. For our generation businesses, our priority for development is platform expansion opportunities, where we can add on to our existing facilities in our key platform markets where we have a competitive advantage. We make the decision to invest in new projects by evaluating the project returns and financial profile against a fair risk-adjusted return for the investment and against alternative uses of capital, including corporate debt repayment and share buybacks.
In some cases, we enter into long-term contracts for output from new facilities prior to commencing construction. To limit required equity contributions from The AES Corporation, we also seek non-recourse project debt financing and other sources of capital, including partners where it is commercially attractive. For construction, we typically contract with a third party to manage construction, although our construction management team supervises the construction work and tracks progress against the project's budget and the required safety, efficiency and productivity standards.
14
Segments
The segment reporting structure uses the Company's management reporting structure as its foundation to reflect how the Company manages the business internally. It is organized by geographic regions which provide a socio-political-economic understanding of our business. For financial reporting purposes, the Company's corporate activities are reported within "Corporate and Other" because they do not require separate disclosure. See Item 7.—
Management's Discussion and Analysis of Financial Condition and Results of Operations
and Note
16
—
Segment and Geographic Information
included in Item 8.—
Financial Statements and Supplementary Data
of this Form 10-K for further discussion of the Company's segment structure.
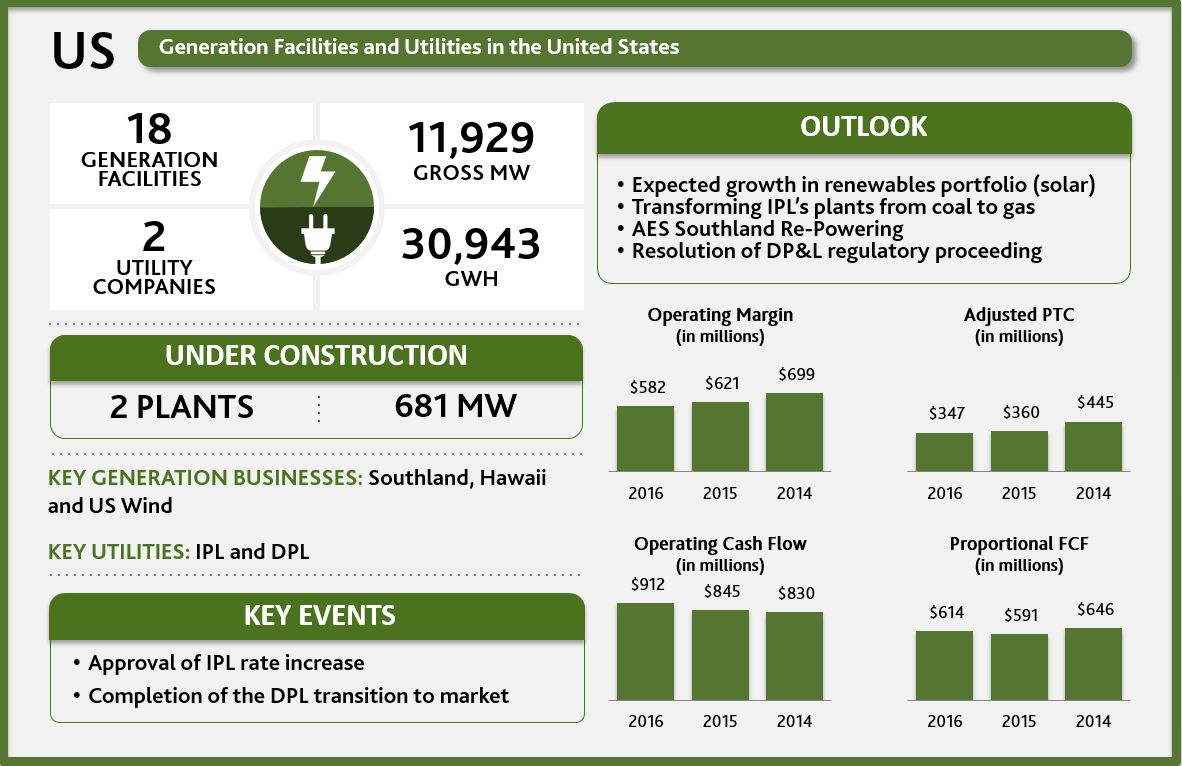
US SBU
Our US SBU has
18
generation facilities and
two
integrated utilities in the United States.
Generation
— Operating installed capacity of our US SBU totals
11,929
MW. IPL's parent, IPALCO Enterprises, Inc., and DPL Inc. are voluntary SEC registrants, and as such, follow public filing requirements of the Securities Exchange Act of 1934. The following table lists our US SBU generation facilities:
|
Business
|
Location
|
Fuel
|
Gross MW
|
AES Equity Interest
|
Year Acquired or Began Operation
|
Contract Expiration Date
|
Customer(s)
|
|||||||||
|
Southland—Alamitos
|
U.S.-CA
|
Gas
|
2,075
|
|
100
|
%
|
1998
|
2018
|
Southern California Edison
|
|||||||
|
Southland—Redondo Beach
|
U.S.-CA
|
Gas
|
1,392
|
|
100
|
%
|
1998
|
2018
|
Southern California Edison
|
|||||||
|
Southland—Huntington Beach
|
U.S.-CA
|
Gas
|
474
|
|
100
|
%
|
1998
|
2018
|
Southern California Edison
|
|||||||
|
Shady Point
|
U.S.-OK
|
Coal
|
360
|
|
100
|
%
|
1991
|
2018
|
Oklahoma Gas & Electric
|
|||||||
|
Buffalo Gap II
(1),(2)
|
U.S.-TX
|
Wind
|
233
|
|
100
|
%
|
2007
|
2017
|
Direct Energy
|
|||||||
|
Hawaii
|
U.S.-HI
|
Coal
|
206
|
|
100
|
%
|
1992
|
2022
|
Hawaiian Electric Co.
|
|||||||
|
Warrior Run
|
U.S.-MD
|
Coal
|
205
|
|
100
|
%
|
2000
|
2030
|
First Energy
|
|||||||
|
Buffalo Gap III
(1)
|
U.S.-TX
|
Wind
|
170
|
|
100
|
%
|
2008
|
|
|
|||||||
|
Buffalo Gap I
(1)
|
U.S.-TX
|
Wind
|
119
|
|
100
|
%
|
2006
|
2021
|
Direct Energy
|
|||||||
|
Laurel Mountain
|
U.S.-WV
|
Wind
|
98
|
|
100
|
%
|
2011
|
|
|
|||||||
|
Distributed PV - Commercial & Utility
(1) (3)
|
U.S.-Various
|
Solar
|
89
|
|
100
|
%
|
2015-2016
|
2029-2042
|
Utility, Municipality, Education, Non-Profit
|
|||||||
|
Mountain View I & II
|
U.S.-CA
|
Wind
|
67
|
|
100
|
%
|
2008
|
2021
|
Southern California Edison
|
|||||||
|
Mountain View IV
|
U.S.-CA
|
Wind
|
49
|
|
100
|
%
|
2012
|
2032
|
Southern California Edison
|
|||||||
|
Laurel Mountain ES
|
U.S.-WV
|
Energy Storage
|
32
|
|
100
|
%
|
2011
|
|
|
|||||||
|
Tait ES
|
U.S.-OH
|
Energy Storage
|
20
|
|
100
|
%
|
2013
|
|
|
|||||||
|
Distributed PV - Residential
(1) (3)
|
U.S.-Various
|
Solar
|
14
|
|
100
|
%
|
2015
|
2037-2040
|
Residential
|
|||||||
|
Warrior Run ES
|
U.S.-MD
|
Energy Storage
|
10
|
|
100
|
%
|
2016
|
|
|
|||||||
|
Advancion Applications Center
|
U.S.-PA
|
Energy Storage
|
2
|
|
100
|
%
|
2013
|
|
|
|||||||
|
5,615
|
|
|||||||||||||||
_____________________________
|
(1)
|
AES owns these assets together with third-party tax equity investors with variable ownership interests. The tax equity investors receive a portion of the economic attributes of the facilities, including tax attributes, that vary over the life of the projects. The proceeds from the issuance of tax equity are recorded as noncontrolling interest in the Company's Consolidated Balance Sheets.
|
|
(2)
|
Power Purchase Agreement with Direct Energy is for 80% of annual expected energy output.
|
|
(3)
|
AES operates these facilities located throughout the U.S. through management or O&M agreements as of December 31, 2016.
|
Under construction
— The following table lists our plants under construction in the US SBU:
|
Business
|
Location
|
Fuel
|
Gross MW
|
AES Equity Interest
|
Expected Date of Commercial Operations
|
|||||||
|
Eagle Valley CCGT
|
U.S.-IN
|
Gas
|
671
|
|
70
|
%
|
1H 2018
|
|||||
|
Distributed PV - Commercial
|
U.S.-Various
|
Solar
|
10
|
|
100
|
%
|
1H 2017
|
|||||
|
681
|
|
|||||||||||
Utilities
— The following table lists our U.S. utilities and their generation facilities:
|
Business
|
Location
|
Approximate Number of Customers Served as of 12/31/2016
|
GWh Sold in 2016
|
Fuel
|
Gross MW
|
AES Equity Interest
|
Year Acquired or Began Operation
|
|||||||||||
|
DPL
(1)
|
U.S.-OH
|
519,000
|
|
16,757
|
|
Coal/Gas/Oil
|
3,066
|
|
100
|
%
|
2011
|
|||||||
|
IPL
(2)
|
U.S.-IN
|
490,000
|
|
14,186
|
|
Coal/Gas/Oil
|
3,248
|
|
70
|
%
|
2001
|
|||||||
|
1,009,000
|
|
30,943
|
|
6,314
|
|
|||||||||||||
_____________________________
|
(1)
|
DPL subsidiary DP&L has the following plants: Tait Units 1-3 and diesels, Yankee Street, Yankee Solar, Monument and Sidney. DP&L jointly owned plants: Conesville Unit 4, Killen, Miami Fort Units 7 & 8, Stuart and Zimmer. In addition to the above, DP&L also owns a 4.9% equity ownership in OVEC ("Ohio Valley Electric Corporation"), an electric generating company. OVEC has two plants in Cheshire, Ohio and Madison, Indiana with a combined generation capacity of
|
15
approximately 2,109 MW. DP&L's share of this generation capacity is approximately 103 MW. AES Ohio Generation, LLC plants: Tait Units 4-7 and Montpelier Units 1-4.
|
(2)
|
CDPQ owns direct and indirect interests in IPALCO which total 30%. AES owns 85% of AES US Investments and AES US Investments owns 82.35% of IPALCO. IPL plants: Georgetown, Harding Street, Petersburg and Eagle Valley (new CCGT currently under construction). 3.2 MW of IPL total is considered a transmission asset.
|
The following map illustrates the location of our U.S. facilities:

U.S. Businesses
U.S. Utilities
IPALCO
Business Description
— IPALCO owns all of the outstanding common stock of IPL. IPL is engaged primarily in generating, transmitting, distributing and selling electric energy to approximately 490,000 retail customers in the city of Indianapolis and neighboring areas within the state of Indiana. IPL has an exclusive right to provide electric service to those customers. IPL's service area covers about 528 square miles with an estimated population of approximately 939,000. IPL owns and operates four generating stations. IPL’s largest generating station, Petersburg, is coal-fired. The second largest station, Harding Street, has converted its coal-fired units to natural gas and uses natural gas and fuel oil to power combustion turbines. The third, Eagle Valley, retired its coal-fired units in April 2016 and their CCGT is expected to be completed in the first half of 2018. The fourth station, Georgetown, is a small peaking station that uses natural gas to power combustion turbines. As of December 31, 2016, IPL's net electric generation capacity for winter is 2,993 MW and net summer capacity is 2,878 MW.
Market Structure
— IPL is one of many transmission system owner members in the MISO. MISO is a RTO, which maintains functional control over the combined transmission systems of its members and manages one of the largest energy and ancillary services markets in the U.S. IPL offers the available electricity production of each of its generation assets into the MISO day-ahead and real-time markets. MISO operates on a merit order dispatch, considering transmission constraints and other reliability issues to meet the total demand in the MISO region.
Regulatory Framework -
Retail Ratemaking
— In addition to the regulations referred to below in
Other Regulatory Matters
, IPL is subject to regulation by the IURC with respect to IPL's services and facilities; retail rates and charges; the issuance of long-term securities; and certain other matters. The regulatory power of the IURC over IPL's business is both comprehensive and typical of the traditional form of regulation generally imposed by state public utility commissions. IPL's tariff rates for electric service to retail customers consist of basic rates and charges,
16
which are set and approved by the IURC after public hearings. The IURC gives consideration to all allowable costs for ratemaking purposes including a fair return on the fair value of the utility property used and useful in providing service to customers. In addition, IPL's rates include various adjustment mechanisms including, but not limited to: (i) a rider to reflect changes in fuel and purchased power costs to meet IPL's retail load requirements, referred to as the FAC, and (ii) a rider for the timely recovery of costs incurred to comply with environmental laws and regulations referred to as the Environmental Compliance Cost Recovery Adjustment. These components function somewhat independently of one another, but the overall structure of IPL's rates and charges would be subject to review at the time of any review of IPL's basic rates and charges.
In March 2016, the IURC issued an order authorizing IPL to increase its basic rates and charges by approximately $31 million annually. On December 22, 2016, IPL filed a petition with the IURC for authority to increase its basic rates and charges, primarily to recover the cost of the new Eagle Valley CCGT. The Eagle Valley CCGT was previously expected to be completed in the first half of 2017, but is now expected to be completed in the first half of 2018. To address this change, on February 24, 2017, IPL filed a motion to withdraw the case without prejudice or alternatively amend the petition at a later date. No assurances can be given as to the timing or outcome of this proceeding.
Environmental Regulation
— For information on compliance with environmental regulations see Item 1.
—United States Environmental and Land-Use Legislation and Regulations
.
Replacement Generation
— IPL has several generating units that have been recently retired or refueled. These units were primarily coal-fired and represented 472 MW of net capacity in total. To replace this generation, IPL has approval to build a 644 to 685 MW CCGT at its Eagle Valley Station site in Indiana and refuel its Harding Street Station Units 5 and 6 from coal to natural gas (approximately 100 MW net capacity each) with a total budget of $649 million. The current estimated cost of these projects is $632 million. IPL was granted authority to accrue post in-service allowance for debt and equity funds used during construction, and to defer the recognition of depreciation expense of the CCGT and refueling project. These costs to build and operate the CCGT and the refueling project, other than fuel costs, will not be recoverable by IPL through rates until the conclusion of a base rate case proceeding with the IURC after the assets have been placed in service. The CCGT is expected to be completed in the first half of 2018, and the refueling project was completed in December 2015.
In July 2015 IPL received approval from the IURC for a CPN to refuel the Harding Street Station Unit 7 from coal to natural gas (about 410 MW net capacity). The Harding Street Station Unit 7 conversion was completed in the second quarter of 2016.
Key Financial Drivers
—
IPL's financial results are driven primarily by retail demand, weather, energy efficiency and wholesale prices. In addition, IPL's financial results are likely to be driven by many factors including but not limited to:
|
•
|
rate case outcomes
|
|
•
|
the timely recovery of capital expenditures through base rate growth
|
|
•
|
the passage of new legislation or implementation of regulations
|
Construction and Development
—
IPL's construction program is composed of capital expenditures necessary for prudent utility operations and compliance with environmental laws and regulations, along with discretionary investments designed to replace aging equipment or improve overall performance. Refer to the section above for a description of our major construction projects.
DPL
Business Description
— DPL is an energy holding company whose principal subsidiaries include DP&L and AES Ohio Generation, LLC.
DP&L generates, transmits, distributes and sells electricity to approximately 519,000 customers in a 6,000 square mile area of West Central Ohio. DP&L, solely or through jointly owned facilities, owns 2,510 MW of generation capacity and numerous transmission facilities.
AES Ohio Generation, LLC owns peaking generation units representing 556 MW located in Ohio and Indiana.
On January 1, 2016, DPL closed on the sale of DPLER to Interstate Gas Supply, Inc. DPLER, a competitive retail marketer, sold retail electricity to more than 124,000 retail customers in Ohio and Illinois while owned by DPL. Approximately 110,000 of those customers were also distribution customers of DP&L in Ohio.
Market Structure
— Since January 2001, electric customers within Ohio have been permitted to choose to purchase power under a contract with a CRES Provider or to continue to purchase power from their local utility
17
under SSO rates established by the tariff. DP&L and other Ohio utilities continue to have the exclusive right to provide delivery service in their state certified territories, and DP&L has the obligation to provide retail generation service to customers that did not choose an alternative supplier. Beginning in 2014, a portion of the SSO generation supply was no longer supplied by DP&L, but was provided by third parties through a competitive bid process. A total of 10%, 60% and 100% of the SSO load was sourced through competitive bid in 2014, 2015 and 2016, respectively. The PUCO maintains jurisdiction over DP&L's delivery of electricity, SSO and other retail electric services. The PUCO has issued extensive rules on how and when a customer can switch generation suppliers, how the local utility will interact with CRES Providers and customers, including for billing and collection purposes, and which elements of a utility's rates are "bypassable" (i.e., avoided by a customer that elects a CRES Provider) and which elements are "non-bypassable" (i.e., charged to all customers receiving a distribution service irrespective of what entity provides the retail generation service).
DP&L is a member of PJM. The PJM RTO operates the transmission systems owned by utilities operating in all or parts of Pennsylvania, New Jersey, Maryland, Delaware, D.C., Virginia, Ohio, West Virginia, Kentucky, North Carolina, Tennessee, Indiana and Illinois. PJM has an integrated planning process to identify potential needs for additional transmission to be built to avoid future reliability problems. PJM also runs the day-ahead and real-time energy markets, ancillary services market and forward capacity market for its members.
As a member of PJM, DP&L is also subject to charges and costs associated with PJM operations as approved by the FERC. Prior to 2015, the RPM was PJM's capacity construct. In 2015, PJM implemented a new CP program, replacing the RPM model. The CP program offers the potential for higher capacity revenues, combined with substantially increased penalties for non-performance or under-performance during certain periods identified as "capacity performance hours." This linkage between non- or under-performance during specific hours means that a generation unit that is generally performing well on an annual basis, may incur substantial penalties if it happens to be unavailable for service during some capacity performance hours. Similarly, a generation unit that is generally performing poorly on an annual basis may avoid such penalties if its outages happen to occur only during hours that are not capacity performance hours. An annual “stop-loss” provision exists that limits the size of penalties to 150% of the net cost of new entry, which is a value computed by PJM. This level is likely to be larger than the capacity price established under the CP program, so that there is potential that participation in the CP program could result in capacity penalties that exceed capacity revenues. The purpose of the RPM and CP Program is to enable PJM to obtain sufficient resources to reliably meet the needs of electric customers within the PJM footprint. PJM conducts an auction to establish the price by zone.
The PJM CP auctions are held three years in advance for a period covering 12 months starting from June 1. Auctions for the period covering June 1, 2020 through May 30, 2021 are expected to take place in May 2017. Future auction results are dependent upon various factors including the demand and supply situation, capacity additions and retirements and any changes in the current auction rules related to bidding for demand response and energy efficiency resources in the capacity auctions. For DPL-owned generation, applicable capacity prices through the auction year 2019/20 are as follows:
|
Auction Year (June 01-May 31)
|
2019/20
|
2018/19
|
2017/18
|
2016/17
|
2015/16
|
2014/15
|
||||||
|
Capacity Clearing Price ($/MW-Day)
|
$100
|
$165
|
$152
|
$134
|
$136
|
$126
|
||||||
The computed average capacity prices by calendar year are as follows:
|
Year
|
2019
|
2018
|
2017
|
2016
|
2015
|
|||||
|
Computed Average Capacity Price ($/MW-Day)
|
$127
|
$159
|
$145
|
$135
|
$132
|
|||||
The above tables reflect the capacity prices after the transitional auctions discussed earlier. Substantially all of DP&L's capacity cleared in the CP auction. The results of these auctions could have a significant effect on DP&L's revenues in the future.
Regulatory Framework -
Retail Regulation and Rate Structure
— DP&L is subject to regulation by the PUCO, for its distribution services and facilities, retail rates and charges, reliability of service, compliance with renewable energy portfolio, energy efficiency program requirements and certain other matters. DP&L's rates for electric service to retail customers consist of basic rates and charges that are set and approved by the PUCO after public hearings. In addition, DP&L's rates include various adjustment mechanisms including, but not limited to, the timely recovery of costs incurred to comply with alternative energy, renewables, energy efficiency, and economic development costs. These components function independently of one another, but the overall structure of DP&L's retail rates and charges are subject to the rules and regulations established by the PUCO.
Since Ohio is deregulated, and allows customers to choose retail generation providers, DP&L is required to provide retail generation service at SSO rates to any customer that has not signed a contract with a CRES provider.
18
SSO rates are subject to rules and regulations of the PUCO and are established based on DP&L's most recently approved ESP. DP&L's distribution rates are regulated by the PUCO and are established through a traditional cost-based rate-setting process. DP&L is permitted to recover its costs of providing distribution service as well as earn a regulated rate of return on assets, determined by the regulator, based on the utility's allowed regulated asset base, capital structure and cost of capital. DP&L's wholesale transmission rates are regulated by the FERC.
Although it had been in effect since January 2014, on June 20, 2016, the Supreme Court of Ohio ("Court") issued an opinion in the appeal of DP&L’s ESP (ESP 2) that had been approved by the PUCO for the years 2014-2016 and which, among other matters, permitted DP&L to collect a non-bypassable Service Stability Rider equal to $110 million per year from 2014-2016 and required DP&L to conduct competitive bid auctions to procure generation supply for SSO service. DP&L's own generation was phased-out of supplying SSO service over the three year period and beginning January 1, 2016 DP&L's SSO was 100% sourced through the competitive bid. In the opinion, the Court stated that the PUCO’s approval of ESP 2 was reversed. In view of that reversal, DP&L filed a motion to withdraw ESP 2 and implement rates consistent with those in effect prior to 2014 (ESP 1). Those rates will be in effect until rates consistent with DP&L’s pending February 22, 2016 ESP (ESP 3) filing are approved and effective.
DP&L originally filed its ESP 3 seeking an effective date of January 1, 2017. On October 11, 2016, DP&L amended the application requesting to recover $145 million per year for seven years supporting the alternative described in the original filing, named the Distribution Modernization Rider. This plan establishes the terms and conditions for DP&L's SSO beginning June 1, 2017 to customers that do not choose a competitive retail electric supplier. In its plan, DP&L recommends including renewable energy attributes as part of the product that is competitively bid, and seeks recovery of approximately $11 million of regulatory assets. The plan also proposes a new Distribution Investment Rider to allow DP&L to recover costs associated with future distribution equipment and infrastructure needs. Additionally, the plan establishes new riders set initially at zero, related to energy reductions from DP&L's energy efficiency programs, and certain environmental liabilities the Company may incur.
On January 30, 2017 DP&L, in conjunction with nine intervening parties, filed a settlement in the ESP 3 case, which is subject to PUCO approval. DP&L and the intervening parties agreed to a six-year settlement that provides a framework for energy rates and defines components which include, but are not limited to, the following:
|
•
|
The establishment of a five-year Distribution Modernization Rider designed to collect $90 million in revenue per year to pay debt obligations at DPL and DP&L and position DP&L to modernize and/or maintain its transmission and distribution infrastructure;
|
|
•
|
The establishment of a Distribution Investment Rider for distribution investments, with one component designed to collect $35 million in revenue per year to enable the implementation of smart grid and advanced metering, ending after the fifth year of the term of the ESP,
|
|
•
|
A commitment by the Company to separate DP&L’s generation assets from its transmission and distribution assets (if approved by FERC);
|
|
•
|
A commitments to commence the sale process of our ownership interests in the Zimmer, Miami Fort and Conesville coal-fired generation plants and;
|
|
•
|
A commitment to develop or procure wind and/or solar energy projects in Ohio,
|
|
•
|
Restrictions on DPL making dividend or tax sharing payments, various other riders, and competitive retail market enhancements.
|
A hearing on the stipulation has been scheduled for March 2017. A final decision by the PUCO is expected at the end of Q2 or early Q3 2017. If the PUCO agrees to the proposed settlement, the average residential customer in the DP&L service territory, using 1,000 kWh on DP&L's Standard Service Offer, can expect a monthly bill increase of $2.39. There can be no assurance that the ESP 3 stipulation will be approved as filed or on a timely basis, and if the final ESP provides for terms that are more adverse than those submitted in DP&L's stipulation, our results of operations, financial condition and cash flows could be materially impacted.
On November 30, 2015 DP&L filed an application to increase its distribution rate case using a 12-month test year of June 1, 2015 to May 31, 2016 to measure revenue and expenses and a date certain of September 30, 2015 to measure its asset base. The Company is seeking an increase to distribution revenues of $66 million per year. The Company has asked for recovery of certain regulatory assets as well as two new riders that would allow the Company to recover certain costs on an ongoing basis. It has proposed a modified straight-fixed variable rate design in an effort to decouple distribution revenues from electric sales. If approved as filed the rates are expected to have a total bill impact of approximately 4% on a typical residential customer.
Environmental Regulation
— In relation to MATS, DPL does not expect to incur material capital expenditures to ensure compliance. For more information see Item 1.
—United States Environmental and Land-Use Legislation
19
and Regulations
.
Key Financial Drivers
— DPL financial results are driven by retail demand, weather, energy efficiency and wholesale prices on financial results. In addition, DPL financial results are likely to be driven by many factors including, but not limited to:
|
•
|
PJM capacity prices
|
|
•
|
Outcome of DP&L's pending ESP 3 case, including the amount of non-bypassable revenue
|
|
•
|
Outcome of DP&L's pending distribution rate case
|
|
•
|
Operational performance of generation facilities
|
|
•
|
Recovery in the power market, particularly as it relates to an expansion in dark spreads
|
|
•
|
Sale or transfer to a DPL affiliate of DP&L generation assets
|
|
•
|
DPL's ability to reduce its cost structure
|
Construction and Development
— Planned construction additions primarily relate to new investments in and upgrades to DP&L's power plant equipment and transmission and distribution system. Capital projects are subject to continuing review and are revised in light of changes in financial and economic conditions, load forecasts, legislative and regulatory developments and changing environmental standards, among other factors.
DPL is projecting to spend an estimated $414 million in capital projects for the period 2017 through 2019 with 65% attributable to Transmission and Distribution. DPL's ability to complete capital projects and the reliability of future service will be affected by its financial condition, the availability of internal funds and the reasonable cost of external funds. We expect to finance these construction additions with a combination of cash on hand, short-term financing, long-term debt and cash flows from operations.
U.S. Generation
Business Description
— In the U.S., we own a diversified generation portfolio in terms of geography, technology and fuel source. The principal markets and locations where we are engaged in the generation and supply of electricity (energy and capacity) are the Western Electric Coordinating Council, PJM, Southwest Power Pool Electric Energy Network and Hawaii. AES Southland, in the Western Electric Coordinating Council, is our most significant generating business.
Many of our U.S. generation plants provide baseload operations and are required to maintain a guaranteed level of availability. Any change in availability has a direct impact on financial performance. The plants are generally eligible for availability bonuses on an annual basis if they meet certain requirements. In addition to plant availability, fuel cost is a key business driver for some of our facilities.
AES Southland
Business Description
— In terms of aggregate installed capacity, AES Southland is one of the largest generation operators in California, with an installed gross capacity of 3,941 MW, accounting for approximately 5% of the state's installed capacity and 17% of the peak demand of Southern California Edison. The three coastal power plants comprising AES Southland are in areas that are critical for local reliability and play an important role in integrating the increasing amounts of renewable generation resources in California.
Market Structure
— All of AES Southland's capacity is contracted through a long-term agreement (the “Tolling Agreement”), which expires in May 31, 2018. A Resource Adequacy agreement has been executed that covers the period from June 1, 2018 through 2020, but it is still subject to approval from the California Public Utilities Commission. Under the current Tolling Agreement, AES Southland's largest revenue driver is unit availability, as approximately 98% of its revenue comes from availability-related payments. Historically, AES Southland has generally met or exceeded its contractual availability requirements under the Tolling Agreement and may capture bonuses for exceeding availability requirements in peak periods.
Under the Tolling Agreement, the offtaker provides gas to the three facilities thus AES Southland is not exposed to significant fuel price risk. If the units operate better than the guaranteed efficiency, AES Southland gets credit for the gas that is not consumed. Conversely, AES Southland is responsible for the cost of fuel in excess of what would have been consumed had the guaranteed efficiency been achieved. The business is also exposed to replacement power costs for a limited period if dispatched by the offtaker and not able to meet the required generation.
AES Southland delivers electricity into the California ISO's market through its Tolling Agreement counterparty.
20
Environmental Regulation
— For a discussion of environmental regulatory matters affecting U.S. Generation, see Item 1.
—United States Environmental and Land-Use Legislation and Regulations.
Re-powering
— In October 2014, AES Southland was awarded 20-year contracts by SCE to provide 1,284 MW of combined cycle gas-fired generation and 100 MW of interconnected battery-based energy storage. In addition to replacing older gas-fired plants with more efficient gas-fired capacity, SCE chose advanced energy storage as a cost effective way to ensure critical power system reliability. This new storage resource will provide operational flexibility, enabling the efficient dispatch of other generating plants, lowering cost and emissions and supporting the on-going addition of renewable power sources.
This new capacity will be built at the Company's existing power plant sites in Huntington Beach and Alamitos Beach. For the gas-fired capacity, financing agreements are expected to be completed in mid-2017 with construction expected to begin shortly thereafter, and commercial operation scheduled for 2020. For the energy storage capacity, commercial operation is scheduled for 2021.
AES is pursuing permits to build both the gas-fired and energy storage capacity and will complete the licensing process before financial close. The total cost for these projects is expected to be approximately $1.9 billion, which will be funded with a combination of non-recourse debt and AES equity.
Key Financial Drivers
— AES Southland's contractual availability is the single most important driver of operations. Its units are generally required to achieve at least 86% availability in each contract year. AES Southland has historically met or exceeded its contractual availability.
Additional U.S. Generation Businesses
Business Description
— Additional businesses include thermal, wind, and solar generating facilities, of which AES Hawaii, our U.S. wind generation businesses and distributed solar are the most significant.
|
•
|
AES Hawaii
— AES Hawaii receives a fuel payment from its offtaker under a PPA expiring in 2022, which is based on a fixed rate indexed to the Gross National Product - Implicit Price Deflator. Since the fuel payment is not directly linked to market prices for fuel, the risk arising from fluctuations in market prices for coal is borne by AES Hawaii.
|
To mitigate the risk from such fluctuations, AES Hawaii has entered into fixed-price coal purchase commitments that end in December 2018; the business could be subject to variability in coal pricing beginning in January 2019. To mitigate fuel risk beyond December 2018, AES Hawaii plans to seek additional fuel purchase commitments on favorable terms. However, if market prices rise and AES Hawaii is unable to procure coal supply on favorable terms, the financial performance of AES Hawaii could be materially and adversely affected.
|
•
|
U.S. Wind
— AES has 736 MW of wind capacity in the U.S., located in California, Texas and West Virginia. Typically, these facilities sell under long-term PPAs. AES financed most of these projects with tax equity structures. The tax equity investors receive a portion of the economic attributes of the facilities, including tax attributes that vary over the life of the projects. Based on certain liquidation provisions of the tax equity structures, this could result in a net loss to AES consolidated results in periods in which the facilities report net income. These non cash net losses will be expected to reverse during the life of the facilities. Some of the wind projects are exposed to the volatility of energy prices and their revenue may change materially as energy prices fluctuate in their respective markets of operations.
|
Buffalo Gap is located in Texas and is comprised of three wind projects with an aggregate generation capacity of 522 MW. Each wind project operates its own PPA with the exception of Buffalo Gap III. The energy price of the entire production of Buffalo Gap I is guaranteed by a PPA expiring in 2021. The PPA of Buffalo Gap II guarantees the energy price of 80% of the installed capacity while the energy price for the remaining 20% is dictated by the prices in the ERCOT market. The PPA of Buffalo Gap II expires in December 2017. Once the PPAs expire, the entire installed capacity of Buffalo Gap will be exposed to the volatility of energy prices in the ERCOT market which could adversely affect revenues.
Laurel Mountain is a wind project located in West Virginia with an installed capacity of 98 MW. Laurel Mountain does not operate under a long-term contract and sells its entire capacity and power generated into the PJM market. The volatility and fluctuations of energy prices in PJM have a direct impact in the results of Laurel Mountain.
AES manages the wind portfolio as part of its broader investments in the U.S., leveraging operational and commercial resources to supplement the experienced subject matter experts in the wind industry to achieve optimal results.
21
|
•
|
AES Distributed Energy
— AES has 103 MW of solar capacity in the U.S., located across multiple states. Distributed Energy's Commercial and Utility division, which comprised 89 MW of solar capacity as of December 31, 2016, sells electricity generated by photovoltaic solar energy systems to public sector, utility, and non-profit entities through power purchase agreements. AES has added 33 MW of commercial and utility capacity in 2016. A majority of this new capacity has been financed with tax equity structures. Under these tax equity structures, the tax equity investors receive a portion of the economic attributes of the facilities, including tax attributes that vary over the life of the projects. Based on certain liquidation provisions of the tax equity structures, this could result in a net loss to AES consolidated results in periods in which the facilities report net income. These non cash net losses will be expected to reverse during the life of the facilities.
|
AES manages the Distributed Energy portfolio as part of its broader investments in the U.S., leveraging operational and commercial resources to supplement the experienced subject matter experts in the solar industry to achieve optimal results.
Market Structure
— For the non-renewable businesses included in our additional U.S. generation facilities, coal and natural gas are used as the primary fuels. Coal has prices that are set by market factors internationally while natural gas is generally set domestically. Price variations for these fuels can change the composition of generation costs and energy prices in our generation businesses, and the prices of these fuels have been subject to volatility in recent years.
Many of these generation businesses have entered into long-term PPAs with utilities or other offtakers. Some coal-fired power plant businesses in the U.S. with PPAs have mechanisms to recover fuel costs from the offtaker, including an energy payment that is partially based on the market price of coal. In addition, these businesses often have an opportunity to increase or decrease profitability from payments under their PPAs depending on such items as plant efficiency and availability, heat rate, ability to buy coal at lower costs through AES' global sourcing program and fuel flexibility. Revenue may change materially as prices in fuel markets fluctuate, but the variable margin or profitability should not be materially changed when market price fluctuations in fuel are borne by the offtaker.
Regulatory Framework
— Several of our generation businesses in the U.S. currently operate as QFs as defined under the PURPA. These businesses entered into long-term contracts with electric utilities that had a mandatory obligation under PURPA requirements to purchase power from QFs at the utility's avoided cost (i.e., the likely costs for both energy and capital investment that would have been incurred by the purchasing utility if that utility had to provide its own generating capacity or purchase it from another source). To be a QF, a cogeneration facility must produce electricity and useful thermal energy for an industrial or commercial process or heating or cooling applications in certain proportions to the facility's total energy output and meet certain efficiency standards. To be a QF, a small power production facility must generally use a renewable resource as its energy input and meet certain size criteria.
Our non-QF generation businesses in the U.S. currently operate as Exempt Wholesale Generators as defined under EPAct 1992. These businesses, subject to approval of FERC, have the right to sell power at market-based rates, either directly to the wholesale market or to a third-party offtaker such as a power marketer or utility/industrial customer. Under the FPA and FERC's regulations, approval from FERC to sell wholesale power at market-based rates is generally dependent upon a showing to FERC that the seller lacks market power in generation and transmission, that the seller and its affiliates cannot erect other barriers to market entry and that there is no opportunity for abusive transactions involving regulated affiliates of the seller. To prevent market manipulation, FERC requires sellers with market-based rate authority to file certain reports, including a triennial updated market power analysis for markets in which they control certain threshold amounts of generation.
Other Regulatory Matters
— The U.S. wholesale electricity market consists of multiple distinct regional markets that are subject to both federal regulation, as implemented by the U.S. FERC, and regional regulation as defined by rules designed and implemented by the RTOs, non-profit corporations that operate the regional transmission grid and maintain organized markets for electricity. These rules for the most part govern such items as the determination of the market mechanism for setting the system marginal price for energy and the establishment of guidelines and incentives for the addition of new capacity. See Item 1A.—
Risk Factors
for additional discussion on U.S. regulatory matters.
Environmental Regulation
— For a discussion of environmental laws and regulations affecting the U.S. business, see Item 1.—
United States
Environmental and Land-Use Legislation and Regulations
.
Key Financial Drivers
— U.S. Generation's financial results are driven by fuel costs and outages. The Company has entered into long-term fuel contracts to mitigate the risks associated with fluctuating prices. In addition, major maintenance requiring units to be off-line is performed during periods when power demand is typically lower. The financial results of U.S. Wind are primarily driven by increased production due to faster and less
22
turbulent wind, and reduced turbine outages. In addition, PJM and ERCOT power prices impact financial results for the wind projects that are operating without long-term contracts for all or some of their capacity.
Construction and Development
— Planned capital projects include the AES Southland re-powering described above. In addition to the new construction projects, U.S. Generation performs capital projects related to major plant maintenance, repairs, and upgrades to be compliant with new environmental laws and regulations.
Andes SBU
Generation
— Our Andes SBU has generation facilities in three countries — Chile, Colombia and Argentina. AES Gener, which owns all of our assets in Chile, Chivor in Colombia and TermoAndes in Argentina, as detailed below, is a publicly listed company in Chile. AES has a 66.7% ownership interest in AES Gener and this business is consolidated in our financial statements.
Operating installed capacity of our Andes SBU totals
9,308
MW, of which 44%, 45% and 11% is located in Argentina, Chile and Colombia, respectively. The following table lists our Andes SBU generation facilities:
|
Business
|
Location
|
Fuel
|
Gross MW
|
AES Equity Interest
|
Year Acquired or Began Operation
|
Contract Expiration Date
|
Customer(s)
|
|||||||||
|
Chivor
|
Colombia
|
Hydro
|
1,000
|
|
67
|
%
|
2000
|
Short-term
|
Various
|
|||||||
|
Tunjita
|
Colombia
|
Hydro
|
20
|
|
67
|
%
|
2016
|
|||||||||
|
Colombia Subtotal
|
1,020
|
|
||||||||||||||
|
Guacolda
(1)
|
Chile
|
Coal/Pet Coke
|
760
|
|
33
|
%
|
2000
|
2017-2032
|
Various
|
|||||||
|
Electrica Santiago
(2)
|
Chile
|
Gas/Diesel
|
750
|
|
67
|
%
|
2000
|
|
|
|||||||
|
Gener - SIC
(3)
|
Chile
|
Hydro/Coal/Diesel/Biomass
|
689
|
|
67
|
%
|
2000
|
2020-2037
|
Various
|
|||||||
|
Electrica Angamos
|
Chile
|
Coal
|
558
|
|
67
|
%
|
2011
|
2026-2037
|
Minera Escondida, Minera Spence, Quebrada Blanca
|
|||||||
|
Cochrane
|
Chile
|
Coal
|
532
|
|
40
|
%
|
2016
|
2030-2034
|
SQM, Sierra Gorda, Quebrada Blanca
|
|||||||
|
Gener - SING
(4)
|
Chile
|
Coal/Pet Coke
|
277
|
|
67
|
%
|
2000
|
2017-2037
|
Minera Escondida, Codelco, SQM, Quebrada Blanca
|
|||||||
|
Electrica Ventanas
(5)
|
Chile
|
Coal
|
272
|
|
67
|
%
|
2010
|
2025
|
Gener
|
|||||||
|
Electrica Campiche
(6)
|
Chile
|
Coal
|
272
|
|
67
|
%
|
2013
|
2020
|
Gener
|
|||||||
|
Andes Solar
|
Chile
|
Solar
|
21
|
|
67
|
%
|
2016
|
2037
|
Quebrada Blanca
|
|||||||
|
Cochrane ES
|
Chile
|
Energy Storage
|
20
|
|
40
|
%
|
2016
|
|||||||||
|
Electrica Angamos ES
|
Chile
|
Energy Storage
|
20
|
|
67
|
%
|
2011
|
|
|
|||||||
|
Gener - Norgener ES (Los Andes)
|
Chile
|
Energy Storage
|
12
|
|
67
|
%
|
2009
|
|
|
|||||||
|
Chile Subtotal
|
4,183
|
|
||||||||||||||
|
TermoAndes
(7)
|
Argentina
|
Gas/Diesel
|
643
|
|
67
|
%
|
2000
|
Short-term
|
Various
|
|||||||
|
AES Gener Subtotal
|
5,846
|
|
||||||||||||||
|
Alicura
|
Argentina
|
Hydro
|
1,050
|
|
100
|
%
|
2000
|
2017
|
Various
|
|||||||
|
Paraná-GT
|
Argentina
|
Gas/Diesel
|
845
|
|
100
|
%
|
2001
|
|
|
|||||||
|
San Nicolás
|
Argentina
|
Coal/Gas/Oil
|
675
|
|
100
|
%
|
1993
|
|
|
|||||||
|
Guillermo Brown
(8)
|
Argentina
|
Gas/Diesel
|
576
|
|
—
|
%
|
2016
|
|||||||||
|
Los Caracoles
(8)
|
Argentina
|
Hydro
|
125
|
|
—
|
%
|
2009
|
2019
|
Energia Provincial Sociedad del Estado (EPSE)
|
|||||||
|
Cabra Corral
|
Argentina
|
Hydro
|
102
|
|
100
|
%
|
1995
|
|
Various
|
|||||||
|
Ullum
|
Argentina
|
Hydro
|
45
|
|
100
|
%
|
1996
|
|
Various
|
|||||||
|
Sarmiento
|
Argentina
|
Gas/Diesel
|
33
|
|
100
|
%
|
1996
|
|
|
|||||||
|
El Tunal
|
Argentina
|
Hydro
|
11
|
|
100
|
%
|
1995
|
|
Various
|
|||||||
|
Argentina Subtotal
|
3,462
|
|
||||||||||||||
|
9,308
|
|
|||||||||||||||
_____________________________
|
(1)
|
Guacolda plants: Guacolda 1, 2, 3, 4, and 5. Unconsolidated entities for which the results of operations are reflected in Equity in Earnings of Affiliates. The Company's ownership in Guacolda is held through AES Gener, a 67%-owned consolidated subsidiary. AES Gener owns 50% of Guacolda, resulting in an AES effective ownership in Guacolda of 33%.
|
|
(2)
|
Electrica Santiago plants: Nueva Renca, Renca, Los Vientos and Santa Lidia.
|
|
(3)
|
Gener — SIC plants: Alfalfal, Laguna Verde, Laguna Verde Turbogas, Laja, Maitenes, Queltehues, Ventanas 1, Ventanas 2 and Volcán.
|
|
(4)
|
Gener — SING plants: Norgener 1 and Norgener 2.
|
|
(5)
|
Electrica Ventanas plant: Ventanas 3.
|
|
(6)
|
Electrica Campiche plant: Ventanas 4.
|
|
(7)
|
TermoAndes is located in Argentina, but is connected to both the SING in Chile and the SADI in Argentina.
|
|
(8)
|
AES operates these facilities through management or O&M agreements and owns no equity interest in these businesses.
|
23
Under construction
— The following table lists our plants under construction in the Andes SBU:
|
Business
|
Location
|
Fuel
|
Gross MW
|
AES Equity Interest
|
Expected Date of Commercial Operations
|
|||||||
|
Alto Maipo
|
Chile
|
Hydro
|
531
|
|
40
|
%
|
1H 2019
|
|||||
|
Chile Subtotal
|
531
|
|
||||||||||
|
531
|
|
|||||||||||
The following map illustrates the location of our Andes facilities:
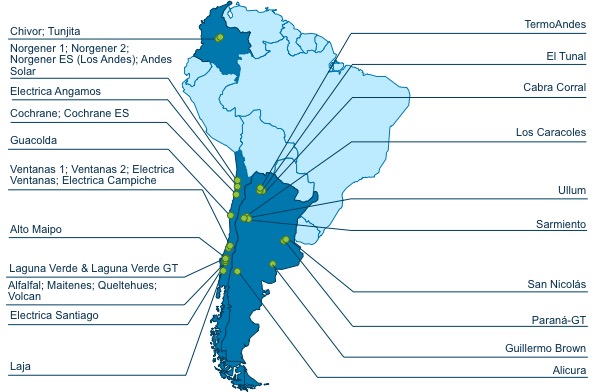
Andes Businesses
Chile
Business Description
— In Chile, through AES Gener, we are engaged in the generation and supply of electricity (energy and capacity) in the two principal markets: the SIC and SING. In terms of aggregate installed capacity, AES Gener is the second largest generation operator in Chile with a calculated installed capacity of 4,131 MW, excluding energy storage and TermoAndes, and a market share of approximately 18% as of December 31, 2016.
AES Gener owns a diversified generation portfolio in Chile in terms of geography, technology, customers and fuel source. AES Gener's installed capacity is located near the principal electricity consumption centers, including Santiago, Valparaiso and Antofagasta. AES Gener's portfolio is composed of hydroelectric, coal, gas, diesel, solar photovoltaic and biomass facilities, that allows the businesses to operate under a variety of market and hydrological conditions, manage AES Gener's contractual obligations with regulated and unregulated customers and, as required, provide backup energy to the spot market.
AES Gener has experienced significant growth in recent years by responding to market opportunities. The company successfully completed a first expansion phase between 2007 and 2014 that added 6 new power plants totaling 1,677 MW. It continued to grow in Chile through its second expansion phase that will add 1,236 MW. As of the end of 2016, AES Gener has completed the construction of Guacolda Unit 5 (152 MW), Cochrane (532 MW) and Andes Solar (21 MW). Additionally, we continue to advance in the construction of the 531 MW Alto Maipo run-of-the-river hydroelectric plant in the SIC.
Our commercial policy in Chile aims to maximize margin while reducing cash flow volatility. In order to achieve this, we contract a significant portion of our baseload capacity, currently coal and hydroelectric, under long-term agreements with a diversified customer base, that includes both regulated and unregulated customers. Power plants that are not considered within our baseload capacity (higher variable cost units, mainly diesel and gas fired
24
units) operate during scarce system supply conditions, such as dry hydrological conditions and plant outages, selling their energy in the spot market. In Chile, sales on the spot market are made only to other generation companies (entities that are members of the Economic Load Dispatch Center - "CISEN") at the system marginal cost. In anticipation of the SIC and SING interconnection, the new Transmission Law created the CISEN, an entity that will merge both system operators into one.
AES Gener currently has long-term contracts, with an average remaining term of approximately 11 years, with regulated distribution companies and unregulated customers, such as mining and industrial companies. In general, these long-term contracts include both fixed and variable payments along with indexation mechanisms that periodically adjust prices based on the generation cost structure related to the United States Consumer Price Index, the international price of coal, and in some cases, with pass-through of fuel and regulatory costs, including changes in law.
In addition to energy payments, AES Gener also receives firm capacity payments for contributing to the system's ability to meet peak demand. These payments are added to the final electricity price paid by both unregulated and regulated customers. In each system, the CISEN annually determines the firm capacity amount allocated to each power plant. A plant's firm capacity is defined as the capacity that it can guarantee at peak hours during critical conditions, such as droughts, taking into account statistical information regarding maintenance periods and water inflows in the case of hydroelectric plants. The capacity price is fixed by the National Energy Commission in the semiannual node price report and indexed to the United States Consumer Price Index and other relevant indices.
Market Structure
— Chile has two main power systems, largely as a result of its geographic shape and size. The SIC is the largest of these systems, with an installed capacity of 17,543 MW as of December 31, 2016. The SIC serves approximately 92% of the Chilean population, including the densely populated Santiago Metropolitan Region, and represents 75% of the country's electricity demand. The SING serves about 6% of the Chilean population, representing 25% of Chile's electricity consumption, and mainly supplies mining companies.
In 2016, thermoelectric generation represented 67% of the total generation in Chile. In the SIC, thermoelectric generation represents 48% of installed capacity, required to fulfill demand not satisfied by hydroelectric output and is critical to guaranteeing reliable and dependable electricity supply under dry hydrological conditions. In the SING, which includes the Atacama Desert, the driest desert in the world, thermoelectric capacity represents 92% of installed capacity. The fuels used for generation, mainly coal, diesel and LNG, are indexed to international prices.
In the SIC, where hydroelectric plants represent a large part of the system's installed capacity, hydrological conditions largely influence plant dispatch and, therefore, spot market prices, given that river inflows, snow melting and initial water levels in reservoirs largely determine the dispatch of the system's hydroelectric and thermoelectric generation plants. Rainfall and snowfall occur in Chile principally in the southern cone winter season (June to August) and during the remainder of the year precipitation is scarce. When rain is abundant, energy produced by hydroelectric plants can amount to more than 70% of total generation. In 2016 hydroelectric generation represented 36% of total energy production within the SIC, and 27% of the country’s total energy production.
Solar and wind installed capacity represents a small but growing part of the total capacity installed. In the SIC, solar accounts for 3% of the power generation and 7% of the system’s installed capacity while in the SING solar accounts for 4% of the power generation and 6% of the system’s capacity. As for wind, in the SIC, wind contributes with 4% of the power generation and 7% of the system’s capacity, while in the SING wind generation represents 1% of the power generation and with 2% of the system’s capacity.
Regulatory Framework
— The government entity that has primary responsibility for the Chilean electricity system is the Ministry of Energy, acting directly or through the National Energy Commission and the Superintendency of Electricity and Fuels. The electricity sector is divided into three segments: generation, transmission and distribution. In general terms, generation and transmission expansion are subject to market competition, while transmission operation and distribution, are subject to price regulation. The transmission segment consists of companies that transmit the electricity produced by generation companies at high voltage. The individual and joint participation of companies operating in any other segment of the electricity sector cannot exceed 8% and 40%, respectively, of the total investment value of the national transmission system.
Companies in the SIC and the SING that own generation, transmission, sub-transmission or additional transmission facilities, as well as unregulated customers directly connected to transmission facilities, are coordinated through the CISEN, which minimizes the operating costs of the electricity system, while meeting all service quality and reliability requirements. The principal purpose of the CISEN is to ensure that the most efficient electricity generation available to meet demand is dispatched to customers. The CISEN dispatches plants in merit order based on their variable cost of production, allowing for electricity to be supplied at the lowest available cost.
25
All generators can commercialize energy through contracts with distribution companies for their regulated and unregulated customers or directly with unregulated customers. Unregulated customers are customers whose connected capacity is higher than 2MW. Customers with connected capacity between 0.5 MW and 2.0 MW can opt for a Regulated or Unregulated regime for a minimum period of four years. By law, both regulated and unregulated customers are required to purchase all of their electricity requirements under contract. Generators may also sell energy to other power generation companies on a short-term basis. Power generation companies may engage in contracted sales among themselves at negotiated prices outside the spot market. Electricity prices in Chile, under contract and on the spot market, are denominated in U.S. Dollars, although payments are made in Chilean Pesos.
In July 2016, modifications to the Transmission Law were enacted. This Law establishes that the transmission system will be completely paid for by the end-users, gradually allocating the costs on the demand side from year 2019 through 2034.
Environmental Regulation
— In 2011, a regulation on air emission standards for thermoelectric power plants became effective. This regulation provides for stringent limits on emission of PM and gases produced by the combustion of solid and liquid fuels, particularly coal. For existing plants, including those currently under construction, the new limits for PM emissions went into effect at the end of 2013, and the new limits for SO
2
, NO
x
and mercury emission were in effect since mid-2016, except for those plants operating in zones declared saturated or latent zones (areas at risk of or affected by excessive air pollution), where these emission limits became effective in June 2015. In order to comply with the new emission standards, AES Gener initiated investments in Chile at its older coal facilities (Ventanas I and II and Norgener I and II, constructed between 1964 and 1997) in 2012. As of December 31, 2016, AES Gener has concluded investments of approximately $229 million in order to comply within the required time frame. Additionally, its equity method investee Guacolda started the installation of new emission control equipment during 2013, and concluded investments of approximately $209 million in order to comply within the required time frame.
On March 29, 2016, the Health Ministry enacted Supreme Decree N°43 (“DS 43”) ruling “Storage of Hazardous Materials”, modifying the current applicable rules. This regulation will become fully effective in March 2018 for structural improvements of currently authorized storage facilities. The estimated investment required to comply with DS 43 would be approximately $15 million.
During 2016, the Environmental Ministry worked on upgrading the Atmospheric Decontamination Plans for Santiago, Ventanas and Huasco areas, each of which, as of December 31, 2016, are currently under different stages of progress. Nueva Renca, Ventanas and Guacolda power plants may require an improvement of their operational practices and additional investments to meet the expected new requirements during the year following the enactment of the Decontamination Plan, which is expected for mid 2017.
Chilean law requires every electricity generator to supply a certain portion of its total contractual obligations with Non-conventional Renewable Energy ("NCREs"). In October 2013, the NCRE law was amended, increasing the NCRE requirements. The law distinguishes between energy contracts executed before and after July 1, 2013. For contracts executed between August 31, 2007 and July 1, 2013, the NCRE requirement is equal to 5% in 2014 with annual contract increases of 0.5% until reaching 10% in 2024. The NCRE requirement for contracts executed after July 1, 2013 is equal to 5% in 2013, with annual increases of 1% thereafter until reaching 12% in 2020, and subsequently annual increases of 1.5% until it is equal to 20% in 2025. Generation companies are able to meet this requirement by developing their own NCRE generation capacity (wind, solar, biomass, geothermal and small hydroelectric technology), purchasing NCREs from qualified generators or by paying the applicable fines for non-compliance. AES Gener currently fulfills the NCRE requirements by utilizing AES Gener's own solar and biomass power plants and by purchasing NCREs from other generation companies. It has sold certain water rights to companies that are developing small hydro projects, entering into power purchase agreements with these companies in order to promote development of these projects, while at the same time meeting the NCRE requirements. At present, AES Gener is in the process of negotiating additional NCRE supply contracts to meet the future requirements.
In September 2014 a new tax law was enacted. The new law introduces an emission tax, or "green tax", that assesses the emissions of PM, SO
2
, NO
x
and CO
2
produced for installations with an installed capacity over 50 MW. The first annual payment shall be made in April 2018 for emissions produced in 2017. In the case of CO
2
, the tax will be equivalent to $5 per ton emitted. In the SING, all PPAs have "change of law" clauses, which would allow the company to transfer this cost to customers. In the SIC, costs can only be passed through to unregulated customers, as existing PPAs with distribution companies do not have change of law clauses. According to its PPAs, the company is currently discussing the pass-through mechanism with each client. Additionally, the new tax systems introduced by the new tax laws enacted in February 2016 will be effective from January 1, 2017 onwards. The statutory income tax rate for most of our Chilean businesses will increase from 25% to 25.5% in 2017 and to 27%
26
for 2018 and future years. See Item 7.—
Management's Discussion and Analysis of Financial Condition and Results of Operations
—
Critical Accounting Policies and Estimates
—
Income Taxes
for further details of the impacts of these new laws.
In June 2015, the Chilean government published Decree N°7/2015, which allows the export of energy generated by plants not dispatched in the SING to Argentina using the transmission line connecting the SING with the SADI. This transmission line is owned by AES Gener and has a capacity of approximately 600 MW, but will be operated at 200 MW according to the government permit and related technical studies. AES Gener signed an agreement with CAMMESA and Chilean generators to export electricity to Argentina. In December 2016, Decree N° 7/2015 was amended to allow the export of energy generated by plants dispatched into the SING to Argentina. During 2016, energy exported to Argentina reached 102 GWh.
Key Financial Drivers
—
Hedge levels at Gener provide some certainty and clarity on the underlying financial drivers. In addition, financial results are likely to be driven by many factors including, but not limited to:
|
•
|
Dry hydrology scenarios reduce hydro generation
|
|
•
|
Forced outages may impact earnings
|
|
•
|
Changes in current regulatory rulings could alter the ability to pass through or recover certain costs
|
|
•
|
AES is exposed to the fluctuation of the Chilean peso, which may pose a risk to earnings; our hedging strategy reduces this risk, but some residual risk to earnings remains
|
|
•
|
Tax policy changes
|
|
•
|
Current legislation is trending towards promoting renewable energy and strengthening regulations on thermal generation assets, posing a risk to future coal margins
|
|
•
|
Market price risk when re-contracting
|
Construction and Development
— Since 2007, AES Gener has constructed and commissioned approximately 2,400 MW of new capacity, representing a significant portion of the capacity increase in the SIC and SING during the period. During 2016, AES Gener achieved important milestones related to the construction of their projects:
|
•
|
Cochrane project began operations (Unit 2 on October 12 and Unit 1 on July 9) adding 532 MW to the SING.
|
|
•
|
Cochrane Energy Storage began operations in October 2016 adding 20 MW of batteries contributing to system stability in the SING.
|
|
•
|
Andes Solar with 21 MW began operations in May 2016
|
Additionally, in the SIC, we continue advancing in the construction of our Alto Maipo project, a 531 MW two unit run-of-river hydroelectric power plant, adjacent to our existing Alfalfal plant, located 50 km from Santiago. Alto Maipo is the largest project in construction in the SIC market and it includes 67 km of tunnel works, two caverns, 17 km of transmission lines as part of the construction, and is 90% underground. Alto Maipo has three main contractors and covers three adjacent valleys in the Chilean Andes. As of today, the project employs approximately 4,300 people and expects to reach a peak close to 4,500. The project units are scheduled to reach commercial operation in the first half of 2019.
We are expanding our business by evaluating opportunities in the desalination business line through two initiatives: i) brownfield projects, which take advantage of existing infrastructure in thermoelectric power plants (marine works, easy access to power, strategic location, permits, etc.), providing shorter development time lines and more competitive water tariffs to offtakers; and ii) greenfield projects, mainly for mining companies which either purchase industrial water through water purchase agreements, or either invite external companies to compete in a bidding process to develop a project under a build-own-operate-and-transfer scheme where the water facility along its pipeline is transferred to the mining operation at the end of a defined period. In Chile, most of the water demand comes from mining operations, either directly or indirectly (their service providers), hence negative outlooks in the mineral markets have translated in the postponement of most of the mining projects and their corresponding water demands.
Colombia
Business Description
— We operate in Colombia through AES Chivor, a subsidiary of AES Gener, who owns a hydroelectric plant with an installed capacity of 1,000 MW, and Tunjita, a 20 MW run-of-river hydroelectric, both located approximately 160 km east of Bogota. As of December 31, 2016, AES Chivor's net power production in reached 4,373 GWh. AES Chivor’s installed capacity accounted for approximately 6.1% of system capacity by the end of the year. Chivor remains dependent on prevailing hydrological conditions in the region in which it operates. Hydrological conditions largely influence generation and the spot prices at which AES Chivor sells its non-
27
contracted generation in Colombia.
AES Chivor's commercial strategy aims to reduce margin volatility by selling a significant portion of the expected generation under short term contracts, mainly with distribution companies. These contracts are awarded in public auctions and normally last from one to three years. The remaining generation is sold on the spot market to other generation and trading companies at the system marginal cost, allowing us to maximize the operating margin. Additionally, AES Chivor receives reliability payments to compensate for the plant availability during periods of power scarcity, such as adverse hydrological conditions, in order to prevent power shortages.
Market Structure
— Electricity supply in Colombia is concentrated in one main system, the SIN which encompasses one-third of Colombia's territory, providing coverage to 97% of the country's population. The SIN's installed capacity totaled 16,690 MW as of December 31, 2016, comprised of 70% hydroelectric generation, 29% thermoelectric generation and 1% other. The dominance of hydroelectric generation and the marked seasonal variations in Colombia's hydrology result in price volatility in the short-term market. In 2016, 72% of total energy demand was supplied by hydroelectric plants with the remaining supply from thermoelectric generation of 27% and cogeneration and self-generation power of 1%. From 2003 to 2016, electricity demand in the SIN has grown at a compound annual growth rate of 2.9% and the Mining and Energetic Planning Unit projects an average compound annual growth rate in electricity demand of 3.0% per year for the next 10 years.
Regulatory Framework
— Since 1994, the electricity sector in Colombia has operated under a competitive market framework for the generation and sale of electricity and a regulated framework for transmission and distribution. The distinct activities of the electricity sector are governed by various laws as well as the regulations and technical standards issued by the CREG. Other government entities that play an important role in the electricity industry include the Ministry of Mines and Energy, which defines the government's policy for the energy sector; the Public Utility Superintendency of Colombia, which is in charge of overseeing and inspecting the utility companies; and the Mining and Energetic Planning Unit, which is in charge of planning the expansion of the generation and transmission network.
The generation sector is organized on a competitive basis with companies selling their generation in the wholesale market at the short-term price or under bilateral contracts with other participants, including distribution companies, generators and traders, and unregulated customers at freely negotiated prices. Generation companies must submit price bids and report the quantity of energy available on a daily basis. The National Dispatch Center dispatches generators in merit order based on bid offers in order to ensure that demand will be satisfied by the lowest cost combination of available generating units.
Regulatory Framework
-
Tax Regulation
— On December 29, 2016, Law 1819 was enacted in Colombia, which introduced a tax reform with several changes in the Colombian tax system, and became effective on January 1, 2017. This tax reform reduced the statutory corporate tax rate of companies to 40% in 2017, 37% in 2018, and 33% in 2019 onwards. The law also created a new withholding tax on dividend distributions based on a tax rate of 5%
,
applicable on distribution of Colombian profits generated from the taxable year 2017 onwards.
Other Regulatory Considerations
— After the phenomenon of El Niño put the energy supply at risk, regulatory agencies and the government have carried out various studies to make adjustments to the market. The subjects susceptible to revision include the following:
|
•
|
Adjustments to the scarcity price so that it reflects a true value of thermal plants that operate in periods of crisis.
|
|
•
|
A plan to implement an option to assign firm energy obligations without the need for reliability auctions but with obligation of signing energy contracts with non-regulated demand.
|
|
•
|
Possible participation of renewable plants in the market and its effect in the formation of prices and operation of the market.
|
|
•
|
The implementation of the standardized contract market, and
|
|
•
|
The possibility of entering into the intraday markets and markets of the previous day are still being considered.
|
Other topics that the regulator could analyze in 2017, but with a secondary priority are: An international interconnection scheme, review of the AGC market and analysis of other ancillary services, and possible modification of the current regulation for emergency situations.
Key Financial Drivers
— Hydrological conditions largely influence Chivor's generation level. Maintaining the appropriate contract level, while working to maximize revenue, through sale of excess generation, is key to Chivor's results of operations Hedge levels at Chivor provide certainty and clarity on the underlying financial drivers, hedging the net cash flows of Chivor, up to 90%. In addition to hydrology financial results are likely to be driven by many factors including, but not limited to:
28
|
•
|
Forced outages may impact earnings
|
|
•
|
AES is exposed to fluctuation of the Colombian peso, which pose a risk to earnings; our hedging strategy reduces this risk, but some residual risk to earnings remains
|
|
•
|
Chivor has exposure to the spot market as hedge levels are lower in the future
|
Construction and Development
—
In Colombia, AES Gener completed the construction of the Tunjita project in June 2016 that added 20 MW of capacity to the Chivor plant.
Argentina
Business Description
— As of December 31, 2016, AES Argentina operates 4,105 MW which represents 12% of the country's total installed capacity. The installed capacity in the SADI includes the TermoAndes plant, a subsidiary of AES Gener, which is connected both to the SADI and the Chilean SING. AES Argentina has a diversified generation portfolio of ten generation facilities, comprised of 68% thermoelectric and 32% hydroelectric capacity. All of the thermoelectric capacity has the capability to burn alternative fuels. Approximately 76% of the thermoelectric capacity can operate with natural gas or diesel oil, and the remaining 24% can operate with natural gas, fuel oil, or coal.
AES Argentina primarily sells its production to the wholesale electric market where prices are largely regulated. In 2016, approximately 94% of the energy was sold in the wholesale electric market and 6% was sold under contract, as a result of the Energy Plus sales made by TermoAndes.
All of the thermoelectric facilities not affected by the Resolution 95/2013, a regulation passed in March 2013 discussed below, including the portion of TermoAndes plant committed to Energy Plus Contracts, are able to use natural gas and receive gas supplied through contracts with Argentine producers. In recent years, gas supply restrictions in Argentina, particularly during the winter season, have affected some of the plants, such as the TermoAndes plant. The TermoAndes plant commenced operations in 2000, selling exclusively into the Chilean SING. In 2008, following requirements from the Argentine authorities, TermoAndes connected its two gas turbines to the SADI, while maintaining its steam turbine connected to the SING. However, since December 2011, TermoAndes has been selling the plant's full capacity in the SADI.
Market Structure
— The SADI electricity market is managed by CAMMESA. As of December 31, 2016, the installed capacity of the SADI totaled 33,901 MW. In 2016, 66% of total energy demand was supplied by thermoelectric plants, 26% by hydroelectric plants and 8% from nuclear, wind and solar plants.
Thermoelectric generation in the SADI is principally fueled by natural gas. However, since 2004 due to natural gas shortages, in addition to increasing electricity demand, the use of alternative fuels in thermoelectric generation, such as oil and coal, has increased. Given the importance of hydroelectric facilities in the SADI, hydrological conditions determining river flow volumes and initial water levels in reservoirs largely influence hydroelectric and thermoelectric plant dispatch. Rainfall occurs principally in the southern cone winter season (June to August).
Regulatory Framework
— The Argentine regulatory framework divides the electricity sector into generation, transmission and distribution. The wholesale electric market is made up of generation companies, transmission companies, distribution companies and large customers who are allowed to buy and sell electricity. Generation companies can sell their output in the short-term market or to customers in the contract market. CAMMESA is responsible for dispatch coordination and determination of short-term prices. The Electricity National Regulatory Agency is in charge of regulating public service activities and the Ministry of Federal Planning, Public Investment and Services, through the Energy Secretariat, regulates system dispatch and grants concessions or authorizations for sector activities.
Since 2001, significant modifications have been made to the electricity regulatory framework. These modifications include the freezing of tariffs, the cancellation of inflation adjustment mechanisms and the introduction of a complex pricing system in the wholesale electric market, which have materially affected electricity generators, transporters and distributors, and generated substantial price differences within the market. Since 2004, as a result of energy market reforms and overdue accounts receivables owed by the government to generators operating in Argentina, AES Argentina contributed certain accounts receivables to fund the construction of new power plants under FONINVEMEM agreements. These receivables accrue interest and are collected in monthly installments over 10 years once the related plants begin operations. At this point, three funds have been created to construct three facilities. The three plants are operating and payments are being received. AES Argentina will receive a pro rata ownership interest in these newly built plants once the accounts receivables have been paid. See Item 7.—
Capital Resources and Liquidity—Long-Term Receivables
and Note 7
—Financing Receivables
for further discussion of receivables in Argentina.
29
In March 2013, the Secretariat of Energy released Resolution 95/2013, which affects the remuneration of generators whose sales prices had been frozen since 2003. This regulation is applicable to generation companies with certain exceptions. It defined a compensation system based on compensating for fixed costs, non-fuel variable costs and an additional margin. Resolution 95/2013 converted the Argentine electric market to an "average cost" compensation scheme.
Thermal units must achieve an availability target, which varies by technology, in order to receive full fixed cost revenues. The Resolution also established that all fuels, except coal, are to be provided by CAMMESA. Thermoelectric natural gas plants not affected by the Resolution, such as TermoAndes, are able to purchase gas directly from the producers for Energy Plus sales.
In May 2014, the Argentine government passed Resolution No. 529/214 ("Resolution 529") which retroactively updated the prices of Resolution 95/2013 to February 1, 2014, changed target availability and added a remuneration for non-periodic maintenance. This remuneration is aimed to cover the expenses that the generator incurs when performing major maintenances in its units. Since 2014, this resolution has been updated annually, the most recent of which was issued in March 2016.
On February 2, 2017, the Ministry of Energy issued Resolution 19/2017 establishing changes to the Energia Base price framework. Effective in February 2017, the framework will maintain the current tolling agreement structure, as fuels will continue to be sourced by CAMMESA. A key change will be introduced to the tariff structure which will now have prices set in USD and also eliminates all future non-cash retention of margins.
In December 2015, the finance minister lifted foreign currency controls, allowing the peso to float under the administration of Argentinean Central Bank. The newly freed currency fell by more than 30%. Over the course of 2016, the Argentinean Peso devalued by approximately 22%. At December 31, 2016, all transactions at our businesses in Argentina were translated using the official exchange rate published by the Argentine Central Bank. See Note 7—
Financing Receivables
in Item 8.—
Financial Statements and Supplementary Data
of this Form 10-K for further information on the long-term receivables. Further weakening of the Argentine Peso and local economic activity could cause significant volatility in our results of operations, cash flows, the ability to pay dividends to the Parent Company, and the value of our assets.
Key Financial Drivers
— Financial results are likely to be driven by many factors including, but not limited to:
•
Forced outages may impact earnings
•
FX exposure to fluctuations of the Argentine Peso
•
Hydrology
|
•
|
Timely collection of FONINVEMEM installment and outstanding receivables (See Note 7—
Financing Receivables
in Item 8.—
Financial Statements and Supplementary Data
for further discussion)
|
•
Level of gas prices for contracted generation (Energy Plus)
Brazil SBU
Our Brazil SBU has generation and distribution businesses. Tietê and Eletropaulo are publicly listed companies in Brazil. AES has a 24% economic interest in Tietê and a 17% economic interest in Eletropaulo. These businesses are consolidated in our financial statements as we maintain control over their operations.
Generation
— Operating installed capacity of our Brazil SBU totals
2,658
MW in AES Tietê plants, located in the state of São Paulo. As of December 31,
2016
, Tietê represents approximately 10% of the total generation capacity in the state of São Paulo and is one of the largest generation companies in Brazil. We also have another generation plant, AES Uruguaiana, located in southern Brazil with an installed capacity of
640
MW. The following table lists our Brazil SBU generation facilities:
|
Business
|
Location
|
Fuel
|
Gross MW
|
AES Equity Interest
|
Year Acquired or Began Operation
|
Contract Expiration Date
|
Customer(s)
|
|||||||||
|
Tietê
(1)
|
Brazil
|
Hydro
|
2,658
|
|
24
|
%
|
1999
|
2029
|
Various
|
|||||||
|
Uruguaiana
|
Brazil
|
Gas
|
640
|
|
46
|
%
|
2000
|
|
|
|||||||
|
3,298
|
|
|||||||||||||||
_____________________________
|
(1)
|
Tietê plants with installed capacity: Água Vermelha (1,396 MW), Bariri (143 MW), Barra Bonita (141 MW), Caconde (80 MW), Euclides da Cunha (109 MW), Ibitinga (132 MW), Limoeiro (32 MW), Mogi-Guaçu (7 MW), Nova Avanhandava (347 MW), Promissão (264 MW), Sao Joaquim (3 MW) and Sao Jose (4 MW).
|
Utilities
— Eletropaulo operates in the metropolitan area of São Paulo and adjacent regions, distributing electricity to 24 municipalities in a total area of 4,526 km
2
, covering a region of high demographic density and the largest concentration of GDP in the country. Serving approximately 18 million people and
7 million
consumer units,
30
Eletropaulo is the largest power distributor in Brazil, according to the 2015 ranking of the Brazilian Association of the Distributors of Electric Energy (Abradee). On October 31, 2016, the Company completed the sale of its wholly-owned subsidiary AES Sul, a distribution business in Brazil. The following table describes our Brazil utility:
|
Business
|
Location
|
Approximate Number of Customers Served as of 12/31/2016
|
GWh Sold in 2016
|
AES Equity Interest (% Rounded)
|
Year Acquired
|
||||||||
|
Eletropaulo
|
Brazil
|
7,015,909
|
|
34,464
|
|
17
|
%
|
1998
|
|||||
The following map illustrates the location of our Brazil facilities:
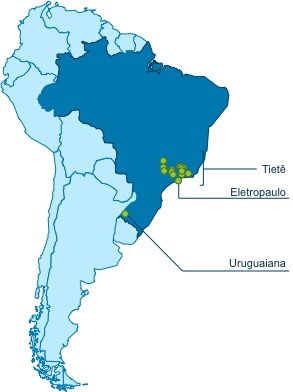
Brazil Businesses
Brazil Utility
Business Description
— Eletropaulo distributes electricity to the greater São Paulo area, Brazil's main economic and financial center. AES owns 17% of the economic interest in Eletropaulo, our partner, BNDES, owns 19% and the remaining shares are publicly held or held by government-related entities. On December 30, 2016 AES purchased par shares from BNDES and increased its participation in Eletropaulo from 16% to 17%.
AES is the controlling shareholder and manages and consolidates this business. Eletropaulo holds a 30-year concession that expires in 2028. In December 2016, Eletropaulo underwent a corporate restructuring which is expected to, among other things, prepare for the listing of its shares on the Novo Mercado, a segment of the Brazilian stock exchange.
Regulatory Framework — In Brazil, ANEEL, a government agency, sets the tariff for each distribution company based on a return on asset base methodology, which also benchmarks operational costs against other distribution companies. The tariff charged to regulated customers consists of two elements: (i) pass-through of non-manageable costs under a determined methodology ("Parcel A"), including energy purchase costs, sector charges and transmission and distribution system expenses; and (ii) a manageable cost component ("Parcel B"), including operation and maintenance costs (defined by ANEEL), recovery of investments and a component for a return to the distributor. The return to distributors is calculated as the net asset base multiplied by the regulatory weighted-average cost of capital, which is set for all industry participants during each tariff reset cycle. The current regulatory weighted-average cost of capital for Eletropaulo, after tax, is 8.1%.
Each year ANEEL reviews each distributor's tariff for an annual tariff adjustment. The annual tariff adjustments allow for pass-through of Parcel A costs and inflation impacts on Parcel B costs, adjusted for expected efficiency gains and quality performances. Distribution companies are required to contract between 100% and 105% of anticipated energy needs through the regulated auction market. If contracted levels fall below required levels distribution companies may be subject to limitations on the pass-through treatment of energy purchase costs as well as penalties. As the costs incurred on energy purchases made by our distribution company are passed through
31
to customers with adjustments on a yearly basis, working capital can be sensitive to significant increases in energy prices. In order to reduce potential working capital needs, in 2015 ANEEL established the tariff flag mechanism, which allows temporary tariff changes to customers on a monthly basis depending on energy purchase prices. The resources collected by the tariff flag mechanism are centralized in an account and shared among distribution companies in proportion to their respective exposure to the spot market.
Every four years, ANEEL resets each distributor's tariff to incorporate the revised regulatory weighted-average cost of capital and determination of the distributor's net asset base as well as operational costs. Eletropaulo's tariff reset occurs every four years and the next tariff reset will be in July 2019. The 4
th
Tariff Reset for AES Eletropaulo occurred on July 4, 2015, representing an average tariff increase of 15.23%.
Between the tariff reset periods, the regulator applies the annual adjustments. On July 4, 2016 ANEEL approved a negative tariff adjustment for Eletropaulo, mainly due to a decrease in energy purchase and sector charges costs. The average tariff decrease was 8.1%
.
In 2013, ANEEL challenged the parameters of a tariff reset for Eletropaulo implemented in July 2012 and retroactive to 2011. ANEEL asserted that during the period between 2007 and 2011, certain assets that were included in the regulatory asset base should not have been included and that Eletropaulo should refund customers for the return on the disputed assets earned during this period. On December 17, 2013, ANEEL determined, at the administrative level, that Eletropaulo should adjust the prior 2007-2011 regulatory asset base and refund customers in the amount of $269 million over a period of up to four tariff processes beginning in July 2014. The Company recognized a regulatory liability of approximately $269 million in 2013, since ANEEL had compelled the Company to refund customers, and started reimbursing customers in July 2014. Eletropaulo filed for an administrative appeal requesting ANEEL to reconsider its decision and requested that the decision be suspended until the appeal process is completed. The injunction was granted and, although for a period was suspended, it has been restored and in effect since December 2014.
Given ANEEL's failure to suspend the injunction through the appeals process in the Brazilian courts thus far, the tariff reset resulted in management's reassessment of the probability of refunding customers these disputed amounts. Therefore, at this point, the Company considers it only reasonably possible that Eletropaulo will be required to refund these amounts to customers prior to the ultimate resolution of the pending court case. As a result, during 2015, the Company reversed the remaining regulatory liability for this contingency of $161 million. Eletropaulo believes it has meritorious arguments on this matter and will continue to pursue its objections to ANEEL's rulings vigorously, however there can be no assurance that Eletropaulo will prevail.
Key Financial Drivers
— Eletropaulo's financial results is likely to be driven by many factors including, but not limited to:
|
•
|
Hydrology, impacting quantity of energy sold and energy purchased
|
|
•
|
Brazilian economic scenario and tariff increases, impacting energy consumption growth, losses and delinquency
|
|
•
|
Quality indicators recovery plan
|
|
•
|
Ability of Eletropaulo to pass through costs via productivity gains
|
|
•
|
Ability of Eletropaulo to solve involuntary exposure
|
|
•
|
Capital structure optimization to reduce leverage and interest costs
|
|
•
|
The CTEEP Eletrobrás case (see Item 3.—
Legal Proceedings
for further information)
|
Eletropaulo is affected by the demand for electricity, which is driven by economic activity, weather patterns and customers' consumption behavior. Operating performance is also driven by the quality of service, efficient management of operating and maintenance costs as well as the ability to control non-technical losses. Finally, annual tariff adjustments and periodic tariff resets by ANEEL impact results from operations.
Brazil Generation
Business Description
— Tietê has a portfolio of 12 hydroelectric power plants with total installed capacity of 2,658 MW in the state of São Paulo. Tietê was privatized in 1999 under a 30-year concession expiring in 2029. AES owns a 24% economic interest in Tietê, our partner, the BNDES, owns 28% and the remaining shares are publicly held or held by government-related entities. AES is the controlling shareholder and manages and consolidates this business.
Tietê sold nearly 100% of its physical guarantee, approximately 11,194 GWh, to Eletropaulo under a long-term PPA, which expired in December 2015. The contract was price-adjusted annually for inflation, and as of December
32
31, 2015, the price was R$218/MWh. After the expiration of contract with Eletropaulo, Tietê's strategy is to contract most of its physical guarantee, as described in
Regulatory Framework
section below, and sell the remaining portion in the spot market. Tietê's strategy is reassessed from time to time according to changes in market conditions, hydrology and other factors. Tietê has been continuously selling its available energy from 2016 forward through medium-term bilateral contracts of three to five years.
As of December 31, 2016, Tietê's contracted portfolio position is 95% and 88% with average prices of R$157/MWh and R$159/MWh (inflation adjusted until December 2016) for 2016 and 2017, respectively. As Brazil is mostly a hydro-based country with energy prices highly tied to the hydrological situation, the deterioration of the hydrology since the beginning of 2014 caused an increase in energy prices going forward. Tietê is closely monitoring and analyzing system supply conditions to support energy commercialization decisions.
Under the concession agreement, Tietê has an obligation to increase its capacity by 15%. Tietê, as well as other concession generators, have not yet met this requirement due to regulatory, environmental, hydrological and fuel constraints. The state of São Paulo does not have a sufficient potential for wind power and only has a small remaining potential for hydro projects. As such, the capacity increases in the state will mostly be derived from thermal gas capacity projects. Due to the highly complex process to obtain an environmental license for coal projects, Tietê decided to fulfill its obligation with gas-fired projects in line with the federal government plans. Petrobras refuses to supply natural gas and to offer capacity in its pipelines and regasification terminals. Therefore, there are no regulations for natural gas swaps in place, and it is unfeasible to bring natural gas to AES Tietê. A legal case has been initiated by the state of São Paulo requiring the investment to be performed. Tietê is in the process of analyzing options to meet the obligation.
Uruguaiana is a 640 MW gas-fired combined cycle power plant located in the town of Uruguaiana in the state of Rio Grande do Sul, commissioned in December 2000. AES manages and has a 46% economic interest in the plant with the remaining interest held by BNDES. The plant's operations were suspended in April 2009 due to the unavailability of gas. AES has evaluated several alternatives to bring gas supply on a competitive basis to Uruguaiana. One of the challenges is the capacity restrictions on the Argentinean pipeline, especially during the winter season when gas demand in Argentina is very high. The plant operated on a short-term basis during February and March 2013, March through May 2014, and February through May 2015 due to the short-term supply of LNG for the facility. The plant did not operate in 2016. Uruguaiana continues to work toward securing gas on a long-term basis.
Market Structure
— Brazil has installed capacity of 150,136 MW, which is 65% hydroelectric, 19% thermal and 16% renewable (biomass and wind). Brazil's national grid is divided into four subsystems. Tietê is in the Southeast and Uruguaiana is in the South subsystems of the national grid.
Regulatory Framework
— In Brazil, the Ministry of Mines and Energy determines the maximum amount of energy that a plant can sell, called physical guarantee, which represents the long-term average expected energy production of the plant. Under current rules, physical guarantee can be sold to distribution companies through long-term regulated auctions or under unregulated bilateral contracts with large consumers or energy trading companies.
The National System Operator ("ONS") is responsible for coordinating and controlling the operation of the national grid. The ONS dispatches generators based on hydrological conditions, reservoir levels, electricity demand and the prices of fuel and thermal generation. Given the importance of hydro generation in the country, the ONS sometimes reduces dispatch of hydro facilities and increases dispatch of thermal facilities to protect reservoir levels in the system.
In Brazil, the system operator controls all hydroelectric generation dispatch and reservoir levels. A mechanism known as the Energy Reallocation Mechanism ("MRE") was created to share hydrological risk across MRE hydro generators. If the hydro plants generate less than the total MRE physical guarantee, the hydro generators may need to purchase energy in the short-term market to fulfill their contract obligations. When total hydro generation is higher than the total MRE physical guarantee, the surplus is proportionally shared among its participants and they are able to make extra revenue selling the excess energy on the spot market. The consequences of unfavorable hydrology are (i) thermal plants more expensive to the system being dispatched, (ii) lower hydropower generation with deficits in the MRE and (iii) high spot prices. ANEEL defines the spot price cap for electricity in the Brazilian market. The spot price caps as defined by ANEEL and average spot prices by calendar year are as follows (R$/MWh):
|
Year
|
2017
|
2016
|
2015
|
2014
|
||||
|
Spot price cap as defined by ANEEL
|
534
|
423
|
388
|
822
|
||||
|
Average spot rate
|
94
|
287
|
689
|
|||||
33
Key Financial Drivers
— As the system is highly dependent on hydroelectric generation, Tietê and Uruguaiana are are affected by the hydrology in the overall sector. They are also affected by the availability of Tietê's plants and reliability of the Uruguaiana facility. The availability of gas is also a driver for continued operations at Uruguaiana. Tietê's financial results are likely to be driven by many factors including, but not limited to:
|
•
|
Hydrology, impacting quantity of energy generated in MRE
|
|
•
|
Demand growth
|
|
•
|
Re-contracting price
|
|
•
|
Asset management and plant availability
|
|
•
|
Cost management
|
|
•
|
Ability to execute on its growth strategy
|
MCAC SBU
Our MCAC SBU has a portfolio of distribution businesses and generation facilities, including renewable energy, in five countries, with a total capacity of
3,239
MW and distribution networks serving
1.4 million
customers as of December 31,
2016
.
Generation
— The following table lists our MCAC SBU generation facilities:
|
Business
|
Location
|
Fuel
|
Gross MW
|
AES Equity Interest
|
Year Acquired or Began Operation
|
Contract Expiration Date
|
Customer(s)
|
|||||||||
|
Andres
|
Dominican Republic
|
Gas
|
319
|
|
90
|
%
|
2003
|
2018
|
Ede Este/Non-Regulated Users/Linea Clave
|
|||||||
|
Itabo
(1)
|
Dominican Republic
|
Coal/Gas
|
295
|
|
45
|
%
|
2000
|
2017
|
Ede Este/Ede Sur/Ede Norte
|
|||||||
|
DPP (Los Mina)
|
Dominican Republic
|
Gas
|
236
|
|
90
|
%
|
1996
|
2022
|
CDEEE
|
|||||||
|
Dominican Republic Subtotal
|
850
|
|
||||||||||||||
|
AES Nejapa
|
El Salvador
|
Landfill Gas
|
6
|
|
100
|
%
|
2011
|
2035
|
CAESS
|
|||||||
|
Moncagua
|
El Salvador
|
Solar
|
3
|
|
100
|
%
|
2015
|
2035
|
EEO
|
|||||||
|
El Salvador Subtotal
|
9
|
|
||||||||||||||
|
Merida III
|
Mexico
|
Gas
|
505
|
|
55
|
%
|
2000
|
2025
|
Comision Federal de Electricidad
|
|||||||
|
Termoelectrica del Golfo (TEG)
|
Mexico
|
Pet Coke
|
275
|
|
99
|
%
|
2007
|
2027
|
CEMEX
|
|||||||
|
Termoelectrica del Penoles (TEP)
|
Mexico
|
Pet Coke
|
275
|
|
99
|
%
|
2007
|
2027
|
Penoles
|
|||||||
|
Mexico Subtotal
|
1,055
|
|
||||||||||||||
|
Bayano
|
Panama
|
Hydro
|
260
|
|
49
|
%
|
1999
|
2030
|
Electra Noreste/Edemet/Edechi/Other
|
|||||||
|
Changuinola
|
Panama
|
Hydro
|
223
|
|
90
|
%
|
2011
|
2030
|
AES Panama
|
|||||||
|
Chiriqui-Esti
|
Panama
|
Hydro
|
120
|
|
49
|
%
|
2003
|
2030
|
Electra Noreste/Edemet/Edechi/Other
|
|||||||
|
Estrella de Mar I
|
Panama
|
Heavy Fuel Oil
|
72
|
|
49
|
%
|
2015
|
2020
|
Electra Noreste/Edemet/Edechi/Other
|
|||||||
|
Chiriqui-Los Valles
|
Panama
|
Hydro
|
54
|
|
49
|
%
|
1999
|
2030
|
Electra Noreste/Edemet/Edechi/Other
|
|||||||
|
Chiriqui-La Estrella
|
Panama
|
Hydro
|
48
|
|
49
|
%
|
1999
|
2030
|
Electra Noreste/Edemet/Edechi/Other
|
|||||||
|
Panama Subtotal
|
777
|
|
||||||||||||||
|
Puerto Rico
|
US-PR
|
Coal
|
524
|
|
100
|
%
|
2002
|
2027
|
Puerto Rico Electric Power Authority
|
|||||||
|
Illumina
|
US-PR
|
Solar
|
24
|
|
100
|
%
|
2012
|
2032
|
Puerto Rico Electric Power Authority
|
|||||||
|
Puerto Rico Subtotal
|
548
|
|
||||||||||||||
|
3,239
|
|
|||||||||||||||
_____________________________
|
(1)
|
Itabo plants: Itabo complex (two coal-fired steam turbines and one gas-fired steam turbine).
|
Under construction
— The following table lists our plants under construction in the MCAC SBU:
|
Business
|
Location
|
Fuel
|
Gross MW
|
AES Equity Interest
|
Expected Date of Commercial Operations
|
|||||||
|
DPP (Los Mina) Conversion
|
Dominican Republic
|
Gas
|
122
|
|
90
|
%
|
1H 2017
|
|||||
|
Dominican ES
|
Dominican Republic
|
Energy Storage
|
20
|
|
90
|
%
|
1H 2017
|
|||||
|
Dominican Republic Subtotal
|
142
|
|
||||||||||
|
Colón
|
Panama
|
Gas
|
380
|
|
50
|
%
|
1H 2018
|
|||||
|
Panama Subtotal
|
380
|
|
||||||||||
|
522
|
|
|||||||||||
34
Utilities
— Our distribution businesses are located in El Salvador and distribute power to 1.4 million people in the country. These businesses consist of four companies, each of which operates in defined service areas. The following table lists our MCAC utilities:
|
Business
|
Location
|
Approximate Number of Customers Served as of 12/31/2016
|
GWh Sold in 2016
|
AES Equity Interest
|
Year Acquired or Began Operation
|
||||||||
|
CAESS
|
El Salvador
|
590,971
|
|
2,232
|
|
75
|
%
|
2000
|
|||||
|
CLESA
|
El Salvador
|
388,341
|
|
894
|
|
80
|
%
|
1998
|
|||||
|
DEUSEM
|
El Salvador
|
78,063
|
|
133
|
|
74
|
%
|
2000
|
|||||
|
EEO
|
El Salvador
|
298,026
|
|
576
|
|
89
|
%
|
2000
|
|||||
|
1,355,401
|
|
3,835
|
|
||||||||||
The following map illustrates the location of our MCAC facilities:
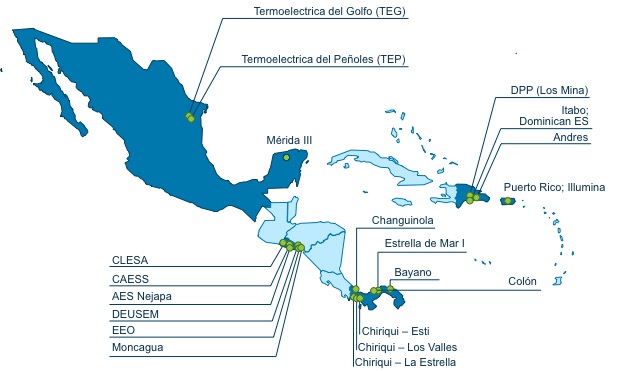
MCAC Businesses
MCAC Utilities
El Salvador
Business Description
— AES is the majority owner of four of the five distribution companies operating in El Salvador. The distribution companies are operated by AES on an integrated basis under a single management team. AES El Salvador's territory covers 77% of the country. AES El Salvador accounted for 4,151 GWh of market energy purchases during 2016, or about 63% market share of the country's total energy purchases.
MCAC Generation
Dominican Republic
Business Description
— AES Dominicana consists of three operating subsidiaries, Itabo, Andres and DPP. AES has 24% of the system capacity of 850 MW and supplies approximately 37% of energy demand through these generation facilities. AES has a strategic partnership with the Estrella and Linda Groups ("Estrella-Linda"), an investor group based in the Dominican Republic. Estrella-Linda is a consortium of two leading Dominican industrial groups: Estrella and Grupo Linda. The two partners manage a diversified business portfolio, including construction services, cement, agribusiness, metalwork, plastics, textiles, paints, transportation, insurance and media.
Itabo is 45% owned by AES, 5% by Estrella-Linda, 49.97% owned by FONPER, a government-owned utility and the remaining 0.03% is owned by employees. Itabo owns and operates two thermal power generation units with a total of 295 MW of installed capacity. Itabo's PPAs with government-owned distribution companies expired in July 2016 and thus two new short term contracts with Ede Sur and Ede Este were signed until new long term contracts take place. The Dominican Corporation of State Electrical Companies is sponsoring a bidding process, released in
35
August 2016, which is expected to be awarded in April 2017 in order to secure supply and competitive pricing for actual and future distribution energy requirements. The existing business strategy is to secure between 80% and 85% of the open position through new PPAs with distribution companies and large users. Price and PPA structure will be subject to the terms of the bidding process.
Andres and DPP are owned 90% by AES and 10% by Estrella-Linda. Andres has a combined cycle gas turbine and generation capacity of 319 MW as well as the only LNG import facility in the country, with 160,000 cubic meters of storage capacity. DPP (Los Mina) has two open cycle natural gas turbines and generation capacity of 236 MW. Both Andres and DPP have in aggregate 555 MW of installed capacity, of which 450 MW is mostly contracted until 2018 with government-owned distribution companies and large customers.
AES Dominicana has a long-term LNG purchase contract through 2023 for 33.6 trillion btu/year with a price linked to NYMEX Henry Hub. The LNG contract terms allow the diversion of the cargoes to various markets in Latin America. These plants capitalize on the competitively-priced LNG contract by selling power where the market is dominated by fuel oil-based generation. Andres has a long-term contract to sell re-gasified LNG to industrial users within the Dominican Republic using compression technology to transport it within the country thereby capturing demand from industrial and commercial customers.
Market Structure - Electricity and Natural Gas
— The Dominican Republic has one main interconnected system with approximately 3,553 MW of installed capacity, composed primarily of thermal generation (80%), hydroelectric power plants (17%) and wind plants (3%).
Regulatory Framework
— The regulatory framework in the Dominican Republic consists of a decentralized industry including generation, transmission and distribution, where generation companies can earn revenue through short- and long-term PPAs, ancillary services and a competitive wholesale generation market. All electric companies (generators, transmission and distributors), are subject to and regulated by the General Electricity Law.
Two main agencies are responsible for monitoring and ensuring compliance with the General Electricity Law, the National Energy Commission and the Superintendence of Electricity. The National Energy Commission is in charge of drafting and coordinating the legal framework and regulatory legislation, proposing and adopting policies and procedures to assure best practices, drafting plans to ensure the proper functioning and development of the energy sector and promoting investment. The Superintendence of Electricity's main responsibilities include monitoring and supervising compliance with legal provisions and rules, monitoring compliance with the technical procedures governing generation, transmission, distribution and commercialization of electricity and supervising electric market behavior in order to avoid monopolistic practices.
The electricity tariff applicable to regulated customers is subject to regulation within the concessions of the distribution companies. Clients with demand above 1 MW are classified as unregulated customers and their tariffs are unregulated.
Fuels and hydrocarbons are regulated by a specific law which establishes prices to end customers and a tax on consumption of fossil fuels. For natural gas there are regulations related to the procedures to be followed to grant licenses and concessions: i) distribution, including loading, transportation and compression plants; ii) the installation and operation of natural gas stations, including consumers and potential modifications of existing facilities; and iii) conversion equipment suppliers for vehicles. The regulation is administered by the Industrial and Commerce Ministry who supervises commercial and industrial activities in the Dominican Republic as well as the fuels and natural gas commercialization to the end users.
Key Financial Drivers
— Financial results are likely to be driven by many factors including, but not limited to:
|
•
|
Changes in spot prices due to fluctuations in commodity prices, (since fuel is a pass-through cost under the PPAs, any variation in oil prices will impact the spot sales for both Andres and Itabo)
|
|
•
|
Contracting levels and the extent of capacity awarded
|
|
•
|
Supply shortages in the near term (next two to three years) may provide opportunities for short term upside, but new generation is expected to come online beginning 2018
|
|
•
|
Additional sales derived from domestic natural gas demand are expected to continue providing income and growth based on the entry of future projects and the fees from the infrastructure service.
|
In addition, the financial weakness of the three state-owned distribution companies due to low collection rates and high levels of non-technical losses has led to delays in payments for the electricity supplied by generators. At times when outstanding receivable balances have accumulated, AES Dominicana has accepted payment through other means, such as government bonds, in order to reduce the balance. There can be no guarantee that alternative collection methodologies will always be an avenue available for payment options.
36
Construction and Development
— DPP is converting its existing plant from open cycle to combined cycle. The project will recycle DPP's heat emissions and increase total power output by approximately 114 MW of gross capacity at an estimated cost of $260 million, fully financed with non-recourse debt. The EPC contract was signed on July 2, 2014, and the additional capacity is expected to become operational in the first half of 2017. Based on the increased capacity, AES Dominicana executed a PPA for 270 MW for a 6.5 year term beginning in 2017.
Panama
Business Description
— AES owns and operates five hydroelectric plants and one thermoelectric power plant, Estrella del Mar I, which commenced operations in March 2015, representing 705 MW and 72 MW of hydro and thermal capacity respectively, for a total of 777 MW equivalent to 23% of the installed capacity in Panama. The majority of hydro sources in Panama are based on run-of-river technology, with the exception of the 260 MW Bayano plant.
A portion of the PPAs with distribution companies will expire in December 2018 reducing the total contracted capacity of the company from 496 MW to 430 MW. Another portion contracted through Estrella del Mar I will expire in June 2020, reducing the total contracted capacity to 350 MW until December 2030.
Market Structure
— Panama's current total installed capacity is 3,350 MW, of which 52% is hydroelectric, 8% wind, 2% solar and the remaining 38% thermal generation from diesel, bunker fuel and coal.
The Panamanian power sector is composed of three distinct operating business units: generation, distribution and transmission, all of which are governed by Electric Law 6 enacted in 1997.
Generators can enter into long-term PPAs with distributors or unregulated consumers. In addition, generators can enter into alternative supply contracts with each other. Outside of the PPA market, generators may buy and sell energy in the short-term market.
The National Dispatch Center implements the economic dispatch of electricity in the wholesale market. The National Dispatch Center's objectives are to minimize the total cost of generation and maintain the reliability and security of the electric power system, taking into account the price of water, which determines the dispatch of hydro plants with reservoirs. Short-term power prices are determined on an hourly basis by the last dispatched generating unit.
In Panama, dry hydrological conditions remained until June 2016, due to the presence of the El Niño phenomenon, affecting the generation output from hydroelectric facilities compared to the prior year. AES Panama had to purchase energy on the spot market to fulfill its contract obligations as its generation output was below contract levels. The drop in the commodities prices helped to reduce the replacement cost and the financial impact of spot purchases compared to the prior year. Despite the hydrology conditions, spot prices were down to $60/MWh from $91/MWh in 2015, limiting the amount recognized through the 2014-2016 Government Compensation Agreement to $1 million out of the possible $30 million for 2016. On March 31, 2014, the government of Panama agreed to reduce the financial impact of spot electricity purchases and transmission constraints equivalent to a 70 MW reduction in contracted capacity for the period 2014-2016 by compensating AES Panama for spot purchases above the contracted price of $82.45/MWh, up to $40 million in 2014, $30 million in 2015 and $30 million in 2016.
Regulatory Framework
— The SNE has the responsibilities of planning, supervising and controlling policies of the energy sector within Panama. With these responsibilities, the SNE proposes laws and regulations to the executive agencies that promote the procurement of electrical energy, hydrocarbons and alternative energy for the country.
The regulator of public services, known as the ASEP, is an autonomous agency of the government. ASEP is responsible for the control and oversight of public services including electricity and the transmission and distribution of natural gas utilities and the companies that provide such services.
Generators can only contract up to their firm capacity. Physical generation of energy is determined by the National Dispatch Center regardless of contractual arrangements.
Key Financial Drivers
— Financial results are likely to be driven by many factors including, but not limited to:
|
•
|
In the event of low hydrology, high commodity prices will increase the business exposure and the cost of replacement power to fulfill our contractual commitments, partially mitigated by additional generation from Estrella del Mar I.
|
|
•
|
Fluctuations in commodity prices, mainly oil prices, affect the thermal generation cost impacting the spot prices and the opportunity cost of water.
|
37
|
•
|
Constraints imposed by the capacity of the transmission line connecting the west side of the country with the load center are expected to continue until the end of 2017 keeping surplus power trapped, particularly during the wet season.
|
|
•
|
Country demand as GDP growth is expected to remain strong over the short and medium term.
|
Given that most of AES' portfolio is run-of-river, hydrological conditions have an important influence on its profitability. Variations in actual hydrology can result in excess or a short energy balance relative to our contract obligations. During the low inflow period of January through May, generation tends to be lower and AES Panama may purchase energy in the short-term market to cover contractual obligations. During the remainder of the year (June to December), generation tends to be higher and energy generated in excess of contract volumes is sold to the short-term market. In addition to hydrological conditions, commodity prices affect short-term electricity prices.
Construction and Development
— Continuing with the strategy to reduce reliance on hydrology started with the acquisition of the power barge, Estrella del Mar I, in August 2015 AES executed a partnership agreement with Deeplight Corporation, a minority partner, with the purpose to construct, operate and maintain a natural gas power generation plant and a liquefied natural gas terminal, in order to purchase and sell energy and capacity as well as commercialize natural gas and other ancillary activities related to natural gas. As of December 31, 2016, amounts capitalized include $254 million recorded in Construction in Progress and the project is scheduled to initiate operations in the first half of 2018.
Mexico
Business Description
— AES has 1,055 MW of installed capacity in Mexico, including the 550 MW Termoeléctrica del Golfo ("TEG") and Termoeléctrica Peñoles ("TEP") facilities and Merida III ("Merida"), a 505 MW generation facility.
The TEG and TEP pet coke-fired plants, located in San Luis Potosi, supply power to their offtakers under long-term PPAs expiring in 2027 with a 90% availability guarantee. TEG and TEP secure their fuel under a long-term contract.
Merida is a CCGT, located in Merida, on Mexico's Yucatan Peninsula. Merida sells power to the Federal Commission of Electricity ("CFE") under a capacity and energy based long-term PPA through 2025. Additionally, the plant purchases natural gas and diesel fuel under a long-term contract, the cost of which is then passed through to CFE under the terms of the PPA.
In line with AES' strategy of building strategic partnerships, on January 18, 2016 the 50/50 joint venture partnership agreement with Grupo BAL was fully executed. The joint venture will co-invest in power and related infrastructure projects in Mexico.
Market Structure
— Mexico has a single national electricity grid, the National Power System, covering nearly all of Mexico's territory. Mexico has an installed capacity totaling 68 GW with a generation mix of 72% thermal, 18% hydroelectric and 10% other. Electricity consumption is split between the following end users: industrial of 58%, residential of 26% and commercial and service of 16%.
Regulatory Framework
—
Following the constitutional changes approved in December 2013, during 2014 and 2015 the Mexican government issued a package of secondary regulations, including the Electricity Law, and operational dispositions, with the objective to start the implementation of a new regulatory framework with the following characteristics:
|
•
|
The energy market liberalization in January 2016 through the implementation of: wholesale electricity market (day ahead and real time market), ancillary services, capacity, Clean Energy Certificates, and Financial Transmission Rights market.
|
|
•
|
CFE's, former state-owned electric monopoly, vertical and horizontal disintegration into different segments of the value chain: generation, transmission, distribution and commercialization.
|
|
•
|
CENACE as new ISO is responsible for managing the wholesale electricity market, transmission and distribution infrastructure, planning the network developments, guaranteeing open access to network infrastructure, executing competitive mechanisms to cover regulated demand, and setting transmission charges.
|
|
•
|
Implementation of annual mid and long term auctions to secure supply for the regulated demand, establishing a PPA with CFE as the Basic Supplier.
|
According to the new regulatory framework, new assets developed under the new framework or assets transferred to the new regime and in operation after the approval of the Electricity Law (August 2014) are eligible to participate in the new markets. Additionally, projects developed and operated under the Electric Public Service Law
38
(self-supply framework) like TEG/TEP, could choose to participate. Until the new framework is further analyzed, AES will continue operating under the same conditions. Merida III and TEG/TEP will continue providing power under long-term contracts and selling any excess or surplus energy produced to CFE.
Key Financial Drivers
— Financial results are likely to be driven by many factors including, but not limited to:
|
•
|
Operational performance (as the companies are fully contracted and better performance provides additional financial benefits including performance incentives and/or excess energy sales (in the case of TEG/TEP).
|
|
•
|
The energy prices of TEG/TEP for the sales in excess over its long-term contracts are driven by the average production cost of CFE which is highly dependent on natural gas and oil.
|
|
•
|
If the average production cost of CFE is higher than the cost of generating with pet coke, our businesses in Mexico will benefit provided that they are able to sell energy in excess of their PPAs.
|
Puerto Rico
Business Description
— AES Puerto Rico owns and operates a coal-fired cogeneration plant and a solar plant of 524 MW and 24 MW, respectively, representing approximately 9% of the installed capacity in Puerto Rico. Both plants have long-term PPAs expiring in 2027 and 2032, respectively, with PREPA, a state-owned entity that supplies virtually all of the electric power consumed in Puerto Rico and generates, transmits and distributes electricity to 1.5 million customers. See Item 7.—
Key Trends and Uncertainties—Macroeconomic and Political—Puerto Rico
for further discussion of the long-term PPA with PREPA.
El Salvador
Business Description
— AES El Salvador also owns AES Nejapa, a 6 MW power plant generating electricity with methane gas from a landfill, fully contracted with CAESS. During 2015, AES El Salvador began operations of a AES Moncagua, a 2.5 MW solar facility located in the East of the country, which is fully contracted with EEO.
The sector is governed by the General Electricity Law and the general and specific orders are issued by Superintendencia General de Electricidad y Telecomunicacions ("SIGET"). SIGET, jointly with the distribution companies in El Salvador, completed the tariff reset process in December 2012 and defined the tariff calculation to be applicable for the five year period 2013-2017.
Europe SBU
Generation
— Our Europe SBU has generation facilities in five countries. Operating installed capacity of our Europe SBU totaled
6,619
MW. The following table lists our Europe SBU generation facilities:
|
Business
|
Location
|
Fuel
|
Gross MW
|
AES Equity Interest
|
Year Acquired or Began Operation
|
Contract Expiration Date
|
Customer(s)
|
|||||||||
|
Maritza
|
Bulgaria
|
Coal
|
690
|
|
100
|
%
|
2011
|
2026
|
Natsionalna Elektricheska
|
|||||||
|
St. Nikola
|
Bulgaria
|
Wind
|
156
|
|
89
|
%
|
2010
|
2025
|
Natsionalna Elektricheska
|
|||||||
|
Bulgaria Subtotal
|
846
|
|
||||||||||||||
|
Amman East
|
Jordan
|
Gas
|
381
|
|
37
|
%
|
2009
|
2033-2034
|
National Electric Power Company
|
|||||||
|
IPP4
|
Jordan
|
Heavy Fuel Oil/Gas
|
250
|
|
36
|
%
|
2014
|
2039
|
National Electric Power Company
|
|||||||
|
Jordan Subtotal
|
631
|
|
||||||||||||||
|
Ust-Kamenogorsk CHP
|
Kazakhstan
|
Coal
|
1,398
|
|
100
|
%
|
1997
|
Short-term
|
Various
|
|||||||
|
Shulbinsk HPP
(1)
|
Kazakhstan
|
Hydro
|
702
|
|
—
|
%
|
1997
|
2020
|
Titanium Magnesium Kombiant
|
|||||||
|
Sogrinsk CHP
|
Kazakhstan
|
Coal
|
345
|
|
100
|
%
|
1997
|
Short-term
|
Various
|
|||||||
|
Ust-Kamenogorsk HPP
(1)
|
Kazakhstan
|
Hydro
|
331
|
|
—
|
%
|
1997
|
2020
|
Titanium Magnesium Kombiant
|
|||||||
|
Kazakhstan Subtotal
|
2,776
|
|
||||||||||||||
|
Elsta
(2)
|
Netherlands
|
Gas
|
630
|
|
50
|
%
|
1998
|
2018
|
Dow Benelux/Delta/Nutsbedrijven/Essent Energy
|
|||||||
|
Netherlands ES
|
Netherlands
|
Energy Storage
|
10
|
|
100
|
%
|
2015
|
|
|
|||||||
|
Netherlands Subtotal
|
640
|
|
||||||||||||||
|
Ballylumford
|
United Kingdom
|
Gas
|
1,015
|
|
100
|
%
|
2010
|
2023
|
Power NI/Single Electricity Market (SEM)
|
|||||||
|
Kilroot
(3)
|
United Kingdom
|
Coal/Oil
|
701
|
|
99
|
%
|
1992
|
|
SEM
|
|||||||
|
Kilroot ES
|
United Kingdom
|
Energy Storage
|
10
|
|
100
|
%
|
2015
|
|
|
|||||||
|
United Kingdom Subtotal
|
1,726
|
|
||||||||||||||
|
6,619
|
|
|||||||||||||||
_____________________________
|
(1)
|
AES operates these facilities under concession agreements until 2017.
|
|
(2)
|
Unconsolidated entity, the results of operations of which are reflected in Equity in Earnings of Affiliates.
|
39
|
(3)
|
Includes Kilroot Open Cycle Gas Turbine ("OCGT").
|
The following map illustrates the location of our Europe facilities:
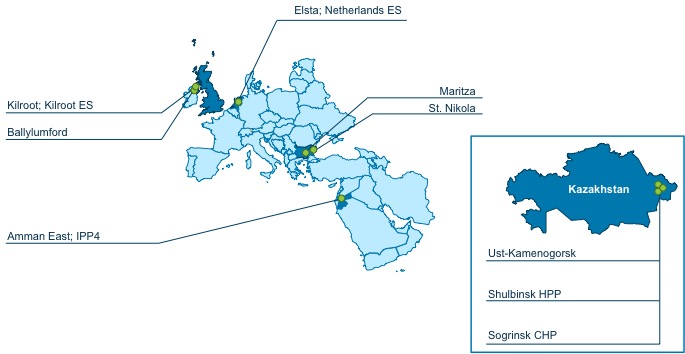
Europe Businesses
Bulgaria
Business Description
— Our Maritza plant is a 690 MW lignite fuel plant that was commissioned in June 2011. Maritza is fully compliant with the European Union Industrial Emission Directive, which became effective in January 2016. Maritza's entire power output is contracted with NEK under a 15-year PPA, capacity and energy based, with a fuel pass-though, expiring in 2026. The lignite and limestone are supplied under 15-year fuel supply contracts.
AES also owns an 89% economic interest in the St. Nikola wind farm with 156 MW of installed capacity. St. Nikola was commissioned in March 2010. Its entire power output is contracted with NEK under a 15-year PPA expiring in March 2025.
Market Structure
— The maximum market capacity in 2016
was approximately 13 GW. Thermal generation, which is mostly coal-fired, and nuclear power plants account for 61% of the installed capacity.
Regulatory Framework
— The electricity sector in Bulgaria operates under the Energy Act of 2004 which allows the sale of electricity to take place freely at negotiated prices, at regulated prices between parties or on the organized market. In 2016 the government of Bulgaria made advances toward market liberalization and has engaged with the World Bank to develop a model for a fully liberalized electricity market in Bulgaria. The final report with recommendations from the World Bank was finalized in December 2016. The Independent Bulgarian Energy Exchange (IBEX) started commercial operation of the power exchange in January 2016 with the introduction of Day Ahead market platform.
In September 2016, IBEX expanded its trading platform for bilateral forward contracts. The next step of the development of IBEX is the introduction of intra-day trading, which is expected in mid-2017.
Our investments in Bulgaria rely on long-term PPAs with NEK, the state-owned electricity public supplier and energy trading company. NEK had been facing some liquidity issues and had been delayed in making payments under the PPAs with Maritza and St. Nikola. In August 2015, the ninth amendment of Maritza's PPA was executed, under which Maritza and NEK agreed to reduce the capacity payment to Maritza by 14% through the PPA term without impacting the energy price component. In exchange, NEK paid Maritza its overdue receivables. The amendment became effective in April 2016 upon full payment of the overdue receivables by NEK. Maritza has experienced timely collection of outstanding receivables from NEK since May 2016.
The Directorate-General for Competition of the European Commission (“DG Comp”) continues to review NEK’s respective PPAs with Maritza and an unrelated generator pursuant to the European Commission’s state aid rules. Although no formal investigation has been launched by DG Comp, Maritza has met with the DG Comp case team and representatives of Bulgaria to discuss the agency’s review. Maritza expects that the parties will engage in
40
further discussions on the issues surrounding the review. At this time, we cannot predict the outcome of such discussions, nor can we predict how DG Comp might resolve its review if the anticipated discussions fail to result in an agreement concerning the review. Maritza believes that its PPA is legal and in compliance with all applicable laws, and it will take all actions necessary to protect its interests, whether through negotiated agreement or otherwise. However, there can be no assurances that this matter will be resolved favorably; if it is not, there could be a material adverse impact on Maritza’s and the Company’s respective financial statements.
In 2015, a number of measures were introduced to the regulation of the energy sector that significantly improved the liquidity of NEK. As a result, NEK is forecast to end the year 2016 with a $7 million net profit, more than a $102 million improvement over year 2015 and more than a $316 million improvement over year 2014
.
However, the financial situation of NEK remains subject to political conditions and regulatory changes in Bulgaria.
Key Financial Drivers
—
Both businesses, Maritza and St. Nikola, operate under PPA contracts. For the duration of the PPA, the financial results are primarily driven by, but not limited to:
|
•
|
the availability of the operating units
|
|
•
|
the level of wind resource for St. Nikola
|
|
•
|
NEK's ability to meet the terms of the PPA contract
|
United Kingdom
Business Description
— AES' generation businesses in the United Kingdom are located in Northern Ireland and operate in the Irish SEM (1,726 MW). The Northern Ireland generation facilities consist of two plants within the Greater Belfast region. Our Kilroot plant is a 701 MW coal-fired plant with an additional 10 MW of energy storage facility and our Ballylumford plant is a 1,015 MW gas-fired plant. These plants provide approximately 62% of the Northern Ireland installed capacity and 16% of the combined installed capacity for the island of Ireland.
Kilroot is a merchant plant that bids into the SEM. the plant earns margin when scheduled in merit, out of merit, for capacity payments, and for ancillary services. Out of merit dispatch, through which costs are recovered, occurs when there are system constraints related to wind generation, voltage and transmission.
Ballylumford is partially contracted for 600 MW under a PPA with PPB that expires in 2023 with the remaining capacity bid into the SEM market. 310 MW of this merchant capacity has a supplemental Local Reserve Services Agreement ("LRSA") with the system operator. Ballylumford earns margin from availability payments received under the PPA, capacity payments offered through the SEM and revenues from the LRSA. Additionally, Ballylumford receives margin from out of merit dispatch through which the costs of operation are recovered as well as ancillary services.
Market Structure
— The majority of the generation capacity in the SEM is represented by gas-fired power plants, which results in market sensitivity to gas prices. Wind generation capacity represents approximately 25% of the total generation capacity. The governments of Northern Ireland and the Republic of Ireland plan further increases in renewable energy sources. Market availability and liquidity of hedging products are weak, reflecting the limited size and immaturity of the market, the predominance of vertical integration and lack of forward pricing. There are essentially three products (baseload, mid-merit and peaking) which are traded between the generators and suppliers.
Regulatory Framework
— The SEM is an energy market established in 2007 and is based on a gross mandatory pool within which all generators with a capacity higher than 10 MW must trade the physical delivery of power. Generators are centrally dispatched based on merit order and physical constraints of the system. The SEM structure is under review by the regulatory authorities with a new structure due to be introduced in the second quarter of 2018.
In addition, there is a capacity payment mechanism to ensure that sufficient generating capacity is offered to the market. The capacity payment is derived from a regulated Euro-based capacity payment pool, established a year ahead by the regulatory authority. Capacity payments are based on the declared availability of a unit and have a degree of volatility to reflect seasonal influences, demand and the actual out-turn of generation declared available over each trading period.
Environmental Regulation
— In 2011, the European Commission adopted the Industrial Emission Directive ("IED") that establishes the Emission Limit Values ("ELV") for SO
2
, NO
x
and dust emissions effective January 1, 2016. Both Ballylumford and Kilroot are required to comply with the IED. The Ballylumford C Station is compliant without the need for investment. Both Ballylumford B Station and Kilroot required investment to be in compliance.
41
The IED provides for two options that may be implemented by the European Union member states other than compliance with the new ELV's the Transitional National Plan or Limited Life Time Derogation.
Kilroot has opted into the Transitional National Plan which allows the plant to operate between 2016-2020, being exempt from compliance with ELVs, but observing a ceiling set for maximum annual emissions that is based on the last 10 years average emissions and operating hours. Kilroot has invested approximately $10 million in Umbrella Selective Non Catalytic Reduction technology, which reduces the plant's NO
x
emissions enabling the plant to increase its capacity factor within the ceiling of NO
x
emissions and earn energy margin. The Transitional National Plan also established a UK wide NO
x
trading scheme which Kilroot avails of as required. Further technical modifications are being evaluated which could make the plant fully compliant with the IED from 2020.
Without investment, the Ballylumford B station of 540 MW did not meet the standards of the IED. In 2014, AES secured a LRSA with the Transmission System Operator ("TSO") to refurbish two of the three units to be compliant with ELVs under IED, providing at least 250 MW of capacity from 2016 to 2018 with an option to extend to 2020 by the TSO. The project was executed in 2015 with an achieved combined gross output of 310 MW.
Key Financial Drivers
— For our businesses in the SEM market, the financial results will be driven by, but not limited to, the following:
|
•
|
Regulatory changes to the market structure and payment mechanism
|
|
•
|
Availability of the operating units
|
|
•
|
Commodity prices (gas, coal and CO
2
) and sufficient market liquidity to hedge prices in the short-term
|
|
•
|
Electricity demand in the SEM (including impact of wind generation)
|
Kazakhstan
Business Description
— Our businesses account for approximately 6% of the total annual generation in Kazakhstan. Of the total capacity of 2,776 MW, 1,033 MW is hydroelectric and operates under a concession agreement until the beginning of October 2017 and 1,743 MW is coal-fired capacity which is owned outright. The thermal plants are designed to produce heat with electricity as a co- or by-product.
The Kazakhstan businesses act as merchant plants for electricity sales by entering into bilateral contracts directly with consumers for periods of generally no more than one year. There are limited opportunities for the plants to be in contracted status, as there is no central offtaker, and the few businesses that could take a whole plant's generation tend to have in-house generation capacity.
The hydroelectric plants are run-of-river and rely on river flow and precipitation, particularly snow. Due to the presence of a large multi-year storage dam upstream and a season minimum river flow rate agreement with Russia downstream, the plants are protected against significant downside risk to their volume in years with low precipitation. AES does not control water flow which impacts our generation.
Ust Kamenogorsk CHP provides heat to the city of Ust Kamenogorsk through the city heat network company (Ust Kamenogorsk Heat Nets). Ust Kamenogorsk CHP is their only source of supply.
Market Structure
— The Kazakhstan electricity market totals approximately 21,307 MW, of which 17,504 MW is available. The bulk of the generating capacity in Kazakhstan is thermal with coal as the main fuel. As coal is abundantly available in Kazakhstan, most plants are designed to burn local coal. The geographical remoteness of Kazakhstan, in combination with its abundant resources, results in coal prices that are not reflective of world coal prices, current delivered cost is less than $12 per metric ton. In addition, the government closely monitors coal prices, due to their impact on the price of socially necessary heating and on electricity tariffs.
Regulatory Framework
— All Kazakhstan generating companies sell electricity at or below their respective tariff-cap level. These tariff-cap levels have been fixed by the Kazakhstan government for the period 2009-2018 for each of the fifteen groups of generators. These groups were determined by the Ministry of Energy, based on a number of factors including plant type and fuel used.
In July 2012, Kazakhstan enacted an amendment to its Electricity Law requiring electricity producers to reinvest all profits generated during the years 2013-2015 as part of annual investment obligation agreements, thereby limiting the businesses ability to distribute dividends. These investment obligation agreements had to be equal to the sum of the planned annual depreciation and profit. Selection of investment projects was at the discretion of electricity producers, but the Ministry of Energy had the right to reject submitted proposals. An electricity producer without an investment obligation agreement executed by the Ministry of Energy was not allowed to charge tariffs exceeding its incremental cost of production, excluding depreciation.
42
In November 2015, Kazakhstan enacted amendments to its Electricity Law to eliminate the obligation for power plants to sign annual investment obligation agreements for 2016-2018, thereby allowing the businesses to distribute dividends. In addition, the amendment stated that a centrally organized capacity market will be established by 2019 and that the Kazakhstan government plans to prolong price cap regulation by fixing new caps on energy and capacity tariffs for each group of power plants.
Kazakhstan government has approved a renewable energy law which set feed-in tariffs for renewable energy and set a renewable energy target of 3% by 2020 and 10% by 2030. This renewable energy law imposes an obligation on all non-renewable power plants to purchase renewable energy at the renewable energy tariff and resell it to customers at their own, lower price cap level.
Heat production in Kazakhstan is also regulated as a natural monopoly. The heat tariffs are set on a cost-plus basis by making an application to the Committee of Natural Monopoly Regulation and Competition Protection, the regulator. Currently, tariffs are only for multi-year periods, but with some annual adjustments for fuel cost.
Key Financial Drivers
— The financial results for assets in Kazakhstan are driven by many factors including, but not limited to:
|
•
|
Availability of the operating units;
|
|
•
|
Regulated electricity tariff-cap levels and heat tariff levels
|
|
•
|
Weather conditions,
|
|
•
|
Regulatory changes to the market structure and payment mechanism
|
|
•
|
Cost of coal and Kazakhstan currency exchange rate fluctuation.
|
Jordan
Business Description
— In Jordan, AES has a 37% controlling interest in Amman East, a 381 MW oil/gas-fired plant fully contracted with the national utility under a 25-year PPA and a 36% controlling interest in the IPP4 plant in Jordan, a 250 MW oil/gas-fired peaker plant which commenced operations in July 2014, fully contracted with the national utility under a 25-year PPA. As we have controlling interest in these businesses, we consolidate the results in our operations.
Asia SBU
Generation
— Our Asia SBU has generation facilities in three countries. Operating installed capacity totals
2,300
MW. The following table lists our Asia SBU generation facilities:
|
Business
|
Location
|
Fuel
|
Gross MW
|
AES Equity Interest
|
Year Acquired or Began Operation
|
Contract Expiration Date
|
Customer(s)
|
|||||||||
|
OPGC
(1)
|
India
|
Coal
|
420
|
|
49
|
%
|
1998
|
2026
|
GRID Corporation Ltd.
|
|||||||
|
India Subtotal
|
420
|
|
||||||||||||||
|
Masinloc
|
Philippines
|
Coal
|
630
|
|
51
|
%
|
2008
|
Mid and long-term
|
Various
|
|||||||
|
Masinloc ES
|
Philippines
|
Energy Storage
|
10
|
|
51
|
%
|
2016
|
|||||||||
|
Philippines Subtotal
|
640
|
|
||||||||||||||
|
Mong Duong 2
|
Vietnam
|
Coal
|
1,240
|
|
51
|
%
|
2015
|
2040
|
EVN
|
|||||||
|
Vietnam Subtotal
|
1,240
|
|
||||||||||||||
|
2,300
|
|
|||||||||||||||
_____________________________
|
(1)
|
Unconsolidated entity for which the results of operations are reflected in Equity in Earnings of Affiliates.
|
Under construction
— The following table lists our plants under construction in the Asia SBU:
|
Business
|
Location
|
Fuel
|
Gross MW
|
AES Equity Interest
|
Expected Date of Commercial Operations
|
|||||||
|
OPGC II
|
India
|
Coal
|
1,320
|
|
49
|
%
|
2H 2018
|
|||||
|
India Subtotal
|
1,320
|
|
||||||||||
|
Masinloc 2
|
Philippines
|
Coal
|
335
|
|
51
|
%
|
1H 2019
|
|||||
|
Philippines Subtotal
|
335
|
|
||||||||||
|
1,655
|
|
|||||||||||
43
The following map illustrates the location of our Asia facilities:
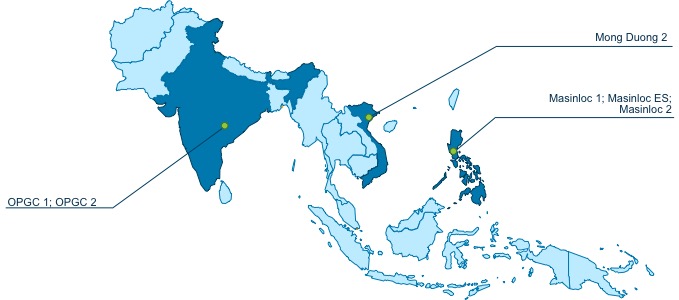
Asia Businesses
India
Business Description
— OPGC is a 420 MW coal-fired generation facility located in the state of Odisha. OPGC has a 30-year PPA with GRIDCO Limited, a state utility, expiring in 2026. The PPA is composed of a capacity payment based on fixed parameters and a variable component, including a pass-through of actual fuel costs. OPGC is an unconsolidated entity and results are reported as
Net Equity in Earnings of Affiliates
in our Consolidated Statements of Operations.
Environmental Regulation
— The Ministry of Environment, Forest and Climate Change in India has recently amended the Environment (Protection) Rules with stricter emission limits for new and existing thermal power plants via their notification issued in December 2015. All existing plants installed before December 31, 2003 are required to meet revised emission limits within two years and any new thermal power plants that will be operational from January 1, 2017 are required to operate with the revised emission limits. An FGD system needs to be installed in the existing units of OPGC for complying with SO
2
emissions requirements. The business has evaluated the options and the cost implications for the operating plant including design modification and schedule implications for the expansion project. The larger impact of these amendments and requirements of substantial investments to meet the revised environmental guidelines across the power sector in India, borne by the public and private power generation companies, is still under review. We believe the cost of complying with the new environmental regulations will be a pass-through in the GRIDCO tariff for both existing and expansion units. Ministry of Power has issued a revised Tariff Policy in January 2016 to bring more regulatory certainty, attract private investment, ensure distribution efficiency and promote renewable energy.
Construction and Development
— As noted above, AES has one coal-fired project under development with a total capacity of 1,320 MW which is an expansion of our existing OPGC business. The project started construction in April 2014 and is currently expected to begin operations in the second half of 2018. As of December 31,
2016
, total capitalized costs at the project level were $598 million (the Company's share is $293 million as part of our investment in subsidiary). In addition, AES has capitalized $18 million in construction management costs which are not attributable to the partner. Currently, 50% of the expansion capacity is contracted with the state offtaker, GRIDCO, for a period of 25 years, with a normative after-tax rate of return of 15.5% with an opportunity to capture additional 0.5% tied to timely completion of the project. The rest of the 50% of the generation capacity is proposed to be offered to GRIDCO under a fresh regulated PPA due to restrictions on power sale under new guidelines.
In August 2014, the Supreme Court of India invalidated the allocation of captive coal blocks. The government of India has subsequently enacted new laws allowing coal block allocation to companies with limited levels of private ownership, based on which the coal blocks have been allocated to a subsidiary of OPGC, Odisha Coal and Power Ltd., which is an OPGC joint venture with another company wholly-owned by the government of Odisha. This new company meets the lower private ownership stipulations for allocation of mines.
44
Key Financial Drivers
— Financial results are likely to be driven by many factors including, but not limited to:
|
•
|
Operating performance of the facility
|
|
•
|
Regulatory and environmental policy changes
|
Philippines
Business Description
— The Masinloc power project in the Philippines is a 630 MW gross coal-fired plant located in Zambales, Philippines and is interconnected to the Luzon Grid, and is owned 51% by AES. More than 95% of Masinloc's current peak capacity is contracted through medium to long-term bilateral contracts primarily with Meralco, the largest distribution company in the Philippines, several electric cooperatives and industrial customers.
In January 2013, Masinloc entered into a new PSA with its main customer, Meralco, as the previous PSA expired in December 2012. The PSA is for seven years and included an additional three-year extension option, which the parties agreed to exercise in March 2016. Payments are primarily capacity-based. The PSA is primarily priced in U.S. dollars, aligning the revenues with the majority of variable and fixed costs (fuel, debt, insurance) and minimizing currency exchange risks. Masinloc's remaining contracts on the existing units expire between 2017 and 2026.
Market Structure
— The Philippine power market is divided into three grids representing the country's three major island groups — Luzon, Visayas and Mindanao. Luzon, which includes Manila and is the country's largest island, has limited interconnection with Visayas and represents 85% of the total demand of both regions. Luzon and Visayas together have an installed capacity of 17,294 MW.
There is diversity in the mix of the Luzon — Visayas generation. For Luzon, coal accounts for 49% of generation, followed by natural gas at 32%, and the remaining 19% is comprised by oil, geothermal, and renewable resources (i.e. hydro, solar, and wind, with the latter two having priority dispatch with feed-in tariff). For Visayas, geothermal is the top energy source and accounts for 47% of generation followed by coal at 39%, and the remaining 14% comprised by oil, geothermal, and renewable resources.
The primary customers for electricity are private distribution utilities, electric cooperatives, and large contestable (industrial and commercial) customers. Over 90% of the system's total energy requirement is currently being sold/purchased through medium (three to five years) to long (six to ten years) term bilateral contracts. The remaining energy is sold through the Wholesale Electricity Spot Market ("WESM"), which is the real-time, bid-based and hourly market for energy where the sellers and the buyers adjust their differences between their production/demand and their contractual commitments.
Regulatory Framework
— The Philippines has divided its power sector into generation, transmission, distribution and supply under the Electric Power Industry Reform Act of 2001. This Act primarily aims to increase private sector participation in the power sector and to privatize the Philippine government's generation and transmission assets. Generation and supply are open and competitive sectors, while transmission and distribution are regulated sectors. Sale of power is conducted primarily through medium or long-term bilateral contracts between generation companies and distribution utilities specifying the volume, price and conditions for the sale of energy and capacity, which are approved by the ERC. Power is traded in the WESM which operates under a gross pool, central dispatch and net settlement protocols. Parties to bilateral contracts settle their transactions outside of the WESM and distribution companies or electricity cooperatives buy their imbalance (i.e., power requirements not covered by bilateral contracts) from the WESM. Distribution utilities and electric cooperatives are allowed to pass on to their end-users the bilateral contract rates, including WESM purchases, approved by the ERC.
Other Regulatory Considerations
— Pursuant to Electric Power Industry Reform Act of 2001, Retail Competition & Open Access ("RCOA") commenced on June 26, 2013, under which retail electricity suppliers, who are duly licensed by the ERC, may supply directly to contestable customers (end-users with an average demand of at least 1 MW), with distribution companies or electricity cooperatives providing non-discriminatory wire services. In order to ensure implementation of RCOA and stimulate transition of contestable customers, ERC issued rules implementing mandatory contestability. Under the said rules, all contestable customers are mandated to enter into power supply contracts with retail electricity suppliers by February 2017 instead of purchasing power from their local distribution utility.
Masinloc has obtained a retail electricity supplier license from the ERC and currently markets power to contestable customers. Unlike Masinloc’s contracts with distribution utilities, its contract with contestable customers do not require ERC approval to be implemented.
Environmental Regulation
— To promote renewable energy, the Philippine government enacted the Renewable Energy Act of 2008 which provides incentives for the development, utilization and commercialization of
45
renewable energy resources such as solar, wind, small hydroelectric and biomass energies. In addition, the government also adopted a feed-in tariff scheme which was detailed under ERC Res No.16 s. 2010, where an eligible producer of renewable energy is entitled to a guaranteed payment of a fixed rate feed-in tariff for each kilowatt-hour of energy it supplies to the grid. The feed-in tariff to be approved shall be specific for each emerging renewable energy technology and shall be extended on a first-to-build basis as there is an established cap per technology on eligibility under the feed-in tariff scheme.
Other Environmental Regulation
—
Over the past year, the government of the Philippines has sought to reduce its environmental impact, including the country’s carbon footprint. As such, the Department of Environment and Natural Resources is promoting stricter environmental compliance, particularly on the effluent discharge standards. The new effluent standards issued in May 2016 have restricted discharge temperature limit compared to previous standards. It is yet uncertain if the new standards will be applicable to the projects under construction which received environmental clearance before the new standards were issued.
Construction and Development
— AES started construction on a 335 MW gross Masinloc expansion project in March 2016. The total capitalized cost at December 31, 2016 is $133 million. An engineering, procurement and construction contract was entered into with POSCO Engineering and Construction of Korea and their wholly owned Philippine affiliate company, Ventanas Philippine Construction Incorporated, in December 2015, with full notice to proceed issued on March 2016. The project is expected to be commercially operating in 2019. Progress is advancing as planned and the project is expected to be completed on schedule and within budget. The additional capacity is targeted for sale to distribution utilities, electric cooperatives, and industrial and commercial customers in the Luzon and Visayas grids. Approximately 50% of this additional capacity has already been contracted with an expectation to have additional capacity contracted by the date of commercial operations.
Key Financial Drivers
— Financial results are likely to be driven by many factors including, but not limited to:
|
•
|
Operating performance of the facility
|
|
•
|
Demand from contracted customers
|
|
•
|
Whole sale electricity price in the market
|
Vietnam
Business Description
— The Mong Duong II power project is a 1,242 MW gross coal-fired plant located in Quang Ninh Province of Vietnam and was constructed under a BOT contract (the project will be transferred to Vietnamese government after 25 years). AES-VCM Mong Duong Power Company Limited ("the BOT Company") is a limited liability joint venture owned by affiliates of AES (51%), Posco Energy Corporation (30%) and China Investment Corporation (19%). This is the first and largest coal-fired BOT project using pulverized coal fired boiler technology in Vietnam. The BOT Company has entered a PPA with EVN, the national utility, and a Coal Supply Agreement with Vinacomin, a state owned entity, both with a 25 year term starting from Commercial Operation Date.
Since April 22, 2015, both units of the power facility have been in commercial operations, six months earlier than the committed schedule with the Vietnamese government. The BOT Company makes available the dependable capacity and delivers electrical energy to EVN and, in return, EVN makes payments to the BOT Company.
Market Structure
— The Vietnam power market is divided into three regions (North, Central and South), with total installed capacity of approximately 41GW, an 8% increase from 2015 (38GW). The total demand in 2016 was 159.5 billion kWh with the highest demand of 76.7 billion kWh in the South and 66.5 billion kWh in the North.
The fuel mix in Vietnam is comprised of hydropower 35% (priority dispatch with low tariff), coal 36%, gas 19%, diesel and small hydro generation 4%, oil 2% (dispatched during emergencies or during peak demand), thermo-gas 1% and the remaining 3% imported from China and Lao. The government has a plan to increase thermal power capacity, primarily with coal, to reduce the dependence on hydroelectricity. According to the Master Plan VII revised in March 2016, the total targeted installed capacity for 2020 is approximately 60,000 MW, in which coal-fired power will account for 43%, hydropower and pumped storage hydropower 30%, gas-fired thermo-power 15%, renewable energy 10%, and imported power 2%.
EVN owns 57% of installed generation capacity followed by Petro Vietnam 11%, Vinacomin 4%, BOT projects 11% and others 17%. EVN is a state-owned company that is solely in charge of buying and selling electricity all over Vietnam. The government is planning to decrease EVN's ownership and increase private sector participation in the power market.
46
Regulatory Framework
— The electricity sector is overseen by several key government entities, including the National Assembly, the Prime Minister, the Ministry of Industry and Trade and the Electricity Regulatory Agency of Vietnam, which is under the supervision of the Ministry of Industry and Trade. These entities are responsible for the issuance of laws, guidance, and implementing regulations for the sector. The Ministry of Industry and Trade, in particular, is responsible for formulating a program to restructure the power industry, develop the electricity market and promulgating electricity market regulations. The fuel supply is owned by the government through Vinacomin and Petro Vietnam. The government plans to equitize EVN-owned generation companies and separate generation, System and Market Provider and distribution into three different independent operations in order to establish the competitive power market.
Other Regulatory Considerations
— According to Decision 63/2013/QD-TTG dated August 2013, the roadmap of the power market of Vietnam consists of three phases. The first phase established a competitive electricity market and was finished at the end of 2014. The second phase: (i) period of 2015-2016 for establishment of a pilot competitive wholesale electricity market; and (ii) period of 2017-2021 for implementation of a competitive wholesale electricity market. The third phase: (i) period of 2022-2023 for establishment of a pilot competitive retail electricity market; and (ii) from 2024 onward for implementation of competitive retail electricity market. EVN, a long standing monopoly in the whole chain of generation, transmission and distribution, is being restructured to allow spin-off of several subsidiaries into either independent state-owned enterprises or joint stock companies. The BOT power plants will not participate in the power market; alternatively the single buyer will bid the tariff on the power pool on their behalf.
Environmental Regulation
— Mong Duong II BOT Power Plant complies strictly with environmental requirements involving local regulations and IFC Environmental, Health and Safety Guidelines for thermal power plants.
Key Financial Drivers
— Financial results are likely to be driven by many factors including, but not limited to the operating performance of the facility.
47
Financial Data by Country
See the table with our consolidated operations for each of the three years ended December 31,
2016
,
2015
and
2014
, and property, plant and equipment as of December 31,
2016
and
2015
, by country, in Note
16
—
Segment and Geographic Information
included in Item 8.—
Financial Statements and Supplementary Data
of this Form 10-K for further information.
Environmental and Land-Use Regulations
The Company faces certain risks and uncertainties related to numerous environmental laws and regulations, including existing and potential GHG legislation or regulations, and actual or potential laws and regulations pertaining to water discharges, waste management (including disposal of coal combustion residuals), and certain air emissions, such as SO
2
, NO
X
, PM, mercury and other hazardous air pollutants. Such risks and uncertainties could result in increased capital expenditures or other compliance costs which could have a material adverse effect on certain of our U.S. or international subsidiaries, and our consolidated results of operations. For further information about these risks, see Item 1A.—
Risk Factors
—
Our businesses are subject to stringent environmental laws and regulations; Our businesses are subject to enforcement initiatives from environmental regulatory agencies;
and
Regulators, politicians, non-governmental organizations and other private parties have expressed concern about greenhouse gas, or GHG, emissions and the potential risks associated with climate change and are taking actions which could have a material adverse impact on our consolidated results of operations, financial condition and cash flows
in this Form 10-K. For a discussion of the laws and regulations of individual countries within each SBU where our subsidiaries operate, see discussion within Item 1.—
Business
of this Form 10-K under the applicable SBUs.
Many of the countries in which the Company does business also have laws and regulations relating to the siting, construction, permitting, ownership, operation, modification, repair and decommissioning of, and power sales from, electric power generation or distribution assets. In addition, international projects funded by the International Finance Corporation, the private sector lending arm of the World Bank, or many other international lenders are subject to World Bank environmental standards or similar standards, which tend to be more stringent than local country standards. The Company often has used advanced generation technologies in order to minimize environmental impacts, such as CFB boilers and advanced gas turbines, and environmental control devices such as flue gas desulphurization for SO
2
emissions and selective catalytic reduction for NO
x
emissions.
Environmental laws and regulations affecting electric power generation and distribution facilities are complex, change frequently and have become more stringent over time. The Company has incurred and will continue to incur capital costs and other expenditures to comply with these environmental laws and regulations. See Item 7
.—Management's Discussion and Analysis of Financial Condition and Results of Operations—Environmental Capital Expenditures
in this Form 10-K for more detail. The Company and its subsidiaries may be required to make significant capital or other expenditures to comply with these regulations. There can be no assurance that the businesses operated by the subsidiaries of the Company will be able to recover any of these compliance costs from their counterparties or customers such that the Company's consolidated results of operations, financial condition and cash flows would not be materially affected.
Various licenses, permits and approvals are required for our operations. Failure to comply with permits or approvals, or with environmental laws, can result in fines, penalties, capital expenditures, interruptions or changes to our operations. Certain subsidiaries of the Company are subject to litigation or regulatory action relating to environmental permits or approvals. See Item 3.
—Legal Proceedings
in this Form 10-K for more detail with respect to environmental litigation and regulatory action.
United States Environmental and Land-Use Legislation and Regulations
In the U.S. the CAA and various state laws and regulations regulate emissions of air pollutants, including SO
2
, NO
X
, PM, GHGs, mercury and other hazardous air pollutants. Certain applicable rules are discussed in further detail below.
CSAPR —
CSAPR addresses the "good neighbor" provision of the CAA, which prohibits sources within each state from emitting any air pollutant in an amount which will contribute significantly to any other state’s nonattainment, or interference with maintenance of, any NAAQS. The CSAPR requires significant reductions in SO
2
and NO
X
emissions from power plants in many states in which subsidiaries of the Company operate. Once fully implemented, the rule requires SO
2
emission reductions of 73%, and NO
X
reductions of 54%, from 2005 levels. The CSAPR is implemented, in part, through a market-based program under which compliance may be achievable through the acquisition and use of emissions allowances created by the EPA. The CSAPR contemplates limited interstate and unlimited intra-state trading of emissions allowances by covered sources. Initially, the EPA issued
48
emissions allowances to affected power plants based on state emissions budgets established by the EPA under the CSAPR. The Company is required to comply with the CSAPR in several states, including Ohio, Indiana, Oklahoma and Maryland. The Company complies with CSAPR through operation of existing controls and purchases of allowances on the open market, as needed. While the Company's 2015 CSAPR compliance costs were immaterial, the future availability of and cost to purchase allowances to meet the emission reduction requirements is uncertain at this time.
The EPA issued an interim final rule establishing the following deadlines for implementation of the CSAPR:
|
•
|
January 1, 2015: Phase 1 (2015 and 2016) began for annual trading programs. Existing units must have begun monitoring and reporting SO
2
and NO
x
emissions.
|
|
•
|
May 1, 2015: Phase 1 began for ozone-season NO
x
trading program. Existing units must have begun monitoring and reporting NO
x
emissions.
|
|
•
|
December 1, 2015 (and each Dec. 1 thereafter): Date by which sources must demonstrate compliance with ozone-season NO
x
trading program (i.e., allowance transfer deadline).
|
|
•
|
March 1, 2016 (and each March 1 thereafter): Date by which sources must demonstrate compliance with annual trading programs (i.e., allowance transfer deadline).
|
|
•
|
January 1, 2017: Phase 2 (2017 and beyond) begins for annual trading programs. Assurance provisions in effect.
|
|
•
|
May 1, 2017: Phase 2 (2017 and beyond) begins for ozone-season NO
x
trading program. Assurance provisions in effect.
|
On October 26, 2016, the EPA published a final rule to update the CSAPR to address the 2008 ozone NAAQS ("CSAPR Update Rule"). The CSAPR Update Rule finds that NO
x
ozone season emissions in 22 states (including Indiana, Maryland, Ohio and Oklahoma) affect the ability of downwind states to attain and maintain the 2008 ozone NAAQS, and, accordingly, the EPA issued federal implementation plans that both updated existing CSAPR NO
x
ozone season emission budgets for electric generating units within these states and implemented these budgets through modifications to the CSAPR NO
x
ozone season allowance trading program. Implementation will start in the 2017 ozone season (May-September 2017). Affected facilities will receive fewer ozone season NO
x
allowances in 2017 and later, resulting in the need to purchase additional allowances. At this time, we cannot predict what the impact will be with respect to these new standards and requirements, but it could be material if certain facilities will need to purchase additional allowances based on reduced allocations.
MATS —
Pursuant to Section 112 of the CAA, the EPA published a final rule in 2012 called the MATS establishing National Emissions Standards for Hazardous Air Pollutants from coal and oil-fired electric utility steam generating units. The rule required all affected power plants to comply with the applicable MATS standards by April 2015, with the possibility of obtaining a one year extension, if needed, to complete the installation of necessary controls. All of the Company's U.S. coal-fired plants operated by the Company's subsidiaries are currently in compliance with MATS.
There currently are challenges to the EPA’s determination that it was appropriate and necessary to regulate hazardous air pollutant emissions from electric generating units - the basis for the MATS rule - proceeding in the United States Court of Appeals for the District of Columbia Circuit (the “D.C. Circuit”) but, in the meantime, the MATS rule remains in effect. We currently cannot predict the outcome of this litigation, or its impact, if any, on our MATS compliance or ultimate costs.
New Source Review ("NSR") —
The NSR requirements under the CAA impose certain requirements on major emission sources, such as electric generating stations, if changes are made to the sources that result in a significant increase in air emissions. Certain projects, including power plant modifications, are excluded from these NSR requirements, if they meet the RMRR exclusion of the CAA. There is ongoing uncertainty, and significant litigation, regarding which projects fall within the RMRR exclusion. The EPA has pursued a coordinated compliance and enforcement strategy to address NSR compliance issues at the nation's coal-fired power plants. The strategy has included both the filing of suits against power plant owners and the issuance of NOVs to a number of power plant owners alleging NSR violations. See Item 3.—
Legal Proceedings
in this Form 10-K for more detail with respect to environmental litigation and regulatory action, including a NOV issued by the EPA against IPL concerning NSR and prevention of significant deterioration issues under the CAA.
In 2000, DP&L's Stuart Station received a NOV from the EPA alleging that certain activities undertaken in the past are outside the scope of the RMRR exclusion. Hutchings Station also received such a NOV in 2009. Additionally, generation units partially owned by DP&L but operated by other utilities have received such NOVs
49
relating to equipment repairs or replacements alleged to be outside the RMRR exclusion. The NOVs issued to DP&L-operated plants have not been pursued through litigation by the EPA.
If NSR requirements were imposed on any of the power plants owned by the Company's subsidiaries, the results could have a material adverse impact on the Company's business, financial condition and results of operations. In connection with the imposition of any such NSR requirements on IPL, the utility would seek recovery of any operating or capital expenditures related to air pollution control technology to reduce regulated air emissions, but not fines or penalties; however, there can be no assurances that they would be successful in that regard.
Regional Haze Rule —
The EPA's "Regional Haze Rule" is intended to reduce haze and protect visibility in designated federal areas, and sets guidelines for determining BART at affected plants and how to demonstrate "reasonable progress" towards eliminating man-made haze by 2064. The Regional Haze Rule required states to consider five factors when establishing BART for sources, including the availability of emission controls, the cost of the controls and the effect of reducing emission on visibility in Class I areas (including wilderness areas, national parks and similar areas). The statute requires compliance within five years after the EPA approves the relevant SIP or issues a federal implementation plan, although individual states may impose more stringent compliance schedules.
EPA previously determined that states included in the CSAPR would not be required to make source-specific BART determinations for BART-affected electric generating units, reasoning that the emissions reductions required by the CSAPR were "better than BART." Concurrently, EPA also finalized a limited disapproval of certain states' plans — including Ohio's — that previously relied on the EPA's Clean Air Interstate Rule to improve visibility and substituted a Federal Implementation Plan that relies on the CSAPR. Environmental groups have challenged EPA's determination than the CSAPR is "better than BART." The challenge currently is proceeding in the D.C. Circuit.
The second phase of the Regional Haze Rule begins in 2019 and states must submit regional haze plans for this second implementation period in 2021, to continue to demonstrate reasonable progress towards reducing visibility impairment in Class I areas. States may need to require additional emissions controls for visibility impairing pollutants, including on BART sources, during the second implementation period. We currently cannot predict the impact of this second implementation period, if any, on any of our Company’s U.S. subsidiaries.
National Ambient Air Quality Standards ("NAAQS") —
Under the CAA, the EPA sets NAAQS for six principal pollutants considered harmful to public health and the environment, including ozone, particulate matter, NO
x
and SO
2
, which result from coal combustion. Areas meeting the NAAQS are designated "attainment areas" while those that do not meet the NAAQS are considered "nonattainment areas." Each state must develop a plan to bring nonattainment areas into compliance with the NAAQS, which may include imposing operating limits on individual plants. The EPA is required to review NAAQS at five-year intervals.
Based on the current and potential future ambient standards, certain of the states in which the Company's subsidiaries operate have determined or will be required to determine whether certain areas within such states meet the NAAQS. Some of these states may be required to modify their State Implementation Plans to detail how the states will regain their attainment status. As part of this process, it is possible that the applicable state environmental regulatory agency or the EPA may require reductions of emissions from our generating stations to reach attainment status for ozone, fine particulate matter, NO
x
or SO
2
. The compliance costs of the Company's U.S. subsidiaries could be material.
On September 30, 2015, IDEM published its final rule establishing reduced SO
2
limits for IPL facilities in accordance with a new one-hour standard of 75 parts per billion, for the areas in which IPL's Harding Street, Petersburg, and Eagle Valley Generating Stations operate. The compliance date for these requirements was January 1, 2017. No impact is expected for Eagle Valley or Harding Street Generating Stations because these facilities ceased coal combustion prior to the compliance date. It is expected that improvements to the existing FGDs at Petersburg will be required in order to comply. IPL estimates costs for compliance at Petersburg at approximately $29 million for measures that enhance the performance and integrity of the FGDs systems. On May 31, 2016, IPL filed its SO
2
NAAQS compliance plans with the IURC. IPL is seeking approval for a CPCN for these measures at its Petersburg Generating Station. IPL expects to recover through its environmental rate adjustment mechanism any operating or capital expenditures related to compliance with these requirements. Recovery of these costs is sought through an Indiana statute that allows for 80% recovery of qualifying costs through a rate adjustment mechanism, with the remainder recorded as a regulatory asset to be considered for recovery in the next base rate case proceeding. However, there can be no assurances that IPL will be successful in that regard. In light of the uncertainties at this time, we cannot predict the impact of these permit requirements on our consolidated results of operations, cash flows, or financial condition, but it may be material.
Greenhouse Gas Emissions —
In January 2011, the EPA began regulating GHG emissions from certain
50
stationary sources under the so-called "Tailoring Rule." The regulations are being implemented pursuant to two CAA programs: the Title V Operating Permit program and the program requiring a permit if undergoing certain new construction or major modifications, known as the PSD. Obligations relating to Title V permits include record-keeping and monitoring requirements. Sources subject to PSD can be required to implement BACT. In June 2014, the U.S. Supreme Court ruled that the EPA had exceeded its statutory authority in issuing the Tailoring Rule by regulating under the PSD program sources based solely on their GHG emissions. However, the U.S. Supreme Court also held that the EPA could impose GHG BACT requirements for sources already required to implement PSD for certain other pollutants. Therefore, if future modifications to our U.S.-based businesses' sources require PSD review for other pollutants, it may trigger GHG BACT requirements. The EPA has issued guidance on what BACT entails for the control of GHG and has now proposed NSPS for modified and reconstructed units (see below) that will serve as a floor (maximum emission rate) for future BACT requirements. Individual states are now required to determine what controls are required for facilities within their jurisdiction on a case-by-case basis. The ultimate impact of the BACT requirements applicable to us on our operations cannot be determined at this time as our U.S.-based businesses will not be required to implement BACT until one of them constructs a new major source or makes a major modification of an existing major source. However, the cost of compliance could be material.
On October 23, 2015, the EPA's rule establishing NSPS for new electric generating units became effective. The NSPS establish CO
2
emissions standards of 1400 lbs/MWh for newly constructed coal-fueled electric generating plants, which reflects the partial capture and storage of CO
2
emissions from the plants. The NSPS for large, newly constructed NGCC facilities is 1,000 lbs/MWh. These standards apply to any electric generating unit with construction commencing after January 8, 2014. The EPA also promulgated NSPS applicable to modified and reconstructed electric generating units, which will serve as a floor for future BACT determinations for such units. The NSPS applicable to modified and reconstructed coal-fired units will be 1,800 lbs CO
2
/MWh for sources with heat input greater than 2,000 MMBtu per hour. For smaller sources, below 2,000 MMBtu per hour, the standard is 2,000 lbs CO
2
/MWh. The NSPS could have an impact on the Company's plans to construct and/or modify or reconstruct electric generating units in some locations.
On December 22, 2015, the EPA's final CO
2
emission rules for existing power plants under Clean Air Act Section 111(d) (called the CPP) also became effective. The CPP provides for interim emissions performance rates that must be achieved beginning in 2022 and final emissions performance rates that must be achieved starting in 2030. Under the CPP, states are required to meet state-wide emission rate standards or equivalent mass-based standards, with the goal being a 32% reduction in total U.S. power sector emissions from 2005 levels by 2030. The CPP requires states to submit, by 2016, implementation plans to meet the standards or a request for an extension to 2018. If a state fails to develop and submit an approvable implementation plan, the EPA will finalize a federal plan for that state. The full impact of the CPP will depend on the following:
|
•
|
whether and how the states in which the Company's U.S. businesses operate respond to the CPP;
|
|
•
|
whether the states adopt an emissions trading regime and, if so, which trading regime;
|
|
•
|
how other states respond to the CPP, which will affect the size and robustness of any emissions trading market; and
|
|
•
|
how other companies may respond in the face of increased carbon costs.
|
Several states and industry groups challenged the NSPS for CO
2
in the D.C. Circuit. Oral argument on the challenges is scheduled for April 2017. We cannot predict at this time the likely outcome of these challenges but, if the NSPS is vacated, it also likely would result in the invalidation of the CPP, as EPA’s authority to issue the CPP under Section 111(d) of the Clean Air Act is triggered only be EPA’s promulgation of NSPS under Section 111(b) of the Clean Air Act.
In addition, several states and industry groups filed petitions in the D.C. Circuit challenging the CPP and requested a stay of the rule while the challenge was considered. The D.C. Circuit denied the stay and granted requests to consider the challenges on an expedited basis. As a result, the D.C. Circuit may issue an opinion on these challenges prior to the end of 2016. On February 9, 2016, the U.S. Supreme Court issued orders staying implementation of the CPP pending resolution of challenges to the rule. The challenges have been fully briefed and argued before the D.C. Circuit and could be decided by the court at any time. Challenges to the D.C. Circuit’s decision could then be filed with the Supreme Court.
The Company will likely not know the answers to the above questions regarding the CPP until 2018 or later. As the first compliance period will not end until 2025, and because we cannot predict whether the CPP will survive the legal challenges, it is too soon to determine the CPP's potential impact on our business, operations or financial condition, but any such impact could be material.
51
Cooling Water Intake —
The Company's facilities are subject to a variety of rules governing water use and discharge. In particular, the Company's U.S. facilities are subject to the CWA Section 316(b) rule issued by the EPA that seeks to protect fish and other aquatic organisms by requiring existing steam electric generating facilities to utilize the BTA for cooling water intake structures. On August 15, 2014, the EPA published its final standards to protect fish and other aquatic organisms drawn into cooling water systems at large power plants and other industrial facilities. These standards require subject facilities that utilize at least 25% of the withdrawn water exclusively for cooling purposes and have a design intake flow of greater than two million gallons per day to choose among seven BTA options to reduce fish impingement. In addition, facilities that withdraw at least 125 million gallons per day for cooling purposes must conduct studies to assist permitting authorities to determine whether and what site-specific controls, if any, would be required to reduce entrainment of aquatic organisms. This decision-making process would include public input as part of permit renewal or permit modification. It is possible this process could result in the need to install closed-cycle cooling systems (closed-cycle cooling towers), or other technology. Finally, the standards require that new units added to an existing facility to increase generation capacity are required to reduce both impingement and entrainment that achieves one of two alternatives under national BTA standards for entrainment. It is not yet possible to predict the total impacts of this recent final rule at this time, including any challenges to such final rule and the outcome of any such challenges. However, if additional capital expenditures are necessary, they could be material.
AES Southland's current plan to comply with the California State Water Resources Board's ("SWRCB") regulations will see all once-through-cooled ("OTC") generating units retired from service by December 31, 2020. New air-cooled combined cycle gas turbine generators and battery energy storage systems will be constructed at the AES Alamitos and AES Huntington Beach generating stations and the OTC generating units at the AES Redondo Beach generating station will be retired. The execution of the Implementation Plan for compliance with the SWRCB's OTC policy is entirely dependent on the Company's ability to execute on long-term power purchase agreements to support project financing of the replacement generating units at AES Alamitos and AES Huntington Beach. The SWRCB is currently reviewing the Implementation Plan and latest update information to evaluate the impact on electrical system reliability, which could result in the extension of OTC compliance dates for specific units. The Company’s California subsidiaries have signed 20-year term power purchase agreements with Southern California Edison for the new generating capacity which have been approved by the California Public Utilities Commission. Approvals and permits to construct the new generating units are pending approval by the California Energy Commission and South Coast Air Quality Management District. Construction is scheduled to begin in June 2017 at AES Huntington Beach and July 2017 at AES Alamitos.
Power plants will be required to comply with the more stringent of state or federal requirements. At present, the California state requirements are more stringent and have earlier compliance dates than the federal EPA requirements, and are therefore applicable to the Company's California assets. Challenges to the federal EPA's rule have been consolidated in the U.S. Court of Appeals for the Second Circuit, although implementation of the rule has not been stayed while the challenges proceed. The Company anticipates once-through cooling and CWA Section 316(b) compliance regulations and costs would have a material impact on our consolidated financial condition or results of operations.
Water Discharges —
Certain of the Company's U.S.-based businesses are subject to National Pollutant Discharge Elimination System permits that regulate specific industrial waste water and storm water discharges to the waters of the U.S. under the CWA. On June 29, 2015, the EPA and the U.S. Army Corps of Engineers published a final rule defining federal jurisdiction over waters of the U.S.. This rule, which became effective on August 28, 2015, may expand or otherwise change the number and types of waters or features subject to federal permitting. On October 9, 2015, the U.S. Court of Appeals for the Sixth Circuit issued an order to temporarily stay the "Waters of the U.S." rule nationwide while that court determines whether it has authority to hear the challenges to the rule. The order was in response to challenges brought by 18 states and followed an August 2015 court decision in the U.S. District Court of North Dakota to stay the rule in 13 other states. We cannot predict the duration of the nationwide or partial stay of the rule or the outcome of this litigation; however, if the rule ultimately survives the legal challenges, it could have a material impact on our business, financial condition or results of operations.
On January 7, 2013, the Ohio Environmental Protection Agency issued an NPDES permit for J.M. Stuart Station. The primary issues involve the temperature and thermal discharges from the Station including the point at which the water quality standards are applied, i.e., whether water quality standards apply at the point where the Station discharge canal discharges into the Ohio River, or whether, as the EPA alleges, the discharge canal is an extension of Little Three Mile Creek and the water quality standards apply at the point where water enters the discharge canal. In addition, there are a number of other water-related permit requirements established with respect to metals and other materials contained in the discharges from the Station. The NPDES permit establishes interim standards related to the thermal discharge for 54 months that are comparable to current levels of discharge by
52
Stuart Station. Permanent standards for both temperature and overall thermal discharges are established as of 55 months after the permit is effective, except that an additional transitional period of approximately 22 months is allowed if compliance with the permanent standards is to be achieved through a plan of construction and various milestones on the construction schedule are met. It is believed that compliance with the permit as written will require capital expenses that will be material to DP&L. The cost of compliance and the timing of such costs is uncertain and may vary considerably depending on a compliance plan that would need to be developed, the type of capital projects that may be necessary, and the uncertainties that may arise in the likely event that permits and approvals from other governmental entities would likely be required to construct and operate any such capital project. DP&L has appealed various aspects of the final permit to the Environmental Review Appeals Commission, although a hearing date is not currently scheduled. The compliance schedule in the final permit has been modified to accommodate the timing of the hearing. The outcome of such appeal is uncertain.
On August 28, 2012, the IDEM issued NPDES permits to the IPL Petersburg, Harding Street and Eagle Valley generating stations, which became effective in October 2012. NPDES permits regulate specific industrial wastewater and storm water discharges to the waters of Indiana under Sections 402 and 405 of the U.S. Clean Water Act. These permits set new water quality-based effluent discharge limits for the Harding Street and Petersburg facilities, as well as monitoring and other requirements designed to protect aquatic life, with full compliance required by October 2015. In April 2013, IPL received an extension to the compliance deadline through September 29, 2017 for IPL's Harding Street and Petersburg facilities through agreed orders with IDEM. IPL conducted studies to determine the operational changes and control equipment necessary to comply with the new limitations. In October 2014, IPL filed its wastewater compliance plans for its power plants with the IURC. On July 29, 2015, the IURC approved a Certificate of Public Convenience and Necessity to convert Unit 7 at the Harding Street Station from coal-fired to natural gas-fired (about 410 MW net capacity) at a cost of up to $71 million (the IURC later approved IPL’s updated cost estimate for the Harding Street Station refuels including $64 million for Unit 7), and also to install and operate wastewater treatment technologies at Harding Street Station and Petersburg Generating Station at a cost of up to $326 million. The IURC order also granted IPL authority for timely rate recovery for 80% of the costs of these projects and authority to defer the remaining 20% as a regulatory asset to be considered for recovery through IPL’s next basic rate case proceeding. However, there can be no assurances that IPL will be successful in that regard.
On November 3, 2015, the EPA published its final ELG rule to reduce toxic pollutants discharged into waters of the U.S. by power plants. These effluent limitations for existing and new sources include dry handling of fly ash, closed-loop or dry handling of bottom ash and more stringent effluent limitations for flue gas de-sulfurization wastewater. Compliance time lines for existing sources will be established by the applicable permitting authorities and will be set as soon as determined possible, but no sooner than November 1, 2018 and no later than December 31, 2023. IPL plans to install a dry bottom ash handling system in response to the CCR rule described below in advance of the ELG compliance date. As such, the impact of the ELG rule is not expected to be material. While we are still evaluating the impacts of the final rule for DP&L, we anticipate that implementation of the requirements will have a material adverse effect on our results of operations, financial condition and cash flows.
Selenium Rule
—
NPDES permits may be updated to include Selenium water quality based effluent limits based on a site specific evaluation process which includes determining if there is a reasonable potential to exceed the revised final Selenium water quality standards for the specific receiving water body utilizing actual and/or project discharge information for the generating facilities. As a result, it is not yet possible to predict the total impacts of this final rule at this time, including any challenges to such final rule and the outcome of any such challenges. However, if additional capital expenditures are necessary, they could be material. IPL would seek recovery of these capital expenditures; however, there is no guarantee it would be successful in this regard.
Waste Management —
In the course of operations, the Company's facilities generate solid and liquid waste materials requiring eventual disposal or processing. With the exception of coal combustion residuals ("CCR"), the wastes are not usually physically disposed of on our property, but are shipped off site for final disposal, treatment or recycling. CCR, which consists of bottom ash, fly ash and air pollution control wastes, is disposed of at some of our coal-fired power generation plant sites using engineered, permitted landfills. Waste materials generated at our electric power and distribution facilities may include asbestos, CCR, oil, scrap metal, rubbish, small quantities of industrial hazardous wastes such as spent solvents, tree and land clearing wastes and PCB contaminated liquids and solids. The Company endeavors to ensure that all of its solid and liquid wastes are disposed of in accordance with applicable national, regional, state and local regulations. On October 19, 2015, an EPA rule regulating CCR under the Resource Conservation and Recovery Act as nonhazardous solid waste became effective. The rule established nationally applicable minimum criteria for the disposal of CCR in new and currently operating landfills and surface impoundments, and may impose closure and/or corrective action requirements for existing CCR landfills and impoundments under certain specified conditions. The primary enforcement mechanisms under this
53
regulation would be actions commenced by the states and private lawsuits. On December 16, 2016, President Obama signed into law the Water Infrastructure Improvements for the Nation Act (WIN Act), which includes provisions to implement the CCR rule through a state permitting program, or if the state chooses not to participate, a possible federal permit program.
The existing ash ponds at IPL's Petersburg Station do not meet certain structural stability requirements set forth in the CCR rule. As such, IPL would be required to cease use of the ash ponds by April 17, 2017. However, IDEM has granted IPL a variance extending that deadline to April 11, 2018. In order to handle the bottom ash material that would otherwise be sluiced to the ash ponds, IPL plans to install a dry bottom ash handling system at an estimated cost of approximately $47 million. On May 31, 2016, IPL filed its CCR compliance plans with the IURC. IPL is seeking approval for a CPCN to install the bottom ash dewatering system at its Petersburg generating station. IPL expects to recover through its environmental rate adjustment mechanism any operating or capital expenditures related to the installation of this system. Recovery of these costs is sought through an Indiana statute that allows for 80% recovery of qualifying costs through a rate adjustment mechanism with the remainder recorded as a regulatory asset to be considered for recovery in the next base rate case proceeding. However, there can be no assurances that IPL will be successful in that regard. In light of the uncertainties at this time, we cannot predict the impact of these requirements on our consolidated results of operations, cash flows, or financial condition, but it may be material.
CERCLA —
The Comprehensive Environmental Response, Compensation and Liability Act of 1980 (aka "Superfund") may be the source of claims against certain of the Company's U.S. subsidiaries from time to time. There is ongoing litigation at a site known as the South Dayton Landfill where a group of companies already recognized as potentially responsible parties have sued DP&L and other unrelated entities seeking a contribution toward the costs of assessment and remediation. DP&L is actively opposing such claims. In 2003, DP&L received notice that the EPA considers DP&L to be a potentially responsible party at the Tremont City landfill Superfund site. EPA has taken no further action with respect to DP&L since 2003 regarding the Tremont City landfill. The Company is unable to determine whether there will be any liability, or the size of any liability that may ultimately be assessed against DP&L at these two sites, but any such liability could be material to DP&L.
Unit Retirement and Replacement Generation —
In the second quarter of 2013, IPL retired in place five oil-fired peaking units with an average life of approximately 61 years (approximately 168 MW net capacity in total), as such units were not equipped with the advanced environmental control technologies needed to comply with existing and expected environmental regulations. Although these units represented approximately 5% of IPL's generating capacity, they were seldom dispatched by Midcontinent Independent System Operator, Inc. in recent years due to their relatively higher production cost and in some instances repairs were needed. In addition to these recently retired units, IPL has several other generating units that it expects to retire or refuel by 2017. These units are primarily coal-fired and represent 472 MW of net capacity in total. To replace this generation, in April 2013, IPL filed a petition and case-in-chief with the IURC in April 2013 seeking a CPCN to build a 550 to 725 MW CCGT at its Eagle Valley Station site in Indiana and to refuel Harding Street Station Units 5 and 6 from coal to natural gas (106 MW net capacity each). In May 2014, the IURC issued an order on the CPCN authorizing the refueling project and granting approval to build a 644 to 685 MW CCGT at a total budget of $649 million. The current estimated cost of these projects is $632 million. IPL was granted authority to accrue post in-service allowance for debt and equity funds used during construction and to defer the recognition of depreciation expense of the CCGT and refueling project until such time that IPL is allowed to collect both a return and depreciation expense on the CCGT and refueling project. The CCGT is expected to be placed into service in the first half of 2018, and the refueling project was completed in December 2015. The costs to build and operate the CCGT and for the refueling project, other than fuel costs, will not be recoverable by IPL through rates until the conclusion of a base rate case proceeding with the IURC after the assets have been placed in service. For a discussion of the retirement of AES Southland's OTC generating units due to U.S. cooling water intake regulations, please see
— Cooling Water Intake,
above.
International Environmental Regulations
For a discussion of the material environmental regulations applicable to the Company's businesses located outside of the U.S., see
Environmental Regulation
under the discussion of the various countries in which the Company's subsidiaries operate in
Business—Our Organization and Segments,
above.
Customers
We sell to a wide variety of customers. No individual customer accounted for 10% or more of our
2016
total revenue. In our generation business, we own and/or operate power plants to generate and sell power to wholesale customers such as utilities and other intermediaries. Our utilities sell to end-user customers in the residential, commercial, industrial and governmental sectors in a defined service area.
54
Executive Officers
The following individuals are our executive officers:
Michael Chilton
, 57 years old, was named Senior Vice President, Construction & Engineering, for the Company in December 2014. Prior to his current role, Mr. Chilton was the Managing Director of Construction from 2009 to 2011 and Vice President, Operations Support from 2012 to 2014. Before joining AES, Mr. Chilton held various leadership roles in Kennametal and GE, including: Regional Director for Kennametal Asia (2006-2009), with GE as President & CEO of Xinhua Controls Solutions based in China (2005-2006), Managing Director for Contractual Services Asia based in Singapore (2001-2005), Quality Leader for Energy Services based in Atlanta (1999-2001), Master Black Belt for Energy Sales based in Tokyo (1998-1999) and President of Joint Conversion company in Nuclear Energy based in Wilmington (1995-1998). Mr. Chilton has a BS in Chemical Engineering from University of Missouri, a MBA from University of Arkansas and a JD from Kaplan University.
Bernerd Da Santos
,
54 years old, was appointed Chief Operating Officer and Senior Vice President in December 2014. Previously, Mr. Da Santos held several positions at the Company including Chief Financial Officer, Global Finance Operations (2012-2014), Chief Financial Officer of Global Utilities (2011-2012), Chief Financial Officer of Latin America and Africa (2009-2011), Chief Financial Officer of Latin America (2007-2009), Managing Director of Finance for Latin America (2005-2007) and VP and Controller of EDC (Venezuela). Prior to joining AES in 2000, Mr. Da Santos held a number of financial leadership positions at EDC. Mr. Da Santos is a member of the Board of Directors of Companhia Brasiliana de Energia, AES Tietê, AES Eletropaulo, AES Gener, Companhia de Alumbrado Electrico de San Salvador ("CAESS"), Empresa Electrica de Oriente ("EEO"), Companhia de Alumbrado Electrico de Santa Ana, and Indianapolis Power & Light. Mr. Da Santos holds a Bachelor's degree with Cum Laude distinction in Business Administration and Public Administration from Universidad José Maria Vargas, a Bachelor's degree with Cum Laude distinction in Business Management and Finance, and an MBA with Cum Laude distinction from Universidad José Maria Vargas.
Andrés R. Gluski
,
59 years old, has been President, CEO and a member of our Board of Directors since September 2011 and is Chairman of the Strategy and Investment Committee of the Board. Prior to assuming his current position, Mr. Gluski served as EVP and Chief Operating Officer ("COO") of the Company since March 2007. Prior to becoming the COO of AES, Mr. Gluski was EVP and the Regional President of Latin America from 2006 to 2007. Mr. Gluski was Senior Vice President ("SVP") for the Caribbean and Central America from 2003 to 2006, CEO of La Electricidad de Caracas ("EDC") from 2002 to 2003 and CEO of AES Gener (Chile) in 2001. Prior to joining AES in 2000, Mr. Gluski was EVP and Chief Financial Officer ("CFO") of EDC, EVP of Banco de Venezuela (Grupo Santander), Vice President ("VP") for Santander Investment, and EVP and CFO of CANTV (subsidiary of GTE). Mr. Gluski has also worked with the International Monetary Fund in the Treasury and Latin American Departments and served as Director General of the Ministry of Finance of Venezuela. From 2013-2016, Mr. Gluski served on President Obama's Export Council. Mr. Gluski currently serves on, the US-Brazil CEO Forum and the US-India CEO Forum. He is a member of the Board of Waste Management and AES Gener in Chile and AES Brasiliana in Brazil. Mr. Gluski is also Chairman of the Americas Society/Council of the Americas, and Director of the Edison Electric Institute and the US-Philippines Society. Mr. Gluski is a magna cum laude graduate of Wake Forest University and holds an M.A. and a Ph.D. in Economics from the University of Virginia.
Elizabeth Hackenson
, 56 years old, was named Chief Information Officer ("CIO") and SVP of AES in October 2008. Prior to assuming her current position, Ms. Hackenson was the SVP and CIO at Alcatel-Lucent from 2006 to 2008, where she managed the development of technology programs for Applications, Operations and Infrastructure. Previously, she also served as the EVP and CIO for MCI from 2004 to 2006. Her corporate tenure has spanned several Fortune 100 companies including, British Telecom (Concert), AOL (UUNET) and EDS. She served in a variety of senior management positions, working on the management and delivery of information technology services to support business needs across a corporate-wide enterprise. Ms. Hackenson serves on the Boards of DP&L and its parent company DPL, Inc. AES Cochrane and AES Chivor. She also serves as a Director on the Greater Washington Board of Trade and Red 5 Security and is a Strategic Advisor to the Paladin Group. Ms. Hackenson earned her degree from New York State University.
Tish Mendoza
, 41 years old, is Chief Human Resources Officer and Senior Vice President, Global Human Resources and Internal Communications. Prior to assuming her current position, Ms. Mendoza was the Vice President of Human Resources, Global Utilities from 2011 to 2012 and Vice President of Global Compensation, Benefits and HRIS, including Executive Compensation, from 2008 to 2011 and acted in the same capacity as the Director of the function from 2006 to 2008. In 2015, Ms. Mendoza was appointed a member of the Boards of AES Chivor S.A. and DP&L, and sits on AES' compensation and benefits committees. She is also currently serving as co-chair of Evanta Global HR, and is part of its governing body in Washington, DC. Prior to joining AES, Ms. Mendoza was Vice President of Human Resources for a product company in the Treasury Services division of JP
55
Morgan Chase and Vice President of Human Resources and Compensation and Benefits at Vastera, Inc, a former technology and managed services company. Ms. Mendoza earned certificates in leadership and human resource management, and a Bachelor's degree in Business Administration and Human Resources.
Brian A. Miller
,
51 years old, has been EVP, General Counsel, and Corporate Secretary of the Company since 2005. Mr. Miller is responsible for the management and operation of the company
's
global
legal
and governance matters
,
stakeholder management and regulatory affairs
,
and ethics
and
compliance efforts. Mr. Miller joined the Company in 2001 and has served in various positions including VP, Deputy General Counsel, Corporate Secretary, Business Development, General Counsel for North America and Assistant General Counsel. He is
a
member of the Board of Directors for the Business Council for
Internati
onal
Unde
rs
tanding, a business association established at President Eisenhower's
initiative
in 1955
t
o promote international
under
sta
nding
between government and business executives. He also
serves
on the Board of the
U
S-Kazak
h
stan
Business Association.
H
e
is
chairman
of
the
Boards of Directors of Dayton Power and Light
,
and Indianapolis Power and Light
,
and serves
on the Advisory Boards
of AES companies
in Bulgaria, the Dominican Republic and
th
e
Philippines. Previously
,
Brian
served
on other
i
nternational Board
s
of Directors,
inc
lu
din
g
AES Chivor
,
AES
'
affiliate in Colombia, from 2013 through 2015; AES Entek, a joint venture, from 2008 through July of 2014, which was
c
r
eated
to develop businesses in the energy sector in Turkey; and Silver Ridge
,
a
joint venture between AES and Riverstone Holdings LLC, from 2008 through July of 2014, which was
created
to develop
,
manage
and ope
r
ate sola
r
power
bus
iness
in
E
urope
,
Asia
,
Latin
America
and
the Un
i
ted
States.
Prior to joining AES, he was counsel in the New York office of the law firm Chadbourne & Parke, LLP. Mr. Miller received a Bachelor's degree in History and Economics from Boston College and holds a Juris Doctorate from the University of Connecticut School Of Law.
Thomas M. O'Flynn
, 57 years old, has served as EVP and CFO of the Company since September 2012. Previously, Mr. O'Flynn served as Senior Advisor to the Private Equity Group of Blackstone, an investment and advisory group and held this position from 2010 to 2012. During this period, Mr. O'Flynn also served as COO and CFO of Transmission Developers, Inc., a Blackstone-controlled company that develops innovative power transmission projects in an environmentally responsible manner. From 2001 to 2009, he served as the CFO of PSEG, a New Jersey-based merchant power and utility company. He also served as President of PSEG Energy Holdings from 2007 to 2009. From 1986 to 2001, Mr. O'Flynn was in the Global Power and Utility Group of Morgan Stanley. He served as a Managing Director for his last five years and as head of the North American Power Group from 2000 to 2001. He was responsible for senior client relationships and led a number of large merger, financing, restructuring and advisory transactions. Mr. O'Flynn is the chairman of the IPALCO and AES US Investments Boards and previously served as a member of the Boards of DP&L and its parent company, DPL, Inc. Mr. O'Flynn served on the Board of Silver Ridge Power, a joint venture between AES and Riverstone Holdings LLC from September 2012 through July 2014. He is also currently on the Board of Directors of the New Jersey Performing Arts Center and was the inaugural Chairman of the Institute for Sustainability and Energy at Northwestern University, of which he is still an active Board member. Mr. O'Flynn has a BA in Economics from Northwestern University and an MBA in Finance from the University of Chicago.
How to Contact AES and Sources of Other Information
Our principal offices are located at 4300 Wilson Boulevard, Arlington, Virginia 22203. Our telephone number is (703) 522-1315. Our website address is
http://www.aes.com
. Our annual reports on Form 10-K, quarterly reports on Form 10-Q and current reports on Form 8-K and any amendments to such reports filed pursuant to Section 13(a) or Section 15(d) of the Securities Exchange Act of 1934 (the "Exchange Act") are posted on our website. After the reports are filed with, or furnished to the SEC, they are available from us free of charge. Material contained on our website is not part of and is not incorporated by reference in this Form 10-K. You may also read and copy any materials we file with the SEC at the SEC's Public Reference Room at 100 F Street, N.E., Washington, D.C. 20549. You may obtain information about the operation of the Public Reference Room by calling the SEC at 1-800-SEC-0330. The SEC maintains an internet website that contains the reports, proxy and information statements and other information that we file electronically with the SEC at
www.sec.gov
.
Our CEO and our CFO have provided certifications to the SEC as required by Section 302 of the Sarbanes-Oxley Act of 2002. These certifications are included as exhibits to this Annual Report on Form 10-K.
Our CEO provided a certification pursuant to Section 303A of the New York Stock Exchange Listed Company Manual on May 13, 2016.
Our Code of Business Conduct ("Code of Conduct") and Corporate Governance Guidelines have been adopted by our Board of Directors. The Code of Conduct is intended to govern, as a requirement of employment, the actions of everyone who works at AES, including employees of our subsidiaries and affiliates. Our Ethics and Compliance Department provides training, information, and certification programs for AES employees related to the
56
Code of Conduct. The Ethics and Compliance Department also has programs in place to prevent and detect criminal conduct, promote an organizational culture that encourages ethical behavior and a commitment to compliance with the law, and to monitor and enforce AES policies on corruption, bribery, money laundering and associations with terrorists groups. The Code of Conduct and the Corporate Governance Guidelines are located in their entirety on our website. Any person may obtain a copy of the Code of Conduct or the Corporate Governance Guidelines without charge by making a written request to: Corporate Secretary, The AES Corporation, 4300 Wilson Boulevard, Arlington, VA 22203. If any amendments to, or waivers from, the Code of Conduct or the Corporate Governance Guidelines are made, we will disclose such amendments or waivers on our website.
You should consider carefully the following risks, along with the other information contained in or incorporated by reference in this Form 10-K. Additional risks and uncertainties also may adversely affect our business and operations including those discussed in Item 7.—Management's Discussion and Analysis of Financial Condition and Results of Operations in this Form 10-K. If any of the following events actually occur, our business, financial results and financial condition could be materially adversely affected.
We routinely encounter and address risks, some of which may cause our future results to be different, sometimes materially different, than we presently anticipate. The categories of risk we have identified in Item 1A.—
Risk Factors
of this Form 10-K include the following:
|
•
|
risks related to our high level of indebtedness;
|
|
•
|
risks associated with our ability to raise needed capital;
|
|
•
|
external risks associated with revenue and earnings volatility;
|
|
•
|
risks associated with our operations; and
|
|
•
|
risks associated with governmental regulation and laws.
|
These risk factors should be read in conjunction with Item 7.—
Management's Discussion and Analysis of Financial Condition and Results of Operations
, and the Consolidated Financial Statements and related notes included elsewhere in this report.
Risks Related to our High Level of Indebtedness
We have a significant amount of debt, a large percentage of which is secured, which could adversely affect our business and the ability to fulfill our obligations.
As of
December 31, 2016
, we had approximately
$20.5 billion
of outstanding indebtedness on a consolidated basis. All outstanding borrowings, if any, under The AES Corporation's senior secured credit facility are secured by certain of our assets, including the pledge of capital stock of many of The AES Corporation's directly held subsidiaries. Most of the debt of The AES Corporation's subsidiaries is secured by substantially all of the assets of those subsidiaries. Since we have such a high level of debt, a substantial portion of cash flow from operations must be used to make payments on this debt. Furthermore, since a significant percentage of our assets are used to secure this debt, this reduces the amount of collateral that is available for future secured debt or credit support and reduces our flexibility in dealing with these secured assets. This high level of indebtedness and related security could have other important consequences to us and our investors, including:
|
•
|
making it more difficult to satisfy debt service and other obligations at the holding company and/or individual subsidiaries;
|
|
•
|
increasing the likelihood of a downgrade of our debt, which could cause future debt costs and/or payments to increase under our debt and related hedging instruments and consume an even greater portion of cash flow;
|
|
•
|
increasing our vulnerability to general adverse industry and economic conditions, including but not limited to adverse changes in foreign exchange rates and commodity prices;
|
|
•
|
reducing the availability of cash flow to fund other corporate purposes and grow our business;
|
|
•
|
limiting our flexibility in planning for, or reacting to, changes in our business and the industry;
|
|
•
|
placing us at a competitive disadvantage to our competitors that are not as highly leveraged; and
|
|
•
|
limiting, along with the financial and other restrictive covenants relating to such indebtedness, among other things, our ability to borrow additional funds as needed or take advantage of business opportunities as they arise, pay cash dividends or repurchase common stock.
|
The agreements governing our indebtedness, including the indebtedness of our subsidiaries, limit, but do not prohibit the incurrence of additional indebtedness. To the extent we become more leveraged, the risks described
57
above would increase. Further, our actual cash requirements in the future may be greater than expected. Accordingly, our cash flows may not be sufficient to repay at maturity all of the outstanding debt as it becomes due and, in that event, we may not be able to borrow money, sell assets, raise equity or otherwise raise funds on acceptable terms or at all to refinance our debt as it becomes due. See Note 11
—Debt
included in Item 8. of this Form 10-K for a schedule of our debt maturities.
The AES Corporation is a holding company and its ability to make payments on its outstanding indebtedness, including its public debt securities, is dependent upon the receipt of funds from its subsidiaries by way of dividends, fees, interest, loans or otherwise.
The AES Corporation is a holding company with no material assets other than the stock of its subsidiaries. All of The AES Corporation's revenue is generated through its subsidiaries. Accordingly, almost all of The AES Corporation's cash flow is generated by the operating activities of its subsidiaries. Therefore, The AES Corporation's ability to make payments on its indebtedness and to fund its other obligations is dependent not only on the ability of its subsidiaries to generate cash, but also on the ability of the subsidiaries to distribute cash to it in the form of dividends, fees, interest, tax sharing payments, loans or otherwise.
However, our subsidiaries face various restrictions in their ability to distribute cash to The AES Corporation. Most of the subsidiaries are obligated, pursuant to loan agreements, indentures or non-recourse financing arrangements, to satisfy certain restricted payment covenants or other conditions before they may make distributions to The AES Corporation. In addition, the payment of dividends or the making of loans, advances or other payments to The AES Corporation may be subject to other contractual, legal or regulatory restrictions or may be prohibited altogether. Business performance and local accounting and tax rules may limit the amount of retained earnings that may be distributed to us as a dividend. Subsidiaries in foreign countries may also be prevented from distributing funds to The AES Corporation as a result of foreign governments restricting the repatriation of funds or the conversion of currencies. Any right that The AES Corporation has to receive any assets of any of its subsidiaries upon any liquidation, dissolution, winding up, receivership, reorganization, bankruptcy, insolvency or similar proceedings (and the consequent right of the holders of The AES Corporation's indebtedness to participate in the distribution of, or to realize proceeds from, those assets) will be effectively subordinated to the claims of any such subsidiary's creditors (including trade creditors and holders of debt issued by such subsidiary).
The AES Corporation's subsidiaries are separate and distinct legal entities and, unless they have expressly guaranteed any of The AES Corporation's indebtedness, have no obligation, contingent or otherwise, to pay any amounts due pursuant to such debt or to make any funds available whether by dividends, fees, loans or other payments.
Even though The AES Corporation is a holding company, existing and potential future defaults by subsidiaries or affiliates could adversely affect The AES Corporation.
We attempt to finance our domestic and foreign projects primarily under loan agreements and related documents which, except as noted below, require the loans to be repaid solely from the project's revenues and provide that the repayment of the loans (and interest thereon) is secured solely by the capital stock, physical assets, contracts and cash flow of that project subsidiary or affiliate. This type of financing is usually referred to as non-recourse debt or "non-recourse financing." In some non-recourse financings, The AES Corporation has explicitly agreed to undertake certain limited obligations and contingent liabilities, most of which by their terms will only be effective or will be terminated upon the occurrence of future events. These obligations and liabilities take the form of guarantees, indemnities, letters of credit, letter of credit reimbursement agreements and agreements to pay, in certain circumstances, the project lenders or other parties.
As of
December 31, 2016
, we had approximately
$20.5 billion
of outstanding indebtedness on a consolidated basis, of which approximately
$4.7 billion
was recourse debt of The AES Corporation and approximately
$15.8 billion
was non-recourse debt. In addition, we have outstanding guarantees, indemnities, letters of credit, and other credit support commitments which are further described in this Form 10-K in Item 7.—
Management's Discussion and Analysis of Financial Condition and Results of Operations
—
Capital Resources and Liquidity
—
Parent Company Liquidity
.
Some of our subsidiaries are currently in default with respect to all or a portion of their outstanding indebtedness. The total debt classified as current in our Consolidated Balance Sheets related to such defaults was
$128 million
as of
December 31, 2016
. While the lenders under our non-recourse financings generally do not have direct recourse to The AES Corporation (other than to the extent of any credit support given by The AES Corporation), defaults thereunder can still have important consequences for The AES Corporation, including, without limitation:
58
|
•
|
reducing The AES Corporation's receipt of subsidiary dividends, fees, interest payments, loans and other sources of cash since the project subsidiary will typically be prohibited from distributing cash to The AES Corporation during the pendency of any default;
|
|
•
|
under certain circumstances, triggering The AES Corporation's obligation to make payments under any financial guarantee, letter of credit or other credit support which The AES Corporation has provided to or on behalf of such subsidiary;
|
|
•
|
causing The AES Corporation to record a loss in the event the lender forecloses on the assets;
|
|
•
|
triggering defaults in The AES Corporation's outstanding debt and trust preferred securities. For example, The AES Corporation's senior secured credit facility and outstanding senior notes include events of default for certain bankruptcy related events involving material subsidiaries. In addition, The AES Corporation's senior secured credit facility includes certain events of default relating to accelerations of outstanding material debt of material subsidiaries or any subsidiaries that in the aggregate constitute a material subsidiary;
|
|
•
|
the loss or impairment of investor confidence in the Company; or
|
|
•
|
foreclosure on the assets that are pledged under the non-recourse loans, therefore eliminating any and all potential future benefits derived from those assets.
|
None of the projects that are currently in default are owned by subsidiaries that individually or in the aggregate meet the applicable standard of materiality in The AES Corporation's senior secured credit facility or other debt agreements in order for such defaults to trigger an event of default or permit acceleration under such indebtedness. However, as a result of future mix of distributions, write-down of assets, dispositions and other matters that affect our financial position and results of operations, it is possible that one or more of these subsidiaries, individually or in the aggregate, could fall within the applicable standard of materiality and thereby upon an acceleration of such subsidiary's debt, trigger an event of default and possible acceleration of the indebtedness under The AES Corporation's senior secured credit facility or other indebtedness of The AES Corporation.
Risks Associated with our Ability to Raise Needed Capital
The AES Corporation, or the Parent Company, has significant cash requirements and limited sources of liquidity.
The AES Corporation requires cash primarily to fund:
|
•
|
principal repayments of debt;
|
|
•
|
interest and preferred dividends;
|
|
•
|
acquisitions;
|
|
•
|
construction and other project commitments;
|
|
•
|
other equity commitments, including business development investments;
|
|
•
|
equity repurchases and/or cash dividends on our common stock;
|
|
•
|
taxes; and
|
|
•
|
Parent Company overhead costs.
|
The AES Corporation's principal sources of liquidity are:
|
•
|
dividends and other distributions from its subsidiaries;
|
|
•
|
proceeds from debt and equity financings at the Parent Company level; and
|
|
•
|
proceeds from asset sales.
|
For a more detailed discussion of The AES Corporation's cash requirements and sources of liquidity, please see Item 7.—
Management's Discussion and Analysis of Financial Condition and Results of Operations
—
Capital Resources and Liquidity
in this Form 10-K.
While we believe that these sources will be adequate to meet our obligations at the Parent Company level for the foreseeable future, this belief is based on a number of material assumptions, including, without limitation, assumptions about our ability to access the capital or commercial lending markets, the operating and financial performance of our subsidiaries, exchange rates, our ability to sell assets, and the ability of our subsidiaries to pay dividends and other distributions. Any number of assumptions could prove to be incorrect, and, therefore there can be no assurance that these sources will be available when needed or that our actual cash requirements will not be greater than expected. For example, in recent years, certain financial institutions have gone bankrupt. In the event that a bank who is party to our senior secured credit facility or other facilities goes bankrupt or is otherwise unable
59
to fund its commitments, we would need to replace that bank in our syndicate or risk a reduction in the size of the facility, which would reduce our liquidity. In addition, our cash flow may not be sufficient to repay at maturity the entire principal outstanding under our credit facility and our debt securities and we may have to refinance such obligations. There can be no assurance that we will be successful in obtaining such refinancing on terms acceptable to us or at all and any of these events could have a material effect on us.
Our ability to grow our business could be materially adversely affected if we were unable to raise capital on favorable terms.
From time to time, we rely on access to capital markets as a source of liquidity for capital requirements not satisfied by operating cash flows. Our ability to arrange for financing on either a recourse or non-recourse basis and the costs of such capital are dependent on numerous factors, some of which are beyond our control, including:
|
•
|
general economic and capital market conditions;
|
|
•
|
the availability of bank credit;
|
|
•
|
investor confidence;
|
|
•
|
the financial condition, performance and prospects of The AES Corporation in general and/or that of any subsidiary requiring the financing as well as companies in our industry or similar financial circumstances; and
|
|
•
|
changes in tax and securities laws which are conducive to raising capital.
|
Should future access to capital not be available to us, we may have to sell assets or decide not to build new plants or expand or improve existing facilities, either of which would affect our future growth, results of operations or financial condition.
A downgrade in the credit ratings of The AES Corporation or its subsidiaries could adversely affect our ability to access the capital markets which could increase our interest costs or adversely affect our liquidity and cash flow.
If any of the credit ratings of The AES Corporation or its subsidiaries were to be downgraded, our ability to raise capital on favorable terms could be impaired and our borrowing costs could increase. Furthermore, depending on The AES Corporation's credit ratings and the trading prices of its equity and debt securities, counterparties may no longer be as willing to accept general unsecured commitments by The AES Corporation to provide credit support. Accordingly, with respect to both new and existing commitments, The AES Corporation may be required to provide some other form of assurance, such as a letter of credit and/or collateral, to backstop or replace any credit support by The AES Corporation. There can be no assurance that such counterparties will accept such guarantees or that AES could arrange such further assurances in the future. In addition, to the extent The AES Corporation is required and able to provide letters of credit or other collateral to such counterparties, it will limit the amount of credit available to The AES Corporation to meet its other liquidity needs.
We may not be able to raise sufficient capital to fund developing projects in certain less developed economies which could change or in some cases adversely affect our growth strategy.
Part of our strategy is to grow our business by developing businesses in less developed economies where the return on our investment may be greater than projects in more developed economies. Commercial lending institutions sometimes refuse to provide non-recourse project financing in certain less developed economies, and in these situations we have sought and will continue to seek direct or indirect (through credit support or guarantees) project financing from a limited number of multilateral or bilateral international financial institutions or agencies. As a precondition to making such project financing available, the lending institutions may also require governmental guarantees for certain project and sovereign related risks. There can be no assurance, however, that project financing from the international financial agencies or that governmental guarantees will be available when needed, and if they are not, we may have to abandon the project or invest more of our own funds which may not be in line with our investment objectives and would leave less funds for other projects.
External Risks Associated with Revenue and Earnings Volatility
Our businesses may incur substantial costs and liabilities and be exposed to price volatility as a result of risks associated with the wholesale electricity markets, which could have a material adverse effect on our financial performance.
Some of our businesses sell electricity in the spot markets in cases where they operate at levels in excess of their power sales agreements or retail load obligations. Our businesses may also buy electricity in the wholesale spot markets. As a result, we are exposed to the risks of rising and falling prices in those markets. The open market wholesale prices for electricity can be volatile and often reflect the fluctuating cost of fuels such as coal, natural gas
60
or oil derivative fuels in addition to other factors described below. Consequently, any changes in the supply and cost of coal, natural gas, or oil derivative fuels may impact the open market wholesale price of electricity.
Volatility in market prices for fuel and electricity may result from among other things:
|
•
|
plant availability in the markets generally;
|
|
•
|
availability and effectiveness of transmission facilities owned and operated by third parties;
|
|
•
|
competition;
|
|
•
|
electricity usage;
|
|
•
|
seasonality;
|
|
•
|
foreign exchange rate fluctuation;
|
|
•
|
availability and price of emission credits;
|
|
•
|
hydrology and other weather conditions;
|
|
•
|
illiquid markets;
|
|
•
|
transmission or transportation constraints or inefficiencies;
|
|
•
|
availability of competitively priced renewables sources;
|
|
•
|
increased adoption of distributed generation;
|
|
•
|
available supplies of natural gas, crude oil and refined products, and coal;
|
|
•
|
generating unit performance;
|
|
•
|
natural disasters, terrorism, wars, embargoes, and other catastrophic events;
|
|
•
|
energy, market and environmental regulation, legislation and policies;
|
|
•
|
geopolitical concerns affecting global supply of oil and natural gas;
|
|
•
|
general economic conditions in areas where we operate which impact energy consumption; and
|
|
•
|
bidding behavior and market bidding rules.
|
Our financial position and results of operations may fluctuate significantly due to fluctuations in currency exchange rates experienced at our foreign operations.
Our exposure to currency exchange rate fluctuations results primarily from the translation exposure associated with the preparation of the Consolidated Financial Statements, as well as from transaction exposure associated with transactions in currencies other than an entity's functional currency. While the Consolidated Financial Statements are reported in U.S. Dollars, the financial statements of many of our subsidiaries outside the U.S. are prepared using the local currency as the functional currency and translated into U.S. Dollars by applying appropriate exchange rates. As a result, fluctuations in the exchange rate of the U.S. Dollar relative to the local currencies where our subsidiaries outside the U.S. report could cause significant fluctuations in our results. In addition, while our expenses with respect to foreign operations are generally denominated in the same currency as corresponding sales, we have transaction exposure to the extent receipts and expenditures are not denominated in the subsidiary's functional currency. Moreover, the costs of doing business abroad may increase as a result of adverse exchange rate fluctuations. Our financial position and results of operations could be affected by fluctuations in the value of a number of currencies. See Item 7A.
—Quantitative and Qualitative Disclosures about Market Risk
to this Form 10-K for further information.
We may not be adequately hedged against our exposure to changes in commodity prices or interest rates.
We routinely enter into contracts to hedge a portion of our purchase and sale commitments for electricity, fuel requirements and other commodities to lower our financial exposure related to commodity price fluctuations. As part of this strategy, we routinely utilize fixed price or indexed forward physical purchase and sales contracts, futures, financial swaps, and option contracts traded in the over-the-counter markets or on exchanges. We also enter into contracts which help us manage our interest rate exposure. However, we may not cover the entire exposure of our assets or positions to market price or interest rate volatility, and the coverage will vary over time. Furthermore, the risk management practices we have in place may not always perform as planned. In particular, if prices of commodities or interest rates significantly deviate from historical prices or interest rates or if the price or interest rate volatility or distribution of these changes deviates from historical norms, our risk management practices may not protect us from significant losses. As a result, fluctuating commodity prices or interest rates may negatively impact our financial results to the extent we have unhedged or inadequately hedged positions. In addition, certain types of economic hedging activities may not qualify for hedge accounting under U.S. GAAP, resulting in increased
61
volatility in our net income. The Company may also suffer losses associated with "basis risk" which is the difference in performance between the hedge instrument and the targeted underlying exposure. Furthermore, there is a risk that the current counterparties to these arrangements may fail or are unable to perform part or all of their obligations under these arrangements.
Our coal-fired facilities in the U.S. continue to face substantial challenges as a result of high coal prices relative to natural gas, particularly those which are merchant plants that are exposed to market risk and those that have hybrid merchant risk, meaning those businesses that have a PPA in place but purchase fuel at market prices or under short term contracts. For our businesses with PPA pricing that does not perfectly pass through our fuel costs, the businesses attempt to manage the exposure through flexible fuel purchasing and timing of entry and terms of our fuel supply agreements; however, these risk management efforts may not be successful and the resulting commodity exposure could have a material impact on these businesses and/or our results of operations.
Supplier and/or customer concentration may expose the Company to significant financial credit or performance risks.
We often rely on a single contracted supplier or a small number of suppliers for the provision of fuel, transportation of fuel and other services required for the operation of certain of our facilities. If these suppliers cannot perform, we would seek to meet our fuel requirements by purchasing fuel at market prices, exposing us to market price volatility and the risk that fuel and transportation may not be available during certain periods at any price, which could adversely impact the profitability of the affected business and our results of operations, and could result in a breach of agreements with other counterparties, including, without limitation, offtakers or lenders.
At times, we rely on a single customer or a few customers to purchase all or a significant portion of a facility's output, in some cases under long-term agreements that account for a substantial percentage of the anticipated revenue from a given facility. We have also hedged a portion of our exposure to power price fluctuations through forward fixed price power sales. Counterparties to these agreements may breach or may be unable to perform their obligations. We may not be able to enter into replacement agreements on terms as favorable as our existing agreements, or at all. If we were unable to enter into replacement PPAs, these businesses may have to sell power at market prices. A breach by a counterparty of a PPA or other agreement could also result in the breach of other agreements, including, without limitation, the debt documents of the affected business.
The failure of any supplier or customer to fulfill its contractual obligations to The AES Corporation or our subsidiaries could have a material adverse effect on our financial results. Consequently, the financial performance of our facilities is dependent on the credit quality of, and continued performance by, suppliers and customers.
The market pricing of our common stock has been volatile and may continue to be volatile in future periods.
The market price for our common stock has been volatile in the past, and the price of our common stock could fluctuate substantially in the future. Stock price movements on a quarter-by-quarter basis for the past two years are presented in Item 5.—
Market
—
Market Information
of this Form 10-K. Factors that could affect the price of our common stock in the future include general conditions in our industry, in the power markets in which we participate and in the world, including environmental and economic developments, over which we have no control, as well as developments specific to us, including, risks that could result in revenue and earnings volatility as well as other risk factors described in Item 1A.—
Risk Factors
and those matters described in Item 7.—
Management's Discussion and Analysis of Financial Conditions and Results of Operations
.
Risks Associated with our Operations
We do a significant amount of business outside the U.S., including in developing countries, which presents significant risks.
A significant amount of our revenue is generated outside the U.S. and a significant portion of our international operations is conducted in developing countries. Part of our growth strategy is to expand our business in certain developing countries in which AES has an existing presence as such countries may have higher growth rates and offer greater opportunities to expand from our platforms, with potentially higher returns than in some more developed countries. International operations, particularly the operation, financing and development of projects in developing countries, entail significant risks and uncertainties, including, without limitation:
|
•
|
economic, social and political instability in any particular country or region;
|
|
•
|
adverse changes in currency exchange rates;
|
|
•
|
government restrictions on converting currencies or repatriating funds;
|
|
•
|
unexpected changes in foreign laws and regulations or in trade, monetary or fiscal policies;
|
62
|
•
|
high inflation and monetary fluctuations;
|
|
•
|
restrictions on imports of coal, oil, gas or other raw materials required by our generation businesses to operate;
|
|
•
|
threatened or consummated expropriation or nationalization of our assets by foreign governments;
|
|
•
|
risks relating to the failure to comply with the U.S. Foreign Corrupt Practices Act, United Kingdom Bribery Act or other anti-bribery laws applicable to our operations;
|
|
•
|
difficulties in hiring, training and retaining qualified personnel, particularly finance and accounting personnel with GAAP expertise;
|
|
•
|
unwillingness of governments and their agencies, similar organizations or other counterparties to honor their contracts;
|
|
•
|
unwillingness of governments, government agencies, courts or similar bodies to enforce contracts that are economically advantageous to subsidiaries of the Company and economically unfavorable to counterparties, against such counterparties, whether such counterparties are governments or private parties;
|
|
•
|
inability to obtain access to fair and equitable political, regulatory, administrative and legal systems;
|
|
•
|
adverse changes in government tax policy;
|
|
•
|
difficulties in enforcing our contractual rights or enforcing judgments or obtaining a favorable result in local jurisdictions; and
|
|
•
|
potentially adverse tax consequences of operating in multiple jurisdictions.
|
Any of these factors, by itself or in combination with others, could materially and adversely affect our business, results of operations and financial condition. Our operations may experience volatility in revenues and operating margin which have caused and are expected to cause significant volatility in our results of operations and cash flows. The volatility is caused by regulatory and economic difficulties, political instability and currency devaluations being experienced in many of these countries. This volatility reduces the predictability and enhances the uncertainty associated with cash flows from these businesses. A number of our businesses are facing challenges associated with regulatory changes.
The operation of power generation, distribution and transmission facilities involves significant risks that could adversely affect our financial results. We and/or our subsidiaries may not have adequate risk mitigation and/or insurance coverage for liabilities.
We are in the business of generating and distributing electricity, which involves certain risks that can adversely affect financial and operating performance, including:
|
•
|
changes in the availability of our generation facilities or distribution systems due to increases in scheduled and unscheduled plant outages, equipment failure, failure of transmission systems, labor disputes, disruptions in fuel supply, poor hydrologic and wind conditions, inability to comply with regulatory or permit requirements or catastrophic events such as fires, floods, storms, hurricanes, earthquakes, dam failures, explosions, terrorist acts, cyber attacks or other similar occurrences; and
|
|
•
|
changes in our operating cost structure including, but not limited to, increases in costs relating to gas, coal, oil and other fuel; fuel transportation; purchased electricity; operations, maintenance and repair; environmental compliance, including the cost of purchasing emissions offsets and capital expenditures to install environmental emission equipment; transmission access; and insurance.
|
Our businesses require reliable transportation sources (including related infrastructure such as roads, ports and rail), power sources and water sources to access and conduct operations. The availability and cost of this infrastructure affects capital and operating costs and levels of production and sales. Limitations, or interruptions in this infrastructure or at the facilities of our subsidiaries, including as a result of third parties intentionally or unintentionally disrupting this infrastructure or the facilities of our subsidiaries, could impede their ability to produce electricity. This could have a material adverse effect on our businesses' results of operations, financial condition and prospects.
In addition, a portion of our generation facilities were constructed many years ago. Older generating equipment may require significant capital expenditures for maintenance. The equipment at our plants, whether old or new, is also likely to require periodic upgrading, improvement or repair, and replacement equipment or parts may be difficult to obtain in circumstances where we rely on a single supplier or a small number of suppliers. The inability to obtain replacement equipment or parts may impact the ability of our plants to perform and could, therefore, have a material impact on our business and results of operations. Breakdown or failure of one of our operating facilities may prevent the facility from performing under applicable power sales agreements which, in certain situations, could result in termination of a power purchase or other agreement or incurrence of a liability for
63
liquidated damages and/or other penalties.
As a result of the above risks and other potential hazards associated with the power generation, distribution and transmission industries, we may from time to time become exposed to significant liabilities for which we may not have adequate risk mitigation and/or insurance coverage. Power generation involves hazardous activities, including acquiring, transporting and unloading fuel, operating large pieces of rotating equipment and delivering electricity to transmission and distribution systems. In addition to natural risks, such as earthquakes, floods, lightning, hurricanes and wind, hazards, such as fire, explosion, collapse and machinery failure, are inherent risks in our operations which may occur as a result of inadequate internal processes, technological flaws, human error or actions of third parties or other external events. The control and management of these risks depend upon adequate development and training of personnel and on the existence of operational procedures, preventative maintenance plans and specific programs supported by quality control systems which reduce, but do not eliminate, the possibility of the occurrence and impact of these risks.
The hazards described above, along with other safety hazards associated with our operations, can cause significant personal injury or loss of life, severe damage to and destruction of property, plant and equipment, contamination of, or damage to, the environment and suspension of operations. The occurrence of any one of these events may result in our being named as a defendant in lawsuits asserting claims for substantial damages, environmental cleanup costs, personal injury and fines and/or penalties. We maintain an amount of insurance protection that we believe is customary, but there can be no assurance that our insurance will be sufficient or effective under all circumstances and against all hazards or liabilities to which we may be subject. A claim for which we are not fully insured or insured at all could hurt our financial results and materially harm our financial condition. Further, due to the cyclical nature of the insurance markets, we cannot provide assurance that insurance coverage will continue to be available on terms similar to those presently available to us or at all. Any losses not covered by insurance could have a material adverse effect on our financial condition, results of operations or cash flows.
Our businesses' insurance does not cover every potential risk associated with its operations. Adequate coverage at reasonable rates is not always obtainable. In addition, insurance may not fully cover the liability or the consequences of any business interruptions such as equipment failure or labor dispute. The occurrence of a significant adverse event not fully or partially covered by insurance could have a material adverse effect on the Company's business, results or operations, financial condition and prospects.
Any of the above risks could have a material adverse effect on our business and results of operations.
We may not be able to attract and retain skilled people, which could have a material adverse effect on our operations.
Our operating success and ability to carry out growth initiatives depends in part on our ability to retain executives and to attract and retain additional qualified personnel who have experience in our industry and in operating a company of our size and complexity, including people in our foreign businesses. The inability to attract and retain qualified personnel could have a material adverse effect on our business, because of the difficulty of promptly finding qualified replacements. For example, we routinely are required to assess the financial impacts of complicated business transactions which occur on a worldwide basis. These assessments are dependent on hiring personnel on a worldwide basis with sufficient expertise in U.S. GAAP to timely and accurately comply with U.S. reporting obligations. An inability to maintain adequate internal accounting and managerial controls and hire and retain qualified personnel could have an adverse effect on our financial and tax reporting.
We have contractual obligations to certain customers to provide full requirements service, which makes it difficult to predict and plan for load requirements and may result in increased operating costs to certain of our businesses.
We have contractual obligations to certain customers to supply power to satisfy all or a portion of their energy requirements. The uncertainty regarding the amount of power that our power generation and distribution facilities must be prepared to supply to customers may increase our operating costs. A significant under- or over-estimation of load requirements could result in our facilities not having enough or having too much power to cover their obligations, in which case we would be required to buy or sell power from or to third parties at prevailing market prices. Those prices may not be favorable and thus could increase our operating costs.
We may not be able to enter into long-term contracts, which reduce volatility in our results of operations. Even when we successfully enter into long-term contracts, our generation businesses are often dependent on one or a limited number of customers and a limited number of fuel suppliers.
Many of our generation plants conduct business under long-term sales and supply contracts, which helps these businesses to manage risks by reducing the volatility associated with power and input costs and providing a
64
stable revenue and cost structure. In these instances, we rely on power sales contracts with one or a limited number of customers for the majority of, and in some cases all of, the relevant plant's output and revenues over the term of the power sales contract. The remaining terms of the power sales contracts of our generation plants range from one to 25 years. In many cases, we also limit our exposure to fluctuations in fuel prices by entering into long-term contracts for fuel with a limited number of suppliers. In these instances, the cash flows and results of operations are dependent on the continued ability of customers and suppliers to meet their obligations under the relevant power sales contract or fuel supply contract, respectively. Some of our long-term power sales agreements are at prices above current spot market prices and some of our long-term fuel supply contracts are at prices below current market prices. The loss of significant power sales contracts or fuel supply contracts, or the failure by any of the parties to such contracts that prevents us from fulfilling our obligations thereunder, could adversely impact our strategy by resulting in costs that exceed revenue, which could have a material adverse impact on our business, results of operations and financial condition. In addition, depending on market conditions and regulatory regimes, it may be difficult for us to secure long-term contracts, either where our current contracts are expiring or for new development projects. The inability to enter into long-term contracts could require many of our businesses to purchase inputs at market prices and sell electricity into spot markets, which may not be favorable.
We have sought to reduce counterparty credit risk under our long-term contracts in part by entering into power sales contracts with utilities or other customers of strong credit quality and by obtaining guarantees from certain sovereign governments of the customer's obligations. However, many of our customers do not have, or have failed to maintain, an investment-grade credit rating, and our generation business cannot always obtain government guarantees and if they do, the government does not always have an investment grade credit rating. We have also sought to reduce our credit risk by locating our plants in different geographic areas in order to mitigate the effects of regional economic downturns. However, there can be no assurance that our efforts to mitigate this risk will be successful.
Competition is increasing and could adversely affect us.
The power production markets in which we operate are characterized by numerous strong and capable competitors, many of whom may have extensive and diversified developmental or operating experience (including both domestic and international) and financial resources similar to or greater than ours. Further, in recent years, the power production industry has been characterized by strong and increasing competition with respect to both obtaining power sales agreements and acquiring existing power generation assets. In certain markets, these factors have caused reductions in prices contained in new power sales agreements and, in many cases, have caused higher acquisition prices for existing assets through competitive bidding practices. The evolution of competitive electricity markets and the development of highly efficient gas-fired power plants have also caused, or are anticipated to cause, price pressure in certain power markets where we sell or intend to sell power. These competitive factors could have a material adverse effect on us.
Some of our subsidiaries participate in defined benefit pension plans and their net pension plan obligations may require additional significant contributions.
Certain of our subsidiaries have defined benefit pension plans covering substantially all of their respective employees. Of the thirty one such defined benefit plans, five are at U.S. subsidiaries and the remaining plans are at foreign subsidiaries. Pension costs are based upon a number of actuarial assumptions, including an expected long-term rate of return on pension plan assets, the expected life span of pension plan beneficiaries and the discount rate used to determine the present value of future pension obligations. Any of these assumptions could prove to be wrong, resulting in a shortfall of pension plan assets compared to pension obligations under the pension plan. The Company periodically evaluates the value of the pension plan assets to ensure that they will be sufficient to fund the respective pension obligations. The Company's exposure to market volatility is mitigated to some extent due to the fact that the asset allocations in our largest plans include a significant weighting of investments in fixed income securities that are less volatile than investments in equity securities. Future downturns in the debt and/or equity markets, or the inaccuracy of any of our significant assumptions underlying the estimates of our subsidiaries' pension plan obligations, could result in an increase in pension expense and future funding requirements, which may be material. Our subsidiaries who participate in these plans are responsible for satisfying the funding requirements required by law in their respective jurisdiction for any shortfall of pension plan assets compared to pension obligations under the pension plan. This may necessitate additional cash contributions to the pension plans that could adversely affect the Parent Company and our subsidiaries' liquidity.
For additional information regarding the funding position of the Company's pension plans, see Item 7.—
Management's Discussion and Analysis of Financial Condition and Results of Operations
—
Critical Accounting Policies and Estimates
—
Pension and Other Postretirement Plans
and Note 15—
Benefit Plans
included in Item 8.—
Financial Statements and Supplementary Data
included in this Form 10-K.
65
Our business is subject to substantial development uncertainties.
Certain of our subsidiaries and affiliates are in various stages of developing and constructing power plants, some but not all of which have signed long-term contracts or made similar arrangements for the sale of electricity. Successful completion depends upon overcoming substantial risks, including, but not limited to, risks relating to siting, financing, engineering and construction, permitting, governmental approvals, commissioning delays, or the potential for termination of the power sales contract as a result of a failure to meet certain milestones. For additional information regarding our projects under construction see Item 1.—
Business
—
Our Organization and Segments
included in this Form 10-K.
In certain cases, our subsidiaries may enter into obligations in the development process even though the subsidiaries have not yet secured financing, power purchase arrangements, or other aspects of the development process. For example, in certain cases, our subsidiaries may instruct contractors to begin the construction process or seek to procure equipment even where they do not have financing or a power purchase agreement in place (or conversely, to enter into a power purchase, procurement or other agreement without financing in place). If the project does not proceed, our subsidiaries may remain obligated for certain liabilities even though the project will not proceed. Development is inherently uncertain and we may forgo certain development opportunities and we may undertake significant development costs before determining that we will not proceed with a particular project. We believe that capitalized costs for projects under development are recoverable; however, there can be no assurance that any individual project will be completed and reach commercial operation. If these development efforts are not successful, we may abandon a project under development and write off the costs incurred in connection with such project. At the time of abandonment, we would expense all capitalized development costs incurred in connection therewith and could incur additional losses associated with any related contingent liabilities.
In some of our joint venture projects and businesses, we have granted protective rights to minority shareholders or we own less than a majority of the equity in the project or business and do not manage or otherwise control the project or business, which entails certain risks.
We have invested in some joint ventures where our subsidiaries share operational, management, investment and/or other control rights with our joint venture partners. In many cases, we may exert influence over the joint venture pursuant to a management contract, by holding positions on the board of the joint venture company or on management committees and/or through certain limited governance rights, such as rights to veto significant actions. However, we do not always have this type of influence over the project or business in every instance and we may be dependent on our joint venture partners or the management team of the joint venture to operate, manage, invest or otherwise control such projects or businesses. Our joint venture partners or the management team of our joint ventures may not have the level of experience, technical expertise, human resources, management and other attributes necessary to operate these projects or businesses optimally, and they may not share our business priorities. In some joint venture agreements where we do have majority control of the voting securities, we have entered into shareholder agreements granting protective minority rights to the other shareholders.
The approval of joint venture partners also may be required for us to receive distributions of funds from jointly owned entities or to transfer our interest in projects or businesses. The control or influence exerted by our joint venture partners may result in operational management and/or investment decisions which are different from the decisions our subsidiaries would make if they operated independently and could impact the profitability and value of these joint ventures. In addition, in the event that a joint venture partner becomes insolvent or bankrupt or is otherwise unable to meet its obligations to the joint venture or its share of liabilities at the joint venture, we may be subject to joint and several liability for these joint ventures, if and to the extent provided for in our governing documents or applicable law.
Our renewable energy projects and other initiatives face considerable uncertainties including, development, operational and regulatory challenges.
Wind generation, our solar projects and our investments in projects such as energy storage are subject to substantial risks. Projects of this nature have been developed through advancement in technologies which may not be proven or whose commercial application is limited, and which are unrelated to our core business. Some of these business lines are dependent upon favorable regulatory incentives to support continued investment, and there is significant uncertainty about the extent to which such favorable regulatory incentives will be available in the future.
Furthermore, production levels for our wind and solar projects may be dependent upon adequate wind or sunlight resulting in volatility in production levels and profitability. For example, for our wind projects, wind resource estimates are based on historical experience when available and on wind resource studies conducted by an independent engineer, and are not expected to reflect actual wind energy production in any given year.
66
As a result, these types of renewable energy projects face considerable risk relative to our core business, including the risk that favorable regulatory regimes expire or are adversely modified. In addition, because certain of these projects depend on technology outside of our expertise in generation and utility businesses, there are risks associated with our ability to develop and manage such projects profitably. Furthermore, at the development or acquisition stage, because of the nascent nature of these industries or the limited experience with the relevant technologies, our ability to predict actual performance results may be hindered and the projects may not perform as predicted. There are also risks associated with the fact that some of these projects exist in markets where long-term fixed price contracts for the major cost and revenue components may be unavailable, which in turn may result in these projects having relatively high levels of volatility. Even where available, many of our renewable projects sell power under a Feed-in-Tariff, which may be eliminated or reduced, which can impact the profitability of these projects, or make money through the sale of Emission Reductions products, such as Certified Emissions Reductions, Renewable Energy Certificates or Renewable Obligation Certificates, and the price of these products may be volatile. These projects can be capital-intensive and generally are designed with a view to obtaining third party financing, which may be difficult to obtain. As a result, these capital constraints may reduce our ability to develop these projects or obtain third party financing for these projects.
Impairment of goodwill or long-lived assets would negatively impact our consolidated results of operations and net worth.
As of
December 31, 2016
, the Company had approximately
$1.2 billion
of goodwill, which represented approximately
3.2%
of the total assets on its Consolidated Balance Sheets. Goodwill is not amortized, but is evaluated for impairment at least annually, or more frequently if impairment indicators are present. We may be required to evaluate the potential impairment of goodwill outside of the required annual evaluation process if we experience situations, including but not limited to: deterioration in general economic conditions, or our operating or regulatory environment; increased competitive environment; increase in fuel costs, particularly when we are unable to pass through the impact to customers; negative or declining cash flows; loss of a key contract or customer, particularly when we are unable to replace it on equally favorable terms; divestiture of a significant component of our business; or adverse actions or assessments by a regulator. These types of events and the resulting analyses could result in goodwill impairment, which could substantially affect our results of operations for those periods. Additionally, goodwill may be impaired if our acquisitions do not perform as expected. See the risk factor
Our acquisitions may not perform as expected
for further discussion.
Long-lived assets are initially recorded at fair value and are amortized or depreciated over their estimated useful lives. Long-lived assets are evaluated for impairment only when impairment indicators, similar to those described above for goodwill, are present, whereas goodwill is also evaluated for impairment on an annual basis.
Certain of our businesses are sensitive to variations in weather.
Our businesses are affected by variations in general weather patterns and unusually severe weather. Our businesses forecast electric sales on the basis of normal weather, which represents a long-term historical average. While we also consider possible variations in normal weather patterns and potential impacts on our facilities and our businesses, there can be no assurance that such planning can prevent these impacts, which can adversely affect our business. Generally, demand for electricity peaks in winter and summer. Typically, when winters are warmer than expected and summers are cooler than expected, demand for energy is lower, resulting in less demand for electricity than forecasted. Significant variations from normal weather where our businesses are located could have a material impact on our results of operations.
In addition, we are dependent upon hydrological conditions prevailing from time to time in the broad geographic regions in which our hydroelectric generation facilities are located. If hydrological conditions result in droughts or other conditions that negatively affect our hydroelectric generation business, our results of operations could be materially adversely affected.
Information security breaches could harm our business.
A security breach of our information technology systems or plant control systems used to manage and monitor operations could impact the reliability of our generation fleets and/or the reliability of our transmission and distribution systems. A security breach that impairs our technology infrastructure could disrupt normal business operations and affect our ability to control our transmission and distribution assets, access customer information and limit our communications with third parties. Our security measures may not prevent such security breaches. Any loss or corruption of confidential or proprietary data through a breach could impair our reputation, expose us to legal claims, or impact our ability to make collections or otherwise impact our operations, and materially adversely affect our business and results of operations.
67
Our acquisitions may not perform as expected.
Historically, acquisitions have been a significant part of our growth strategy. We may continue to grow our business through acquisitions. Although acquired businesses may have significant operating histories, we will have a limited or no history of owning and operating many of these businesses and possibly limited or no experience operating in the country or region where these businesses are located. Some of these businesses may have been government owned and some may be operated as part of a larger integrated utility prior to their acquisition. If we were to acquire any of these types of businesses, there can be no assurance that:
|
•
|
we will be successful in transitioning them to private ownership;
|
|
•
|
such businesses will perform as expected;
|
|
•
|
integration or other one-time costs will not be greater than expected;
|
|
•
|
we will not incur unforeseen obligations or liabilities;
|
|
•
|
such businesses will generate sufficient cash flow to support the indebtedness incurred to acquire them or the capital expenditures needed to develop them; or
|
|
•
|
the rate of return from such businesses will justify our decision to invest capital to acquire them.
|
Risks associated with Governmental Regulation and Laws
Our operations are subject to significant government regulation and our business and results of operations could be adversely affected by changes in the law or regulatory schemes.
Our ability to predict, influence or respond appropriately to changes in law or regulatory schemes, including any ability to obtain expected or contracted increases in electricity tariff or contract rates or tariff adjustments for increased expenses, could adversely impact our results of operations or our ability to meet publicly announced projections or analysts' expectations. Furthermore, changes in laws or regulations or changes in the application or interpretation of regulatory provisions in jurisdictions where we operate, particularly at our utilities where electricity tariffs are subject to regulatory review or approval, could adversely affect our business, including, but not limited to:
|
•
|
changes in the determination, definition or classification of costs to be included as reimbursable or pass-through costs to be included in the rates we charge our customers, including but not limited to costs incurred to upgrade our power plants to comply with more stringent environmental regulations;
|
|
•
|
changes in the determination of what is an appropriate rate of return on invested capital or a determination that a utility's operating income or the rates it charges customers are too high, resulting in a reduction of rates or consumer rebates;
|
|
•
|
changes in the definition or determination of controllable or non-controllable costs;
|
|
•
|
adverse changes in tax law;
|
|
•
|
changes in law or regulation which limit or otherwise affect the ability of our counterparties (including sovereign or private parties) to fulfill their obligations (including payment obligations) to us or our subsidiaries;
|
|
•
|
changes in environmental law which impose additional costs or limit the dispatch of our generating facilities within our subsidiaries;
|
|
•
|
changes in the definition of events which may or may not qualify as changes in economic equilibrium;
|
|
•
|
changes in the timing of tariff increases;
|
|
•
|
other changes in the regulatory determinations under the relevant concessions;
|
|
•
|
other changes related to licensing or permitting which affect our ability to conduct business; or
|
|
•
|
other changes that impact the short or long term price-setting mechanism in the markets where we operate.
|
Any of the above events may result in lower margins for the affected businesses, which can adversely affect our business.
In many countries where we conduct business, the regulatory environment is constantly changing and it may be difficult to predict the impact of the regulations on our businesses. On July 21, 2010, President Obama signed the Dodd-Frank Act. While the bulk of regulations contained in the Dodd-Frank Act regulate financial institutions and their products, there are several provisions related to corporate governance, executive compensation, disclosure and other matters which relate to public companies generally. The types of provisions described above are currently not expected to have a material impact on the Company or its results of operations. Furthermore, while the Dodd-Frank Act substantially expands the regulation regarding the trading, clearing and reporting of derivative transactions, the Dodd-Frank Act provides for commercial end-user exemptions which may apply to our derivative transactions. However, even with the exemption, the Dodd-Frank Act could still have a material adverse impact on
68
the Company, as the regulation of derivatives (which includes capital and margin requirements for non-exempt companies), could limit the availability of derivative transactions that we use to reduce interest rate, commodity and currency risks, which would increase our exposure to these risks. Even if derivative transactions remain available, the costs to enter into these transactions may increase, which could adversely (1) affect the operating results of certain projects; (2) cause us to default on certain types of contracts where we are contractually obligated to hedge certain risks, such as project financing agreements; (3) prevent us from developing new projects where interest rate hedging is required; (4) cause the Company to abandon certain of its hedging strategies and transactions, thereby increasing our exposure to interest rate, commodity and currency risk; (5) and/or consume substantial liquidity by forcing the Company to post cash and/or other permitted collateral in support of these derivatives. In addition to the Dodd-Frank Act, in 2012, the EMIR became effective. EMIR includes regulations related to the trading, reporting and clearing of derivatives and the impacts described above could also result from our (or our subsidiaries') efforts to comply with EMIR. It is also possible that additional similar regulations may be passed in other jurisdictions where we conduct business. Any of these outcomes could have a material adverse effect on the Company.
Our business in the United States is subject to the provisions of various laws and regulations administered in whole or in part by the FERC and NERC, including PURPA, the Federal Power Act, and the EPAct 2005. Actions by the FERC, NERC and by state utility commissions can have a material effect on our operations.
EPAct 2005 authorizes the FERC to remove the obligation of electric utilities under Section 210 of PURPA to enter into new contracts for the purchase or sale of electricity from or to QFs if certain market conditions are met. Pursuant to this authority, the FERC has instituted a rebuttable presumption that utilities located within the control areas of the Midwest Independent Transmission System Operator, Inc., PJM Interconnection, L.L.C., ISO New England, Inc., the NYISO and the Electric Reliability Council of Texas, Inc. are not required to purchase or sell power from or to QFs above a certain size. In addition, the FERC is authorized under EPAct 2005 to remove the purchase/sale obligations of individual utilities on a case-by-case basis. While this law does not affect existing contracts, as a result of the changes to PURPA, our QFs may face a more difficult market environment when their current long-term contracts expire.
EPAct 2005 repealed PUHCA 1935 and enacted PUHCA 2005 in its place. PUHCA 1935 had the effect of requiring utility holding companies to operate in geographically proximate regions and therefore limited the range of potential combinations and mergers among utilities. By comparison, PUHCA 2005 has no such restrictions and simply provides the FERC and state utility commissions with enhanced access to the books and records of certain utility holding companies. The repeal of PUHCA 1935 removed barriers to mergers and other potential combinations which could result in the creation of large, geographically dispersed utility holding companies. These entities may have enhanced financial strength and therefore an increased ability to compete with us in the U.S. generation market.
In accordance with Congressional mandates in the EPAct 1992 and now in EPAct 2005, the FERC has strongly encouraged competition in wholesale electric markets. Increased competition may have the effect of lowering our operating margins. Among other steps, the FERC has encouraged RTOs and ISOs to develop demand response bidding programs as a mechanism for responding to peak electric demand. These programs may reduce the value of our peaking assets which rely on very high prices during a relatively small number of hours to recover their costs. Similarly, the FERC is encouraging the construction of new transmission infrastructure in accordance with provisions of EPAct 2005. Although new transmission lines may increase market opportunities, they may also increase the competition in our existing markets.
While the FERC continues to promote competition, some state utility commissions have reversed course and begun to encourage the construction of generation facilities by traditional utilities to be paid for on a cost-of-service basis by retail ratepayers. Such actions have the effect of reducing sale opportunities in the competitive wholesale generating markets in which we operate.
FERC has civil penalty authority over violations of any provision of Part II of the FPA which concerns wholesale generation or transmission, as well as any rule or order issued thereunder. FERC is authorized to assess a maximum civil penalty of $1 million per violation for each day that the violation continues. The FPA also provides for the assessment of criminal fines and imprisonment for violations under the FPA. This penalty authority was enhanced in EPAct 2005. With this expanded enforcement authority, violations of the FPA and FERC's regulations could potentially have more serious consequences than in the past.
Pursuant to EPAct 2005, the NERC has been certified by FERC as the Electric Reliability Organization ("ERO") to develop mandatory and enforceable electric system reliability standards applicable throughout the U.S. to improve the overall reliability of the electric grid. These standards are subject to FERC review and approval.
69
Once approved, the reliability standards may be enforced by FERC independently, or, alternatively, by the ERO and regional reliability organizations with responsibility for auditing, investigating and otherwise ensuring compliance with reliability standards, subject to FERC oversight. Monetary penalties of up to $1 million per day per violation may be assessed for violations of the reliability standards.
Our utility businesses in the U.S. face significant regulation by their respective state utility commissions. The regulatory discretion is reasonably broad in both Indiana and Ohio and includes regulation as to services and facilities, the valuation of property, the construction, purchase, or lease of electric generating facilities, the classification of accounts, rates of depreciation, the increase or decrease in retail rates and charges, the issuance of certain securities, the acquisition and sale of some public utility properties or securities and certain other matters. These businesses face the risk of unexpected or adverse regulatory action which could have a material adverse effect on our results of operations, financial condition, and cash flows. See Item 1.—
Business
—
US SBU
—
U.S. Businesses
—
U.S. Utilities
for further information on the regulation faced by our U.S. utilities.
Our businesses are subject to stringent environmental laws and regulations.
Our businesses are subject to stringent environmental laws and regulations by many federal, regional, state and local authorities, international treaties and foreign governmental authorities. These laws and regulations generally concern emissions into the air, effluents into the water, use of water, wetlands preservation, remediation of contamination, waste disposal, endangered species and noise regulation, among others. Failure to comply with such laws and regulations or to obtain or comply with any necessary environmental permits pursuant to such laws and regulations could result in fines or other sanctions. Environmental laws and regulations affecting power generation and distribution are complex and have tended to become more stringent over time. Congress and other domestic and foreign governmental authorities have either considered or implemented various laws and regulations to restrict or tax certain emissions, particularly those involving air emissions and water discharges. See the various descriptions of these laws and regulations contained in Item 1.—
Business
of this Form 10-K. These laws and regulations have imposed, and proposed laws and regulations could impose in the future, additional costs on the operation of our power plants. We have incurred and will continue to incur significant capital and other expenditures to comply with these and other environmental laws and regulations. Changes in, or new development of, environmental restrictions may force the Company to incur significant expenses or expenses that may exceed our estimates. There can be no assurance that we would be able to recover all or any increased environmental costs from our customers or that our business, financial condition, including recorded asset values or results of operations, would not be materially and adversely affected by such expenditures or any changes in domestic or foreign environmental laws and regulations.
Our businesses are subject to enforcement initiatives from environmental regulatory agencies.
The EPA has pursued an enforcement initiative against coal-fired generating plants alleging wide-spread violations of the new source review and prevention of significant deterioration provisions of the CAA. The EPA has brought suit against a number of companies and has obtained settlements with many of these companies over such allegations. The allegations typically involve claims that a company made major modifications to a coal-fired generating unit without proper permit approval and without installing best available control technology. The principal, but not exclusive, focus of this EPA enforcement initiative is emissions of SO
2
and NO
x
. In connection with this enforcement initiative, the EPA has imposed fines and required companies to install improved pollution control technologies to reduce emissions of SO
2
and NO
x
. There can be no assurance that foreign environmental regulatory agencies in countries in which our subsidiaries operate will not pursue similar enforcement initiatives under relevant laws and regulations.
Regulators, politicians, non-governmental organizations and other private parties have expressed concern about greenhouse gas, or GHG, emissions and the potential risks associated with climate change and are taking actions which could have a material adverse impact on our consolidated results of operations, financial condition and cash flows.
As discussed in Item 1.—
Business
, at the international, federal and various regional and state levels, rules are in effect and policies are under development to regulate GHG emissions, thereby effectively putting a cost on such emissions in order to create financial incentives to reduce them. In
2016
, the Company's subsidiaries operated businesses which had total CO
2
emissions of approximately 67.7 million metric tonnes, approximately 30.2 million of which were emitted by businesses located in the U.S. (both figures ownership adjusted). The Company uses CO
2
emission estimation methodologies supported by "The Greenhouse Gas Protocol" reporting standard on GHG emissions. For existing power generation plants, CO
2
emissions data are either obtained directly from plant continuous emission monitoring systems or calculated from actual fuel heat inputs and fuel type CO
2
emission factors. The estimated annual CO
2
emissions from fossil fuel electric power generation facilities of the Company's
70
subsidiaries that are in construction or development and have received the necessary air permits for commercial operations are approximately 7.7 million metric tonnes (ownership adjusted). This overall estimate is based on a number of projections and assumptions that may prove to be incorrect, such as the forecasted dispatch, anticipated plant efficiency, fuel type, CO
2
emissions rates and our subsidiaries' achieving completion of such construction and development projects. However, it is certain that the projects under construction or development when completed will increase emissions of our portfolio and therefore could increase the risks associated with regulation of GHG emissions. Because there is significant uncertainty regarding these estimates, actual emissions from these projects under construction or development may vary substantially from these estimates.
The non-utility, generation subsidiaries of the Company often seek to pass on any costs arising from CO
2
emissions to contract counterparties, but there can be no assurance that such subsidiaries of the Company will effectively pass such costs onto the contract counterparties or that the cost and burden associated with any dispute over which party bears such costs would not be burdensome and costly to the relevant subsidiaries of the Company. The utility subsidiaries of the Company may seek to pass on any costs arising from CO
2
emissions to customers, but there can be no assurance that such subsidiaries of the Company will effectively pass such costs to the customers, or that they will be able to fully or timely recover such costs.
Foreign, federal, state or regional regulation of GHG emissions could have a material adverse impact on the Company's financial performance. The actual impact on the Company's financial performance and the financial performance of the Company's subsidiaries will depend on a number of factors, including among others, the degree and timing of GHG emissions reductions required under any such legislation or regulation, the cost of emissions reduction equipment and the price and availability of offsets, the extent to which market based compliance options are available, the extent to which our subsidiaries would be entitled to receive GHG emissions allowances without having to purchase them in an auction or on the open market and the impact of such legislation or regulation on the ability of our subsidiaries to recover costs incurred through rate increases or otherwise. As a result of these factors, our cost of compliance could be substantial and could have a material adverse impact on our results of operations.
In January 2005, based on European Community "Directive 2003/87/EC on Greenhouse Gas Emission Allowance Trading," the EU ETS commenced operation as the largest multi-country GHG emission trading scheme in the world. On February 16, 2005, the Kyoto Protocol became effective. The Kyoto Protocol requires all developed countries that have ratified it to substantially reduce their GHG emissions, including CO
2
. However, the United States never ratified the Kyoto Protocol and, to date, compliance with the Kyoto Protocol and the EU ETS has not had a material adverse effect on the Company's consolidated results of operations, financial condition and cash flows.
In December 2015, the Parties to the United Nations Framework Convention on Climate Change ("UNFCCC") convened for the 21st Conference of the Parties in Paris, France. The result was the so-called Paris Agreement. The Paris Agreement has a long-term goal of keeping the increase in global average temperature to well below 2°C above pre-industrial levels. In furtherance of this goal, participating countries submitted comprehensive national climate action plans and have agreed to meet every five years to set more ambitious targets as required by science, to report to each other and the public on how well they are doing to implement their targets and to track progress towards the long-term goal through a robust transparency and accountability system. We anticipate that the Paris Agreement will continue the trend towards the efforts to de-carbonize the global economy and to further limit GHG emissions, including in those countries where the Company does business. It is difficult to predict the nature, timing and scope of such regulation but it could have a material adverse effect on the Company's financial performance.
In the U.S., there currently is no federal legislation imposing a mandatory GHG emission reduction programs (including for CO
2
) affecting the electric power generation facilities of the Company's subsidiaries. However, the EPA has adopted regulations pertaining to GHG emissions that require new sources of GHG emissions of over 100,000 tons per year, and existing sources planning physical changes that would increase their GHG emissions by more than 75,000 tons per year, to obtain new source review permits from the EPA prior to construction or modification. Additionally, the EPA has promulgated a rule establishing New Source Performance Standards for CO
2
emissions for newly constructed and modified/reconstructed fossil-fueled EUSGUs larger than 25 MW. The EPA has also promulgated a rule, the CPP, which requires existing EUSGUs to begin reducing GHG emissions starting in 2022 with the full reduction requirement in 2030. Under the CPP, states are required to develop and submit plans that establish performance standards or, through emissions trading programs, otherwise meet a state-wide emissions rate average or mass-based goal. For further discussion of the regulation of GHG emission, including the U.S. Supreme Court's issued an order staying implementation of the CPP, see Item 1.
—Business—Environmental and Land-Use Regulations—United States Environmental and Land-Use Legislation and Regulations—Greenhouse Gas Emissions
above.
71
Such regulations, and in particular regulations applying to modified or existing EUSGUs, could increase our costs directly and indirectly and have a material adverse effect on our business and/or results of operations. See Item 1.—
Business
of this Form 10-K for further discussion about these environmental agreements, laws and regulations.
At the state level, the RGGI, a cap-and-trade program covering CO
2
emissions from electric power generation facilities in the Northeast, became effective in January 2009, and California has adopted comprehensive legislation and regulation that requires GHG reductions from multiple industrial sectors, including the electric power generation industry. At this time, other than with regard to RGGI (further described below) and proposed Hawaii regulations relating to the collection of fees on GHG emissions, the impact of both of which we do not expect to be material, the Company cannot estimate the costs of compliance with U.S. federal, regional or state GHG emissions reduction legislation or initiatives, due to the fact that most of these proposals are not being actively pursued or are in the early stages of development and any final regulations or laws, if adopted, could vary drastically from current proposals; in the case of California, we anticipate no material impact due to the fact that we expect such costs will be passed through to our offtakers under the terms of existing tolling agreements.
The auctions of RGGI allowances needed by power generators to comply with state programs implementing RGGI occur approximately every quarter. Our subsidiary in Maryland is our only subsidiary that was subject to RGGI in
2016
. Of the approximately 30.2 million metric tonnes of CO
2
emitted in the United States by our subsidiaries in
2016
(ownership adjusted), approximately 1.1 million metric tonnes were emitted by our subsidiary in Maryland. The Company estimates that the RGGI compliance costs could be approximately $3.2 million for
2017
. There is a risk that our actual compliance costs under RGGI will differ from our estimates by a material amount and that our model could underestimate our costs of compliance.
In addition to government regulators, other groups such as politicians, environmentalists and other private parties have expressed increasing concern about GHG emissions. For example, certain financial institutions have expressed concern about providing financing for facilities which would emit GHGs, which can affect our ability to obtain capital, or if we can obtain capital, to receive it on commercially viable terms. Further, rating agencies may decide to downgrade our credit ratings based on the emissions of the businesses operated by our subsidiaries or increased compliance costs which could make financing unattractive. In addition, plaintiffs have brought tort lawsuits against the Company because of its subsidiaries' GHG emissions. While the litigation mentioned has been dismissed, it is impossible to predict whether similar future lawsuits are likely to prevail or result in damages awards or other relief. Consequently, it is impossible to determine whether such lawsuits are likely to have a material adverse effect on the Company's consolidated results of operations and financial condition.
Furthermore, according to the Intergovernmental Panel on Climate Change, physical risks from climate change could include, but are not limited to, increased runoff and earlier spring peak discharge in many glacier and snow-fed rivers, warming of lakes and rivers, an increase in sea level, changes and variability in precipitation and in the intensity and frequency of extreme weather events. Physical impacts may have the potential to significantly affect the Company's business and operations, and any such potential impact may render it more difficult for our businesses to obtain financing. For example, extreme weather events could result in increased downtime and operation and maintenance costs at the electric power generation facilities and support facilities of the Company's subsidiaries. Variations in weather conditions, primarily temperature and humidity also would be expected to affect the energy needs of customers. A decrease in energy consumption could decrease the revenues of the Company's subsidiaries. In addition, while revenues would be expected to increase if the energy consumption of customers increased, such increase could prompt the need for additional investment in generation capacity. Changes in the temperature of lakes and rivers and changes in precipitation that result in drought could adversely affect the operations of the fossil fuel-fired electric power generation facilities of the Company's subsidiaries. Changes in temperature, precipitation and snow pack conditions also could affect the amount and timing of hydroelectric generation.
In addition to potential physical risks noted by the Intergovernmental Panel on Climate Change, there could be damage to the reputation of the Company and its subsidiaries due to public perception of GHG emissions by the Company's subsidiaries, and any such negative public perception or concerns could ultimately result in a decreased demand for electric power generation or distribution from our subsidiaries. The level of GHG emissions made by subsidiaries of the Company is not a factor in the compensation of executives of the Company.
If any of the foregoing risks materialize, costs may increase or revenues may decrease and there could be a material adverse effect on the electric power generation businesses of the Company's subsidiaries and on the Company's consolidated results of operations, financial condition and cash flows.
72
Tax legislation initiatives or challenges to our tax positions could adversely affect our results of operations and financial condition.
Our subsidiaries have operations in the U.S. and various non-U.S. jurisdictions. As such, we are subject to the tax laws and regulations of the U.S. federal, state and local governments and of many non-U.S. jurisdictions. From time to time, legislative measures may be enacted that could adversely affect our overall tax positions regarding income or other taxes. There can be no assurance that our effective tax rate or tax payments will not be adversely affected by these legislative measures.
For example, the U.S. is considering corporate tax reform that may significantly change corporate tax rates, business rules such as interest deductibility and capital expenditure cost recovery, and U.S. international tax rules. Additionally, longstanding international tax norms that determine how and where cross-border international trade is subjected to tax are evolving. The Organization for Economic Cooperation and Development ("OECD"), in coordination with the G8 and G20, through its Base Erosion and Profit Shifting project (“BEPS") introduced a series of recommendations that many tax jurisdictions have adopted, or may adopt in the future, as law. As these and other tax laws, related regulations and double-tax conventions change, our financial results could be materially impacted. Given the unpredictability of these possible changes and their potential interdependency, it is very difficult to assess whether the overall effect of such potential tax changes would be cumulatively positive or negative for our earnings and cash flow, but such changes could adversely impact our results of operations.
In addition, U.S. federal, state and local, as well as non-U.S., tax laws and regulations are extremely complex and subject to varying interpretations. There can be no assurance that our tax positions will be sustained if challenged by relevant tax authorities and if not sustained, there could be a material impact on our results of operations.
We and our affiliates are subject to material litigation and regulatory proceedings.
We and our affiliates are parties to material litigation and regulatory proceedings. See Item 3.—
Legal Proceedings
below. There can be no assurances that the outcome of such matters will not have a material adverse effect on our consolidated financial position.
None.
We maintain offices in many places around the world, generally pursuant to the provisions of long- and short-term leases, none of which we believe are material. With a few exceptions, our facilities, which are described in Item 1
—Business
of this Form 10-K, are subject to mortgages or other liens or encumbrances as part of the project's related finance facility. In addition, the majority of our facilities are located on land that is leased. However, in a few instances, no accompanying project financing exists for the facility, and in a few of these cases, the land interest may not be subject to any encumbrance and is owned outright by the subsidiary or affiliate.
The Company is involved in certain claims, suits and legal proceedings in the normal course of business. The Company has accrued for litigation and claims where it is probable that a liability has been incurred and the amount of loss can be reasonably estimated. The Company believes, based upon information it currently possesses and taking into account established reserves for estimated liabilities and its insurance coverage, that the ultimate outcome of these proceedings and actions is unlikely to have a material adverse effect on the Company's financial statements. It is reasonably possible, however, that some matters could be decided unfavorably to the Company and could require the Company to pay damages or make expenditures in amounts that could be material but cannot be estimated as of December 31, 2016.
In 1989, Centrais Elétricas Brasileiras S.A. (“Eletrobrás”) filed suit in the Fifth District Court in the state of Rio de Janeiro (“FDC”) against Eletropaulo Eletricidade de São Paulo S.A. (“EEDSP”) relating to the methodology for calculating monetary adjustments under the parties' financing agreement. In April 1999, the FDC found in favor of Eletrobrás and in September 2001, Eletrobrás initiated an execution suit in the FDC to collect approximately
R$2.0 billion
(
$602 million
) from Eletropaulo as estimated by Eletropaulo (or approximately
R$2.6 billion
(
$802 million
) as of September 2016, as estimated by Eletrobrás, and possibly legal costs) and a lesser amount from an unrelated company, Companhia de Transmissão de Energia Elétrica Paulista (“CTEEP”) (Eletropaulo and CTEEP were spun off of EEDSP pursuant to its privatization in 1998). In November 2002, the FDC rejected Eletropaulo's defenses in the execution suit. On appeal, the case was remanded to the FDC for further proceedings to determine whether Eletropaulo is liable for the debt. In December 2012, the FDC issued a decision that Eletropaulo is liable for the
73
debt. However, that decision was annulled on appeal and the case was remanded to the FDC for further proceedings. On remand at the FDC, the FDC appointed an accounting expert to analyze the issues in the case. In September 2015, the expert issued a preliminary report concluding that Eletropaulo is liable for the debt, without quantifying the debt. Eletropaulo thereafter submitted questions to the expert and reports rebutting the expert's preliminary report. In April 2016, Eletrobrás requested that the expert determine both the criteria to calculate the debt and the amount of the debt. The FDC is considering whether the criteria can be determined by the expert or must be determined by the FDC. After that issue is resolved,
t
he expert may issue a final report. Ultimately, a decision will be issued by the FDC, which will be free to reject or adopt in whole or in part the expert's report. If the FDC again determines that Eletropaulo is liable for the debt, Eletrobrás will be entitled to resume the execution suit in the FDC. If Eletrobrás does so, Eletropaulo will be required to provide security for its alleged liability. In addition, in February 2008, CTEEP filed a lawsuit in the FDC against Eletrobrás and Eletropaulo seeking a declaration that CTEEP is not liable for any debt under the financing agreement. Eletropaulo believes it has meritorious defenses to the claims asserted against it and will defend itself vigorously in these proceedings; however, there can be no assurances that it will be successful in its efforts. If Eletrobrás requests the seizure of the security noted above and the FDC grants such request (or if a court determines that Eletropaulo is liable for the debt), Eletropaulo's results of operations may be materially adversely affected and, in turn, the Company's results of operations may also be materially adversely affected. Eletropaulo and the Company could face a loss of earnings and/or cash flows and may have to provide loans or equity to support affected businesses or projects, restructure them, write down their value, and/or face the possibility that Eletropaulo cannot continue operations or provide returns consistent with our expectations, any of which could have a material impact on the Company.
In September 1996, a public civil action was asserted against Eletropaulo and Associação Desportiva Cultural Eletropaulo (the “Associação”) relating to alleged environmental damage caused by construction of the Associação near Guarapiranga Reservoir. The initial decision that was upheld by the Appellate Court of the state of São Paulo in 2006 found that Eletropaulo should repair the alleged environmental damage by demolishing certain construction and reforesting the area, and either sponsor an environmental project which would cost approximately
R$2 million
(
$614 thousand
) as of December 31, 2015, or pay an indemnification amount of approximately
R$15 million
(
$5 million
). Eletropaulo has appealed this decision to the Supreme Court and the Supreme Court affirmed the decision of the Appellate Court. Following the Supreme Court's decision, the case has been remanded to the court of first instance for further proceedings and to monitor compliance by the defendants with the terms of the decision. In January 2014, Eletropaulo informed the court that it intended to comply with the court's decision by donating a green area inside a protection zone and restore watersheds, the aggregate cost of which is expected to be approximately
R$2 million
(
$614 thousand
). Eletropaulo also requested that the court add the current owner of the land where the Associação facilities are located, Empresa Metropolitana de Águas e Energia S.A. (“EMAE”), as a party to the lawsuit and order EMAE to perform the demolition and reforestation aspects of the court's decision. In July 2014, the court requested the Secretary of the Environment for the State of São Paulo to notify the court of its opinion regarding the acceptability of the green areas to be donated by Eletropaulo to the State of São Paulo. In January 2015, the Secretary of the Environment for the State of São Paulo notified Eletropaulo and the court that it would not accept Eletropaulo's proposed green areas donation. Instead of such green areas donation, the Secretary of the Environment proposed in March 2015 that Eletropaulo undertake an environmental project to offset the alleged environmental damage. Since March 2015, Eletropaulo and the Secretary of Environment have been working together to define an environmental project, which will be submitted for approval by the Public Prosecutor. The cost of such project is currently estimated to be
R$3 million
(
$1 million
).
In December 2001, GRIDCO served a notice to arbitrate pursuant to the Indian Arbitration and Conciliation Act of 1996 on the Company, AES Orissa Distribution Private Limited (“AES ODPL”), and Jyoti Structures (“Jyoti”) pursuant to the terms of the shareholders agreement between GRIDCO, the Company, AES ODPL, Jyoti and the Central Electricity Supply Company of Orissa Ltd. (“CESCO”), an affiliate of the Company. In the arbitration, GRIDCO asserted that a comfort letter issued by the Company in connection with the Company's indirect investment in CESCO obligates the Company to provide additional financial support to cover all of CESCO's financial obligations to GRIDCO. GRIDCO appeared to be seeking approximately $189 million in damages, plus undisclosed penalties and interest, but a detailed alleged damage analysis was not filed by GRIDCO. The Company counterclaimed against GRIDCO for damages. In June 2007, a 2-to-1 majority of the arbitral tribunal rendered its award rejecting GRIDCO's claims and holding that none of the respondents, the Company, AES ODPL, or Jyoti, had any liability to GRIDCO. The respondents' counterclaims were also rejected. A majority of the tribunal later awarded the respondents, including the Company, some of their costs relating to the arbitration. GRIDCO filed challenges of the tribunal's awards with the local Indian court. GRIDCO's challenge of the costs award has been dismissed by the court, but its challenge of the liability award remains pending. The Company believes that it has
74
meritorious defenses to the claims asserted against it and will defend itself vigorously in these proceedings; however, there can be no assurances that it will be successful in its efforts.
In March 2003, the office of the Federal Public Prosecutor for the State of São Paulo, Brazil (“MPF”) notified Eletropaulo that it had commenced an inquiry into the BNDES financings provided to AES Elpa and AES Transgás, the rationing loan provided to Eletropaulo, changes in the control of Eletropaulo, sales of assets by Eletropaulo, and the quality of service provided by Eletropaulo to its customers. The MPF requested various documents from Eletropaulo relating to these matters. In July 2004, the MPF filed a public civil lawsuit in the Federal Court of São Paulo (“FCSP”) alleging that BNDES violated Law 8429/92 (“the Administrative Misconduct Act”) and BNDES's internal rules by: (1) approving the AES Elpa and AES Transgás loans; (2) extending the payment terms on the AES Elpa and AES Transgás loans; (3) authorizing the sale of Eletropaulo's preferred shares at a stock-market auction; (4) accepting Eletropaulo's preferred shares to secure the loan provided to Eletropaulo; and (5) allowing the restructurings of Light Serviços de Eletricidade S.A. and Eletropaulo. The MPF also named AES Elpa and AES Transgás as defendants in the lawsuit because they allegedly benefited from BNDES's alleged violations. In May 2006, the FCSP ruled that the MPF could pursue its claims based on the first, second, and fourth alleged violations noted above. The MPF subsequently filed an interlocutory appeal with the Federal Court of Appeals (“FCA”) seeking to require the FCSP to consider all five alleged violations. In April 2015, the FCA issued a decision holding that the FCSP should consider all five alleged violations. AES Elpa and AES Brasiliana (the successor of AES Transgás) have appealed the April 2015 decision to the Superior Court of Justice. The lawsuit remains pending before the FCSP. AES Elpa and AES Brasiliana believe they have meritorious defenses to the allegations asserted against them and will defend themselves vigorously in these proceedings; however, there can be no assurances that they will be successful in their efforts.
Pursuant to their environmental audit, AES Sul and AES Florestal discovered 200 barrels of solid creosote waste and other contaminants at a pole factory that AES Florestal had been operating. The conclusion of the audit was that a prior operator of the pole factory, Companhia Estadual de Energia (“CEEE”), had been using those contaminants to treat the poles that were manufactured at the factory. On their initiative, AES Sul and AES Florestal communicated with Brazilian authorities and CEEE about the adoption of containment and remediation measures. In March 2008, the State Attorney of the state of Rio Grande do Sul, Brazil filed a public civil action against AES Sul, AES Florestal and CEEE seeking an order requiring the companies to recover the contaminated area located on the grounds of the pole factory and an indemnity payment of approximately
R$6 million
(
$2 million
) to the state's Environmental Fund. In October 2011, the State Attorney Office filed a request for an injunction ordering the defendant companies to contain and remove the contamination immediately. The court granted injunctive relief on October 18, 2011, but determined only that defendant CEEE was required to proceed with the removal work. In May 2012, CEEE began the removal work in compliance with the injunction. The removal costs are estimated to be approximately
R$60 million
(
$18 million
) and the work was completed in February 2014. In parallel with the removal activities, a court-appointed expert investigation took place, which was concluded in May 2014. The court-appointed expert final report was presented to the State Attorneys in October 2014, and in January 2015 to the defendant companies. In March 2015, AES Sul and AES Florestal submitted comments and supplementary questions regarding the expert report. The Company believes that it has meritorious defenses to the claims asserted against it and will defend itself vigorously in these proceedings; however, there can be no assurances that it will be successful in its efforts.
In March 2009, AES Uruguaiana Empreendimentos S.A. (“AESU”) in Brazil initiated arbitration against YPF S.A. (“YPF”) seeking damages and other relief relating to YPF's breach of the parties' gas supply agreement (“GSA”). Thereafter, in April 2009, YPF initiated arbitration against AESU and two unrelated parties, Companhia de Gas do Estado do Rio Grande do Sul and Transportador de Gas del Mercosur S.A. (“TGM”), claiming that AESU wrongfully terminated the GSA and caused the termination of a transportation agreement (“TA”) between YPF and TGM (“YPF Arbitration”). YPF sought an unspecified amount of damages from AESU, a declaration that YPF's performance was excused under the GSA due to certain alleged force majeure events, or, in the alternative, a declaration that the GSA and the TA should be terminated without a finding of liability against YPF because of the allegedly onerous obligations imposed on YPF by those agreements. In addition, in the YPF Arbitration, TGM asserted that if AESU were found liable for terminating the GSA, AESU should also be found liable for TGM's alleged losses, under the TA. In April 2011, the arbitrations were consolidated into a single proceeding. In May 2013, the arbitral tribunal issued an award finding YPF liable to AESU and TGM. Thereafter, in April 2016, the tribunal issued a damages award ordering YPF to pay damages to AESU and TGM. In January 2017, AESU and YPF settled their dispute.
In October 2009, IPL received a NOV and Finding of Violation from the EPA pursuant to the CAA Section 113(a). The NOV alleges violations of the CAA at IPL's three primarily coal-fired electric generating facilities dating back to 1986. The alleged violations primarily pertain to the Prevention of Significant Deterioration and nonattainment
75
New Source Review requirements under the CAA. IPL management previously met with EPA staff regarding possible resolutions of the NOV. At this time, we cannot predict the ultimate resolution of this matter. However, settlements and litigated outcomes of similar cases have required companies to pay civil penalties, install additional pollution control technology on coal-fired electric generating units, retire existing generating units, and invest in additional environmental projects. A similar outcome in this case could have a material impact to IPL and could, in turn, have a material impact on the Company. IPL would seek recovery of any operating or capital expenditures related to air pollution control technology to reduce regulated air emissions; however, there can be no assurances that it would be successful in that regard.
In June 2011, the São Paulo Municipal Tax Authority (the “Tax Authority”) filed 60 tax assessments in São Paulo administrative court against Eletropaulo, seeking to collect services tax (“ISS”) that allegedly had not been paid on revenues for services rendered by Eletropaulo. Eletropaulo challenged the assessments on the grounds that the revenues at issue were not subject to ISS. In October 2013, the First Instance Administrative Court (“FIAC”) determined that Eletropaulo was liable for ISS, interest, and related penalties totaling approximately
R$3.3 billion
(
$1.0 billion
) as estimated by Eletropaulo. Eletropaulo thereafter appealed to the Second Instance Administrative Court (“SIAC”). In January 2016, the Tax Authority nullified most of the ISS sought from Eletropaulo.In January 2017, the SIAC issued a decision confirming the reduction and rejecting certain other amounts of ISS as time-barred, but finding that Eletropaulo was liable for the remainder of ISS totaling approximately
R$200 million
(
$61 million
). The matter is on appeal before the Municipal Council of Taxes. Eletropaulo believes it has meritorious defenses and will defend itself vigorously in these proceedings; however, there can be no assurances that it will be successful in its efforts.
In January 2012, the Brazil Federal Tax Authority issued an assessment alleging that AES Tietê had paid PIS and COFINS taxes from 2007 to 2010 at a lower rate than the tax authority believed was applicable. AES Tietê challenged the assessment on the grounds that the tax rate was set in the applicable legislation. In April 2013, the FIAC determined that AES Tietê should have calculated the taxes at the higher rate and that AES Tietê was liable for unpaid taxes, interest, and penalties totaling approximately
R$960 million
(
$295 million
) as estimated by AES Tietê. AES Tietê appealed to the SIAC. In January 2015, the SIAC issued a decision in AES Tietê's favor, finding that AES Tietê was not liable for unpaid taxes. The public prosecutor subsequently filed an appeal, which was denied as untimely. The Tax Authority thereafter filed a motion for clarification of the SIAC's decision, which was denied in September 2016. The Tax Authority later filed a special appeal, but that appeal was rejected in October 2017. The Tax Authority has filed an interlocutory appeal, which is pending. AES Tietê believes it has meritorious defenses to the claim and will defend itself vigorously in these proceedings; however, there can be no assurances that it will be successful in its efforts.
In January 2015, DPL received NOVs from the EPA alleging violations of opacity at Stuart and Killen Stations, and in October 2015, IPL received a similar NOV alleging violations at Petersburg Station. In February 2016, IPL received an NOV from the EPA alleging violations of New Source Review (“NSR”) and other CAA regulations, the Indiana SIP, and the Title V operating permit at Petersburg Station. It is too early to determine whether the NOVs could have a material impact on our business, financial condition or results of our operations. IPL would seek recovery of any operating or capital expenditures, but not fines or penalties, related to air pollution control technology to reduce regulated air emissions; however, there can be no assurances that we would be successful in this regard.
In September 2015, AES Southland Development, LLC and AES Redondo Beach, LLC filed a lawsuit against the California Coastal Commission (the “CCC”) over the CCC's determination that the site of AES Redondo Beach included approximately 5.93 acres of CCC-jurisdictional wetlands. The CCC has asserted that AES Redondo Beach has improperly installed and operated water pumps affecting the alleged wetlands in violation of the California Coastal Act and Redondo Beach Local Coastal Program and has ordered AES Redondo Beach to restore the site. Additional potential outcomes of the CCC determination could include an order requiring AES Redondo Beach to fund a wetland mitigation project and/or pay fines or penalties. AES Redondo Beach believes that it has meritorious arguments and intends to vigorously prosecute such lawsuit, but there can be no assurances that it will be successful.
In October 2015, Ganadera Guerra, S.A. (“GG”) and Constructora Tymsa, S.A. (“CT”) filed separate lawsuits against AES Panama in the local courts of Panama. The claimants allege that AES Panama profited from a hydropower facility (La Estrella) being partially located on land owned initially
by GG and currently by CT, and that AES Panama must pay compensation for its use of the land. The damages sought from AES Panama are approximately $685 million (GG) and $100 million (CT). In October 2016, the court dismissed GG's claim because of GG's failure to comply with a court order requiring GG to disclose certain information. It is expected that GG will refile its lawsuit. Also, there are ongoing administrative proceedings concerning whether AES Panama is entitled to
76
acquire an easement over the land and whether AES Panama can continue to occupy the land. AES Panama believes it has meritorious defenses and claims and will assert them
vigorously; however, there can be no assurances that it will be successful in its efforts.
Not applicable.
77
Recent Sales of Unregistered Securities
None.
Purchases of Equity Securities by the Issuer and Affiliated Purchasers
Stock Repurchase Program
— The Board authorization permits the Company to repurchase stock through a variety of methods, including open market repurchases and/or privately negotiated transactions. There can be no assurances as to the amount, timing or prices of repurchases, which may vary based on market conditions and other factors. The Program does not have an expiration date and can be modified or terminated by the Board of Directors at any time. During the year ended
December 31, 2016
, the Company repurchased
8.7 million
shares of its common stock at a total cost of
$79 million
under the existing stock repurchase program. The cumulative repurchase from the commencement of the Program in July 2010 through December 31, 2016 is
154.3 million
shares at a total cost of
$1.9 billion
, at an average price per share of
$12.12
(including a nominal amount of commissions). As of December 31, 2016,
$246 million
remained available for repurchase under the Program.
No repurchases were made by The AES Corporation of its common stock during the fourth quarter of
2016
.
Market Information
Our common stock is traded on the NYSE under the symbol "AES." The closing price of our common stock as reported by the NYSE on
February 17, 2017
, was $11.46 per share. The Company repurchased
8,686,983
, 39,684,131, and 21,900,246 shares of its common stock in
2016
,
2015
and
2014
, respectively. The following tables present the high and low intraday sale prices of our common stock and cash dividends declared for the indicated periods.
|
|
2016
|
2015
|
|||||||||||||||||||||
|
|
Sales Price
|
Cash Dividends
|
Sales Price
|
Cash Dividends
|
|||||||||||||||||||
|
|
High
|
Low
|
Declared
|
High
|
Low
|
Declared
|
|||||||||||||||||
|
First Quarter
|
$
|
11.80
|
|
$
|
8.22
|
|
$
|
0.11
|
|
$
|
13.87
|
|
$
|
11.53
|
|
$
|
—
|
|
|||||
|
Second Quarter
|
12.48
|
|
10.49
|
|
—
|
|
14.02
|
|
12.64
|
|
0.10
|
|
|||||||||||
|
Third Quarter
|
13.32
|
|
11.85
|
|
0.11
|
|
13.40
|
|
9.42
|
|
0.10
|
|
|||||||||||
|
Fourth Quarter
|
12.75
|
|
10.98
|
|
0.23
|
|
11.21
|
|
8.76
|
|
0.21
|
|
|||||||||||
Dividends
The Company commenced a quarterly cash dividend beginning in the fourth quarter of 2012. The Company has increased this dividend annually as displayed below.
|
Commencing the fourth quarter of
|
2016
|
2015
|
2014
|
2013
|
2012
|
|||||
|
Cash dividend
|
$0.12
|
$0.11
|
$0.10
|
$0.05
|
$0.04
|
|||||
The fourth quarter 2016 cash dividend is to be paid beginning in the first quarter of 2017
.
There can be no assurance that the AES Board will declare a dividend in the future or, if declared, the amount of any dividend. Our ability to pay dividends will also depend on receipt of dividends from our various subsidiaries across our portfolio.
Under the terms of our senior secured credit facility, which we entered into with a commercial bank syndicate, we have limitations on our ability to pay cash dividends and/or repurchase stock. Our subsidiaries' ability to declare and pay cash dividends to us is also subject to certain limitations contained in the project loans, governmental provisions and other agreements to which our subsidiaries are subject. See the information contained under Item 12.—
Security Ownership of Certain Beneficial Owners and Management and Related Stockholder Matters
—
Securities Authorized for Issuance under Equity Compensation Plans
of this Form 10-K.
Holders
As of
February 17, 2017
, there were approximately 4,335 record holders of our common stock.
78
Performance Graph
THE AES CORPORATION
PEER GROUP INDEX/STOCK PRICE PERFORMANCE
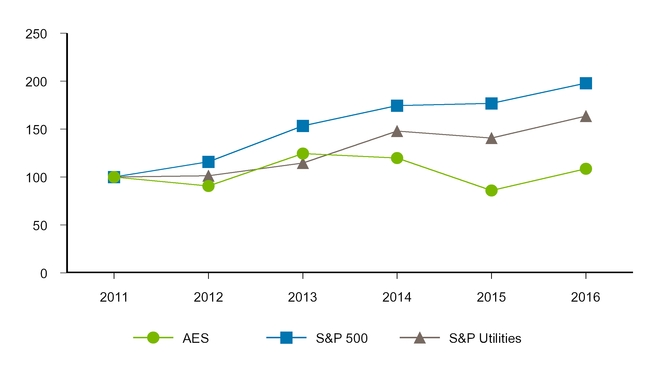
Source: Bloomberg
We have selected the Standard and Poor's ("S&P") 500 Utilities Index as our peer group index. The S&P 500 Utilities Index is a published sector index comprising the 28 electric and gas utilities included in the S&P 500.
The five year total return chart assumes $100 invested on December 31, 2010 in AES Common Stock, the S&P 500 Index and the S&P 500 Utilities Index. The information included under the heading
Performance Graph
shall not be considered "filed" for purposes of Section 18 of the Securities Exchange Act of 1934 or incorporated by reference in any filing under the Securities Act of 1933 or the Securities Exchange Act of 1934.
The following table presents our selected financial data as of the dates and for the periods indicated. You should read this data together with Item 7.—
Management's Discussion and Analysis of Financial Condition and Results of Operations
and the Consolidated Financial Statements and the notes thereto included in Item 8.—
Financial Statements and Supplementary Data
of this Form 10-K. The selected financial data for each of the years in the five year period ended December 31,
2016
have been derived from our audited Consolidated Financial Statements. Prior period amounts have been restated to reflect discontinued operations in all periods presented. Effective July 1, 2014, the Company adopted new accounting guidance on discontinued operations. Please refer to Note
1
in Item 8.—
Financial Statements and Supplementary Data
of this Form 10-K for further explanation. Our historical results are not necessarily indicative of our future results.
Acquisitions, disposals, reclassifications and changes in accounting principles affect the comparability of information included in the tables below. Please refer to the Notes to the Consolidated Financial Statements included in Item 8.—
Financial Statements and Supplementary Data
of this Form 10-K for further explanation of the effect of such activities. Please also refer to Item 1A.—
Risk Factors
of this Form 10-K and Note
26
—
Risks and Uncertainties
to the Consolidated Financial Statements included in Item 8.—
Financial Statements and Supplementary Data
of this Form 10-K for certain risks and uncertainties that may cause the data reflected herein not to be indicative of our future financial condition or results of operations.
79
SELECTED FINANCIAL DATA
|
2016
|
2015
|
2014
|
2013
|
2012
|
|||||||||||||||
|
Statement of Operations Data for the Years Ended December 31:
|
(in millions, except per share amounts)
|
||||||||||||||||||
|
Revenue
|
$
|
13,586
|
|
$
|
14,155
|
|
$
|
16,124
|
|
$
|
15,093
|
|
$
|
16,072
|
|
||||
|
Income (loss) from continuing operations
(1)
|
361
|
|
787
|
|
1,091
|
|
700
|
|
(518
|
)
|
|||||||||
|
Income (loss) from continuing operations attributable to The AES Corporation, net of tax
|
8
|
|
331
|
|
705
|
|
254
|
|
(1,058
|
)
|
|||||||||
|
Income (loss) from discontinued operations attributable to The AES Corporation, net of tax
|
(1,138
|
)
|
(25
|
)
|
64
|
|
(140
|
)
|
146
|
|
|||||||||
|
Net income (loss) attributable to The AES Corporation
|
$
|
(1,130
|
)
|
$
|
306
|
|
$
|
769
|
|
$
|
114
|
|
$
|
(912
|
)
|
||||
|
Per Common Share Data
|
|
|
|
|
|
||||||||||||||
|
Basic earnings (loss) per share:
|
|||||||||||||||||||
|
Income (loss) from continuing operations attributable to The AES Corporation, net of tax
|
$
|
—
|
|
$
|
0.48
|
|
$
|
0.98
|
|
$
|
0.34
|
|
$
|
(1.40
|
)
|
||||
|
Income (loss) from discontinued operations attributable to The AES Corporation, net of tax
|
(1.72
|
)
|
(0.03
|
)
|
0.09
|
|
(0.19
|
)
|
0.19
|
|
|||||||||
|
Basic earnings (loss) per share
|
$
|
(1.72
|
)
|
$
|
0.45
|
|
$
|
1.07
|
|
$
|
0.15
|
|
$
|
(1.21
|
)
|
||||
|
Diluted earnings (loss) per share:
|
|||||||||||||||||||
|
Income (loss) from continuing operations attributable to The AES Corporation, net of tax
|
$
|
—
|
|
$
|
0.48
|
|
$
|
0.97
|
|
$
|
0.34
|
|
$
|
(1.40
|
)
|
||||
|
Income (loss) from discontinued operations attributable to The AES Corporation, net of tax
|
(1.71
|
)
|
(0.04
|
)
|
0.09
|
|
(0.19
|
)
|
0.19
|
|
|||||||||
|
Diluted earnings (loss) per share
|
$
|
(1.71
|
)
|
$
|
0.44
|
|
$
|
1.06
|
|
$
|
0.15
|
|
$
|
(1.21
|
)
|
||||
|
Dividends Declared Per Common Share
|
$
|
0.45
|
|
0.41
|
|
0.25
|
|
0.17
|
|
0.08
|
|
||||||||
|
Cash Flow Data for the Years Ended December 31:
|
|||||||||||||||||||
|
Net cash provided by operating activities
|
$
|
2,884
|
|
$
|
2,134
|
|
$
|
1,791
|
|
$
|
2,715
|
|
$
|
2,901
|
|
||||
|
Net cash used in investing activities
|
(2,108
|
)
|
(2,366
|
)
|
(656
|
)
|
(1,774
|
)
|
(895
|
)
|
|||||||||
|
Net cash provided by (used in) financing activities
|
(747
|
)
|
28
|
|
(1,262
|
)
|
(1,136
|
)
|
(1,867
|
)
|
|||||||||
|
Total (decrease) increase in cash and cash equivalents
|
48
|
|
(260
|
)
|
(119
|
)
|
(253
|
)
|
280
|
|
|||||||||
|
Cash and cash equivalents, ending
|
1,305
|
|
1,257
|
|
1,517
|
|
1,636
|
|
1,889
|
|
|||||||||
|
Balance Sheet Data at December 31:
|
|||||||||||||||||||
|
Total assets
|
$
|
36,119
|
|
$
|
36,470
|
|
$
|
38,562
|
|
$
|
39,981
|
|
$
|
41,498
|
|
||||
|
Non-recourse debt (noncurrent)
|
14,489
|
|
12,943
|
|
13,046
|
|
12,646
|
|
11,734
|
|
|||||||||
|
Non-recourse debt (noncurrent)—Discontinued operations
|
—
|
|
13
|
|
257
|
|
469
|
|
636
|
|
|||||||||
|
Recourse debt (noncurrent)
|
4,671
|
|
4,966
|
|
5,047
|
|
5,485
|
|
5,883
|
|
|||||||||
|
Redeemable stock of subsidiaries
|
782
|
|
538
|
|
78
|
|
78
|
|
78
|
|
|||||||||
|
Retained earnings (accumulated deficit)
|
(1,146
|
)
|
143
|
|
512
|
|
(150
|
)
|
(264
|
)
|
|||||||||
|
The AES Corporation stockholders' equity
|
2,794
|
|
3,149
|
|
4,272
|
|
4,330
|
|
4,569
|
|
|||||||||
_____________________________
|
(1)
|
Includes pretax impairment expense of
$1.1 billion
,
$602 million
,
$383 million
,
$596 million
, and
$1.9 billion
for the years ended December 31,
2016
,
2015
,
2014
,
2013
and
2012
, respectively. See Note
8
—
Other Non-Operating Expense
, Note
9
—
Goodwill and Other Intangible Assets
and Note
20
—
Asset Impairment Expense
included in Item 8.—
Financial Statements and Supplementary Data
of this Form 10-K for further information.
|
Key Topics in Management's Discussion and Analysis
Our discussion covers the following:
|
•
|
Executive Summary
|
|
•
|
Overview of
2016
Results and Strategic Performance
|
|
•
|
Review of Consolidated Results of Operations
|
|
•
|
SBU Performance Analysis
|
|
•
|
Key Trends and Uncertainties
|
|
•
|
Capital Resources and Liquidity
|
Executive Summary
Consolidated Net Cash Provided by Operating Activities for the year ended December 31, 2016 was
$2,884 million
, an increase of
$750 million
compared to the year ended December 31, 2015. The increase was primarily driven by higher collections at the Company’s distribution business in Brazil, Eletropaulo and Sul, and the settlement of overdue receivables at Maritza in Bulgaria. These positive contributions were offset by lower margins across the SBUs (primarily due to lower wholesale prices and lower contributions from regulated customers in the U.S., lower contracted rates in
Tietê
, the prior year liability reversal in Eletropaulo and unfavorable FX in Kazakhstan), as well as the recovery of overdue receivables in the Dominican Republic in 2015, which benefited
80
2015 results. Proportional Free Cash Flow (a non-GAAP financial measure) for the year ended December 31, 2016 increased
$176 million
to
$1,417 million
compared to the year ended December 31, 2015, primarily due to the same factors as Consolidated Net Cash Provided by Operating Activities.
Overview of
2016
Results
Earnings Per Share and Proportional Free Cash Flow Results in
2016
(in millions, except per share amounts)
|
Years Ended December 31,
|
2016
|
2015
|
2014
|
||||||||
|
Diluted earnings per share from continuing operations
|
$
|
—
|
|
$
|
0.48
|
|
$
|
0.97
|
|
||
|
Adjusted earnings per share (a non-GAAP measure)
(1)
|
0.98
|
|
1.25
|
|
1.18
|
|
|||||
|
Net cash provided by operating activities
|
2,884
|
|
2,134
|
|
1,791
|
|
|||||
|
Proportional Free Cash Flow (a non-GAAP measure)
(1) (2)
|
1,417
|
|
1,241
|
|
891
|
|
|||||
_____________________________
|
(1)
|
See reconciliation and definition under
SBU Performance Analysis—Non-GAAP Measures
.
|
|
(2)
|
Disclosure of Proportional Free Cash Flow will be discontinued beginning in the first quarter of 2017. See further discussion under
SBU Performance Analysis—Non-GAAP Measures.
|
Diluted earnings per share from continuing operations
decreased
primarily due to higher impairment expense on long lived assets, lower gains on foreign currency derivatives, lower operating margins at our US, Brazil and Europe SBUs, and lower equity in earnings of affiliates due to the gain earned in 2015 from the restructuring of Guacolda; partially offset by a lower effective tax rate, the absence of goodwill impairment expense in the current year, lower losses on extinguishment of debt and lower share count.
Adjusted EPS, a non-GAAP measure, decreased by
22%
to
$0.98
primarily driven by lower operating margins at our US, Brazil, and Europe SBUs, lower equity in earnings of affiliates due to the gain earned in 2015 from the restructuring of Guacolda; partially offset by a lower adjusted effective tax rate and lower share count.
Net cash provided by operating activities increased by
35%
to
$2.9 billion
primarily driven by an increase in collections at our Brazil utilities, the collection of overdue receivables at Maritza, and lower costs associated with the fulfillment of our service concession arrangement and lower working capital requirements at Mong Duong. These positive impacts were partially offset by the timing of payments at our Brazil utilities for higher energy purchases made in the prior year, collections of overdue receivables in the prior year in the Dominican Republic, and lower net income adjusted for non-cash items.
Proportional free cash flow, a non-GAAP measure, increased by
14%
to
$1.4 billion
primarily driven by an increase in collections at our Brazil utilities, the collection of overdue receivables at Maritza, and lower working capital requirements at Mong Duong. These positive impacts were partially offset by the timing of payments at our Brazil utilities for higher energy purchases made in the prior year, collections of overdue receivables in the prior year in the Dominican Republic, and a decrease in Adjusted Operating Margin (a non-GAAP measure).
81
Review of Consolidated Results of Operations
|
Years Ended December 31,
|
2016
|
2015
|
2014
|
% Change 2016 vs. 2015
|
% Change 2015 vs. 2014
|
||||||||||||
|
(in millions, except per share amounts)
|
|||||||||||||||||
|
Revenue:
|
|||||||||||||||||
|
US SBU
|
$
|
3,429
|
|
$
|
3,593
|
|
$
|
3,826
|
|
-5
|
%
|
-6
|
%
|
||||
|
Andes SBU
|
2,506
|
|
2,489
|
|
2,642
|
|
1
|
%
|
-6
|
%
|
|||||||
|
Brazil SBU
|
3,755
|
|
3,858
|
|
4,987
|
|
-3
|
%
|
-23
|
%
|
|||||||
|
MCAC SBU
|
2,172
|
|
2,353
|
|
2,682
|
|
-8
|
%
|
-12
|
%
|
|||||||
|
Europe SBU
|
918
|
|
1,191
|
|
1,439
|
|
-23
|
%
|
-17
|
%
|
|||||||
|
Asia SBU
|
752
|
|
684
|
|
558
|
|
10
|
%
|
23
|
%
|
|||||||
|
Corporate and Other
|
77
|
|
31
|
|
15
|
|
NM
|
|
NM
|
|
|||||||
|
Intersegment eliminations
|
(23
|
)
|
(44
|
)
|
(25
|
)
|
48
|
%
|
-76
|
%
|
|||||||
|
Total Revenue
|
13,586
|
|
14,155
|
|
16,124
|
|
-4
|
%
|
-12
|
%
|
|||||||
|
Operating Margin:
|
|||||||||||||||||
|
US SBU
|
582
|
|
621
|
|
699
|
|
-6
|
%
|
-11
|
%
|
|||||||
|
Andes SBU
|
634
|
|
618
|
|
587
|
|
3
|
%
|
5
|
%
|
|||||||
|
Brazil SBU
|
239
|
|
592
|
|
634
|
|
-60
|
%
|
-7
|
%
|
|||||||
|
MCAC SBU
|
523
|
|
543
|
|
541
|
|
-4
|
%
|
—
|
%
|
|||||||
|
Europe SBU
|
259
|
|
303
|
|
403
|
|
-15
|
%
|
-25
|
%
|
|||||||
|
Asia SBU
|
170
|
|
149
|
|
76
|
|
14
|
%
|
96
|
%
|
|||||||
|
Corporate and Other
|
15
|
|
33
|
|
53
|
|
-55
|
%
|
-38
|
%
|
|||||||
|
Intersegment eliminations
|
11
|
|
(1
|
)
|
(13
|
)
|
NM
|
|
92
|
%
|
|||||||
|
Total Operating Margin
|
2,433
|
|
2,858
|
|
2,980
|
|
-15
|
%
|
-4
|
%
|
|||||||
|
General and administrative expenses
|
(194
|
)
|
(196
|
)
|
(187
|
)
|
-1
|
%
|
5
|
%
|
|||||||
|
Interest expense
|
(1,431
|
)
|
(1,344
|
)
|
(1,451
|
)
|
6
|
%
|
-7
|
%
|
|||||||
|
Interest income
|
464
|
|
460
|
|
320
|
|
1
|
%
|
44
|
%
|
|||||||
|
Loss on extinguishment of debt
|
(13
|
)
|
(182
|
)
|
(261
|
)
|
-93
|
%
|
-30
|
%
|
|||||||
|
Other expense
|
(103
|
)
|
(58
|
)
|
(65
|
)
|
78
|
%
|
-11
|
%
|
|||||||
|
Other income
|
65
|
|
82
|
|
121
|
|
-21
|
%
|
-32
|
%
|
|||||||
|
Gain on disposal and sale of businesses
|
29
|
|
29
|
|
358
|
|
—
|
%
|
-92
|
%
|
|||||||
|
Goodwill impairment expense
|
—
|
|
(317
|
)
|
(164
|
)
|
NM
|
|
93
|
%
|
|||||||
|
Asset impairment expense
|
(1,096
|
)
|
(285
|
)
|
(91
|
)
|
NM
|
|
NM
|
|
|||||||
|
Foreign currency transaction gains (losses)
|
(15
|
)
|
107
|
|
11
|
|
NM
|
|
NM
|
|
|||||||
|
Other non-operating expense
|
(2
|
)
|
—
|
|
(128
|
)
|
NM
|
|
NM
|
|
|||||||
|
Income tax benefit (expense)
|
188
|
|
(472
|
)
|
(371
|
)
|
NM
|
|
27
|
%
|
|||||||
|
Net equity in earnings of affiliates
|
36
|
|
105
|
|
19
|
|
-66
|
%
|
NM
|
|
|||||||
|
INCOME FROM CONTINUING OPERATIONS
|
361
|
|
787
|
|
1,091
|
|
-54
|
%
|
-28
|
%
|
|||||||
|
Income (loss) from operations of discontinued businesses
|
(19
|
)
|
(25
|
)
|
111
|
|
-24
|
%
|
NM
|
|
|||||||
|
Net loss from disposal and impairments of discontinued operations
|
(1,119
|
)
|
—
|
|
(55
|
)
|
NM
|
|
NM
|
|
|||||||
|
NET INCOME (LOSS)
|
(777
|
)
|
762
|
|
1,147
|
|
NM
|
|
-34
|
%
|
|||||||
|
Noncontrolling interests:
|
|||||||||||||||||
|
(Income) from continuing operations attributable to noncontrolling interests
|
(364
|
)
|
(456
|
)
|
(386
|
)
|
-20
|
%
|
18
|
%
|
|||||||
|
Net loss attributable to redeemable stocks of subsidiaries
|
11
|
|
—
|
|
—
|
|
NM
|
|
NM
|
|
|||||||
|
Loss from discontinued operations attributable to noncontrolling interests
|
—
|
|
—
|
|
8
|
|
NM
|
|
NM
|
|
|||||||
|
NET INCOME (LOSS) ATTRIBUTABLE TO THE AES CORPORATION
|
$
|
(1,130
|
)
|
$
|
306
|
|
$
|
769
|
|
NM
|
|
-60
|
%
|
||||
|
AMOUNTS ATTRIBUTABLE TO THE AES CORPORATION COMMON STOCKHOLDERS:
|
|
|
|||||||||||||||
|
Income from continuing operations, net of tax
|
$
|
8
|
|
$
|
331
|
|
$
|
705
|
|
-98
|
%
|
-53
|
%
|
||||
|
Income (loss) from discontinued operations, net of tax
|
(1,138
|
)
|
(25
|
)
|
64
|
|
NM
|
|
NM
|
|
|||||||
|
NET INCOME (LOSS) ATTRIBUTABLE TO THE AES CORPORATION
|
$
|
(1,130
|
)
|
$
|
306
|
|
$
|
769
|
|
NM
|
|
-60
|
%
|
||||
|
Net cash provided by operating activities
|
$
|
2,884
|
|
$
|
2,134
|
|
$
|
1,791
|
|
35
|
%
|
19
|
%
|
||||
|
DIVIDENDS DECLARED PER COMMON SHARE
|
$
|
0.45
|
|
$
|
0.41
|
|
$
|
0.25
|
|
10
|
%
|
64
|
%
|
||||
_____________________________
NM — Not meaningful
Components of Revenue, Cost of Sales and Operating Margin —
Revenue includes revenue earned from the sale of energy from our utilities and the production of energy from our generation plants, which are classified as regulated and non-regulated, respectively, on the Consolidated Statements of Operations. Revenue also includes the gains or losses on derivatives associated with the sale of electricity.
Cost of sales includes costs incurred directly by the businesses in the ordinary course of business. Examples include electricity and fuel purchases, operations & maintenance costs, depreciation and amortization expense, bad debt expense and recoveries, and general administrative and support costs (including employee-related costs directly associated with the operations of the business). Cost of sales also includes the gains or losses on derivatives (including embedded derivatives other than foreign currency embedded derivatives) associated with the purchase of electricity or fuel.
Operating margin is defined as revenue less cost of sales.
82
Consolidated Revenue and Operating Margin
(in millions)
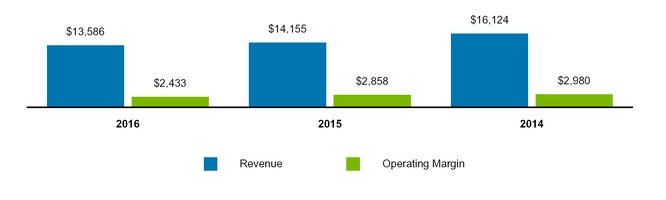
Year Ended
December 31, 2016
Consolidated Revenue
—
Revenue
decrease
d in
2016
compared to
2015
primarily due to:
|
•
|
Unfavorable
FX impacts of
$511 million
, primarily in Brazil of $
213 million
, Argentina of $94 million, Kazakhstan of $63 million and Colombia of $54 million.
|
|
•
|
Brazil due to lower rates for energy sold in Brazil under new contracts at Tietê; operations in 2015 but not in 2016 at Uruguiana; the reversal of a contingent regulatory liability in 2015, and lower demand, partially offset by the annual tariff adjustment at Eletropaulo.
|
|
•
|
Lower pass-through costs at El Salvador and IPP4 in Jordan, the sale of DPLER in January 2016, and lower rates at DPL.
|
These decreases were partially offset by:
|
•
|
The full operations at Mong Duong in 2016 compared to Unit 1 in March 2015 with principal operations commencing in April 2015
|
|
•
|
The commencement of operations at Cochrane in Chile with Unit 1 operational in July 2016 and principal operations in October).
|
|
•
|
Higher environmental returns and new rate case at IPL.
|
Consolidated Operating Margin
—
Operating margin
decrease
d in
2016
compared to
2015
primarily due to:
|
•
|
Unfavorable
FX impacts of
$80 million
, primarily in Kazakhstan, Argentina, and Colombia.
|
|
•
|
Brazil driven by the revenue drivers above as well as higher fixed costs at Eletropaulo.
|
These decreases were partially offset by:
|
•
|
Higher margin at Gener, impact from full operations at Mong Duong in Vietnam and Cochrane in Chile, and higher margins at IPL as discussed above.
|
Year Ended December 31,
2015
Consolidated Revenue
—
Revenue
decrease
d in
2015
compared to 2014 primarily due to:
|
•
|
Unfavorable FX impacts of $2.2 billion, mainly in Brazil of $1.8 billion, Colombia of $179 million, and Bulgaria of $74 million.
|
|
•
|
US Utilities due to lower volumes primarily at DPL and outages, milder weather, and lower demand at IPL.
|
|
•
|
Lower prices in the Dominican Republic and El Salvador (primarily resulting from lower pass-through costs).
|
These decreases were partially offset by:
|
•
|
Brazil due to higher tariffs at Eletropaulo (including higher pass-through costs) and the reversal of a contingent regulatory liability at Eletropaulo.
|
|
•
|
Higher capacity prices at DPL.
|
|
•
|
Commencement of principal operations at Mong Duong in April 2015.
|
83
Consolidated Operating Margin
—
Operating margin
decrease
d in
2015
compared to 2014 primarily due to:
|
•
|
Unfavorable
FX impacts of
$362 million
, primarily in Brazil of
$228 million
and Colombia of $83 million.
|
|
•
|
Brazil due to lower demand, lower hydrology, and higher fixed costs.
|
|
•
|
The Dominican Republic due to lower prices and lower availability.
|
These decreases were partially offset by:
|
•
|
Higher tariffs in Brazil as discussed above and lower spot prices on energy purchases at Tietê.
|
|
•
|
Higher generation and lower energy purchases driven by improved hydrological conditions in Panama.
|
|
•
|
Higher prices at Chivor driven by a strong El Niño.
|
|
•
|
Higher availability at Gener and Masinloc.
|
See Item 7.
—SBU Performance Analysis
of this Form 10-K for additional discussion and analysis of operating results for each SBU.
Consolidated Results of Operations — Other
General and administrative expenses
General and administrative expenses include expenses related to corporate staff functions and/or initiatives, executive management, finance, legal, human resources and information systems, as well as global development costs.
General and administrative expenses
decrease
d in
2016
from
2015
primarily due to decreased employee-related costs, partially offset by increased business development costs.
General and administrative expenses
increase
d in
2015
from
2014
primarily due to increased business development costs and employee-related costs partially offset by decreased professional fees.
Interest expense
Interest expense
increase
d in 2016 from 2015 primarily due to a
$97 million
increase at Eletropaulo as a result of the prior year reversal of
$64 million
in interest expense, previously recognized on a contingent regulatory liability, and increased interest expense due to higher regulatory liabilities and interest rates in the current year. Additionally, there was a
$26 million
increase at Mong Duong, mainly due to this entity no longer capitalizing interest as a result of the commencement of operations in April 2015. These increases were partially offset by lower interest expense of
$22 million
due to a reduction in debt principal at the Parent Company.
Interest expense
decrease
d in 2015 from 2014 primarily due to lower interest expense of
$63 million
at the Parent Company due to a reduction in debt principal, and a
$64 million
reversal of interest expense previously recognized on a contingent regulatory liability at Eletropaulo. These decreases were partially offset by an increase at Mong Duong as the plant commenced operations in April 2015 and ceased capitalizing interest.
Interest income
Interest income
increase
d in 2016 from 2015 primarily due to higher interest income of
$19 million
recognized on the financing element of the service concession arrangement at Mong Duong, which became fully operational in April 2015, partially offset by lower interest income of
$16 million
in Argentina due to prior year recognition of accumulated interest on VAT balances related to CAMESSA.
Interest income
increase
d in 2015 from 2014 primarily due to interest income of
$114 million
recognized in 2015 on the financing element of the service concession arrangement at Muong Duong, as well as an increase of
$36 million
at Eletropaulo resulting from higher interest rates and an increase in regulatory assets.
Loss on extinguishment of debt was
$13 million
for the
year ended December 31, 2016
primarily related to expense of
$14 million
recognized on debt extinguishment at the Parent Company.
Loss on extinguishment of debt was
$182 million
for the year ended December 31,
2015
. This loss was primarily related to expense of
$105 million
,
$22 million
, and
$19 million
recognized on debt extinguishments at the Parent Company, IPL, and the Dominican Republic, respectively.
Loss on extinguishment of debt was
$261 million
for the year ended December 31, 2014. This was primarily related to expense of
$193 million
,
$31 million
, and
$20 million
recognized on debt extinguishments at the Parent
84
Company, DPL, and Gener, respectively.
Other income and expense
Other income decreased in 2016 from 2015 primarily due to gains on early contract termination in 2015 and lower gains on asset sales in 2016; partially offset by an increase in allowance for funds used during construction as a result of increased construction activity at IPL.
Other income decreased in 2015 from 2014 primarily due to lower gains on asset sales in 2015 and the 2014 reversal of a liability in Kazakhstan due to the expiration of a statute of limitations for the Republic of Kazakhstan to claim payment from AES.
Other expense increased in 2016 from 2015 primarily due to the 2016 recognition a full allowance on a non-trade receivable in the MCAC SBU as a result of payment delays and discussions with the counterparty. The allowance relates to certain reimbursements the Company was expecting in connection with a legal matter. Management believes the counterparty is obligated to pay and plans to continue to attempt to fully collect the non-trade receivable.
Other expense decreased in 2015 from 2014 primarily due to lower losses on sales and disposal of assets at Termo Andes and Eletropaulo.
See Note
19
—
Other Income and Expense
included in Item 8.—
Financial Statements and Supplementary Data
of this Form 10-K for further information.
Gain on disposal and sale of businesses
Gain on sale of businesses was
$29 million
for the year ended
December 31, 2016
, which was primarily related to the gain on sale of DPLER, partially offset by a loss on the deconsolidation of U.K. Wind.
Gain on sale of businesses was
$29 million
for the year ended
December 31, 2015
, which was primarily related to the sale of Armenia Mountain.
Gain on disposal and sale of investments for the year ended December 31,
2014
was
$358 million
, which was primarily related to the sale of 45% of the Company's interest in Masinloc, as well as the sale of U.K. Wind (Operating Projects).
Goodwill impairment expense
There were
no
goodwill impairments for the year ended
December 31, 2016
.
Goodwill impairment expense was
$317 million
for the year ended
December 31, 2015
due to a goodwill impairment at DP&L.
Goodwill impairment expense was
$164 million
for the year ended
December 31, 2014
. This expense consisted of
$136 million
,
$20 million
and
$8 million
of goodwill impairments at DPLER, Buffalo Gap II and Buffalo Gap I, respectively.
See Note
9
—
Goodwill and Other Intangible Assets
included in Item 8.—
Financial Statements and Supplementary Data
of this Form 10-K for further information.
Asset impairment expense
Asset impairment expense was
$1.1 billion
for the year ended
December 31, 2016
. This was primarily related to asset impairments of
$859 million
,
$159 million
and
$77 million
at DPL, Buffalo Gap II and Buffalo Gap I, respectively.
Asset impairment expense was
$285 million
for the year ended
December 31, 2015
primarily due to asset impairments of
$121 million
,
$116 million
and
$37 million
at Kilroot, Buffalo Gap III and U.K. Wind, respectively.
Asset impairment expense was
$91 million
for the year ended
December 31, 2014
primarily due to asset impairments of
$67 million
,
$12 million
and
$12 million
at Ebute, U.K. Wind and DPL, respectively.
See Note
20
—
Asset Impairment Expense
included in Item 8.—
Financial Statements and Supplementary Data
of this Form 10-K for further information.
Income tax expense
Income tax decreased to a benefit of
$188 million
in
2016
as compared to expense of
$472 million
in 2015. The Company's effective tax rates were (
137%
) and
41%
for the years ended
December 31, 2016
and
2015
, respectively.
85
The net
decrease
in the
2016
effective tax rate was due, in part, to the 2016 asset impairments in the U.S. and to the current year benefit related to a restructuring of one of our Brazilian businesses that increases tax basis in long-term assets. Further, the 2015 rate was impacted by the items described below. See Note 20—
Asset Impairment Expense
for additional information regarding the 2016 U.S. asset impairments.
Income tax expense
increase
d
$101 million
, or
27%
, to
$472 million
in
2015
. The Company's effective tax rates were
41%
and
26%
for the years ended December 31,
2015
and
2014
, respectively.
The net
increase
in the
2015
effective tax rate was due, in part, to the nondeductible 2015 impairment of goodwill at our U.S. utility, DP&L and Chilean withholding taxes offset by the release of valuation allowance at certain of our businesses in Brazil, Vietnam and the U.S. Further, the 2014 rate was impacted by the sale of approximately 45% of the Company’s interest in Masin AES Pte Ltd., which owns the Company’s business interests in the Philippines and the 2014 sale of the Company’s interests in four U.K. wind operating projects. Neither of these transactions gave rise to income tax expense. See Note
15
—
Equity
for additional information regarding the sale of approximately 45% of the Company’s interest in Masin-AES Pte Ltd. See Note
23
—
Dispositions
for additional information regarding the sale of the Company’s interests in four U.K. wind operating
projects.
Our effective tax rate reflects the tax effect of significant operations outside the U.S., which are generally taxed at rates lower than the U.S. statutory rate of 35%. A future proportionate change in the composition of income before income taxes from foreign and domestic tax jurisdictions could impact our periodic effective tax rate. The Company also benefits from reduced tax rates in certain countries as a result of satisfying specific commitments regarding employment and capital investment. See Note
21
—
Income Taxes
for additional information regarding these reduced rates.
Foreign currency transaction gains (losses)
Foreign currency transaction gains (losses) in millions were as follows:
|
Years Ended December 31,
|
2016
|
2015
|
2014
|
||||||||
|
AES Corporation
|
$
|
(50
|
)
|
$
|
(31
|
)
|
$
|
(34
|
)
|
||
|
Chile
|
(9
|
)
|
(18
|
)
|
(30
|
)
|
|||||
|
Colombia
|
(8
|
)
|
29
|
|
17
|
|
|||||
|
Mexico
|
(8
|
)
|
(6
|
)
|
(14
|
)
|
|||||
|
Philippines
|
12
|
|
8
|
|
11
|
|
|||||
|
United Kingdom
|
13
|
|
11
|
|
12
|
|
|||||
|
Argentina
|
37
|
|
124
|
|
66
|
|
|||||
|
Other
|
(2
|
)
|
(10
|
)
|
(17
|
)
|
|||||
|
Total
(1)
|
$
|
(15
|
)
|
$
|
107
|
|
$
|
11
|
|
||
_____________________________
|
(1)
|
Includes gains of
$17 million
,
$247 million
and
$172 million
on foreign currency derivative contracts for the years ended December 31,
2016
,
2015
and
2014
, respectively.
|
The Company recognized a net foreign currency transaction loss of
$15 million
for the year ended
December 31, 2016
primarily due to losses of
$50 million
at The AES Corporation mainly due to remeasurement losses on intercompany notes, and losses on swaps and options.
This loss was partially offset by gains of
$37 million
in Argentina, mainly due to the favorable impact of foreign currency derivatives related to government receivables.
The Company recognized a net foreign currency transaction gain of
$107 million
for the year ended
December 31, 2015
primarily due to gains of:
|
•
|
$124 million
in Argentina, due to the favorable impact from foreign currency derivatives related to government receivables, partially offset by losses from the devaluation of the Argentine Peso associated with U.S. Dollar denominated debt, and losses at Termoandes (a U.S. Dollar functional currency subsidiary) primarily associated with cash and accounts receivable balances in local currency,
|
|
•
|
$29 million
in Colombia, mainly due to the depreciation of the Colombian Peso, positively impacting Chivor (a U.S. Dollar functional currency subsidiary) due to liabilities denominated in Colombian Pesos,
|
|
•
|
$11 million
in the United Kingdom, mainly due to the depreciation of the Pound Sterling, resulting in gains at Ballylumford Holdings (a U.S. Dollar functional currency subsidiary) associated with intercompany notes payable denominated in Pound Sterling, and
|
86
These gains were partially offset by losses of:
|
•
|
$31 million
at The AES Corporation primarily due to decreases in the valuation of intercompany notes receivable denominated in foreign currency, resulting from the weakening of the Euro and British Pound during the year, partially offset by gains related to foreign currency option purchases, and
|
|
•
|
$18 million
in Chile primarily due to the devaluation of the Chilean Peso at Gener (a U.S. Dollar functional currency subsidiary) from working capital denominated in Chilean Pesos, partially offset by gains on foreign currency derivatives.
|
The Company recognized a net foreign currency transaction gains of
$11 million
for the
year ended
December 31,
2014
primarily due to gains of:
|
•
|
$66 million
in Argentina, due to the favorable impact from foreign currency derivatives related to government receivables, partially offset by losses from the devaluation of the Argentine Peso associated with U.S. Dollar denominated debt, and losses at Termoandes (a U.S. Dollar functional currency subsidiary) primarily associated with cash and accounts receivable balances in local currency, and the purchase of Argentine sovereign bonds,
|
|
•
|
$17 million
in Colombia, mainly due to a 23% depreciation of the Colombian Peso, positively impacting Chivor (a U.S. Dollar functional currency subsidiary) due to liabilities denominated in Colombian Pesos, primarily income tax payable and accounts payable,
|
|
•
|
$12 million
in the United Kingdom, mainly due to a 6% depreciation of the Pound Sterling, resulting in gains at Ballylumford Holdings (a U.S. Dollar functional currency subsidiary) associated with intercompany notes payable denominated in Pound Sterling, and gains related to foreign currency derivatives, and
|
|
•
|
$11 million
in the Philippines, mainly due to amortization of frozen embedded derivatives and a 4% appreciation of the Philippine Peso against the U.S. Dollar, resulting in a revaluation of cash accounts, customer receivables, and deferred tax asset.
|
These gains were partially offset by losses of:
|
•
|
$34 million
at The AES Corporation primarily due to decreases in the valuation of intercompany notes receivable denominated in foreign currency, resulting from the weakening of the Euro and British Pound during the year, partially offset by gains related to foreign currency option purchases,
|
|
•
|
$30 million
in Chile primarily due to a 16% devaluation of the Chilean Peso, resulting in a $39 million loss at Gener (a U.S. Dollar functional currency subsidiary) from working capital denominated in Chilean Pesos, primarily cash, accounts receivable and VAT receivables, partially offset by income of $9 million on foreign currency derivatives, and
|
|
•
|
$14 million
in Mexico, primarily due to a 13% devaluation of the Mexican Peso, resulting in a loss at TEGTEP and Merida (U.S. Dollar functional currency subsidiaries) from working capital denominated in Pesos (primarily cash, recoverable tax, and VAT).
|
Other non-operating expense
There were no significant non-operating expenses for the years ended
December 31, 2016
and
2015
.
Other non-operating expense was
$128 million
for the year ended December 31, 2014 due to impairments recognized at Entek and Silver Ridge.
See Note
8
—
Other Non-Operating Expense
included in Item 8.—
Financial Statements and Supplementary Data
of this Form 10-K for further information.
Net equity in earnings of affiliates
Net equity in earnings of affiliates
decrease
d in
2016
compared to
2015
as a result of the restructuring of Guacolda in September 2015, which resulted in a
$66 million
benefit. No comparable transaction occurred in 2016.
Net equity in earnings of affiliates
increase
d in
2015
compared to
2014
as a result of the restructuring of Guacolda in September 2015, which resulted in a
$66 million
benefit, as well as the impairment at Elsta in 2014.
See Note
7
—Investments In and Advances to Affiliates included in Item 8.—Financial Statements and Supplementary Data of this Form 10-K for further information.
87
Income from continuing operations attributable to noncontrolling interests
Income from continuing operations attributable to noncontrolling interests
decrease
d in
2016
compared to
2015
as a result of:
|
•
|
a decrease at Tietê due to lower earnings
|
|
•
|
a decrease at Eletropaulo resulting from the the reversal of a contingent regulatory liability in 2015, and
|
|
•
|
asset impairments at Buffalo Gap I and II;
|
Partially offset by:
|
•
|
a lower asset impairment at Buffalo Gap III in 2015, and
|
|
•
|
income tax benefits at Eletropaulo.
|
Income from continuing operations attributable to noncontrolling interests
increase
d in
2015
compared to
2014
as a result of:
|
•
|
an increase at Mong Duong due to commencement of operations in 2015,
|
|
•
|
an increase at Gener primarily due to the restructuring of Guacolda,
|
|
•
|
an increase at Masinloc due to increased earnings in 2015 and the 2014 sale of a noncontrolling interest in that business
|
Partially offset by:
|
•
|
a decrease at Buffalo Gap III resulting from the asset impairment expense allocation to the tax equity partner, and
|
|
•
|
a decrease at Eletropaulo resulting from unfavorable foreign exchange and lower demand.
|
Loss from discontinued operations
Total loss from discontinued operations in
2016
and
2015
was due to the sale of AES Sul. The loss in 2016 includes an after tax loss on impairment of
$382 million
recognized in the second quarter of 2016 and an additional after tax loss on sale of
$737 million
upon disposal of AES Sul in October 2016. There were no significant changes in loss from operations related to the AES Sul discontinued business.
Total income from discontinued operations for the year ended
December 31, 2014
was primarily due to AES Sul, Cameroon, Saurashtra and U.S. wind projects.
See Note
22
—
Discontinued Operations
included in Item 8.—
Financial Statements and Supplementary Data
of this Form 10-K for further information.
Net income (loss) attributable to The AES Corporation
Net income (loss) attributable to The AES Corporation
decrease
d in
2016
compared to
2015
as a result of:
|
•
|
impairments and loss on sale at discontinued businesses;
|
|
•
|
higher impairment expense on long lived assets;
|
|
•
|
lower operating margins at our US, Brazil and Europe SBUs;
|
|
•
|
lower equity in earnings of affiliates due to the 2015 restructuring at Guacolda; and
|
|
•
|
lower gains on foreign currency derivatives.
|
These decreases were partially offset by:
|
•
|
lower effective tax rate;
|
|
•
|
lower debt extinguishment expense; and
|
|
•
|
absence of goodwill impairment expense.
|
Net income attributable to The AES Corporation
decrease
d in
2015
compared to
2014
as result of:
|
•
|
Higher impairment expense
|
|
•
|
Lower gains from the sale of businesses
|
These decreases were partially offset by:
|
•
|
Lower debt extinguishment expense
|
88
SBU Performance Analysis
Non-GAAP Measures
Adjusted Operating Margin, Adjusted PTC, Adjusted EPS, and Proportional Free Cash Flow are non-GAAP supplemental measures that are used by management and external users of our consolidated financial statements such as investors, industry analysts and lenders.
Adjusted Operating Margin
We define Adjusted Operating Margin as Operating Margin, adjusted for the impact of NCI, excluding unrealized gains or losses related to derivative transactions. See
Review of Consolidated Results of Operations
for definitions of Operating Margin and cost of sales.
The GAAP measure most comparable to Adjusted Operating Margin is Operating Margin. We believe that Adjusted Operating Margin better reflects the underlying business performance of the Company. Factors in this determination include the impact of NCI, where AES consolidates the results of a subsidiary that is not wholly owned by the Company, as well as the variability due to unrealized derivatives gains or losses. Adjusted Operating Margin should not be construed as an alternative to Operating Margin, which is determined in accordance with GAAP.
|
Reconciliation of Adjusted Operating Margin (in millions)
|
Years Ended December 31,
|
||||||||||
|
2016
|
2015
|
2014
|
|||||||||
|
Operating Margin
|
$
|
2,433
|
|
$
|
2,858
|
|
$
|
2,980
|
|
||
|
Noncontrolling Interests Adjustment
|
(689
|
)
|
(869
|
)
|
(760
|
)
|
|||||
|
Derivatives Adjustment
|
9
|
|
19
|
|
8
|
|
|||||
|
Total Adjusted Operating Margin
|
$
|
1,753
|
|
$
|
2,008
|
|
$
|
2,228
|
|
||
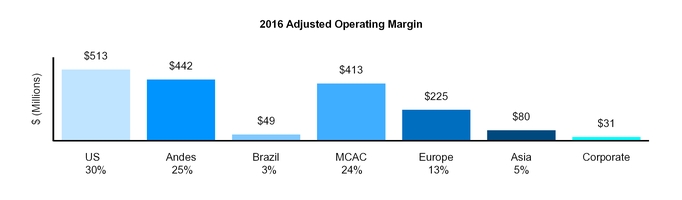
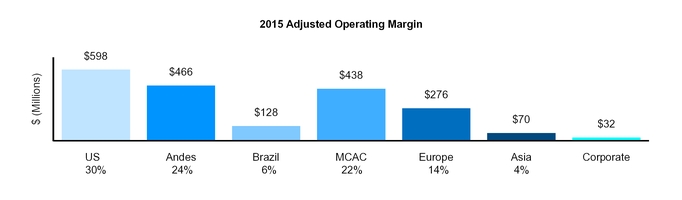
89
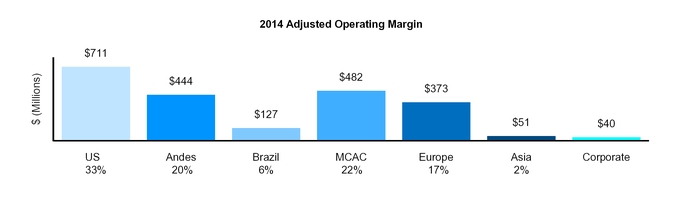
Adjusted PTC
We define Adjusted PTC as pretax income from continuing operations attributable to The AES Corporation excluding gains or losses due to (a) unrealized gains or losses related to derivative transactions, (b) unrealized foreign currency gains or losses, (c) gains or losses due to dispositions and acquisitions of business interests, (d) losses due to impairments, and (e) costs due to the early retirement of debt. Adjusted PTC also includes net equity in earnings of affiliates on an after-tax basis adjusted for the same gains or losses excluded from consolidated entities.
Adjusted PTC reflects the impact of NCI and excludes the items specified in the definition above. In addition to the revenue and cost of sales reflected in Operating Margin, Adjusted PTC includes the other components of our income statement, such as
general and administrative expense
in the corporate segment, as well as business development costs;
interest expense
and
interest income
;
other expense
and
other income
;
realized foreign currency transaction gains and losses
; and
net equity in earnings of affiliates
.
The GAAP measure most comparable to Adjusted PTC is
income from continuing operations attributable to The AES Corporation
. We believe that Adjusted PTC better reflects the underlying business performance of the Company and is considered in the Company's internal evaluation of financial performance. Factors in this determination include the variability due to unrealized gains or losses related to derivative transactions, unrealized foreign currency gains or losses, losses due to impairments and strategic decisions to dispose of or acquire business interests or retire debt, which affect results in a given period or periods. In addition, earnings before tax represents the business performance of the Company before the application of statutory income tax rates and tax adjustments, including the effects of tax planning, corresponding to the various jurisdictions in which the Company operates. Adjusted PTC should not be construed as an alternative to
income from continuing operations attributable to The AES Corporation
, which is determined in accordance with GAAP.
|
Reconciliation of Adjusted PTC (in millions)
|
Years Ended December 31,
|
||||||||||
|
2016
|
2015
|
2014
|
|||||||||
|
Income from continuing operations, net of tax, attributable to The AES Corporation
|
$
|
8
|
|
$
|
331
|
|
$
|
705
|
|
||
|
Income tax (benefit) expense attributable to The AES Corporation
|
(148
|
)
|
275
|
|
179
|
|
|||||
|
Pretax contribution
|
(140
|
)
|
606
|
|
884
|
|
|||||
|
Unrealized derivative (gains) losses
|
(9
|
)
|
(166
|
)
|
(135
|
)
|
|||||
|
Unrealized foreign currency losses
|
23
|
|
96
|
|
110
|
|
|||||
|
Disposition/acquisition (gains) losses
|
6
|
|
(42
|
)
|
(361
|
)
|
|||||
|
Impairment losses
|
933
|
|
504
|
|
415
|
|
|||||
|
Loss on extinguishment of debt
|
29
|
|
179
|
|
274
|
|
|||||
|
Total Adjusted PTC
|
$
|
842
|
|
$
|
1,177
|
|
$
|
1,187
|
|
||
90
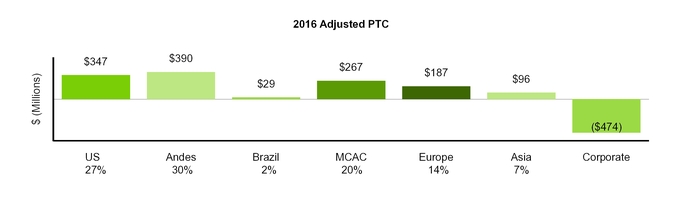
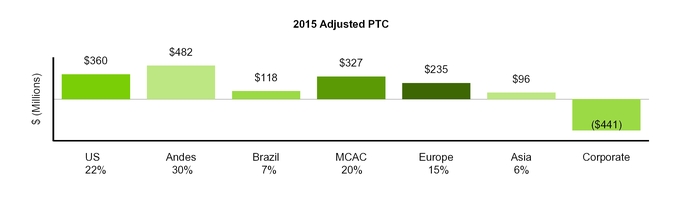
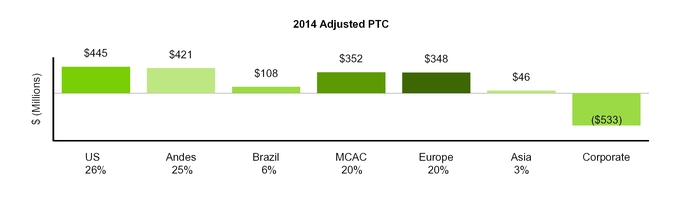
Adjusted EPS
We define Adjusted EPS as diluted earnings per share from continuing operations excluding gains or losses of both consolidated entities and entities accounted for under the equity method due to (a) unrealized gains or losses related to derivative transactions, (b) unrealized foreign currency gains or losses, (c) gains or losses due to dispositions and acquisitions of business interests, (d) losses due to impairments, and (e) costs due to the early retirement of debt.
The GAAP measure most comparable to Adjusted EPS is diluted earnings per share from continuing operations. We believe that Adjusted EPS better reflects the underlying business performance of the Company and is considered in the Company's internal evaluation of financial performance. Factors in this determination include the variability due to unrealized gains or losses related to derivative transactions, unrealized foreign currency gains or losses, losses due to impairments and strategic decisions to dispose of or acquire business interests or retire debt, which affect results in a given period or periods. Adjusted EPS should not be construed as an alternative to diluted earnings per share from continuing operations, which is determined in accordance with GAAP.
91
|
Adjusted EPS
|
Years Ended December 31,
|
|||||||||||
|
2016
|
2015
|
2014
|
||||||||||
|
Diluted earnings per share from continuing operations
|
$
|
—
|
|
$
|
0.48
|
|
$
|
0.97
|
|
|||
|
Unrealized derivative gains
|
(0.02
|
)
|
(0.24
|
)
|
(0.19
|
)
|
||||||
|
Unrealized foreign currency losses
|
0.04
|
|
0.14
|
|
0.16
|
|
||||||
|
Disposition/acquisition (gains) losses
|
0.01
|
|
(1)
|
(0.06
|
)
|
(2)
|
(0.50
|
)
|
(3)
|
|||
|
Impairment losses
|
1.41
|
|
(4)
|
0.73
|
|
(5)
|
0.57
|
|
(6)
|
|||
|
Loss on extinguishment of debt
|
0.05
|
|
(7)
|
0.26
|
|
(8)
|
0.38
|
|
(9)
|
|||
|
Less: Net income tax benefit
|
(0.51
|
)
|
(10)
|
(0.06
|
)
|
(11)
|
(0.21
|
)
|
(12)
|
|||
|
Adjusted EPS
|
$
|
0.98
|
|
$
|
1.25
|
|
$
|
1.18
|
|
|||
_____________________________
|
(1)
|
Amount primarily relates to the loss on deconsolidation of UK Wind of
$20 million
, or
$0.03
per share and losses associated with the sale of Sul of
$10 million
, or
$0.02
; partially offset by the gain on sale of DPLER of
$22 million
, or
$0.03
per share.
|
|
(2)
|
Amount primarily relates to the gains on the sale of Armenia Mountain of
$22 million
, or $
0.03
per share and from the sale of Solar Spain and Solar Italy of
$7 million
, or
$0.01
per share.
|
|
(3)
|
Amount primarily relates to the gain on the sale of a noncontrolling interest in Masinloc of
$283 million
, or
$0.39
per share; and the gain from the sale of the U.K. wind projects of
$78 million
, or
$0.11
per share.
|
|
(4)
|
Amount primarily relates to asset impairments at DPL of
$859 million
, or
$1.30
per share;
$159 million
at Buffalo Gap II (
$49 million
, or
$0.07
per share, net of NCI); and
$77 million
at Buffalo Gap I (
$23 million
, or
$0.03
per share, net of NCI).
|
|
(5)
|
Amount primarily relates to the goodwill impairment at DPL of
$317 million
, or
$0.46
per share, and asset impairments at Kilroot of
$121 million
(
$119 million
, or $
0.17
per share, net of NCI), at Buffalo Gap III of
$116 million
(
$27 million
, or
$0.04
per share, net of NCI), and at U.K. Wind (Development Projects) of
$38 million
(
$30 million
, or $
0.04
per share, net of NCI).
|
|
(6)
|
Amount primarily relates to the goodwill impairments at DPLER of
$136 million
, or
$0.19
per share, and at Buffalo Gap I & II of
$28 million
, or
$0.04
per share; and asset impairments at Ebute of
$67 million
(
$64 million
, or
$0.09
per share, net of NCI), at Elsta of
$41 million
, or
$0.06
per share; and the other-than-temporary impairments at Entek of
$86 million
,
$0.12
per share and at Silver Ridge Power of
$42 million
, or
$0.06
per share.
|
|
(7)
|
Amount primarily relates to the loss on early retirement of debt at the Parent Company of
$19 million
, or
$0.03
per share.
|
|
(8)
|
Amount primarily relates to the loss on early retirement of debt at the Parent Company of
$116 million
, or
$0.17
per share and at IPL of
$22 million
(
$17 million
, or
$0.02
per share, net of NCI).
|
|
(9)
|
Amount primarily relates to the loss on early retirement of debt at the Parent Company of
$200 million
, or
$0.28
per share, at DPL of
$31 million
, or
$0.04
per share, at Angamos of
$20 million
(
$14 million
, or
$0.02
per share, net of NCI) and at U.K. wind projects of
$18 million
, or
$0.02
per share.
|
|
(10)
|
Amount primarily relates to the per share income tax benefit associated with asset impairment of $332 million, or $0.50 per share in the twelve months ended December 31, 2016.
|
|
(11)
|
Amount primarily relates to the per share income tax benefit associated with losses on extinguishment of debt of $55 million, or $0.08 per share in the twelve months ended December 31, 2015.
|
|
(12)
|
Amount primarily relates to the per share income tax benefit associated with losses on extinguishment of debt of
$90 million
, or
$0.12
per share and dispositions/acquisitions of
$67 million
, or
$0.09
per share in the twelve months ended December 31, 2014.
|
Proportional Free Cash Flow
We define proportional free cash flow as cash flows from operating activities less maintenance capital expenditures (including non-recoverable environmental capital expenditures), adjusted for the estimated impact of noncontrolling interests. The proportionate share of cash flows and related adjustments attributable to noncontrolling interests in our subsidiaries comprise the proportional adjustment factor presented in the reconciliation below. Upon the Company's adoption of the accounting guidance for service concession arrangements effective January 1, 2015, capital expenditures related to service concession assets that would have been classified as investing activities on the Consolidated Statement of Cash Flows are now classified as operating activities. See Note 1
—General and Summary of Significant Accounting Policies
of this Form 10-K for further information on the adoption of this guidance.
Beginning in the quarter ended March 31, 2015, the Company changed the definition of proportional free cash flow to exclude the cash flows for capital expenditures related to service concession assets that are now classified within net cash provided by operating activities on the Consolidated Statement of Cash Flows. The proportional adjustment factor for these capital expenditures is presented in the reconciliation below.
We also exclude environmental capital expenditures that are expected to be recovered through regulatory, contractual or other mechanisms. An example of recoverable environmental capital expenditures is IPL's investment in MATS-related environmental upgrades that are recovered through a tracker. See Item 1.
—US SBU—IPL—Environmental Matters
for details of these investments.
The GAAP measure most comparable to proportional free cash flow is cash flows from operating activities. We believe that proportional free cash flow better reflects the underlying business performance of the Company, as it measures the cash generated by the business, after the funding of maintenance capital expenditures, that may be available for investing in growth opportunities or repaying debt. Factors in this determination include the impact of noncontrolling interests, where AES consolidates the results of a subsidiary that is not wholly-owned by the Company.
92
The presentation of free cash flow has material limitations. Proportional free cash flow should not be construed as an alternative to cash from operating activities, which is determined in accordance with GAAP. Proportional free cash flow does not represent our cash flow available for discretionary payments because it excludes certain payments that are required or to which we have committed, such as debt service requirements and dividend payments. Our definition of proportional free cash flow may not be comparable to similarly titled measures presented by other companies.
Beginning in the first quarter of 2017, we will no longer include these non-GAAP proportional free cash flow disclosures that have historically been provided and will instead disclose non-GAAP free cash flows only on a consolidated basis. Our use of proportional free cash flow was intended to provide investors with an understanding of the portion of free cash flows attributable to AES after the impact of non-controlling interests. However, since the concept of a non-controlling interest is not contemplated under GAAP with respect to the statement of cash flows, we will no longer be able to disclose proportional free cash flow in light of recent interpretive guidance issued by the SEC staff.
|
Reconciliation of Proportional Free Cash Flow (in millions)
|
Years Ended December 31,
|
|||||||||||||||||||
|
2016
|
2015
|
2014
|
2016/2015 Change
|
2015/2014 Change
|
||||||||||||||||
|
Net Cash Provided by Operating Activities
|
$
|
2,884
|
|
$
|
2,134
|
|
$
|
1,791
|
|
$
|
750
|
|
$
|
343
|
|
|||||
|
Add: capital expenditures related to service concession assets
(1)
|
29
|
|
165
|
|
—
|
|
(136
|
)
|
165
|
|
||||||||||
|
Adjusted Operating Cash Flow
|
2,913
|
|
2,299
|
|
1,791
|
|
614
|
|
508
|
|
||||||||||
|
Less: proportional adjustment factor on operating cash activities
(2) (3)
|
(1,032
|
)
|
(558
|
)
|
(359
|
)
|
(474
|
)
|
(199
|
)
|
||||||||||
|
Proportional Adjusted Operating Cash Flow
|
1,881
|
|
1,741
|
|
1,432
|
|
140
|
|
309
|
|
||||||||||
|
Less: proportional maintenance capital expenditures, net of reinsurance proceeds
(2)
|
(425
|
)
|
(449
|
)
|
(485
|
)
|
24
|
|
36
|
|
||||||||||
|
Less: proportional non-recoverable environmental capital expenditures
(2) (4)
|
(39
|
)
|
(51
|
)
|
(56
|
)
|
12
|
|
5
|
|
||||||||||
|
Proportional Free Cash Flow
|
$
|
1,417
|
|
$
|
1,241
|
|
$
|
891
|
|
$
|
176
|
|
$
|
350
|
|
|||||
_____________________________
|
(1)
|
Service concession asset expenditures are excluded from the proportional free cash flow non-GAAP metric.
|
|
(2)
|
The proportional adjustment factor, proportional maintenance capital expenditures (net of reinsurance proceeds) and proportional non-recoverable environmental capital expenditures are calculated by multiplying the percentage owned by noncontrolling interests for each entity by its corresponding consolidated cash flow metric and are totaled to the resulting figures. For example, Parent Company A owns 20% of Subsidiary Company B, a consolidated subsidiary. Thus, Subsidiary Company B has an 80% noncontrolling interest. Assuming a consolidated net cash flow from operating activities of $100 from Subsidiary B, the proportional adjustment factor for Subsidiary B would equal $80 (or $100 x 80%). The Company calculates the proportional adjustment factor for each consolidated business in this manner and then sums these amounts to determine the total proportional adjustment factor used in the reconciliation. The proportional adjustment factor may differ from the proportion of income attributable to noncontrolling interests as a result of (a) non-cash items which impact income but not cash and (b) AES' ownership interest in the subsidiary where such items occur.
|
|
(3)
|
Includes proportional adjustment amount for service concession asset expenditures of
$15 million
and
$84 million
for the years ended
December 31, 2016
and
2015
, respectively. The Company adopted service concession accounting effective January 1, 2015.
|
|
(4)
|
Excludes IPL's proportional recoverable environmental capital expenditures of
$132 million
,
$205 million
and
$163 million
for the years ended
December 31, 2016
,
2015
and
2014
, respectively.
|

93
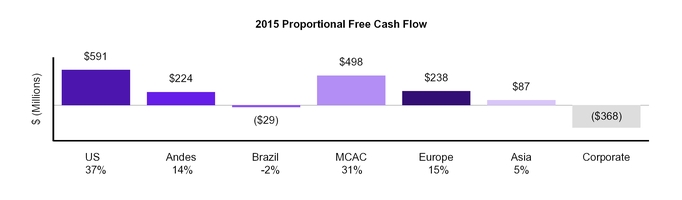
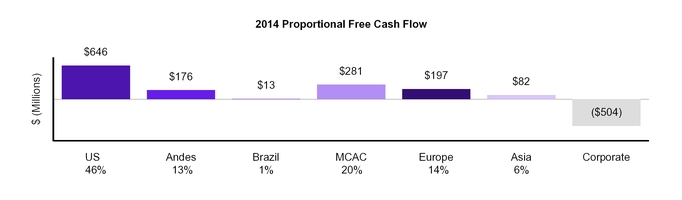
Parent Free Cash Flow (a non-GAAP measure)
The Company defines Parent Free Cash Flow as dividends and other distributions received from our operating businesses less certain cash costs at the Parent Company level, primarily interest payments, overhead, and development costs. Parent Free Cash Flow is used to fund shareholder dividends, share repurchases, growth investments, recourse debt repayments, and other uses by the Parent Company. Refer to Item 1—
Business
—
Overview
for further discussion of the Parent Company's capital allocation strategy.
US SBU
A summary of Operating Margin, Adjusted Operating Margin, Adjusted PTC, and Proportional Free Cash Flow ($ in millions) is as follows:
|
For the Years Ended December 31,
|
2016
|
2015
|
2014
|
$ Change 2016 vs. 2015
|
$ Change 2015 vs. 2014
|
% Change 2016 vs. 2015
|
% Change 2015 vs. 2014
|
|||||||||||||||||||
|
Operating Margin
|
$
|
582
|
|
$
|
621
|
|
$
|
699
|
|
$
|
(39
|
)
|
$
|
(78
|
)
|
-6
|
%
|
-11
|
%
|
|||||||
|
Noncontrolling Interests Adjustment
(1)
|
(75
|
)
|
(38
|
)
|
—
|
|
||||||||||||||||||||
|
Derivatives Adjustment
|
6
|
|
15
|
|
12
|
|
||||||||||||||||||||
|
Adjusted Operating Margin
|
$
|
513
|
|
$
|
598
|
|
$
|
711
|
|
$
|
(85
|
)
|
$
|
(113
|
)
|
-14
|
%
|
-16
|
%
|
|||||||
|
Adjusted PTC
|
$
|
347
|
|
$
|
360
|
|
$
|
445
|
|
$
|
(13
|
)
|
$
|
(85
|
)
|
-4
|
%
|
|
-19
|
%
|
||||||
|
Proportional Free Cash Flow
|
$
|
614
|
|
$
|
591
|
|
$
|
646
|
|
$
|
23
|
|
$
|
(55
|
)
|
4
|
%
|
-9
|
%
|
|||||||
_____________________________
|
(1)
|
See Item 1. Business for the respective ownership interest for key business. In addition, AES owns 70% of IPL as of March 2016 compared to 75% beginning April 2015, 85% beginning in February 2015 and 100% prior to February 2015.
|
94
Fiscal year
2016
versus
2015
Operating margin
decrease
d
$39 million
, or
6%
, which was driven primarily by the following:
|
US Generation
|
|||
|
Southland related to an increase in depreciation expense as a result of a change in estimated useful lives of the plants
|
$
|
(17
|
)
|
|
Impact from sale of Armenia Mountain in July 2015
|
(10
|
)
|
|
|
Warrior Run due to lower availability and higher maintenance cost primarily due to major outages in 2016
|
(8
|
)
|
|
|
Laurel Mountain due to lower regulation dispatch as well as lower energy and regulation pricing
|
(8
|
)
|
|
|
Other
|
(4
|
)
|
|
|
Total US Generation Decrease
|
(47
|
)
|
|
|
DPL
|
|||
|
Impact of lower wholesale prices and completion of DP&L’s transition to a competitive-bid market
|
(42
|
)
|
|
|
Decrease in RTO capacity and other revenues primarily due to lower capacity cleared in the auction
|
(21
|
)
|
|
|
Lower depreciation expense due to June 2016 fixed asset impairment and decrease in generating facility maintenance and other expenses
|
17
|
|
|
|
Other
|
2
|
|
|
|
Total DPL Decrease
|
(44
|
)
|
|
|
IPL
|
|||
|
Higher retail margin driven by environmental revenues and higher rates due to a new rate order
|
36
|
|
|
|
Change in accrual resulting from the implementation of new rates
|
18
|
|
|
|
Other
|
(2
|
)
|
|
|
Total IPL Increase
|
52
|
|
|
|
Total US SBU Operating Margin Decrease
|
$
|
(39
|
)
|
Adjusted Operating Margin
decrease
d
$85 million
for the US SBU due to the drivers above, excluding the impact of unrealized derivative gains and losses and adjusted for the impact of noncontrolling interests.
Adjusted PTC
decrease
d
$13 million
driven by the
decrease
of
$85 million
in Adjusted Operating Margin described above, partially offset by a gain on contract termination at DP&L, lower interest expense at DPL and IPL in part due to the sell-down impacts as discussed above and the impact of HLBV at our Distributed Energy business as a result of new projects achieving COD in 2016.
Proportional Free Cash Flow increased
$23 million
, primarily driven by a $93 million decrease in coal purchases due to the ongoing conversion of coal generation assets to natural gas at IPL, a build-up of inventory due to mild winter weather in December 2015, and inventory optimization efforts at DPL. Additionally, Proportional Free Cash Flow benefited from a $32 million increase in accounts payable due to the timing of vendor payments, $17 million in net settlements of accounts receivable primarily resulting from the sale of DPLER in 2016, and lower interest payments of $19 million due to timing and lower interest rates. These positive impacts were partially offset by an $81 million decrease in Adjusted Operating Margin (net of non-cash impacts of $4 million, primarily related to the implementation of IPL’s new rates and depreciation), and a $84 million decrease in the timing of receivables collections resulting primarily from higher rates at IPL, more favorable weather in 2016, and the impact of DPLER’s declining customer base in 2015.
Fiscal year
2015
versus
2014
Operating margin
decrease
d by
$78 million
, or
11%
, which was driven primarily by the following:
|
DPL
|
|||
|
Impact of more of DP&L's generation being sold in the wholesale market at lower prices in 2015 compared to supplying DP&L retail customers in 2014, lower generation driven by plant outages in 2015, and unfavorable weather; partially offset by the impact of outages and lower gas availability occurring in Q1 2014
|
$
|
(53
|
)
|
|
Increase in capacity margin due to increase in PJM capacity price
|
26
|
|
|
|
Total DPL Decrease
|
(27
|
)
|
|
|
US Generation
|
|||
|
Lower production and prices across the US Wind businesses
|
(20
|
)
|
|
|
Lower availability and dispatch at Hawaii
|
(10
|
)
|
|
|
Other
|
4
|
|
|
|
Total US Generation Decrease
|
(26
|
)
|
|
|
IPL
|
|||
|
Lower wholesale margin due to lower market prices of electricity and outages
|
(26
|
)
|
|
|
Higher fixed costs primarily due to higher maintenance expense attributed to plant outages and higher depreciation expense due to MATS assets
|
(18
|
)
|
|
|
Higher retail margins
|
20
|
|
|
|
Other
|
(1
|
)
|
|
|
Total IPL Decrease
|
(25
|
)
|
|
|
Total US SBU Operating Margin Decrease
|
$
|
(78
|
)
|
Adjusted Operating Margin
decrease
d
$113 million
at the US SBU due to the drivers above, excluding the
95
impact of unrealized derivative gains and losses and adjusted for the impact of noncontrolling interests.
Adjusted PTC
decrease
d
$85 million
driven by the decrease of
$113 million
in Adjusted Operating Margin described above as well as a decrease in the Company's share of earnings under the HLBV allocation of noncontrolling interest at Buffalo Gap, partially offset by IPL due to lower interest expense related to the impact of the sell down and increased AFUDC, and DPL due to lower interest expense.
Proportional Free Cash Flow decreased
$55 million
, primarily driven by the
$113 million
decrease
in Adjusted Operating Margin described above, and a $22 million increase in maintenance and non-recoverable capital expenditures. These negative impacts were partially offset by a $22 million increase due to the collection of previously deferred storm costs, a one-time payment of $19 million in 2014 to terminate an unfavorable coal contract, higher collections of $16 million due to settlement of a receivable balance related to the sale of MC
2
in 2015, and the timing of inventory payments of $16 million at DPL. Additionally, Proportional Free Cash Flow was favorably impacted by the timing of power purchase payments of $7 million and the timing of $9 million of receivables collections at IPL.
ANDES SBU
A summary of Operating Margin, Adjusted Operating Margin, Adjusted PTC, and Proportional Free Cash Flow ($ in millions) is as follows:
|
For the Years Ended December 31,
|
2016
|
2015
|
2014
|
$ Change 2016 vs. 2015
|
$ Change 2015 vs. 2014
|
% Change 2016 vs. 2015
|
% Change 2015 vs. 2014
|
|||||||||||||||||||
|
Operating Margin
|
$
|
634
|
|
$
|
618
|
|
$
|
587
|
|
$
|
16
|
|
$
|
31
|
|
3
|
%
|
5
|
%
|
|||||||
|
Noncontrolling Interests Adjustment
(1)
|
(192
|
)
|
(152
|
)
|
(143
|
)
|
||||||||||||||||||||
|
Adjusted Operating Margin
|
$
|
442
|
|
$
|
466
|
|
$
|
444
|
|
$
|
(24
|
)
|
$
|
22
|
|
-5
|
%
|
5
|
%
|
|||||||
|
Adjusted PTC
|
$
|
390
|
|
$
|
482
|
|
$
|
421
|
|
$
|
(92
|
)
|
$
|
61
|
|
-19
|
%
|
14
|
%
|
|||||||
|
Proportional Free Cash Flow
|
$
|
264
|
|
$
|
224
|
|
$
|
176
|
|
$
|
40
|
|
$
|
48
|
|
18
|
%
|
27
|
%
|
|||||||
_____________________________
|
(1)
|
See Item 1. Business for the respective ownership interest for key business. In addition, AES owned 71% of Gener and Chivor prior to sell down effective December 2015 which resulted in ownership of 67%. The Alto Maipo (under construction) and Cochrane plants are owned 40%.
|
Fiscal year
2016
versus
2015
Including the
unfavorable
impact of foreign currency translation and remeasurement of
$36 million
, operating margin
increase
d
$16 million
, or
3%
, which was driven primarily by the following:
|
Gener
|
|||
|
Lower spot prices on energy and fuel purchases
|
$
|
82
|
|
|
Start of operations of Cochrane Plant
|
36
|
|
|
|
Other
|
(3
|
)
|
|
|
Total Gener Increase
|
115
|
|
|
|
Argentina
|
|||
|
Higher rates driven by annual price review granted by Resolution 22/2016
|
61
|
|
|
|
Lower availability mainly associated with planned major maintenance
|
(20
|
)
|
|
|
Higher fixed costs primarily driven by higher inflation and by higher maintenance cost
|
(44
|
)
|
|
|
Unfavorable FX remeasurement impacts
|
(21
|
)
|
|
|
Total Argentina Decrease
|
(24
|
)
|
|
|
Chivor
|
|||
|
Higher volume of energy sales to Spot Market
|
14
|
|
|
|
Unfavorable FX remeasurement impacts
|
(15
|
)
|
|
|
Lower spot sales prices
|
(72
|
)
|
|
|
Other
|
(2
|
)
|
|
|
Total Chivor Decrease
|
(75
|
)
|
|
|
Total Andes SBU Operating Margin Increase
|
$
|
16
|
|
Adjusted Operating Margin
decrease
d
$24 million
for the year due to the drivers above, adjusted for the impact of noncontrolling interests.
Adjusted PTC
decrease
d
$92 million
, driven by the decrease in Equity Earnings of $54 million mainly related to Guacolda’s reorganization in September 2015, the
decrease
of
$24 million
in Adjusted Operating Margin and the increase of $12 million in interest expense primarily associated to lower interest capitalization after beginning of commercial operations at Cochrane.
Proportional Free Cash Flow increased
$40 million
, primarily driven by $57 million in collections of financing receivables and the timing of maintenance remuneration from CAMMESSA in Argentina, a $25 million positive impact related to a one-time interest rate swap termination payment at Ventanas in July 2015, a decrease of $58 million in working capital requirements at Chivor mainly related to collections of prior period sales, and a $23 million reduction in proportional maintenance and non-recoverable capital expenditures due to lower expenditures on
96
emissions control equipment at Chile. These positive impacts were partially offset by a reduction of $4 million in Adjusted Operating Margin (net of non-cash impacts), $43 million of lower VAT refunds related to our Cochrane and Alto Maipo construction projects, higher net tax payments of $56 million primarily related to withholding taxes paid on Chilean distributions to AES Affiliates and higher taxable income in Colombia, and $18 million of higher interest payments primarily as a consequence of debt refinancing at higher interest rates and lower interest capitalization under construction projects.
Fiscal year
2015
versus
2014
Including the
unfavorable
impact of foreign currency translation and remeasurement of
$87 million
, operating margin
increase
d
$31 million
, or
5%
, which was driven primarily by the following:
|
Gener
|
|||
|
Higher margins associated to Nueva Renca Plant tolling agreement
|
$
|
26
|
|
|
Higher volume of energy sales mainly related to higher availability
|
21
|
|
|
|
Other
|
(2
|
)
|
|
|
Total Gener Increase
|
45
|
|
|
|
Argentina
|
|||
|
Higher rates driven by an annual price review and additional contributions introduced by Resolution 482
|
49
|
|
|
|
Higher fixed costs primarily driven by higher inflation and by higher maintenance cost
|
(45
|
)
|
|
|
Unfavorable FX remeasurement impacts
|
(4
|
)
|
|
|
Other
|
4
|
|
|
|
Total Argentina Increase
|
4
|
|
|
|
Chivor
|
|||
|
Unfavorable FX remeasurement impacts
|
(83
|
)
|
|
|
Higher rates driven by a strong El Niño impact on prices
|
60
|
|
|
|
Higher volume of energy sales mainly associated to higher generation
|
12
|
|
|
|
Other
|
(7
|
)
|
|
|
Total Chivor Decrease
|
(18
|
)
|
|
|
Total Andes SBU Operating Margin Increase
|
$
|
31
|
|
Adjusted Operating Margin
increase
d
$22 million
for the year due to the drivers above, adjusted for the impact of noncontrolling interests.
Adjusted PTC
increase
d
$61 million
driven by a restructuring of Guacolda in Chile which increased our equity investment and resulted in additional Equity Earnings of $46 million as well as realized FX gains, lower interest expense at Chivor and the
$22 million
in Adjusted Operating Margin described above. This was partially offset by lower equity earnings at Guacolda of $16 million (excluding restructuring impact above) mainly driven by a 2014 gain on sale of a transmission line.
Proportional Free Cash Flow increased
$48 million
, primarily driven by $107 million higher VAT refunds at Cochrane and Alto Maipo, $27 million of non-recurring maintenance collections in Argentina, and a $17 million decrease in interest payments. These positive impacts were partially offset by $49 million of higher tax payments and $25 million of lower collections primarily from contract customers at Chivor, and a $25 million impact related to a one-time interest rate swap termination payment at Ventanas in July 2015.
BRAZIL SBU
A summary of Operating Margin, Adjusted Operating Margin, Adjusted PTC, and Proportional Free Cash Flow ($ in millions) is as follows:
|
For the Years Ended December 31,
|
2016
|
2015
|
2014
|
$ Change 2016 vs. 2015
|
$ Change 2015 vs. 2014
|
% Change 2016 vs. 2015
|
% Change 2015 vs. 2014
|
|||||||||||||||||||
|
Operating Margin
|
$
|
239
|
|
$
|
592
|
|
$
|
634
|
|
$
|
(353
|
)
|
$
|
(42
|
)
|
-60
|
%
|
-7
|
%
|
|||||||
|
Noncontrolling Interests Adjustment
(1)
|
(190
|
)
|
(464
|
)
|
(507
|
)
|
||||||||||||||||||||
|
Adjusted Operating Margin
|
$
|
49
|
|
$
|
128
|
|
$
|
127
|
|
$
|
(79
|
)
|
$
|
1
|
|
-62
|
%
|
1
|
%
|
|||||||
|
Adjusted PTC
|
$
|
29
|
|
$
|
118
|
|
$
|
108
|
|
$
|
(89
|
)
|
$
|
10
|
|
-75
|
%
|
9
|
%
|
|||||||
|
Proportional Free Cash Flow
|
$
|
110
|
|
$
|
(29
|
)
|
$
|
13
|
|
$
|
139
|
|
$
|
(42
|
)
|
479
|
%
|
-323
|
%
|
|||||||
_____________________________
|
(1)
|
See Item 1. Business for the respective ownership interest for key business.
|
97
Fiscal year
2016
versus
2015
Including the
unfavorable
impact of foreign currency translation of
$6 million
, operating margin
decrease
d
$353 million
, or
60%
, which was driven primarily by the following:
|
Tietê
|
|||
|
Lower rates for energy sold under new contracts
|
$
|
(239
|
)
|
|
Unfavorable FX impacts
|
(14
|
)
|
|
|
Higher fixed costs due to higher legal settlements
|
(13
|
)
|
|
|
Lower rates for energy purchases mainly due to decrease in spot market prices
|
78
|
|
|
|
Other
|
(2
|
)
|
|
|
Total Tietê Decrease
|
(190
|
)
|
|
|
Eletropaulo
|
|||
|
Negative impact of reversal of contingent regulatory liability in 2015
|
(97
|
)
|
|
|
Higher fixed costs mainly due to higher bad debt and employee-related costs
|
(68
|
)
|
|
|
Lower demand mainly due to economic decline
|
(59
|
)
|
|
|
Higher regulatory penalties in 2016 partially offset by regulatory penalties contingency provision in 2015
|
(30
|
)
|
|
|
Higher tariffs
|
116
|
|
|
|
Other
|
(3
|
)
|
|
|
Total Eletropaulo Decrease
|
(141
|
)
|
|
|
Uruguaiana
|
|||
|
Operations in 2015 compared to not operating in 2016
|
(20
|
)
|
|
|
Total Uruguaiana Decrease
|
(20
|
)
|
|
|
Other Business Drivers
|
(2
|
)
|
|
|
Total Brazil SBU Operating Margin Decrease
|
$
|
(353
|
)
|
Adjusted Operating Margin
decrease
d
$79 million
primarily due to the drivers discussed above, adjusted for the impact of noncontrolling interests.
Adjusted PTC
decrease
d
$89 million
, driven by the decrease of
$79 million
in Adjusted Operating Margin described above as well as higher interest expense of $10 million related to the reversal of a contingent regulatory liability at Eletropaulo in 2015.
Proportional Free Cash Flow
increased
by
$139 million
, primarily driven by favorable timing of $309 million in net collections of higher costs deferred in net regulatory assets in the prior year at Eletropaulo and Sul as a result of unfavorable hydrology in prior periods, favorable timing of $133 million in collections on current year energy sales, and lower energy purchases of $23 million at Tietê due to favorable hydrology. These positive impacts were partially offset by unfavorable timing of $241 million in payments for energy purchases and regulatory charges at Eletropaulo and Sul, and a $72 million decrease in in Adjusted Operating Margin (net of $7 million in non-cash impacts, primarily due to the reversal of a contingent regulatory liability at Eletropaulo in 2015).
Fiscal year
2015
versus
2014
Including the
unfavorable
impact of foreign currency translation of
$228 million
, operating margin
decrease
d
$42 million
, or
7%
, which was driven primarily by the following:
|
Tietê
|
|||
|
Energy purchases at lower rates primarily due to lower spot prices
|
$
|
311
|
|
|
Unfavorable FX impacts
|
(152
|
)
|
|
|
Higher volume purchased on the spot market due to higher assured energy requirement
|
(113
|
)
|
|
|
Other
|
(8
|
)
|
|
|
Total Tietê Increase
|
38
|
|
|
|
Uruguaiana
|
|||
|
Higher generation from a longer period of temporary restart of operations
|
11
|
|
|
|
Total Uruguaiana Increase
|
11
|
|
|
|
Eletropaulo
|
|||
|
Higher fixed costs, primarily due to higher bad debt expense, storms and employee-related costs
|
(142
|
)
|
|
|
Unfavorable FX impacts
|
(74
|
)
|
|
|
Contingency related to performance indicators
|
(59
|
)
|
|
|
Lower volumes due to lower demand
|
(35
|
)
|
|
|
Reversal of a contingent regulatory liability (excluding FX)
|
135
|
|
|
|
Higher tariffs
|
82
|
|
|
|
Total Eletropaulo Decrease
|
(93
|
)
|
|
|
Other Business Drivers
|
2
|
|
|
|
Total Brazil SBU Operating Margin Decrease
|
$
|
(42
|
)
|
Adjusted Operating Margin increased
$1 million
primarily due to the drivers discussed above, adjusted for the impact of noncontrolling interests.
98
Adjusted PTC increased
$10 million
, driven by the increase of
$1 million
in Adjusted Operating Margin described above as well as favorable net interest income recognized on receivables at Eletropaulo.
Proportional Free Cash Flow decreased by
$42 million
, primarily driven by a $99 million decrease in Sul's Adjusted Operating Margin classified as a discontinued operation (not included in the
$1 million
increase in Adjusted Operating Margin described above), higher energy purchases of $59 million at Tietê due to the timing of purchases in the spot market at higher prices, unfavorable timing of $32 million of higher costs deferred in net regulatory assets at Sul as result of unfavorable hydrology, and $17 million of higher interest payments at Sul due to a higher debt balance and higher interest rate. These negative impacts were partially offset by favorable timing of $121 million in payments for energy purchases and regulatory charges at Eletropaulo and Sul, $31 million of lower income tax payments at Tietê, and favorable timing of $14 million in net collections of higher costs deferred in net regulatory assets in the prior year at Eletropaulo.
MCAC SBU
A summary of Operating Margin, Adjusted Operating Margin, Adjusted PTC, and Proportional Free Cash Flow ($ in millions) is as follows:
|
For the Years Ended December 31,
|
2016
|
2015
|
2014
|
$ Change 2016 vs. 2015
|
$ Change 2015 vs. 2014
|
% Change 2016 vs. 2015
|
% Change 2015 vs. 2014
|
|||||||||||||||||||
|
Operating Margin
|
$
|
523
|
|
$
|
543
|
|
$
|
541
|
|
$
|
(20
|
)
|
$
|
2
|
|
-4
|
%
|
—
|
%
|
|||||||
|
Noncontrolling Interests Adjustment
(1)
|
(108
|
)
|
(106
|
)
|
(59
|
)
|
||||||||||||||||||||
|
Derivatives Adjustment
|
(2
|
)
|
1
|
|
—
|
|
||||||||||||||||||||
|
Adjusted Operating Margin
|
$
|
413
|
|
$
|
438
|
|
$
|
482
|
|
$
|
(25
|
)
|
$
|
(44
|
)
|
-6
|
%
|
(9
|
)%
|
|||||||
|
Adjusted PTC
|
$
|
267
|
|
$
|
327
|
|
$
|
352
|
|
$
|
(60
|
)
|
$
|
(25
|
)
|
-18
|
%
|
(7
|
)%
|
|||||||
|
Proportional Free Cash Flow
|
$
|
168
|
|
$
|
498
|
|
$
|
281
|
|
$
|
(330
|
)
|
$
|
217
|
|
-66
|
%
|
77
|
%
|
|||||||
_____________________________
|
(1)
|
See Item 1. Business for the respective ownership interest for key business. In addition, AES owned 92% of Andres and Los Mina and 46% of Itabo in the Dominican Republic until December 2015 when the ownership changed to 90% at Andres and Los Mina and 45% at Itabo.
|
Fiscal year
2016
versus
2015
Operating margin
decrease
d
$20 million
, or
4%
, which was driven primarily by the following:
|
Mexico
|
|||
|
Lower availability and related costs
|
$
|
(11
|
)
|
|
Other
|
(6
|
)
|
|
|
Total Mexico Decrease
|
(17
|
)
|
|
|
El Salvador
|
|||
|
Higher fixed costs
|
(6
|
)
|
|
|
Lower energy sales margin
|
(4
|
)
|
|
|
Total El Salvador Decrease
|
(10
|
)
|
|
|
Panama
|
|||
|
Expenses related to the ongoing construction of a natural gas generation plant and a liquefied natural gas terminal
|
(19
|
)
|
|
|
Commencement of power barge operations at the end of March 2015
|
13
|
|
|
|
Other
|
(3
|
)
|
|
|
Total Panama Decrease
|
(9
|
)
|
|
|
Dominican Republic
|
|||
|
Higher contracted and spot energy sales
|
24
|
|
|
|
Total Dominican Republic Increase
|
24
|
|
|
|
Other Business Drivers
|
(8
|
)
|
|
|
Total MCAC SBU Operating Margin Decrease
|
$
|
(20
|
)
|
Adjusted Operating Margin
decrease
d
$25 million
due to the drivers above, adjusted for the impact of noncontrolling interests and excluding unrealized gains and losses on derivatives.
Adjusted PTC
decrease
d
$60 million
, driven by the
decrease
in Adjusted Operating Margin of
$25 million
as described above as well as a 2015 compensation agreement regarding early termination of the original Barge PPA of $10 million and a $26 million allowance recognized in 2016 at Puerto Rico.
Proportional Free Cash Flow
decreased
$330 million
, primarily driven by $212 million of lower collections in the Dominican Republic mainly due to collections of overdue receivables in September 2015, the
$25 million
decrease
in Adjusted Operating Margin described above, $47 million of decreased collections in Puerto Rico due to lower sales, $14 million of higher tax payments in El Salvador due to higher taxable income in 2015, and a $10 million impact from compensation received in the prior-year from the off-taker in Panama related to an early termination of the barge PPA.
99
Fiscal year
2015
versus
2014
Operating margin
increase
d
$2 million
, or
0.4%
, which was driven primarily by the following:
|
Panama
|
|||
|
Higher generation and lower energy purchases, driven by improved hydrological conditions
|
$
|
118
|
|
|
Commencement of power barge operations at the end of March 2015
|
18
|
|
|
|
Lower compensation from the government of Panama due to lower volumes of energy purchased at lower spot prices
|
(34
|
)
|
|
|
Other
|
(6
|
)
|
|
|
Total Panama Increase
|
96
|
|
|
|
El Salvador
|
|||
|
One-time unfavorable adjustment to unbilled revenue in 2014
|
12
|
|
|
|
Lower energy losses and higher demand
|
11
|
|
|
|
Total El Salvador Increase
|
23
|
|
|
|
Dominican Republic
|
|||
|
Lower commodity prices resulting in lower spot prices and lower than expected gas sales demand with excess gas used for generation at lower margins
|
(29
|
)
|
|
|
Lower availability
|
(28
|
)
|
|
|
Lower frequency regulation revenues
|
(21
|
)
|
|
|
Total Dominican Republic Decrease
|
(78
|
)
|
|
|
Puerto Rico
|
|||
|
One-time reversal of bad debt in 2014 and higher maintenance expense
|
(11
|
)
|
|
|
Total Puerto Rico Decrease
|
(11
|
)
|
|
|
Mexico
|
|||
|
Higher fuel costs, lower spot sales and lower availability
|
(29
|
)
|
|
|
Total Mexico Decrease
|
(29
|
)
|
|
|
Other Business Drivers
|
1
|
|
|
|
Total MCAC SBU Operating Margin Increase
|
$
|
2
|
|
Adjusted Operating Margin decreased
$44 million
due to the drivers above adjusted for the impact of noncontrolling interests and excluding unrealized gains and losses on derivatives.
Adjusted PTC decreased
$25 million
, driven by the decrease in Adjusted Operating Margin of
$44 million
described above. These results were partially offset by a compensation agreement regarding early termination of the original Barge PPA of $10 million and 2014 losses on a legal dispute settlement of $4 million in Panama as well as lower interest expense due to lower debt at Puerto Rico.
Proportional Free Cash Flow increased
$217 million
, primarily due to the favorable timing of $220 million of collections, mainly related to the collection of overdue receivables in the Dominican Republic in September 2015. Proportional Free Cash Flow also benefited from a $17 million impact of lower energy purchases in El Salvador due to lower fuel prices, and a $10 million impact from compensation received from the off-taker in Panama related to an early termination of the barge PPA. These favorable impacts were partially offset by the
$44 million
decrease in Adjusted Operating Margin as described above.
EUROPE SBU
A summary of Operating Margin, Adjusted Operating Margin, Adjusted PTC, and Proportional Free Cash Flow ($ in millions) is as follows:
|
For the Years Ended December 31,
|
2016
|
2015
|
2014
|
$ Change 2016 vs. 2015
|
$ Change 2015 vs. 2014
|
% Change 2016 vs. 2015
|
% Change 2015 vs. 2014
|
|||||||||||||||||||
|
Operating Margin
|
$
|
259
|
|
$
|
303
|
|
$
|
403
|
|
$
|
(44
|
)
|
$
|
(100
|
)
|
-15
|
%
|
-25
|
%
|
|||||||
|
Noncontrolling Interests Adjustment
(1)
|
(33
|
)
|
(30
|
)
|
(26
|
)
|
||||||||||||||||||||
|
Derivatives Adjustment
|
(1
|
)
|
3
|
|
(4
|
)
|
||||||||||||||||||||
|
Adjusted Operating Margin
|
$
|
225
|
|
$
|
276
|
|
$
|
373
|
|
$
|
(51
|
)
|
$
|
(97
|
)
|
-18
|
%
|
-26
|
%
|
|||||||
|
Adjusted PTC
|
$
|
187
|
|
$
|
235
|
|
$
|
348
|
|
$
|
(48
|
)
|
$
|
(113
|
)
|
-20
|
%
|
|
-32
|
%
|
||||||
|
Proportional Free Cash Flow
|
$
|
552
|
|
$
|
238
|
|
$
|
197
|
|
$
|
314
|
|
$
|
41
|
|
132
|
%
|
21
|
%
|
|||||||
_____________________________
|
(1)
|
See Item 1. Business for the respective ownership interest for key business.
|
100
Fiscal year
2016
versus
2015
Including the
unfavorable
impact of foreign currency translation of
$36 million
, operating margin
decrease
d
$44 million
, or
15%
, which was driven primarily by the following:
|
Kazakhstan
|
|||
|
Unfavorable FX impact due to KZT depreciation against USD
|
$
|
(29
|
)
|
|
Other
|
(1
|
)
|
|
|
Total Kazakhstan Decrease
|
(30
|
)
|
|
|
Maritza
|
|||
|
Lower contracted capacity prices due to PPA amendment
|
(18
|
)
|
|
|
Other
|
(2
|
)
|
|
|
Total Maritza Decrease
|
(20
|
)
|
|
|
Ballylumford
|
|||
|
Higher contracted revenues
|
27
|
|
|
|
Lower plant capacity resulting from the retirement of one generation facility
|
(21
|
)
|
|
|
Total Ballylumford Increase
|
6
|
|
|
|
Total Europe SBU Operating Margin Decrease
|
$
|
(44
|
)
|
Adjusted Operating Margin decreased
$51 million
due to the drivers above adjusted for noncontrolling interests and excluding unrealized gains and losses on derivatives.
Adjusted PTC decreased
$48 million
, driven primarily by the decrease of
$51 million
in Adjusted Operating Margin described above.
Proportional Free Cash Flow increased
$314 million
, primarily driven by $360 million of increased collections at Maritza from NEK, net of payments to the fuel supplier (MMI), and a decrease in maintenance and non-recoverable environmental capital expenditures of
$21 million
. These favorable increases were partially offset by the
$51 million
decrease in Adjusted Operating Margin and a $24 million decrease in CO
2
allowances due to a price decrease.
Fiscal year
2015
versus
2014
Including the
unfavorable
impact of foreign currency translation of
$47 million
, operating margin
decrease
d
$100 million
, or
25%
, which was driven primarily by the following:
|
Maritza
|
|||
|
Unfavorable FX impacts due to Euro depreciation against USD
|
$
|
(30
|
)
|
|
Lower rates due to non-operating costs passed through the tariff
|
(8
|
)
|
|
|
Higher availability in 2015
|
8
|
|
|
|
Total Maritza Decrease
|
(30
|
)
|
|
|
Kilroot
|
|||
|
Lower dispatch and lower market prices due to gas/coal spread as well as lower capacity prices
|
(23
|
)
|
|
|
Higher fixed costs primarily driven by maintenance cost due to timing of outages
|
(3
|
)
|
|
|
Lower depreciation due to impairment in Q3 2015
|
7
|
|
|
|
Other
|
1
|
|
|
|
Total Kilroot Decrease
|
(18
|
)
|
|
|
Ballylumford
|
|||
|
Lower availability and lower capacity prices
|
(8
|
)
|
|
|
Write down of non-primary fuel inventory
|
(4
|
)
|
|
|
Total Ballylumford Decrease
|
(12
|
)
|
|
|
Other
|
|||
|
Reduction due to the sale of Ebute in 2014
|
(34
|
)
|
|
|
Lower Heat Rate margin at Jordan
|
(6
|
)
|
|
|
Total Other Decrease
|
(40
|
)
|
|
|
Total Europe SBU Operating Margin Decrease
|
$
|
(100
|
)
|
Adjusted Operating Margin decreased
$97 million
due to the drivers above adjusted for noncontrolling interests and excluding unrealized gains and losses on derivatives.
Adjusted PTC decreased
$113 million
, driven by the decrease of
$97 million
in Adjusted Operating Margin described above, and by higher depreciation and unfavorable FX impact from Elsta as well as unfavorable impact due to the reversal of a liability in 2014 in Kazakhstan. These results partially offset by lower interest expenses in Bulgaria.
Proportional Free Cash Flow increased
$41 million
, primarily driven by $69 million of increased collections at Maritza from NEK, net of payments to the fuel supplier (MMI), a $22 million benefit at IPP4 Jordan due to the commencement of operations in July 2014, and lower interest expense of $38 million due primarily to the sale of UK Wind in 2014. These favorable increases were partially offset by the
$97 million
decrease in Adjusted Operating
101
Margin described above.
ASIA SBU
A summary of Operating Margin, Adjusted Operating Margin, Adjusted PTC, and Proportional Free Cash Flow ($ in millions) is as follows:
|
For the Years Ended December 31,
|
2016
|
2015
|
2014
|
$ Change 2016 vs. 2015
|
$ Change 2015 vs. 2014
|
% Change 2016 vs. 2015
|
% Change 2015 vs. 2014
|
|||||||||||||||||||
|
Operating Margin
|
$
|
170
|
|
$
|
149
|
|
$
|
76
|
|
$
|
21
|
|
$
|
73
|
|
14
|
%
|
96
|
%
|
|||||||
|
Noncontrolling Interests Adjustment
(1)
|
(91
|
)
|
(79
|
)
|
(25
|
)
|
||||||||||||||||||||
|
Derivatives Adjustment
|
1
|
|
—
|
|
—
|
|
||||||||||||||||||||
|
Adjusted Operating Margin
|
$
|
80
|
|
$
|
70
|
|
$
|
51
|
|
$
|
10
|
|
$
|
19
|
|
14
|
%
|
37
|
%
|
|||||||
|
Adjusted PTC
|
$
|
96
|
|
$
|
96
|
|
$
|
46
|
|
$
|
—
|
|
$
|
50
|
|
—
|
%
|
|
109
|
%
|
||||||
|
Proportional Free Cash Flow
|
$
|
136
|
|
$
|
87
|
|
$
|
82
|
|
$
|
49
|
|
$
|
5
|
|
56
|
%
|
6
|
%
|
|||||||
_____________________________
|
(1)
|
See Item 1. Business for the respective ownership interest for key business.
|
Fiscal year
2016
versus
2015
Operating margin
increase
d
$21 million
, or
14%
, which was driven primarily by the following:
|
Mong Duong
|
|||
|
Impact of full year operations for 2016 compared to commencement of principal operations in April 2015
|
$
|
16
|
|
|
Total Mong Duong Increase
|
16
|
|
|
|
Other business drivers
|
5
|
|
|
|
Total Asia SBU Operating Margin Increase
|
$
|
21
|
|
Adjusted Operating Margin
increase
d
$10 million
due to the drivers above adjusted for the impact of noncontrolling interests.
Adjusted PTC was neutral driven by the
increase
of
$10 million
in Adjusted Operating Margin described above offset by lower equity earnings at OPGC in India due to lower tariffs and the net impact of higher interest expense and higher interest income at Mong Duong.
Proportional Free Cash Flow increased
$49 million
, primarily driven by a decrease of $29 million in working capital requirements at Mong Duong due to a build up in the prior year in preparation for commencement of plant operations, and an increase in Adjusted Operating Margin of $35 million (net of non-cash service concession expense of $24 million). These positive impacts were partially offset by higher interest expense of $18 million as interest is no longer capitalized as part of service concession asset expenditures.
Fiscal year
2015
versus
2014
Operating margin
increase
d
$73 million
, or
96%
, which was driven primarily by the following:
|
Masinloc
|
|||
|
Higher availability
|
$
|
27
|
|
|
One-time unfavorable impact in 2014 due to market operator's retrospective adjustment to energy prices in Nov and Dec 2013
|
15
|
|
|
|
Lower fixed costs and lower tax assessments in 2015 relative to 2014
|
7
|
|
|
|
Other
|
3
|
|
|
|
Total Masinloc Increase
|
52
|
|
|
|
Mong Duong
|
|||
|
Commencement of principal operations in April 2015
|
24
|
|
|
|
Total Mong Duong Increase
|
24
|
|
|
|
Other Business Drivers
|
(3
|
)
|
|
|
Total Asia SBU Operating Margin Increase
|
$
|
73
|
|
Adjusted Operating Margin increased
$19 million
due to the drivers above adjusted for the impact of noncontrolling interests.
Adjusted PTC increased
$50 million
, driven by the increase of
$19 million
in Adjusted Operating Margin described above, and the additional net impact of $28 million at Mong Duong due to a component of service concession revenue recognized as interest income, net of higher interest expense as interest is no longer capitalized. See Note 1—
General and Summary of Significant Accounting Policies
in Part II.—Item 8.—
Financial Statements and Supplementary Data
for further information regarding the accounting for service concession arrangements.
Proportional Free Cash Flow increased
$5 million
, primarily driven by an increase in Adjusted Operating Margin of $28 million (net of $9 million in non-cash items, primarily service concession expense and the
102
retrospective adjustment to energy prices noted above), and $58 million in higher interest income recognized at Mong Duong as a result of the financing component under service concession accounting. These positive impacts were partially offset by $26 million in higher working capital requirements at Mong Duong due to a build-up in preparation of the commencement of operations, $22 million in higher interest payments at Mong Duong, $11 million of higher tax payments at Masinloc, and $9 million in higher working capital requirements at Masinloc due primarily to the timing of coal purchases.
Key Trends and Uncertainties
During
2017
and beyond, we expect to face the following challenges at certain of our businesses. Management expects that improved operating performance at certain businesses, growth from new businesses and global cost reduction initiatives may lessen or offset their impact. If these favorable effects do not occur, or if the challenges described below and elsewhere in this section impact us more significantly than we currently anticipate, or if volatile foreign currencies and commodities move more unfavorably, then these adverse factors (or other adverse factors unknown to us) may impact our operating margin, net income attributable to The AES Corporation and cash flows. We continue to monitor our operations and address challenges as they arise. For the risk factors related to our business, see Item 1.—
Business
and Item 1A.—
Risk Factors
of this Form 10-K.
Macroeconomic and Political
During 2016, the political environments in some countries where our subsidiaries conduct business have changed which could result in significant impacts to tax laws, and environmental and energy policies. Additionally, we operate in multiple countries and as such are subject to volatility in exchange rates at the subsidiary level. See Item 7A.—
Quantitative and Qualitative Disclosures About Market Risk
for further information.
Brazil
—
President Michel Temer, with majority congressional support, continues to implement the fiscal reforms needed to improve the country’s finances. While uncertainty dominates the political arena, if enacted, President Temer's market reforms would improve the the economic outlook, which may benefit our businesses in Brazil.
In October 2016, AES completed the sale of the Company's 100% ownership interest in AES Sul and recognized an after-tax loss on disposal of $737 million. This after-tax loss excludes the impact of contingent proceeds linked to the favorable settlement of pending litigation, which is not guaranteed. If the case is decided in the Company's favor, amounts would be remitted to AES over an unknown period of time. Any potential gain from the eventual resolution of this contingency would be presented separately as Discontinued Operations.
United Kingdom
—
On June 23, 2016, the United Kingdom (U.K.) held a referendum in which voters approved an exit from the European Union (“E.U.”), commonly referred to as “Brexit”. As a result of the referendum, it is expected that the British government will begin negotiating the terms of the U.K.’s future relationship with the E.U. Although it is unclear what the long-term global implications will be, it is possible that the European or U.K. economy could weaken and our businesses may experience a decline in demand. While the full impact of the Brexit is uncertain, these changes may adversely affect our operations and financial results. The most immediate impact has been a devaluation of the pound and euro against the U.S. dollar. For 2016 and 2017, the Company has hedged against these foreign currency movements, however, the impact could be greater in future years.
Puerto Rico
—
Our subsidiaries in Puerto Rico have long term PPAs with state-owned PREPA. Due to the ongoing economic situation in the territory, PREPA faces significant financial challenges. There have been no significant adverse impacts to AES Puerto Rico due to PREPA’s financial challenges.
If PREPA continues to face challenges, or those challenges worsen, or otherwise impact PREPA’s ability to make payments to AES Puerto Rico, there could be a material impact on the Company.
United States of America
— The outcome of the 2016 U.S. elections could result in significant changes to U.S. tax laws, and environmental and energy policies, the impact of which is uncertain.
Philippines
— The outcome of the 2016 Philippines election could result in changes in policies towards the U.S., China or other nations the impact of which on our business is uncertain.
Foreign Exchange and Commodities
Our businesses are exposed to and proactively manage market risk. Our primary market risk exposure is to the price of commodities, particularly electricity, oil, natural gas, coal and environmental credits. In 2016, there were more than 50% improvement in both oil and natural gas prices, which had a positive impact on our businesses in the Dominican Republic, Ohio and Northern Ireland. Since we operate in multiple countries, we are subject to volatility in exchange rates at varying degrees at the subsidiary level and between our functional currency, the U.S.
103
Dollar, and currencies of the countries in which we operate. In 2016, we had a significant devaluation in the Argentine Peso. The Brazilian Real, Colombian Peso and Kazakhstani Tenge recovered during the year, but remain devalued as compared to the beginning of 2015, which had an offsetting impact on our 2016 results. For additional information, refer to Item 7A.—
Quantitative and Qualitative Disclosures About Market Risk.
Alto Maipo
During 2016, the Alto Maipo project in Chile experienced technical difficulties in construction which resulted in an increase in projected costs of up to 22% over the original $2 billion budget. These additional costs have led to a series of negotiations with the main contractors, financiers and partners of the project, with the intention to restructure the existing financing and obtain additional financing to guarantee project completion. On January 19, 2017, the parties agreed on the basis of the restructuring process, including new project milestones. These agreements are subject to the negotiation and finalization of the specific restructuring terms and conditions; and the negotiation and approval of the terms and conditions of each of the financing documents. Currently, the Company's indirect equity interest in the project is 40%.
Impairments
Long-lived Assets
—
During the year ended
December 31, 2016
, the Company recognized asset impairment expense of
$1.1 billion
. Due to decreased wind production and a decline in forward power curves in 2016, the Company tested the recoverability of its long-lived assets at Buffalo Gap I, II, and III. After recognizing asset impairment expense of
$236 million
at Buffalo Gap I and II, the carrying value of the long-lived asset groups at Buffalo Gap I, II, and III totaled
$242 million
at
December 31, 2016
.
Additionally, the Company recognized an asset impairment expense of
$859 million
at DPL in 2016. After recognizing asset impairment expense at DPL, the carrying value of the long-lived asset groups at DPL, including those that were not impaired, totaled
$498 million
at
December 31, 2016
. See Note
20
—
Asset Impairment Expense
in Item 8.—
Financial Statements and Supplementary Data
for further information regarding the impairments at Buffalo Gap and DPL.
Events or changes in circumstances that may necessitate further recoverability tests and potential impairments of long-lived assets may include, but are not limited to, adverse changes in the regulatory environment, unfavorable changes in power prices or fuel costs, increased competition due to additional capacity in the grid, technological advancements, declining trends in demand, or an expectation that it is more likely than not that the asset will be disposed of before the end of its previously estimated useful life.
Goodwill
—
The Company currently has no reporting units considered to be "at risk."
A reporting unit is considered "at risk" when its fair value is not higher than its carrying amount by more than 10%. The Company monitors its reporting units at risk of Step 1 failure on an ongoing basis. It is possible that the Company may incur goodwill impairment charges at any reporting units containing goodwill in future periods if adverse changes in their business or operating environments occur. See Note
9
—
Goodwill and Other Intangible Assets
in Item 8.—
Financial Statements and Supplementary Data
for further information.
Capital Resources and Liquidity
Overview —
As of
December 31, 2016
, the Company had unrestricted cash and cash equivalents of
$1.3 billion
, of which
$100 million
was held at the Parent Company and qualified holding companies. The Company also had
$798 million
in short term investments, held primarily at subsidiaries. In addition, we had restricted cash and debt service reserves of
$871 million
. The Company also had non-recourse and recourse aggregate principal amounts of debt outstanding of
$15.8 billion
and
$4.7 billion
, respectively. Of the approximately
$1.3 billion
of our current non-recourse debt,
$1.2 billion
was presented as such because it is due in the next twelve months and
$128 million
relates to debt considered in default due to covenant violations. The defaults are not payment defaults, but are instead technical defaults triggered by failure to comply with other covenants and/or other conditions such as (but not limited to) failure to meet information covenants, complete construction or other milestones in an allocated time, meet certain minimum or maximum financial ratios, or other requirements contained in the non-recourse debt documents of the Company.
104
We expect such current maturities will be repaid from net cash provided by operating activities of the subsidiary to which the debt relates or through opportunistic refinancing activity or some combination thereof.
None
of our recourse debt matures within the next twelve months. From time to time, we may elect to repurchase our outstanding debt through cash purchases, privately negotiated transactions or otherwise when management believes that such securities are attractively priced. Such repurchases, if any, will depend on prevailing market conditions, our liquidity requirements and other factors. The amounts involved in any such repurchases may be material.
We rely mainly on long-term debt obligations to fund our construction activities. We have, to the extent available at acceptable terms, utilized non-recourse debt to fund a significant portion of the capital expenditures and investments required to construct and acquire our electric power plants, distribution companies and related assets. Our non-recourse financing is designed to limit cross default risk to the Parent Company or other subsidiaries and affiliates. Our non-recourse long-term debt is a combination of fixed and variable interest rate instruments. Generally, a portion or all of the variable rate debt is fixed through the use of interest rate swaps. In addition, the debt is typically denominated in the currency that matches the currency of the revenue expected to be generated from the benefiting project, thereby reducing currency risk. In certain cases, the currency is matched through the use of derivative instruments. The majority of our non-recourse debt is funded by international commercial banks, with debt capacity supplemented by multilaterals and local regional banks.
Given our long-term debt obligations, the Company is subject to interest rate risk on debt balances that accrue interest at variable rates. When possible, the Company will borrow funds at fixed interest rates or hedge its variable rate debt to fix its interest costs on such obligations. In addition, the Company has historically tried to maintain at least 70% of its consolidated long-term obligations at fixed interest rates, including fixing the interest rate through the use of interest rate swaps. These efforts apply to the notional amount of the swaps compared to the amount of related underlying debt. Presently, the Parent Company's only material un-hedged exposure to variable interest rate debt relates to indebtedness under its floating rate senior unsecured notes due 2019. On a consolidated basis, of the Company's
$20.5 billion
of total debt outstanding as of
December 31, 2016
, approximately
$3.5 billion
bore interest at variable rates that were not subject to a derivative instrument which fixed the interest rate. Brazil holds $1.3 billion of our floating rate non-recourse exposure as we have no ability to fix local debt interest rates efficiently.
In addition to utilizing non-recourse debt at a subsidiary level when available, the Parent Company provides a portion, or in certain instances all, of the remaining long-term financing or credit required to fund development, construction or acquisition of a particular project. These investments have generally taken the form of equity investments or intercompany loans, which are subordinated to the project's non-recourse loans. We generally obtain the funds for these investments from our cash flows from operations, proceeds from the sales of assets and/or the proceeds from our issuances of debt, common stock and other securities. Similarly, in certain of our businesses, the Parent Company may provide financial guarantees or other credit support for the benefit of counterparties who have entered into contracts for the purchase or sale of electricity, equipment or other services with our subsidiaries or lenders. In such circumstances, if a business defaults on its payment or supply obligation, the Parent Company will be responsible for the business' obligations up to the amount provided for in the relevant guarantee or other credit support. At
December 31, 2016
, the Parent Company had provided outstanding financial and performance-related guarantees or other credit support commitments to or for the benefit of our businesses, which were limited by the terms of the agreements, of approximately
$535 million
in aggregate (excluding those collateralized by letters of credit and other obligations discussed below).
As a result of the Parent Company's below investment grade rating, counterparties may be unwilling to accept our general unsecured commitments to provide credit support. Accordingly, with respect to both new and existing commitments, the Parent Company may be required to provide some other form of assurance, such as a letter of credit, to backstop or replace our credit support. The Parent Company may not be able to provide adequate assurances to such counterparties. To the extent we are required and able to provide letters of credit or other collateral to such counterparties, this will reduce the amount of credit available to us to meet our other liquidity needs. At
December 31, 2016
, we had
$6 million
in letters of credit outstanding, provided under our senior secured credit facility,
$245 million
in letters of credit outstanding, provided under our un-senior secured credit facility and
$3 million
in cash collateralized letters of credit outstanding outside of our senior secured credit facility. These letters of credit operate to guarantee performance relating to certain project development activities and business operations. During the year ended
December 31, 2016
, the Company paid letter of credit fees ranging from
0.2%
to
2.5%
per annum on the outstanding amounts.
We expect to continue to seek, where possible, non-recourse debt financing in connection with the assets or businesses that we or our affiliates may develop, construct or acquire. However, depending on local and global market conditions and the unique characteristics of individual businesses, non-recourse debt may not be available
105
on economically attractive terms or at all. If we decide not to provide any additional funding or credit support to a subsidiary project that is under construction or has near-term debt payment obligations and that subsidiary is unable to obtain additional non-recourse debt, such subsidiary may become insolvent, and we may lose our investment in that subsidiary. Additionally, if any of our subsidiaries lose a significant customer, the subsidiary may need to withdraw from a project or restructure the non-recourse debt financing. If we or the subsidiary choose not to proceed with a project or are unable to successfully complete a restructuring of the non-recourse debt, we may lose our investment in that subsidiary.
Many of our subsidiaries depend on timely and continued access to capital markets to manage their liquidity needs. The inability to raise capital on favorable terms, to refinance existing indebtedness or to fund operations and other commitments during times of political or economic uncertainty may have material adverse effects on the financial condition and results of operations of those subsidiaries. In addition, changes in the timing of tariff increases or delays in the regulatory determinations under the relevant concessions could affect the cash flows and results of operations of our businesses.
Long-Term Receivables —
As of
December 31, 2016
, the Company had approximately
$264 million
of accounts receivable classified as
Noncurrent assets—other
related to certain of its generation businesses in Argentina and the U.S. and its utility business in Brazil. The noncurrent portion primarily consists of accounts receivable in Argentina that, pursuant to amended agreements or government resolutions, have collection periods that extend beyond
December 31,
2017
, or one year from the latest balance sheet date. The majority of Argentinian receivables have been converted into long-term financing for the construction of power plants. See Note
6
—
Financing Receivables
included in Item 8.—
Financial Statements and Supplementary Data
and Item 1.—
Business
—
Regulatory Matters—Argentina
of this Form 10-K for further information.
Consolidated Cash Flows
The following table reflects the changes in operating, investing, and financing cash flows for the comparative
twelve
month periods (in millions):
|
December 31,
|
$ Change
|
|||||||||||||||||||
|
Cash flows provided by (used in):
|
2016
|
2015
|
2014
|
2016 vs. 2015
|
2015 vs. 2014
|
|||||||||||||||
|
Operating activities
|
$
|
2,884
|
|
$
|
2,134
|
|
$
|
1,791
|
|
$
|
750
|
|
$
|
343
|
|
|||||
|
Investing activities
|
(2,108
|
)
|
(2,366
|
)
|
(656
|
)
|
258
|
|
(1,710
|
)
|
||||||||||
|
Financing activities
|
(747
|
)
|
28
|
|
(1,262
|
)
|
(775
|
)
|
1,290
|
|
||||||||||
Operating Activities
The following table summarizes the key components of our consolidated operating cash flows (in millions):
|
December 31,
|
$ Change
|
|||||||||||||||||||
|
2016
|
2015
|
2014
|
2016 vs. 2015
|
2015 vs. 2014
|
||||||||||||||||
|
Net Income (Loss)
|
$
|
(777
|
)
|
$
|
762
|
|
$
|
1,147
|
|
$
|
(1,539
|
)
|
$
|
(385
|
)
|
|||||
|
Depreciation and amortization
|
1,176
|
|
1,144
|
|
1,245
|
|
32
|
|
(101
|
)
|
||||||||||
|
Impairment expenses
|
2,481
|
|
602
|
|
433
|
|
1,879
|
|
169
|
|
||||||||||
|
Loss on the extinguishment of debt
|
20
|
|
186
|
|
261
|
|
(166
|
)
|
(75
|
)
|
||||||||||
|
Deferred Income Taxes
|
(793
|
)
|
(50
|
)
|
47
|
|
(743
|
)
|
(97
|
)
|
||||||||||
|
Other adjustments to net income
|
225
|
|
(73
|
)
|
(320
|
)
|
298
|
|
247
|
|
||||||||||
|
Non-cash adjustments to net income
|
3,109
|
|
1,809
|
|
1,666
|
|
1,300
|
|
143
|
|
||||||||||
|
Net income, adjusted for non-cash items
|
$
|
2,332
|
|
$
|
2,571
|
|
$
|
2,813
|
|
$
|
(239
|
)
|
$
|
(242
|
)
|
|||||
|
Net change in operating assets and liabilities
(1)
|
552
|
|
(437
|
)
|
(1,022
|
)
|
989
|
|
585
|
|
||||||||||
|
Net cash provided by operating activities
(2)
|
$
|
2,884
|
|
$
|
2,134
|
|
$
|
1,791
|
|
$
|
750
|
|
$
|
343
|
|
|||||
_____________________________
|
(1)
|
Refer to the table below for explanations of the variance in operating assets and liabilities.
|
|
(2)
|
Amounts included in the table above include the results of discontinued operations, where applicable.
|
106
Fiscal Year
2016
versus
2015
The variance of
$989 million
in changes in operating assets and liabilities for the year ended December 31,
2016
compared to the year ended December 31,
2015
was driven by (in millions):
|
Decreases in:
|
|||
|
Other assets, primarily long-term regulatory assets at Eletropaulo and service concession assets at Vietnam
|
$
|
1,054
|
|
|
Accounts receivable, primarily at Maritza and Eletropaulo
|
615
|
|
|
|
Prepaid expenses and other current assets, primarily regulatory assets at Eletropaulo and Sul
|
215
|
|
|
|
Accounts payable and other current liabilities, primarily at Eletropaulo and Sul
|
(651
|
)
|
|
|
Income taxes payable, net and other taxes payable, primarily at Tietê, Chivor and Gener
|
(252
|
)
|
|
|
Other operating assets and liabilities
|
8
|
|
|
|
Total increase in cash from changes in operating assets and liabilities
|
$
|
989
|
|
Fiscal Year
2015
versus
2014
The variance of
$585 million
in changes in operating assets and liabilities for the year ended December 31,
2015
compared to the year ended December 31,
2014
was driven by (in millions):
|
Decreases in:
|
|||
|
Prepaid expenses and other current assets, primarily at Eletropaulo, Gener and DPL
|
$
|
728
|
|
|
Accounts receivable, primarily at Andres and Itabo Opco
|
142
|
|
|
|
Other operating assets and liabilities
|
39
|
|
|
|
Increases in:
|
|||
|
Income tax payables, net and other tax payables, primarily at Tietê and Gener
|
142
|
|
|
|
Accounts payable and other current liabilities, primarily at Eletropaulo, Sul and Tietê
|
116
|
|
|
|
Other assets, primarily long-term regulatory assets at Eletropaulo and Sul and service concession assets at Mong Duong
|
(582
|
)
|
|
|
Total increase in cash from changes in operating assets and liabilities
|
$
|
585
|
|
Investing Activities
Fiscal Year
2016
versus
2015
Net cash used in investing activities decreased
$258 million
for the year ended December 31,
2016
compared to December 31,
2015
, which was primarily driven by (in millions):
|
Increases in:
|
|||
|
Capital expenditures
(1)
|
$
|
(37
|
)
|
|
Acquisitions, net of cash acquired (primarily Distributed Energy)
|
(38
|
)
|
|
|
Proceeds from the sales of businesses, net of cash sold (primarily related to sales of DPLER and Sul)
|
493
|
|
|
|
Net purchases of short-term investments
|
(297
|
)
|
|
|
Decreases in:
|
|||
|
Restricted cash, debt service and other assets
|
98
|
|
|
|
Other investing activities
|
39
|
|
|
|
Total decrease in net cash used in investing activities
|
$
|
258
|
|
_____________________________
|
(1)
|
Refer to the tables below for a breakout of capital expenditure by type and by primary business driver.
|
Capital Expenditures
The following table summarizes the Company's capital expenditures for growth investments, maintenance and environmental reported in investing cash activities for the periods indicated (in millions):
|
December 31,
|
$ Change
|
|||||||||||
|
2016
|
2015
|
2016 vs. 2015
|
||||||||||
|
Growth Investments
|
$
|
(1,510
|
)
|
$
|
(1,401
|
)
|
$
|
(109
|
)
|
|||
|
Maintenance
|
(617
|
)
|
(606
|
)
|
(11
|
)
|
||||||
|
Environmental
(1)
|
(218
|
)
|
(301
|
)
|
83
|
|
||||||
|
Total capital expenditures
|
$
|
(2,345
|
)
|
$
|
(2,308
|
)
|
$
|
(37
|
)
|
|||
_____________________________
|
(1)
|
Includes both recoverable and non-recoverable environmental capital expenditures. See SBU Performance Analysis for more information.
|
107
Cash used for capital expenditures increased by
$37 million
for the year ended December 31,
2016
compared to December 31,
2015
, which was primarily driven by (in millions):
|
Increases in:
|
|||
|
Growth expenditures at the Asia SBU, primarily due to investments at Masinloc related to the construction of a coal-fired plant, a battery storage project, and retrofit related costs
|
$
|
(124
|
)
|
|
Growth expenditures at the MCAC SBU, primarily due to the construction of a natural gas-fired generation plant in Panama and construction of a combined cycle project at Los Mina in the Dominican Republic
|
(266
|
)
|
|
|
Decreases in:
|
|
|
|
|
Growth expenditures at the Andes SBU, primarily due to lower spending related to Cochrane and the Andes Solar plant; partially offset by higher investments in the Alto Maipo construction project
|
280
|
|
|
|
Growth expenditures at the US SBU, primarily due to lower spending related to the CCGT and Transmission & Distribution projects at IPALCO
|
20
|
|
|
|
Maintenance and environmental expenditures at the US SBU, primarily due to lower spending related to MATS compliance and the conversion of Harding Street Stations 5, 6 and 7 to natural gas upon being placed into service in late 2015 and early 2016; partially offset by higher spending on CCR compliance
|
63
|
|
|
|
Other capital expenditures
|
(10
|
)
|
|
|
Total increase in net cash used for capital expenditures
|
$
|
(37
|
)
|
Fiscal Year
2015
versus
2014
Net cash used in investing activities increased
$1.7 billion
for the year ended December 31,
2015
compared to December 31,
2014
, which was primarily driven by (in millions):
|
Increases in:
|
|||
|
Capital expenditures
(1)
|
$
|
(292
|
)
|
|
Restricted cash, debt service and other assets
|
(578
|
)
|
|
|
Decreases in:
|
|||
|
Proceeds from sales of businesses (primarily related to the Guacolda and Masinloc transactions in 2014)
|
(1,669
|
)
|
|
|
Acqusitions, net of cash acquired (primarily related to the Guacolda transaction in 2014)
|
711
|
|
|
|
Net purchases of short-term investments
|
170
|
|
|
|
Other investing activities
|
(52
|
)
|
|
|
Total increase in net cash used in investing activities
|
$
|
(1,710
|
)
|
_____________________________
|
(1)
|
Refer to the tables below for a breakout of capital expenditures by type and by primary business driver.
|
The following table summarizes the Company's capital expenditures for growth investments, maintenance and environmental for the periods indicated (in millions):
|
December 31,
|
$ Change
|
|||||||||||
|
2015
|
2014
|
2015 vs. 2014
|
||||||||||
|
Growth Investments
|
$
|
(1,401
|
)
|
$
|
(1,151
|
)
|
$
|
(250
|
)
|
|||
|
Maintenance
|
(606
|
)
|
(645
|
)
|
39
|
|
||||||
|
Environmental
(1)
|
(301
|
)
|
(220
|
)
|
(81
|
)
|
||||||
|
Total capital expenditures
|
$
|
(2,308
|
)
|
$
|
(2,016
|
)
|
$
|
(292
|
)
|
|||
_____________________________
|
(1)
|
Includes both recoverable and non-recoverable environmental capital expenditures. See SBU Performance Analysis for more information.
|
Cash used for capital expenditures increased by
$292 million
for the year ended December 31,
2015
compared to December 31,
2014
, which was primarily driven by (in millions):
|
Increases in:
|
|||
|
Growth expenditures at the Andes SBU, primarily due to higher spending on Cochrane projects
|
$
|
(271
|
)
|
|
Growth expenditures at the US SBU, primarily due to higher spending on the CCGT, Transmission & Distribution projects and a battery storage project at IPALCO
|
(192
|
)
|
|
|
Maintenance and environmental expenditures at the US SBU, primarily due to higher spending on the NPDES compliance and Harding Street refueling projects as they began in 2015; partially offset by lower spending on MATS compliance
|
(98
|
)
|
|
|
Decreases In:
|
|||
|
Growth expenditures at Mong Duong due to the adoption of service concession accounting in 2015
|
111
|
|
|
|
Growth expenditures at Jordan due to the completion of IPP4 plant construction
|
72
|
|
|
|
Other capital expenditures
|
86
|
|
|
|
Total increase in net cash used for capital expenditures
|
$
|
(292
|
)
|
108
Financing Activities
Net cash used in financing activities increased
$775 million
for the year ended December 31,
2016
compared to December 31,
2015
, which was primarily driven by (in millions):
|
Increases in:
|
|||
|
Distributions to noncontrolling interests, primarily at the Brazil SBU
|
$
|
(150
|
)
|
|
Contributions from noncontrolling interests, primarily at the MCAC SBU
|
64
|
|
|
|
Decreases in:
|
|||
|
Net issuance of non-recourse debt, primarily at the Andes and Brazil SBUs
|
(624
|
)
|
|
|
Proceeds from the sale of redeemable stock of subsidiaries at IPALCO
|
(327
|
)
|
|
|
Proceeds from sales to noncontrolling interests, net of transaction costs
|
(154
|
)
|
|
|
Purchases of treasury stock by the Parent Company
|
403
|
|
|
|
Net repayments of recourse debt at the Parent Company
(1)
|
32
|
|
|
|
Other financing activities
|
(19
|
)
|
|
|
Total increase in net cash used in financing activities
|
$
|
(775
|
)
|
_____________________________
|
(1)
|
See Note
11
—
Debt
in Item 8.—Financial Statements and Supplementary Data of this Form 10-K for more information regarding significant recourse debt transactions.
|
Net cash provided by financing activities increased
$1.3 billion
for the year ended December 31,
2015
compared to the year ended December 31,
2014
, which was primarily driven by (in millions):
|
Increases in:
|
|||
|
Proceeds from the sale of redeemable stock of subsidiaries at IPALCO
|
$
|
461
|
|
|
Net issuance of non-recourse debt, primarily at the Andes and Brazil SBUs
|
238
|
|
|
|
Proceeds from sales to noncontrolling interests, net of transaction costs
|
71
|
|
|
|
Dividends paid on The AES Corporation common stock
|
(132
|
)
|
|
|
Purchases of treasury stock by the Parent Company
|
(174
|
)
|
|
|
Decreases in:
|
|||
|
Net repayments of recourse debt at the Parent Company
(1)
|
252
|
|
|
|
Payments for financed capital expenditures, primarily at the Andes and Asia SBUs
|
378
|
|
|
|
Other financing activities
|
196
|
|
|
|
Total increase in net cash provided by financing activities
|
$
|
1,290
|
|
_____________________________
|
(1)
|
See Note
11
—
Debt
in Item 8.—Financial Statements and Supplementary Data of this Form 10-K for more information regarding significant recourse debt transactions.
|
109
Segment Operating Cash Flow Analysis
Operating Cash Flow
(1)
|
Operating Cash Flow by SBU
|
||||||||||||||||||||
|
2016
|
2015
|
2014
|
2016/2015 Change
|
2015/2014 Change
|
||||||||||||||||
|
US
|
$
|
912
|
|
$
|
845
|
|
$
|
830
|
|
$
|
67
|
|
$
|
15
|
|
|||||
|
Andes
|
475
|
|
462
|
|
359
|
|
13
|
|
103
|
|
||||||||||
|
Brazil
|
716
|
|
136
|
|
316
|
|
580
|
|
(180
|
)
|
||||||||||
|
MCAC
|
312
|
|
705
|
|
370
|
|
(393
|
)
|
335
|
|
||||||||||
|
Europe
|
637
|
|
339
|
|
292
|
|
298
|
|
47
|
|
||||||||||
|
Asia
|
255
|
|
15
|
|
105
|
|
240
|
|
(90
|
)
|
||||||||||
|
Corporate
|
(423
|
)
|
(368
|
)
|
(481
|
)
|
(55
|
)
|
113
|
|
||||||||||
|
Total SBUs
|
$
|
2,884
|
|
$
|
2,134
|
|
$
|
1,791
|
|
$
|
750
|
|
$
|
343
|
|
|||||
_____________________________
|
(1)
|
Operating cash flow as presented above include the effect of intercompany transactions with other segments except for interest, tax sharing, charges for management fees and transfer pricing.
|
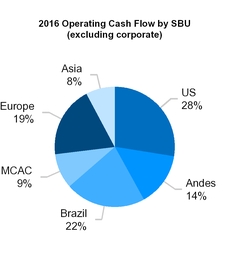
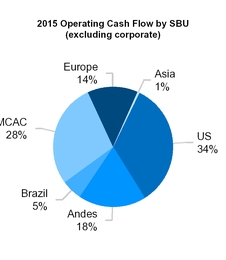

US SBU
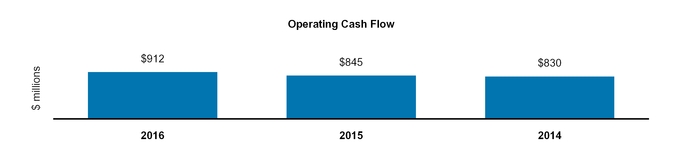
Fiscal Year
2016
versus
2015
The
increase
in Operating Cash Flow of
$67 million
was driven primarily by the following (in millions):
|
US SBU 2016 vs. 2015
|
||||
|
Timing of payments for accounts payable and consumption of inventory, primarily due to lower inventory purchases from inventory optimization efforts
|
$
|
142
|
|
|
|
Net impact of receivable settlements related to the 2016 sale of DPLER and the 2015 sale of MC
2
|
17
|
|
||
|
Lower payments for interest expense, primarily due to debt repayments at DPL, and lower interest rates
|
16
|
|
||
|
Timing of receivables collections, primarily due to higher rates at IPL, favorable weather in Q4 2016, and the impact of DPLER's declining customer base in 2015
|
(97
|
)
|
||
|
Lower operating margin, net of non-cash items (primarily depreciation of $28 and an $18 accrual impact from IPL's new rates)
|
(21
|
)
|
||
|
Other
|
10
|
|
||
|
Total US SBU Operating Cash Increase
|
$
|
67
|
|
|
110
Fiscal Year
2015
versus
2014
The
increase
in Operating Cash Flow of
$15 million
was driven primarily by the following (in millions):
|
US SBU 2015 vs. 2014
|
||||
|
Decrease in Operating Margin, net of non-cash items (primarily depreciation of $6)
|
$
|
(84
|
)
|
|
|
Collection of previously deferred storm costs at DPL
|
22
|
|
||
|
One-time payment occurring in 2014 at DPL to terminate an unfavorable coal contract
|
19
|
|
||
|
Settlement of receivables related to the sale of MC
2
|
16
|
|
||
|
Favorable timing of inventory purchases and power purchase payments
|
25
|
|
||
|
Increased A/R collections at IPL
|
12
|
|
||
|
Other
|
5
|
|
||
|
Total US SBU Operating Cash Increase
|
$
|
15
|
|
|
ANDES SBU

Fiscal Year
2016
versus
2015
The
increase
in Operating Cash Flow of
$13 million
was driven primarily by the following (in millions):
|
Andes SBU 2016 vs. 2015
|
||||
|
Higher operating margin, net of non-cash items (primarily depreciation of $44)
|
$
|
58
|
|
|
|
Higher collections at Chivor, primarily due to increased sales in Q4 2015
|
83
|
|
||
|
Collections of FONINVEMEM III receivables in Argentina, primarily as result of the commencement of operations at Termoelectrica Guillermo Brown in 2016
|
57
|
|
||
|
Impact from a prior year payment to unwind an interest rate swap as part of the Ventanas refinancing in July 2015
|
38
|
|
||
|
Lower VAT refunds due to projects entering COD at Cochrane and the timing of VAT Refunds at Alto Maipo
|
(107
|
)
|
||
|
Higher interest payments due primarily to new unsecured notes issued by Gener in July 2015 as part of the Ventanas refinancing
|
(29
|
)
|
||
|
Higher tax payments in Chile, primarily due to withholding taxes paid on Chilean distributions to AES affiliates
|
(29
|
)
|
||
|
Increase in income tax payments due to higher taxable income at Chivor
|
(28
|
)
|
||
|
Timing of collections at Gener
|
(22
|
)
|
||
|
Other
|
(8
|
)
|
||
|
Total Andes SBU Operating Cash Increase
|
$
|
13
|
|
|
Fiscal Year
2015
versus
2014
The
increase
in Operating Cash Flow of
$103 million
was driven primarily by the following (in millions):
|
Andes SBU 2015 vs. 2014
|
||||
|
Higher VAT refunds due to the construction of the Cochrane and Alto Maipo plants
|
$
|
153
|
|
|
|
Timing of non-recurring maintenance collections in Argentina
|
27
|
|
||
|
Lower interest payments at Chivor
|
15
|
|
||
|
Higher income tax payments at Chivor due to an increase in the tax rate and advance payments made in 2015
|
(37
|
)
|
||
|
Lower collections on contract sales at Chivor
|
(36
|
)
|
||
|
Impact from payments to unwind an interest rate swap as part of the Ventanas refinancing in July 2015
|
(38
|
)
|
||
|
Other
|
19
|
|
||
|
Total Andes SBU Operating Cash Increase
|
$
|
103
|
|
|
111
BRAZIL SBU
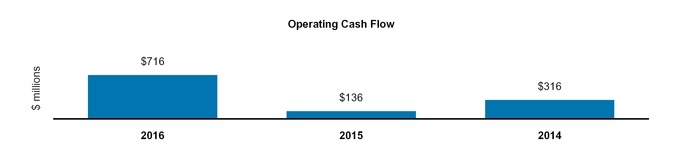
Fiscal Year
2016
versus
2015
The
increase
in Operating Cash Flow of
$580 million
was driven primarily by the following (in millions):
|
Brazil SBU 2016 vs. 2015
|
||||
|
Lower operating margin
(1)
, net of non-cash items (primarily a net $45 impact from contingency items at Eletropaulo)
|
$
|
(308
|
)
|
|
|
Timing of payments at Eletropaulo and Sul related to regulatory charges and tariff flags due to improved hydrology in 2016
|
(581
|
)
|
||
|
Collections of higher costs deferred in net regulatory assets at Eletropaulo and Sul as result of unfavorable hydrology in prior periods
|
974
|
|
||
|
Timing of collections on energy sales in the current year
|
416
|
|
||
|
Lower energy purchases at Tietê in the current year as result of favorable hydrology
|
93
|
|
||
|
Timing of non-income tax payments
|
28
|
|
||
|
Other
|
(42
|
)
|
||
|
Total Brazil SBU Operating Cash Increase
|
$
|
580
|
|
|
____________________________
|
(1)
|
Includes the results of AES Sul, which is excluded from continuing operations in the Condensed Consolidated Statements of Operations but is included within operating cash flow on the Condensed Consolidated Statements of Cash Flows. See Note
22
of Item 8.—
Notes to Condensed Consolidated Financial Statements
within this Form 10-K for further information.
|
Fiscal Year
2015
versus
2014
The
decrease
in Operating Cash Flow of
$180 million
was driven primarily by the following (in millions):
|
Brazil SBU 2015 vs. 2014
|
||||
|
Lower operating margin
(1)
, net of non-cash items (primarily a net $38 impact from contingency items at Eletropaulo)
|
$
|
(179
|
)
|
|
|
Timing of energy purchases in the spot market at Tietê at higher prices
|
(241
|
)
|
||
|
Timing of collections at Eletropaulo due to higher tarriffs
|
(41
|
)
|
||
|
Higher interest payments at Sul due to higher debt and a higher interest rate
|
(17
|
)
|
||
|
Timing of payments at Eletropaulo and Sul related to regulatory charges and tariff flags due to unfavorable hydrology
|
181
|
|
||
|
Lower income tax payments at Tietê due to lower taxable income in 2014
|
127
|
|
||
|
Collections of higher costs deferred in net regulatory assets at Eletropaulo and Sul as result of unfavorable hydrology in prior periods
|
53
|
|
||
|
Other
|
(63
|
)
|
||
|
Total Brazil SBU Operating Cash Decrease
|
$
|
(180
|
)
|
|
____________________________
|
(1)
|
Includes the results of AES Sul, which is excluded from continuing operations in the Condensed Consolidated Statements of Operations but is included within operating cash flow on the Condensed Consolidated Statements of Cash Flows. See Note
22
of Item 8.—
Notes to Condensed Consolidated Financial Statements
within this Form 10-K for further information
|
112
MCAC SBU
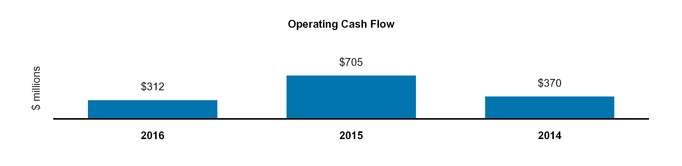
Fiscal Year
2016
versus
2015
The
decrease
in Operating Cash Flow of
$393 million
was driven primarily by the following (in millions):
|
MCAC SBU 2016 vs. 2015
|
||||
|
Collection of overdue receivables in September 2015 from distribution companies in the Dominican Republic
|
$
|
(243
|
)
|
|
|
Lower operating margin, net of non-cash items (primarily depreciation of $10)
|
(55
|
)
|
||
|
Lower collections from the off-taker in Puerto Rico, primarily due to lower sales from Q4 2015
|
(47
|
)
|
||
|
Compensation received in the prior year due to an early termination of the barge PPA by the off-taker in Panama
|
(20
|
)
|
||
|
Higher withholding taxes paid on dividend distributions to AES affiliates in the Dominican Republic
|
(16
|
)
|
||
|
Higher tax payments due to higher taxable income in El Salvador
|
(17
|
)
|
||
|
Other
|
5
|
|
||
|
Total MCAC SBU Operating Cash Decrease
|
$
|
(393
|
)
|
|
Fiscal Year
2015
versus
2014
The
increase
in Operating Cash Flow of
$335 million
was driven primarily by the following (in millions):
|
MCAC SBU 2015 vs. 2014
|
||||
|
Higher collections on contract sales in Panama
|
$
|
27
|
|
|
|
Collection of overdue receivables in September 2015 from distribution companies in the Dominican Republic
|
243
|
|
||
|
Lower energy purchases due to a decrease in fuel prices in El Salvador
|
22
|
|
||
|
Timing of collections from the off-taker in Puerto Rico
|
45
|
|
||
|
Compensation received due to an early termination of the barge PPA by the off-taker in Panama
|
20
|
|
||
|
Other
|
(22
|
)
|
||
|
Total MCAC SBU Operating Cash Increase
|
$
|
335
|
|
|
EUROPE SBU
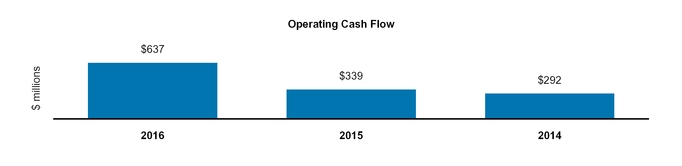
113
Fiscal Year
2016
versus
2015
The
increase
in Operating Cash Flow of
$298 million
was driven primarily by the following (in millions):
|
Europe SBU 2016 vs. 2015
|
||||
|
Increase in collections at Maritza from NEK (off-taker), net of payments to MMI (fuel supplier)
|
$
|
360
|
|
|
|
Timing of vendor payments
|
47
|
|
||
|
Lower operating margin, net of non cash items (primarily lower depreciation of $18)
|
(92
|
)
|
||
|
Decrease in CO
2
allowances due to a price decrease
|
(24
|
)
|
||
|
Other
|
7
|
|
||
|
Total Europe SBU Operating Cash Increase
|
$
|
298
|
|
|
Fiscal Year
2015
versus
2014
The
increase
in Operating Cash Flow of
$47 million
was driven primarily by the following (in millions):
|
Europe SBU 2015 vs. 2014
|
||||
|
Increase in collections at Maritza from NEK (off-taker), net of payments to MMI (fuel supplier)
|
$
|
69
|
|
|
|
Favorable timing of collections at IPP4
|
34
|
|
||
|
Lower operating margin
|
(102
|
)
|
||
|
Lower payments for interest expense
|
42
|
|
||
|
Other
|
4
|
|
||
|
Total Europe SBU Operating Cash Increase
|
$
|
47
|
|
|
ASIA SBU
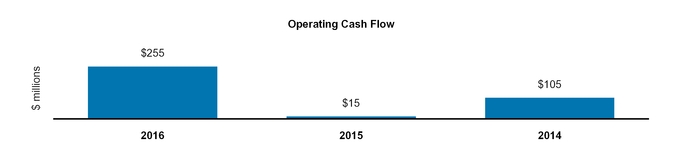
Fiscal Year
2016
versus
2015
The
increase
in Operating Cash Flow of
$240 million
was driven primarily by the following (in millions):
|
Asia SBU 2016 vs. 2015
|
||||
|
Reduction in service concession asset expenditures, net of previously capitalized interest payments
|
$
|
98
|
|
|
|
Higher operating margin, net of an increase of $48 in non-cash service concession amortization
|
69
|
|
||
|
Decrease in working capital requirements at Mong Duong as the plant was fully operational in 2016
|
58
|
|
||
|
Higher interest income as a result of the financing component under service concession accounting
|
34
|
|
||
|
Other
|
(19
|
)
|
||
|
Total Asia SBU Operating Cash Increase
|
$
|
240
|
|
|
Fiscal Year
2015
versus
2014
The
decrease
in Operating Cash Flow of
$90 million
was driven primarily by the following (in millions):
|
Asia SBU 2015 vs. 2014
|
||||
|
Service concession asset expenditures at Mong Duong
|
$
|
(165
|
)
|
|
|
Increase in interest payments at Mong Duong
|
(44
|
)
|
||
|
Higher working capital at Mong Duong, due to a build-up in preparation for commencement of plant operations
|
(50
|
)
|
||
|
Higher working capital at Masinloc, due primarily to the timing of coal purchases
|
(17
|
)
|
||
|
Higher tax payments at Masinloc
|
(21
|
)
|
||
|
Higher interest income as a result of the financing component under service concession accounting
|
115
|
|
||
|
Higher operating margin, net of non-cash items (primarily $33 in service concession amortization and a $15 retrospective adjustment to energy prices in 2014)
|
91
|
|
||
|
Other
|
1
|
|
||
|
Total Asia SBU Operating Cash Decrease
|
$
|
(90
|
)
|
|
114
CORPORATE AND OTHER
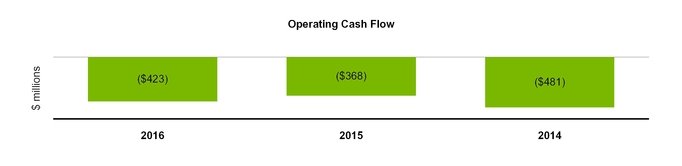
Fiscal Year
2016
versus
2015
The
decrease
in Operating Cash Flow of
$55 million
was driven primarily by the following (in millions):
|
Corporate and Other 2016 vs. 2015
|
||||
|
Lower interest payments due principal repayments on debt
|
$
|
18
|
|
|
|
Decrease in cash from net settlements of FX and oil derivatives
|
(40
|
)
|
||
|
Higher payments for people-related costs, primarily due to health benefit costs and severance
|
(25
|
)
|
||
|
Other
|
(8
|
)
|
||
|
Total Corporate and Other Operating Cash Decrease
|
$
|
(55
|
)
|
|
Fiscal Year
2015
versus
2014
The
increase
in Operating Cash Flow of
$113 million
was driven primarily by the following (in millions):
|
Corporate and Other 2015 vs. 2014
|
||||
|
Lower interest payments due primarily to corporate debt refinancing
|
$
|
60
|
|
|
|
Impact of swap termination payments occurring in the prior year related to corporate debt refinancing
|
22
|
|
||
|
Reduction in people-related costs, primarily due to benefit costs
|
16
|
|
||
|
Increase in collections from realized gains resulting from the settlement of foreign currency derivatives
|
15
|
|
||
|
Total Corporate and Other Operating Cash Increase
|
$
|
113
|
|
|
Parent Company Liquidity
The following discussion of Parent Company Liquidity has been included because we believe it is a useful measure of the liquidity available to The AES Corporation, or the Parent Company, given the non-recourse nature of most of our indebtedness. Parent Company Liquidity as outlined below is a non-GAAP measure and should not be construed as an alternative to cash and cash equivalents which are determined in accordance with GAAP, as a measure of liquidity. Cash and cash equivalents are disclosed in the consolidated statements of cash flows. Parent Company Liquidity may differ from similarly titled measures used by other companies. The principal sources of liquidity at the Parent Company level are dividends and other distributions from our subsidiaries, including refinancing proceeds; proceeds from debt and equity financings at the Parent Company level, including availability under our credit facility; and proceeds from asset sales. Cash requirements at the Parent Company level are primarily to fund interest; principal repayments of debt; construction commitments; other equity commitments; common stock repurchases; acquisitions; taxes; Parent Company overhead and development costs; and dividends on common stock.
The Company defines Parent Company Liquidity as cash available to the Parent Company plus available borrowings under existing credit facility. The cash held at qualified holding companies represents cash sent to subsidiaries of the Company domiciled outside of the U.S.. Such subsidiaries have no contractual restrictions on their ability to send cash to the Parent Company. Parent Company Liquidity is reconciled to its most directly comparable U.S. GAAP financial measure,
Cash and cash equivalents
, at
December 31, 2016
and
2015
as follows:
115
|
Parent Company Liquidity
(in millions)
|
2016
|
2015
|
||||||
|
Consolidated cash and cash equivalents
|
$
|
1,305
|
|
$
|
1,257
|
|
||
|
Less: Cash and cash equivalents at subsidiaries
|
1,205
|
|
857
|
|
||||
|
Parent and qualified holding companies' cash and cash equivalents
|
100
|
|
400
|
|
||||
|
Commitments under Parent credit facility
|
800
|
|
800
|
|
||||
|
Less: Letters of credit under the credit facilities
|
(6
|
)
|
(62
|
)
|
||||
|
Borrowings available under Parent credit facilities
|
794
|
|
738
|
|
||||
|
Total Parent Company Liquidity
|
$
|
894
|
|
$
|
1,138
|
|
||
The Company paid dividends of $0.44 per share to its common stockholders during the year ended
December 31, 2016
. While we intend to continue payment of dividends and believe we will have sufficient liquidity to do so, we can provide no assurance that we will continue to pay dividends, or if continued, the amount of such dividends.
Recourse Debt
— Our recourse debt at year-end was approximately
$4.7 billion
and
$5.0 billion
in
2016
and
2015
, respectively. See Note
11
—
Debt
in Item 8.—
Financial Statements and Supplementary Data
of this Form 10-K for additional detail.
While we believe that our sources of liquidity will be adequate to meet our needs for the foreseeable future, this belief is based on a number of material assumptions, including, without limitation, assumptions about our ability to access the capital markets (see
Key Trends and Uncertainties
—
Global Economic Conditions
), the operating and financial performance of our subsidiaries, currency exchange rates, power market pool prices, and the ability of our subsidiaries to pay dividends. In addition, our subsidiaries' ability to declare and pay cash dividends to us (at the Parent Company level) is subject to certain limitations contained in loans, governmental provisions and other agreements. We can provide no assurance that these sources will be available when needed or that the actual cash requirements will not be greater than anticipated. See Item 1A.—
Risk Factors
—
The AES Corporation is a holding company and its ability to make payments on its outstanding indebtedness, including its public debt securities, is dependent upon the receipt of funds from its subsidiaries by way of dividends, fees, interest, loans or otherwise,
of this Form 10-K.
Various debt instruments at the Parent Company level, including our senior secured credit facility, contain certain restrictive covenants. The covenants provide for — among other items — limitations on other indebtedness, liens, investments and guarantees; limitations on dividends, stock repurchases and other equity transactions; restrictions and limitations on mergers and acquisitions, sales of assets, leases, transactions with affiliates and off-balance sheet and derivative arrangements; maintenance of certain financial ratios; and financial and other reporting requirements.
As of December 31,
2016
, we were in compliance with these covenants at the Parent Company level.
Non-Recourse Debt
— While the lenders under our non-recourse debt financings generally do not have direct recourse to the Parent Company, defaults thereunder can still have important consequences for our results of operations and liquidity, including, without limitation:
|
•
|
reducing our cash flows as the subsidiary will typically be prohibited from distributing cash to the Parent Company during the time period of any default;
|
|
•
|
triggering our obligation to make payments under any financial guarantee, letter of credit or other credit support we have provided to or on behalf of such subsidiary;
|
|
•
|
causing us to record a loss in the event the lender forecloses on the assets; and
|
|
•
|
triggering defaults in our outstanding debt at the Parent Company.
|
For example, our senior secured credit facility and outstanding debt securities at the Parent Company include events of default for certain bankruptcy related events involving material subsidiaries. In addition, our revolving credit agreement at the Parent Company includes events of default related to payment defaults and accelerations of outstanding debt of material subsidiaries.
Some of our subsidiaries are currently in default with respect to all or a portion of their outstanding indebtedness. The total non-recourse debt classified as current in the accompanying Consolidated Balance Sheets amounts to
$1.3 billion
. The portion of current debt related to such defaults was
$128 million
at
December 31, 2016
, all of which was non-recourse debt related to two subsidiaries — Kavarna, and Sogrinsk. See Note
11
—
Debt
in Item 8.—
Financial Statements and Supplementary Data
of this Form 10-K for additional detail.
None of the subsidiaries that are currently in default are subsidiaries that met the applicable definition of materiality under AES' corporate debt agreements as of
December 31, 2016
in order for such defaults to trigger an event of default or permit acceleration under AES' indebtedness. However, as a result of additional dispositions of
116
assets, other significant reductions in asset carrying values or other matters in the future that may impact our financial position and results of operations or the financial position of the individual subsidiary, it is possible that one or more of these subsidiaries could fall within the definition of a "material subsidiary" and thereby upon an acceleration trigger an event of default and possible acceleration of the indebtedness under the Parent Company's outstanding debt securities. A material subsidiary is defined in the Company's senior secured revolving credit facility as any business that contributed 20% or more of the Parent Company's total cash distributions from businesses for the four most recently completed fiscal quarters. As of
December 31, 2016
, none of the defaults listed above individually or in the aggregate results in or is at risk of triggering a cross-default under the recourse debt of the Company.
Contractual Obligations and Parent Company Contingent Contractual Obligations
A summary of our contractual obligations, commitments and other liabilities as of December 31,
2016
is presented below and excludes any businesses classified as discontinued operations or held-for-sale (in millions):
|
Contractual Obligations
|
Total
|
Less than 1 year
|
1-3 years
|
3-5 years
|
More than 5 years
|
Other
|
Footnote Reference
(4)
|
|||||||||||||||||||
|
Debt Obligations
(1)
|
$
|
20,949
|
|
$
|
1,339
|
|
$
|
2,897
|
|
$
|
5,115
|
|
$
|
11,598
|
|
$
|
—
|
|
11
|
|
||||||
|
Interest Payments on Long-Term Debt
(2)
|
7,945
|
|
1,160
|
|
1,962
|
|
1,511
|
|
3,312
|
|
—
|
|
n/a
|
|
||||||||||||
|
Capital Lease Obligations
|
165
|
|
25
|
|
32
|
|
19
|
|
89
|
|
—
|
|
12
|
|
||||||||||||
|
Operating Lease Obligations
|
1,374
|
|
84
|
|
181
|
|
183
|
|
926
|
|
—
|
|
12
|
|
||||||||||||
|
Electricity Obligations
|
33,106
|
|
2,513
|
|
4,874
|
|
5,454
|
|
20,265
|
|
—
|
|
12
|
|
||||||||||||
|
Fuel Obligations
|
5,163
|
|
1,609
|
|
1,213
|
|
916
|
|
1,425
|
|
—
|
|
12
|
|
||||||||||||
|
Other Purchase Obligations
|
14,009
|
|
2,966
|
|
3,260
|
|
1,771
|
|
6,012
|
|
—
|
|
12
|
|
||||||||||||
|
Other Long-Term Liabilities Reflected on AES' Consolidated Balance Sheet under GAAP
(3)
|
783
|
|
—
|
|
264
|
|
41
|
|
430
|
|
48
|
|
n/a
|
|
||||||||||||
|
Total
|
$
|
83,494
|
|
$
|
9,696
|
|
$
|
14,683
|
|
$
|
15,010
|
|
$
|
44,057
|
|
$
|
48
|
|
||||||||
_____________________________
|
(1)
|
Includes recourse and non-recourse debt presented on the Consolidated Balance Sheet. These amounts exclude capital lease obligations which are included in the capital lease category.
|
|
(2)
|
Interest payments are estimated based on final maturity dates of debt securities outstanding at December 31,
2016
and do not reflect anticipated future refinancing, early redemptions or new debt issuances. Variable rate interest obligations are estimated based on rates as of December 31,
2016
.
|
|
(3)
|
These amounts do not include current liabilities on the Consolidated Balance Sheet except for the current portion of uncertain tax obligations. Noncurrent uncertain tax obligations are reflected in the "Other" column of the table above as the Company is not able to reasonably estimate the timing of the future payments. In addition, these amounts do not include: (1) regulatory liabilities (See Note
10
—
Regulatory Assets and Liabilities
), (2) contingencies (See Note
13
—
Contingencies
), (3) pension and other post retirement employee benefit liabilities (see Note
14
—
Benefit Plans
), (4) derivatives and incentive compensation (See Note
5
—
Derivative Instruments and Hedging Activities
) or (5) any taxes (See Note
21
—
Income Taxes
) except for uncertain tax obligations, as the Company is not able to reasonably estimate the timing of future payments. See the indicated notes to the Consolidated Financial Statements included in Item 8 of this Form 10-K for additional information on the items excluded.
|
|
(4)
|
For further information see the note referenced below in Item 8.—
Financial Statements and Supplementary Data
of this Form 10-K.
|
The following table presents our Parent Company's contingent contractual obligations as of December 31,
2016
:
|
Contingent contractual obligations ($ in millions)
|
Amount
|
Number of Agreements
|
Maximum Exposure Range for Each Agreement
|
||||
|
Guarantees and commitments
|
$
|
508
|
|
18
|
$8 - 58
|
||
|
Letters of Credit under the unsecured credit facility
|
245
|
|
8
|
$2 - 73
|
|||
|
Asset sale related indemnities
(1)
|
27
|
|
1
|
27
|
|||
|
Letters of Credit under the senior secured credit facility
|
6
|
|
15
|
<$1 - 1
|
|||
|
Cash collateralized letters of credit
|
3
|
|
1
|
3
|
|||
|
Total
|
$
|
789
|
|
43
|
|||
_____________________________
|
(1)
|
Excludes normal and customary representations and warranties in agreements for the sale of assets (including ownership in associated legal entities) where the associated risk is considered to be nominal.
|
As of December 31,
2016
, the Company had
no
commitments to invest in subsidiaries under construction and to purchase related equipment that were not included in the letters of credit disclosed above.
We have a diverse portfolio of performance-related contingent contractual obligations. These obligations are designed to cover potential risks and only require payment if certain targets are not met or certain contingencies occur. The risks associated with these obligations include change of control, construction cost overruns, subsidiary default, political risk, tax indemnities, spot market power prices, sponsor support and liquidated damages under power sales agreements for projects in development, in operation and under construction. In addition, we have an asset sale program through which we may have customary indemnity obligations under certain assets sale agreements. While we do not expect that we will be required to fund any material amounts under these contingent contractual obligations beyond
2016
, many of the events which would give rise to such obligations are beyond our control. We can provide no assurance that we will be able to fund our obligations under these contingent contractual obligations if we are required to make substantial payments thereunder.
117
Critical Accounting Policies and Estimates
The Consolidated Financial Statements of AES are prepared in conformity with U.S. GAAP, which requires the use of estimates, judgments and assumptions that affect the reported amounts of assets and liabilities at the date of the financial statements and the reported amounts of revenue and expenses during the periods presented. AES' significant accounting policies are described in Note
1
—
General and Summary of Significant Accounting Policies
to the Consolidated Financial Statements included in Item 8 of this Form 10-K.
An accounting estimate is considered critical if the estimate requires management to make assumptions about matters that were highly uncertain at the time the estimate was made; different estimates reasonably could have been used; or the impact of the estimates and assumptions on financial condition or operating performance is material.
Management believes that the accounting estimates employed are appropriate and the resulting balances are reasonable; however, actual results could materially differ from the original estimates, requiring adjustments to these balances in future periods. Management has discussed these critical accounting policies with the Audit Committee, as appropriate. Listed below are the Company's most significant critical accounting estimates and assumptions used in the preparation of the Consolidated Financial Statements.
Income Taxes
— We are subject to income taxes in both the U.S. and numerous foreign jurisdictions. Our worldwide income tax provision requires significant judgment and is based on calculations and assumptions that are subject to examination by the Internal Revenue Service and other taxing authorities. The Company and certain of its subsidiaries are under examination by relevant taxing authorities for various tax years. The Company regularly assesses the potential outcome of these examinations in each tax jurisdiction when determining the adequacy of the provision for income taxes. Accounting guidance for uncertainty in income taxes prescribes a more likely than not recognition threshold. Tax reserves have been established, which the Company believes to be adequate in relation to the potential for additional assessments. Once established, reserves are adjusted only when there is more information available or when an event occurs necessitating a change to the reserves. While the Company believes that the amounts of the tax estimates are reasonable, it is possible that the ultimate outcome of current or future examinations may be materially different than the reserve amounts.
Because we have a wide range of statutory tax rates in the multiple jurisdictions in which we operate, any changes in our geographical earnings mix could materially impact our effective tax rate. Furthermore, our tax position could be adversely impacted by changes in tax laws, tax treaties or tax regulations or the interpretation or enforcement thereof and such changes may be more likely or become more likely in view of recent economic trends in certain of the jurisdictions in which we operate. As an example, new tax laws were enacted in February 2016 in Chile which increased the statutory income tax rate for most of our Chilean businesses from 25% to 25.5% in 2017 and to 27% for 2018 and future years. Accordingly, in 2016 our net Chilean deferred tax liabilities were remeasured to the new rates. The remeasurement amount and other potential future impacts of the changes in tax law may be material to continuing operations. See Note
21
—
Income Taxes
to the Consolidated Financial Statements included in Item 8 of this Form 10-K for additional information.
The Company's provision for income taxes could be adversely impacted by changes to the U.S. taxation of earnings of our foreign subsidiaries. Since 2006, the Company has benefited from the Controlled Foreign Corporation look-through rule, originally enacted in the TIPRA of 2005, subject to five temporary extensions, including the most recent five year retroactive extension enacted on December 18, 2015 in the H.R.2029 - Consolidated Appropriations Act, 2016. There can be no assurance that this provision will continue to be extended beyond December 31, 2019. Further, the U.S. is considering corporate tax reform that may significantly change corporate tax rates, business rules such as interest deductibility and capital expenditure cost recovery, and U.S. international tax rules. Our expected effective tax rate could increase by amounts that may be material to the Company should such reforms be enacted.
In addition, U.S. income taxes and foreign withholding taxes have not been provided on undistributed earnings for certain of our non-U.S. subsidiaries to the extent such earnings are considered to be indefinitely reinvested in the operations of those subsidiaries.
Deferred tax assets and liabilities are recognized for the future tax consequences attributable to differences between the financial statement carrying amounts of the existing assets and liabilities, and their respective income tax bases. The Company establishes a valuation allowance when it is more likely than not that all or a portion of a deferred tax asset will not be realized.
Sales of Noncontrolling Interests
— The accounting for a sale of noncontrolling interests under the accounting standards depends on whether the sale is considered to be a sale of in-substance real estate (as
118
opposed to an equity transaction), where the gain (loss) on sale would be recognized in earnings rather than within stockholders' equity. If management's estimation process determines that there is no significant value beyond the in-substance real estate, the gain (loss) on the sale of the noncontrolling interest is recognized in earnings. However, if it is determined that significant value likely exists beyond the in-substance real estate, the gain (loss) on the sale of the noncontrolling interest would be recognized within stockholders' equity. In-substance real estate is comprised of land plus improvements and integral equipment. The determination of whether property, plant and equipment is integral equipment is based on the significance of the costs to remove the equipment from its existing location (including the cost of repairing damage resulting from the removal), combined with the decrease in the fair value of the equipment as a result of those removal activities. When the combined total of removal costs and the decrease in fair value of the equipment exceeds 10% of the fair value of the equipment, the equipment is considered integral equipment. The accounting standards specifically identify power plants as an example of in-substance real estate. Where the consolidated entity in which noncontrolling interests have been sold contains in-substance real estate, management estimates the extent to which the total fair value of the assets of the entity is represented by the in-substance real estate and whether significant value exists beyond the in-substance real estate. This estimation considers all qualitative and quantitative factors relevant for each sale and, where appropriate, includes making quantitative estimates about the fair value of the entity and its identifiable assets and liabilities (including any favorable or unfavorable contracts) by analogy to the accounting standards on business combinations. As such, these estimates may require significant judgment and assumptions, similar to the critical accounting estimates discussed below for impairments and fair value.
Impairments
— Our accounting policies on goodwill and long-lived assets are described in detail in Note
1
—
General and Summary of Significant Accounting Policies
, included in Item 8 of this Form 10-K. The Company makes considerable judgments in its impairment evaluations of goodwill and long-lived assets; however, the fair value determination is typically the most judgmental part in an impairment evaluation.
The Company determines the fair value of a reporting unit or a long-lived asset (asset group) by applying the approaches prescribed under the fair value measurement accounting framework. Generally, the market approach and income approach are most relevant in the fair value measurement of our reporting units and long-lived assets; however, due to the lack of available relevant observable market information in many circumstances, the Company often relies on the income approach. The Company may engage an independent valuation firm to assist management with the valuation. The decision to engage an independent valuation firm considers all relevant facts and circumstances, including a cost-benefit analysis and the Company's internal valuation knowledge of the long-lived asset (asset group) or business. The Company develops the underlying assumptions consistent with its internal budgets and forecasts for such valuations. Additionally, the Company uses an internal discounted cash flow valuation model (the "DCF model"), based on the principles of present value techniques, to estimate the fair value of its reporting units or long-lived assets under the income approach. The DCF model estimates fair value by discounting our internal budgets and cash flow forecasts, adjusted to reflect market participant assumptions, to the extent necessary, at an appropriate discount rate.
Management applies considerable judgment in selecting several input assumptions during the development of our internal budgets and cash flow forecasts. Examples of the input assumptions that our budgets and forecasts are sensitive to include macroeconomic factors such as growth rates, industry demand, inflation, exchange rates, power prices and commodity prices. Whenever appropriate, management obtains these input assumptions from observable market data sources (e.g., Economic Intelligence Unit) and extrapolates the market information if an input assumption is not observable for the entire forecast period. Many of these input assumptions are dependent on other economic assumptions, which are often derived from statistical economic models with inherent limitations such as estimation differences. Further, several input assumptions are based on historical trends which often do not recur. The input assumptions most significant to our budgets and cash flows are based on expectations of macroeconomic factors which have been volatile recently. It is not uncommon that different market data sources have different views of the macroeconomic factor expectations and related assumptions. As a result, macroeconomic factors and related assumptions are often available in a narrow range; however, in some situations these ranges become wide and the use of a different set of input assumptions could produce significantly different budgets and cash flow forecasts.
A considerable amount of judgment is also applied in the estimation of the discount rate used in the DCF model. To the extent practical, inputs to the discount rate are obtained from market data sources (e.g., Bloomberg, Capital IQ, etc.). The Company selects and uses a set of publicly traded companies from the relevant industry to estimate the discount rate inputs. Management applies judgment in the selection of such companies based on its view of the most likely market participants. It is reasonably possible that the selection of a different set of likely market participants could produce different input assumptions and result in the use of a different discount rate.
119
Fair value of a reporting unit or a long-lived asset (asset group) is sensitive to both input assumptions to our budgets and cash flow forecasts and the discount rate. Further, estimates of long-term growth and terminal value are often critical to the fair value determination. As part of the impairment evaluation process, management analyzes the sensitivity of fair value to various underlying assumptions. The level of scrutiny increases as the gap between fair value and carrying amount decreases. Changes in any of these assumptions could result in management reaching a different conclusion regarding the potential impairment, which could be material. Our impairment evaluations inherently involve uncertainties from uncontrollable events that could positively or negatively impact the anticipated future economic and operating conditions.
Further discussion of the impairment charges recognized by the Company can be found within Note
9
—
Goodwill and Other Intangible Assets,
Note
20
—
Asset Impairment Expense
and Note
8
—
Other Non-Operating Expense
to the Consolidated Financial Statements included in Item 8 of this Form 10-K.
Fair Value
Fair Value Hierarchy
— The Company uses valuation techniques and methodologies that maximize the use of observable inputs and minimize the use of unobservable inputs. Where available, fair value is based on observable market prices or parameters or derived from such prices or parameters. Where observable prices are not available, valuation models are applied to estimate the fair value using the available observable inputs. The valuation techniques involve some level of management estimation and judgment, the degree of which is dependent on the price transparency for the instruments or market and the instruments' complexity.
To increase consistency and enhance disclosure of the fair value of financial instruments, the fair value measurement standard includes a fair value hierarchy to prioritize the inputs used to measure fair value into three categories. An asset or liability's level within the fair value hierarchy is based on the lowest level of input significant to the fair value measurement, where Level 1 is the highest and Level 3 is the lowest. For more information regarding the fair value hierarchy, see Note 1—
General and Summary of Significant Accounting Policies
included in Item 8 of this Form 10-K.
Fair Value of Financial Instruments
— A significant number of the Company's financial instruments are carried at fair value with changes in fair value recognized in earnings or other comprehensive income each period. The Company makes estimates regarding the valuation of assets and liabilities measured at fair value in preparing the Consolidated Financial Statements. These assets and liabilities include short and long-term investments in debt and equity securities, included in the balance sheet line items
Short-term investments
and
Other assets (Noncurrent)
, derivative assets, included in
Other current asset
s and
Other assets (Noncurrent)
and derivative liabilities, included in
Accrued and other liabilities (current)
and
Other long-term liabilities
. Investments are generally fair valued based on quoted market prices or other observable market data such as interest rate indices. The Company's investments are primarily certificates of deposit, government debt securities and money market funds. Derivatives are valued using observable data as inputs into internal valuation models. The Company's derivatives primarily consist of interest rate swaps, foreign currency instruments, and commodity and embedded derivatives. Additional discussion regarding the nature of these financial instruments and valuation techniques can be found in Note
4
—
Fair Value
included in Item 8 of this Form 10-K.
Fair Value of Nonfinancial Assets and Liabilities
— Significant estimates are made in determining the fair value of long-lived tangible and intangible assets (i.e., property, plant and equipment, intangible assets and goodwill) during the impairment evaluation process. In addition, the majority of assets acquired and liabilities assumed in a business combination are required to be recognized at fair value under the relevant accounting guidance. In determining the fair value of these items, management makes several assumptions as discussed in the Impairments section above.
Accounting for Derivative Instruments and Hedging Activities
— We enter into various derivative transactions in order to hedge our exposure to certain market risks. We primarily use derivative instruments to manage our interest rate, commodity and foreign currency exposures. We do not enter into derivative transactions for trading purposes.
In accordance with the accounting standards for derivatives and hedging, we recognize all derivatives as either assets or liabilities in the balance sheet and measure those instruments at fair value except where derivatives qualify and are designated as "normal purchase/normal sale" transactions. Changes in fair value of derivatives are recognized in earnings unless specific hedge criteria are met. Income and expense related to derivative instruments are recognized in the same category as that generated by the underlying asset or liability. See Note
5
—
Derivative Instruments and Hedging Activities
included in Item 8 of this Form 10-K for further information on the classification.
120
The accounting standards for derivatives and hedging enable companies to designate qualifying derivatives as hedging instruments based on the exposure being hedged. These hedge designations include fair value hedges and cash flow hedges. Changes in the fair value of a derivative that is highly effective and is designated and qualifies as a fair value hedge, are recognized in earnings as offsets to the changes in fair value of the exposure being hedged. The Company has no fair value hedges at this time. Changes in the fair value of a derivative that is highly effective and is designated as and qualifies as a cash flow hedge, are deferred in accumulated other comprehensive income and are recognized into earnings as the hedged transactions occur. Any ineffectiveness is recognized in earnings immediately. For all hedge contracts, the Company provides formal documentation of the hedge and effectiveness testing in accordance with the accounting standards for derivatives and hedging.
The fair value measurement accounting standard provides additional guidance on the definition of fair value and defines fair value as the price that would be received to sell an asset or paid to transfer a liability in an orderly transaction between market participants at the measurement date, or exit price. The fair value measurement standard requires the Company to consider and reflect the assumptions of market participants in the fair value calculation. These factors include nonperformance risk (the risk that the obligation will not be fulfilled) and credit risk, both of the reporting entity (for liabilities) and of the counterparty (for assets). Due to the nature of the Company's interest rate swaps, which are typically associated with non-recourse debt, credit risk for AES is evaluated at the subsidiary level rather than at the Parent Company level. Nonperformance risk on the Company's derivative instruments is an adjustment to the initial asset/liability fair value position that is derived from internally developed valuation models that utilize observable market inputs.
As a result of uncertainty, complexity and judgment, accounting estimates related to derivative accounting could result in material changes to our financial statements under different conditions or utilizing different assumptions. As a part of accounting for these derivatives, we make estimates concerning nonperformance, volatilities, market liquidity, future commodity prices, interest rates, credit ratings (both ours and our counterparty's), and future exchange rates. Refer to Note
4
—
Fair Value
included in Item 8 of this Form 10-K for additional details.
The fair value of our derivative portfolio is generally determined using internal and third party valuation models, most of which are based on observable market inputs including interest rate curves and forward and spot prices for currencies and commodities. The Company derives most of its financial instrument market assumptions from market efficient data sources (e.g., Bloomberg, Reuters and Platt's). In some cases, where market data is not readily available, management uses comparable market sources and empirical evidence to derive market assumptions to determine a financial instrument's fair value. In certain instances, the published curve may not extend through the remaining term of the contract and management must make assumptions to extrapolate the curve. Specifically, where there is limited forward curve data with respect to foreign exchange contracts, beyond the traded points the Company utilizes the purchasing power parity approach to construct the remaining portion of the forward curve using relative inflation rates. Additionally, in the absence of quoted prices, we may rely on "indicative pricing" quotes from financial institutions to input into our valuation model for certain of our foreign currency swaps. These indicative pricing quotes do not constitute either a bid or ask price and therefore are not considered observable market data. For individual contracts, the use of different valuation models or assumptions could have a material effect on the calculated fair value.
Regulatory Assets
— Management continually assesses whether the regulatory assets are probable of future recovery by considering factors such as applicable regulatory changes, recent rate orders applicable to other regulated entities and the status of any pending or potential deregulation legislation. If future recovery of costs ceases to be probable, any asset write-offs would be required to be recognized in operating income.
Consolidation
— The Company has recently entered into several transactions whereby the Company sells an interest in its controlled subsidiaries and/or equity method investments. In connection with each transaction, the Company must determine whether the sale of the interest impacts the Company's consolidation conclusion by first determining whether the transaction should be evaluated under the variable interest model or the voting model. In determining which consolidation model applies to the transaction, the Company is required to make judgments about how the entity operates, the most significant of which are whether (i) the entity has sufficient equity to finance its activities, (ii) the equity holders, as a group, have the characteristics of a controlling financial interest, and (iii) whether the entity has non-substantive voting rights.
If the entity is determined to be a variable interest entity, the most significant judgment in determining whether the Company must consolidate the entity is whether the Company, including its related parties and de facto agents, collectively have power and benefits. If AES is determined to have power and benefits, the entity will be consolidated by AES.
121
Alternatively, if the entity is determined to be a voting model entity, the most significant judgments involve determining whether the non-AES shareholders have substantive participating rights. The assessment of shareholder rights and whether they are substantive participating rights requires significant judgment since the rights provided under shareholders' agreements may include selecting, terminating, and setting the compensation of management responsible for implementing the subsidiary's policies and procedures, establishing operating and capital decisions of the entity, including budgets, in the ordinary course of business. On the other hand, if shareholder rights are only protective in nature (referred to as protective rights) then such rights would not overcome the presumption that the owner of a majority voting interest shall consolidate its investee. Significant judgment is required to determine whether minority rights represent substantive participating rights or protective rights that do not affect the evaluation of control. While both represent an approval or veto right, a distinguishing factor is the underlying activity or action to which the right relates.
Pension and Other Postretirement Plans
— Effective January 1, 2016 the Company applied a disaggregated discount rate approach for determining service cost and interest cost for its defined benefit pension plans and post-retirement plans in the U.S. and U.K. Refer to Note
1
—
General and Summary of Significant Accounting Policies
included in Item 8 of this Form 10-K for further information.
New Accounting Pronouncements
—
See Note
1
—
General and Summary of Significant Accounting Policies
included in Item 8 of this Form 10-K for further information about new accounting pronouncements adopted during
2016
and accounting pronouncements issued but not yet effective.
Overview Regarding Market Risks
— Our businesses are exposed to and proactively manage market risk. Our primary market risk exposure is to the price of commodities, particularly electricity, oil, natural gas, coal and environmental credits. In addition, our businesses are also exposed to lower electricity prices due to increased competition, including from renewable sources such as wind and solar, as a result of lower costs of entry and lower variable costs. We operate in multiple countries and as such are subject to volatility in exchange rates at varying degrees at the subsidiary level and between our functional currency, the U.S. Dollar, and currencies of the countries in which we operate. We are also exposed to interest rate fluctuations due to our issuance of debt and related financial instruments.
The disclosures presented in this Item 7A are based upon a number of assumptions; actual effects may differ. The safe harbor provided in Section 27A of the Securities Act of 1933 and Section 21E of the Securities Exchange Act of 1934 shall apply to the disclosures contained in this Item 7A. For further information regarding market risk, see Item 1A.—
Risk Factors
,
Our financial position and results of operations may fluctuate significantly due to fluctuations in currency exchange rates experienced at our foreign operations
,
Our businesses may incur substantial costs and liabilities and be exposed to price volatility as a result of risks associated with the electricity markets, which could have a material adverse effect on our financial performance,
and
We may not be adequately hedged against our exposure to changes in commodity prices or interest rates
of this
2016
Form 10-K.
Commodity Price Risk
— Although we prefer to hedge our exposure to the impact of market fluctuations in the price of electricity, fuels and environmental credits, some of our generation businesses operate under short-term sales or under contract sales that leave an unhedged exposure on some of our capacity or through imperfect fuel pass-throughs. In our utility businesses, we may be exposed to commodity price movements depending on our excess or shortfall of generation relative to load obligations and sharing or pass-through mechanisms. These businesses subject our operational results to the volatility of prices for electricity, fuels and environmental credits in competitive markets. We employ risk management strategies to hedge our financial performance against the effects of fluctuations in energy commodity prices. The implementation of these strategies can involve the use of physical and financial commodity contracts, futures, swaps and options. At our generation businesses for 2017-2019, 75% to 80% of our variable margin is hedged against changes in commodity prices. At our utility businesses for 2017-2019, 85% to 90% of our variable margin is insulated from changes in commodity prices.
The portion of our sales and purchases that are not subject to such agreements or contracted businesses where indexation is not perfectly matched to business drivers will be exposed to commodity price risk. When hedging the output of our generation assets, we utilize contract sales that lock in the spread per MWh between variable costs and the price at which the electricity can be sold.
AES businesses will see changes in variable margin performance as global commodity prices shift. For 2017, we project pretax earnings exposure on a 10% move in commodity prices would be approximately $15 million for U.S. power (DPL), $5 million for natural gas, $5 million for oil and $10 million for coal.
Our estimates exclude correlation of oil with coal or natural gas. For example, a decline in oil or natural gas prices can be accompanied by
122
a decline in coal price if commodity prices are correlated. In aggregate, the Company's downside exposure occurs with lower oil, lower natural gas, and higher coal prices. Exposures at individual businesses will change as new contracts or financial hedges are executed, and our sensitivity to changes in commodity prices generally increases in later years with reduced hedge levels at some of our businesses.
Commodity prices affect our businesses differently depending on the local market characteristics and risk management strategies. Spot power prices, contract indexation provisions and generation costs can be directly or indirectly affected by movements in the price of natural gas, oil and coal. We have some natural offsets across our businesses such that low commodity prices may benefit certain businesses and be a cost to others. Exposures are not perfectly linear or symmetric. The sensitivities are affected by a number of local or indirect market factors. Examples of these factors include hydrology, local energy market supply/demand balances, regional fuel supply issues, regional competition, bidding strategies and regulatory interventions such as price caps. Operational flexibility changes the shape of our sensitivities. For instance, certain power plants may limit downside exposure by reducing dispatch in low market environments. Volume variation also affects our commodity exposure. The volume sold under contracts or retail concessions can vary based on weather and economic conditions resulting in a higher or lower volume of sales in spot markets. Thermal unit availability and hydrology can affect the generation output available for sale and can affect the marginal unit setting power prices.
In the US SBU, the generation businesses are largely contracted but may have residual risk to the extent contracts are not perfectly indexed to the business drivers. IPL primarily generates energy to meet its retail customer demand however it opportunistically sells surplus economic energy into wholesale markets at market prices. Additionally, at DPL, competitive retail markets permit our customers to select alternative energy suppliers or elect to remain in aggregated customer pools for which energy is supplied by third party suppliers through a competitive auction process. DPL participates in these auctions held by other utilities and sells the remainder of its economic energy into the wholesale market. Given that natural gas-fired generators generally get energy prices for many markets, higher natural gas prices tend to expand our coal fixed margins. Our non-contracted generation margins are impacted by many factors including the growth in natural gas-fired generation plants, new energy supply from renewable sources, and increasing energy efficiency.
In the Andes SBU, our business in Chile owns assets in the central and northern regions of the country and has a portfolio of contract sales in both. In the central region, the contract sales generally cover the efficient generation from our coal-fired and hydroelectric assets. Any residual spot price risk will primarily be driven by the amount of hydrological inflows. In the case of low hydroelectric generation, spot price exposure is capped by the ability to dispatch our natural gas/diesel assets the price of which depends on fuel pricing at the time required. There is a small amount of coal generation in the northern region that is not covered by the portfolio of contract sales and therefore subject to spot price risk. In both regions, generators with oil or oil-linked fuel generally set power prices. In Colombia, we operate under a short-term sales strategy and have commodity exposure to unhedged volumes. Because we own hydroelectric assets there, contracts are not indexed to fuel.
In the Brazil SBU, the hydroelectric generating facility is covered by contract sales. Under normal hydrological volatility, spot price risk is mitigated through a regulated sharing mechanism across all hydroelectric generators in the country. Under drier conditions, the sharing mechanism may not be sufficient to cover the business' contract position, and therefore it may have to purchase power at spot prices driven by the cost of thermal generation.
In the MCAC SBU, our businesses have commodity exposure on unhedged volumes. Panama is highly contracted under a portfolio of fixed volume contract sales. To the extent hydrological inflows are greater than or less than the contract sales volume, the business will be sensitive to changes in spot power prices which may be driven by oil prices in some time periods. In the Dominican Republic, we own natural gas-fired assets contracted under a portfolio of contract sales and a coal-fired asset contracted with a single contract, and both contract and spot prices may move with commodity prices. Additionally, the contract levels do not always match our generation availability and our assets may be sellers of spot prices in excess of contract levels or a net buyer in the spot market to satisfy contract obligations.
In the Europe SBU, our Kilroot facility operates on a short-term sales strategy. To the extent that sales are unhedged, the commodity risk at our Kilroot business is to the clean dark spread, which is the difference between electricity price and our coal-based variable dispatch cost including emissions. Natural gas-fired generators set power prices for many periods, so higher natural gas prices generally expand margins and higher coal or emissions prices reduce them. Similarly, increased wind generators displaces higher cost generation, reducing Kilroot's margins, and vice versa.
In the Asia SBU, our Masinloc business is a coal-fired generation facility which hedges its output under a portfolio of contract sales that are indexed to fuel prices, with generation in excess of contract volume or shortfalls
123
of generation relative to contract volumes settled in the spot market. Low oil prices may be a driver of margin compression since oil affects spot power sale prices sold in the spot market. Our Mong Duong business has minimal exposure to commodity price risk as it has no merchant exposure and fuel is subject to a pass-through mechanism.
Foreign Exchange Rate Risk
— In the normal course of business, we are exposed to foreign currency risk and other foreign operations risks that arise from investments in foreign subsidiaries and affiliates. A key component of these risks stems from the fact that some of our foreign subsidiaries and affiliates utilize currencies other than our consolidated reporting currency, the U.S. Dollar ("USD"). Additionally, certain of our foreign subsidiaries and affiliates have entered into monetary obligations in the USD or currencies other than their own functional currencies. We have varying degrees of exposure to changes in the exchange rate between the USD and the following currencies: Argentine Peso, British Pound, Brazilian Real, Chilean Peso, Colombian Peso, Dominican Peso, Euro, Indian Rupee, Kazakhstan Tenge, Mexican Peso and Philippine Peso. These subsidiaries and affiliates have attempted to limit potential foreign exchange exposure by entering into revenue contracts that adjust to changes in foreign exchange rates. We also use foreign currency forwards, swaps and options, where possible, to manage our risk related to certain foreign currency fluctuations.
AES enters into cash flow hedges to protect economic value of the business and minimize impact of foreign exchange rate fluctuations to AES portfolio. While protecting cash flows, the hedging strategy is also designed to reduce forward looking earnings foreign exchange volatility. Due to variation of timing and amount between cash distribution and earnings exposure, the hedge impact may not fully cover the earnings exposure on a realized basis which could result in greater volatility in earnings. The largest foreign exchange risks over a 12-month forward-looking period stem from the following currencies: Brazilian Real, Euro, Colombian Peso, British Pound, and Kazakhstan Tenge. As of
December 31, 2016
, assuming a 10% USD appreciation, cash distributions attributable to foreign subsidiaries exposed to movement in the exchange rate of the Brazilian Real and Euro each is projected to be reduced by $5 million. Colombian Peso, Kazakhstan Tenge and British Pound - less than $5 million for 2017. These numbers have been produced by applying a one-time 10% USD appreciation to forecasted exposed cash distributions for
2017
coming from the respective subsidiaries exposed to the currencies listed above, net of the impact of outstanding hedges and holding all other variables constant. The numbers presented above are net of any transactional gains/losses. These sensitivities may change in the future as new hedges are executed or existing hedges are unwound. Additionally, updates to the forecasted cash distributions exposed to foreign exchange risk may result in further modification. The sensitivities presented do not capture the impacts of any administrative market restrictions or currency inconvertibility.
The foreign exchange sensitivities included above have been calculated based on the underlying cash distribution exposures. This is different than the prior period’s disclosure, which was based on earnings, as a result of a change in AES’ foreign exchange hedging strategy in 2016. The table below provides a comparison of the earnings based sensitivity approached used in the 2015 Form 10-K for both FY2016 and FY2017.
|
Earnings Exposure
|
|||
|
2017
|
2016
|
||
|
ARS
|
—
|
5
|
|
|
BRL
|
10
|
5
|
|
|
COP
|
5
|
5
|
|
|
EUR
|
—
|
5
|
|
|
KZT
|
5
|
5
|
|
Interest Rate Risks
— We are exposed to risk resulting from changes in interest rates as a result of our issuance of variable and fixed-rate debt, as well as interest rate swap, cap, floor and option agreements.
Decisions on the fixed-floating debt mix are made to be consistent with the risk factors faced by individual businesses or plants. Depending on whether a plant's capacity payments or revenue stream is fixed or varies with inflation, we partially hedge against interest rate fluctuations by arranging fixed-rate or variable-rate financing. In certain cases, particularly for non-recourse financing, we execute interest rate swap, cap and floor agreements to effectively fix or limit the interest rate exposure on the underlying financing. Most of our interest rate risk is related to non-recourse financings at our businesses.
As of
December 31, 2016
, the portfolio's pretax earnings exposure for
2017
to a one time 100-basis-point increase in interest rates for our Argentine Peso, Brazilian Real, Colombian Peso, Euro, Kazakhstani Tenge and USD denominated debt would be approximately $25 million on interest expense for the debt denominated in these currencies. These amounts do not take into account the historical correlation between these interest rates.
124
REPORT OF INDEPENDENT REGISTERED PUBLIC ACCOUNTING FIRM
The Board of Directors and Stockholders of The AES Corporation:
We have audited the accompanying consolidated balance sheets of The AES Corporation as of December 31, 2016 and 2015, and the related consolidated statements of operations, comprehensive income, changes in equity, and cash flows for each of the three years in the period ended December 31, 2016. Our audits also included the financial statement schedules listed in the Index at Item 15(a). These financial statements and schedules are the responsibility of the Company’s management. Our responsibility is to express an opinion on these financial statements and schedules based on our audits.
We conducted our audits in accordance with the standards of the Public Company Accounting Oversight Board (United States). Those standards require that we plan and perform the audit to obtain reasonable assurance about whether the financial statements are free of material misstatement. An audit includes examining, on a test basis, evidence supporting the amounts and disclosures in the financial statements. An audit also includes assessing the accounting principles used and significant estimates made by management, as well as evaluating the overall financial statement presentation. We believe that our audits provide a reasonable basis for our opinion.
In our opinion, the financial statements referred to above present fairly, in all material respects, the consolidated financial position of The AES Corporation at December 31, 2016 and 2015, and the consolidated results of its operations and its cash flows for each of the three years in the period ended December 31, 2016, in conformity with U.S. generally accepted accounting principles. Also, in our opinion, the related financial statement schedules, when considered in relation to the basic financial statements taken as a whole, present fairly in all material respects the information set forth therein.
As discussed in Note 1 to the consolidated financial statements, the Company changed its requirements for reporting discontinued operations as a result of the adoption of the amendments to the FASB Accounting Standards Codification resulting from Accounting Standards Update No. 2014-08, “Reporting Discontinued Operations and Disclosures of Disposals of Components of an Entity,” effective July 1, 2014. Also, the Company changed its classification of debt issuance costs as a result of the adoption of the amendments to the FASB Accounting Standards Codification resulting from Accounting Standards Update No. 2015-03 and No. 2015-15, “Interest - Imputation of Interest (Subtopic 835-30),” effective January 1, 2016.
We also have audited, in accordance with the standards of the Public Company Accounting Oversight Board (United States), The AES Corporation’s internal control over financial reporting as of December 31, 2016, based on criteria established in Internal Control-Integrated Framework issued by the Committee of Sponsoring Organizations of the Treadway Commission (2013 framework) and our report dated February 24, 2017 expressed an unqualified opinion thereon.
/s/ Ernst & Young LLP
McLean, Virginia
February 24, 2017
125
THE AES CORPORATION
DECEMBER 31,
2016
AND
2015
See Accompanying Notes to Consolidated Financial Statements.
|
2016
|
2015
|
||||||
|
(in millions, except share and per share data)
|
|||||||
|
ASSETS
|
|||||||
|
CURRENT ASSETS
|
|||||||
|
Cash and cash equivalents
|
$
|
1,305
|
|
$
|
1,257
|
|
|
|
Restricted cash
|
278
|
|
295
|
|
|||
|
Short-term investments
|
798
|
|
469
|
|
|||
|
Accounts receivable, net of allowance for doubtful accounts of $111 and $87, respectively
|
2,166
|
|
2,302
|
|
|||
|
Inventory
|
630
|
|
671
|
|
|||
|
Prepaid expenses
|
83
|
|
106
|
|
|||
|
Other current assets
|
1,151
|
|
1,318
|
|
|||
|
Current assets of discontinued operations and held-for-sale businesses
|
—
|
|
424
|
|
|||
|
Total current assets
|
6,411
|
|
6,842
|
|
|||
|
NONCURRENT ASSETS
|
|||||||
|
Property, Plant and Equipment:
|
|||||||
|
Land
|
779
|
|
702
|
|
|||
|
Electric generation, distribution assets and other
|
28,539
|
|
27,282
|
|
|||
|
Accumulated depreciation
|
(9,528
|
)
|
(8,939
|
)
|
|||
|
Construction in progress
|
3,057
|
|
2,977
|
|
|||
|
Property, plant and equipment, net
|
22,847
|
|
22,022
|
|
|||
|
Other Assets:
|
|||||||
|
Investments in and advances to affiliates
|
621
|
|
610
|
|
|||
|
Debt service reserves and other deposits
|
593
|
|
555
|
|
|||
|
Goodwill
|
1,157
|
|
1,157
|
|
|||
|
Other intangible assets, net of accumulated amortization of $519 and $481, respectively
|
359
|
|
340
|
|
|||
|
Deferred income taxes
|
781
|
|
410
|
|
|||
|
Service concession assets, net of accumulated amortization of $114 and $34, respectivel
y
|
1,445
|
|
1,543
|
|
|||
|
Other noncurrent assets
|
1,905
|
|
2,109
|
|
|||
|
Noncurrent assets of discontinued operations and held-for-sale businesses
|
—
|
|
882
|
|
|||
|
Total other assets
|
6,861
|
|
7,606
|
|
|||
|
TOTAL ASSETS
|
$
|
36,119
|
|
$
|
36,470
|
|
|
|
LIABILITIES AND EQUITY
|
|||||||
|
CURRENT LIABILITIES
|
|||||||
|
Accounts payable
|
$
|
1,656
|
|
$
|
1,571
|
|
|
|
Accrued interest
|
247
|
|
236
|
|
|||
|
Accrued and other liabilities
|
2,066
|
|
2,286
|
|
|||
|
Non-recourse debt, including $273 and $258, respectively, related to variable interest entities
|
1,303
|
|
2,172
|
|
|||
|
Current liabilities of discontinued operations and held-for-sale businesses
|
—
|
|
661
|
|
|||
|
Total current liabilities
|
5,272
|
|
6,926
|
|
|||
|
NONCURRENT LIABILITIES
|
|||||||
|
Recourse debt
|
4,671
|
|
4,966
|
|
|||
|
Non-recourse debt, including $1,502 and $1,531, respectively, related to variable interest entities
|
14,489
|
|
12,943
|
|
|||
|
Deferred income taxes
|
804
|
|
1,090
|
|
|||
|
Pension and other postretirement liabilities
|
1,396
|
|
919
|
|
|||
|
Other noncurrent liabilities
|
3,005
|
|
2,794
|
|
|||
|
Noncurrent liabilities of discontinued operations and held-for-sale businesses
|
—
|
|
123
|
|
|||
|
Total noncurrent liabilities
|
24,365
|
|
22,835
|
|
|||
|
Commitments and Contingencies (see Notes 12 and 13)
|
|
|
|||||
|
Redeemable stock of subsidiaries
|
782
|
|
538
|
|
|||
|
EQUITY
|
|||||||
|
THE AES CORPORATION STOCKHOLDERS’ EQUITY
|
|||||||
|
Common stock ($0.01 par value, 1,200,000,000 shares authorized; 816,061,123 issued and 659,182,232 outstanding at December 31, 2016 and 815,846,621 issued and 666,808,790 outstanding at December 31, 2015)
|
8
|
|
8
|
|
|||
|
Additional paid-in capital
|
8,592
|
|
8,718
|
|
|||
|
Retained earnings (accumulated deficit)
|
(1,146
|
)
|
143
|
|
|||
|
Accumulated other comprehensive loss
|
(2,756
|
)
|
(3,883
|
)
|
|||
|
Treasury stock, at cost (156,878,891 shares at December 31, 2016 and 149,037,831 shares at December 31, 2015)
|
(1,904
|
)
|
(1,837
|
)
|
|||
|
Total AES Corporation stockholders’ equity
|
2,794
|
|
3,149
|
|
|||
|
NONCONTROLLING INTERESTS
|
2,906
|
|
3,022
|
|
|||
|
Total equity
|
5,700
|
|
6,171
|
|
|||
|
TOTAL LIABILITIES AND EQUITY
|
$
|
36,119
|
|
$
|
36,470
|
|
|
126
THE AES CORPORATION
YEARS ENDED DECEMBER 31,
2016
,
2015
, AND
2014
|
2016
|
2015
|
2014
|
|||||||||
|
(in millions, except per share amounts)
|
|||||||||||
|
Revenue:
|
|||||||||||
|
Regulated
|
$
|
6,629
|
|
$
|
6,852
|
|
$
|
7,852
|
|
||
|
Non-Regulated
|
6,957
|
|
7,303
|
|
8,272
|
|
|||||
|
Total revenue
|
13,586
|
|
14,155
|
|
16,124
|
|
|||||
|
Cost of Sales:
|
|||||||||||
|
Regulated
|
(6,078
|
)
|
(5,764
|
)
|
(6,615
|
)
|
|||||
|
Non-Regulated
|
(5,075
|
)
|
(5,533
|
)
|
(6,529
|
)
|
|||||
|
Total cost of sales
|
(11,153
|
)
|
(11,297
|
)
|
(13,144
|
)
|
|||||
|
Operating margin
|
2,433
|
|
2,858
|
|
2,980
|
|
|||||
|
General and administrative expenses
|
(194
|
)
|
(196
|
)
|
(187
|
)
|
|||||
|
Interest expense
|
(1,431
|
)
|
(1,344
|
)
|
(1,451
|
)
|
|||||
|
Interest income
|
464
|
|
460
|
|
320
|
|
|||||
|
Loss on extinguishment of debt
|
(13
|
)
|
(182
|
)
|
(261
|
)
|
|||||
|
Other expense
|
(103
|
)
|
(58
|
)
|
(65
|
)
|
|||||
|
Other income
|
65
|
|
82
|
|
121
|
|
|||||
|
Gain on disposal and sale of businesses
|
29
|
|
29
|
|
358
|
|
|||||
|
Goodwill impairment expense
|
—
|
|
(317
|
)
|
(164
|
)
|
|||||
|
Asset impairment expense
|
(1,096
|
)
|
(285
|
)
|
(91
|
)
|
|||||
|
Foreign currency transaction gains (losses)
|
(15
|
)
|
107
|
|
11
|
|
|||||
|
Other non-operating expense
|
(2
|
)
|
—
|
|
(128
|
)
|
|||||
|
INCOME FROM CONTINUING OPERATIONS BEFORE TAXES AND EQUITY IN EARNINGS OF AFFILIATES
|
137
|
|
1,154
|
|
1,443
|
|
|||||
|
Income tax benefit (expense)
|
188
|
|
(472
|
)
|
(371
|
)
|
|||||
|
Net equity in earnings of affiliates
|
36
|
|
105
|
|
19
|
|
|||||
|
INCOME FROM CONTINUING OPERATIONS
|
361
|
|
787
|
|
1,091
|
|
|||||
|
Income (loss) from operations of discontinued businesses, net of income tax benefit (expense) of $9, $7, and $(71), r
espectively
|
(19
|
)
|
(25
|
)
|
111
|
|
|||||
|
Net loss from disposal and impairments of discontinued businesses, net of income tax benefit (expense) of $266, $0, and $(4), respectivel
y
|
(1,119
|
)
|
—
|
|
(55
|
)
|
|||||
|
NET INCOME (LOSS)
|
(777
|
)
|
762
|
|
1,147
|
|
|||||
|
Noncontrolling interests:
|
|||||||||||
|
Less: Net (income) attributable to noncontrolling interests
|
(364
|
)
|
(456
|
)
|
(386
|
)
|
|||||
|
Less: Net loss attributable to redeemable stocks of subsidiaries
|
11
|
|
—
|
|
—
|
|
|||||
|
Plus: Loss from discontinued operations attributable to noncontrolling interests
|
—
|
|
—
|
|
8
|
|
|||||
|
Total net income attributable to noncontrolling interests
|
(353
|
)
|
(456
|
)
|
(378
|
)
|
|||||
|
NET INCOME (LOSS) ATTRIBUTABLE TO THE AES CORPORATION
|
$
|
(1,130
|
)
|
$
|
306
|
|
$
|
769
|
|
||
|
AMOUNTS ATTRIBUTABLE TO THE AES CORPORATION COMMON STOCKHOLDERS:
|
|||||||||||
|
Income from continuing operations, net of tax
|
$
|
8
|
|
$
|
331
|
|
$
|
705
|
|
||
|
Income (loss) from discontinued operations, net of tax
|
(1,138
|
)
|
(25
|
)
|
64
|
|
|||||
|
NET INCOME (LOSS) ATTRIBUTABLE TO THE AES CORPORATION
|
$
|
(1,130
|
)
|
$
|
306
|
|
$
|
769
|
|
||
|
BASIC EARNINGS PER SHARE:
|
|||||||||||
|
Income from continuing operations attributable to The AES Corporation common stockholders, net of tax
|
$
|
—
|
|
$
|
0.48
|
|
$
|
0.98
|
|
||
|
Income (loss) from discontinued operations attributable to The AES Corporation common stockholders, net of tax
|
(1.72
|
)
|
(0.03
|
)
|
0.09
|
|
|||||
|
NET INCOME (LOSS) ATTRIBUTABLE TO THE AES CORPORATION COMMON STOCKHOLDERS
|
$
|
(1.72
|
)
|
$
|
0.45
|
|
$
|
1.07
|
|
||
|
DILUTED EARNINGS PER SHARE:
|
|||||||||||
|
Income from continuing operations attributable to The AES Corporation common stockholders, net of tax
|
$
|
—
|
|
$
|
0.48
|
|
$
|
0.97
|
|
||
|
Income (loss) from discontinued operations attributable to The AES Corporation common stockholders, net of tax
|
(1.71
|
)
|
(0.04
|
)
|
0.09
|
|
|||||
|
NET INCOME (LOSS) ATTRIBUTABLE TO THE AES CORPORATION COMMON STOCKHOLDERS
|
$
|
(1.71
|
)
|
$
|
0.44
|
|
$
|
1.06
|
|
||
|
DIVIDENDS DECLARED PER COMMON SHARE
|
$
|
0.45
|
|
$
|
0.41
|
|
$
|
0.25
|
|
||
See Accompanying Notes to Consolidated Financial Statements.
127
THE AES CORPORATION
CONSOLIDATED STATEMENTS OF COMPREHENSIVE INCOME (LOSS)
YEARS ENDED DECEMBER 31,
2016
,
2015
, AND
2014
|
2016
|
2015
|
2014
|
|||||||||
|
(in millions)
|
|||||||||||
|
NET INCOME (LOSS)
|
$
|
(777
|
)
|
$
|
762
|
|
$
|
1,147
|
|
||
|
Foreign currency translation activity:
|
|||||||||||
|
Foreign currency translation adjustments, net of income tax benefit (expense) of $1, $1, and $(7), respectively
|
189
|
|
(1,019
|
)
|
(491
|
)
|
|||||
|
Reclassification to earnings, net of $0 income tax for all periods
|
992
|
|
—
|
|
(3
|
)
|
|||||
|
Total foreign currency translation adjustments
|
1,181
|
|
(1,019
|
)
|
(494
|
)
|
|||||
|
Derivative activity:
|
|||||||||||
|
Change in derivative fair value, net of income tax benefit (expense) of $(7), $16 and $72, respectively
|
5
|
|
(57
|
)
|
(358
|
)
|
|||||
|
Reclassification to earnings, net of income tax expense of $8, $11 and $26, respectively
|
37
|
|
66
|
|
99
|
|
|||||
|
Total change in fair value of derivatives
|
42
|
|
9
|
|
(259
|
)
|
|||||
|
Pension activity:
|
|||||||||||
|
Change in pension adjustments due to prior service cost, net of income tax expense of $6, $0, and $0 respectively
|
11
|
|
1
|
|
—
|
|
|||||
|
Change in pension adjustments due to net actuarial gain (loss) for the period, net of income tax benefit (expense) of $106, $(29), and $27, respectively
|
(208
|
)
|
60
|
|
(49
|
)
|
|||||
|
Reclassification to earnings due to amortization of net actuarial loss, net of income tax expense of $3, $9, and $7, respectively
|
10
|
|
16
|
|
29
|
|
|||||
|
Total pension adjustments
|
(187
|
)
|
77
|
|
(20
|
)
|
|||||
|
OTHER COMPREHENSIVE INCOME (LOSS)
|
1,036
|
|
(933
|
)
|
(773
|
)
|
|||||
|
COMPREHENSIVE INCOME (LOSS)
|
259
|
|
(171
|
)
|
374
|
|
|||||
|
Less: Comprehensive (income) loss attributable to noncontrolling interests
|
(262
|
)
|
(133
|
)
|
(49
|
)
|
|||||
|
COMPREHENSIVE INCOME (LOSS) ATTRIBUTABLE TO THE AES CORPORATION
|
$
|
(3
|
)
|
$
|
(304
|
)
|
$
|
325
|
|
||
See Accompanying Notes to Consolidated Financial Statements.
128
THE AES CORPORATION
CONSOLIDATED STATEMENTS OF CHANGES IN EQUITY
YEARS ENDED DECEMBER 31,
2016
,
2015
, AND
2014
|
THE AES CORPORATION STOCKHOLDERS
|
|||||||||||||||||||||||||||||
|
Common Stock
|
Treasury Stock
|
Additional
Paid-In
Capital
|
Retained
Earnings
(Accumulated
Deficit)
|
Accumulated
Other
Comprehensive
Loss
|
Noncontrolling
Interests
|
||||||||||||||||||||||||
|
(in millions)
|
Shares
|
Amount
|
Shares
|
Amount
|
|||||||||||||||||||||||||
|
Balance at December 31, 2013
|
813.3
|
|
$
|
8
|
|
90.8
|
|
$
|
(1,089
|
)
|
$
|
8,443
|
|
$
|
(150
|
)
|
$
|
(2,882
|
)
|
$
|
3,321
|
|
|||||||
|
Net income
|
—
|
|
—
|
|
—
|
|
—
|
|
—
|
|
769
|
|
—
|
|
378
|
|
|||||||||||||
|
Total foreign currency translation adjustment, net of income tax
|
—
|
|
—
|
|
—
|
|
—
|
|
—
|
|
—
|
|
(332
|
)
|
(162
|
)
|
|||||||||||||
|
Total change in derivative fair value, net of income tax
|
—
|
|
—
|
|
—
|
|
—
|
|
—
|
|
—
|
|
(108
|
)
|
(151
|
)
|
|||||||||||||
|
Total pension adjustments, net of income tax
|
—
|
|
—
|
|
—
|
|
—
|
|
—
|
|
—
|
|
(4
|
)
|
(16
|
)
|
|||||||||||||
|
Total other comprehensive loss
|
|
|
|
|
|
|
|
|
|
|
|
|
(444
|
)
|
(329
|
)
|
|||||||||||||
|
Balance Sheet reclassification related to an equity method investment
(1)
|
—
|
|
—
|
|
—
|
|
—
|
|
—
|
|
—
|
|
40
|
|
—
|
|
|||||||||||||
|
Disposition of businesses
|
—
|
|
—
|
|
—
|
|
—
|
|
—
|
|
—
|
|
—
|
|
(153
|
)
|
|||||||||||||
|
Distributions to noncontrolling interests
|
—
|
|
—
|
|
—
|
|
—
|
|
—
|
|
—
|
|
—
|
|
(466
|
)
|
|||||||||||||
|
Contributions from noncontrolling interests
|
—
|
|
—
|
|
—
|
|
—
|
|
—
|
|
—
|
|
—
|
|
147
|
|
|||||||||||||
|
Dividends declared on common stock
|
—
|
|
—
|
|
—
|
|
—
|
|
(73
|
)
|
(107
|
)
|
—
|
|
—
|
|
|||||||||||||
|
Purchase of treasury stock
|
—
|
|
—
|
|
21.9
|
|
(308
|
)
|
—
|
|
—
|
|
—
|
|
—
|
|
|||||||||||||
|
Issuance and exercise of stock-based compensation benefit plans, net of income tax
|
1.2
|
|
—
|
|
(2.0
|
)
|
26
|
|
3
|
|
—
|
|
—
|
|
—
|
|
|||||||||||||
|
Sale of subsidiary shares to noncontrolling interests
|
—
|
|
—
|
|
—
|
|
—
|
|
29
|
|
—
|
|
—
|
|
173
|
|
|||||||||||||
|
Acquisition of subsidiary shares from noncontrolling interests
|
—
|
|
—
|
|
—
|
|
—
|
|
7
|
|
—
|
|
—
|
|
(18
|
)
|
|||||||||||||
|
Balance at December 31, 2014
|
814.5
|
|
$
|
8
|
|
110.7
|
|
$
|
(1,371
|
)
|
$
|
8,409
|
|
$
|
512
|
|
$
|
(3,286
|
)
|
$
|
3,053
|
|
|||||||
|
Net income
|
—
|
|
—
|
|
—
|
|
—
|
|
—
|
|
306
|
|
—
|
|
456
|
|
|||||||||||||
|
Total foreign currency translation adjustment, net of income tax
|
—
|
|
—
|
|
—
|
|
—
|
|
—
|
|
—
|
|
(674
|
)
|
(345
|
)
|
|||||||||||||
|
Total change in derivative fair value, net of income tax
|
—
|
|
—
|
|
—
|
|
—
|
|
—
|
|
—
|
|
43
|
|
(34
|
)
|
|||||||||||||
|
Total pension adjustments, net of income tax
|
—
|
|
—
|
|
—
|
|
—
|
|
—
|
|
—
|
|
21
|
|
56
|
|
|||||||||||||
|
Total other comprehensive loss
|
|
|
|
|
|
|
|
|
|
|
|
|
(610
|
)
|
(323
|
)
|
|||||||||||||
|
Cumulative effect of a change in accounting principle
|
—
|
|
—
|
|
—
|
|
—
|
|
—
|
|
(18
|
)
|
13
|
|
—
|
|
|||||||||||||
|
Acquisition of a business
(2)
|
—
|
|
—
|
|
—
|
|
—
|
|
—
|
|
—
|
|
—
|
|
15
|
|
|||||||||||||
|
Disposition of businesses
|
—
|
|
—
|
|
—
|
|
—
|
|
—
|
|
—
|
|
—
|
|
(41
|
)
|
|||||||||||||
|
Distributions to noncontrolling interests
|
—
|
|
—
|
|
—
|
|
—
|
|
(27
|
)
|
—
|
|
—
|
|
(383
|
)
|
|||||||||||||
|
Contributions from noncontrolling interests
|
—
|
|
—
|
|
—
|
|
—
|
|
—
|
|
—
|
|
—
|
|
126
|
|
|||||||||||||
|
Dividends declared on common stock
|
—
|
|
—
|
|
—
|
|
—
|
|
—
|
|
(280
|
)
|
—
|
|
—
|
|
|||||||||||||
|
Purchase of treasury stock
|
—
|
|
—
|
|
39.7
|
|
(482
|
)
|
—
|
|
—
|
|
—
|
|
—
|
|
|||||||||||||
|
Issuance and exercise of stock-based compensation benefit plans, net of income tax
|
1.3
|
|
—
|
|
(1.4
|
)
|
16
|
|
13
|
|
—
|
|
—
|
|
—
|
|
|||||||||||||
|
Sale of subsidiary shares to noncontrolling interests
|
—
|
|
—
|
|
—
|
|
—
|
|
323
|
|
(377
|
)
|
—
|
|
119
|
|
|||||||||||||
|
Balance at December 31, 2015
|
815.8
|
|
$
|
8
|
|
149.0
|
|
$
|
(1,837
|
)
|
$
|
8,718
|
|
$
|
143
|
|
$
|
(3,883
|
)
|
$
|
3,022
|
|
|||||||
|
Net income
|
—
|
|
—
|
|
—
|
|
—
|
|
—
|
|
(1,130
|
)
|
—
|
|
364
|
|
|||||||||||||
|
Total foreign currency translation adjustment, net of income tax
|
—
|
|
—
|
|
—
|
|
—
|
|
—
|
|
—
|
|
1,109
|
|
72
|
|
|||||||||||||
|
Total change in derivative fair value, net of income tax
|
—
|
|
—
|
|
—
|
|
—
|
|
—
|
|
—
|
|
30
|
|
12
|
|
|||||||||||||
|
Total pension adjustments, net of income tax
|
—
|
|
—
|
|
—
|
|
—
|
|
—
|
|
—
|
|
(12
|
)
|
(175
|
)
|
|||||||||||||
|
Total other comprehensive loss
|
|
|
|
|
|
|
|
|
|
|
|
|
1,127
|
|
(91
|
)
|
|||||||||||||
|
Fair value adjustment
(3)
|
—
|
|
—
|
|
—
|
|
—
|
|
17
|
|
(4
|
)
|
—
|
|
(17
|
)
|
|||||||||||||
|
Disposition of businesses
|
—
|
|
—
|
|
—
|
|
—
|
|
—
|
|
—
|
|
—
|
|
(2
|
)
|
|||||||||||||
|
Distributions to noncontrolling interests
|
—
|
|
—
|
|
—
|
|
—
|
|
(10
|
)
|
—
|
|
—
|
|
(430
|
)
|
|||||||||||||
|
Contributions from noncontrolling interests
|
—
|
|
—
|
|
—
|
|
—
|
|
—
|
|
—
|
|
—
|
|
60
|
|
|||||||||||||
|
Dividends declared on common stock
|
—
|
|
—
|
|
—
|
|
—
|
|
(226
|
)
|
(71
|
)
|
—
|
|
—
|
|
|||||||||||||
|
Purchase of treasury stock
|
—
|
|
—
|
|
8.7
|
|
(79
|
)
|
—
|
|
—
|
|
—
|
|
—
|
|
|||||||||||||
|
Issuance and exercise of stock-based compensation benefit plans, net of income tax
|
0.3
|
|
—
|
|
(0.8
|
)
|
12
|
|
11
|
|
—
|
|
—
|
|
—
|
|
|||||||||||||
|
Sale of subsidiary shares to noncontrolling interests
|
—
|
|
—
|
|
—
|
|
—
|
|
84
|
|
(84
|
)
|
—
|
|
17
|
|
|||||||||||||
|
Acquisition and reclassification of subsidiary shares from noncontrolling interests
|
—
|
|
—
|
|
—
|
|
—
|
|
(2
|
)
|
—
|
|
—
|
|
(17
|
)
|
|||||||||||||
|
Balance at December 31, 2016
|
816.1
|
|
$
|
8
|
|
156.9
|
|
$
|
(1,904
|
)
|
$
|
8,592
|
|
$
|
(1,146
|
)
|
$
|
(2,756
|
)
|
$
|
2,906
|
|
|||||||
(1)
Reclassification resulting from SRP transaction during the third quarter of 2014. See Note
7
—
Investments In and Advances to Affiliates
for further information.
(2)
Fair value of a tax equity partner's right to preferential returns recognized as a result of the acquisition of Solar Power PR, LLC, which was previously accounted for as an equity method investment.
(3)
Adjustment to the carrying amount of non-controlling interest and redeemable stock of subsidiaries to fair value.
See Accompanying Notes to Consolidated Financial Statements
129
THE AES CORPORATION
YEARS ENDED DECEMBER 31,
2016
,
2015
, AND
2014
|
2016
|
2015
|
2014
|
|||||||||
|
(in millions)
|
|||||||||||
|
OPERATING ACTIVITIES:
|
|||||||||||
|
Net income (loss)
|
$
|
(777
|
)
|
$
|
762
|
|
$
|
1,147
|
|
||
|
Adjustments to net income:
|
|||||||||||
|
Depreciation and amortization
|
1,176
|
|
1,144
|
|
1,245
|
|
|||||
|
Gain on sales and disposals of businesses
|
(29
|
)
|
(29
|
)
|
(358
|
)
|
|||||
|
Impairment expenses
|
1,098
|
|
602
|
|
383
|
|
|||||
|
Deferred income taxes
|
(793
|
)
|
(50
|
)
|
47
|
|
|||||
|
Provisions for (reversals of) contingencies
|
48
|
|
(72
|
)
|
(34
|
)
|
|||||
|
Loss on extinguishment of debt
|
20
|
|
186
|
|
261
|
|
|||||
|
Loss (Gain) on sale and disposal of assets
|
38
|
|
20
|
|
(20
|
)
|
|||||
|
Impairments of discontinued operations and held-for-sale businesses
|
1,383
|
|
—
|
|
50
|
|
|||||
|
Other
|
168
|
|
8
|
|
92
|
|
|||||
|
Changes in operating assets and liabilities:
|
|||||||||||
|
(Increase) decrease in accounts receivable
|
237
|
|
(378
|
)
|
(520
|
)
|
|||||
|
(Increase) decrease in inventory
|
42
|
|
(26
|
)
|
(48
|
)
|
|||||
|
(Increase) decrease in prepaid expenses and other current assets
|
870
|
|
655
|
|
(73
|
)
|
|||||
|
(Increase) decrease in other assets
|
(251
|
)
|
(1,305
|
)
|
(723
|
)
|
|||||
|
Increase (decrease) in accounts payable and other current liabilities
|
(620
|
)
|
31
|
|
(85
|
)
|
|||||
|
Increase (decrease) in income tax payables, net and other tax payables
|
(199
|
)
|
53
|
|
(89
|
)
|
|||||
|
Increase (decrease) in other liabilities
|
473
|
|
533
|
|
516
|
|
|||||
|
Net cash provided by operating activities
|
2,884
|
|
2,134
|
|
1,791
|
|
|||||
|
INVESTING ACTIVITIES:
|
|||||||||||
|
Capital expenditures
|
(2,345
|
)
|
(2,308
|
)
|
(2,016
|
)
|
|||||
|
Acquisitions, net of cash acquired
|
(55
|
)
|
(17
|
)
|
(728
|
)
|
|||||
|
Proceeds from the sale of businesses, net of cash sold, and equity method investments
|
631
|
|
138
|
|
1,807
|
|
|||||
|
Sale of short-term investments
|
4,904
|
|
4,851
|
|
4,503
|
|
|||||
|
Purchase of short-term investments
|
(5,151
|
)
|
(4,801
|
)
|
(4,623
|
)
|
|||||
|
(Increase) decrease in restricted cash, debt service reserves and other assets
|
(61
|
)
|
(159
|
)
|
419
|
|
|||||
|
Other investing
|
(31
|
)
|
(70
|
)
|
(18
|
)
|
|||||
|
Net cash used in investing activities
|
(2,108
|
)
|
(2,366
|
)
|
(656
|
)
|
|||||
|
FINANCING ACTIVITIES:
|
|||||||||||
|
Borrowings under the revolving credit facilities
|
1,465
|
|
959
|
|
836
|
|
|||||
|
Repayments under the revolving credit facilities
|
(1,433
|
)
|
(937
|
)
|
(834
|
)
|
|||||
|
Issuance of recourse debt
|
500
|
|
575
|
|
1,525
|
|
|||||
|
Repayments of recourse debt
|
(808
|
)
|
(915
|
)
|
(2,117
|
)
|
|||||
|
Issuance of non-recourse debt
|
2,978
|
|
4,248
|
|
4,179
|
|
|||||
|
Repayments of non-recourse debt
|
(2,666
|
)
|
(3,312
|
)
|
(3,481
|
)
|
|||||
|
Payments for financing fees
|
(105
|
)
|
(90
|
)
|
(158
|
)
|
|||||
|
Distributions to noncontrolling interests
|
(476
|
)
|
(326
|
)
|
(485
|
)
|
|||||
|
Contributions from noncontrolling interests and redeemable security holders
|
190
|
|
126
|
|
143
|
|
|||||
|
Proceeds from the sale of redeemable stock of subsidiaries
|
134
|
|
461
|
|
—
|
|
|||||
|
Dividends paid on AES common stock
|
(290
|
)
|
(276
|
)
|
(144
|
)
|
|||||
|
Payments for financed capital expenditures
|
(113
|
)
|
(150
|
)
|
(528
|
)
|
|||||
|
Purchase of treasury stock
|
(79
|
)
|
(482
|
)
|
(308
|
)
|
|||||
|
Proceeds from sales to noncontrolling interests, net of transaction costs
|
—
|
|
154
|
|
83
|
|
|||||
|
Other financing
|
(44
|
)
|
(7
|
)
|
27
|
|
|||||
|
Net cash (used in) provided by financing activities
|
(747
|
)
|
28
|
|
(1,262
|
)
|
|||||
|
Effect of exchange rate changes on cash
|
9
|
|
(52
|
)
|
(51
|
)
|
|||||
|
Decrease (Increase) in cash of discontinued operations and held-for-sale businesses
|
10
|
|
(4
|
)
|
59
|
|
|||||
|
Total Increase (decrease) in cash and cash equivalents
|
48
|
|
(260
|
)
|
(119
|
)
|
|||||
|
Cash and cash equivalents, beginning
|
1,257
|
|
1,517
|
|
1,636
|
|
|||||
|
Cash and cash equivalents, ending
|
$
|
1,305
|
|
$
|
1,257
|
|
$
|
1,517
|
|
||
|
SUPPLEMENTAL DISCLOSURES:
|
|||||||||||
|
Cash payments for interest, net of amounts capitalized
|
$
|
1,273
|
|
$
|
1,265
|
|
$
|
1,351
|
|
||
|
Cash payments for income taxes, net of refunds
|
$
|
487
|
|
$
|
388
|
|
$
|
480
|
|
||
|
SCHEDULE OF NONCASH INVESTING AND FINANCING ACTIVITIES:
|
|||||||||||
|
Assets received upon sale of subsidiaries
|
$
|
—
|
|
$
|
—
|
|
$
|
44
|
|
||
|
Assets acquired through capital lease and other liabilities
|
$
|
5
|
|
$
|
18
|
|
$
|
49
|
|
||
|
Dividends declared but not yet paid
|
$
|
174
|
|
$
|
135
|
|
$
|
72
|
|
||
See Accompanying Notes to Consolidated Financial Statements.
130
THE AES CORPORATION
NOTES TO CONSOLIDATED FINANCIAL STATEMENTS
DECEMBER 31, 2016, 2015, AND 2014
1
. GENERAL AND SUMMARY OF SIGNIFICANT ACCOUNTING POLICIES
The AES Corporation is a holding company (the "Parent Company") that through its subsidiaries and affiliates, (collectively, "AES" or "the Company") operates a geographically diversified portfolio of electricity generation and distribution businesses. Generally, given this holding company structure, the liabilities of the individual operating entities are non-recourse to the parent and are isolated to the operating entities. Most of our operating entities are structured as limited liability entities, which limit the liability of shareholders. The structure is generally the same regardless of whether a subsidiary is consolidated under a voting or variable interest model.
PRINCIPLES OF CONSOLIDATION
— The Consolidated Financial Statements of the Company include the accounts of The AES Corporation and its subsidiaries, which are the entities that it controls. Furthermore, variable interest entities ("VIEs") in which the Company has a variable interest have been consolidated when the Company is the primary beneficiary and thus controls the VIE. Intercompany transactions and balances are eliminated in consolidation. Investments in entities where the Company has the ability to exercise significant influence, but not control, are accounted for using the equity method of accounting.
DP&L, our utility in Ohio, has undivided interests in five generation facilities and numerous transmission facilities. These undivided interests in jointly-owned facilities are accounted for on a pro-rata basis in our consolidated financial statements. Certain expenses, primarily fuel costs for the generating units, are allocated to the joint owners based on their energy usage. The remaining expenses, investments in fuel inventory, plant materials and operating supplies and capital additions are allocated to the joint owners in accordance with their respective ownership interests. See Note
3
—
Property, Plant and Equipment
for additional details.
USE OF ESTIMATES
— The preparation of these consolidated financial statements in conformity with accounting principles generally accepted in the United States of America ("GAAP") requires the Company to make estimates and assumptions that affect reported amounts of assets and liabilities and disclosures of contingent assets and liabilities at the date of the consolidated financial statements, as well as the reported amounts of revenue and expenses during the reporting period. Actual results could differ from those estimates. Items subject to such estimates and assumptions include: the carrying amount and estimated useful lives of long-lived assets; asset retirement obligations; impairment of goodwill, long-lived assets and equity method investments; valuation allowances for receivables and deferred tax assets; the recoverability of regulatory assets; the estimation of regulatory liabilities; the fair value of financial instruments; the fair value of assets and liabilities acquired in a business combination; the measurement of noncontrolling interest using the hypothetical liquidation at book value ("HLBV") method for certain renewable generation partnerships; the determination of whether a sale of noncontrolling interests is considered to be a sale of in-substance real estate (as opposed to an equity transaction); pension liabilities; environmental liabilities; and potential litigation claims and settlements.
DISCONTINUED OPERATIONS
— Effective July 1, 2014, the Company prospectively adopted Accounting Standards Update ("ASU") No. 2014-08,
Presentation of Financial Statements (Topic 205) and Property, Plant, and Equipment (Topic 360): Reporting discontinued Operations and Disclosures of Disposals of Components of an Entity
, which significantly changed the prior accounting guidance on discontinued operations. Under ASU No. 2014-08, only those disposals of components of an entity that represent a strategic shift that has (or a held-for-sale business that will have) a major effect on an entity's operations and financial results are reported as discontinued operations. Amongst other changes: equity method investments that were previously scoped-out of the discontinued operations accounting guidance are now included in the scope; a business can meet the criteria to be classified as held-for-sale upon acquisition and be reported in discontinued operations; and components where an entity retains significant continuing involvement or where operations and cash flows will not be eliminated from ongoing operations as a result of a disposal transaction can meet the definition of discontinued operations. Additionally, where summarized amounts are presented on the face of the financial statements, reconciliations of those amounts to major classes of line items are also required. ASU No. 2014-08 requires additional disclosures for individually material components that do not meet the definition of discontinued operations. Prior to the adoption of ASU 2014-08 we had classified certain business as discontinued operations that would not meet the criteria under the current standard. See Note
23
—
Dispositions
for further information.
Prior to July 1, 2014, a discontinued operation was a component of the Company that either had been disposed of or was classified as held-for-sale and where the Company did not expect to have significant cash flows from or significant continuing involvement with the component as of one year after its disposal or sale. A component
131
THE AES CORPORATION
NOTES TO CONSOLIDATED FINANCIAL STATEMENTS—(Continued)
DECEMBER 31, 2016, 2015, AND 2014
was comprised of operations and cash flows that could be clearly distinguished, operationally and for financial reporting purposes, from the rest of the Company.
Prior period amounts in the statement of operations are retrospectively revised to reflect the businesses determined to be discontinued operations. The cash flows of businesses that are determined to be discontinued operations or held-for-sale are included within the relevant categories within operating, investing and financing activities. The aggregate amount of cash flows is offset by the net increase or decrease in cash of discontinued and held-for-sale businesses, which is presented as a separate line item in the Consolidated Statements of Cash Flows.
When an operation is classified as held-for-sale, the Company recognizes any impairment expense on the entire operation, which will include an amount allocable to noncontrolling interests, at the level of the held-for-sale operation and/or at a parent entity as applicable. However, any gain or loss on the completion of a disposal transaction is fully allocated to AES and to its noncontrolling interests at a parent entity level, given that the operational level noncontrolling interests have been removed with deconsolidation of the disposed entity. Assets and liabilities of held-for-sale businesses are classified as current when they are expected to be disposed of within twelve months.
RECLASSIFICATIONS
— To comply with newly adopted accounting standards, certain prior period amounts in the consolidated financial statements have been reclassified to conform to the current presentation. Deferred financing costs were reclassified from the
Other current assets
and
Other noncurrent assets
lines to the current and noncurrent
Non-recourse debt
lines, respectively, in the Consolidated Balance Sheet for the year ended December 31, 2015. Additionally, amounts relating to capitalized software were reclassified from
Electric generation, distribution assets and other
line to
Other intangible assets, net of amortization
line on the Consolidated Balance sheet for the year ended December 31, 2015. See further detail in the new accounting pronouncements discussion.
FAIR VALUE
— Fair value is the price that would be received to sell an asset or paid to transfer a liability in an orderly, hypothetical transaction between market participants at the measurement date, or exit price. The Company applies the fair value measurement accounting guidance to financial assets and liabilities in determining the fair value of investments in marketable debt and equity securities, included in the Consolidated Balance Sheet line items
Short-term investments
and
Other assets (noncurrent)
; derivative assets, included in
Other current assets
and
Other assets (noncurrent)
; and, derivative liabilities, included in
Accrued and other liabilities (current)
and
Other long-term liabilities
. The Company applies the fair value measurement guidance to nonfinancial assets and liabilities upon the acquisition of a business or in conjunction with the measurement of an asset retirement obligation or a potential impairment loss on an asset group or goodwill under the accounting guidance for the impairment of long-lived assets or goodwill.
The Company makes assumptions about what market participants would assume in valuing an asset or liability based on the best information available. These factors include nonperformance risk (the risk that the obligation will not be fulfilled) and credit risk of the subsidiary (for liabilities) and of the counterparty (for assets). The Company is prohibited from including transaction costs and any adjustments for blockage factors in determining fair value. The principal or most advantageous market is considered from the perspective of the subsidiary owning the asset or with the liability.
Fair value is based on observable market prices where available. Where they are not available, specific valuation models and techniques are applied depending on what is being fair valued. These models and techniques maximize the use of observable inputs and minimize the use of unobservable inputs. The process involves varying levels of management judgment, the degree of which is dependent on price transparency and complexity. An asset's or liability's level within the fair value hierarchy is based on the lowest level of input significant to the fair value measurement, where Level 1 is the highest and Level 3 is the lowest. The three levels are defined as follows:
|
•
|
Level 1 — unadjusted quoted prices in active markets accessible by the Company for identical assets or liabilities. Active markets are those in which transactions for the asset or liability occur with sufficient frequency and volume to provide pricing information on an ongoing basis.
|
|
•
|
Level 2 — pricing inputs other than quoted market prices included in Level 1 which are based on observable market data, that are directly or indirectly observable for substantially the full term of the asset or liability. These include quoted market prices for similar assets or liabilities, quoted market prices for identical or similar assets in markets that are not active, adjusted quoted market prices, inputs from observable data such as interest rate and yield curves, volatilities or default rates observable at commonly quoted intervals or inputs derived from observable market data by correlation or other means.
|
132
THE AES CORPORATION
NOTES TO CONSOLIDATED FINANCIAL STATEMENTS—(Continued)
DECEMBER 31, 2016, 2015, AND 2014
|
•
|
Level 3 — pricing inputs that are unobservable from objective sources. Unobservable inputs are only used to the extent observable inputs aren't available. These inputs maintain the concept of an exit price from the perspective of a market participant and reflect assumptions of other market participants. The Company considers all market participant assumptions that are available without unreasonable cost and effort. These are given the lowest priority and are generally used in internally developed methodologies to generate management's best estimate of the fair value when no observable market data is available.
|
Any transfers between all levels within the fair value hierarchy levels are recognized at the end of the reporting period.
CASH AND CASH EQUIVALENTS
— The Company considers unrestricted cash on hand, deposits in banks, certificates of deposit and short-term marketable securities with original maturities of three months or less to be cash and cash equivalents. The carrying amounts of such balances approximate fair value.
RESTRICTED CASH AND DEBT SERVICE RESERVES
— These include cash balances which are restricted as to withdrawal or usage by the subsidiary that owns the cash. The nature of restrictions includes restrictions imposed by financing agreements such as security deposits kept as collateral, debt service reserves, maintenance reserves, contractual terms and others, as well as restrictions imposed by agreements related to the sales of businesses or long-term PPAs.
INVESTMENTS IN MARKETABLE SECURITIES
— The Company's marketable investments are primarily unsecured debentures, certificates of deposit, government debt securities and money market funds. Short-term investments consist of marketable equity securities and debt securities with original maturities in excess of three months with remaining maturities of less than one year.
Marketable debt securities that the Company has both the positive intent and ability to hold to maturity are classified as held-to-maturity and are carried at amortized cost. Other marketable securities that the Company does not intend to hold to maturity are classified as available-for-sale or trading and are carried at fair value. Available-for-sale investments are fair valued at the end of each reporting period where the unrealized gains or losses are reflected in AOCL, a separate component of equity.
Investments classified as trading are fair valued at the end of each reporting period through the Consolidated Statements of Operations. Interest and dividends on investments are reported in
interest income
and
other income
, respectively. Gains and losses on sales of investments are determined using the specific identification method.
ACCOUNTS AND NOTES RECEIVABLE AND ALLOWANCE FOR DOUBTFUL ACCOUNTS
— Accounts and notes receivable are carried at amortized cost. The Company periodically assesses the collectability of accounts receivable, considering factors such as specific evaluation of collectability, historical collection experience, the age of accounts receivable and other currently available evidence of the collectability, and records an allowance for doubtful accounts for the estimated uncollectible amount as appropriate. Certain of our businesses charge interest on accounts receivable either under contractual terms or where charging interest is a customary business practice. In such cases, interest income is recognized on an accrual basis. When the collection of such interest is not reasonably assured, interest income is recognized as cash is received. Individual accounts and notes receivable are written off when they are no longer deemed collectible.
INVENTORY
— Inventory primarily consists of fuel and other raw materials used to generate power, and spare parts and supplies used to maintain power generation and distribution facilities. Inventory is carried at lower of cost or market. Cost is the sum of the purchase price and incidental expenditures and charges incurred to bring the inventory to its existing condition or location. Costs of inventory are valued primarily using the average cost method. Generally, the carrying amount of fuel inventory is reduced to market value if the market value of inventory has declined and it is expected that the carrying amount of inventory, in its use in the ordinary course of business, will not be recovered through revenue earned from the generation of power. The carrying amount of spare parts and supplies is typically reduced only in instances where the items are considered obsolete.
LONG-LIVED ASSETS
— Long-lived assets include property, plant and equipment, assets under capital leases and intangible assets subject to amortization (i.e., finite-lived intangible assets).
Property, plant and equipment
— Property, plant and equipment are stated at cost, net of accumulated depreciation. The cost of renewals and improvements that extend the useful life of property, plant and equipment are capitalized.
133
THE AES CORPORATION
NOTES TO CONSOLIDATED FINANCIAL STATEMENTS—(Continued)
DECEMBER 31, 2016, 2015, AND 2014
Construction progress payments, engineering costs, insurance costs, salaries, interest and other costs directly relating to construction in progress are capitalized during the construction period, provided the completion of the project is deemed probable, or expensed at the time the Company determines that development of a particular project is no longer probable. The continued capitalization of such costs is subject to ongoing risks related to successful completion, including those related to government approvals, site identification, financing, construction permitting and contract compliance. Construction-in-progress balances are transferred to electric generation and distribution assets when an asset group is ready for its intended use. Government subsidies, liquidated damages recovered for construction delays and income tax credits are recorded as a reduction to property, plant and equipment and reflected in cash flows from investing activities.
Depreciation, after consideration of salvage value and asset retirement obligations, is computed primarily using the straight-line method over the estimated useful lives of the assets, which are determined on a composite or component basis. Maintenance and repairs are charged to expense as incurred. Capital spare parts, including rotable spare parts, are included in electric generation and distribution assets. If the spare part is considered a component, it is depreciated over its useful life after the part is placed in service. If the spare part is deemed part of a composite asset, the part is depreciated over the composite useful life even when being held as a spare part.
The Company's Brazilian subsidiaries, which include both generation and distribution companies, operate under concession contracts. Certain estimates are utilized to determine depreciation expense for the Brazilian subsidiaries, including the useful lives of the property, plant and equipment and the amounts to be recovered at the end of the concession contract. The amounts to be recovered under these concession contracts are based on estimates that are inherently uncertain and actual amounts recovered may differ from those estimates. These concession contracts are not within the scope of ASC 853—
Service Concession Arrangements
.
Intangible Assets Subject to Amortization
— Finite-lived intangible assets are amortized over their useful lives which range from
3
–
50
years. The Company accounts for purchased emission allowances as intangible assets and records an expense when utilized or sold. Granted emission allowances are valued at zero.
Impairment of Long-lived Assets
— When circumstances indicate that the carrying amount of long-lived assets in a held-for-use asset group may not be recoverable, the Company evaluates the assets for potential impairment using internal projections of undiscounted cash flows expected to result from the use and eventual disposal of the assets. Events or changes in circumstances that may necessitate a recoverability evaluation may include, but are not limited to, adverse changes in the regulatory environment, unfavorable changes in power prices or fuel costs, increased competition due to additional capacity in the grid, technological advancements, declining trends in demand, or an expectation that it is more likely than not that the asset will be disposed of before the end of its previously estimated useful life. If the carrying amount of the assets exceeds the undiscounted cash flows expected to result from its use, an impairment expense is recognized for the amount by which the carrying amount of the asset group exceeds its fair value. The impairment expense cannot exceed the carrying amount of the long-lived assets (but subject to the carrying amount not being reduced below fair value for any individual long-lived asset that is determinable without undue cost and effort). For regulated assets where recovery through approved rates is probable, an impairment expense could be reduced by the establishment of a regulatory asset. For other regulated assets and for non-regulated assets, impairment is recognized as an expense. When long-lived assets meet the criteria to be classified as held-for-sale and the carrying amount of the disposal group exceeds its fair value less costs to sell, an impairment expense is recognized for the excess up to the carrying amount of the long-lived assets; if the fair value of the disposal group subsequently exceeds the carrying amount while the disposal group is still held-for-sale, any impairment expense previously recognized will be reversed up to the lower of the prior expense or the subsequent excess.
SERVICE CONCESSION ASSETS
— Service concession assets are stated at cost, net of accumulated amortization, in accordance with ASC 853. Service concession assets represent the cost of all infrastructure to be transferred to the public-sector entity grantors at the end of the concession. These costs primarily represent construction progress payments, engineering costs, insurance costs, salaries, interest and other costs directly relating to construction of the service concession infrastructure. Government subsidies, liquidated damages recovered for construction delays and income tax credits are recorded as a reduction to Service Concession Assets. Service concession assets are amortized and recognized in earnings as a cost of goods sold as infrastructure construction revenue is recognized. Services provided under concession arrangements are recognized on a straight line basis.
134
THE AES CORPORATION
NOTES TO CONSOLIDATED FINANCIAL STATEMENTS—(Continued)
DECEMBER 31, 2016, 2015, AND 2014
DEBT ISSUANCE COSTS
— Costs incurred in connection with the issuance of long-term debt are deferred and presented as a direct reduction from the face amount of that debt and amortized over the related financing period using the effective interest method. Debt issuance costs related to a line-of-credit are deferred and presented as an asset and amortized over the related financing period. Make-whole payments in connection with early debt retirements are classified as cash flows used in financing activities.
EQUITY METHOD INVESTMENTS
— Investments in entities over which the Company has the ability to exercise significant influence, but not control, are accounted for using the equity method of accounting and reported in
Investments in and advances to affiliates
on the Consolidated Balance Sheets. The Company periodically assesses if there is an indication that the fair value of an equity method investment is less than its carrying amount. When an indicator exists, any excess of the carrying amount over its estimated fair value is recognized as impairment expense when the loss in value is deemed other-than-temporary and included in
Other non-operating expense
in the Consolidated Statements of Operations. The difference between the carrying amount and our underlying equity in the net assets of the investee are accounted for as if the investee were a consolidated subsidiary, except that the portion that represents equity method goodwill is not reviewed for impairment like consolidated goodwill. Upon acquiring the investment, we determine the fair value of the identifiable assets and assumed liabilities and the AES share of the amortization of the basis difference between each fair value and the carrying amount of the corresponding asset or liability in the financial statements of the investee. The amortization of the basis difference is recognized in our net equity in earnings of affiliates over the life of the asset or liability.
The Company discontinues the application of the equity method when an investment is reduced to zero and the Company is not otherwise committed to provide further financial support to the investee. The Company resumes the application of the equity method accounting to the extent that net income is greater than the share of net losses not previously recorded.
GOODWILL AND INDEFINITE-LIVED INTANGIBLE ASSETS
— The Company evaluates goodwill and indefinite-lived intangible assets for impairment on an annual basis and whenever events or changes in circumstances necessitate an evaluation for impairment. The Company's annual impairment testing date is October first.
Goodwill
— The Company evaluates goodwill impairment at the reporting unit level, which is an SBU (i.e. an operating segment as defined in the segment reporting accounting guidance), or a component (i.e., one level below an operating segment). In determining its reporting units, the Company starts with its management reporting structure. Operating segments are identified and then analyzed to identify components which make up these operating segments. Two or more components are combined into a single reporting unit if they are economically similar. Assets and liabilities are allocated to a reporting unit if the assets will be employed by or a liability relates to the operations of the reporting unit or would be considered by a market participant in determining its fair value. Goodwill resulting from an acquisition is assigned to the reporting units that are expected to benefit from the synergies of the acquisition. Generally, each AES business with a goodwill balance constitutes a reporting unit as they are not reported to segment management together with other businesses and are not similar to other businesses in a segment.
Goodwill is evaluated for impairment either under the qualitative assessment option or the two-step test. If the Company qualitatively determines it is more likely than not that the fair value of a reporting unit is greater than its carrying amount, the two-step impairment test is unnecessary. Otherwise, goodwill is evaluated for impairment using the two-step test, where the carrying amount of a reporting unit is compared to its fair value in Step 1; if the fair value exceeds the carrying amount, Step 2 is unnecessary. If the carrying amount exceeds the reporting unit's fair value, this could indicate potential impairment and Step 2 of the goodwill evaluation process is required to determine if goodwill is impaired and to measure the amount of impairment loss to recognize, if any. When Step 2 is necessary, the fair value of individual assets and liabilities is determined using valuations (which in some cases may be based in part on third party valuation reports) or other observable sources of fair value, as appropriate. If the carrying amount of goodwill exceeds its implied fair value, the excess is recognized as an impairment loss up to the carrying amount of the goodwill.
Most of the Company's reporting units are not publicly traded. Therefore, the Company estimates the fair value of its reporting units using internal budgets and forecasts, adjusted for any market participants' assumptions and discounted at the rate of return required by a market participant. The Company generally considers both market and income-based approaches to determine a range of fair value, but typically concludes that the value derived using an income-based approach is more representative of fair value due to the lack of direct market comparables. The
135
THE AES CORPORATION
NOTES TO CONSOLIDATED FINANCIAL STATEMENTS—(Continued)
DECEMBER 31, 2016, 2015, AND 2014
Company utilizes market data, when available, to corroborate and determine the reasonableness of the fair value derived from the income-based discounted cash flow analysis.
Indefinite-Lived Intangible Assets
— The Company's indefinite-lived intangible assets primarily include land-use rights and water rights. These are tested for impairment on an annual basis or whenever events or changes in circumstances necessitate an evaluation for impairment. If the carrying amount of an intangible asset exceeds its fair value, the excess is recognized as impairment expense. When deemed appropriate, the Company uses the qualitative assessment option under the accounting guidance on goodwill and intangible assets to determine whether the existence of events or circumstances indicate that it is more likely than not that an intangible asset is impaired. If, after assessing the totality of events and circumstances, the Company determines that it is not more likely than not that an intangible asset is impaired, no further action is taken. The accounting guidance provides the option to bypass the qualitative assessment for any intangible asset in any period and proceed directly to performing the quantitative impairment test.
ACCOUNTS PAYABLE AND OTHER ACCRUED LIABILITIES
— Accounts payable consists of amounts due to trade creditors related to the Company's core business operations. These payables include amounts owed to vendors and suppliers for items such as energy purchased for resale, fuel, maintenance, inventory and other raw materials. Other accrued liabilities include items such as income taxes, regulatory liabilities, legal contingencies and employee-related costs including payroll, benefits and related taxes.
REGULATORY ASSETS AND LIABILITIES
— The Company records assets and liabilities that result from the regulated ratemaking process that are not recognized under GAAP for non-regulated entities. Regulatory assets generally represent incurred costs that have been deferred due to the future recovery in customer rates being probable. Generally, returns earned on regulatory assets are reflected on the Consolidated Statement of Operations within
Interest Income
. Regulatory liabilities generally represent obligations to make refunds to customers. Management continually assesses whether the regulatory assets are probable of future recovery and regulatory of liabilities are probable of future payment by considering factors such as applicable regulatory changes, recent rate orders applicable to other regulated entities and the status of any pending or potential deregulation legislation. If future recovery of costs previously deferred ceases to be probable, the related regulatory assets are written off and recognized in income from continuing operations.
PENSION AND OTHER POSTRETIREMENT PLANS
— The Company recognizes in its Consolidated Balance Sheets an asset or liability reflecting the funded status of pension and other postretirement plans with current-year changes in actuarial gains or losses recognized in AOCL, except for those plans at certain of the Company's regulated utilities that can recover portions of their pension and postretirement obligations through future rates. All plan assets are recorded at fair value. AES follows the measurement date provisions of the accounting guidance, which require a year-end measurement date of plan assets and obligations for all defined benefit plans.
Effective January 1, 2016, the Company applied a disaggregated discount rate approach for determining service cost and interest cost for its defined benefit pension plans and postretirement plans in the U.S. and U.K. This approach is consistent with the requirements of ASC 715—
Compensation—Retirement Benefits
and is considered to be more precise compared to the aggregated single rate discount approach, which has historically been used in the U.S. and U.K., because it is more consistent with the philosophy of a full yield curve valuation. The disaggregated rate approach can be applied only in countries with a sufficiently robust yield curve. For countries other than the U.S. and U.K., the Company will continue to apply a local government bond yield approach.
The change in discount rate approach in the U.S. and U.K. did not have an impact on the measurement of the benefit obligations as of December 31, 2015. The 2016 service costs and interest costs included in Note
14
—
Benefit Plans
reflect the change in estimate described above. The impact of the change in approach on service costs for the U.S. and U.K. plans in 2016 is shown below (in millions):
|
2016 Service Cost
|
2016 Interest Cost
|
||||||||||||||||||||||
|
Disaggregated rate approach
|
Aggregate rate approach
|
Impact of change
|
Disaggregated rate approach
|
Aggregate rate approach
|
Impact of change
|
||||||||||||||||||
|
U.S.
|
$
|
13
|
|
$
|
14
|
|
$
|
(1
|
)
|
$
|
42
|
|
$
|
51
|
|
$
|
(9
|
)
|
|||||
|
U.K.
|
3
|
|
4
|
|
(1
|
)
|
7
|
|
9
|
|
(2
|
)
|
|||||||||||
|
Total
|
$
|
16
|
|
$
|
18
|
|
$
|
(2
|
)
|
$
|
49
|
|
$
|
60
|
|
$
|
(11
|
)
|
|||||
INCOME TAXES
— Deferred tax assets and liabilities are recognized for the future tax consequences attributable to differences between the financial statement carrying amounts of the existing assets and liabilities,
136
THE AES CORPORATION
NOTES TO CONSOLIDATED FINANCIAL STATEMENTS—(Continued)
DECEMBER 31, 2016, 2015, AND 2014
and their respective income tax bases. The Company establishes a valuation allowance when it is more likely than not that all or a portion of a deferred tax asset will not be realized. The Company's tax positions are evaluated under a more likely than not recognition threshold and measurement analysis before they are recognized for financial statement reporting.
Uncertain tax positions have been classified as noncurrent income tax liabilities unless expected to be paid within one year. The Company's policy for interest and penalties related to income tax exposures is to recognize interest and penalties as a component of the provision for income taxes in the Consolidated Statements of Operations.
ASSET RETIREMENT OBLIGATIONS
— The Company records the fair value of the liability for a legal obligation to retire an asset in the period in which the obligation is incurred. When a new liability is recognized, the Company capitalizes the costs of the liability by increasing the carrying amount of the related long-lived asset. The liability is accreted to its present value each period and the capitalized cost is depreciated over the useful life of the related asset. Upon settlement of the obligation, the Company eliminates the liability and, based on the actual cost to retire, may incur a gain or loss.
NONCONTROLLING INTERESTS
— Noncontrolling interests are classified as a separate component of equity in the Consolidated Balance Sheets and Consolidated Statements of Changes in Equity. Additionally, net income and comprehensive income attributable to noncontrolling interests are reflected separately from consolidated net income and comprehensive income on the Consolidated Statements of Operations and Consolidated Statements of Changes in Equity. Any change in ownership of a subsidiary while the controlling financial interest is retained is accounted for as an equity transaction between the controlling and noncontrolling interests (unless the transaction qualifies as a sale of in-substance real estate). Losses continue to be attributed to the noncontrolling interests, even when the noncontrolling interests' basis has been reduced to zero.
Although, in general, the noncontrolling ownership interest in earnings is calculated based on ownership percentage, certain of the Company's businesses are subject to profit-sharing arrangements. These agreements exist for certain renewable generation partnerships to designate different allocations of value among investors, where the allocations change in form or percentage over the life of the partnership. For these businesses, the Company uses the HLBV method when it is a reasonable approximation of the profit-sharing arrangement. HLBV uses a balance sheet approach, which measures the Company's share of income or loss by calculating the change in the amount of net worth the partners are legally able to claim based on a hypothetical liquidation of the entity at the beginning of a reporting period compared to the end of that period.
Equity securities with redemption features that are not solely within the control of the issuer are classified outside of permanent equity. Generally, initial measurement will be at fair value. Subsequent measurement and classification vary depending on whether the instrument is probable of becoming redeemable. Where the equity instrument is not probable of becoming redeemable subsequent allocation of income and dividends is classified in permanent equity. For those securities where it is probable that the instrument will become redeemable or that are currently redeemable, AES recognizes changes in the fair value at each accounting period against retained earnings subject to the floor of the initial fair value. Further, the allocation of income and dividends, as well as the adjustment to fair value, is classified outside permanent equity. Amounts that are mandatory redeemable are classified as a liability.
FOREIGN CURRENCY TRANSLATION
— A business's functional currency is the currency of the primary economic environment in which the business operates and is generally the currency in which the business generates and expends cash. Subsidiaries and affiliates whose functional currency is a currency other than the U.S. dollar translate their assets and liabilities into U.S. dollars at the current exchange rates in effect at the end of the fiscal period. Translation adjustments arising from the translation of the balance sheet of such subsidiaries are included in AOCL. The revenue and expense accounts of such subsidiaries and affiliates are translated into U.S. dollars at the average exchange rates that prevailed during the period. Gains and losses on intercompany foreign currency transactions that are long-term in nature and which the Company does not intend to settle in the foreseeable future, are also recognized in AOCL. Gains and losses that arise from exchange rate fluctuations on transactions denominated in a currency other than the functional currency are included in determining net income. Accumulated foreign currency translation adjustments are reclassified from AOCL to net income only when realized upon sale or upon complete or substantially complete liquidation of the investment in a foreign entity. The accumulated adjustments are included in carrying amounts in impairment assessments where the Company has committed to a plan that will cause the accumulated adjustments to be reclassified to earnings.
137
THE AES CORPORATION
NOTES TO CONSOLIDATED FINANCIAL STATEMENTS—(Continued)
DECEMBER 31, 2016, 2015, AND 2014
REVENUE RECOGNITION
— Revenue from utilities is classified as regulated in the Consolidated Statements of Operations. Revenue from the sale of energy is recognized in the period during which the sale occurs. The calculation of revenue earned but not yet billed is based on the number of days not billed in the month, the estimated amount of energy delivered during those days and the estimated average price per customer class for that month. Differences between actual and estimated unbilled revenue are usually immaterial. The Company has businesses where it sells and purchases power to and from ISOs and RTOs. In those instances, the Company accounts for these transactions on a net hourly basis because the transactions are settled on a net hourly basis. Revenue from generation businesses is classified as non-regulated and is recognized based upon output delivered and capacity provided, at rates as specified under contract terms or prevailing market rates. Certain of the Company PPAs meet the definition of an operating lease or contain similar arrangements. Typically, minimum lease payments from such PPAs are recognized as revenue on a straight-line basis over the lease term whereas contingent rentals are recognized when earned. Revenue is recorded net of any taxes assessed on and collected from customers, which are remitted to the governmental authorities.
SHARE-BASED COMPENSATION
— The Company grants share-based compensation in the form of stock options, restricted stock units, and performance stock units. The expense is based on the grant-date fair value of the equity or liability instrument issued and is recognized on a straight-line basis over the requisite service period, net of estimated forfeitures. The Company uses a Black-Scholes option pricing model to estimate the fair value of stock options granted to its employees.
GENERAL AND ADMINISTRATIVE EXPENSES
— General and administrative expenses include corporate and other expenses related to corporate staff functions and initiatives, primarily executive management, finance, legal, human resources and information systems, which are not directly allocable to our business segments. Additionally, all costs associated with corporate business development efforts are classified as general and administrative expenses.
DERIVATIVES AND HEDGING ACTIVITIES
— Under the accounting standards for derivatives and hedging, the Company recognizes all contracts that meet the definition of a derivative, except those designated as normal purchase or normal sale at inception, as either assets or liabilities in the Consolidated Balance Sheets and measures those instruments at fair value. See the Company's fair value policy and Note 4—
Fair Value
for additional discussion regarding the determination of the fair value. The PPAs and fuel supply agreements entered into by the Company are evaluated to determine if they meet the definition of a derivative or contain embedded derivatives, either of which require separate valuation and accounting. To be a derivative under the accounting standards for derivatives and hedging, an agreement would need to have a notional and an underlying, require little or no initial net investment and could be net settled. Generally, these agreements do not meet the definition of a derivative, often due to the inability to be net settled. On a quarterly basis, we evaluate the markets for the commodities to be delivered under these agreements to determine if facts and circumstances have changed such that the agreements could then be net settled and meet the definition of a derivative.
Derivatives primarily consist of interest rate swaps, cross-currency swaps, foreign currency instruments, and commodity derivatives. The Company enters into various derivative transactions in order to hedge its exposure to certain market risks, primarily interest rate, foreign currency and commodity price risks. Regarding interest rate risk, the Company and our subsidiaries generally utilize variable rate debt financing for construction projects and operations so interest rate swap, lock, cap, and floor agreements are entered into to manage interest rate risk by effectively fixing or limiting the interest rate exposure on the underlying financing and are typically designated as cash flow hedges. Regarding foreign currency risk, we are exposed to it as a result of our investments in foreign subsidiaries and affiliates that may be impacted by significant fluctuations in foreign currency exchange rates so foreign currency options and forwards are utilized, where deemed appropriate, to manage the risk related to these fluctuations. Cross-currency swaps are utilized in certain instances to manage the risk related to certain foreign currencies and the associated impact on interest and loan principal payments. In addition, certain of our subsidiaries have entered into contracts which contain embedded foreign currency derivatives as a result of the contracts being denominated in a currency other than the functional or local currency of the parties to the contract. Regarding commodity price risk, we are exposed to the impact of market fluctuations in the price of electricity, fuel and environmental credits. Although we primarily consist of businesses with long-term contracts or retail sales concessions (which provide our distribution businesses with a franchise to serve a specific geographic region), a portion of our current and expected future revenues are derived from businesses without significant long-term purchase or sales contracts. We use an overall hedging strategy, not just derivatives, to hedge our financial performance against the effects of fluctuations in commodity prices.
138
THE AES CORPORATION
NOTES TO CONSOLIDATED FINANCIAL STATEMENTS—(Continued)
DECEMBER 31, 2016, 2015, AND 2014
The accounting standards for derivatives and hedging enable companies to designate qualifying derivatives as hedging instruments based on the exposure being hedged. The Company only has cash flow hedges at this time. Changes in the fair value of a derivative that is highly effective, designated and qualifies as a cash flow hedge are deferred in AOCL and are recognized into earnings as the hedged transactions affect earnings. Any ineffectiveness is recognized in earnings immediately. For all designated and qualifying hedges, the Company maintains formal documentation of the hedge and effectiveness testing in accordance with the accounting standards for derivatives and hedging. If AES determines that the derivative is no longer highly effective as a hedge, hedge accounting will be discontinued prospectively. For cash flow hedges of forecasted transactions, AES estimates the future cash flows of the forecasted transactions and evaluates the probability of the occurrence and timing of such transactions. Changes in conditions or the occurrence of unforeseen events could require discontinuance of hedge accounting or could affect the timing of the reclassification of gains or losses on cash flow hedges from AOCL into earnings.
While derivative transactions are not entered into for trading purposes, some contracts are either not eligible or not designated for hedge accounting. Changes in the fair value of derivatives not designated and qualifying as cash flow hedges are immediately recognized in earnings. Regardless of when gains or losses on derivatives (including all those where the fair value measurement is classified as Level 3) are recognized in earnings, they are generally classified as follows: interest expense for interest rate and cross-currency derivatives, foreign currency transaction gains or losses for foreign currency derivatives, and non-regulated revenue or non-regulated cost of sales for commodity and other derivatives. However, gains and losses on interest rate and cross-currency derivatives are classified as foreign currency transaction gains and losses if they offset the remeasurement of the foreign currency-denominated debt being hedged by the cross-currency swaps. If the underlying hedged item is construction debt, the effective portion of the realized swap payment related to capitalized interest is deferred in AOCL, then reclassified to cost of sales to offset depreciation expense over the useful life of the associated asset. Any foreign currency remeasurement effects in earnings of the foreign currency denominated debt is offset by a reclassification from AOCL. Cash flows arising from derivatives are included in the Consolidated Statements of Cash Flows as an operating activity given the nature of the underlying risk being economically hedged and the lack of significant financing elements, except that cash flows on designated and qualifying hedges of variable-rate interest during construction are classified as an investing activity.
The Company has elected not to offset net derivative positions in the financial statements. Accordingly, the Company does not offset such derivative positions against the fair value of amounts (or amounts that approximate fair value) recognized for the right to reclaim cash collateral (a receivable) or the obligation to return cash collateral (a payable) under master netting arrangements.
NEW ACCOUNTING PRONOUNCEMENTS
—
The following table provides a brief description of recent accounting pronouncements that had and/or could have a material impact on the Company’s consolidated financial statements. Accounting pronouncements not listed below were assessed and determined to be either not applicable or are expected to have no material impact on the Company’s consolidated financial statements.
139
THE AES CORPORATION
NOTES TO CONSOLIDATED FINANCIAL STATEMENTS—(Continued)
DECEMBER 31, 2016, 2015, AND 2014
|
New Accounting Standards Adopted
|
|||
|
ASU Number and Name
|
Description
|
Date of Adoption
|
Effect on the financial statements upon adoption
|
|
2016-19 — Technical Corrections and Improvements
|
This standard clarifies that the license of internal-use software shall be accounted for as the acquisition of an intangible asset. Transition Method: retrospective.
The adoption of the new guidance did not have an impact on net income, net assets or net equity.
|
December 31, 2016
|
The license fees and capitalized costs of internal-use software previously classified as property plant and equipment of $469 million, the corresponding accumulated amortization of $388 million, and construction in progress of $52 million were reclassified to intangible assets as of December 31, 2015.
|
|
2015-03, 2015-15, Interest — Imputation of Interest (Subtopic 835-30)
|
These standards simplify the presentation of debt issuance costs by requiring that debt issuance costs related to a tranche of debt be presented on the balance sheet as a direct deduction from the carrying amount of that debt, consistent with debt discounts. Debt issuance costs related to a line-of-credit can still be presented as an asset and subsequently amortized over the term of the line-of-credit, regardless of whether there are any outstanding borrowings on the line-of-credit arrangement. The recognition and measurement guidance for debt issuance costs are not affected by the standard. Transition method: retrospective.
|
January 1, 2016
|
Deferred financing costs of $24 million previously classified within other current assets and $357 million previously classified within other noncurrent assets were reclassified to reduce the related debt liabilities as of December 31, 2015.
|
|
2015-02, Consolidation — Amendments to the Consolidation Analysis (Topic 810)
|
The standard makes targeted amendments to the current consolidation guidance and ends the deferral granted to investment companies from applying the VIE guidance. The standard amends the evaluation of whether (1) fees paid to a decision-maker or service providers represent a variable interest, (2) a limited partnership or similar entity has the characteristics of a VIE and (3) a reporting entity is the primary beneficiary of a VIE. Transition method: retrospective.
|
January 1, 2016
|
None, other than that some entities previously consolidated under the voting model are now consolidated under the VIE model.
|
|
New Accounting Standards Issued But Not Yet Effective
|
|||
|
ASU Number and Name
|
Description
|
Date of Adoption
|
Effect on the financial statements upon adoption
|
|
2017-04, Intangibles - Goodwill and Other (Topic 350): Simplifying the Test for Goodwill Impairment
|
This standard simplifies the accounting for goodwill impairment by removing the requirement to calculate the implied fair value. Instead, it requires that an entity records an impairment charge based on the excess of a reporting unit's carrying amount over its fair value.
Transition method: retrospective.
|
January 1, 2020. Early adoption is permitted as of January 1, 2017.
|
The Company is currently evaluating the impact of adopting the standard on its consolidated financial statements.
|
|
2017-01, Business Combinations (Topic 805): Clarifying the Definition of a Business
|
This standard provides guidance to assist the entities with evaluating when a set of transferred assets and activities is a business.
Transition method: prospective.
|
January 1, 2018. Early adoption is permitted
|
The Company is currently evaluating the impact of adopting the standard on its consolidated financial statements.
|
|
2016-18, Statement of Cash Flows (Topic 320): Restricted Cash (a consensus of the FASB Emerging Issues Task Force)
|
This standard requires that a statement of cash flows explain the change during the period in the total of cash, cash equivalents, and amounts generally described as restricted cash or restricted cash equivalents. Therefore, amounts generally described as restricted cash and restricted cash equivalents should be included with cash and cash equivalents when reconciling the beginning-of-period and end-of-period total amounts shown on the statement of cash flows. Transition method: retrospective.
|
January 1, 2018. Early adoption is permitted.
|
The Company is currently evaluating the impact of adopting the standard on its consolidated financial statements.
|
|
2016-16, Income Taxes (Topic 740): Intra-Entity Transfers of Assets Other Than Inventory
|
This standard requires that an entity recognizes the income tax consequences of an intra-entity transfer of an asset other than inventory when the transfer occurs. Transition method: modified retrospective.
|
January 1, 2018. Early adoption is permitted.
|
The Company is currently evaluating the impact of adopting the standard on its consolidated financial statements.
|
|
2016-15, Statement of Cash Flows (Topic 230): Classification of Certain Receipts and Cash Payments (a consensus of the Emerging Issues Task Force)
|
This standard provides specific guidance on how certain cash transactions are presented and classified in the statement of cash flows. Transition method: retrospective.
|
January 1, 2018. Early adoption is permitted.
|
The Company is currently evaluating the impact of adopting the standard, but does not anticipate a material impact on its consolidated financial statements.
|
|
2016-13, Financial Instruments-Credit Losses (Topic 326): Measurement of Credit Losses on Financial Instruments
|
The standard updates the impairment model for financial assets measured at amortized cost to an expected loss model rather than an incurred loss model. It also allows for the presentation of credit losses on available-for-sale debt securities as an allowance rather than a write down. Transition method: various.
|
January 1, 2020. Early adoption is permitted only as of January 1, 2019.
|
The Company is currently evaluating the impact of adopting the standard on its consolidated financial statements.
|
140
THE AES CORPORATION
NOTES TO CONSOLIDATED FINANCIAL STATEMENTS—(Continued)
DECEMBER 31, 2016, 2015, AND 2014
|
2016-09, Compensation
—
Stock Compensation (Topic 718): Improvements to Employee Share-Based Payment Accounting
|
The standard simplifies the following aspects of accounting for share-based payments awards: accounting for income taxes, classification of excess tax benefits on the statement of cash flows, forfeitures, statutory tax withholding requirements, classification of awards as either equity or liabilities and classification of employee taxes paid on statement of cash flows when an employer withholds shares for tax-withholding purposes. Transition method: The recording of excess tax benefits and tax deficiencies arising from vesting or settlement will be applied prospectively. The elimination of the requirement that excess tax benefits be realized before they are recognized will be adopted on a modified retrospective basis with a cumulative adjustment to the opening balance sheet.
|
January 1, 2017.
|
The primary effect of adoption will be the recognition of excess tax benefits in our provision for income taxes in the period when the awards vest or are settled, rather than in paid-in-capital in the period when the excess tax benefits are realized. Upon adoption, the change will result in a decrease of approximately $30 million to net deferred tax liabilities, offset by an increase to retained earnings. We will continue to estimate the number of awards that are expected to vest in our determination of the related periodic compensation cost.
|
|
2016-02, Leases (Topic 842)
|
The standard creates Topic 842, Leases, which supersedes Topic 840, Leases. It introduces a lessee model that brings substantially all leases onto the balance sheet while retaining most of the principles of the existing lessor model in U.S. GAAP and aligning many of those principles with ASC 606, Revenue from Contracts with Customers. Transition method: modified retrospective approach with certain practical expedients.
|
January 1, 2019. Early adoption is permitted.
|
The Company is currently evaluating the impact of adopting the standard on its consolidated financial statements. The Company intends to adopt the standard as of January 1, 2019.
|
|
2014-09, 2015-14, 2016-08, 2016-10, 2016-12, 2016-20, Revenue from Contracts with Customers (Topic 606)
|
See discussion of the ASU below:
|
January 1, 2018. Earlier application is permitted only as of January 1, 2017.
|
The Company will adopt the standard on January 1, 2018; see below for the evaluation of the impact of its adoption on the consolidated financial statements.
|
ASU 2014-09 and its subsequent corresponding updates provides the principles an entity must apply to measure and recognize revenue. The core principle is that an entity shall recognize revenue to depict the transfer of promised goods or services to customers in an amount that reflects the consideration to which the entity expects to be entitled in exchange for those goods or services. Amendments to the standard were issued that provide further clarification of the principle and to provide certain transition expedients. The standard will replace most existing revenue recognition guidance in GAAP, including the guidance on recognizing other income upon the sale or transfer of nonfinancial assets (including in-substance real estate).
The standard requires retrospective application and allows either a full retrospective adoption in which all of the periods are presented under the new standard or a modified retrospective approach in which the cumulative effect of initially applying the guidance is recognized at the date of initial application. We are currently working towards adopting the standard using the full retrospective method. However, the company will continue to assess this conclusion which is dependent on the final impact to the financial statements.
In 2016, the company established a cross-functional implementation team and is in the process of evaluating changes to our business processes, systems and controls to support recognition and disclosure under the new standard. At this time, we do not expect any significant impact on our financial systems as a result of the implementation of the new revenue recognition standard.
Given the complexity and diversity of our non-regulated arrangements, the Company is assessing the standard on a contract by contract basis and has completed more than half of the total expected effort. Through this assessment, the Company has identified certain key issues that we are continuing to evaluate in order to complete our assessment of the full population of contracts and be able to assess the overall impact to the financial statements. These issues include: the application of the practical expedient for measuring progress toward satisfaction of a performance obligation, when variable quantities would be considered variable consideration versus an option to acquire additional goods and services, how to measure progress toward completion for a performance obligation that is a bundle and application of the standard to contracts that are under the scope of Service Concession Arrangements (Topic 853). We are continuing to work with various non-authoritative industry groups, and monitoring the FASB and Transition Resource Group (TRG) activity, as we finalize our accounting policy on these and other industry specific interpretative issues which is expected in 2017.
141
THE AES CORPORATION
NOTES TO CONSOLIDATED FINANCIAL STATEMENTS—(Continued)
DECEMBER 31, 2016, 2015, AND 2014
2
. INVENTORY
Inventory is valued primarily using the average-cost method. The following table summarizes the Company's inventory balances as of the dates indicated (in millions):
|
December 31,
|
2016
|
2015
|
||||||
|
Fuel and other raw materials
|
$
|
302
|
|
$
|
343
|
|
||
|
Spare parts and supplies
|
328
|
|
328
|
|
||||
|
Total
|
$
|
630
|
|
$
|
671
|
|
||
3
. PROPERTY, PLANT AND EQUIPMENT
The following table summarizes the components of the electric generation and distribution assets and other property, plant and equipment (in millions) with their estimated useful lives (in years). The amounts are stated net of all prior asset impairment losses recognized.
|
December 31,
|
|||||||||
|
Estimated Useful Life
|
2016
|
2015
|
|||||||
|
Electric generation and distribution facilities
|
4 - 68
|
$
|
25,773
|
|
$
|
24,740
|
|
||
|
Other buildings
|
3 - 63
|
2,034
|
|
1,856
|
|
||||
|
Furniture, fixtures and equipment
|
3 - 31
|
309
|
|
288
|
|
||||
|
Other
|
2 - 50
|
423
|
|
398
|
|
||||
|
Total electric generation and distribution assets and other
|
28,539
|
|
27,282
|
|
|||||
|
Accumulated depreciation
|
(9,528
|
)
|
(8,939
|
)
|
|||||
|
Net electric generation and distribution assets and other
|
$
|
19,011
|
|
$
|
18,343
|
|
|||
The following table summarizes depreciation expense (including the amortization of assets recorded under capital leases and the amortization of asset retirement obligations) and interest capitalized during development and construction on qualifying assets for the periods indicated (in millions):
|
Years Ended December 31,
|
2016
|
2015
|
2014
|
|||||||||
|
Depreciation expense
|
$
|
1,105
|
|
$
|
1,064
|
|
$
|
1,154
|
|
|||
|
Interest capitalized during development and construction
|
125
|
|
89
|
|
118
|
|
||||||
Property, plant and equipment, net of accumulated depreciation, of
$10 billion
and
$11 billion
was mortgaged, pledged or subject to liens as of
December 31, 2016
and
2015
, respectively.
The following table summarizes regulated and non-regulated generation and distribution property, plant and equipment and accumulated depreciation as of the dates indicated (in millions):
|
December 31,
|
2016
|
2015
|
||||||
|
Regulated generation, distribution assets and other, gross
|
$
|
11,021
|
|
$
|
10,789
|
|
||
|
Regulated accumulated depreciation
|
(4,194
|
)
|
(3,984
|
)
|
||||
|
Regulated generation, distribution assets and other, net
|
6,827
|
|
6,805
|
|
||||
|
Non-regulated generation, distribution assets and other, gross
|
17,518
|
|
16,493
|
|
||||
|
Non-regulated accumulated depreciation
|
(5,334
|
)
|
(4,955
|
)
|
||||
|
Non-regulated generation, distribution assets and other, net
|
12,184
|
|
11,538
|
|
||||
|
Net electric generation, distribution assets and other
|
$
|
19,011
|
|
$
|
18,343
|
|
||
The following table presents amounts recognized related to asset retirement obligations for the periods indicated (in millions):
|
2016
|
2015
|
|||||||
|
Balance at January 1
|
$
|
247
|
|
$
|
209
|
|
||
|
Additional liabilities incurred
|
12
|
|
43
|
|
||||
|
Liabilities settled
|
(4
|
)
|
(6
|
)
|
||||
|
Accretion expense
|
15
|
|
13
|
|
||||
|
Change in estimated cash flows
|
86
|
|
(7
|
)
|
||||
|
Other
|
1
|
|
(5
|
)
|
||||
|
Balance at December 31
|
$
|
357
|
|
$
|
247
|
|
||
The Company's asset retirement obligations primarily include active ash landfills, water treatment basins and the removal or dismantlement of certain plants and equipment. The
$86 million
increase in estimated cash flows for 2016 is primarily relates to revised estimated closure expenditures and earlier plant closure dates than previously forecast at DPL. There were
$1 million
of legally restricted assets for the year ended
December 31, 2016
and
$2 million
for the year ended
December 31, 2015
for purposes of settling asset retirement obligations.
142
THE AES CORPORATION
NOTES TO CONSOLIDATED FINANCIAL STATEMENTS—(Continued)
DECEMBER 31, 2016, 2015, AND 2014
Ownership of Certain Coal-Fired Facilities
— DP&L has undivided ownership interests in
five
coal-fired generation facilities jointly owned with other utilities. DP&L's share of the operating costs of the facilities is included in
Cost of Sales
in the Consolidated Statements of Operations and its share of investment in the facilities is included in
Property, Plant and Equipment
in the Consolidated Balance Sheets. DP&L's undivided ownership interest in the facilities as of
December 31, 2016
is as follows ($ in millions):
|
DP&L Share
|
DP&L Investment
|
||||||||||||
|
Production units:
|
Ownership
|
Gross Plant In Service
|
Accumulated Depreciation
|
Construction Work In Process
|
|||||||||
|
Conesville Unit 4
|
17%
|
$
|
—
|
|
$
|
—
|
|
$
|
—
|
|
|||
|
Killen Station
|
67%
|
34
|
|
—
|
|
2
|
|
||||||
|
Miami Fort Units 7 and 8
|
36%
|
27
|
|
—
|
|
7
|
|
||||||
|
Stuart Station
|
35%
|
24
|
|
—
|
|
23
|
|
||||||
|
Zimmer Station
|
28%
|
7
|
|
—
|
|
9
|
|
||||||
|
Transmission
|
Various
|
99
|
|
66
|
|
—
|
|
||||||
|
Total
|
$
|
191
|
|
$
|
66
|
|
$
|
41
|
|
||||
4
. FAIR VALUE
The fair value of current financial assets and liabilities, debt service reserves and other deposits approximate their reported carrying amounts. The estimated fair values of the Company's assets and liabilities have been determined using available market information. By virtue of these amounts being estimates and based on hypothetical transactions to sell assets or transfer liabilities, the use of different market assumptions and/or estimation methodologies may have a material effect on the estimated fair value amounts.
Valuation Techniques
—
The fair value measurement accounting guidance describes three main approaches to measuring the fair value of assets and liabilities: (1) market approach, (2) income approach and (3) cost approach. The market approach uses prices and other relevant information generated from market transactions involving identical or comparable assets or liabilities. The income approach uses valuation techniques to convert future amounts to a single present value amount. The measurement is based on current market expectations of the return on those future amounts. The cost approach is based on the amount that would currently be required to replace an asset. The Company measures its investments and derivatives at fair value on a recurring basis. Additionally, in connection with annual or event-driven impairment evaluations, certain nonfinancial assets and liabilities are measured at fair value on a nonrecurring basis. These include long-lived tangible assets (i.e., property, plant and equipment), goodwill and intangible assets (e.g., sales concessions, land use rights and water rights, etc.). In general, the Company determines the fair value of investments and derivatives using the market approach and the income approach, respectively. In the nonrecurring measurements of nonfinancial assets and liabilities, all three approaches are considered; however, the value estimated under the income approach is often the most representative of fair value.
Investments
— The Company's investments measured at fair value generally consist of marketable debt and equity securities. Equity securities are either measured at fair value using quoted market prices, which are considered Level 1 measurements in the fair value hierarchy, or measured at fair value based on comparisons to market data obtained for similar assets, which are considered Level 2 measurements in the fair value hierarchy. Debt securities primarily consist of unsecured debentures, certificates of deposit and government debt securities held by our Brazilian subsidiaries. Returns and pricing on these instruments are generally indexed to the CDI rates in Brazil. Debt securities are measured at fair value based on comparisons to market data obtained for similar assets and are considered Level 2 measurements in the fair value hierarchy.
Derivatives
— Any Level 1 derivative instruments are exchange-traded commodity futures for which the pricing is observable in active markets, and as such, these are not expected to transfer to other levels. There have been no transfers between Level 1 and Level 2.
For all derivatives, with the exception of any classified as Level 1, the income approach is used, which consists of forecasting future cash flows based on contractual notional amounts and applicable and available market data as of the valuation date. The most common market data inputs used in the income approach include volatilities, spot and forward benchmark interest rates (such as LIBOR and EURIBOR), foreign exchange rates and commodity prices. Forward rates with the same tenor as the derivative instrument being valued are generally obtained from published sources, with these forward rates being assessed quarterly at a portfolio-level for reasonableness versus comparable published information provided from another source. When significant inputs are not observable, the Company uses relevant techniques to determine the inputs, such as regression analysis or prices for similarly traded instruments available in the market.
143
THE AES CORPORATION
NOTES TO CONSOLIDATED FINANCIAL STATEMENTS—(Continued)
DECEMBER 31, 2016, 2015, AND 2014
For derivatives for which there is a standard industry valuation model, the Company uses a third-party derivative accounting and valuation service provider that uses a standard model and observable inputs to estimate the fair value. For these derivatives, the Company performs analytical procedures and makes comparisons to other third-party information in order to assess the reasonableness of the fair value. For derivatives for which there is not a standard industry valuation model (such as PPAs and fuel supply agreements that are derivatives or include embedded derivatives), the Company has created internal valuation models to estimate the fair value, using observable data to the extent available. At each quarter-end, the models for the commodity and foreign currency-based derivatives are generally prepared and reviewed by employees who globally manage the respective commodity and foreign currency risks and are analytically reviewed independent of those employees.
Those cash flows are then discounted using the relevant spot benchmark interest rate (such as LIBOR or EURIBOR). The Company then makes a credit valuation adjustment ("CVA") by further discounting the cash flows for nonperformance or credit risk based on the observable or estimated debt spread of the Company's subsidiary or its counterparty and the tenor of the respective derivative instrument. The CVA for potential future scenarios in which the derivative is in an asset is based on the counterparty's credit ratings, credit default swap spreads, and debt spreads, as available. The CVA for potential future scenarios in which the derivative is a liability is based on the Parent Company's or the subsidiary's current debt spread. In the absence of readily obtainable credit information, the Parent Company's or the subsidiary's estimated credit rating (based on applying a standard industry model to historical financial information and then considering other relevant information) and spreads of comparably rated entities or the respective country's debt spreads are used as a proxy. All derivative instruments are analyzed individually and are subject to unique risk exposures.
The Company's methodology to fair value its derivatives is to start with any observable inputs; however, in certain instances the published forward rates or prices may not extend through the remaining term of the contract and management must make assumptions to extrapolate the curve, which necessitates the use of unobservable inputs, such as proxy commodity prices or historical settlements to forecast forward prices. Specifically, where there is limited forward curve data with respect to foreign exchange contracts, beyond the traded points the Company utilizes the purchasing power parity approach to construct the remaining portion of the forward curve using relative inflation rates. In addition, in certain instances, there may not be market or market-corroborated data readily available, requiring the use of unobservable inputs. Similarly, in certain instances, the spread that reflects the credit or nonperformance risk is unobservable requiring us to utilize proxy yield curves of similar credit quality. The fair value hierarchy of an asset or a liability is based on the level of significance of the input assumptions. An input assumption is considered significant if it affects the fair value by at least 10%. Assets and liabilities are classified as Level 3 when the use of unobservable inputs is significant. When the use of unobservable inputs is insignificant, assets and liabilities are classified as Level 2. Transfers between Level 3 and Level 2 are determined as of the end of the reporting period and result from changes in significance of unobservable inputs used to calculate the CVA.
Debt
— Recourse and non-recourse debt are carried at amortized cost. The fair value of recourse debt is estimated based on quoted market prices. The fair value of non-recourse debt is estimated differently based upon the type of loan. In general, the carrying amount of variable rate debt is a close approximation of its fair value. For fixed rate loans, the fair value is estimated using quoted market prices or discounted cash flow ("DCF") analyses. In the DCF analysis, the discount rate is based on the credit rating of the individual debt instruments, if available, or the credit rating of the subsidiary. If the subsidiary's credit rating is not available, a synthetic credit rating is determined using certain key metrics, including cash flow ratios and interest coverage, as well as other industry-specific factors. For subsidiaries located outside the U.S., in the event that the country rating is lower than the credit rating previously determined, the country rating is used for purposes of the DCF analysis. The fair value of recourse and non-recourse debt excludes accrued interest at the valuation date. The fair value was determined using available market information as of
December 31, 2016
. The Company is not aware of any factors that would significantly affect the fair value amounts subsequent to
December 31, 2016
.
Nonrecurring Measurements
—
For nonrecurring measurements derived using the income approach, fair value is determined using valuation models based on the principles of DCF. The income approach is most often used in the impairment evaluation of long-lived tangible assets, equity method investments, goodwill, and intangible assets. The Company uses its internally developed DCF valuation models as the primary means to determine nonrecurring fair value measurements though other valuation approaches prescribed under the fair value measurement accounting guidance are also considered. Depending on the complexity of a valuation, an independent valuation firm may be engaged to assist management in the valuation process. A few examples of input assumptions to such valuations include macroeconomic factors such as growth rates, industry demand, inflation, exchange rates and
144
THE AES CORPORATION
NOTES TO CONSOLIDATED FINANCIAL STATEMENTS—(Continued)
DECEMBER 31, 2016, 2015, AND 2014
power and commodity prices. Whenever possible, the Company attempts to obtain market observable data to develop input assumptions. Where the use of market observable data is limited or not available for certain input assumptions, the Company develops its own estimates using a variety of techniques such as regression analysis and extrapolations.
For nonrecurring measurements derived using the market approach, recent market transactions involving the sale of identical or similar assets are considered. The use of this approach is limited because it is often difficult to identify sale transactions of identical or similar assets. This approach is used in impairment evaluations of certain intangible assets. Otherwise, it is used to corroborate the fair value determined under the income approach.
For nonrecurring measurements derived using the cost approach, fair value is typically based upon a replacement cost approach. Under this approach, the depreciated replacement cost of assets is derived by first estimating the current replacement cost of assets and then applying the remaining useful life percentages to such costs. Further adjustments for economic and functional obsolescence are made to the depreciated replacement cost. This approach involves a considerable amount of judgment, which is why its use is limited to the measurement of long-lived tangible assets. Like the market approach, this approach is also used to corroborate the fair value determined under the income approach.
Fair Value Considerations
— In determining fair value, the Company considers the source of observable market data inputs, liquidity of the instrument, the credit risk of the counterparty and the risk of the Company's or its counterparty's nonperformance. The conditions and criteria used to assess these factors are:
Sources of market assumptions
— The Company derives most of its market assumptions from market efficient data sources (e.g., Bloomberg and Reuters). To determine fair value, where market data is not readily available, management uses comparable market sources and empirical evidence to develop its own estimates of market assumptions.
Market liquidity
— The Company evaluates market liquidity based on whether the financial or physical instrument, or the underlying asset, is traded in an active or inactive market. An active market exists if the prices are fully transparent to market participants, can be measured by market bid and ask quotes, the market has a relatively large proportion of trading volume as compared to the Company's current trading volume and the market has a significant number of market participants that will allow the market to rapidly absorb the quantity of assets traded without significantly affecting the market price. Another factor the Company considers when determining whether a market is active or inactive is the presence of government or regulatory controls over pricing that could make it difficult to establish a market-based price when entering into a transaction.
Nonperformance risk
— Nonperformance risk refers to the risk that an obligation will not be fulfilled and affects the value at which a liability is transferred or an asset is sold. Nonperformance risk includes, but may not be limited to, the Company or its counterparty's credit and settlement risk. Nonperformance risk adjustments are dependent on credit spreads, letters of credit, collateral, other arrangements available and the nature of master netting arrangements. The Company and its subsidiaries are parties to various interest rate swaps and options; foreign currency options and forwards; and derivatives and embedded derivatives, which subject the Company to nonperformance risk. The financial and physical instruments held at the subsidiary level are generally non-recourse to the Parent Company.
Nonperformance risk on the investments held by the Company is incorporated in the fair value derived from quoted market data to mark the investments to fair value.
Recurring Measurements
— The following table presents, by level within the fair value hierarchy, as described in Note 1—
General and Summary of Significant Accounting Policies,
the Company's financial assets and liabilities that were measured at fair value on a recurring basis as of the dates indicated (in millions). For the Company's investments in marketable debt and equity securities, the security classes presented are determined based on the nature and risk of the security and are consistent with how the Company manages, monitors and measures its marketable securities:
145
THE AES CORPORATION
NOTES TO CONSOLIDATED FINANCIAL STATEMENTS—(Continued)
DECEMBER 31, 2016, 2015, AND 2014
|
|
December 31, 2016
|
December 31, 2015
|
||||||||||||||||||||||||||||||
|
|
Level 1
|
Level 2
|
Level 3
|
Total
|
Level 1
|
Level 2
|
Level 3
|
Total
|
||||||||||||||||||||||||
|
Assets
|
||||||||||||||||||||||||||||||||
|
AVAILABLE FOR SALE:
|
||||||||||||||||||||||||||||||||
|
Debt securities:
|
||||||||||||||||||||||||||||||||
|
Unsecured debentures
|
$
|
—
|
|
$
|
360
|
|
$
|
—
|
|
$
|
360
|
|
$
|
—
|
|
$
|
318
|
|
$
|
—
|
|
$
|
318
|
|
||||||||
|
Certificates of deposit
|
—
|
|
372
|
|
—
|
|
372
|
|
—
|
|
129
|
|
—
|
|
129
|
|
||||||||||||||||
|
Government debt securities
|
—
|
|
9
|
|
—
|
|
9
|
|
—
|
|
28
|
|
—
|
|
28
|
|
||||||||||||||||
|
Subtotal
|
—
|
|
741
|
|
—
|
|
741
|
|
—
|
|
475
|
|
—
|
|
475
|
|
||||||||||||||||
|
Equity securities:
|
||||||||||||||||||||||||||||||||
|
Mutual funds
|
—
|
|
49
|
|
—
|
|
49
|
|
—
|
|
15
|
|
—
|
|
15
|
|
||||||||||||||||
|
Subtotal
|
—
|
|
49
|
|
—
|
|
49
|
|
—
|
|
15
|
|
—
|
|
15
|
|
||||||||||||||||
|
Total available for sale
|
—
|
|
790
|
|
—
|
|
790
|
|
—
|
|
490
|
|
—
|
|
490
|
|
||||||||||||||||
|
TRADING:
|
||||||||||||||||||||||||||||||||
|
Equity securities:
|
||||||||||||||||||||||||||||||||
|
Mutual funds
|
16
|
|
—
|
|
—
|
|
16
|
|
15
|
|
—
|
|
—
|
|
15
|
|
||||||||||||||||
|
Total trading
|
16
|
|
—
|
|
—
|
|
16
|
|
15
|
|
—
|
|
—
|
|
15
|
|
||||||||||||||||
|
DERIVATIVES:
|
||||||||||||||||||||||||||||||||
|
Interest rate derivatives
|
—
|
|
18
|
|
—
|
|
18
|
|
—
|
|
—
|
|
—
|
|
—
|
|
||||||||||||||||
|
Cross currency derivatives
|
—
|
|
4
|
|
—
|
|
4
|
|
—
|
|
—
|
|
—
|
|
—
|
|
||||||||||||||||
|
Foreign currency derivatives
|
—
|
|
54
|
|
255
|
|
309
|
|
—
|
|
35
|
|
292
|
|
327
|
|
||||||||||||||||
|
Commodity derivatives
|
—
|
|
38
|
|
7
|
|
45
|
|
—
|
|
41
|
|
7
|
|
48
|
|
||||||||||||||||
|
Total derivatives — assets
|
—
|
|
114
|
|
262
|
|
376
|
|
—
|
|
76
|
|
299
|
|
375
|
|
||||||||||||||||
|
TOTAL ASSETS
|
$
|
16
|
|
$
|
904
|
|
$
|
262
|
|
$
|
1,182
|
|
$
|
15
|
|
$
|
566
|
|
$
|
299
|
|
$
|
880
|
|
||||||||
|
Liabilities
|
||||||||||||||||||||||||||||||||
|
DERIVATIVES:
|
||||||||||||||||||||||||||||||||
|
Interest rate derivatives
|
$
|
—
|
|
$
|
121
|
|
$
|
179
|
|
$
|
300
|
|
$
|
—
|
|
$
|
54
|
|
$
|
304
|
|
$
|
358
|
|
||||||||
|
Cross currency derivatives
|
—
|
|
18
|
|
—
|
|
18
|
|
—
|
|
43
|
|
—
|
|
43
|
|
||||||||||||||||
|
Foreign currency derivatives
|
—
|
|
64
|
|
—
|
|
64
|
|
—
|
|
41
|
|
15
|
|
56
|
|
||||||||||||||||
|
Commodity derivatives
|
—
|
|
40
|
|
2
|
|
42
|
|
—
|
|
29
|
|
4
|
|
33
|
|
||||||||||||||||
|
Total derivatives — liabilities
|
—
|
|
243
|
|
181
|
|
424
|
|
—
|
|
167
|
|
323
|
|
490
|
|
||||||||||||||||
|
TOTAL LIABILITIES
|
$
|
—
|
|
$
|
243
|
|
$
|
181
|
|
$
|
424
|
|
$
|
—
|
|
$
|
167
|
|
$
|
323
|
|
$
|
490
|
|
||||||||
As of
December 31, 2016
, all AFS debt securities had stated maturities within one year. For the years ended
December 31, 2016
,
2015
, and
2014
,
no
other-than-temporary impairment of marketable securities were recognized in earnings or Other Comprehensive Income (Loss). Gains and losses on the sale of investments are determined using the specific-identification method. The following table presents gross proceeds from sale of AFS securities for the periods indicated (in millions):
|
Year Ended December 31,
|
2016
|
2015
|
2014
|
|||||||||
|
Gross proceeds from sales of AFS securities
|
$
|
4,335
|
|
$
|
4,177
|
|
$
|
3,829
|
|
|||
The following tables present a reconciliation of net derivative assets and liabilities measured at fair value on a recurring basis using significant unobservable inputs (Level 3) for the years ended
December 31, 2016
and
2015
(presented net by type of derivative in millions). Transfers between Level 3 and Level 2 are determined as of the end of the reporting period and principally result from changes in the significance of unobservable inputs used to calculate the credit valuation adjustment.
|
Year Ended December 31, 2016
|
Interest Rate
|
Foreign Currency
|
Commodity
|
Total
|
|||||||||||
|
Balance at January 1
|
$
|
(304
|
)
|
$
|
277
|
|
$
|
3
|
|
$
|
(24
|
)
|
|||
|
Total realized and unrealized gains (losses):
|
|||||||||||||||
|
Included in earnings
|
—
|
|
31
|
|
2
|
|
33
|
|
|||||||
|
Included in other comprehensive income — derivative activity
|
(36
|
)
|
6
|
|
—
|
|
(30
|
)
|
|||||||
|
Included in other comprehensive income — foreign currency translation activity
|
3
|
|
(52
|
)
|
—
|
|
(49
|
)
|
|||||||
|
Included in regulatory (assets) liabilities
|
—
|
|
—
|
|
11
|
|
11
|
|
|||||||
|
Settlements
|
72
|
|
(22
|
)
|
(11
|
)
|
39
|
|
|||||||
|
Transfers of liabilities into Level 3
|
(32
|
)
|
—
|
|
—
|
|
(32
|
)
|
|||||||
|
Transfers of liabilities out of Level 3
|
118
|
|
15
|
|
—
|
|
133
|
|
|||||||
|
Balance at December 31
|
$
|
(179
|
)
|
$
|
255
|
|
$
|
5
|
|
$
|
81
|
|
|||
|
Total gains for the period included in earnings attributable to the change in unrealized gains (losses) relating to assets and liabilities held at the end of the period
|
$
|
6
|
|
$
|
16
|
|
$
|
2
|
|
$
|
24
|
|
|||
146
THE AES CORPORATION
NOTES TO CONSOLIDATED FINANCIAL STATEMENTS—(Continued)
DECEMBER 31, 2016, 2015, AND 2014
|
Year Ended December 31, 2015
|
Interest Rate
|
Foreign Currency
|
Commodity
|
Total
|
|||||||||||
|
Balance at January 1
|
$
|
(210
|
)
|
$
|
209
|
|
$
|
6
|
|
$
|
5
|
|
|||
|
Total realized and unrealized gains (losses):
|
|||||||||||||||
|
Included in earnings
|
(1
|
)
|
198
|
|
(1
|
)
|
196
|
|
|||||||
|
Included in other comprehensive income — derivative activity
|
(31
|
)
|
—
|
|
—
|
|
(31
|
)
|
|||||||
|
Included in other comprehensive income — foreign currency translation activity
|
9
|
|
(103
|
)
|
—
|
|
(94
|
)
|
|||||||
|
Included in regulatory (assets) liabilities
|
—
|
|
—
|
|
(18
|
)
|
(18
|
)
|
|||||||
|
Settlements
|
24
|
|
(7
|
)
|
16
|
|
33
|
|
|||||||
|
Transfers of liabilities into Level 3
|
(95
|
)
|
(1
|
)
|
—
|
|
(96
|
)
|
|||||||
|
Transfers of assets out of Level 3
|
—
|
|
(19
|
)
|
—
|
|
(19
|
)
|
|||||||
|
Balance at December 31
|
$
|
(304
|
)
|
$
|
277
|
|
$
|
3
|
|
$
|
(24
|
)
|
|||
|
Total gains (losses) for the period included in earnings attributable to the change in unrealized gains (losses) relating to assets and liabilities held at the end of the period
|
$
|
—
|
|
$
|
187
|
|
$
|
(1
|
)
|
$
|
186
|
|
|||
The following table summarizes the significant unobservable inputs used for the Level 3 derivative assets (liabilities) as of
December 31, 2016
(in millions, except range amounts):
|
Type of Derivative
|
Fair Value
|
Unobservable Input
|
Amount or Range
(Weighted Average)
|
|||||
|
Interest rate
|
$
|
(179
|
)
|
Subsidiaries’ credit spreads
|
2.1% - 4.4% (4.3%)
|
|||
|
Foreign currency:
|
||||||||
|
Argentine Peso
|
255
|
|
Argentine Peso to U.S. Dollar currency exchange rate after one year
|
19.9 - 33.4 (26.4)
|
||||
|
Commodity:
|
||||||||
|
Other
|
5
|
|
||||||
|
Total
|
$
|
81
|
|
|||||
Changes in the above significant unobservable inputs that lead to a significant and unusual impact to current-period earnings are disclosed to the Financial Audit Committee. For interest rate derivatives, and foreign currency derivatives, increases (decreases) in the estimates of the Company's own credit spreads would decrease (increase) the value of the derivatives in a liability position. For foreign currency derivatives, increases (decreases) in the estimate of the above exchange rate would increase (decrease) the value of the derivative.
Nonrecurring Measurements
When evaluating impairment of goodwill, long-lived assets, discontinued operations, and equity method investments, the Company measures fair value using the applicable fair value measurement guidance. Impairment expense is measured by comparing the fair value at the evaluation date to their then-latest available carrying amount. The following table summarizes major categories of assets and liabilities measured at fair value on a nonrecurring basis during the period and their level within the fair value hierarchy (in millions):
|
Year Ended December 31, 2016
|
Measurement Date
|
Carrying Amount
(1)
|
Fair Value
|
Pretax
Loss
|
||||||||||||||||||
|
Assets
|
Level 1
|
Level 2
|
Level 3
|
|||||||||||||||||||
|
Long-lived assets held and used:
(2)
|
||||||||||||||||||||||
|
DPL
|
12/31/2016
|
$
|
787
|
|
$
|
—
|
|
$
|
60
|
|
$
|
103
|
|
$
|
624
|
|
||||||
|
Buffalo Gap I
|
08/31/2016
|
113
|
|
—
|
|
—
|
|
36
|
|
77
|
|
|||||||||||
|
DPL
|
06/30/2016
|
324
|
|
—
|
|
—
|
|
89
|
|
235
|
|
|||||||||||
|
Buffalo Gap II
|
03/31/2016
|
251
|
|
—
|
|
—
|
|
92
|
|
159
|
|
|||||||||||
|
Discontinued operations:
(3)
|
||||||||||||||||||||||
|
Sul
|
06/30/2016
|
1,581
|
|
—
|
|
470
|
|
—
|
|
783
|
|
|||||||||||
|
Year Ended December 31, 2015
|
Measurement Date
|
Carrying Amount
(1)
|
Fair Value
|
Pretax
Loss
|
||||||||||||||||||
|
Assets
|
Level 1
|
Level 2
|
Level 3
|
|||||||||||||||||||
|
Long-lived assets held and used:
(2)
|
||||||||||||||||||||||
|
Buffalo Gap III
|
09/30/2015
|
$
|
234
|
|
$
|
—
|
|
$
|
—
|
|
$
|
118
|
|
$
|
116
|
|
||||||
|
Kilroot
|
08/28/2015
|
191
|
|
—
|
|
—
|
|
70
|
|
121
|
|
|||||||||||
|
UK Wind
|
06/30/2015
|
38
|
|
—
|
|
1
|
|
—
|
|
37
|
|
|||||||||||
|
Other
|
Various
|
32
|
|
—
|
|
21
|
|
—
|
|
11
|
|
|||||||||||
|
Equity method investments:
(4)
|
||||||||||||||||||||||
|
Solar Spain
|
02/09/2015
|
29
|
|
—
|
|
—
|
|
29
|
|
—
|
|
|||||||||||
|
Goodwill:
(5)
|
||||||||||||||||||||||
|
DP&L
|
10/01/2015
|
317
|
|
—
|
|
—
|
|
—
|
|
317
|
|
|||||||||||
_____________________________
|
(1)
|
Represents the carrying values at the dates of measurement, before fair value adjustment.
|
|
(2)
|
See Note
20
—
Asset Impairment Expense
for further information.
|
|
(3)
|
Per the Company's policy, pre-tax loss was limited to the impairment of long-lived assets. Upon disposal of AES Sul, we incurred an additional pre-tax loss on sale of
$602 million
. See Note
22
—
Discontinued Operations
for further information.
|
|
(4)
|
See Note
7
—
Investments In and Advances to Affiliates
for further information.
|
|
(5)
|
See Note
9
—
Goodwill and Other Intangible Assets
for further information.
|
147
THE AES CORPORATION
NOTES TO CONSOLIDATED FINANCIAL STATEMENTS—(Continued)
DECEMBER 31, 2016, 2015, AND 2014
The following table summarizes the significant unobservable inputs used in the Level 3 measurement of long-lived assets held and used measured on a nonrecurring basis during the
year ended December 31, 2016
(in millions, except range amounts):
|
December 31, 2016
|
Fair Value
|
Valuation Technique
|
Unobservable Input
|
Range (Weighted Average)
|
||||||
|
Long-lived assets held and used:
|
||||||||||
|
DPL
(1)
|
$
|
103
|
|
Discounted cash flow
|
Annual revenue growth
|
-13% to -1% (-6%)
|
||||
|
Annual pretax operating margin
|
-42% to 3% (-16%)
|
|||||||||
|
Weighted-average cost of capital
|
7% to 10%
|
|||||||||
|
Buffalo Gap I
|
36
|
|
Discounted cash flow
|
Annual revenue growth
|
-20% to 9% (-14%)
|
|||||
|
Annual pretax operating margin
|
-40% to 42% (29%)
|
|||||||||
|
Weighted-average cost of capital
|
9%
|
|||||||||
|
DPL
(1)
|
89
|
|
Discounted cash flow
|
Annual revenue growth
|
-11% to 13% (1%)
|
|||||
|
Annual pretax operating margin
|
-50% to 60% (5%)
|
|||||||||
|
Weighted-average cost of capital
|
7% to 12%
|
|||||||||
|
Buffalo Gap II
|
92
|
|
Discounted cash flow
|
Annual revenue growth
|
-17% to 21% (20%)
|
|||||
|
Annual pretax operating margin
|
-166% to 48% (18%)
|
|||||||||
|
Weighted-average cost of capital
|
9%
|
|||||||||
|
Total
|
$
|
320
|
|
|||||||
_____________________________
|
(1)
|
See Note
20
—
Asset Impairment Expense
for further discussion of each DPL impairment.
|
Financial Instruments not Measured at Fair Value in the Consolidated Balance Sheets
The following table presents (in millions) the carrying amount, fair value and fair value hierarchy of the Company's financial assets and liabilities that are not measured at fair value in the Consolidated Balance Sheets as of the periods indicated, but for which fair value is disclosed.
|
December 31, 2016
|
|||||||||||||||||||||
|
Carrying
Amount
|
Fair Value
|
||||||||||||||||||||
|
Total
|
Level 1
|
Level 2
|
Level 3
|
||||||||||||||||||
|
Assets:
|
Accounts receivable — noncurrent
(1)
|
$
|
264
|
|
$
|
350
|
|
$
|
—
|
|
$
|
20
|
|
$
|
330
|
|
|||||
|
Liabilities:
|
Non-recourse debt
|
15,792
|
|
16,188
|
|
—
|
|
15,120
|
|
1,068
|
|
||||||||||
|
Recourse debt
|
4,671
|
|
4,899
|
|
—
|
|
4,899
|
|
—
|
|
|||||||||||
|
December 31, 2015
|
|||||||||||||||||||||
|
Carrying
Amount
|
Fair Value
|
||||||||||||||||||||
|
Total
|
Level 1
|
Level 2
|
Level 3
|
||||||||||||||||||
|
Assets:
|
Accounts receivable — noncurrent
(1)
|
$
|
238
|
|
$
|
310
|
|
$
|
—
|
|
$
|
20
|
|
$
|
290
|
|
|||||
|
Liabilities:
|
Non-recourse debt
|
15,115
|
|
15,592
|
|
—
|
|
13,325
|
|
2,267
|
|
||||||||||
|
Recourse debt
|
4,966
|
|
4,696
|
|
—
|
|
4,696
|
|
—
|
|
|||||||||||
_____________________________
|
(1)
|
These accounts receivable principally relate to amounts due from CAMMESA, the administrator of the wholesale electricity market in Argentina, and are included in
Other noncurrent assets
in the accompanying Consolidated Balance Sheets. The fair value and carrying amount of these receivables exclude VAT of
$24 million
and
$27 million
as of
December 31, 2016
and
2015
, respectively.
|
5
. DERIVATIVE INSTRUMENTS AND HEDGING ACTIVITIES
Volume of Activity
— The following table presents the Company's significant outstanding notional (in millions) by type of derivative as of
December 31, 2016
, regardless of whether they are in qualifying cash flow hedging relationships, and the dates through which the maturities for each type of derivative range:
|
Derivatives
|
Current Notional Translated to USD
|
Latest Maturity
|
||||
|
Interest Rate (LIBOR and EURIBOR)
|
$
|
3,581
|
|
2034
|
||
|
Cross Currency Swaps (Chilean Unidad de Fomento and Chilean Peso)
|
374
|
|
2029
|
|||
|
Foreign Currency:
|
||||||
|
Argentine Peso
|
171
|
|
2026
|
|||
|
Chilean Unidad de Fomento
|
151
|
|
2019
|
|||
|
Euro
|
226
|
|
2019
|
|||
|
Others, primarily with weighted average remaining maturities of a year or less
|
749
|
|
2018
|
|||
148
THE AES CORPORATION
NOTES TO CONSOLIDATED FINANCIAL STATEMENTS—(Continued)
DECEMBER 31, 2016, 2015, AND 2014
Accounting and Reporting
—
Assets and Liabilities
— The following tables present the fair value of assets and liabilities related to the Company's derivative instruments as of the periods indicated (in millions):
|
Fair Value
|
December 31, 2016
|
December 31, 2015
|
||||||||||||||||||||||
|
Assets
|
Designated
|
Not Designated
|
Total
|
Designated
|
Not Designated
|
Total
|
||||||||||||||||||
|
Interest rate derivatives
|
$
|
18
|
|
$
|
—
|
|
$
|
18
|
|
$
|
—
|
|
$
|
—
|
|
$
|
—
|
|
||||||
|
Cross currency derivatives
|
4
|
|
—
|
|
4
|
|
—
|
|
—
|
|
—
|
|
||||||||||||
|
Foreign currency derivatives
|
9
|
|
300
|
|
309
|
|
8
|
|
319
|
|
327
|
|
||||||||||||
|
Commodity derivatives
|
20
|
|
25
|
|
45
|
|
30
|
|
18
|
|
48
|
|
||||||||||||
|
Total assets
|
$
|
51
|
|
$
|
325
|
|
$
|
376
|
|
$
|
38
|
|
$
|
337
|
|
$
|
375
|
|
||||||
|
Liabilities
|
||||||||||||||||||||||||
|
Interest rate derivatives
|
$
|
295
|
|
$
|
5
|
|
$
|
300
|
|
$
|
358
|
|
$
|
—
|
|
$
|
358
|
|
||||||
|
Cross currency derivatives
|
18
|
|
—
|
|
18
|
|
43
|
|
—
|
|
43
|
|
||||||||||||
|
Foreign currency derivatives
|
19
|
|
45
|
|
64
|
|
35
|
|
21
|
|
56
|
|
||||||||||||
|
Commodity derivatives
|
26
|
|
16
|
|
42
|
|
12
|
|
21
|
|
33
|
|
||||||||||||
|
Total liabilities
|
$
|
358
|
|
$
|
66
|
|
$
|
424
|
|
$
|
448
|
|
$
|
42
|
|
$
|
490
|
|
||||||
|
December 31, 2016
|
December 31, 2015
|
|||||||||||||||
|
Fair Value
|
Assets
|
Liabilities
|
Assets
|
Liabilities
|
||||||||||||
|
Current
|
$
|
99
|
|
$
|
155
|
|
$
|
86
|
|
$
|
144
|
|
||||
|
Noncurrent
|
277
|
|
269
|
|
289
|
|
346
|
|
||||||||
|
Total
|
$
|
376
|
|
$
|
424
|
|
$
|
375
|
|
$
|
490
|
|
||||
|
Credit Risk-Related Contingent Features
(1)
|
December 31, 2016
|
December 31, 2015
|
||||||||||||||
|
Present value of liabilities subject to collateralization
|
$
|
41
|
|
$
|
58
|
|
||||||||||
|
Cash collateral held by third parties or in escrow
|
18
|
|
38
|
|
||||||||||||
_____________________________
|
(1)
|
Based on the credit rating of certain subsidiaries
|
Earnings and other Comprehensive (Loss) Income
— The following table presents (in millions) the pretax gains (losses) recognized in AOCL and earnings related to all derivative instruments for the periods indicated:
|
Cash flow hedges
|
Years Ended December 31,
|
|||||||||||
|
2016
|
2015
|
2014
|
||||||||||
|
Effective portion gain (losses) recognized in AOCL
|
||||||||||||
|
Interest rate derivatives
|
$
|
(35
|
)
|
$
|
(103
|
)
|
$
|
(421
|
)
|
|||
|
Cross-currency derivatives
|
21
|
|
(20
|
)
|
(25
|
)
|
||||||
|
Foreign currency derivatives
|
(4
|
)
|
10
|
|
(28
|
)
|
||||||
|
Commodity derivatives
|
30
|
|
40
|
|
44
|
|
||||||
|
Total
|
$
|
12
|
|
$
|
(73
|
)
|
$
|
(430
|
)
|
|||
|
Effective portion gain (losses) reclassified from AOCL into earnings
|
||||||||||||
|
Interest rate derivatives
|
$
|
(101
|
)
|
$
|
(116
|
)
|
$
|
(144
|
)
|
|||
|
Cross-currency derivatives
|
8
|
|
(24
|
)
|
(23
|
)
|
||||||
|
Foreign currency deriviatives
|
(8
|
)
|
32
|
|
14
|
|
||||||
|
Commodity derivatives
|
56
|
|
31
|
|
28
|
|
||||||
|
Total
|
$
|
(45
|
)
|
$
|
(77
|
)
|
$
|
(125
|
)
|
|||
|
Gain (losses) recognized in earnings related to
|
||||||||||||
|
Ineffective portion of cash flow hedges
|
$
|
(1
|
)
|
$
|
(6
|
)
|
$
|
(4
|
)
|
|||
|
Not designated as hedging instruments:
|
||||||||||||
|
Foreign currency derivatives
|
19
|
|
211
|
|
144
|
|
||||||
|
Commodity derivatives and Other
|
(16
|
)
|
(29
|
)
|
58
|
|
||||||
|
Total
|
$
|
2
|
|
$
|
176
|
|
$
|
198
|
|
|||
The AOCL expected to decrease pretax income from continuing operations, primarily due to interest rate derivatives, for the twelve months ended December 31, 2017 is
$90 million
.
6
. FINANCING RECEIVABLES
The Company's financing receivables are defined as receivables with contractual maturities of greater than one year. They are primarily related to amended agreements or government resolutions that are due from CAMMESA. The following table presents financing receivables by country as of the dates indicated (in millions):
|
December 31,
|
2016
|
2015
|
||||||
|
Argentina
|
$
|
236
|
|
$
|
237
|
|
||
|
United States
|
20
|
|
20
|
|
||||
|
Brazil
|
8
|
|
7
|
|
||||
|
Total long-term financing receivables
|
$
|
264
|
|
$
|
264
|
|
||
149
THE AES CORPORATION
NOTES TO CONSOLIDATED FINANCIAL STATEMENTS—(Continued)
DECEMBER 31, 2016, 2015, AND 2014
Argentina —
Collection of the principal and interest on these receivables is subject to various business risks and uncertainties including, but not limited to, the operation of power plants which generate cash for payments of these receivables, regulatory changes that could impact the timing and amount of collections, and economic conditions in Argentina. The Company monitors these risks, including the credit ratings of the Argentine government, on a quarterly basis to assess the collectability of these receivables. The Company accrues interest on these receivables once the recognition criteria have been met. The Company's collection estimates are based on assumptions that it believes to be reasonable, but are inherently uncertain. Actual future cash flows could differ from these estimates.
FONINVEMEM Agreements
As a result of energy market reforms in 2004 and 2010, AES Argentina entered into
three
agreements with the Argentine government, referred to as the FONINVEMEM Agreements, to contribute a portion of their accounts receivable into a fund for financing the construction of combined cycle and gas-fired plants. These receivables accrue interest and are collected in monthly installments over
10 years
once the related plant begins operations. In addition, AES Argentina receives an ownership interest in these newly built plants once the receivables have been fully repaid.
FONINVEMEM I and II
—
The receivables under the first
two
FONINVEMEM Agreements have been actively collected since the related plants commenced operations in 2010. In assessing the collectability of the receivables under these agreements, the Company also considers how timely the collections have historically been made in accordance with the agreements.
FONINVEMEM III —
The receivables related to the third FONINVEMEM Agreement have been actively collected since the related plants commenced operations in 2016. In assessing the collectability of the receivables under this agreement, the Company also considers how timely the collections have historically been made in accordance with the agreements.
The FONINVEMEM receivables are denominated in Argentine pesos, but indexed to U.S. dollars, which represents a foreign currency derivative. As of
December 31, 2016
and
2015
, the amount of the foreign currency-related derivative assets associated with the FONINVEMEM financing receivables that were excluded from the table above had a fair value of
$255 million
and
$292 million
, respectively.
Other Agreements
In 2013, Resolution No. 95/2013 ("Resolution 95") which developed a new energy regulatory framework that applies to all generation companies with certain exceptions became effective. The new regulatory framework reimburses fixed and variable costs plus a margin that will depend on the technology and fuel used to generate the electricity and the installed capacity of each plant.
In the fourth quarter of 2014, the Argentine government passed a resolution to contribute outstanding Resolution 95 receivables into a trust whereby AES Argentina has committed to install additional capacity into the system. CAMMESA will finance the investment utilizing the outstanding receivables as a guarantee.
On July 10, 2015, the Argentine government passed Resolution No. 482/2015 ("Resolution 482") which updated the prices of Resolution 529/2014 retroactively to February 1, 2015, and created a new trust called FONINVEMEM 2015-2018 in order to invest in new generation plants. AES Argentina and certain Termoandes units will receive compensation under this program.
150
THE AES CORPORATION
NOTES TO CONSOLIDATED FINANCIAL STATEMENTS—(Continued)
DECEMBER 31, 2016, 2015, AND 2014
7
. INVESTMENTS IN AND ADVANCES TO AFFILIATES
The following table summarizes the relevant effective equity ownership interest and carrying values for the Company's investments accounted for under the equity method as of the periods indicated:
|
December 31,
|
2016
|
2015
|
2016
|
2015
|
|||||||||||
|
Affiliate
|
Country
|
Carrying Value (in millions)
|
Ownership Interest %
|
||||||||||||
|
Barry
(1)
|
United Kingdom
|
—
|
|
—
|
|
100
|
%
|
100
|
%
|
||||||
|
Elsta
(1)
|
Netherlands
|
41
|
|
53
|
|
50
|
%
|
50
|
%
|
||||||
|
Distributed Energy
(1)
|
United States
|
22
|
|
17
|
|
95
|
%
|
94
|
%
|
||||||
|
Guacolda
(2)
|
Chile
|
362
|
|
344
|
|
33
|
%
|
33
|
%
|
||||||
|
OPGC
(3)
|
India
|
195
|
|
195
|
|
49
|
%
|
49
|
%
|
||||||
|
Other affiliates
|
Various
|
1
|
|
1
|
|
||||||||||
|
Total investments in and advances to affiliates
|
$
|
621
|
|
$
|
610
|
|
|||||||||
_____________________________
|
(1)
|
Represent VIEs in which the Company holds a variable interest but is not the primary beneficiary.
|
|
(2)
|
The Company's ownership in Guacolda is held through AES Gener, a
67%
-owned consolidated subsidiary. AES Gener owns
50%
of Guacolda, resulting in an AES effective ownership in Guacolda of
33%
.
|
|
(3)
|
OPGC has one coal-fired project under development which is an expansion of our existing OPGC business. The project started construction in April 2014 and is expected to begin operations in 2018.
|
Guacolda
— On September 1, 2015, AES Gener and Global Infrastructure Partners ("GIP") executed a restructuring of Guacolda that increased Guacolda's tax basis in certain long-term assets and AES Gener's equity investment. As a result, AES Gener recorded
$66 million
in net equity in earnings of affiliates for the year ended December 31, 2015, of which
$46 million
is attributable to The AES Corporation.
On April 11, 2014, AES Gener undertook a series of transactions, pursuant to which AES Gener acquired the interests that it did not previously own in Guacolda for
$728 million
and simultaneously sold the ownership interest to GIP for
$730 million
. The transaction provided GIP with substantive participating rights in Guacolda and, as a result, the Company continues to account for its investment in Guacolda using the equity method of accounting. At no time during this transaction did the Company acquire a non-controlling interest. The cash paid for the acquisition is reflected in
Acquisitions, net of cash acquired
and the cash proceeds from the sale of these ownership interests to GIP is reflected in
Proceeds from the sale of businesses, net of cash sold, and equity method investments
on the Consolidated Statement of Cash Flows for the period ended December 31, 2014.
Silver Ridge Power
— On July 2, 2014, the Company closed the sale of its
50%
ownership interest in Silver Ridge Power, LLC ("SRP") for a purchase price of
$179 million
, excluding the Company's indirect ownership interests in SRP's solar generation businesses in Italy and Spain ("Solar Italy" and "Solar Spain," respectively). As part of the sale, the buyer had an option to purchase Solar Italy for additional consideration of
$42 million
by August 2015. The buyer exercised its option to purchase Solar Italy on August 31, 2015, and the sale was completed on October 1, 2015.
On September 24, 2015, the Company completed the sale of Solar Spain. Net proceeds from the sale transaction were
$31 million
and the Company recognized a pretax gain on sale of less than
$1 million
. Upon the completion of the Solar Spain and Solar Italy sale transactions noted above, the Company ceased its involvement in SRP's business operations and accounted for these transactions as sales of real estate.
AES Barry Ltd.
— The Company holds a
100%
ownership interest in AES Barry Ltd. ("Barry"), a dormant entity in the U.K. that disposed of its generation and other operating assets. Due to a debt agreement, no material financial or operating decisions can be made without the banks' consent, and the Company does not control Barry. As of December 31,
2016
and
2015
, other long-term liabilities included
$41 million
and
$49 million
related to this debt agreement.
Elsta
— In 2014, long lived assets within Elsta were determined to not be recoverable and an impairment charge of approximately
$82 million
was recognized. The Company recognized its
50%
share, or
$41 million
, through its proportion of the equity earnings in Elsta.
151
THE AES CORPORATION
NOTES TO CONSOLIDATED FINANCIAL STATEMENTS—(Continued)
DECEMBER 31, 2016, 2015, AND 2014
Summarized Financial Information
— The following tables summarize financial information of the Company's 50%-or-less-owned affiliates and majority-owned unconsolidated subsidiaries that are accounted for using the equity method in millions:
|
|
50%-or-less Owned Affiliates
|
Majority-Owned Unconsolidated Subsidiaries
|
|||||||||||||||||||||
|
Years ended December 31,
|
2016
|
2015
|
2014
|
2016
|
2015
|
2014
|
|||||||||||||||||
|
Revenue
|
$
|
586
|
|
$
|
641
|
|
$
|
928
|
|
$
|
23
|
|
$
|
24
|
|
$
|
2
|
|
|||||
|
Operating margin
|
145
|
|
152
|
|
206
|
|
9
|
|
11
|
|
—
|
|
|||||||||||
|
Net income
|
64
|
|
210
|
|
59
|
|
(2
|
)
|
6
|
|
—
|
|
|||||||||||
|
December 31,
|
2016
|
2015
|
|
2016
|
2015
|
|
|||||||||||||||||
|
Current assets
|
$
|
308
|
|
$
|
376
|
|
$
|
16
|
|
$
|
20
|
|
|||||||||||
|
Noncurrent assets
|
2,577
|
|
2,132
|
|
181
|
|
211
|
|
|||||||||||||||
|
Current liabilities
|
626
|
|
435
|
|
10
|
|
21
|
|
|||||||||||||||
|
Noncurrent liabilities
|
1,209
|
|
1,044
|
|
122
|
|
153
|
|
|||||||||||||||
|
Stockholders' equity
|
1,048
|
|
1,029
|
|
65
|
|
57
|
|
|||||||||||||||
At December 31,
2016
, retained earnings included
$246 million
related to the undistributed earnings of the Company's 50%-or-less owned affiliates. Distributions received from these affiliates were
$24 million
,
$18 million
, and
$28 million
for the years ended December 31,
2016
,
2015
, and
2014
, respectively. As of December 31,
2016
, the aggregate carrying amount of our investments in equity affiliates exceeded the underlying equity in their net assets by
$162 million
.
8
. OTHER NON-OPERATING EXPENSE
There were
no
significant non-operating expenses for the years ended December 31,
2016
or
2015
.
Entek
— During 2014, the Company executed an agreement to sell its
49.62%
interest in Entek, an investment accounted for under the equity method, for
$125 million
. Entek consists of natural gas and hydroelectric generation facilities, plus a coal-fired development project. The Company determined that there was an other-than-temporary decline in the fair value of its equity method investment in Entek and recognized pretax impairment expense of
$86 million
. The sale of the Company's interest in Entek closed on December 18, 2014.
Silver Ridge
— During 2014, the Company determined that there was a decline in the fair value of its equity method investment in Silver Ridge Power, LLC ("SRP") that was other-than-temporary based on indications about the fair value of the projects in Italy and Spain that resulted from actual and proposed changes to tariffs. Accordingly, the Company recognized pretax impairment expense of
$42 million
. The transaction related to our
50%
ownership interest in SRP closed on July 2, 2014 for
$179 million
. See Note
7
—
Investments in and Advances to Affiliates
of this Form 10-K for further information.
9
. GOODWILL AND OTHER INTANGIBLE ASSETS
Goodwill
— The following table summarizes the changes in the carrying amount of goodwill, by reportable segment for the years ended
December 31, 2016
and
2015
in millions:
|
US
|
Andes
|
MCAC
|
Europe
|
Asia
|
Total
|
||||||||||||||||||
|
Balance as of December 31, 2014
|
|||||||||||||||||||||||
|
Goodwill
|
$
|
2,658
|
|
$
|
899
|
|
$
|
149
|
|
$
|
122
|
|
|
$
|
68
|
|
$
|
3,896
|
|
||||
|
Accumulated impairment losses
|
(2,316
|
)
|
—
|
|
—
|
|
(122
|
)
|
—
|
|
(2,438
|
)
|
|||||||||||
|
Net balance
|
342
|
|
899
|
|
149
|
|
—
|
|
68
|
|
1,458
|
|
|||||||||||
|
Impairment losses
|
(317
|
)
|
—
|
|
—
|
|
—
|
|
—
|
|
(317
|
)
|
|||||||||||
|
Goodwill acquired during the year
|
16
|
|
—
|
|
—
|
|
—
|
|
—
|
|
16
|
|
|||||||||||
|
Balance as of December 31, 2015
|
|||||||||||||||||||||||
|
Goodwill
|
2,674
|
|
899
|
|
149
|
|
122
|
|
68
|
|
3,912
|
|
|||||||||||
|
Accumulated impairment losses
|
(2,633
|
)
|
—
|
|
—
|
|
(122
|
)
|
—
|
|
(2,755
|
)
|
|||||||||||
|
Net balance
|
41
|
|
899
|
|
149
|
|
—
|
|
68
|
|
1,157
|
|
|||||||||||
|
Balance as of December 31, 2016
|
|||||||||||||||||||||||
|
Goodwill
|
2,674
|
|
899
|
|
149
|
|
122
|
|
68
|
|
3,912
|
|
|||||||||||
|
Accumulated impairment losses
|
(2,633
|
)
|
—
|
|
—
|
|
(122
|
)
|
—
|
|
(2,755
|
)
|
|||||||||||
|
Net balance
|
$
|
41
|
|
$
|
899
|
|
$
|
149
|
|
$
|
—
|
|
$
|
68
|
|
$
|
1,157
|
|
|||||
DP&L —
During the fourth quarter of 2015, the Company performed the annual goodwill impairment test at its DP&L reporting unit and recognized a goodwill impairment expense of
$317 million
. The reporting unit failed Step 1 as its fair value was less than its carrying amount, which was primarily due to a decrease in forecasted dark spreads that were driven by decreases in projected forward power prices, and lower than expected revenues from a
152
THE AES CORPORATION
NOTES TO CONSOLIDATED FINANCIAL STATEMENTS—(Continued)
DECEMBER 31, 2016, 2015, AND 2014
new CP product. The fair value of the reporting unit was determined under the income approach using a discounted cash flow valuation model. The significant assumptions included within the discounted cash flow valuation model were forward commodity price curves, the amount of non-bypassable charges from the pending ESP, expected revenues from the new CP product, and planned environmental expenditures. In Step 2, goodwill was determined to have an implied negative fair value after the hypothetical purchase price allocation under the accounting guidance for business combinations; therefore, a full impairment of the remaining goodwill balance of
$317 million
was recognized. DP&L is reported in the US SBU reportable segment.
Distributed Energy
— During the first quarter of 2015, the Company completed the acquisition of
100%
of the common stock of Main Street Power Company, Inc (subsequently renamed Distributed Energy). The transaction included recognition of
$16 million
of goodwill and is reported in the US SBU reportable segment. See Note
24
—
Acquisitions
for additional information.
Other Intangible Assets
— The following table summarizes the balances comprising
Other intangible assets
in the accompanying Consolidated Balance Sheets (in millions) as of the periods indicated:
|
December 31, 2016
|
December 31, 2015
|
||||||||||||||||||||||
|
Gross Balance
|
Accumulated Amortization
|
Net Balance
|
Gross Balance
|
Accumulated Amortization
|
Net Balance
|
||||||||||||||||||
|
Subject to Amortization
|
|
|
|||||||||||||||||||||
|
Internal-use software
|
$
|
567
|
|
$
|
(424
|
)
|
$
|
143
|
|
$
|
521
|
|
$
|
(388
|
)
|
$
|
133
|
|
|||||
|
Sales concessions
|
63
|
|
(22
|
)
|
41
|
|
63
|
|
(15
|
)
|
48
|
|
|||||||||||
|
Contractual payment rights
(1)
|
56
|
|
(42
|
)
|
14
|
|
66
|
|
(46
|
)
|
20
|
|
|||||||||||
|
Management rights
|
28
|
|
(13
|
)
|
15
|
|
24
|
|
(10
|
)
|
14
|
|
|||||||||||
|
Land use rights
|
25
|
|
(1
|
)
|
24
|
|
25
|
|
—
|
|
25
|
|
|||||||||||
|
Contracts
|
53
|
|
(15
|
)
|
38
|
|
29
|
|
(12
|
)
|
17
|
|
|||||||||||
|
Other
(2)
|
12
|
|
(2
|
)
|
10
|
|
25
|
|
(10
|
)
|
15
|
|
|||||||||||
|
Subtotal
|
804
|
|
(519
|
)
|
285
|
|
753
|
|
(481
|
)
|
272
|
|
|||||||||||
|
Indefinite-Lived Intangible Assets
|
|||||||||||||||||||||||
|
Land use rights
|
47
|
|
—
|
|
47
|
|
38
|
|
—
|
|
38
|
|
|||||||||||
|
Water rights
|
17
|
|
—
|
|
17
|
|
17
|
|
—
|
|
17
|
|
|||||||||||
|
Other
|
10
|
|
—
|
|
10
|
|
13
|
|
—
|
|
13
|
|
|||||||||||
|
Subtotal
|
74
|
|
—
|
|
74
|
|
68
|
|
—
|
|
68
|
|
|||||||||||
|
Total
|
$
|
878
|
|
$
|
(519
|
)
|
$
|
359
|
|
$
|
821
|
|
$
|
(481
|
)
|
$
|
340
|
|
|||||
_____________________________
|
(1)
|
Represent legal rights to receive system reliability payments from the regulator.
|
|
(2)
|
Includes renewable energy credits, organization costs, project development rights, and other individually insignificant intangible assets.
|
The following tables summarize other intangible assets acquired during the periods indicated (in millions):
|
December 31, 2016
|
Amount
|
Subject to Amortization/Indefinite-Lived
|
Weighted Average Amortization Period (in years)
|
Amortization Method
|
|||||
|
Internal-use software
|
$
|
51
|
|
Subject to Amortization
|
4
|
Straight-line
|
|||
|
Contracts
|
24
|
|
Subject to Amortization
|
26
|
Straight-line
|
||||
|
Other
|
5
|
|
Subject to Amortization
|
13
|
Straight-line
|
||||
|
Total
|
$
|
80
|
|
||||||
|
December 31, 2015
|
Amount
|
Subject to Amortization/
Indefinite-Lived
|
Weighted Average
Amortization Period (in years)
|
Amortization
Method
|
|||||
|
Internal-use software
|
$
|
29
|
|
Subject to Amortization
|
5
|
Straight-line
|
|||
|
Contracts
|
22
|
|
Subject to Amortization
|
5
|
Straight-line
|
||||
|
Land-use rights
(1)
|
13
|
|
Subject to Amortization
|
N/A
|
N/A
|
||||
|
Other
|
5
|
|
Various
|
N/A
|
N/A
|
||||
|
Total
|
$
|
69
|
|
||||||
_____________________________
|
(1)
|
The carrying value of these definite-lived intangible assets equals their salvage value
|
The following table summarizes the estimated amortization expense by intangible asset category for
2017
through
2021
:
|
(in millions)
|
2017
|
2018
|
2019
|
2020
|
2021
|
||||||||||||||
|
Internal-use software
|
38
|
|
34
|
|
21
|
|
14
|
|
10
|
|
|||||||||
|
Sales concessions
|
6
|
|
6
|
|
6
|
|
4
|
|
2
|
|
|||||||||
|
All other
|
6
|
|
5
|
|
5
|
|
5
|
|
5
|
|
|||||||||
|
Total
|
$
|
50
|
|
$
|
45
|
|
$
|
32
|
|
$
|
23
|
|
$
|
17
|
|
||||
153
THE AES CORPORATION
NOTES TO CONSOLIDATED FINANCIAL STATEMENTS—(Continued)
DECEMBER 31, 2016, 2015, AND 2014
Intangible asset amortization expense was
$46 million
,
$52 million
and
$57 million
for the years ended
December 31, 2016
,
2015
and
2014
, respectively.
10
. REGULATORY ASSETS AND LIABILITIES
The Company has recorded regulatory assets and liabilities (in millions) that it expects to pass through to its customers in accordance with, and subject to, regulatory provisions as follows:
|
December 31,
|
2016
|
2015
|
Recovery/Refund Period
|
||||||
|
REGULATORY ASSETS
|
|||||||||
|
Current regulatory assets:
|
|||||||||
|
Brazil tariff recoveries:
(1)
|
|||||||||
|
Energy purchases/sales
|
$
|
319
|
|
$
|
349
|
|
Annually as part of the tariff adjustment
|
||
|
Transmission costs, regulatory fees and other
|
139
|
|
212
|
|
Annually as part of the tariff adjustment
|
||||
|
El Salvador tariff recoveries
(1)
|
54
|
|
43
|
|
Quarterly as part of the tariff adjustment
|
||||
|
Other
|
34
|
|
23
|
|
Various
|
||||
|
Total current regulatory assets
|
546
|
|
627
|
|
|||||
|
Noncurrent regulatory assets:
|
|||||||||
|
IPL and DPL defined benefit pension obligations
|
316
|
|
227
|
|
Various
|
||||
|
DPL and IPL income taxes recoverable from customers
|
87
|
|
36
|
|
Various
|
||||
|
Brazil tariff recoveries:
(1)
|
|||||||||
|
Energy purchases/sales
|
63
|
|
132
|
|
Annually as part of the tariff adjustment
|
||||
|
Transmission costs, regulatory fees and other
|
18
|
|
124
|
|
Annually as part of the tariff adjustment
|
||||
|
IPL deferred Midwest ISO costs
(1)
|
114
|
|
129
|
|
10 years
|
||||
|
Other
|
143
|
|
239
|
|
Various
|
||||
|
Total noncurrent regulatory assets
|
741
|
|
887
|
|
|||||
|
TOTAL REGULATORY ASSETS
|
$
|
1,287
|
|
$
|
1,514
|
|
|||
|
REGULATORY LIABILITIES
|
|||||||||
|
Current regulatory liabilities:
|
|||||||||
|
Brazil efficiency program costs
|
$
|
36
|
|
$
|
9
|
|
Annually as part of the tariff adjustment
|
||
|
Brazil tariff refunds:
|
|||||||||
|
Energy purchases/sales
|
211
|
|
105
|
|
Annually as part of the tariff adjustment
|
||||
|
Transmission costs, regulatory fees and other
|
249
|
|
235
|
|
Annually as part of the tariff adjustment
|
||||
|
Other
|
42
|
|
59
|
|
Various
|
||||
|
Total current regulatory liabilities
|
538
|
|
408
|
|
|||||
|
Noncurrent regulatory liabilities:
|
|||||||||
|
IPL and DPL asset retirement obligations
|
795
|
|
759
|
|
Over life of assets
|
||||
|
Brazil special obligations
|
362
|
|
313
|
|
To be determined
|
||||
|
Brazil efficiency program costs
|
24
|
|
14
|
|
Annually as part of the tariff adjustment
|
||||
|
Brazil tariff refunds:
|
|||||||||
|
Energy purchases/sales
|
7
|
|
30
|
|
Annually as part of the tariff adjustment
|
||||
|
Transmission costs, regulatory fees and other
|
170
|
|
86
|
|
Annually as part of the tariff adjustment
|
||||
|
Other
|
5
|
|
7
|
|
Various
|
||||
|
Total noncurrent regulatory liabilities
|
1,363
|
|
1,209
|
|
|||||
|
TOTAL REGULATORY LIABILITIES
|
$
|
1,901
|
|
$
|
1,617
|
|
|||
_____________________________
|
(1)
|
Past expenditures on which the Company does not earn a rate of return
.
|
Our regulatory assets primarily consist of costs that are generally non-controllable, such as purchased electricity, energy transmission, the difference between actual fuel costs and the fuel costs recovered in the tariffs, and other sector costs. These costs are recoverable or refundable as defined by the laws and regulations in our various markets. Our regulatory assets also include defined pension and postretirement benefit obligations equal to the previously unrecognized actuarial gains and losses and prior services costs that are expected to be recovered through future rates. Other current and noncurrent regulatory assets primarily consist of:
|
•
|
Unamortized carrying charges, certain environmental costs, and demand charges at IPL and DPL.
|
|
•
|
Unamortized premiums reacquired or redeemed on long term debt at IPL and DPL, which are amortized over the lives of the original issuances.
|
|
•
|
Unrecovered fuel and purchased power costs at IPL and DPL.
|
Other current regulatory assets that did not earn a rate of return were
$34 million
and
$8 million
, as of
December 31, 2016
and
2015
, respectively. Other noncurrent regulatory assets that did not earn a rate of return were
$138 million
and
$237 million
, as of
December 31, 2016
and
2015
, respectively.
Our regulatory liabilities primarily consist of obligations for removal costs which do not have an associated
154
THE AES CORPORATION
NOTES TO CONSOLIDATED FINANCIAL STATEMENTS—(Continued)
DECEMBER 31, 2016, 2015, AND 2014
legal retirement obligation, as well as obligations established by ANEEL in Brazil associated with electric utility concessions and represent amounts received from customers or donations not subject to return. These donations are allocated to support energy network expansion and to improve utility operations to meet customers' needs. The term of the obligation is established by ANEEL and settlement will occur when the electric utility concessions end.
Other current and noncurrent regulatory liabilities primarily consist of amounts related to rider over collection at DPL and liabilities owed to electricity generators due to variance in energy prices during rationing periods known as "Free Energy" at Eletropaulo. Our Brazilian subsidiaries are authorized to refund this cost associated with monthly energy price variances between the wholesale energy market prices owed to the power generation plants producing Free Energy and the capped price reimbursed by the local distribution companies which are passed through to the final customers through energy tariffs.
In the accompanying Consolidated Balance Sheets the current regulatory assets and liabilities are recorded in
Other current assets
and
Accrued and other liabilities
, respectively, and the noncurrent regulatory assets and liabilities are recorded in
Other noncurrent assets
and
Other noncurrent liabilities
, respectively. The following table summarizes regulatory assets and liabilities by reportable segment in millions as of the periods indicated:
|
December 31, 2016
|
December 31, 2015
|
||||||||||||||
|
Regulatory Assets
|
Regulatory Liabilities
|
Regulatory Assets
|
Regulatory Liabilities
|
||||||||||||
|
Brazil SBU
|
$
|
544
|
|
$
|
1,059
|
|
$
|
821
|
|
$
|
798
|
|
|||
|
US SBU
|
689
|
|
842
|
|
650
|
|
819
|
|
|||||||
|
MCAC SBU
|
54
|
|
—
|
|
43
|
|
—
|
|
|||||||
|
Total
|
$
|
1,287
|
|
$
|
1,901
|
|
$
|
1,514
|
|
$
|
1,617
|
|
|||
11
. DEBT
NON-RECOURSE DEBT
— The following table summarizes the carrying amount and terms of non-recourse debt at our subsidiaries as of the periods indicated (in millions):
|
NON-RECOURSE DEBT
|
Weighted Average Interest Rate
|
Maturity
|
December 31,
|
||||||||
|
2016
|
2015
|
||||||||||
|
Variable Rate:
(1)
|
|||||||||||
|
Bank loans
|
4.61%
|
2017 – 2035
|
$
|
2,807
|
|
$
|
2,275
|
|
|||
|
Notes and bonds
|
13.65%
|
2017 – 2023
|
1,204
|
|
1,169
|
|
|||||
|
Debt to (or guaranteed by) multilateral, export credit agencies or development banks
(2)
|
2.99%
|
2021 – 2034
|
3,189
|
|
3,089
|
|
|||||
|
Other
|
14.19%
|
2018 – 2043
|
56
|
|
39
|
|
|||||
|
Fixed Rate:
|
|||||||||||
|
Bank loans
|
5.43%
|
2017 – 2032
|
791
|
|
557
|
|
|||||
|
Notes and bonds
|
5.69%
|
2017 – 2073
|
7,822
|
|
7,987
|
|
|||||
|
Debt to (or guaranteed by) multilateral, export credit agencies or development banks
(2)
|
5.85%
|
2023 – 2034
|
328
|
|
309
|
|
|||||
|
Other
|
5.77%
|
2018 – 2061
|
36
|
|
13
|
|
|||||
|
Unamortized (discount)/premium & debt issuance (costs), net
|
(441
|
)
|
(323
|
)
|
|||||||
|
Subtotal
|
15,792
|
|
15,115
|
|
|||||||
|
Less: Current maturities
|
(1,303
|
)
|
(2,172
|
)
|
|||||||
|
Noncurrent maturities
|
$
|
14,489
|
|
$
|
12,943
|
|
|||||
_____________________________
|
(1)
|
The interest rate on variable rate debt represents the total of a variable component that is based on changes in an interest rate index and of a fixed component. The Company has interest rate swaps and option agreements in an aggregate notional principal amount of approximately
$3.6 billion
on non-recourse debt outstanding at December 31,
2016
. These agreements economically fix the variable component of the interest rates on the portion of the variable-rate debt being hedged so that the total interest rate on that debt has been fixed at rates ranging from approximately
1.99%
to
8.25%
. The debt agreements expire at various dates from
2017
through
2073
.
|
|
(2)
|
Multilateral loans include loans funded and guaranteed by bilaterals, multilaterals, development banks and other similar institutions.
|
Non-recourse debt as of December 31,
2016
is scheduled to reach maturity as shown below (in millions):
|
December 31,
|
Annual Maturities
|
||
|
2017
|
$
|
1,339
|
|
|
2018
|
1,443
|
|
|
|
2019
|
1,214
|
|
|
|
2020
|
1,645
|
|
|
|
2021
|
2,035
|
|
|
|
Thereafter
|
8,557
|
|
|
|
Unamortized (discount)/premium & debt issuance (costs), net
|
(441
|
)
|
|
|
Total non-recourse debt
|
$
|
15,792
|
|
As of December 31,
2016
, AES subsidiaries with facilities under construction had a total of approximately
$1.9
155
THE AES CORPORATION
NOTES TO CONSOLIDATED FINANCIAL STATEMENTS—(Continued)
DECEMBER 31, 2016, 2015, AND 2014
billion
of committed but unused credit facilities available to fund construction and other related costs. Excluding these facilities under construction, AES subsidiaries had approximately
$2.3 billion
in a number of available but unused committed credit lines to support their working capital, debt service reserves and other business needs. These credit lines can be used for borrowings, letters of credit, or a combination of these uses.
Significant transactions
— During the year ended December 31,
2016
, the Company's subsidiaries had the following significant debt transactions:
|
Subsidiary
|
Issuances
|
Repayments
|
Gain (Loss) on Extinguishment of Debt
|
|||||||||
|
IPALCO
|
$
|
688
|
|
|
$
|
(455
|
)
|
|
$
|
—
|
|
|
|
Gener
|
633
|
|
|
(314
|
)
|
|
7
|
|
||||
|
DPL
|
460
|
|
|
(593
|
)
|
|
(3
|
)
|
||||
|
Andres
|
243
|
|
(180
|
)
|
(2
|
)
|
||||||
|
Los Mina
|
172
|
|
—
|
|
—
|
|
||||||
|
Wind Generation Holdings
|
130
|
|
(65
|
)
|
—
|
|
||||||
|
Eletropaulo
|
73
|
|
|
(202
|
)
|
|
—
|
|
||||
|
Maritza
|
18
|
|
(153
|
)
|
—
|
|
||||||
|
Other
|
611
|
|
(664
|
)
|
(2
|
)
|
||||||
|
$
|
3,028
|
|
$
|
(2,626
|
)
|
$
|
—
|
|
||||
Non-Recourse Debt Covenants, Restrictions and Defaults
— The terms of the Company's non-recourse debt include certain financial and non-financial covenants. These covenants are limited to subsidiary activity and vary among the subsidiaries. These covenants may include, but are not limited to, maintenance of certain reserves and financial ratios, minimum levels of working capital and limitations on incurring additional indebtedness.
As of December 31,
2016
and
2015
, approximately
$535 million
and
$513 million
, respectively, of restricted cash was maintained in accordance with certain covenants of the non-recourse debt agreements, and these amounts were included within
Restricted cash
and
Debt service reserves and other deposits
in the accompanying Consolidated Balance Sheets.
Various lender and governmental provisions restrict the ability of certain of the Company's subsidiaries to transfer their net assets to the Parent Company. Such restricted net assets of subsidiaries amounted to approximately
$2.5 billion
at December 31,
2016
.
The following table summarizes the Company's subsidiary non-recourse debt in default (in millions) as of
December 31, 2016
. Due to the defaults, these amounts are included in the current portion of non-recourse debt:
|
Primary Nature
of Default |
December 31, 2016
|
||||||||
|
Subsidiary
|
Default
|
Net Assets
|
|||||||
|
Kavarna (Bulgaria)
|
Covenant
|
$
|
123
|
|
$
|
78
|
|
||
|
Sogrinsk (Kazakhstan)
|
Covenant
|
5
|
|
9
|
|
||||
|
Total
|
$
|
128
|
|
||||||
As of
December 31, 2016
, none of the defaults are payment defaults. All of the subsidiary non-recourse defaults were triggered by failure to comply with other covenants and/or conditions such as (but not limited to) failure to meet information covenants, complete construction or other milestones in an allocated time, meet certain minimum or maximum financial ratios, or other requirements contained in the non-recourse debt documents of the applicable subsidiary.
In the event that there is a default, bankruptcy or maturity acceleration at a subsidiary or group of subsidiaries that meets the applicable definition of materiality under the corporate debt agreements of The AES Corporation, there could be a cross-default to the Company's recourse debt. Materiality is defined in the Parent's senior secured credit facility as having provided 20% or more of the Parent Company's total cash distributions from businesses for the four most recently completed fiscal quarters. As of
December 31, 2016
, none of the defaults listed above individually or in the aggregate result in or are at risk of triggering a cross-default under the recourse debt of the Parent Company. In the event the Parent Company is not in compliance with the financial covenants of its senior secured revolving credit facility, restricted payments will be limited to regular quarterly shareholder dividends at the then-prevailing rate. Payment defaults and bankruptcy defaults would preclude the making of any restricted payments.
156
THE AES CORPORATION
NOTES TO CONSOLIDATED FINANCIAL STATEMENTS—(Continued)
DECEMBER 31, 2016, 2015, AND 2014
RECOURSE DEBT
— The following table summarizes the carrying amount and terms of recourse debt of the Company as of the periods indicated (in millions):
|
Interest Rate
|
Final Maturity
|
December 31, 2016
|
December 31, 2015
|
||||||||
|
Senior Unsecured Note
|
8.00%
|
2017
|
$
|
—
|
|
$
|
181
|
|
|||
|
Senior Unsecured Note
|
LIBOR + 3%
|
2019
|
240
|
|
775
|
|
|||||
|
Senior Unsecured Note
|
8.00%
|
2020
|
469
|
|
469
|
|
|||||
|
Senior Unsecured Note
|
7.38%
|
2021
|
966
|
|
1,000
|
|
|||||
|
Senior Unsecured Note
|
4.88%
|
2023
|
713
|
|
750
|
|
|||||
|
Senior Unsecured Note
|
5.50%
|
2024
|
738
|
|
750
|
|
|||||
|
Senior Unsecured Note
|
5.50%
|
2025
|
573
|
|
575
|
|
|||||
|
Senior Unsecured Note
|
6.00%
|
2026
|
500
|
|
—
|
|
|||||
|
Term Convertible Trust Securities
|
6.75%
|
2029
|
517
|
|
517
|
|
|||||
|
Unamortized (discounts)/premiums & debt issuance (costs), net
|
(45
|
)
|
(51
|
)
|
|||||||
|
Subtotal
|
$
|
4,671
|
|
$
|
4,966
|
|
|||||
|
Less: Current maturities
|
—
|
|
—
|
|
|||||||
|
Noncurrent maturities
|
$
|
4,671
|
|
$
|
4,966
|
|
|||||
The following table summarizes the principal amounts due under our recourse debt for the next five years and thereafter (in millions):
|
December 31,
|
Net Principal Amounts Due
|
||
|
2017
|
$
|
—
|
|
|
2018
|
—
|
|
|
|
2019
|
240
|
|
|
|
2020
|
469
|
|
|
|
2021
|
966
|
|
|
|
Thereafter
|
3,041
|
|
|
|
Unamortized (discount)/premium & debt issuance (costs), net
|
(45
|
)
|
|
|
Total recourse debt
|
$
|
4,671
|
|
In July 2016, the Company redeemed in full the
$181 million
balance of its
8.0%
outstanding senior unsecured notes due 2017. As a result, the Company recognized a loss on extinguishment of debt of
$16 million
that is included in the Consolidated Statement of Operations.
In May 2016, the Company issued
$500 million
aggregate principal amount of
6.0%
senior notes due 2026. The Company used these proceeds to redeem, at par,
$495 million
aggregate principal of its existing
LIBOR + 3.00%
senior unsecured notes due 2019. As a result of the latter transaction, the Company recognized a net loss on extinguishment of debt of
$4 million
that is included in the Consolidated Statement of Operations.
In January 2016, the Company redeemed
$125 million
of its senior unsecured notes outstanding. The repayment included a portion of the
7.375%
senior notes due in 2021, the
4.875%
senior notes due in 2023, the
5.5%
senior notes due in 2024, the
5.5%
senior notes due in 2025 and the floating rate senior notes due in 2019. As a result of these transactions, the Company recognized a net gain on extinguishment of debt of
$7 million
that is included in the Consolidated Statement of Operations.
In April 2015, the Company issued
$575 million
aggregate principal amount of
5.50%
senior notes due 2025. Concurrent with this offering, the Company redeemed via tender offers
$344 million
aggregate principal of its existing
8.00%
senior unsecured notes due 2017, and
$156 million
of its existing
8.00%
senior unsecured notes due 2020. As a result of the latter transaction, the Company recognized a loss on extinguishment of debt of
$82 million
that is included in the Consolidated Statement of Operations.
In March 2015, the Company redeemed in full the
$151 million
balance of its
7.75%
senior unsecured notes due October 2015 and the
$164 million
balance of its
9.75%
senior unsecured notes due April 2016. As a result of these transactions, the Company recognized a loss on extinguishment of debt of
$23 million
that is included in the Consolidated Statement of Operations.
Recourse Debt Covenants and Guarantees
— The Company's obligations under the senior secured credit facility are subject to certain exceptions, secured by (i) all of the capital stock of domestic subsidiaries owned directly by the Company and
65%
of the capital stock of certain foreign subsidiaries owned directly or indirectly by the Company; and (ii) certain intercompany receivables, certain intercompany notes and certain intercompany tax sharing agreements.
The senior secured credit facility is subject to mandatory prepayment under certain circumstances, including the sale of certain assets. In such a situation, the net cash proceeds from the sale must be applied pro rata to repay
157
THE AES CORPORATION
NOTES TO CONSOLIDATED FINANCIAL STATEMENTS—(Continued)
DECEMBER 31, 2016, 2015, AND 2014
the term loan, if any, using
60%
of net cash proceeds, reduced to
50%
when and if the parent's recourse debt to cash flow ratio is less than
5:1
. The lenders have the option to waive their pro rata redemption.
The senior secured credit facility contains customary covenants and restrictions on the Company's ability to engage in certain activities, including, but not limited to, limitations on other indebtedness, liens, investments and guarantees; limitations on restricted payments such as shareholder dividends and equity repurchases; restrictions on mergers and acquisitions, sales of assets, leases, transactions with affiliates and off-balance sheet or derivative arrangements; and other financial reporting requirements.
The senior secured credit facility also contains financial covenants requiring the Company to maintain certain financial ratios including a cash flow to interest coverage ratio, calculated quarterly, which provides that a minimum ratio of the Company's adjusted operating cash flow to the Company's interest charges related to recourse debt of
1.3
times must be maintained at all times and a recourse debt to cash flow ratio, calculated quarterly, which provides that the ratio of the Company's total recourse debt to the Company's adjusted operating cash flow must not exceed a maximum of
7.5
times.
The terms of the Company's senior unsecured notes and senior secured credit facility contain certain covenants including, without limitation, limitation on the Company's ability to incur liens or enter into sale and leaseback transactions.
TERM CONVERTIBLE TRUST SECURITIES
— In 1999, AES Trust III, a wholly-owned special purpose business trust and a VIE, issued approximately
10.35 million
of
$50
par value TECONS with a quarterly coupon payment of
$0.844
for total proceeds of
$517 million
and concurrently purchased
$517 million
of
6.75%
Junior Subordinated Convertible Debentures due 2029 (the "6.75% Debentures") issued by AES. The Company consolidates AES Trust III in its consolidated financial statements and classifies the TECONS as recourse debt on its Consolidated Balance Sheet. The Company's obligations under the
6.75%
Debentures and other relevant trust agreements, in aggregate, constitute a full and unconditional guarantee by the Company of the TECON Trusts' obligations. As of December 31,
2016
and
2015
, the sole assets of AES Trust III are the
6.75%
Debentures.
AES, at its option, can redeem the
6.75%
Debentures which would result in the required redemption of the TECONS issued by AES Trust III, currently for
$50
per TECON. The TECONS must be redeemed upon maturity of the
6.75%
Debentures. The TECONS are convertible into the common stock of AES at each holder's option prior to October 15, 2029 at the rate of
1.4216
, representing a conversion price of
$35.17
per share. The maximum number of shares of common stock AES would be required to issue should all holders decide to convert their securities would be
14.7 million
shares.
Dividends on the TECONS are payable quarterly at an annual rate of
6.75%
. The Trust is permitted to defer payment of dividends for up to
20
consecutive quarters, provided that the Company has exercised its right to defer interest payments under the corresponding debentures or notes. During such deferral periods, dividends on the TECONS would accumulate quarterly and accrue interest, and the Company may not declare or pay dividends on its common stock. AES has not exercised the option to defer any dividends at this time and all dividends due under the Trust have been paid.
12
. COMMITMENTS
LEASES
— The Company and its subsidiaries enter into long-term non-cancelable lease arrangements which, for accounting purposes, are classified as either an operating lease or capital lease. Operating leases primarily include certain transmission lines, office rental and site leases. Operating lease rental expense for the years ended
December 31,
2016
,
2015
, and
2014
was
$80 million
,
$59 million
and
$48 million
, respectively. Capital leases primarily include transmission lines at our subsidiaries in Brazil, vehicles, and office and other operating equipment. Capital leases are recognized in Property, Plant and Equipment within
Electric generation, distribution assets and other
. The gross value of the capital lease assets as of
December 31,
2016
and
2015
was
$91 million
and
$67 million
, respectively. The following table shows the future minimum lease payments under operating and capital leases for continuing operations together with the present value of the net minimum lease payments under capital leases as of December 31,
2016
for
2017
through
2021
and thereafter (in millions):
158
THE AES CORPORATION
NOTES TO CONSOLIDATED FINANCIAL STATEMENTS—(Continued)
DECEMBER 31, 2016, 2015, AND 2014
|
Future Commitments for
|
|||||||
|
December 31,
|
Capital Leases
|
Operating Leases
|
|||||
|
2017
|
$
|
25
|
|
$
|
84
|
|
|
|
2018
|
18
|
|
90
|
|
|||
|
2019
|
14
|
|
91
|
|
|||
|
2020
|
11
|
|
92
|
|
|||
|
2021
|
8
|
|
91
|
|
|||
|
Thereafter
|
89
|
|
926
|
|
|||
|
Total
|
$
|
165
|
|
$
|
1,374
|
|
|
|
Less: Imputed interest
|
(96
|
)
|
|||||
|
Present value of total minimum lease payments
|
$
|
69
|
|
||||
CONTRACTS
— The Company's operating subsidiaries enter into long-term contracts for construction projects, maintenance and service, transmission of electricity, operations services and purchase of electricity and fuel. In general, these contracts are subject to variable quantities or prices and are terminable only in limited circumstances. Electricity purchase contracts primarily include energy auction agreements at our Brazil subsidiaries with extended terms through 2028. The following table shows the future minimum commitments for continuing operations under these contracts as of
December 31,
2016
for
2017
through
2021
and thereafter as well as actual purchases under these contracts for the years ended
December 31,
2016
,
2015
, and
2014
(in millions):
|
Actual purchases during the year ended December 31,
|
Electricity Purchase Contracts
|
Fuel Purchase Contracts
|
Other Purchase Contracts
|
||||||||
|
2014
|
$
|
2,475
|
|
$
|
1,521
|
|
$
|
1,367
|
|
||
|
2015
|
2,120
|
|
1,262
|
|
2,110
|
|
|||||
|
2016
|
2,447
|
|
1,790
|
|
1,093
|
|
|||||
|
Future commitments for the year ending December 31,
|
|||||||||||
|
2017
|
$
|
2,513
|
|
$
|
1,609
|
|
$
|
2,966
|
|
||
|
2018
|
2,507
|
|
724
|
|
1,865
|
|
|||||
|
2019
|
2,367
|
|
489
|
|
1,395
|
|
|||||
|
2020
|
2,704
|
|
451
|
|
956
|
|
|||||
|
2021
|
2,750
|
|
465
|
|
815
|
|
|||||
|
Thereafter
|
20,265
|
|
1,425
|
|
6,012
|
|
|||||
|
Total
|
$
|
33,106
|
|
$
|
5,163
|
|
$
|
14,009
|
|
||
13
. CONTINGENCIES
Guarantees, Letters of Credit —
In connection with certain project financings, acquisitions and dispositions, power purchases and other agreements, the Parent Company has expressly undertaken limited obligations and commitments, most of which will only be effective or will be terminated upon the occurrence of future events. In the normal course of business, the Parent Company has entered into various agreements, mainly guarantees and letters of credit, to provide financial or performance assurance to third parties on behalf of AES businesses. These agreements are entered into primarily to support or enhance the creditworthiness otherwise achieved by a business on a stand-alone basis, thereby facilitating the availability of sufficient credit to accomplish their intended business purposes. Most of the contingent obligations relate to future performance commitments which the Company or its businesses expect to fulfill within the normal course of business. The expiration dates of these guarantees vary from less than
one
year to more than
18
years.
The following table summarizes the Parent Company's contingent contractual obligations as of
December 31, 2016
. Amounts presented in the following table represent the Parent Company's current undiscounted exposure to guarantees and the range of maximum undiscounted potential exposure. The maximum exposure is not reduced by the amounts, if any, that could be recovered under the recourse or collateralization provisions in the guarantees. The were
no
obligations made by the Parent Company for the direct benefit of the lenders associated with the non-recourse debt of its businesses.
159
THE AES CORPORATION
NOTES TO CONSOLIDATED FINANCIAL STATEMENTS—(Continued)
DECEMBER 31, 2016, 2015, AND 2014
|
Contingent Contractual Obligations
|
Amount
(in millions)
|
Number of Agreements
|
Maximum Exposure Range for Each Agreement
(in millions)
|
|||||
|
Guarantees and commitments
|
$
|
508
|
|
18
|
$8 - 58
|
|||
|
Letters of Credit under the unsecured credit facility
|
245
|
|
8
|
$2 - 73
|
||||
|
Asset sale related indemnities
(1)
|
27
|
|
1
|
27
|
||||
|
Letters of Credit under the senior secured credit facility
|
6
|
|
15
|
<$1 - 1
|
||||
|
Cash collateralized letters of credit
|
3
|
|
1
|
3
|
||||
|
Total
|
$
|
789
|
|
43
|
||||
_____________________________
|
(1)
|
Excludes normal and customary representations and warranties in agreements for the sale of assets (including ownership in associated legal entities) where the associated risk is considered to be nominal.
|
As of December 31,
2016
, the Parent Company had
no
commitments to invest in subsidiaries under construction and to purchase related equipment that were not included in the letters of credit discussed above. During the year ended
December 31, 2016
, the Company paid letter of credit fees ranging from
0.2%
to
2.5%
per annum on the outstanding amounts of letters of credit.
Environmental —
The Company periodically reviews its obligations as they relate to compliance with environmental laws, including site restoration and remediation. As of
December 31, 2016
and
2015
the Company had recognized liabilities of
$12 million
and
$10 million
, respectively, for projected environmental remediation costs. Due to the uncertainties associated with environmental assessment and remediation activities, future costs of compliance or remediation could be higher or lower than the amount currently accrued. Moreover, where no liability has been recognized, it is reasonably possible that the Company may be required to incur remediation costs or make expenditures in amounts that could be material but could not be estimated as of
December 31, 2016
. In aggregate, the Company estimates that the range of potential losses related to environmental matters, where estimable, to be up to
$19 million
. The amounts considered reasonably possible do not include amounts accrued as discussed above.
Litigation —
The Company is involved in certain claims, suits and legal proceedings in the normal course of business. The Company accrues for litigation and claims when it is probable that a liability has been incurred and the amount of loss can be reasonably estimated. The Company has evaluated claims in accordance with the accounting guidance for contingencies that it deems both probable and reasonably estimable and, accordingly, has recorded aggregate liabilities for all claims of approximately
$179 million
as of
December 31, 2016
and
2015
. These amounts are reported on the Consolidated Balance Sheets within
Accrued and other liabilities
and
Other noncurrent liabilities
. A significant portion of these accrued liabilities relate to employment, non-income tax and customer disputes in international jurisdictions (principally Brazil). Certain of the Company's subsidiaries, principally in Brazil, are defendants in a number of labor and employment lawsuits. The complaints generally seek unspecified monetary damages, injunctive relief, or other relief. The subsidiaries have denied any liability and intend to vigorously defend themselves in all of these proceedings. There can be no assurance that these accrued liabilities will be adequate to cover all existing and future claims or that we will have the liquidity to pay such claims as they arise.
Where no accrued liability has been recognized, it is reasonably possible that some matters could be decided unfavorably to the Company and could require the Company to pay damages or make expenditures in amounts that could be material but could not be estimated as of
December 31, 2016
. The material contingencies where a loss is reasonably possible primarily include claims under financing agreements; disputes with offtakers, suppliers and EPC contractors; alleged violation of monopoly laws and regulations; income tax and non-income tax matters with tax authorities; and regulatory matters. In aggregate, the Company estimates that the range of potential losses, where estimable, related to these reasonably possible material contingencies to be between
$1.5 billion
and
$1.8 billion
. The amounts considered reasonably possible do not include amounts accrued, as discussed above. These material contingencies do not include income tax-related contingencies which are considered part of our uncertain tax positions.
Regulatory
— During 2013, the Company recognized a regulatory liability of
$269 million
for a contingency related to an administrative ruling which required Eletropaulo to refund customers' amounts related to the regulatory asset base. In 2014, Eletropaulo started refunding customers as part of the tariff. In January 2015, ANEEL updated the tariff to exclude any further customer refunds. On June 30, 2015, ANEEL included in the tariff reset the reimbursement to Eletropaulo of these amounts previously refunded to customers to begin in July 2015. During 2015, as a result of favorable events, management reassessed the contingency and determined that it no longer meets the recognition criteria under ASC 450 —
Contingencies
. Management believes that it is now only reasonably possible that Eletropaulo will have to refund these amounts to customers. Accordingly, the Company reversed the
160
THE AES CORPORATION
NOTES TO CONSOLIDATED FINANCIAL STATEMENTS—(Continued)
DECEMBER 31, 2016, 2015, AND 2014
remaining regulatory liability for this contingency of
$161 million
in 2015, which increased
Regulated Revenue
by
$97 million
and reduced
Interest Expense
by
$64 million
. Amounts related to this case are now included as part of our reasonably possible contingent range mentioned in the preceding paragraph.
14
. BENEFIT PLANS
Defined Contribution Plan
—
The Company sponsors
four
defined contribution plans ("the Plans").
Two
are for U.S. non-union employees, of which
one
is for employees of the Parent Company and certain U.S. SBU businesses and
one
is for DPL employees.
One
plan includes both union and non-union employees at IPL.
One
defined contribution plan is for union employees at DPL. The Plans are qualified under section 401 of the Internal Revenue Code. All U.S. employees of the Company are eligible to participate in the appropriate Plan except for those employees who are covered by a collective bargaining agreement, unless such agreement specifically provides that the employee is considered an eligible employee under a Plan. The Plans provide matching contributions in AES common stock or cash, other contributions at the discretion of the Compensation Committee of the Board of Directors in AES common stock or cash and discretionary tax deferred contributions from the participants. Participants are fully vested in their own contributions and the Company's matching contributions. Participants vest in other company contributions ratably over a
five
-year period ending on the fifth anniversary of their hire date. For the year ended
December 31, 2016
, the Company's contributions to the defined contribution plans were approximately
$15 million
, and for the years ended December 31,
2015
and
2014
, contributions were
$18 million
and
$22 million
per year, respectively.
Defined Benefit Plans —
Certain of the Company's subsidiaries have defined benefit pension plans covering substantially all of their respective employees. Pension benefits are based on years of credited service, age of the participant and average earnings. Of the
33
active defined benefit plans as of
December 31, 2016
,
5
are at U.S. subsidiaries and the remaining plans are at foreign subsidiaries
.
The following table reconciles the Company's funded status, both domestic and foreign, as of the periods indicated (in millions):
|
December 31,
|
2016
|
2015
|
||||||||||||||
|
U.S.
|
Foreign
|
U.S.
|
Foreign
|
|||||||||||||
|
CHANGE IN PROJECTED BENEFIT OBLIGATION:
|
||||||||||||||||
|
Benefit obligation as of January 1
|
$
|
1,172
|
|
$
|
2,876
|
|
$
|
1,235
|
|
$
|
4,222
|
|
||||
|
Service cost
|
13
|
|
13
|
|
16
|
|
15
|
|
||||||||
|
Interest cost
|
42
|
|
344
|
|
48
|
|
340
|
|
||||||||
|
Employee contributions
|
—
|
|
3
|
|
—
|
|
3
|
|
||||||||
|
Plan amendments
|
—
|
|
(4
|
)
|
5
|
|
2
|
|
||||||||
|
Plan curtailments
|
2
|
|
—
|
|
—
|
|
—
|
|
||||||||
|
Plan settlements
|
—
|
|
—
|
|
(3
|
)
|
—
|
|
||||||||
|
Benefits paid
|
(60
|
)
|
(303
|
)
|
(61
|
)
|
(292
|
)
|
||||||||
|
Actuarial (gain) loss
|
19
|
|
558
|
|
(68
|
)
|
(158
|
)
|
||||||||
|
Effect of foreign currency exchange rate changes
|
—
|
|
505
|
|
—
|
|
(1,256
|
)
|
||||||||
|
Benefit obligation as of December 31
|
$
|
1,188
|
|
$
|
3,992
|
|
$
|
1,172
|
|
$
|
2,876
|
|
||||
|
CHANGE IN PLAN ASSETS:
|
||||||||||||||||
|
Fair value of plan assets as of January 1
|
$
|
1,021
|
|
$
|
2,195
|
|
$
|
1,061
|
|
$
|
3,144
|
|
||||
|
Actual return on plan assets
|
61
|
|
451
|
|
(7
|
)
|
175
|
|
||||||||
|
Employer contributions
|
22
|
|
138
|
|
31
|
|
86
|
|
||||||||
|
Employee contributions
|
—
|
|
3
|
|
—
|
|
3
|
|
||||||||
|
Plan settlements
|
—
|
|
—
|
|
(3
|
)
|
—
|
|
||||||||
|
Benefits paid
|
(60
|
)
|
(303
|
)
|
(61
|
)
|
(292
|
)
|
||||||||
|
Effect of foreign currency exchange rate changes
|
—
|
|
340
|
|
—
|
|
(921
|
)
|
||||||||
|
Fair value of plan assets as of December 31
|
$
|
1,044
|
|
$
|
2,824
|
|
$
|
1,021
|
|
$
|
2,195
|
|
||||
|
RECONCILIATION OF FUNDED STATUS
|
||||||||||||||||
|
Funded status as of December 31
|
$
|
(144
|
)
|
$
|
(1,168
|
)
|
$
|
(151
|
)
|
$
|
(681
|
)
|
||||
The following table summarizes the amounts recognized on the Consolidated Balance Sheets related to the funded status of the plans, both domestic and foreign, as of the periods indicated (in millions):
|
December 31,
|
2016
|
2015
|
||||||||||||||
|
Amounts Recognized on the Consolidated Balance Sheets
|
U.S.
|
Foreign
|
U.S.
|
Foreign
|
||||||||||||
|
Noncurrent assets
|
$
|
—
|
|
$
|
60
|
|
$
|
—
|
|
$
|
67
|
|
||||
|
Accrued benefit liability—current
|
—
|
|
(5
|
)
|
—
|
|
(5
|
)
|
||||||||
|
Accrued benefit liability—noncurrent
|
(144
|
)
|
(1,223
|
)
|
(151
|
)
|
(743
|
)
|
||||||||
|
Net amount recognized at end of year
|
$
|
(144
|
)
|
$
|
(1,168
|
)
|
$
|
(151
|
)
|
$
|
(681
|
)
|
||||
161
THE AES CORPORATION
NOTES TO CONSOLIDATED FINANCIAL STATEMENTS—(Continued)
DECEMBER 31, 2016, 2015, AND 2014
The following table summarizes the Company's U.S. and foreign accumulated benefit obligation as of the periods indicated (in millions):
|
December 31,
|
2016
|
2015
|
||||||||||||||
|
U.S.
|
Foreign
|
U.S.
|
Foreign
|
|||||||||||||
|
Accumulated Benefit Obligation
|
$
|
1,167
|
|
$
|
3,942
|
|
$
|
1,150
|
|
$
|
2,836
|
|
||||
|
Information for pension plans with an accumulated benefit obligation in excess of plan assets:
|
||||||||||||||||
|
Projected benefit obligation
|
$
|
1,188
|
|
$
|
3,671
|
|
$
|
1,172
|
|
$
|
2,585
|
|
||||
|
Accumulated benefit obligation
|
1,167
|
|
3,638
|
|
1,150
|
|
2,561
|
|
||||||||
|
Fair value of plan assets
|
1,044
|
|
2,448
|
|
1,021
|
|
1,842
|
|
||||||||
|
Information for pension plans with a projected benefit obligation in excess of plan assets:
|
||||||||||||||||
|
Projected benefit obligation
|
$
|
1,188
|
|
$
|
3,793
|
|
(1)
|
$
|
1,172
|
|
$
|
2,600
|
|
(1)
|
||
|
Fair value of plan assets
|
1,044
|
|
2,565
|
|
(1)
|
1,021
|
|
1,853
|
|
(1)
|
||||||
_____________________________
|
(1)
|
$1.2 billion
and
$686 million
of the total net unfunded projected benefit obligation is due to Eletropaulo in Brazil as of December 31,
2016
and
2015
, respectively.
|
The following table summarizes the significant weighted average assumptions used in the calculation of benefit obligation and net periodic benefit cost, both domestic and foreign, as of the periods indicated:
|
December 31,
|
2016
|
2015
|
|||||||||||
|
U.S.
|
Foreign
|
U.S.
|
Foreign
|
||||||||||
|
Benefit Obligation —
|
Discount rate
|
4.28
|
%
|
10.08
|
%
|
(1)
|
4.44
|
%
|
11.35
|
%
|
(1)
|
||
|
Rate of compensation increase
|
3.34
|
%
|
6.41
|
%
|
3.34
|
%
|
6.31
|
%
|
|||||
|
Periodic Benefit Cost —
|
Discount rate
|
4.44
|
%
|
11.37
|
%
|
4.04
|
%
|
10.47
|
%
|
||||
|
Expected long-term rate of return on plan assets
|
6.67
|
%
|
9.54
|
%
|
6.67
|
%
|
9.77
|
%
|
|||||
|
Rate of compensation increase
|
3.34
|
%
|
6.40
|
%
|
3.94
|
%
|
6.33
|
%
|
|||||
_____________________________
|
(1)
|
Includes an inflation factor that is used to calculate future periodic benefit cost, but is not used to calculate the benefit obligation.
|
The Company establishes its estimated long-term return on plan assets considering various factors, which include the targeted asset allocation percentages, historic returns and expected future returns.
The measurement of pension obligations, costs and liabilities is dependent on a variety of assumptions. These assumptions include estimates of the present value of projected future pension payments to all plan participants, taking into consideration the likelihood of potential future events such as salary increases and demographic experience. These assumptions may have an effect on the amount and timing of future contributions.
The assumptions used in developing the required estimates include the following key factors: discount rates; salary growth; retirement rates; inflation; expected return on plan assets; and mortality rates.
The effects of actual results differing from the Company's assumptions are accumulated and amortized over future periods and, therefore, generally affect the Company's recognized expense in such future periods.
Effective January 1, 2016, the Company applied a disaggregated discount rate approach for determining service cost and interest cost for its defined benefit pension plans and postretirement plans in the U.S. and U.K. Refer to Note
1
—
General and Summary of Significant Accounting Policies
for further information relating to this change in estimate.
Sensitivity of the Company's pension funded status to the indicated increase or decrease in the discount rate and long-term rate of return on plan assets assumptions is shown below. Note that these sensitivities may be asymmetric and are specific to the base conditions at year-end
2016
. They also may not be additive, so the impact of changing multiple factors simultaneously cannot be calculated by combining the individual sensitivities shown. The funded status as of December 31,
2016
is affected by the assumptions as of that date. Pension expense for
2016
is affected by the December 31,
2015
assumptions. The impact on pension expense from a one percentage point change in these assumptions is shown in the following table (in millions):
|
Increase of 1% in the discount rate
|
$
|
(37
|
)
|
|
|
Decrease of 1% in the discount rate
|
32
|
|
||
|
Increase of 1% in the long-term rate of return on plan assets
|
(35
|
)
|
||
|
Decrease of 1% in the long-term rate of return on plan assets
|
35
|
|
||
The following table summarizes the components of the net periodic benefit cost, both domestic and foreign, for the years indicated (in millions):
162
THE AES CORPORATION
NOTES TO CONSOLIDATED FINANCIAL STATEMENTS—(Continued)
DECEMBER 31, 2016, 2015, AND 2014
|
December 31,
|
2016
|
2015
|
2014
|
|||||||||||||||||||||
|
Components of Net Periodic Benefit Cost:
|
U.S.
|
Foreign
|
U.S.
|
Foreign
|
U.S.
|
Foreign
|
||||||||||||||||||
|
Service cost
|
$
|
13
|
|
$
|
13
|
|
$
|
16
|
|
$
|
15
|
|
$
|
14
|
|
$
|
16
|
|
||||||
|
Interest cost
|
42
|
|
344
|
|
48
|
|
340
|
|
50
|
|
473
|
|
||||||||||||
|
Expected return on plan assets
|
(68
|
)
|
(221
|
)
|
(70
|
)
|
(236
|
)
|
(67
|
)
|
(348
|
)
|
||||||||||||
|
Amortization of prior service cost
|
7
|
|
(1
|
)
|
7
|
|
—
|
|
6
|
|
(1
|
)
|
||||||||||||
|
Amortization of net loss
|
18
|
|
19
|
|
20
|
|
25
|
|
13
|
|
35
|
|
||||||||||||
|
Curtailment loss recognized
|
4
|
|
—
|
|
—
|
|
—
|
|
—
|
|
—
|
|
||||||||||||
|
Settlement gain recognized
|
—
|
|
—
|
|
—
|
|
—
|
|
—
|
|
1
|
|
||||||||||||
|
Total pension cost
|
$
|
16
|
|
$
|
154
|
|
$
|
21
|
|
$
|
144
|
|
$
|
16
|
|
$
|
176
|
|
||||||
The following table summarizes in millions the amounts reflected in AOCL, including AOCL attributable to noncontrolling interests, on the Consolidated Balance Sheet as of December 31,
2016
, that have not yet been recognized as components of net periodic benefit cost and amounts expected to be reclassified to earnings in the next fiscal year (in millions):
|
December 31, 2016
|
Accumulated Other Comprehensive Income (Loss)
|
Amounts expected to be reclassified to earnings in next fiscal year
|
|||||||||||||
|
U.S.
|
Foreign
|
U.S.
|
Foreign
|
||||||||||||
|
Prior service cost
|
$
|
—
|
|
$
|
(1
|
)
|
$
|
—
|
|
$
|
—
|
|
|||
|
Unrecognized net actuarial gain (loss)
|
(16
|
)
|
(1,370
|
)
|
—
|
|
(41
|
)
|
|||||||
|
Total
|
$
|
(16
|
)
|
$
|
(1,371
|
)
|
$
|
—
|
|
$
|
(41
|
)
|
|||
The following table summarizes the Company's target allocation for
2016
and pension plan asset allocation, both domestic and foreign, as of the periods indicated:
|
Percentage of Plan Assets as of December 31,
|
|||||||||||||||
|
Target Allocations
|
2016
|
2015
|
|||||||||||||
|
Asset Category
|
U.S.
|
Foreign
|
U.S.
|
Foreign
|
U.S.
|
Foreign
|
|||||||||
|
Equity securities
|
53%
|
15% -28%
|
50.96
|
%
|
9.42
|
%
|
44.76
|
%
|
12.76
|
%
|
|||||
|
Debt securities
|
45%
|
62% - 85%
|
45.88
|
%
|
78.29
|
%
|
50.05
|
%
|
81.41
|
%
|
|||||
|
Real estate
|
2%
|
0% - 4%
|
3.16
|
%
|
3.15
|
%
|
2.94
|
%
|
3.33
|
%
|
|||||
|
Other
|
—%
|
0% - 5%
|
—
|
%
|
9.14
|
%
|
2.25
|
%
|
2.50
|
%
|
|||||
|
Total pension assets
|
100.00
|
%
|
100.00
|
%
|
100.00
|
%
|
100.00
|
%
|
|||||||
The U.S. plans seek to achieve the following long-term investment objectives:
|
•
|
maintenance of sufficient income and liquidity to pay retirement benefits and other lump sum payments;
|
|
•
|
long-term rate of return in excess of the annualized inflation rate;
|
|
•
|
long-term rate of return, net of relevant fees, that meets or exceeds the assumed actuarial rate; and
|
|
•
|
long-term competitive rate of return on investments, net of expenses, that equals or exceeds various benchmark rates.
|
The asset allocation is reviewed periodically to determine a suitable asset allocation which seeks to manage risk through portfolio diversification and takes into account, among other possible factors, the above-stated objectives, in conjunction with current funding levels, cash flow conditions and economic and industry trends. The following table summarizes the Company's U.S. plan assets by category of investment and level within the fair value hierarchy as of the periods indicated (in millions):
|
December 31, 2016
|
December 31, 2015
|
|||||||||||||||||||||||||||||||
|
U.S. Plans
|
Level 1
|
Level 2
|
Level 3
|
Total
|
Level 1
|
Level 2
|
Level 3
|
Total
|
||||||||||||||||||||||||
|
Equity securities:
|
Mutual funds
|
532
|
|
—
|
|
—
|
|
532
|
|
457
|
|
—
|
|
—
|
|
457
|
|
|||||||||||||||
|
Debt securities:
|
Government debt securities
|
86
|
|
—
|
|
—
|
|
86
|
|
53
|
|
—
|
|
—
|
|
53
|
|
|||||||||||||||
|
Mutual funds
(1)
|
393
|
|
—
|
|
—
|
|
393
|
|
458
|
|
—
|
|
—
|
|
458
|
|
||||||||||||||||
|
Real Estate:
|
Real Estate
|
—
|
|
33
|
|
—
|
|
33
|
|
—
|
|
30
|
|
—
|
|
30
|
|
|||||||||||||||
|
Other:
|
Other investments
|
—
|
|
—
|
|
—
|
|
—
|
|
—
|
|
23
|
|
—
|
|
23
|
|
|||||||||||||||
|
Total plan assets
|
$
|
1,011
|
|
$
|
33
|
|
$
|
—
|
|
$
|
1,044
|
|
$
|
968
|
|
$
|
53
|
|
$
|
—
|
|
$
|
1,021
|
|
||||||||
_____________________________
|
(1)
|
Mutual funds categorized as debt securities consist of mutual funds for which debt securities are the primary underlying investment.
|
The investment strategy of the foreign plans seeks to maximize return on investment while minimizing risk. The assumed asset allocation has less exposure to equities in order to closely match market conditions and near term forecasts. The following table summarizes the Company's foreign plan assets by category of investment and level within the fair value hierarchy as of the periods indicated (in millions):
163
THE AES CORPORATION
NOTES TO CONSOLIDATED FINANCIAL STATEMENTS—(Continued)
DECEMBER 31, 2016, 2015, AND 2014
|
December 31, 2016
|
December 31, 2015
|
|||||||||||||||||||||||||||||||
|
Foreign Plans
|
Level 1
|
Level 2
|
Level 3
|
Total
|
Level 1
|
Level 2
|
Level 3
|
Total
|
||||||||||||||||||||||||
|
Equity securities —
|
Mutual funds
|
$
|
175
|
|
$
|
—
|
|
$
|
—
|
|
$
|
175
|
|
$
|
156
|
|
$
|
—
|
|
$
|
—
|
|
$
|
156
|
|
|||||||
|
Private equity
(1)
|
—
|
|
—
|
|
150
|
|
150
|
|
—
|
|
—
|
|
124
|
|
124
|
|
||||||||||||||||
|
Debt securities —
|
Government debt securities
|
10
|
|
—
|
|
—
|
|
10
|
|
11
|
|
29
|
|
—
|
|
40
|
|
|||||||||||||||
|
Corporate debt securities
|
—
|
|
67
|
|
—
|
|
67
|
|
—
|
|
—
|
|
—
|
|
—
|
|
||||||||||||||||
|
Mutual funds
(2)
|
215
|
|
2,049
|
|
—
|
|
2,264
|
|
217
|
|
1,530
|
|
—
|
|
1,747
|
|
||||||||||||||||
|
Real estate
—
|
Real estate
(1)
|
—
|
|
—
|
|
89
|
|
89
|
|
—
|
|
—
|
|
73
|
|
73
|
|
|||||||||||||||
|
Other —
|
Participant loans
(3)
|
—
|
|
—
|
|
42
|
|
42
|
|
—
|
|
—
|
|
37
|
|
37
|
|
|||||||||||||||
|
Other assets
|
24
|
|
—
|
|
3
|
|
27
|
|
16
|
|
—
|
|
2
|
|
18
|
|
||||||||||||||||
|
Total plan assets
|
$
|
424
|
|
$
|
2,116
|
|
$
|
284
|
|
$
|
2,824
|
|
$
|
400
|
|
$
|
1,559
|
|
$
|
236
|
|
$
|
2,195
|
|
||||||||
_____________________________
|
(1)
|
Plan assets of our Brazilian subsidiaries are invested in private equities and commercial real estate through the plan administrator in Brazil. The fair value of these assets is determined using the income approach through annual appraisals based on a discounted cash flow analysis.
|
|
(2)
|
Mutual funds categorized as debt securities consist of mutual funds for which debt securities are the primary underlying investment.
|
|
(3)
|
Loans to participants are stated at cost, which approximates fair value.
|
The following table presents a reconciliation of all plan assets measured at fair value using significant unobservable inputs (Level 3) for the periods indicated (in millions):
|
December 31,
|
2016
|
2015
|
||||||
|
Balance at January 1
|
$
|
236
|
|
$
|
389
|
|
||
|
Actual return on plan assets:
|
||||||||
|
Returns relating to assets still held at reporting date
|
3
|
|
(35
|
)
|
||||
|
Change due to exchange rate changes
|
45
|
|
(118
|
)
|
||||
|
Balance at December 31
|
$
|
284
|
|
$
|
236
|
|
||
The following table summarizes the estimated cash flows for U.S. and foreign expected employer contributions and expected future benefit payments, both domestic and foreign (in millions):
|
U.S.
|
Foreign
|
|||||||
|
Expected employer contribution in 2017
|
$
|
14
|
|
$
|
159
|
|
||
|
Expected benefit payments for fiscal year ending:
|
||||||||
|
2017
|
67
|
|
334
|
|
||||
|
2018
|
69
|
|
346
|
|
||||
|
2019
|
71
|
|
358
|
|
||||
|
2020
|
72
|
|
370
|
|
||||
|
2021
|
74
|
|
381
|
|
||||
|
2022 - 2026
|
387
|
|
2,057
|
|
||||
15
. EQUITY
Equity Transactions with Noncontrolling Interests
Jordan
— In February 2016, the Company completed the sale of
40%
of its interest in a wholly-owned subsidiary in Jordan that owns a controlling interest in the Jordan IPP4 gas-fired plant for
$21 million
. The transaction was accounted for as a sale of in-substance real estate and a pretax gain of
$4 million
, net of transaction costs, was recognized in net income. The cash proceeds from the sale are reflected in
Proceeds from the sale of businesses, net of cash sold
on the Consolidated Statement of Cash Flows for the period ended
December 31, 2016
. After completion of the sale, the Company has a
36%
economic interest in Jordan IPP4 and will continue to manage and operate the plant, with
40%
owned by Mitsui Ltd. and
24%
owned by Nebras Power Q.S.C. As the Company maintained control after the sale, Jordan IPP4 continues to be consolidated by the Company within the Europe SBU reportable segment.
Brazil Reorganization
— In 2015, the Company completed a restructuring of Tietê. This transaction resulted in no change of ownership or control. The
$27 million
impact of this equity transaction was recognized in additional paid-in capital.
Gener
— In November 2015, the Company sold a
4%
stake in AES Gener S.A. ("Gener") through its
99.9%
owned subsidiary Inversiones Cachagua S.p.A ("Cachagua") for
$145 million
, net of transaction costs. The sale was of previously issued common shares of Gener to certain institutional investors and is not a sale of in-substance real estate. While the sale decreased Parent ownership interest from
70.7%
to
66.7%
, the Parent continues to retain its controlling financial interest in the subsidiary. The difference of
$24 million
between the fair value of the consideration received, net of taxes and transaction costs, and the amount by which the NCI is adjusted was
164
THE AES CORPORATION
NOTES TO CONSOLIDATED FINANCIAL STATEMENTS—(Continued)
DECEMBER 31, 2016, 2015, AND 2014
recognized in additional paid-in capital.
No
pretax gain or loss was recognized in net income as a result of this transaction.
Dominican Republic
— In December 2014 Estrella and Linda Groups, an investor-based group in the Dominican Republic acquired
8%
noncontrolling interest in our businesses in the Dominican Republic for
$83 million
, net of transaction costs, with options to acquire an additional
2%
for
$24 million
at any time between the closing date and December 31, 2015, and an additional
10%
for
$125 million
at any time between the closing date and December 31, 2017. In December 2015, Estrella and Linda Groups exercised its first call option of additional
2%
for
$18 million
, net of discount and transaction costs. This resulted in Estrella and Linda Groups having a total of
10%
noncontrolling interest in our businesses in the Dominican Republic.
As a result of these transaction,
$7 million
, net of taxes and transaction costs, was recognized in additional paid-in capital at December 31, 2015.
No
gain or loss was recognized in net income as the sale was not considered to be a sale of in-substance real estate. As the Company maintained control after the sale, our businesses in the Dominican Republic continue to be consolidated by the Company within the MCAC SBU reportable segment.
Masinloc
— On June 25, 2014, the Company executed an agreement to sell approximately
45%
of its interest in Masin-AES Pte Ltd., a wholly-owned subsidiary that owns the Company's business interests in the Philippines, for
$453 million
, subject to certain purchase price adjustments. On July 15, 2014, the Company completed the Masinloc sale transaction and received cumulative net proceeds of
$436 million
, including
$23 million
contingent upon the achievement of certain restructuring efficiencies. The transaction was accounted for as a sale of in-substance real estate. Noncontrolling interest of
$130 million
and a pretax gain on sale of investment of approximately
$283 million
, net of transaction costs, were recognized during the third quarter of 2014. The portion of the proceeds related to the contingency has been deferred.
After completion of the sale, the Company owns a
51%
net ownership interest in Masinloc and will continue to manage and operate the plant. As the Company maintained control after the sale, Masinloc continues to be accounted for as a consolidated subsidiary within the Asia SBU reportable segment.
The following table summarizes the net income attributable to The AES Corporation and all transfers (to) from noncontrolling interests for the periods indicated (in millions):
|
December 31,
|
||||||||||||
|
2016
|
2015
|
2014
|
||||||||||
|
Net income attributable to The AES Corporation
|
$
|
(1,130
|
)
|
$
|
306
|
|
$
|
769
|
|
|||
|
Transfers from the noncontrolling interest:
|
||||||||||||
|
Net increase in The AES Corporation's paid-in capital for sale of subsidiary shares
|
84
|
|
323
|
|
29
|
|
||||||
|
Additional paid-in capital, IPALCO shares, transferred to redeemable stock of subsidiaries
(1)
|
(84
|
)
|
(377
|
)
|
—
|
|
||||||
|
Increase (decrease) in The AES Corporation's paid-in capital for purchase of subsidiary shares
|
(2
|
)
|
—
|
|
7
|
|
||||||
|
Net transfers (to) from noncontrolling interest
|
(2
|
)
|
(54
|
)
|
36
|
|
||||||
|
Change from net income attributable to The AES Corporation and transfers (to) from noncontrolling interests
|
$
|
(1,132
|
)
|
$
|
252
|
|
$
|
805
|
|
|||
_____________________________
|
(1)
|
See Note
18
—
Redeemable stock of subsidiaries
for further information on increase in paid-in capital transferred to redeemable stock of subsidiaries.
|
Deconsolidations
UK Wind
— During 2016, the Company determined it no longer had control of its wind development projects in the United Kingdom (“UK Wind”) as the Company no longer held seats on the board of directors. In accordance with the accounting guidance, UK Wind was deconsolidated and a loss on deconsolidation of
$20 million
was recorded to
Gain (loss) on disposal and sale of businesses
in the Consolidated Statement of Operations to write off the Company’s non-controlling interest in the project. The UK Wind projects were reported in the Europe SBU reportable segment.
165
THE AES CORPORATION
NOTES TO CONSOLIDATED FINANCIAL STATEMENTS—(Continued)
DECEMBER 31, 2016, 2015, AND 2014
Accumulated Other Comprehensive Loss
— The changes in AOCL by component, net of tax and noncontrolling interests, for the periods indicated were as follows (in millions):
|
Foreign currency translation adjustment, net
|
Unrealized derivative losses, net
|
Unfunded pension obligations, net
|
Total
|
||||||||||||
|
Balance at December 31,2014
|
$
|
(2,595
|
)
|
$
|
(396
|
)
|
$
|
(295
|
)
|
$
|
(3,286
|
)
|
|||
|
Other comprehensive (loss) income before reclassifications
|
$
|
(674
|
)
|
$
|
(5
|
)
|
$
|
19
|
|
$
|
(660
|
)
|
|||
|
Amount reclassified to earnings
|
—
|
|
48
|
|
2
|
|
50
|
|
|||||||
|
Other comprehensive (loss) income
|
$
|
(674
|
)
|
$
|
43
|
|
$
|
21
|
|
$
|
(610
|
)
|
|||
|
Cumulative effect of a change in accounting principle
|
$
|
13
|
|
$
|
—
|
|
$
|
—
|
|
$
|
13
|
|
|||
|
Balance at December 31, 2015
|
$
|
(3,256
|
)
|
$
|
(353
|
)
|
$
|
(274
|
)
|
$
|
(3,883
|
)
|
|||
|
Other comprehensive (loss) income before reclassifications
|
$
|
117
|
|
$
|
2
|
|
$
|
(13
|
)
|
$
|
106
|
|
|||
|
Amount reclassified to earnings
|
992
|
|
28
|
|
1
|
|
1,021
|
|
|||||||
|
Other comprehensive (loss) income
|
$
|
1,109
|
|
$
|
30
|
|
$
|
(12
|
)
|
$
|
1,127
|
|
|||
|
Balance at December 31, 2016
|
$
|
(2,147
|
)
|
$
|
(323
|
)
|
$
|
(286
|
)
|
$
|
(2,756
|
)
|
|||
Reclassifications out of AOCL are presented in the following table. Amounts for the periods indicated are in millions and those in parenthesis indicate debits to the Condensed Consolidated Statements of Operations:
|
Details About
|
December 31,
|
|||||||||||||
|
AOCL Components
|
Affected Line Item in the Consolidated Statements of Operations
|
2016
|
2015
|
2014
|
||||||||||
|
Foreign currency translation adjustment, net
|
||||||||||||||
|
Gain on sale of businesses
|
$
|
—
|
|
$
|
—
|
|
$
|
4
|
|
|||||
|
Net loss from disposal and impairments of discontinued operations
|
(992
|
)
|
—
|
|
(38
|
)
|
||||||||
|
Net income attributable to The AES Corporation
|
$
|
(992
|
)
|
$
|
—
|
|
$
|
(34
|
)
|
|||||
|
Unrealized derivative gains (losses), net
|
||||||||||||||
|
Non-regulated revenue
|
$
|
111
|
|
$
|
43
|
|
$
|
30
|
|
|||||
|
Non-regulated cost of sales
|
(57
|
)
|
(14
|
)
|
(4
|
)
|
||||||||
|
Interest expense
|
(107
|
)
|
(112
|
)
|
(139
|
)
|
||||||||
|
Gain on sale of businesses
|
—
|
|
(4
|
)
|
—
|
|
||||||||
|
Foreign currency transaction gains (losses)
|
8
|
|
12
|
|
(9
|
)
|
||||||||
|
Income from continuing operations before taxes and equity in earnings of affiliates
|
(45
|
)
|
(75
|
)
|
(122
|
)
|
||||||||
|
Income tax expense
|
8
|
|
11
|
|
26
|
|
||||||||
|
Net equity in earnings of affiliates
|
—
|
|
(2
|
)
|
(3
|
)
|
||||||||
|
Income from continuing operations
|
(37
|
)
|
(66
|
)
|
(99
|
)
|
||||||||
|
Less: (Income) from continuing operations attributable to noncontrolling interests
|
9
|
|
18
|
|
27
|
|
||||||||
|
Net income attributable to The AES Corporation
|
$
|
(28
|
)
|
|
$
|
(48
|
)
|
$
|
(72
|
)
|
||||
|
Amortization of defined benefit pension actuarial loss, net
|
||||||||||||||
|
Regulated cost of sales
|
$
|
(17
|
)
|
$
|
(24
|
)
|
$
|
(32
|
)
|
|||||
|
Non-regulated cost of sales
|
—
|
|
2
|
|
(5
|
)
|
||||||||
|
General and administrative expenses
|
(1
|
)
|
(2
|
)
|
—
|
|
||||||||
|
Other Expense
|
(1
|
)
|
—
|
|
—
|
|
||||||||
|
Income from continuing operations before taxes and equity in earnings of affiliates
|
(19
|
)
|
|
(24
|
)
|
(37
|
)
|
|||||||
|
Income tax expense
|
3
|
|
9
|
|
7
|
|
||||||||
|
Income from continuing operations
|
(16
|
)
|
|
(15
|
)
|
(30
|
)
|
|||||||
|
Net loss from disposal and impairments of discontinued operations
|
6
|
|
(1
|
)
|
1
|
|
||||||||
|
Net Income
|
(10
|
)
|
(16
|
)
|
(29
|
)
|
||||||||
|
Less: (Income) from continuing operations attributable to noncontrolling interests
|
9
|
|
14
|
|
19
|
|
||||||||
|
Net income attributable to The AES Corporation
|
$
|
(1
|
)
|
|
$
|
(2
|
)
|
$
|
(10
|
)
|
||||
|
Total reclassifications for the period, net of income tax and noncontrolling interests
|
$
|
(1,021
|
)
|
|
$
|
(50
|
)
|
$
|
(116
|
)
|
||||
Common Stock Dividends
— The Company paid dividends of
$0.11
per outstanding share to its common stockholders during the first, second, third and fourth quarters of 2016 for dividends declared in December 2015, February, July, and October 2016.
On December 9, 2016, the Board of Directors declared a quarterly common stock dividend of
$0.12
per share payable on February 15, 2017 to shareholders of record at the close of business on February 1, 2017.
Stock Repurchase Program
— During the year ended
December 31, 2016
, the Company repurchased
8.7 million
shares of its common stock under the Program at a total cost of
$79 million
under the existing stock repurchase program. The cumulative repurchase from the commencement of the Program in July 2010 through December 31, 2016 totaled
154.3 million
shares for a total cost of
$1.9 billion
, at an average price per share of
$12.12
(including a nominal amount of commissions). As of
December 31, 2016
,
$246 million
remained available for repurchase under the Program.
166
THE AES CORPORATION
NOTES TO CONSOLIDATED FINANCIAL STATEMENTS—(Continued)
DECEMBER 31, 2016, 2015, AND 2014
The common stock repurchased has been classified as treasury stock and accounted for using the cost method. A total of
156,878,891
and
149,037,831
shares were held as treasury stock at
December 31, 2016
and
2015
, respectively. Restricted stock units under the Company's employee benefit plans are issued from treasury stock. The Company has not retired any common stock repurchased since it began the Program in July 2010.
16
. SEGMENTS AND GEOGRAPHIC INFORMATION
The segment reporting structure uses the Company's organizational structure as its foundation to reflect how the Company manages the businesses internally and is organized by geographic regions which provides a socio-political-economic understanding of our business. The management reporting structure is organized by
six
SBUs led by our President and Chief Executive Officer: US, Andes, Brazil, MCAC, Europe, and Asia SBUs. Using the accounting guidance on segment reporting, the Company determined that it has
six
operating and
six
reportable segments corresponding to its SBUs.
Corporate and Other
— Corporate overhead costs which are not directly associated with the operations of our
six
reportable segments are included in "Corporate and Other." Also included are certain intercompany charges such as self-insurance premiums which are fully eliminated in consolidation.
The Company uses Adjusted PTC as its primary segment performance measure. Adjusted PTC, a non-GAAP measure, is defined by the Company as pretax income from continuing operations attributable to AES excluding (1) unrealized gains or losses related to derivative transactions, (2) unrealized foreign currency gains or losses, (3) gains or losses due to dispositions and acquisitions of business interests, (4) losses due to impairments, and (5) costs due to the early retirement of debt. The Company has concluded that Adjusted PTC best reflects the underlying business performance of the Company and is the most relevant measure considered in the Company's internal evaluation of the financial performance of its segments. Additionally, given its large number of businesses and complexity, the Company concluded that Adjusted PTC is a more transparent measure that better assists investors in determining which businesses have the greatest impact on the Company's results.
Revenue and Adjusted PTC are presented before inter-segment eliminations, which includes the effect of intercompany transactions with other segments except for interest, charges for certain management fees, and the write-off of intercompany balances, as applicable. All intra-segment activity has been eliminated within the segment. Inter-segment activity has been eliminated within the total consolidated results.
The following tables present financial information by segment for the periods indicated (in millions):
|
Total Revenue
|
|||||||||||
|
Year Ended December 31,
|
2016
|
2015
|
2014
|
||||||||
|
US SBU
|
$
|
3,429
|
|
$
|
3,593
|
|
$
|
3,826
|
|
||
|
Andes SBU
|
2,506
|
|
2,489
|
|
2,642
|
|
|||||
|
Brazil SBU
|
3,755
|
|
3,858
|
|
4,987
|
|
|||||
|
MCAC SBU
|
2,172
|
|
2,353
|
|
2,682
|
|
|||||
|
Europe SBU
|
918
|
|
1,191
|
|
1,439
|
|
|||||
|
Asia SBU
|
752
|
|
684
|
|
558
|
|
|||||
|
Corporate and Other
|
77
|
|
31
|
|
15
|
|
|||||
|
Eliminations
|
(23
|
)
|
(44
|
)
|
(25
|
)
|
|||||
|
Total Revenue
|
$
|
13,586
|
|
$
|
14,155
|
|
$
|
16,124
|
|
||
|
Reconciliation from Income from Continuing Operations before Taxes and Equity In Earnings of Affiliates:
|
Total Adjusted PTC
|
||||||||||
|
Year Ended December 31,
|
2016
|
2015
|
2014
|
||||||||
|
Income from continuing operations before taxes and equity in earnings of affiliates
|
$
|
137
|
|
$
|
1,154
|
|
$
|
1,443
|
|
||
|
Add: Net equity earnings in affiliates
|
36
|
|
105
|
|
19
|
|
|||||
|
Less: Income from continuing operations before taxes, attributable to noncontrolling interests
|
313
|
|
653
|
|
578
|
|
|||||
|
Pretax contribution
|
(140
|
)
|
606
|
|
884
|
|
|||||
|
Unrealized derivative (gains) losses
|
(9
|
)
|
(166
|
)
|
(135
|
)
|
|||||
|
Unrealized foreign currency losses
|
23
|
|
96
|
|
110
|
|
|||||
|
Disposition/acquisition (gains) losses
|
6
|
|
(42
|
)
|
(361
|
)
|
|||||
|
Impairment losses
|
933
|
|
504
|
|
415
|
|
|||||
|
Loss on extinguishment of debt
|
29
|
|
179
|
|
274
|
|
|||||
|
Total Adjusted PTC
|
$
|
842
|
|
$
|
1,177
|
|
$
|
1,187
|
|
||
167
THE AES CORPORATION
NOTES TO CONSOLIDATED FINANCIAL STATEMENTS—(Continued)
DECEMBER 31, 2016, 2015, AND 2014
|
Total Adjusted PTC
|
|||||||||||
|
Year Ended December 31,
|
2016
|
2015
|
2014
|
||||||||
|
US SBU
|
$
|
347
|
|
$
|
360
|
|
$
|
445
|
|
||
|
Andes SBU
|
390
|
|
482
|
|
421
|
|
|||||
|
Brazil SBU
|
29
|
|
118
|
|
108
|
|
|||||
|
MCAC SBU
|
267
|
|
327
|
|
352
|
|
|||||
|
Europe SBU
|
187
|
|
235
|
|
348
|
|
|||||
|
Asia SBU
|
96
|
|
96
|
|
46
|
|
|||||
|
Corporate and Other
|
(474
|
)
|
(441
|
)
|
(533
|
)
|
|||||
|
Total Adjusted PTC
|
$
|
842
|
|
$
|
1,177
|
|
$
|
1,187
|
|
||
|
Total Assets
|
Depreciation and Amortization
|
Capital Expenditures
|
|||||||||||||||||||||||||||||||||
|
Year Ended December 31,
|
2016
|
2015
|
2014
|
2016
|
2015
|
2014
|
2016
|
2015
|
2014
|
||||||||||||||||||||||||||
|
US SBU
|
$
|
9,333
|
|
$
|
9,800
|
|
$
|
10,019
|
|
$
|
471
|
|
$
|
443
|
|
$
|
450
|
|
$
|
809
|
|
$
|
861
|
|
$
|
534
|
|
||||||||
|
Andes SBU
|
8,971
|
|
8,594
|
|
7,741
|
|
218
|
|
175
|
|
182
|
|
538
|
|
949
|
|
702
|
|
|||||||||||||||||
|
Brazil SBU
|
6,448
|
|
5,209
|
|
6,830
|
|
145
|
|
145
|
|
210
|
|
264
|
|
224
|
|
317
|
|
|||||||||||||||||
|
MCAC SBU
|
5,162
|
|
4,820
|
|
4,924
|
|
165
|
|
155
|
|
144
|
|
480
|
|
201
|
|
192
|
|
|||||||||||||||||
|
Europe SBU
|
2,664
|
|
3,101
|
|
3,491
|
|
116
|
|
134
|
|
154
|
|
143
|
|
118
|
|
228
|
|
|||||||||||||||||
|
Asia SBU
|
3,113
|
|
3,099
|
|
2,883
|
|
33
|
|
32
|
|
32
|
|
136
|
|
13
|
|
429
|
|
|||||||||||||||||
|
Assets of discontinued operations and held-for-sale businesses
|
—
|
|
1,306
|
|
1,603
|
|
16
|
|
40
|
|
49
|
|
70
|
|
75
|
|
112
|
|
|||||||||||||||||
|
Corporate and Other
|
428
|
|
541
|
|
1,071
|
|
12
|
|
20
|
|
24
|
|
18
|
|
17
|
|
30
|
|
|||||||||||||||||
|
Total
|
$
|
36,119
|
|
$
|
36,470
|
|
$
|
38,562
|
|
$
|
1,176
|
|
$
|
1,144
|
|
$
|
1,245
|
|
$
|
2,458
|
|
$
|
2,458
|
|
$
|
2,544
|
|
||||||||
|
Interest Income
|
Interest Expense
|
||||||||||||||||||||||
|
Year Ended December 31,
|
2016
|
2015
|
2014
|
2016
|
2015
|
2014
|
|||||||||||||||||
|
US SBU
|
$
|
—
|
|
$
|
—
|
|
$
|
—
|
|
$
|
236
|
|
$
|
262
|
|
$
|
285
|
|
|||||
|
Andes SBU
|
57
|
|
77
|
|
87
|
|
178
|
|
154
|
|
160
|
|
|||||||||||
|
Brazil SBU
|
257
|
|
235
|
|
204
|
|
365
|
|
257
|
|
311
|
|
|||||||||||
|
MCAC SBU
|
11
|
|
30
|
|
26
|
|
163
|
|
179
|
|
178
|
|
|||||||||||
|
Europe SBU
|
5
|
|
1
|
|
1
|
|
68
|
|
73
|
|
98
|
|
|||||||||||
|
Asia SBU
|
134
|
|
115
|
|
2
|
|
111
|
|
85
|
|
25
|
|
|||||||||||
|
Corporate and Other
|
—
|
|
2
|
|
—
|
|
310
|
|
334
|
|
394
|
|
|||||||||||
|
Total
|
$
|
464
|
|
$
|
460
|
|
$
|
320
|
|
$
|
1,431
|
|
$
|
1,344
|
|
$
|
1,451
|
|
|||||
|
Investments in and Advances to Affiliates
|
Net Equity in Earnings of Affiliates
|
||||||||||||||||||||||
|
Year Ended December 31,
|
2016
|
2015
|
2014
|
2016
|
2015
|
2014
|
|||||||||||||||||
|
US SBU
|
$
|
23
|
|
$
|
1
|
|
$
|
1
|
|
$
|
9
|
|
$
|
—
|
|
$
|
—
|
|
|||||
|
Andes SBU
|
363
|
|
345
|
|
287
|
|
15
|
|
83
|
|
42
|
|
|||||||||||
|
Brazil SBU
|
—
|
|
—
|
|
—
|
|
—
|
|
—
|
|
—
|
|
|||||||||||
|
MCAC SBU
|
(1
|
)
|
—
|
|
—
|
|
(2
|
)
|
—
|
|
—
|
|
|||||||||||
|
Europe SBU
|
41
|
|
53
|
|
54
|
|
10
|
|
10
|
|
(25
|
)
|
|||||||||||
|
Asia SBU
|
195
|
|
195
|
|
194
|
|
3
|
|
8
|
|
10
|
|
|||||||||||
|
Corporate and Other
|
—
|
|
16
|
|
1
|
|
1
|
|
4
|
|
(8
|
)
|
|||||||||||
|
Total
|
$
|
621
|
|
$
|
610
|
|
$
|
537
|
|
$
|
36
|
|
$
|
105
|
|
$
|
19
|
|
|||||
168
THE AES CORPORATION
NOTES TO CONSOLIDATED FINANCIAL STATEMENTS—(Continued)
DECEMBER 31, 2016, 2015, AND 2014
The following table presents information, by country, about the Company's consolidated operations for each of the three years ended
December 31, 2016
,
2015
, and
2014
, and as of
December 31, 2016
and
2015
(in millions). Revenue is recorded in the country in which it is earned and assets are recorded in the country in which they are located.
|
Total Revenue
|
Property, Plant & Equipment, net
|
||||||||||||||||||
|
Year Ended December 31,
|
2016
|
2015
|
2014
|
2016
|
2015
|
||||||||||||||
|
United States
|
$
|
3,489
|
|
$
|
3,597
|
|
$
|
3,828
|
|
$
|
7,397
|
|
$
|
7,957
|
|
||||
|
Non-U.S.:
|
|||||||||||||||||||
|
Brazil
|
3,755
|
|
3,858
|
|
4,987
|
|
3,221
|
|
2,582
|
|
|||||||||
|
Chile
|
1,707
|
|
1,523
|
|
1,624
|
|
4,995
|
|
4,591
|
|
|||||||||
|
Dominican Republic
|
614
|
|
632
|
|
802
|
|
914
|
|
781
|
|
|||||||||
|
El Salvador
|
601
|
|
736
|
|
832
|
|
327
|
|
313
|
|
|||||||||
|
Colombia
|
437
|
|
557
|
|
552
|
|
451
|
|
445
|
|
|||||||||
|
Philippines
|
401
|
|
406
|
|
451
|
|
866
|
|
735
|
|
|||||||||
|
Argentina
|
359
|
|
399
|
|
463
|
|
195
|
|
193
|
|
|||||||||
|
Mexico
|
342
|
|
383
|
|
434
|
|
699
|
|
716
|
|
|||||||||
|
Vietnam
|
340
|
|
233
|
|
—
|
|
1
|
|
2
|
|
|||||||||
|
United Kingdom
|
337
|
|
396
|
|
533
|
|
151
|
|
190
|
|
|||||||||
|
Bulgaria
|
334
|
|
382
|
|
410
|
|
1,174
|
|
1,259
|
|
|||||||||
|
Panama
|
312
|
|
297
|
|
263
|
|
1,233
|
|
1,027
|
|
|||||||||
|
Puerto Rico
|
301
|
|
302
|
|
348
|
|
583
|
|
599
|
|
|||||||||
|
Jordan
|
136
|
|
248
|
|
262
|
|
452
|
|
469
|
|
|||||||||
|
Kazakhstan
|
103
|
|
155
|
|
161
|
|
178
|
|
146
|
|
|||||||||
|
Sri Lanka
|
10
|
|
45
|
|
107
|
|
—
|
|
—
|
|
|||||||||
|
Other Non-U.S.
|
8
|
|
6
|
|
67
|
|
10
|
|
17
|
|
|||||||||
|
Total Non-U.S.
|
10,097
|
|
10,558
|
|
12,296
|
|
15,450
|
|
14,065
|
|
|||||||||
|
Total
|
$
|
13,586
|
|
$
|
14,155
|
|
$
|
16,124
|
|
$
|
22,847
|
|
$
|
22,022
|
|
||||
17
. SHARE-BASED COMPENSATION
STOCK OPTIONS
— AES grants options to purchase shares of common stock under stock option plans to employees and non-employee directors. Under the terms of the plans, the Company may issue options to purchase shares of the Company's common stock at a price equal to
100%
of the market price at the date the option is granted. Stock options are generally granted based upon a percentage of an employee's base salary. Stock options issued in
2015
and
2014
have a
three
-year vesting schedule and vest in one-third increments over the
three
-year period. The stock options have a contractual term of
ten
years. The Company did not issue stock options in 2016. At December 31,
2016
, approximately
16 million
shares were remaining for award under the plans. In all circumstances, stock options granted by AES do not entitle the holder the right, or obligate AES, to settle the stock option in cash or other assets of AES.
The following table presents the weighted average fair value of each option grant and the underlying weighted average assumptions, as of the grant date, using the Black-Scholes option-pricing model:
|
December 31,
|
2015
|
2014
|
||||||
|
Expected volatility
|
25
|
%
|
24
|
%
|
||||
|
Expected annual dividend yield
|
3
|
%
|
1
|
%
|
||||
|
Expected option term (years)
|
7
|
|
6
|
|
||||
|
Risk-free interest rate
|
1.86
|
%
|
1.86
|
%
|
||||
|
Fair value at grant date
|
$
|
2.07
|
|
$
|
3.26
|
|
||
The Company does not discount the grant date fair values to estimate post-vesting restrictions. Post-vesting restrictions include black-out periods when the employee is not able to exercise stock options based on their potential knowledge of information prior to the release of that information to the public.
169
THE AES CORPORATION
NOTES TO CONSOLIDATED FINANCIAL STATEMENTS—(Continued)
DECEMBER 31, 2016, 2015, AND 2014
The Company initially recognizes compensation cost on the estimated number of instruments for which the requisite service is expected to be rendered. The following table summarizes the components of stock-based compensation related to employee stock options recognized in the Company's consolidated financial statements (in millions):
|
December 31,
|
2016
|
2015
|
2014
|
|||||||||
|
Pretax compensation expense
|
$
|
2
|
|
$
|
3
|
|
$
|
3
|
|
|||
|
Tax benefit
|
(1
|
)
|
(1
|
)
|
(1
|
)
|
||||||
|
Stock options expense, net of tax
|
$
|
1
|
|
$
|
2
|
|
$
|
2
|
|
|||
|
Total intrinsic value of options exercised
|
$
|
—
|
|
$
|
1
|
|
$
|
1
|
|
|||
|
Total fair value of options vested
|
3
|
|
3
|
|
2
|
|
||||||
|
Cash received from the exercise of stock options
|
1
|
|
5
|
|
3
|
|
||||||
No
cash was used to settle stock options or compensation cost capitalized as part of the cost of an asset for the years ended December 31,
2016
,
2015
and
2014
. As of December 31,
2016
, total unrecognized compensation cost related to stock options of
$1 million
is expected to be recognized over a weighted average period of
1
year.
A summary of the option activity for the year ended December 31,
2016
follows (number of options in thousands, dollars in millions except per option amounts):
|
Options
|
Weighted Average Exercise Price
|
Weighted Average Remaining Contractual Term (in years)
|
Aggregate Intrinsic Value
|
||||||||||
|
Outstanding at December 31, 2015
|
7,155
|
|
$
|
13.81
|
|
||||||||
|
Exercised
|
(127
|
)
|
11.00
|
|
|||||||||
|
Forfeited and expired
|
(700
|
)
|
17.70
|
|
|||||||||
|
Outstanding at December 31, 2016
|
6,328
|
|
$
|
13.43
|
|
5.5
|
$
|
2
|
|
||||
|
Vested and expected to vest at December 31, 2016
|
6,200
|
|
$
|
13.46
|
|
5.5
|
$
|
2
|
|
||||
|
Eligible for exercise at December 31, 2016
|
4,810
|
|
$
|
13.72
|
|
4.8
|
$
|
2
|
|
||||
The aggregate intrinsic value in the table above represents the total pre-tax intrinsic value (the difference between the Company's closing stock price on the last trading day of
2016
and the exercise price, multiplied by the number of in-the-money options) that would have been received by the option holders had all option holders exercised their options on December 31,
2016
. The amount of the aggregate intrinsic value will change based on the fair market value of the Company's stock.
RESTRICTED STOCK
Restricted Stock Units
— The Company issues restricted stock units ("RSUs") under its long-term compensation plan. The RSUs are generally granted based upon a percentage of the participant's base salary. The units have a
three
-year vesting schedule and vest in one-third increments over the
three
-year period. Units granted prior to 2011 are required to be held for an additional
two
years before they can be converted into shares, and thus become transferable. There is no such requirement for units granted in 2011 and afterwards. In all circumstances, restricted stock units granted by AES do not entitle the holder the right, or obligate AES, to settle the restricted stock unit in cash or other assets of AES.
For the years ended December 31,
2016
,
2015
, and
2014
, RSUs issued had a grant date fair value equal to the closing price of the Company's stock on the grant date. The Company does not discount the grant date fair values to reflect any post-vesting restrictions. RSUs granted to employees during the years ended December 31,
2016
,
2015
, and
2014
had grant date fair values per RSU of
$9.42
,
$12.03
and
$14.60
, respectively.
The following table summarizes the components of the Company's stock-based compensation related to its employee RSUs recognized in the Company's consolidated financial statements (in millions):
|
December 31,
|
2016
|
2015
|
2014
|
|||||||||
|
RSU expense before income tax
|
$
|
14
|
|
$
|
13
|
|
$
|
12
|
|
|||
|
Tax benefit
|
(4
|
)
|
(3
|
)
|
(3
|
)
|
||||||
|
RSU expense, net of tax
|
$
|
10
|
|
$
|
10
|
|
$
|
9
|
|
|||
|
Total value of RSUs converted
(1)
|
$
|
7
|
|
$
|
16
|
|
$
|
25
|
|
|||
|
Total fair value of RSUs vested
|
$
|
13
|
|
$
|
12
|
|
$
|
13
|
|
|||
_____________________________
|
(1)
|
Amount represents fair market value on the date of conversion.
|
There was no cash used to settle RSUs or compensation cost capitalized as part of the cost of an asset for the years ended December 31,
2016
,
2015
, and
2014
. As of December 31,
2016
, total unrecognized compensation cost related to RSUs of
$17 million
is expected to be recognized over a weighted average period of approximately
1.8
years. There were no modifications to RSU awards during the year ended December 31,
2016
.
170
THE AES CORPORATION
NOTES TO CONSOLIDATED FINANCIAL STATEMENTS—(Continued)
DECEMBER 31, 2016, 2015, AND 2014
A summary of the activity of RSUs for the year ended December 31,
2016
follows (RSUs in thousands):
|
RSUs
|
Weighted Average Grant Date Fair Values
|
Weighted Average Remaining Vesting Term
|
|||||||
|
Nonvested at December 31, 2015
|
2,392
|
|
$
|
12.55
|
|
||||
|
Vested
|
(1,063
|
)
|
12.43
|
|
|||||
|
Forfeited and expired
|
(256
|
)
|
10.91
|
|
|||||
|
Granted
|
1,964
|
|
9.42
|
|
|||||
|
Nonvested at December 31, 2016
|
3,037
|
|
$
|
10.70
|
|
1.7
|
|||
|
Vested and expected to vest at December 31, 2016
|
2,716
|
|
$
|
10.76
|
|
||||
The Company initially recognizes compensation cost on the estimated number of instruments for which the requisite service is expected to be rendered. In
2016
, AES has estimated a weighted average forfeiture rate of
11.54%
for RSUs granted in
2016
. This estimate will be revised if subsequent information indicates that the actual number of instruments forfeited is likely to differ from previous estimates. Based on the estimated forfeiture rate, the Company expects to expense
$16 million
on a straight-line basis over a
three
year period related to RSUs granted during the year ended December 31,
2016
.
The following table summarizes the RSUs that vested and were converted during the periods indicated (RSUs in thousands):
|
Years Ended December 31,
|
2016
|
2015
|
2014
|
||||||
|
RSUs vested during the year
|
1,063
|
|
954
|
|
1,037
|
|
|||
|
RSUs converted during the year, net of shares withheld for taxes
|
705
|
|
1,238
|
|
1,734
|
|
|||
|
Shares withheld for taxes
|
358
|
|
549
|
|
796
|
|
|||
Performance Stock Units
— In 2015 and 2014, the Company issued performance stock units ("PSUs") to officers under its long-term compensation plan. PSUs are restricted stock units of which
50%
of the units awarded include a market condition and the remaining
50%
include a performance condition. Vesting will occur if the applicable continued employment conditions are satisfied and (a) for the units subject to the market condition the total stockholder return on AES common stock exceeds the total stockholder return of the Standard and Poor's 500 Utilities Sector Index over the
three
-year measurement period beginning on January 1 of the grant year and ending on December 31 of the third year and (b) for the units subject to the performance condition if the Company's actual Adjusted EBITDA meets the performance target over the
three
-year measurement period beginning on January 1 of the grant year and ending on December 31 of the third year. The market and performance conditions determine the vesting and final share equivalent per PSU and can result in earning an award payout range of
0%
to
200%
, depending on the achievement. PSUs that included a market condition granted during the year ended December 31,
2015
, and
2014
had a grant date fair value per PSU of
$8.22
and
$15.19
, respectively.
In 2016, the Company issued PSUs to officers under its long-term compensation plan. Vesting will occur if the Company achieves its Proportional Free Cash Flow target over the three-year performance period beginning on January 1 of the grant year and ending on December 31 of the third year. The PSUs issued to officers in 2016 had a grant date fair value of
$9.41
equal to the closing price of the Company's stock on the grant date. The grant date fair value is estimated at
100%
of the company's closing stock price. The company believes that it's probable that the performance condition will be met and will continue to be evaluated throughout the performance period.
In all circumstances, PSUs granted by AES do not entitle the holder the right, or obligate AES, to settle the restricted stock unit in cash or other assets of AES.
The following table summarizes the components of the Company's stock-based compensation related to its PSUs recognized in the Company's consolidated financial statements (in millions):
|
December 31,
|
2016
|
2015
|
2014
|
|||||||||
|
PSU expense before income tax
|
$
|
6
|
|
$
|
5
|
|
$
|
6
|
|
|||
|
Tax benefit
|
(2
|
)
|
(1
|
)
|
(2
|
)
|
||||||
|
PSU expense, net of tax
|
$
|
4
|
|
|
$
|
4
|
|
|
$
|
4
|
|
|
|
Total value of PSUs converted
(1)
|
$
|
1
|
|
$
|
1
|
|
$
|
4
|
|
|||
|
Total fair value of PSUs vested
|
$
|
3
|
|
$
|
3
|
|
$
|
1
|
|
|||
_____________________________
|
(1)
|
Amount represents fair market value on the date of conversion.
|
There was no cash used to settle PSUs or compensation cost capitalized as part of the cost of an asset for the years ended December 31,
2016
,
2015
, and
2014
. As of December 31,
2016
total unrecognized compensation cost
171
THE AES CORPORATION
NOTES TO CONSOLIDATED FINANCIAL STATEMENTS—(Continued)
DECEMBER 31, 2016, 2015, AND 2014
related to PSUs of
$7 million
is expected to be recognized over a weighted average period of approximately
1.8
years. There were no modifications to PSU awards during the year ended December 31,
2016
.
A summary of the activity of PSUs for the year ended December 31,
2016
follows (PSUs in thousands):
|
PSUs
|
Weighted Average Grant Date Fair Values
|
Weighted Average Remaining Vesting Term
|
|||||||
|
Nonvested at December 31, 2015
|
1,551
|
|
$
|
12.16
|
|
||||
|
Vested
|
(231
|
)
|
12.23
|
|
|||||
|
Forfeited and expired
|
(308
|
)
|
12.28
|
|
|||||
|
Granted
|
697
|
|
9.41
|
|
|||||
|
Nonvested at December 31, 2016
|
1,709
|
|
$
|
11.01
|
|
1.3
|
|||
|
Vested and expected to vest at December 31, 2016
|
1,449
|
|
$
|
10.39
|
|
||||
The Company initially recognizes compensation cost on the estimated number of instruments for which the requisite service is expected to be rendered. In
2016
, AES has estimated a forfeiture rate of
12.28%
for PSUs granted in 2016. This estimate will be revised if subsequent information indicates that the actual number of instruments forfeited is likely to differ from previous estimates. Based on the estimated forfeiture rate, the Company expects to expense
$6 million
on a straight-line basis over a
three
year period (approximately
$2 million
per year) related to PSUs granted during the year ended December 31,
2016
.
The following table summarizes the PSUs that vested and were converted during the periods indicated (PSUs in thousands):
|
Years Ended December 31,
|
2016
|
2015
|
2014
|
||||||
|
PSUs vested during the year
|
231
|
|
161
|
|
85
|
|
|||
|
PSUs converted during the year, net of shares withheld for taxes
|
141
|
|
96
|
|
287
|
|
|||
|
Shares withheld for taxes
|
90
|
|
65
|
|
141
|
|
|||
OTHER SHARE-BASED AWARDS
Performance Cash Units
- In
2016
, the Company issued Performance Cash Units ("PCUs") to its officers under its long-term compensation plan. The value of these units depends on the total stockholder return on AES common stock as compared to the total stockholder return of the Standard and Poor's 500 Utilities Sector Index, Standard and Poor's 500 Index and MSCI Emerging Market Index over a
three
-year measurement period beginning on January 1 of the grant year and ending on December 31 of the third year. Since PCUs are settled in cash, they qualify for liability accounting and periodic measurement is required. As of December 31, 2016, each PCU is valued at
$1.04
per unit. The Company expects to expense
$7 million
on a straight-line basis over a three year period (approximately
$2 million
per year) related to these PCUs.
18
. REDEEMABLE STOCK OF SUBSIDIARIES
The following table is a reconciliation of changes in redeemable stock of subsidiaries (in millions):
|
December 31,
|
2016
|
2015
|
|||||
|
Balance at the beginning of the period
|
$
|
538
|
|
$
|
78
|
|
|
|
Sale of redeemable stock of subsidiaries
|
134
|
|
460
|
|
|||
|
Contributions from holders of redeemable stock of subsidiaries
|
130
|
|
—
|
|
|||
|
Net loss attributable to redeemable stock of subsidiaries
|
(11
|
)
|
—
|
|
|||
|
Fair value adjustment recorded to retained earnings
(1)
|
4
|
|
—
|
|
|||
|
Other comprehensive income attributable to redeemable stock of subsidiaries
|
6
|
|
—
|
|
|||
|
Acquisition and reclassification of stock of subsidiaries
|
(19
|
)
|
—
|
|
|||
|
Balance at the end of the period
|
$
|
782
|
|
$
|
538
|
|
|
_____________________________
|
(1)
|
$5 million
increase in fair value of DP&L preferred shares offset by
$1 million
decrease in fair value of Colon common stock.
|
172
THE AES CORPORATION
NOTES TO CONSOLIDATED FINANCIAL STATEMENTS
DECEMBER 31, 2016, 2015, AND 2014
The following table summarizes the Company's redeemable stock of subsidiaries balances as of the periods indicated (in millions):
|
December 31,
|
2016
|
2015
|
||||||
|
IPALCO common stock
|
$
|
618
|
|
$
|
460
|
|
||
|
Colon quotas
(1)
|
100
|
|
—
|
|
||||
|
IPL preferred stock
|
60
|
|
60
|
|
||||
|
Other common stock
|
4
|
|
—
|
|
||||
|
DPL preferred stock
|
—
|
|
18
|
|
||||
|
Total redeemable stock of subsidiaries
|
$
|
782
|
|
$
|
538
|
|
||
_____________________________
|
(1)
|
Characteristics of quotas are similar to common stock.
|
Colon
— During the year ended December 31,
2016
, our partner in Colon increased their ownership from
25%
to
49.9%
and made capital contributions of
$106 million
. Any subsequent adjustments to allocate earnings and dividends to our partner, or measure the investment at fair value, will be classified as temporary equity each reporting period as it is probable that the shares will become redeemable.
IPL
— IPL had
$60 million
of cumulative preferred stock outstanding at December 31,
2016
and
2015
, which represented
five
series of preferred stock. The total annual dividend requirements were approximately
$3 million
at December 31,
2016
and
2015
. Certain series of the preferred stock were redeemable solely at the option of the issuer at prices between
$100
and
$118
per share. Holders of the preferred stock are entitled to elect a majority of IPL's board of directors if IPL has not paid dividends to its preferred stockholders for
four
consecutive quarters. Based on the preferred stockholders' ability to elect a majority of IPL's board of directors in this circumstance, the redemption of the preferred shares is considered to be not solely within the control of the issuer and the preferred stock is considered temporary equity.
DPL
— DPL had
$18 million
of cumulative preferred stock outstanding as of December 31,
2015
, which represented
three
series of preferred stock issued by DP&L, a wholly-owned subsidiary of DPL. The DP&L preferred stock was redeemable at DP&L's option as determined by its board of directors at per-share redemption prices between
$101
and
$103
per share, plus cumulative preferred dividends. In addition, DP&L's Amended Articles of Incorporation contained provisions that permitted preferred stockholders to elect members of the DP&L Board of Directors in the event that cumulative dividends on the preferred stock are in arrears in an aggregate amount equivalent to at least
four
full quarterly dividends. Based on the preferred stockholders' ability to elect members of DP&L's board of directors in this circumstance, the redemption of the preferred shares was considered to be not solely within the control of the issuer and the preferred stock was considered temporary equity.
In September 2016, it became probable that the preferred shares would become redeemable. As such, the Company recorded an adjustment of
$5 million
to retained earnings to adjust the preferred shares to their redemption value of
$23 million
. In October 2016, DP&L redeemed all of its preferred shares. Upon redemption, the preferred shares were no longer outstanding and all rights of the holders thereof as shareholders of DP&L ceased to exist.
IPALCO
— In February 2015, CDPQ purchased
15%
of AES US Investment, Inc., a wholly-owned subsidiary that owns
100%
of IPALCO, for
$247 million
, with an option to invest an additional
$349 million
in IPALCO through 2016 in exchange for a
17.65%
equity stake. In April 2015, CDPQ invested an additional
$214 million
in IPALCO, which resulted in CDPQ's combined direct and indirect interest in IPALCO of
24.90%
. As a result of these transactions,
$84 million
in taxes and transaction costs were recognized as a net decrease to equity. The Company also recognized an increase to additional paid-in capital and a reduction to retained earnings of
377 million
for the excess of the fair value of the shares over their book value.
No
gain or loss was recognized in net income as the transaction was not considered to be a sale of in-substance real estate.
In March 2016, CDPQ exercised its remaining option by investing
$134 million
in IPALCO, which resulted in CDPQ's combined direct and indirect interest in IPALCO of
30%
. The Company also recognized an increase to additional paid-in capital and a reduction to retained earnings of
$84 million
for the excess of the fair value of the shares over their book value. In June 2016, CDPQ contributed an additional
$24 million
to IPALCO, with no impact to the ownership structure of the investment. Any subsequent adjustments to allocate earnings and dividends to CDPQ will be classified as NCI within permanent equity as it is not probable that the shares will become redeemable.
173
THE AES CORPORATION
NOTES TO CONSOLIDATED FINANCIAL STATEMENTS—(Continued)
DECEMBER 31, 2016, 2015, AND 2014
19
. OTHER INCOME AND EXPENSE
Other Income
— Other income generally includes gains on asset sales and liability extinguishments, favorable judgments on contingencies, gains on contract terminations, allowance for funds used during construction and other income from miscellaneous transactions. The components are summarized as follows (in millions):
|
Years Ended December 31,
|
2016
|
2015
|
2014
|
||||||||
|
Allowance for Funds Used During Construction (US Utilities)
|
$
|
29
|
|
$
|
17
|
|
$
|
9
|
|
||
|
Gain on sale of assets
|
5
|
|
19
|
|
66
|
|
|||||
|
Contract termination
|
—
|
|
20
|
|
—
|
|
|||||
|
Contingency reversal
|
—
|
|
—
|
|
18
|
|
|||||
|
Other
|
31
|
|
26
|
|
28
|
|
|||||
|
Total other income
|
$
|
65
|
|
$
|
82
|
|
$
|
121
|
|
||
Other Expense
— Other expense generally includes losses on asset sales and dispositions, losses on legal contingencies, and losses from other miscellaneous transactions. The components are summarized as follows (in millions):
|
Years Ended December 31,
|
2016
|
2015
|
2014
|
||||||||
|
Allowance for other receivables
(1)
|
$
|
52
|
|
$
|
—
|
|
$
|
—
|
|
||
|
Loss on sale and disposal of assets
|
38
|
|
31
|
|
46
|
|
|||||
|
Water rights write-off
|
6
|
|
10
|
|
—
|
|
|||||
|
Legal contingencies and settlements
|
3
|
|
9
|
|
11
|
|
|||||
|
Other
|
4
|
|
8
|
|
8
|
|
|||||
|
Total other expense
|
$
|
103
|
|
$
|
58
|
|
$
|
65
|
|
||
_____________________________
|
(1)
|
During the fourth quarter of 2016, we recognized a full allowance on a non-trade receivable in the MCAC SBU as a result of payment delays and discussions with the counterparty. The allowance relates to certain reimbursements the Company was expecting in connection with a legal matter. Management believes the counterparty is obligated to pay and plans to continue to attempt to fully collect the non-trade receivable.
|
20
. ASSET IMPAIRMENT EXPENSE
|
Years ended December 31,
(in millions)
|
2016
|
2015
|
2014
|
|||||||||
|
DPL
|
$
|
859
|
|
$
|
—
|
|
$
|
—
|
|
|||
|
Buffalo Gap II
|
159
|
|
—
|
|
—
|
|
||||||
|
Buffalo Gap I
|
77
|
|
—
|
|
—
|
|
||||||
|
Kilroot
|
—
|
|
121
|
|
—
|
|
||||||
|
Buffalo Gap III
|
—
|
|
116
|
|
—
|
|
||||||
|
U.K. Wind
|
—
|
|
37
|
|
12
|
|
||||||
|
Ebute
|
—
|
|
—
|
|
67
|
|
||||||
|
East Bend (DP&L)
|
—
|
|
—
|
|
12
|
|
||||||
|
Other
|
1
|
|
11
|
|
—
|
|
||||||
|
Total asset impairment expense
|
$
|
1,096
|
|
$
|
285
|
|
$
|
91
|
|
|||
Buffalo Gap I
— During 2016, the Company tested the recoverability of its long-lived assets at Buffalo Gap I. Low wind production during 2016 resulted in management lowering future expectations of production and therefore future forecasted revenues. As such this was determined to be an impairment indicator. The Company determined that the carrying amount of the asset group was not recoverable. The Buffalo Gap I asset group was determined to have a fair value of
$36 million
using the income approach. As a result, the Company recognized an asset impairment expense of
$77 million
(
$23 million
attributable to AES). Buffalo Gap I is reported in the US SBU reportable segment.
DPL
— During the second quarter of 2016, the Company tested the recoverability of its long-lived generation assets at DPL. Uncertainty created by the Supreme Court of Ohio’s June 20, 2016 opinion regarding ESP 2, lower expectations of future revenue resulting from the most recent PJM capacity auction, and higher anticipated environmental compliance costs resulting from third party studies were collectively determined to be an impairment indicator for these assets. The Company performed a long-lived asset impairment analysis and determined that the carrying amount of Killen, a coal-fired generation facility, and certain DPL peaking generation facilities were not recoverable. The Killen and DPL peaking generation asset groups were determined to have a fair value of
$84 million
and
$5 million
, respectively, using the income approach. As a result, the Company recognized a total asset impairment expense of
$235 million
. DPL is reported in the US SBU reportable segment.
During the fourth quarter of 2016, the Company tested the recoverability of its long-lived coal-fired generation assets and one gas-fired peaking plant at DPL. Additional uncertainty around the useful life of Stuart and Killen
174
THE AES CORPORATION
NOTES TO CONSOLIDATED FINANCIAL STATEMENTS—(Continued)
DECEMBER 31, 2016, 2015, AND 2014
related to the Company’s ESP proceedings, along with lower expected forward dark spreads and capacity prices, were collectively determined to be an impairment indicator for these assets. Market information indicating that there was a significant decrease in the fair value of Zimmer and Miami Fort was determined to be an indicator of impairment for these assets. The lower forward dark spreads and capacity prices, along with the indicators at the other coal-fired facilities, collectively, resulted in an indicator of impairment for the Conesville asset group. For the gas-fired peaking plant, significant incremental capital expenditures relative to its fair value, and an impairment charge taken at this facility in Q2 2016, were collectively determined to be impairment indicators for this asset. The Company performed a long-lived asset impairment analysis for each of these asset groups and determined that their carrying amounts were not recoverable. The Stuart, Killen, Miami Fort, Zimmer, Conesville and the gas-fired peaking plant asset groups were determined to have a fair value of
$57 million
,
$43 million
,
$36 million
,
$24 million
,
$1 million
and
$2 million
, respectively, using the market approach for Miami Fort and Zimmer and the income approach for the remaining asset groups. As a result, the Company recognized a total pre-tax asset impairment expense of
$624 million
. DPL is reported in the US SBU reportable segment.
Buffalo Gap II
— During 2016, the Company tested the recoverability of its long-lived assets at Buffalo Gap II. Impairment indicators were identified based on a decline in forward power curves. The Company determined that the carrying amount was not recoverable. The Buffalo Gap II asset group was determined to have a fair value of
$92 million
using the income approach. As a result, the Company recognized an asset impairment expense of
$159 million
(
$49 million
attributable to AES). Buffalo Gap II is reported in the US SBU reportable segment.
Kilroot
— During 2015, the Company tested the recoverability of long-lived assets at Kilroot, a coal- and oil-fired plant in the U.K., when the regulator established lower capacity prices for the Irish Single Electricity Market. The Company determined that the carrying amount of the asset group was not recoverable. The Kilroot asset group was determined to have a fair value of
$70 million
using the income approach. As a result, the Company recognized asset impairment expense of
$121 million
. Kilroot is reported in the Europe SBU reportable segment.
Buffalo Gap III
— During 2015, the Company tested the recoverability of its long-lived assets at Buffalo Gap III, a wind farm in Texas. Impairment indicators were identified based on a decline in forward power curves coupled with the near term expiration of favorable contracted cash flows. The Company determined that the carrying amount was not recoverable. The Buffalo Gap III asset group was determined to have a fair value of
$118 million
using the income approach. As a result, the Company recognized asset impairment expense of
$116 million
. Buffalo Gap III is reported in the US SBU reportable segment.
U.K. Wind
— During 2015, the Company decided to no longer pursue
two
wind projects in the U.K. based on recent regulatory clarifications specific to these projects, resulting in a full impairment. Impairment indicators were also identified at
four
other wind projects based on their current development status and a reassessment of the likelihood that each project would be pursued given aviation concerns, regulatory changes, economic considerations and other factors. The Company determined that the carrying amounts of each of these asset groups, which totaled
$38 million
, were not recoverable. In aggregate, the asset groups were determined to have a fair value of
$1 million
using the market approach and, as a result, the Company recognized asset impairment expense of
$37 million
. The U.K. Wind Projects are reported in the Europe SBU reportable segment.
Ebute
— During 2014, the Company identified impairment indicators at Ebute in Nigeria, resulting from the continued lack of gas supply, the increased likelihood of selling the asset group before the end of its useful life, and indications about the potential proceeds that could be received from a future sale. The Company determined that the carrying amount of the asset group was not recoverable. The Company recognized asset impairment of
$67 million
, which represents the difference between the carrying amount of
$103 million
and fair value less cost to sell of
$36 million
. In November 2014, the Company completed the sale of its interest in Ebute. See Note
23
—
Dispositions
for additional details. Prior to its sale, Ebute was reported in the Europe SBU reportable segment.
U.K. Wind (Newfield)
— During 2014, the Company tested the recoverability of long-lived assets at its Newfield wind development project in the U.K. after their government refused to grant a permit necessary for the project to continue. The Company determined that the carrying amount of the asset group was not recoverable. The Newfield asset group was determined to have
no
fair value using the income approach. As a result, the Company recognized asset impairment expense of
$12 million
. U.K. Wind (Newfield) is reported in the Europe SBU reportable segment.
East Bend (DP&L)
— During 2014, the Company identified impairment indicators at East Bend, a coal-fired plant in Ohio jointly owned by DP&L, resulting from the increased likelihood that the asset group would be disposed
175
THE AES CORPORATION
NOTES TO CONSOLIDATED FINANCIAL STATEMENTS—(Continued)
DECEMBER 31, 2016, 2015, AND 2014
prior to the end of its useful life. The Company determined that the carrying amount of the asset group was not recoverable. The East Bend asset group was determined to have a fair value of
$2 million
using the market approach, and the Company recognized asset impairment expense of
$12 million
. The Company's interest in East Bend was sold in December 2014. Prior to its sale, East Bend was reported in the US SBU reportable segment.
21
. INCOME TAXES
Income Tax Provision
— The following table summarizes the expense for income taxes on continuing operations for the periods indicated (in millions):
|
December 31,
|
2016
|
2015
|
2014
|
|||||||||
|
Federal:
|
Current
|
$
|
2
|
|
$
|
9
|
|
$
|
—
|
|
||
|
Deferred
|
(361
|
)
|
(59
|
)
|
(127
|
)
|
||||||
|
State:
|
Current
|
1
|
|
1
|
|
1
|
|
|||||
|
Deferred
|
(4
|
)
|
(5
|
)
|
1
|
|
||||||
|
Foreign:
|
Current
|
326
|
|
505
|
|
432
|
|
|||||
|
Deferred
|
(152
|
)
|
21
|
|
64
|
|
||||||
|
Total
|
$
|
(188
|
)
|
$
|
472
|
|
$
|
371
|
|
|||
Effective and Statutory Rate Reconciliation
— The following table summarizes a reconciliation of the U.S. statutory federal income tax rate to the Company's effective tax rate as a percentage of income from continuing operations before taxes for the periods indicated:
|
December 31,
|
2016
|
2015
|
2014
|
||||||
|
Statutory Federal tax rate
|
35
|
%
|
35
|
%
|
35
|
%
|
|||
|
State taxes, net of Federal tax benefit
|
(24
|
)%
|
(5
|
)%
|
(1
|
)%
|
|||
|
Taxes on foreign earnings
|
(215
|
)%
|
3
|
%
|
(15
|
)%
|
|||
|
Valuation allowance
|
14
|
%
|
(4
|
)%
|
(1
|
)%
|
|||
|
Uncertain tax positions
|
10
|
%
|
(1
|
)%
|
—
|
%
|
|||
|
Noncontrolling Interest on Buffalo Gap impairments
|
42
|
%
|
3
|
%
|
—
|
%
|
|||
|
Change in tax law
|
16
|
%
|
—
|
%
|
4
|
%
|
|||
|
Goodwill impairment
|
—
|
%
|
10
|
%
|
4
|
%
|
|||
|
Other—net
|
(15
|
)%
|
—
|
%
|
—
|
%
|
|||
|
Effective tax rate
|
(137
|
)%
|
41
|
%
|
26
|
%
|
|||
For
2016
, included in the favorable
215%
taxes on foreign earnings percentage above is approximately
151%
related to the current year benefit resulting from a restructuring of one of our Brazilian subsidiaries that increased tax basis in long-term assets. The
42%
Buffalo Gap impairments item relates to the amounts of impairment allocated to noncontrolling interest which is nondeductible.
Included in the favorable
15%
2014 taxes on foreign earnings percentage above is approximately
9%
related to the sale of approximately
45%
of the Company's interest in Masin AES Pte Ltd., which owns the Company's interests in the Philippines, and the sale of the Company's interests in
four
U.K. wind projects. Neither of these transactions gave rise to income tax expense.
Income Tax Receivables and Payables
— The current income taxes receivable and payable are included in
Other Current Assets
and
Accrued and Other Liabilities
, respectively, on the accompanying Consolidated Balance Sheets. The noncurrent income taxes receivable and payable are included in Other Noncurrent Assets and Other Noncurrent Liabilities, respectively, on the accompanying Consolidated Balance Sheets. The following table summarizes the income taxes receivable and payable as of the periods indicated (in millions):
|
December 31,
|
2016
|
2015
|
||||||
|
Income taxes receivable—current
|
$
|
145
|
|
$
|
166
|
|
||
|
Total income taxes receivable
|
$
|
145
|
|
$
|
166
|
|
||
|
Income taxes payable—current
|
$
|
149
|
|
$
|
264
|
|
||
|
Income taxes payable—noncurrent
|
22
|
|
35
|
|
||||
|
Total income taxes payable
|
$
|
171
|
|
$
|
299
|
|
||
Chilean Tax Reform
— In February 2016, the Chilean government enacted further reforms to its income tax laws that resulted in an increase to statutory income tax rates for most of our Chilean businesses from
25%
to
25.5%
in 2017 and to
27%
for 2018 and future years. The impact of remeasuring deferred taxes to account for the enacted change in future applicable income tax rates was recognized as discrete income tax expense in the first quarter of 2016, resulting in an increase of
$26 million
to consolidated income tax expense.
176
THE AES CORPORATION
NOTES TO CONSOLIDATED FINANCIAL STATEMENTS—(Continued)
DECEMBER 31, 2016, 2015, AND 2014
Deferred Income Taxes
— Deferred income taxes reflect the net tax effects of (a) temporary differences between the carrying amounts of assets and liabilities for financial reporting purposes and the amounts used for income tax purposes and (b) operating loss and tax credit carryforwards. These items are stated at the enacted tax rates that are expected to be in effect when taxes are actually paid or recovered.
As of December 31,
2016
, the Company had federal net operating loss carryforwards for tax purposes of approximately
$3.5 billion
expiring in years 2021 to 2036. Approximately
$88 million
of the net operating loss carryforward related to stock option deductions will be recognized in additional paid-in capital when realized. The Company also had federal general business tax credit carryforwards of approximately
$20 million
expiring primarily from 2021 to 2036, and federal alternative minimum tax credits of approximately
$5 million
that carry forward without expiration. The Company had state net operating loss carryforwards as of December 31,
2016
of approximately
$9.1 billion
expiring in years 2017 to 2036. As of December 31,
2016
, the Company had foreign net operating loss carryforwards of approximately
$3.1 billion
that expire at various times beginning in 2017 and some of which carry forward without expiration, and tax credits available in foreign jurisdictions of approximately
$32 million
,
$22 million
of which expire in 2021 and
$8 million
of which carryforward without expiration.
Valuation allowances decreased
$18 million
during
2016
to
$876 million
at December 31,
2016
. This net decrease was primarily the result of valuation allowance releases and foreign exchange gains at certain of our Brazil subsidiaries.
Valuation allowances decreased
$103 million
during
2015
to
$894 million
at December 31,
2015
. This net decrease was primarily the result of foreign exchange losses and valuation allowance releases at certain of our Brazil and Vietnam subsidiaries.
The Company believes that it is more likely than not that the net deferred tax assets as shown below will be realized when future taxable income is generated through the reversal of existing taxable temporary differences and income that is expected to be generated by businesses that have long-term contracts or a history of generating taxable income. The Company continues to monitor the utilization of its deferred tax asset for its U.S. consolidated net operating loss carryforward. Although management believes it is more likely than not that this deferred tax asset will be realized through generation of sufficient taxable income or reversal of deferred tax liabilities prior to expiration of the loss carryforwards, such realization is not assured.
The following table summarizes deferred tax assets and liabilities, as of the periods indicated (in millions):
|
December 31,
|
2016
|
2015
|
||||||
|
Differences between book and tax basis of property
|
$
|
(2,071
|
)
|
$
|
(2,199
|
)
|
||
|
Other taxable temporary differences
|
(80
|
)
|
(328
|
)
|
||||
|
Total deferred tax liability
|
(2,151
|
)
|
(2,527
|
)
|
||||
|
Operating loss carryforwards
|
2,116
|
|
2,107
|
|
||||
|
Capital loss carryforwards
|
59
|
|
66
|
|
||||
|
Bad debt and other book provisions
|
182
|
|
156
|
|
||||
|
Retirement costs
|
306
|
|
146
|
|
||||
|
Tax credit carryforwards
|
54
|
|
55
|
|
||||
|
Other deductible temporary differences
|
287
|
|
211
|
|
||||
|
Total gross deferred tax asset
|
3,004
|
|
2,741
|
|
||||
|
Less: valuation allowance
|
(876
|
)
|
(894
|
)
|
||||
|
Total net deferred tax asset
|
2,128
|
|
1,847
|
|
||||
|
Net deferred tax (liability)
|
$
|
(23
|
)
|
$
|
(680
|
)
|
||
The Company considers undistributed earnings of certain foreign subsidiaries to be indefinitely reinvested outside of the U.S. and, accordingly,
no
U.S. deferred taxes have been recorded with respect to such earnings in accordance with the relevant accounting guidance for income taxes. Should the earnings be remitted as dividends, the Company may be subject to additional U.S. taxes, net of allowable foreign tax credits. As of December 31,
2016
, the cumulative amount of foreign un-remitted earnings upon which U.S. income taxes have not been provided is approximately
$4 billion
. It is not practicable to estimate the amount of any additional taxes which may be payable on the undistributed earnings.
Income from operations in certain countries is subject to reduced tax rates as a result of satisfying specific commitments regarding employment and capital investment. The Company's income tax benefits related to the tax status of these operations are estimated to be
$20 million
,
$21 million
and
$38 million
for the years ended December 31,
2016
,
2015
and
2014
, respectively. The per share effect of these benefits after noncontrolling interests was
$0.02
,
$0.02
and
$0.04
for the years ended December 31,
2016
,
2015
and
2014
, respectively.
177
THE AES CORPORATION
NOTES TO CONSOLIDATED FINANCIAL STATEMENTS—(Continued)
DECEMBER 31, 2016, 2015, AND 2014
Included in the Company's income tax benefits is the benefit related to our operations in Vietnam, which is estimated to be
$15 million
and
$8 million
for the years ended December 31,
2016
and 2015, respectively. The per share effect of these benefits related to our operations in Vietnam after noncontrolling interest was
$0.01
and
$0.01
for the years ended December 31,
2016
and 2015, respectively.
The following table shows the income (loss) from continuing operations, before income taxes, net equity in earnings of affiliates and noncontrolling interests, for the periods indicated (in millions):
|
December 31,
|
2016
|
2015
|
2014
|
|||||||||
|
U.S.
|
$
|
(1,305
|
)
|
$
|
(612
|
)
|
$
|
(560
|
)
|
|||
|
Non-U.S.
|
1,442
|
|
1,766
|
|
2,003
|
|
||||||
|
Total
|
$
|
137
|
|
$
|
1,154
|
|
$
|
1,443
|
|
|||
Uncertain Tax Positions
— Uncertain tax positions have been classified as noncurrent income tax liabilities unless they are expected to be paid in one year. The Company's policy for interest and penalties related to income tax exposures is to recognize interest and penalties as a component of the provision for income taxes in the Consolidated Statements of Operations. The following table shows the total amount of gross accrued income tax included in the Consolidated Balance Sheets for the periods indicated (in millions):
|
December 31,
|
2016
|
2015
|
||||||
|
Interest related
|
$
|
10
|
|
$
|
8
|
|
||
|
Penalties related
|
1
|
|
—
|
|
||||
The following table shows the total expense/(benefit) related to unrecognized tax benefits for the periods indicated (in millions):
|
December 31,
|
2016
|
2015
|
2014
|
|||||||||
|
Total expense for interest related to unrecognized tax benefits
|
$
|
4
|
|
$
|
—
|
|
$
|
2
|
|
|||
|
Total benefit for penalties related to unrecognized tax benefits
|
—
|
|
—
|
|
(1
|
)
|
||||||
We are potentially subject to income tax audits in numerous jurisdictions in the U.S. and internationally until the applicable statute of limitations expires. Tax audits by their nature are often complex and can require several years to complete. The following is a summary of tax years potentially subject to examination in the significant tax and business jurisdictions in which we operate:
|
Jurisdiction
|
Tax Years Subject to Examination
|
|
|
Argentina
|
2010-2016
|
|
|
Brazil
|
2011-2016
|
|
|
Chile
|
2013-2016
|
|
|
Colombia
|
2014-2016
|
|
|
Dominican Republic
|
2013-2016
|
|
|
El Salvador
|
2014-2016
|
|
|
Netherlands
|
2014-2016
|
|
|
Philippines
|
2013-2016
|
|
|
United Kingdom
|
2010-2016
|
|
|
United States (Federal)
|
2013-2016
|
|
As of December 31,
2016
,
2015
and
2014
, the total amount of unrecognized tax benefits was
$369 million
,
$373 million
and
$394 million
, respectively. The total amount of unrecognized tax benefits that would benefit the effective tax rate as of December 31,
2016
,
2015
and
2014
is
$332 million
,
$343 million
and
$366 million
, respectively, of which
$24 million
,
$24 million
and
$24 million
, respectively, would be in the form of tax attributes that would warrant a full valuation allowance.
The total amount of unrecognized tax benefits anticipated to result in a net decrease to unrecognized tax benefits within 12 months of December 31,
2016
is estimated to be up to
$10 million
, primarily relating to statute of limitation lapses and tax exam settlements.
178
THE AES CORPORATION
NOTES TO CONSOLIDATED FINANCIAL STATEMENTS—(Continued)
DECEMBER 31, 2016, 2015, AND 2014
The following is a reconciliation of the beginning and ending amounts of unrecognized tax benefits for the periods indicated (in millions):
|
December 31,
|
2016
|
2015
|
2014
|
|||||||||
|
Balance at January 1
|
$
|
373
|
|
$
|
394
|
|
$
|
392
|
|
|||
|
Additions for current year tax positions
|
8
|
|
7
|
|
7
|
|
||||||
|
Additions for tax positions of prior years
|
1
|
|
12
|
|
14
|
|
||||||
|
Reductions for tax positions of prior years
|
(1
|
)
|
(7
|
)
|
(2
|
)
|
||||||
|
Effects of foreign currency translation
|
2
|
|
(7
|
)
|
(3
|
)
|
||||||
|
Settlements
|
(13
|
)
|
(19
|
)
|
(2
|
)
|
||||||
|
Lapse of statute of limitations
|
(1
|
)
|
(7
|
)
|
(12
|
)
|
||||||
|
Balance at December 31
|
$
|
369
|
|
$
|
373
|
|
$
|
394
|
|
|||
The Company and certain of its subsidiaries are currently under examination by the relevant taxing authorities for various tax years. The Company regularly assesses the potential outcome of these examinations in each of the taxing jurisdictions when determining the adequacy of the amount of unrecognized tax benefit recorded. While it is often difficult to predict the final outcome or the timing of resolution of any particular uncertain tax position, we believe we have appropriately accrued for our uncertain tax benefits. However, audit outcomes and the timing of audit settlements and future events that would impact our previously recorded unrecognized tax benefits and the range of anticipated increases or decreases in unrecognized tax benefits are subject to significant uncertainty. It is possible that the ultimate outcome of current or future examinations may exceed our provision for current unrecognized tax benefits in amounts that could be material, but cannot be estimated as of December 31,
2016
. Our effective tax rate and net income in any given future period could therefore be materially impacted.
22
. DISCONTINUED OPERATIONS
Brazil Distribution —
Due to a portfolio evaluation in the first half of 2016, management has decided to pursue a strategic shift of its distribution companies in Brazil, AES Sul and Eletropaulo. The disposal of Sul was completed in October 2016. In December 2016, Eletropaulo underwent a corporate restructuring which is expected to, among other things, provide more liquidity of its shares. AES is continuing to pursue strategic options for Eletropaulo in order to complete its strategic shift to reduce AES’ exposure to the Brazilian distribution business, including preparation for listing its shares into the Novo Mercado, which is a listing segment of the Brazilian stock exchange with the highest standards of corporate governance.
The Company executed an agreement for the sale of its wholly-owned subsidiary AES Sul in June 2016. We have reported the results of operations and financial position of AES Sul as discontinued operations in the consolidated financial statements for all periods presented. Upon meeting the held-for-sale criteria, the Company recognized an after tax loss of
$382 million
comprised of a pretax impairment charge of
$783 million
, offset by a tax benefit of
$266 million
related to the impairment of the Sul long lived assets and a tax benefit of
$135 million
for deferred taxes related to the investment in AES Sul. Prior to the impairment charge in the second quarter, the carrying value of the AES Sul asset group of
$1.6 billion
was greater than its approximate fair value less costs to sell. However, the impairment charge was limited to the carrying value of the long lived assets of the AES Sul disposal group.
On
October 31, 2016
, the Company completed the sale of AES Sul and received final proceeds less costs to sell of
$484 million
, excluding contingent consideration. Upon disposal of AES Sul, we incurred an additional after-tax loss on sale of
$737 million
. The cumulative impact to earnings of the impairment and loss on sale was
$1.1 billion
. This includes the reclassification of approximately
$1 billion
of cumulative translation losses, resulting in a net reduction to the Company’s stockholders’ equity of
$92 million
.
Sul’s pretax loss attributable to AES for the years ended
December 31, 2016
and
2015
was
$1.4 billion
and
$32 million
, respectively. Sul’s pretax gain attributable to AES for the
year ended December 31, 2014
was
$133 million
. Prior to its classification as discontinued operations, Sul was reported in the Brazil SBU reportable segment.
As discussed in Note
1
—
General and Summary of Significant Accounting Policies
, effective July 1, 2014, the Company prospectively adopted ASU No. 2014-08. Discontinued operations prior to adoption of ASU No. 2014-08 include the results of Cameroon, Saurashtra and various U.S. wind projects which were each sold in the first half of 2014.
Cameroon —
In September 2013, the Company executed agreements for the sale of its
56%
equity interests in businesses in Cameroon: Sonel, an integrated utility, Kribi, a gas and light fuel oil plant, and Dibamba, a heavy
179
THE AES CORPORATION
NOTES TO CONSOLIDATED FINANCIAL STATEMENTS—(Continued)
DECEMBER 31, 2016, 2015, AND 2014
fuel oil plant. The sale was completed in June 2014. Net proceeds from the sale transaction were
$200 million
, of which
$156 million
was received in 2014. Of the remaining non-contingent consideration of
$44 million
,
$40 million
was received in the second quarter of 2016. Between meeting the held-for-sale criteria in September 2013 and completing the sale in June 2014, the Company recognized impairments of
$101 million
and an additional loss on sale of
$7 million
. Prior to classification as discontinued operations, these businesses were reported in the Europe SBU reportable segment.
Saurashtra —
In October 2013, the Company executed an agreement for the sale of Saurashtra, a wind project in India. The sale transaction was completed in February 2014 and net proceeds of
$8 million
were received. Prior to its classification as discontinued operations, Saurashtra was reported in the Asia SBU reportable segment.
U.S. Wind Projects —
In November 2013, the Company executed an agreement for the sale of its
100%
membership interests in
three
wind projects: Condon in California, Lake Benton I in Minnesota and Storm Lake II in Iowa. Upon meeting the held-for-sale criteria for these three projects, the Company recognized impairment expense of
$47 million
(of which
$7 million
was attributable to noncontrolling interests held by tax equity partners) representing the difference between their aggregate carrying amount of
$77 million
and the fair value less costs to sell of
$30 million
. The sale was completed in January 2014 and net proceeds of
$27 million
were received. Prior to classification as discontinued operations, these businesses were reported in the US SBU reportable segment.
As the sale of AES Sul closed
October 31, 2016
, there were
no
assets or liabilities of discontinued operations and held-for-sale businesses at
December 31, 2016
. The following table summarizes the carrying amounts of the major classes of assets and liabilities of discontinued operations and held-for-sale businesses at
December 31, 2015
:
|
(in millions)
|
December 31, 2015
|
||
|
Assets of discontinued operations and held-for-sale businesses:
|
|||
|
Cash and cash equivalents
|
$
|
5
|
|
|
Accounts receivable, net of allowance for doubtful accounts of $8
|
171
|
|
|
|
Property, plant and equipment and intangibles, net
|
668
|
|
|
|
Deferred income taxes
|
133
|
|
|
|
Other classes of assets that are not major
|
233
|
|
|
|
Total assets of discontinued operations
|
1,210
|
|
|
|
Other assets of businesses classified as held-for-sale
(1)
|
96
|
|
|
|
Total assets of discontinued operations and held-for-sale businesses
(2)
|
$
|
1,306
|
|
|
Liabilities of discontinued operations and held-for-sale businesses:
|
|||
|
Accounts payable
|
$
|
150
|
|
|
Accrued and other liabilities
|
150
|
|
|
|
Non-recourse debt
|
346
|
|
|
|
Other classes of liabilities that are not major
|
125
|
|
|
|
Total liabilities of discontinued operations
|
771
|
|
|
|
Other liabilities of businesses classified as held-for-sale
(1)
|
13
|
|
|
|
Total liabilities of discontinued operations and held-for-sale businesses
(2)
|
$
|
784
|
|
_____________________________
|
(1)
|
DPLER and Kelanitissa were classified as held-for-sale as of
December 31, 2015
. See Note
23
—
Dispositions
for further information.
|
|
(2)
|
Amounts were classified as both current and long-term on the Consolidated Balance Sheet as of
December 31, 2015
.
|
The following table summarizes the major line items constituting income (losses) from discontinued operations for the periods indicated (in millions):
|
December 31,
|
2016
|
2015
|
2014
|
||||||||
|
Income (loss) from discontinued operations, net of tax:
|
|||||||||||
|
Revenue
—
regulated
|
$
|
701
|
|
$
|
808
|
|
$
|
1,255
|
|
||
|
Cost of sales
|
(672
|
)
|
(800
|
)
|
(1,078
|
)
|
|||||
|
Other income and expense items that are not major
|
(57
|
)
|
(40
|
)
|
5
|
|
|||||
|
Pretax income (loss) from operations of discontinued businesses
|
(28
|
)
|
(32
|
)
|
182
|
|
|||||
|
Pretax gain (loss) from disposal and impairments of discontinued businesses
|
(1,385
|
)
|
—
|
|
(51
|
)
|
|||||
|
Pretax income (loss) from discontinued operations
|
(1,413
|
)
|
(32
|
)
|
131
|
|
|||||
|
Less: Net loss attributable to noncontrolling interests
|
—
|
|
—
|
|
8
|
|
|||||
|
Pretax income (loss) from discontinued operations attributable to The AES Corporation
|
(1,413
|
)
|
(32
|
)
|
139
|
|
|||||
|
Income tax benefit (expense)
|
275
|
|
7
|
|
(75
|
)
|
|||||
|
Income (loss) from discontinued operations, net of tax
|
$
|
(1,138
|
)
|
$
|
(25
|
)
|
$
|
64
|
|
||
180
THE AES CORPORATION
NOTES TO CONSOLIDATED FINANCIAL STATEMENTS—(Continued)
DECEMBER 31, 2016, 2015, AND 2014
The following table summarizes the operating and investing cash flows from discontinued operations associated with Sul, the only business that qualifies for discontinued operations after the adoption of ASU No. 2014-08, for the periods indicated (in millions):
|
December 31,
|
2016
|
2015
|
2014
|
||||||||
|
Cash flows from operating activities of Sul discontinued operations
|
$
|
58
|
|
$
|
(15
|
)
|
$
|
15
|
|
||
|
Cash flows from investing activities of Sul discontinued operations
|
(54
|
)
|
(25
|
)
|
(123
|
)
|
|||||
23
. DISPOSITIONS
U.K. Wind
—
During the second quarter of 2016, the Company deconsolidated UK Wind and recorded a loss on deconsolidation of
$20 million
to
Gain on disposal and sale of businesses
in the Consolidated Statement of Operations. Prior to deconsolidation, UK Wind was reported in the Europe SBU reportable segment. See Note
15
—
Equity
for additional information.
DPLER
—
In December 2015, the Company executed an agreement for the sale of its ownership interest in DPLER, a competitive retail marketer selling electricity to customers in Ohio. Accordingly, DPLER was classified as held-for-sale as of December 31, 2015, but did not meet the criteria to be reported as a discontinued operation. DPLER's results were therefore reflected within continuing operations in the Consolidated Statements of Operations.
On January 1, 2016, the Company completed the sale of its interest in DPLER and recognized a gain on sale of
$49 million
. Proceeds of
$76 million
were received on December 31, 2015. The proceeds were classified as restricted cash with a corresponding amount recorded in
Accrued and other liabilities
in the Consolidated Balance Sheet as of December 31, 2015. DPLER's pretax income attributable to AES for the year ended December 31, 2015 was
$11 million
and pretax loss attributable to AES for the year ended December 31, 2014 was
$129 million
. Prior to its sale, DPLER was reported in the US SBU reportable segment.
Kelanitissa
—
In August 2015, the Company executed an agreement for the sale of its
90%
ownership interest in Kelanitissa, a diesel-fired generation plant in Sri Lanka. Accordingly, Kelanitissa was classified as held-for-sale as of December 31, 2015, but did not meet the criteria to be reported as a discontinued operation. Kelanitissa's results were therefore reflected within continuing operations in the Consolidated Statements of Operations.
On January 27, 2016, the Company completed the sale of its interest in Kelanitissa. Upon completion, proceeds of
$18 million
were received and a loss on sale of
$5 million
was recognized. Kelanitissa's pretax loss attributable to AES for the year ended December 31, 2015 was
$7 million
and pretax income attributable to AES for the year ended December 31, 2014 was
$1 million
. Prior to its sale, Kelanitissa was reported in the Asia SBU reportable segment.
Armenia Mountain —
Under the terms of the sale agreement for certain U.S. Wind Projects, the buyer was provided an option to purchase the Company's
100%
interest in Armenia Mountain, a wind project in Pennsylvania, at a fixed price of
$75 million
. The buyer exercised the option on March 31, 2015 and completed the sale of its interest in Armenia Mountain on July 1, 2015. The sale did not meet the criteria to be reported as a discontinued operation. Upon completion, net proceeds of
$64 million
were received and a pretax gain on sale of
$22 million
was recognized. Excluding the gain on sale, Armenia Mountain's pretax income attributable to AES was
$6 million
and
$7 million
for the years ended December 31, 2015 and 2014, respectively. Prior to its sale, Armenia Mountain was reported in the US SBU reportable segment.
Ebute
— On November 20, 2014, the Company completed the sale of its interest in Ebute, which included its
95%
interest in AES Nigeria Barge Limited and its
100%
interest in AES Nigeria Barge Operations Limited. Proceeds from the sale were
$22 million
and the Company recognized a loss on sale of
$6 million
. As Ebute did not meet the criteria to be reported as a discontinued operation, its results were reflected within continuing operations in the Consolidated Statements of Operations. Excluding the loss on sale, Ebute's pretax loss attributable to AES was
$27 million
for the year ended December 31, 2014. Prior to its sale, Ebute was reported in the Europe SBU reportable segment.
U.K. Wind (Operating Projects)
— On August 22, 2014, the Company completed the sale of its interests in
four
operating wind projects located in the U.K.. Total net proceeds from the sale were
$158 million
and the Company recognized a pretax gain on sale of
$78 million
. As these wind projects did not meet the criteria to be reported as discontinued operations, their results were reflected within continuing operations in the Consolidated Statements of Operations. Excluding the gain on sale, the pretax loss attributable to AES for these disposed projects was
$18
181
THE AES CORPORATION
NOTES TO CONSOLIDATED FINANCIAL STATEMENTS—(Continued)
DECEMBER 31, 2016, 2015, AND 2014
million
for the year ended December 31, 2014. Prior to the sale, U.K. Wind (Operating Projects) were reported in the Europe SBU reportable segment.
24
. ACQUISITIONS
Distributed Energy
— On February 18, 2015, the Company completed the acquisition of
100%
of the common stock of Main Street Power Company, Inc. for approximately
$25 million
. The purchase consideration was composed of
$20 million
cash and the fair value of earn-out payments of
$5 million
. At December 31, 2015, the assets acquired (including
$4 million
cash) and liabilities assumed at the acquisition date were recorded at fair value based on the final purchase price allocation, which resulted in the recognition of
$16 million
of goodwill. After the date of acquisition, Main Street Power Company, Inc. was renamed Distributed Energy, Inc.
On September 16, 2016, Distributed Energy acquired the equity interest of various projects held by multiple partnerships for approximately
$43 million
. These partnerships were previously classified as equity method investments. In accordance with the accounting guidance for business combinations, the Company has recorded the opening balance sheets of the acquired businesses based on the purchase price allocation as of the acquisition date.
25
. EARNINGS PER SHARE
Basic and diluted earnings per share are based on the weighted-average number of shares of common stock and potential common stock outstanding during the period. Potential common stock, for purposes of determining diluted earnings per share, includes the effects of dilutive restricted stock units, stock options and convertible securities. The effect of such potential common stock is computed using the treasury stock method or the if-converted method, as applicable.
The following table is a reconciliation of the numerator and denominator of the basic and diluted earnings per share computation for income from continuing operations for the years ended
December 31, 2016
,
2015
and
2014
, where income represents the numerator and weighted-average shares represent the denominator. Values are in millions except per share data:
|
Year Ended December 31,
|
2016
|
2015
|
2014
|
|||||||||||||||||||||||||||||
|
Income
|
Shares
|
$ per Share
|
Income
|
Shares
|
$ per Share
|
Income
|
Shares
|
$ per Share
|
||||||||||||||||||||||||
|
BASIC EARNINGS PER SHARE
|
||||||||||||||||||||||||||||||||
|
Income from continuing operations attributable to The AES Corporation common stockholders
(1)
|
$
|
3
|
|
660
|
|
$
|
—
|
|
$
|
331
|
|
687
|
|
$
|
0.48
|
|
$
|
705
|
|
720
|
|
$
|
0.98
|
|
||||||||
|
EFFECT OF DILUTIVE SECURITIES
|
|
|||||||||||||||||||||||||||||||
|
Stock options
|
—
|
|
—
|
|
—
|
|
—
|
|
—
|
|
—
|
|
—
|
|
1
|
|
—
|
|
||||||||||||||
|
Restricted stock units
|
—
|
|
2
|
|
—
|
|
—
|
|
2
|
|
—
|
|
—
|
|
3
|
|
(0.01
|
)
|
||||||||||||||
|
DILUTED EARNINGS PER SHARE
|
$
|
3
|
|
662
|
|
$
|
—
|
|
$
|
331
|
|
689
|
|
$
|
0.48
|
|
$
|
705
|
|
724
|
|
$
|
0.97
|
|
||||||||
_____________________________
|
(1)
|
Income from continuing operations, net of tax, of $
8 million
less the $
5 million
adjustment to retained earnings to record the DP&L redeemable preferred stock at its redemption value as of
December 31, 2016
.
|
The calculation of diluted earnings per share excluded
8 million
,
8 million
and
6 million
stock awards outstanding for the years ended
December 31, 2016
,
2015
and
2014
, respectively, that could potentially dilute basic earnings per share in the future. Additionally, for the years ended
December 31, 2016
,
2015
and
2014
, all
15 million
convertible debentures were omitted from the earnings per share calculation. The stock awards and convertible debentures were excluded from the calculation because they were anti-dilutive.
26
. RISKS AND UNCERTAINTIES
AES is a diversified power generation and utility company organized into
six
market-oriented SBUs. See additional discussion of the Company's principal markets in Note
16
—
Segment and Geographic Information
. Within our
six
SBUs, we have
two
primary lines of business: Generation and Utilities. The Generation line of business uses a wide range of fuels and technologies to generate electricity such as coal, gas, hydro, wind, solar and biomass. Our Utilities business is comprised of businesses that transmit, distribute, and in certain circumstances, generate power. In addition, the Company has operations in the renewables area. These efforts include projects primarily in wind and solar.
Operating and Economic Risks
— The Company operates in several developing economies where macroeconomic conditions are usually more volatile than developed economies. Deteriorating market conditions often expose the Company to the risk of decreased earnings and cash flows due to, among other factors, adverse
182
THE AES CORPORATION
NOTES TO CONSOLIDATED FINANCIAL STATEMENTS—(Continued)
DECEMBER 31, 2016, 2015, AND 2014
fluctuations in the commodities and foreign currency spot markets. Additionally, credit markets around the globe continue to tighten their standards, which could impact our ability to finance growth projects through access to capital markets. Currently, the Company has a below-investment grade rating from Standard & Poor's of BB-. This could affect the Company's ability to finance new and/or existing development projects at competitive interest rates. As of
December 31, 2016
, the Company had
$1.3 billion
of unrestricted cash and cash equivalents.
During
2016
,
74%
of our revenue was generated outside the U.S. and a significant portion of our international operations is conducted in developing countries. We continue to invest in several developing countries to expand our existing platform and operations. International operations, particularly the operation, financing and development of projects in developing countries, entail significant risks and uncertainties, including, without limitation:
|
•
|
economic, social and political instability in any particular country or region;
|
|
•
|
inability to economically hedge energy prices;
|
|
•
|
volatility in commodity prices;
|
|
•
|
adverse changes in currency exchange rates;
|
|
•
|
government restrictions on converting currencies or repatriating funds;
|
|
•
|
unexpected changes in foreign laws, regulatory framework, or in trade, monetary or fiscal policies;
|
|
•
|
high inflation and monetary fluctuations;
|
|
•
|
restrictions on imports of coal, oil, gas or other raw materials required by our generation businesses to operate;
|
|
•
|
threatened or consummated expropriation or nationalization of our assets by foreign governments;
|
|
•
|
unwillingness of governments, government agencies, similar organizations or other counterparties to honor their commitments;
|
|
•
|
unwillingness of governments, government agencies, courts or similar bodies to enforce contracts that are economically advantageous to subsidiaries of the Company and economically unfavorable to counterparties, against such counterparties, whether such counterparties are governments or private parties;
|
|
•
|
inability to obtain access to fair and equitable political, regulatory, administrative and legal systems;
|
|
•
|
adverse changes in government tax policy;
|
|
•
|
difficulties in enforcing our contractual rights, enforcing judgments, or obtaining a just result in local jurisdictions; and
|
|
•
|
potentially adverse tax consequences of operating in multiple jurisdictions.
|
Any of these factors, individually or in combination with others, could materially and adversely affect our business, results of operations and financial condition. In addition, our Latin American operations experience volatility in revenue and earnings which have caused and are expected to cause significant volatility in our results of operations and cash flows. The volatility is caused by regulatory and economic difficulties, political instability, indexation of certain PPAs to fuel prices, and currency fluctuations being experienced in many of these countries. This volatility reduces the predictability and enhances the uncertainty associated with cash flows from these businesses.
Our inability to predict, influence or respond appropriately to changes in law or regulatory schemes, including any inability to obtain reasonable increases in tariffs or tariff adjustments for increased expenses, could adversely impact our results of operations or our ability to meet publicly announced projections or analysts' expectations. Furthermore, changes in laws or regulations or changes in the application or interpretation of regulatory provisions in jurisdictions where we operate, particularly our Utility businesses where electricity tariffs are subject to regulatory review or approval, could adversely affect our business, including, but not limited to:
|
•
|
changes in the determination, definition or classification of costs to be included as reimbursable or pass-through costs;
|
|
•
|
changes in the definition or determination of controllable or noncontrollable costs;
|
|
•
|
adverse changes in tax law;
|
|
•
|
changes in the definition of events which may or may not qualify as changes in economic equilibrium;
|
|
•
|
changes in the timing of tariff increases;
|
|
•
|
other changes in the regulatory determinations under the relevant concessions; or
|
183
THE AES CORPORATION
NOTES TO CONSOLIDATED FINANCIAL STATEMENTS—(Continued)
DECEMBER 31, 2016, 2015, AND 2014
|
•
|
changes in environmental regulations, including regulations relating to GHG emissions in any of our businesses.
|
Any of the above events may result in lower margins for the affected businesses, which can adversely affect our results of operations.
Construction
— As of
December 31, 2016
, the Company has
531
MW under construction at Alto Maipo. Increased project costs, or delays in construction, could have an adverse impact on the Company.
Foreign Currency Risks
— AES operates businesses in many foreign countries and such operations could be impacted by significant fluctuations in foreign currency exchange rates. Fluctuations in currency exchange rate between U.S. Dollar and the following currencies could create significant fluctuations to earnings and cash flows: the Argentine peso, the Brazilian real, the Dominican Republic peso, the Euro, the Chilean peso, the Colombian peso, the Philippine peso and the Kazakhstan tenge.
Concentrations
— Due to the geographical diversity of its operations, the Company does not have any significant concentration of customers or sources of fuel supply. Several of the Company's generation businesses rely on PPAs with one or a limited number of customers for the majority of, and in some cases all of, the relevant businesses' output over the term of the PPAs. However, no single customer accounted for
10%
or more of total revenue in
2016
,
2015
or
2014
.
The cash flows and results of operations of our businesses depend on the credit quality of our customers and the continued ability of our customers and suppliers to meet their obligations under PPAs and fuel supply agreements. If a substantial portion of the Company's long-term PPAs and/or fuel supply were modified or terminated, the Company would be adversely affected to the extent that it would be unable to replace such contracts at equally favorable terms.
27
. RELATED PARTY TRANSACTIONS
Certain of our businesses in Panama and the Dominican Republic are partially owned by governments either directly or through state-owned institutions. In the ordinary course of business, these businesses enter into energy purchase and sale transactions, and transmission agreements with other state-owned institutions which are controlled by such governments. At two of our generation businesses in Mexico, the offtakers exercise significant influence, but not control, through representation on these businesses' Boards of Directors. These offtakers are also required to hold a nominal ownership interest in such businesses. In Chile, we provide capacity and energy under contractual arrangements to our investment which is accounted for under the equity method of accounting. Additionally, the Company provides certain support and management services to several of its affiliates under various agreements.
The Company's Consolidated Statements of Operations included the following transactions with related parties for the periods indicated (in millions):
|
Years Ended December 31,
|
2016
|
2015
|
2014
|
||||||||
|
Revenue—Non-Regulated
|
$
|
1,100
|
|
$
|
1,099
|
|
$
|
1,188
|
|
||
|
Cost of Sales—Non-Regulated
|
210
|
|
330
|
|
331
|
|
|||||
|
Interest Income
|
4
|
|
25
|
|
17
|
|
|||||
|
Interest Expense
|
39
|
|
33
|
|
9
|
|
|||||
The following table summarizes the balances receivable from and payable to related parties included in the Company's Consolidated Balance Sheets as of the periods indicated (in millions):
|
December 31,
|
2016
|
2015
|
|||||
|
Receivables from related parties
|
$
|
218
|
|
$
|
181
|
|
|
|
Accounts and notes payable to related parties
|
498
|
|
524
|
|
|||
28
. SELECTED QUARTERLY FINANCIAL DATA (UNAUDITED)
Quarterly Financial Data
— The following tables summarize the unaudited quarterly Condensed Consolidated Statements of Operations for the Company for
2016
and
2015
(amounts in millions, except per share data). Amounts have been restated to reflect discontinued operations in all periods presented and reflect all adjustments necessary in the opinion of management for a fair statement of the results for interim periods.
184
THE AES CORPORATION
NOTES TO CONSOLIDATED FINANCIAL STATEMENTS—(Continued)
DECEMBER 31, 2016, 2015, AND 2014
|
Quarter Ended 2016
|
Mar 31
|
June 30
|
Sept 30
|
Dec 31
|
|||||||||||
|
Revenue
|
$
|
3,271
|
|
$
|
3,229
|
|
$
|
3,542
|
|
$
|
3,544
|
|
|||
|
Operating margin
|
509
|
|
574
|
|
688
|
|
662
|
|
|||||||
|
Income (loss) from continuing operations, net of tax
(1)
|
83
|
|
(8
|
)
|
230
|
|
56
|
|
|||||||
|
(Loss) from discontinued operations, net of tax
|
(9
|
)
|
(379
|
)
|
(1
|
)
|
(749
|
)
|
|||||||
|
Net income (loss)
|
$
|
74
|
|
$
|
(387
|
)
|
$
|
229
|
|
$
|
(693
|
)
|
|||
|
Net income (loss) attributable to The AES Corporation
|
$
|
126
|
|
$
|
(482
|
)
|
$
|
175
|
|
$
|
(949
|
)
|
|||
|
Basic income (loss) per share:
|
|||||||||||||||
|
Income (loss) from continuing operations attributable to The AES Corporation, net of tax
|
$
|
0.20
|
|
$
|
(0.16
|
)
|
$
|
0.26
|
|
$
|
(0.30
|
)
|
|||
|
Income (loss) from discontinued operations attributable to The AES Corporation, net of tax
|
(0.01
|
)
|
(0.57
|
)
|
—
|
|
(1.14
|
)
|
|||||||
|
Basic income (loss) per share attributable to The AES Corporation
|
$
|
0.19
|
|
$
|
(0.73
|
)
|
$
|
0.26
|
|
$
|
(1.44
|
)
|
|||
|
Diluted income (loss) per share:
|
|||||||||||||||
|
Income (loss) from continuing operations attributable to The AES Corporation, net of tax
|
$
|
0.20
|
|
$
|
(0.16
|
)
|
$
|
0.26
|
|
$
|
(0.30
|
)
|
|||
|
Income (loss) from discontinued operations attributable to The AES Corporation, net of tax
|
(0.01
|
)
|
(0.57
|
)
|
—
|
|
(1.14
|
)
|
|||||||
|
Diluted income (loss) per share attributable to The AES Corporation
|
$
|
0.19
|
|
$
|
(0.73
|
)
|
$
|
0.26
|
|
$
|
(1.44
|
)
|
|||
|
Dividends declared per common share
|
$
|
0.11
|
|
$
|
—
|
|
$
|
0.11
|
|
$
|
0.23
|
|
|||
|
Quarter Ended 2015
|
Mar 31
|
June 30
|
Sept 30
|
Dec 31
|
|||||||||||
|
Revenue
|
$
|
3,758
|
|
$
|
3,656
|
|
$
|
3,522
|
|
$
|
3,219
|
|
|||
|
Operating margin
|
721
|
|
755
|
|
665
|
|
717
|
|
|||||||
|
Income from continuing operations, net of tax
(2)
|
261
|
|
274
|
|
198
|
|
54
|
|
|||||||
|
Income (loss) from discontinued operations, net of tax
|
(7
|
)
|
(10
|
)
|
5
|
|
(13
|
)
|
|||||||
|
Net income
|
$
|
254
|
|
$
|
264
|
|
$
|
203
|
|
$
|
41
|
|
|||
|
Net income (loss) attributable to The AES Corporation
|
$
|
142
|
|
$
|
69
|
|
$
|
180
|
|
$
|
(85
|
)
|
|||
|
Basic income (loss) per share:
|
|||||||||||||||
|
Income (loss) from continuing operations attributable to The AES Corporation, net of tax
|
$
|
0.21
|
|
$
|
0.11
|
|
$
|
0.26
|
|
$
|
(0.11
|
)
|
|||
|
Income (loss) from discontinued operations attributable to The AES Corporation, net of tax
|
(0.01
|
)
|
(0.01
|
)
|
0.01
|
|
(0.02
|
)
|
|||||||
|
Basic income (loss) per share attributable to The AES Corporation
|
$
|
0.20
|
|
$
|
0.10
|
|
$
|
0.27
|
|
$
|
(0.13
|
)
|
|||
|
Diluted income (loss) per share:
|
|||||||||||||||
|
Income (loss) from continuing operations attributable to The AES Corporation, net of tax
|
$
|
0.21
|
|
$
|
0.11
|
|
$
|
0.26
|
|
$
|
(0.11
|
)
|
|||
|
Income (loss) from discontinued operations attributable to The AES Corporation, net of tax
|
(0.01
|
)
|
(0.01
|
)
|
—
|
|
(0.02
|
)
|
|||||||
|
Diluted income (loss) per share attributable to The AES Corporation
|
$
|
0.20
|
|
$
|
0.10
|
|
$
|
0.26
|
|
$
|
(0.13
|
)
|
|||
|
Dividends declared per common share
|
$
|
—
|
|
$
|
0.10
|
|
$
|
0.10
|
|
$
|
0.21
|
|
|||
_____________________________
|
(1)
|
Includes pretax impairment expense of
$159 million
,
$235 million
,
$79 million
and
$625 million
, for the first, second, third and fourth quarters of
2016
, respectively. See Note
20
—
Asset Impairment Expense
for further discussion.
|
|
(2)
|
Includes pretax impairment expense of
$8 million
,
$37 million
,
$231 million
and
$326 million
, for the first, second, third and fourth quarters of
2015
, respectively. See
Note
9
—
Goodwill and Other Intangible Assets
and Note
20
—
Asset Impairment Expense
for further discussion.
|
29
. SUBSEQUENT EVENTS
Kazakhstan Sale
- In January 2017, the Company entered into an agreement for the sale of Ust-Kamenogorsk CHP and Sogrinsk CHP, its combined heating and power coal plants in Kazakhstan. The sale is expected to close in the second quarter of 2017. The assets did not qualify as held-for-sale as of December 31, 2016. The Company expects to recognize a combined impairment and loss on sale of approximately
$125 million
in the first half of 2017.
sPower Acquisition
- On February 19, 2017, the Company and Alberta Investment Management Corporation (“AIMCo”) entered into an agreement to acquire FTP Power LLC (“sPower”) for
$853 million
in cash, subject to customary purchase price adjustments, plus the assumption of sPower’s non-recourse debt. Upon completion of the transaction, AES and AIMCo will each own slightly below 50% of sPower. The sPower portfolio includes solar and wind projects in operation, under construction, and in development located in the United States. The transaction is expected to close by the third quarter of 2017. The Agreement contains certain termination rights for the parties, including if the closing does not occur by December 31, 2017, which may be automatically extended under certain circumstances. Additionally, the Company and AIMCo may be required to incur a reverse termination fee of up to
$75 million
.
185
None.
Conclusion Regarding the Effectiveness of Disclosure Controls and Procedures
The Company maintains disclosure controls and procedures that are designed to ensure that information required to be disclosed in the reports that the Company files or submits under the Securities Exchange Act of 1934, as amended (the "Exchange Act") is recorded, processed, summarized and reported within the time periods specified in the SEC's rules and forms, and that such information is accumulated and communicated to the CEO and CFO, as appropriate, to allow timely decisions regarding required disclosures.
The Company carried out the evaluation required by Rules 13a-15(b) and 15d-15(b), under the supervision and with the participation of our management, including the CEO and CFO, of the effectiveness of our “disclosure controls and procedures” (as defined in the Exchange Act Rules 13a-15(e) and 15d-15(e)). Based upon this evaluation, the CEO and CFO concluded that as of
December 31, 2016
, our disclosure controls and procedures were effective.
Management's Report on Internal Control over Financial Reporting
Management of the Company is responsible for establishing and maintaining adequate internal control over financial reporting, as defined in Rule 13a-15(f) under the Exchange Act. The Company's internal control over financial reporting is a process designed to provide reasonable assurance regarding the reliability of financial reporting and the preparation of financial statements for external purposes in accordance with GAAP and includes those policies and procedures that:
|
•
|
pertain to the maintenance of records that in reasonable detail, accurately and fairly reflect the transactions and dispositions of the assets of the Company;
|
|
•
|
provide reasonable assurance that transactions are recorded as necessary to permit preparation of financial statements in accordance with GAAP, and that receipts and expenditures of the Company are being made only in accordance with authorizations of management and directors of the Company; and
|
|
•
|
provide reasonable assurance that unauthorized acquisition, use or disposition of the Company's assets that could have a material effect on the financial statements are prevented or detected timely.
|
Management, including our CEO and CFO, does not expect that our internal controls will prevent or detect all errors and all fraud. A control system, no matter how well designed and operated, can provide only reasonable, not absolute, assurance that the objectives of the control system are met. Further, the design of a control system must reflect the fact that there are resource constraints, and the benefits of controls must be considered relative to their costs. In addition, any evaluation of the effectiveness of controls is subject to risks that those internal controls may become inadequate in future periods because of changes in business conditions, or that the degree of compliance with the policies or procedures deteriorates.
Management assessed the effectiveness of our internal control over financial reporting as of
December 31, 2016
. In making this assessment, management used the criteria established in Internal Control—Integrated Framework issued by the Committee of Sponsoring Organizations of the Treadway Commission ("COSO") in 2013. Based on this assessment, management believes that the Company maintained effective internal control over financial reporting as of
December 31, 2016
.
The effectiveness of the Company's internal control over financial reporting as of
December 31, 2016
, has been audited by Ernst & Young LLP, an independent registered public accounting firm, as stated in their report, which appears herein.
Changes in Internal Control Over Financial Reporting:
There were no changes that occurred during the quarter ended
December 31, 2016
that have materially affected, or are reasonably likely to materially affect, our internal control over financial reporting.
186
REPORT OF INDEPENDENT REGISTERED PUBLIC ACCOUNTING FIRM
The Board of Directors and Stockholders of The AES Corporation:
We have audited The AES Corporation’s internal control over financial reporting as of December 31, 2016, based on criteria established in Internal Control-Integrated Framework issued by the Committee of Sponsoring Organizations of the Treadway Commission (2013 Framework) (the COSO criteria). The AES Corporation’s management is responsible for maintaining effective internal control over financial reporting, and for its assessment of the effectiveness of internal control over financial reporting included in the accompanying Management’s Report on Internal Control over Financial Reporting. Our responsibility is to express an opinion on the company’s internal control over financial reporting based on our audit.
We conducted our audit in accordance with the standards of the Public Company Accounting Oversight Board (United States). Those standards require that we plan and perform the audit to obtain reasonable assurance about whether effective internal control over financial reporting was maintained in all material respects. Our audit included obtaining an understanding of internal control over financial reporting, assessing the risk that a material weakness exists, testing and evaluating the design and operating effectiveness of internal control based on the assessed risk, and performing such other procedures as we considered necessary in the circumstances. We believe that our audit provides a reasonable basis for our opinion.
A company’s internal control over financial reporting is a process designed to provide reasonable assurance regarding the reliability of financial reporting and the preparation of financial statements for external purposes in accordance with generally accepted accounting principles. A company’s internal control over financial reporting includes those policies and procedures that (1) pertain to the maintenance of records that, in reasonable detail, accurately and fairly reflect the transactions and dispositions of the assets of the company; (2) provide reasonable assurance that transactions are recorded as necessary to permit preparation of financial statements in accordance with generally accepted accounting principles, and that receipts and expenditures of the company are being made only in accordance with authorizations of management and directors of the company; and (3) provide reasonable assurance regarding prevention or timely detection of unauthorized acquisition, use, or disposition of the company’s assets that could have a material effect on the financial statements.
Because of its inherent limitations, internal control over financial reporting may not prevent or detect misstatements. Also, projections of any evaluation of effectiveness to future periods are subject to the risk that controls may become inadequate because of changes in conditions, or that the degree of compliance with the policies or procedures may deteriorate.
In our opinion, The AES Corporation maintained, in all material respects, effective internal control over financial reporting as of December 31, 2016, based on the COSO criteria.
We also have audited, in accordance with the standards of the Public Company Accounting Oversight Board (United States), the consolidated balance sheets of The AES Corporation as of December 31, 2016 and 2015, and the related consolidated statements of operations, comprehensive income, changes in equity, and cash flows for each of the three years in the period ended December 31, 2016 of The AES Corporation and our report dated February 24, 2017 expressed an unqualified opinion thereon.
/s/ Ernst & Young LLP
McLean, Virginia
February 24, 2017
None.
187
The following information is incorporated by reference from the Registrant's Proxy Statement for the Registrant's 2017 Annual Meeting of Stockholders which the Registrant expects will be filed on or around March 7,
2017
(the "
2017
Proxy Statement"):
|
•
|
information regarding the directors required by this item found under the heading
Board of Directors
;
|
|
•
|
information regarding AES' Code of Ethics found under the heading
Additional Governance Matters - AES Code of Business Conduct and Corporate Governance Guidelines
;
|
|
•
|
information regarding compliance with Section 16 of the Exchange Act required by this item found under the heading
Additional Governance Matters - Other Governance Information - Section 16(a) Beneficial Ownership Reporting Compliance
; and
|
|
•
|
information regarding AES' Financial Audit Committee found under the heading
Board and Committee Governance Matters - Financial Audit Committee (the “Audit Committee”).
|
Certain information regarding executive officers required by this Item is presented as a supplementary item in Part I hereof (pursuant to Instruction 3 to Item 401(b) of Regulation S-K). The other information required by this Item, to the extent not included above, will be contained in our
2017
Proxy Statement and is herein incorporated by reference.
The following information is contained in the
2017
Proxy Statement and is incorporated by reference: the information regarding executive compensation contained under the heading
Compensation Discussion and Analysis
and the Compensation Committee Report on Executive Compensation under the heading
Report of the Compensation Committee
.
|
(a)
|
Security Ownership of Certain Beneficial Owners.
|
See the information contained under the heading
Security Ownership of Certain Beneficial Owners, Directors, and Executive Officers
of the
2017
Proxy Statement, which information is incorporated herein by reference.
|
(b)
|
Security Ownership of Directors and Executive Officers.
|
See the information contained under the heading
Security Ownership of Certain Beneficial Owners, Directors, and Executive Officers
of the
2017
Proxy Statement, which information is incorporated herein by reference.
|
(c)
|
Changes in Control.
|
None.
|
(d)
|
Securities Authorized for Issuance under Equity Compensation Plans.
|
The following table provides information about shares of AES common stock that may be issued under AES' equity compensation plans, as of December 31,
2016
:
Securities Authorized for Issuance under Equity Compensation Plans (As of December 31,
2016
)
|
(a)
|
(b)
|
(c)
|
|||||||
|
Plan category
|
Number of securities to be issued upon exercise of outstanding options, warrants and rights
|
Weighted average exercise price of outstanding options, warrants and rights
|
Number of securities remaining available for future issuance under equity compensation plans (excluding securities reflected in column (a))
|
||||||
|
Equity compensation plans approved by security holders
(1)
|
12,630,620
|
|
(2)
|
$
|
13.43
|
|
15,918,834
|
|
|
|
Equity compensation plans not approved by security holders
|
—
|
|
$
|
—
|
|
—
|
|
||
|
Total
|
12,630,620
|
|
$
|
—
|
|
15,918,834
|
|
||
_____________________________
|
(1)
|
The following equity compensation plans have been approved by the Company's Stockholders:
|
|
(A)
|
The AES Corporation 2003 Long Term Compensation Plan was adopted in 2003 and provided for 17,000,000 shares authorized for issuance thereunder. In 2008, an amendment to the Plan to provide an additional 12,000,000 shares was approved by AES' stockholders, bringing the total authorized shares to 29,000,000. In 2010, an additional amendment to the Plan to provide an additional 9,000,000 shares was approved by AES' stockholders, bringing the total authorized shares to 38,000,000. In 2015, an additional amendment to the Plan to provide an additional 7,750,000 shares was approved by AES' stockholders, bringing the total
|
188
authorized shares to 45,750,000. The weighted average exercise price of Options outstanding under this plan included in Column (b) is $13.42 (excluding performance stock units, restricted stock units and director stock units), with 15,915,834 shares available for future issuance).
|
(B)
|
The AES Corporation 2001 Plan for outside directors adopted in 2001 provided for 2,750,000 shares authorized for issuance. The weighted average exercise price of Options outstanding under this plan included in Column (b) is $21.44. In conjunction with the 2010 amendment to the 2003 Long Term Compensation plan, ongoing award issuance from this plan was discontinued in 2010. Any remaining shares under this plan, which are not reserved for issuance under outstanding awards, are not available for future issuance and thus the amount of 2,078,579 shares is not included in Column (c) above.
|
|
(C)
|
The AES Corporation Second Amended and Restated Deferred Compensation Plan for directors provided for 2,000,000 shares authorized for issuance. Column (b) excludes the Director stock units granted thereunder. In conjunction with the 2010 amendment to the 2003 Long Term Compensation Plan, ongoing award issuance from this plan was discontinued in 2010 as Director stock units will be issued from the 2003 Long Term Compensation Plan. Any remaining shares under this plan, which are not reserved for issuance under outstanding awards, are not available for future issuance and thus the amount of 105,341 shares is not included in Column (c) above.
|
|
(2)
|
Includes 4,745,968 (of which 427,520 are vested and 4,318,488 are unvested) shares underlying PSU and RSU awards (assuming performance at a maximum level), 1,556,575 shares underlying Director stock unit awards, and 6,328,077 shares issuable upon the exercise of Stock Option grants, for an aggregate number of 12,630,620 shares.
|
The information regarding related party transactions required by this item is included in the
2017
Proxy Statement found under the headings
Transactions with Related Persons, Proposal I: Election of Directors
and
Board Committees
and are incorporated herein by reference.
The information concerning principal accountant fees and services included in the
2017
Proxy Statement contained under the heading
Information Regarding The Independent Registered Public Accounting Firm's Fees, Services and Independence
and is incorporated herein by reference.
189
|
(a)
|
Financial Statements.
|
|
Financial Statements and Schedules:
|
Page
|
|
|
S-2-S-7
|
||
|
(b)
|
Exhibits.
|
|
3.1
|
Sixth Restated Certificate of Incorporation of The AES Corporation is incorporated herein by reference to Exhibit 3.1 of the Company's Form 10-K for the year ended December 31, 2008.
|
|
|
3.2
|
By-Laws of The AES Corporation, as amended and incorporated herein by reference to Exhibit 3.1 of the Company's Form 8-K/A filed on December 2, 2015.
|
|
|
4
|
There are numerous instruments defining the rights of holders of long-term indebtedness of the Registrant and its consolidated subsidiaries, none of which exceeds ten percent of the total assets of the Registrant and its subsidiaries on a consolidated basis. The Registrant hereby agrees to furnish a copy of any of such agreements to the Commission upon request. Since these documents are not required filings under Item 601 of Regulation S-K, the Company has elected to file certain of these documents as Exhibits 4.(a)—4.(r).
|
|
|
4.(a)
|
Junior Subordinated Indenture, dated as of March 1, 1997, between The AES Corporation and Wells Fargo Bank, National Association, as successor to Bank One, National Association (formerly known as The First National Bank of Chicago) is incorporated herein by reference to Exhibit 4.(a) of the Company's Form 10-K for the year ended December 31, 2008.
|
|
|
4.(b)
|
Third Supplemental Indenture, dated as of October 14, 1999, between The AES Corporation and Wells Fargo Bank, National Association, as successor to Bank One, National Association is incorporated herein by reference to Exhibit 4.(b) of the Company's Form 10-K for the year ended December 31, 2008.
|
|
|
4.(c)
|
Senior Indenture, dated as of December 8, 1998, between The AES Corporation and Wells Fargo Bank, National Association, as successor to Bank One, National Association (formerly known as The First National Bank of Chicago) is incorporated herein by reference to Exhibit 4.01 of the Company's Form 8-K filed on December 11, 1998 (SEC File No. 001-12291).
|
|
|
4.(d)
|
Ninth Supplemental Indenture, dated as of April 3, 2003, between The AES Corporation and Wells Fargo Bank, National Association (as successor by consolidation to Wells Fargo Bank Minnesota, National Association) is incorporated herein by reference to Exhibit 4.6 of the Company's Form S-4 filed on December 7, 2007.
|
|
|
4.(e)
|
Twelfth Supplemental Indenture, dated as of October 15, 2007, between The AES Corporation and Wells Fargo Bank, National Association is incorporated herein by reference to Exhibit 4.8 of the Company's Form S-4 filed on December 7, 2007.
|
|
|
4.(f)
|
Thirteenth Supplemental Indenture, dated as of May 19, 2008, between The AES Corporation and Wells Fargo Bank, National Association is incorporated herein by reference to Exhibit 4.(l) of the Company's Form 10-K for the year ended December 31, 2008.
|
|
|
4.(g)
|
Fifteenth Supplemental Indenture, dated as of June 15, 2011, between The AES Corporation and Wells Fargo Bank, National Association is incorporated herein by reference to Exhibit 4.3 of the Company's Form 8-K filed on June 15, 2011.
|
|
|
4.(h)
|
Indenture, dated October 3, 2011, between Dolphin Subsidiary II, Inc. and Wells Fargo Bank, National Association is incorporated herein by reference to Exhibit 4.1 of the Company's Form 8-K filed on October 5, 2011.
|
|
|
4.(i)
|
Sixteenth Supplemental Indenture, dated April 30, 2013, between The AES Corporation and Wells Fargo Bank, N.A., as Trustee is incorporated herein by reference to Exhibit 4.1 of the Company's Form 8-K filed on April 30, 2013 (SEC File No. 001-12291).
|
|
|
4.(j)
|
Seventeenth Supplemental Indenture, dated March 7, 2014, between The AES Corporation and Wells Fargo Bank, N.A. as Trustee is incorporated herein by reference to Exhibit 4.1 of the Company's Form 8-K filed on March 7, 2014.
|
|
|
4.(k)
|
Eighteenth Supplemental Indenture, dated May 20, 2014, between The AES Corporation and Wells Fargo Bank, N.A. as Trustee is incorporated herein by reference to Exhibit 4.1 of the Company's Form 8-K filed on May 20, 2014.
|
|
|
4.(l)
|
Nineteenth Supplemental Indenture, dated April 6, 2015, between The AES Corporation and Wells Fargo Bank, N.A. as Trustee is incorporated herein by reference to Exhibit 4.1 of the Company's Form 8-K filed on April 6, 2015.
|
|
|
4.(m)
|
Twentieth Supplemental Indenture, dated May 25, 2016, between The AES Corporation and Wells Fargo Bank, N.A. as Trustee is incorporated herein by reference to Exhibit 4.1 of the Company's Form 8-K filed on May 25, 2016.
|
|
|
10.1
|
The AES Corporation Profit Sharing and Stock Ownership Plan are incorporated herein by reference to Exhibit 4(c)(1) of the Registration Statement on Form S-8 (Registration No. 33-49262) filed on July 2, 1992.
|
|
|
10.2
|
The AES Corporation Incentive Stock Option Plan of 1991, as amended, is incorporated herein by reference to Exhibit 10.30 of the Company's Form 10-K for the year ended December 31, 1995 (SEC File No. 00019281).
|
|
|
10.3
|
Applied Energy Services, Inc. Incentive Stock Option Plan of 1982 is incorporated herein by reference to Exhibit 10.31 of the Registration Statement on Form S-1 (Registration No. 33-40483).
|
|
|
10.4
|
Deferred Compensation Plan for Executive Officers, as amended, is incorporated herein by reference to Exhibit 10.32 of Amendment No. 1 to the Registration Statement on Form S-1 (Registration No. 33-40483).
|
|
|
10.5
|
Deferred Compensation Plan for Directors, as amended and restated, on February 17, 2012 is incorporated herein by reference to Exhibit 10.5 of the Company's Form 10-K for the year ended December 31, 2012.
|
|
|
10.6
|
The AES Corporation Stock Option Plan for Outside Directors, as amended and restated, on December 7, 2007 is incorporated herein by reference to Exhibit 10.6 of the Company's Form 10-K for the year ended December 31, 2012.
|
|
|
10.7
|
The AES Corporation Supplemental Retirement Plan is incorporated herein by reference to Exhibit 10.63 of the Company's Form 10-K for the year ended December 31, 1994 (SEC File No. 00019281).
|
|
|
10.7A
|
Amendment to The AES Corporation Supplemental Retirement Plan, dated March 13, 2008 is incorporated herein by reference to Exhibit 10.9.A of the Company's Form 10-K for the year ended December 31, 2007.
|
|
|
10.8
|
The AES Corporation 2001 Stock Option Plan is incorporated herein by reference to Exhibit 10.12 of the Company's Form 10-K for the year ended December 31, 2000 (SEC File No. 001-12291).
|
|
|
10.9
|
Second Amended and Restated Deferred Compensation Plan for Directors is incorporated herein by reference to Exhibit 10.13 of the Company's Form 10-K for the year ended December 31, 2000 (SEC File No. 001-12291).
|
|
190
|
10.10
|
The AES Corporation 2001 Non-Officer Stock Option Plan is incorporated herein by reference to Exhibit 10.12 of the Company's Form 10-K for the year ended December 31, 2002 (SEC File No. 001-12291).
|
|
|
10.10A
|
Amendment to the 2001 Stock Option Plan and 2001 Non-Officer Stock Option Plan, dated March 13, 2008 is incorporated herein by reference to Exhibit 10.12.A of the Company's Form 10-K for the year ended December 31, 2007.
|
|
|
10.11
|
The AES Corporation 2003 Long Term Compensation Plan, as Amended and Restated, dated April 23, 2015, is incorporated herein by reference to Exhibit 99.1 of the Company's Form 8-K filed on April 23, 2015.
|
|
|
10.12
|
Form of AES Nonqualified Stock Option Award Agreement under The AES Corporation 2003 Long Term Compensation Plan (Outside Directors) is incorporated herein by reference to Exhibit 10.2 of the Company's Form 8-K filed on April 27, 2010.
|
|
|
10.13
|
Form of AES Performance Stock Unit Award Agreement under The AES Corporation 2003 Long Term Compensation Plan is incorporated herein by reference to Exhibit 10.13 of the Company's Form 10-K for the year ended December 31,2015.
|
|
|
10.14
|
Form of AES Restricted Stock Unit Award Agreement under The AES Corporation 2003 Long Term Compensation Plan is incorporated herein by reference to Exhibit 10.14 of the Company's Form 10-K for the year ended December 31, 2015.
|
|
|
10.15
|
Form of AES Performance Unit Award Agreement under The AES Corporation 2003 Long Term Compensation Plan is incorporated herein by reference to Exhibit 10.15 of the Company's Form 10-K for the year ended December 31,2015.
|
|
|
10.16
|
Form of AES Nonqualified Stock Option Award Agreement under The AES Corporation 2003 Long Term Compensation Plan is incorporated herein by reference to Exhibit 10.4 of the Company's Form 10-Q for the quarter ended June 30, 2015.
|
|
|
10.17
|
Form of AES Performance Cash Unit Award Agreement under The AES Corporation 2003 Long Term Compensation Plan is incorporated herein by reference to Exhibit 10.17 of the Company's Form 10-K for the year ended December 31, 2015.
|
|
|
10.18
|
The AES Corporation Restoration Supplemental Retirement Plan, as amended and restated, dated December 29, 2008 is incorporated herein by reference to Exhibit 10.15 of the Company's Form 10-K for the year ended December 31, 2008.
|
|
|
10.18A
|
Amendment to The AES Corporation Restoration Supplemental Retirement Plan, dated December 9, 2011 is incorporated herein by reference to Exhibit 10.17A of the Company's Form 10-K for the year ended December 31, 2012.
|
|
|
10.19
|
The AES Corporation International Retirement Plan, as amended and restated on December 29, 2008 is incorporated herein by reference to Exhibit 10.16 of the Company's Form 10-K for the year ended December 31, 2008.
|
|
|
10.19A
|
Amendment to The AES Corporation International Retirement Plan, dated December 9, 2011 is incorporated herein by reference to Exhibit 10.18A of the Company's Form 10-K for the year ended December 31, 2012.
|
|
|
10.20
|
The AES Corporation Severance Plan, as amended and restated on April 23, 2015 is incorporated herein by reference to Exhibit 10.6 of the Company's Form 10-Q for the quarter ended June 30, 2015.
|
|
|
10.21
|
The AES Corporation Amended and Restated Executive Severance Plan dated April 23, 2015 is incorporated herein by reference to Exhibit 10.5 of the Company's Form 10-Q for the period ended June 30, 2015.
|
|
|
10.22
|
The AES Corporation Performance Incentive Plan, as Amended and Restated on April 23, 2015 is incorporated herein by reference to Exhibit 99.2 of the Company's Form 8-K filed on April 23, 2015.
|
|
|
10.23
|
The AES Corporation Deferred Compensation Program For Directors dated February 17, 2012 is incorporated herein by reference to Exhibit 10.22 of the Company's Form 10-K filed on December 31, 2011.
|
|
|
10.24
|
The AES Corporation Employment Agreement with Andrés Gluski is incorporated herein by reference to Exhibit 99.3 of the Company's Form 8-K filed on December 31, 2008.
|
|
|
10.25
|
Mutual Agreement, between Andrés Gluski and The AES Corporation dated October 7, 2011 is incorporated herein by reference to Exhibit 10.2 of the Company's Form 10-Q for the period ended September 30, 2011.
|
|
|
10.26
|
Form of Retroactive Consent to Provide for Double-Trigger IN Change-In-Control Transactions is incorporated herein by reference to Exhibit 10.7 of the Company's Form 10-Q for the period ended June 30, 2015.
|
|
|
10.27
|
Amendment No. 3, dated as of July 26, 2013 to the Fifth Amended and Restated Credit and Reimbursement Agreement, dated as of July 29, 2010 is incorporated herein by reference to Exhibit 10.1 of the Company's Form 8-K filed on July 29, 2013.
|
|
|
10.27A
|
Sixth Amended and Restated Credit and Reimbursement Agreement dated as of July 26, 2013 among The AES Corporation, a Delaware corporation, the Banks listed on the signature pages thereof, Citibank, N.A., as Administrative Agent and Collateral Agent, Citigroup Global Markets Inc., as Lead Arranger and Book Runner, Banc of America Securities LLC, as Lead Arranger and Book Runner and Co-Syndication Agent, Barclays Capital, as Lead Arranger and Book Runner and Co-Syndication Agent, RBS Securities Inc., as Lead Arranger and Book Runner and Co-Syndication Agent and Union Bank, N.A., as Lead Arranger and Book Runner and Co-Syndication Agent is incorporated herein by reference to Exhibit 10.1.A of the Company's Form 8-K filed on July 29, 2013.
|
|
|
10.27B
|
Appendices and Exhibits to the Sixth Amended and Restated Credit and Reimbursement Agreement, dated as of July 29, 2013 is incorporated herein by reference to Exhibit 10.1.B of the Company's Form 8-K filed on July 29, 2013.
|
|
|
10.27C
|
Amendment No. 1, dated as of May 6, 2016 to the Sixth Amended and Restated Credit and Reimbursement Agreement, dated as of July 23, 2013 among The AES Corporation, a Delaware corporation, the Banks listed on the signature pages thereof and Citibank, N.A. as Administrate Agent and Collateral Agent is incorporated herein by reference to Exhibit 10.1 of the Company's Form 8-K filed on May 9, 2016.
|
|
|
10.28
|
Collateral Trust Agreement dated as of December 12, 2002 among The AES Corporation, AES International Holdings II, Ltd., Wilmington Trust Company, as corporate trustee and Bruce L. Bisson, an individual trustee is incorporated herein by reference to Exhibit 4.2 of the Company's Form 8-K filed on December 17, 2002 (SEC File No. 001-12291).
|
|
|
10.29
|
Security Agreement dated as of December 12, 2002 made by The AES Corporation to Wilmington Trust Company, as corporate trustee and Bruce L. Bisson, as individual trustee is incorporated herein by reference to Exhibit 4.3 of the Company's Form 8-K filed on December 17, 2002 (SEC File No. 001-12291).
|
|
|
10.30
|
Charge Over Shares dated as of December 12, 2002 between AES International Holdings II, Ltd. and Wilmington Trust Company, as corporate trustee and Bruce L. Bisson, as individual trustee is incorporated herein by reference to Exhibit 4.4 of the Company's Form 8-K filed on December 17, 2002 (SEC File No. 001-12291).
|
|
|
10.31
|
Agreement and Plan of Merger, dated as of February 19, 2017, by and among AES Lumos Holdings, LLC, PIP5 Lumos LLC, AES Lumos Merger Sub, LLC, PIP5 Lumos MS LLC, FTP Power LLC and Fir Tree Solar LLC (filed herewith).
|
|
|
12
|
Statement of computation of ratio of earnings to fixed charges (filed herewith).
|
|
|
21.1
|
Subsidiaries of The AES Corporation (filed herewith).
|
|
|
23.1
|
Consent of Independent Registered Public Accounting Firm, Ernst & Young LLP (filed herewith).
|
|
|
24
|
Powers of Attorney (filed herewith).
|
|
|
31.1
|
Rule 13a-14(a)/15d-14(a) Certification of Andrés Gluski (filed herewith).
|
|
|
31.2
|
Rule 13a-14(a)/15d-14(a) Certification of Thomas M. O'Flynn (filed herewith).
|
|
|
32.1
|
Section 1350 Certification of Andrés Gluski (filed herewith).
|
|
|
32.2
|
Section 1350 Certification of Thomas M. O'Flynn (filed herewith).
|
|
|
101.INS
|
XBRL Instance Document (filed herewith).
|
|
|
101.SCH
|
XBRL Taxonomy Extension Schema Document (filed herewith).
|
|
191
|
101.CAL
|
XBRL Taxonomy Extension Calculation Linkbase Document (filed herewith).
|
|
|
101.DEF
|
XBRL Taxonomy Extension Definition Linkbase Document (filed herewith).
|
|
|
101.LAB
|
XBRL Taxonomy Extension Label Linkbase Document (filed herewith).
|
|
|
101.PRE
|
XBRL Taxonomy Extension Presentation Linkbase Document (filed herewith).
|
|
|
(c)
|
Schedules
|
Schedule I—Financial Information of Registrant
Schedule II—Valuation and Qualifying Accounts
192
SIGNATURES
Pursuant to the requirements of Section 13 or 15(d) of the Securities Exchange Act of 1934, as amended, the Company has duly caused this report to be signed on its behalf by the undersigned, thereunto duly authorized.
|
THE AES CORPORATION
(Company)
|
||||
|
Date:
|
February 24, 2017
|
By:
|
/s/ A
NDRÉS
G
LUSKI
|
|
|
Name:
|
Andrés Gluski
|
|||
|
President, Chief Executive Officer
|
||||
Pursuant to the requirements of the Securities Exchange Act of 1934, as amended, this report has been signed below by the following persons on behalf of the Company and in the capacities and on the dates indicated.
|
Name
|
Title
|
Date
|
||
|
*
|
President, Chief Executive Officer (Principal Executive Officer) and Director
|
|||
|
Andrés Gluski
|
February 24, 2017
|
|||
|
*
|
Director
|
|||
|
Charles L. Harrington
|
February 24, 2017
|
|||
|
*
|
Director
|
|||
|
Kristina M. Johnson
|
February 24, 2017
|
|||
|
*
|
Director
|
|||
|
Tarun Khanna
|
February 24, 2017
|
|||
|
*
|
Director
|
|||
|
Holly K. Koeppel
|
February 24, 2017
|
|||
|
*
|
Director
|
|||
|
Philip Lader
|
February 24, 2017
|
|||
|
*
|
Director
|
|||
|
James H. Miller
|
February 24, 2017
|
|||
|
*
|
Director
|
|||
|
John B. Morse
|
February 24, 2017
|
|||
|
*
|
Director
|
|||
|
Moises Naim
|
February 24, 2017
|
|||
|
*
|
Chairman of the Board and Lead Independent Director
|
|||
|
Charles O. Rossotti
|
February 24, 2017
|
|||
|
/s/ THOMAS M. O'FLYNN
|
Executive Vice President and Chief Financial Officer (Principal Financial Officer)
|
|||
|
Thomas M. O'Flynn
|
February 24, 2017
|
|||
|
/s/ FABIAN E. SOUZA
|
Vice President and Controller (Principal Accounting Officer)
|
|||
|
Fabian E. Souza
|
February 24, 2017
|
|||
|
*By:
|
/s/ BRIAN A. MILLER
|
February 24, 2017
|
|
|
Attorney-in-fact
|
|||
193
THE AES CORPORATION AND SUBSIDIARIES
INDEX TO FINANCIAL STATEMENT SCHEDULES
Schedules other than those listed above are omitted as the information is either not applicable, not required, or has been furnished in the financial statements or notes thereto included in Item 8 hereof.
See Notes to Schedule I
S-1
THE AES CORPORATION
SCHEDULE I CONDENSED FINANCIAL INFORMATION OF PARENT
BALANCE SHEETS
|
December 31,
|
||||||||
|
2016
|
2015
|
|||||||
|
(in millions)
|
||||||||
|
ASSETS
|
||||||||
|
Current Assets:
|
||||||||
|
Cash and cash equivalents
|
$
|
109
|
|
$
|
186
|
|
||
|
Restricted cash
|
3
|
|
32
|
|
||||
|
Accounts and notes receivable from subsidiaries
|
155
|
|
264
|
|
||||
|
Prepaid expenses and other current assets
|
39
|
|
26
|
|
||||
|
Total current assets
|
306
|
|
508
|
|
||||
|
Investment in and advances to subsidiaries and affiliates
|
7,561
|
|
7,764
|
|
||||
|
Office Equipment:
|
||||||||
|
Cost
|
26
|
|
27
|
|
||||
|
Accumulated depreciation
|
(16
|
)
|
(15
|
)
|
||||
|
Office equipment, net
|
10
|
|
12
|
|
||||
|
Other Assets:
|
||||||||
|
Other intangible assets, net of accumulated amortization
|
5
|
|
11
|
|
||||
|
Deferred financing costs, net of accumulated amortization of $1
|
5
|
|
—
|
|
||||
|
Deferred income taxes
|
1,041
|
|
1,028
|
|
||||
|
Other assets
|
13
|
|
1
|
|
||||
|
Total other assets
|
1,064
|
|
1,040
|
|
||||
|
Total
|
$
|
8,941
|
|
$
|
9,324
|
|
||
|
LIABILITIES AND STOCKHOLDERS' EQUITY
|
||||||||
|
Current Liabilities:
|
||||||||
|
Accounts payable
|
$
|
18
|
|
$
|
16
|
|
||
|
Accounts and notes payable to subsidiaries
|
304
|
|
97
|
|
||||
|
Accrued and other liabilities
|
250
|
|
204
|
|
||||
|
Total current liabilities
|
572
|
|
317
|
|
||||
|
Long-term Liabilities:
|
||||||||
|
Senior notes payable
|
4,154
|
|
4,449
|
|
||||
|
Junior subordinated notes and debentures payable
|
517
|
|
517
|
|
||||
|
Accounts and notes payable to subsidiaries
|
883
|
|
873
|
|
||||
|
Other long-term liabilities
|
21
|
|
19
|
|
||||
|
Total long-term liabilities
|
5,575
|
|
5,858
|
|
||||
|
Stockholders' equity:
|
||||||||
|
Common stock
|
8
|
|
8
|
|
||||
|
Additional paid-in capital
|
8,592
|
|
8,718
|
|
||||
|
Retained earnings (accumulated deficit)
|
(1,146
|
)
|
143
|
|
||||
|
Accumulated other comprehensive loss
|
(2,756
|
)
|
(3,883
|
)
|
||||
|
Treasury stock
|
(1,904
|
)
|
(1,837
|
)
|
||||
|
Total stockholders' equity
|
2,794
|
|
3,149
|
|
||||
|
Total
|
$
|
8,941
|
|
$
|
9,324
|
|
||
See Notes to Schedule I.
S-2
THE AES CORPORATION
SCHEDULE I CONDENSED FINANCIAL INFORMATION OF PARENT
STATEMENTS OF OPERATIONS
|
For the Years Ended December 31,
|
2016
|
2015
|
2014
|
|||||||||
|
(in millions)
|
||||||||||||
|
Revenue from subsidiaries and affiliates
|
$
|
14
|
|
$
|
24
|
|
$
|
29
|
|
|||
|
Equity in earnings of subsidiaries and affiliates
|
(615
|
)
|
859
|
|
1,313
|
|
||||||
|
Interest income
|
19
|
|
24
|
|
59
|
|
||||||
|
General and administrative expenses
|
(144
|
)
|
(154
|
)
|
(161
|
)
|
||||||
|
Other income
|
7
|
|
24
|
|
8
|
|
||||||
|
Other expense
|
(65
|
)
|
(6
|
)
|
(30
|
)
|
||||||
|
Loss on extinguishment of debt
|
(14
|
)
|
(105
|
)
|
(193
|
)
|
||||||
|
Interest expense
|
(344
|
)
|
(364
|
)
|
(422
|
)
|
||||||
|
Income (loss) before income taxes
|
(1,142
|
)
|
302
|
|
603
|
|
||||||
|
Income tax benefit
|
12
|
|
4
|
|
166
|
|
||||||
|
Net income (loss)
|
$
|
(1,130
|
)
|
$
|
306
|
|
$
|
769
|
|
|||
See Notes to Schedule I.
S-3
THE AES CORPORATION
SCHEDULE I CONDENSED FINANCIAL INFORMATION OF PARENT
STATEMENTS OF COMPREHENSIVE INCOME
YEARS ENDED DECEMBER 31,
2016
,
2015
, AND
2014
|
2016
|
2015
|
2014
|
|||||||||
|
(in millions)
|
|||||||||||
|
NET INCOME (LOSS)
|
$
|
(1,130
|
)
|
$
|
306
|
|
$
|
769
|
|
||
|
Foreign currency translation activity:
|
|||||||||||
|
Foreign currency translation adjustments, net of income tax benefit (expense) of $1, $1 and $(7), respectively
|
117
|
|
(674
|
)
|
(366
|
)
|
|||||
|
Reclassification to earnings, net of $0 income tax for all periods
|
992
|
|
—
|
|
34
|
|
|||||
|
Total foreign currency translation adjustments, net of tax
|
1,109
|
|
(674
|
)
|
(332
|
)
|
|||||
|
Derivative activity:
|
|||||||||||
|
Change in derivative fair value, net of income tax benefit (expense) of $(5), $4 and $51, respectively
|
2
|
|
(5
|
)
|
(180
|
)
|
|||||
|
Reclassification to earnings, net of income tax benefit (expense) of $1, $(12) and $(37), respectively
|
28
|
|
48
|
|
72
|
|
|||||
|
Total change in fair value of derivatives, net of tax
|
30
|
|
43
|
|
(108
|
)
|
|||||
|
Pension activity:
|
|||||||||||
|
Prior service cost for the period, net of income tax expense of $5, $0 and $0, respectively
|
9
|
|
1
|
|
(1
|
)
|
|||||
|
Change in pension adjustments due to net actuarial gain (loss) for the period, net of income tax benefit (expense) of $10, $(7) and $9, respectively
|
(22
|
)
|
18
|
|
(13
|
)
|
|||||
|
Reclassification of earnings due to amortization of net actuarial loss, net of income tax benefit (expense) of $2, $(2) and $0, respectively
|
1
|
|
2
|
|
10
|
|
|||||
|
Total change in unfunded pension obligation
|
(12
|
)
|
21
|
|
(4
|
)
|
|||||
|
OTHER COMPREHENSIVE INCOME (LOSS)
|
1,127
|
|
(610
|
)
|
(444
|
)
|
|||||
|
COMPREHENSIVE INCOME (LOSS)
|
$
|
(3
|
)
|
$
|
(304
|
)
|
$
|
325
|
|
||
See Notes to Schedule I.
S-4
THE AES CORPORATION
SCHEDULE I CONDENSED FINANCIAL INFORMATION OF PARENT
STATEMENTS OF CASH FLOWS
|
For the Years Ended December 31,
|
2016
|
2015
|
2014
|
|||||||||
|
(in millions)
|
||||||||||||
|
Net cash provided by operating activities
|
$
|
818
|
|
$
|
475
|
|
$
|
449
|
|
|||
|
Investing Activities:
|
||||||||||||
|
Expenses related to asset sales
|
—
|
|
—
|
|
(4
|
)
|
||||||
|
Investment in and net advances to subsidiaries
|
(650
|
)
|
(221
|
)
|
(69
|
)
|
||||||
|
Return of capital
|
247
|
|
501
|
|
740
|
|
||||||
|
Decrease in restricted cash
|
29
|
|
49
|
|
96
|
|
||||||
|
Additions to property, plant and equipment
|
(12
|
)
|
(11
|
)
|
(31
|
)
|
||||||
|
Purchase of short term investments, net
|
—
|
|
—
|
|
(1
|
)
|
||||||
|
Net cash provided by (used in) investing activities
|
(386
|
)
|
318
|
|
731
|
|
||||||
|
Financing Activities:
|
||||||||||||
|
Borrowings of notes payable and other coupon bearing securities
|
500
|
|
575
|
|
1,525
|
|
||||||
|
Repayments of notes payable and other coupon bearing securities
|
(808
|
)
|
(915
|
)
|
(2,117
|
)
|
||||||
|
Loans from subsidiaries
|
183
|
|
—
|
|
263
|
|
||||||
|
Purchase of treasury stock
|
(79
|
)
|
(482
|
)
|
(308
|
)
|
||||||
|
Proceeds from issuance of common stock
|
1
|
|
4
|
|
1
|
|
||||||
|
Common stock dividends paid
|
(290
|
)
|
(276
|
)
|
(144
|
)
|
||||||
|
Payments for deferred financing costs
|
(12
|
)
|
(6
|
)
|
(20
|
)
|
||||||
|
Distributions to noncontrolling interests
|
(2
|
)
|
—
|
|
—
|
|
||||||
|
Other financing
|
(3
|
)
|
(18
|
)
|
—
|
|
||||||
|
Net cash used in financing activities
|
(510
|
)
|
(1,118
|
)
|
(800
|
)
|
||||||
|
Effect of exchange rate changes on cash
|
1
|
|
—
|
|
—
|
|
||||||
|
Increase (decrease) in cash and cash equivalents
|
(77
|
)
|
(325
|
)
|
380
|
|
||||||
|
Cash and cash equivalents, beginning
|
186
|
|
511
|
|
131
|
|
||||||
|
Cash and cash equivalents, ending
|
$
|
109
|
|
$
|
186
|
|
$
|
511
|
|
|||
|
Supplemental Disclosures:
|
||||||||||||
|
Cash payments for interest, net of amounts capitalized
|
$
|
296
|
|
$
|
314
|
|
$
|
373
|
|
|||
|
Cash payments for income taxes, net of refunds
|
$
|
6
|
|
$
|
—
|
|
$
|
(2
|
)
|
|||
See Notes to Schedule I.
S-5
THE AES CORPORATION
SCHEDULE I
NOTES TO SCHEDULE I
1. Application of Significant Accounting Principles
The Schedule I Condensed Financial Information of the Parent includes the accounts of The AES Corporation (the “Parent Company”) and certain holding companies.
Accounting for Subsidiaries and Affiliates
—The Parent Company has accounted for the earnings of its subsidiaries on the equity method in the financial information.
Income Taxes
—Positions taken on the Parent Company's income tax return which satisfy a more-likely-than-not threshold will be recognized in the financial statements. The income tax expense or benefit computed for the Parent Company reflects the tax assets and liabilities on a stand-alone basis and the effect of filing a consolidated U.S. income tax return with certain other affiliated companies.
Accounts and Notes Receivable from Subsidiaries
—Amounts have been shown in current or long-term assets based on terms in agreements with subsidiaries, but payment is dependent upon meeting conditions precedent in the subsidiary loan agreements.
2. Debt
Senior Notes and Loans Payable ($ in millions)
|
December 31,
|
||||||||||||
|
Interest Rate
|
Maturity
|
2016
|
2015
|
|||||||||
|
Senior Unsecured Note
|
8.00%
|
2017
|
$
|
—
|
|
$
|
181
|
|
||||
|
Senior Unsecured Note
|
LIBOR + 3.00%
|
2019
|
240
|
|
775
|
|
||||||
|
Senior Unsecured Note
|
8.00%
|
2020
|
469
|
|
469
|
|
||||||
|
Senior Unsecured Note
|
7.38%
|
2021
|
966
|
|
1,000
|
|
||||||
|
Senior Unsecured Note
|
4.88%
|
2023
|
713
|
|
750
|
|
||||||
|
Senior Unsecured Note
|
5.50%
|
2024
|
738
|
|
750
|
|
||||||
|
Senior Unsecured Note
|
5.50%
|
2025
|
573
|
|
575
|
|
||||||
|
Senior Unsecured Note
|
6.00%
|
2026
|
500
|
|
—
|
|
||||||
|
Unamortized (discounts)/premiums & debt issuance (costs)
|
(45
|
)
|
(51
|
)
|
||||||||
|
SUBTOTAL
|
$
|
4,154
|
|
$
|
4,449
|
|
||||||
|
Less: Current maturities
|
—
|
|
—
|
|
||||||||
|
Total
|
$
|
4,154
|
|
$
|
4,449
|
|
||||||
Junior Subordinated Notes Payable ($ in millions)
|
December 31,
|
||||||||||||
|
Interest Rate
|
Maturity
|
2016
|
2015
|
|||||||||
|
Term Convertible Trust Securities
|
6.75%
|
2029
|
$
|
517
|
|
$
|
517
|
|
||||
Future Maturities of Recourse Debt
— As of December 31,
2016
scheduled maturities are presented in the following table (in millions):
|
December 31,
|
Annual Maturities
|
||
|
2017
|
$
|
—
|
|
|
2018
|
—
|
|
|
|
2019
|
240
|
|
|
|
2020
|
469
|
|
|
|
2021
|
966
|
|
|
|
Thereafter
|
3,041
|
|
|
|
Unamortized (discount)/premium & debt issuance (costs)
|
(45
|
)
|
|
|
Total debt
|
$
|
4,671
|
|
3. Dividends from Subsidiaries and Affiliates
Cash dividends received from consolidated subsidiaries were
$1 billion
,
$748 million
, and
$880 million
for the years ended December 31,
2016
,
2015
, and
2014
, respectively. There were no cash dividends received from affiliates accounted for by the equity method for the years ended December 31,
2016
,
2015
, and
2014
.
4. Guarantees and Letters of Credit
GUARANTEES
— In connection with certain of its project financing, acquisition, and power purchase agreements, the Company has expressly undertaken limited obligations and commitments, most of which will only be effective or will be terminated upon the occurrence of future events. These obligations and commitments, excluding those collateralized by letter of credit and other obligations discussed below, were limited as of December 31,
2016
, by the terms of the agreements, to an aggregate of approximately
$535 million
representing
19
S-6
agreements with individual exposures ranging from
$8 million
up to
$58 million
. These amounts exclude normal and customary representations and warranties in agreements for the sale of assets (including ownership in associated legal entities) where the associated risk is considered to be nominal.
LETTERS OF CREDIT
— At December 31,
2016
, the Company had
$6 million
in letters of credit outstanding under the senior secured credit facility, representing
15
agreements with individual exposures up to
$1 million
, and
$245 million
in letters of credit outstanding under the senior unsecured credit facility, representing
8
agreements with individual exposures of
$2 million
up to
$73 million
, and
$3 million
in cash collateralized letters of credit outstanding representing
1
agreement with exposure of
$3 million
, which operate to guarantee performance relating to certain project development and construction activities and subsidiary operations. During
2016
, the Company paid letter of credit fees ranging from
0.2%
to
2.5%
per annum on the outstanding amounts.
SCHEDULE II
VALUATION AND QUALIFYING ACCOUNTS
|
(in millions)
|
Balance at Beginning of the Period
|
Charged to Cost and Expense
|
Amounts Written off
|
Translation Adjustment
|
Balance at End of the Period
|
||||||||||||||
|
Allowance for accounts receivables
|
|||||||||||||||||||
|
(current and noncurrent)
|
|||||||||||||||||||
|
Year Ended December 31, 2014
|
$
|
114
|
|
$
|
60
|
|
$
|
(75
|
)
|
$
|
(10
|
)
|
$
|
89
|
|
||||
|
Year Ended December 31, 2015
|
89
|
|
80
|
|
(56
|
)
|
(26
|
)
|
87
|
|
|||||||||
|
Year Ended December 31, 2016
|
87
|
|
37
|
|
(27
|
)
|
14
|
|
111
|
|
|||||||||
S-7
TABLE OF CONTENTS
Part IItem 1. BusinessItem 1A. Risk FactorsItem 1B. Unresolved Staff CommentsItem 2. PropertiesItem 3. Legal ProceedingsItem 4. Mine Safety DisclosuresPart IIItem 5. Market For Registrant's Common Equity, Related Stockholder Matters and Issuer Purchases Of Equity SecuritiesItem 6. Selected Financial DataItem 7. Management's Discussion and Analysis Of Financial Condition and Results Of OperationsItem 7A. Quantitative and Qualitative Disclosures About Market RiskItem 8. Financial Statements and Supplementary DataItem 9. Changes in and Disagreements with Accountants on Accounting and Financial DisclosureItem 9A. Controls and ProceduresItem 9B. Other InformationPart IIIItem 10. Directors, Executive Officers and Corporate GovernanceItem 11. Executive CompensationItem 12. Security Ownership Of Certain Beneficial Owners and Management and Related Stockholder MattersItem 13. Certain Relationships and Related Party Transactions, and Director IndependenceItem 14. Principal Accountant Fees and ServicesPart IVItem 15. Exhibits and Financial Statement Schedules